REPORT ON THE RISKS IN THE BANKING SYSTEM OF THE …
58
National Bank of the Republic of Macedonia Supervision, Banking Regulation and Financial Stability Sector Financial Stability and Banking Regulations Department REPORT ON THE RISKS IN THE BANKING SYSTEM OF THE REPUBLIC OF MACEDONIA IN THE FIRST QUARTER OF 2016 July 2016
Transcript of REPORT ON THE RISKS IN THE BANKING SYSTEM OF THE …

National Bank of the Republic of Macedonia Supervision, Banking Regulation and Financial Stability Sector
Financial Stability and Banking Regulations Department
REPORT ON THE RISKS IN THE BANKING SYSTEM OF THE REPUBLIC OF MACEDONIA IN THE FIRST QUARTER OF 2016
July 2016

NATIONAL BANK OF THE REPUBLIC OF MACEDONIA
2
Contents
I. Summary .......................................................................................................... 3
II. Bank Risks........................................................................................................ 5
1. Credit risk ....................................................................................................... 6
1.1. The quality of banks’ loan portfolio ...................................................................... 6
1.2. Non-performing loans (non-financial entities)........................................................ 7
1.3. Stress test simulation of the banking system's sensitivity to the increase of credit risk .................................................................................................................. 10
2. Liquidity risk ................................................................................................. 12
2.1. Dynamics and composition of liquid assets .......................................................... 12
2.2. Liquidity ratios .................................................................................................. 17
2.3. Maturity structure of assets and liabilities ............................................................ 20
2.4. Stress-simulations for liquidity shocks ................................................................. 20
3. Currency risk ................................................................................................ 23
4. Interest rate risk in the banking book .......................................................... 27
5. Insolvency risk ............................................................................................. 31
5.1. Indicators for solvency and capitalization of the banking system and risk level of the activities ........................................................................................................... 31
5.2. Movement and quality of the own funds of the banking system ............................. 32
5.3. Movements and structure of capital requirements and available capital of the banking system ............................................................................................................. 33
5.4. Stress-testing of the resilience of the banking system to hypothetical shocks .......... 35
III.STRUCTURAL FEATURES, SIGNIFICANT BALANCE SHEET CHANGES AND PROFITABILITY OF THE BANKING SYSTEM ....................................................... 37
1. Structure of the banking system .................................................................. 38
2. Banks' activities ........................................................................................... 41
2.1. Loans to non-financial entities .............................................................................. 42
2.2. Deposits of non-financial entities .......................................................................... 45
2.3. Other activities ................................................................................................... 48
3. Profitability .................................................................................................. 52
3.1. Income, expenses and indicators of profitability and efficiency of the banking system ............................................................................................................. 52
3.2. Movements in interest rates and interest rate spread ............................................. 57
ANNEXES ............................................................................................................ 58

Report on the Risks in the Banking System of the Republic of Macedonia in the First Quarter of 2016
3
I. Summary
In the first quarter of 2016, in conditions of quarterly decline of gross investments and total GDP, declining consumer prices and deceleration of the current positive trends of the labor market, the overall banks’ activity in the Republic of Macedonia minimally decreased. The quarterly decline of the assets of the banking system by 0.2%, was, entirely, a result of the usual seasonal decline of the assets in the first month of the year, which in 2016 was much more evident compared to the previous years. After relatively high increase of the banking activities with the corporate sector in December 2015, in the next month there were completely opposite movements of decline of the credit support for non-financial companies followed by more significant decrease of the corporate, transaction and short-term deposits, which at the same tame disturbed the multiyear trend of constant denarization of deposits with banks. Despite that, in the first quarter of 2016, the deceleration of the increase in deposits was also evident in the household segment. Household lending continues to be attractive for the banks because, for it, excluding housing loans, higher interest rates are applied, and at the same time no significant additional expenses for the banks are created, because the credit worthiness of the “household” sector, as a whole, still does not register any signs of impairment. The unstable domestic environment in the second quarter of 2016 and the subsequently deteriorating expectations of the economic entities, especially in households, had the withdrawal of deposits from the banking system as a consequence, mostly pronounced in the second half of April 2016. The withdrawal of deposits from banks was simultaneously followed with the increased turnover in the currency exchange market, where the claims of foreign currency registered an increase, which imposed the need of tightening up the monetary policy expressed through increasing the interest rate of the CB bills and reserve requirement rate for banks’ liabilities, in denars with FX clause. In the first quarter of 2016, the quality of the credit portfolio of banking system was maintained. The increase of non-performing loans with almost unchanged credit activity of the banks in the first quarter of 2016, caused nearly minimal increase of the share of non-performing in total loans in 31.3.2016, reaching 10.9%, which was mainly prompted by corporate loans. After the cut-off date of this Report, non-performing loans register a more significant decline, mostly under the influence of the change in the existing regulation of the National Bank, according to which, on 30 June 2016, at the latest, the banks are required to “clean up” credit portfolios of all claims which are entirely reserved for longer than two years. Mandatory cleanup of credit portfolios, from old and entirely scrapped non-performing loans, statistically will improve the indicators for quality of credit portfolio of banks (the share of non-performing in total loans descended to 7.5% in 30.6.2016), but should encourage greater focus in managing with new and less reserved non-performing loans, which can, potentially create losses in the future. The threat for the banks' own assets from the possible materialization of the credit risk from non-performing loans is not high due to their high coverage with allocated impairment, but also due to the satisfactory volume and quality of bank’s own funds. In the first three months of 2016, banks increased the investments in treasury bills, which corresponds with the greater volume of offers of these securities. This, in turn contributed in increasing the liquidity of assets and strengthening the already high liquidity of banks, which in the next period was put to test. Namely, in the second quarter of 2016, the liquid assets of the banks were under direct hit as result to the withdrawal of deposits from banking system. The higher amount of previously accumulated liquid assets, successfully depreciated this crisis
NATIONAL BANK OF THE REPUBLIC OF MACEDONIA
4
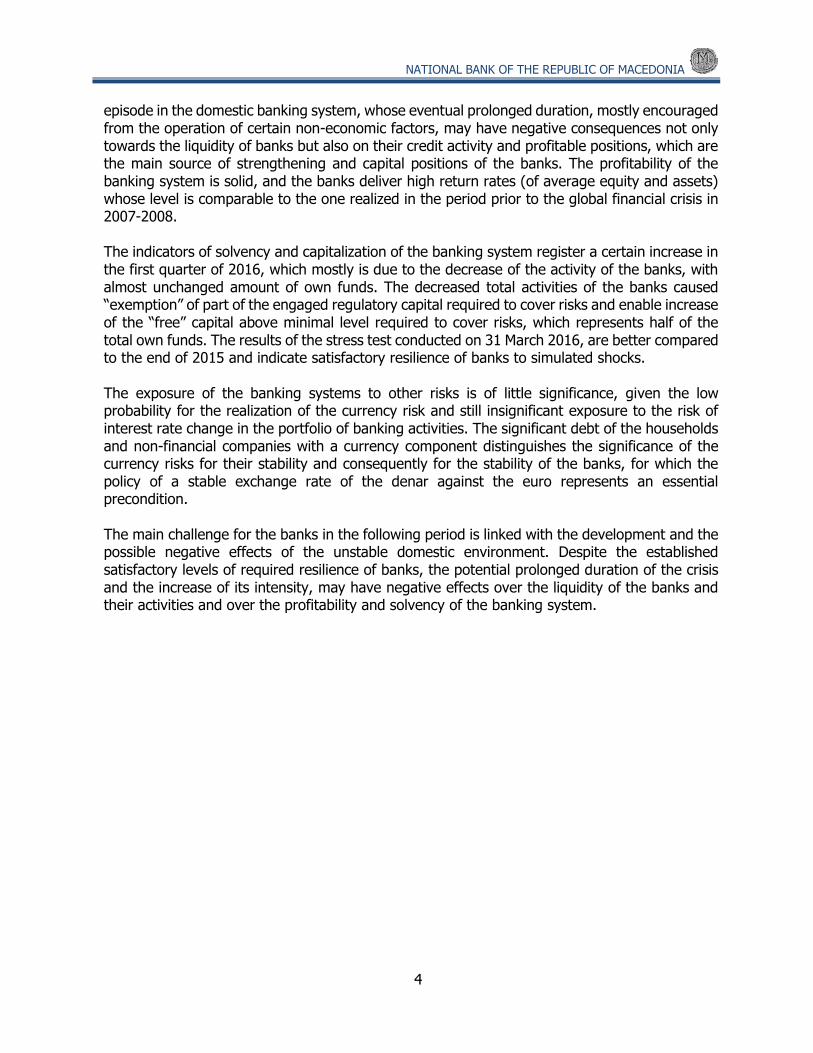
episode in the domestic banking system, whose eventual prolonged duration, mostly encouraged from the operation of certain non-economic factors, may have negative consequences not only towards the liquidity of banks but also on their credit activity and profitable positions, which are the main source of strengthening and capital positions of the banks. The profitability of the banking system is solid, and the banks deliver high return rates (of average equity and assets) whose level is comparable to the one realized in the period prior to the global financial crisis in 2007-2008. The indicators of solvency and capitalization of the banking system register a certain increase in the first quarter of 2016, which mostly is due to the decrease of the activity of the banks, with almost unchanged amount of own funds. The decreased total activities of the banks caused “exemption” of part of the engaged regulatory capital required to cover risks and enable increase of the “free” capital above minimal level required to cover risks, which represents half of the total own funds. The results of the stress test conducted on 31 March 2016, are better compared to the end of 2015 and indicate satisfactory resilience of banks to simulated shocks. The exposure of the banking systems to other risks is of little significance, given the low probability for the realization of the currency risk and still insignificant exposure to the risk of interest rate change in the portfolio of banking activities. The significant debt of the households and non-financial companies with a currency component distinguishes the significance of the currency risks for their stability and consequently for the stability of the banks, for which the policy of a stable exchange rate of the denar against the euro represents an essential precondition. The main challenge for the banks in the following period is linked with the development and the possible negative effects of the unstable domestic environment. Despite the established satisfactory levels of required resilience of banks, the potential prolonged duration of the crisis and the increase of its intensity, may have negative effects over the liquidity of the banks and their activities and over the profitability and solvency of the banking system.

Report on the Risks in the Banking System of the Republic of Macedonia in the First Quarter of 2016
5
II. Bank Risks

NATIONAL BANK OF THE REPUBLIC OF MACEDONIA
6
1. Credit risk
In the first quarter of 2016, the quality of credit portfolio of the banks is almost unchanged compared to the previous quarter. The share of non-performing loans in total loans slightly increased by 0.1 percentage points, and reached 10.9%. The measure of the National Bank1 still has not significantly affected the volume of non-functional credits and respectively, the indicators of the quality of the credit portfolio of the banks2. The coverage of the non-performing loans with an allocated impairment is high and increases, which strengthens the capacity of the banking system for absorbing the unexpected loan losses. In the recent quarters a trend of reduced increase is registered in the restructured loans, even though the share of these loans with a non-performing status increases. Credit risk concentration, observed through the share of large exposures to non-financial entities in the banks' own funds continued decreasing in the first quarter of 2016.
1.1. The quality of banks’ loan portfolio
In the first quarter of 2016, the level of the realization (materialization)3 of the credit risk increased compared to the previous quarter, mainly due to the higher increase of the non-performing loans, in conditions of decrease in total loans. Compared to the first quarter of the previous year, the materialization of the credit risk is lower.
1 NBRM adopted a decision to amend and supplement the Decision on credit risk management (“Official Gazette of Republic of Macedonia” no. 223/15), pursuant to which banks are responsible to transfer claims which are entirely reserved for more than two years in off-balance sheet. Thus, banks will still be allowed and required to take actions to collect these claims. The new decision is applied from 1.1.2016, and the banks are responsible to comply with its regulations until 30.6.2016, at the latest. 2 Effects are registered at the end of June 2016, when the non-performing loan rate comes down to 7.5%. 3 The realization of the credit risk as a sum of the quarterly changes of the positions whose increase (decrease) represents the realization (decrease of the realization) of credit risk of non-performing loans, regular reconstructed credits, non-reconstructed credits late from 61 up to 90 days, write-offs of receivables and assets taken on the basis of uncollected claims.Total change in gross loans refers to the annual change in gross loans including the change in the written-off loans and assets foreclosed on the basis of uncollected claims, as they were loans in the past.
Chart 1 Materialization of credit risk in banks' credit portfolios in millions of denars
Source: NBRM's Credit Registry, based on data submitted by banks.

Report on the Risks in the Banking System of the Republic of Macedonia in the First Quarter of 2016
7
The concentration of credit exposures, observed through the share of high risk exposures4 towards non-financial entities in banks’ own funds, is also a credit risk indicator. This indicator, at the end of the first quarter of 2016, indicates reduction of the credit risk compared to the end of the previous quarter. Although it is about the so called high exposures, the low average percentage of impairment of these claims is 1.2% (risk category “A”), which indicates that the banks do not have significant problems with their collection.
1.2. Non-performing loans (non-financial
entities)
In the first quarter of the year, non-performing loans, as a basic measure of the changes in the quality of the loan portfolio of the banking system, increased by 1%, compared to the reduction (-3.5%) in the previous quarter.
The changes of non-performing
loans are mostly determined from the non-performing loans of non-financial companies which occupy nearly 80% of total non-performing loans. In general, non-performing loans from corporate sector register an upward trend, compared to households, which gradually decreases. In fact, these trends confirm the lower credit risk for the banks from their exposure towards households, due to absence of high exposure per client, lower individual amounts of loan, more yield-baring placements, easier collection, simpler approval procedure etc.
4 Large exposure to a person or persons related thereto is an exposure equal to or higher than 10% of bank's own funds.
Chart 3 Quarterly increase of non-performing loans (for non-financial entities) in millions of denars and in %
Source: NBRM's Credit Registry, based on data submitted by banks.
Chart 4 Share of non-performing loans in total loans (non-financial entities) in %
Source: NBRM's Credit Registry, based on data submitted by banks.
Chart 2 Share of large exposures to non-financial companies in banks’ own funds in %
Source: NBRM's Credit Registry, based on data submitted by banks.

NATIONAL BANK OF THE REPUBLIC OF MACEDONIA
8
The quality of the loan portfolio in the banking system, observed through the rate5 of non-performing loans, remained almost unchanged compared to the previous quarter. Namely, the rate of non-performing loans is 10.9% and is higher by 0.1 percentage point compared to the previous quarter. According to the sectors, the quality of the loan portfolio improves in households, compared to the non-financial companies, where this rate registers a deterioration by 0.5 percentage points.
Within the “non-financial
companies” sector, in the first quarter 2016, the increase of the rate of non-performing loans mostly reflects “wholesale and retail” and “industry” businesses.
In households, a reduction trend is noticed in the share of non-performing in total loans among all loan products. The loans for residential and commercial properties have the lowest rate of non-performing loans, whereas costumer loans have an above average
5 The rate of non-performing loans shows the share of non-performing loans in total loans.
Chart 6 Share of non-performing loans in total household loans, by credit products (left) and quarterly increase of non-performing loans intended for consumption in % in millions of denars in %
Source: NBRM's Credit Registry, based on data submitted by banks.
Chart 5 Share of non-performing loans in total loans of non-financial companies, by activity in %
Source: NBRM's Credit Registry, based on data submitted by banks.

Report on the Risks in the Banking System of the Republic of Macedonia in the First Quarter of 2016
9
rate of non-performing loans (within which, in the first quarter of 2016, non-performing consumer loans have the highest quarterly increase)
In the analyzed period, there is a
concentration of the credit risks in few banks, measured through the share of non-performing in total loans of the non-financial companies and households. Therefore, the rate of non-performing loans of non-financial companies is determined by few banks where this share exceeds 10%. In the first quarter of 2016 in non-financial companies, a divergence of the rates of non-performing loans in individual banks is registered, compared to the rates of non-performing loans in households, where the trend of convergence towards the median and the rate on banking system level continues.
The coverage of non-performing loans with allocated impairment is high and minimally increased compared to the previous quarter. The high reserve level of non-performing loans enables satisfying capacity of the banking system for absorbing the unexpected loan losses. The increase of coverage of non-performing loans, which is due to the faster increase of impairment from the increase of non-performing loans, indicates into observing banks for the increasing risks of these loans, primarily of the non-financial companies.
Chart 8 Coverage of non-performing loans and share of net non-performing loans in banks' own funds in %
Source: NBRM's Credit Registry, based on data submitted by banks.
Chart 7 Share of non-performing loans in total loans to companies (top) and households (below), by individual bank, in %
Source: NBRM's Credit Registry, based on data submitted by banks.

NATIONAL BANK OF THE REPUBLIC OF MACEDONIA
10
Restructuring gives the client the possibility to ease the credit “load” with an appropriate adjustment of the credit terms of the current difficult condition of the client. In the first quarter of 2016, the trend of gradual increase of the share in non-performing loans within restructured loans continued. However, the share of restructured loans in total loans is not high (5.7%) and it decreases.
Write-offs made in the first quarter
of 2016 reached Denar 405 million. Almost half of this amount is due to the mentioned regulatory change in December 20156 for cleaning the portfolio from exposures which are entirely reserved for longer than two years. Therefore, if the effect of all write-offs from the first quarter of 2016 is exempted, the quarterly rate of increase in non-performing loans will be 2.3% instead of 1.0%. Most of the write-off claims (77%) are related to non-financial companies. 1.3. Stress test simulation of the banking
system's sensitivity to the increase of credit risk
Regular stress tests are aimed to
investigate the sensitivity of the banking system during the deterioration of the quality of certain segments of the loan portfolio. They consist of simulations of hypothetical migration of 10%
6 NBRM adopted a decision to amend and supplement the Decision on credit risk management (“Official Gazette of Republic of Macedonia” no. 223/15)
Chart 10 Amount of write-offs by quarters in millions of denars
Source: NBRM's Credit Registry, based on data submitted by banks.
Chart 9 Structure of restructured loans by their status (regular/non-performing), by quarter in millions of denars and in %
Source: NBRM's Credit Registry, based on data submitted by banks.

Report on the Risks in the Banking System of the Republic of Macedonia in the First Quarter of 2016
11
(first simulation) and 30% (second simulation) of credit exposure to non-financial companies (by activity) and households (by credit product), separately, and to the two sectors jointly, to the following two higher risk categories. The results of the simulations show resilience of the banking system to the simulated shocks. They register significant improvement compared to the previous quarter, which is mainly due to the higher rate of the capital adequacy prior stimulations.The largest decrease in the capital adequacy ratio during the implementation of the two simulations was recorded in the case of deterioration of the creditworthiness of clients from the “industry” and “wholesale and retail trade” businesses.
Chart 11 Capital adequacy ratio, by activity, before and after the first (top) and the second (bottom) simulation for both sectors in %
Source: NBRM's Credit Registry, based on data submitted by banks.

NATIONAL BANK OF THE REPUBLIC OF MACEDONIA
12
2. Liquidity risk In the first quarter of 2016, the banks of the Republic of Macedonia had
sufficient amount of liquid assets, which ensured their uninterrupted operational activity. The liquid assets of the banks registered an increase at the end of the quarter, which also improved the indicators for liquidity. The increasing instability of the domestic environment, which represents a limiting factor not only for the banks but also for all economic entities, influenced the change of the expectations of the economic entities. In April 2016, this resulted in the realization of the liquidity risk for the banks, through outflows of deposits and increased claims for foreign currencies, especially from the population, which, given the high amount of liquid assets that traditionally banks have, were promptly serviced by the banks7. The stimulations for banking system resilience on liquidity shocks confirms that liquid assets of the banking system are in sufficient amount for covering extreme hypothetical liquid outflows.
2.1. Dynamics and composition of
liquid assets
Liquid assets8 on banking system level, at the end of the first quarter were Denar 128.972 million and compared to the end of 2015 they register a mild increase of 0.6%, respectively, Denar 792 million. The increase that was realized in the first quarter of 2016 also determined this year’s increase of liquid assets by 0.5% (March 2016 – March 2015). The low yields that are carried by the liquid financial instruments and the gradual strengthening of the propensity for undertaking credit risk through financing domestic economic entities, influenced the increase of liquid assets with a slower pace and at the same time their increase should be more modest compared to the increase of total loans or of the total assets of banks. Therefore, in 31.3.2016, the annual rate increase of liquid assets was remarkably lower compared to the increase of total loans (8.6%) that indicates that undertaking the credit
7 As a result of the negative impact of non-economic factors on the expectations of domestic economic entities, during April 2016 came to a decrease of the deposits in banks and increase of foreign currency claims, which in the second quarter influenced the National Bank to increase the interest rates for CB bills for 0.75 percentage points, which starting 11.5.2016 is 4%. 8 The liquid assets encompass: 1) assets and claims on the National Bank, which include cash, assets on the accounts of banks with the National Bank, deposit facility with the National Bank and CB bills; 2) short-term deposits with foreign banks, including the assets of the banks on their correspondent accounts abroad and 3) the carrying amount of the investments in securities issued by the central governments, so called government securities issued by Republic of Macedonia and by foreign governments. For the purposes of analyzing the liquidity, assets and liabilities in denars with foreign exchange clause are considered denar assets and liabilities.
Chart 12 Liquid assets, structure and annual increase rate in millions of denars and in %
Source: NBRM, based on the data submitted by banks.
61,551
58,769 58,024
34,083 36,384 38,403
32,655 33,027 32,545
6.3
-0.20.5-0.2
2.7 0.6
-3
0
3
6
9
12
-35,000
0
35,000
70,000
105,000
140,000
Q1 2015 Q2 2015 Q3 2015 Q4 2015 Q1 2016
Short-term deposits at foreign banks (left scale)
Government securities (left scale)
Cash and claims on NBRM (left sclae)
Annual rate of change (right scale)
Quarterly rate of change (right scale)

Report on the Risks in the Banking System of the Republic of Macedonia in the First Quarter of 2016
13
risks from banks, follows the change of the expectations of economic entities with a delay.
The instable domestic environment
represented real stress-test in terms of the volume of liquid assets, especially in conditions of increased volatility of the sources for financing of banks. Therefore, in the middle of April 2016, the deteriorating expectations of the economic entities, and especially the population, caused withdrawal of deposits outside the banking system and increase in claims of foreign currencies. This also represented the reason for the reduction of liquid assets of banks by 6.3% during April 20169.
In the first quarter of 2016, the
increase of the liquid assets of banks was mainly due to their placements in government securities. At the end of March 2016, these placements increased by 5.6% on a quarterly basis, respectively by 12.7% on an annual basis. In the first quarter of 2016, other components of liquid assets of banks decreased, which were slightly more pronounced in the investments of the financial instruments in the National Bank compared with short-term FX currency assets in foreign banks, despite the trend of interest rates in international markets, the placement of the FX currency assets in the banks, brings almost no income to domestic banks. The changes of the main components of the liquid assets of the banks, caused increase in the structural share of the government securities of 28.4% at the end of 2015 and 29.8% at the end of the first quarter of 2016.
The decrease of cash assets and
claims of the banks from the National Bank in the first quarter of 2016, primarily is due to the quarterly decrease in deposit facilities10 in the National Bank, by 10.4%, thus registering a decrease for two consecutive quarters.
9 Except on monthly basis, at the end of April 2016 liquid assets are also reduced on annual basis by 5.1%, as well as quarterly basis by 3.2%. 10 According to the Decision on the deposit facility ("Official Gazette of the Republic of Macedonia" No. 49/12, 18/13, 50/13 and 166/13), the banks could place deposits with the National Bank every working day with a maturity of one business day and once a week with a maturity of seven days. These deposits are placed without the possibility of partial or full early withdrawal. In the first quarter of 2016, the interest rates on these deposits equaled 0.25% on overnight deposits and 0.5% on seven-day deposits.
Chart 14 Amount of cash and claims on National bank (up) and their quarterly change (down) by induvial components in millions of denars
Source: NBRM, based on the data submitted by banks.
-6.000
-3.000
0
3.000
6.000
9.000
12.000
Q1 2015 Q2 2015 Q3 2015 Q4 2015 Q1 2016
15.697 15.891 16.720
12.860 8.921 7.995
25.46525.045 24.576
7.530 8.912 8.733
0
10.000
20.000
30.000
40.000
50.000
60.000
70.000
12.2
014
1.20
15
2.20
15
3.20
15
4.20
15
5.20
15
6.20
15
7.20
15
8.20
15
9.20
15
10.2
015
11.2
015
12.2
015
1.20
16
2.20
16
3.20
16
4.20
16
funds on account at NBRM deposit facilities at NBRM
NBRM bills cash at banks
Chart 13 Quarterly (up) and annual (down) change of liquid assets by induvial components in millions of denars
Source: NBRM, based on the data submitted by banks.
-745
2.018
-481
-6.000
-4.000
-2.000
0
2.000
4.000
6.000
Q1 2015 Q2 2015 Q3 2015 Q4 2015 Q1 2016
-3.527
4.320
-109
-10.000
-5.000
0
5.000
10.000
15.000
Q1 2015 Q2 2015 Q3 2015 Q4 2015 Q1 2016
Short-term deposits at foreign banks
Government securities
Cash and claims on NBRM

NATIONAL BANK OF THE REPUBLIC OF MACEDONIA
14
Investment of banks in CB bills of the National Bank, during the first quarter of 2016 registered a modest decrease11. The cash in banks disposal and their funds in the accounts of the National Bank12 in the first quarter of 2016 registered an increase, but their size was not enough to compensate the decrease of the placements of the deposit facilities.
In the primary market of the continuous13
government securities, in the first quarter of 2016 a greater amoun of seccurities was offered, which was more expressed in treasury bills. But, despite the gradual increase of the interest rates that were offered in the auctions of treasury bills14, and consequently the increase of their attractiveness in terms of expected yield, still the claims of market participants from of the primary market was slightly lower from the offered amount. The net issued15 amount of government securities in the first quarter of 2016 was Denar 4.362 million and compared to the previous quarter it registers a decrease of Denar 1.247 million. Almost 90% of net issued amount of government securities is due to the issuance of treasury bills.
Banks still have the role of the most important investor in the primary government securities market, with a share of 46.2% in the total value of the issued government securities. Despite the gradual decrease of this share (on an annual basis is lower than 1.5 percentage points), still the yield and characteristics of these
11 This is due to the weaker claims of the banks as a result of the changes in the basis through which the maximum amount of their participations in the auctions is determined. According to the Decision on CB bills (Official Gazette of the Republic of Macedonia No. 166/13, 30/15, 35/15 and 148/15), when conducting CB bills auctions through tenders with amounts and determined original amount, the National Bank can limit auction offers of individual banks, on the basis of their percentage share in denar liabilities on banking system level from the basis of calculating the reserve requirement, for the period of fulfillment, starting on the day of the auction. 12 According to the Decision on the reserve requirement ("Official Gazette of the Republic of Macedonia" No. 153/12, 98/13, 166/13, 143/14, 30/15, 35/15 and 148/15), the average daily outstanding amounts on the bank account at the National Bank are used to meet the total calculated reserve requirement of banks based on their liabilities in denars and liabilities in denars with FX clause, as well as 30% of the calculated reserve requirements of banks on the basis of their foreign currency liabilities. Banks can fully utilize their assets on the account with the National Bank on a daily basis. 13 Treasury bills and government bonds issued by the financial market are considered as continuous government securities, not including structural securities, i.e. denationalization bonds. 14 Auctions of treasury bills and government bonds were conducted through tenders with amounts with predetermined interest rate. 15 Net issued amount obtained as a difference between the realized amount in auctions of government securities for a specific period of time and the amount of government securities submitted at the same period of time.
Chart 15 Supply and demand of government securities (up) and net issued amount of government securities and average interest rate in the primary market (down) in millions of denars and in %
Source: National Bank and Ministry of Finance. Note: As a weight while calculating the average interest rate of the newly issued securities in a particular quarter, the appropriate nominal amount
of each individual auction in the appropriate quarter is taken.
0
5.000
10.000
15.000
20.000
Q1 2015 Q2 2015 Q3 2015 Q4 2015 Q1 2016
Supply of treasury bills Demand for treasury bills
Supply of treasury bonds Demand for treasury bills
-1,0
0,0
1,0
2,0
3,0
4,0
5,0
-2.000
0
2.000
4.000
6.000
8.000
10.000
Q1 2015 Q2 2015 Q3 2015 Q4 2015 Q1 2016
Net issued ammount of government securities (left scale)
Weighted average interest rate of treasury bills from auctionsheld in respective quarter (right scale)
Weighted average interest rate of treasury bonds fromauctions held in respective quarter (right scale)

Report on the Risks in the Banking System of the Republic of Macedonia in the First Quarter of 2016
15
financial instruments16, and the modest offer of other alternative for the placement of their liquidity, make them attractive for the domestic banks. Hence, investments in these financial instruments have an important place in the structure of the liquid assets of banks, with a share of 29.8% at the end of the first quarter in 2016. The increased investment of banks in government securities on a quarterly basis is due to the investments in treasury bills, which have a share of more than 67% in the total portfolio of the government securities of the banks. Investments in government bonds issued by the Republic of Macedonia in the first quarter of 2016 decreased by Denar 1.057 million, thus their share in the structure of government securities of banks decreased on an quarterly basis by 4.7 percentage points (in 31.3.2016 was 31.6%). The largest share of bonds issued by the Republic of Macedonia owned by domestic banks are with a relatively short contractual maturity17, despite the fact that emissions with a maturity of ten and fifteen years were realized in the market. Investments in government bonds issued by foreign countries have a modest share of 1% in the total portfolio of government securities of the banks.
The assets placed in foreign banks
with contractual maturity lower than one year, are the most important foreign currency
16 According to the list of securities for implementing monetary operations (Official Gazette of the Republic of Macedonia No. 126/11), government securities can only be used as a security instrument while conducting monetary operations from the National Bank, which gives them the opportunity to be used in operational liquidity management. At the same time, according to paragraph 47 from the Decision on the methodology for determining capital adequacy (“Official Gazette of the Republic of Macedonia” no. 47/12, 50/13, 71/14 and 223/15), for the claims of the banks from central government of the Republic of Macedonia, while calculating the credit risk weighted assets, a risk weigh of 0% is applied, which practically means that for investing in government securities banks do not need to calculate the capital need for covering the credit risk. 17 In 31.03.2016, domestic government bonds issued with a maturity of two or three years, jointly form over 71.2% of bonds owned by banks, respectively 22.5% of total government securities owned banks.
Chart 17 Movements of short-term deposits in foreign banks (up) and changes in liquidity assets according to foreign currency characteristics (down) in millions of denars and in %
Source: NBRM, based on the data submitted by banks.
0
4.000
8.000
12.000
16.000
20.000
Q1 2015 Q2 2015 Q3 2015 Q4 2015 Q1 2016
overnight assets and assets without contractual maturity
with maturity up to one month
with maturity from one month up to three months
with maturity from three months up to twelve months
3,2
-0,2 -0,1
15,5
-0,3
2,1
-8
-4
0
4
8
12
16
-4.000
-2.000
0
2.000
4.000
6.000
8.000
Q1 2015 Q2 2015 Q3 2015 Q4 2015 Q1 2016quarterly absolute change of foreign exchange liquid assets(left scale)quarterly absolute change of denar liquid assets (left scale)
annual rate of change of denar liquid assets (right scale)
annual rate of change of foreign exchange liquid assets(right scale)
Chart 16 Structure of continuous government securities owned by banks in %
Source: National Bank and Ministry of Finance Note: Structure of continuous government securities is displayed based on their nominal value, excluding foreign government bonds which are displayed in net in net fair value.
0
7.000
14.000
21.000
28.000
35.000
42.000
Q1 2015 Q2 2015 Q3 2015 Q4 2015 Q1 2016
treasury bills 2 year treasury bonds 3 year treasury bonds
5 year treasury bonds 10 year treasury bonds 15 year treasury bonds
foreign treasury bonds

NATIONAL BANK OF THE REPUBLIC OF MACEDONIA
16
component of the liquid assets of the banks18, which decreased in the first quarter of 2016. Most of the short term assets invested in foreign banks are placed overnight, respectively are found in the correspondent accounts of domestic banks abroad19, which usually bring low and even negative yields as a result of the current placement of the monetary instruments of the important central banks in the world and low interest rates for the international financial markets. In the first quarter of 2016, some reduction is registered in the maturity of these assets (slight decrease of the assets with a maturity of three to twelve months, at the expense of assets with a maturity of one month). The decrease of the short term assets in foreign banks in the first quarter of 2016, influenced in the reduction of the foreign currency liquid assets of banks, but their share in the total liquid assets of the banks of 28.6% is unchanged compared to the end of 2015.
During the first quarter of 2016, interest
rates of domestic interbank market (SKIBOR) registered a slight increase, whereas the interest rates of the interbank market in the Euro area (EURIBOR) registered a decline. In the first quarter of 2016, these divergent movements of the interbank interest rates caused the increase of the range between them20. Thus, after the several-year trend of gradual decrease of this range and reaching the historically lowest level in the third quarter of 2015, during the last quarter of 2015 and the first quarter of 2016, its expansion started to get noticed. In the interbank market in the euro area, since the last quarter of 2015, started a
18 Despite short-term deposits in foreign banks, including bank assets in their corresponding accounts in foreign banks, as part of the liquid foreign currency assets, the invesment in government securities nominated in forreign currencies are also included as well as foreign currency cash in banks. According to the Decision on foreign currency deposit in the National Bank of the Republic of Macedonia (“Official Gazette of the Republic of Macedonia” no 87/16), starting from 6.5.2016, the banks can place deposits in euros in the National Bank with an interest rate determined by the governor, whereas according to the regulations from the previously valid Decision on foreign currency deposit in the National Bank of the Republic of Macedonia (“Official Gazette of the Republic of Macedonia” no. 42/2011), banks can place deposits like these with an interest rate which was equal to the interest rates of the assets placed in the central banks of the Euro area, in international financial institutions and yield of treasury bills in member states of Euro Area. 19 Banks can immediately use these FX liquid assets for performing their operational activities, primarily for payments in foreign currencies for the bank and/or its clients. 20 The range between SKIBOR and EURIBOR for the corresponding maturity, at the end of the first quarter in 2016, and implemented by the end of 2015, was increased in interval of around 9 basis points (for maturity of 6 months) to 20 basis points (for a maturity of one year).
Chart 18 Movements of the key interbank interest rates SKIBOR (up) EURIBOR (middle) and LIBOR for US dollars (down) in %
Source: The National Bank and the internet site of the European Money Market Institute for EURIBOR and the internet site of the Federal Reserve’s Bank from St. Luis (so called FRED) for LIBOR for US dollars.
-0,4
-0,3
-0,2
-0,1
0,0
0,1
0,2
0,3
0,4
01.2
015
03.2
015
05.2
015
07.2
015
10.2
015
12.2
015
02.2
016
04.2
016
1 week 2 weeks 1 month2 months 3 months 6 months9 months 12 months
0
0,5
1
1,5
2
2,5
3
3,5
4
02.0
1.2
015
10.0
2.2
015
16.0
3.2
015
21.0
4.2
015
27.0
5.2
015
01.0
7.2
015
06.0
8.2
015
11.0
9.2
015
16.1
0.2
015
20.1
1.2
015
25.1
2.2
015
03.0
2.2
016
08.0
3.2
016
11.0
4.2
016
over night 1 week 1 motnh3 months 6 months 9 months12 months
0,0
0,2
0,4
0,6
0,8
1,0
1,2
1,4
12.2
014
03.2
015
05.2
015
07.2
015
10.2
015
12.2
015
02.2
016
04.2
016
over night1 month3 months6 months12 months

Report on the Risks in the Banking System of the Republic of Macedonia in the First Quarter of 2016
17
trend of more sharpened decrease of the interest rates, which was more intensified in the first quarter of 2016. Therefore, EURIBOR registered a negative value not only in shorter maturities, but also in the largest maturity of twelve months. the base of these movements was represented by the signals that were sent by the European Central Bank for taking additional measures for further relaxation of the monetary policy to influence a greater deflation of the Euro area, which during March 2016 were transferred concrete decisions for the placement of the instruments of its monetary policy21. Contrary to this, in the domestic interbank market, mainly as a result of the instable domestic environment and the spillover effects from it, came to upward movement of interbank interest rates in denars.
Additional factors that influenced
perceptions of risks from market participants, and consequently, which is reflected on the risk premium incorporated by market participants with interest rates in denars, represented increase of the base interest rate in the US Central Bank (Federal Reserves) in December 201522. Even though this increase was foretold and market participants were expecting it, still reflected through upward movement of the level of international rates in US dollars.
2.2. Liquidity ratios In the first quarter of 2016, liquidity
ratios of the banking system23 were mainly increasing primarily due to the reduction of various categories of liabilities and total bank assets. The only exception is the indicator for the coverage of household deposits with liquid assets, which decreased primarily due to the growth of household deposits in the first quarter of the year.
21 Review of the decisions of the European Central Bank for monetary policy from March 2016 is available in the following internet address: https://www.ecb.europa.eu/press/pr/date/2016/html/pr160310.en.html. 22 Federal Reserves of USA, in 16.12.2015 announce increase of the targeted interval for basis interest rate by 0.25 percentage points, thus the new the newly placed interval is from 0.25% to 0.5%. For more information visit https://www.federalreserve.gov/newsevents/press/monetary/20151216a.htm. 23 The calculation of liquidity of the banking system does not take into account resident interbank assets and liabilities.
Chart 19 Movement of the range of SKIBOR in relation to EURIBOR and LIBOR for US-Dollar, for selected maturities in percentage points
Source: Calculation of the National Bank, based on publicly available data for interbank interest rates.
0,0
0,5
1,0
1,5
2,0
2,5
12.2
014
01.2
015
02.2
015
03.2
015
04.2
015
05.2
015
06.2
015
07.2
015
08.2
015
09.2
015
10.2
015
11.2
015
12.2
015
01.2
016
02.2
016
03.2
016
04.2
016
SKIBOR 1 week - EURIBOR 1 weekSKIBOR 1 months - EURIBOR 1 monthsSKIBOR 3 months - EURIBOR 3 monthsSKIBOR 1 month - LIBOR for USD 1 monthSKIBOR 3 month - LIBOR for USD 3 month
Chart 20 Liquidity ratios of the banking system in %
Source: NBRM, based on the data submitted by banks.
33.1
31.4 31.6
59.5
54.9 55.7
61.0 59.5 59.4
47.5
44.1 44.2
92.8
76.480.6
20
30
40
50
60
70
80
90
100
12.2014
1.2015
2.2015
3.2015
4.2015
5.2015
6.2015
7.2015
8.2015
9.2015
10.2015
11.2015
12.2015
1.2016
2.2016
3.2016
4.2016
Liquid assets / Total assets
Liquid assets / Short-term liabilities
Liquid assets / Households deposits
Liquid assets / Liabilities with residual maturity up to one year
Liquid assets / Liabilities with residual maturity up to 30 days

NATIONAL BANK OF THE REPUBLIC OF MACEDONIA
18
Heterogeneity of liquidity ratios24 among banks25 has been increasing, i.e. there are growing differences among banks in terms of the dynamics of their liquid assets and the categories of liabilities.
In the first quarter of 2016, the
loan/deposit ratio of non-financial entities continued increasing. Moreover, this ratio is more than one standard deviation above its five-year moving average, as well as above the twelve-month moving average. This ratio increased due to the somewhat faster quarterly deposit decline, compared with the decline in loans to non-financial entities. The growth of this ratio indicates lower funding of loans with deposits, which is also an alert of higher liquidity risk. Banks where this ratio is over 100%26 needs to be particularly cautious since this indicates that the lending has been financed by non-deposit sources, which are generally regarded as volatile source of funding. At the end of the first quarter of 2016, the loan/deposit ratio of five banks with a joint share in total assets of 22.2% (six banks with a share of 23.8% as of 31 December, 2015) is over 100%.
24 In the first quarter of 2016, the interquartile differences in liquidity ratio increased (excluding the coverage of liabilities with residual maturity up to 30 days).
25 At the end of the first quarter of 2016, the share of liquid assets in total assets ranged from 13.7% to 41.3% with a median of 29.0%. The coverage of short-term liabilities with liquid assets ranged from 28.0% to 98.2% with a median of 56.1%, while the coverage of liabilities with residual maturity up to 30 days ranged from 31.9% to 164.6%, with a median of 84.6%. 26 As of 31 March 206, the loan/deposit ratio, by bank ranges from 71.2% to 128.4% (from 72.5% to 128.7% at the end of 2015) with a median of 96.3% (95.3% as of 31 December 2015).
Chart 21 Share of liquid in total assets (up), coverage of short-term liabilities with liquid assets (middle) and of liabilities with residual maturity up to 30 days (down), by bank in %
Source: NBRM, based on the data submitted by banks.
0
10
20
30
40
50
3.2015 6.2015 9.2015 12.2015 3.2016individual banks median
0
35
70
105
140
3.2015 6.2015 9.2015 12.2015 3.2016
0
50
100
150
200
250
300
3.2015 6.2015 9.2015 12.2015 3.2016
Chart 22 Dynamics of loan/deposit ratio of non-financial entities in %
Source: NBRM, based on the data submitted by banks.
Note: The shaded part in the chart denotes the range of one standard deviation above and below the five-year moving average of the indicator.
88.7
90.6 90.8
88.9
90.5
85
87
89
91
93
95
12.2
013
2.2
014
4.2
014
6.2
014
8.2
014
10.2
014
12.2
014
2.2
015
4.2
015
6.2
015
8.2
015
10.2
015
12.2
015
2.2
016
4.2
016
loans / depositsfive year moving averagetwelve months moving average

Report on the Risks in the Banking System of the Republic of Macedonia in the First Quarter of 2016
19
In the first quarter of 2016, the liquidity ratios by the currency feature of assets and liabilities showed divergent movement. Liquidity ratios in denars have mainly increased, while foreign currency liquidity ratios have been stable or modestly lower. Higher banks' investments in government securities, as a financial instrument with an expected cash flow in denars, have increased denar liquid assets, which amid quarterly decline in banks’ funding sources (deposits) with an expected cash flow in denars27 have increased the denar liquidity ratios. On the other hand, in the first quarter of 2016, depositors preferred to hold foreign currency in banks, which coupled with the modest decline in foreign currency liquid assets, decreased the foreign currency liquidity ratios.
Liquidity ratios of the banking system28 presented as a ratio between assets and liabilities that fall due in the following 30 and 180 days significantly exceeded the required minimum of 1.
27 Banks accept and return denar deposits and denar deposits with foreign currency clause in denars and therefore they have an expected cash flow (inflow or outflow) in denars. According to the Law on Foreign Exchange Operations, banks accept and return foreign currency deposits in the respective foreign currency and therefore, have an expected cash flow (inflow or outflow) in foreign currency. 28 Decision on banks' liquidity risk management (Official Gazette of the Republic of Macedonia No. 126/11, No. 19/12 and 151/13).
Chart 24 Liquidity ratios of the banking system in points
Source: NBRM, based on the data submitted by banks.
2.272.07 2.17
1.59 1.50 1.48
0
1
2
3
12.2
014
01.2
015
02.2
015
03.2
015
04.2
015
05.2
015
06.2
015
07.2
015
08.2
015
09.2
015
10.2
015
11.2
015
12.2
015
01.2
016
02.2
016
03.2
016
04.2
016
up to 30 days up to 180 days
Chart 23 Banking system liquidity ratios, according to currency structure - Denars (top) and FX (bottom) in %
Source: NBRM, based on the data submitted by banks.
32.5 30.1 30.3
78.9 70.2 72.5
85.581.9
82.3
121.1 124.5 126.4
63.456.1 57.3
112.2 92.195.6
0
20
40
60
80
100
120
140
3.2015 6.2015 9.2015 12.2015 3.2016
34.8 35.6 35.836.3
35.535.0
34.9 35.4 34.7
46.244.2 42.6
28.8 28.2 27.9
63.0
55.9 57.6
20
30
40
50
60
70
3.2015 6.2015 9.2015 12.2015 3.2016
Liquid assets / Total assets
Liquid assets / Short-term liabilities
Liquid assets / Household deposits
Loans / Deposits
Liquid assets / Liabilities with residual maturity up to 1yearLiquid assets / Liabilities with residual maturity up to30 days
NATIONAL BANK OF THE REPUBLIC OF MACEDONIA
20
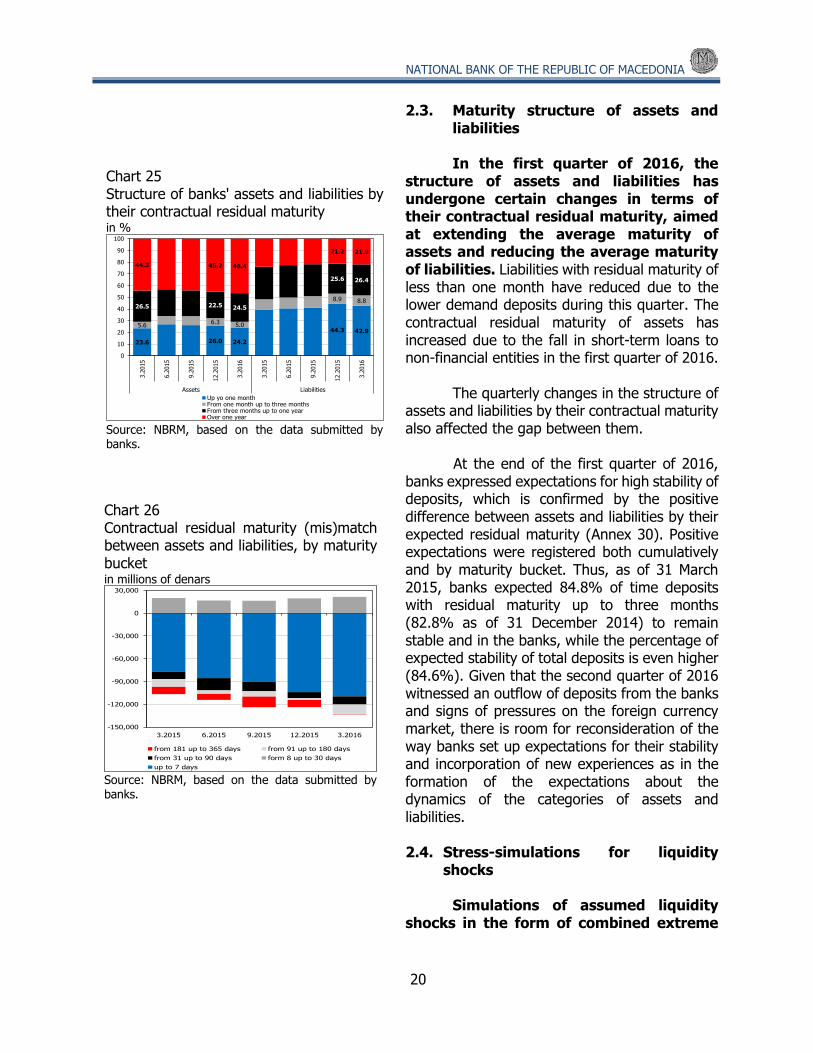
2.3. Maturity structure of assets and liabilities In the first quarter of 2016, the
structure of assets and liabilities has undergone certain changes in terms of their contractual residual maturity, aimed at extending the average maturity of assets and reducing the average maturity of liabilities. Liabilities with residual maturity of less than one month have reduced due to the lower demand deposits during this quarter. The contractual residual maturity of assets has increased due to the fall in short-term loans to non-financial entities in the first quarter of 2016.
The quarterly changes in the structure of
assets and liabilities by their contractual maturity also affected the gap between them.
At the end of the first quarter of 2016, banks expressed expectations for high stability of deposits, which is confirmed by the positive difference between assets and liabilities by their expected residual maturity (Annex 30). Positive expectations were registered both cumulatively and by maturity bucket. Thus, as of 31 March 2015, banks expected 84.8% of time deposits with residual maturity up to three months (82.8% as of 31 December 2014) to remain stable and in the banks, while the percentage of expected stability of total deposits is even higher (84.6%). Given that the second quarter of 2016 witnessed an outflow of deposits from the banks and signs of pressures on the foreign currency market, there is room for reconsideration of the way banks set up expectations for their stability and incorporation of new experiences as in the formation of the expectations about the dynamics of the categories of assets and liabilities. 2.4. Stress-simulations for liquidity
shocks Simulations of assumed liquidity
shocks in the form of combined extreme
Chart 25 Structure of banks' assets and liabilities by their contractual residual maturity
in %
Source: NBRM, based on the data submitted by banks.
23.6 26.0 24.2
44.3 42.95.6
6.3 5.0
8.9 8.826.5 22.5 24.5
25.6 26.4
44.3 45.2 46.4
21.2 21.9
0
10
20
30
40
50
60
70
80
90
100
3.2
015
6.2
015
9.2
015
12.2
015
3.2
016
3.2
015
6.2
015
9.2
015
12.2
015
3.2
016
Assets Liabilities
Up yo one monthFrom one month up to three monthsFrom three months up to one yearOver one year
Chart 26 Contractual residual maturity (mis)match between assets and liabilities, by maturity bucket in millions of denars
Source: NBRM, based on the data submitted by banks.
-150,000
-120,000
-90,000
-60,000
-30,000
0
30,000
3.2015 6.2015 9.2015 12.2015 3.2016
from 181 up to 365 days from 91 up to 180 days
from 31 up to 90 days form 8 up to 30 days
up to 7 days

Report on the Risks in the Banking System of the Republic of Macedonia in the First Quarter of 2016
21
outflows of sources of financing29 outside the banks within 30 days, show that banks have reasonable resilience to extreme shocks due to their volume of liquid assets. The combination of such extreme liquidity outflows fully absorbs the liquid assets of the banking system (over 100%). Shortage of liquidity would have been reported by ten banks (of Denar 18,295 million) with a joint share in total assets of the banking system of 56.8% at the end of the first quarter of 2016. After this integrated liquidity shock, the share of liquid assets in total assets of the other four banks would have ranged from 0.6% to 19.3%. If for the purposes of this simulation, these liquid assets also include other financial instruments30 that are assumed to have been recoverable relatively quickly and easily or convertible into cash within 30 days, the fall of liquid assets of the banking system would have been 90.9%, which means that even after such shocks, banks would have hold certain amount of cash.
When applying individual assumed
liquidity shocks, banks show that they hold sufficient liquid assets to settle simulated outflows.
Significant liquidity shocks that are
combined for the purposes of this simulation include simulations of outflow of deposits of 20 largest depositors and outflow of 20% of household deposits, which is quite expected considering the business model of domestic banks, i.e. the structure of their sources of funding. These two hypothetical liquidity shocks jointly constituted almost 70% of the result of simulation of combined liquidity shocks.
29 The simulation assumes outflow of deposits of the twenty largest depositors, 20% of household deposits, liabilities to parent entities with the exception of liabilities on subordinated instruments and hybrid capital instruments that are excluded from the simulation as according to the regulations for calculating capital adequacy their early repayment is limited, 50% of the liabilities to non-residents (excluding liabilities to non-resident parent entities of banks which are already covered by one of the previous simulations) and conversion of certain off-balance sheet liabilities of the banks (uncovered letters of credits, irrevocable credit lines and unused limits based on credit cards and approved overdrafts on transaction accounts) in balance sheet claims. The simulations of liquidity shocks exclude MBDP AD Skopje, because of the legal restriction to serve in a deposit market and hence in the presentation of results this bank is excluded in all indicators. 30 With this extension of the scope of liquid assets, besides the financial instruments that comprise the liquid assets, the following financial instruments from the banks’ balance sheets are added: term deposits in foreign banks, money market instruments issued by foreign non-government issuers, loans with contractual residual maturity up to 30 days and the effect of reducing the reserve requirement for banks’ foreign currency liabilities, which is allocated in foreign currency due to the simulated outflow of households' foreign currency deposits.
Chart 28 Contribution of individual combined shocks to the decline in the liquid assets in the simulation of a combined liquidity shock, by bank as percentage of decline of liquid assets
Source: NBRM, based on the data submitted by banks.
37.4 33.7
2.4 5.6
21.4
0
20
40
60
80
100
120
otflow ofdeposits of 20
largestdeponents
outflow of 20%of household
deposits
outflow ofliabilities to
parent enteties
outflow of 50%of the liabilitiesto nonresidents
conversion ofoff-balance sheet
items intobalance sheet
claims
individual banks total banking system
Chart 27 Reduction of liquid assets in the simulation of combined liquidity shocks in %
Source: NBRM calculations, based on data submitted by banks
95.8 99.7 102.4 102.8 100.6
50
75
100
125
150
175
200
225
03.2015 06.2015 09.2015 12.2015 03.2016
individual banks total banking system

NATIONAL BANK OF THE REPUBLIC OF MACEDONIA
22
The potential conversion of some banks’ off-balance sheet exposures to on-balance sheet claims has played a relatively important role, mainly due to the volume of approved unsecured credit limits and overdrafts and credit cards limits. Shocks associated with outflows of liabilities to non-residents or outflows of liabilities to parent entities without treatment of capital instruments play a less significant role in the creation of total combined outflows, reflecting the fact that banks are not largely funded by such liabilities. The distribution of total combined outflows by shock, clearly demonstrate the important role of deposits for the financing of domestic banks and that the sustainability of liquidity position of banks, and the potential growth of activities, is mostly determined by the developments and the performance of banks in the deposit market and the trust of domestic depositors.

Report on the Risks in the Banking System of the Republic of Macedonia in the First Quarter of 2016
23
3. Currency risk
The banking system in the Republic of Macedonia has a relatively low exposure to currency risk (the share of gap between assets and liabilities with currency component in the banks' own funds was positive and relatively low, and continued dropping in the first quarter of 2016). The euro is the most common currency of assets and liabilities with currency component, which also contributes to the low banks’ exposure to currency risk due to the strategy of maintaining stable nominal exchange rate of the denar against the euro. The pronounced volatility and general downward movement of the pound in the first quarter of 2016, almost had no impact on the stability of the Macedonian banking system, due to the insignificant presence of this currency in the banks’ balance sheets. Banks have been complied with the aggregate currency position requirement of 30% of own funds.
Chart 29 Quarterly (left and middle) and annual (right) growth of assets and liabilities with currency component in millions of denars in % in %
Source: NBRM, based on the data submitted by banks.
-7
39
1
-912
-5,000
0
5,000
10,000
15,000
20,000
3.2015 6.2015 9.2015 12.2015 3.2016
assets with currency component
liabilities with currency component
total assets
2.4
2.3
5.6
-2
0
2
4
6
8
3.2015 6.2015 9.2015 12.2015 3.2016
0.0
0.2
-0.2-1
0
1
2
3
4
5
3.2015 6.2015 9.2015 12.2015 3.2016
assets with currency component
liabilities with currency component
total assets
Chart 30 Structure of the gap between assets and liabilities with currency component (left) and share of the assets and liabilities with currency component in own funds (right) in millions of denars in %
Source: NBRM, based on the data submitted by banks.
-57,262 -60,365 -59,985 -59,248 -60,438
61,798 64,122 63,550 64,481 65,273
4,536 3,757 3,565 5,233 4,835
-80,000
-60,000
-40,000
-20,000
0
20,000
40,000
60,000
80,000
3.2015 6.2015 9.2015 12.2015 3.2016
Gap between the assets and liabilities in foreign currency
Gap between the assets and liabilities in Denars with FX clause
Gap between the assets and liabilities with currency component
-131.3 -133.8 -132.4 -129.3 -131.9
141.7 142.1 140.2 140.7 142.4
10.4 8.3 7.9 11.4 10.5
-150
-100
-50
0
50
100
150
200
3.2015 6.2015 9.2015 12.2015 3.2016
Gap between the assets and liabilities in foreign currency / own funds
Gap between the assets and liabilities in Denars with FX clause / own funds
Gap between the assets and liabilities with currency component / own funds

NATIONAL BANK OF THE REPUBLIC OF MACEDONIA
24
As of 31 March 2016, the gap between assets and liabilities with a currency component decreased by Denar 398 million compared to the previous quarter. The gap narrowed due to the growth of liabilities with currency component, which is mostly driven by foreign currency deposits of non-financial institutions (without current accounts). The narrowed gap between assets and liabilities with currency component, amid almost the same own funds, reduced its share in own funds by 0.9 percentage points compared to the previous quarter.
The share of assets and liabilities with
currency component in total assets and liabilities of the banking system terminated the downward trend. The share of assets with currency component remained the same, while the share of liabilities with currency component increased by 0.1 percentage points.
The euro is the most common
currency in the structure of banks’ assets and liabilities with currency component, which amid stable exchange rate of the denar against the euro, confirms the relatively low exposure of banks to currency risk. Also, the gap in euro that dropped by Denar 417 million contributed the most to the narrowing of the total gap between assets and liabilities with currency component. Other currencies that contributed to the narrowing of the gap are the US dollar whose negative gap increased by Denar 232 million, and the Swiss franc that decreased the positive gap by Denar 188 million. In this quarter, the largest change was registered in the negative gap in the Australian dollar, which narrowed by Denar 450 million31.
31 Assets with currency component in the Australian dollar increased by Denar 501 million, while the increase in liabilities with currency component in Australian dollars is much lower and amounts to Denar 51 million. In the first quarter of 2016, one bank invested Denar 418 million in deposits in another foreign bank.
Chart 31 Share of assets and liabilities with currency component* in total assets of banks in %
Source: NBRM, based on the data submitted by banks. *Within the assets, loans are shown on a net basis i.e. adjusted for the impairment. MBDP AD Skopje is not included.
40
42
44
3.2015 6.2015 9.2015 12.2015 3.2016
Assets with currency component
Liabilities with currency component
Chart 32 Dynamics and structure of the gap between assets and liabilities with currency component, by currency
in millions of denars
Source: NBRM, based on the data submitted by banks.
7,005 6,588
-1,742 -1,975
374186
7866
-482 -32
-4000
-2000
0
2000
4000
6000
8000
3. 2015 6. 2015 9.2015 12. 2015 3. 2016
Euro US dollar Swiss franc Other Australian Dollar
Report on the Risks in the Banking System of the Republic of Macedonia in the First Quarter of 2016
25
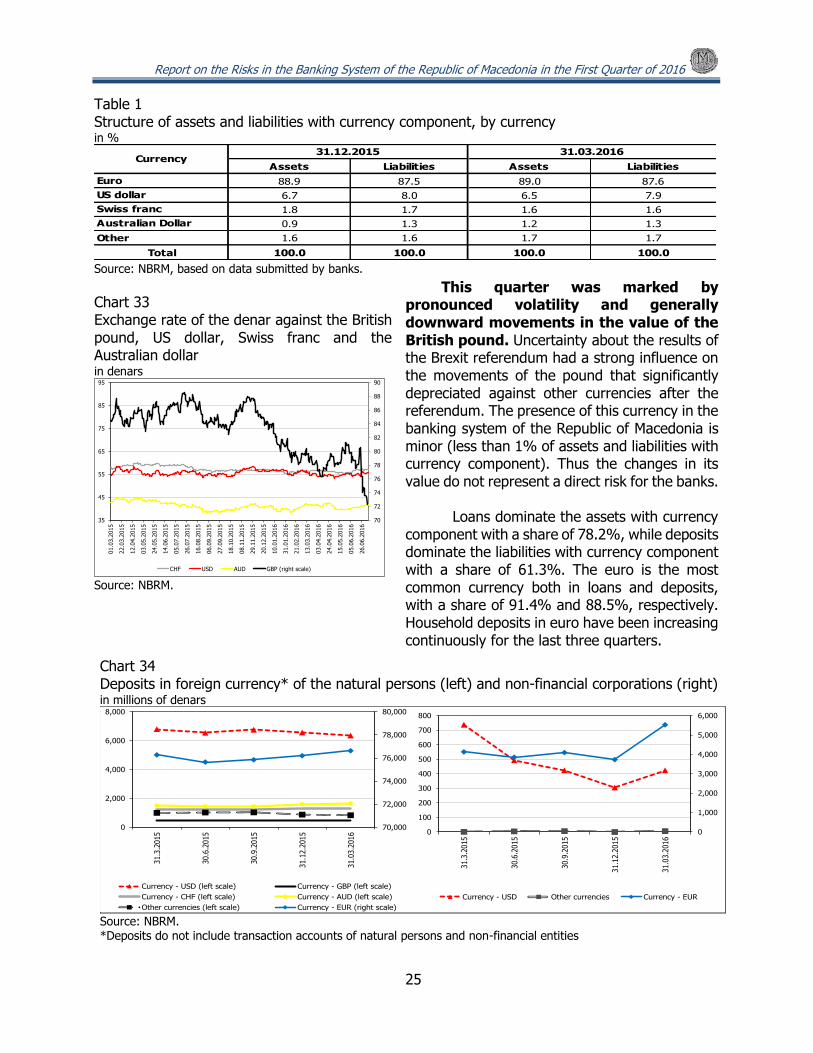
This quarter was marked by
pronounced volatility and generally downward movements in the value of the British pound. Uncertainty about the results of the Brexit referendum had a strong influence on the movements of the pound that significantly depreciated against other currencies after the referendum. The presence of this currency in the banking system of the Republic of Macedonia is minor (less than 1% of assets and liabilities with currency component). Thus the changes in its value do not represent a direct risk for the banks.
Loans dominate the assets with currency
component with a share of 78.2%, while deposits dominate the liabilities with currency component with a share of 61.3%. The euro is the most common currency both in loans and deposits, with a share of 91.4% and 88.5%, respectively. Household deposits in euro have been increasing continuously for the last three quarters.
Table 1 Structure of assets and liabilities with currency component, by currency in %
Source: NBRM, based on data submitted by banks.
Source:
Assets Liabilities Assets Liabilities
Euro 88.9 87.5 89.0 87.6
US dollar 6.7 8.0 6.5 7.9
Swiss franc 1.8 1.7 1.6 1.6
Australian Dollar 0.9 1.3 1.2 1.3
Other 1.6 1.6 1.7 1.7
Total 100.0 100.0 100.0 100.0
Currency31.12.2015 31.03.2016
Chart 33 Exchange rate of the denar against the British pound, US dollar, Swiss franc and the Australian dollar in denars
Source: NBRM.
70
72
74
76
78
80
82
84
86
88
90
35
45
55
65
75
85
95
01.0
3.2
015
22.0
3.2
015
12.0
4.2
015
03.0
5.2
015
24.0
5.2
015
14.0
6.2
015
05.0
7.2
015
26.0
7.2
015
16.0
8.2
015
06.0
9.2
015
27.0
9.2
015
18.1
0.2
015
08.1
1.2
015
29.1
1.2
015
20.1
2.2
015
10.0
1.2
016
31.0
1.2
016
21.0
2.2
016
13.0
3.2
016
03.0
4.2
016
24.0
4.2
016
15.0
5.2
016
05.0
6.2
016
26.0
6.2
016
CHF USD AUD GBP (right scale)
Chart 34 Deposits in foreign currency* of the natural persons (left) and non-financial corporations (right) in millions of denars
Source: NBRM. *Deposits do not include transaction accounts of natural persons and non-financial entities
70,000
72,000
74,000
76,000
78,000
80,000
0
2,000
4,000
6,000
8,000
31.3
.2015
30.6
.2015
30.9
.2015
31.1
2.2
015
31.0
3.2
016
Currency - USD (left scale) Currency - GBP (left scale)
Currency - CHF (left scale) Currency - AUD (left scale)
Other currencies (left scale) Currency - EUR (right scale)
0
1,000
2,000
3,000
4,000
5,000
6,000
0
100
200
300
400
500
600
700
800
31.3
.2015
30.6
.2015
30.9
.2015
31.1
2.2
015
31.0
3.2
016
Currency - USD Other currencies Currency - EUR

NATIONAL BANK OF THE REPUBLIC OF MACEDONIA
26
As of 31 March 2016, all banks complied with the aggregate currency position requirement of 30% of own funds.
Table 2 Distribution of banks by share of open currency position, by currency and the aggregate currency position in own funds
Source: NBRM, based on data submitted by banks.
Source:
Long Short Long Short Long Short Long Short Long Short
under 5% 4 2 8 6 9 4 7 2 12 2 5
from 5% to 10% 3 4
from 10% to
20%3
2
from 20% to
30%2
3
over 30%
Items
Number of banks
Aggregate currency
position / own funds
Euro US Dollar Swiss franc Australian Dollar Other
Open currency position by currency /own funds
Chart 35 Aggregate currency position to own funds ratio, by bank in %
Source: NBRM.
0
10
20
30
40
1 2 3 4 5 6 7 8 9 10 11 12 13 14
12.2015 3.2016 maximum prescribed level

Report on the Risks in the Banking System of the Republic of Macedonia in the First Quarter of 2016
27
Chart 36 Structure of interest sensitive assets and liabilities, by type of interest rates in millions of denars
Source: NBRM, based on the data submitted by banks.
0
50000
100000
150000
200000
250000
300000
350000
400000
31.3
.2015
30.6
.2015
30.9
.2015
31.1
2.2
015
31.3
.2016
31.3
.2015
30.6
.2015
30.9
.2015
31.1
2.2
015
31.3
.2016
Interest sensitive assets Interest sensitive liabilities
Adjustable interest rate Variable interest rate Fixed interest rate
4. Interest rate risk in the banking book In the first quarter of 2016, banks in the Republic of Macedonia successfully
managed the interest rate risk in the banking book. The increasing use of fixed interest rate, especially in loans to households, further increased the ratio between the total weighted value of the banking book and own funds. However, the use of adjustable interest rates, and the fact that these are mainly interest rates that are fixed only for a certain period after which they become variable or adjustable, mitigates the potential risk to banks of losing income in case of higher lending market interest rates.
At the end of the first quarter of
2016, banks’ interest sensitive assets and liabilities remained almost the same as on 31 December 201532.
Lending with adjustable interest
rate that dominates the structure of interest sensitive assets has decreased by 1.3% on the account of the growth of fixed interest rates. This increase is due to the boost of most housing and consumer loans with fixed and relatively low interest rates in the first few years of the loan, and less to the change of the type of interest rate (from variable to fixed) made as part of the restructuring of loans of one bank. Also, interest sensitive assets with fixed interest rate increased due to the enhanced banks’ investment in treasury bills of 2.5%. These developments have made the share of assets with fixed interest rate exceed the share of assets with adjustable interest rates for the first time (46.9% and 45.4%, respectively).
Unlike the structure of interest
sensitive assets, interest sensitive liabilities remain dominated by the positions with adjustable interest rates (71.8%) that also determine the total movements on the liabilities side. Thus, the quarterly growth of interest sensitive liabilities is due to the growth in deposits with adjustable interest rates on early withdrawal deposits and demand deposits mostly in the household sector.
32 Interest sensitive assets and liabilities make up 84.5% and 82.3% respectively of the banks' assets (as of 31 December 2015: 84.4% and 82.0%, respectively).
Chart 37 Quarterly growth of interest sensitive assets and liabilities, by type of interest rates
Source: NBRM, based on the data submitted by banks.
3.2%
-11.2%
-1.3%
-0.1%
-1.8%
4.0%
0.7%0.1%
-30%
-20%
-10%
0%
10%
20%
30%
31.3
.2015
30.6
.2015
30.9
.2015
31.1
2.2
015
31.3
.2016
31.3
.2015
30.6
.2015
30.9
.2015
31.1
2.2
015
31.3
.2016
Interest sensitive assets Interest sensitive liabilities
Fixed interest rate Variable interest rate
Adjustable interest rate Total interest sensitive assets/ liabilities

NATIONAL BANK OF THE REPUBLIC OF MACEDONIA
28
In the first three months of the year, banks only once changed the adjustable interest rates on household deposits in all analyzed currencies and maturities. In addition, all the changes banks made to the interest rates on household deposits in the first quarter of 2016 were to reduce them. Most pronounced interest rate cut was made in denar and euro deposits, of 0.6 and 0.4 percentage points, on average for all banks.
Chart 39 Interest-sensitive assets (up) and liabilities (down), by on-balance sheet items and type of interest rates in millions of denars
Source: NBRM, based on the data submitted by banks.
0
10000
20000
30000
40000
50000
60000
70000
80000
31.3.2015 30.6.2015 30.9.2015 31.12.2015 31.3.2016
fixed interest rate
Sight assets Term deposits Loans Securities Other assets
0
2000
4000
6000
8000
10000
12000
14000
16000
18000
20000
31.3.2015 30.6.2015 30.9.2015 31.12.2015 31.3.2016
variable interest rate
Sight assets Term deposits Loans Securities Other assets
0
500
1,000
1,500
2,000
2,500
3,000
3,500
4,000
4,500
152000
154000
156000
158000
160000
162000
164000
166000
31.3.2015 30.6.2015 30.9.2015 31.12.2015 31.3.2016
adjustable interest rate
Loans (left scale) Sight assets (right scale)
Term deposits (right scale) Other assets (right scale)
0
10000
20000
30000
40000
50000
60000
31.3.2015 30.6.2015 30.9.2015 31.12.2015 31.3.2016
Sight liabilities Term depositis Loans Hybrid and subordinated instruments
0
1000
2000
3000
4000
5000
6000
7000
8000
31.3.2015 30.6.2015 30.9.2015 31.12.2015 31.3.2016
Sight liabilities Term depositis Loans Hybrid and subordinated instruments
0
20000
40000
60000
80000
100000
120000
140000
160000
31.3.2015 30.6.2015 30.9.2015 31.12.2015 31.3.2016
Sight liabilities Term depositis Loans
Chart 38 Change in interest rates on household deposits, by currency and maturity
Source: NBRM, based on the data submitted by banks. *The analysis refers to interest rates on household deposits that are traditional deposits composed solely of deposits with adjustable interest rate for the period from January to March 2016, on a monthly basis.
-0.70
-0.60
-0.50
-0.40
-0.30
-0.20
-0.10
0.00
1 month 3 months 6 months 12 months 24 months 36 months
PER
CEN
TAG
E P
OIN
TS
MKD EUR USD CHF
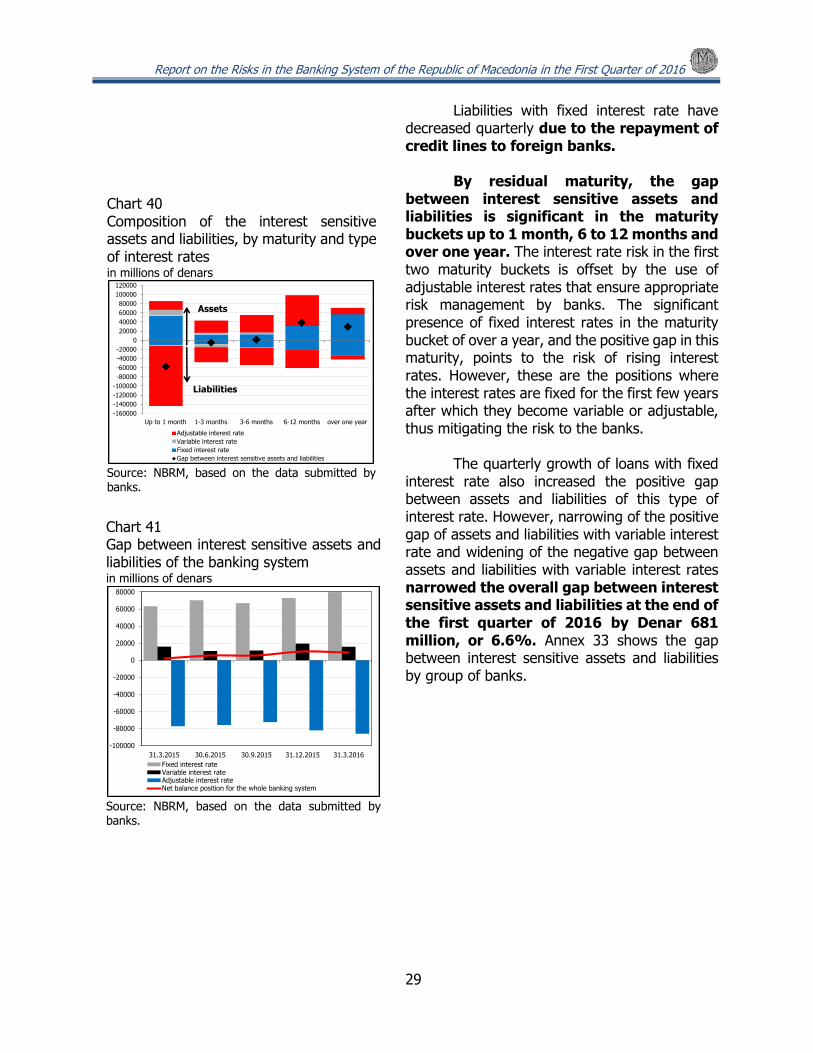
Report on the Risks in the Banking System of the Republic of Macedonia in the First Quarter of 2016
29
Liabilities with fixed interest rate have decreased quarterly due to the repayment of credit lines to foreign banks.
By residual maturity, the gap
between interest sensitive assets and liabilities is significant in the maturity buckets up to 1 month, 6 to 12 months and over one year. The interest rate risk in the first two maturity buckets is offset by the use of adjustable interest rates that ensure appropriate risk management by banks. The significant presence of fixed interest rates in the maturity bucket of over a year, and the positive gap in this maturity, points to the risk of rising interest rates. However, these are the positions where the interest rates are fixed for the first few years after which they become variable or adjustable, thus mitigating the risk to the banks.
The quarterly growth of loans with fixed
interest rate also increased the positive gap between assets and liabilities of this type of interest rate. However, narrowing of the positive gap of assets and liabilities with variable interest rate and widening of the negative gap between assets and liabilities with variable interest rates narrowed the overall gap between interest sensitive assets and liabilities at the end of the first quarter of 2016 by Denar 681 million, or 6.6%. Annex 33 shows the gap between interest sensitive assets and liabilities by group of banks.
Chart 40 Composition of the interest sensitive assets and liabilities, by maturity and type of interest rates in millions of denars
Source: NBRM, based on the data submitted by banks.
Assets
Liabilities
-160000
-140000
-120000
-100000
-80000
-60000
-40000
-20000
0
20000
40000
60000
80000
100000
120000
Up to 1 month 1-3 months 3-6 months 6-12 months over one year
Adjustable interest rate
Variable interest rate
Fixed interest rate
Gap between interest sensitive assets and liabilities
Chart 41 Gap between interest sensitive assets and liabilities of the banking system in millions of denars
Source: NBRM, based on the data submitted by banks.
-100000
-80000
-60000
-40000
-20000
0
20000
40000
60000
80000
31.3.2015 30.6.2015 30.9.2015 31.12.2015 31.3.2016
Fixed interest rateVariable interest rateAdjustable interest rateNet balance position for the whole banking system

NATIONAL BANK OF THE REPUBLIC OF MACEDONIA
30
The ratio between the total weighted value of the banking book33 and own funds at the end of the first quarter of 2016 was 7.4%. Analyzing by banks, this ratio ranges from 0.2% to 14.7% with a median of 9.4%, which is below 20%34. Most of the growth in the total weighted value of the banking book is due to the positions with fixed interest rate.
33 The total weighted value of the banking book shows the change of the economic value of this portfolio as a result of the assessment of the change in the interest rates using a standard interest rate shock (parallel positive or negative change in interest rates by 200 basis points). The total weighted value of the banking book of the banking system is obtained by aggregating the weighted values of the banking book of individual banks. 34 According to the Decision on managing interest rate risk in the banking book (Official Gazette of the Republic of Macedonia No. 163/2008 и 144/2009), when total weighted value to own funds ratio exceeds 20%, the bank is required to propose measures to reduce this ratio, and the National Bank may also require allocation of appropriate amount of capital for the interest rate risk in the banking book.
Chart 42 Weighted value (left scale) and total weighted value of banking book to own assets ratio (right scale), by type of interest rate in millions of denars and in %
Source: NBRM, based on the data submitted by banks.
0.0
0.5
1.0
1.5
2.0
2.5
3.0
3.5
4.0
4.5
5.0
5.5
6.0
6.5
7.0
7.5
0
150
300
450
600
750
900
1050
1200
1350
1500
1650
1800
1950
2100
2250
2400
2550
2700
2850
3.2015 6.2015 9.2015 12.2015 3.2016
Fixed interest rate (left scale) Variable interest rate (left scale)
Adjustable interest rate (left scale) Fixed interest rate (right scale)
Variable interest rate (right scale) Adjustable interset rate (right scale)
Total weighted value (right scale)

Report on the Risks in the Banking System of the Republic of Macedonia in the First Quarter of 2016
31
5. Insolvency risk
The solvency and capitalization ratios of the banking system somewhat improved in the first quarter of 2016, which is mostly due to the reduction of banks' activities, amid almost unchanged amount of the own funds of the banking system. Capital requirements for credit risk also reduced, mostly due to the smaller claims on companies. The capital requirement for currency risk registered quarterly drop, which was mostly caused by the changes in two banks. The results of the stress test conducted on 31 March 2016, are better compared to the end of 2015.
5.1. Indicators for solvency and
capitalization of the banking system and risk level of the activities
The solvency and capitalization
indicators of the banking system somewhat improved in the first quarter of 2016. In the first quarter of 2016, the own funds remained almost unchanged, the core capital growth slowed down to 0.4%, while equity and reserves recorded certain acceleration of growth, which stood at 2.2%. Contrary to the registered growth at the end of 2015, in the first quarter of 2016, the banks' activities somewhat deteriorated, leading to a decline of 1.9% in the risk-weighted assets. As of 31 March 2016, all banks reported a capital adequacy ratio higher than 12%.
Chart 43 Solvency ratios in %
Source: NBRM, based on the data submitted by banks.
16.0
15.5
15.8
13.9 13.914.3
9.39.1
9.3
10.9 10.811.1
8
9
10
11
12
13
14
15
16
17
3.2015 6.2015 9.2015 12.2015 3.2016
Capital adequacy ratio
Regulatory tier 1 capital (core capital) after supervisory deductions/risk-weighted
assets
Equity and reserves/total activities
Equity and reserves/total assets
Chart 44 Measures for distribution of capital adequacy ratio in the banking system in %
Source: NBRM, based on the data submitted by banks.
12
14
16
18
20
22
24
26
28
30
3.2015 6.2015 9.2015 12.2015 3.2016
Interquartile spread Maximum Minimum Median

NATIONAL BANK OF THE REPUBLIC OF MACEDONIA
32
The level of risk of the banking
activities (measured as a ratio between credit risk-weighted assets and the total on-balance sheet and off-balance sheet exposure) decreased by 0.7 percentage points and totaled 52.5% as of 31 March 2016. In the first quarter of 2016, there was a fall of Denar 6,077 million (or by 2.8%) in the banks'35 activities, which are included in the calculation of credit risk-weighted assets with a risk weight of 100%. 5.2. Movement and quality of the own
funds of the banking system
In the first three months of 2016, the own funds of the banking system declined by negligible Denar 0.9 million (or 0.002%). One bank retained the profit realized in 2015 of the positions of the core capital, amounting to Denar 240 million36. In contrast, in the first quarter of 2016, some banks had losses of Denar 139 million, which is a deductible item in the calculation of own funds. Also, in one
35 In terms of exposure category, these are claims on other trade companies.
36 Also, in 2015, two banks met the regulatory requirements to include the profit from 2015 (totaling Euro 477 million) in the calculation of own funds.
Chart 45 Growth rates of components of solvency ratios, quarterly (left) and annual (right) in percentages in percentages
Source: NBRM, based on the data submitted by banks.
-1.4
5.1
-1.9
0.0
4.1
-0.2
-0.1
4.0
-0.1
0.7 1.1
0.00.0
0.9
0.40.6
0.2
2.2
-3
-2
-1
0
1
2
3
4
5
6
7
8
3.20
15
6.20
15
9.20
15
12.2
015
3.20
16
3.20
15
6.20
15
9.20
15
12.2
015
3.20
16
Activities Capital positions
Risk-weighted assetsTotal assetsTotal on- and off-balance sheet activitiesRegulatory capital (own funds)Regulatory tier 1 capital (Core capital)Equity and reserves
5.7
6.9
6.3
7.0
5.85.6
7.6
7.1 7.1
1.6
5.8
5.1
3.4
8.7
9.1
5.0
6.0
7.7
1
2
3
4
5
6
7
8
9
10
3.20
15
6.20
15
9.20
15
12.2
015
3.20
16
3.20
15
6.20
15
9.20
15
12.2
015
3.20
16
Activities Capital positions
Risk-weighted assetsTotal assetsTotal on- and off-balance sheet activitiesRegulatory capital (own funds)Regulatory tier 1 capital (Core capital)Equity and reserves
Chart 46 Structure of total on-balance sheet and off-balance sheet exposure, by risk weights in %
Source: NBRM, based on the data submitted by banks. Note: *The average risk weight of total on-balance sheet and off-balance sheet exposure is calculated as a ratio between credit risk weighted assets and net on-balance sheet and off-balance sheet exposure of banks.
25.3 24.0 24.1
5.8 5.8 6.0
2.3 2.5 2.5
4.6 4.4 4.2
19.8 19.9 20.5
42.1 43.3 42.1
0.1 0.0 0.5
52.9 53.2 52.5
0
10
20
30
40
50
60
70
80
90
100
3.2015 6.2015 9.2015 12.2015 3.2016
150%
100%
75%
50%
35%
20%
10%
0%
Average riskweight*

Report on the Risks in the Banking System of the Republic of Macedonia in the First Quarter of 2016
33
bank, one of the subordinated instruments entered the last five years to the maturity date, which, under the regulations, is included at discounted value in the calculation of own funds. The quality of own funds is high with the share of core capital (after deductibles of core and additional capital) in total own funds of over 90%.
For more details about the level of own
funds by group of banks see Annex 34.
5.3. Movements and structure of capital requirements and available capital of the banking system
In the first quarter of 2016, part of
the already engaged regulatory capital required to cover risks (or capital requirements37) was "reversed" and used for accumulation of own funds above the required minimum. Thus, in the first three months of 2016, the "free" capital above the capital requirement for covering risks rose by Denar 478 million, or 2.1%. Simultaneously, capital requirements for covering risks decreased by almost identical Denar 479 million (or -1.9%). Reduction of capital requirements was more pronounced in the regulatory capital required to cover credit risk (by Denar 326 million or 1.5%), and is mostly derived from the lower claims on companies. Solid quarterly decrease of Denar 152 million (or 22.8%) was registered in regulatory capital requirement for currency risk, most evident in two banks38. Own funds above the capital requirement for covering risks make up almost half of the total own funds.
At the end of 2015, the National Bank
introduced lower capital requirements for guarantees issued by banks which guarantee payment based on a certain business relationship of the client, as well as banks' claims backed by
37 Capital requirements are determined at the level of 8% of the risk weighted assets. 38 In one bank from the group of large banks, the reduction of capital requirement for currency risk is due to the quarterly decline in the assets with currency component (of Denar 671 million), amid simultaneous increase in the liabilities with currency component (of Denar 40 million). In another bank, from the group of medium-size banks, the assets with currency component registered stronger quarterly decline (of Denar 1,244 million), compared with the reduction of the liabilities with currency component (by Denar 573 million), which also contributed to the reduction of capital required to cover currency risk.
Chart 48 Structure of quarterly growth of own funds, by the purpose for covering risks in millions of denars
Source: NBRM, based on the data submitted by banks.
-67
Total:
-1
Total:
509
880
-326
167
-256
153
-152
622
Total:
301
-690
478
-2,000
-1,500
-1,000
-500
0
500
1,000
1,500
2,000
3.2015 6.2015 9.2015 12.2015 3.2016
Regulatory capital exceeding capital requirements
Capital requirements for currency risk
Capital requirements for operational risk
Capital requirements for credit risk
Chart 47 Structure of the quarterly growth of own funds in millions of denars
Source: NBRM, based on the data submitted by banks. Note: * Refers to the changes in the amount of outstanding subordinated instruments arising from the compliance/non-compliance with the regulation for inclusion of these instruments in the calculation of own funds.
633
Total:
301
360 240
-670
73
-139
9361
-121
Total:
-1
-81-122
Total:
509
123308
243
-211
20
-1,500
-1,000
-500
0
500
1,000
1,500
2,000
2,500
3,000
3,500
2015Q1 2015Q2 2015Q3 2015Q4 2016Q1
Other changes
Issued new hybrid instruments
Early repayment of subordinated instruments
Allowed amount of subordinated instruments that may be included in the calculation
of regulatory capital (own funds)*Issued new subordinated instruments
Loss in current year
Retained profit from previous years

NATIONAL BANK OF THE REPUBLIC OF MACEDONIA
34
commercial property that meets certain conditions. These amendments became effective from 1 January 2016. The effects of these amendments to the regulations are aimed at "reversing" capital of nearly Denar 250 million, which had previously been engaged to cover credit risk. Simultaneously, the National Bank introduced higher capital requirements for new long-term consumer loans (with maturity equal to or longer than eight years) approved after 1 January 2016, as well as for the growth of overdrafts on transaction accounts and credit cards, realized in relation to 31 December 2015. The effects of these amendments to the regulations are estimated at approximately Denar 160 million additional capital required to cover credit risk, in the first quarter of 2016. As a result, total net effects of the amendments to the regulations on the methodology for determining capital adequacy are aimed at "reversing" capital amounting to about Denar 90 million, previously engaged to cover credit risk.
Chart 50 Quarterly growth (left) and structure (right) of capital requirements for credit risk, by exposure category
in millions of denars in %
Source: NBRM, based on the data submitted by banks.
979
-69-37
474
-563
109
179
39353
-13
21
-126
147
107
-75
15
-215
-900
-800
-700
-600
-500
-400
-300
-200
-100
0
100
200
300
400
500
600
700
800
900
1,000
31.3.2015 30.6.2015 30.9.2015 31.12.2015 31.3.2016
Claims on banks Claims on corporates
Retail credit portfolio Claims secured by residential property
Claims secured by commercial real estate Other categories of exposure
6.8 6.4 6.2
40.5 41.0 39.0
32.1 32.4 34.7
2.0 2.2 2.4
10.4 10.7 11.3
8.1 7.3 6.4
0
10
20
30
40
50
60
70
80
90
100
31.3.2015 30.6.2015 30.9.2015 31.12.2015 31.3.2016
Claims on banks Claims on corporates
Retail credit portfolio Claims secured by residential property
Claims secured by commercial real estate Other categories of exposure
Chart 49 Structure of own funds according to the use for covering risks in %
Source: NBRM, based on the data submitted by banks.
Source:
43.7 44.9 44.2
5.3 5.4 5.41.1 1.4 1.1
49.9 48.4 49.4
0
25
50
75
100
3.2015 6.2015 9.2015 12.2015 3.2016
Regulatory capital exceeding capital requirements
Capital requirements for currency risk
Capital requirements for operational risk
Capital requirements for credit risk

Report on the Risks in the Banking System of the Republic of Macedonia in the First Quarter of 2016
35
For more details on the capital requirements for covering risks and on the capital adequacy ratio, by group of banks, see Annex 35.
5.4. Stress-testing of the resilience of the
banking system to hypothetical shocks
The stress testing of the resilience of
the banking system and individual banks in the Republic of Macedonia to simulated shocks indicates improved results compared with 31 December 2015. The capital adequacy of the banking system does not fall below 8% in any of the simulations, although individual banks show hypothetical need for recapitalization in the event of possible materialization of the simulated extreme shocks.
Chart 51 Comparison of results from simulations of credit and combined shocks in %
Source: NBRM, based on the data submitted by banks. *Stress testing includes the following simulations: I simulation: Increasing the non-performing credit exposure to non-financial entities by 50%; II simulation: Increasing the non-performing credit exposure to non-financial entities by 80%; III simulation: Migration of 10% of the regular to a non-performing credit exposure to non-financial entities; IV simulation: Reclassification in risk category "C - non-performing" of the five largest credit exposures to non-financial entities (including related entities); V simulation: Increasing the non-performing credit exposure to non-financial entities by 80% and increase in
interest rates from 1 to 5 pp.; VI simulation: Increasing the non-performing credit exposure to non-financial entities by 80%, depreciation of the Denar exchange rate by 30%, and increase in interest rates from 1 to 5 pp.; **Note: Credit exposure to non-financial entities includes the total credit exposure decreased by the exposure of banks to financial institutions and the government, i.e to customers from the "financial activities and insurance activities" and "public administration and defense and compulsory social security"
16.015.5 15.8
11.3 11.0 11.2
8.4
8.3 8.4
10.1
9.5 9.6
12.4 12.1
12.5
8.5 8.3 8.48.5 8.3 8.4
8
9
10
11
12
13
14
15
16
17
31.3.2015 30.6.2015 30.9.2015 31.12.2015 31.3.2016
Capital adequacy ratio of the banking system, before simulations
Capital adequacy ratio after I stress-test simulation
Capital adequacy ratio after II stress-test simulation
Capital adequacy ratio after III stress-test simulation
Capital adequacy ratio after IV stress-test simulation
Capital adequacy ratio after V stress-test simulation
Capital adequacy ratio after VI stress-test simulation

NATIONAL BANK OF THE REPUBLIC OF MACEDONIA
36
The hypothetical shocks on the part of the credit risk have the greatest impact on the stability of the banking system. Simulations show that the capital adequacy of the banking system would drop to the capital requirement of 8% only if the non-performing credit exposure to non-financial entities rises by 83.9%, i.e. in case of migration of 12.3% from regular to non-performing credit exposure. These simulations would result in almost doubling of the share of non-performing in the total credit exposure to non-financial entities (from the current 9.4% to 17.3%). However, these are rather extreme and less likely simulations, especially in the short term39.
39 For comparison, in the first quarter of 2016, only 0.5% of the regular credit exposure to non-financial entities migrated to non-performing exposure (in the last seven years, the historic maximum for this data was 2.1% and was reached in the second quarter of 2009).
Chart 52 Necessary deterioration of the quality of credit exposure for the capital adequacy of the banking system to drop to 8% in %
Source: NBRM, based on the data submitted by banks.
Source:
13.2
12.1
12.3
84.6 83.1 83.9
11
12
13
14
0
10
20
30
40
50
60
70
80
90
100
31.3.2015 30.6.2015 30.9.2015 31.12.2015 31.3.2016
Assumed % of migration of performing credit exposure to non-performing credit exposure to non-
financial entities, at which the capital adequacy ratio is reduced to 8% (right scale)
Assumed % of rise of non-performing credit exposure to non-financial entities, at which the capital
adequacy ratio is reduced to 8% (left scale)

Report on the Risks in the Banking System of the Republic of Macedonia in the First Quarter of 2016
37
III. STRUCTURAL FEATURES, SIGNIFICANT BALANCE SHEET CHANGES AND PROFITABILITY OF THE BANKING SYSTEM

NATIONAL BANK OF THE REPUBLIC OF MACEDONIA
38
1. Structure of the banking system
As of 31 March 2016, eighteen depository institutions operate in the Republic of Macedonia, fifteen banks and three savings houses40, which is unchanged number compared to the previous quarter. The number of banks that are predominantly owned by foreign shareholders (eleven), and the number of subsidiaries of foreign banks (seven) is unchanged.
The capital of the banks in the
Republic of Macedonia is mostly foreign (nearly 70% of the total capital and reserves).
Banks in dominant foreign
ownership prevailed in all major banks' balance sheet positions, whereby there are no significant changes compared to the previous quarter.
40 The share of savings houses is only 0.6% of total assets of depository financial institutions (banks and savings banks), 0.8% of total loans to non-financial entities and 0.4% of total household deposits. The risk profile and the scope of activities of savings houses is analyzed in the reports on the financial stability of the Republic of Macedonia.
Chart 53 Number of foreign bank subsidiaries, number of banks in dominant foreign ownership and their share in the capital of the banking system number of banks in %
Source: NBRM, based on data submitted by banks. *Equity includes face value of paid-in common and preference shares. ***Capital and reserves comprise equity and premiums based on paid-in shares, reserve fund, retained earnings (accumulated loss) and revaluation reserves. Capital and reserves are reduced by the current loss.
Source:
11 11 11 11 117 7 7 7 7
68.9 68.9 68.8 69.1 69.2
69.4 68.6 69.4 69.369.6
58.6 58.5 58.2 58.758.7
74.2 74.2 74.2 74.8 74.8
0
20
40
60
80
0
2
4
6
8
10
12
31.3.2015 30.6.2015 30.9.2015 31.12.2015 31.03.2016
number of banks in dominant foreign ownership (left scale)
number of foreign bank subsidiaries (left scale)
share of the banks in dominant foreign ownership in the total assets of the banking system (right scale)
share of the banks in dominant foreign ownership in the total capital and reserves of the banking system* (right scale)
share of the foreign bank subsidiaries in the total assets of the banking system (right scale)
share of the foreign capital in the total equity of the banking system** (right scale)

Report on the Risks in the Banking System of the Republic of Macedonia in the First Quarter of 2016
39
According to the country of origin of
the prevailing foreign shareholder, the market share of banks with a prevailing owner from France decreased by 0.5 percentage points and the share of banks with a prevailing owner from Turkey increased by 0.3 percentage points and from Greece by 0.2 percentage points.
Chart 54 Structure of major banks' balance sheet positions, by banks' majority ownership in millions of denars
Source: NBRM, based on data submitted by banks. Note: The categories of the income statement are annualized. Categories are annualized by summing up the values in the last twelve months for the respective categories of the income statement.
Source:
27.3
26.9 27.031.3 30.6 30.8 26.6 25.3 25.0
68.9 69.1 69.2 68.7 69.4 69.273.3 74.6 74.9
3.8 4.0 3.90.1 0.1 0.1
0
20
40
60
80
100
31.3
.2015
31.1
2.2
015
31.3
.2016
31.3
.2015
31.1
2.2
015
31.3
.2016
31.3
.2015
31.1
2.2
015
31.3
.2016
Assets Deposits Loans
banks in dominant ownership of domestic shareholders
banks in dominant ownership of foreign shareholders
banks in dominant ownership of the state
2.0
12.37.1
25.4 26.7 24.7 25.3 25.8 24.6
95.1
85.291.1
73.6 72.4 74.5 73.6 73.1 74.4
2.9 2.4 1.9 0.9 0.9 0.8 1.1 1.1 1.1
0
20
40
60
80
100
31.0
3.2
015
31.1
2.2
015
31.0
3.2
016
31.0
3.2
015
31.1
2.2
015
31.0
3.2
016
31.0
3.2
015
31.1
2.2
015
31.0
3.2
016
Profit (loss) after tax Total income Net interest income
Chart 55 Market share (assets) of banks (left) and growth rate of banks’ assets (right) by domicile country of the dominant foreign shareholder* in % in %
Source: NBRM, based on data submitted by banks. *The bank in domestic ownership and banks without major owner are not included in the chart.
0
5
10
15
20
25
Gre
ece
Slo
venia
Fra
nce
Bulg
aria
Austr
ia
Turk
ey
Germ
any
Sw
itzerland
31.3.2015 30.6.2015 30.9.2015 31.12.2015 31.3.2016
-8
-4
0
4
8
12
31.3
.2015
30.6
.2015
30.9
.2015
31.1
2.2
015
31.3
.2016
31.3
.2015
30.6
.2015
30.9
.2015
31.1
2.2
015
31.3
.2016
31.3
.2015
30.6
.2015
30.9
.2015
31.1
2.2
015
31.3
.2016
31.3
.2015
30.6
.2015
30.9
.2015
31.1
2.2
015
31.3
.2016
31.3
.2015
30.6
.2015
30.9
.2015
31.1
2.2
015
31.3
.2016
31.3
.2015
30.6
.2015
30.9
.2015
31.1
2.2
015
31.3
.2016
31.3
.2015
30.6
.2015
30.9
.2015
31.1
2.2
015
31.3
.2016
31.3
.2015
30.6
.2015
30.9
.2015
31.1
2.2
015
31.3
.2016
Greece Slovenia France Bulgaria Austria Turkey Germany Switzerland
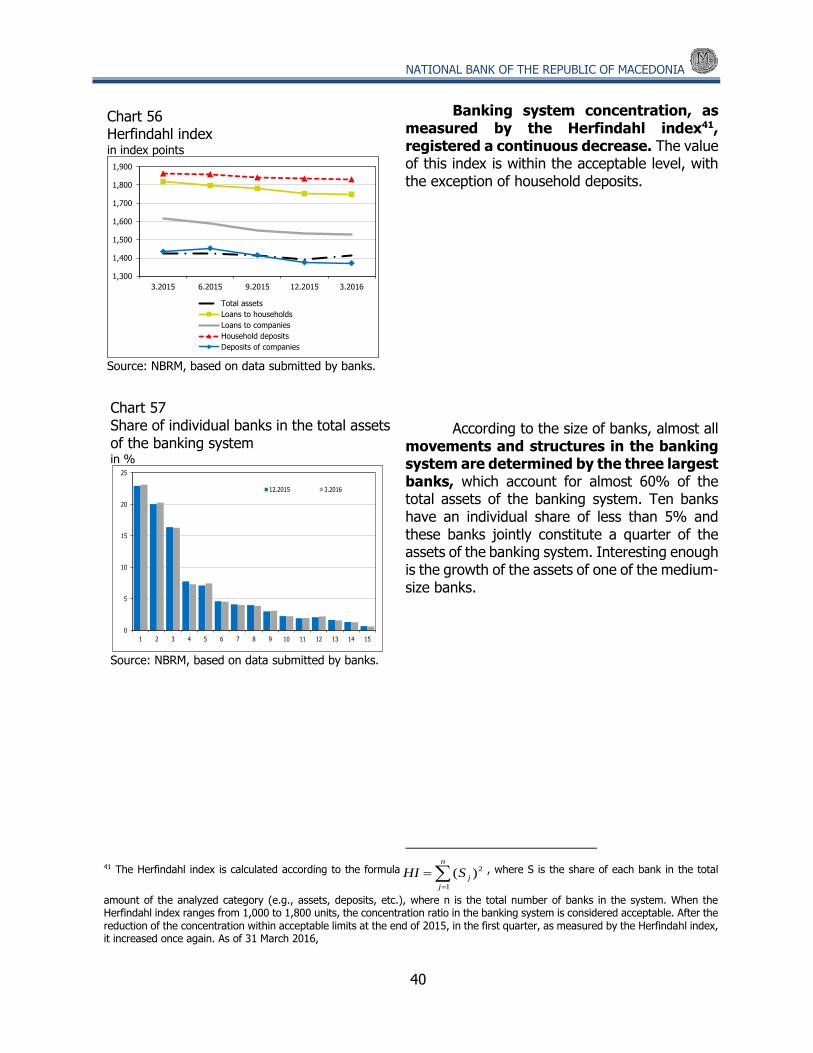
NATIONAL BANK OF THE REPUBLIC OF MACEDONIA
40
Banking system concentration, as measured by the Herfindahl index41, registered a continuous decrease. The value of this index is within the acceptable level, with the exception of household deposits.
According to the size of banks, almost all
movements and structures in the banking system are determined by the three largest banks, which account for almost 60% of the total assets of the banking system. Ten banks have an individual share of less than 5% and these banks jointly constitute a quarter of the assets of the banking system. Interesting enough is the growth of the assets of one of the medium-size banks.
41 The Herfindahl index is calculated according to the formula
n
j
jSHI1
2)( , where S is the share of each bank in the total
amount of the analyzed category (e.g., assets, deposits, etc.), where n is the total number of banks in the system. When the Herfindahl index ranges from 1,000 to 1,800 units, the concentration ratio in the banking system is considered acceptable. After the reduction of the concentration within acceptable limits at the end of 2015, in the first quarter, as measured by the Herfindahl index, it increased once again. As of 31 March 2016,
Chart 57 Share of individual banks in the total assets of the banking system in %
Source: NBRM, based on data submitted by banks.
Source:
0
5
10
15
20
25
1 2 3 4 5 6 7 8 9 10 11 12 13 14 15
12.2015 3.2016
Chart 56 Herfindahl index in index points
Source: NBRM, based on data submitted by banks.
Source:
1,300
1,400
1,500
1,600
1,700
1,800
1,900
3.2015 6.2015 9.2015 12.2015 3.2016
Total assets
Loans to households
Loans to companies
Household deposits
Deposits of companies

Report on the Risks in the Banking System of the Republic of Macedonia in the First Quarter of 2016
41
2. Banks' activities Amid quarterly decline in gross capital formation and total GDP, lower
consumer prices and slowdown in recent positive labor market developments in the first quarter of 2016 and still present uncertainty due to the domestic political developments, overall activities of the Macedonian banking system minimally changed. Bank lending reached a solid annual growth, despite the small negative quarterly movements that are entirely derived from reduced corporate loans (usually their growth in the first quarter of the years is very low). Banks continued to direct their attention to lending to households, due to lower risks compared to the corporate sector. However, in the first quarter of 2016, under the influence of the introduced higher capital requirement for long-term consumer loans42, the further intensification of the long-term credit support to the households intended for consumption halted, i.e. the growth of these loans slightly decelerated43. The fall of banks' deposit potential was fully due to corporate deposits, while slowdown of growth was evident in the segment of households. The trend of constant denarization of bank deposits halted, and in April and May 2016, influenced by the re-escalation of the domestic political turmoil and publicly expressed doubts about the stability of bank deposits, the banking system of the Republic of Macedonia faced with certain deposit withdrawal from households, which were unrestrictedly carried out.
42 Decision amending the Decision on the methodology for determining the capital adequacy (Official Gazette of the Republic of Macedonia No. 223/15), of December 2015. 43 The amendment to the regulations applies only to new consumer loans with a maturity of over eight years.
Chart 58 Absolute quarterly growth of the components of assets (left) and liabilities (right) of the banking system in millions of denars
Source: NBRM, based on the data submitted by banks.
-39
3,219 3,399
16,808
-912
-6.000
-3.000
0
3.000
6.000
9.000
12.000
15.000
18.000
21.000
3.2015 6.2015 9.2015 12.2015 3.2016
Fixed assets
Accrued interest and other assets
Loans to non-financial sector
Placements with banks and other financial institutions
Investments in securities
Cash and balances with MBRM
Total assets
-39
3,219 3,399
16,808
-912
-3.000
0
3.000
6.000
9.000
12.000
15.000
18.000
3.2015 6.2015 9.2015 12.2015 3.2016
Capital and reserves
Provisions for off-balance sheet items and other provisions
Other sources of funds
Deposits from non-financial sector
Deposits from financial institutions
Borrowings, issued debt securities, subordinated instruments and hybrid capital instruments
Total liabilities

NATIONAL BANK OF THE REPUBLIC OF MACEDONIA
42
As of 31 March 2016, the total assets
of the banking system amounted to Denar 422,756 million. In the first quarter of the year, except the increasing banks' investments in domestic short-term debt securities (mostly six-month treasury bills), all other major categories of banks' assets declined.
2.1. Loans to non-financial entities
In the first three months of 2016, the growth in lending to non-financial entities44 by banks, for the first time since 201245 , was negative (by insignificant -0,003%). As of April 2016, the quarterly growth rate of total loans to non-financial entities switched to the positive zone.
However, on an annual basis,
despite the certain slowdown, lending registered solid growth (by Denar 21,909 million or 8.6%, which is deceleration of 1.1 percentage point, compared to the annual growth in the previous quarter).
44 Loans to non-financial entities include the loans to resident and non-resident non-financial entities, including loans to private and public non-financial companies, central government, local government, non-profit institutions serving households (loans to other clients), sole proprietors and natural persons (loans to households). 45 The latest quarterly decrease in total loans to non-financial entities is registered on 30 October 2012.
Chart 59 Structure of the assets (left) and liabilities (right) of the banking system in %
Source: NBRM, based on the data submitted by banks.
12.2 11.5 11.8 11.1 11.1
15.4 15.3 14.5 14.9 15.3
12.0 11.7 11.9 12.0 11.8
55.9 57.0 57.3 57.7 57.7
1.6 1.6 1.6 1.5 1.32.9 2.9 2.9 2.8 2.8
0
10
20
30
40
50
60
70
80
90
100
3.2015 6.2015 9.2015 12.2015 3.2016
Fixed assets
Accrued interest and other assets
Loans to non-financial sector
Placements with banks and other financial institutions
Investments in securities
Cash and balances with MBRM
10.8 10.6 10.3 10.1 9.9
3.8 3.9 3.9 4.0 3.9
72.0 72.0 71.9 72.3 72.3
2.3 2.3 2.4 2.6 2.60.2 0.2 0.2 0.2 0.2
10.9 11.0 11.3 10.8 11.1
0
10
20
30
40
50
60
70
80
90
100
3.2015 6.2015 9.2015 12.2015 3.2016
Capital and reserves
Provisions for off-balance sheet items and other provisions
Other sources of funds
Deposits from non-financial sector
Deposits from financial institutions
Borrowings, issued debt securities, subordinated instruments and hybrid capital instruments
Chart 60 Assets of the banking system
in millions of denars and in %
Source: NBRM, based on the data submitted by banks.
-0.01 0.8 0.8
4.1
-0.2
6.8 6.9
5.6 5.8 5.6
-1
1
3
5
7
9
11
13
-5000
0
5000
10000
15000
20000
25000
30000
3.2015 6.2015 9.2015 12.2015 3.2016
Absolute quarterly growth of total assets (left scale)
Absolute annual growth of total assets (left scale)
Quarterly growth rate of total assets (right scale)
Annual growth rate of total assets (right scale)

Report on the Risks in the Banking System of the Republic of Macedonia in the First Quarter of 2016
43
Banks continued to be restrained in lending to corporate entities, and were increasingly oriented towards lending to households mainly due to lower risks, compared to the corporate sector. The downward movement in bank lending is evident exactly in the segment of corporate clients46, as opposed to credit support to households47, whose quarterly growth rate remained unchanged. In order to support corporate lending, in the first quarter of 2016, the National Bank continued the importance of the non-standard monetary policy measure that supports lending to net exporters and domestic producers of electricity48.
In the first quarter of 2016,
denarization of lending activity (characteristic of the past few quarters), significantly slowed down, which is mostly perceived in the corporate sector. However, in the currency structure of loans, Denar loans retained the major role, with so far the highest share of 53.8%.
46 Lending to non-financial companies on a quarterly basis decreased by Denar 2.832 million, or 1.8%. 47 Consumer loans and loans for the purchase and renovation of residential property are the most widely used credit products in the households. 48 With the Decision on reserve requirement (Official Gazette of the Republic of Macedonia No. 87/16), the reserve requirement base from banks' liabilities in domestic currency is reduced by the amount of the claims on net exporters and domestic producers of electricity, which are approved and paid as of 31 December 2017.
Chart 61 Amount of loans to non-financial entities in millions of denars
Source: NBRM, based on the data submitted by banks.
255,617262,615 265,964
277,533 277,525
0
20000
40000
60000
80000
100000
120000
140000
160000
180000
200000
220000
240000
260000
280000
300000
3.2015 6.2015 9.2015 12.2015 3.2016
Total loans to non-financial entities
Chart 62 Growth of loans to non-financial entities in millions of denars and in %
Source: NBRM, based on the data submitted by banks.
1.0
2.7
1.3
4.3
-0.003
9.2 9.1 8.99.7
8.6
-1
1
3
5
7
9
11
13
-1000
3000
7000
11000
15000
19000
23000
27000
3.2015 6.2015 9.2015 12.2015 3.2016
Absolute quarterly growth of total loans (left scale)
Absolute annual growth of total loans (left scale)
Quarterly growth rate of total loans (right scale)
Annual growth rate of total loans (right scale)

NATIONAL BANK OF THE REPUBLIC OF MACEDONIA
44
In terms of maturity, long-term lending is still predominant in the structure of total loans to non-financial entities, despite the slower growth in the first quarter of 2016. The growth of long-term loans entirely resulted from the "household" sector. However, banks, following the signal of the National Bank (through the adopted package of macro prudential measures to slow down the rapid growth of long-term consumer loans, of December 2015), slowed down the growth of long-term lending to households, from 3.4% as of 31 December 2015 to 2.7% as of 31 March 2016.
Chart 63 Quarterly (top) and annual (bottom) growth of loans by sector, currency and maturity in millions of denars and in %
Source: NBRM, based on the data submitted by banks.
15.4 15.9 15.6 16.015.0
2.4
3.14.2
5.67.1
4.9
1.80.2 0.4
-4.1-5
-2
1
4
7
10
13
16
19
22
25
-5000
-2000
1000
4000
7000
10000
13000
16000
19000
22000
25000
3.2015 6.2015 9.2015 12.2015 3.2016
Absolute change - foreign currency loans (left scale)
Absolute change - denar loans with FX clause (left scale)
Absolute change - denar loans (left scale)
Relative change - denar loans (right scale)
Relative change - denar loans with FX clause (right scale)
Relative change - foreign currency loans (right scale)
2.4
4.4
3.5
2.6 2.6
0.1
1.6
-0.4
5.7
-1.8 -2
-1
0
1
2
3
4
5
6
-4000
-2000
0
2000
4000
6000
8000
10000
12000
3.2015 6.2015 9.2015 12.2015 3.2016
12.4 12.7 13.2 13.4 13.6
7.26.8
5.97.1
5.0
0
2
4
6
8
10
12
14
16
18
0
3000
6000
9000
12000
15000
18000
21000
24000
27000
3.2015 6.2015 9.2015 12.2015 3.2016
Absolute change - non-financial companies (left scale)
Absolute change - households (left scale)
Relative change - households (right scale)
Relative change - non-financial companies (right scale)
1.4
5.8
1.8
6.4
0.5-0.1
1.3
2.4
2.01.3
1.7
-2.4
-1.2
2.3
-2.9-3.5
-2.0
-0.5
1.0
2.5
4.0
5.5
7.0
-2000
0
2000
4000
6000
8000
10000
12000
3.2015 6.2015 9.2015 12.2015 3.2016
-4.1
1.2-2.1
10.7
-5.4
1.73.8
1.94.0
1.4
37.3
-23.2
2.6
0.30.5
-30
-22
-14
-6
2
10
18
26
34
42
-4000
-2000
0
2000
4000
6000
8000
10000
12000
14000
3.2015 6.2015 9.2015 12.2015 3.2016
6.9 5.63.1
5.23.8
9.011.0 11.4 11.9 11.6
24.0
-10.4
14.5
8.5
-20.6-24
-19
-14
-9
-4
1
6
11
16
21
26
-3000
0
3000
6000
9000
12000
15000
18000
21000
24000
27000
3.2015 6.2015 9.2015 12.2015 3.2016
Absolute change - past due loans (left scale)
Absolute change - long-term loans (left scale)
Absolute change - short-term loans (left scale)
Relative change - short-term loans (right scale)
Relative change - long-term loans (right scale)
Relative change - past due loans (right scale)
Chart 64 Structure of total loans, by sector (left) and currency (middle), and by regular loans, by maturity (right) in %
Source: NBRM, based on the data submitted by banks.
41.3 41.9 42.8 42.1 43.2
57.5 56.9 56.0 56.7 55.6
1.2 1.2 1.2 1.2 1.2
0
20
40
60
80
100
3.2015 6.2015 9.2015 12.2015 3.2016
Households Non-financial companies Other clients
50.8 52.2 52.5 53.5 53.8
26.6 26.3 26.6 26,0 26.3
22.6 21.5 20.9 20.5 19.9
0
20
40
60
80
100
3.2015 6.2015 9.2015 12.2015 3.2016
Denar loans Denar loans with FX clause Foreign currency loans
21.9 21.5 20.8 21.9 20.8
76.6 77.4 78.0 77.0 78.1
1.5 1.1 1.2 1.1 1.1
0
20
40
60
80
100
3.2015 6.2015 9.2015 12.2015 3.2016
Short-term loans Long-term loans Past due loans
Chart 65 Quarterly growth of long-term loans to households, by currency in millions of denars and in %
Source: NBRM, based on the data submitted by banks.
11.2
-3.8
3.8 3.4 2.7
-15
-10
-5
0
5
10
15
20
25
-7500
-5000
-2500
0
2500
5000
7500
10000
12500
3.2015 6.2015 9.2015 12.2015 3.2016
Absolute change - foreign currency loans (left scale)Absolute change - denar loans with FX clause (left scale)Absolute change - denar loans (left scale)Relative change - denar loans (right scale)Relative change - denar loans with FX clause (right scale)Relative change - foreign currency loans (right scale)Relative change - total loans (right scale)

Report on the Risks in the Banking System of the Republic of Macedonia in the First Quarter of 2016
45
2.2. Deposits of non-financial entities
The extended internal political uncertainty, coupled with record low interest rates in the domestic and international financial markets, influenced on limitation of the growth of deposits of non-financial entities. In the first quarter of 2016, the annual growth of the total deposit base of banks slowed down, while on a quarterly basis, it decreased by Denar 429 million, or 0.1%. The quarterly dynamics of the deposit potential of the Macedonian banking system was fully determined by the deposits of non-financial companies, which in the first quarter of 2016 decreased by Denar 2,138 million, or 2.7% (mainly due to reduced deposits in domestic currency). Households, however, which are traditionally the most important depositor in the banks (a share of 71% in total deposits as of 31 March 2016), in the first quarter of 2016 increased their assets in banks by Denar 1,762 million, or 0.8%, which is a slowdown by 1.5 percentage points compared to the previous quarter49. In April 2016, there were certain pressures on the banks' deposit base, due to the worsened expectations of economic agents, caused by the action of the non-economic factors - destabilizing the political situation in the country and publicly expressed "doubts" by individuals about the stability of banks and deposits with them. This was particularly felt in April and May 2016, when the banking system faced with deposit withdrawal by natural persons, as well as increased demand for foreign currency. In such conditions, banks managed their liquidity extremely well and executed all the requirements for payment of deposits unrestrictedly. Also, the National Bank intensified monitoring of the deposit base, and in response to these changes, at the beginning of May 2016, increased the interest rate on CB bills by 0.75 percentage points (from 3.25% to 4%).
49 The annual growth rate of household deposits was more than halved compared to the same period last year, and is at the lowest level in the last decade.
Chart 66 Stock of deposits of non-financial entities in millions of denars
Source: NBRM, based on the data submitted by banks.
288,304 290,687 292,444306,190 305,761
0
30000
60000
90000
120000
150000
180000
210000
240000
270000
300000
330000
3.2015 6.2015 9.2015 12.2015 3.2016
Total deposits of non-financial entities
Chart 67 Growth of deposits of non-financial entities in millions of denars and in %
Source: NBRM, based on the data submitted by banks.
0.50.8 0.6
4.7
-0.1
8.5 8.7
5.9
6.7
6.1
-1
0
1
2
3
4
5
6
7
8
9
-3000
0
3000
6000
9000
12000
15000
18000
21000
24000
27000
3.2015 6.2015 9.2015 12.2015 3.2016
Absolute quarterly growth of total deposits (left scale)
Absolute annual growth of total deposits (left scale)
Quarterly growth rate of total deposits (right scale)
Annual growth rate of total deposits (right scale)

NATIONAL BANK OF THE REPUBLIC OF MACEDONIA
46
Under the influence of the uncertain
environment, denarization of deposits halted. The quarterly decline of Denar deposits of non-financial companies caused the quarterly decrease of total Denar deposits in the first quarter of the year (by Denar 1.669 million, or 0.9%, compared to the previous quarter). However, most (or 57.1%) of the total deposit base is comprised of Denar savings, for which the "household" sector is the most deserving (64.5% of total Denar deposits are household deposits). In order to support the process of denarization of deposits in the domestic banking system, in May 2016, the National Bank increased the
Chart 69 Quarterly (top) and annual (bottom) deposit growth by sector, currency and maturity in millions of denars and in %
Source: NBRM, based on the data submitted by banks.
1.8
-0.7
0.8 2.3 0.8
-4.2
5.1
-1.1
13.7
-2.7-5
-3
0
3
5
8
10
13
15
-5000
-2500
0
2500
5000
7500
10000
12500
15000
3.2015 6.2015 9.2015 12.2015 3.2016
8.3
6.25.2
4.33.3
9.2
16.7
6.9
13.3
15.2
0
4
8
12
16
20
24
0
4000
8000
12000
16000
20000
24000
3.2015 6.2015 9.2015 12.2015 3.2016
Absolute change - non-financial companies (left scale)
Absolute change - households (left scale)
Relative change - households (right scale)
Relative change - non-financial companies (right scale)
-0.7
-4.2
-0.9 -0.5-0.1
2.4
0.3 0.81.1
1.90.2
6.2
1.9
11.9
-1.5
-6
-3
0
3
6
9
12
15
-6000
-3000
0
3000
6000
9000
12000
15000
3.2015 6.2015 9.2015 12.2015 3.2016
-5.4 -5.9-8.2
-6.2 -5.7
17.9
13.4
9.0
4.6 4.1
18.7
22.119.6
21.319.3
-10
-5
0
5
10
15
20
25
30
-10000
-5000
0
5000
10000
15000
20000
25000
30000
3.2015 6.2015 9.2015 12.2015 3.2016
Absolute change - sight deposits (left scale)
Absolute change - long-term deposits (left scale)
Absolute change - short-term deposits (left scale)
Relative change - short-term deposits (right scale)
Relative change - long-term deposits (right scale)
Relative change - sight deposits (right scale)
-1.5 2.4 0.16.4
-0.9
21.6
-63.6
63.2
-11.8
27.1
2.9 -0.3 0.92.5
0.8
-80
-65
-50
-35
-20
-5
10
25
40
55
70
85
100
-3000
-1500
0
1500
3000
4500
6000
7500
9000
10500
12000
13500
15000
3.2015 6.2015 9.2015 12.2015 3.2016
11.0 12.08.5 7.4 8.1
-8.8
-23.7 -22.9
-36.2
-33.4
5.7 4.83.0
6.24.0
-40
-30
-20
-10
0
10
20
-5000
0
5000
10000
15000
20000
25000
3.2015 6.2015 9.2015 12.2015 3.2016
Absolute change - foreign currency deposits (left scale)
Absolute change - denar deposits with FX clause (left scale)
Absolute change - denar deposits (left scale)
Relative change - denar deposits (right scale)
Relative change - denar deposits with FX clause (right scale)
Relative change - foreign currency deposits (right scale)
Chart 68 Total deposit structure by sector, currency and maturity in %
Source: NBRM, based on the data submitted by banks.
72.9 71.8 72.0 70,3 71.0
23.5 24.5 24.1 26.2 25.5
3.6 3.7 3.9 3.5 3.5
0
20
40
60
80
100
3.2015 6.2015 9.2015 12.2015 3.2016
Households Non-financial companies Other clients
56.1 56.9 56.6 57.6 57.1
0.6 0.2 0.4 0.3 0.4
43.3 42.9 43.0 42.1 42.5
0
20
40
60
80
100
3.2015 6.2015 9.2015 12.2015 3.2016
Denar loans Denar loans with FX clause Foreign currency loans
36.1 38.1 38.5 41.2 40.6
36.2 34.4 33.9 32.2 32.2
27.7 27.5 27.6 26.6 27.2
0
20
40
60
80
100
3.2015 6.2015 9.2015 12.2015 3.2016
Sight deposits Short-term loans Long-term loans

Report on the Risks in the Banking System of the Republic of Macedonia in the First Quarter of 2016
47
reserve requirement rate for banks' liabilities in domestic currency with FX clause50 (given the negligible share of these liabilities in the banks' balance sheets, the changes are mainly to retain the low propensity of economic agents for this type of deposits).
The quarterly growth of foreign currency
deposits51 was almost entirely influenced by households, as opposed to the contribution of the companies, which was negative.
The decrease in short-term deposits,
typical for the past few quarters, continued in the first quarter of 2016, but it was significantly lower. On the other hand, for the first time after eleven quarters, a decline was registered in demand deposits (mainly due to corporate deposits, whose quarterly decline continued in April and May 2016, but at a slower pace).
50 Decision on reserve requirement (Official Gazette of the Republic of Macedonia No. 87/16) 51 Foreign currency deposits increased by Denar 989 million, or 0.8%.
Chart 70 Growth rate of interest rates on deposits of natural persons in denars (up), euros (middle) and US dollars (down), by bank in %
Source: National Bank, based on data submitted by banks, ECB and Fed. Note: The analysis includes interest rates on one-month, three-month, 12-month and 24-month deposits.
-0.5
0.0
0.5
1.0
1.5
2.0
2.5
3.0
3.5
dece
mber
2013
marc
h 2
014
june 2
014
septe
mber
2014
dece
mber
2014
marc
h 2
015
june 2
015
septe
mber
2015
dece
mber
2015
marc
h 2
016
3 months SKIBOR
-0.5
0.0
0.5
1.0
1.5
2.0
2.5
3.0
dece
mber
2013
marc
h 2
014
june 2
014
septe
mber
2014
dece
mber
2014
marc
h 2
015
june 2
015
septe
mber
2015
dece
mber
2015
marc
h 2
016
1 month SKIBOR
interest rate on theovernight deposit facility ofthe National Bank
0.0
1.0
2.0
3.0
4.0
5.0
6.0
dece
mber
2013
marc
h 2
014
june 2
014
septe
mber
2014
dece
mber
2014
marc
h 2
015
june 2
015
septe
mber
2015
dece
mber
2015
marc
h 2
016
12 months SKIBOR
0.0
1.0
2.0
3.0
4.0
5.0
6.0
7.0
8.0
dece
mber
2013
marc
h 2
014
june 2
014
septe
mber
2014
dece
mber
2014
marc
h 2
015
june 2
015
septe
mber
2015
dece
mber
2015
marc
h 2
016
-0.5
0.0
0.5
1.0
1.5
dece
mber
2013
marc
h 2
014
june 2
014
septe
mber
2014
dece
mber
2014
marc
h 2
015
june 2
015
septe
mber
2015
dece
mber
2015
marc
h 2
016
-0.5
0.0
0.5
1.0
1.5
2.0
novem
ber
2013
febru
ary
2014
may 2
014
august
2014
novem
ber
2014
febru
ary
2015
may 2
015
august
2015
novem
ber
2015
febru
ary
2016
3 months EURIBOR
-0.5
0.0
0.5
1.0
1.5
2.0
2.5
3.0
3.5
dece
mber
2013
marc
h 2
014
june 2
014
septe
mber
2014
dece
mber
2014
marc
h 2
015
june 2
015
septe
mber
2015
dece
mber
2015
marc
h 2
016
12 months EURIBOR
0.0
0.5
1.0
1.5
2.0
2.5
3.0
3.5
4.0
dece
mber
2013
marc
h 2
014
june 2
014
septe
mber
2014
dece
mber
2014
marc
h 2
015
june 2
015
septe
mber
2015
dece
mber
2015
marc
h 2
016
-0.5
0.0
0.5
1.0
1.5
2.0
dece
mber
2013
marc
h 2
014
june 2
014
septe
mber
2014
dece
mber
2014
marc
h 2
015
june 2
015
septe
mber
2015
dece
mber
2015
marc
h 2
016
1 month LIBOR
American interest rateFED (base rate)
-0.5
0.0
0.5
1.0
1.5
2.0
dece
mber
2013
marc
h 2
014
june 2
014
septe
mber
2014
dece
mber
2014
marc
h 2
015
june 2
015
septe
mber
2015
dece
mber
2015
marc
h 2
016
3 months LIBOR
-0.5
0.0
0.5
1.0
1.5
2.0
2.5
3.0
dece
mber
2013
marc
h 2
014
june 2
014
septe
mber
2014
dece
mber
2014
marc
h 2
015
june 2
015
septe
mber
2015
dece
mber
2015
marc
h 2
016
12 months LIBOR
0.0
0.5
1.0
1.5
2.0
2.5
dece
mber
2013
marc
h 2
014
june 2
014
septe
mber
2014
dece
mber
2014
marc
h 2
015
june 2
015
septe
mber
2015
dece
mber
2015
marc
h 2
016

NATIONAL BANK OF THE REPUBLIC OF MACEDONIA
48
Contrary to these developments, in the first quarter of 2016, the growth of long-term household deposits continued (but in April and May 2016, these deposits decreased).
In the recent period, the downward
trend in interest rates on deposits of natural persons continued, (for both short- and long-term). Such changes, in most banks, are partly attributed to the movements of policy rates for each currency and the downward adjustment of the interest rates of the banks themselves. Namely, in order to maintain and increase deposits in the domestic banking system, the National Bank improved the terms for placing foreign currency deposits of domestic banks in the National Bank52 and allowed banks, starting from May 2016, to place foreign currency deposits at the central bank at higher interest rates from the current negative interest rates prevailing in the international financial markets. Thus, a possibility was created to reduce the cost of domestic banks, which would accordingly contribute to higher interest rates on the deposits of their clients.
2.3. Other activities
The interest of banks in the Republic
of Macedonia to invest in domestic debt securities was present in the first quarter of 2016. The significant quarterly increase in investments in treasury bills53 caused a quarterly increase in the total portfolio of Denar 1,562 million, or 2.5%. Accordingly, the share of the securities portfolio in the total assets of banks, at the end of March 2016, reached 15.3% (from 14.9% at the end of December 2015). Banks' investments in CB bills showed minimal decrease, which, amid unchanged interest rate and supply of CB bills, is associated with the limited level of the offered amount54, through
52 Decision on foreign currency deposit with the National Bank of the Republic of Macedonia (Official Gazette of the Republic of Macedonia No. 87/16). 53 As of 31 March 2016, the banks' investments in treasury bills amounted to Denar 26,409 million, which is an increase of Denar 3,062 million, or 13.1% compared to 31 December 2015. 54 In August 2015, a criterion for allocation of the offered amount by banks was established, through the relative share of Denar liabilities of individual banks in the total Denar liabilities at the level of the banking system (Decision amending the Decision on CB bills (Official Gazette of RM No. 148/2015)).
Chart 71 Structure of the securities portfolio in %
Source: NBRM, based on the data submitted by banks.
41.4 41.2 42.8 39.7 38.0
30.8 30,5 32.0 37.0 40.8
24.6 25.6 22.4 20.0 17.9
3.2 2.7 2.8 3.3 3.3
0
10
20
30
40
50
60
70
80
90
100
3.2015 6.2015 9.2015 12.2015 3.2016
Other placements Placements in government bonds
Placements in Treasury bills Placements in CB bills

Report on the Risks in the Banking System of the Republic of Macedonia in the First Quarter of 2016
49
changes in the mechanism of forming banks' offers at the auctions of CB bills. Debt securities issued by the Republic of Macedonia and CB bills are components with the largest share in the structure of the total securities portfolio of banks.
On a quarterly basis, placements
with banks and other financial institutions minimally decreased (by Denar 899 million, or 1,8%). Reduction of funds on correspondent accounts in foreign banks, as well as long-term loans to domestic banks in foreign currency with a maturity of over two years, caused the largest portion of the reduction of total placements with banks and other financial institutions. The fall in funds on correspondent accounts in foreign banks was particularly intensified in April and May 2016, for unrestricted execution of the requirements for payment of deposits and / or for conversion in foreign currency and foreign currency deposits.
On the liabilities side, the reduction of
liabilities based on loans in the first quarter of 2016 (by Denar 1.240 million, or 3.3%) was mostly determined by the reduced liabilities on the basis of long-term loans in foreign currency to domestic banks (credit lines placed through "MBDP" AD Skopje), as well as by the reduced liabilities (of "MBDP" AD Skopje) based on long-term loans to non-residents - financial companies.
Chart 72 Maturity structure of banks' investments in government securities in %
Source: NBRM, based on the data submitted by banks.
0
20
40
60
80
100
3.2015 6.2015 9.2015 12.2015 3.2016
5, 10 and 15 year government bonds3 year government bonds2 year government bonds12 month Treasury bills6 month Treasury bills3 month Treasury bills
Chart 73 Quarterly (left) and annual (right) growth rate of securities portfolio in %
Source: NBRM, based on the data submitted by banks.
5.00.5
-4.7
7.1
2.5
-10
-8
-6
-4
-2
0
2
4
6
8
10
12
-100
-80
-60
-40
-20
0
20
40
60
80
100
120
3.2015 6.2015 9.2015 12.2015 3.2016
Placements in Treasury bills (left scale)
Placements in government bonds (left scale)
Other placements (left scale)
Placements in CB bills (left scale)
Total placements in securities (right scale)
-9.1
-4.7
-7.7
7.7
5.1
-15
-10
-5
0
5
10
15
20
25
-150
-100
-50
0
50
100
150
200
250
3.2015 6.2015 9.2015 12.2015 3.2016
Placements in Treasury bills (left scale)
Placements in government bonds (left scale)
Other placements (left scale)
Placements in CB bills (left scale)
Total placements in securities (right scale)

NATIONAL BANK OF THE REPUBLIC OF MACEDONIA
50
In the first quarter of 2016, deposits from banks and other financial institutions are lower compared to the previous quarter (short-term foreign currency deposits of non-resident - financial institutions registered the fastest decrease as a result of the disbursement of funds from the members of the groups to which one large and one medium-size bank in the country belong). Deposits from banks and other financial institutions are still very small source of funding for banks (3.7% of total funding sources).
Domestic banking system performs
its activities mainly on the domestic market. In the first quarter of 2016, the already smaller volume of activity banks realize with non-residents further reduced. Accordingly, the share of banks' claims and liabilities on / to non-residents55 in total assets, i.e. liabilities of the banking system reduced to a level that is only a little bit over 8%56. Placements with non-residents are generally liquid assets (correspondent accounts or in the form of short-term deposits) with foreign banks, while the bulk of the liabilities to non-residents are based on long-term loans, mainly to "MBDP" AD Skopje from international financial institutions.
55 On a quarterly basis, banks' liabilities to non-residents decreased by Denar 1,359 million, or 3.7%, while the reduction in claims on non-residents was lower and amounted to Denar 553 million, or 1.5%. 56 Analyzed by individual bank, the share of banks' claims on non-residents in total assets ranges from 0.6% to 19.1%, while the share of banks' liabilities to non-residents in the total liabilities ranges from 0.3% to 14.8%. "MBDP" AD Skopje was excluded from this analysis.
Chart 74 Quarterly growth rate of placements with financial institutions (top), loan liabilities (middle) and deposits of financial companies (bottom) in %
Source: NBRM, based on the data submitted by banks.
-27.9
37.1
78.7
1.6
8.8
-3.7
-3.92.7
2.4 -1.2
-0.8
-1.0
-2.9
14.8
-4.4-3.5
-2.12.3 5.5 -1.8
-40
-20
0
20
40
60
80
100
3.2015 6.2015 9.2015 12.2015 3.2016
Accounts and deposits with domestic banks
Accounts and deposits with foreign banks
Loans to domestic banks
Total placements with banks and other financial institutions
-1.2
-1.7
-3.2
13.2
-4.9
0.3
-1.9
4.0
5.3
-2.7-0.4
-2.0
0.9
8.0
-3.3
-9
-6
-3
0
3
6
9
12
15
3.2015 6.2015 9.2015 12.2015 3.2016
Credit liabilities to financial entities - residents
Credit liabilities to nonresidents
Total credit liabilities
-0.6
-3.9
14.2
0.2
-0.3
-32.1
30.9
-30.7
31.1
-7.6-9.1
3.1 2.75.5
-1.9
-35
-25
-15
-5
5
15
25
35
3.2015 6.2015 9.2015 12.2015 3.2016
Deposits of financial institutions - residents
Deposits of financial institutions - nonresidents
Total deposits of banks and other financial institutions
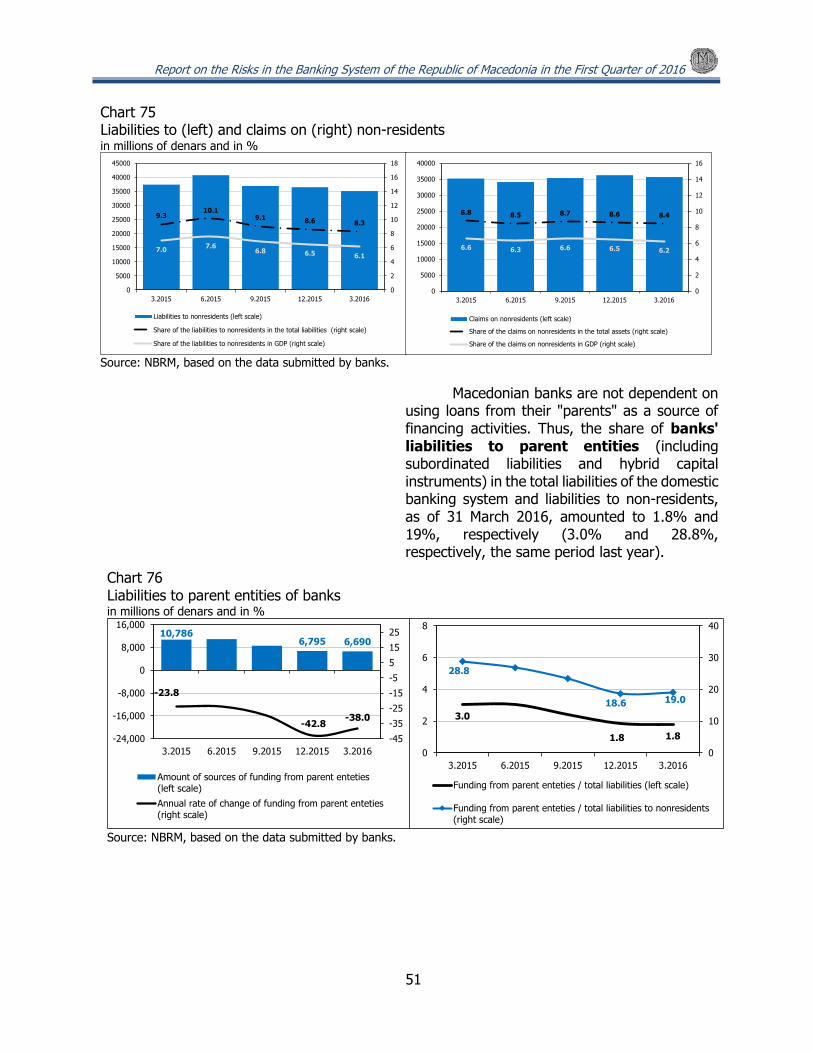
Report on the Risks in the Banking System of the Republic of Macedonia in the First Quarter of 2016
51
Macedonian banks are not dependent on
using loans from their "parents" as a source of financing activities. Thus, the share of banks' liabilities to parent entities (including subordinated liabilities and hybrid capital instruments) in the total liabilities of the domestic banking system and liabilities to non-residents, as of 31 March 2016, amounted to 1.8% and 19%, respectively (3.0% and 28.8%, respectively, the same period last year).
Chart 75 Liabilities to (left) and claims on (right) non-residents in millions of denars and in %
Source: NBRM, based on the data submitted by banks.
9.310.1
9.1 8.6 8.3
7.07.6
6.8 6.5 6.1
0
2
4
6
8
10
12
14
16
18
0
5000
10000
15000
20000
25000
30000
35000
40000
45000
3.2015 6.2015 9.2015 12.2015 3.2016
Liabilities to nonresidents (left scale)
Share of the liabilities to nonresidents in the total liabilities (right scale)
Share of the liabilities to nonresidents in GDP (right scale)
8.8 8.5 8.7 8.6 8.4
6.6 6.3 6.6 6.5 6.2
0
2
4
6
8
10
12
14
16
0
5000
10000
15000
20000
25000
30000
35000
40000
3.2015 6.2015 9.2015 12.2015 3.2016
Claims on nonresidents (left scale)
Share of the claims on nonresidents in the total assets (right scale)
Share of the claims on nonresidents in GDP (right scale)
Chart 76 Liabilities to parent entities of banks in millions of denars and in %
Source: NBRM, based on the data submitted by banks.
10,7866,795 6,690
-23.8
-42.8-38.0
-45
-35
-25
-15
-5
5
15
25
-24,000
-16,000
-8,000
0
8,000
16,000
3.2015 6.2015 9.2015 12.2015 3.2016
Amount of sources of funding from parent enteties(left scale)
Annual rate of change of funding from parent enteties(right scale)
3.0
1.8 1.8
28.8
18.6 19.0
0
10
20
30
40
0
2
4
6
8
3.2015 6.2015 9.2015 12.2015 3.2016
Funding from parent enteties / total liabilities (left scale)
Funding from parent enteties / total liabilities to nonresidents(right scale)

NATIONAL BANK OF THE REPUBLIC OF MACEDONIA
52
3. Profitability
In the first quarter of 2016, banks in the Republic of Macedonia reported almost three times higher profit compared with the first three months of the previous year. Lower interest expenses and lower total impairment of financial assets (loans) and non-financial assets (foreclosed assets) of banks had the most pronounced effect on increasing profits. Amid a general downward movement in interest rates (both lending and deposit), the decrease in net interest income is due to the minimal quarterly decline in the banks' deposit base at almost unchanged level of lending. The main profitability indicators, return on assets and equity, have significantly improved, and the banks' operational ability to generate revenues that cover their operating costs has remarkably improved, despite the small growth of banks' operating costs. As of March 2016, the ten banks (nine at the end of 2015) which reported profit make up 92.3% of the total assets of the banking system (68.6% at the end of 2015).
3.1. Income, expenses and indicators of
profitability and efficiency of the banking system
In the first quarter of 2016, total
income of banks (total regular income57 and
extraordinary income) increased by Denar 237.1 million, or 4.6%, compared with the previous year and reached Denar 5,422.4 million. Generator of the increased income of banks is the higher net interest income (by Denar 391.2 million, or 11.6%), which increased due to the lower interest expenses (by Denar 363.3 million, or 23.0%), amid simultaneous insignificant increase in interest income (by Denar 27.9 million, or 0.6%). Other regular income58 declined, which led to a significant slowdown in the growth of total income. In the first quarter of 2016, the growth rate of total income is three times lower than the growth rate in the previous year.
57 Total regular income includes: net interest income, net commission income and other regular income (net trading income, net income from financial instruments carried at fair value, net income from exchange rate differentials, income from dividends and equity investments, net gains from sale of financial assets available for sale, capital gains from assets sales, release of provisions for off-balance sheet items, release of other provisions, income from other sources and income based on collected claims previously written off). 58 The decrease in other regular income by Denar 179.9 million, or 22.3% is mainly due to the high base effect, due to the capital profit from sale of assets of a bank in the first quarter of 2015.
Chart 77 Net profit after taxation (top) and annual change in main income and expenses (bottom) in millions of denars
Source: NBRM, based on the data submitted by banks.
-1500
-1000
-500
0
500
1000
1500
3.2014 3.2015 3.2016
Impairment losses Operating expenses
Other regular income Interest income
Interest expenses Net interest income
Net fees and commissions income
414 593
1,512
-2000
-1500
-1000
-500
0
500
1000
1500
2000
3.2014 3.2015 3.2016
Profit Loss Net profit

Report on the Risks in the Banking System of the Republic of Macedonia in the First Quarter of 2016
53
Following these developments, minimal changes occurred in the structure of total revenues, and net interest income strengthened its largest share in total income of banks.
Analyzing individual sectors, the
increase in interest income in the first quarter of 2016 results from the growth of interest income from households, amid a decline in income from all other sectors. The growth of interest income from households (of Denar 144.1 million, or 7.3%) corresponds to the credit growth to this sector, in spite of the downtrend of interest rates on loans to households. On the other hand, interest income from non-financial companies declined by Denar 31.8 million, or 1.7% on an annual basis, mainly due to the downward trend in lending interest rates and the slower growth of bank loans to this sector. Decrease was also registered in interest income from other entities (by Denar 33.6 million, or 9.3%)59 and financial companies (by Denar 15.6 million, or 4.6%)60.
In the first quarter of 2016, interest
expenses of all sectors declined, mainly due to lower deposit interest rates compared with March 201561. Interest expenses from the household sector62 contributed the most (68.1%) to the decrease in interest expenses, which still dominate the structure of interest expenses. Despite the cut in interest rates, the slower growth of deposits of the household sector63 had a
59 The reduction in interest income from other entities is mainly due to the reduced investments in government bonds issued by the Republic of Macedonia in the first quarter of 2016, despite the growth of investments in treasury bills. The average amount of banks' investments in government bonds in the first quarter of 2016 is smaller by Denar 1.864 million than the average amount invested in the first quarter of 2015. In the first quarter of 2016, the average amount of investments in treasury bills is by 6.640 million more than the invested in the first quarter of 2015. 60 The reduction in income from financial companies is primarily due to the reduced bank investments in the deposit facility at the National Bank, as well as the modest reduction in banks' investments in the CB bills of the National Bank, during the first quarter of 2016. Thus, the average amount of the invested overnight deposits is almost halved, while deposits up to seven days decreased by Denar 288 million. In addition, in February 2015, interest rates on these deposits at the National Bank decreased by 0.25 percentage points (for overnight deposits), i.e. by 0.5 percentage points (for deposits with a maturity of seven days) compared to the first quarter of 2016. 61 Compared with the first quarter of 2015, interest rates on deposits decreased by 0.6 p.p.. 62 Compared to the first quarter of 2015, interest rates on household Denar deposits, without and with currency clause decreased by 0.7 and 1.0 p.p. respectively. Interest rates on foreign currency deposits declined by 0.3 p.p.. 63 The annual growth rate of household deposits at the end of March 2016 stood at 3.3% and in March 2015 8.3%.
Chart 79 Sector structure of interest income (top) and interest expenses (bottom) in %
Source: NBRM, based on the data submitted by banks.
45 43.8 44.1 42.9
38.4 39.6 41.1 43.6
7.9 7.5 7.2 6.78.7 9.1 7.6 6.8
0
10
20
30
40
50
60
70
80
90
100
3.2013 3.2014 3.2015 3.2016
Non-financial companies Households Financial institutions Other
11 10.5 10.8 10.5
65.4 63.2 60.6 58.4
10.3 11.8 13.2 15.2
13.3 14.5 15.4 15.9
0
10
20
30
40
50
60
70
80
90
100
3.2013 3.2014 3.2015 3.2016
Non-financial companies Households Financial institutions Other
Chart 78 Structure of total income in %
Source: NBRM, based on the data submitted by banks.
66 68.7 64.9 69.3
21.521.9
19.619.2
12.5 9.415.6 11.6
0
10
20
30
40
50
60
70
80
90
100
3.2013 3.2014 3.2015 3.2016
Net interest income Net fees and commissions income
Other regular income Extraordinary income

NATIONAL BANK OF THE REPUBLIC OF MACEDONIA
54
respective impact on the reduction of interest expenses on these deposits.
The largest portion of total income
of banks was spent to cover operating costs64 and impairment. It is important that their share in total income is lower compared with the previous year.
Despite the lower share in total
income, in the first three months of 2016, banks' operating costs increased by Denar 83.5 million, or 3.2% relative to the previous year. The increase in staff costs, which contributed with 68.0% to the growth of operating costs, was most noticeable, thereby increasing their share in the structure of these costs. Slower growth of operating costs compared to the increase in the total regular income enabled a continuation of the trend of improving banks’ operational efficiency (the amount of total regular income used to cover operating costs significantly reduced). Improved operational efficiency of banks is confirmed by other ratios that also decreased.
In the first three months of 2016, banks
allocated lower amount for impairment of financial assets, by Denar 452.1 million, or 33,3%65. The decrease in net impairment is due to slower growth in non-performing loans66. Accordingly, the share of net interest income spent to cover the impairment of financial assets almost halved (from 40.3% as of 31 March 2015 to 24.1% as of 31 March 2016).
64 Banks' operating costs include: staff costs, depreciation, general and administrative expenses, deposit insurance premiums and other operating costs, except extraordinary expenses. 65 For comparison, in the first quarter of 2015, net impairment of financial assets (loans and similar claims), increased by Denar 566.3 million, or by 71.7%, on an annual basis. 66 The annual growth rate of non-performing loans has been reduced from 13.6% (31 March 2015) to 2.3% (31 March 2016).
Chart 81 Structure of operating costs in %
Source: NBRM, based on the data submitted by banks.
38.5 39.1 41.8 42.6
9.8 9.3 9.1 9.2
31.1 31.132.3 30.4
12.2 12.9 10.1 10.2
8.5 7.6 6.8 7.7
0
10
20
30
40
50
60
70
80
90
100
3.2013 3.2014 3.2015 3.2016
Employees expenses Depreciation
General and administrative costs Deposit insurance premiums
Other operating expenditures
Chart 80 Usage of total income in %
Source: NBRM, based on the data submitted by banks.
60.9 58.750.8 50.2
40.132.1
37.6
21.8
-1.0
9.2 11.4
27.9
0,1 0,6
-10
0
10
20
30
40
50
60
70
80
90
100
3.2013 3.2014 3.2015 3.2016
Extraordinary expensesCurrent profit before taxationNet-impairment of financial and non-financial assetsOperating costs
Chart 82 Bank efficiency indicators in %
Source: NBRM, based on the data submitted by banks.
50.8 50.1
78.2
72.3
2.63
2.57
2
2.5
3
3.5
4
4.5
40
50
60
70
80
90
100
3.2013 3.2014 3.2015 3.2016
Operating expenses/ Total regular income (Cost-to-income) (left scale)
Operating expenses / Net interest income (left scale)
Operating expenses / Average assets (right scale)

Report on the Risks in the Banking System of the Republic of Macedonia in the First Quarter of 2016
55
Impairment of non-financial assets
(foreclosed assets) decreased by Denar 313.1 million, or by 53.1%, compared to the same period last year, owing to the reduction of new foreclosed assets.
In the first quarter of 2016, the
increased profit of the banking system had a positive impact on the main indicators of banks’ profitability. Compared to the previous year, rates of return on assets and equity have increased, and also, banks' profit margin67 has significantly improved, and all indicators based on rates that are influenced by net interest income.
67 Profit margin is the ratio of operating profit (loss) to total regular income.
Table 3 Profitability and efficiency indicators of the banking system in %
Source: NBRM, based on the data submitted by banks. Indicators by groups of banks are shown in Annex 36.
3.2015 3.2016
Rate of return on average assets (ROAA) 0.6 1.4
Rate of return on average equity (ROAE) 5.5 13.0
Cost-to-income ratio 50.8 50.1
Non-interest expenses/Total regular income 56.8 56.8
Labor costs /Total regular income 21.2 21.3
Labor costs /Operating expenses 41.8 42.6
Impairment losses of financial and non-financial assets /Net interest income 57.8 31.4
Net interest income /average assets 3.4 3.5
Net interest income /Total regular income 64.9 69.3
Net interest income /Non-interest expenses 114.2 121.9
Non-interest income/Total regular income 41.2 37.4
Financial result/Total regular income 11.4 27.9
Chart 83 Impairment of financial and non-financial assets in millions of denars
Source: NBRM, based on the data submitted by banks.
0
500
1000
1500
2000
2500
3000
3500
3.2013 3.2014 3.2015 3.2016
Net impairment losses of financial assets Impairment losses of financial assets
Reversal of impairment losses of financial assets Impairment losses of non-financial assets
Chart 84 Annual growth rate of impairment loss in %
Source: NBRM, based on the data submitted by banks.
-100
-50
0
50
100
150
200
250
300
350
3.2013 3.2014 3.2015 3.2016
Net impairment losses of financial assets
Impairment losses of financial assets
Reversal of impairment losses of financial assets
Impairment losses of non-financial assets

NATIONAL BANK OF THE REPUBLIC OF MACEDONIA
56
The increase in the net interest margin68 compared to March 2015 is a result of the more evident annual growth in net interest income (by 11.6%) compared to the growth of interest-bearing assets (by 7.7%). This is due to the reduced interest expenses (by 23.0%), while the slower growth of interest-bearing liabilities (3.4%) caused the reduction of interest expenses per unit of interest-bearing liabilities. On the other hand, the reduced lending interest rates amid higher interest-bearing assets resulted in a slight increase in interest income (0.6%), and a decrease in interest income per unit of interest-bearing assets of 0.4 percentage points.
Analyzing by bank, eight of fifteen banks
reported higher net interest margin than the net interest margin earned by the banking system.
68 Net interest margin is calculated as a ratio between net interest income and average interest-bearing assets. Average interest-bearing assets are calculated as an arithmetic mean of the amounts of interest-bearing assets at the end of the current year and at the end of the previous year.
Chart 85 Net interest margin in %
Source: NBRM, based on the data submitted by banks.
6.0
2.3
3.8
5.9
1.9
4.0
5.5
1.4
4.1
0
1
2
3
4
5
6
7
Interest income/averageinterest-bearing assets
Interest expenses/averageinterest-bearing liabilities
Net interest margin
3.2014 3.2015 3.2016
Chart 86 Income/expenses to interest-bearing assets/liabilities (up) and Net interest margin, by bank (down) in %
Source: NBRM, based on the data submitted by banks.
Banking system 4.1
0
1
2
3
4
5
6
Bank 1
Bank 2
Bank 3
Bank 4
Bank 5
Bank 6
Bank 7
Bank 8
Bank 9
Bank 1
0
Bank 1
1
Bank 1
2
Bank 1
3
Bank 1
4
Bank 1
5
0
1
2
3
4
5
6
7
8
9
Bank 1
Bank 2
Bank 3
Bank 4
Bank 5
Bank 6
Bank 7
Bank 8
Bank 9
Bank 1
0
Bank 1
1
Bank 1
2
Bank 1
3
Bank 1
4
Bank 1
5
Interest income/average interest-bearing assets
Interest expenses/average interest-bearing liabilities
Interest income/average interest-bearing assets of the banking system
Interest expenses/average interest-bearing liabilities of the banking system

Report on the Risks in the Banking System of the Republic of Macedonia in the First Quarter of 2016
57
3.2. Movements in interest rates and interest rate spread
The trend of reduction in lending and deposit interest rates of banks continued in the first quarter of 2016, amid unchanged level of the policy rate of the National Bank of 3.25%69. Compared to the first quarter of 2015, interest rates for all currencies are decreasing70. In addition, more intensive decrease in interest rates on Denar deposits compared to Denar loans caused a widening of the Denar interest rate spread, and the total interest rate spread was moving in the same direction. In contrast, the interest rate spread and the spread of interest rates of the Denar positions with foreign exchange clause narrowed, influenced by the increased reduction of lending and deposit interest rates. Generally, all changes in interest rate spreads were less than one percentage point.
69 In May 2016, under the influence of factors of non-economic nature due to the volatile environment in the country, the NBRM increased the interest rate to 4%. 70 With the exception of Denar deposits with foreign currency clause which, when comparing March 2016 with March 2015, registered a small increase.
Chart 87 Lending (top) and deposit interest rates (bottom) in percentage points
Source: NBRM, based on the data submitted by banks.
7.6
7.1
6.7 6.0
6.0 5.6
6.9
6.5
5
6
7
8
9
10
I.13
III.
13
V.1
3
VII
.13
IX.1
3
XI.
13
I.14
III.
14
V.1
4
VII
.14
IX.1
4
XI.
14
I.15
III.
15
V.1
5
VII
.15
IX.1
5
XI.
15
I.16
III.
16
V.1
6
Interest rates on denar loans
Interest rates on denar loans with FX clause
Interest rates on foreign currency loans
Interest rates on total loans
3.22.5
1.7 1,8
1.51.1
2.4
1.8
0
1
2
3
4
5
6
I.13
III.
13
V.1
3
VII
.13
IX.1
3
XI.
13
I.14
III.
14
V.1
4
VII
.14
IX.1
4
XI.
14
I.15
III.
15
V.1
5
VII
.15
IX.1
5
XI.
15
I.16
III.
16
V.1
6
Interest rates on denar deposits
Interest rates on denar deposits with FX clause
Interest rates on foreign currency deposits
Interest rates on total deposits
Chart 88 Interest spread, by currency in percentage points
Source: NBRM, based on the data submitted by banks.
4.44
4.96
4.20
4,57 4.49
4.59
4.63
4,57
3
4
5
6
I.13
III.
13
V.1
3
VII
.13
IX.1
3
XI.
13
I.14
III.
14
V.1
4
VII
.14
IX.1
4
XI.
14
I.15
III.
15
V.1
5
VII
.15
IX.1
5
XI.
15
I.16
III.
16
V.1
6
Denar interest rates spread
Denar interest rates spread with FX clause
Foreign currency interest rates spread
Total lonas and deposits interest rates spread

NATIONAL BANK OF THE REPUBLIC OF MACEDONIA
58
ANNEXES