Report on the Quality Check of the Robustness of the ...€¦ · Report on the Quality Check of the...
92
Deliverable 5.4 Report on the Quality Check of the Robustness of the Narrative behind Energy Directives Contributors (alphabetical order): Louisa Di Felice (UAB), Tessa Dunlop (JRC), Mario Giampietro (UAB), Zora Kovacic (UAB/UiB), Ansel Renner (UAB), Maddalena Ripa (UAB), Raúl Velasco-Fernández (UAB) November, 2018 Horizon 2020 Societal challenge 5: Climate action, environment, resource efficiency and raw materials
Transcript of Report on the Quality Check of the Robustness of the ...€¦ · Report on the Quality Check of the...
Deliverable 5.4
Report on the Quality Check of the Robustness of the Narrative behind Energy Directives
Contributors (alphabetical order):
Louisa Di Felice (UAB), Tessa Dunlop (JRC), Mario Giampietro (UAB), Zora Kovacic (UAB/UiB), Ansel Renner (UAB), Maddalena
Ripa (UAB), Raúl Velasco-Fernández (UAB)
November, 2018
Horizon 2020 Societal challenge 5:
Climate action, environment, resource
efficiency and raw materials

Report on the Quality Check of the Robustness of the Narrative behind Energy Directives
Please cite as:
Di Felice L., Dunlop T., Giampietro M., Kovacic Z., Renner A., Ripa M., Velasco-Fernández R. – Report on the Quality Check of the Robustness of the Narrative behind Energy Directives
MAGIC (H2020–GA 689669) Project Deliverable 5.4
Date (30 November 2018)
Disclaimer:
This project has received funding from the European Union’s Horizon 2020 Research and Innovation Programme under grant agreement No. 689669. The present work reflects only the authors' view and the funding Agency cannot be held responsible for any use that may be made of the information it contains.

MAGIC – GA 689669
3
Table of Contents
Table of Contents 3
Abbreviations 5
List of Figures 7
List of Tables 8
Summary for Policymakers 9
Technical Summary 11
1. Introduction 13
1.1 Policy Domain and the Nexus 13
1.2 Social Metabolism and Quantitative Story-Telling 15
1.3 Structure and focus of the Report 23
2 Methodology 24
2.1 Selection and Validation of Narratives 24
2.2 Quantifying the Narratives 28
2.3 Closing the QST Loop 30
3 Results 33
3.1 Transition to renewable energy 33
3.2 Intermittency challenge 41
3.3 Energy Efficiency narrative 46
3.4 Outsourcing Challenge 61
3.5 Main insights from Closing the QST Loop 72
4 Concluding Discussion 73
5 Reflections and Next Steps 75
5.1 EU energy policy and the management of expectations 75
5.2 Lessons learnt about the quality of the narratives used in the energy policy domain 77
5.3 Lessons learnt about the undertaking of Quantitative Story-Telling 78
5.4 Lessons learnt about policy and the Nexus 79
5.5 Next Steps 80
List of Publications 82
Dissemination in Conferences/Workshops 82
Annex A – Policy Briefs 83
Annex B – Data 84

Report on the Quality Check of the Robustness of the Narrative behind Energy Directives
Acknowledgements 85
References 86

MAGIC – GA 689669
5
Abbreviations
AG agricultural sector
BEP bioeconomic pressure
BES battery energy storage
CCF cultivation, construction and fabrication
CGE computable general equilibrium
CSS carbon capture and storage
DEA data envelopment analysis
DG directorate-general
DHoU deputy head of unit
EEA european environment agency
EC energy carrier
EM energy and mining sector
EMR energy metabolic ratio
ES energy sector
EU european union
EU-28 the 28 current eu member states
GHG greenhouse gases
GMR greenhouses gases metabolic ratio
HA human activity
HoU head of unit
HSLC high storage low curtailment
IEA international energy agency
JRC joint research centre
LCE low-carbon economy

Report on the Quality Check of the Robustness of the Narrative behind Energy Directives
LSHC low storage high curtailment
MAGIC moving towards adaptive governance in complexity (h2020 project reference no 689669)
MC manufacturing and construction sector
MuSIASEM multi-scale integrated analysis of societal and ecosystem metabolism
PES primary energy source
PHS pumped hydroelectric storage
PNS post-normal science
QST quantitative story-telling
RES renewable energy sources
SDG sustainability development goal
SES social-ecological system
SG service and government sector
STOA european parliament's science and technology options assessment
WEF water-energy-food nexus

MAGIC – GA 689669
7
List of Figures
Figure 1. State-pressure representation for an isolated social-ecological system ..................... 17
Figure 2. State-pressure representation for interacting social-ecological systems .................... 17
Figure 3. How Quantitative Story-Telling can be used to challenge “epistemic boxes” ............. 19
Figure 4. QST timeline for Energy Policy ..................................................................................... 24
Figure 5. CO2 emission projections, in megatons (Mt) of CO2, under the EU high RES
decarbonisation pathway. ........................................................................................................... 34
Figure 6. Total GHG emissions in the low storage high curtailment (LSHC) scenario. ................ 37
Figure 7. GHG emissions in the LSHC scenario, broken down into operational (flows, green line)
and infrastructural (funds, blue line). ......................................................................................... 37
Figure 8. Total GHG emissions in the high storage low curtailment (HSLC) scenario. ................ 38
Figure 9. GHG emissions in the HSLC scenario, broken down into operational (flows, green line)
and infrastructural (funds, blue line). ......................................................................................... 38
Figure 10. Growth in power capacities over time during the Peninsular Spain renewable energy
transition ..................................................................................................................................... 42
Figure 11. Growth in power capacities over time during the German renewable energy
transition. .................................................................................................................................... 42
Figure 12. Three clusters of countries having similar values of Energy Intensity. After Fiorito
(2013). ......................................................................................................................................... 50
Figure 13. Euro area GDP growth rate (at current prices): an economic explanation of the
reduction of GHG emissions in the EU in the period 2008-2009. ............................................... 51
Figure 14. Evolution of the ‘efficiency’ of the US food system based on fossil energy input and
food energy output (in MJ per capita per day). .......................................................................... 52
Figure 15. The different factors affecting the energy and carbon intensity of an economy. ..... 57
Figure 16. An example of the features of the information space generated by the end-use matrix
characterizing the pattern of energy end uses in a society. ....................................................... 58
Figure 17. Changes in the metabolic characteristics of the Paid Work sector of the EU and China
in the period 2001-2016. ............................................................................................................. 59
Figure 18. Changes in the metabolic characteristics of 11 sub-sectors of the industrial sector of
the EU and China in the period 2001-2016. ................................................................................ 60
Figure 19. Taxonomy of the analysis. .......................................................................................... 63
Figure 20. EMR_GER (Energy Metabolic Rate) for the Energy Sector in EU17 from 2009 to 2015.
..................................................................................................................................................... 66
Figure 21. EMR_el (Electricity Metabolic Rate) for the Energy Sector in EU17 from 2009 to 2015
..................................................................................................................................................... 66
Figure 22. EMR_he (Heat Metabolic Rate) for the Energy Sector in EU17 from 2009 to 2015 .. 67

Report on the Quality Check of the Robustness of the Narrative behind Energy Directives
Figure 23. GMR (GHG Metabolic Rate) for the Energy Sector in EU17 from 2009 to 2015 ........ 67
Figure 24. Relative change (2009-2015) of the inputs and GHG emissions of local Energy Sector
..................................................................................................................................................... 68
Figure 25. Relative change (2009-2015) of the inputs and GHG emissions of virtual Energy Sector
..................................................................................................................................................... 68
Figure 26. breakdown of GHG emissions allocated to the three ECs supply, including exports. 70
Figure 27. Relative change (2009-2015) of the fossil PES metabolized by EU countries. ........... 71
Figure 28. The Gartner hype-cycle. ............................................................................................. 75
List of Tables
Table 1. List of primary policy documents analysed for the Renewable Energy narrative ......... 25
Table 2. List of primary policy documents analysed for Energy Efficiency narrative.................. 26
Table 3. Power and energy gaps ................................................................................................ 44
Table 4. Monetary and GHG requirements for lithium batteries ............................................... 45
Table 5. Comparing the usefulness of the electric supply of different types of power plants ... 49

MAGIC – GA 689669
9
Summary for Policymakers
Energy plays a central role in nexus discourses, and as such energy policies have long-lasting
effects both on the economic behaviour of societies and on local and global environments. In
this deliverable, we focus on the central role played by narratives in the policy process, and in
building the scientific models that inform EU energy policies. Our analysis is based on an
innovative approach called Quantitative Story-Telling (QST), a hybrid qualitative and
quantitative tool, used to check the robustness: (i) the definitions of policy problems – i.e.
concerns; and (ii) the identification of policy solutions – i.e. based on models and targets. QST
looks at a given problem definition and policy solution adopting various narratives and different
models. For this reason, we do not claim that the quantitative results presented in this
deliverable are “better” or “truer” than the original ones. Quantitative Story-Telling (QST) has
the goal of expanding the set of insights that can be obtained in relation to a given issue because
a diversity of story-telling makes it possible to reflect the diversity of story-tellers.
Within the larger information space generated by QST it becomes easier to compare the quality
of the various narratives used to both identify trade-offs and effective solutions. The quality
criterion becomes the priority given to the policy concern and the plausibility of the analysis and
the scenarios rather than the scientific rigour of the quantitative assessment.
In this report, QST has been applied to check the robustness of the narratives and models
supporting the EU’s energy directives/policies.
The main policy-relevant results of each narrative domain are the following:
1. Decarbonisation of the EU’s power sector through the generation of renewable (intermittent)
electricity.
* By adopting a different (metabolic) framing of analysis, we challenge the dominant policy
narrative according to which a quick decarbonisation of the EU’s power sector is feasible in the
next two or three decades. Our results hint that, if the emissions associated with the building
of the powerplants and storage required to supply renewables-based electricity are accounted
for, EU might not be able to meet the given carbon targets.
* Built on the same policy narrative, the second analysis discusses the main feasibility (GHG
emissions) and viability (economic costs) challenges posed by the increasing penetration of
intermittent electricity due to the inherent nature of renewables (that cannot be stored as such).
In this narrative, according to existing technology, the scale of the required storage capacity for
a full supply of electricity from intermittent sources would exceed (in the order of hundreds of
GWh) any optimistic assumption of what can be achieved in two or three decades of frenetic
construction.
2. The adoption of simple indicators and targets based on the concept of energy efficiency is not
effective in monitoring and implementing energy policies
Our analysis provides several practical examples where the intended outcomes of policies are
being undermined by the use of indicators and targets based on simplistic definitions of
efficiency. Adopting different epistemic framings (social practices theory, a multilevel metabolic
analysis), it is possible to identify practical examples of single indicators and targets designed on

Report on the Quality Check of the Robustness of the Narrative behind Energy Directives
a simplistic definition of efficiency. Rather rather than assuming that increase efficiency alone
will deliver utopian solutions where all objectives are achieved, our results suggest that both the
development and monitoring of EU energy policy would be better informed using the concept
of performance (a characterization referring to an integrated set of goals defined across scales
and dimensions) as a substitute of efficiency. Performance is a complex concept that entails the
existence of trade-offs across different targets.
3. The omission of the implications of externalization (outsourcing) found in the analysis of
energy performance and GHG emissions.
An analysis of the importance of the quantities of energy and emissions associated with the
import of energy commodities in seventeen EU countries at three snapshots (2009, 2012 and
2015) shows that they should not be neglected and deserve much closer attention in order to
better inform policy-making. Since the functioning of the energy sector in the EU depends on
massive quantities of imported energy commodities, its performance cannot be meaningfully
studied without also considering externalized energy uses (also known as embodied energy) and
externalized emissions associated with the energy commodities being imported, as they
challenge the basis of conventional energy policy discourses of decoupling, efficiency and
security.
In relation to the quality of the existing quantitative analysis we found that:
* There is an excessive hegemonization of economic narratives (the narratives less suitable to
deal with sustainability issues!) in the framing of energy problems;
* There is a systemic strategy of using reductionism (simplistic analysis based on the adoption
of a single scale and/or a single dimension at the time) to deal with complex problems;
* There is a systemic neglecting of a key characteristics of complex adaptive systems (social-
ecological systems): they must be open to survive. This results into a systemic neglecting of the
implications of their level of openness (the level of externalization/outsourcing of the economic
process);
* There is a systemic neglecting of the existence of different typologies of metabolic patterns –
i.e. there are different typologies of economies operating in different evolutionary phases with:
(i) different endowment of natural resources, (ii) different endowment of technical capital, (iii)
different size of population and different age structures, (iv) different level of openness. Existing
“one size fits all” models and indicators tend to compare the performance of “apples”, “oranges”
and “cars”;
* There is a systemic neglecting of social aspects: energy uses can only be explained in relation
to the associated social practices. They cannot be explained by the technical coefficients of the
devices converting energy flows.
In conclusion, the exercise of QST presented in this deliverable suggests that it is essential to
expand not only the analyses used to support EU energy policies, but also the framing of the
analysis (what we refer to as epistemic boxes). This implies that in terms of the science-policy
interface, the set of relevant narratives used has to be enriched and the existing discourse and
models dominated by neo-classical economic assumptions have to be complemented with
alternative types of models and data.

MAGIC – GA 689669
11
Technical Summary
The research conducted for D5.4 had two main objectives:
1. To apply QST to check the quality of the narratives used to inform to generate alternative
story-telling. We did so by using the MAGIC tool-kit (making it possible to integrate different
conceptual frameworks in the generation of quantitative results). With this approach we
compared the plausibility and salience of the different insights associated with the different
story-telling. QST opens up spaces for alternative narratives that could be used to help address
in a more effective way the WEF nexus challenges;
2. To learn from the implementation of the QST approach in the real world – discussing our
findings with stakeholders and policy makers - in order to use these lessons for further stages of
the MAGIC-NEXUS project.
The first objective self-evidently speaks to the debates regarding the robustness and usefulness
of the scientific evidence used to inform policy. The second objective speaks to a growing
interest in transdisciplinary research, or co-production of knowledge, that supports science-
policy interfaces bridging academic and policy arenas.
The QST methodology has a cyclic and participatory nature: an initial set of narratives is
identified and mapped through the analysis of policy documents (qualitative input); the
narratives are then discussed with stakeholders (in this first phase mainly DG staff, Scientists
involved in the discussion over energy policies, Members of the European Parliament, NGOs), in
order to identify which ones are, in their opinion, the most relevant and useful to analyse. Then
for the quantitative analysis we use an accounting framework - the Multi-Scale Integrated
Analysis of Society and Ecosystem Metabolism (MuSIASEM) – based on the combination of a
series of conceptual frameworks – the metabolic pattern of social-ecological systems, relational
analysis, the flow-fund model developed in bioeconomics, social practices theory. In this way
we can generate quantitative representations of the causal relations and scenarios associated
with the choice of different narratives. This quantitative analysis based on adoption of
alternative conceptual frameworks is then used as an input to stir a discussion on the quality of
the original energy narratives with stakeholders.
The approach provides a series of quality checks on the robustness of selected narratives based
on different ‘pillars of sustainability’: (i) on environmental feasibility: an analysis of the external
limits (outwith human control) based on the availability of primary sources and primary sinks
required by the metabolic pattern under analysis – for example the amount of available arable
land, water, or admissible levels of CO2 in the atmosphere; (ii) on economic and technical
viability: an analysis of the internal limits (within human control) based on congruence with
economic and technical constraints – for example, the amount of hours available to the working
population, and the price of infrastructural changes; (iii) on desirability: an analysis of the
performance of the metabolic pattern in relation to the expectations of the socio-economic
systems under analysis – touching upon issues of the material standard of living, the robustness
of social fabric and institutions, normative values, etc. In relation to the quality check QST relies
on three pillars: (i) the acknowledgment of the existence of different and distinct epistemic
framings of energy discourses, these provide the context of the QST analysis; (ii) the

Report on the Quality Check of the Robustness of the Narrative behind Energy Directives
identification and mapping of energy narratives into different typologies, providing the
qualitative methodology to the QST cycle; (iii) the societal metabolism (MuSIASEM) approach
used to quantify the feasibility, viability and desirability of narratives, providing the quantitative
methodology to the QST cycle.
The acknowledgment of the existence of different epistemic framings is central to this
deliverable’s approach. We define an epistemic framing (also referred as epistemic box) as a set
of established relations across semantic and formal statements that is used to perceive and
represent the interactions of a social system with the external world. The generation of a policy
and the setting of policy target are carried out within a given epistemic box. Systemic analyses
of the energy system may not only tackle issues within the given framing, but also show, that
the framing itself is inadequate to properly represent the system (for example in the
decarbonisation narrative for EU energy generation systems). Inadequate framing undermines
policy design, implementation and monitoring by excluding factors that can make the
achievement of policy objectives impossible. Worse still inadequate framing makes it much
more likely that unintended negative consequences will occur. The concept is further explained
in Section 1.2.2. Within the epistemic framing, policy narratives are mapped and classified
depending on their role within the policy, making the distinction between justification
narratives, normative narratives and explanation narratives. We explain the strength of this
distinction in analysing policy discourses in Section 1.2.3. The quantitative analysis, using
MuSIASEM describes the operation of the economy from a biophysical perspective, making the
distinction between processes taking place within the biosphere and technosphere of a social-
ecological system (outside and under human control) and processes taking place in other social-
ecological systems (relevant in relation to externalization). Section 1.2.1. explains the
quantitative tools in detail.
Stakeholders’ engagement is the second main objective of the QST described in this report.
Some of the social actors, who participated in the various participatory events, expressed a
certain reluctance about our findings. This is not surprising given the innovative nature of our
methodology – it requires time to be “metabolized”, especially by those established institutions
(administrative and academic) that are not accustomed to “think outside the epistemic box”. In
any case all social actors well received the opportunity to enlarge the analytical tools used to
inform policy and to generate new sets of narratives to co-produce useful knowledge at the
science-policy interface.

MAGIC – GA 689669
13
1. Introduction
This report illustrates the application of Quantitative Story-Telling (QST) to the policy domain of
EU energy directives. QST is used to check the quality of a set of relevant narratives behind EU
energy policies. The quality check aims to consider whether the narratives used within the
various domains to justify, endorse and select policy targets are associated with practical
solutions to given problems that are feasible, viable and desirable. Following the classification
made by Felt (2007), we refer to these types of narratives, respectively, as justification,
normative and explanation narratives. To carry out this check, we analyse the perceptions and
representations of the energy systems associated with the selected narratives through the lens
of the metabolic pattern of social-ecological systems. This entails using modes of analysis that
look at the biophysical underpinning of the economic process. The consideration of the
biophysical underpinning of the economy allows us to operationalize and integrate the concepts
of feasibility, viability and desirability across different disciplinary fields. In terms of feasibility,
we consider whether the solution proposed by the policy, and envisioned in the narrative, is
compatible with external boundary conditions, i.e. the constraints imposed on an economy by
natural processes outside human control. A viability check considers whether the solution(s)
proposed by the policy, and envisioned in the narrative, is compatible with the internal
constraints imposed on the economy by economic and technical processes under human
control. Desirability is concerned with whether the solution proposed by the policy, and
envisioned in the narrative, is compatible with existing institutions, normative values and
expectations of the social actors affected by the decision. As a consequence, desirability will
depend on the perspective(s) of stakeholder(s).
This report contributes to the suite of analyses being undertaken within WP5 across a range of
policies, including: Water directives (D5.3); Energy directives (D5.4); Common Agricultural Policy
(CAP) (D5.5), Environment protection – biodiversity and soils (D5.6) and Circular Economy
concept (D5.7).
1.1 Policy Domain and the Nexus
The EU is a global leader in seeking to mitigate climate change by reducing GHG emissions, a
position won first through being ahead of the curve in cutting emissions and setting relatively
ambitious new targets, and now buttressed by more unified climate diplomacy efforts
(European Commission, 2017a, 2017b). Efforts in Paris and afterward to improve
decarbonisation and ‘bend the curve’ on climate change, creating a downward trajectory in
future emissions. On neither climate nor energy policy are, however, all European voices
perfectly in sync. Both scientists and politicians are increasingly highlighting the importance of
the nexus between these closely connected energy and climate policy areas and advocating “an
approach that integrates management and governance across sectors and scales”.
In parallel to climate debates, it has become evident in the academic community and in
policymaking that environmental issues need to be approached from a holistic perspective,
considering the entangled web of nexus elements, such as water, energy and food, within a
coherent framework (Hoff, 2011; Ringler et al., 2013; Gulati et al., 2013; Brazilian et al., 2011).
Directives affecting different spheres of the nexus, moreover, are decided by separate entities.

Report on the Quality Check of the Robustness of the Narrative behind Energy Directives
In EU policy, discourses of moving beyond so-called policy silos towards deeper forms of
interdisciplinarity are gaining ground. Monodisciplinary science reinforces policy silos by
providing solutions that are limited to a specific domain. Interdisciplinary science, on the other
hand, challenges this division with new methods and theories, but is resisted by the existing
organisation of silos. Improving the governance and integration of policy making and their
implementation across these entities of the targets and goals, thus, requires significant shifts
not only in the organisation of structures deciding and implementing the policies but also in the
scientific information used to inform policies. In academia, the remarkable upsurge in scientific
papers, projects, platforms and networks dedicated to the concept of the nexus has generated
an intense discussion on the topic and flagged the existence of three important knowledge gaps
in relation to sustainability (Giampietro, 2018):
1. Addressing the challenge of the nexus requires a radical change in the business as usual mode
of dealing with sustainability problems. Hitherto the sustainability problem has been perceived
as a technical problem within isolated silos and dealt with accordingly. This approach has
translated into the adoption of strategies aimed at addressing and fixing one problem at the
time. For example, if we have a problem with finite fossil energy stocks, then we develop new
technologies making alternative energy sources available. If we face land constraints for food
production, we develop novel methods of food production boosting the yields per hectare. Do
we have a problem of water shortage? Then we develop innovations boosting the efficiency of
end-uses. When considering all these problems simultaneously across different scales and
dimensions of analysis, under the umbrella of the resource nexus, the Cartesian dream of
prediction and control shatters: the sustainability problem cannot be solved with technological
innovations (Guimarães Pereira and Funtowicz, 2015). This has implications for both the process
of policy making and the nature of the solutions that may have to be considered in function of
the policy process;
2. Consideration of the resource nexus also flags a remarkable gap in governance structures
when it comes to dealing with the complexity of the sustainability predicament. Existing
institutions are fragmented into silos to deal with problems categorized on the basis of specific
dimensions of analysis, one at the time. We thus have institutions to deal with water, energy,
food, or the environment, but on whose desk does the resource nexus sit?
3. The resource nexus exposes the inadequacy of the paradigm of reductionism as a mode of
scientific inquiry for dealing with complex issues in quantitative terms. “Normal science” (in the
Kunhian definition) is good at generating very large and complicated models, yet these models
often only build representations based on one narrative (one dimension and one scale) at the
time. Their pertinence and relevance depend on the pertinence and the relevance of the
narrative framing within which they have been built. A common solution to the need to deal
with problems encompassing multiple framings or dimensions is combining quantitative results
from different models — for example transformations, water transformations and other
biophysical transformations taking place in the agricultural sector— into some sort of composite
quantitative representation. However, in this way the entanglement of the various resource
flows across different levels of analysis and dimensions may be missed.

MAGIC – GA 689669
15
Acknowledging the existence of these three knowledge gaps is relevant in a discussion of the
quality of energy directives. They flag the existence of a systemic problem affecting the quality
of the scientific input used in the process of decision making. The types of models used right
now to inform policies are derived from the traditional economic theory which aims to identify
the “best course of action”. This tradition assumes that it is possible to optimize the choices, by
regulating energy systems’ behaviour using for example Computable General Equilibrium (CGE)
models, or to rank possible options using ranking multi-criteria methods, for example through
Data Envelopment Analysis (DEA). However, when the analysis of the performance of an energy
system, regulated by an energy directive, has to be integrated within a larger characterization
of its performance which includes water, food, land use, social aspects and environmental
impact, it becomes evident that current models are simplistic. This is because they rely on a set
of assumptions and simplifications associated with the compressing of multiple scales and
dimensions into a single inferential system. These simplifications imply a systemic neglect of
key information that would be relevant for the other elements of the nexus. For this reason, in
this report QST is used to check the quality of two processes. The first is the quality of the
narratives used to select policies, and the second is the quality of the models used to generate
information that supports said narratives.
1.2 Social Metabolism and Quantitative Story-Telling
QST proposes a new way of using scientific analysis in the process of decision making. It is an
alternative to the concept of evidence based policy, assuming that specific pieces of information
can be used as “evidence” to inform policy makers (Saltelli and Giampietro, 2016). While the
latter aims at identifying the “best course of action” using models, QST anticipates possible
troubles associated with proposed policies by carrying out an extended quality check on the
production and use of the narratives, rather than the models, used in the process of decision
making. The ultimate goal is to check the robustness of knowledge claims in face of uncertainty.
QST focuses its quality check on the usefulness and the pertinence of the pre-quantification
choice of narratives behind a given issue definition (the semantic framing) that are reflected
later on in the consequent problem structuring (the formal framing). Therefore, QST is a
heuristic approach aimed at providing a quality control on the process used to structure both
the specific perception (qualitative) and representation (quantitative) of a given issue relevant
for policy making. The quantitative analysis in QST is carried out using a metabolic approach, as
explained in the next sub-section (1.2.1). Sub-sections 1.2.2 and 1.2.3 focus on the qualitative
side of QST, which relies on the identification of epistemic boxes and on the use of narratives.
1.2.1 The metabolic pattern of social-ecological systems
The approach developed in MAGIC allows studying the metabolic pattern of social-ecological
systems. The concept of social-ecological systems evolved from the seminal work of (Holling,
2001, 1998), (Berkes et al., 2003), (Gunderson and Holling, 2002), (Glaser et al., 2008). A social-
ecological system can be defined as the complex of functional and structural components
operating within a prescribed boundary, that is controlled in an integrated way by the activities
expressed by a given set of ecosystems (in the biosphere) and a given set of social actors and
institutions (in the technosphere). As a consequence of this definition, social-ecological systems
are open systems, exchanging inputs and waste flows with their context. Therefore, they

Report on the Quality Check of the Robustness of the Narrative behind Energy Directives
depend on their context for maintaining their current level of activity and size of production
factors. Social-ecological systems must be adaptive and anticipatory in order to survive because
of their option space being constrained by processes both under and beyond their control.
Because of this duality, in a social-ecological system the process of maintenance and
reproduction of the components operating inside the technosphere should not undermine the
processes of maintenance and reproduction of the components operating in the biosphere. An
analysis that includes the biophysical roots of the economic process fills a knowledge gap in the
repertoire of used perceptions and representations of the sustainability of the economic
process.
In the economic narratives often used in quantitative analysis, for example, stemming from the
application of CGE models it is difficult to make a clear distinction between key concepts such
as environment, nature, technology, human-made and non-human made. Because of this
problem “the representation of nature as external to the social has important depoliticizing
effects, since it makes the political nature of certain events and processes invisible and therefore
incontestable” (Kenis and Lievens, 2014). As a result of the inability to properly represent the
pattern of interaction of social-ecological systems with their context, the discussion of
sustainability becomes reified and simplistic. It is particularly difficult to handle the logical
distinction between the self and the other in relation to environmental impacts. The economic
process has a context, composed of local environmental processes, other economic processes
and distant environmental processes.
The analytical methods currently employed to inform EU energy policy cannot make a clear
logical distinction between the “context” of the economy – i.e. the boundary conditions in
technical jargon. The context of an economy is determined by processes taking place in the
biosphere and by economic processes taking place in the technosphere belonging to trading
economies. As a consequence of this ambiguity, the analytical methods currently employed to
inform EU energy policy cannot provide clear quantitative assessments of the policy implications
of changing the level of openness of the economy though trade. This problem can be solved by
adopting the definition of a social-ecological system. In this way, we can distinguish between
context and environment by adopting the state-pressure concept adopted by the European
Environmental Agency (EEA). To illustrate the nature of the problem and the solution provided
by the MAGIC tool-kit, we adopt the visualization proposed by the EEA. This explanation is
important as it underpins the analytical method adopted by MAGIC to check, through QST, the
feasibility, viability and desirability of policy measures and targets.
In the simple view of the state-pressure relation for an isolated social-ecological system, as
shown in ¡Error! No se encuentra el origen de la referencia., we can see the division between a
set of processes taking place inside the technosphere and a set of interactions between the
technosphere and the biosphere. In the technosphere, socio-economic processes are described
by an end use matrix as a set of various secondary flows (as opposite to primary flows associated
with primary sources and sinks) used by fund elements inside the economy in relation to various
end users: the household compartment, the service sector, the sector of mobility, the industry
and the primary sectors of the economy. The End-Use Matrix, as developed in MAGIC, analyses
the metabolism inside society across different levels and identifies who is using the various types
of resources, how and why (it organizes the funds and flows within the system).

MAGIC – GA 689669
17
Figure 1. State-pressure representation for an isolated social-ecological system
Between the biosphere and the technosphere, this set of interactions allows tracking the
primary sources and primary sinks required to produce the secondary inputs consumed inside
the technosphere. In this way, one can track the environmental pressure that the internal
consumption generates on the embedding ecosystems. A more complex view is given in Figure
2.
Figure 2. State-pressure representation for interacting social-ecological systems

Report on the Quality Check of the Robustness of the Narrative behind Energy Directives
The situation illustrated in ¡Error! No se encuentra el origen de la referencia. considers both
the interaction of a SES with its own environment (part of the biosphere included in its borders)
and with more SESs (processes taking place in technosphere and in the biosphere outside the
borders of the SES).
A cursory observation of the two figures explains why the use of economic narratives is
ineffective in framing the factors generating problems of sustainability. The state-pressure
concept allows us to study the trade-offs between changes in the technosphere and changes in
the biosphere: changes in the technosphere are described in MAGIC as changes in the End-Use
Matrix – a data array representing how resources are used, by whom, how, and why – inside the
economic process – across the different functional elements of the economy. Changes in the
biosphere, on the other hand, are described in MAGIC as changes in the Environmental Pressure
Matrix – the requirement of primary sources and primary sinks associated with the secondary
flows metabolized by the economy. This approach makes it possible to track who is gaining and
who is losing from a given change in the existing metabolic pattern, when considering a single
social-ecological system. However, recognizing the level of openness of the modern economies
– i.e. the implications of globalized trade - there is another aspect of the metabolism of a social-
ecological system that has to be considered. Looking at the graph in Fig. 2 we can see that trade
with other social-ecological systems implies that the “context” of a SES is determined by: (i)
processes taking place in the biosphere operating inside its own border; (ii) processes taking
place in the technosphere of other SESs; and (iii) processes taking place in the biosphere
operating inside the borders of other SESs.
To summarise, studying sustainability within the framework of the metabolic pattern of social-
ecological systems, as described in Figures 2, 3 and 4, is an approach that highlights the role that
a pre-analytical framing of an issue plays in its quantification, therefore it does not shy away
from associating the issue with its political surroundings. As sustainability issues are too complex
to be translated into policy-based evidence based on reductionist analysis. This kind of framing
at the science-policy interface shows how simple short-cuts in both the analysis of the problem
and in the formulation of the solutions are not acceptable options.
1.2.2 How QST challenges epistemic boxes
We can define an epistemic box as a set of established relations across semantic and formal
statements that is used to perceive and represent the interactions of a social system with the
external world – Figure 3. The definition of this set of relations is used to decide action (through
policies) and to test and validate the knowledge claims adopted in previous choices.
In relation to the energy policy domain, the existing epistemic boxes are the knowledge used
right now to:
(i) identify policy concerns, expressed using a selected set of narratives that describe
the expected effects of energy uses (on the semantic framing side of Figure 3); and
(ii) formalize this semantic framing in the form of models, data and indicators (on the
formalization side of Figure 3) also developed within the scope of the chosen
narratives.

MAGIC – GA 689669
19
This formalization (needed to guide action) defining indicators and targets allows validating the
knowledge claims used to select policies: if the policies as tested against the indicators and
targets achieve the expected results, the validity of the existing epistemic box is confirmed.
Within the paradigm of “normal science” the quality checks on the knowledge claims are carried
out only inside the chosen epistemic box. The checks may refer to the quality of the relation
between policy concern and scientific evidence, or to the chosen models that are expected to
generate reliable predictions of the effects of the chosen policies. For example, when dealing
with the policy concern “climate change”, an example of the quality check of the first kind
(focusing on the relation between policy concern and scientific evidence) would be the check on
the robustness of the evidence that this phenomenon is generated by anthropogenic causes.
When dealing with the side of formalization, the quality check would be on the robustness of
the predictions of emission reductions through given policy measures, depending on the
reliability of the chosen monitoring and targets. This second quality check refers to the
representation of causality linking the relevant narrative (what-how) to the chosen models and
data” (HOW).
Figure 3. How Quantitative Story-Telling can be used to challenge “epistemic boxes”
The set of relations established inside the epistemic box can be described by looking at the role
played by models, data and evidence-based policy in linking perceptions and representation.
Analyses of policies requires an iterative approach between perceptions and representations.
Once a problem is perceived in a certain way, both in terms of what the concern is and what the
narratives underpinning the concern are, it can be framed through models and data to lead to
policy targets. The perception of policy concerns reflects the why-what relation: what should be
considered to be a policy concern, and why. This is then framed in terms of relevant narratives

Report on the Quality Check of the Robustness of the Narrative behind Energy Directives
(what-how): how the identify policy concern is framed. Moving from perception to
representation, policy concerns and relevant narratives lead to the implementation of specific
models and data that lead, in turn, to the generation of policy targets (what we should achieve,
and how: the how-what relation). All this is carried out within a chosen epistemic box. With QST,
we argue that we should not only change the models and data linking policy concerns, relevant
narratives and policy targets, but reframe the whole set of relations.
Considering this set of relations, we can say that the conventional paradigm of “normal science”
checks: (i) the quality of scientific evidence – e.g. in the example of climate change - how robust
are the scientific results proving that the increased concentration of GHG in the atmosphere is
due to human agency?; (ii) the quality of models and data by controlling the respect of
established rules and protocols. In relation to the first quality check, when dealing with complex
phenomena it is easy to have diverging assessments on the robustness of the scientific evidence.
In relation to the second quality check, when dealing with the quality of a given representation
the focus is on the proper behavior of the scientists that produced the analysis. A discussion on
whether the chosen model (reflecting a pre-quantitative choice of a narrative) is useful for
generating the required insights is rarely done.
QST checks the congruence of the choices of relevant narratives, policy concerns and policy
targets: the three elements in red in ¡Error! No se encuentra el origen de la referencia.. For this
reason, QST does not focus much on the formal rigor of the scientific information that is
processed inside the epistemic box. Rather, QST focuses on the plausibility and salience of the
chosen combination of policy concerns, relevant narratives and policy targets, without relying
on internal formal relations established in the original epistemic box. For this reason, the quality
check of QST has to be based on alternative inputs of transdisciplinary information generated in
different epistemic boxes. In this way, QST aims to:
1. Check whether the targets (proposed by the models developed inside the given narratives)
are feasible, viable, and desirable. For example, is it feasible, viable and desirable to reduce GHG
emissions by 90% while supporting green growth? In case they appear to be either unfeasible,
unviable or undesirable in the QST check, we should question the knowledge claims generated
within the existing epistemic box. The robustness of the existing set of narratives and models
used to identify both policy concerns and policy targets has to be re-evaluated;
2. Check whether the identified policy concerns should be changed. In this case, we should
question the choice of the old set of relevant narratives and pertinent models because they have
led to an irrelevant (or useless) identification of policy concerns.
When the QST check shows that the considered epistemic box is not capable of generating
robust and useful knowledge claims, it is necessary to either expand the number of epistemic
boxes to be considered, or to complement existing models and data with alternative models and
data. The first approach allows us to better frame the problems associated with the original
policy concern. New relevant narratives have to be added to the existing ones providing the
insights missed by the current selection. In relation to implausible targets the addition of
alternative modelling frameworks can provide the missing representations of relevant aspects
to be considered.

MAGIC – GA 689669
21
1.2.3 Quality check of narratives through Quantitative Story-Telling
QST relies on the identification of narratives in the policy domain. During the identification of
these narratives, the distinction between three different types of narratives used in governance
is particularly useful. As originally suggested by the European Commission report Taking
European Knowledge Society Seriously (Wynne and Felt, 2007), narratives can be split into: (i)
justification narratives – the basic assumptions on which the normative and the technical targets
are built – e.g. the narrative that maintaining current consumption patterns, and shifting to
renewable production systems, we can decarbonise the energy sector that ; (ii) normative
narratives – the identification of what should be done – e.g. that green growth is desirable and
(iii) explanation narratives – the practical implementation of specific strategies used to articulate
policies – e.g. that the mass implementation of renewable energy decreases GHG emissions.
In this report we suggest that in addition to the various narratives used right now in the
sustainability discussion, there is a neglected set of alternative difficult policy questions that
should also be posed. In our view the alternative policy questions may result even more salient
than those discussed right now. The discussion of narrative typologies can be linked back to the
concept of epistemic boxes. Whereas the evidence produced by models is generated within a
given “box” determined by the pre-analytical choice of a relevant narrative about the issue to
be dealt with, the analysis provided by QST is about comparing the usefulness of different
epistemic boxes that can be used to perceive and represent the specific issue of interest. More
specifically, when dealing with the production and use of quantitative information to be used
for governance (targets, indicators, anticipatory models) Quantitative Story-Telling makes it
possible to identify and discuss the pre-analytical choices of two different types of narratives:
a justification narrative that is behind the choice of a given policy – why we should do
something;
a normative narrative which is represented by the policy itself – what should be done.
Conventional, evidence-based policy, though, can often deal only with an explanatory narrative
– how to do what has been identified previously in the selection of a normative narrative. The
process by which this normative narrative was generated may not be clear or evidence based or
robust. It should be noted that the fact that science is asked, in this way, to help normative
decisions should be considered as a system failure of the political system. When dealing with
complex issues associated with large doses of uncertainty, policy makers tend to rely on science
to reach allegedly scientifically proven decisions.
However, the quality of the choice of the why and the what, that needs to be carried out in a
pre-analytical phase, cannot be checked by using formal models or by adopting the wisdom of
disciplinary knowledge – i.e. the axioms of economics, ecology, engineering, sociology.
Disciplinary knowledge assumes by default that the narrative within which the disciplinary
analysis is carried out (the epistemic box providing the why-what relation, i.e. framing policy
concerns) is valid, pertinent and useful for dealing with the proposed issue. Disciplinary
knowledge can only provide useful information about the how required for achieving a given
what. For this reason, QST must be by default transdisciplinary.
The analytical strength of QST comes from its acknowledgment of the epistemological
implications of complexity, particularly the predicament caused by the co-existence of multiple

Report on the Quality Check of the Robustness of the Narrative behind Energy Directives
scales at which the external world can be observed. Different relevant pieces of the
sustainability puzzle can only be perceived, described and measured by adopting non-equivalent
descriptive domains (analyses at different geographical scales or hierarchical levels). A single
instance of quantitative analysis requires adopting just one of the many possible non-equivalent
views the external world. In effect this choice of perspective is a narrative choice. The choice
of a single narrative view is a necessary pre-analytical step to allow one to focus on relevant
aspects of the sustainability problem at hand. However, the choice of only a single narrative
view implies neglecting other aspects that are also relevant for sustainability. For this reason
we proposed an approach using simultaneously an analysis referring to multiple scales and
dimensions of analysis, asking: do we have a ‘Plan B’ in the case we discover soon that: (i) the
justification narratives currently used are not valid; (ii) the implementation of the chosen
normative narratives is generating more harm than good; and/or (iii) the explanation narratives
used at the moment are suggesting impractical solutions?

MAGIC – GA 689669
23
1.3 Structure and focus of the Report
This report adopts the wu wei philosophy of Taoism by acknowledging the fact that a decision
of non-action is itself an action. In line with this philosophy, rather than trying to answer the
most salient, frequent and difficult policy questions circulating in current framing of
sustainability issues we have identified the most salient, frequent and difficult policy questions
that are not addressed within the conventional sustainability policy debate. We here embrace
a different approach by addressing the untouched governance challenges: what potential
troubles can we anticipate in relation to the proposed scenarios? Drawing on this approach and
using the examples of energy-climate nexus, we quantitatively analyze some current
shortcomings in the existing models of energy governance. That is, QST proposes a different use
of quantitative analysis: it does not aim to predict what will happen, but rather it tries to
anticipate potential troubles by representing different aspects of expected futures across
different narratives.
Following the introduction, the report proceeds to define the mixed methodology applied in
Part 2, which combined social science methods with QST – quantitative story-telling. We start
by illustrating the QST cycle, and then explain each step of the cycle individually: how narratives
are selected and validated, how they are quantified, and how the outputs of the analysis are fed
back into the cycle to close the QST loop. Section 3 presents the results, split across four case
studies: the GHG emissions of a renewable electricity transformation in the EU; the implications
of intermittency in Spain and Germany in terms of storage; the role that outsourcing plays in the
description of the performance of the EU’s energy system; the analysis of energy efficiency
narratives and indicators. In the concluding discussion (Part 4) and section 5 we make a
reflection on the main insights of the QST and we define the next steps.

Report on the Quality Check of the Robustness of the Narrative behind Energy Directives
2 Methodology
QST involves a participative and deliberative analysis of the quality of proposed or available
policies and narratives on governance. QST is a mix of qualitative and quantitative methods to
structure the exploration and representation of the resource nexus. It encourages stakeholders
to carefully examine existing EU policies and stimulates reflection on the feasibility, viability and
desirability of existing and potential options for managing energy and the nexus.
The general iterative schema of QST includes several steps: the first step is to identify stories, or
narratives, about situations, problems and solutions (through text analysis and interviews); then
selected relevant narratives, validated though meetings with policy-makers, are quantitatively
represented with MuSIASEM. Lastly, the results are presented and then the feedbacks received
are used to eventually run another cycle of QST.
In Figure 4 the workflow and the corresponding QST timeline followed for the energy policy QST
is shown. The different steps are detailed in the following sections.
Figure 4. QST timeline for Energy Policy
2.1 Selection and Validation of Narratives
In the first QST step, a preliminary text analysis of selected policy documents related to the
policy areas that are of interest for the project was carried out. This analysis functioned as a
preparatory step for the development of the interview guidelines.

MAGIC – GA 689669
25
2.1.1 Text Analysis
A policy-document analysis was conducted by the energy policy team in November/December
2016. The work consisted in identifying the existing directives and policy proposals and
extracting the relevant policy narratives.
The text analysis was performed according to the common guidelines put together by the MAGIC
social science team and focused on coding two main directives:
1. Energy efficiency directive 2012 http://eur-lex.europa.eu/legal-
content/EN/TXT/PDF/?uri=CELEX:32012L0027&from=EN;
2. Renewable energy directive 2009 http://eur-lex.europa.eu/legal-
content/EN/TXT/PDF/?uri=CELEX:32009L0028&from=en
Nevertheless, many other documents have been referred. Table 1 and Table 2 report the main
documents analysed for the Renewable Energy and Energy Efficiency directives. The energy
team also closely monitored the EU energy discussion, using channels such as the DG Energy
News webpage (https://ec.europa.eu/energy/en/latest-updates); the DG Energy newsletter; EP
ITRE news.
Table 1. List of primary policy documents analysed for the Renewable Energy narrative
Type of document Name Year Code
Directive On the promotion of the use of energy from
renewable sources and amending and
subsequently repealing Directives 2001/77/EC and
2003/30/EC
2009 2009/28/EC
Communication A Roadmap for moving to a competitive low
carbon economy in 2050
2011 COM(2011) 112
final
Communication Energy Roadmap 2050 2011 COM(2011) 885
final
Communication A policy framework for climate and energy in the
period from 2020 to 2030
2014 COM(2014) 15
final
Directive Amending Directive 98/70/EC relating to the
quality of petrol and diesel fuels and amending
Directive 2009/28/EC on the promotion of the use
of energy from renewable sources
2015 (EU) 2015/1513
Communication Clean Energy for all Europeans 2016 COM(2016) 860
final
Directive Proposal Proposal for a directive of the European
Parliament and of the Council on the promotion
of the use of energy from renewable sources
2016 COM(2016) 767
final
Web page Energy Strategy and Energy Union Last access
08/2018
–
Web page Renewable Energy – Moving towards a low
carbon economy
Last access
08/2018
–

Report on the Quality Check of the Robustness of the Narrative behind Energy Directives
Table 2. List of primary policy documents analysed for Energy Efficiency narrative
Type of Document Name Year Code
Report on the proposal for a directive of the European
Parliament and of the Council amending Directive
2012/27/EU on energy efficiency
2017 A8-0391/2017
(written by Rapporteur Adam
Gierek)
Draft Report on the proposal for a directive of the European
Parliament and of the Council amending Directive
2012/27/EU on energy efficiency
2017 2016/0376(COD)
Report on the proposal for a directive of the European
Parliament and of the Council amending Directive
2012/27/EU on energy efficiency
2017 A8-0391/2017 (updated by
Rapporteur: Miroslav Poche)
Proposal for a directive European Parliament and of the
Council amending Directive 2012/27/EU on energy
efficiency
2018 2016/0376(COD)
Proposal Provisional agreement resulting from
interinstitutional negotiations
2018 2016/0376(COD)
2.1.2 Exploratory interviews
The identification and contacting of main actors started in November 2016. Firstly, contacts
provided by partners within the MAGIC consortium were used; secondly, relevant DG Units were
identified and the HoU and DHoU of these units were contacted.
The MAGIC team started by contacting the head of units of the DG ENER through partner JRC,
which in the case of energy comprised Directorate A “Energy policy”, Directorate B “Internal
energy market”, and Directorate C “Renewables, research and innovation, energy efficiency”,
within DG ENERGY. Heads of unit were invited to interviews and/or asked to indicate names of
policy officers working in their Directorate who could participate in interviews. Furthermore, the
snowballing technique was used in that respondents were asked to identify other relevant actors
in their policy area (both institutions and specific individuals).
In total seven interviews were conducted for energy policy. Two weeks of interviews were
organized in January and February 2017 in Brussels. Specifically, JRC and UAB staff carried out 5
interviews with EC officers, 1 interview with a MEP (Member of European Parliament) and 1 with
a former IEA (International Energy Agency) officer involved in energy efficiency and renewable
energies initiatives. The interviews were planned as exploratory, semi-structured interviews,
which meant they were designed in an open way to get the interviewees to tell their stories
about the different policy areas. More details on these interviews have been provided in the
(confidential) report of MAGIC Milestone 8 (MS8).

MAGIC – GA 689669
27
2.1.3 Selection of narratives
The transcripts of the interviews were analysed and combined with the earlier document
analysis in order to develop a first set (long list) of 32 narratives about energy governance. In
general, most of the interviews conducted on energy policy - the Renewable Energy Directive
and the Energy Efficiency Directive - focused very much on recent developments in renewable
energy and storage technology. Details on the content of the interviews conducted are available
in the report for MS6.
2.1.4 Validation of narratives
A dedicated focus group was organised on the 8th of June 2017 in Brussels by the JRC, with the
participation of the energy policy task (Task 5.3) lead, WP5 lead and WP2 lead, to present and
agree the narratives selected for energy policy and their relation to agricultural, environmental,
biodiversity and circular economy policy. For this focus group actors who had been already
contacted for the interviews were invited: actors from DG ENER, DG AGRI, DG ENV and from
STOA (European Parliament's Science and Technology Options Assessment) joined the focus
group. The workshop was useful both to validate the narratives and to identify the main
interests and priorities of the participants. The transcripts from the workshop were analysed to
complete the list of narratives. Details on the outcomes of this focus group have been presented
in the (confidential) report for MAGIC Milestone 8.
Another workshop that was instrumental in validating the selected narratives was:
Inspirational Workshop on New Narratives of Energy and Sustainability - Debunking
myths and interrogating the universality of global and local integrations, organised by
JRC, 20 April 2017 in Brussels. (Mario Giampietro) https://magic-nexus.eu/news/magic-
inspirational-workshop-energy-narratives
The most discussed narratives in the focus group were selected and arrived at a final list of 7
narratives and associated Quantitative Story-Telling analysis. In the beginning of October 2017,
this list was used to draft a policy brief that was distributed to the persons previously contacted
for the interviews. We asked our contacts to prioritise the narratives they found most interesting
and relevant to their work, and to express interest on the type of analysis that the MAGIC team
could do on the selected narratives.
The seven identified narratives varied in their specificity, relevance to the nexus, and tractability
for analysis using MuSIASEM. Therefore, this list was further reduced to a ‘short list’ of four
narratives deemed relevant for informing how to manage the nexus from the energy
perspective, and amenable to analysis in MAGIC.
1. Transition to renewable energies. Europe needs to increase the share of renewable energy
by using more solar and wind energy. This is environmentally necessary to fight climate change
by reducing CO2 emissions and is socially and economically desirable.
2. Intermittency challenge. Intermittency of supply is a key challenge limiting the greater use of
solar and wind energy. More efficient storage systems are a key enabling technological
innovation that will have to contribute to solving the problem of intermittency. The magnitude
of the challenge for storage needs to be understood with reference to factors such as flexibility
(e.g. in demand response) and bottle necks (e.g. in the transport sector).

Report on the Quality Check of the Robustness of the Narrative behind Energy Directives
3. Energy efficiency narrative. Energy efficiency is a means to achieve energy security and
decarbonize the economy. Energy savings from efficiency have the potential of being the first
fuel. However, past improvements in efficiency that have reduced unit costs of energy have
been more than offset using new and more numerous devices.
4. Outsourcing challenge. Outsourcing leads to the externalisation of productive activities and
their associated environmental impacts. In making and assessing energy policy, these
macroeconomic dynamics need to be considered. If industrial production is outsourced to China
and other countries, GHG emissions are not reduced but just geographically relocated.
For more information about the narratives, see MS10: https://magic-
nexus.eu/documents/milestone-10-definition-policy-case-studies
2.2 Quantifying the Narratives
The methodological toolkit used to quantify the selected narratives is based on relational
analysis and specifically the Multi-Scale Integrated Assessment of Social and Ecosystem
Metabolism (MuSIASEM) accounting framework. These methodologies were introduced and
described at length in the MAGIC Deliverables 4.1 and 4.2. When paired with the analysis of
narratives and with stakeholder engagement, the MuSIASEM framework completes the QST
cycle as explained in section 2 of this deliverable. There was no single standard methodology
followed in the analysis of energy policy narratives, with each case study approaching the issue
from a different analytical perspective:
1. For energy narratives on decarbonisation and intermittency, a scenario approach is
taken. Future anticipations of the energy system are developed and contrasted against
dominant policy narratives. For the case of decarbonisation, MuSIASEM has been used
in its anticipation mode to generate scenarios with the aim of quantifying GHG
emissions under decarbonised futures and of flagging a missing variable in the analysis
of energy futures (the biophysical implications of grid flexibility and the conflicts
prioritizing one end-uses over another).
2. For the intermittency narrative, focus is shifted to the framework used to discuss energy
options, stressing the importance of functional elements of the energy system and
urging policymakers to consider the importance of functional changes (changing social
practices) rather than purely structural and technological ones (matching requirement
and supply using technical innovations).
3. For the energy efficiency narrative, the check is based on a combination of: (i) a critical
reflexion on the problematic operationalization of the concept and the lack of
contextualization when the concept is implemented; and (ii) a series of practical
examples (quantitative stories) showing the lack of utility of simple indicators based on
the concept of efficiency when applied to the definition of energy policy targets.
4. For the outsourcing challenge, the accounting framework of MuSIASEM has been used
in its diagnostic mode to identify and characterize relevant factors determining the
feasibility and viability of the energy sector in several EU countries.

MAGIC – GA 689669
29
Thus, the appraisal of policy narratives has been done combining discussions over different
crucial aspects of the knowledge production process. More concretely the focus has been placed
on:
(i) the pre-analytical choices, when discussing the ontological and epistemic
considerations behind concepts and indicators used (paradigm);
(ii) the relational perspective, when discussing the (miss)connection between
narratives, targets and indicators (methods); and
(iii) the explorative results and their implications, when discussing the feasibility and
viability of certain imaginaries and when contrasting scenarios and its relationship
with claimed pretensions (recording and explorative technique).
First and second aspects are discussed when using MuSIASEM in its diagnostic mode (how we
generate knowledge) and the third aspect when MuSIASEM is used to generate fictional
scenarios for contrasting imaginaries of implausible futures (anticipation mode).
2.2.1 Main features of MuSIASEM
The Multi-Scale Integrated Analysis of Societal and Ecosystem Metabolism (MuSIASEM) is a
reflexive method of accounting developed to analyze socio-ecosystems. It is characterized by an
inter-disciplinary approach built on complex system theory, bioeconomics, energetics and
theoretical ecology (Giampietro et al., 2012). It allows to develop relational analyses considering
multiple dimensions, scales and levels through quantitative representations and to frame
sustainability issues in a post-normal science perspective (Funtowicz and Ravetz, 1994). Some
of the key features of MuSIASEM, which are of direct relevance to the work presented, are
briefly described below:
- The analysis distinguishes between different types of energy: primary energy sources
(PES) (e.g. coal, crude oil and uranium) energy carriers (EC) (e.g. electricity, process
heat, fuels); and types of electricity (e.g. baseloader, peaker, intermittent).
- The use of an operational tool called ‘end-uses matrix’, specifying which types of energy
carriers are used by different compartments of society, how, and to do what (Velasco-
Fernández et al., 2018a). The end-use matrix allows bridging consumption and
production: by specifying the different consumption patterns of each country, which can
then be associated to a set of production systems which are, in turn, uniquely linked to
a set of entangled nexus elements, domestically and abroad;
- The distinction between those elements that are considered funds and those that are
considered flows according to Georgescu-Roegen’s flow-fund model (Georgescu-
Roegen, 1971). In our QST, for example, power capacity and labour are considered
funds, while PES (primary energy sources), ECs (energy carriers) and GHG are considered
flows. A further novel contribution of the societal metabolism approach to the
exploration of the option space for energy production in the EU is the inclusion of a
specific analysis of the key role of fund elements, in particular power capacity, storage
capacity and human activity. For example, in narrative 1 (Transition to Renewable
Energies) and 2 (Intermittency challenge), we consider the biophysical and/or the

Report on the Quality Check of the Robustness of the Narrative behind Energy Directives
economic investments needed to produce the part of the infrastructure (power and
storage capacity) – funds - required for a radical transformation of the energy sector.
- The simultaneous use of technical, economic, social, demographic, and ecological nexus
variables1 of the metabolic pattern of modern societies, even if these variables are
defined within different dimensions of analysis and non-equivalent descriptive domains,
referring to different hierarchical levels and scales;
- The inclusion of the different nexus dimensions in the processes of the energy chain by
means of a processor (González-López and Giampietro, 2017);
2.2.2 Data sources
The MAGIC toolkit attempts to be agile at identifying relevant descriptive domains and at
reconciling top-down and bottom-up assessments, thereby providing (or adding) meaning and
coherence to the various sets of data required for informing policy across scales. This implies
that, when dealing with the analysis of processes observable across levels and scales, not
necessarily all the data we are gathering and using in our models are perfectly shaped to our
categories.
In our QST, each analysis addresses a narrative pertaining to a specific descriptive domain
therefore a large set of datasets was used. For checking narratives 1 (transition to renewable
energy) and 2 (intermittency challenge) a mix of bottom-up data from EC reports, scientific
papers, etc (e.g. GHG emissions for building power-plants) and top-down statistical data (e.g.
electrical power capacity in EU countries) have been used. Bottom-up data have been collected
from many different sources and in case of data discrepancies from one source to another, a
variation range (the difference between the lowest and highest values in a dataset) has been
added to the results in order to give a measure of dispersion. When checking narrative 3 (energy
efficiency) the source of data is varied and chord to the specific issues addressed. Last, narrative
4 (outsourcing challenge) mainly used statistical top-down data from Eurostat. More details on
the data used and references can be found in the specific sections.
2.3 Closing the QST Loop
Several events were instrumental in closing the QST loop and receiving feedback on the
quantitative story-telling (QST) results of MAGIC related to Energy Policy, the most significant of
which were:
Squaring the Energy Circle (discussion panel) at the Post-Growth Conference 2018,
European Parliament, 18 September 2018. (Mario Giampietro and Raul Fernandez
Velasco) https://magic-nexus.eu/news/squaring-energy-circle
1 We do not address all these dimensions in the proposed analysis, but a key feature of MuSIASEM is that the flexibility of the framework allows considering further dimensions depending on the goal of the analysis.

MAGIC – GA 689669
31
Focus group “Energy Modelling and The Water-Energy-Food Nexus Conundrum” in the
framework of the Energy Modeling Platform for Europe (EMP-E) 2018, Brussels
(Belgium), 26 September 2018. (Mario Giampietro, Maddalena Ripa, Raul Fernandez
Velasco) https://magic-nexus.eu/events/energy-modelling-and-water-energy-food-
nexus-conundrum
The Post Growth Conference at the European Parliament concerned a two-day public multi-
stakeholder gathering organized by ten Members of the European Parliament (MEP)
representing six political groups with the aim to re-think future policies and discuss alternatives
respecting the environment, human rights and viable economic development. Mario Giampietro
(UAB) participated in the discussion panel on Squaring the Energy Circle, which attracted an
audience of about 50 persons, and presented the main quantitative outcomes of the QST of
energy policy. The other panel members included: Francesco Ferioli (European Commission, DG
Energy, Economic Analysis Unit) and Grégoire Wallenborn (Free University of Brussels, ULB). The
panel was chaired by Florent Marcellesi, MEP (Greens/EFA).
The second event consisted in a focus group organized by MAGIC in the framework of the EMP-
E conference 2018 'Modelling Clean Energy Pathways' (25-26 September 2018, EC-RTD,
Brussels) and in response to an open call for focus group topics/organizers. The focus group
aimed at triggering a discussion in the energy modelling community on the usefulness of
scientific information in the field of energy policy. The specific goals were to examine (i) critical
points in relation to the (lack of) transparency of energy models, (ii) the (lack of) relevance of
the produced ‘quantitative evidence’ for policy-making, and (iii) the risk of making wrong pre-
analytical choices of narratives about sustainability challenges. These aspects were explored in
relation to the energy narratives analyzed in MAGIC’s energy policy task. The MAGIC focus group
attracted 22 of the conference participants (belonging to academia, JRC, DGs), in addition to the
two purposefully invited moderators, one member of the European Parliament and one member
of the European Commission (DG RTD). The focus group consisted in a brief presentation of
MAGIC results of QST related to energy policy (by the MAGIC team addressed in MAGIC Task
5.3) to inform and warm up the debate, followed by a world café with three tables discussing
three different topics and a plenary debate with the participants. Each table were moderated
by a MEP, a DG staff and an energy modeler expert. MAGIC was represented at each table to
guide the event and take notes of the outcomes. Following the world café discussions, an open
discussion followed in which the moderators summarized the main outcomes of the discussions.
More details could be found on the MAGIC website.
Furthermore, a follow-up text analysis and a semi-structured interview with a MEP was
conducted in October 2018 to verify the energy efficiency narrative and follow the process of
the energy efficiency package negotiations which were taking place during 2017/18 with
trialogue interinstitutional negotiations completed in June 2018.
Besides the two events mentioned above and the interview with the MEP, additional iterative
input/feedbacks on the quantitative analysis were received during the following events, in which
the energy team policy participated:
EEA-MAGIC Workshop, 15-16 May 2018, European Environment Agency, Copenhagen:
https://magic-nexus.eu/events/eu-environmental-policy-frameworks-through-
resource-nexus-lens

Report on the Quality Check of the Robustness of the Narrative behind Energy Directives
Energy Sustainability in the Transition to Renewables: Framings from Social Practices
and Complex Systems, 20-21 March 2018, JRC, Ispra: https://magic-
nexus.eu/news/insights-magic-exploratory-jrc-workshop-energy-transition
SHAPE ENERGY sandpits, 8-9 February 2018: https://magic-nexus.eu/news/shape-
energy-sandpit-event
Decarbonisation Project Networking Workshop, 07 Feb 2018, Brussels: https://magic-
nexus.eu/news/decarbonisation-project-networking-workshop
Social impacts of climate change mitigation in Europe, EUCALC Workshop, 1 December
2017, Delft: https://magic-nexus.eu/news/magic-participates-eucalc-workshop
Further details on these events have been provided in the report for Milestone 9 and the main
insights can be found in section 3.5.

MAGIC – GA 689669
33
3 Results
3.1 Transition to renewable energy 2
Shifting from fossil to renewable energy is one of the priorities not only of EU’s energy policies,
but of EU policy at large.
Electricity is seen to play a major role in this shift, as it is expected that the energy sector will
gradually increase its level of electrification – that is, the ratio of electricity versus heat and fuels
will increase in the mix of energy carriers consumed. Moreover, renewable energy has made
inroads in the electric system, while its contribution to the generation of thermal energy carriers
(heat and fuels) remains minimal. Focusing on the electricity system, we check what a
decarbonisation of the EU’s electricity sector would entail from a biophysical perspective. To do
so, our case study analyses the GHG emissions associated to a renewable electricity transition,
making a crucial distinction between different functional types of electricity. Specifically, we
develop a scenario singling out the EU power sector up to 2050 and hypothesize two different
pathways for its decarbonisation. Increasing grid flexibility is central to ensuring that high levels
of variable renewable energy (VRE) can be managed by the grid (Kondziella and Bruckner, 2016).
Grid flexibility can be increased in various ways, including through demand-side management,
storage, virtual power plants and curtailment. Curtailment is defined as the installation of a
surplus of renewable electricity power capacity – when more renewable electricity is being
produced then what is needed, it is not entered into the grid (it is curtailed). In the first pathway,
grid flexibility is increased through high rates of curtailment of renewable generation and low
storage; in the second, lower levels of curtailment are paired with storage technologies. In each
pathway, the emissions associated with the cultivation, construction and fabrication (CFC) of
funds are calculated at yearly intervals up to the year 2050, in addition to the operational
emissions associated with electricity generation (flows). The approach is meta-analytical and
adjusts data available in literature to fit our problem framing.
Decarbonisation in EU policy
In the EU, the energy sector accounted for approximately 30% of total emissions in 2016. It was
the sector with the highest share of emissions, followed by transport and by manufacturing
(accounting for approximately 20% each) (Eurostat, 2018). EU decarbonisation policies fall under
the 2050 low-carbon economy package (2050 low-carbon economy | Climate Action), as part of
the EU’s wider climate strategy. The low-carbon economy roadmap calls for GHG emissions to
be cut by 80% below the 1990 levels by 2050, with two intermediate milestones of 40% by 2030
and 60% by 2040. The strategy is currently being renewed in order to reflect the Paris Agreement
and is expected to be updated by early 2019 (European Commission, 2018a).
The EU Energy Roadmap 2050, published in 2011, highlights four strategic directions for
decarbonisation: energy efficiency, renewable energy sources (RES), nuclear and carbon capture
and storage (CCS). The four directions are explored through six scenarios: current policies, high
2 Parts of this section are adapted from the following work: Di Felice, L., Ripa, M., Giampietro, M. (2018). Deep Decarbonisation from a Biophysical Perspective: GHG Emissions of a Renewable Electricity Transformation in the EU. Sustainability, 10(10), 3685. https://doi.org/10.3390/su10103685

Report on the Quality Check of the Robustness of the Narrative behind Energy Directives
efficiency, high RES, delayed CCS, low nuclear and diversified supply technologies. Since the
publication of the Energy Roadmap 2050, significant events such as the Paris Agreement and the
release of the Clean Energy for all Europeans package have impacted EU energy discourses. In
light of this, new scenarios have been developed to inform the EU’s mid-century strategy, to be
released by fall this year (2018). The scenarios included in the Clean Energy for all Europeans
package model pathways to decarbonisation based on efficiency, integration of renewable
energy sources and the functioning of the internal energy market (European Commission,
2016a). The main trends, which are an increased share of RES, a linear decrease of GHG and an
increased electrification, have persisted across the two generations of scenarios.
In the six decarbonisation scenarios of the Energy Roadmap 2050, RES rises significantly, to a
minimum of 55% of gross consumption of energy carriers in 2050 and 60–80% of gross electricity
production by the same year. Absolute electricity production increases steadily between 20 and
40% by 2050 across the six scenarios, despite an overall reduction in total energy consumption.
This reflects trends in mitigation scenarios, where a gradual electrification of the energy system
is seen as a key element for its decarbonisation (Bruckner et al., 2014). Emissions across all
sectors decrease steadily and monotonically—that is, there is no increase in emissions
associated with infrastructural change and there are no relative peaks of GHG emissions
throughout the years. Figure 5 shows an example of projected sectoral emission reduction in
the high RES pathway.
Figure 5. CO2 emission projections, in megatons (Mt) of CO2, under the EU high RES decarbonisation pathway. Source: Own elaboration from the EU Energy Roadmap 2050 (European Commission, 2012).
The power sector, in particular, is seen to reach zero or almost zero emissions by 2050 for all
pathways, as further indicated by the low-carbon strategy: “The power sector has the biggest
potential for cutting emissions. It can almost totally eliminate CO2 emissions by 2050” (European
Commission, 2012). Similarly, the Intergovernmental Panel on Climate Change (IPCC) highlights
the decarbonisation of the power sector as one of the three main components of mitigation

MAGIC – GA 689669
35
scenario studies, together with a gradual electrification of the energy sector and a reduction in
energy demand through technology and other substitutions (Bruckner et al., 2014).
The scenarios developed to support the Energy Roadmap 2050 build on the PRIMES (Price-
Induced Market Equilibrium System) energy model, “a partial equilibrium modelling system that
simulates an energy market equilibrium in the European Union and each of its Member States”
(European Commission, 2018b).
For the accounting of GHG emissions, the model simulates the operational emissions associated
with electricity production (flows) but neglects the emissions associated with the construction
of infrastructures (funds). This omission is linked to the fact that grid flexibility requirements are
not modelled. A small but growing body of literature in academia points towards the emissions
associated with renewable infrastructure and with storage, and to how they may impact future
decarbonisation pathways. Additionally, the need to increase grid flexibility at high renewable
energy penetrations has been stressed and modelled for specific case studies, including Europe
(Steinke et al., 2013), Japan (Esteban et al., 2012), Texas (Denholm and Hand, 2011) and
California (Denholm and Margolis, 2016).
However, EU energy policy discourses uphold the narrative that the main barrier to a high
integration of RES into the energy system is financial rather than biophysical. The renewable
energy package (European Commission, 2017c), for example, highlights a number of barriers
envisioned on the path to a fully renewable energy system, including administrative hurdles,
cost-effectiveness, loss of citizen buy-in and uncertainty for investors. Grid stability is also
mentioned as an issue, with the electricity system needing to “adapt to an increasingly
decentralized and variable production”(European Commission, 2017c). Despite this mention,
the issue is not framed as being central and no concrete targets for adaptation have been set,
nor have the (biophysical) implications of increasing grid flexibility been included in the EU
decarbonisation pathways.
Alternative Decarbonisation Pathways
As the high doses of uncertainty attached to the prediction of future states of the complex social-
ecological system become apparent, scenarios used to support decision-making are framed
more and more as tools for deliberation, rather than prediction. The EU webpage on energy
modelling, for example, states that the EU Reference Scenario, “one of the European
Commission’s key analysis tools in the areas of energy, transport and climate action”, (…), “is
not designed as a forecast of what is likely to happen in the future but it provides a benchmark
against which new policy proposals can be assessed”(European Commission, 2018b). In a similar
spirit, the aim of the alternative decarbonisation pathways is not to predict the behaviour of
future decarbonisation pathways in the EU. Rather, the aim is to flag the need to include
emissions associated with the construction of infrastructure in decarbonisation discourses.
We explored two decarbonisation pathways of the EU’s power sector for the years 2020–2050,
each dealing differently with grid flexibility requirements. Focus was given to the integration of
renewable energy into the grid as a means to decrease GHG emissions, in line with the high RES
scenario of the EU’s Energy Roadmap 2050, on which the two pathways were based. The values
of gross electricity consumption up to 2050, in fact, were taken from the high RES scenario, as
well as the share of nuclear electricity at each year. Hydropower was assumed to remain
unchanged over the years, while solar power and wind power were assumed to increase until

Report on the Quality Check of the Robustness of the Narrative behind Energy Directives
producing 90% of electricity, entirely phasing out fossil power plants. In this coarse-grained
analysis, power plants that currently do not significantly produce electricity were not taken into
account, such as tidal power. Adjusting data from existing studies, we calculated the emissions
associated with the construction and operation of funds (renewable and storage infrastructure)
with respect to the reduction in emissions due to the substitution of fossil with alternative
energy systems (associated with the electricity generated by the systems—flows). In this first
approximation we do not consider the turnover of materials – that is, we assume that new funds
being constructed are not replaced in the chosen timeframe. The aim of the analysis is not to
compare a renewable electricity transition to a no-transition scenario, where fossil fuel
infrastructure needs to be updated over the years, but to focus on absolute GHG emissions of a
transformation of the electricity sector in light of climate change mitigation policies – focusing
on the justification narrative that we can use renewable energy to power green growth. For an
overview of the modelling assumptions and equations for this case study, see Di Felice et al.,
(2018).
GHG emissions and policy implications
GHG Emission Curves and Cumulative Emissions
To discuss the results of the two decarbonisation scenarios, emissions can be viewed from three
perspectives:
1. Emission curves at a yearly resolution, useful to comment on the temporal behaviour of
emissions and their possible non-linear evolution;
2. Cumulative emissions up to the year 2050, i.e., the sum of the yearly emissions, which
can be related to carbon budgets;
3. Yearly emissions at the target year 2050, currently the only view used to inform EU
decision-making processes (with different targets set for different years).
Starting with the emission curves provided throughout the years, Figure 6 and Figure 7 show
the behaviour of the GHG emissions of the EU power sector (including cultivation, fabrication
and construction of infrastructure) under the low storage high curtailment (LSHC) scenario. The
total emissions of the electricity sector, including those required for cultivation, construction
and manufacturing, are shown in Figure 6, while Figure 7 breaks the emissions down into those
linked to the operation of power plants (associated with electricity flows) and those linked to
the cultivation, fabrication and construction of renewable infrastructure (associated with funds).

MAGIC – GA 689669
37
Figure 6. Total GHG emissions in the low storage high curtailment (LSHC) scenario.
Figure 7. GHG emissions in the LSHC scenario, broken down into operational (flows, green line) and infrastructural (funds, blue line).
In the LSHC scenario, while the amount of wind and solar infrastructure installed each year
increased exponentially, the GHG emissions associated with the cultivation, fabrication and
construction phases of the infrastructure were mitigated by the steady reduction in operational
emissions, which dropped to almost 0 by 2050. The initial steady decrease in emissions became
less linear from the year 2030, i.e., when curtailment of renewable electricity started. As
curtailment increased, emissions due to an infrastructure rise led to relative peaks in emissions
between the years 2030 and 2050, with overall emissions associated with infrastructure
increasing despite the increased renewable penetration into the system. This is due to the
manufacturing of large amounts of renewable infrastructure, with lowering utilization factors.
The behaviour of the curve depended on the rate that renewable infrastructure was installed.
With high levels of emissions associated with the installation of both pumped hydroelectric
storage (PHS) and battery energy storage (BES) technologies, the yearly emission curve for the
0
200
400
600
800
1000
1200
2020 2025 2030 2035 2040 2045 2050
Mt
of
CO
2eq
.
LSHC scenario
0
200
400
600
800
1000
1200
2020 2025 2030 2035 2040 2045 2050
Mt
of
CO
2eq
.
LSHC scenario

Report on the Quality Check of the Robustness of the Narrative behind Energy Directives
low curtailment high storage (LCHS) scenario displays a behaviour which is less linear, as seen
Figure 8 and Figure 9.
Figure 8. Total GHG emissions in the high storage low curtailment (HSLC) scenario.
Figure 9. GHG emissions in the HSLC scenario, broken down into operational (flows, green line) and infrastructural (funds, blue line).
Emissions were strongly dependent on the type of storage infrastructure and on when it was
integrated into the system. Emissions gradually decreased up to the year 2027, when the
amount of installed PHS started to increase considerably. The biggest peak, however, was visible
at the year 2035, when BES technologies were introduced, as PHS reached its maximum
capacity. The peak can be softened if BES is gradually installed from the start, however, in this
case, cumulative emissions would be higher as the manufacturing process would rely more
heavily on fossil fuels. Thus, different timing options should be carefully considered from a
biophysical perspective.
The behaviour of the curves of Figure 6 and Figure 8, and the presence or absence of relative
GHG emission peaks, can be varied by varying assumptions on timings and introduction of
0
200
400
600
800
1000
1200
2020 2025 2030 2035 2040 2045 2050
Mt
of
CO
2eq
.
HSLC scenario
0
200
400
600
800
1000
1200
2020 2025 2030 2035 2040 2045 2050
Mt
of
CO
2eq
.
HSLC scenario

MAGIC – GA 689669
39
technologies. This would also vary cumulative emissions, as the emissions associated with the
construction of infrastructure also depend on the yearly electricity mix. Cumulative emissions
are a useful indicator as they can give us an idea of how much is being emitted by the EU’s power
sector during its transitional phase towards deep decarbonisation. It is expected that, on
average, the EU has a carbon budget on the order of 90 Gt in order to remain within a 2°
temperature range for the period between 2020 and 2100 (Meyer-Ohlendorf et al., 2018). The
situation is even worse when considering the 1.5° target of the Paris Agreement. Cumulative
emissions associated with the power sector and to the manufacturing of infrastructure were of
the order of 21 Gt of CO2 eq. and 25 Gt of CO2 eq. respectively, for the HCLS and LCHS scenarios.
Thus, under deep decarbonisation pathways, between the years 2020 and 2050 alone the power
sector and its associated manufacturing would emit 23–28% of the total budget available to the
whole society up to the year 2100. This suggests that efforts on the production side of the energy
system are not enough to stay within safe carbon budgets.
Policy implications
To inform decision-making, the type of GHG accounting proposed here is incomplete, as it needs
to be associated with economic analyses and with the assessment of other biophysical variables
such as land and water. While the high curtailment scenario results in overall lower emissions
than the high storage one, it would lead to other trade-offs in different domains, including higher
electricity prices and large areas of land occupied by renewable infrastructure. On the other
hand, the high storage scenario would also be associated with high levels of lithium
requirements (to be imported), which may not be desirable from a security perspective.
Additionally, increasing PHS may have important consequences for natural water cycles.
Synergies and trade-offs also emerge within and outside EU borders. A part of the emissions
derived in the scenarios would necessarily be located outside of EU borders, such as those for
the extraction of primary materials. This points towards the need of discussing the impact of EU
climate targets at different geographical scales.
When it comes to the integration of renewable energy, differences across countries are also
important and should be modelled in relation to grid flexibility and associated GHG emissions.
The Netherlands, for example, is mostly flat and does not have any PHS potential, therefore in
an increased flexibility scenario, it would either require high rates of curtailment (which may
interfere with current land use patterns) or high interconnections to neighbouring countries.
Utilisation factors of technologies also vary across countries, depending on weather conditions.
In addition to differences across spatial scales, the temporal scale is also important when
considering decarbonisation scenarios: different types of storage services, in fact, are useful for
fluctuations occurring at different scales (Aneke and Wang, 2016). Current statistics do not allow
for this type of analysis. Therefore, it would be advisable for supra-national statistical bodies
such as Eurostat to include data across shorter timescales.
The results presented are very conservative, as two elements which have not been included in
the model may increase GHG emissions substantially: (i) the change in end-use infrastructure
required by an increased electrification of the energy sector (such as the manufacturing of
electric vehicles); and (ii) the turnover of funds. There is uncertainty associated with the possible
lifetime of grid-scale batteries, however, it is likely that within the 30-year timeframe considered
in the study some turnover will be necessary, by either producing new batteries or recycling

Report on the Quality Check of the Robustness of the Narrative behind Energy Directives
existing ones. Of course, substituting regular cars in their lifetime turnover would also be
associated to GHG emissions (although the GHG emissions associated with the construction of
regular vehicles are considerably lower than the ones associated with the construction of
electric vehicles). However, as stressed previously, the narrative tackled here is that green
growth can be sustained through renewable electricity by decreasing emissions, and not to
check whether renewable electricity emits less than fossil fuels.

MAGIC – GA 689669
41
3.2 Intermittency challenge3
The European Commission upholds a historic flagship initiative to transform the European Union
into a resource efficient and low-carbon economy. It contends that economic growth and energy
use must be decoupled tandem with an improvement of economic competitiveness and energy
security. Entirely unprecedented determination and commitment would be needed to realize
such an energy transition. Entire sectors of the economy would necessarily reinvent themselves.
The Commission’s ambitious economic plan for the European Union hinges itself in exclusivity
on structural and technological changes, however, and accordingly reinvention circumscribes
sectoral change altogether narrowly (European Commission, 2010a, 2010b; European Union,
2012).
The descriptive and prescriptive discourse surrounding the EU renewables energy transition is
characterized by a critical lack of discussion surrounding joint functional and structural analysis.
The EU’s energy policy package, indeed, focuses on technological changes (how energy is
produced) rather than functional changes (what the energy is being used for). Looking at energy
from a functional perspective, intermittent renewable energy either (i) needs to be paired with
storage to be able to provide the same services as current fossil fuelled power plants; or (ii) a
drastic set of changes in social practices would be needed among those social practices creating
the functional demands for energy. Effective policy will necessarily holistically assume a
perspective at once functional and structural, rather than simply reductionist technological
changes.
From a rudimentary engineering perspective, different types of power plants may be
categorized as baseload, middle-load (aka load following plants) or peak-load depending on
which section of the demand curve their electricity covers. In general, baseload electricity is the
section of the demand curve relatively invariant over time, usually provided by nuclear and coal
plants. In contrast, peak electricity is provided by plants that can be ramped up rapidly, such as
natural gas turbines, generally at the cost of energy conversion efficiency (fossil fuel to
electrical). This distinction between types of power plant, however, rarely makes it past
engineering readings of energy systems. In EU energy modelling, all electricity is considered to
be the same and interchangeable, and statistics refer simply to structural aspects.
This distinction between different types of electricity, however, is very important in discussions
of renewable energy futures. Primary renewable energy sources are outside of human control
(we do not decide when the derived electricity is produced), so it cannot be managed to cover
specific sections of the demand curve in the same way that fossil fuel-based plants do. This
means that comparing renewable electricity generation to fossil electricity generation using
yearly statistics is misleading – it is like comparing apples and oranges. In order to discuss
renewable electricity as a functional substitute to other types of electricity generation, it needs
to be paired with grid flexibility measures, such as storage and curtailment.
Grid-level storage allows for the output of renewable electricity plants to be under human
control by storing excess electricity when it is not needed and releasing it when it is needed. In
3 Parts of this section are adapted from the following work: Renner, A., M. Giampietro. The regulation of alternatives in the electric grid: Nice try guys, but let’s move on. Sustainable Energy and Environment Sensing (SEES) Conference. Cambridge, United Kingdom. 18-19 June 2018. ISBN: 978-1-912532-01-8.

Report on the Quality Check of the Robustness of the Narrative behind Energy Directives
this way, renewable energy can be used to cover specific sections of the electricity demand
curve in a predictable manner.
Adding storage to the discussion of renewable energy futures, it is important to ask how much
storage would be needed in an electricity sector dominated by intermittent sources.
The energy transition of Germany and Spain
In this case-study, Spain and Germany were selected as exploratory cases illustrative of countries
undergoing renewable energy transitions. In the global context, and in both absolute and
relative terms, both countries are leaders in electricity generation from intermittent renewable
energy sources (wind and solar). The case-study focused on both Spain and Germany from a
national-level security perspective, while it should be noted that many renewable energy studies
choose instead to focus on national interdependencies (e.g. European-scale grids).
Figure 10. Growth in power capacities over time during the Peninsular Spain renewable energy transition Source of data: (Red Eléctrica de España, 2017).
Figure 11. Growth in power capacities over time during the German renewable energy transition. Source of data: (BMWi - Federal Ministry for Economic Affairs and Energy - Working Group on Renewable Energy
Statistics, 2017)

MAGIC – GA 689669
43
As shown in the following figures, both Spain and Germany observed a 22% increase in system
power capacity, 18.3 GW and 42.6 GW respectively, as a result of a respective 14.2% and 9.3%
increase in intermittently sourced electricity generation. While prodigious amounts of wind and
solar power capacity were added in both countries, conventional fossil-fuel power capacity
either increased in tandem (Germany) or remained at a constant level (Spain) regardless of a
decrease in demand.
In the exploration of future scenarios, it is of utmost importance to explore the option space in
a manner informing stakeholders considering differing relevant dimensions. Table 3 attempts to
provide an example set of statistical information reflecting the challenges which would need to
be overcome by decision makers. The scenarios described imagine a future energy power system
where 100% of the electricity is provided by intermittent primary energy sources (wind and
solar).
The power gap reflects both an absolute level (in GW) and a relative level (percentage of the
total electricity demanded unfulfilled). The energy gap described refers to a singular, continuous
period where less than the guaranteed level of total electricity was fulfilled by intermittent
energy sources.
In interpretation of Table 3, if Germany wanted to guarantee 90% of their (annual) average 100%
intermittent electricity generation at a 75% confidence level, they could expect to prepare
contingency capacity (e.g. storage capacity, generating capacity, import capacity) capable of
providing 10 TWh with a 68 GW peak output. To summarize the storage requirements, the
results of our analysis show that the energy gap could be on the order of 4-14 TWh in Germany
and 1-6 TWh in Spain. That level of storage is, by any measure, massive – one whole order of
magnitude larger than the pre-existing pumped hydroelectric storage capacity of Germany and
Spain and many orders of magnitude larger than other pre-existing forms of energy storage.
While pumped hydroelectric storage is the most used form of large-scale form of storage,
suitable sites for its creation remain a device of nature and its development is strongly limited
by geographic configurations, with some EU countries such as the Netherlands lacking suitable
sites (Gimeno-Gutiérrez and Lacal-Arántegui, 2013). As a result, the popularity of other storage
options, such as lithium-ion batteries – especially distributed among consumer electric vehicles,
is gaining ground.

Report on the Quality Check of the Robustness of the Narrative behind Energy Directives
Table 3. Power and energy gaps
Confidence Level
Guarantee 50% 75% 99%
Power Gap
Spain
95% 31 GW (69%) 34 GW (75%) 41 GW (92%)
90% 31 GW (64%) 33 GW (71%) 40 GW (87%)
75% 30 GW (53%) 33 GW (59%) 39 GW (74%)
50% 29 GW (34%) 32 GW (40%) 39 GW (57%)
Germany
95% 62 GW (73%) 69 GW (81%) 84 GW (100%)
90% 62 GW (69%) 68 GW (76%) 83 GW (95%)
75% 60 GW (55%) 66 GW (63%) 81 GW (81%)
50% 56 GW (34%) 61 GW (42%) 76 GW (59%)
Energy Gap
Spain
95% 4 TWh 4 TWh 6 TWh
90% 3 TWh 4 TWh 5 TWh
75% 2 TWh 3 TWh 4 TWh
50% 1 TWh 2 TWh 3 TWh
Germany
95% 9 TWh 11 TWh 14 TWh
90% 9 TWh 10 TWh 14 TWh
75% 7 TWh 8 TWh 11 TWh
50% 4 TWh 4 TWh 5 TWh
The monetary and GHG investments required to produce storage systems
Currently, one of the more fashionable and invested technologies is Lithium-ion batteries. In
particular, a synergy has been identified whereby the cost of electricity storage in Lithium-ion
batteries could be decentralized while maintaining a high degree of spatial smoothing if a
sufficient quantity of civilian electric vehicles double function as storage devices for the electrical
grid. Following the ‘gaps’ showed above (Table 3), estimations of the monetary costs and
greenhouse gas externalities of such a plan are provided in the following table. Table 4 shows
monetary costs and GHG emissions when electricity discrepancies (unfulfilled guarantees) are
fulfilled by lithium-ion batteries.
The greenhouse gas emissions embodied in just the manufacturing of the lithium-ion batteries
used as peakers result to be on the order of the entirety of greenhouse gas emissions for their
respective countries. While the analytical case at hand is admittedly extreme in nature (100%
intermittents penetration), the costs of storage are massive even at a scale one order of
magnitude smaller.
Following the results and using the United Nations’ population estimates (United Nations, 2017),
while planning for the expected annual worst event in the most extreme scenario (99%
confidence interval, 95% guaranteed) the anticipated levelized costs of using lithium battery
storage backup supply are on the order of 35-72 USD per capita for Spain and 49-100 USD per
capita for Germany.

MAGIC – GA 689669
45
Table 4. Monetary and GHG requirements for lithium batteries
Guarantee 50% 75% 99%
Energy Gap
($USD)
Spain
95% $1.1bn-$2.2bn $1.2bn-$2.5bn $1.6bn-$3.3bn
90% $1bn-$1.9bn $1.1bn-$2.3bn $1.5bn-$3.1bn
75% $0.7bn-$1.4bn $0.9bn-$1.8bn $1.3bn-$2.6bn
50% $0.4bn-$0.8bn $0.5bn-$1bn $0.8bn-$1.6bn
Germany
95% $2.7bn-$5.5bn $3.1bn-$6.3bn $4bn-$8.2bn
90% $2.5bn-$5.1bn $2.9bn-$5.9bn $3.9bn-$7.9bn
75% $1.9bn-$3.9bn $2.3bn-$4.7bn $3.2bn-$6.5bn
50% $1.1bn-$2.3bn $1.2bn-$2.4bn $1.4bn-$2.8bn
Energy Gap
(CO2-eq)
Spain
95% 0.1 Gt-0.6 Gt 0.1 Gt-0.7 Gt 0.2 Gt-1 Gt
90% 0.1 Gt-0.6 Gt 0.1 Gt-0.7 Gt 0.2 Gt-0.9 Gt
75% 0.1 Gt-0.4 Gt 0.1 Gt-0.5 Gt 0.1 Gt-0.8 Gt
50% 0 Gt-0.2 Gt 0.1 Gt-0.3 Gt 0.1 Gt-0.5 Gt
Germany
95% 0.3 Gt-1.6 Gt 0.4 Gt-1.9 Gt 0.5 Gt-2.4 Gt
90% 0.3 Gt-1.5 Gt 0.3 Gt-1.7 Gt 0.4 Gt-2.4 Gt
75% 0.2 Gt-1.2 Gt 0.3 Gt-1.4 Gt 0.4 Gt-1.9 Gt
50% 0.1 Gt-0.7 Gt 0.1 Gt-0.7 Gt 0.2 Gt-0.8 Gt
Monetary figures refer to the unsubsidized levelized cost of storage from (Lazard, 2017), which includes capital,
operation and maintenance, charging, taxes and extended warranty costs. Greenhouse gas figures refer only to the
manufacturing of the battery, using range estimates from a review of the literature (Hao et al., 2017).
Annual greenhouse gas emissions from lithium battery manufacturing are on the order of 4-21
tons CO2-eq per capita for Spain and 6-30 tons CO2-eq per capita for Germany. Putting these
emissions into context, the figures are 0.5-3x the 2015 per capita greenhouse gas emissions
(Kyoto basket) in Spain and Germany (Eurostat, 2016). Furthermore, it is expected that the
actual power capacity and therefore the costs of Lithium ion peakers would be significantly
higher than described here as a number of important scenario factors where not considered in
the illustrative example. For example, significantly more storage power capacity would be
needed in order to avoid a damaging state of deep discharge, to compensate for transmission
losses and to account for conversion losses. The storage estimates also do not consider the
energy storage needs of the transmission system itself (e.g. as frequency regulation). For these
reasons it would not be unreasonable to expect additional power capacity, energy storage,
monetary costs and emission externalities of the order of, say, 50%4. Finally, it’s worth reminding
that this case study focused on the storage needs of national-level electricity security, and did
not take into account hypothetical potentials available from changes in social practices or
multinational geographic smoothing. In this sense, the impracticality flagged by the results
indeed indicates that an increased policy focus on changes in social practices would be
appropriate.
4 Rough estimate taking the non-nominal electric grid needs into consideration.

Report on the Quality Check of the Robustness of the Narrative behind Energy Directives
3.3 Energy Efficiency narrative
Energy Efficiency is considered to be a key pillar of EU policy (European Parliament, 2012). The
directive has been updated with a new agreement in June 2018, setting a new EU energy
efficiency target for 2030 of 32.5% (European Commission, 2016b). According to the narrative
endorsed in the policy, energy efficiency is a means to achieve three basic goals: (i) achieve
energy security; (ii) decarbonize the economy; and (iii) improve the competitiveness of industry
in the Union.
In this narrative, energy savings from efficiency have the potential of being the first fuel,
reducing dependency on energy imports and scarce energy resources, as well as reducing
greenhouse gas emissions and thereby mitigating climate change. However, when it comes to
selecting efficiency targets, it becomes clear that the popularity of the concept of “efficiency” is
partly due to its simple nature: a generic call for “doing more with less”. Any quantitative
implementation of this semantic message is problematic in a real-world situation, particularly
when efficiency is the mechanism by which other objectives are delivered rather than the end
of itself. Let’s imagine that we want to achieve the three goals associated with the energy
efficiency policy:
1. energy security – according to Walter Lippmann (1943) security is about being “not in
danger of having to sacrifice core values”, a definition that resonates with Wolfers'
characterization of security as “the absence of threats to acquired values” (Wolfers,
2016). Therefore, when applying these definitions to the issue of energy security we
should conclude that energy efficiency should be able to reduce the consumption of
primary energy sources and other strategic resources (especially when a country is
heavily dependent on imports) while preserving the expected level of standard of living.
In relation to this goal a country should rely as much as possible on primary sources
abundant inside its boundaries, which would depend on their particular environment.
It could be coal in Poland or oil and hydro in Norway.
2. decarbonize the economy – in relation to this goal energy efficiency should be able to
replace the consumption of both primary energy sources and secondary energy flows
(energy carriers) based on the depletion of oil with the use of alternative primary energy
sources and energy carriers. In relation to this goal a country should rely as much as
possible on alternative sources even though this choice may imply higher cost of
production, reducing the overall consumption of energy carriers because of biophysical
limits – e.g. shortage of land to produce biofuels. This could imply halting all the social
practices that are currently only possible by using fossil fuels (e.g. massive use of
transoceanic air transport);
3. improve the competitiveness of industry in the Union – in relation to this goal energy
efficiency should be able to increase the productivity of the industry per unit of energy
carrier consumed. In relation to this goal, we can use the example of the massive
increase in the use of electricity in the EU industry in the 70s and 80s that boosted
productivity. However, this increase in the “efficiency” of the use of energy carriers was
associated with an increase in the consumption of primary energy sources (a decrease
in the efficiency in relation to the use of primary energy sources), and an increase of
primary energy sources used per unit of human activity, closely related to the increase

MAGIC – GA 689669
47
of economic labour productivity through using more capital machinery when producing
the same product or service.
A cursory reading of the expectations and the required changes associated with these three
goals makes it evident that analytical tools and indicators required to assess potential
improvements in relation to each one of these three goals considered in isolation do not have
anything in common. On the other hand, the narrative used by the EU to formulate the directive
seems to assume that within an integrated representation of the performance of a modern
economy these three indicators can be moved together in the expected direction mainly
through the concept of efficiency. That is, this narrative seems to assume that energy efficiency
per se is the means to increase energy security (producing locally what could be imported at a
cheaper price) by decarbonizing the economy (producing what is currently being produced by
fossil energy with alternative energy sources) while improving the competitiveness of the
industry (by boosting the productivity of production factors while using less energy inputs). In
order to check the robustness of this triple assumption we can check whether improvements in
energy efficiency will deliver this combination of changes. This requires considering the
functioning of the energy sector inside the economy and the role it plays in determining the
energy uses in the rest of the society. Another heroic assumption associated with the directive
is that the assessment of improvements in relation to these three goals can be obtained using a
set of simple output/input ratios used as targets.
A sign of the ineffectiveness of the policies based on “efficiency indicators” is that strategies
aimed at “improving the situation” are based on trade-offs among these three goals: the
competitiveness of the EU industry is obtained by eliminating the low performing industrial
processes that are externalized to other countries and by an increasing dependence on imports
in the energy sector and in the industrial sector. The goal of security is the big loser in the existing
situation.
3.3.1 Practical examples of systemic problems to be expected when using a simple
definition of efficiency
During the interactions we had with social actors, we prepared a series of practical examples of
systemic conceptual problems associated with the use of simple definition of efficiency. In this
way complex theoretical concepts can be conveyed to non-energy-experts. In each presentation
we started by using Sadi Carnot as a testimonial – the “guru” of energy efficiency. In fact, with
his seminal work, he brought forward a rigorous definition of efficiency in thermodynamic
terms. Carnot, in the closing paragraph of his book Reflections on the motive power of fire, and
on machines fitted to develop that power published in 1824 states explicitly that we should
assess the performance of energy systems (multi-criteria analysis), rather than their efficiency:
“We should not expect ever to utilize in practice all the motive power of combustibles. The
attempts made to attain this result would be far more harmful than useful if they caused other
important considerations to be neglected. The economy of the combustible [efficiency] is only
one of the conditions to be fulfilled in heat-engines. In many cases it is only secondary. It should
often give precedence to safety, to strength, to the durability of the engine, to the small space
which it must occupy, to small cost of installation, etc.” [Carnot (1897) p. 126 emphasis added].
Below are given five practical examples of the risk of an excessive simplification in the definition
of efficiency.

Report on the Quality Check of the Robustness of the Narrative behind Energy Directives
(i) Signals of the problems with policy design just based in prices and markets designs
When talking of de-carbonization of the economy the very expensive experiment done in
Germany with the Energiewende can be used as a warning signal (Bundesrechnungshof, 2016).
According to the report of the Supreme Court of Auditing of Germany, in the Energiewende
“inefficient funding programmes have been launched, extended and increased. The Ministry has
so far not taken any steps to ensure that inefficient programmes which at the same time
contribute little to energy transition are phased out and the funds thus released may be re-
employed to provide better value for money” (Bundesrechnungshof, 2016). Indeed, the
significant economic investments in alternative energy sources in Germany led to high electricity
prices without reducing emissions levels (Scholz et al. 2014). We can conclude that the scientific
advice received in terms of policy targets and indicators for monitoring the results were not
effective.
We can use this example to identify the risk of excessive simplification associated with the
adoption of economic narratives to the analysis of energy systems. The generalized problems
currently experienced with the integration of intermittent electricity sources in the grid are
easily explained by the excessive simplifications adopted in the economic analyses used to
inform policy. Electricity is a form of secondary energy (it requires primary energy to be
produced) and of “mechanical” energy. This label implies that it cannot be stored as such. In
order to be stored it has to be transformed into other forms of energy (e.g. gravitational energy
in the case of pumped-storage hydroelectricity or chemical energy in the case of batteries). The
very existence of flows of electricity requires the simultaneous connection inside an electric grid
of a power capacity producing a quantity of kWh to another piece of power capacity consuming
that quantity. This requirement of a simultaneous connection of production and consumption
has to be achieved at a local timescale and this implies that generic quantities of kWh cannot be
measured per year. Put it in another way, “kWh of electricity” generated cannot be accounted
as generic quantities of “electricity”. They have to be accounted separately in relation to the
characteristics generated by the modality of production. In fact, the actual process for producing
electricity - baseloaders, peakers and intermittent sources -produce electricity with different
level of “usefulness” for the grid: (i) kWh of Peakers are predictable and can be regulated (could
be switched on and off without great losses); (ii) kWh of baseloaders are predictable but cannot
be regulated; (iii) intermittents are not predictable and cannot be regulated. Accepting that the
same quantity of output – i.e. 1 kWh – can have different qualities entails and a competent
accounting should maintain a separation among different types of electricity.
In fact, assuming that you can produce coins of gold, bronze and wood having different selling
values it would be nonsensical to calculate and compare the cost of production of these “coins”
in general terms. The fact that the coin of wood (1 kWh of intermittent sources) has a lower
production cost of the coin of gold (1 kWh of peaker sources) should not be used as a sign of
better efficiency of the process of “generating coins”. However this is not always the case even
when considering elaborate analytical approaches: “the power sector has been identified as
exceptionally suitable for this field of research, as the electricity output is perfectly
interchangeable and homogeneous (not like in many other industries)” Mezösi et al. (2018).
A comparison of the utilization factors of installed power capacity for the mentioned categories
of power plant is illustrated in ¡Error! No se encuentra el origen de la referencia.. In this table

MAGIC – GA 689669
49
we can see how the GWh of electricity produced by MW of power capacity installed is much
higher in baseloaders and peakers than in intermittents (intermittents may be produced when
not needed, or not be produced when needed). These qualitative differences imply that when
discussing the convenience of intermittent renewables and their efficiency producing energy
carriers, one may take into account that:
1. The production cost of 1 kWh with intermittents for users seeking supply security
(24/7/365) is not equivalent to the cost of 1 kWh produced by peakers or baseloaders.
2. The increases in power capacity of intermittents could be problematic if there is no
important demand side flexibility. This would require political discussions in relation to
the priority of end-uses balancing many trade-offs at different levels: from vital minimal
vs superfluous consumptions at the household’s level; to services as hospitals, education
or offices vs industries as car production at the sectoral level, and to international
agreements level due to this flexibility in the consumption side would affect
competitiveness in global markets.
3. Without this flexibility or effective system of storage, the technological promise of
replacing fossil energies with renewables became problematic.
Table 5. Comparing the usefulness of the electric supply of different types of power plants
Many narratives try to solve these complex issues by the levelized cost of electricity (IRENA,
2018), a problematic pricicing method based on the marginal value of energy and capacity that
hide all these previous political issues under the market carpet. Some institutions as the U.S.
Energy Information Administration flagged this problem “Because load must be balanced on a
continuous basis, generating units with the capability to vary output to follow demand
(dispatchable technologies) generally have more value to a system than less flexible units (non-
dispatchable technologies), or than units using intermittent resource to operate.” Therefore,
they listed LCOE separately in tables by dispatchable and non-dispatchable technologies
“because comparing them must be done carefully”, the direct comparison of LCOE is “often
problematic and can be misleading as a method to assess the economic competitiveness of
various generation alternatives because projected utilization rates, the existing resource mix,
and capacity values can all vary dramatically across regions where new generation capacity may
be needed”. Therefore, continuous increase of intermittent power capacity or reduction of

Report on the Quality Check of the Robustness of the Narrative behind Energy Directives
generation costs per kWh are not straightforward indicators from a viability perspective and
clearly generate a trade-off between environmental and economic issues.
In the case of intermittent sources, the additional requirement of a storage system will change
the definition of the energy supply system. Hence, the assessment of the performance (rather
than efficiency) of electricity production with intermittent sources should not only consider the
material characteristics of the intermittent power plant but also those of the storage system and
the overall ratio between supply of useful electricity and the sum of the fixed and circulating
investments. An alternative solution to this problem is to develop flexibility on the demand side
through aggregators (European Parliament, 2018). However, this solution is market oriented
and entails the risk of falling in the same problem of considering all end-uses like the same (or
worst, prioritize just by purchase capacity and information access). Again, models and policy-
makers need to distinguish between energy qualities, in this case between different end-uses –
i.e. 1 kWh consumed by a hospital is not equivalent to a 1 kWh consumed by neon lights of a
casino. This example indicates that a simple input/output ratio, such as the monetary cost of
generating 1 kWh of ‘electricity’ – an economic definition of efficiency - taken out of context can
only muddle the discussion of achieving technical energy efficiency.
(ii) The Economic Energy Intensity indicator - problems with excessive aggregation
The Economic Energy Intensity (EEI) indicator is one of the most commonly used aggregate
measure of a nation’s energy efficiency. The problem in measuring energy intensity at the
national level is that a great deal of information, context and discriminatory power is lost
through the process of aggregation. Economic Energy Intensity is expressed in MJ/€ (Mega
Joules of gross energy requirement per € of GDP for any given year) and can be expressed as a
ratio over two other indicators: “energy use per capita per year” and “GDP per capita per year”
that are strongly correlated. On this point, see (Fiorito, 2013).
Figure 12. Three clusters of countries having similar values of Energy Intensity. After Fiorito (2013).

MAGIC – GA 689669
51
The graphs illustrated in Figure 12 show the poor discriminatory power of economic energy
intensity indicator by showing clusters of countries that share very similar EEI values, but have
different levels of wealth and patterns of economic development. That is EEI cannot distinguish
between a rich country that consumes high levels of energy with high value-added production
per capita per year and a poor country that consumes very little energy with very little value-
added production per capita per year (Giampietro et al., 2012). The EEI ratio is an
‘uncontextualized’ and ‘uncontexualizable’ piece of information. This is important because a
great deal of qualitative information is lost in simple indicators, for example, they can render
invisible the displacement of energy and pollution in other counties.
(iii) Confusing energy efficiency with energy savings or even worse, reduction of energy use
Measurements of efficiency when used alone often do not include sufficient information. For
example, the Energy Efficiency Directive 2012/27/EU – EED had an energy efficiency target of
reducing the EU’s primary energy consumption by 20% by 2020 (European Union and European
Parliament, 2012). Note that this target does not consider the extent output (i.e., what is
produced by the economy); it assumes that any reduction in primary energy consumption is only
the consequence of increased efficiency of the economy. When the EU experienced a downward
trend in the level of GHG emissions in the period 2007-2008, this reduction was attributed by
the European Environment Agency (2010, p. 5) to successful efficiency policy: “our policies and
tools seem to be working”. However, Figure 13¡Error! No se encuentra el origen de la
referencia. below shows that the reduction in emissions was more likely the consequence of the
European economic crisis. This example shows that defining a simple percentage target for
efficiency (by reducing the input) does not provide enough discriminatory power for a meaning
interpretation of results.
Figure 13. Euro area GDP growth rate (at current prices): an economic explanation of the reduction of GHG emissions in the EU in the period 2008-2009.

Report on the Quality Check of the Robustness of the Narrative behind Energy Directives
(iv) The elusive assessment of efficiency in time: the Jevons paradox
Another challenge related to efficiency measurements at the macroeconomic scale is
determined by the complexity of social-ecological adaptive systems. Complex systems can adjust
to changes, either generated internally or imposed on them by the context, by “becoming
something else” (Prigogine, 1980). This implies that changes in efficiency eventually translate
into an evolution of (change in) the definition of ‘what a given activity is’ and ‘what the role of
that activity inside the system is’. One outcome of this restructuring in the light of increased
efficiency can be an increase in consumption this is called Jevons Paradox (Giampietro and
Mayumi, 2018; Polimeni et al., 2008). The Jevons Paradox stipulates that when a system gains
the ability to use a resource more efficiently, it will use the resource more (increasing its diversity
and/or its size), and not less because of an increase in efficiency.
To illustrate the pitfalls of simple assessments of efficiency in making valuations of outcomes
over time we provide below an example of a quantitative assessment of the ‘efficiency’ of
energy use in the US food system over time is helpful (Figure 14). The example is based on a
well-known study of Steinhart and Steinhart (1974), flagging in the 1970s the problem of the
heavy dependence on fossil energy of US food security, and a study of Heller and Koeleian (2000)
showing the dramatic changes in the profile of energy consumption in the food system of
developed countries (which also applies to the EU countries). Using a simple definition of
efficiency based on the measurement of a given input (the commercial energy consumed by the
US food system per capita per day in MJ) and a given output (food energy consumed at the
household level per capita per day in MJ) over a given period of time (1940-1995) we observe
the results shown in Figure 14. Both inputs and outputs increase but the gap between them
increases. Using this ratio of inputs and outputs as an indicator of efficiency, one would conclude
that the US food system has become less efficient over the considered period, but is this the
case?
Figure 14. Evolution of the ‘efficiency’ of the US food system based on fossil energy input and food energy output (in MJ per capita per day).
Data 1940-1970 are from Steinhart and Steinhart, 1974; data 1970-1995 from Heller and Keoleian (2000).

MAGIC – GA 689669
53
The calculation of the ‘efficiency’ based on the data shown in Figure 14 seems to be rigorous
and is certainly straightforward because the input and output are measured in the same unit
(MJ per capita per day averaged over the year). However, as discussed earlier the aggregation
of available information into a simple ratio and the mixing of quantitative assessments referring
to different energy forms misses key pieces of qualitative information. In this example, it
concerns changes on both the output and input side.
On the output side, two factors dramatically changed the quality (usefulness) of the food output
between 1940 and 1995:
i. There was a significant increase in the share of meat in the US diet from about 40 kg per
capita per year in the 1940s to almost 75 kg in the 1990s. This increase caused an
increase in the requirement for grain to feed animals. At household level the quantity
of MJ/day consumed by the US population per capita remained almost the same,
whereas the quantity of MJ/day of food (including food used as animal feed) produced
and processed by the food system greatly increased. In the US in 1995 the amount of
grain per capita per year used in the production of animal products was more than six
times the amount consumed directly in the average diet. The change in quality of the
human diet implies that at some point between 1940 and 2000 that the quantity of food
energy (MJ/day) consumed in the diet is no longer strictly speaking comparable to
earlier periods. This illustrates that it makes a big difference whether 1 MJ of dietary
energy intake comes from beef or potatoes;
ii. A dramatic increase in the convenience of food products. The preparation time of US
meals in the 1940s was measured in hours, in the 1990s in minutes. This significant
increase in convenience is a hallmark of modern economies. It has made more labor
available for the market economy as it has enabled many stay-at-home mothers to enter
the paid work sector. In this case, it is the usefulness of the product or service provided
(per unit of food consumed) that changed; 1kg of food in 1940 did not entail the same
level of convenience and energy inputs as 1kg of food in 1995. Thus, the quantification
of the ‘useful output’ is missed by the assessment in Figure 14 of the food delivered
measured in MJ.
On the input side, the set of activities carried out in the food systems changed dramatically in
the period under study. Besides food production, other activities in the agri-food system have
been growing dramatically in terms of their importance such as food processing in the food
industry, more packaging, longer distance transportation, and distribution that at all require an
increasingly large share of the total energy inputs (Heller and Keoleian, 2000). Moreover, there
has been a change in the level of openness of the US food system. In the period under analysis,
the level of exports of the agricultural sector in the US increased 8 times (Dimitri et al., 2005).
This means that part of the energy included in the assessment of the input to the US food system
in the 1940’ to 50’s was used for food export production so the inputs should not be associated
with local patterns of consumption. Finally, the characterization of energy inputs in joules does
not consider the implications of changes in the mix of primary energy sources (e.g. coal, oil,
nuclear, alternatives sources), the mix of energy carriers (electricity, fuels, process heat) used
for the various activities undertaken in the food system (agriculture, food industry, distribution,
home preparation).

Report on the Quality Check of the Robustness of the Narrative behind Energy Directives
In conclusion, the two output/input ratios measured in Figure 14 do not provide any useful
insight about changes in the efficiency of the US food system. Without an understanding of the
implications of the changes to the characteristics of the system being observed in the time
period across the various possible scales of analysis (the whole economy, the industrial sector,
a given process of production, the household level) including changes in the regulatory
framework, it is difficult to assess changes in energy performance.
(v) The difference between technological innovation and change in social practices:
assessing the efficiency of complex systems hierarchically organized is challenging.
The difference between the concept of technological innovation and change in social practices
is important because it should mean making a different choice of the indicators to be used to
assess “efficiency”. Put another way, the framing of the issue of sustainability as technological
innovation rather than change in social practices has deep political implications.
In relation to the consumption of energy carriers at the household level there are several
possible energy efficiency indicators:
(a) technical efficiency referring to specific energy conversions – e.g. the conversion in
electricity in BTU of refrigeration;
(b) final consumption per capita; or
(c) final consumption per household.
In this situation, depending on our choice of indicator we can have different results.
* Using the technical efficiency indicator, we could conclude that the social practice associated
with wealthy residents living alone in large houses equipped with state of the art technology is
very efficient;
* Using final consumption per capita we could conclude that the social practice of living alone in
large apartment without energy services is very efficient;
* Using the final consumption per household we could conclude that a social practice associated
with 8 people living in a small apartment using non-efficient appliances is very efficient.
Given this situation, who is choosing the indicators to be used as targets of energy efficiency in
policy? Is the setting of technical standards the only type of policy that can be implemented?
This question is important because policies aimed at technological innovations tend to subsidize
and promote the consumption of new products on the basis of perceived obsolescence and a
social distinction (Bourdieu, 1984; Veblen, 1899). This assumption that technical innovations are
the only solution for “saving the planet” can be seen as a kind of greenwashing of the consumer
society. In this way, public institutions promote a Schumpeterian creative destruction in the
name of sustainability, while ordinary people wonder why it is cheaper and greener to buy a
more efficient appliance than repairing their old one, why the house of a single rich person is
labeled more environmentally friendly because of expensive green gadgets, than their small old
apartments that house 8 people.
3.3.2 The problematic aspects of efficiency-based narratives in relation to energy
policy: The End-use Matrix as possible solution
During the trialogue negotiations as part of the EC’s Clean Energy Package in 2017-2018,
negotiations over the energy efficiency target for 2030 for Europe lasted over the course of six

MAGIC – GA 689669
55
rounds of talks. The discussions hinged on whether the energy efficiency target should be a
reduction in energy consumption of between 30-40% with arguments centered on the issues of
economic and jobs growth. The EU energy efficiency target for 2030 was finally agreed at 32.5%
with an upwards revision clause by 2023 (European Commission, 2018c). But these debates
were not just about setting a specific percentage decrease in energy consumption (energy
efficiency target), they were also about how to measure energy efficiency. This is a discussion
where science and politics intersect because the method for measuring energy efficiency
indicators does affect different powerful interests in the energy industry (as indicated in the
interview to a MEP member). For example, discussions have included questions such as: “to
what extent processes in the energy distribution chain should be included in measures such as
producers, suppliers, energy carriers and end-users?”. Moreover, depending on how different
forms of energy are considered in the calculation of primary energy consumption at the moment
of fixing the targets. Different methods of accounting – e.g. partial substitution, physical content
or direct equivalent method – can imply variations in the results between 17% for total amounts
(557 vs 653 EJ), or more than 200% for nuclear (20 vs 61 EJ) - see pages 213-215 from
(International Energy Agency (IEA) and World Bank, 2014). For a more detailed explanation of
this issue see Giampietro & Sorman (2012). The extent to which these issues are included in the
accounting (and how) will inevitably impact the definition of the final energy efficiency targets.
Therefore, these discussions are not only about the final energy target (how much do we have
to reduce energy consumption or GHG emissions), but also about the quality of the selected
quantitative representation used to translate the normative message in practical targets (what
is the level of reduction that should be achieved). That means that when designing targets one
may consider : (i) which flows of specific energy forms should be reduced – i.e. primary energy
sources vs secondary energy (energy carriers), thermal energy (e.g. fuels) vs mechanical energy
(e.g. electricity), energy derived from fossil sources vs carbon free sources; and (ii) which criteria
of performance should be used to characterize the reduction as acceptable – i.e. effects on the
competitiveness, employment, material standard of living, environmental impact.
Successful political agreements require the recognition of diverse of interests to achieve
compromise solutions acceptable to all stakeholders. In this process the pre-analytical choice of
indicators and frames it is essential because it may hide conflicts of interest, that later on will
negatively affect the effectiveness of the agreement. The introduction of ambiguity in the
agreements (based on simplistic definitions of efficiency) makes them easy to sign but useless
to guide pathways and generate accountability. This a problematic aspect with the Energy
Efficiency Directive or EU Climate Action plans (Lilleholt et al., 2018). When dealing with a
complex set of energy transformations of different types of energy forms, each expressing
different types of functions at different scales, we cannot use “un-contextualized” efficiency
targets. Looking at the situation in the EU, it is evident that a more comprehensive method is
required in order to generate effective energy targets and indicators. Specifically, what is
needed is an agreement on how to characterize the energy performance (and not the
input/output ratio energy efficiency) of the complex “energy-sector” “rest of the
economy”. A definition of performance requires the adoption of an integrated set of indicators
– a multi-criteria performance space – in order to generate enough discriminatory power to
identify the relevant factors affecting it. This is essential in EU when we deal with a set of
different types of energy sectors operating in different types of economies. For example, inside
the EU there are: (i) countries that use a significant amount nuclear energy (e.g. France), (ii)

Report on the Quality Check of the Robustness of the Narrative behind Energy Directives
countries heavily relying on coal (e.g. Poland); (iii) countries with the option to have a large
contribution of hydro to electric generation (e.g. Sweden and Finland); (iv) countries with a
relatively small economy and located in the middle of the EU grid, allowing them to have the
option of trading intermittent electricity with peak electricity at will (e.g. Denmark); (v) countries
in the South of Europe with better conditions for using solar (e.g. Spain); (vi) countries with a
very limited endowment of fossil energy sources (e.g. Italy). It is clear that within this
heterogeneous set of energy sectors it is absolutely impossible to even imagine a “one size fits
all” definition of targets, on the other hand the alternative of “everything goes” is also not
acceptable. So what should be the information space used to generate indicators of energy
performance that are useful for the discussion of indicators in energy directives? In order to
track and identify the various aspects (or better attributes of performance) relevant to discuss
policies it is essential to make a distinction between three sets of energy transformations
describing the relation between the energy sector and the rest of the society:
(1) the conversion of Primary Energy Sources - source of energy that are outside human
control - into secondary energy (energy carriers). According to the laws of
thermodynamics energy is not a ‘normal’ commodity: Primary Energy Sources cannot
be produced. This conversion takes place inside the energy sector;
(2) the conversion of Energy Carriers (secondary energy produced by processes under
human control while exploiting primary sources and sinks) into end-uses associated with
the various tasks and functions expressed in the society;
(3) the convenience of end-uses in relation to the generation of value-added in the market,
and material standard of living in the household. In modern economies, the biophysical
analysis of the characterization of the economic usefulness of end-uses is studied only
in economic terms – i.e., in observing monetary flows. However, studying the economic
effect of the conversion of energy commodities into useful economic outputs –
something that is observed and assessed using economic narratives – unavoidably
misses relevant implications of the characteristics of biophysical conversions.
These three different sets of conversions require the adoption of different analytical tools and
different metrics. The first has to do with security (availability of resources, depletions of stocks
and environmental impact), the second has to do with the problem of de-carbonization and
environmental compatibility of the energy uses, the third has to do with an economic analysis
of competitiveness. An integrated analysis of these three sets of conversion requires the
adoption of an interdisciplinary approach able to track changes and relations over attributes
observable only across different scales and dimensions of analysis. This complex analysis is
essential to have an informed discussion about policy targets in relation to two points: (i) identify
relevant attributes of performance that can be used as targets; (ii) gain insights about how a
change in the chosen attributes will affect the other targets.
An overview of all the factors affecting the possible definitions of “efficiency” of an economy is
shown in Figure 15. There we can see five key factors affecting the overall performance of an
economy: (i) the degree of openness of the energy sector, (ii) the mix of primary energy sources
and energy carriers used in society, (iii) the mix of economic activities carried out in society, (iv)
a selective externalization of economic activities (imports of goods and services), and (iv) credit
leverage and quantitative easing boosting the GDP. This latter is crucial due to the massive
financialization of the economy using credit leverage (fuelled by quantitative easing) to boost

MAGIC – GA 689669
57
the GDP independently from the actual production of biophysical goods. Sustaining the
consumption of imported goods by generating higher debt levels is an effective way of reducing
the perceived biophysical/energy input required by an economy. Considering that between
2007 and 2015 credit leverage (debt) globally has increased by 57 trillion USD - more than the
increase in global GDP (38 trillion USD) in the same time period– and that the vast majority of
this credit has been generated and used in developed countries (McKinsey Global Institute,
2015), it becomes clear how significant this factor has been in helping post-industrial countries
maintain high levels of the GDP/energy input ‘efficiency’ ratio.
Figure 15. The different factors affecting the energy and carbon intensity of an economy.
The End-Use Matrix
The End-Use Matrix (EUM) can be used to generate a systemic characterization of the
performance of energy sectors by identifying relevant differences among countries in terms of
the mix of primary energy sources, the mix of energy carriers required for end-uses, the level of
externalization of the economy, the geographic locations and the size of the economy
simultaneously at different levels - the whole country, individual economic sectors, sub-sectors
and sub-sub-sectors. This common set of integrated characteristics can be used to describe the
energy performance across the various EU countries in relation to a series of indicators (that can
be chosen “à la carte” by the various social actors using the analysis). Moreover, this approach
could be used for an informed deliberation about how EU countries want to change their
metabolic patterns of energy. This informed deliberation can only be done after having defined
who is using energy, which type of energy, how much energy, and why (to do what) and in which
context (see Figure 16). Combined with other tools of the MuSIASEM framework, it can analyze
the openness of flows, externalization of functions and impacts to the environment.

Report on the Quality Check of the Robustness of the Narrative behind Energy Directives
Figure 16. An example of the features of the information space generated by the end-use matrix characterizing the pattern of energy end uses in a society.
Abbreviations: all of them are yearly values or yearly average: HA = Human Activity in hours; EMRi = Energy
Metabolic Rate of energy carrier i in MJ/h; EJP = Economic Job Productivity or gross value added per hour of human
activity in €/h; ETi = Energy Throughput of energy carrier i in PJ; GVA = Gross Value Added in €.
A visualization of relational analysis compressed in the EUM over time could be seen in Figure
17 and Figure 18 The EUM has recently been employed in an explorative comparative analysis
of the energy performance of the economy of the EU and China (Velasco-Fernández et al.,
2018b). For example, Figure 17 shows the crucial difference in the energy performance of the
paid work sector of these two economies over the period 2000-2016. While the level of
capitalization of the economy (energy use per hour of labor in the paid work sector) was stable
in the EU, it has been steadily growing in China (it tripled). Note that the number of hours per
capita allocated to paid work in China is 1.8 times higher than in Europe (almost the double).
This is due to a dramatic difference in demographic structure and the higher workload per
worker in China (an information that can only be observed at a higher level of analysis). Indeed,
the metabolic narrative shows that we deal with different typologies of social-ecological
systems: the metabolic pattern of China is typical of a fast industrializing country (young
economy in the maximum phase of growth), whereas the metabolic pattern of the EU28 is
typical of senescent post-industrial economy. These differences cannot be detected with simple
output/input ratios.
The study also examined externalization of energy and labor intensive economic activities in the
EU. For example, the blue point in the graph of ¡Error! No se encuentra el origen de la
referencia. shows the performance of the EU economy if it were to internalize the ‘virtual’
amounts of energy carriers and labor hours embodied in the imports of the EU from the rest of
the world.

MAGIC – GA 689669
59
Figure 17. Changes in the metabolic characteristics of the Paid Work sector of the EU and China in the period 2001-2016.
Capitalization of the economy (assessed as gross energy requirement, thermal equivalent, in MJ/h on a year
basis) versus allocation of human activity (labor) to the paid work sector (assessed in h/y per capita).
Figure 18 shows another example of visualization of results derived from the same study. These
results refer to a lower hierarchical level of analysis, that is, economic sub-sectors. (Classification
of economic sub-sectors as shown in Figure 4 for ‘manufacturing and construction’, level n-3).
Figure 18 flags some important issues. First, also at this lower level of analysis differences in
societal context remain significant: labor hours per capita per year in the industrial subsectors
range from 5 to 40 in the EU, while in China from 1 to 90. Capitalization level (as estimated by
EMR) ranges from 100 to 2000MJ/h in the EU, but from 100 to 1200MJ/h in China. Second, as
regards individual subsectors, the machinery (Ma) sector in China showed a dramatic increase
in labor use, while the rate of total energy per labor hour (EMR) remained the same. Also in the
EU the EMR of the machinery sector remained constant, but the hours of labor in this subsector
dramatically shrunk. This indicates an expansion of the machinery sector in China (without major
changes in technology) and a contraction in the EU. Also the Textile and Leather (TL) sector
steadily shrank in the EU28. This trend indicates externalization of labor-intensive activities
generating relatively little value added (economic labor productivity not shown in Fig. 7) in the
EU. The Basic Metal (BaM) and Non-Metallic Mineral (NM) sectors in China (associated with
construction and infrastructures) underwent massive capitalization (dramatic increase in EMR),
while yearly labor input remained constant. In the EU, on the other hand, the EMR of these two
sectors oscillated in the same period. Note that none of the subsectors of the industrial sector
in the EU has reduced energy use per hour of labor. This finding contradicts the widespread
belief that the observed reduction of energy intensity in EU28 (European Environment Agency,
2018) is due to technological improvements. Indeed, the EU-China study showed that this

Report on the Quality Check of the Robustness of the Narrative behind Energy Directives
reduction of EEI is due to a continuous shrinking of activities in the industrial sector (as evident
from Figure 18) and an expansion of the service sector (not shown).
Figure 18. Changes in the metabolic characteristics of 11 sub-sectors of the industrial sector of the EU and China in the period 2001-2016.
Capitalization of the economy (assessed as gross energy requirement, thermal equivalent, in MJ/h on a year
basis) versus allocation of human activity (labor) (assessed in h/yr).The acronyms of 11 subsectors considered are:
BaM – Basic Metal; CP –Chemical & Petrochemical; EM – Energy & Mining; FT – Food & Tobacco; Ma –
Machinery; NM – Non-Metallic Minerals; PPP – Paper, Pulp & Print; TE – Transport Equipment; TL – Textile &
Leather; WWP – Wood & Wood Products.
The two examples given in Figure 17 and Figure 18 illustrate the type of insights that can be
obtained using the rich information space of the EUM. These results are in stark contrast with
the simplicity of indicators based on output/input ratios referring to just a single level of analysis.
As has been shown, many interrelated changes take place simultaneously in society’s energy
metabolism on different hierarchical levels that do or do not result in changes in either output
or input. Further results, including the economic job productivity (the amount of value added
per hour of labor – the equivalent of EMR in monetary accounting), that provide insight in the
factors determining changes in economic energy intensity in the EU and China can be found in
(Velasco-Fernández et al., 2015).

MAGIC – GA 689669
61
3.4 Outsourcing Challenge5
EU energy policy is concerned with a number of complex, inter-related and often contrasting
goals, underpinned by three main objectives. These are defined by Bale et al. (2015) as the
energy trilemma: to ensure affordable energy for all its citizens, as stressed in the Clean Energy
for All Europeans package (European Commission, 2016a); to reduce GHG emissions (European
Commission, 2017c) and to increase security of supply (European Commission, 2014).
The commissioner for Climate Action and Energy Miguel Arias Cañete said, upon the release of
the Clean Energy for all Europeans package, and specifically in relation to its energy efficiency
target: "Europe is by far the largest importer of fossil fuel in the world. Today we put an end to
this. This deal is a major push for Europe's energy independence. Much of what we spend on
imported fossil fuels will now be invested at home in more efficient buildings, industries and
transport. The new target of 32.5% will boost our industrial competitiveness, create jobs, reduce
energy bills, help tackle energy poverty and improve air quality. Our path to real energy security
and climate protection begins here at home, and this deal shows Europe's determination to build
a modern economy that is less dependent on imported energy and with more domestically
produced clean energy". (European Commission, 2018c)
All these goals fall under the common umbrella of ‘decoupling’. Decoupling refers to a
disassociation between indicators of economic growth and indicators of other domains: most
frequently, it is used to describe the decoupling between GDP and energy consumption (energy
decoupling), or between GDP and GHG emissions (GHG decoupling) (Steinberger and Roberts,
2010; Wang et al., 2016; Gupta, 2015; Bennetzen et al., 2016). Dematerialization can be
considered as a special case of decoupling, hinging on the notion that economic throughput
(and, as a consequence, economic growth) requires a gradually shrinking contribution of
material inputs. Classically, energy decoupling is measured through the economic energy
intensity (EEI), relating energy throughput to GDP (Quah, 1997). EEI, the ratio of final energy
consumption and gross domestic product, is the most widespread indicator used to assess
decoupling. Despite receiving criticism (Giampietro et al., 2012), the indicator is used by the
European Environmental Agency (EEA). Through the use of the EEI, the EEA states that there has
been a steady decoupling of the EU’s economy since the 1990s (EEA, 2018).
Nevertheless, it has been widely acknowledged in the literature that the ambiguity of energy
efficiency itself has caused problems for achieving robust science and effective policy: major
challenges include mechanisms that may reduce expected energy savings from energy efficiency
policies, known as the Jevons paradox (Polimeni et al., 2008) or the rebound effect (Sorrell,
2009) and the fact that headline indicators, such as energy intensity, cannot measure underlying
technical efficiency comprehensively.
We here recognize four main limits affecting current decoupling indicators, such as EEI:
5 Parts of this section are adapted from the following work: Ripa, M., Di Felice, L., Giampietro, M (2018). The externalization of the EU’s energy sector: policy implications of the nexus in a globalized world. Submitted to Energy Policy.

Report on the Quality Check of the Robustness of the Narrative behind Energy Directives
(i) the neglect of the issue of scale: when assessing the characteristics of the economy at single
scale (e.g. whole economy), a single (flow-flow) indicator might provide misleading results
(Giampietro et al., 2012);
(ii) the use of two correlated variables: the energy throughput of an economy and GDP are highly
correlated, thus their ratio cannot give useful information about the state of economic
development in relation to the decoupling or dematerialization of modern economies (Fiorito,
2013);
(iii) the relative (a.k.a. weak) decoupling due to the financialization of the economy: (Kovacic et
al., 2018) demonstrated that the decoupling between energy throughput and economic growth
in the EU countries reflects a process of financialization, rather than a change in metabolic
patterns or production process;
(iv) the virtual decoupling: the effects of what economists call the effect of “externalization”,
more commonly defined as outsourcing: that is a reduction in energy consumption is often
linked to outsourcing of energy intensive processes of production (i.e., displacement outside
national borders) rather than any efficiency improvements per se.
The fourth point is still partially explored in scientific literature: few studies raise the issue that
that when embodied energy is taken into account, decoupling has been virtually non-existent
(Moreau and Vuille, 2018; Tang et al., 2013; Weber and Matthews, 2007).
During the interviews and the focus group, policy-makers recurrently expressed interest in the
potential of MAGIC approach to analyse the relation between the sustainability of EU energy
use and the outsourcing of industrial and agricultural production.
As explained earlier in this report, the Quantitative Story-Telling proposed does not want to get
into a theoretical discussion over the validity of the indicator of Economic Energy Intensity.
Moreover, this topic is touched upon in the section providing a QST about the usefulness of the
concept of energy efficiency. The analysis presented here wants to flag the lack of discriminatory
power of the models used right now to inform policy by carrying out a semantic check on the
importance of outsourcing in the current functioning of the EU’s energy sector.
We analysed to what extent decoupling can be attributed to energy outsourcing by shifting
energy consumption abroad, which are re-imported as embodied energy in products.
To address this challenge, our framework builds on the method of Multi-Scale Integrated
Analysis of Societal and Ecosystem Metabolism (MuSIASEM) (Giampietro et al. 2012; 2013;
2014). There are three core elements to the proposed framework:
1. patterns of social (labour) and bio-physical (including both energy and GHG for the first
time) elements are considered simultaneously, differently from current models used for
decision-making;
2. the framework allows for scaling across hierarchical levels, differently from classical
indicators which focus on one scale and level at the time;
3. third, the MuSIASEM framework can be used to account for embodied energy (this is
the first time the method is applied to this task).
In this analysis, MuSIASEM (Giampietro et al., 2009; Giampietro and Mayumi, 2000; Giampietro
and Ramos-Martin, 2005) has been used in its diagnostic mode to firstly characterize the local

MAGIC – GA 689669
63
energy sector at different scales (sectorial, functional-supply and process) and then to quantify
the externalization, meaning the virtual bio-physical investments made elsewhere to extract or
produce the imported energy.
Definitions and accounting framework
Building on the concept of virtual and embodied imports (Hoekstra and Hung, 2005; Treloar,
1998), we refer to externalized energy as the sum of direct energy imports (both primary energy
sources and energy carriers) and energy embodied in the direct energy imports (e.g. electricity
needed to extract coal, or coal needed to produce the electricity that is imported). Of the nexus
elements considered in the analysis, energy is the only one which can be imported both directly
and virtually: human activity (HA) and GHG emissions are by their very nature only embodied.
Figure 19 illustrates the representation of the functional elements producing and consuming
energy carriers broken down across hierarchical levels. In this case the hierarchical organization
is nested, meaning that in the dendrogram the size of lower-level components sums up to the
size of upper-level components. This organization generates mutual information in the
metabolic network. This mutual information represents a downward causation for the rest of
the metabolic elements operating at lower levels. What this means is that the behaviour of the
elements at the lower levels of the hierarchy simultaneously constrains the behaviour of the
higher levels while being constrained by it.
Figure 19. Taxonomy of the analysis.
Level n represents the national/country level.
Level n-1. Moving down, society can be split into different constituent components, i.e.
economic sectors: Agriculture and Forestry (AF), Energy and Mining (EM), Manufacturing and
Construction (MC), Service and Government (SG), Household (HH). Level n-1 also includes
exports as an end-uses, meaning that part of the Energy Carriers (ECs) are not consumed inside
the country exported. The quantitative information here provides a characterization of how
different compartments of society do what they do: that is, the flows consumed and funds
allocated to each constituent component in relation to the total amount of energy carriers and
human activity in society/country.
Level n-2 disaggregates the energy sector from the mining one.

Report on the Quality Check of the Robustness of the Narrative behind Energy Directives
Level n-3 distinguishes three functional compartments inside the Energy sector (ES), each
responsible to produce one energy carrier (named Supply Systems). The characterization of the
ES depends on the mix of the functional elements whose size determines the size of the whole.
Therefore, the energy sector is then opened into different supply systems: electricity supply,
heat supply and fuel supply. The identification of the functional elements “supply systems” is
essential in order to understand the differences of the metabolic pattern of different countries.
At this level, part of the flows and fund consumed in the ES is also allocated to produce PES and
ECs which are exported (ESexp).
Level n-4: this is the lowest level analysed in this case (production processes level). The lowest
level provides three types of information:
I. the mix of processes fulfilling the functions above them. For example, if one wants to
understand how the behaviour at the functional supply level is the result of a
heterogeneous structural mix – e.g. if “electricity supply” in a certain country has a much
higher allocation of HA than the same functional compartment of a different country, it
may be useful to check which process mix leads to the difference. As it can be seen in
Figure 1, single production processes (e.g. refinery) are linked to more than one element
in the hierarchical level above them (e.g. electricity, heat and fuel supply). This non-
unique ‘one-to-many’ mapping requires allocating different inputs and outputs of the
process to different functional outputs. This makes the description of level n-3 (supply
systems) purely notional but relevant when the discussion about ‘what different
countries do’ comes into play.
II. level of externalization (i.e. outsourcing) since the energy consumed inside the country
(but also the exported energy) can be either guaranteed by local supply systems
operating inside the boundaries of the system (domestic production) or by externalized
to “virtual supply systems” not operating inside the social-ecological system (imports).
III. the pressure that the processes of energy production have on the environment: in this
case depletion of stocks and sink capacity (GHG emissions).
To avoid redundancy, the analysis of level n, n-1 and n-2 is not reported here since it has been
already tackled in previous works (Giampietro M et al., 2017; Velasco-Fernández et al., 2018a).
Each box in Figure 19 is described by a “processor” – a set of data including information about
the profile of inputs (production factors, including resources under human control and resources
from the environment) and outputs (the specific product as well as the pollution product of the
studied process) associated with the process.
Therefore, each processor represents a pattern of the labour-energy-climate nexus:
• HA - Human activity (fund) includes the working hours spent to produce the output,
accounted for in hours (h). Data on hours worked (human activity − HA) have been
obtained from the National account employment data (Eurostat, 2012a) and Annual
detailed enterprise statistics for industry (Eurostat, 2012b);
• ETi - Amount of energy throughput metabolized in the form of energy carrier i by the
end-use, where i is either electricity, heat or fuel, measured in joules (J). The
throughputs of the energy carriers (electricity, heat and fuel) are obtained by

MAGIC – GA 689669
65
aggregating the different energy products provided in the Energy Balances of Eurostat
(Eurostat, 2012c);
• GER (Gross Energy Requirement) is the equivalent amount of fossil energy that
is required directly and indirectly by a system to produce a good or service. In the case
of Heat and Fuel, the ratio GER/EC is 1, while in case of Electricity, a GER/EC ratio of 2.59
has been assumed;
GHG emissions which contribute to global warming according to the IPCC Fifth
Assessment Report (AR5), and by converting them into CO2 equivalent (by using the
characterization factors provided by the report), are quantified. Data for GHG emissions
are taken from Eurostat (Eurostat, 2012d).
The intensive indicators used in the following analysis are:
HA p.c.: the amount of hours per capita allocated to the end-use, measured in h
EC p.c.: the amount of energy carrier i consumed per capita, measured in J/p.c.;
PES p.c.: the physical amount of primary energy sources (e.g. kg of coal, m3 of natural
gas, etc.) per capita;
EMRi −Energy Metabolic Rate: the amount of energy carrier i metabolized per hour of
work allocated to the end-use, measured in joules of ECi per hour (J/h), different for the
different typologies of energy carrier, as described for example through the Electricity
Metabolic Rate and the Heat Metabolic Rate;
GMR – GHG Metabolic Rate: the amount of GHG emitted per hour of work allocated to
the end-use, measured in kg of CO2 equivalent per hour (kg/h);
Level n-2: characterization of the energy sector and externalization
Although the Energy Sector shows a limited, but not marginal, contribution to the countries’
total energy consumption: around 10% of total energy consumption (calculated as gross energy
requirement) in EU-28 (ranging from 3% - in the Netherlands - to 16% - in Romania), it is the
sector with the highest EMR (Energy Metabolic Rate) and GMR (GHG Metabolic rate) expressed
as MJ/h and kg/h, respectively.
The bubble graph in Figure 20 shows the relationship between human activity per capita
(plotted along the x-axis) and the energy metabolic rate (as gross energy requirement) of the
energy sector of the seventeen countries. Similarly, Figure 21 and Figure 22 show the
relationship between human activity and the electricity (EMR_el) and heat (EMR_he) metabolic
rates, respectively. The more a country moves on x-axis, the more it is capitalizing its energy
sector (i.e. highest energy consumption per working hour) over the timeframe (2009-2015).
Moreover, the dimension of the bubbles expresses the energy consumption per capita in the
Energy Sector, while colours mark the different countries.
As it can be noticed, the Eastern countries are those placed at the bottom right of the figure:
they show lower energy consumption (the bubbles are smaller), they have lower EMRs (ranging
between 1 and 3 GJ/h/pc) and higher HA (between 6 and 12 h/pc). This means that, compared
to Western countries, they have lower levels of capitalization but larger amounts of human labor

Report on the Quality Check of the Robustness of the Narrative behind Energy Directives
invested in the energy sector (this of course determines an upward influence in the West on the
amount of labour available for the other sectors).
Figure 20. EMR_GER (Energy Metabolic Rate) for the Energy Sector in EU17 from 2009 to 2015.
The distinction among different ECs (Figure 21 and Figure 22) discloses differences in the
countries’ patterns, not observable in Figure 20 (when ECs are kept aggregated in the GER): for
example, Spain and Portugal, on the top left corner, show an EMR_el that is unchanged over
time; conversely, EMR_he has raised from 2009 to 2015.
Figure 21. EMR_el (Electricity Metabolic Rate) for the Energy Sector in EU17 from 2009 to 2015
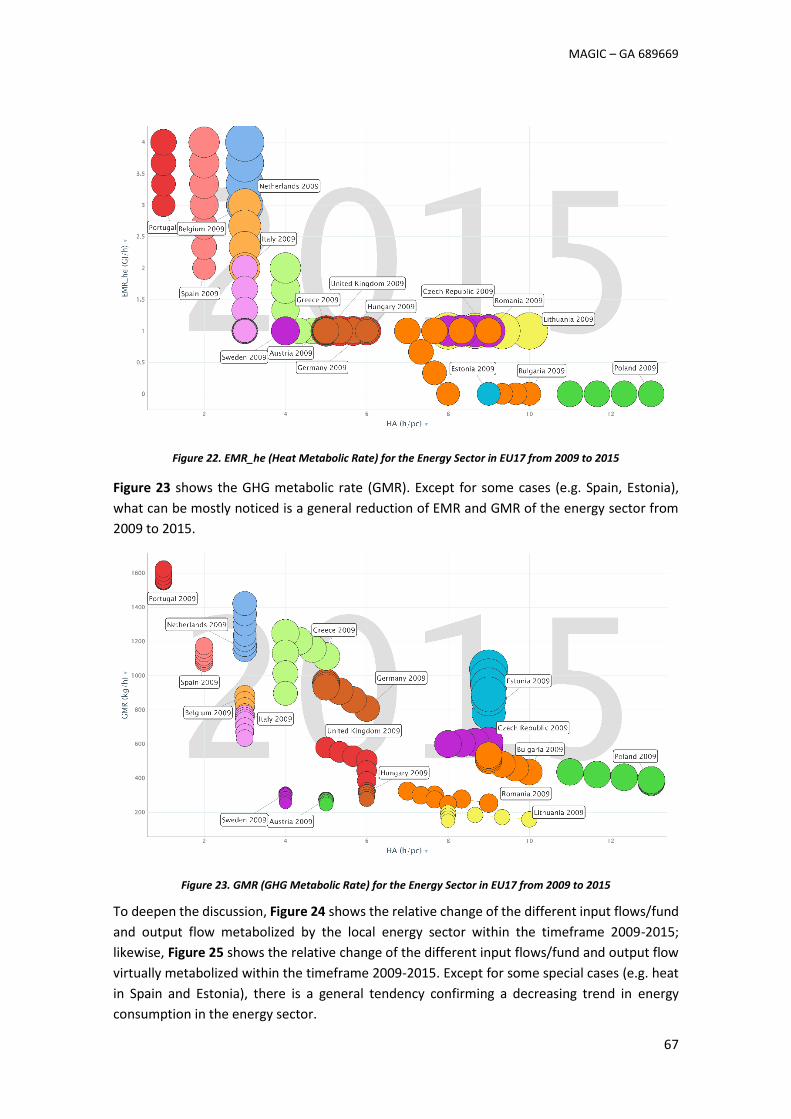
MAGIC – GA 689669
67
Figure 22. EMR_he (Heat Metabolic Rate) for the Energy Sector in EU17 from 2009 to 2015
Figure 23 shows the GHG metabolic rate (GMR). Except for some cases (e.g. Spain, Estonia),
what can be mostly noticed is a general reduction of EMR and GMR of the energy sector from
2009 to 2015.
Figure 23. GMR (GHG Metabolic Rate) for the Energy Sector in EU17 from 2009 to 2015
To deepen the discussion, Figure 24 shows the relative change of the different input flows/fund
and output flow metabolized by the local energy sector within the timeframe 2009-2015;
likewise, Figure 25 shows the relative change of the different input flows/fund and output flow
virtually metabolized within the timeframe 2009-2015. Except for some special cases (e.g. heat
in Spain and Estonia), there is a general tendency confirming a decreasing trend in energy
consumption in the energy sector.

Report on the Quality Check of the Robustness of the Narrative behind Energy Directives
Nevertheless, Figure 25 shows a different picture: there is, indeed, a general tendency to
increase the mix of virtual inputs and externalized GHG emissions embodied in the imports.
Moreover, the magnitude of the change is sometimes one order of magnitude bigger than the
decreasing change in Figure 24.
Figure 24. Relative change (2009-2015) of the inputs and GHG emissions of local Energy Sector
Figure 25. Relative change (2009-2015) of the inputs and GHG emissions of virtual Energy Sector
-40%
-20%
0%
20%
40%
60%
80%
HA Electricity Heat GHG
-100%
-50%
0%
50%
100%
150%
200%
250%
HA Electricity Heat GHG

MAGIC – GA 689669
69
The reasons why these changes have occurred can be very different (e.g. a structural change, an
increase in export, an end-use shift, etc.) and requires looking at a lower level of analysis.
Level n-3: Supply Systems and externalization
¡Error! No se encuentra el origen de la referencia. shows the breakdown of GHG emissions
allocated to the three ECs supply, including exports. It is well known that the majority of GHG
emissions are generated by the combustion of fossil fuels, therefore the majority of emissions
occur locally. Looking at the figures, it is interesting to see that some countries have reduced
their carbon footprint locally but increased it abroad. This information, however, is not enough
to establish effective policies: in fact, in some countries (like the Netherlands), this rise is mostly
caused by an increase of energy exports. This is something that remains hidden when taking an
approach at a single scale.
Moreover, the analysis shows that only when considering the end uses of the energy sector (a
minor fraction of the total energy consumption of the total economy), the accounting of
externalized use of inputs and emissions can be relevant. For example, when considering the
Netherlands, the GHG emissions embodied in the imports of the Energy Sector account for 50%
of the sector’s total emissions. This suggest that considering embodied emissions of all sectors
would radically change the country’s emissions profile, particularly when considering emissions
embodied in imported goods (not accounted here). This exercise of QST shows that when
deciding targets of reduction of GHG emission of the order of 20% or 30% it is essential to
consider (or better to avoid) the possibility that these targets will be achieved by externalizing
both energy uses and emissions to other economies (what is known as carbon leakage). If the
goal is to prevent climate change, it does not matter where the GHG emissions take place in the
planet.

Report on the Quality Check of the Robustness of the Narrative behind Energy Directives
Figure 26. breakdown of GHG emissions allocated to the three ECs supply, including exports.
Positive emissions are taking place inside the borders, negative emissions are those externalized through imports
-4000
-2000
0
2000
4000
6000
8000
2009 2015 2009 2015 2009 2015 2009 2015 2009 2015 2009 2015 2009 2015 2009 2015 2009 2015 2009 2015 2009 2015 2009 2015 2009 2015 2009 2015 2009 2015 2009 2015 2009 2015
Austria Belgium Bulgaria CzechRepublic
Germany Estonia Greece Spain Hungary Italy Lithuania Netherlands Poland Portugal Romania Sweden UnitedKingdom
kg/p
c
Electricity Supply Local Heat Supply Local Fuel Supply Local Export Electricity Supply Ext Heat Supply Ext Fuel Supply Ext Export Ext

MAGIC – GA 689669
71
Environmental pressure (PES) and externalization
‘Decoupling at its simplest is reducing the amount of resources used to produce economic
growth and delinking economic development from environmental deterioration’ (United
Nations Environment Programme, 2011). As said before, several analyses of environment-
economy decoupling are based on a single indicator (e.g. intensity of carbon emissions or energy
use). Decoupling indicators are characterized by simplicity, which can sometimes be misleading.
Indeed, most pressures on the environment are the result of multiple factors.
¡Error! No se encuentra el origen de la referencia. gives an overview on the relative change (in
percentages) of the fossil PES (coal, natural gas, oil, uranium) metabolized (both domestically
consumed and/or exported) by the EU countries within the timeframe 2009-2015. If we consider
the total PES - locally produced and externalized - , the decoupling of EU countries results to be
quite weak: while some countries have reduced their use of coal and natural gas, there is an
homogeneous trend in increasing the oil demand in almost the analyzed countries.
Our results show that flow and funds embodied in imports play a key role in decoupling
discourses. However, the question of whether the EU is actually decoupling, or simply
outsourcing its energy and GHG intensive industries, is not a simple one to address. It requires
untangling a complicated and often intractable network of exchanges, where data is often
missing or not coherent across different countries. Therefore, the analysis of the implications of
externalization raises a note of caution with regard to the robustness of current decoupling
analyses. Given the crucial importance of the long-term sustainability of economic growth and
the constraints imposed by resource depletion and climate change, a misleading information
could lead to an attitude of excess of confidence that may result harmful to the environment.
Figure 27. Relative change (2009-2015) of the fossil PES metabolized by EU countries.
-60%
-40%
-20%
0%
20%
40%
60%
80%
100%
coal natural gas uranium oil

3.5 Main insights from Closing the QST Loop
As explained in section 2.3, several events were instrumental in closing the QST loop and
receiving feedback on the quantitative story-telling (QST) results of MAGIC related to Energy
Policy.
The discussion panel on Squaring the Energy Circle in the Post Growth Conference at the
European Parliament gave interested insights for closing the QST loop. The divergence between
MAGIC’s QST of energy policy narratives and the official framing stimulated a lively discussion.
Interventions from the public (academic, NGOs, lobby groups, and think-tanks) focused on: the
low quality of current energy models, the lack of consideration of Jevons paradox/rebound
effects in the models and in policies, the need of addressing energy issues also from a social
perspective (e.g. social practice, sufficiency) and the need of addressing externalization
(outsourcing). Most of these supported the QST of selected energy narratives.
In relation to the insights from the focus group organized by MAGIC in the framework of the
EMP-E conference 2018 'Modelling Clean Energy Pathways', valuable feedbacks were received
from DG officers on the presentation of MAGIC QST results, especially with regard to the way
some results were presented. To get more attention from policy-makers, the tool must be more
clearly presented, providing concrete examples of how it could improve current modelling
advice for developing European policies. On the other hand, the current problems exposed were
not contested and the participants discussed some of the possible causes that generate these
narratives during the world café tables. From the discussion at the various tables the energy
policy narratives addressed in MAGIC Task 5.3 – i.e. outsourcing challenge, energy efficiency,
and decarbonization in the transition to renewable energies – emerged as relevant but at the
same time controversial. More details of the outcomes can be found in the minutes of the focus
group.
Furthermore, a follow-up text analysis and a semi-structured interview with a MEP was
conducted in October 2018 to verify narratives and follow the process of the energy efficiency
package negotiations which were taking place during 2017/18 with trialogue interinstitutional
negotiations completed in June 2018. Keeping abreast of these negotiations was important
because many issues were raised in negotiations that relate to the MAGIC project. These include
externalization of resources (suggestions were made by ITRE Rapporteur to better define the
primary energy definition) and comprehensiveness of energy efficiency measures to include the
whole energy chain and all actors within it. This has implications for assessing policy processes
regarding sociotechnical regimes and social processes in energy transitions. Furthermore, the
issue was raised that MEPs did not properly understand the energy efficiency issues (e.g.
difference between energy savings and energy efficiency) which is an important
issue/opportunity for MAGIC to intervene and provide scientific/policy support.
MAGIC – GA 689669
73
4 Concluding Discussion
In rhetoric and action the European Union has attempted to be a global leader in forging
solutions to confront the problem of climate change. The energy system of the future could
potentially develop in a number of different directions, depending on how society and its
decision makers prioritize various worthwhile energy objectives, including, but not limited to,
decarbonization, energy efficiency, and enhanced energy security. Achieving these objectives
would require a dramatic transformation of the entire society over the next several decades.
According to what presented in this deliverable our team maintains that understanding these
dynamic relationships requires more integrated and holistic lens. This deliverable shows the
existence of major trade-offs among the various energy objectives and the requisite policy
choices and outcomes.
In our applications of QST we found several reasons for challenging the robustness of the four
narratives we considered in the check, that are used at the moment to inform policy making.
We used a set of models based on different narratives (relational analysis of the metabolic
pattern of social-ecological systems, bio-economics, social practices) to assess the feasibility,
viability and desirability of the expected results of current energy policies. When considering
the characteristics of current technologies, the reasonable productivity of available production
factors and the associated uncertainty the results provided by the alternative set of models
clearly indicate that the promised smooth transition toward a more prosperous and sustainable
EU, to be achieved in 30 years, is very problematic. This should be a reason for concern (more
on this point in the section of reflections).
The results obtained by adopting alternative narratives and alternative models suggest that
more drastic measures than ambiguous improvements in efficiency targets, a progressive shift
towards renewable resources and a rain of technological innovations should take place –
although, of course, all of these measures remain fundamental to a sustainable energy
transition. What our results show is that rather than a smooth energy transition in which
“everything will be changed in order to preserve the status quo” we should expect a radical
transformation of our society. To make things more challenging we will be able to control only
in part this radical transformation. However, this research team endorses the growing numbers
of analysts, business leaders and policy-makers calling for an urgent and broader cultural
change in our approach toward sustainability, as it becomes clearer that technological change
alone is not enough to avoid climate catastrophe and myriad other consequences of energy-
intensive consumer societies.
Through our interactions with social actors, we received recurrent feedback from DG staff about
a systemic lack of relevance and usefulness for policy making of the inputs they generally receive
from scientific projects. This should be interpreted as a signal that there is some systemic
problem in managing the science-policy process. In fact, there are two possible explanations for
these findings noted above:
(1) the expectations of the DGs are hardly achievable – as a matter of fact, when reading
the list of expectations mobilized by the EU (and by other international bodies) one
wonders whether policymakers actually believe that tangible results can be achieved in
30 years: that all EU citizens will live in an inclusive economy with zero waste, zero
emissions, with a perpetual economic growth. More specifically that the radical

Report on the Quality Check of the Robustness of the Narrative behind Energy Directives
technological transformations promised in a couple of decades will do nothing less than
to open up new and immense horizons for industry, provide multiple value creation
mechanisms, produce better welfare, GDP, and employment outcomes, is inevitable, and
perhaps may even be the next European major political economy project (Ellen
MacArthur Foundation, 2015). To this list we have to add that all of the above is
expected to be achieved while protecting and enhancing the ecological processes and
biodiversity in the environment (in the EU);
(2) the EU is funding the wrong type of scientific analysis –it should be noted that economic
narratives rely on the assumption that we are living, and will always live, in a situation
of moderate scarcity (according to dominant economic narratives, moderate scarcity is
required to have the stability of the institutions associated with a functioning market).
That is, these narratives are assuming “by default” that we will never have problems of
sustainability, because innovations and the market will always prevent negative feed-
back from the environment. As observed by many scholars in the field of ecological
economics, it is bizarre to use economic narratives that cannot see potential
sustainability troubles (that can only be observed when adopting biophysical narratives
going beyond prices and markets) to develop policies aimed at avoiding sustainability
troubles.
During the Energy Modelling Platform for Europe that took place in the headquarters of the
European Commission in Brussels on past 25-26 September 2018 (and specially during the focus
group organised by the MAGIC-Nexus participants during the event), the biophysical analysts
who presented at the workshop agreed on the fact that there is a homogenization of
perspectives dominated by economic narratives in energy modelling. In that sense, there is a
key aspect of the performance of social-ecological systems that is missed because of the
hegemonization of economic narratives in the vast majority of energy models.

MAGIC – GA 689669
75
5 Reflections and Next Steps
This section is divided into five sub-sections. Section 5.1 attempts to provide a theory-grounded
reflection on the implications of the hype of expectations about the future energy transition to
sustainability. Section 5.2 provides a reflection on the lessons learned about the quality of the
narratives used in the energy policy domain. Section 5.3 provides a reflection on the lessons
learned about undertaking QST. Section 5.4 provides a few reflections on the additional
challenge represented by the nexus. Section 5.5 illustrates the next steps we intend to carry out
in the rest of the MAGIC project.
5.1 EU energy policy and the management of expectations
The quantitative analyses carried out in this deliverable suggest that an energy transition to a
zero-carbon economy by 2050 presents various problems that are currently not considered in
EU energy policy. When relying on models based on a different framing of issues (developed in
alternative epistemic boxes) a few of the promises associated with the great and quick transition
seem to be implausible. This forces a reflection on the current strategy of how expectations of
the energy transition are managed by the EU. We consider expectations as considered in Science
and Technology Studies, and borrow the definitions of Brown & Michael, (2003) and Lazarevic
& Valve, (2017):
“Future expectations and promises are crucial to providing the dynamism and
momentum upon which so many ventures in science and technology depend” – (Brown
and Michael, 2003)
“Expectations have been advocated as having an essential role in guiding technological
innovation and sustainability transitions” - (Lazarevic and Valve, 2017)
Currently, EU decarbonisation strategies, and sustainability strategies at large, including
narratives of circular economy, bioeconomy, and electric vehicles (to name a few), rely on the
mobilization of expectations. Building on these expectations, the EU is promising a radically
different social-ecological future to its citizens. The cycle of management of expectations can be
represented via the Gartner hype-cycle, as shown in Figure 28. The cycle undergoes four main
phases, which we can relate to the EU’s strategy of expectation mobilization in relation to its
energy policies.
Figure 28. The Gartner hype-cycle.

Report on the Quality Check of the Robustness of the Narrative behind Energy Directives
What are the risks of a strategy of generation of expectations that is too aggressive?
Phase 1 – when moving from the innovation trigger to the peak of inflated expectations – this is
the most critical and delicate phase when expectations are mobilised, because of three issues:
1. An aggressive mobilization of expectations about sustainability translates into an
endorsement of ideological justification narratives
As noted by Brown and Michael (2003) expectations bring futures into being while
presenting pathways through which change is to be achieved. Therefore, expectations
do political work, by mobilising resources and scripting actions into the present.
Expectations can be seen as a strategy of “colonisation of the future”.
This ‘hero story’, where society is ‘saved’ by clever technologies, is inspiring, positive
and familiar. However, in this hero story “the founding principles of Western patterns
of consumption and production remain non-negotiable” and “ecological sustainability
[…] remains firmly subordinated to economic growth” (Fournier, 2008; p. 530).
2. An aggressive mobilisation of expectations about sustainability translates into a suppression
of criticism and the avoidance of considering alternative narratives, locking-in chosen normative
narratives – but then what if the choice of proposed solutions isn’t adequate?
Once they have attained the normative status of assumptions that are taken for granted,
they neither have to be justified nor reflected upon (Konrad, 2006).
The danger here is that the myths underpinning the reference points become
“naturalized”, the result being that space for critical and hesitative reflection diminishes
(Buclet and Lazarevic, 2015).
The expectations carry persuasive and performative power (Brown and Michael, 2003)
“Narrated expectations […] are so all-encompassing that they face little critique”
(Lazarevic and Valve, 2017).
This can lead to a situation of ‘ancien régime’, that can be defined as a state of affairs in which
the ruling elites become unable to cope with stressors and adopt a strategy of denial, refusing
to process either internal or external signals, including those of danger (after Funtowicz &
Ravetz, 1994).
3. An aggressive mobilization of expectations about sustainability that are perceived as
implausible can be considered as irresponsible
The radical technological transformations promised in a couple of decades, such as promises of
the circular economy, “will do nothing less than to open up new and immense horizons for
industry, provide multiple value creation mechanisms, produce better welfare, GDP, and
employment outcomes, is inevitable, and perhaps may even be Europe’s next major political
economy project” (Ellen MacArthur Foundation, 2015). However, “it is also evident that no
clarity exists as to the means the EU will be brought to change” (Lazarevic and Valve, 2017).
This implies that if the results promised by the EU will not be delivered then both EU citizens and
EU institutions will suffer negative consequences. The problems associated with disillusionment
refer to the second phase of the hype cycle illustrated in Figure 28.

MAGIC – GA 689669
77
Phase 2 – when moving from the peak of inflated expectations to the trough of disillusionment
4.The creation of inflated expectations about sustainability will generate problems of
governance if these expectations are not met
If expectations cannot be met, we are dealing with a case of Granfalloon (a term introduced by
Kurt Vannegut in his novel Cat’s Cradle (1963)) meaning that the management of expectation
has generated “a proud and meaningless association of human beings” who imagine (or are
manipulated to believe) that they are involved in an important mission. In the Granfalloon, they
share a connection based on beliefs or expectations that have little or no real significance.
As a matter of fact, we are observing in these years that the systemic failure of political
establishments of delivering the rosy future promised in the previous decade is weakening the
support to traditional political parties. This fact can explain the recent widespread success of
“unconventional” and unorthodox political figures and parties around the world. This wearing
out of the old social fabric and ideologies can be interpreted as a warning about the possible
consequences of a systemic disillusionment of the rest of society. If the various hypes associated
with different policy promises cannot be fulfilled, we should expect a progressive erosion of the
legitimacy of existing governments and institutions with negative consequences on the
governance of the transition. In phase 2 of the graph illustrated in Figure 28 it is logical to see
slash backs in the political arena, because the story-telling associated with the mobilization of
expectations (as discussed in Phase 1), always has deep political roots. In the current regime of
economics of technological promises (Jasanoff et al., 2015) the functioning of the economy is
heavily affected by political choices of allocating subsidies with the goal of boosting technical
innovations based on techno-fantasies. For this reason, it would be important to have a more
robust discussion of what is feasible, viable and desirable when anticipating future scenarios and
raising expectations.
5.2 Lessons learnt about the quality of the narratives used in the energy
policy domain
In relation to the policy focus
In our opinion, the applications of QST shows that the four narratives considered in this
deliverable and their associated models provide information of insufficient quality to policy
makers when it comes to identifying effective policies. This is an extremely dangerous situation
because of the urgency and the stakes of the decisions. According to the wisdom of the approach
of Post-Normal Science - referring to the use of science for decision making when "facts are
uncertain, values in dispute, stakes high and decisions urgent" (Funtowicz and Ravetz, 1993)–
rather than relying on complicated and obscure models (with thousands of variables) all
developed inside the same epistemic box it would be better to rely on information coming from
different story-telling (analyses carried out in different epistemic boxes) and a variety of
different story-tellers.
In relation to the analytical focus
In our opinion, the applications of QST show that in the existing use of science to inform policy:
There is an excessive hegemonization of economic narratives (that are the less suitable
to frame sustainability issues);

Report on the Quality Check of the Robustness of the Narrative behind Energy Directives
There is a systemic strategy of using reductionism to deal with complex problems;
There is a systemic neglect of key characteristics of complex adaptive systems (social-
ecological systems): they must be open to survive. This entails that the implications of
their level of openness (the level of externalization/outsourcing of the economic
process) cannot be neglected;
There is a systemic neglect of the existence of different typologies of metabolic patterns
– i.e. different typologies of economies operating in different evolutionary phases, with
different endowments of natural resources, different endowments of technical capita,
different population sizes and age structures, different level of openness and terms of
trade. Models and indicators are applied to “apples”, “oranges” and “harvesters”: on
size fits all;
There is a systemic neglect of social aspects: energy uses can only be understood in
relation to the associated social practices and not in relation to the technical coefficients
of the devices converting energy flows.
5.3 Lessons learnt about the undertaking of Quantitative Story-Telling
The simultaneous adoption of different epistemic boxes for framing an issue is
something unusual when dealing with scientific analysis. Therefore, an exercise of QST
tends to overwhelm the capacity of non-trained people to process the massive flow of
quantitative information coming in an unfamiliar format;
To make thing more challenging, alternative narratives shaking the existing epistemic
box are perceived as “inconvenient narratives”. Nobody, holding the expectation that
all the problems of sustainability can be solved soon in a smooth and painless way, (used
to the “yes we can” narrative) likes hearing a different narrative flagging that “Houston
we have a problem”;
Inconvenient narratives are what Rayner (2012) calls “uncomfortable knowledge” for
society. Therefore, they are not compatible with the institutional channels of
communication. According to Rayner (Rayner, 2012) to make sense of the complexity of
the world individuals and institutions tend to adopt simplified and self-consistent
versions of the world. Then knowledge which is in tension or outright contradiction with
these simplified versions must be expunged. This mechanism explains the phenomenon
of “socially constructed ignorance” that leads soon to the instauration of the “ancient
regime syndrome”. For this reason, our team believes that opening a discussion on
inconvenient narratives is extremely good for sustainability;
The future of QST depends on the generation of better visualization methods allowing
to handle and communicate complex information spaces. In our experience we
observed that stakeholders can easily grasp individual points, but when they are asked
to connect the dots to get the “big picture” associated with policy implications they tend
to get lost;
The original strategy aimed at involving EU staff in the quality check on the robustness
of the narratives was useful for validating our choice of narratives, but not effective
when coming to a critical appraisal of their usefulness. EU functionaries have the goal of
implementing policies and not of questioning them. Therefore, they are institutionally
located inside the various epistemic boxes associated with the various policy domains.
Even though we found a lot of bright people willing to explore alternative views, their

MAGIC – GA 689669
79
institutional role still forces them to focus only on how to improve the quality of the
models selected within the chosen epistemic box rather than questioning the pre-
quantitative framing of the issues;
We discovered that by changing the choice of stakeholders – e.g. Members of the
European Parliament, Executive Agencies or stakeholders operating at the national level
– it is possible to find people that are much more open to discuss in public the political
implications of QST. In fact, the role of these stakeholders is to check the quality of
political choices related to the priorities given to policies. In relation to this task, the
simultaneous consideration of alternative narratives in the phase of problem
identification and search for solutions provided by QST is considered useful;
The experiences of this preliminary experiment suggest that QST is a very powerful
method for opening new discussions and for generating a richer option space when
discussing policies. However, more experience is required (and more attention has to
be dedicated) to establishing and managing the interface of the co-production of
knowledge in tailoring the combination of methods and strategies on specific situations.
5.4 Lessons learnt about policy and the Nexus
In relation to the nexus, we experienced an obvious problem associated with the forced choice
of looking just at a single policy area (energy policy). After checking the quality of the narratives
used in the energy policy domain we cannot, later on, guarantee that the choice of these
narratives will remain valid when considering their effect on other policy areas. As discussed in
Section 1.1 the nexus is gaining relevance exactly because of the increasing recognition that
different sectors are inherently interconnected and must be investigated and governed in an
integrated, holistic manner (Hoff, 2011). Accordingly, the nexus literature emphasizes the
complexity of interactions occurring across sectors and the need to overcome silo approaches
in knowledge generation, and resource management and governance (Giampietro, 2018). A
nexus approach is deemed necessary to highlight interdependences, exploit potential synergies,
and identify critical trade‐offs to be negotiated among the affected parties (Allan et al., 2015;
Hoff, 2011).
Whereas the master narrative about sustainability claims that with more and smarter
technology and the market “yes we can” achieve sustainability, the nexus narrative tends to
suggest that “Houston, we have a problem”: sustainability will require important re-adjustments
in the pattern of production and consumption of goods and services. In the sphere of scientific
inquiry, the nexus flags an important shortcoming of existing quantitative approaches:
governance of the nexus requires the consideration of multiple relevant attributes that can only
be observed across different dimensions and scales of analysis. The simplifications typical of
reductionism (which reduce the nexus to a series of problems addressed one at the time) make
the nexus by default invisible to the analyst. The resource nexus calls for an overhaul of the
existing theoretic and analytic approaches.
Looking at the case of EU energy policy, the transition of the energy system towards
lower carbon emissions following relevant and suitable decarbonisation pathways is a major
challenge to society. Matching energy demand with supply, water demand with supply and food
demand with supply is increasingly dependent upon natural, technical and institutional
resources, as well as labor and land availability which have to be allocated across different

Report on the Quality Check of the Robustness of the Narrative behind Energy Directives
purposes, leading to a potential scarcity for each one of these production factors. MAGIC
believes that science for policy is also an art that should be used to inspire a re-thinking of
existing institutions.
5.5 Next Steps
Within the MAGIC project this deliverable represents the passage from the first half of the
activities, in which we have been learning how to carry out both co-production and
transdisciplinary working tackling individual policy domains, to the second half of the project in
which we will apply what we learned to the policy domain of the nexus. In this first phase, we
have learned within individual policy domains pros and cons of different engagement techniques
and how to establish and handle an interface with political and social actors. On the quantitative
side, we have been developing and testing a tool-kit to be used for QST. In the second phase of
the project we expect to do the following:
1. In relation to further analysis inside the energy policy domain, we will develop an application
of the MAGIC tool-kit tailored on the analysis of the various relevant features identified in this
first phase. This application will be used to address the specific shortcomings identified in this
deliverable: (i) a complex characterization of the internal end uses in society using an End-Use
Matrix – characterising who is using energy carriers inside the society, why, how, how much,
which type of energy carriers – capable of describing social practices across different constituent
components of society across different hierarchical levels of analysis; (ii) a complex
characterization of the requirement of local primary energy sources and primary sinks described
using an Environmental Pressure Matrix; (iii) a characterization of the effects of the
externalization/outsourcing using an Externalized End-Use Matrix and an Externalized
Environmental Pressure Matrix. In this way we can revisit the scenarios of decarbonization and
innovations for additional discussion within WP5 and within the activities of WP6.
2. In relation to analysis in the nexus domain, we will develop and application of the MAGIC
approach to the analysis of the metabolic pattern of EU countries calculating the four matrices
described above (end-use, environmental pressure, externalized end-use and externalized
environmental pressure). This time we will account simultaneously for the metabolized flows of
water, energy and food. The possibility of doing that has been shown in preliminary tests in
Deliverable 4.1, Deliverable 4.2 and Deliverable 4.3. In the remaining activities of WP5 we will
generate information useful for a discussion on “climate change actions”, “implications of
changes on SDGs” and “preservation of landscape and biodiversity”. This information will be
used to generate some reflections on the WEF nexus security within the European Commission.
3. Reflecting on the experience gained in relation to the undertaking of QST in the first phase,
we will dedicate an important effort in developing better methods of visualization of results. In
particular, if we want to simultaneously discuss feasibility, viability and desirability of scenarios
using non-equivalent models, it is essential to use an interactive software capable of making the
complexity of the explored relations manageable by stakeholders. The best solution is probably
to organize the information space in the form of a game. In relation to this task, we can build on
the experience done at the UAB in the past with “the sustainability sudoku” - a game developed
years ago using a very simple version of the set of the relations addressed by the MAGIC
approach.

MAGIC – GA 689669
81
4. Finally, we want to continue the ongoing activities on the engagement side: (i) MAGIC was
invited to participate in the organization of the next EMP-E 2019 conference and is currently
involved in the decision of topics for plenaries and focus groups. We can propose some specific
issues addressed in this report at the next edition; (ii) we are discussing with the group of MEPs
organizers of the Post-Growth conference at the European Parliament the organization of a
similar event dedicated to a public discussion of the robustness of the narrative of decoupling;
(iii) we are organizing at the national level (Spain) a meeting of energy experts of different
political parties to open a discussion on energy policies at the national level; (iv) we sent a
funding application for a series of conferences in Barcelona with the goal of involving various
social actors of the Catalan society in a discussion of the results of the first phase of MAGIC.

Report on the Quality Check of the Robustness of the Narrative behind Energy Directives
List of Publications
Di Felice, L., Ripa, M., Giampietro, M. (2018). An alternative to market-oriented energy
models: Nexus patterns across hierarchical levels. Published on Energy Policy.
Di Felice, L. J., Ripa, M., & Giampietro, M. (2018). Deep Decarbonisation from a Biophysical
Perspective: GHG Emissions of a Renewable Electricity Transformation in the EU. Sustainability,
10(10), 3685. https://doi.org/10.3390/su10103685
Giampietro, M., Velasco-Fernández, R., Dunlop, T. (2018). A critical appraisal of energy efficiency
measurements: the need for a new accounting approach. Submitted to Renewable &
Sustainable Energy Reviews.
Renner, A., Giampietro, M. The Regulation of Alternatives in the Electric Grid: Nice Try Guys, But
Let’s Move On. In International Conference on Sustainable Energy and Environment Sensing
(SEES); University of Cambridge, Cambridge, UK, 2018.
Ripa, M., Di Felice, L., Giampietro, M (2018). The externalization of the EU’s energy sector: policy
implications of the nexus in a globalized world. Submitted to Energy Policy.
Dissemination in Conferences/Workshops
Energy Modelling Platform for Europe 2018 (EMP-E2018), 26 September 2018, Brussels
(Belgium): https://magic-nexus.eu/events/energy-modelling-and-water-energy-food-nexus-
conundrum
Biennial International Workshop Advances in Energy Studies (BIWAES), 25-28 September 2017,
Naples (Italy): https://magic-nexus.eu/news/magic-biwaes-naples-25-28-september-2017
12th Conference on Sustainable Development of Energy, Water and Environment Systems
(SDEWES 2017), 06 October 2017, Dubrovnik (Croatia): https://magic-nexus.eu/news/invited-
lecture-wef-nexus-sdewes-2017
Energy Modelling Platform for Europe (EMP-E), 17-18 May 2017, Brussels (Belgium):
https://magic-nexus.eu/news/magic-emp-e-meeting-brussels-17-18-may-2017

MAGIC – GA 689669
83
Annex A – Policy Briefs
The content of this deliverable has been used to produce policy briefs that can be found:
http://magic-nexus.eu/policy-briefs

Report on the Quality Check of the Robustness of the Narrative behind Energy Directives
Annex B – Data
All the data used to perform the analyses are organized following the Data management Plan
(DMP) and therefore can be found in the Nextcloud shared folder:
https://nextcloud.data.magic-
nexus.eu/apps/files/?dir=/NIS_internal/WP5/Policy_Theme_ENERGY&fileid=5443

MAGIC – GA 689669
85
Acknowledgements
The authors acknowledge consortium colleagues for their contribution in stakeholders’
interviews, preliminary text analysis and internal deliverable review: Sandra Bukkens (UAB),
Tarik Serrano Tovar (UAB), Ângela Guimarães Pereira (JRC), Thomas Völker (JRC), Roger Strand
(UiB), Jan Sindt (CA) and Hutton team.

Report on the Quality Check of the Robustness of the Narrative behind Energy Directives
References
Allan, T., Keulertz, M., Woertz, E., 2015. The water–food–energy nexus: an introduction to nexus
concepts and some conceptual and operational problems. Int. J. Water Resour. Dev. 31,
301–311. doi:10.1080/07900627.2015.1029118
Aneke, M., Wang, M., 2016. Energy storage technologies and real life applications – A state of
the art review. Appl. Energy 179, 350–377. doi:10.1016/j.apenergy.2016.06.097
Bale, C.S.E., Varga, L., Foxon, T.J., 2015. Energy and complexity: New ways forward. Appl. Energy
138, 150–159. doi:10.1016/J.APENERGY.2014.10.057
Bennetzen, E.H., Smith, P., Porter, J.R., 2016. Decoupling of greenhouse gas emissions from
global agricultural production: 1970-2050. Glob. Chang. Biol. 22, 763–781.
doi:10.1111/gcb.13120
Berkes, F., Colding, J., Folke, C., 2003. NAVIGATING SOCIAL-ECOLOGICAL SYSTEMS Building
Resilience for Complexity and Change.
BMWi - Federal Ministry for Economic Affairs and Energy - Working Group on Renewable Energy
Statistics, 2017. BMWi - Federal Ministry for Economic Affairs and Energy - Working Group
on Renewable Energy Statistics (AGEE-Stat) [WWW Document]. URL
https://www.bmwi.de/Redaktion/EN/Textsammlungen/Energy/working-group-
renewable-energy-statistics.html (accessed 10.31.18).
Bourdieu, P., 1984. Distinction. A social critique of the judgement of taste. Harvard University
Press, Cambridge, Massachusetts.
Brazilian, M., Rogner, H., Howells, M., Hermann, S., Arent, D., Gielen, D., Steduto, P., 2011.
Considering the energy, water and food nexus: Towards an integrated modeling approach.
Energy Policy 39, 7896–7906.
Brown, N., Michael, M., 2003. A Sociology of Expectations: Retrospecting Prospects and
Prospecting Retrospects. Technol. Anal. Strateg. Manag. 15, 3–18.
doi:10.1080/0953732032000046024
Bruckner, T., Bashmakov, I.A., Mulugetta, Y., Chum, H., De la Vega Navarro, A., Edmonds, J., Faaij,
A., Fungtammasan, B., Garg, A., Hertwich, E., Honnery, D., Infield, D., Kainuma, M.,
Khennas, S., Kim, S., Nimir, H.B., Riahi, K., Strachan, N., Wiser, R., Zhang, X., 2014. Energy
systems. Clim. Chang. 2014 Mitig. Clim. Chang. Contrib. Work. Gr. III to Fifth Assess. Rep.
Intergov. Panel Clim. Chang.
Buclet, N., Lazarevic, D., 2015. Principles for sustainability: the need to shift to a sustainable
conventional regime. Environ. Dev. Sustain. 17, 83–100. doi:10.1007/s10668-014-9539-4
Bundesrechnungshof, 2016. Advisory Report to the Budget Commitee of the German
Parliament. Pursuant to Article 88 (2) Federal Budget Code - Key issue: Chapter 0903,
Energy and Climate Fund. Ref. :VIII 4 - 2016 - 0722. Bonn, den 21. Dezember 2016.
doi:10.1128/mSphere.00132-16
Carnot, S., 1897. Reflections on the motive power of fire, and on machines fitted to develop that
power. John Wiley & Sons, New York.

MAGIC – GA 689669
87
Denholm, P., Hand, M., 2011. Grid flexibility and storage required to achieve very high
penetration of variable renewable electricity. Energy Policy 39, 1817–1830.
doi:10.1016/j.enpol.2011.01.019
Denholm, P., Margolis, R., 2016. Energy Storage Requirements for Achieving 50 % Solar
Photovoltaic Energy Penetration in California. Nrel.
Di Felice, L., Ripa, M., Giampietro, M., Di Felice, L.J., Ripa, M., Giampietro, M., 2018. Deep
Decarbonisation from a Biophysical Perspective: GHG Emissions of a Renewable Electricity
Transformation in the EU. Sustainability 10, 3685. doi:10.3390/su10103685
Dimitri, C., Effland, A., Conklin, N., 2005. The 20th Century Transformation of U . S . Agriculture
and Farm Policy The 20th Century and Farm Policy.
EEA, 2018. Energy intensity — European Environment Agency [WWW Document].
Ellen MacArthur Foundation, 2015. Growth within: a circular economy vision for a competitive
europe. doi:Article
Esteban, M., Zhang, Q., Utama, A., 2012. Estimation of the energy storage requirement of a
future 100% renewable energy system in Japan. Energy Policy 47, 22–31.
doi:10.1016/j.enpol.2012.03.078
European Commission, 2018a. European Council conclusions on Jobs, Growth and
Competitiveness, as well as some of the other items (Paris Agreement and Digital Europe).
European Commission, 2018b. Energy modelling [WWW Document].
European Commission, 2018c. Energy efficiency first: Commission welcomes agreement on
energy efficiency [WWW Document]. URL http://europa.eu/rapid/press-
release_STATEMENT-18-3997_en.htm (accessed 9.11.18).
European Commission, 2017a. Europe’s energy transition is well underway - European
Commission.
European Commission, 2017b. Second Report on the State of the Energy Union Commission Staff
Workng Document Monitoring progress towards the Energy Union objectives – key
indicators.
European Commission, 2017c. Proposal for a directive of the European Parliament and of the
council on the promotion of the use of energy from renewable sources (recast) 0382 (COD),
1–116.
European Commission, 2016a. Clean Energy For All Europeans. Commun. from Comm. to Eur.
Parliam. Counc. Eur. Econ. Soc. Comm. Comm. Reg. COM(2016).
European Commission, 2016b. Proposal for a directive of the European Parliament and of the
Council amending Directive 2012/27/EU on Energy Efficiency. Brussels.
European Commission, 2014. European Energy Security Strategy, Communication from the
Commission to the European Parliament and the Council. Brussels. doi:10.1007/978-3-531-
19201-7
European Commission, 2012. Energy Roadmap 2050. doi:10.2833/10759

Report on the Quality Check of the Robustness of the Narrative behind Energy Directives
European Commission, 2010a. COM(2010) 2020 final, Europe 2020: A strategy for smart,
sustainable and inclusive growth — European Environment Agency.
European Commission, 2010b. A strategy for smart, sustainable and inclusive growth.
COM(2010) 2020 final.
European Environment Agency, 2018. Energy Intensity. Has there been absolute decoupling of
economic growth from energy consumption in Europe? [WWW Document].
European Environment Agency, 2010. EU greenhouse gas emissions: more than half way to the
‘20 % target by 2020’’’ 3.
European Parliament, 2018. REPORT on the proposal for a directive of the European Parliament
and of the Council on common rules for the internal market in electricity (recast) - Ordinary
legislative procedure (first reading).
European Parliament, 2012. Directive 2012/27/EU of the European Parliament and of the
Council of 25 October 2012 on energy efficiency. Off. J. Eur. Union Dir. 1–56.
doi:10.3000/19770677.L_2012.315.eng
European Union, 2012. Consolidated versions of the Treaty on European Union and the Treaty
on the Functioning of the European Union.
Eurostat, 2018. Greenhouse gas emission statistics - emission inventories.
Eurostat, 2016. Greenhouse gas emissions per capita (t2020 rd300). [WWW Document]. URL
http://appsso.eurostat.ec.europa.eu/nui/show.do?dataset=t2020_rd300&lang=en
(accessed 10.31.18).
Eurostat, 2012a. National accounts by 64 branches - employment data (nama_nace64_e).
Eurostat, 2012b. Annual detailed enterprise statistics for industry (NACE Rev. 2, B-E)
(sbs_na_ind_r2).
Eurostat, 2012c. Complete energy balances - annual data (nrg_100a).
Eurostat, 2012d. Air emissions accounts by NACE Rev. 2 activity [env_ac_ainah_r2] [WWW
Document]. URL
http://appsso.eurostat.ec.europa.eu/nui/show.do?dataset=env_ac_ainah_r2&lang=en
(accessed 11.14.18).
Fiorito, G., 2013. Can we use the energy intensity indicator to study “decoupling” in modern
economies? J. Clean. Prod. 47, 465–473. doi:10.1016/j.jclepro.2012.12.031
Fournier, V., 2008. Escaping from the economy: the politics of degrowth. Int. J. Sociol. Soc. Policy
28, 528–545. doi:10.1108/01443330810915233
Funtowicz, S.O., Ravetz, J.R., 1994. The worth of a songbird: ecological economics as a post-
normal science. Ecol. Econ. 10, 197–207. doi:10.1016/0921-8009(94)90108-2
Funtowicz, S.O., Ravetz, J.R., 1993. Science for the post-normal age. Futures 25, 739–755.
doi:10.1016/0016-3287(93)90022-L
Georgescu-Roegen, N., 1971. The Entropy Law and the Economic Process. Harvard University
Press.

MAGIC – GA 689669
89
Giampietro, M., 2018. Perception and Representation of the Resource Nexus at the Interface
between Society and the Natural Environment. Sustainability 10, 2545.
doi:10.3390/su10072545
Giampietro, M., Mayumi, K., 2018. Unraveling the Complexity of the Jevons Paradox: The Link
Between Innovation, Efficiency, and Sustainability. Front. Energy Res. 6, 1–13.
doi:10.3389/fenrg.2018.00026
Giampietro, M., Mayumi, K., 2000. Multiple-scale integrated assesment of societal metabolism:
Introducing the approach. Popul. Environ. 22, 109–153. doi:10.1023/A:1026691623300
Giampietro, M., Mayumi, K., Ramos-Martin, J., 2009. Multi-scale integrated analysis of societal
and ecosystem metabolism (MuSIASEM): Theoretical concepts and basic rationale. Energy
34, 313–322. doi:10.1016/j.energy.2008.07.020
Giampietro, M., Mayumi, K., Sorman, A., 2012. The Metabolic Pattern of Societies: Where
Economists Fall Short. Routledge, New York.
Giampietro, M., Ramos-Martin, J., 2005. Multi-scale integrated analysis of sustainability: a
methodological tool to improve the quality of narratives. Int. J. Glob. Environ. Issues 5,
119–141. doi:10.1504/IJGENVI.2005.007989
Giampietro, M., Sorman, A.H., 2012. Are energy statistics useful for making energy scenarios?
Energy 37, 5–17. doi:10.1016/j.energy.2011.08.038
Giampietro M, Velasco-Fernández R, Ripa M, 2017. Characterizing the factors determining
energy efficiency of an economy using the multi-level end use matrix of energy carriers
Deliverable 4.2.
Gimeno-Gutiérrez, M., Lacal-Arántegui, R., 2013. Assessment of the European potential for
pumped hydropower energy storage : A GIS-based assessment of pumped hydropower
storage potential. doi:10.2790/86815
Glaser, M., Krause, G., Ratter, B.M.W., Welp, M., 2008. Human/Nature Interaction in the
Anthropocene: Potential of Social-Ecological Systems Analysis. Epic. Perspect. Sci. Soc.
OEKOM VERLAG, 17(1), pp. 77-80, ISSN 0940-5550.
González-López, R., Giampietro, M., 2017. Multi-Scale Integrated Analysis of Charcoal
Production in Complex Social-Ecological Systems. Front. Environ. Sci. 5, 54.
doi:10.3389/fenvs.2017.00054
Guimarães Pereira, Â., Funtowicz, S. (Eds.), 2015. Science, Philosophy and Sustainability.
Routledge.
Gulati, M., Jacobs, I., Jooste, A., Naidoo, D., Fakir, S., 2013. The Water–energy–food Security
Nexus: Challenges and Opportunities for Food Security in South Africa. Aquat. Procedia 1,
150–164. doi:10.1016/j.aqpro.2013.07.013
Gunderson, L.H., Holling, C.S., 2002. Panarchy : understanding transformations in human and
natural systems. Island Press.
Gupta, S., 2015. Decoupling: a step toward sustainable development with reference to OECD
countries. Int. J. Sustain. Dev. World Ecol. 22, 510–519.
doi:10.1080/13504509.2015.1088485

Report on the Quality Check of the Robustness of the Narrative behind Energy Directives
Hao, H., Mu, Z., Jiang, S., Liu, Z., Zhao, F., Hao, H., Mu, Z., Jiang, S., Liu, Z., Zhao, F., 2017. GHG
Emissions from the Production of Lithium-Ion Batteries for Electric Vehicles in China.
Sustainability 9, 504. doi:10.3390/su9040504
Heller, M.C., Keoleian, G., 2000. Life cycle-based sustainability indicators for assessment of the
U.S. food system. Rep. - Cent. Sustain. Syst. Sch. Nat. Resour. Environ. Univ. Michigan 59
pp.
Hoekstra, A.Y., Hung, P.Q., 2005. Globalisation of water resources: international virtual water
flows in relation to crop trade. Glob. Environ. Chang. 15, 45–56.
doi:10.1016/J.GLOENVCHA.2004.06.004
Hoff, H., 2011. Understanding the nexus : Background paper for the Bonn2011 Nexus
Conference.
Holling, C.S., 2001. Understanding the Complexity of Economic, Ecological, and Social Systems,
Ecosystems. Springer. doi:10.2307/3658800
Holling, C.S., 1998. Two Cultures of Ecology. Conserv. Ecol. 2, art4. doi:10.5751/ES-00045-
020204
International Energy Agency (IEA), World Bank, 2014. Sustainable Energy for All 2013-2014:
Global Tracking Framework Report. Washington, DC: World Bank.
IRENA, 2018. Renewable Power Generation Costs in 2017. IRENA - International Renewable
Energy Agency, International Renewable Energy Agency.
doi:10.1007/SpringerReference_7300
Jasanoff, S., Kim, S.-H., Sang-Hyun Kim, 2015. Dreamscapes of Modernity: Sociotechnical
Imaginaries and the Fabrication of Power. doi:10.1007/s13398-014-0173-7.2
Kenis, A., Lievens, M., 2014. Searching for ‘the political’ in environmental politics. Env. Polit. 23,
531–548. doi:10.1080/09644016.2013.870067
Kondziella, H., Bruckner, T., 2016. Flexibility requirements of renewable energy based electricity
systems - A review of research results and methodologies. Renew. Sustain. Energy Rev. 53,
10–22. doi:10.1016/j.rser.2015.07.199
Konrad, K., 2006. The social dynamics of expectations: The interaction of collective and actor-
specific expectations on electronic commerce and interactive television. Technol. Anal.
Strateg. Manag. 18, 429–444. doi:10.1080/09537320600777192
Kovacic, Z., Spanò, M., Piano, S. Lo, Sorman, A.H., 2018. Finance, energy and the decoupling: an
empirical study. J. Evol. Econ. 28, 565–590. doi:10.1007/s00191-017-0514-8
Lazard, 2017. Lazard’s Levelized Cost of Storage Analysis.
Lazarevic, D., Valve, H., 2017. Narrating expectations for the circular economy: Towards a
common and contested European transition. Energy Res. Soc. Sci. 31, 60–69.
doi:10.1016/J.ERSS.2017.05.006
Lilleholt, L.C., Tiilikainen, K., Rugy, F. de, Poirson, B., Costa, S., Dieschbourg, C., Wiebes, E.,
Matos-Fernandes, J.-P., Leben, J., Ribera, T., Lövin, I., 2018. Joint letter to Commissioner
Miguel Arias Cañete on the Climate ambition of the future EU long-term strategy. 14

MAGIC – GA 689669
91
november.
Lippman, W., 1943. U.S. Foreign Policy: Shield of the Republic. Little, Brown & Co., Boston, MA.
McKinsey Global Institute, 2015. Debt and (Not Much) Deleveraging.
Meyer-Ohlendorf, N., Voß, P., Velten, E., Görlach, B., 2018. EU Greenhouse Gas Emission Budget:
Implications for EU Climate Policies.
Mezősi, A., Szabó, L., Szabó, S., 2018. Cost-efficiency benchmarking of European renewable
electricity support schemes. Renew. Sustain. Energy Rev. 98, 217–226.
doi:10.1016/j.rser.2018.09.001
Moreau, V., Vuille, F., 2018. Decoupling energy use and economic growth: Counter evidence
from structural effects and embodied energy in trade. Appl. Energy 215, 54–62.
doi:10.1016/J.APENERGY.2018.01.044
Polimeni, J.M., Mayumi, K., Giampietro, M., Alcott, B., 2008. The Jevons Paradox and the Myth
of Resource Efficiency Improvements. Earthscan.
Prigogine, I., 1980. From being to becoming. San Fr.
Quah, D., 1997. Increasingly weightless economies. Bank Engl. Quaterly Bull. 49–56.
Rayner, S., 2012. Uncomfortable knowledge: the social construction of ignorance in science and
environmental policy discourses. Econ. Soc. 41, 107–125.
doi:10.1080/03085147.2011.637335
Red Eléctrica de España, 2017. Red Eléctrica de España | Series estadísticas nacionales [WWW
Document]. URL https://www.ree.es/es/estadisticas-del-sistema-electrico-
espanol/series-estadisticas/series-estadisticas-nacionales (accessed 10.31.18).
Ringler, C., Bhaduri, A., Lawford, R., 2013. The nexus across water, energy, land and food (WELF):
Potential for improved resource use efficiency? Curr. Opin. Environ. Sustain. 5, 617–624.
doi:10.1016/j.cosust.2013.11.002
Saltelli, A., Giampietro, M., 2016. What is wrong with evidence based policy ? 1 . Science advice
at times of crises. Futures 1–24.
Sorrell, S., 2009. The Evidence for Direct Rebound Effects, in: Energy Efficiency and Sustainable
Consumption. Palgrave Macmillan UK, London, pp. 23–46. doi:10.1057/9780230583108_2
Steinberger, J.K., Roberts, J.T., 2010. From constraint to sufficiency: The decoupling of energy
and carbon from human needs, 1975–2005. Ecol. Econ. 70, 425–433.
doi:10.1016/J.ECOLECON.2010.09.014
Steinhart, J.S., Steinhart, C.E., 1974. Energy Use in the U.S. Food System. Science (80-. ). 184,
307–316.
Steinke, F., Wolfrum, P., Hoffmann, C., 2013. Grid vs. storage in a 100% renewable Europe.
Renew. Energy 50, 826–832. doi:10.1016/j.renene.2012.07.044
Tang, X., Snowden, S., Höök, M., 2013. Analysis of energy embodied in the international trade
of UK. Energy Policy 57, 418–428. doi:10.1016/J.ENPOL.2013.02.009
Treloar, G.J., 1998. A Comprehensive Embodied Energy Analysis Framework.

Report on the Quality Check of the Robustness of the Narrative behind Energy Directives
United Nations, 2017. World Population Prospects - Population Division - United Nations [WWW
Document].
United Nations Environment Programme, 2011. Decoupling natural resource use and
environmental impacts from economic growth. United Nations Environment Programme.
Veblen, T., 1899. The Theory of the Leisure Class. J. Polit. Econ. 7, 425–455. doi:10.1086/250610
Velasco-Fernández, R., Giampietro, M., Bukkens, S.G.F., 2018a. Analyzing the energy
performance of manufacturing across levels using the end-use matrix. Energy 161, 559–
572. doi:10.1016/J.ENERGY.2018.07.122
Velasco-Fernández, R., Lei, C., Pérez-Sánchez, L., Mario, G., 2018b. Multi-scale integrated
comparison of the metabolic pattern of EU28 and China in time. Available at
http://www.euforie-h2020.eu.
Velasco-Fernández, R., Ramos-Martín, J., Giampietro, M., 2015. The energy metabolism of China
and India between 1971 and 2010: Studying the bifurcation. Renew. Sustain. Energy Rev.
41, 1052–1066. doi:10.1016/j.rser.2014.08.065
Vonnegut, K., 1963. Cat’s Cradle. Holt, Rinehart and Winston.
Wang, Q., Li, R., Liao, H., 2016. Toward Decoupling: Growing GDP without Growing Carbon
Emissions. Environ. Sci. Technol. 50, 11435–11436. doi:10.1021/acs.est.6b05150
Weber, C.L., Matthews, H.S., 2007. Embodied environmental emissions in U.S. international
trade, 1997-2004. Environ. Sci. Technol. 41, 4875–4881. doi:10.1021/es0629110
Wolfers, A., 2016. " National Security " as an Ambiguous Symbol Linked references are available
on JSTOR for this article : POLITICAL SCIENCE 67, 481–502.
Wynne, B., Felt, U., 2007. Taking European Knowledge Society Seriously.