May 2005 Hibiscos Coast, Royal Forest and Bird Protecton Society Newsletter

EUROPEAN COMMISSION
REPORT ON THE MONITORINGREPORT ON THE MONITORINGAND TESTING OF RUMINANTS
FOR THE PRESENCE OF TRANSMISSIBLESPONGIFORM ENCEPHALOPATHY (TSE)
IN THE EU IN 2003,INCLUDING THE RESULTS OF THE SURVEY
OF PRION PROTEIN GENOTYPES IN SHEEP BREEDS
ISSN 1725-583XISSN 1725-583X

Further information on the Health and Consumer Protecton Directorate-General is available on the Internet at : http://europa.eu.int/comm/dgs/health_consumer/index_en.htm Additional information on BSE is available on the website at : http://europa.eu.int/comm/food/fs/bse/index_en.html ISBN 92-894-7431-9 © European Communities, 2004 Reproduction is authorised provided the source is acknowledged

EUROPEAN COMMISSION HEALTH & CONSUMER PROTECTION DIRECTORATE-GENERAL Directorate D - Food Safety: production and distribution chain D2 – Biological risks
REPORT ON THE MONITORING AND TESTING OF RUMINANTS
FOR THE PRESENCE OF TRANSMISSIBLE SPONGIFORM ENCEPHALOPATHY (TSE) IN THE EU IN 2003, INCLUDING THE RESULTS OF THE SURVEY OF PRION PROTEIN GENOTYPES IN
SHEEP BREEDS
May 2004 04-D-420525

ii
INTRODUCTION I am delighted to present here the 2003 report on the monitoring and testing of cattle, sheep and goats for the presence of transmissible spongiform encephalopathy (TSE) in the European Union. Since the start of an expanded monitoring programme on bovine spongiform encephalopathy (BSE) in 2001, more than 30 million cattle have been tested, in addition to those tested as BSE suspects. The surveillance involves active monitoring of healthy slaughtered cattle, risk animals such as fallen stock and cattle with an epidemiological link to known BSE cases. It ensures that no BSE cases are slaughtered for human consumption, thus further increasing the safety of beef. In addition, the monitoring provides a reliable insight into the prevalence and evolution of BSE in the Member States. The monitoring programme in 2003 was very similar to the programme in 2002 in the current Member States, allowing comparisons between both years within the same target group (e.g. healthy slaughtered cattle) and within the same age group. Overall, the BSE situation has improved considerably, showing the effect of measures taken in the past. However, given the long incubation period of BSE it will take many years still before we can hope for a complete eradication of BSE. The report furthermore summarises the results of TSE monitoring in small ruminants in 2003 and of the survey of prion protein genotypes in sheep breeds. The report is based on information submitted voluntarily by the Member States on a monthly basis. I am particularly pleased that even in 2003 25 countries reported the results of their active monitoring. An increasing number of tests were performed in 2003 in the new Member States. I would like to thank all Member States for making this report possible. Our combined efforts have enhanced the understanding of the epidemiology of TSEs. They also provide a solid basis for the determination of the future direction of our policies to protect animal and human health. I hope that this report will provide useful data to all interested parties.
R. Madelin Director-General

iii
TABLE OF CONTENTS p.
List of acronyms iv
1. Summary 1
2. Monitoring programmes, sampling and test methods 2
2.1 Legal basis 2
2.2 BSE Monitoring of bovine animals 2
2.3 TSE Monitoring of ovine and caprine animals 4
2.4 Sampling and testing for TSE monitoring 4
2.5 Genotyping of ovine animals 4
2.6 Sampling and testing for the prion protein genotype 4
3. Reports forwarded to the Commission 5
4. BSE testing in bovine animals during 2003 8
4.1 Sampling 8
4.2 Positive cases 11
4.3 Testing by target group 18
4.4 Age distribution of the positive cases 23
4.5 Year of birth distribution in cases detected since 2001 33
4.6 Prevalence of BSE in different age categories 36
4.7 BSE in young cattle 51
5. TSE testing and prion protein genotyping in ovine and caprine animals during 2003 57
5.1 Sampling 57
5.2 Positive cases 58
5.3 Testing by target group 61
5.4 Year of birth and age distribution of the positive cases 66
5.5 Genotyping 69
5.5.1 Genotypes of confirmed TSE cases 69
5.5.2 Genotypes in random sampled ovine animals 72
5.5.3 Susceptibility 73
5.5.4 Genotyping and TSE testing in culled ovine animals 73
5.5.5 Distribution of genotypes in pure breeds 74
Appendix: Results of the survey of prion protein genotypes of pure sheep breeds 80

iv
LIST OF ACRONYMS AM : Ante-mortem inspection BSE : Bovine spongiform encephalopathy DNA : Deoxyribonucleic acid
EU15 : The 15 countries, member of the European Union before 1 May 2004
EU15-UK : The EU15 except the United Kingdom
EU25 : The 25 countries, member of the European Union since 1 May 2004
EU25-UK : The EU25 except the United Kingdom
MIO : Million
MS: Member States the European Union Na: not available nMS : The 10 countries, new Members of the European Union from 1 May 2004 on
NSP : National scrapie plan OTM : Over thirty months
TSE: Transmissible spongiform encephalopathy
See also list of ISO codes for countries on page 5.

1
1. SUMMARY In 2003, a total of 10.041.295 bovine, 488.119 ovine and 63.022 caprine animals were tested in the EU15 in the framework of the TSE monitoring programme. 1.364 bovine, 1.787 ovine and 46 caprine animals turned out positive. The positive cases in bovine animals were considered as BSE cases, while those in ovine and caprine animals as scrapie. 1.295.769 risk bovine animals and 8.716.481 healthy animals slaughtered for human consumption were tested by rapid tests. 2.578 bovine animals were tested in the framework of passive surveillance (animals reported as BSE suspects by the farmer or the veterinary practitioner and subject to laboratory examination). In addition, 24.966 animals were tested in the framework of culling of animals with an epidemiological connection to a BSE case. 78% of positive cases were detected by the active monitoring (testing of risk animals, healthy slaughtered and culled cattle) and 22% were detected by passive surveillance. BSE cases were found in all Member States except Austria, Greece, Luxembourg, Finland and Sweden. The number of BSE cases and the overall prevalence in tested animals decreased by respectively 36% and 34% in 2003 compared to 2002. The most significant decrease was in risk animals. The number of cases in animals tested below 60 months decreased by 32%. These reductions and the increasing age of positive cases indicate that measures taken in the past are having some effect.
486.822 ovine animals were tested by active monitoring, while 1.297 were animals reported as scrapie suspects and therefore subjected to laboratory examination. In caprine animals, the numbers of tests in the respective groups were 62.957 (active monitoring) and 65 (scrapie suspects). The information on the genotypes of TSE positive, random sampled and pure-bred ovine animals is a major tool to decide how to progress in TSE eradication programs in these animals.
In addition, information was forwarded to the Commission on TSE testing of 945.042 bovine animals in the 10 new Member States and of 7.754 TSE tests in ovine and caprine animals in the Czech and Slovak Republic. BSE cases were detected in Poland, the Slovak Republic, the Czech Republic and Slovenia. Furthermore, Norway forwarded information on the TSE testing of bovine, ovine and caprine animals.
Further information: Health and Consumer Protection Directorate-General, Unit D2; fax: +32-2-296.90.62; e-mail: [email protected]

2
2. MONITORING PROGRAMMES, SAMPLING AND TEST METHODS 2.1 LEGAL BASIS During the year 2003, the legal framework for the monitoring of ruminants for the presence of TSE was laid down in Chapter A of Annex III in Regulation (EC) No 999/20011 of the European Parliament and of the Council laying down rules for the prevention, control and eradication of certain transmissible spongiform encephalopathies (the TSE Regulation), as amended by Commission Regulation (EC) No 1494/20022. Amendments to the monitoring of small ruminants in Chapter A, applicable from 1 October 2003 on, were introduced by Commission Regulation (EC) No 1139/20033. The EU legislation on TSE monitoring is summarised in Table 1. The legal basis for the sample collection and for the test methods was Chapter C of Annex X in Regulation (EC) No 999/2001. Finally, the legal basis for the survey of prion protein genotypes of TSE cases in sheep, of random sampled sheep and of pure sheep breeds are points 7.1 and 7.2 to Chapter A in Annex III of the TSE Regulation, and Article 2 of Commission Decision 2002/1003/EC4 respectively. 2.2 BSE MONITORING OF BOVINE ANIMALS
The monitoring of bovine animals for the presence of BSE was divided into the following target groups:
(1) Fallen stock: Bovine animals which have died or have been killed on the farm or in transport, but not slaughtered for human consumption nor killed in the framework of an epidemic. Member States may decide to derogate from this provision in remote areas with a low animal density, where no collection of dead animals is organised. The derogation shall not cover more than 10% of the bovine population in the Member State.
(2) Emergency slaughtered animals: Bovine animals subject to “Special emergency
slaughtering” as defined in Article 2 of Council Directive 64/433/EEC5 as amended. (3) Animals with clinical signs at AM: Bovine animals sent for normal slaughter but the
slaughter of which was deferred because they were:
(a) suspected of suffering from a disease which is communicable to man and to animals or showing symptoms or being in a general condition such as to indicate that such a disease may occur.
(b) Showing symptoms of a disease or of a disorder of their general conditions which
is likely to make their meat unfit for human consumption. (as referred to in Directive 64/433/EEC, Annex I, Chapter VI, points 27-28)
1 OJ L 147, 31.5.2001, p 1. 2 OJ L 225, 22.8.2002, p 3. 3 OJ L 160, 28.6.2003, p. 22 4 OJ L 41, 14.2.2003, p. 41 5 OJ L 121, 29.7.1964, p. 2012

3
(4) Healthy slaughtered animals: Bovine animals subject to normal slaughter for human consumption and animals without clinical signs of disease slaughtered in the context of a disease eradication campaign other than BSE. Sweden was allowed to test only a random sample.
(5) Animals culled under BSE eradication: birth cohorts (bovine cattle born in a herd
within 1 year before or after the birth of a BSE case), rearing cohorts (bovine animals reared together with a BSE case during the first year of their life), offspring and any other bovine animals killed because of an epidemiological link to a BSE case.
(6) Suspects subject to laboratory examination: Bovine animals reported as suspects of TSE
as defined in Article 3(h) of Regulation 999/2001 and subject to the measures described in Articles 12 and 13 of this Regulation.
In the United Kingdom, bovine animals over 30 months (OTM) were purchased for destruction pursuant to Regulation 716/961. All these animals were tested if subject to emergency slaughter or showing clinical signs of any disease at ante-mortem. In addition, a part of the healthy slaughtered animals were tested (see Table 1). Table 1: Summary of the EU legislation on TSE monitoring in 2003
EU15 Except SV and UK SV UK
Legal provisions Regulation (CE) No 999/2001 as amended
Regulation (CE) No 999/2001 as amended
Regulation (CE) No 999/2001 as amended Regulation (CE) No 716/96.
Bovine animals Special emergency slaughter
All > 24 months
Clinical signs at ante-mortem inspection
All > 24 months
Fallen stock All > 24 months
Animals slaughtered for human consumption
All >30 months Random sample
comprising at least 10.000 animals >30 months
All > 30 months
BSE suspects All All All
Other
Animals slaughtered under the OTM scheme All animals >30 months subject to “special emergency slaughter” ,with clinical signs at ante-mortem or born after 1/8/96 and > 42 months old Random sample comprising at least 10.000 animals of remaining animals (born before 1/8/96).
Ovine and caprine animals Animals slaughtered for human consumption
Minimal sample size in ovine and caprine animals > 18 months
Animals not slaughtered for human consumption
Minimal sample size in ovine and caprine animals > 18 months
Animals in infected flocks (voluntary until 1 October 2003)
Minimal sample size in ovine and caprine animals > 12 months or which have a permanent incisor erupted though the gum
Other than bovine, ovine and caprine animals: voluntary
1 OJ L 99. 20.04.1996, p. 14

4
2.3 TSE MONITORING OF OVINE AND CAPRINE ANIMALS
The testing of ovine and caprine animals for the presence of TSE was divided into the following target groups: (1) Healthy animals over 18 months of age which are slaughtered for human consumption . (2) Risk animals containing almost exclusively fallen stock, with a few emergency slaughtered
animals and animals with clinical signs at AM which have died or been killed, but which were not killed in the framework of an epidemic or slaughtered for human consumption.
(3) Animals culled under scrapie eradication. The testing of a minimum random sampled number
of these animals became mandatory from 1 October 2003 on by Commission Regulation (EC) No 1139/2003 amending Regulation (EC) No 999/2001.
(4) Scrapie suspects subject to laboratory examination. In Portugal, animals slaughtered in the context of a disease eradication campaign were also monitored and included in the total figures but not added to one of the above target groups. 2.4 SAMPLING AND TESTING FOR TSE MONITORING
Samples collected in the context of active monitoring (risk animals, healthy slaughtered animals and animals culled in the framework of TSE eradication) were screened by one of the three (until July 2003) or five (from July 2003 on) approved rapid tests. Confirmation tests from inconclusive or positive results in the active monitoring and analysis of samples from suspects were performed by histopathology or, if appropriate, by immunocytochemistry, immunoblotting or by demonstration of characteristic fibrils by electron microscopy. 2.5 GENOTYPING OF OVINE ANIMALS
The genotyping of ovine animals was conducted under the following categories: (1) TSE positive animals. (2) The crossbreed survey – a random sample selected from the healthy animals over 18 months of
age slaughtered for human consumption or live animals of a similar age. (3) The purebred survey – a representative sample of ovine animals from each breed, drawn from
flocks of high genetic merit. This report also represents the summary of reports referred to in Article 4 of Commission Decision 2002/1003/EC.
2.6 SAMPLING AND TESTING FOR THE PRION PROTEIN GENOTYPE The alleles were defined by reference to the amino acids encoded by codons 136, 154 and 171 of the prion protein gene. Routine methods for the collection of samples and DNA genotyping were used.

5
3. REPORTS FORWARDED TO THE COMMISSION The Commission invited the Member States of the EU25 in the Standing Committee on the Food Chain and Animal Health to provide monthly data on TSE testing on a voluntary basis. The names of the Member States are quoted in this report in their own language.
Name ISO Code English Français Deutsch Member States of the EU15
Belgique/België BE Belgium Belgique Belgien Danmark DK Denmark Danemark Dänemark Deutschland DE Germany Allemagne Deutschland Ellas EL Greece Grèce Griechenland España ES Spain Espagne Spanien France FR France France Frankreich Ireland IE Ireland Irelande Irland Italia IT Italy Italie Italien Luxembourg LU Luxembourg Luxembourg Luxemburg Nederland NL Netherlands Pays-Bas Niederlande Österreich AT Austria Autriche Österreich Portugal PT Portugal Portugal Portugal Suomi/Finland FI Finland Finlande Finnland Sverige SV Sweden Suède Schweden United Kingdom UK United Kingdom Royaume-Uni Vereinigtes Königreich
New Member States (nMS) Česká Republiká CZ Czech Republic République tchèque Tschechische Republik Eesti EE Estonia Estonie Estland Kypros CY Cyprus Chypre Zypern Latvija LV Latvia Lettonie Lettland Lietuva LT Lithuania Lituanie Litauen Magyarország HU Hungary Hongrie Ungarn Malta MT Malta Malte Malta Polska PL Poland Pologne Polen Slovenija SI Slovenia Slovénie Slowenien Slovenská Republika SK Slovak Republic Républic Slovaque Slowakische Republik
In addition, Norway (NO) forwarded monthly reports. The Commission requested, per species, information on:
1. Positive cases detected during the reporting period: month of birth, target group, diagnostic method used for screening and diagnostic method used for confirmation.
2. Monitoring carried out during the reporting period: number of samples, number of positive results, number of negative results, number of tests pending and age limit for each target group.
3. The results of the epidemiological investigation in BSE cases born after 1 January 1996.
4. Genotypes of confirmed TSE cases in ovine animals and of random sampled and culled ovine animals. Reporting of the genotype survey in sheep breeds was mandatory in the Member States of the EU15 in accordance with Article 3 of Commission Decision 2002/1003/EC.

6
The above-mentioned target groups were divided into the following categories: (1) Bovine animals:
(a) Active Monitoring – Fallen stock – Emergency slaughter – Animals with clinical signs at AM – Healthy slaughtered animals – Animals culled in connection to a BSE case. Fallen stock, emergency slaughtered animals and animals with clinical signs at ante-mortem inspection are considered as “risk animals”.
(b) Passive Surveillance Animals reported as BSE suspects by the farmer or the veterinary practitioner and subject to laboratory examination.
The age limits used in testing different target groups of bovine animals are summarised in Table 2. Table 2: Age limits used in sampling of bovine animals
Age limit
Fallen Stock Emergency slaughtered
Clinical signs at AM
Healthy slaughtered BSE culling BSE suspects
Belgique/belgïë > 24 months1 > 24 months1 > 12 months > 30 months1 > 24 months No age limit Danmark > 24 months > 30 months > 24 months No age limit Deutschland Compulsory testing > 24 months, voluntary testing < 24 months No age limit No age limit Ellas > 24 months > 24 months No age limit > 30 months No age limit No age limit España > 24 months No age limit No age limit France > 24 months No age limit Ireland > 24 months > 30 months > 30 months No age limit Italia > 24 months No age limit No age limit Luxembourg > 24 months > 30 months > 24 months No age limit Nederland > 24 months > 30 months No age limit No age limit Österreich > 24 months1 > 24 months1 > 24 months > 30 months1 No age limit No age limit Portugal > 24 months > 30 months > 30 months No age limit Suomi/Finland > 24 months > 30 months No age limit No age limit Sverige > 24 months > 30 months No age limit No age limit United Kingdom > 24 months > 30 months No age limit No age limit Česká Republic > 24 months > 30 months No age limit No age limit Eesti > 24 months > 30 months No age limit No age limit Kypros > 24 months > 30 months No age limit No age limit Latvija > 24 months > 30 months No age limit No age limit Lietuva > 24 months > 30 months No age limit No age limit Magyarország > 24 months > 30 months No age limit No age limit Malta > 24 months > 30 months No age limit No age limit Polska > 24 months > 30 months No age limit No age limit Slovenija > 24 months > 24 months No age limit No age limit Slovenská Rep. > 24 months > 30 months No age limit No age limit Norway > 24 months > 30 months No age limit No age limit
1 A limited number of samples were collected in younger bovine animals.

7
(2) Ovine and caprine animals
(a) Active Monitoring – Risk animals containing almost exclusively fallen stock with a few tests in
emergency slaughtered animals and animals with clinical signs at AM; – Healthy slaughtered animals; – Animals culled in a herd where an animal has been declared TSE positive.
(b) Passive Surveillance Animals reported as scrapie suspects by the farmer or the veterinary practitioner and subject to laboratory examination.
At the end of 2003, the Commission invited the Member States to provide data on a voluntary basis on the age structure of the tested bovine animals, separated per semester and per target group. All this information has been introduced and processed in a database in order to summarise the information provided and to elaborate summary tables to be distributed within the Commission and to the Member States and Norway.

8
4. SUMMARY OF THE BSE TESTING IN BOVINE ANIMALS DURING 2003 The information was extracted directly from the monthly reports. The monthly information is often updated and/or corrected by the Member States in the following reports. The information shown in the following summaries is updated according to the information received on 1 May 2004. Information on the population was obtained from Eurostat. The mean population of bovine animals of 2 years and over in June and December 2003 were considered as the mean adult population in 2003. 4.1 SAMPLING
Table 3: Total tests performed in 2003 per Member State and target group Number of tests performed BSE Clinical signs Emergency Fallen Healthy BSE Total culling ad AM Slaughter Stock Slaughter suspects Belgique/België 1.126 83 1.214 33.691 356.184 167 392.465 Danmark 1.774 17 1.739 35.576 250.558 38 289.702 Deutschland 1.125 3.254 5.679 240.556 2.337.605 854 2.589.073 Ellas 0 74 127 1.798 24.533 1 26.533 España 2.356 1.810 1.457 90.916 471.252 73 567.864 France 1.669 0 0 283.695 2.920.157 442 3.205.963 Ireland 11.986 0 2.483 84.954 600.586 330 700.339 Italia 2.148 54.674 5.217 64.159 658.770 63 786.506 Luxembourg 2 0 27 3.083 14.598 4 17.714 Nederland 954 14.043 1.375 50.525 439.403 25 506.325 Österreich 0 0 3.755 13.235 205.658 2 222.650 Portugal 1.271 5.521 1.562 19.310 81.633 102 109.399 Suomi/Finland 0 4.216 8.087 10.899 108.198 5 131.430 Sverige 0 0 2.229 22.479 9.856 16 34.580 United Kingdom 555 18 145.651 76.582 237.490 456 460.752 Total EU15 24.966 83.710 180.602 1.031.458 8.716.481 2.578 10.041.295 Česká Republika 706 156 43.640 32.635 133.046 1 210.184 Eesti 0 0 1.549 2.415 19 0 3.983 Kypros 0 22 135 1.168 6.401 0 7.726 Latvija 0 0 263 1.014 4.838 11 6.126 Lietuva 0 28 113 2.187 7.418 0 9.746 Magyarorzág 0 0 4.263 6.532 86.595 98 97.488 Malta* 0 0 40 70 1.089 0 1.199 Polska 37 59 9.401 17.413 428.452 51 455.413 Slovenija 27 2.866 399 8.092 54.751 32 66.167 Slovenská Republika 11 75 8.269 13.461 65.192 2 87.010 New Member States 781 3.206 68.072 84.987 787.801 195 945.042 Norway 0 4.102 7.322 1.872 10.726 2 24.024 Total EU25 25.747 86.916 248.674 1.116.445 9.504.282 2.773 10.986.337
* March until September

9
Table 4: Active monitoring in relation to the adult population ≥ 2 years of age) Adult cattle Risk animals Healthy Slaughtered (x1000)* No. Tests % tests/adult cattle No. Tests % tests/adult cattle Belgique/België 1.424 34.988 2,46% 356.184 25,0% Danmark 834 37.332 4,48% 250.558 30,0% Deutschland 6.170 249.489 4,04% 2.337.605 37,9% Ellas 325 1.999 0,62% 24.533 7,5% España 3.530 94.183 2,67% 471.252 13,3% France 10.817 283.695 2,62% 2.920.157 27,0% Ireland 3.220 87.437 2,72% 600.586 18,7% Italia 2.966 124.050 4,18% 658.770 22,2% Luxembourg 95 3.110 3,27% 14.598 15,4% Nederland 1.770 65.943 3,73% 439.403 24,8% Österreich 969 16.990 1,75% 205.658 21,2% Portugal 779 26.393 3,39% 81.633 10,5% Suomi/Finland 396 23.202 5,86% 108.198 27,3% Sverige 678 24.708 3,64% 9.856 1,5% United Kingdom 4.919 222.251 4,52% 237.490 4,8% Total EU15 38.892 1.295.770 3,33% 8.716.481 22,4% Česká Republika 683 76.431 11,19% 133.046 19,5% Eesti 129 3.964 3,07% 19 0,01% Kypros 27 1.325 4,91% 6.401 23,7% Latvija 203 1.277 0,63% 4.838 2,4% Lietuva 491 2.328 0,47% 7.418 1,5% Magyarorzág 404 10.795 2,67% 86.595 21,4% Malta** 8 110 1,38% 1.089 13,6% Polska 3175 26.873 0,85% 428.452 13,5% Slovenija 214 11.357 5,31% 54.751 25,6% Slovenská Rep. 287 21.805 7,60% 65.192 22,7% nMS 5621 156.265 2,78% 787.801 14,0% Norway 404 13.296 3,29% 10.726 2,7% Total EU25 44.513 1.452.035 3,26% 9.504.282 21,4%
* Eurostat: mean of May-June and December 2003 ** March until September

10
Table 5: Comparative active monitoring 2003 versus 2002 Healthy Slaughtered Risk animals Total active monitoring 2002 2003 ∆ 2002 2003 ∆ 2002 2003 ∆ Belgique/België 408.934 356.184 -13% 37.929 34.988 -8% 450.140 392.298 -13% Danmark 254.668 250.558 -2% 35.995 37.332 4% 293.303 289.664 -1% Deutschland 2.767.958 2.337.605 -16% 259.612 249.489 -4% 3.030.196 2.588.219 -15% Ellas 21.457 24.533 14% 2.256 1.999 -11% 23.735 26.532 12% España 454.132 471.252 4% 86.380 94.183 9% 545.985 567.791 4% France 2.896.182 2.920.157 1% 271.727 283.695 4% 3.183.790 3.205.521 1% Ireland 610.002 600.586 -2% 78.372 87.437 12% 707.033 700.009 -1% Italia 623.913 658.770 6% 103.539 124.050 20% 731.486 786.443 8% Luxembourg 16.443 14.598 -11% 1.941 3.110 60% 18.384 17.710 -4% Nederland 491.069 439.403 -11% 64.321 65.943 3% 558.390 506.300 -9% Österreich 215.075 205.658 -4% 13.564 16.990 25% 228.639 222.648 -3% Portugal 66.721 81.633 22% 14.193 26.393 86% 82.077 109.297 33% Suomi/Finland 114.669 108.198 -6% 22.333 23.202 4% 137.002 131.425 -4% Sverige 12.073 9.856 -18% 25.398 24.708 -3% 37.471 34.564 -8% United Kingdom 170.907 237.490 39% 221.054 222.251 1% 392.906 460.296 17%
Total EU 15 9.126.205 8.716.481 -4% 1.240.616 1.295.770 4% 10.424.541 10.038.717 -4%
Comments on the sampling The monitoring programme carried out in 2003 was similar to the programme carried out in 2002. Therefore the differences in the number of tests in different target groups are minor. Almost 30 million cattle have been tested by active monitoring in the EU15 since 2001. The percentage of tested risk animals and healthy slaughtered cattle compared to the adult population (Table 4) should be interpreted with caution as certain Member States were running different monitoring programmes (only random sampling in Sweden, the purchase for destruction scheme of healthy slaughtered cattle in the UK without obligatory testing), as additional voluntary testing of younger cattle occurred in certain Member States and as there may be a difference in risk animals, including fallen stock, per year in relation to the population because of different production systems. The increased effort of certain Member States in 2003 compared to 2002 to monitor risk animals (see Table 5) and the efforts of new Member States to carry out active monitoring are appreciated.

11
4.2
POSI
TIV
E C
ASE
S T
able
6:
Evo
lutio
n of
pos
itive
cas
es w
orld
-wid
e si
nce
BSE
was
rec
ogni
sed
Cou
ntry
<
1988
19
88
1989
19
9019
9119
9219
9319
9419
95
1996
1997
1998
1999
2000
2001
2002
2003
T
otal
B
elgi
que/
Bel
gië
0 0
0 0
0 0
0 0
0 0
1 6
3 9
46
38
15
118
Dan
mar
k 0
0 0
0 0
1(a)
0 0
0 0
0 0
0 1
6 3
2 13
D
euts
chla
nd
0 0
0 0
0 1(a
) 0
3(a)
0 0
2(a)
0 0
7 12
5 10
6 54
29
8 El
las
0 0
0 0
0 0
0 0
0 0
0 0
0 0
1 0
0 1
Espa
ña
0 0
0 0
0 0
0 0
0 0
0 0
0 2
82
134
173
391
Fran
ce
0 0
0 0
5 0
1 4
3 12
6
18
31(b
) 16
2 27
7 24
0 13
8 89
7 Ir
elan
d 0
0 15
(b)
14(b
) 17
(b)
18(b
) 16
19
(b)
16(b
) 74
80
83
95
14
9 24
6 33
3 18
5 1.
360
Italia
0
0 0
0 0
0 0
2(a)
0 0
0 0
0 0
50
36(b
) 31
11
9 Lu
xem
bour
g 0
0 0
0 0
0 0
0 0
0 1
0 0
0 0
1 0
2 N
eder
land
0
0 0
0 0
0 0
0 0
0 2
2 2
2 20
24
19
71
Ö
ster
reic
h 0
0 0
0 0
0 0
0 0
0 0
0 0
0 1
0 0
1 Po
rtuga
l 0
0 0
1(a)
1(a)
1(a)
3(a)
12
15
31
30
127
159
150(b
) 11
3 86
(b)
133(b
) 86
2 Su
omi/F
inla
nd
0 0
0 0
0 0
0 0
0 0
0 0
0 0
1 0
0 1
Tot
al E
U15
- UK
0
0 15
15
23
21
20
40
34
11
7 12
2 23
6 29
0 48
2 96
8 1.
001
750
4.13
4 U
nite
d K
ingd
om
442
2.47
3 7.
166
14.2
94
25.2
02
37.0
56
34.8
29
24.2
90
14.4
75
8.09
0 4.
335
3.19
7 2.
281
1.42
8 1.
194
1.13
0 61
4 18
2.49
5 T
otal
EU
15
442
2.47
3 7.
181
14.3
09
25.2
25
37.0
77
34.8
49
24.3
30
14.5
09
8.20
7 4.
457
3.43
3 2.
571
1.91
0 2.
162
2.13
1 1.
364
186.
630
Ces
ká R
epub
lika
0 0
0 0
0 0
0 0
0 0
0 0
0 0
2 2
4 8
Pols
ka
0 0
0 0
0 0
0 0
0 0
0 0
0 0
0 4
5 9
Slov
enija
0
0 0
0 0
0 0
0 0
0 0
0 0
0 1
1 1
3 Sl
oven
ská
Rep
. 0
0 0
0 0
0 0
0 0
0 0
0 0
0 5
6 2
13
Tot
al n
MS
0 0
0 0
0 0
0 0
0 0
0 0
0 0
8 13
12
33
Is
land
of M
an
0 6
6 22
67
10
9 11
1 55
33
11
9
5 3
0 0
0 0
437
Jers
ey
0 1
4 8
15
23
35
22
10
12
5 8
6 0
0 0
0 14
9 G
uern
esey
4
34
52
83
75
92
115
69
44
36
44
25
11
13
2 0
0 69
9 Sw
itser
land
0
0 0
2 8
15
29
64
68
45
38
14
50
33
42
24
21
453
Res
t of t
he w
orld
0
0 3(a
) 0
0 0
1(a)
0 0
0 0
2(a)
0 0
3 3
6 18
T
otal
wor
ld
446
2.51
4 7.
246
14.4
24
25.3
90
37.3
16
35.1
40
24.5
40
14.6
64
8.31
1 4.
553
3.48
7 2.
641
1.95
6 2.
217
2.17
1 1.
403
188.
419
Sour
ces:
<19
97: O
IE;
From
199
7: S
yste
mat
ic n
otifi
catio
n of
ani
mal
dis
ease
s by
MS,
com
plet
ed b
y m
onth
ly re
ports
of t
he U
K a
nd P
ortu
gal a
nd, s
ince
200
1, o
f the
oth
er M
S; w
ebsi
tes o
f the
com
pete
nt n
atio
nal a
utho
ritie
s and
th
e O
IE.
(a) A
ll im
porte
d ca
ses.
(b) In
clud
ing
impo
rted
case
s: Ir
elan
d: 1
in 1
990,
in 1
994
and
in 1
995,
2 in
199
1 an
d 19
92, 5
in 1
989;
Fra
nce:
1 in
199
9; P
ortu
gal:
1 in
200
0, 2
002
and
2003
; Ita
ly: 1
in 2
002.

12
Cha
rt 1
: Evo
lutio
n of
BSE
det
ecte
d by
pas
sive
surv
eilla
nce
and
activ
e m
onito
ring
in th
e U
K
0
5.00
0
10.0
00
15.0
00
20.0
00
25.0
00
30.0
00
35.0
00
40.0
00
<19
8819
8819
8919
9019
9119
9219
9319
9419
9519
9619
9719
9819
9920
0020
0120
0220
03
Act
iveP
assi
ve
0
500
1.00
0
1.50
0
2.00
0
2.50
0 1999
2000
2001
2002
2003

13
Cha
rt 2
: Evo
lutio
n of
BSE
det
ecte
d by
pas
sive
surv
eilla
nce
and
activ
e m
onito
ring
in th
e re
st o
f the
EU
25
0
200
400
600
800
1.00
0
1.20
0 1988
1989
1990
1991
1992
1993
1994
1995
1996
1997
1998
1999
2000
2001
2002
2003
new
MS
tota
lE
U15
-UK
act
iveE
U15
-UK
pas
sive

14
Table 7: Total positive cases per number of cattle tested or present in the adult population (> 24 months of age) Adult cattle Tests Prevalence2 (x1000)* No. Positives Ratio1 Passive Total Surveill. Monit. Belgique/België 1.424 392.465 15 0,38 0,00 10,53 Danmark 834 289.702 2 0,07 1,20 2,40 Deutschland 6.170 2.589.073 54 0,21 1,62 8,75 Ellas 325 26.533 0 0,00 0,00 0,00 España 3.530 567.864 173 3,05 7,08 49,01 France 10.817 3.205.963 138 0,43 1,11 12,76 Ireland 3.220 700.339 185 2,64 12,73 57,45 Italia 2.966 786.506 31 0,39 0,34 10,45 Luxembourg 95 17.714 0 0,00 0,00 0,00 Nederland 1.770 506.325 19 0,38 1,13 10,73 Österreich 969 222.650 0 0,00 0,00 0,00 Portugal 779 109.399 133 12,16 35,94 170,73 Suomi/Finland 396 131.430 0 0,00 0,00 0,00 Sverige 678 34.580 0 0,00 0,00 0,00 United Kingdom 4.919 460.752 614 13,33 37,81 124,82 Total EU 15 38.892 10.041.295 1.364 1,36 7,87 35,07 Česká Republika 683 210.184 4 0,19 0,00 5,86 Eesti 129 3.983 0 0,00 0,00 0,00 Kypros 27 7.726 0 0,00 0,00 0,00 Latvija 203 6.126 0 0,00 0,00 0,00 Lietuva 491 9.746 0 0,00 0,00 0,00 Magyarorzág 404 97.488 0 0,00 0,00 0,00 Malta** 8 1.199 0 0,00 0,00 0,00 Polska 3175 455.413 5 0,11 0,31 1,57 Slovenija 214 66.167 1 0,15 0,00 4,67 Slovenská Rep. 287 87.010 2 0,23 0,00 6,97 nMS 5621 945.042 12 0,13 0,18 2,13 Norway 404 24.024 0 0,00 0,00 0,00 Total EU25 44.513 10.986.337 1.376 1,25 6,90 30,91
1 : Positives per 10.000 bovine animals tested2 : Cases over the last 12 months per 1 Million adult bovine animals * Eurostat: mean of May-June and December 2003
** March until September Map 1: European Countries where positive cases were detected in 2003
Countries with cases Countries without cases and having submitted data on active monitoring Countries without cases and not having submitted data

15
Table 8: Positives in active monitoring and passive surveillance Active monitoring Passive surveillance Percentage of Tests Tests cases detected by No. Positive Ratio* No. Positive Ratio* active monitoring Belgique/België 392.298 15 0,38 167 0 0,0 100% Danmark 289.664 1 0,03 38 1 263,2 50% Deutschland 2.588.219 44 0,17 854 10 117,1 81% Ellas 26.532 0 0,00 1 0 0,0 España 567.791 148 2,61 73 25 3.424,7 86% France 3.205.521 126 0,39 442 12 271,5 91% Ireland 700.009 144 2,06 330 41 1.242,4 78% Italia 786.443 30 0,38 63 1 158,7 97% Luxembourg 17.710 0 0,00 4 0 0,0 Nederland 506.300 17 0,34 25 2 800,0 89% Österreich 222.648 0 0,00 2 0 0,0 Portugal 109.297 105 9,61 102 28 2.745,1 79% Suomi/Finland 131.425 0 0,00 5 0 0,0 Sverige 34.564 0 0,00 16 0 0,0 United Kingdom 460.296 428 9,30 456 186 4.078,9 70% Total EU15 10.038.717 1.058 1,05 2.578 306 1.187,0 78% Česká Republika 210.183 4 0,19 1 0 0,0 100% Eesti 3.983 0 0,00 0 0 Kypros 7.726 0 0,00 0 0 Latvija 6.115 0 0,00 11 0 0,0 Lietuva 9.746 0 0,00 0 0 Magyarorzág 97.390 0 0,00 98 0 0,0 Malta** 1.199 0 0,00 0 0 Polska 455.362 4 0,09 51 1 196,1 80% Slovenija 66.135 1 0,15 32 0 0,0 100% Slovenská Rep. 87.008 2 0,23 2 0 0,0 100% nMS 944.847 11 0,12 195 1 51,3 92% Norway 24.022 0 0,00 2 0 0,0 Total EU25 10.983.564 1.069 0,97 2.773 307 1.107,1 78%
* : Positives per 10.000 bovine animals tested ** March until September
Chart 3: Number of positive cases per month in different target groups in the EU15 in 2003
0
50
100
150
200
No.
of c
ases
BSE culling 0 2 1 0 0 2 0 1 1 1 1 0
Healthy s l. 25 19 22 26 21 16 29 12 18 29 30 19
Suspect 46 24 2 1 28 19 18 33 18 28 18 24 29
Risk animals 91 78 79 85 47 4 2 62 59 68 59 55 56
Jan Feb Mar Apr May Jun Jul Aug Sep t Oct Nov Dec

16
Table 9: Comparison of the number of positive cases and the prevalence in 2003 and 2002 Number of positives Prevalence* 2003 2002 ∆ 2003 2002 ∆ Belgique/België 15 38 -61% 0,38 0,84 -55% Danmark 2 3 -33% 0,07 0,10 -32% Deutschland 54 106 -49% 0,21 0,35 -40% Ellas 0 0 0,00 0,00 España 173 134 29% 3,05 2,45 24% France 138 240 -43% 0,43 0,75 -43% Ireland 185 331 -44% 2,64 4,68 -44% Italia 31 36 -14% 0,39 0,49 -20% Luxembourg 0 1 -100% 0,00 0,54 -100% Nederland 19 24 -21% 0,38 0,43 -13% Österreich 0 0 0,00 0,00 Portugal 133 86 55% 12,16 10,46 16% Suomi/Finland 0 0 0,00 0,00 Sverige 0 0 0,00 0,00 United Kingdom 614 1.130 -46% 13,33 28,65 -53% EU 15-UK 750 999 -25% 0,78 1,00 -21% Total EU 15 1.364 2.129 -36% 1,36 2,04 -34% Česká Republika 4 2 100% 0,19 0,11 67% Polska 5 4 25% 0,11 0,14 -21% Slovenija 1 1 0% 0,15 0,15 -2% Slovenská Rep. 2 6 -67% 0,23 0,90 -74% New MS 12 13 -8% 0,14 0,19 -26% Norway 0 0 0,00 0,00 Total EU 25 1.376 2.142 -36% 1,26 1,93 -35% *: positive cases per 10.000 bovine animals tested
Chart 4: Evolution of positive cases per month since July 2001 in the EU15
050
100150200250300350
No.
of c
ases
2 003 162 123 123 139 87 78 124 90 115 107 110 104
2002 240 235 200 181 158 140 147 152 150 178 183 160
200 1 156 220 253 257 288 224
Jan Feb Mar Apr May Jun Jul Aug Sep t Oct Nov Dec

17
Comments on positive cases When analysing Charts 1 and 2, it should be kept in mind that active monitoring was limited before 2001. The expanded active monitoring became fully applicable in July 2001. The number of tests was about 20% higher in 2002 and 2003 than in 2001. Therefore, the prevalence of BSE is reducing since 2002 despite a higher number of cases detected in 2002 compared to 2001.
The results of UK in Tables 7, 8 and 9 cannot be compared to other Member States because the monitoring programme was not the same. Furthermore in Table 7, the results of Member States using a lower age limit should not be compared with results of Member States using the standard age limit.
Overall the number of cases and the prevalence of BSE dropped respectively by 36% and 33% in the EU15 in 2003 compared to 2002. However, in Spain and Portugal an increase was observed as illustrated in Table 9. Also, a reduction of the number of positive cases was observed during 2003 although a seasonal effect similar to 2002 was observed (Charts 3 and 4).
In Spain, the increased number of positive cases and ratio may be explained by the relatively high number of cases detected in 2003 in young animals born between 1997 and 1998 (see charts 32 and 33). This age group of animals was now closer to the average age when the disease becomes clinical, which is 4-6 years, and consequently the number of reported cases increases. In Portugal, a similar observation was made and the number of tested risk animals increased significantly resulting in more positive cases and a higher prevalence in active monitoring.

18
4.3 TESTING BY TARGET GROUP
Table 10: Testing on emergency slaughtered bovine animals Emergency Slaughter No. Positives Ratio* 2003 2002 ∆ Belgique/België 1.214 0 0,00 0,00 Danmark 1.739 0 0,00 0,00 Deutschland 5.679 0 0,00 8,76 -100% Ellas 127 0 0,00 0,00 España 1.457 2 13,73 12,04 14% France 0 0 0,00 0,00 Ireland 2.483 4 16,11 0,00 Italia 5.217 2 3,83 7,84 -51% Luxembourg 27 0 0,00 0,00 Nederland 1.375 0 0,00 1,95 -100% Österreich 3.755 0 0,00 0,00 Portugal 1.562 4 25,61 9,02 184% Suomi/Finland 8.087 0 0,00 0,00 Sverige 2.229 0 0,00 0,00 United Kingdom 145.651 317 21,76 35,58 -39% Total EU 15 180.602 329 18,22 27,95 -35% Česká Republika 43.640 1 0,23 Slovenská Rep. 8.269 1 1,21 *: positive cases per 10.000 bovine animals tested
Table 11: Testing on bovine animals with clinical signs at ante-mortem Clinical signs ad ante-mortem inspection No. Positives Ratio* 2003 2002 ∆ Belgique/België 83 0 0,00 0,00 Danmark 17 0 0,00 0,00 Deutschland 3.254 0 0,00 0,00 Ellas 74 0 0,00 0,00 España 1.810 3 16,57 71,32 -77% France 0 0 0,00 0,00 Ireland 0 0 18,44 -100% Italia 54.674 8 1,46 0,94 55% Luxembourg 0 0 3333,33 Nederland 14.043 1 0,71 2,69 -73% Österreich 0 0 Portugal 5.521 14 25,36 4,09 520% Suomi/Finland 4.216 0 0,00 0,00 Sverige 0 0 0,00 United Kingdom 18 3 1666,67 38,02 4283% Total EU 15 83.710 29 3,46 3,78 -8% *: positive cases per 10.000 bovine animals tested

19
Table 12: Testing on fallen stock Fallen Stock No. Positives Ratio* 2003 2002 ∆ Belgique/België 33.691 5 1,48 4,40 -66% Danmark 35.576 0 0,00 0,58 -100% Deutschland 240.556 20 0,83 1,75 -53% Ellas 1.798 0 0,00 0,00 España 90.916 63 6,93 7,55 -8% France 283.695 87 3,07 4,56 -33% Ireland 84.954 108 12,71 23,88 -47% Italia 64.159 5 0,78 1,25 -38% Luxembourg 3.083 0 0,00 0,00 Nederland 50.525 5 0,99 1,93 -49% Österreich 13.235 0 0,00 0,00 Portugal 19.310 43 22,27 57,49 -61% Suomi/Finland 10.899 0 0,00 0,00 Sverige 22.479 0 0,00 0,00 United Kingdom 76.582 89 11,62 17,07 -32% Total EU 15 1.031.458 425 4,12 6,14 -33% Slovenija 8.092 1 1,24 *: positive cases per 10.000 bovine animals tested
Table 13: Testing on all risk bovine animals (Fallen stock, bovine animals with clinical signs at AM and emergency slaughter) Total Risk animals No. Positives Ratio* 2003 2002 ∆ Belgique/België 34.988 5 1,43 4,22 -66% Danmark 37.332 0 0,00 0,56 -100% Deutschland 249.489 20 0,80 1,93 -58% Ellas 1.999 0 0,00 0,00 España 94.183 68 7,22 8,57 -16% France 283.695 87 3,07 4,56 -33% Ireland 87.437 112 12,81 23,73 -46% Italia 124.050 15 1,21 1,45 -17% Luxembourg 3.110 0 0,00 5,15 -100% Nederland 65.943 6 0,91 2,02 -55% Österreich 16.990 0 0,00 0,00 Portugal 26.393 61 23,11 16,91 37% Suomi/Finland 23.202 0 0,00 0,00 Sverige 24.708 0 0,00 0,00 United Kingdom 222.251 409 18,40 28,77 -36% Total EU 15 1.295.770 783 6,04 9,21 -34% Česká Republika 76.431 1 0,13 Slovenija 11.357 1 0,88 Slovenská Rep. 21.805 1 0,46 *: positive cases per 10.000 bovine animals tested

20
Table 14: Testing on healthy slaughtered bovine animals Healthy Slaughter No. Positives Ratio* 2003 2002 ∆ Belgique/België 356.184 10 0,28 0,42 -32% Danmark 250.558 1 0,04 0,04 2% Deutschland 2.337.605 23 0,10 0,15 -35% Ellas 24.533 0 0,00 0,00 España 471.252 74 1,57 0,79 98% France 2.920.157 37 0,13 0,26 -50% Ireland 600.586 31 0,52 0,54 -5% Italia 658.770 15 0,23 0,34 -32% Luxembourg 14.598 0 0,00 0,00 Nederland 439.403 11 0,25 0,20 23% Österreich 205.658 0 0,00 0,00 Portugal 81.633 44 5,39 5,70 -5% Suomi/Finland 108.198 0 0,00 0,00 Sverige 9.856 0 0,00 0,00 United Kingdom 237.490 19 0,80 0,82 -2% Total EU 15 8.716.481 265 0,30 0,31 -3% Česká Republika 133.046 3 0,23 Polska 428.452 4 0,09 Slovenská Rep. 65.192 1 0,15 *: positive cases per 10.000 bovine animals tested
Table 15: Testing on bovine animals culled in the frame of BSE eradication Culled animals No. Positives Ratio* 2003 2002 ∆ Belgique/België 1.126 0 0,00 0,00 Danmark 1.774 0 0,00 0,00 Deutschland 1.125 1 8,89 11,42 -22% Ellas 0 0 0,00 España 2.356 6 25,47 12,79 99% France 1.669 2 11,98 0,63 1803% Ireland 11.986 1 0,83 2,14 -61% Italia 2.148 0 0,00 0,00 Luxembourg 2 0 0,00 Nederland 954 0 0,00 0,00 Österreich 0 0 Portugal 1.271 0 0,00 8,60 -100% Suomi/Finland 0 0 Sverige 0 0 United Kingdom 555 0 0,00 0,00 Total EU 15 24.966 10 4,00 2,77 44% *: positive cases per 10.000 bovine animals tested

21
Table 16: Total of testing by active monitoring Total Active Monitoring No. Positives Ratio* 2003 2002 ∆ Belgique/België 392.298 15 0,38 0,73 -48% Danmark 289.664 1 0,03 0,10 -66% Deutschland 2.588.219 44 0,17 0,31 -46% Ellas 26.532 0 0,00 0,00 España 567.791 148 2,61 2,14 22% France 3.205.521 126 0,39 0,63 -37% Ireland 700.009 144 2,06 3,15 -35% Italia 786.443 30 0,38 0,49 -22% Luxembourg 17.710 0 0,00 0,54 -100% Nederland 506.300 17 0,34 0,41 -18% Österreich 222.648 0 0,00 0,00 Portugal 109.297 105 9,61 7,68 25% Suomi/Finland 131.425 0 0,00 0,00 Sverige 34.564 0 0,00 0,00 United Kingdom 460.296 428 9,30 16,51 -44% Total EU 15 10.038.717 1.058 1,05 1,38 -24% Česká Republika 210.183 4 0,19 Polska 455.362 4 0,09 Slovenija 66.135 1 0,15 Slovenská Rep. 87.008 2 0,23 *: positive cases per 10.000 bovine animals tested
Chart 5: Evolution of the prevalence in target groups detected by active monitoring
0,00
2,00
4,00
6,00
8,00
10,00
case
s per
10.
000
test
ed
2001 2,83 0,36 9,76
2002 2,77 0,31 9,21
2003 4,00 0,30 6,04
BSE culling Healthy slaughter Risk animals

22
Comments on the testing by target group Figures between different Member States should be compared with caution as:
• The policy on emergency slaughter varies between Member States. In certain countries cattle are hardly, or not, received for emergency slaughter.
• The policy on animals with clinical signs at ante-mortem inspection also varies between Member States.
• Different monitoring programmes were run in healthy slaughtered cattle. Testing younger cattle on a voluntary basis results in a lower ratio. In addition, the testing in the UK focussed on animals born after the date of the effective feed ban.
• The results of different target groups are interdependent and should not be viewed in isolation. For example, an effective passive surveillance will increase the number of cases found in suspects and may at the same time decrease the ratio of positive cases in the other target groups, in particular in fallen stock and emergency slaughtered animals.
The above tables and charts demonstrate that the prevalence of BSE dropped in risk animals in 2003 compared to 2002 except in Portugal. The increase in risk animals in Portugal is overestimated because cattle culled in the frame of eradication of diseases other than BSE, having a low BSE prevalence, were recorded as risk animals in 2002, while as healthy slaughtered cattle in 2003. The prevalence in healthy slaughtered cattle however was similar in 2003 and 2002. The figures illustrate that the likelihood of finding BSE cases is around 20 times higher in fallen stock, emergency slaughtered cattle and cattle with general clinical signs at ante-mortem (“risk animals”) than in healthy slaughtered cattle. In culled animals, the prevalence was more than 10 times higher than in healthy slaughtered cattle.

23
4.4
AG
E D
IST
RIB
UT
ION
OF
POSI
TIV
E C
ASE
S T
able
17:
Age
dis
trib
utio
n of
all
posi
tive
case
s
Age
(yea
rs o
ld)
3 4
5 6
7 8
9 10
11
12
>1
2
(3
6-47
m)
(48-
59m
) (6
0-71
m)
(72-
83m
) (8
4-95
m)
(96-
107m
) (1
08-1
19m
) (1
20-1
31m
) (1
32-1
43m
) (1
44-1
55m
) (>
155
m)
No
of c
ases
0
1 3
4 3
2 1
0 0
1 0
Bel
giqu
e/B
elgi
ë
%
0%
7%
20%
27
%
20%
13
%
7%
0%
0%
7%
0%
No
of c
ases
0
0 1
0 1
0 0
0 0
0 0
Dan
mar
k
%
0%
0%
50%
0%
50
%
0%
0%
0%
0%
0%
0%
No
of c
ases
2
13
9 16
12
1
0 0
0 0
1 D
euts
chla
nd
%
4%
24%
17
%
30%
22
%
2%
0%
0%
0%
0%
2%
No
of c
ases
1
10
50
41
32
15
8 5
1 0
4 E
spañ
a
%
1%
6%
30%
25
%
19%
9%
5%
3%
1%
0%
2%
N
o of
cas
es
0 1
10
16
29
29
18
1 3
1 3
Fran
ce
%
0%
1%
9%
14%
26
%
26%
16
%
1%
3%
1%
3%
No
of c
ases
0
0 2
2 67
55
27
14
7
3 6
Irel
and
%
0%
0%
1%
1%
37
%
30%
15
%
8%
4%
2%
3%
No
of c
ases
0
0 3
10
8 3
3 1
1 0
2 It
alia
%
0%
0%
10
%
32%
26
%
10%
10
%
3%
3%
0%
6%
No
of c
ases
0
2 2
10
3 0
0 0
0 1
0 N
eder
land
%
0%
11
%
11%
56
%
17%
0%
0%
0%
0%
6%
0%
N
o of
cas
es
0 3
25
30
19
13
22
14
3 1
2 Po
rtug
al
%
0%
2%
19%
23
%
14%
10
%
17%
11
%
2%
1%
2%
No
of c
ases
1
11
20
14
71
149
116
90
53
30
58
Uni
ted
Kin
gdom
%
0%
2%
3%
2%
12
%
24%
19
%
15%
9%
5%
9%
N
o of
cas
es
4 41
12
5 14
3 24
5 26
7 19
5 12
5 68
37
76
T
otal
EU
15
%
0%
3%
9%
11%
18
%
20%
15
%
9%
5%
3%
6%
No
of c
ases
2
0 0
1 0
1 0
0 0
0 0
Čes
ka R
epub
lika
%
50
%
0%
0%
25%
0%
25
%
0%
0%
0%
0%
0%
No
of c
ases
0
0 2
2 1
0 0
0 0
0 0
Pols
ka
%
0%
0%
40%
40
%
20%
0%
0%
0%
0%
0%
0%
N
o of
cas
es
1 0
0 0
0 0
0 0
0 0
0 Sl
oven
ija
%
100%
0%
0%
0%
0%
0%
0%
0%
0%
0%
0%
N
o of
cas
es
0 0
0 1
1 0
0 0
0 0
0 Sl
oven
ská
Rep
. %
0%
0%
0%
50
%
50%
0%
0%
0%
0%
0%
0%
N
o of
cas
es
3 0
2 4
2 1
0 0
0 0
0 N
ew M
S
%
25%
0%
17
%
33%
17
%
8%
0%
0%
0%
0%
0%

24
Charts 6: Age distribution of positive cases in the UK, Ireland, the rest of the EU15 and the new Member States in 2003
0%
5%
10%
15%
20%
25%
30%
35%
40%
2 3 4 5 6 7 8 9 10 11 12 >12
Years of age
UK
IE
Rest of EU15
New MS
Charts 7, 8 and 9: Comparison of the age distribution of positive cases detected in 2003, 2002 and 2001: United Kingdom, Ireland and the rest of the EU15
Chart 7: UK
0%5%
10%15%
20%25%30%35%
2 3 4 5 6 7 8 9 10 11 12 >12
years of age
200120022003

25
Chart 8: Ireland
0%5%
10%15%20%25%30%35%40%45%
2 3 4 5 6 7 8 9 10 11 12 >12
Years of age
200120022003
Chart 9: rest of the EU15
0%5%
10%15%20%25%30%35%40%
2 3 4 5 6 7 8 9 10 11 12 >12
Years of age
200120022003
Chart 10: Age distribution in risk animals in 2003
0%
5%
10%
15%
20%
25%
30%
35%
40%
Years of age
UK 0 % 0 % 1% 3% 3% 9% 2 2 % 18% 17% 10 % 6% 11%
Ireland 0 % 0 % 0 % 2% 0% 3 7% 2 9 % 16% 6 % 3% 3% 4 %
Rest o f the EU15 0 % 0 % 5% 16 % 2 6 % 19 % 13 % 11% 4 % 3% 1% 2 %
2 3 4 5 6 7 8 9 10 11 12 >12

26
Tab
le 1
8: A
ge d
istr
ibut
ion
of p
ositi
ve c
ases
in r
isk
anim
als (
Falle
n st
ock,
em
erge
ncy
slau
ghte
r an
d cl
inic
al si
gns a
t AM
) in
2003
A
ge (y
ears
old
)
3
4 5
6 7
8 9
10
11
12
>12
(36-
47m
) (4
8-59
m)
(60-
71m
) (7
2-83
m)
(84-
95m
) (9
6-10
7m)
(108
-119
m)
(120
-131
m)
(132
-143
m)
(144
-155
m)
(>15
5 m
)
No
of c
ases
0
0 2
1 1
0 1
0 0
0 0
Bel
giqu
e/B
elgi
ë
%
0%
0%
40%
20
%
20%
0%
20
%
0%
0%
0%
0%
No
of c
ases
1
4 3
7 4
0 0
0 0
0 1
Deu
tsch
land
%
5%
20
%
15%
35
%
20%
0%
0%
0%
0%
0%
5%
N
o of
cas
es
0 3
16
23
10
6 5
3 1
0 1
Espa
ña
%
0%
4%
24%
34
%
15%
9%
7%
4%
1%
0%
1%
N
o of
cas
es
0 0
5 11
18
21
9
0 3
1 2
Fran
ce
%
0%
0%
7%
16%
26
%
30%
13
%
0%
4%
1%
3%
No
of c
ases
0
0 2
0 41
32
18
7
3 3
4 Ir
elan
d
%
0%
0%
2%
0%
37%
29
%
16%
6%
3%
3%
4%
N
o of
cas
es
0 0
1 6
4 0
1 1
0 0
2 Ita
lia
%
0%
0%
7%
40%
27
%
0%
7%
7%
0%
0%
13%
N
o of
cas
es
0 2
0 3
0 0
0 0
0 0
0 N
eder
land
%
0%
40
%
0%
60%
0%
0%
0%
0%
0%
0%
0%
N
o of
cas
es
0 2
13
12
9 5
10
5 3
1 0
Portu
gal
%
0%
3%
21%
20
%
15%
8%
16
%
8%
5%
2%
0%
No
of c
ases
1
4 13
9
38
88
72
67
40
23
46
Uni
ted
Kin
gdom
%
0%
1%
3%
2%
9%
22
%
18%
17
%
10%
6%
11
%
No
of c
ases
2
15
55
72
125
152
116
83
50
28
56
Tot
al E
U15
%
0%
2%
7%
10
%
16%
20
%
15%
11
%
7%
4%
7%
No
of c
ases
0
0 0
1 0
0 0
0 0
0 0
Čes
ká R
epub
lika
%
0%
0%
0%
10
0%
0%
0%
0%
0%
0%
0%
0%
No
of c
ases
1
0 0
0 0
0 0
0 0
0 0
Slov
enija
%
10
0%
0%
0%
0%
0%
0%
0%
0%
0%
0%
0%
No
of c
ases
0
0 0
1 0
0 0
0 0
0 0
Slov
ensk
á R
ep.
%
0%
0%
0%
100%
0%
0%
0%
0%
0%
0%
0%

27
Tab
le 1
9: A
ge d
istr
ibut
ion
of p
ositi
ve c
ases
in h
ealth
y sl
augh
tere
d ca
ttle
A
ge (y
ears
old
)
3
4 5
6 7
8 9
10
11
12
>12
(36-
47m
) (4
8-59
m)
(60-
71m
) (7
2-83
m)
(84-
95m
) (9
6-10
7m)
(108
-119
m)
(120
-131
m)
(132
-143
m)
(144
-155
m)
(>15
5 m
)
No
of c
ases
0
1 1
3 2
2 0
0 0
1 0
Bel
giqu
e/B
elgi
ë
%
0%
10%
10
%
30%
20
%
20%
0%
0%
0%
10
%
0%
No
of c
ases
0
0 0
0 1
0 0
0 0
0 0
Dan
mar
k
%
0%
0%
0%
0%
100%
0%
0%
0%
0%
0%
0%
N
o of
cas
es
0 6
5 6
6 0
0 0
0 0
0 D
euts
chla
nd
%
0%
26%
22
%
26%
26
%
0%
0%
0%
0%
0%
0%
No
of c
ases
1
4 21
14
19
7
2 2
0 0
3 Es
paña
%
1%
5%
29
%
19%
26
%
10%
3%
3%
0%
0%
4%
N
o of
cas
es
0 1
3 1
7 7
9 1
0 0
1 Fr
ance
%
0%
3%
10
%
3%
23%
23
%
30%
3%
0%
0%
3%
N
o of
cas
es
0 0
0 1
7 9
4 4
4 0
2 Ir
elan
d
%
0%
0%
0%
3%
23%
29
%
13%
13
%
13%
0%
6%
N
o of
cas
es
0 0
2 4
4 2
2 0
1 0
0 Ita
lia
%
0%
0%
13%
27
%
27%
13
%
13%
0%
7%
0%
0%
N
o of
cas
es
0 0
2 5
3 0
0 0
0 1
0 N
eder
land
%
0%
0%
18
%
45%
27
%
0%
0%
0%
0%
9%
0%
No
of c
ases
0
1 9
12
3 5
3 9
0 0
2 Po
rtuga
l %
0%
2%
20
%
27%
7%
11
%
7%
20%
0%
0%
5%
N
o of
cas
es
0 3
4 0
1 3
3 5
2 0
4 U
nite
d K
ingd
om
%
0%
12%
16
%
0%
4%
12%
12
%
20%
8%
0%
16
%
No
of c
ases
1
16
47
46
53
35
23
21
7 2
12
Tot
al E
U15
%
0%
6%
18
%
18%
20
%
13%
9%
8%
3%
1%
4%
N
o of
cas
es
2 0
0 0
0 1
0 0
0 0
0 Č
eská
Rep
ublik
a
%
67%
0%
0%
0%
0%
33
%
0%
0%
0%
0%
0%
No
of c
ases
0
0 1
2 1
0 0
0 0
0 0
Pols
ka
%
0%
0%
25%
50
%
25%
0%
0%
0%
0%
0%
0%
N
o of
cas
es
0 0
0 0
1 0
0 0
0 0
0 Sl
oven
ská
Rep
. %
0%
0%
0%
0%
10
0%
0%
0%
0%
0%
0%
0%

28
Chart 11: Age distribution in healthy slaughtered cattle in 2003
0%
5%
10%
15%
20%
25%
30%
35%
Years of age
ES 0% 1% 5% 29% 19% 26% 10% 3% 3% 0% 0% 4%
PT 0% 0% 2% 20% 27% 7% 11% 7% 20% 0% 0% 5%
IE 0% 0% 0% 0% 3% 23% 29% 13% 13% 13% 0% 6%
Rest EU15-UK 0% 0% 9% 14% 21% 26% 12% 12% 1% 1% 2% 1%
New MS 0% 25% 0% 13% 25% 25% 13% 0% 0% 0% 0% 0%
2 3 4 5 6 7 8 9 10 11 12 >12
The highest number of cases and the highest incidence in healthy slaughtered cattle were detected in Portugal and Spain. Therefore these Member States were plotted separately in Chart 11. The age distribution in the UK is without interest given the biased testing programme. Chart 12: Age distribution in suspects in 2003
0%
10%
20%
30%
40%
50%
Years of age
UK 0% 2 % 2% 3 % 17% 3 1% 2 2% 10% 6% 4 % 4 %
Ireland 0% 0 % 0% 2 % 4 4% 34 % 12 % 7% 0% 0 % 0 %
Rest o f the EU15 1% 6 % 2 4% 24 % 21% 10% 13 % 0 % 0% 0 % 0 %
3 4 5 6 7 8 9 10 11 12 >12

29
Tab
le 2
0: A
ge d
istr
ibut
ion
of p
ositi
ve c
ases
in B
SE su
spec
ts:
Age
(yea
rs o
ld)
3 4
5 6
7 8
9 10
11
12
>1
2
(3
6-47
m)
(48-
59m
) (6
0-71
m)
(72-
83m
) (8
4-95
m)
(96-
107m
) (1
08-1
19m
) (1
20-1
31m
) (1
32-1
43m
) (1
44-1
55m
) (>
155
m)
No
of c
ases
0
0 1
0 0
0 0
0 0
0 0
Dan
mar
k
%
0%
0%
100%
0%
0%
0%
0%
0%
0%
0%
0%
N
o of
cas
es
1 2
1 3
2 1
0 0
0 0
0 D
euts
chla
nd
%
10%
20
%
10%
30
%
20%
10
%
0%
0%
0%
0%
0%
No
of c
ases
0
3 12
4
3 2
1 0
0 0
0 Es
paña
%
0%
12
%
48%
16
%
12%
8%
4%
0%
0%
0%
0%
N
o of
cas
es
0 0
2 4
4 1
0 0
0 0
0 Fr
ance
%
0%
0%
18
%
36%
36
%
9%
0%
0%
0%
0%
0%
No
of c
ases
0
0 0
1 18
14
5
3 0
0 0
Irel
and
%
0%
0%
0%
2%
44
%
34%
12
%
7%
0%
0%
0%
No
of c
ases
0
0 0
0 0
1 0
0 0
0 0
Italia
%
0%
0%
0%
0%
0%
10
0%
0%
0%
0%
0%
0%
No
of c
ases
0
0 0
2 0
0 0
0 0
0 0
Ned
erla
nd
%
0%
0%
0%
100%
0%
0%
0%
0%
0%
0%
0%
N
o of
cas
es
0 0
3 6
7 3
9 0
0 0
0 Po
rtuga
l %
0%
0%
11
%
21%
25
%
11%
32
%
0%
0%
0%
0%
No
of c
ases
0
4 3
5 32
58
40
18
11
7
7 U
nite
d K
ingd
om
%
0%
2%
2%
3%
17%
31
%
22%
10
%
6%
4%
4%
No
of c
ases
1
9 22
25
66
80
55
21
11
7
7 T
otal
EU
15
%
0%
3%
7%
8%
22%
26
%
19%
7%
4%
2%
2%
N
o of
cas
es
0 0
1 0
0 0
0 0
0 0
0 Po
lska
%
0%
0%
10
0%
0%
0%
0%
0%
0%
0%
0%
0%

30
Table 21: Average age in months per target group BSE Culling Healthy slaughter Risk animals BSE suspects 2001 2002 2003 2001 2002 2003 2001 2002 2003 2001 2002 2003 Belgique/België 74,0 0,0 0,0 72,1 74,8 88,1 73,6 84,0 81,6 73,9 81,0 0,0 Danmark 0,0 0,0 0,0 57,7 71,0 86,0 78,0 64,0 0,0 48,0 0,0 66,0 Deutschland 61,5 56,3 52,0 68,4 78,3 72,7 63,8 78,5 77,0 64,7 70,5 71,7 Ellas 0,0 0,0 0,0 56,0 0,0 0,0 0,0 0,0 0,0 0,0 0,0 0,0 España 0,0 0,0 69,0 83,0 81,3 84,2 72,5 76,4 84,2 64,3 86,6 74,0 France 86,0 79,0 0,0 75,6 86,6 99,7 79,3 85,5 97,6 74,6 83,9 81,7 Ireland 0,0 71,6 95,0 90,7 99,1 112,3 83,5 95,6 104,5 82,4 91,5 100,0 Italia 0,0 0,0 0,0 66,5 80,3 91,5 71,9 75,9 97,3 0,0 0,0 96,0 Luxembourg 0,0 0,0 0,0 0,0 0,0 0,0 0,0 73,0 0,0 0,0 0,0 0,0 Nederland 0,0 0,0 0,0 76,2 79,3 85,4 70,8 72,9 69,8 78,0 75,0 79,0 Österreich 0,0 0,0 0,0 70,0 0,0 0,0 0,0 0,0 0,0 0,0 0,0 0,0 Portugal 0,0 99,0 0,0 81,2 86,9 94,5 82,3 85,2 92,1 81,9 88,2 93,2 Suomi/Finland 0,0 0,0 0,0 0,0 0,0 0,0 81,0 0,0 0,0 0,0 0,0 0,0 United Kingdom 0,0 0,0 0,0 57,0 102,0 109,4 101,0 110,9 119,2 89,4 101,0 108,4 Total EU15 72,3 70,5 72,0 76,2 85,9 93,1 88,7 100,0 107,6 86,5 96,9 100,5 Česká Republika 0,0 0,0 0,0 72,0 73,5 62,7 68,0 0,0 76,0 0,0 0,0 0,0 Polska 0,0 0,0 0,0 0,0 76,3 74,0 0,0 0,0 0,0 0,0 99,0 67,0 Slovenija 0,0 0,0 0,0 0,0 0,0 0,0 72,0 0,0 44,0 0,0 0,0 0,0 Slovenská Rep. 0,0 0,0 0,0 72,8 95,3 93,0 78,0 71,3 72,0 0,0 0,0 0,0
Chart 13: Average age of positive cases detected in 2001, 2002 and 2003
60,0
70,0
80,0
90,0
100,0
110,0
120,0
2001 2002 2003
mon
ths
BSE Culling
Healthy slaughter
Risk animals
BSE suspects

31
Chart 14: Average age of positive cases per target group in the UK: comparison of 2003, 2002 and 2001 (see comment at chart 11)
0,0
20,0
40,0
60,0
80,0
100,0
120,0
140,0
2001 101,0 89,4
2002 110,9 101,0
2003 119,2 108,4
Risk animals BSE suspects
Chart 15: Average age of positive cases per target group in Ireland: comparison of 2003, 2002 and 2001
0,0
20,0
40,0
60,0
80,0
100,0
120,0
2001 90,7 83,5 82,4
2002 99,1 95,6 91,5
2003 112,3 104,5 100,0
Healthy sl. Risk animals BSE suspects

32
Chart 16: Average age of positive cases per target group in the rest of the EU15: comparison of 2003, 2002 and 2001
0,010,020,0
30,040,050,060,070,0
80,090,0
100,0
2001 72,3 74,2 73,5 76,1
2002 69,4 82,6 81,1 83,6
2003 60,5 88,0 89,8 82,0
BSE culling Healthy s l. Ris k Animals Sus pect
Comments on the age distribution of positive cases Tables 17 to 20, and Charts 6 to 12 illustrate that there are differences between Member States in the age profile of positive cases in 2003 as was already observed in 2002. A favourable evolution is observed in the average age of positive cases of the major target groups (BSE suspects, healthy slaughtered cattle and risk animals) from 2001 to 2003 in the EU15 (Table 21 and Charts 13 to 16). Taking into consideration an average incubation period of 5 years, these figures are an indication that measures taken from 1997 onwards may have had some effect and that the prevalence of BSE in young animals is decreasing. When assessing the figures in healthy slaughtered animals in the UK, it should be borne in mind that the testing was targeted at animals born after 1 August 1996.

33
4.5
YE
AR
OF
BIR
TH
DIS
TR
IBU
TIO
N IN
CA
SES
DE
TE
CT
ED
SIN
CE
200
1 T
able
22:
Yea
r of
bir
th d
istr
ibut
ion
of p
ositi
ve c
ases
Y
ear
of B
irth
B
efor
e 19
90
1990
19
91
1992
19
93
1994
19
95
1996
19
97
1998
19
99
2000
N
o. o
f cas
es
0 0
2 4
2 14
28
37
11
1
0 0
Bel
giqu
e/B
elgi
ë
%
0%
0%
2%
4%
2%
14%
28
%
37%
11
%
1%
0%
0%
No.
of c
ases
0
0 0
0 1
0 0
6 2
2 1
0 D
anm
ark
%
0%
0%
0%
0%
8%
0%
0%
50
%
17%
17
%
8%
0%
No.
of c
ases
1
2 1
2 3
13
80
123
29
18
13
0 D
euts
chla
nd
%
0%
1%
0%
1%
1%
5%
28%
43
%
10%
6%
5%
0%
N
o. o
f cas
es
0 0
0 0
0 0
0 1
0 0
0 0
Ella
s %
0%
0%
0%
0%
0%
0%
0%
10
0%
0%
0%
0%
0%
No.
of c
ases
10
2
0 4
28
31
79
87
96
33
5 1
Espa
ña
%
3%
1%
0%
1%
7%
8%
21%
23
%
26%
9%
1%
0%
N
o. o
f cas
es
3 2
5 8
54
166
278
74
30
8 0
0 Fr
ance
%
0%
0%
1%
1%
9%
26
%
44%
12
%
5%
1%
0%
0%
No.
of c
ases
18
14
22
29
86
13
4 31
7 12
9 8
0 2
0 Ir
elan
d
%
2%
2%
3%
4%
11%
18
%
42%
17
%
1%
0%
0%
0%
No.
of c
ases
3
0 1
1 5
14
26
44
20
3 0
0 Ita
lia
%
3%
0%
1%
1%
4%
12%
22
%
39%
17
%
3%
0%
0%
No.
of c
ases
0
0 0
0 0
0 0
1 0
0 0
0 Lu
xem
bour
g
%
0%
0%
0%
0%
0%
0%
0%
100%
0%
0%
0%
0%
N
o. o
f cas
es
1 0
1 2
3 4
7 29
10
4
1 0
Ned
erla
nd
%
2%
0%
2%
3%
5%
6%
11%
47
%
16%
6%
2%
0%
N
o. o
f cas
es
0 0
0 0
0 0
0 1
0 0
0 0
Öst
erre
ich
%
0%
0%
0%
0%
0%
0%
0%
10
0%
0%
0%
0%
0%
No.
of c
ases
6
2 1
8 57
79
48
64
41
19
2
0 Po
rtuga
l %
2%
1%
0%
2%
17
%
24%
15
%
19%
12
%
6%
1%
0%
No.
of c
ases
0
0 0
0 0
0 1
0 0
0 0
0 Su
omi/F
inla
nd
%
0%
0%
0%
0%
0%
0%
100%
0%
0%
0%
0%
0%
N
o. o
f cas
es
208
82
158
303
515
798
724
87
40
19
6 0
Uni
ted
Kin
gdom
%
7%
3%
5%
10
%
18%
27
%
25%
3%
1%
1%
0%
0%
N
o. o
f cas
es
250
104
191
361
754
1.25
3 1.
588
683
287
107
30
1 T
otal
EU
15
%
4%
2%
3%
6%
13%
22
%
28%
12
%
5%
2%
1%
0%
No.
Of c
ases
0
0 0
0 0
0 4
0 2
0 0
2 Č
eská
Rep
. %
0%
0%
0%
0%
0%
0%
50
%
0%
25%
0%
0%
25
%
No.
of c
ases
0
0 0
0 0
1 1
3 3
1 0
0 Po
lska
%
0%
0%
0%
0%
0%
11
%
11%
33
%
33%
11
%
0%
0%
No.
of c
ases
0
0 0
0 0
0 1
1 0
0 1
0 Sl
oven
ija
%
0%
0%
0%
0%
0%
0%
33%
33
%
0%
0%
33%
0%
N
o. o
f cas
es
0 0
1 0
0 0
8 3
1 0
0 0
Slov
ensk
á R
ep.
%
0%
0%
8%
0%
0%
0%
62%
23
%
8%
0%
0%
0%
No.
of c
ases
0
0 1
0 0
1 14
7
6 1
1 2
Tot
al n
MS
%
0%
0%
3%
0%
0%
3%
42
%
21%
18
%
3%
3%
6%

34
Charts 17 to 21: Year of birth distribution of positive cases detected in 2001, 2002 or 2003 (France is used as a reference in Charts 17 to 20)
Chart 17
0100200300400500600700800900
< 1990
1990
1991
1992
1993
1994
1995
1996
1997
1998
1999
2000
2001
Cas
es
UK
IE
FR
PT
Chart 18
0
50
100
150
200
250
300
< 1990
1990
1991
1992
1993
1994
1995
1996
1997
1998
1999
2000
2001
case
s
ES
DE
FR
BE
IT
NL
Chart 19
0%5%
10%15%20%25%30%35%40%45%50%
< 1990
1990
1991
1992
1993
1994
1995
1996
1997
1998
1999
2000
2001
% o
f cas
es
UK
IE
FR
PT

35
Chart 20
0%5%
10%15%20%25%30%35%40%45%50%
< 1990
1990
1991
1992
1993
1994
1995
1996
1997
1998
1999
2000
2001
% o
f cas
esES
DE
FR
BE
IT
NL
Chart 21
0%
5%
10%
15%
20%
25%
30%
35%
40%
45%
< 1990
1990
1991
1992
1993
1994
1995
1996
1997
1998
1999
2000
2001
% o
f cas
es UK
IRL
Rest of EU15
new MS
Comments on the year of birth distribution of positive animals Table 22 and Charts 17 to 21 only take account of cases detected since 2001 and does not include cases detected before 2001 in particular in the United Kingdom, Portugal, Ireland and France. However, differences between Member States with regard to the year of birth with the highest % of positive cases may be an indication of differences in the period of exposure to the agent and by the effectiveness of measures to prevent transmission of the agent, in particular the feed ban. In several Member States the peak of exposure seems to be very well defined, representing almost half of the positive cases detected (France and Ireland: 1995; Germany, Belgium, Italy and the Netherlands: 1996). The UK figures are not fully representative as the testing programme in healthy slaughtered animals is different for animals born pre-August 1996.

36
4.6
PRE
VA
LE
NC
E O
F B
SE IN
DIF
FER
EN
T A
GE
CA
TE
GO
RIE
S
Tab
le 2
3: E
xtra
pola
ted
age
dist
ribu
tion
of a
ll te
sted
cat
tle
Rep
orte
d as
A
TB
E
DK
D
EE
LE
SFI
FRIE
ITL
UN
LPT
SVU
K
EU
15
< 24
38
8 1.
031
2.73
1 51
8.44
6 27
2 2.
618
875
0 17
0 1.
796
3 1.
510
0 1.
355
151
531.
348
24-3
5
36.6
41
38.2
30
586.
987
2.02
5 64
.906
19
.897
61
0.40
9 23
0.52
3 14
5.39
6 3.
395
59.2
86
7.54
7 5.
816
27.6
08
1.83
8.66
7 36
-47
85
.998
65
.145
33
0.49
6 3.
523
61.8
44
28.7
02
672.
233
95.1
73
113.
681
3.98
1 94
.832
13
.151
6.
105
63.9
43
1.63
8.80
5 48
-59
80
.751
62
.843
29
4.19
1 3.
795
69.1
48
27.7
42
405.
384
45.6
58
114.
382
2.65
4 94
.281
14
.754
6.
405
89.7
78
1.31
1.76
6 60
-71
61
.440
47
.978
24
6.94
8 3.
569
64.1
52
21.2
94
331.
935
40.7
55
102.
045
9.93
5 78
.437
13
.427
5.
665
87.2
19
1.11
4.80
1 72
-83
44
.794
31
.345
19
3.09
6 3.
430
56.6
94
14.2
40
282.
090
38.6
37
81.8
73
1.58
6 63
.134
12
.779
3.
939
74.2
99
901.
936
84-9
5
32.3
40
20.3
14
144.
474
2.85
9 50
.107
8.
464
232.
189
18.0
18
64.2
03
1.27
1 48
.364
10
.926
2.
215
32.0
76
667.
819
96-1
07
0
11.4
52
0 2.
245
35.5
78
0 0
0 46
.858
0
27.9
94
8.61
3 0
23.3
72
156.
113
108-
119
0
5.90
8 0
1.59
9 28
.090
0
0 0
33.8
06
0 15
.093
6.
714
0 17
.413
10
8.62
4 12
0-13
1
0 3.
246
0 1.
074
21.4
44
0 0
0 23
.771
0
9.25
9 4.
593
0 15
.938
79
.325
13
2-14
3
0 1.
698
0 79
2 16
.698
0
0 0
17.5
11
0 5.
011
3.45
6 0
8.98
8 54
.154
14
4-15
5
0 90
5 0
537
15.2
48
0 0
0 13
.128
0
2.56
5 2.
776
0 7.
814
42.9
74
156
& >
0 1.
130
0 81
3 44
.728
0
0 0
27.6
05
0 2.
467
11.2
36
0 13
.121
10
1.10
2 96
& >
49.4
69
0 27
4.43
5 0
29.4
24
10.2
27
671.
723
232.
142
2.
842
6.48
6 0
3.07
5 0
1.27
9.82
3 <
30
1.01
2 0
0 0
0 0
0 0
0 0
0 0
0 0
0 1.
012
> 30
20
4.64
9 0
0 0
0 0
0 0
0 0
0 0
0 0
0 20
4.64
9 >
24
16.6
01
0 0
0 0
0 0
0 0
0 0
0 0
0 0
16.6
01
Tota
l 22
2.65
0 39
2.46
5 29
2.92
5 2.
589.
073
26.5
33
560.
681
131.
441
3.20
5.96
3 70
1.07
6 78
6.05
7 25
.667
50
8.72
0 10
9.97
2 34
.575
46
1.72
0 10
.049
.518
Rep
orte
d as
C
YC
Z E
E
HU
LT
LV
MT
PL
SISK
< 24
0
101
Na
Na
25
50
Na
Na
175
99
24-3
5 17
3 32
.532
N
a N
a 56
0 38
2 N
a N
a 19
.585
11
.158
36
-47
661
40.2
18
Na
Na
937
579
Na
Na
7.22
0 14
.647
48
-59
1.45
2 36
.825
N
a N
a 82
1 60
6 N
a N
a 6.
020
13.2
82
60-7
1 2.
247
29.7
10
Na
Na
865
682
Na
Na
5.99
8 12
.295
72
-83
2.58
6 22
.233
N
a N
a 75
2 70
0 N
a N
a 5.
569
9.86
9 84
-95
519
16.8
66
Na
Na
1.00
8 68
6 N
a N
a 5.
234
7.93
3 96
-107
57
11
.913
N
a N
a 1.
148
534
Na
Na
4.64
1 5.
978
108-
119
17
8.06
5 N
a N
a 90
0 48
7 N
a N
a 3.
450
3.97
3 12
0-13
1 9
5.30
6 N
a N
a 91
0 40
8 N
a N
a 2.
718
3.00
5 13
2-14
3 0
2.78
0 N
a N
a 62
1 35
1 N
a N
a 1.
921
1.82
6 14
4-15
5 4
1.78
3 N
a N
a 56
2 30
3 N
a N
a 1.
459
1.36
4 15
6 &
>
0 2.
124
Na
Na
636
358
Na
Na
2.17
8 1.
597
96 &
>
0 0
Na
Na
0 0
Na
Na
0 0
Tota
l 7.
726
210.
456
3.98
3 97
.488
9.
746
6.12
6 1.
199
455.
362
66.1
67
87.0
25

37
Tab
le 2
4: E
xtra
pola
ted
age
dist
ribu
tion
of te
sted
ris
k an
imal
s R
epor
ted
as
AT
BE
D
K
DE
EL
ES
FIFR
IE
ITL
UN
LPT
SVU
K
EU
15
< 24
38
8 86
8 1.
065
7.26
9 81
87
0 60
3 0
127
514
0 30
8 0
1.31
8 56
13
.468
24
-35
0 6.
997
8.50
4 66
.743
27
1 12
.064
5.
837
45.4
06
13.9
07
18.9
67
614
13.5
26
3.16
0 4.
821
27.1
23
227.
939
36-4
7 0
6.
943
6.97
6 36
.320
24
3 11
.359
3.
831
50.3
23
8.31
7 19
.511
58
5 9.
781
3.28
3 4.
166
28.1
34
189.
773
48-5
9 0
5.
350
6.98
2 35
.451
26
0 11
.754
4.
320
37.9
99
6.61
5 19
.586
46
3 10
.086
3.
474
4.28
1 24
.783
17
1.40
4 60
-71
0
4.39
0 5.
764
31.8
83
276
11.3
45
3.60
2 32
.277
6.
484
17.8
74
380
9.59
0 3.
090
3.92
3 24
.027
15
4.90
5 72
-83
0
3.44
3 3.
653
24.2
43
246
9.64
2 2.
424
27.1
85
6.15
5 13
.802
31
9 7.
883
2.90
1 2.
679
22.2
34
126.
810
84-9
5 0
2.
565
2.46
8 17
.216
17
7 8.
116
1.30
3 21
.785
2.
581
10.7
28
247
6.09
6 2.
278
1.52
8 20
.103
97
.191
96
-107
0
0
1.34
8 0
14
7 5.
789
0
0 0
7.38
3 0
1.
014
1.78
7 0
20.6
59
38.1
28
108-
119
0
0 64
4 0
80
4.
523
0
0
0 5.
042
0
474
1.45
4 0
15.3
13
27.5
30
120-
131
0
0 40
6 0
70
3.
378
0
0
0 3.
393
0
267
997
0 14
.352
22
.864
13
2-14
3 0
0
212
0
48
2.45
8 0
0
0
2.40
4 0
14
4 80
4 0
7.71
6 13
.786
14
4-15
5 0
0
140
0
51
2.29
8 0
0
0
1.74
7 0
76
68
7 0
6.98
9 11
.987
15
6 &
>
0
0 18
1 0
50
5.
324
0
0
0 3.
613
0
90
3.00
8 0
11.6
04
23.8
69
96 &
>
0
4.43
2 0
30
.363
0
3.
644
1.45
9 68
.720
43
.281
0
502
0
0 2.
008
0 15
4.40
8 >
24
16.6
01
0 0
0
0 0
0
0
0 0
0 0
0
0 0
16.6
01
Tota
l 16
.989
34
.988
38
.343
24
9.48
9 1.
999
92.5
64
23.3
79
283.
695
87.4
67
124.
564
3.11
0 65
.832
26
.922
24
.724
22
3.09
4 1.
297.
159
R
epor
ted
as
CY
CZ
EE
H
UL
TL
VM
TPL
SI
SK<
24
0 76
N
a N
a 19
30
N
a N
a 10
4 45
24
-35
173
17.0
79
Na
Na
247
147
Na
Na
1.59
3 4.
701
36-4
7 19
4 13
.066
N
a N
a 23
9 14
4 N
a N
a 1.
482
3.71
5 48
-59
306
12.8
86
Na
Na
212
125
Na
Na
1.40
9 3.
371
60-7
1 28
7 10
.930
N
a N
a 22
0 16
3 N
a N
a 1.
460
3.11
4 72
-83
202
7.90
6 N
a N
a 19
9 13
2 N
a N
a 1.
302
2.32
2 84
-95
82
5.50
6 N
a N
a 25
2 11
8 N
a N
a 1.
118
1.66
3 96
-107
51
3.
706
Na
Na
262
121
Na
Na
985
1.13
9 10
8-11
9 16
2.
193
Na
Na
190
87
Na
Na
659
643
120-
131
10
1.43
2 N
a N
a 19
2 80
N
a N
a 48
8 47
0 13
2-14
3 0
614
Na
Na
114
50
Na
Na
270
227
144-
155
4 40
6 N
a N
a 83
45
N
a N
a 18
5 14
4 15
6 &
>
0 70
7 N
a N
a 99
35
N
a N
a 30
2 25
9 To
tal
1.32
5 76
.507
3.
964
10.7
95
2.32
8 1.
277
110
26.8
73
11.3
57
21.8
12

38
Tab
le 2
5: E
xtra
pola
ted
age
dist
ribu
tion
of te
sted
hea
lthy
slau
ghte
red
anim
als
Rep
orte
d as
A
TB
E
DK
D
EE
LE
SFI
FRIE
IT
LU
NL
PTSV
UK
E
U15
<
24
0 14
8 1.
685
511.
012
194
1.61
7 27
2 0
0 50
6 3
1.05
7 0
43
3 51
6.53
9 24
-35
0
29.3
18
29.7
82
520.
017
1.76
2 52
.769
14
.056
56
4.95
4 21
4.40
5 12
6.12
2 2.
780
45.7
29
4.58
8 1.
005
364
1.60
7.65
0 36
-47
0
78.7
46
58.0
28
293.
951
3.27
9 50
.277
24
.871
62
1.87
7 85
.412
93
.894
3.
395
84.9
60
9.84
0 1.
936
35.7
28
1.44
6.19
3 48
-59
0
75.1
76
55.7
64
258.
438
3.53
3 56
.939
23
.421
36
7.25
8 37
.240
94
.581
2.
190
83.9
57
11.1
71
2.12
0 64
.930
1.
136.
717
60-7
1 0
56
.882
41
.907
21
4.72
3 3.
294
52.2
77
17.6
92
299.
423
32.5
33
83.9
87
9.55
5 68
.669
10
.128
1.
740
63.1
14
955.
923
72-8
3 0
41
.238
26
.895
16
8.45
2 3.
183
46.5
93
11.8
16
254.
504
31.2
87
67.8
89
1.26
7 55
.127
9.
600
1.25
8 52
.011
77
1.12
0 84
-95
0
29.7
08
17.3
80
127.
046
2.68
0 41
.710
7.
161
209.
863
14.3
12
53.3
71
1.02
2 42
.210
8.
266
686
11.8
84
567.
299
96-1
07
0
0 10
.043
0
2.
095
29.7
37
0
0 0
39.3
95
0 26
.961
6.
536
0 2.
576
117.
342
108-
119
0
0 5.
249
0
1.51
7 23
.546
0
0
0
28.7
22
0
14.6
08
5.10
0 0
1.99
5 80
.737
12
0-13
1 0
0
2.83
2 0
1.
004
18.0
52
0
0
0 20
.359
0
8.
985
3.51
8 0
1.51
8 56
.268
13
2-14
3 0
0
1.48
2 0
74
3 14
.230
0
0
0
15.1
00
0
4.86
3 2.
612
0 1.
233
40.2
63
144-
155
0
0 76
2 0
48
6 12
.946
0
0
0
11.3
79
0
2.48
8 2.
070
0 79
4 30
.925
15
6 &
>
0
0 94
5 0
76
3 39
.399
0
0
0
23.9
76
0
2.37
6 8.
244
0 1.
472
77.1
74
96 &
>
0
44.9
68
0
243.
966
0
25.5
99
8.76
8 60
2.27
8 18
6.09
0 0
2.33
9 0
0
1.06
5 0
1.11
5.07
2 <
30
1.01
2 0
0
0
0
0 0
0
0
0 0
0
0
0 0
1.01
2 >
30
204.
647
0 0
0
0 0
0
0
0 0
0
0
0 0
0 20
4.64
7 To
tal
205.
659
356.
184
252.
753
2.33
7.60
5 24
.533
46
5.68
9 10
8.05
7 2.
920.
157
601.
279
659.
282
22.5
51
441.
991
81.6
73
9.85
1 23
7.61
9 8.
724.
883
Rep
orte
d as
C
YC
Z E
E
HU
LT
LV
MT
PLSI
SK
< 24
0
24
Na
Na
8 17
N
a N
a 52
53
24
-35
11
15.3
99
Na
Na
330
234
Na
Na
17.9
66
6.46
6 36
-47
473
26.7
50
Na
Na
700
432
Na
Na
5.72
8 10
.930
48
-59
1.15
0 23
.694
N
a N
a 61
1 48
1 N
a N
a 4.
610
9.91
1 60
-71
1.95
4 18
.780
N
a N
a 64
7 51
9 N
a N
a 4.
537
9.17
9 72
-83
2.36
6 14
.323
N
a N
a 55
6 56
6 N
a N
a 4.
269
7.54
4 84
-95
437
11.3
60
Na
Na
757
568
Na
Na
4.11
7 6.
266
96-1
07
9 8.
207
Na
Na
884
413
Na
Na
3.65
6 4.
835
108-
119
2 5.
872
Na
Na
707
400
Na
Na
2.79
1 3.
327
120-
131
0 3.
874
Na
Na
715
327
Na
Na
2.22
9 2.
533
132-
143
0 2.
166
Na
Na
502
300
Na
Na
1.64
8 1.
598
144-
155
0 1.
377
Na
Na
471
258
Na
Na
1.27
3 1.
219
156
& >
0
1.41
6 N
a N
a 53
0 32
3 N
a N
a 1.
875
1.33
7 To
tal
6.40
1 13
3.24
2 19
86
.595
7.
418
4.83
8 1.
089
428.
452
54.7
51
65.1
99

39
Tab
le 2
6: E
xtra
pola
ted
age
dist
ribu
tion
of te
sted
BSE
susp
ects
R
epor
ted
as
AT
BE
D
K
DE
EL
ES
FIFR
IE
ITL
UN
LPT
SVU
K
EU
15
< 24
0
10
0 50
0
4 0
0 3
1 0
0 0
0 5
74
24-3
5 0
33
11
200
0 3
4 22
17
10
1
5 5
0 17
32
8 36
-47
0 38
8
144
0 3
0 20
29
11
1
7 10
0
22
293
48-5
9 0
28
7 12
0 0
9 1
50
30
8 1
5 10
0
35
305
60-7
1 0
21
5 10
2 0
20
0 38
28
10
0
1 16
0
55
297
72-8
3 0
11
2 90
0
10
0 73
44
5
0 5
14
0 34
28
8 84
-95
0 9
3 57
0
12
0 11
4 67
8
0 2
13
0 46
33
1 96
-107
0
0 2
0 1
3 0
0 0
6 0
0 14
0
86
112
108-
119
0 0
0 0
0 2
0 0
0 2
0 0
12
0 67
83
12
0-13
1 0
0 0
0 0
0 0
0 0
0 0
0 3
0 32
35
13
2-14
3 0
0 0
0 0
0 0
0 0
0 0
0 1
0 20
21
14
4-15
5 0
0 0
0 0
1 0
0 0
1 0
0 2
0 14
18
15
6 &
>
0 0
0 0
0 4
0 0
0 1
0 0
6 0
17
28
96 &
>
0 17
0
90
0 1
0 12
5 12
6 0
1 2
0 0
0 36
2 >
30
2 0
0 0
0 0
0 0
0 0
0 0
0 0
0 0
Tota
l 2
167
38
854
1 72
5
442
344
63
4 27
10
6 0
452
2.57
5
R
epor
ted
as
CY
C
Z
EE
H
U
LT
L
V
MT
PL
SI
SK
<
24
0 0
0 N
a 0
3 0
Na
13
0 24
-35
0 1
0 N
a 0
1 0
Na
4 2
36-4
7 0
0 0
Na
0 3
0 N
a 6
1 48
-59
0 0
0 N
a 0
0 0
Na
0 0
60-7
1 0
0 0
Na
0 0
0 N
a 4
0 72
-83
0 0
0 N
a 0
2 0
Na
1 0
84-9
5 0
0 0
Na
0 0
0 N
a 0
0 96
-107
0
0 0
Na
0 0
0 N
a 1
0 10
8-11
9 0
0 0
Na
0 0
0 N
a 1
0 12
0-13
1 0
0 0
Na
0 1
0 N
a 0
0 13
2-14
3 0
0 0
Na
0 1
0 N
a 1
0 14
4-15
5 0
0 0
Na
0 0
0 N
a 0
0 15
6 &
>
0 0
0 N
a 0
0 0
Na
0 0
Tota
l 0
1 0
98
0 11
0
51
32
3

40
Tab
le 2
7: E
xtra
pola
ted
age
dist
ribu
tion
of te
sted
ani
mal
s cul
led
in th
e fr
ame
of B
SE e
radi
catio
n R
epor
ted
as
AT
B
E
DK
D
E
EL
E
S FI
FR
IE
IT
L
U
NL
PT
SV
U
K
EU
15
< 24
0
9 11
48
0
127
0 0
53
776
0 14
6 0
0 29
1 1.
461
24-3
5 0
306
82
42
0 70
0
27
1.54
5 29
7 0
68
31
0 34
2.
502
36-4
7 0
267
67
89
0 20
4 0
13
1.33
3 26
5 0
66
33
0 47
2.
385
48-5
9 0
188
37
193
0 44
6 0
77
2.13
1 20
7 0
218
78
0 57
3.
632
60-7
1 0
142
281
253
0 50
9 0
197
2.07
7 17
4 0
173
158
0 37
4.
000
72-8
3 0
100
775
320
0 44
8 0
328
1.33
1 17
7 0
116
221
0 10
3.
827
84-9
5 0
57
455
159
0 27
0 0
427
1.33
1 95
2
54
293
0 0
3.14
4 96
& >
0
55
0 21
0
181
0 60
0 2.
184
0 0
29
0 0
0 3.
070
Tota
l 0
1.12
5 1.
791
1.12
5 0
2.35
6 0
1.66
9 11
.986
2.
148
2 87
0 1.
270
0 47
5 24
.817
Rep
orte
d as
C
Y
CZ
E
E
HU
L
T
LV
M
T
PL
SI
SK
< 24
0
1 0
0 0
0 0
Na
7 1
24-3
5 0
53
0 0
0 0
0 N
a 3
2 36
-47
0 40
2 0
0 0
0 0
Na
7 1
48-5
9 0
245
0 0
0 0
0 N
a 5
0 60
-71
0 0
0 0
0 0
0 N
a 2
2 72
-83
0 4
0 0
0 0
0 N
a 0
2 84
-95
0 0
0 0
0 0
0 N
a 1
2 96
-107
0
0 0
0 0
0 0
Na
0 1
108-
119
0 0
0 0
0 0
0 N
a 0
0 12
0-13
1 0
0 0
0 0
0 0
Na
1 0
132-
143
0 0
0 0
0 0
0 N
a 1
0 14
4-15
5 0
0 0
0 0
0 0
Na
0 0
156
& >
0
1 0
0 0
0 0
Na
0 0
Tota
l 0
706
0 0
0 0
0 37
27
11

41
Chart 22: Extrapolated mean age distribution of cattle tested in different target groups in the EU15
0%
5%
10%
15%
2 0%
25%
Risk animals 1% 18% 15% 13% 12 % 10 % 7% 2 3%
Healthy Sl. 6% 18% 17% 13% 11% 9 % 6 % 13 %
Susp ects 3% 13% 11% 12% 12 % 11% 13 % 14 %
Culled cat t le 6% 8% 9 % 14% 16 % 16 % 13 % 12 %
< 2 4 24 -3 5 3 6-4 7 48 -59 60 -71 72 -8 3 8 4-95 96 and >
Chart 23: Extrapolated age distribution in risk animals tested in some major Member States
0%
5%
10%
15%
20%
25%
30%
< 24 24-35 36-47 48-59 60-71 72-83 84-95 96 and >
UK
DE
FR
ES
PT
IE
Chart 24: Extrapolated age distribution in healthy slaughtered cattle tested in some major Member States
0%
5%
10%
15%
20%
25%
30%
35%
40%
< 24 24-35 36-47 48-59 60-71 72-83 84-95 96 and >
UK
DE
FR
ES
PT
IRL

42
Tab
le 2
8: P
reva
lenc
e of
BSE
in c
attle
(pos
itive
cas
es p
er 1
0.00
0 te
sts)
of d
iffer
ent a
ge: t
otal
pop
ulat
ion
BE
D
K
DE
E
S FR
IE
IT
N
L
PT
UK
E
U 1
5 C
Z
PL
SI
SK
< 24
0,
00
0,00
0,
00
0,00
0,
00
0,00
0,
00
0,00
0,
00
0,00
0,
00
0,00
0,
00
0,00
0,
00
24-3
5 0,
00
0,00
0,
00
0,00
0,
00
0,00
0,
00
0,00
0,
00
0,00
0,
00
0,00
0,
00
0,00
0,
00
36-4
7 0,
00
0,00
0,
06
0,16
0,
00
0,00
0,
00
0,00
0,
00
0,16
0,
02
0,50
0,
00
1,39
0,
00
48-5
9 0,
12
0,00
0,
44
1,45
0,
02
0,00
0,
00
0,21
2,
03
1,11
0,
30
0,00
0,
00
0,00
0,
00
60-7
1 0,
49
0,21
0,
36
7,48
0,
30
0,49
0,
29
0,25
18
,62
2,41
1,
11
0,00
N
a 0,
00
0,00
72
-83
0,89
0,
00
0,83
6,
53
0,57
0,
52
1,22
1,
58
23,4
8 2,
42
1,59
0,
45
Na
0,00
1,
01
84-9
5 0,
93
0,49
0,
83
6,39
1,
25
37,1
9 1,
25
0,62
17
,39
21,5
1 3,
64
0,00
N
a 0,
00
1,26
96
-107
0,00
3,65
0,
64
0,00
15
,09
63,3
2
0,84
0,
00
0,00
0,
00
108-
119
0,
00
2,
85
0,89
0,
00
32,7
7 67
,19
0,
00
0,00
0,
00
0,00
12
0-13
1
0,00
0,93
0,
42
0,00
30
,48
56,4
7
0,00
0,
00
0,00
0,
00
132-
143
0,
00
0,
60
0,57
0,
00
8,68
58
,97
0,
00
0,00
0,
00
0,00
14
4-15
5
0,00
0,00
0,
00
3,90
3,
60
33,2
7
0,00
0,
00
0,00
0,
00
156
& >
0,00
0,89
0,
72
0,00
1,
78
41,9
2
0,00
0,
00
0,00
0,
00
96 &
>
0,81
0,
00
0,07
1,
46
0,82
4,
82
0,61
0,
15
14,7
1 56
,44
4,15
0,
31
0,00
0,
00
0,00

43
Tab
le 2
9: P
reva
lenc
e of
BSE
in c
attle
(pos
itive
cas
es p
er 1
0.00
0 te
sts)
of d
iffer
ent a
ge: r
isk
anim
als
B
E
DK
D
E
ES
FR
IE
IT
NL
PT
U
K
EU
15
CZ
PL
SI
SK
<
24
0,00
0,
00
0,00
0,
00
0,00
0,
00
0,00
0,
00
0,00
0,
00
0,00
0,
00
0,00
0,
00
0,00
24
-35
0,00
0,
00
0,00
0,
00
0,00
0,
00
0,00
0,
00
0,00
0,
00
0,00
0,
00
0,00
0,
00
0,00
36
-47
0,00
0,
00
0,28
0,
00
0,00
0,
00
0,00
0,
00
0,00
0,
36
0,11
0,
00
0,00
6,
75
0,00
48
-59
0,00
0,
00
1,13
2,
55
0,00
0,
00
0,00
1,
98
5,76
1,
61
0,88
0,
00
0,00
0,
00
0,00
60
-71
4,56
0,
00
0,94
13
,22
1,55
3,
08
0,56
0,
00
42,0
7 5,
41
3,49
0,
00
0,00
0,
00
0,00
72
-83
2,90
0,
00
2,89
20
,74
4,05
0,
00
4,35
3,
81
41,3
7 5,
40
5,68
1,
26
0,00
0,
00
4,31
84
-95
3,90
0,
00
2,32
12
,32
8,26
15
8,85
3,
73
0,00
39
,51
17,9
1 12
,66
0,00
0,
00
0,00
0,
00
96-1
07
0,
00
10
,36
0,00
0,
00
27,9
8 43
,08
0,
00
0,00
0,
00
0,00
10
8-11
9
0,00
11,0
5
1,
98
0,00
68
,80
46,3
7
0,00
0,
00
0,00
0,
00
120-
131
0,
00
2,
96
2,95
0,
00
50,1
3 47
,38
0,
00
0,00
0,
00
0,00
13
2-14
3
0,00
4,07
0,
00
0,00
37
,31
51,8
4
0,00
0,
00
0,00
0,
00
144-
155
0,
00
0,
00
0,00
0,
00
14,5
6 32
,91
0,
00
0,00
0,
00
0,00
15
6 &
>
0,
00
1,
88
5,54
0,
00
0,00
38
,78
0,
00
0,00
0,
00
0,00
96
& >
2,
26
0,00
0,
33
5,11
5,
24
15,4
8 1,
70
0,00
27
,47
43,8
5 16
,51
0,00
0,
00
0,00
0,
00

44
Tab
le 3
0: P
reva
lenc
e of
BSE
in c
attle
(pos
itive
cas
es p
er 1
0.00
0 te
sts)
of d
iffer
ent a
ge: h
ealth
y sl
augh
tere
d an
imal
s
B
E
DK
D
E
ES
FR
IE
IT
NL
PT
U
K
EU
15
CZ
PL
SI
SK
<
24
0,00
0,
00
0,00
0,
00
0,00
0,
00
0,00
0,
00
0,00
0,
00
0,00
0,
00
0,00
0,
00
0,00
24
-35
0,00
0,
00
0,00
0,
00
0,00
0,
00
0,00
0,
00
0,00
0,
00
0,00
0,
00
0,00
0,
00
0,00
36
-47
0,00
0,
00
0,00
0,
20
0,00
0,
00
0,00
0,
00
0,00
0,
00
0,01
0,
75
0,00
0,
00
0,00
48
-59
0,13
0,
00
0,23
0,
70
0,03
0,
00
0,00
0,
00
0,90
0,
31
0,13
0,
00
0,00
0,
00
0,00
60
-71
0,18
0,
00
0,23
3,
83
0,10
0,
00
0,24
0,
29
8,89
0,
79
0,49
0,
00
Na
0,00
0,
00
72-8
3 0,
73
0,00
0,
36
3,00
0,
04
0,32
0,
59
0,91
12
,50
0,00
0,
60
0,00
N
a 0,
00
0,00
84
-95
0,67
0,
58
0,47
4,
32
0,33
4,
89
0,75
0,
71
3,63
0,
84
0,92
0,
00
Na
0,00
1,
60
96-1
07
0,
00
2,
02
0,51
0,
00
7,65
11
,65
1,
22
0,00
0,
00
0,00
10
8-11
9
0,00
0,85
0,
70
0,00
5,
88
20,0
6
0,00
0,
00
0,00
0,
00
120-
131
0,
00
0,
55
0,00
0,
00
25,5
8 32
,94
0,
00
0,00
0,
00
0,00
13
2-14
3
0,00
0,00
0,
66
0,00
0,
00
16,2
3
0,00
0,
00
0,00
0,
00
144-
155
0,
00
0,
00
0,00
4,
02
0,00
12
,59
0,
00
0,00
0,
00
0,00
15
6 &
>
0,
00
0,
76
0,00
0,
00
2,43
20
,39
0,
00
0,00
0,
00
0,00
96
& >
0,
67
0,00
0,
00
0,73
0,
30
1,24
0,
36
0,17
6,
77
18,7
8 0,
65
0,44
0,
00
0,00
0,
00
Tab
le 3
1: P
reva
lenc
e of
BSE
in c
attle
(pos
itive
cas
es p
er 1
0.00
0 te
sts)
of d
iffer
ent a
ge: c
ulle
d bo
vine
ani
mal
s
B
E
DK
D
E
ES
FR
IE
IT
NL
PT
U
K
EU
15
CZ
PL
SI
SK
<
24
0,00
0,
00
0,00
0,
00
0,00
0,
00
0,00
0,
00
0,00
0,
00
0,00
0,
00
0,00
0,
00
0,00
24
-35
0,00
0,
00
0,00
0,
00
0,00
0,
00
0,00
0,
00
0,00
0,
00
0,00
0,
00
0,00
0,
00
0,00
36
-47
0,00
0,
00
0,00
0,
00
0,00
0,
00
0,00
0,
00
0,00
0,
00
0,00
0,
00
0,00
0,
00
0,00
48
-59
0,00
0,
00
51,9
4 0,
00
0,00
0,
00
0,00
0,
00
0,00
0,
00
2,75
0,
00
0,00
0,
00
0,00
60
-71
0,00
0,
00
0,00
19
,65
0,00
0,
00
0,00
0,
00
0,00
0,
00
2,50
0,
00
0,00
0,
00
0,00
72
-83
0,00
0,
00
0,00
0,
00
0,00
0,
00
0,00
0,
00
0,00
0,
00
0,00
0,
00
0,00
0,
00
0,00
84
-95
0,00
0,
00
0,00
0,
00
0,00
7,
51
0,00
0,
00
0,00
0,
00
3,18
0,
00
0,00
0,
00
0,00
96
& >
0,
00
0,00
0,
00
0,00
0,
00
0,00
0,
00
0,00
0,
00
0,00
0,
00
0,00
0,
00
0,00
0,
00

45
Tab
le 3
2: P
reva
lenc
e of
BSE
in c
attle
(pos
itive
cas
es p
er 1
0.00
0 te
sts)
of d
iffer
ent a
ge: B
SE su
spec
ts
BE
D
K
DE
E
S FR
IE
IT
N
L
PT
UK
E
U 1
5 C
Z
PL
SI
SK
< 24
0
0 0
0 0
0 0
0 0
0 0
0 0
0 0
24-3
5 0
0 0
0 0
0 0
0 0
0 0
0 0
0 0
36-4
7 0
0 69
0
0 0
0 0
0 0
34
0 0
0 0
48-5
9 0
0 16
6 33
33
0 0
0 0
0 11
35
295
0 0
0 0
60-7
1 0
2000
98
60
00
526
0 0
0 18
75
542
742
0 N
a 0
0 72
-83
0 0
332
3000
54
8 22
8 0
4000
42
86
1753
86
7 0
0 0
0 84
-95
0 0
351
3333
35
1 26
98
0 0
5385
69
10
2024
0
0 0
0 96
-107
0
0
3333
16
67
21
43
6545
0 0
0 0
108-
119
0 0
50
00
0
7500
62
27
0
0 0
0 12
0-13
1 0
0
0
0
0
5277
0 0
0 0
132-
143
0 0
0
0
0 54
63
0
0 0
0 14
4-15
5 0
0
0
0
0
4967
0 0
0 0
156
& >
0
0
0
0
0
4090
0 0
0 0
96 &
>
0 0
111
1818
80
17
44
1000
0
3158
59
18
2712
0
Na
0 0
Cha
rt 2
5: P
reva
lenc
e of
BSE
per
targ
et g
roup
in c
attle
of d
iffer
ent a
ge in
the
EU
15
0,00
2,00
4,00
6,00
8,00
10,0
0
12,0
0
14,0
0
16,0
0
18,0
0
< 24
24-3
536
-47
48-5
960
-71
72-8
384
-95
96 a
nd >
Positives per 10.000 tested
Risk
ani
mal
s
Hea
lthy
Sl.
Culle
d ca
ttle

46
Charts 26: BSE prevalence (positive per 10.000 cattle tested) in healthy slaughtered cattle in Member States with more than 10 positive cases in 2003 (NL is used as reference)
0,000,100,200,300,400,500,600,700,800,901,00
< 24 24-35 36-47 48-59 60-71 72-83 84-95 96 and>
Months of age
Posit
ives
per
10.
000
teste
dNL
BE
DE
FR
IT
0,00
2,00
4,00
6,00
8,00
10,00
12,00
14,00
< 24 24-35 36-47 48-59 60-71 72-83 84-95 96 and>
Months of age
Posit
ives
per
10.
000
teste
d
NL
ES
IE
PT
Chart 27: BSE prevalence (positive/10.000 cattle tested) in healthy slaughtered cattle in the EU15
0,000,501,00
1,502,002,503,003,50
4,004,505,00
< 24 24-35 36-47 48-59 60-71 72-83 84-95 96 and>
Posit
ives
per
10.
000
teste
d
UK
EU15-UK

47
Charts 28: BSE prevalence (positive per 10.000 cattle tested) in risk animals in Member States with more than 10 positive case in 2003 (NL is used as reference)
0,00
1,00
2,00
3,00
4,00
5,00
6,00
7,00
8,00
9,00
< 24 24-35 36-47 48-59 60-71 72-83 84-95 96 and>
Posit
ives
per
10.
000
teste
dNL
BE
DE
FR
IT
0,00
20,00
40,00
60,00
80,00
100,00
120,00
140,00
160,00
180,00
0,00 0,00 0,00 5,76 42,07 41,37 39,51 27,47
Posit
ives
per
10.
000
teste
d
NL
ES
IE
PT
Chart 29: BSE prevalence (positive per 10.000 cattle tested) in risk animals in the EU15
0,005,00
10,00
15,0020,0025,0030,0035,00
40,0045,0050,00
< 24 24-35 36-47 48-59 60-71 72-83 84-95 96 and>
Posit
ives
per
10.
000
teste
d
UK
EU15-UK

48
Charts 30: Comparison of the prevalence of BSE in healthy slaughtered cattle of different age in 2001, 2002 and 2003
Deutschland
0,00
0,20
0,40
0,60
0,80
1,00
1,20Po
sitiv
es p
er 1
0.00
0 te
sted
2 0 03 0 ,0 0 0 ,00 0 ,00 0 ,23 0 ,23 0 ,3 6 0 ,4 7 0 ,0 0
2 .0 02 0 ,0 0 0 ,00 0 ,00 0 ,13 0 ,32 1,12 0 ,3 4 0 ,11
2 .0 01 0 ,0 0 0 ,00 0 ,00 0 ,39 0 ,84 0 ,2 9 0 ,0 0 0 ,13
< 2 years 2 years 3 years 4 years 5 years 6 years 7 years > 8 years
France
0,00
0,50
1,00
1,50
2,00
2,50
posit
ives
per
10.
000
teste
d
2 0 03 0 ,0 0 0 ,00 0 ,00 0 ,03 0 ,10 0 ,0 4 0 ,3 3 0 ,3 0
2 .0 02 0 ,0 0 0 ,00 0 ,00 0 ,06 0 ,30 0 ,8 6 1,2 1 0 ,2 6
2 .0 01 0 ,0 0 0 ,00 0 ,02 0 ,06 0 ,85 1,9 1 0 ,8 7 0 ,0 4
< 2 years 2 years 3 years 4 years 5 years 6 years 7 years > 8 years
España
0,00
1,00
2,00
3,00
4,00
5,00
Posit
ives
per
10.
000
teste
d
2 0 03 0 ,0 0 0 ,00 0 ,2 0 0 ,70 3 ,8 3 3 ,00 4 ,3 2 0 ,73
20 02 0 ,0 0 0 ,00 0 ,0 0 0 ,46 2 ,31 2 ,75 2 ,50 0 ,64
20 01 0 ,0 0 0 ,00 0 ,31 1,8 9 1,14 1,8 5 3 ,58 0 ,40
< 2 years 2 years 3 years 4 years 5 years 6 years 7 years > 8 years

49
België/Belgique
0,000,501,001,502,002,503,00
Posi
tives
per
10.
000
test
ed
2 0 03 0 ,0 0 0 ,0 0 0 ,00 0 ,13 0 ,18 0 ,73 0 ,67 0 ,6 7
2 .0 02 0 ,0 0 0 ,0 0 0 ,00 0 ,0 0 1,24 1,02 1,19 0 ,0 0
2 .0 01 0 ,0 0 0 ,0 0 0 ,00 0 ,2 7 2 ,6 3 1,43 1,10 0 ,4 9
< 2 years 2 years 3 years 4 years 5 years 6 years 7 years > 8 years
Ireland
0,00
2,00
4,00
6,00
8,00
Posi
tives
per
10.
000
test
ed
2 0 03 0 ,0 0 0 ,0 0 0 ,00 0 ,0 0 0 ,0 0 0 ,3 2 4 ,89 1,24
2 .0 02 0 ,0 0 0 ,0 0 0 ,00 0 ,0 0 0 ,0 0 2 ,81 7,35 1,26
2 .0 01 0 ,0 0 0 ,0 0 0 ,00 0 ,0 0 3 ,3 4 2 ,56 2 ,86 0 ,9 2
< 2 years 2 years 3 years 4 years 5 years 6 years 7 years > 8 years
Portugal
0,00
5,00
10,00
15,00
20,00
25,00
30,00
Posi
tives
per
10.
000
test
ed
2 0 03 0 ,0 0 0 ,00 0 ,00 0 ,9 0 8 ,89 12 ,50 3 ,6 3 6 ,77
20 02 0 ,0 0 1,6 4 1,3 4 2 ,4 8 10 ,67 10 ,52 14 ,00 4 ,36
2 .0 01 0 ,0 0 0 ,00 0 ,00 2 ,78 2 4 ,10 6 ,47 2 1,13 3 ,62
< 2 years 2 years 3 years 4 years 5 years 6 years 7 years > 8 years

50
United Kingdom
0,00
5,00
10,00
15,00
20,00
Posi
tives
per
10.
000
test
ed
2 0 03 0 ,0 0 0 ,00 0 ,00 0 ,3 1 0 ,79 0 ,0 0 0 ,8 4 18 ,78
20 02 0 ,0 0 0 ,00 0 ,00 0 ,24 0 ,60 8 ,17 0 ,0 0 13 ,09
< 2 years 2 years 3 years 4 years 5 years 6 years 7 years > 8 years
EU15
0,00
1,00
2,00
3,00
4,00
Posit
ives
per
10.
000
teste
d
2 0 03 0 ,0 0 0 ,00 0 ,0 1 0 ,13 0 ,49 0 ,6 0 0 ,9 2 0 ,6 5
2 .0 02 0 ,0 0 0 ,0 1 0 ,0 1 0 ,11 0 ,57 1,26 1,26 0 ,3 9
2 .0 01 0 ,0 0 0 ,03 0 ,10 1,3 7 3 ,6 1 2 ,9 3 1,85 0 ,3 9
< 2 years 2 years 3 years 4 years 5 years 6 years 7 years > 8 years
Comments on the prevalence of BSE in different age groups The data in the tables and the figures, in particular those concerning healthy slaughtered cattle, indicate differences between Member States with regard to the testing programme in young cattle. In the United Kingdom, the testing of healthy slaughtered cattle was concentrated on above 42 months old cattle born after the reinforced feed ban was considered effective (August 1996). A high number of tested young cattle may decrease the overall prevalence of BSE and the prevalence in a target group. Therefore differences in prevalence of BSE between Member States should be compared within the same age and target group. Tables 28 to 32 allow a comparison between Member States within a particular target and age group and is illustrated in Charts 26 to 29. However, the results should be interpreted with caution if the number of positive cases within a target and age group is limited. Chart 30 illustrates the evolution over one year of the prevalence per age group in healthy slaughtered bovine animals. It indicates a lower prevalence in young animals and a shift to older bovine animals in 2003 compared to 2002 in most Member States. This trend started already in 2002.

51
4.7
BSE
IN Y
OU
NG
BO
VIN
E A
NIM
AL
S
Cha
rt 3
1: N
umbe
r of
pos
itive
cas
es b
elow
60
mon
ths o
f age
in th
e E
U25
0246810121416
Age
(mon
ths)
2001
1513
1013
119
76
43
65
12
11
22
00
00
00
00
00
00
11
2002
46
116
26
77
23
23
11
10
00
10
10
00
01
01
00
00
2003
44
46
43
55
22
10
03
11
01
00
00
01
00
00
00
00
5958
5756
5554
5352
5150
4948
4746
4544
4342
4140
3938
3736
3534
3332
3130
2928

52
Table 33: BSE cases prevalence in cattle born in 1996 or later, detected in 2001, 2002 or 2003
Cattle population Prevalence (cases per 1 Mio cattle
≥ 2 years old ≥ 2 years old) of cattle born in (x 1000) 1996 1997 1998 1999 2000 2001 Belgique/België 1.424 26,0 7,7 0,7 0,0 0,0 0,0 Danmark 834 7,2 2,4 2,4 1,2 0,0 0,0 Deutschland 6.170 29,9 4,7 2,9 2,1 0,0 0,0 Ellas 325 3,1 0,0 0,0 0,0 0,0 0,0 España 3.530 24,6 27,2 9,3 1,4 0,3 0,0 France 10.817 6,8 2,8 0,7 0,0 0,0 0,0 Ireland 3.220 40,1 2,5 0,0 0,6 0,0 0,0 Italia 2.966 14,8 6,7 0,7 0,0 0,0 0,0 Luxembourg 95 10,5 0,0 0,0 0,0 0,0 0,0 Nederland 1.770 16,4 5,6 2,3 0,6 0,0 0,0 Österreich 974 1,0 0,0 0,0 0,0 0,0 0,0 Portugal 779 82,2 52,6 24,4 2,6 0,0 0,0 United Kingdom 4.919 17,7 8,1 3,9 1,2 0,0 0,0 EU 15 total 2001 39.700 6,2 1,1 0,1 0,0 0,0 0,0 EU 15 total 2002 39.000 7,0 2,3 0,8 0,2 0,0 0,0 EU 15 total 2003 37.823 4,2 3,8 1,8 0,6 0,03 0,0 Česká Republika 683 0,0 2,9 0,0 0,0 2,9 0,0 Polska 3.175 0,9 0,9 0,3 0,0 0,6 0,0 Slovenija 214 4,7 0,0 0,0 4,7 0,0 0,0 Slovenská Rep. 287 10,5 3,5 0,0 0,0 0,0 0,0 Evolution 2001→2002 Evolution 2002→2003
Chart 32: Prevalence (cases/1 Mio cattle pop. ≥ 2 years old) detected in 2001, 2002 or 2003 and born in 1996
0 10 20 30 40 50 60 70 80 90
Po lska
Österreich
Ellas
Slovenija
France
Danmark
Slo venská Rep .
Luxemb ourg
Italia
Ned erland
United Kingd o m
Deutschland
Esp aña
Belg iq ue/Belg ië
Ireland
Po rtug al
cases per 1 Mio cattle > 2 years old

53
Chart 33: Prevalence (cases/1 Mio cattle pop. ≥ 2 years old) detected in 2001, 2002 or 2003 and born in 1997
0 10 20 30 40 50 60
P o ls ka
Danmark
Ire land
France
Čes ká Republika
Slo vens ká Rep.
Deuts chland
Nederland
Ita lia
Be lgique/Be lgië
United Kingdo m
Es paña
P o rtuga l
cases per 1 Mio cattle > 2 years old
Chart 34: Prevalence (cases/1 Mio cattle pop. ≥ 2 years old) detected in 2001, 2002 or 2003 and born in 1998
0 5 10 15 20 25 30
P o ls ka
Belgique/Be lgië
France
Ita lia
Nederland
Danmark
Deuts chland
United Kingdo m
Es paña
P o rtuga l
cases per 1 Mio cattle > 2 years old

54
Chart 35: Prevalence (cases/1 Mio cattle pop. ≥ 2 years old) detected in 2001, 2002 or 2003 and born in 1999
0 1 2 3 4 5
Nederland
Ire land
Danmark
United Kingdo m
Es paña
Deuts chland
P o rtuga l
Slo venija
cases per 1 Mio cattle > 2 years old
Chart 36: Prevalence (cases/10.000 tested) detected in 2002 or 2003 between 24 and 47 months of age
0 0,1 0,2 0,3 0,4 0,5 0,6 0,7
PT
DK
UK
ES
IE
DE
20032002

55
Chart 37: Prevalence (cases/10.000 tested) detected in 2002 or 2003 between 48 and 59 months of age
0,00 1,00 2,00 3,00 4,00 5,00 6,00
PT
ES
UK
DE
NL
IT
BE
FR
IE
20032002
Table 34: Age and date of birth distribution in cases born in 1996 or later reported since the beginning of 2001 until March 2004 in the EU15
Year of Age (months) Birth 24-29 30-35 36-41 42-47 48-53 54-59 60-65 66-71 72-77 78-83 84-89 90-95 1996 1 10 55 113 158 132 116 74 44 1997 0 0 6 27 40 56 77 67 30 2 1998 2 0 0 3 22 26 40 34 3 1999 0 2 2 5 15 14 3 2000 0 0 1 1 1 2001 0 0 0
Underestimated figures because the monitoring was more limited before July 2001 Provisional figure which still may increase by future monitoring

56
Chart 38: Age pattern of positive cases born since 1996 and detected since 2001 in the EU15
0
20
40
60
80
100
120
140
160
180
24-29
30-35
36-41
42-47
48-53
54-59
60-65
66-71
72-77
78-83
84-89
No.
of c
ases
1996
1997
1998
1999
2000
2001
Table 35: Details on positive cases < 48 months detected in 2003 in the EU25
Age (months) Member State Target group Date of birth36 Spain (EU15) Healthy slaughter 11/12/2000 42 Czech Republic (new MS) Healthy slaughter 15/4/2000 44 Slovenia (new MS) Fallen Stock 12/7/1999 45 Germany (EU15) Suspect 24/12/1999 46 Czech Republic (new MS) Healthy slaughter 15/1/2000 46 United Kingdom (EU15) Emergency slaughter 12/03/1999 46 Germany (EU15) Fallen Stock 24/12/1999
In 2002 and 2001, respectively 7 and 10 cases below 48 months were detected in the EU15 (2003: 4 cases in EU15). Comments on BSE in young animals Comparisons in this section should be interpreted with caution since the number of cases born after 1996 is rather low. However, the decreasing prevalence by date of birth in Table 33 may be an indication of the effectiveness of measures to prevent BSE infection in cattle in certain Member States in the period 1996 to 1999. In some Member States the trend is not consistently decreasing. Although the total prevalence in the UK is slightly underestimated due to the differences in the monitoring programme, the prevalence in the UK in cattle born in 1996 or later can be compared with other Member States. It seems to be similar to several other MS. Charts 36 and 37, and Table 35 illustrate the reduction of BSE cases in young cattle detected in 2003 as compared to 2002. In the EU15 in 2003, 43 cases below 60 months were detected compared to 66 in 2002 (see chart 30 which includes also 3 cases detected in new Member States in 2003). The reduction (35%) is similar as the overall reduction. Once more information becomes available in the coming year(s), it may be possible to make an estimation of BSE cases to be expected in the future by evaluating the evolution of the figures from left to right in Table 32 or by completing the curves to the right in Charts 38.

57
5. SUMMARY OF SCRAPIE TESTING IN OVINE AND CAPRINE ANIMALS DURING 2003
The information is extracted directly from the monthly reports since January 2003. The monthly information is often updated and/or corrected by the Member States in subsequent reports. The information shown in the following summaries is updated according to the information received on 1 May 2004. 5.1 SAMPLING Table 36: Number of tests performed in ovine animals per target group Healthy Risk animals Suspects Culling Others or Total slaughtered unspecified Belgique/België 2.376 496 6 205 0 3.083 Danmark 871 1.320 5 0 0 2.196 Deutschland 20.116 48.629 353 3.429 0 72.527 Ellas 22.613 793 163 236 0 23.805 España 49.940 12.950 57 6.601 0 69.548 France 44.687 18.989 69 16.239 0 79.984 Ireland 51.588 2.848 44 510 0 54.990 Italia* 35.274 5.024 19 3.641 810 44.768 Luxembourg 213 244 0 0 0 457 Nederland 21.140 4.000 61 100 0 25.301 Österreich 4.225 3.255 1 0 219 7.700 Portugal 10.703 243 0 31 3.800 14.777 Suomi/Finland 1.990 683 0 0 0 2.673 Sverige 5.177 2.849 25 121 0 8.172 United Kingdom 72.518 5.126 494 0 0 78.138 Total EU 15 343.431 107.449 1.297 31.113 4.785 488.119 Česká Republika 426 2.528 0 16 0 2.970 Slovenská Rep. 3.924 214 1 1 562 4.702 Norway 33.524 3.367 15 1.072 0 37.978 *: including 509 samples of unspecified species

58
Table 37: Number of tests performed in caprine animals per target group Healthy Risk Suspects Culling Others or Total slaughtered animals unspecified Belgique/België 70 46 4 0 0 120 Danmark 93 352 3 0 0 448 Deutschland 1.216 3.559 20 44 0 4.839 Ellas 6.425 526 28 121 0 7.100 España 6.893 1.024 3 18 0 7.938 France 11.223 12.026 1 4.109 0 27.359 Ireland 0 1 0 0 0 1 Italia 3.642 1.193 2 256 133 5.226 Luxembourg 54 2 0 0 0 56 Nederland 3.654 1.456 0 0 0 5.110 Österreich 609 786 0 0 23 1.418 Portugal 2.174 44 0 0 569 2.787 Suomi/Finland 57 171 0 22 0 250 Sverige 51 70 4 0 0 125 United Kingdom 191 54 0 0 0 245 Total EU 15 36.352 21.310 65 4.570 714 63.022 Česká Republika 42 231 0 1 0 274 Slovenská Rep. 4 4 0 0 0 8 Norway 1.610 221 2 0 0 1.833
5.2 POSITIVE CASES
Table 38: Total positives detected in ovine and caprine animals Sheep Goats Number Total Total Total Total of herds tests positives tests positives Belgique/België 3.083 2 120 0 2 Danmark 2.196 0 448 0 0 Deutschland 72.527 23 4.839 0 23 Ellas 23.805 124 7.100 19 136 España 69.548 138 7.938 1 31 France 79.984 750 27.359 19 131 Ireland 54.990 49 1 0 39 Italia 44.768 190 5.226 6 34 Luxembourg 457 0 56 0 0 Nederland 25.301 63 5.110 0 63 Österreich 7.700 0 1.418 0 0 Portugal 14.777 6 2.787 0 1 Suomi/Finland 2.673 0 250 0 0 Sverige 8.172 4 125 0 4 United Kingdom 78.138 438 245 1 435 Total EU 15 488.119 1.787 63.022 46 899 Česká Republika 2.970 12 274 0 2 Slovenská Rep. 4.702 3 8 0 3 Norway 37.977 15 1.835 0 15

59
Map 2: European Countries where scrapie was reported in 2003
countries with cases countries without cases having submitted data on active monitoring countries without cases and not having submitted data
Table 39: Positives detected by active monitoring and passive surveillance (suspects) in ovine and caprine animals
Sheep Goats Population Positives No. of suspects Population Positives No. of suspects x 1000 Act. Mon. Suspects in population* x 1000 Act. Mon. Suspects in population*
Belgique/België 146 2 0 41 26 0 0 154 Danmark 105 0 0 48 10 0 0 300 Deutschland 2.637 23 0 134 160 0 0 125 Ellas 9.042 69 55 18 5.362 9 10 5 España 23.045 124 14 2 2.952 1 0 1 France 8.962 709 41 8 1.228 19 0 1 Ireland 5.907 33 16 7 9 0 0 0 Italia 7.952 172 18 2 961 5 1 2 Luxembourg 7 0 0 0 2 0 0 0 Nederland 1.276 51 12 48 274 0 0 0 Österreich 304 0 0 3 56 0 0 0 Portugal 3.411 6 0 0 509 0 0 0 Suomi/Finland 67 0 0 0 5 0 0 0 Sverige 451 2 2 55 5 0 0 800 United Kingdom 24.574 58 380 20 88 1 0 0 Total EU15 87.886 1249 538 15 11.647 35 11 6 Česká Republika 103 12 0 0 38 0 0 0 Slovenská Rep. 325 2 1 3 39 0 0 0 Norway 928 14 1 16 46 0 0 43 *: reported suspects per 1.000.000 animals in the total population

60
Chart 39: Number of scrapie cases per month in sheep in the EU15
0
10
20
30
40
50
60
70
80
90
100
Jan Feb Mar Apr May Jun Jul Aug Sep Oct Nov Dec
2003
2002
Chart 40: Percentage of cases per target group in sheep
0%
10%
20%
30%
40%
50%
60%
Culling Risk Healthy Sl. Suspects
20032002

61
5.3 TESTING BY TARGET GROUP
Table 40: Positives in healthy slaughtered ovine and caprine animals Sheep Goats Total Total Ratio* Ratio* Total Total Ratio* Ratio* tests positives 2003 2002 tests positives 2003 2002 Belgique/België 2.376 0 0,0 4,7 70 0 0,0 0,0 Danmark 871 0 0,0 0,0 93 0 0,0 0,0 Deutschland 20.116 9 4,5 3,9 1.216 0 0,0 0,0 Ellas 22.613 49 21,7 19,2 6.425 9 14,0 5,4 España 49.940 19 3,8 2,5 6.893 1 1,5 0,0 France 44.687 46 10,3 9,5 11.223 4 3,6 1,4 Ireland 51.588 9 1,7 2,4 0 0 Italia 35.274 14 4,0 13,2 3.642 2 5,5 9,7 Luxembourg 213 0 0,0 0,0 54 0 0,0 Nederland 21.140 45 21,3 14,8 3.654 0 0,0 0,0 Österreich 4.225 0 0,0 0,0 609 0 0,0 0,0 Portugal 10.703 6 5,6 0,0 2.174 0 0,0 0,0 Suomi/Finland 1.990 0 0,0 0,0 57 0 0,0 172,4 Sverige 5.177 2 3,9 0,0 51 0 0,0 0,0 United Kingdom 72.518 45 6,2 10,9 191 1 52,4 0,0 Total EU 15 343.431 244 7,0 8,1 36.352 17 4,7 3,1 Česká Republika 426 1 23,5 42 0 0,0 Slovenská Rep. 3.924 1 2,5 4 0 0,0 Norway 33.524 5 1,5 2,2 1.610 0 0,0 0,0 *: positives per 10.000 animals tested
Chart 41: Prevalence of positives in healthy slaughtered ovine animals in the EU15
0,0
5,0
10,0
15,0
20,0
25,0
BE DK DE EL ES FR IE IT LU NL AT PT FI SV UK
case
s per
10.
000
teste
d
2003
2002

62
Table 41: Positives in risk ovine and caprine animals Sheep Goats Total Total Ratio* Ratio* Total Total Ratio* Ratio* tests positives 2003 2002 tests positives 2003 2002 Belgique/België 496 2 40,3 27,1 46 0 0,0 0,0 Danmark 1.320 0 0,0 0,0 352 0 0,0 0,0 Deutschland 48.629 13 2,7 3,7 3.559 0 0,0 0,0 Ellas 793 13 163,9 193,1 526 0 0,0 0,0 España 12.950 8 6,2 4,6 1.024 0 0,0 11,1 France 18.989 34 17,9 68,7 12.026 6 5,0 10,5 Ireland 2.848 18 63,2 63,2 1 0 0,0 0,0 Italia 5.024 13 25,9 83,3 1.193 0 0,0 17,4 Luxembourg 244 0 0,0 0,0 2 0 0,0 Nederland 4.000 6 15,0 28,5 1.456 0 0,0 0,0 Österreich 3.255 0 0,0 0,0 786 0 0,0 0,0 Portugal 243 0 0,0 0,0 44 0 0,0 0,0 Suomi/Finland 683 0 0,0 0,0 171 0 0,0 0,0 Sverige 2.849 0 0,0 0,0 70 0 0,0 0,0 United Kingdom 5.126 13 25,4 57,2 54 0 0,0 0,0 Total EU 15 107.449 120 11,2 31,1 21310 6 2,9 8,7 Česká Republika 2.528 0 0,0 231 0 0,0 Slovenská Rep. 214 1 46,7 4 0 0,0 Norway 3.367 8 23,8 16,5 221 0 0,0 0,0 *: positives per 10.000 animals tested
Chart 42: Prevalence of positives in risk ovine animals in different Member States
0,0
50,0
100,0
150,0
200,0
250,0
BE DK DE EL ES FR IE IT LU NL AT PT FI SV UK
case
s per
10.
000
test
ed
20032002

63
Chart 43: Prevalence of scrapie in healthy slaughtered and risk animals in the EU15, goats versus sheep
0,0
2,0
4,0
6,0
8,0
10,0
12,0
case
s per
10.
000
test
ed
Goats 4,7 2,9
sheep 7,0 11,3
Healthy slaughtered Risk animals
Chart 44: Prevalence of scrapie in healthy slaughtered and risk sheep in the EU 15, 2002 versus 2003
0,0
5,0
10,0
15,0
20,0
25,0
30,0
35,0
case
s per
10.
000
teste
d
2003 7,0 11,3
2002 8,1 31,1
Healthy slaughtered Risk animals
Chart 45: Prevalence of scrapie in healthy slaughtered and risk goats in the EU 15, 2002 versus 2003
0,0
1,02,03,0
4,05,0
6,07,08,0
9,010,0
case
s per
10.
000
teste
d
2003 4,7 2,9
2002 3,1 8,7
Healthy slaughtered Risk animals

64
Table 42: Positives in suspect ovine and caprine animals Sheep Goats Total Total Ratio* Ratio* Total Total Ratio* Ratio* tests positives 2002 tests positives 2002 Belgique/België 6 0 0 2.222 4 0 0 0 Danmark 5 0 0 0 3 0 0 0 Deutschland 353 0 0 24 20 0 0 0 Ellas 163 55 3.374 3.826 28 10 3.571 3077 España 57 14 2.456 1.013 3 0 0 0 France 69 41 5.942 8.732 1 0 0 Ireland 44 16 3.636 3.852 0 0 Italia 19 18 9.474 7.500 2 1 5.000 0 Luxembourg 0 0 0 0 Nederland 61 12 1.967 0 0 Österreich 1 0 0 0 0 0 Portugal 0 0 0 0 Suomi/Finland 0 0 0 0 Sverige 25 2 800 0 4 0 0 0 United Kingdom 494 380 7.692 7.860 0 0 Total EU 15 1.297 538 4.148 2.334 65 11 1.692 635 Česka Republika 0 0 0 0 Slovenská Rep. 1 1 10.000 0 0 Norway 15 1 667 769 2 0 0 0 *: positives per 10.000 animals tested
Table 43: Positives in ovine and caprine animals, culled in the frame of TSE eradication Sheep Goats Total Total Ratio* Ratio* Total Total Ratio* Ratio* tests positives 2003 2002 tests positives 2003 2002 Belgique/België 205 0 0,0 467,3 0 0 Danmark 0 0 0 0 Deutschland 3.429 1 2,9 0,0 44 0 0,0 Ellas 236 7 296,6 121 0 0,0 España 6.601 97 146,9 88,1 18 0 0,0 France 16.239 629 387,3 130,8 4.109 9 21,9 22,4 Ireland 510 6 117,6 108,3 0 0 Italia 3.641 145 398,2 638,5 256 3 117,2 2500,0 Luxembourg 0 0 0 0 Nederland 100 0 0,0 0 0 Österreich 0 0 0 0 Portugal 31 0 0,0 0 0 Suomi/Finland 0 0 0,0 22 0 0,0 214,3 Sverige 121 0 0,0 0 0 United Kingdom 0 0 0 0 Total EU 15 31.113 885 284,4 127,0 4.570 12 26,3 69,6 Česká Republika 16 11 6.875,0 1 0 0,0 Slovenská Rep. 1 0 0,0 0 0 Norway 1.072 1 9,3 0 0 *: positives per 10.000 animals tested

65
Comments on positives cases and target groups Half of the positive cases in sheep were detected in animals culled in the frame of TSE eradication. TSE was detected in about 3% of the animals in an infected herd. It underlines the importance of the measures applicable to such herds. The difference in prevalence in risk animals compared to healthy slaughtered animals is less pronounced than the prevalence of BSE in cattle in the same target groups. All 4 TSE cases in Sweden and 14 of the 15 TSE cases in Norway were indicated as infections by the Nor98 strain.

66
5.4
YE
AR
OF
BIR
TH
AN
D A
GE
DIS
TR
IBU
TIO
N O
F PO
SIT
IVE
CA
SES
T
able
44:
Yea
r of
bir
th d
istr
ibut
ion
of p
ositi
ve c
ases
in o
vine
ani
mal
s of k
now
n ag
e de
tect
ed in
200
3
Yea
r of
bir
th d
istr
ibut
ion
<199
5 19
95
1996
19
97
1998
19
99
2000
20
01
2002
20
03
Unk
now
n T
otal
N
o of
cas
es
1 0
0 0
1 0
0 0
0 0
0 2
Bel
giqu
e/B
elgi
ë %
of k
now
n 50
%
0%
0%
0%
50%
0%
0%
0%
0%
0%
0%
10
0%
No
of c
ases
0
1 0
1 2
2 0
1 1
0 16
24
D
euts
chla
nd
% o
f kno
wn
0%
13%
0%
13
%
25%
25
%
0%
13%
13
%
0%
67%
10
0%
No
of c
ases
0
0 2
2 13
25
16
31
3
0 0
92
Ella
s %
of k
now
n 0%
0%
2%
2%
14
%
27%
17
%
34%
3%
0%
0%
10
0%
No
of c
ases
1
1 2
6 6
10
6 1
0 0
5 38
Es
paña
%
of k
now
n 3%
3%
5%
16
%
16%
26
%
16%
3%
0%
0%
13
%
100%
N
o of
cas
es
2 6
2 3
7 20
13
64
2
1 6
126
Fran
ce
% o
f kno
wn
2%
5%
2%
3%
6%
17%
11
%
53%
2%
1%
5%
10
0%
No
of c
ases
0
0 0
0 0
0 0
0 0
0 41
41
Ir
elan
d %
of k
now
n 0%
0%
0%
0%
0%
0%
0%
0%
0%
0%
10
0%
100%
N
o of
cas
es
0 1
3 2
7 10
7
11
2 0
0 43
Ita
lia
% o
f kno
wn
0%
2%
7%
5%
16%
23
%
16%
26
%
5%
0%
100%
10
0%
Ned
erla
nd
No
of c
ases
0
0 0
0 0
0 0
0 0
0 63
63
% o
f kno
wn
0%
0%
0%
0%
0%
0%
0%
0%
0%
0%
100%
10
0%
Portu
gal
No
of c
ases
0
0 0
0 0
0 0
1 0
0 1
2
% o
f kno
wn
0%
0%
0%
0%
0%
0%
0%
100%
0%
0%
50
%
100%
Sv
erig
e N
o of
cas
es
1 0
0 0
0 0
0 0
0 0
3 4
%
of k
now
n 10
0%
0%
0%
0%
0%
0%
0%
0%
0%
0%
75%
10
0%
No
of c
ases
0
4 8
22
45
77
68
65
21
2 10
1 41
3 U
nite
d K
ingd
om
% o
f kno
wn
0%
1%
3%
7%
14%
25
%
22%
21
%
7%
1%
23%
10
0%
No
of c
ases
5
13
17
36
81
144
110
174
29
3 23
6 84
8 E
U 1
5 %
of k
now
n 1%
2%
3%
6%
13
%
24%
18
%
28%
5%
0%
27
%
100%
N
o of
cas
es
0 0
0 0
0 0
0 1
0 0
1 2
Slov
ensk
á R
ep.
% o
f kno
wn
0%
0%
0%
0%
0%
0%
0%
100%
0%
0%
50
%
100%
N
o of
cas
es
1 1
4 5
1 1
1 1
0 0
0 15
N
orw
ay
% o
f kno
wn
7%
7%
27%
33
%
7%
7%
7%
7%
0%
0%
0%
100%

67
Chart 46: Year of birth distribution of sheep in some Member States detected in 2003
0%
10%
20%
30%
40%
50%
60%
<1995 1995 1996 1997 1998 1999 2000 2001 2002 2003
FRITUKEL
Chart 47: Year of birth distribution of positive cases detected in 2002 or 2003
0%
5%
10%
15%
20%
25%
30%
<1995 1995 1996 1997 1998 1999 2000 2001 2002 2003
20032002

68
Tab
le 4
5: A
ge d
istr
ibut
ion
of p
ositi
ve c
ases
in 2
003
in o
vine
ani
mal
s
A
ge d
istr
ibut
ion
(mon
ths o
f age
at c
onfir
mat
ion)
<1
2 12
to 2
3 24
to 3
5 36
to 4
7 48
to 5
9 60
to 7
1 72
to 8
3 84
to 9
5 96
and
>
Unk
now
n T
otal
N
o of
cas
es
0 0
0 0
0 1
0 0
1 0
2 B
elgi
que/
Bel
gië
% o
f kno
wn
0 0%
0%
0%
0%
50
%
0%
0%
50%
N
o of
cas
es
0 2
0 1
2 1
1 1
0 16
24
D
euts
chla
nd
% o
f kno
wn
0%
25%
0%
13
%
25%
13
%
13%
13
%
0%
No
of c
ases
0
5 38
11
22
13
1
2 0
0 92
El
las
% o
f kno
wn
0%
5%
41%
12
%
24%
14
%
1%
2%
0%
No
of c
ases
0
0 1
7 9
6 6
2 2
5 38
Es
paña
%
of k
now
n 0%
0%
3%
21
%
27%
18
%
18%
6%
6%
N
o of
cas
es
1 20
51
14
15
6
4 2
7 6
126
Fran
ce
% o
f kno
wn
1%
17%
43
%
12%
13
%
5%
3%
2%
6%
No
of c
ases
0
0 0
0 0
0 0
0 0
41
41
Irel
and
% o
f kno
wn
0%
0%
0%
0%
0%
0%
0%
0%
0%
No
of c
ases
0
6 10
7
11
4 3
1 1
0 43
Ita
lia
% o
f kno
wn
0%
14%
23
%
16%
26
%
9%
7%
2%
2%
No
of c
ases
0
0 0
0 0
0 0
0 0
63
63
Ned
erla
nd
% o
f kno
wn
0%
0%
0%
0%
0%
0%
0%
0%
0%
No
of c
ases
0
0 1
0 0
0 0
0 0
1 2
Portu
gal
% o
f kno
wn
0%
0%
100%
0%
0%
0%
0%
0%
0%
N
o of
cas
es
0 0
0 0
0 0
0 0
1 3
4 Sv
erig
e
% o
f kno
wn
0%
0%
0%
0%
0%
0%
0%
0%
100%
N
o of
cas
es
4 39
59
67
76
42
13
7
2 10
1 41
0 U
nite
d K
ingd
om
% o
f kno
wn
1%
13%
19
%
22%
25
%
14%
4%
2%
1%
N
o of
cas
es
5 72
16
0 10
7 13
5 73
28
15
14
23
6 84
5 E
U 1
5 %
of k
now
n 1%
12
%
26%
18
%
22%
12
%
5%
2%
2%
%
0 0
1 0
0 0
0 0
0 1
2 Sl
oven
ská
Rep
. %
of k
now
n 0%
0%
10
0%
0%
0%
0%
0%
0%
0%
%
0 1
0 1
1 2
4 5
0 1
15
Nor
way
%
of k
now
n 0%
7%
0%
7%
7%
14
%
29%
36
%
0%

69
Chart 48: Age distribution of positive cases in sheep detected in 2002 or 2003
0%
5%
10%
15%
20%
25%
30%
<12 12 to23
24 to35
36 to47
48 to59
60 to71
72 to83
84 to95
96and >
20032002
5.5 GENOTYPING
The genotypes found in positive cases and by random sampling were grouped in accordance with the NSP classification system used in the United Kingdom: NSP1 ARR/ARR Genetically most resistant to scrapie
NSP2 ARR/ARQ, ARR/ARH, ARR/ AHQ, VRR/ARQ Genetically resistant to scrapie
NSP3 (ARQ/ARQ) ARQ/ARQ
NSP3 (others) AHQ/AHQ, ARH/ARH, ARH/ ARQ, AHQ/ARH, AHQ/ARQ
Genetically little resistance to scrapie (ARQ/ARQ may be scientifically reviewed)
NSP4 ARR/VRQ Genetically susceptible to scrapie
NSP5 ARQ/VRQ, ARH/VRQ, AHQ/VRQ, VRQ/VRQ Genetically highly susceptible to scrapie
5.5.1 Genotypes of confirmed TSE cases in accordance with point 7.1 of Chapter A.II of Annex III to Regulation (EC) No 999/2001

70
Table 46: Distribution of genotypes in 2003 in TSE positive ovine animals others than animals culled in the frame of TSE eradication Known genotypes Distribution of known genotypes Number % of TSE NSP1 NSP2 NSP3 NSP4 NSP5 positives ARQ/ARQ Others Belgique/België 2 100% 0% 0% 0% 50% 0% 50% Deutschland 16 67% 6% 19% 31% 44% 0% 0% Ellas 56 60% 0% 0% 64% 34% 0% 2% España 25 81% 0% 8% 84% 8% 0% 0% France 18 13% 17% 33% 33% 6% 0% 11% Ireland 23 56% 0% 0% 65% 9% 0% 26% Italia 42 91% 0% 0% 93% 7% 0% 0% Nederland 63 100% 0% 0% 19% 0% 16% 65% Portugal 5 83% 20% 20% 40% 20% 0% 0% Sverige 4 100% 0% 50% 50% 0% 0% 0% United Kingdom 341 81% 0% 0% 26% 5% 4% 64% Total EU15-UK 249 57% 2% 5% 55% 14% 4% 20% Norway 15 100% 0% 27% 33% 33% 0% 7% Slovenská Rep. 0 0%
Chart 49: Distribution of genotypes in positive cases in sheep others than culled ones in 2002 and 2003 in the EU15
United Kingdom
0%10%20%30%40%50%60%70%80%
2003 0% 0% 26% 5% 4% 64%
2002 0% 0% 24% 4% 5% 67%
NSP1 NSP2 ARQ/ARQ NSP3-others NSP4 NSP5
EU15-UK
0%
10%
20%
30%
40%
50%
60%
2003 2% 5% 55% 14% 4% 20%
2002 0% 3% 57% 9% 2% 30%
NSP1 NSP2 ARQ/ARQ NSP3-others NSP4 NSP5

71
Table 47: Age distribution of positive cases per genotype in the EU15 detected in 2002 and 2003 Years of age NSP Genotype < 1 1 2 3 4 5 6 7 >7 Unknown Total
cases 0 0 0 0 1 0 0 1 1 1 4 NSP1 % of known 0% 0% 0% 0% 33% 0% 0% 33% 33% cases 0 4 3 2 6 1 1 0 1 4 22 NSP2 % of known 0% 22% 17% 11% 33% 6% 6% 0% 6% cases 5 48 67 70 66 45 20 3 3 188 515 NSP3:
ARQ/ARQ % of known 2% 15% 20% 21% 20% 14% 6% 1% 1% cases 1 11 14 6 14 4 5 4 2 43 104 NSP3: others % of known 2% 18% 23% 10% 23% 7% 8% 7% 3% cases 0 0 2 4 5 6 4 3 1 24 49 NSP4 % of known 0% 0% 8% 16% 20% 24% 16% 12% 4% cases 1 37 102 112 106 49 15 3 4 187 616 NSP5 % of known 0% 9% 24% 26% 25% 11% 4% 1% 1%
Unknown cases 9 94 151 58 77 36 22 15 11 127 600 cases 16 194 339 253 275 141 67 29 23 574 1910
Grand Total % of known 1% 14% 25% 19% 21% 11% 5% 2% 2%
Table 48: Average age of positive cases per genotype in the EU15 in 2002 and 2003
Mean age (months) Genotype 2002 2003 Mean
NSP1 No cases 118,3 118,3 NSP2 40,7 44,7 43,2
ARQ/ARQ 41,9 43,6 42,8 NSP3 Others 47,4 43,4 44,8
NSP4 61,6 66,2 63,3 NSP5 42,3 45,0 43,4
Unknown 38,0 40,4 39,0 Average 41,2 43,6 42,3
Chart 50: Average age of positive cases per genotype in the EU15 in 2002 and 2003
0,0
20,0
40,0
60,0
80,0
100,0
120,0
140,0
ARQ/ARQ Others
NSP1 NSP2 NSP3 NSP4 NSP5
20032002

72
5.5.2 Genotypes in random sampled ovine animals in accordance with point 7.2 of Chapter A.II of Annex III to Regulation (EC) No 999/2001 Table 49: Distribution of genotypes in ovine animals in some Member States in 2003
Distribution of genotypes in random sampled sheep NSP1 NSP2 NSP3 NSP4 NSP5 Total
ARQ/ARQ Others No of samples 19 42 19 13 8 11 112 België/Belgique
% 17% 38% 17% 12% 7% 10% No of samples 12 10 8 3 0 3 36 Danmark
% 33% 28% 22% 8% 0% 8% No of samples 742 968 581 244 51 70 2656 Deutschland
% 28% 36% 22% 9% 2% 3% No of samples 44 203 304 37 6 30 624 España
% 7% 33% 49% 6% 1% 5% No of samples 62 134 73 9 15 22 315 France
% 20% 43% 23% 3% 5% 7% No of samples 114 269 241 51 15 29 719 Italia
% 16% 37% 34% 7% 2% 4% No of samples 39 93 78 40 4 8 262 Luxembourg
% 15% 35% 30% 15% 2% 3% No of samples 212 257 107 0 12 12 600 Nederland
% 35% 43% 18% 0% 2% 2% No of samples 11 37 43 18 0 3 112 Österreich
% 10% 33% 38% 16% 0% 3% No of samples 3 13 46 28 0 -1 89 Suomi/Finland
% 3% 15% 52% 31% 0% -1% No of samples 3 11 78 3 0 7 102 Sverige
% 3% 11% 76% 3% 0% 7% No of samples 82669 117994 36944 40721 10838 11576 300742
United Kingdom % 27% 39% 12% 14% 4% 4%
No of samples 1261 2037 1578 446 111 194 5627 Total except UK
% 22% 36% 28% 8% 2% 3%
Chart 51: Distribution of genotypes by random sampling in 2003 compared to 2002 in the EU15 except UK
0%
5%
10%
15%
20%
25%
30%
35%
40%
2003 22% 36% 28% 8% 2% 3%
2002 14% 35% 38% 6% 3% 4%
NSP1 NSP2 ARQ/ARQ NSP3-others NSP4 NSP5

73
5.5.3 Susceptibility Table 50: Relative susceptibility of genotypes to a TSE infection NSP1 NSP2 NSP3 NSP4 NSP5 ARQ/ARQ others Frequency in sandom samples DE 28% 36% 22% 9% 2% 3% ES 7% 33% 49% 6% 1% 5% FR 20% 43% 23% 3% 5% 7% IT 16% 37% 34% 7% 2% 4% NL 35% 43% 18% 0% 2% 2% UK 27% 39% 12% 14% 4% 4% Mean 22% 39% 26% 7% 3% 4% Frequency in TSE cases DE 6% 19% 31% 44% 0% 0% (except culled animals) ES 0% 8% 84% 8% 0% 0% FR 17% 33% 33% 6% 0% 11% IT 0% 0% 93% 7% 0% 0% NL 0% 0% 19% 0% 16% 65% UK 0% 0% 26% 5% 4% 64% Mean 4% 10% 48% 12% 3% 23%
DE 0,15 0,37 1,00 3,47 0,00 0,00 ES 0,00 0,14 1,00 0,78 0,00 0,00 FR 0,59 0,53 1,00 1,39 0,00 1,10 IT 0,00 0,00 1,00 0,37 0,00 0,00 NL 0,00 0,00 1,00 0,00 7,58 30,79 UK 0,00 0,00 1,00 0,16 0,46 7,38
Relative susceptibility (ARQ/ARQ = 1,00)
Mean 0,10 0,14 1,00 0,99 0,69 3,09
5.5.4 Genotyping and TSE testing in culled ovine animals carried out under the provisions of Annex VII, point 2(b)(ii) to Regulation (EC) No 999/2001 in certain Member States. Table 51: TSE testing per genotype in ovine animals culled in the frame of TSE eradication NSP1 NSP2 NSP3 NSP4 NSP5 Total ARQ/ARQ others
No. of animals 27 58 57 18 15 17 192 Belgique/België % TSE positives 0% 0% 0% 0% 0% 0% No. of animals 66 252 1819 121 626 820 3704 France % TSE positives 0% 9% 4% 2% 2% 18% No. of animals 0 0 26 2 0 7 35
Ireland % TSE positives 0% 0% 0% 0% 0% 0%

74
5.5.5 Distribution of genotypes in pure breeds (Prion protein genotype survey in accordance with Commission Decision 2002/1003/EC). Information was forwarded by the Member States of the EU 15 and the Slovak Republic. Alphabetic overview table of genotypes in pure breeds: see Appendix. Table 52: Classifications of breeds according to the frequency of the ARR allele (breeds with 45 or more samples analysed in 2003) % of ARR
allele Breed
0-9% North Ronaldsay, Soay, Boreray, Gute, Castlemilk Moorit, Finuld, Finnsheep, Barbaros Blackbelly,Gotland Pels, Bentheimer Landschaf, Churra Tensina, Mondegueira, Manx Loghtan, Rya, Kainuu grey sheep, Schoonebeeker, Milchschaf, Bergamasca, Krainer Steinschaf
10-19%
Campaniça, Ostfriesisches Milchschaf Weiss, Alands sheep, Manchega, Belgische melkschaap, Finull, Fries-Zeeuws melkschaap, Manchega Negra, Galega Bragançana, Merinolandschaf, Thônes et Marthod, Braunes Bergschaf, Galega Mirandesa, Graue Gehörnte Heidschnucke, Romanov, Weisses Bergschaf , Merino, Hill Radnor, Est à Laine Mérinos, Churra, Veluws Heideschaap, Churra da Terra Quente, Aragonesa, Castellana, Ostfriesisches Molchschaf Braun, Biellese, Landschaf
20-29%
Weisse Hornlose Heidschnucke, Hebridean, Carranzana, Navarra, Manech Tête Rousse, Landaise, Braunes Bergschaf, Merino da Beira Baixa, Skudde, Noire du Velay, Kärnter Brillenschaf, Segureña, Churra Badana, Castellana Negra, Montafoner Steinschaf, Churra Algarvia, Lacha, Ojinegra de Teruel, Barbaresca, Saloia, Friesland, Fabrianese, Waterford Blackface, Bordaleira, Ojalada, Mourérous, Skudde, Blanc du Massif Central, Tiroler Steinschaf, Vendeen, Juraschaf, Rauhwolliges Pommersches Landschaf, Coburger Fuchs, Drents Heideschaap, Vlaams Kuddeschaap, Ripollesa, Beltex, Castillonnaise, Gentile di Puglia, Shropshire, Racka, Merinolangwollschaf, Shetland
30-39%
Scottish Blackface, Valle del Belice, Roussin, Herdwick, Weisses Bergschaf, Merina, Waldschaf, Lonk, Alpines Steinschaf, Devon Closewool, White Face Dartmoor, Dalesbred, Caussenarde des Garrigues, Basco-Béarnaise, Delle Langhe, Rouge du Roussillon, Altamurana, Comisana, Kempens schaap, Merinizzata, Merino Preto, Greyface Dartmoor, Appenninica, Sopravissana, Solognote, White Face Woodland, Welsh Mountain, Derbyshire Gritstone, Mérinos d’Arles, Merino Blanco, Cheviot, Charmoise, Southdown, Pinzirita, British Milksheep, Rayole, Weisse Gehörnte Heidschnucke, Merino Precoce, Wicklow Cheviot
40-49%
Tarasconnaise, Serra da Estrela, Merino Precoz, Rough Fell, Swaledale, Préalpes du Sud, Berrichon de l’Indre, Corse, Grivette, Mergelandschaap, Ardennais Roux, Texel, Rava, Zwartbles, Boulonnaise, Badger Face Welsh Mountain, Limousine, Mayo-Connemara Blackface, Merinofleischschaf, Manech Tête Noire, North County Cheviot, Tregaron Welsh Mountain, Moscia Leccese, Fleischschaf, Dorper, Causses du Lot
50-59%
Brecknock Hill Cheviot, Massese, Sarda, Llanwenog, Blauköpfiges Fleischschaf, Noord Hollander, Dorset Down, Belclare, Leineschaf, Beulah Speckled Face, Landes de Bretagne, Inra 401, Lleyn, Charolais, Welsh Hill Speckled Face, Llandovery Whiteface, Laticauda, Dorset, Ouessant, Mérinos de Rambouillet, Talybont Welsh, Hampshire Down, Bizet, Belle Isle, Cambridge,
60-69% Cotswold, Lacaune (meat breed), Romney, Dorset Horn and Poll Dorset, Coburger Fuchschaf, Nolana, Bluefaced Leicester, Black Welsh Mountain, Jacob, Vlaams schaap, Blauwe Texelaar, Lacaune (milk breed), South Wales Mountain, Rhönschaf, Wiltshire Horn, Schwarzkopf, Kerry Hill
70-79% Balwen Welsh Mountain, Rouge de l’Ouest, Flevolander, Galway, Exmoor Horn, Leicester, Weissköpfiges Fleischschaf, Border Leicester, Suffolk, Berrichon du Cher, Devon and Cornwall Longwool, Bleu du Maine, Swifter, Cotentin, Ile de France, Easycare, Schwarzköpfiges Fleischschaf
80-89% Clun Forest, Oxford Down, Blessumer, Portland, Teeswater, Lincoln Longwool, Norfolk Horn, Marskfar
> 90% Ryeland, Warborough, Meatline, Wensleydale, Leicester Longwool, Avranchin
The genotypes of 430.233 purebred sheep, mainly (69,9%) sampled in the United Kingdom (69,9%) and the Netherlands (13,9%), were forwarded. Of all alleles, ARR represented 48,9% in the United Kingdom, 56,8% in the Netherlands and 35,7% in the other Member States.

75
Table 53: Details on genotypes in Leicester sheep Percentage of tested sheep Total NSP1 NSP2 NSP3 NSP4 NSP5 No. Breed Member State ARQ/ARQ Others Tested Leicester Danmark 54% 24% 4% 2% 13% 2% 46
Leicester (Bluefaced) United Kingdom 38% 46% 5% 11% 0% 0% 18244
Leicester (Bluefaced) Nederland 57% 43% 0% 0% 0% 0% 7
Leicester (Border) United Kingdom 55% 23% 3% 0% 15% 4% 2716
Leicester (Longwool) United Kingdom 83% 4% 0% 0% 12% 1% 443
Leicester (Longwool) Nederland 89% 0% 11% 0% 0% 0% 9
Table 54: Details on genotypes in Merino sheep Percentage of tested sheep Total NSP1 NSP2 NSP3 NSP4 NSP5 no. Breed Member State ARQ/ARQ Others tested Merino Luxembourg 0% 16% 79% 0% 0% 5% 19 Merino Österreich 5% 25% 56% 13% 0% 1% 102 Merino Nederland 0% 33% 67% 0% 0% 0% 6 Merino Branco Portugal 13% 47% 35% 3% 2% 0% 60 Merino da Beira Baixa Portugal 8% 25% 51% 2% 2% 12% 59 Merino Precoce Portugal 19% 41% 36% 5% 0% 0% 59 Merino Preto Portugal 17% 34% 29% 3% 3% 14% 59 Mérinos d'Arles France 13% 47% 36% 0% 1% 2% 739 Mérinos de Rambouillet France 31% 48% 0% 12% 6% 3% 229 Merino Precoz España 17% 49% 32% 2% 0% 1% 2069 Merinofleischschaf Deutschland 22% 47% 27% 4% 0% 2% 51 Merinolandschaf Deutschland 2% 25% 56% 18% 0% 0% 57 Merinolangwollschaf Deutschland 6% 45% 37% 6% 2% 12% 51
Chart 52: Details on genotypes in Berrichon sheep
0%
10%
20%
30%
40%
50%
60%
70%
UK 58% 35% 6 % 0 % 0% 0 %
IRL 4 0% 4 9% 4 % 2 % 4% 2 %
FR 52% 3 9% 2 % 0 % 5% 2 %
ES 61% 27% 2 % 0 % 9% 1%
NSP1 NSP2 ARQ/ARQ NSP3-o thers NSP4 NSP5

76
Chart 53: Details on genotypes in Scottish Blackface sheep
0%5%
10%15%20%25%
30%35%40%
45%50%
UK 9% 4 0% 36 % 10% 1% 4 %
IRL 8% 3 3% 44 % 10% 4% 2 %
NL 3 8% 45% 7% 0 % 10 % 1%
NSP1 NSP2 ARQ/ARQ NSP3-o thers NSP4 NSP5
Chart 54: Details on genotypes in Bleu du Maine sheep
0%
10%
20%
30%
40%
50%
60%
70%
80%
IRL 55% 16 % 2 % 2 % 15% 11%
FR 47% 12 % 0 % 0 % 3 3% 9 %
BE 31% 3 2% 8 % 0 % 21% 8 %
UK 72% 7% 0 % 0 % 18 % 3 %
NL 59% 2 6% 3 % 0 % 10 % 2 %
NSP1 NSP2 ARQ/ARQ NSP3-o thers NSP4 NSP5
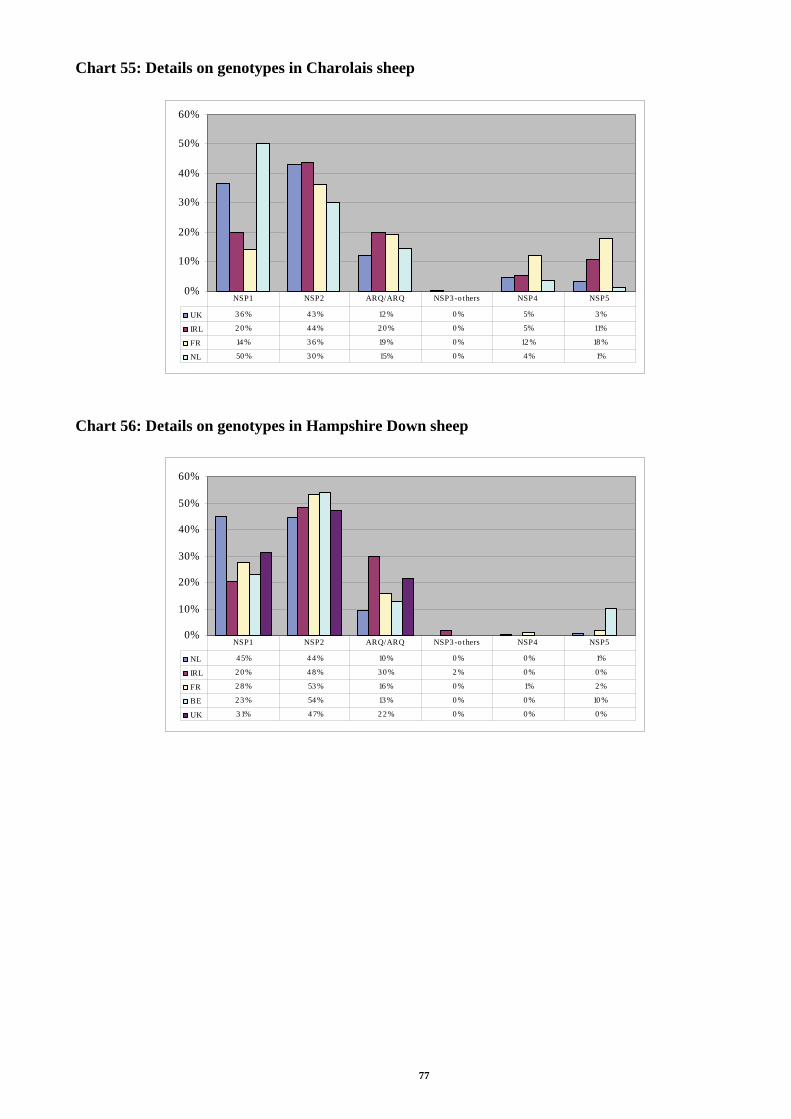
77
Chart 55: Details on genotypes in Charolais sheep
0%
10%
20%
30%
40%
50%
60%
UK 3 6% 4 3% 12% 0 % 5% 3 %
IRL 2 0% 4 4% 20 % 0 % 5% 11%
FR 14 % 3 6% 19% 0 % 12 % 18 %
NL 50% 3 0% 15% 0 % 4% 1%
NSP1 NSP2 ARQ/ARQ NSP3-o thers NSP4 NSP5
Chart 56: Details on genotypes in Hampshire Down sheep
0%
10%
20%
30%
40%
50%
60%
NL 45% 4 4% 10% 0 % 0% 1%
IRL 2 0% 4 8% 30 % 2 % 0% 0 %
FR 2 8% 53% 16% 0 % 1% 2 %
BE 2 3% 54% 13% 0 % 0% 10 %
UK 31% 47% 22 % 0 % 0% 0 %
NSP1 NSP2 ARQ/ARQ NSP3-o thers NSP4 NSP5

78
Chart 57: Details on genotypes in Île de France sheep
0%10%20%30%40%50%60%70%80%90%
UK 76% 12 % 0 % 2 % 9% 0%
PT 65% 7% 2 % 0 % 25% 2%
FR 6 0% 14 % 1% 0 % 21% 4%
ES 57% 12 % 4 % 0 % 2 2% 6%
DE 51% 2 2% 8 % 0 % 10 % 8%
NSP1 NSP2 ARQ/ARQ NSP3-o thers NSP4 NSP5
Chart 58: Details on genotypes in Suffolk sheep
0%
10%
20%
30%
40%
50%
60%
70%
80%
UK 56% 37% 6 % 1% 0% 0 %
FR 45% 3 6% 12% 0 % 4% 3 %
DK 2 2% 3 8% 20 % 0 % 8% 12 %
BE 4 3% 4 4% 10% 0 % 2% 1%
AT 27% 4 8% 23 % 1% 0% 1%
IRL 50% 3 0% 8 % 10% 2% 0 %
NL 67% 2 9% 3 % 0 % 1% 0 %
DE 3 3% 51% 12% 1% 1% 1%
NSP1 NSP2 ARQ/ARQ NSP3-o thers NSP4 NSP5

79
Chart 59: Details on genotypes in Texel sheep
0%
10%
20%
30%
40%
50%
60%
SV 4% 45% 3 1% 12% 6% 2 %
FR 9% 4 0% 3 5% 0 % 5% 11%
DK 9% 4 0% 2 1% 28 % 0% 2 %
BE 2 0% 47% 8 % 22 % 1% 1%
LU 21% 4 6% 8 % 19% 2% 4 %
IRL 5% 4 8% 2 % 29 % 2% 16 %
FI 2% 35% 3 7% 24 % 0% 2 %
NL 35% 50% 12% 0 % 2% 1%
DE 12 % 41% 15% 11% 9% 13 %
NSP1 NSP2 ARQ/ARQ NSP3-o thers NSP4 NSP5
Comments on genotypes
In UK and Netherlands the majority of cases are in the NSP 5 category. In the Mediterranean MS (Greece, Spain, Italy) most cases are in ARQ/ARQ animals. This difference seems not only due to a greater frequency of the ARQ/ARQ genotype in the Mediterranean MS, but to a greater relative susceptibility of ARQ/ARQ genotypes in these MS, possibly due to an effect of sheep breed or scrapie strain. Data on genotypes of positive cases outside the UK is however still limited. Average age of positive cases is as expected older for NSP1 genotypes , but also for NSP4 genotypes. Random sampling of genotypes showed a shift towards NSP 1, 2 and 3 genotypes compared to 2002. In the survey of pure breeds, the level of resistant genotypes is higher in most breeds in the Netherlands compared to the same breeds in other MS.

80
Appendix
Results of the survey of prion protein genotypes of pure sheep breeds in accordance with Article 2 of Commission Decision 2002/1003/EC. Percentage of tested sheep Total No NSP1 NSP2 NSP3 NSP4 NSP5 tested ARR/ARR ARR/X, X≠VRQ) ARQ/ARQ Others ARR/VRQ VRQ/X, X≠ARR Alands sheep 0,0% 22,2% 48,9% 28,9% 0,0% 0,0% 45 Alpines Steinschaf 8,5% 44,1% 8,5% 23,7% 1,7% 13,6% 59 Altamurana 7,3% 54,5% 36,4% 1,8% 0,0% 0,0% 55 Appenninica 10,0% 50,0% 24,0% 10,0% 2,0% 4,0% 50 Aragonesa 3,3% 28,6% 55,3% 7,5% 0,9% 4,5% 10686 Ardennais Roux 14,8% 54,8% 29,6% 0,9% 0,0% 0,0% 115 Ardenner 0,0% 40,0% 10,0% 50,0% 0,0% 0,0% 10 Ardense Voskop 100,0% 0,0% 0,0% 0,0% 0,0% 0,0% 2 Aure et Campan 9,1% 36,4% 39,4% 6,1% 3,0% 6,1% 33 Avranchin 87,8% 9,8% 1,2% 0,0% 1,2% 0,0% 246 Badger Face Welsh Mountain 19,1% 43,6% 11,2% 13,8% 4,9% 7,4% 1425 Balwen Welsh Mountain 49,5% 39,3% 3,1% 6,5% 0,8% 0,9% 800 Barbaresca 6,0% 36,0% 34,0% 24,0% 0,0% 0,0% 50 Barbaros Blackbelly 0,0% 7,4% 92,6% 0,0% 0,0% 0,0% 54 Barégeoise 20,0% 20,0% 60,0% 0,0% 0,0% 0,0% 10 Basco-Béarnaise 9,5% 46,6% 43,4% 0,4% 0,1% 0,1% 1131 Belclare 22,0% 56,0% 4,0% 10,0% 6,0% 2,0% 50 Belgische melkschaap 0,0% 23,5% 17,6% 58,8% 0,0% 0,0% 51 Belle Isle 33,8% 49,3% 16,9% 0,0% 0,0% 0,0% 71 Beltex 8,9% 37,7% 20,7% 26,7% 1,5% 4,5% 2260 Bentheimer Landschaf 0,0% 11,0% 32,9% 26,0% 1,4% 28,8% 73 Bergamasca 0,0% 16,0% 70,0% 6,0% 2,0% 6,0% 50 Bergschaf braun 5,7% 30,2% 56,6% 5,7% 1,9% 0,0% 53 Bergschaf weiss 0,0% 32,0% 30,0% 38,0% 0,0% 0,0% 50 Berrichon de l'Indre 17,5% 41,2% 23,7% 0,0% 6,2% 11,3% 97 Berrichon du Cher 55,0% 36,2% 3,7% 0,4% 3,3% 1,4% 2332 Beulah Speckled Face 28,5% 46,5% 15,7% 2,8% 3,3% 3,2% 6109 Biellese 8,0% 22,0% 46,0% 8,0% 0,0% 16,0% 50 Bizet 35,0% 46,0% 19,0% 0,0% 0,0% 0,0% 100 Black Welsh Mountain 39,3% 24,3% 0,8% 2,8% 23,0% 9,7% 2120 Blanc du Massif Central 5,9% 35,6% 43,8% 0,0% 3,4% 11,2% 2761 Blauköpfiges Fleischschaf 28,0% 34,0% 8,0% 0,0% 14,0% 16,0% 50 Blauwe Texelaar 37,1% 48,1% 7,9% 0,0% 5,4% 1,5% 3570 Blessumer 67,7% 24,0% 2,0% 0,0% 6,3% 0,0% 254 Bleu du Maine 57,8% 18,9% 2,7% 0,0% 16,3% 4,2% 2637 Bordaleira 9,7% 29,0% 46,8% 4,8% 1,6% 8,1% 62 Boreray 0,0% 3,8% 45,2% 1,0% 1,0% 49,0% 104 Boulonnaise 10,6% 64,4% 22,1% 0,0% 1,0% 1,9% 104 braunes Bergschaf 6,1% 10,2% 30,6% 14,3% 6,1% 32,7% 49 Brilschaap 0,0% 6,7% 80,0% 0,0% 0,0% 13,3% 15 British Milksheep 11,3% 54,7% 11,3% 22,6% 0,0% 0,0% 53 Cambridge 35,2% 47,7% 17,1% 0,0% 0,0% 0,0% 369 Campaniça 0,0% 21,7% 50,0% 5,0% 0,0% 23,3% 60 Carranzana 3,9% 33,3% 47,1% 13,7% 0,0% 2,0% 51 Castellana 4,2% 28,3% 51,5% 13,9% 0,6% 1,7% 361 Castellana Negra 5,5% 34,5% 56,4% 3,6% 0,0% 0,0% 55 Castillonnaise 8,2% 40,8% 49,0% 0,0% 0,0% 2,0% 49 Castlemilk Moorit 0,0% 6,3% 92,9% 0,8% 0,0% 0,0% 616 Caussenarde des Garr. 10,9% 43,6% 32,7% 12,7% 0,0% 0,0% 55

81
Percentage of tested sheep Total NSP1 NSP2 NSP3 NSP4 NSP5 No ARR/ARR ARR/X, X≠VRQ) ARQ/ARQ Others ARR/VRQ VRQ/X, X≠ARR Tested Causses du Lot 12,3% 64,6% 1,2% 8,2% 9,0% 4,7% 1129 Charmoise 14,2% 35,5% 19,7% 0,5% 11,8% 18,3% 950 Charolais 32,1% 41,3% 13,7% 0,2% 6,4% 6,3% 15653 Cheviot 13,8% 40,2% 8,5% 19,1% 7,2% 11,1% 6024 Cheviot (Brecknock Hill) 25,5% 42,3% 4,0% 15,8% 6,5% 5,8% 4385 Cheviot (North County) 21,0% 43,4% 13,0% 10,2% 5,7% 6,7% 13985 Churra 3,3% 27,4% 56,8% 11,6% 0,2% 0,8% 636 Churra Algarvia 1,7% 41,4% 44,8% 10,3% 1,7% 0,0% 58 Churra Badana 5,0% 35,0% 53,3% 6,7% 0,0% 0,0% 60 Churra da Terra Quente 1,7% 31,7% 63,3% 1,7% 0,0% 1,7% 60 Churra Tensina 0,0% 13,0% 42,6% 33,9% 0,0% 10,4% 115 Cigaja 6,3% 81,3% 0,0% 6,3% 6,3% 0,0% 16 Clun Forest 65,7% 28,3% 1,8% 2,4% 1,4% 0,4% 1690 Coburger Fuchs 8,5% 36,6% 54,9% 0,0% 0,0% 0,0% 82 Coburger Fuchsschaf 35,3% 49,0% 13,7% 0,0% 2,0% 0,0% 51 Comisana 11,5% 44,2% 17,3% 13,5% 1,9% 11,5% 52 Corse 15,8% 50,8% 26,0% 7,1% 0,1% 0,2% 1598 Cotentin 55,8% 5,6% 0,9% 0,4% 34,2% 3,0% 231 Cotswold 37,9% 43,1% 17,0% 1,2% 0,1% 0,6% 670 Dalesbred 7,9% 47,6% 26,8% 11,0% 1,7% 5,1% 471 Danish Landrace 51,2% 39,0% 9,8% 0,0% 0,0% 0,0% 41 Delle Langhe 10,0% 48,0% 40,0% 0,0% 0,0% 2,0% 50 Derbyshire Gritstone 12,9% 43,9% 4,4% 29,9% 4,9% 4,0% 953 Deutsche Weisskopf 0,0% 100,0% 0,0% 0,0% 0,0% 0,0% 1 Devon & Cornwall Longwool 56,7% 37,2% 6,1% 0,0% 0,0% 0,0% 180 Devon Closewool 11,7% 33,7% 5,8% 26,0% 5,9% 16,8% 572 Dorper 24,0% 50,0% 24,0% 0,0% 0,0% 2,0% 50 Dorset 32,9% 46,3% 17,1% 1,2% 2,4% 0,0% 82 Dorset Down 26,8% 50,9% 21,0% 1,1% 0,0% 0,1% 794 Dorset Horn and Poll Dorset 36,0% 36,1% 7,9% 0,6% 12,9% 6,6% 5085 Drents Heideschaap 8,3% 37,0% 47,1% 0,0% 2,4% 5,2% 2206 East.frízske 0,0% 33,3% 0,0% 0,0% 33,3% 33,3% 3 Easycare 59,0% 22,0% 1,7% 0,7% 14,9% 1,7% 295 Est à Laine Mérinos 2,9% 28,2% 67,0% 1,0% 0,0% 1,0% 103 Exmoor Horn 51,4% 21,4% 1,3% 2,4% 18,1% 5,5% 847 Fabrianese 6,0% 36,0% 22,0% 24,0% 2,0% 10,0% 50 Finnsheep 0,0% 6,4% 85,7% 0,7% 0,0% 7,1% 140 Finuld 0,0% 6,4% 70,2% 17,0% 0,0% 6,4% 47 Finull 1,9% 17,3% 53,8% 11,5% 3,8% 11,5% 52 Fleischschaf 22,2% 52,1% 21,7% 3,6% 0,3% 0,2% 1079 Flevolander 47,7% 43,8% 8,1% 0,0% 0,4% 0,0% 480 Friesland 9,2% 29,4% 16,4% 29,4% 1,1% 14,5% 262 Fries-Zeeuws melkschaap 1,6% 22,0% 76,3% 0,0% 0,0% 0,0% 2872 Galega Bragançana 0,0% 25,0% 65,0% 5,0% 1,7% 3,3% 60 Galega Mirandesa 1,7% 26,7% 53,3% 11,7% 0,0% 6,7% 60 Galway 47,9% 14,9% 1,5% 1,2% 29,2% 5,4% 336 Gentile di Puglia 10,0% 36,0% 40,0% 10,0% 2,0% 2,0% 50 Gotland Pels 0,2% 9,8% 79,2% 0,2% 0,2% 10,4% 510 Graue Gehörnte Heidschnucke 3,8% 22,8% 53,2% 20,3% 0,0% 0,0% 79 Greyface Dartmoor 14,1% 35,3% 26,4% 2,6% 7,9% 13,7% 2346 Grivette 15,3% 51,6% 29,9% 0,0% 0,6% 2,5% 157 Gute 2,0% 2,0% 96,0% 0,0% 0,0% 0,0% 50

82
Percentage of tested sheep Total No NSP1 NSP2 NSP3 NSP4 NSP5 tested ARR/ARR ARR/X, X≠VRQ) ARQ/ARQ Others ARR/VRQ VRQ/X, X≠ARR Hampshire down 34,5% 46,7% 18,1% 0,1% 0,2% 0,4% 3271 Hebridean 4,8% 31,4% 29,8% 33,9% 0,0% 0,0% 2295 Heidschnucke 13,2% 63,2% 18,4% 5,3% 0,0% 0,0% 38 Herdwick 9,7% 34,3% 10,9% 26,3% 6,5% 12,2% 2453 Hill Radnor 1,7% 27,2% 51,3% 13,1% 1,7% 4,9% 526 Ile de France 60,0% 12,9% 2,0% 0,3% 20,3% 4,6% 4634 Inra 401 28,5% 47,8% 12,4% 1,9% 5,2% 4,2% 688 Jacob 39,9% 46,1% 7,0% 6,7% 0,1% 0,1% 2802 Juraschaf 1,9% 46,2% 21,2% 26,9% 1,9% 1,9% 52 Kainuu grey sheep 0,0% 16,7% 83,3% 0,0% 0,0% 0,0% 48 Kameroen 0,0% 0,0% 100,0% 0,0% 0,0% 0,0% 26 Karakul 0,0% 23,5% 76,5% 0,0% 0,0% 0,0% 17 Kärntner Brillenschaf 5,9% 28,7% 3,0% 50,5% 4,0% 7,9% 101 Kempens schaap 11,4% 46,3% 40,1% 0,0% 0,6% 1,6% 821 Kerry Hill 48,7% 40,2% 10,2% 0,0% 0,8% 0,1% 1802 Krainer Steinschaf 0,0% 18,0% 20,0% 56,0% 0,0% 6,0% 50 Lacaune (meat breed) 34,2% 46,7% 10,9% 0,1% 4,3% 3,8% 853 Lacaune (milk breed) 40,8% 46,0% 11,4% 0,7% 0,7% 0,5% 1361 Lacha 4,8% 36,8% 49,5% 6,6% 0,2% 2,0% 993 Lacoune 30,0% 50,0% 10,0% 10,0% 0,0% 0,0% 10 Lakens schaap 0,0% 0,0% 0,0% 100% 0,0% 0,0% 1 Landaise 4,6% 26,6% 41,1% 0,6% 7,5% 19,5% 477 Landes de Bretagne 30,1% 47,0% 22,9% 0,0% 0,0% 0,0% 83 Landschaf 3,0% 32,6% 45,7% 18,7% 0,0% 0,0% 230 Laticauda 32,0% 48,0% 16,0% 2,0% 2,0% 0,0% 50 Leicester 54,3% 23,9% 4,3% 2,2% 13,0% 2,2% 46 Leicester (Bluefaced) 38,0% 46,4% 4,5% 10,6% 0,3% 0,2% 18251 Leicester (Border) 54,9% 23,2% 3,2% 0,1% 14,6% 4,1% 2716 Leicester Longwool 83,0% 4,2% 0,2% 0,0% 11,3% 1,3% 452 Leineschaf 32,0% 42,0% 20,0% 6,0% 0,0% 0,0% 50 Limousine 16,8% 53,2% 29,4% 0,0% 0,3% 0,3% 333 Lincoln Longwool 74,3% 11,9% 0,3% 0,0% 12,2% 1,3% 712 Llandovery Whiteface 31,5% 44,0% 2,7% 11,9% 6,7% 3,2% 1018 Llanwenog 26,7% 48,4% 21,8% 0,3% 1,3% 1,5% 3277 Lleyn 31,6% 46,7% 5,1% 13,0% 2,0% 1,6% 14548 Lonk 9,6% 41,0% 11,3% 32,1% 1,4% 4,7% 666 Lourdaise 3,7% 48,1% 44,4% 0,0% 0,0% 3,7% 27 Manchega 1,5% 19,6% 68,7% 9,1% 0,3% 0,8% 2782 Manchega Negra 1,8% 19,3% 72,8% 2,6% 3,5% 0,0% 114 Manech Tête Noire 19,1% 52,5% 27,4% 0,1% 0,4% 0,5% 760 Manech Tête Rousse 4,5% 33,4% 57,4% 0,4% 0,7% 3,6% 1234 Manx Loghtan 1,3% 13,8% 5,8% 79,2% 0,0% 0,0% 1024 Marskfar 82,2% 2,2% 4,4% 2,2% 8,9% 0,0% 45 Massese 20,0% 58,0% 0,0% 0,0% 2,0% 20,0% 50 Mayo-C. Blackface 25,9% 31,5% 13,0% 13,0% 5,6% 11,1% 54 Meatline 81,6% 11,5% 0,2% 0,0% 6,4% 0,3% 999 Mergelandschaap 14,3% 51,5% 27,2% 0,0% 3,9% 3,2% 596 Merina 8,6% 43,3% 42,3% 5,2% 0,1% 0,4% 3356 Merina Negra 14,3% 71,4% 7,1% 7,1% 0,0% 0,0% 14 Merinizzata 10,0% 34,0% 26,0% 2,0% 16,0% 12,0% 50 Merino 3,9% 24,4% 59,8% 10,2% 0,0% 1,6% 127 Merino Branco 13,3% 46,7% 35,0% 3,3% 1,7% 0,0% 60

83
Percentage of tested sheep Total No NSP1 NSP2 NSP3 NSP4 NSP5 tested ARR/ARR ARR/X, X≠VRQ) ARQ/ARQ Others ARR/VRQ VRQ/X, X≠ARR Merino da Beira Baixa 8,5% 25,4% 50,8% 1,7% 1,7% 11,9% 59 Merino Precoce 18,6% 40,7% 35,6% 5,1% 0,0% 0,0% 59 Merino Precoz 16,5% 48,9% 32,2% 2,3% 0,0% 0,0% 2069 Merino Preto 16,9% 33,9% 28,8% 3,4% 3,4% 13,6% 59 Merinofleischschaf 21,6% 47,1% 27,5% 3,9% 0,0% 0,0% 51 Merinolandschaf 1,8% 24,6% 56,1% 17,5% 0,0% 0,0% 57 Merinolangwollschaf 5,9% 45,1% 37,3% 5,9% 2,0% 3,9% 51 Mérinos d'Arles 13,4% 47,2% 36,4% 0,1% 0,9% 1,9% 739 Mérinos de Rambouillet 30,6% 48,5% 0,0% 11,8% 6,1% 3,1% 229 Milchschaf 2,8% 12,1% 47,7% 37,4% 0,0% 0,0% 107 Mondegueira 1,5% 10,6% 83,3% 4,5% 0,0% 0,0% 66 Montafoner Steinschaf 6,0% 32,0% 34,0% 2,0% 2,0% 24,0% 50 Moscia Leccese 24,0% 48,0% 22,0% 4,0% 0,0% 2,0% 50 Mourérous 3,7% 43,0% 51,4% 0,0% 0,0% 1,9% 107 Navarra 5,2% 31,5% 53,3% 5,2% 0,9% 3,8% 2801 Noire du Velay 4,6% 34,3% 53,2% 0,0% 0,9% 6,9% 216 Nolana 36,0% 20,0% 4,0% 4,0% 30,0% 6,0% 50 Noord Hollander 26,6% 43,8% 20,1% 0,0% 7,3% 2,3% 384 Norfolk Horn 75,7% 22,0% 1,9% 0,3% 0,0% 0,0% 1145 North Ronaldsay 0,0% 1,5% 97,5% 0,4% 0,0% 0,6% 479 Ojalada 8,3% 33,9% 48,8% 8,3% 0,0% 0,8% 121 Ojinegra de Teruel 5,9% 34,8% 53,1% 1,0% 1,0% 4,3% 512 Ostfriesisches Milchschaf braun 1,7% 33,9% 13,6% 50,8% 0,0% 0,0% 59 Ostfriesisches Milchschaf weiss 1,2% 19,3% 30,1% 48,2% 0,0% 1,2% 83 Ouessant 33,5% 43,4% 18,2% 0,0% 4,9% 0,0% 1308 Oxford Down 64,6% 32,2% 3,2% 0,0% 0,0% 0,0% 621 Pinzirita 7,5% 58,5% 17,0% 13,2% 3,8% 0,0% 53 Portland 71,1% 25,8% 0,0% 3,0% 0,0% 0,0% 1050 Préalpes du Sud 15,8% 49,5% 32,1% 0,0% 1,1% 1,5% 816 Racka 8,6% 40,0% 50,0% 0,0% 1,4% 0,0% 70 Rauhwolliges Pommersches Landschaf 5,7% 41,5% 30,2% 20,8% 0,0% 1,9% 53
Rava 17,8% 49,0% 30,1% 0,0% 0,8% 2,3% 259 Rayole 15,3% 47,5% 37,3% 0,0% 0,0% 0,0% 59 Rhönschaf 46,6% 37,9% 6,9% 6,9% 1,7% 0,0% 58 Rijnlam 59,4% 37,5% 0,0% 0,0% 3,1% 0,0% 32 Ripollesa 7,2% 42,3% 39,2% 11,3% 0,0% 0,0% 97 Romanov 3,0% 22,1% 49,9% 3,3% 3,7% 17,9% 429 Romney 37,9% 40,4% 10,5% 4,6% 4,1% 2,4% 1261 Rouge de l'Ouest 48,6% 30,2% 5,4% 0,0% 11,7% 4,2% 1725 Rouge du Roussillon 12,1% 43,7% 35,0% 7,3% 0,5% 1,5% 206 Rough Fell 15,8% 47,8% 29,9% 2,3% 2,6% 1,7% 1449 Roussin 13,5% 27,1% 23,8% 0,4% 6,2% 29,0% 483 Rya 0,0% 14,3% 40,8% 20,4% 2,0% 22,4% 49 Ryeland 80,9% 16,4% 1,3% 0,1% 1,2% 0,2% 1881 Saefting 0,0% 100,0% 0,0% 0,0% 0,0% 0,0% 5 Saloia 9,7% 27,4% 46,8% 12,9% 1,6% 1,6% 62 Sarda 30,0% 42,0% 28,0% 0,0% 0,0% 0,0% 50 Schoonebeeker 0,9% 14,7% 74,0% 0,0% 0,5% 10,0% 1556 Schwarzkopf 47,8% 41,6% 8,4% 0,0% 1,1% 1,1% 178 Schwarzköpfiges Fleischschaf 60,0% 36,0% 4,0% 0,0% 0,0% 0,0% 50 Scottish Blackface 9,1% 39,6% 36,2% 9,9% 1,5% 3,6% 28984

84
Percentage of tested sheep Total No NSP1 NSP2 NSP3 NSP4 NSP5 tested ARR/ARR ARR/X, X≠VRQ) ARQ/ARQ Others ARR/VRQ VRQ/X, X≠ARR Segureña 6,9% 30,9% 53,9% 6,2% 0,4% 1,8% 1474 Serra da Estrela 17,2% 45,3% 29,7% 6,3% 0,0% 1,6% 64 Shetland 8,8% 37,5% 33,1% 8,5% 3,8% 8,3% 7686 Shropshire 9,6% 39,1% 42,6% 8,6% 0,0% 0,0% 2003 Skudde 7,2% 34,8% 54,4% 2,0% 1,6% 0,0% 250 Soay 0,0% 4,4% 63,6% 20,9% 0,1% 11,0% 844 Solognote 14,9% 43,1% 41,4% 0,0% 0,6% 0,0% 174 Somalische Vetstaart 0,0% 0,0% 100,0% 0,0% 0,0% 0,0% 1 Sopravissana 10,0% 52,0% 30,0% 6,0% 0,0% 2,0% 50 South Wales Mountain 42,9% 36,5% 5,3% 3,0% 8,7% 3,6% 2235 Southdown 14,0% 48,2% 36,6% 1,1% 0,0% 0,1% 2897 Suffolk 56,1% 36,7% 5,9% 0,6% 0,5% 0,2% 39043 Sussex Merino 0,0% 100,0% 0,0% 0,0% 0,0% 0,0% 1 Swaledale 16,5% 44,2% 13,6% 14,6% 4,9% 6,0% 6283 Swifter 57,0% 33,2% 4,4% 0,1% 4,2% 1,1% 9585 Talybont Welsh 33,0% 41,9% 2,5% 10,6% 8,0% 4,0% 2828 Tarasconnaise 15,8% 47,9% 33,5% 0,0% 0,0% 2,8% 284 Teeswater 71,0% 2,4% 0,0% 0,0% 24,6% 2,0% 744 Texel 19,0% 44,2% 6,5% 24,6% 2,1% 3,5% 81733 Thônes et Marthod 0,0% 28,3% 69,8% 1,9% 0,0% 0,0% 53 Tiroler Steinschaf 9,8% 31,4% 45,1% 3,9% 0,0% 9,8% 51 Tregaron Welsh Mountain 22,8% 42,0% 4,4% 15,5% 8,3% 7,0% 1660 Valle del Belice 3,4% 49,4% 38,2% 0,0% 3,4% 5,6% 89 Veluws Heideschaap 3,4% 26,1% 60,6% 0,0% 1,9% 8,1% 1506 Vendeen 7,5% 35,9% 53,8% 0,0% 0,6% 2,3% 2063 Vlaams Kuddeschaap 6,5% 43,5% 41,9% 8,1% 0,0% 0,0% 62 Vlaams schaap 44,0% 29,1% 6,9% 4,0% 10,3% 5,7% 175 Waldschaf 11,9% 35,7% 40,5% 8,3% 1,2% 2,4% 84 Wallische Schwarznase 0,0% 0,0% 100,0% 0,0% 0,0% 0,0% 4 Warborough 80,9% 17,7% 0,0% 0,0% 1,4% 0,0% 220 Waterford Blackface 5,8% 32,7% 34,6% 15,4% 5,8% 5,8% 52 Weisse Gehörnte Heidschnucke 18,0% 42,0% 40,0% 0,0% 0,0% 0,0% 50 Weisse Hornlose Heidschnucke 0,0% 41,1% 53,6% 5,4% 0,0% 0,0% 56 weisses Bergschaf 8,3% 41,7% 37,5% 4,2% 2,1% 6,3% 48 Weissköpfiges Fleischschaf 57,4% 31,5% 11,1% 0,0% 0,0% 0,0% 54 Welsh Hill Speckled Face 31,2% 43,7% 12,4% 2,0% 6,4% 4,3% 3021 Welsh Mountain 15,1% 39,2% 12,2% 21,3% 4,8% 7,5% 16022 Wensleydale 81,6% 0,1% 0,0% 0,0% 18,0% 0,4% 1090 White Face Dartmoor 3,1% 19,3% 37,9% 0,9% 38,5% 0,3% 327 White Face Woodland 14,3% 39,8% 10,3% 18,2% 5,4% 12,0% 691 Wicklow Cheviot 7,8% 56,9% 11,8% 9,8% 5,9% 7,8% 51 Wiltshire Horn 47,2% 18,0% 1,3% 1,6% 23,6% 8,4% 3411 Zwartbles 20,6% 43,7% 30,1% 2,1% 1,0% 2,4% 4404 Total 26,7% 38,9% 17,0% 10,3% 3,5% 3,7% 430233

ISBN 92-894-7431-9