REPORT ON THE LIVELIHOOD OF IDPS IN INDONESIA –...
25
Survey on the Livelihood of IDPs in Indonesia Sorong, Papua DRAFT (6/25/02) Page 1 REPORT ON THE LIVELIHOOD OF IDP S IN INDONESIA – DRAFT District: Sorong Province: Papua EXECUTIVE SUMMARY The Survey on the Livelihood of IDPs for Sorong District, one of two districts surveyed from the province of Papua, includes 90 IDP households, 10 host households, and 4 community leaders. There are no female-headed households in the sample. Nearly one-quarter of IDPs live in camps, while almost 30% live in self-built homes on their own property; all are in urban areas. The majority of IDPs are of Moluccan ethnicity, relocated from the district of Maluku Utara. Sixty percent of IDPs have been displaced between 18 and 23 months. The principal reason for displacement is sectarian conflict. Generally, IDPs have access to basic facilities and services including electricity (99%); footpaths or roads (98%); bathing, washing areas and latrines (97%); and potable water (96%). Fewer households have access to trash cans (70%) and wells (39%). Of 89 children between 6-15 years of age, 80% are currently enrolled in school. Unemployment rates among household heads increased from 10% to 13%. There has been a considerable shift from employment in the agricultural sector to industrial production. Currently 38% of household heads are employed in the industrial sector and 25% in agriculture, none of whom are farmers. The remaining household heads work in the professional, clerical, sales, and service sectors. While 17% of IDP households have access to cash savings, no households report access to tools for skilled trades or business, and there are no households with access to agricultural land. Since displacement, asset ownership among households has declined for every recorded asset in the survey. Ownership of luxury and transportation items, as well as poultry, have declined the most significantly. Mean total household income has increased by 23,178 Rp/month, which corresponds to a 4% increase in income. However, total monthly household income has decreased for 29% of the households sampled. Over half of IDPs report that it is difficult for members to find paid work in the vicinity. About 34% of families report no change in income, and for 37%, total household income has increased since displacement. Average per capita income has increased by 10,360 Rp/month. Nearly half of all IDP families fall below the district per capita poverty line of 93,532 Rp/month. All households in Sorong are able to consume rice on a daily basis, with a mean consumption of 17 times per week. Side-dishes are also widely consumed, an average of 14 times per week. Mean per capita consumption of rice is 260 grams/day, or 936 Kcal. Most households do not regularly consume staples other than rice. Less than half of all households below the poverty line consume rice three times per day. One-third of all IDPs lack sufficient food to fulfill their daily needs. As a result, all household members have decreased daily food intake. Additionally, nearly 40% borrow money and one-third of IDPs have resorted to selling assets. No households report monetization of food rations. Although 93% of all IDP households have received staple food assistance, this assistance is limited in frequency and duration. Cash assistance for side-dishes is less substantial, with fewer than half of all IDP families receiving assistance, on only one occasion. For non-food aid, 71% of households have received clothing, but only one household has received a family kit. The most common illnesses are coughing and influenza, fevers, and malaria, and 80% of households experiencing illness report malaria during the wet season. Overall, IDPs report limited access to and utilization of health services – prayer is the most common treatment of ailments. Survey findings for emotional well-being indicate that IDPs in Sorong exhibit most indicators of emotional stress less frequently than IDPs overall. The most commonly reported indicators of emotional stress among men and women are illnesses that are difficult to cure, sadness, daydreaming and insomnia. Less than 3% of respondents indicate that children exhibit signs of emotional trauma such as violent behavior, fear, loss of appetite or frequent daydreaming. While host households and communities express a willingness to continue hosting IDP families, there is some indication that the influx of IDPs is a severe burden on hosts. Community leaders perceive that IDPs have contributed to an increase in theft, alcohol abuse, youth unemployment and school dropouts. For the most part, host households and communities do not receive compensation for accommodating IDPs, and one-third of host families report that presence of IDPs is negatively affecting household food sufficiency. .
Transcript of REPORT ON THE LIVELIHOOD OF IDPS IN INDONESIA –...

Survey on the Livelihood of IDPs in Indonesia Sorong, Papua DRAFT (6/25/02) Page 1
REPORT ON THE LIVELIHOOD OF IDPS IN INDONESIA – DRAFT District: Sorong Province: Papua
EXECUTIVE SUMMARY
The Survey on the Livelihood of IDPs for Sorong District, one of two districts surveyed from the
province of Papua, includes 90 IDP households, 10 host households, and 4 community leaders. There are no female-headed households in the sample. Nearly one-quarter of IDPs live in camps, while almost 30% live in self-built homes on their own property; all are in urban areas. The majority of IDPs are of Moluccan ethnicity, relocated from the district of Maluku Utara. Sixty percent of IDPs have been displaced between 18 and 23 months. The principal reason for displacement is sectarian conflict.
Generally, IDPs have access to basic facilities and services including electricity (99%); footpaths or roads (98%); bathing, washing areas and latrines (97%); and potable water (96%). Fewer households have access to trash cans (70%) and wells (39%). Of 89 children between 6-15 years of age, 80% are currently enrolled in school.
Unemployment rates among household heads increased from 10% to 13%. There has been a considerable shift from employment in the agricultural sector to industrial production. Currently 38% of household heads are employed in the industrial sector and 25% in agriculture, none of whom are farmers. The remaining household heads work in the professional, clerical, sales, and service sectors. While 17% of IDP households have access to cash savings, no households report access to tools for skilled trades or business, and there are no households with access to agricultural land. Since displacement, asset ownership among households has declined for every recorded asset in the survey. Ownership of luxury and transportation items, as well as poultry, have declined the most significantly.
Mean total household income has increased by 23,178 Rp/month, which corresponds to a 4% increase in income. However, total monthly household income has decreased for 29% of the households sampled. Over half of IDPs report that it is difficult for members to find paid work in the vicinity. About 34% of families report no change in income, and for 37%, total household income has increased since displacement. Average per capita income has increased by 10,360 Rp/month. Nearly half of all IDP families fall below the district per capita poverty line of 93,532 Rp/month.
All households in Sorong are able to consume rice on a daily basis, with a mean consumption of 17 times per week. Side-dishes are also widely consumed, an average of 14 times per week. Mean per capita consumption of rice is 260 grams/day, or 936 Kcal. Most households do not regularly consume staples other than rice. Less than half of all households below the poverty line consume rice three times per day. One-third of all IDPs lack sufficient food to fulfill their daily needs. As a result, all household members have decreased daily food intake. Additionally, nearly 40% borrow money and one-third of IDPs have resorted to selling assets. No households report monetization of food rations.
Although 93% of all IDP households have received staple food assistance, this assistance is limited in frequency and duration. Cash assistance for side-dishes is less substantial, with fewer than half of all IDP families receiving assistance, on only one occasion. For non-food aid, 71% of households have received clothing, but only one household has received a family kit.
The most common illnesses are coughing and influenza, fevers, and malaria, and 80% of households experiencing illness report malaria during the wet season. Overall, IDPs report limited access to and utilization of health services – prayer is the most common treatment of ailments. Survey findings for emotional well-being indicate that IDPs in Sorong exhibit most indicators of emotional stress less frequently than IDPs overall. The most commonly reported indicators of emotional stress among men and women are illnesses that are difficult to cure, sadness, daydreaming and insomnia. Less than 3% of respondents indicate that children exhibit signs of emotional trauma such as violent behavior, fear, loss of appetite or frequent daydreaming.
While host households and communities express a willingness to continue hosting IDP families, there is some indication that the influx of IDPs is a severe burden on hosts. Community leaders perceive that IDPs have contributed to an increase in theft, alcohol abuse, youth unemployment and school dropouts. For the most part, host households and communities do not receive compensation for accommodating IDPs, and one-third of host families report that presence of IDPs is negatively affecting household food sufficiency. .
Survey on the Livelihood of IDPs in Indonesia Sorong, Papua DRAFT (6/25/02) Page 2
The Survey on the Livelihood of IDPs for Sorong district, one of two districts surveyed from the province of Papua, includes three components: 1) the IDP Questionnaire, with a sample size of 90 IDP households; 2) the Host Household Questionnaire, with a sample size of 10 host households; and 3) the Community Leader Questionnaire, with a sample of four community leaders. This brief provides results of information collected through the three components of the survey instrument outlined above, for Sorong District. It includes baseline information on the IDP population, and coping mechanisms for securing adequate basic needs for livelihood activities, food and non-food sufficiency, health and shelter. The brief proceeds to report on the emotional condition of respondents, social capital and effects on host households and host communities. The urban district of Sorong is one of two districts surveyed from the province of Papua. Of the 90 IDP households sampled in Sorong, 22 (24%) live in camps. A comparison of the livelihood indicators measured in this study between IDPs in camps and IDPs living in self-owned or host households suggests that coping strategies, income and access to food and resources are nearly equal among the IDP population. A. POPULATION CHARACTERISTICS Members of IDP Households
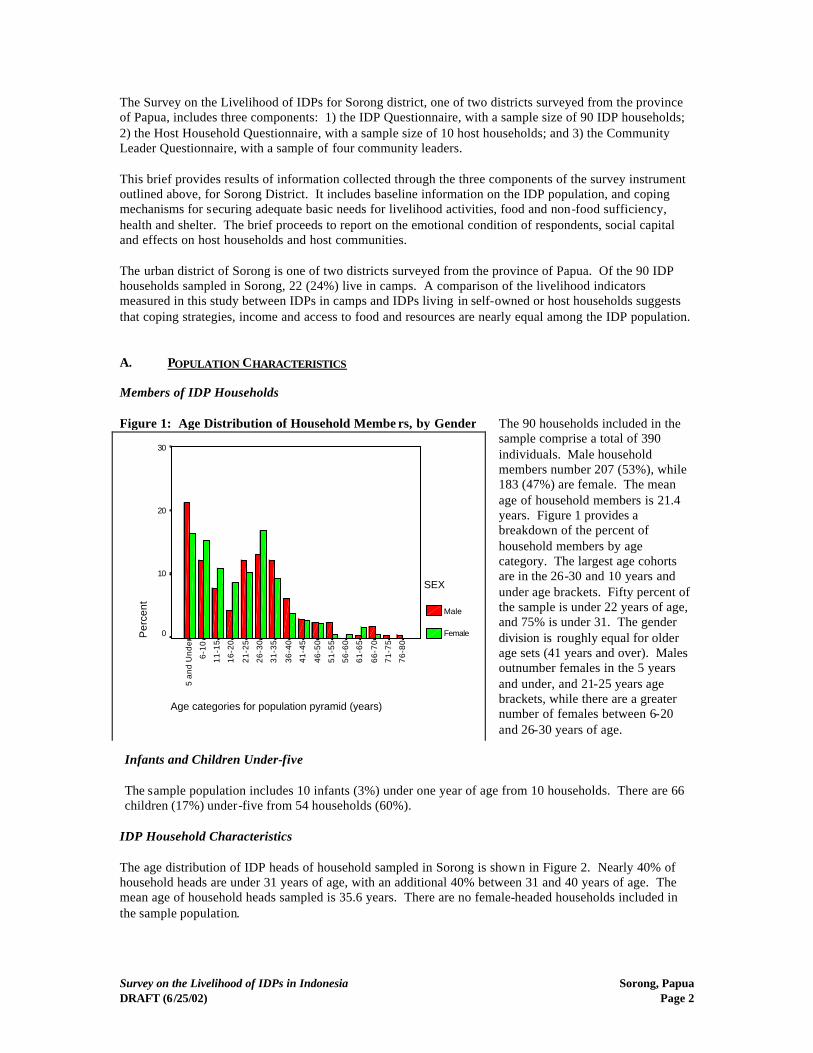
The 90 households included in the sample comprise a total of 390 individuals. Male household members number 207 (53%), while 183 (47%) are female. The mean age of household members is 21.4 years. Figure 1 provides a breakdown of the percent of household members by age category. The largest age cohorts are in the 26-30 and 10 years and under age brackets. Fifty percent of the sample is under 22 years of age, and 75% is under 31. The gender division is roughly equal for older age sets (41 years and over). Males outnumber females in the 5 years and under, and 21-25 years age brackets, while there are a greater number of females between 6-20 and 26-30 years of age.
Infants and Children Under-five The sample population includes 10 infants (3%) under one year of age from 10 households. There are 66 children (17%) under-five from 54 households (60%).
IDP Household Characteristics The age distribution of IDP heads of household sampled in Sorong is shown in Figure 2. Nearly 40% of household heads are under 31 years of age, with an additional 40% between 31 and 40 years of age. The mean age of household heads sampled is 35.6 years. There are no female-headed households included in the sample population.
Figure 1: Age Distribution of Household Membe rs, by Gender
Age categories for population pyramid (years)
76-8
0
71-7
5
66-7
0
61-6
5
56-6
0
51-5
5
46-5
0
41-4
5
36-4
0
31-3
5
26-3
0
21-2
5
16-2
0
11-1
5
6-10
5 an
d U
nder
Per
cent
30
20
10
0
SEX
Male
Female

Survey on the Livelihood of IDPs in Indonesia Sorong, Papua DRAFT (6/25/02) Page 3
As shown in Table 1, the dominant ethnic group is Maluku, accounting for 70% of the sample population, and the majority of IDPs indicate Maluku Utara as their district of residence prior to displacement. All sampled households are Christian. Nearly all heads-of-household (97%) are married, while one is single, and two are widowed. Table 1 also shows the percent distribution of households that fall below the poverty line for each ethnic group by prior district of residence. More than half of all IDPs of Maluku ethnicity fall below the poverty line, and over 60% of Timorese households are in this category. Table 1: Ethnicity of IDPs and Prior Residence of Households Displaced to Sorong, by Ethnic Group
Ethnic Group No. of HH
District of Prior Residence
Province of Prior Residence
Percent below Poverty Line1
MALUKU (n=63 / 70%) 31 Maluku Utara Maluku Utara 52 17 Maluku Tengah Maluku 65 15 Ambon Maluku 40 TIMOR (n=10 / 11.1%) 7 Maluku Utara Maluku Utara 57 3 Maluku Tengah Maluku 67 MANADO (n=5 / 5.6%) 5 Maluku Utara Maluku Utara 2 JAWA (n=1 / 1.1%) 1 Maluku Utara Maluku Utara 100 IRIAN (n=1 / 1.1%) 1 Maluku Utara Maluku Utara 100 BALI (n=1 / 1.1%) 1 Maluku Utara Maluku Utara 0 Others (n=9 / 10%) 6 Maluku Utara Maluku Utara 33 3 Maluku Tengah Maluku 0
IDP Documentation Of the 90 IDP households surveyed in Sorong, 85 (94%) are registered and have been given official documentation of their IDP status. All IDPs living in camps are currently registered. A total of 61 households have retained at least one official document, such as an identity card, driver’s license, or certificate of birth, baptism or marriage. None of the sample households, however, report any difficulty in obtaining IDP assistance.
1 The poverty line was constructed following criteria developed by BPS, and is specific to the district (see Section D.5). The per capita poverty line for Sorong district is 93,532 Rp/month.
Figure 2: Age Distribution of IDP Household Heads
51 and over (n=10)
41-50 (n=10)
31-40 (n=36)
Up to 30 (n=34)

Survey on the Livelihood of IDPs in Indonesia Sorong, Papua DRAFT (6/25/02) Page 4
B. IDP DISPLACEMENT AND RELOCATION IDPs in Sorong report two primary reasons for their last displacement. The majority of households (78 or 87%) relocated because of sectarian conflict, and 12 (13%) attribute their displacement to inter-communal ethnic conflict. Reasons for relocation varied by district of prior residence. All ethnically Timorese IDPs relocated due to sectarian conflict and 55 IDPs of Moluccan ethnicity (87%) also moved because of sectarian conflict. Figure 3 shows the categorical duration of displacement for households in the sample. Fifty-five IDPs (60%) have been displaced for a duration of 18 to 20 months. Only 13 households have been displaced less than one year. Half of all households (45) have moved at least once from their original IDP site − 36 families have lived in two IDP settings and nine households (10%) have relocated twice. Of these 45 households, 18 (40%) moved because of poor conditions such as overcrowding and lack of security. An additional 12 households (27%) relocated in search of work at a new IDP site, eight households (18%) moved to be closer to relatives and six (13%) were relocated by officials. The number of times a family has been displaced influences their current living situation. All households in camps are living in their first IDP setting, while two-thirds (45) of IDP families in other types of living situations – host households or self-owned homes – have moved more than once. IDP Relocations from Host Households Only 14 IDP families (16%) surveyed in Sorong formerly lived with a host household. A ll of these families relocated to a new site, suggesting that conflict between hosts and IDP guest families is not uncommon. The primary reason for moving was the financial strain imposed on host households, reported by five families (36%). Two IDP households (14%) report disagreements with their hosts. Other IDPs relocated in search of better conditions at a new site (3 or 21%), or to have their own home (2 or 14%). C. LIVING S ITUATION AND HOUSEHOLD COMPOSITION C.1 Type of Living Situation Table 2 shows that the majority of IDPs live in a non-camp setting, accounting for 68 households (76%). Of those IDPs living outside of a camp setting, 38 live in their own house on the property of non-relatives and 26 live in a self-owned house on their own property. Two families live in a self-built home on common property and two IDP families live with host households. Nearly one-quarter of IDPs sampled in Sorong live in a camp setting. There are no reported limitations on the movement of IDPs outside of the camp or nearby community. In terms of the source districts for IDPs living in camp and non-camp settings, IDPs living in camps comprise 18 households from the district of Maluku Utara – representing 35% of the 52 IDP households relocated from Maluku Utara, and 82% of IDPs in camps. Nearly all of the 23 IDPs from Maluku Tengah (21 or 91%) live in non-camp settings.
Figure 3: Duration of Displacement (months)
Categories of duration of displacement (months)
30-3518-2312-176-11 months0-5 months
Fre
quen
cy
60
50
40
30
20
10
0
56
20
11
Survey on the Livelihood of IDPs in Indonesia Sorong, Papua DRAFT (6/25/02) Page 5
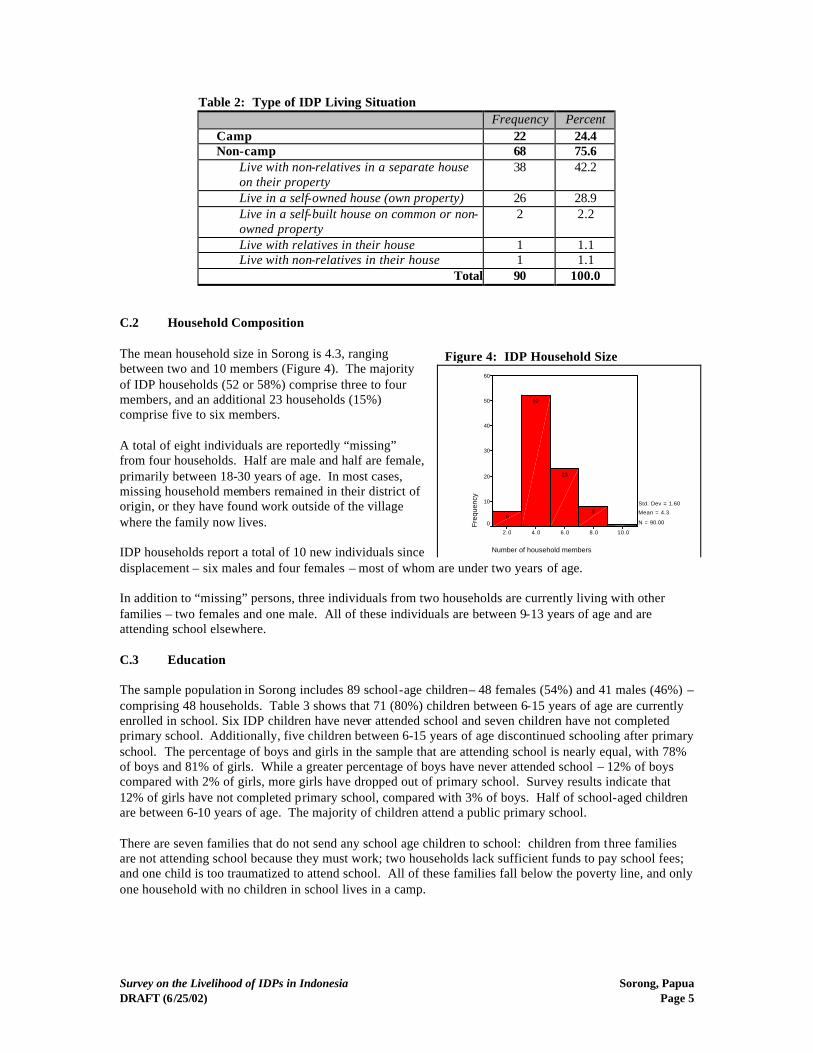
Table 2: Type of IDP Living Situation Frequency Percent
Camp 22 24.4 Non-camp 68 75.6
Live with non-relatives in a separate house on their property
38 42.2
Live in a self-owned house (own property) 26 28.9 Live in a self-built house on common or non-owned property
2 2.2
Live with relatives in their house 1 1.1 Live with non-relatives in their house 1 1.1
Total 90 100.0 C.2 Household Composition The mean household size in Sorong is 4.3, ranging between two and 10 members (Figure 4). The majority of IDP households (52 or 58%) comprise three to four members, and an additional 23 households (15%) comprise five to six members. A total of eight individuals are reportedly “missing” from four households. Half are male and half are female, primarily between 18-30 years of age. In most cases, missing household members remained in their district of origin, or they have found work outside of the village where the family now lives. IDP households report a total of 10 new individuals since displacement – six males and four females – most of whom are under two years of age. In addition to “missing” persons, three individuals from two households are currently living with other families – two females and one male. All of these individuals are between 9-13 years of age and are attending school elsewhere. C.3 Education The sample population in Sorong includes 89 school-age children– 48 females (54%) and 41 males (46%) – comprising 48 households. Table 3 shows that 71 (80%) children between 6-15 years of age are currently enrolled in school. Six IDP children have never attended school and seven children have not completed primary school. Additionally, five children between 6-15 years of age discontinued schooling after primary school. The percentage of boys and girls in the sample that are attending school is nearly equal, with 78% of boys and 81% of girls. While a greater percentage of boys have never attended school – 12% of boys compared with 2% of girls, more girls have dropped out of primary school. Survey results indicate that 12% of girls have not completed primary school, compared with 3% of boys. Half of school-aged children are between 6-10 years of age. The majority of children attend a public primary school. There are seven families that do not send any school age children to school: children from three families are not attending school because they must work; two households lack sufficient funds to pay school fees; and one child is too traumatized to attend school. All of these families fall below the poverty line, and only one household with no children in school lives in a camp.
Figure 4: IDP Household Size
Number of household members
10.08.06.04.02.0
Fre
quen
cy
60
50
40
30
20
10
0
Std. Dev = 1.60
Mean = 4.3
N = 90.00
8
23
52
6

Survey on the Livelihood of IDPs in Indonesia Sorong, Papua DRAFT (6/25/02) Page 6
Table 3: Educational Status of IDP Children (6-15 years) Education of Children, Age 6-15 All Children Males Females
N % N % N % Never Attended School 6 6.7 5 12.2 1 2.1 Dropped out of Primary School 7 7.9 1 2.5 6 12.4 Dropped out after Primary School 5 5.6 3 7.3 2 4.2 Currently Enrolled 71 79.8 32 78.0 39 81.3
Total 89 100.0 41 100.0 48 100.0 Nearly all households (32 or 76%) are required to pay school fees; of these, only six receive any dispensation. Educational expenses include school uniforms (36 or 40%); books (35 or 39%); donations for teachers and school authorities (24 or 27%); and transportation (18 or 20%). Four households regularly postpone paying educational expenses due to lack of funds. One household only sends boys to school. Children attending school travel a mean distance of 1.4 kilometers from the camp or household – 40% of children attending school travel less than one kilometer, with an additional 30% traveling less than two kilometers. Table 4 presents survey results for the levels of educational attainment for all adult IDPs in the sample, 16 years of age and over. Ninety-nine percent of the sample has acquired some level of formal schooling, though 6% have not completed primary school. Twenty-four percent of all IDPs over-15 have attained a primary school level of education. An additional 24% of the sample has completed lower secondary school, and 41% has completed upper secondary school. Four percent of IDPs have attained a tertiary level of education. Non-attendance is nearly equal for males and females, accounting for two males and one female. While a greater percentage of females have not completed primary school – with 8% of females, compared to 4% of males, more females have completed primary school, accounting for 27% of females compared to 21% of males. Likewise, a greater percentage of females have completed lower secondary school. A substantially higher percentage of males, however, continue their education to complete upper secondary school, with 48% of males sampled compared to 33% of females. Six males and four females have attained tertiary level schooling. Table 4: Educational Attainment of Adult IDPs (16-years and over) Education of Adults, Age 16+ All Adults Males Females N % N % N % Never Attended School 3 1.3 2 1.6 1 1.0 Primary Incomplete 13 5.7 5 4.1 8 7.6 Primary 54 23.8 26 21.3 28 26.7 Lower Secondary 54 23.8 25 20.5 29 26.7 Upper Secondary 93 41.0 56 47.5 35 33.3 Tertiary 10 4.4 6 4.9 4 3.8
Total 227 100.0 122 100.0 105 100.0 D. IDP HOUSEHOLD LIVELIHOOD ACTIVITIES AND RESOURCE ENDOWMENTS
D.1 Employment Prior to displacement, 81 households (90%) had at least one member working, primarily in agriculture related fields (47 or 58%). A considerable number of IDPs (21 or 26%) were also engaged in production as their primary employment prior to displacement, and nine (11%) worked in clerical positions. In seven IDP households, two family members were drawing outside incomes – primarily in agriculture; and from two households, three members were working in agriculture.

Survey on the Livelihood of IDPs in Indonesia Sorong, Papua DRAFT (6/25/02) Page 7
Currently, 77 households (86%) have at least one family member over six years of age working and 17 households have two members working, including nine females. One household rep orts that three members – two males and one female – are working. Since displacement, the number of IDPs engaged in agriculture as their primary employment has dropped from 47 to 25 – a 47% decrease. The number of IDPs working in production related fields has increased 34%, to 38 (49%). For female income earners, the primary occupations are in sales, service and professional fields. Table 5 shows the type of employment of the primary income earner for IDP households prior to and after displacement.
Table 5: Main Employment of Principal Income Earner for IDP Households, Prior to and After Displacement
Prior to Displacement After Displacement Frequency Percent Type of Employment Frequency Percent
3 3.3 Professional and Technical 4 4.4 9 10.0 Clerical 7 7.8 - - Sales 2 2.2 1 1.1 Service 1 1.1
47 52.2 Agricultural, Animal Husbandry,
Forestry, Fishing, Hunting 25 27.8 21 23.3 Industrial Production 38 42.2 9 10.0 Unemployed 13 14.4
90 100.0 Total 90 100.0 Over half of households (51 or 57%) report that it is difficult to find paid work in their geographical area. There is no reported seasonal variability in work opportunities. Only 18 respondents (20%) state that they know the daily casual wage rate, citing a range between 10,000 and 25,000 Rp/day. The majority of respondents (14), however, note a daily labor rate of 15,000 Rp. Eleven households (12%), all of whom live in non-camp settings, report that a family member who did not previously work has been forced to work since displacement. Of 68 respondents, only two work in some capacity for their host family − performing basic household work; these households report that they do not receive any type of direct payment or compensation. Table 6 shows the dependency ratio for Sorong households compared to IDP households in general.2 The dependency ratio for Sorong of .29 is similar to the ratio for the overall sample, indicating the same percentage of household members are working, with less variation among households in the district. The dependency ratio is calculated as the number of persons working over the number of household members. D.2 Access to Productive Capital and Assets None of the households in the sample have access to tools for skilled trades or business, and only 15 families (17%) report access to cash savings. Table 7 shows the number and percent of households that report ownership of each item listed in the questionnaire, prior to and after displacement. As the table shows, asset ownership has declined substantially among households sampled, with a decrease for every listed item. Most notably, ownership of poultry has declined from 61% of households prior to displacement to 3% of families currently, and cattle
2 The dependency ratio is calculated based on a single survey response for the total number of persons working in a household, whereas employment figures are drawn from a separate set of individual responses for employment.
Table 6: Dependency Ratio All IDPs Sorong
Mean Dependency Ratio 0.28 0.29 Standard Deviation 0.21 0.14
Survey on the Livelihood of IDPs in Indonesia Sorong, Papua DRAFT (6/25/02) Page 8
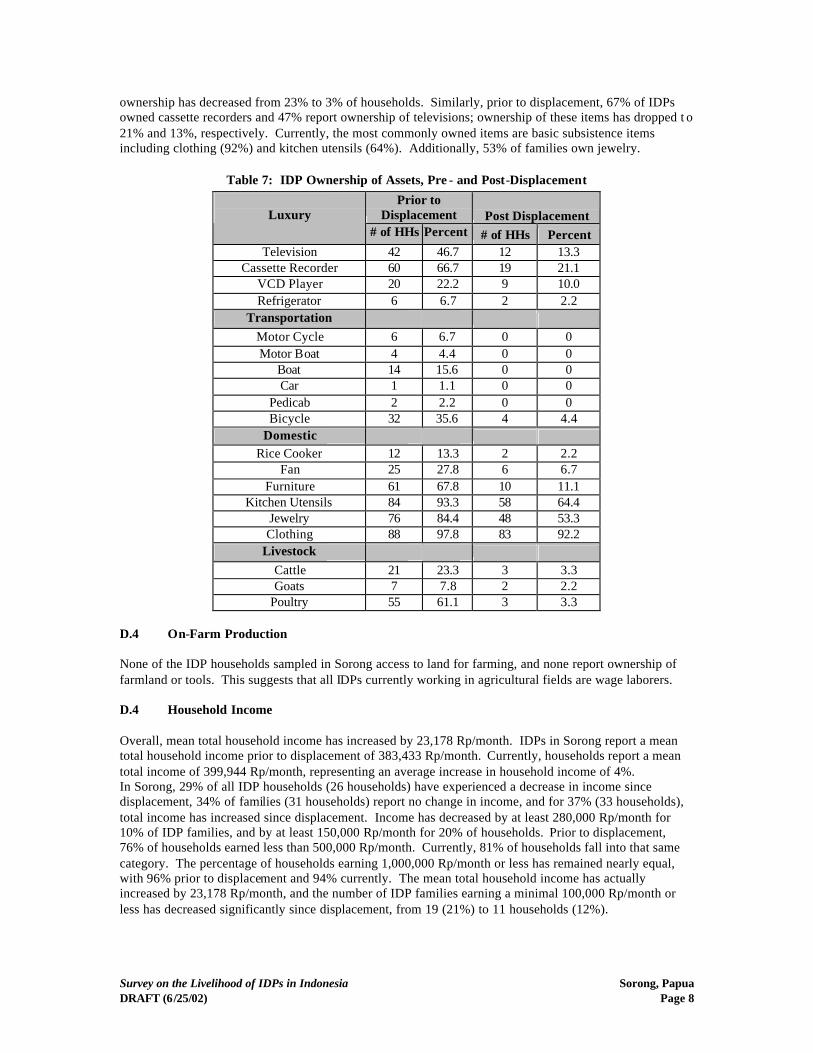
ownership has decreased from 23% to 3% of households. Similarly, prior to displacement, 67% of IDPs owned cassette recorders and 47% report ownership of televisions; ownership of these items has dropped t o 21% and 13%, respectively. Currently, the most commonly owned items are basic subsistence items including clothing (92%) and kitchen utensils (64%). Additionally, 53% of families own jewelry.
Table 7: IDP Ownership of Assets, Pre - and Post-Displacement
Prior to Displacement Post Displacement
Luxury
# of HHs Percent # of HHs Percent Television 42 46.7 12 13.3
Cassette Recorder 60 66.7 19 21.1 VCD Player 20 22.2 9 10.0 Refrigerator 6 6.7 2 2.2
Transportation Motor Cycle 6 6.7 0 0 Motor Boat 4 4.4 0 0
Boat 14 15.6 0 0 Car 1 1.1 0 0
Pedicab 2 2.2 0 0 Bicycle 32 35.6 4 4.4
Domestic Rice Cooker 12 13.3 2 2.2
Fan 25 27.8 6 6.7 Furniture 61 67.8 10 11.1
Kitchen Utensils 84 93.3 58 64.4 Jewelry 76 84.4 48 53.3 Clothing 88 97.8 83 92.2
Livestock Cattle 21 23.3 3 3.3 Goats 7 7.8 2 2.2
Poultry 55 61.1 3 3.3 D.4 On-Farm Production None of the IDP households sampled in Sorong access to land for farming, and none report ownership of farmland or tools. This suggests that all IDPs currently working in agricultural fields are wage laborers. D.4 Household Income Overall, mean total household income has increased by 23,178 Rp/month. IDPs in Sorong report a mean total household income prior to displacement of 383,433 Rp/month. Currently, households report a mean total income of 399,944 Rp/month, representing an average increase in household income of 4%. In Sorong, 29% of all IDP households (26 households) have experienced a decrease in income since displacement, 34% of families (31 households) report no change in income, and for 37% (33 households), total income has increased since displacement. Income has decreased by at least 280,000 Rp/month for 10% of IDP families, and by at least 150,000 Rp/month for 20% of households. Prior to displacement, 76% of households earned less than 500,000 Rp/month. Currently, 81% of households fall into that same category. The percentage of households earning 1,000,000 Rp/month or less has remained nearly equal, with 96% prior to displacement and 94% currently. The mean total household income has actually increased by 23,178 Rp/month, and the number of IDP families earning a minimal 100,000 Rp/month or less has decreased significantly since displacement, from 19 (21%) to 11 households (12%).

Survey on the Livelihood of IDPs in Indonesia Sorong, Papua DRAFT (6/25/02) Page 9
D.5 Per Capita Income and Poverty Figure 5 shows monthly per capita income prior to and after displacement. Per capita income is calculated based on reported household income. Change in per capita income is calculated by averaging the change values for individual households. For two-thirds of the district sample (31 or 34%), there is no calculated change in per capita income. Overall, average per capita income has increased by 10,360 Rp/month. Current mean per capita income is 99,282 Rp/month; prior mean per capita income was slightly lower with 88,922 Rp/month.
Figure 5: Prior and Current Monthly Per Capita Income Streams (Rupiah)
Per capita income prior to displacement
38
00
00
- 4
00
00
03
60
00
0 -
38
00
00
34
00
00
- 3
60
00
03
20
00
0 -
34
00
00
30
00
00
- 3
20
00
02
80
00
0 -
30
00
00
26
00
00
- 2
80
00
02
40
00
0 -
26
00
00
22
00
00
- 2
40
00
02
00
00
0 -
22
00
00
18
00
00
- 2
00
00
01
60
00
0 -
18
00
00
14
00
00
- 1
60
00
01
20
00
0 -
14
00
00
10
00
00
- 1
20
00
08
00
00
- 1
00
00
06
00
00
- 8
00
00
40
00
0 -
60
00
02
00
00
- 4
00
00
0 -
20
00
0Fre
quen
cy
20
10
0
Std. Dev = 69637.89
Mean = 88922
N = 90.00
32
7
10
18
3
15
6
4
18
Current per capita income
37
50
00
- 4
00
00
0
35
00
00
- 3
75
00
0
32
50
00
- 3
50
00
0
30
00
00
- 3
25
00
0
27
50
00
- 3
00
00
0
25
00
00
- 2
75
00
0
22
50
00
- 2
50
00
0
20
00
00
- 2
25
00
0
17
50
00
- 2
00
00
0
15
00
00
- 1
75
00
0
12
50
00
- 1
50
00
0
10
00
00
- 1
25
00
0
75
00
0 -
10
00
00
50
00
0 -
75
00
0
25
00
0 -
50
00
0
0 -
25
00
0Fre
quen
cy
20
10
0
Std. Dev = 63801.30
Mean = 99283
N = 90.00222
8
11
1718
14
4
10
Based on per capita income levels, nearly half (44 or 49%) of all IDP households in Sorong fall below the district level poverty line of 93,532 Rp/month established by BPS for year 2000 (figures for 2001 are unavailable). Although the percentage of IDPs sampled in Sorong that fall below the poverty line is lower than for IDPs overall, it is markedly higher than that of the total population in the district, estimated at 32% (BPS figure for year 2000). The mean per capita income for IDP households under the poverty line is 51,984 Rp/month and none of these households have access to cash savings (the only productive resource reported by IDP households in Sorong). Table 8 shows the type of living situation for the 44 households in Sorong that fall below the poverty line. Poor IDP families are fairly evenly distributed between separate homes with non-related host families, self-owned homes and camps. Over half (12 of 22) of all IDPs living in camp settings fall below the poverty line. Overall, IDPs in camps earn 10% less than those in non-camp settings: IDPs in camps currently earn an average of 91,861 Rp/month, while IDPs that do not live in camps report a
mean per capita income of 101,684 Rp/month since displacement.
Figure 6: Percentage of Households below the Poverty Line
56
49
44
46
48
50
52
54
56
58
All
IDP
s
Sor
ong
Per
cent
of
Hou
seho
lds
Bel
ow P
over
ty
Line

Survey on the Livelihood of IDPs in Indonesia Sorong, Papua DRAFT (6/25/02) Page 10
Table 8: Type of Living Situation of Households below the Poverty Line
No. of HH Percent of HH below poverty line
Live with non-relatives in a separate house on their property
16 36.4
Live in a self-owned house (own property) 14 31.8 Camp 12 27.3 Live with relatives in their house 1 2.3 Live with non-relatives in their house 1 2.3 Total 44 100.0
Figure 7 presents the mean monthly per capita income for households in Sorong, compared with the overall mean for the total IDP sample population. At the district level, mean per capita income increased by 12%. For the population overall, average per capita income decreased by 54%. Although the average monthly per capita income has increased in Sorong, mean per capita income in the district is only 1,616 Rp higher than for the population overall, reflecting the notably low average income levels of IDPs sampled in the district prior to displacement.
Figure 7: Average Prior, Current and Change in Monthly Per Capita Income for
Househol ds in Sorong, Compared with Total IDP Sample Population
Per Capita Income, Prior
0
50000
100000
150000
200000
250000
All
IDP
s
Sor
ongP
er C
apita
Inco
me
(Rup
iah)
Current per Capita Income
96500
97000
97500
98000
98500
99000
99500
All
IDP
s
Sor
ong
Per
Cap
ita In
com
e (R
up
iah
)
Change in per Capita Income
-140000
-120000
-100000
-80000
-60000
-40000
-20000
0
20000
All
IDP
s
Sor
ong
Cha
nge
in P
er C
apita
Inco
me
(Rup
iah)
Figure 8 shows that there is a significant correlation between per capita income level and duration of displacement (p=.01)3. On average, there is a high rate of increase of IDP per capita income during the first year of displacement. After one year of displacement, IDPs report a mean per capita income of 101,800 Rp/month, an increase from a mean of 59,831 Rp/ month for IDPs displaced between 6-11 months. The average monthly per capita income for households displaced between 12-17 months is slightly above the district poverty line, and gains in earned income begin to level off. These findings suggest that duration is a viable indicator of vulnerability. Survey findings suggest that newly displaced families sampled in Sorong are significantly more vulnerable than families that have been displaced longer than one year.
3 ‘P’ is the one-tailed significance of a Pearson’s Correlation. Relationships between variables are considered significant if the Pearson’s Correlation is equal to or greater than a 95% confidence interval.

Survey on the Livelihood of IDPs in Indonesia Sorong, Papua DRAFT (6/25/02) Page 11
Figure 8: Mean of IDP Monthly Per Capita Income by Duration of Displacement
Duration (months)
N Mean (Rp)
Std. Deviation
0-5 2 31250.00 44194.17 6-11 11 59831.17 35678.34 12-17 20 101799.99 91161.79 18-23 56 107954.71 53568.52 30-35 1 133333.33 .
Total 90 99282.67 63801.30
Categories of duration of Displacement
30-3518-2312-176-11 months0-5 months
Mea
n H
H P
er C
apita
Inco
me
140000
120000
100000
80000
60000
40000
20000
0
133333
107955101800
59831
31250
E. FOOD S UFFICIENCY E.1 Food Consumption Frequency of Staple Food and Side-dish Consumption On a daily basis, every IDP household surveyed in Sorong consumes rice. Half of all households consume rice twice a day, and 40 households (44%) consume rice three times per day; only one household reports eating rice once per day. Side-dishes are also widely consumed, almost as frequently as rice: 21 households (23%) consume side dishes 21 times per week; 50 (69%) eat side dishes at least 14 times a week; and 16 households (18%) eat side dishes at least seven times per week. Mean weekly consumption reported by households is 17 times for rice and 14 for side dishes. Many households do not regularly consume staples other than rice on a weekly basis. Noodles are the most important of the alternative staples, consumed by 51 households (57%) at least once per week: 20 households (22%) consume noodles two or three times per week, and 11 households (12%) eat noodles at least once per day. Thirty-two households (18%) report consumption of tubers and bread at least once the previous week. Sago is a less significant staple food, consumed by only 16 households (18%) at least once the previous week. Lastly, only five households eat maize at least once a week. Figure 9 shows the mean weekly household consumption of staple foods and side dishes in Sorong, compared with weekly consumption frequencies for the IDP population overall. Consumption of rice and side dishes in Sorong is equal to frequencies reported by IDPs overall. Consumption of other staple foods, however, is lower for the district.

Survey on the Livelihood of IDPs in Indonesia Sorong, Papua DRAFT (6/25/02) Page 12
Figure 9: Average Weekly Household Consumption of Staple Foods and Side-dishes in Maluku Utara, Compared with the Total IDP Sample Population (n=90)
1 12
3 3
14
17
0 01 2
1
14
17
0
2
4
6
8
10
12
14
16
18
Sago
Maize
Bread
Noodle
sTu
bors
Side D
ish RiceAve
rage
Fre
quen
cy C
onsu
med
per
wee
k
All IDPs
Sorong
E.2 Caloric Intake and Food Sufficiency The overall mean for daily per capita rice consumption in Sorong is only 260 grams, or 936 Kcal,4 indicating that rice comprises less than half of the required daily caloric intake for the sample population. 5 A total of 89 households provide estimates of weekly rice consumption in grams. As calculated from these responses, 27 (35%) households consume less than 200 grams/capita/day; and 65 (73%) consume less than 300 grams/capita/day. The maximum amount of rice consumed per day – reported by two households – is 500 grams/capita. The data does not specify the content nor amount of side dishes consumed, and therefore does not allow for a calculation of caloric intake attributed to side dish consumption. Based on frequency of consumption, however, we can estimate that side dishes account for roughly half of the daily caloric intake. Figure 10 displays the mean per capita income rank compared with the average daily Kcal intake from the principal staples. Households in the “poorest” and “lower poor” income categories fall below the district poverty line, while households in the “middle” and “upper” income categories fall above the poverty level. Kcal consumption increases as the income ranks increase (p = .00).6 There are 23 households each in the poorest group and lower poor group, and 22 each in the middle and upper income groups. The findings show a trend of increasing Kcal intake with increase income rank. On a daily basis, IDPs in the 23 poorest households consume an average of 818 Kcal, compared with 1,128 Kcal in the 22upper income households.
4Calculated based on the US Department of Agriculture’s caloric value for uncooked rice (360 Kcal/100 grams) as well as tubers and noodles; http://www.nal.usda.gov/fnic/cgi-bin/nut_search.pl. 5 The established WFP value for sufficient daily caloric intake is 2,100 Kcal per capita (an average value for the population). 6 P’ is the one-tailed significance of a Pearson’s Correlation. Relationships between variables are considered significant if the Pearson’s Correlation is equal to or greater than a 95% confidence interval.
Figure 10: Average Daily Kcal Intake and Per Capita Income Rank
HH Per Capita Income Rank
UpperMiddleLowerPoorest
Mea
n H
H D
aily
Per
Cap
ita K
cal C
onsu
mpt
ion
1200
1100
1000
900
800
700
1128
1029
870
818

Survey on the Livelihood of IDPs in Indonesia Sorong, Papua DRAFT (6/25/02) Page 13
Fewer than half (19 or 43%) of all households below the poverty line consume rice three times per day. This suggests that 57% of all households are extremely vulnerable – particularly one household that consumes rice only once per day, and reports no source of outside income. The mean daily per capita expenditure on food for self-cooking is 3,002 Rp, ranging between 714 and 8,333 Rp. Nearly all households (81 or 90%) purchase food with money earned from paid employment; only one household relies on cash assistance, and one uses money from savings. Of 89 respondents, 30 (34%) report that food available to their household is insufficient to meet their daily needs. On average, individuals in these households eat 219 grams of rice per day, while members of households with sufficient food availability consume an average of 276 grams of rice per day. To compensate for inadequate food availability, the majority of households (22 or 73%) report that children and adults reduce the amount of food they consume. In an effort to meet their daily food needs, 34 households (38%) have borrowed money. Fourteen of the households that have borrowed money live in camps – 64% of the total camp population. The remaining 20 households live in non-camp settings and comprise nearly one-third of the non-camp population. Most IDPs borrow from friends or family and do not pay interest on loans. Additionally, a total of 31 households (34%) have sold assets they brought with them, and 14 (16%) have resorted to pawning assets. E.3 Food Assistance As shown in Table 9, 84 households (93%) have received staple food assistance to fulfill their daily needs – and all IDPs living in camp settings receive assistance. For most of these families (65 or 77%), however, this assistance has been for a duration of only one month (Table 10).
Table 9: Food Assistance to IDPs Type of Assistance N of Households
Receiving % Predominant Source of
Assistance
Staple Foods 84 93 Government/NGOs Prepared Rations 12 13 Government/Local Communities Cash for Side-dishes 49 54 Government
The maximum duration for staple food assistance, reported by two households, is eight months. The majority of households (59 or 66%) have received staple food assistance one time, with an additional 13 households (14%) receiving assistance twice. The government and NGOs comprise the greatest source of staple food assistance, accounting for 76% of the total in Sorong.
Table 10: Duration (left) and Frequency (right) of Staple Food Assistance
No. of Months
No. of Households
Percent Valid Percent
1 65 72.2 77.4 2 6 6.7 7.1 3 2 2.2 2.4 4 9 10.0 10.7 8 2 2.2 2.4 Total 84 93.3 100.0
No. of Times
No. of Households
Percent Valid Percent
1 59 65.6 70.2 2 13 14.4 15.5 3 4 4.4 4.8 4 2 2.2 2.4 5 1 1.1 1.2 7 3 3.3 3.6 8 2 2.2 2.4
Total 84 93.3 100.0
Cash assistance for side-dishes is less significant, received by 49 IDP families (54%), for a duration of one month. For 47 of the 49 households, assistance was received only once − with only one family receiving assistance two and three times, respectively. The most common source of side-dish assistance is the

Survey on the Livelihood of IDPs in Indonesia Sorong, Papua DRAFT (6/25/02) Page 14
government, contributing 86% of the total cash allocation for side-dishes; the remaining seven households report receiving assistance from NGOs and the local community. Only 12 families (13%) report that they have received prepared food rations on one to three occasions, primarily from the government and local communities. Only three households report that they regularly receive food rations from the government authorities or NGOs − showing no correlation with per capita income level. None of the 90 households included in the survey report selling food rations. E.4 Cooking Practices Nearly all households (88 or 98%) prepare their own food, relying on kerosene as their primary cooking fuel − only one household purchases prepared food. F. NON-FOOD BASIC NEEDS Only 44 families (49%) have an adequate supply of blankets; 57 IDP households (63%) have enough beds or sleeping mats for all members of their family. All but one IDP household has at least two sets of clothing for every family member. To meet periodic non-food needs, some IDP households have resorted to selling (11 or 12%) or pawning (7 or 8%) assets they brought with them to the IDP site. Over 20% of households have borrowed money to meet daily non-food needs. Non-food Assistance Non-food assistance for IDPs is considerably less substantial than for food items (Table 11). None of the IDPs sampled have received household goods such as cooking utensils or blankets. Only one household has received a family kit, from an NGO, and one family has received ‘other’ assistance from the local community. A total of 64 households (71%), however, have received clothing, primarily from NGOs and the government. Table 11: Non-food Assistance to IDP Households in Maluku Tengah District
Commodity # of Households Receiving
Percent of Households Receiving
Predominant Source of Assistance
Blankets 0 0 - Cooking Utensils 0 0 - Clothing 64 71.1 NGOs/Government Family Kits 1 1.1 NGOs Other 1 1.1 Local Community
G. NUTRITION, HEALTH AND INFANT FOOD G.1 Nutrition of Children Under-five
Of 45 respondents (83% of households with children under-five), children from 10 households (11%) do not eat the same foods as adult family members. Generally, the diet for these children consists of "porridge" or instant powdered milk. Figure 11 shows the percent of households with children under-five that consume the listed food at least once a week, for Sorong district and IDPs overall. The most commonly consumed sources of protein and micronutrients for children under-five in Sorong include fresh fish (43 or 96%), vegetables (42 or 93%), fruits other than mango and papaya (30 or 67%), and eggs (28 or 62%). Conversely, less than 10% of households with children under-five report consumption of chicken or

Survey on the Livelihood of IDPs in Indonesia Sorong, Papua DRAFT (6/25/02) Page 15
plain porridge. Compared with children from other districts, children in Sorong consume protein foods such as vegetables, fresh fish, milk, meatballs and shell-fish more frequently. However, a smaller percentage of children in the district regularly consume mango, papaya and meat.
Figure 11: Foods Consumed by Children Under-five at least One Time per Week, in Sorong and for IDP Children Overall (n=45)
0102030405060708090
100V
eget
able
s
Fre
sh F
ish
Egg
s
Oth
er F
ruits
Soy
bean
Cak
e
Bea
ns
Milk
Sal
ted
Fish
Pap
aya
or M
ango
Sal
ty R
ice
Por
ridge
Mea
tbal
ls
Chi
cken
or
Bee
f
Sw
eet R
ice
Por
ridge
Oth
er P
orrid
ge
Shr
imp,
Cra
b or
Squ
id
Chi
cken
Por
ridge
Per
cent
of
Hou
seho
lds
with
Chi
ldre
n
All IDPsSorong
G.2 Diarrhea Incidence among Children Under-five During the last seven days, six children under-five (9%) reportedly suffered from diarrhea. Half of these children continued to eat normally, while half reportedly consumed less than normal. Four children received special foods, notably Oralit given in two cases. Parents in two households discontinued feeding their children certain foods while they were ill with diarrhea to avoid worsening their condition. One child has died since displacement, suffering from a fever in the week prior to death. G.3 Vitamin A Supplements
Prior to displacement, 37 of 52 households with children under-five (71%) received Vitamin A supplements (Table 12). Following displacement, 28 (53%) households report that their children continue to receive Vitamin A supplements. The percentage of infants under one year of age immunized against measles, BCG and polio has also decreased. Prior to displacement, 37 infants (71%) were vaccinated; since displacement, 23 (43%) have been vaccinated.
Table 12: Vitamin A Supplements and Immunizations for Children and Infants Pre-displacement Post-displacement
Services Received by Children Under-5
N of Respondents
N of Children Receiving Services
% N of Respondents
N of Children Receiving Services
% % of All IDP
Children Receiving Services
Children < 5 received Vitamin A
52
37
71
53
28
53 49
Infants Immunized Against: Measles,
BCG and Polio
52
37
71
53
23
43 46

Survey on the Livelihood of IDPs in Indonesia Sorong, Papua DRAFT (6/25/02) Page 16
G.4 Sickness and Access to Medical Treatment
A total of 85 families (94%) sampled report that at least one member of their household has become ill since displacement. Coughs and influenza, malaria and fevers are the most common illnesses reported by IDPs in Sorong, followed by toothache, asthma and diarrhea. The prevalence of illness is slightly higher in the wet season, as may be expected, for most ailments. There is an increase of nearly 20% in the incidence of malaria and fevers during the wet season. Figures 12 and 13show the rates of illness reported in the district compared with the total IDP sample population of 5,506 households. For roughly half of all ailments listed on the questionnaire, rates of illness in Sorong are lower than those reported for the overall IDP population during both the wet and dry seasons. Malaria is considerably more common in Sorong, reported by nearly 80% of respondents in the district sample, compared with one-third of IDP respondents across districts during the wet season.
Figure 12: Wet Season Rates of Illness among IDP Households in Sorong, and the Total IDP Sample Population (n=85)
Wet Season Illness Rates
0102030405060708090
Cou
ghin
g, In
fluen
za
Fev
er
Too
thac
he
Mal
aria
Bac
teria
l Dia
rrhe
a
Hea
dach
e
Ski
n D
isea
se
Res
pira
tory
Sca
ble
Fung
us
Am
oeba
, Pro
tozo
a
Eye
Infe
ctio
n
Fatig
ue
Ast
hma
Stif
f
Ear
, Nos
e, T
hroa
t
Dys
entr
y
Den
gue
Hep
atiti
s
Oth
er
Per
cent
of H
H E
xper
ienc
ing
Illne
ss
All IDPs
Sorong

Survey on the Livelihood of IDPs in Indonesia Sorong, Papua DRAFT (6/25/02) Page 17
Figure 13: Dry Season Rates of Illness among IDP Households in Sorong, and the Total IDP Sample Population (n=85)
Dry Season Illness Rates
0102030405060708090
Cou
ghin
g, In
fluen
za
Fev
er
Too
thac
he
Mal
aria
Bac
teria
l Dia
rrhe
a
Hea
dach
e
Ski
n D
isea
se
Res
pira
tory
Sca
ble
Fung
us
Am
oeba
, Pro
tozo
a
Eye
Infe
ctio
n
Fatig
ue
Ast
hma
Stif
f
Ear
, Nos
e, T
hroa
t
Dys
entr
y
Den
gue
Hep
atiti
s
Oth
er
Per
cent
of H
H E
xper
ienc
ing
Illne
ss
All IDPs
Sorong
Figure 14 shows that the most common treatment for illnesses is prayer, reported by 59 households (69%). Other common practices for treating illnesses include visiting the community health center (42 or 49%), self-treatment (39 or 46%), seeing a private doctor (26 or 31%), or going to the hospital (23 or 27%). When IDP families lack funds for professional medical treatment, the majority (47 or 52%) borrow money, self-treat (26 or 29%), or treat with prayer (10 or 11%). Two households seek no treatment whatsoever.
Figure 14: Household Utilization of Health Care Options (n=85)
01020304050607080
Sel
f-T
reat
men
t
Com
mun
ity H
ealth
Cen
ter
Pra
yer
Oth
er M
edic
al P
erso
nnel
Clin
ic
Priv
ate
Doc
tor
Mid
wife
Hos
pita
l
Fol
k P
ract
ione
rs
Per
cent
of
HH
Util
izin
g Tr
eatm
ent
All IDPsManokwari
Only six IDP households (7%) have access to a permanent health clinic on-site. Of those, five report they have utilised the medical services and one household has paid clinic fees of 500 Rp. Table 13 presents findings on the overall decrease in the utilisation of medical services by pregnant women since

Survey on the Livelihood of IDPs in Indonesia Sorong, Papua DRAFT (6/25/02) Page 18
displacement, including iron folate supplements, ante- and post-natal care, and delivery supervision. Only one family reports that family planning services are available, though they have not used these services.
Table 13: Pregnancy-related and Family Planning Services Utilized by Women Prior to and After Displacement
Last pregnancy before displacement Most recent pregnancy since displacement Services received during pregnancy No. of women
(n=48) Percent of
Respondents No. of women
(n=42) Percent of
Respondents Iron folate 43 89.6 21 50.0 Ante-natal care 40 83.3 21 50.0 Post-natal care 36 75.0 22 52.4 Medically supervised birth 28 58.3 17 40.5 G.5 Infant Food Of the 90 households included in the sample, 10 (11%) have infants under one-year of age. Eight of these infants are currently breastfeeding, for a total reported duration of five to 11 months. Two mothers are unable to breastfeed and therefore provide their infants with baby formula and instant powdered milk. In all but one case, mothers breastfeed in combination with supplemental foods. H. HOUSING CONDITIONS, FACILITIES AND S ECURITY H.1 Housing Conditions Table 14 shows type of IDP housing facilities by living situation. The majority of IDP families in Sorong live in temporary housing accommodations (40 or 44%). An additional 28 families (31%) live with a host household, and 22 (24%) live in other types of camp housing (type of housing is not coded for the data set).
Table 14: Type of IDP Housing Facility Type of Living Situation of IDP
Household Facility type Frequency Percent
Camp Other 22 100 Live with relatives in their house Host house 1 100.0 Live with non-relatives in their house Host house 1 100.0 Live with non-relatives in a separate house on their property
Temporary housing 38 100.0
Live in a self-owned house (own property) Host house 26 100.0 Live in a self-built house on common or non-owned property
Temporary housing 2 100.0
Generally, IDPs have access to basic facilities and services including electricity (89 or 99%); footpaths or roads (88 or 98%); and bathing, washing areas and latrines (87 or 97%). Ninety-six percent of IDPs report access to drinking water, including all camp dwelling IDPs. Only 39% of IDPs overall have access to a well (Table 15).

Survey on the Livelihood of IDPs in Indonesia Sorong, Papua DRAFT (6/25/02) Page 19
Table 15: IDP Access to Services
Type of Living Situation of IDP Household
Drinking Water
Bathing/W ashing Latrine
Well Electricity Trash Can Footpaths
n Yes % Yes % Yes % Yes % Yes % Yes % Camp 22 22 100 22 100 8 36 22 100 17 77 22 100 Live with relatives in their house 1 1 100 1 100 0 0 1 100 1 100 1 100 Live with non-relatives in their house
1 1 100 1 100 1 100 1 100 0 0 0 0
Live with non-relatives in a separate house on their property
38 37 97 38 100 14 37 38 100 30 79 37 97
Live in a self-owned house (own property)
26 23 89 24 92 11 42 25 96 13 50 26 100
Live in a self-built house on common or non-owned property
2 2 100 1 50 1 50 2 100 2 100 2 100
Total 90 86 96 87 97 35 39 89 99 63 70 88 98
H.2 Potable Water and Sanitation Water use Figure 15: Total Daily Water Use for Cooking, Washing and Bathing
Total water used daily for cooking, washing and bathing (buckets)
40.035.030.025.020.015.010.05.00.0
Fre
quen
cy
40
30
20
10
0
Std. Dev = 7.53
Mean = 17.4
N = 90.00
All IDPs sampled report that they are able to access safe drinking water. Seventy-four households (82%) rely on piped water systems. Other water sources include wells (8), springs (4), and rainwater (3). For 98% of all families, the distance from the IDP site to the nearest water source is less than 75 meters, with a mean of 14.5 meters. Nearly all households (84 or 93%) have an adequate supply of drinking water. Overall, IDP households report a mean daily water requirement of 17.4 buckets for cooking, washing and bathing (Figure 15).7
Waste Disposal A total of 55 households (61%) have access to and use bins for rubbish collection. IDPs without adequate facilities for trash disposal primarily burn refuse (15 or 44%), the remainder of which is deposited in rivers, gardens, rubbish holes or in sewage gutters. Only two households report on human waste disposal practices and both houses deposit waste in rivers. Most IDP households reportedly work together to voluntarily maintain their surrounding environment, particularly garden sites (84 or 93%), sewage gutters (81 or 90%), the camp site or IDP housing areas (77 or 86%) and bathing, washing and latrine areas (73 or 81%). H.3 Personal Security
Nearly all families in Sorong feel generally safe at their IDP site, reported by 88 households (98%) – 87 families state that they always feel safe in their living situation, and one household feels safe “sometimes”.
7 One bucket is roughly equivalent to 10 liters.

Survey on the Livelihood of IDPs in Indonesia Sorong, Papua DRAFT (6/25/02) Page 20
The remaining two households feel safe “rarely” or “never”, respectively. Both of these households are situated in camps. All 90 households state that women are safe to walk around the camp freely at night. I. EMOTIONAL EVALUATION To assess the emotional health of IDPs, the questionnaire asks a female respondent from each household to indicate – by degree (“often”, “sometimes” or “never”) – the prevalence of a number of observable indicators for herself, her husband and her children. The figures below present the percentage of respondents that report “often” for each indicator, for the district, and the IDP population overall. Figure 16 shows the percent of female respondents that “often” experience a given indicator; Figure 17 presents the respondent’s observations of her husband; and lastly, Figure 18 shows the results for the respondent’s observations of her children. Figure 16 shows that female respondents in Sorong experience most of the observable indicators included in the questionnaire less often than female respondents across districts. The most commonly reported indicator of emotional stress among respondents is illnesses that are difficult to cure, reported by 20% of women in Sorong, and 11% of women overall.
Figure 16: Observable Signs of Emotional Health of the Female Respondent, for Sorong District and IDPs Overall (n=81)
Mental State - Respondents
0
5
10
15
20
25
Violen
t
Letha
rgy
Suicid
al
Sad/C
rying
Insom
nia
Nightm
ares
Illnesse
s
Loss
Appe
tite
Daydre
am Ange
r
Powerle
ss
Anxio
us/W
orried Bo
red
% O
ften All IDPs
Sorong
Similarly, the most commonly exhibited indicator of emotional stress among adult males in the district is prolonged illness, as shown in Figure 17. Eighteen percent of men in Sorong experience illnesses that are difficult to cure, compared with 10% overall. The second most common indicator of emotional stress among men is sadness, reported by 11% of respondents in Sorong (compared with 17% of men across all districts).

Survey on the Livelihood of IDPs in Indonesia Sorong, Papua DRAFT (6/25/02) Page 21
Figure 17: Observable Signs of Emotional Health of the Respondent’s Husband, for Sorong District and IDPs Overall (n=81)
Mental State - Husbands
02468
101214161820
Violen
t
Letha
rgy
Drinkin
g
Fightin
g
Suicida
lSad
Insom
nia
Nightm
ares
Illnes
ses
Loss
Appe
tite
Daydrea
mAn
ger
Compla
ining
Powerle
ssW
orried
Bored
% O
ften All IDPs
Sorong
Figure 18 shows that children in Sorong rarely exhibit any signs of emotional trauma. Less than 3% of respondents observe children behaving violently, expressing fear, lacking an inclination to eat or frequently daydreaming. For all other indicators, at least three-quarters of respondents indicate that their children never exhibit the indicators of emotional stress listed in the questionnaire.
Figure 18: Observable Signs of Emotional Health of the Respondent’s Children, for Sorong District and IDPs Overall (n=81)
Mental State - Children
0123456789
10
Violen
t
Hypera
ctive
Mischie
f
Letha
rgy
Unfamilia
l
Isolate
dAfr
aid
Sad/C
rying
Insom
nia
Loss
Appetit
eFe
ars
Daydre
am
% O
ften All IDPs
Sorong
Survey on the Livelihood of IDPs in Indonesia Sorong, Papua DRAFT (6/25/02) Page 22
J. SOCIAL CAPITAL
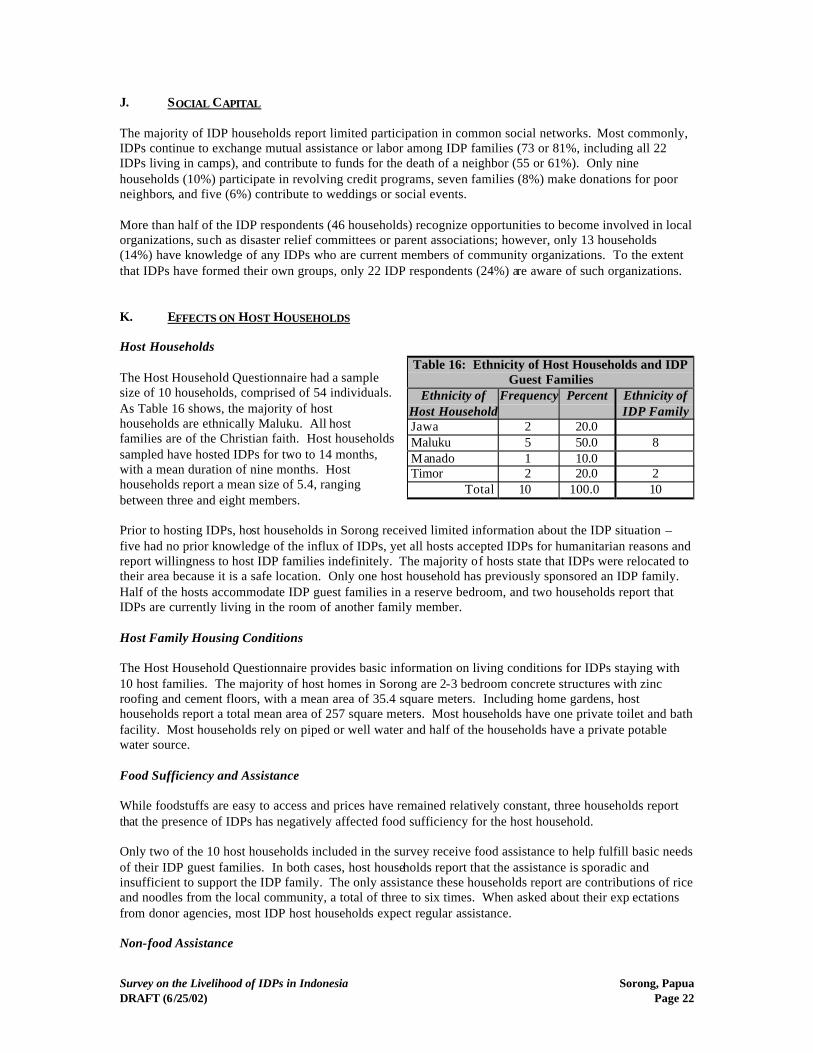
The majority of IDP households report limited participation in common social networks. Most commonly, IDPs continue to exchange mutual assistance or labor among IDP families (73 or 81%, including all 22 IDPs living in camps), and contribute to funds for the death of a neighbor (55 or 61%). Only nine households (10%) participate in revolving credit programs, seven families (8%) make donations for poor neighbors, and five (6%) contribute to weddings or social events. More than half of the IDP respondents (46 households) recognize opportunities to become involved in local organizations, such as disaster relief committees or parent associations; however, only 13 households (14%) have knowledge of any IDPs who are current members of community organizations. To the extent that IDPs have formed their own groups, only 22 IDP respondents (24%) are aware of such organizations. K. EFFECTS ON HOST HOUSEHOLDS Host Households The Host Household Questionnaire had a sample size of 10 households, comprised of 54 individuals. As Table 16 shows, the majority of host households are ethnically Maluku. All host families are of the Christian faith. Host households sampled have hosted IDPs for two to 14 months, with a mean duration of nine months. Host households report a mean size of 5.4, ranging between three and eight members. Prior to hosting IDPs, host households in Sorong received limited information about the IDP situation – five had no prior knowledge of the influx of IDPs, yet all hosts accepted IDPs for humanitarian reasons and report willingness to host IDP families indefinitely. The majority of hosts state that IDPs were relocated to their area because it is a safe location. Only one host household has previously sponsored an IDP family. Half of the hosts accommodate IDP guest families in a reserve bedroom, and two households report that IDPs are currently living in the room of another family member. Host Family Housing Conditions The Host Household Questionnaire provides basic information on living conditions for IDPs staying with 10 host families. The majority of host homes in Sorong are 2-3 bedroom concrete structures with zinc roofing and cement floors, with a mean area of 35.4 square meters. Including home gardens, host households report a total mean area of 257 square meters. Most households have one private toilet and bath facility. Most households rely on piped or well water and half of the households have a private potable water source. Food Sufficiency and Assistance While foodstuffs are easy to access and prices have remained relatively constant, three households report that the presence of IDPs has negatively affected food sufficiency for the host household. Only two of the 10 host households included in the survey receive food assistance to help fulfill basic needs of their IDP guest families. In both cases, host households report that the assistance is sporadic and insufficient to support the IDP family. The only assistance these households report are contributions of rice and noodles from the local community, a total of three to six times. When asked about their exp ectations from donor agencies, most IDP host households expect regular assistance. Non-food Assistance
Table 16: Ethnicity of Host Households and IDP Guest Families
Ethnicity of Host Household
Frequency Percent Ethnicity of IDP Family
Jawa 2 20.0 Maluku 5 50.0 8 Manado 1 10.0 Timor 2 20.0 2 Total 10 100.0 10

Survey on the Livelihood of IDPs in Indonesia Sorong, Papua DRAFT (6/25/02) Page 23
Generally, hosts do not receive compensation for the costs associated with housing IDPs, such as rent or home repairs. Two host families have received cash assistance on one occasion, contributed by the government in one case, and the local community in the other. Impact of IDPs on Host Households Most hosts report that the condition of their home has not changed since the arrival of IDPs. Only one household reports that living space is too limited to accommodate the IDP family. While hosts report that the division of domestic work is generally satisfactory, only two hosts indicate that IDPs perform any work for the host family. In both cases, adults (male and female) contribute to childcare and basic domestic chores. Host respondents describe relationships between IDP and host family members, including children, as friendly or neutral. One respondent acknowledges a resentment of the assistance that IDPs receive, because host households do not receive similar compensation for accommodating IDPs. L. EFFECTS ON HOST COMMUNITIES Four community members from Sorong participated in the Local Community Leader Questionnaire. Respondents indicate that local communities did receive information – though limited in detail – about the arrival of IDPs to the area, available through religious leaders. The primary factor leading to the relocation of IDPs to Sorong is proximity to family. The relative safety of the area is a secondary consideration. Community leaders report that community members are generally receptive to the influx of IDPs, and community members have made efforts to counteract unexpected impacts that may result from the IDP presence, particularly sermons by religious leaders. The only form of compensation that communities receive for hosting IDPs is basic food assistance. The government and NGOs are the primary source of food assistance, which has been received an average of three times. To obtain assistance, host communities must first submit a proposal. While the majority of community leaders state that communities can continue to host IDPs for the foreseeable future without creating an undue burden on the community, one respondent reports that the presence of IDPs has already drained local community resources. Half of host community respondents report that IDPs voluntarily work on behalf of the community. IDPs are compensated with wages, foodstuffs and housing. Impact of IDPs on Host Communities Table 17 shows that, overall, IDPs have had a limited impact on local resources and services, such as food and water availability, the quality of health services, education and sanitation. Host community respondents also report no change in the surrounding environment, including forested areas; work opportunities and wages; the incidence of illness; nor cultural activities and festivals. The only significant change is the increase in petty crime, including house theft and pick pocketing. In reporting on benefits and losses to host communities resulting from the influx of IDPs, community leaders report fewer benefits overall. All respondents state that there is livelier community environment. Half of the respondents indicate that economic and business activities have increased with greater demand for goods and services. In terms of negative impacts, however, community leaders attribute a number of problems to the presence of IDPs, including increasing school drop-outs, youth unemployment, alcohol and drug use, and illegal and criminal activities. Host household respondents indicate an overall benefit to communities derived from hosting IDPs. In reporting on the advantages and disadvantages of hosting IDPs, half of the host respondents state that the

Survey on the Livelihood of IDPs in Indonesia Sorong, Papua DRAFT (6/25/02) Page 24
presence of IDPs enhances their homes and communities. IDPs contribute to a livelier environment and increase the solidarity between community members. Nine of 10 hosts report that their general household welfare has not changed since the arrival of IDPs, and no host household identifies an increase in community problems resulting from the presence of IDPs, such as youth unemployment, crime, prostitution, or drug and alcohol use.
Table 17: Impact of IDPs on Local Communities, Reported by Community Leaders
Host community respondents indicate a number of benefits and losses to specific individuals or groups resulting from the presence of IDPs in their communities. These responses are summarized in Table 18. Community leaders identify merchants, farmers and fishers as those having the most to gain from the influx of IDPs. Religious leaders, midwives, housewives and general community members also benefit from the presence of IDPs, though respondents identify some additional challenges to these individuals as well, such as increase in workload. While moneylenders and traditional medicine men incur the greatest losses, they also receive the benefits of increased capital and more patients, respectively.
SERVICES
Inc. Unchanged, No Impact
Dec.
SOCIETY
Inc. Unchanged, No Impact
Dec.
Transportation X Population X
Local Government X Congestion X
Education X Infectious and Skin Disease X
Health Care X Youth Unemployment X
Trash Disposal X School Drop-Out X
Sanitation X Alcohol, Drug Use X
ECONOMY Liveliness X
Local Prices X Mutual Help X
Business Activities X Cultural Activities X
Employment Opportunities X CRIME
Labor Supply X Theft X
Wage Rate X Armed Robbery X
Demand for Goods X Battery and Assault X
RESOURCES Rape X
Food Supply X Riot X
Drinking Water X Homicide X
Environment X Prostitution X
Flooding X Other Illegal Activities X
Trees X

Survey on the Livelihood of IDPs in Indonesia Sorong, Papua DRAFT (6/25/02) Page 25
Table 18: Summary of Benefits and Losses to Host Community Members, Reported by Community Leaders Benefits Losses Merchants aaaa Increase in consumers - Farmers aaaa Increase in work - Fishers aaaa Increase in work -
Religious leaders aaa More intense religious activity a Increasing crime and pregnancy (of unmarried mothers)
Midwives aaa Greater number of patients a More patients, but free services Housewives aaa More domestic help a Increase workload General community aaa Increase in social relationships a
Political leaders aa Increase in party members aa Lack of political interest School teachers/ administrators
aa Increase in pupils aa Limited capacity/resources
Moneylenders a Increase in capital aaa Increase in exploitation Traditional medicine men
a Greater number of patients aaa Shaman is a source of conflict
IDPs and Community Conflict As reported by IDP families, conflicts between IDPs and host communities have been uncommon. Only two of the 90 households in the sample population report any conflict between IDPs and host communities, attributed to the host community’s dislike of the IDP presence in the area. To resolve conflicts with host communities, IDPs favor mediation by local authorities and the active involvement of all community members. Host household respondents (10) describe community relations with IDPs as positive or normal. Hosts attribute conflicts between IDPs and the local community to the host community’s dislike of the IDP presence, or the behavior (“habits”) of the IDP guests. Only one host reports that IDPs staying in their household have encountered any problems with the local community: harassment by the local authorities. Two-thirds of host households feel that the local community is accepting and supportive of the IDP presence.