Report on the Investigation of the Natural Gas Invasion of ... · Report on the Investigation of...
153
Report on the Investigation of the Natural Gas Invasion of Aquifers in Bainbridge Township of Geauga County, Ohio September 1, 2008 Ohio Department of Natural Resources Division of Mineral Resources Management Lease Road to English No.1 Well English No.1 Well
Transcript of Report on the Investigation of the Natural Gas Invasion of ... · Report on the Investigation of...
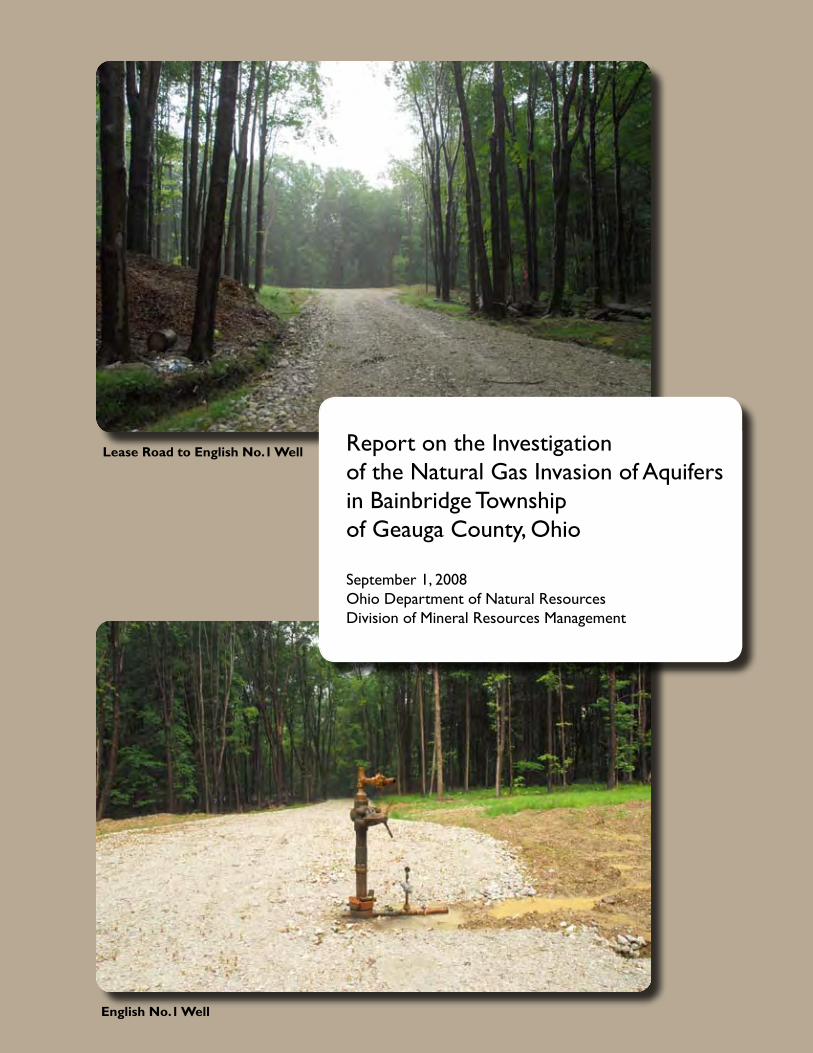
Report on the Investigation of the Natural Gas Invasion of Aquifers in Bainbridge Township of Geauga County, Ohio
September 1, 2008Ohio Department of Natural Resources Division of Mineral Resources Management
Lease Road to English No.1 Well
English No.1 Well

TABLE OF CONTENTS Executive Summary ..……………………………………………………………………………03 Incident Response Summary…..…………………………………………………………………08 Investigation Methods........………………………………………………………………………12 Regional Geologic Setting and Oil and Gas Exploration ....……………………………………. 21 Hydro-Geologic Setting ………………………………………………………………………….23 Background Water Quality....…….………………………………………………………………25 Cause of Aquifer Natural Gas Invasion and Explosion ………………………………………….42 Alternative Explanations ....………………………………………………………………………47 Corrective Action and Remedial Cementing of the English No.1 Well ....………………………51 Risk Assessment / New Permit Conditions ……………………………………………………...53 Water Quality …………………………………………………………………………………….57 Next Steps and Recommendations……………………………………………………………….76 Summary of Public Communications ……………………………………………………………77 References..……………………………………………………………………………………….81
APPENDICES
Appendix 1. Ohio Environmental Protection Agency Public Water Standards Appendix 2. Oil and Gas Well Permit Conditions
Appendix 3. Public Communications
FIGURES
Figure 1. Location of Bainbridge Township in Geauga County, Ohio
Figure 2. Location of the in-house explosion
Figure 3. Location of the 19 evacuated homes
Figure 4. Location of residences with disconnected water well
REPORT ON THE BAINBRIDGE INVESTIGATIONi
Figure 5. Location of residences receiving bottled water
Figure 6. Location of residences with in-house gas detection systems
Figure 7. Location of domestic water wells pumped to remove natural gas from aquifers
Figure 8. Location of oil and gas wells within one mile radius
Figure 9. Natural gas monitoring area
Figure 10. Water wells sampled between December 17, 2007 and January 26, 2008
Figure 11. Water wells sampled between February 19, 2008 and March 11, 2008
Figure 12. Generalized schematic of a “Clinton” sandstone oil and gas well
Figure 13. Surface topography of the investigation area
Figure 14. Glacial geology of the investigation area
Figure 15. Bedrock surface topography in the investigation area
Figure 16. Bedrock geology in the investigation area
Figure 17. Ground-water levels and direction of flow in the glacial and Pottsville aquifer in Geauga County Figure 18. Ground-water levels and direction of flow in the Berea Sandstone aquifer in Geauga County Figure 19. Location of water wells sampled by the United States Geological Survey
Figure 20. Binary mixing curves plotting chloride to bromide ratio versus chloride concentration Figure 21. Construction of the English No.1 Well after primary cement job on the production casing (November 1, 2007) Figure 22. Deep gas migration into the annulus of the English No.1 Well Figure 23. Construction of the English No.1 Well after the first remedial cement squeeze job on December 15, 2007 Figure 24. Construction of the English No.1 Well after the second remedial cement squeeze job on December 17, 2007 Figure 25. Location of water wells affected by natural gas from the English No.1 Well
REPORT ON THE BAINBRIDGE INVESTIGATIONii

EXECUTIVE SUMMARY Incident Response
On Saturday, December 15, 2007, at 7:30 AM, the Geauga County Emergency Management Agency notified an Ohio Department of Natural Resources, Division of Mineral Resources Management (DMRM) Inspector that there was an explosion at a house on 17975 English Drive in Bainbridge Township of Geauga County. Two residents in the house at the time of the explosion were not injured, but the house was significantly damaged. The DMRM responded immediately and three DMRM Inspectors were on location on Saturday morning.
The Bainbridge Township Fire Department and Dominion East Ohio personnel canvassed
the surrounding neighborhoods to identify houses and water wells with detectable natural gas to ensure prompt evacuation of potentially at-risk residents. Early in the investigation, responders recognized that natural gas was entering homes via water wells. There were a number of possible avenues for natural gas to enter residences via ground water, including 1) unvented water wells located in basements, 2) abandoned and unplugged water wells in basements, and 3) wells with indoor well pumps. The in-home water wells and abandoned wells were immediately identified as high risk. By the evening of December 15, 2007, 19 homes had been evacuated. Utilities were disconnected for safety reasons. Ohio Valley Energy Systems Corp. (OVESC), the owner of the recently completed English No.1 oil and gas well, assumed responsibility to coordinate lodging and meal arrangements for all displaced residents.
DMRM inspectors evaluated local oil and gas wells to identify potential source(s) of the
problem. Based upon preliminary information regarding the extent of the natural gas incident, DMRM inspectors were instructed to focus attention on surface-production casing annular pressures at all oil and gas wells within the investigation area. When DMRM inspectors arrived at the English No.1 Well, representatives of OVESC and their consultant were already on location evaluating the well and discussing remedial cementing plans. OVESC management elected to take a pre-emptive approach and assume responsibility rather than waiting for completion of the DMRM investigation. By the end of day one, the Bainbridge Fire Department had evacuated potentially at-risk residents, the DMRM had identified the likely cause of the problem, and OVESC had initiated corrective action.
During the weeks following the explosion, DMRM initiated a monitoring program to 1)
identify water wells with detectable natural gas, 2) define the area where water samples would be collected, 3) monitor in-house gas concentrations for protection of public health and safety, and 4) measure the response of water wells to the corrective action at the English No.1 Well. OVESC contractors disconnected 26 water wells, purged gas from domestic plumbing/heater systems, installed vents on six water wells, plugged abandoned in-house water wells, plumbed 26 houses to temporary water supplies, provided 49 in-house methane monitoring systems for homeowner installation, and began to provide bottled drinking water to 48 residences upon request. By December 24, 2007 (Day 9) all residents had been returned to their homes, except for the family whose house was damaged by the explosion.
REPORT ON THE BAINBRIDGE INVESTIGATIONPAGE 3

Public Safety Wall-mounted gas detection equipment provided continuous LEL monitoring at 49
residences. These gas detectors are designed to monitor explosive gas levels in the ambient air within a home providing continuous digital readings. These systems are programmed to provide audible alarms at 10 percent of the Lower Explosive Limit (LEL) for natural gas, well below the explosive level. If an alarm were triggered, the DMRM advised residents to shut off running water, ventilate the house, and immediately call the Bainbridge Fire Department and the DMRM. The DMRM recommended the following actions in response to LEL measurements within a home. These action levels do not apply to measurements at the wellhead or measurements at the water tap.
% LEL Range Action 1 – 4 No immediate action necessary 5 – 9 Increase ventilation, continue to monitor to see if
the % LEL continues to rise 10 – 19 Shut off water; and monitor to see if % LEL
continues to rise 20+ Keep water shut off; increase ventilation;
evacuate the premises; call the Fire Department for an inspection (440) 543-9873; notify DMRM at (330) 896-0616
The DMRM also coordinated a monitoring program to collect in-house gas readings on a
regular schedule. From the time the continuous monitoring systems were installed to September 1, 2008, the DMRM is not aware of a single incident where in-house gas concentrations triggered an alarm. The highest in home reading recorded during the first nine months was 0.8 percent of the LEL. At this level, the concentration of gas in the confined space would need to increase 125-fold in the presence of an ignition source to trigger an explosion. The highest concentration of dissolved methane found in 79 ground water samples was 1.04 mg/L. At this concentration, the federal Office of Surface Mining recommends periodic monitoring, but no specific action. Cause of Natural Gas Invasion of Aquifers
The primary oil and gas-bearing reservoir in eastern Ohio is the Silurian “Clinton” sandstone. The “Clinton” is a driller’s term for a sequence of inter-bedded sandstones, siltstones and shales that range from 60 to 200 feet thick in eastern Ohio. Over 79,000 wells have been drilled to the “Clinton sandstone” in eastern Ohio since 1897. The Clinton is generally 3600 to 3900 feet below surface in Bainbridge Township. Since 1981, the DMRM had issued 131 permits to drill “Clinton” oil and gas wells in Bainbridge Township. All producing wells in Bainbridge Township have been completed in the “Clinton” sandstone.
The DMRM determined that accumulation and confinement of deep, high-pressure gas in
the surface-production casing annulus of the English No.1 Well, between November 13 and December 15, 2007 resulted in over-pressurization of the annulus. This over-pressurized condition resulted in the invasion, or migration, of natural gas from the annulus of the well into natural fractures in the bedrock below the base of the cemented surface casing. This gas migrated
REPORT ON THE BAINBRIDGE INVESTIGATIONPAGE 4
vertically through fractures into the overlying aquifers and discharged, or exited, the aquifers through local water wells.
Three different factors in the drilling and completion of the English No.1 Well are
believed to be the primary contributing factors that led to the gas invasion of the shallow aquifers and subsequent explosion in the house on English Drive. The first contributing factor was inadequate cementing of the production casing prior to remedial cementing on December 15 2007. The second contributing factor was the decision to proceed with stimulating, or hydro-fracturing, the well without addressing the issue of the minimal cement behind the production casing. Hydro-fracturing is the process in which fluid is pumped into the oil and gas reservoir through perforations in the production casing t enhance fractures and improve the flow of gas and/or crude oil into the production casing. Finally, the third and most critical contributing factor leading to the incident was the 31 day period after the fracturing stimulation of the “Clinton” sandstone during which the annular space between the surface and production casings was mostly shut in. This confined the deep, high-pressure gas from “Newburg” and/or “Clinton” within this restricted space. Readings taken and reported by OVESC during this shut in period were consistently 320 psi or greater. Corrective Action
The DMRM evaluated OVESC’s remedial cement job at the English No.1 Well by reviewing annular pressure measurements and well construction records including four cement bond logs. Based upon this evaluation, the DMRM concluded that:
1. Inadequate primary cementing of the production casing has been remedied by the
subsequent squeeze cementing operations; 2. The deep high-pressure gas zones that were the source of over-pressurization of the
aquifers have been isolated and sealed from the well bore through the squeeze cementing procedures;
3. The confinement of annular gas, which caused the build up of pressure, has been eliminated.
Remedial cementing operations completed by OVESC in mid-December, 2007 have effectively isolated and sealed deep, high-pressure gas bearing zones. As a result, natural gas from deep formations can no longer migrate up the surface-production casing annulus of the English No.1 Well and migrate into local aquifers. The “Clinton” sandstone and “Newburg” are effectively sealed behind cemented production casing.
Since 1984, when the DMRM established a ground water investigation program, this is the first documented incident where natural gas invaded ground water aquifers as a result of a deficient primary cement job on the production casing. During this same period of time, over 22,000 “Clinton” wells, and nearly 30,000 oil and gas wells have been completed in Ohio. Ground Water Impacts
Ground water is the primary source of drinking water for 98 percent of the population of Geauga County. Approximately 78 percent of the population relies on ground water from domestic wells. In Bainbridge Township, water wells are developed in four aquifers, listed in
REPORT ON THE BAINBRIDGE INVESTIGATIONPAGE 5

descending stratigraphic order: 1) glacial sand and gravel deposits 2) sandstones of the Pennsylvanian Pottsville Group, 3) shales and interbedded sandstones of the Mississippian Cuyahoga Formation, and 4) the underlying Mississippian Berea Sandstone.
The deepest water wells in the investigation area are developed in the Berea Sandstone –
Bedford Shale sequence that is underlain by the Devonian Ohio Shale. The Ohio Shale is a known natural gas reservoir that is over 1800 feet thick in the vicinity of the investigation area. The occurrence of natural gas in ground water for wells developed in the Berea-Bedford sequence is common in Geauga County.
The DMRM compiled historic records representing “background” ground water quality
in Geauga County to compare with water quality data for samples collected after the December 15 incident. Based upon a review of this data the DMRM determined that ground waters in the glacial, Cuyahoga Group and Berea Sandstone aquifers are commonly reducing. Ground water in Geauga County is typically hard and iron and manganese concentrations exceed Secondary Maximum Contaminant Levels (MCLs) in over half of all wells sampled. Secondary MCLs are based on aesthetic considerations such as taste or odor, and are not related to health. Ground water in Geauga County does not typically exceed Primary Maximum Contaminant Levels (MCLs) for VOCs, or secondary MCLs for chloride or Total Dissolved Solids except when anthropogenically affected. Primary MCLs are health based standards for public drinking water supplies. It is common for deep-water wells developed in the Berea- Bedford interval to emit natural gas.
Beginning in mid February 2008, the DMRM coordinated a major sampling initiative,
collecting samples at 79 water wells in the investigation area. To evaluate the suitability of ground water for domestic purposes the DMRM compared water quality data to OEPA standards for public drinking water supplies. Ohio EPA has established both Primary and Secondary Maximum Contaminant Levels (MCLs) for public drinking water supplies. Primary MCLs are health-based limits and reflect the highest concentration that is allowable for a selected parameter in raw (untreated) water for a public water supply. Secondary MCL standards address aesthetic considerations such as taste, color and odor, rather than hazards to human health.
Ground water is considered “contaminated” when measured concentrations of induced
chemical parameters of interest exceed “background” levels or ranges. Ground water is considered “polluted” when measured concentrations of induced chemical parameters of interest exceed “background” levels or ranges, and exceed maximum concentrations prescribed by regulation.
Based upon a review of the water quality data and other observations, the DMRM has
determined that 22 domestic and one public water supply were contaminated by the natural gas charging event caused by the English No.1 Well. The DMRM has also determined that the data indicates that ground water has not been contaminated or polluted by brine, crude oil, or hydro-fracture fluids, which are commonly associated with the oil and gas drilling and well completion process. Furthermore, the data does not indicate that natural gas invasion of local aquifers alterated inorganic water quality, or caused pollution salts or metals.
REPORT ON THE BAINBRIDGE INVESTIGATIONPAGE 6

There was only one exceedance of an OEPA PMCL. This exceedance was not related to
oilfield operations. Iron and manganese concentrations exceeded OEPA SMCL for approximately 55 percent of the 79 wells sampled. However, this is not unusual for clastic aquifers in Geauga County and could not be correlated with natural gas presence or concentration. New Permit Conditions
On January 18, 2008, the DMRM announced implementation of new permit conditions through broad areas of northeastern Ohio. The new conditions were designed to address the full-range of conditions that can create over-pressurized conditions in the surface-production casing annulus. On January 29, 2008, the DMRM attended meetings sponsored by the Ohio Oil and Gas Association to explain the new permit conditions to northeast Ohio oil and gas producers. On February 6, 2008, the DMRM notified all permittees (33) in a seven-county area of northeastern Ohio, that the new conditions were being applied retroactively.
REPORT ON THE BAINBRIDGE INVESTIGATIONPAGE 7

INCIDENT RESPONSE SUMMARY
On Saturday, December 15, 2007, at 7:30 AM, the Geauga County Emergency Management Agency notified an Ohio Department of Natural Resources, Division of Mineral Resources Management (DMRM) inspector that there was an explosion at a house on 17975 English Drive in Bainbridge Township of Geauga County. Geauga County is in northeastern Ohio, southeast of Cleveland (Figure 1). Figure 2 shows the location of the property with the natural gas explosion. Two residents in the house at the time of the explosion were not injured, but the house was significantly damaged. The DMRM Columbus office was notified at 9:45 AM on December 15 regarding the explosion at a house in Bainbridge Township. By 11:00 AM on December 15, three DMRM inspectors were on location in Bainbridge Township. A fourth Mineral Resource inspector provided remote support, relaying water well record information to on-site personnel through a web-search of the ODNR Division of Water database.
When the DMRM inspectors arrived on location, three-man teams consisting of
Bainbridge Township Fire Department and Dominion East Ohio personnel were canvassing the neighborhoods to identify houses and water wells with detectable natural gas to ensure prompt evacuation of potentially at-risk residents. Early in the investigation, responders recognized that natural gas was entering homes via water wells. There were a number of possible avenues for natural gas to enter residences via ground water, including 1) unvented water wells located in basements, 2) abandoned and unplugged water wells in basements, and 3) wells with indoor well pumps. The in-home water wells and abandoned wells were immediately identified as high risk. During the first day of the incident response, the location of gas measurement sites, and the natural gas concentration measurements were not recorded or were poorly documented. Therefore, it is not clear which residents were evacuated for potentially dangerous levels of methane within homes, versus residents evacuated due to detection of natural gas in outdoor water wells. However, the Bainbridge Fire Department responded decisively and ordered some of the displaced residents to evacuate. Other residents understandably elected to leave when their water or utilities were shut off. By the evening of December 15, 2007, 19 homes had been evacuated. Utilities were disconnected for safety reasons. Ohio Valley Energy Systems Corp. (OVESC) assumed responsibility to coordinate lodging and meal arrangements for all displaced residents. Figure 3 shows the location of the explosion and evacuated residences.
DMRM inspectors evaluated local oil and gas wells to identify potential source(s) of the
problem. The DMRM began evaluation of all oil and gas wells within one mile of the Bainbridge Fire Department public water supply well, the first water well where the increase in natural gas concentrations was noticed. Based upon preliminary information regarding the extent of the natural gas incident, DMRM inspectors were instructed to focus attention on surface-production casing annular pressures at all oil and gas wells within the investigation area.
When DMRM inspectors arrived on location at the English No.1 Well, representatives of
Ohio Valley Energy Systems Corporation (OVESC) and their consultant were already on location evaluating the well and discussing corrective action plans. OVESC management elected to take a pre-emptive approach and assume responsibility rather than waiting for completion of the DMRM investigation.
REPORT ON THE BAINBRIDGE INVESTIGATIONPAGE 8

When DMRM inspectors arrived on location, OVESC was venting gas from the English
No.1 Well surface-production casing annulus and preparing to conduct a cement “squeeze job” to seal natural gas in uncemented formations in the well-production casing annulus. The first squeeze job was completed on December 15, 2007. DMRM inspectors witnessed and documented the cement squeeze job.
By the end of day one, the Bainbridge Fire Department had evacuated potentially at-risk
residents, the DMRM had identified the likely cause of the problem, and OVESC had initiated corrective action. OVESC elected to complete a second squeeze job on December 17, 2007.
The DMRM continued to evaluate other oil and gas wells and other potential sources of gas to ensure that all sources were identified. DMRM geologists were directed to compile area well records and begin assessment of other plausible explanations for the incident including:
1. Presence of unplugged orphan wells; 2. Improperly plugged oil and gas wells; 3. Seismic event releasing natural gas from the Ohio Shale into the overlying aquifers; 4. Annular over-pressurization at other oil and gas wells; and 5. Natural occurrence.
DMRM inspectors continued to monitor affected water wells and inspect area oil and gas
wells. The DMRM required the Peninsula Group to plumb the open annulus of the Davis No.1Well to their production tank as a preventive measure in case pressure communication with the nearby English No.1 Well caused flow of annular fluids to surface. While the annulus of the Davis No.1 Well did not flow, this proactive step effectively addressed any risk of brine or crude oil entering a tributary of the Chagrin River.
During the first week following the explosion, DMRM initiated a monitoring program to
1) identify water wells with detectable natural gas, 2) define the area where water samples would be collected, 3) monitor in-house gas concentrations for protection of public health and safety, and 4) measure the response of water wells to the corrective action at the English No.1 Well. OVESC contractors disconnected water wells, purged gas from domestic plumbing/heater systems, installed vents on water wells, plumbed houses to temporary water supplies, installed in-house methane monitoring systems and began to provide bottled drinking water to residents upon request.
A total of 26 domestic water wells were disconnected between December 17 and 22, 2007 (Figure 4). OVESC installed 1500-gallon storage tanks as temporary water supplies at all homes where water wells had been disconnected. As of July 2008, 14 residents remain on temporary water storage systems provided by OVESC. OVESC installed vent systems on six water wells and sealed two unused in-home wells. OVESC began to deliver bottled water to affected residents, whose water had been shut off, on Saturday, December 15, 2007, the day the explosion was reported. As evacuated residents returned to their homes, OVESC provided bottled water to all residents who were now on temporary storage tank water systems. Over
REPORT ON THE BAINBRIDGE INVESTIGATIONPAGE 9

time, OVESC began to provide bottled water for concerned residents who continued to use their wells for domestic purposes, but were concerned with the safety of their well water. Figure 5 shows the location of the 48 residents that received bottled water during some phase of the investigation.
Beginning on December 19, 2007 OVESC began to provide in-home gas detectors for
area residents who had been evacuated by the Bainbridge Township Fire Department. They also provided gas detectors to area residents upon request. Gas detection systems were provided to a total of 49 residents (Figure 6). These units are set to provide audible alarms if concentrations of gas exceed ten percent of the Lower Explosive Limit (LEL).
By Wednesday, December 19, 2007, only one home continued to test positive for the presence of non-explosive concentrations of natural gas (17938 English Drive). The Bainbridge Fire Department authorized re-occupation of all evacuated homes. Utility services were restored. Six families elected to remain out of their homes until Saturday, December 22, 2007. By December 24, 2007 (Day 9) all residents had been returned to their homes, except for the family whose house was damaged by the explosion.
Early in the investigation, the DMRM identified three water wells near the Scotland-English Drive intersection, that when pumped, emitted significant volumes of gas (Figure 7). DMRM geologists determined that pumping these wells could be useful to reduce the volume of gas in the aquifers and minimize gas migration with the permission of these home owners, these water wells were pumped periodically and ground water was discharged to surface.
The DMRM identified the holder of all active (undrilled) oil and gas well permits in Bainbridge Township and requested a voluntary delay in drilling activity until risk factors and causation had been established and protective permit conditions were finalized. The permittee agreed to temporarily suspend plans to drill.
On January 18, 2008, the DMRM announced implementation of new permit conditions through broad areas of northeastern Ohio. The new conditions were designed to address the full-range of conditions that can create over-pressurized conditions in the surface-production casing annulus. On January 29, 2008, the DMRM attended OOGA sponsored meetings to explain the new permit conditions to northeast Ohio oil and gas producers.
On January 29, 2008, the DMRM released a letter to local residents in the investigation area and the Bainbridge Township Trustees. The letter announced that:
1. DMRM had completed its preliminary investigation; 2. The English No.1 Well had been identified as the likely source of natural gas in the local
aquifers; 3. Alternative explanations had been evaluated and dismissed; 4. DMRM believed that the source of natural gas had been identified and eliminated, but
would continue to evaluate area oil and gas wells;
REPORT ON THE BAINBRIDGE INVESTIGATIONPAGE 10

5. DMRM was implementing new permit conditions that were designed to prevent similar events from occurring in Bainbridge Township, as well as broadly defined areas of northeastern Ohio.
The DMRM further committed to the following:
1. Continue monitoring for the presence of natural gas in local water wells and homes, until confident that the gas had effectively dissipated and no longer posed a threat to public health and safety.
2. Implement a comprehensive water quality-testing program to thoroughly evaluate whether there were indications of affectment by natural gas and/or contamination by oilfield brine, crude oil, and/or fluids used in the hydro-fracture operation at the English No.1 Well.
3. Continue to evaluate the effectiveness of remedial cementing to seal and isolate deep, high-pressure gas bearing zones in the annulus of the English well.
4. Complete a full report regarding the incident when all water quality monitoring and testing was finished.
5. Work with OVESC until all affected residents had been safely reconnected to properly disinfected domestic water supplies.
6. Refer reported health issues to the Ohio Department of Health for evaluation.
The DMRM cautioned that it could not predict how long it would take for gas to dissipate, and to complete monitoring of local domestic water wells. The DMRM has completed its investigation, consistent with the commitments listed above. The attached report reflects the final findings, conclusions, and recommendations of the DMRM.
REPORT ON THE BAINBRIDGE INVESTIGATIONPAGE 11

INVESTIGATION METHODS Emergency Response
On the morning of December 15, 2007, in response to an explosion inside a house at 17975 English Drive, representatives from Dominion East Ohio and the Bainbridge Township Fire Department formed teams to canvass the neighborhood. The teams used portable gas detection equipment to measure gas concentrations inside homes and/or at water wells, and where gas was detected, advised residents to evacuate their homes. The teams quickly assessed the possibility of additional explosions on English Drive, Scotland Drive, Kenston Lake Drive, Kingswood Drive, and segments of Bainbridge Road. Certain homes had natural gas and electric services disconnected in an attempt to eliminate ignition sources. This initial emergency survey was completed very quickly in order to protect residents. At this time, the source of the explosive gas was unknown. Time was critical and as a result, neither the specific location nor concentration of natural gas measurement were consistently documented.
By late morning, the likely source of the natural gas was identified and measures were initiated to terminate the continued flow of gas from the surface-production casing annulus of the English No.1 Well. In the days immediately following this incident, the Bainbridge Fire Department continued to monitor homes and respond to calls. Oil and Gas Well Inspections
DMRM inspectors queried the oil and gas well database (RBDMS) to identify oil and gas wells in the immediate area (Figure 8). DMRM inspectors focused on five wells that were located within a one-mile radius of the explosion, as summarized in the following table. Figure 7 shows the location of the oil and gas wells within one-mile of the property at 17975 English Drive. Table 1 summarizes ownership, identification and completion date of the five wells.
Table 1: Oil and Gas Wells within a One-Mile Radius of the Explosion Owner Lease Name Permit No. Completion Date
Range Resources, Inc. Campane 1 480 December 1984 Range Resources, Inc. Mayer-Campane 482 January 1985 Summit Petroleum, Inc. Weber 1 1811 September 2005 Transcontinental Szumilak 1 1946 October 2007 Ohio Valley Energy English 1 1983 November 2007
On December 15, 2007, DMRM inspectors contacted and met with oil and gas well owner representatives, including Transcontinental Oil and Gas, Inc., Range Resources, Inc. and Summit Petroleum. Representatives of OVESC were already on location at the recently drilled English No.1 Well when DMRM inspectors arrived. The English No.1 Well had not been placed in production. When DMRM inspectors arrived on location, the surface-production casing annulus was open and venting gas. DMRM inspectors and owner representatives of the other four producing oil and gas wells examined the wellhead conditions to determine whether the valves on the surface – production casing annuli of these oil and gas wells were open or closed, and whether gas was venting from the annuli in significant volumes or apparent pressures. inspectors reviewed well construction records, as well as compliance and production histories.
REPORT ON THE BAINBRIDGE INVESTIGATIONPAGE 12

Surface-Production Casing Annular Pressure Measurements– Fluid Level Measurement The DMRM reviewed well construction, completion, production and compliance records
for each oil and gas well within the one-mile radius looking for possible problems that have the potential to cause high-pressure natural gas leaks. High-pressure gas leaks may occur at the wellhead or in very rare instances, natural gas can escape through cemented production casing and enter into the annular space between the surface and production casing strings. If the annulus is confined (annular valve is closed and there is no pressure relief valve), and the gas pressure in the annulus exceeds the hydrostatic pressure outside the cemented surface casing, and there are permeable pathways at the surface casing-shoe, gas can migrate, into overlying aquifers. This process is known as annular over-pressurization (Harrison, S., 1983).
The DMRM continued to evaluate all five oil and gas wells within the one-mile radius as possible contributing sources of gas. Several test methods were used to evaluate each well. Beginning on January 25, 2008, for approximately one week, the DMRM required each owner to shut in the surface- production casing annulus. All five oil and gas wells were fitted with pressure gauges to measure annular pressures. Properly functioning pressure relief valves were installed to prevent build up of excessive pressure during the brief monitoring period. Pressure relief valves are designed to release gas when pressures reach specified relief points. In this monitoring event, pressure relief valves were set at approximately 25 psi. A 50 psi pressure relief valve was installed on the English No.1 Well. It is common in northeastern Ohio for small volumes of low-pressure shale gas to accumulate in the un-cemented surface-production casing annulus. Shale gas pressure is typically less than 60 psi. The DMRM was seeking to determine if gas migrating through the channelized cement in the surface-production casing annulus of the English No.1 Well after completion of remedial cementing operations on December 15 and 17, 2007, had pressures indicative of leakage from deep high pressure formations, or pressures indicative of shale gas. A DMRM inspector monitored pressure readings.
As part of the evaluation of fluid pressures in the surface-production casing annuli, the DMRM also attempted to measure the annular fluid levels at Transcontinental Oil and Gas, Inc’s. oil and gas well (Permit 2-1946) using an Echo-meter . The echo-meter is a precision instrument used for determining the depth of the fluid level in the oil and gas well surface casing/production casing annulus. The principal of echo-meter operation involves the generation of a pressure pulse from the wellhead attachment that is connected to the surface casing/production casing annulus valve. When the pressure is released from the echo-meter, a pulse travels down the annulus of the oil and gas well and is reflected back by collars on the production casing, fluids, and other obstructions.
A microphone in the echo-meter wellhead attachment converts the pressure pulses into electric pulses, which are amplified, filtered, and recorded on a strip of chart paper (Echo-meter Company, 1985). The chart paper then shows the number of casing collars to the liquid level and the depth is determined by multiplying the number of casing collars by their average length. English Well Construction/Completion Records Review
In order to develop a more complete understanding of the English No.1 Well, the DMRM requested and reviewed records regarding well construction and completion of the English No.1 Well. These included: the geolograph, daily drilling reports, invoices, job logs, employee field
REPORT ON THE BAINBRIDGE INVESTIGATIONPAGE 13

notes, and bond and temperature logs. Owner/operators are not required to submit these records by Ohio Oil and Gas Law. In addition DMRM staff interviewed oil and gas industry personnel who were on location during various phases of drilling and well completion operations. Natural Gas Monitoring
DMRM field staff members are equipped with intrinsically safe explosive gas monitors. DMRM inspectors are trained to use the portable gas meters in accordance with manufacturer instructions. Each gas monitor is calibrated for methane, the most common chemical constituent of natural gas. Field calibrations and checks are completed each time the instrument is activated. Methane concentrations were measured by the DMRM using a Biosystems PhD lite Multi Gas Detector. Ohio Valley Energy Systems Corporation and the Bainbridge Fire Department used a Sensit Gold meter. All meters were calibrated per manufacturers’ recommendations and standards. The meters used by DMRM have sensors installed to measure oxygen and H2S concentrations, as well as the percent LEL. The lowest reading that the PhD lite will register is an LEL of 1 percent or 500 ppm.
The monitoring program was established and has been maintained for the primary purposes of: 1) ensuring public safety while gases continue to exsolve from the ground water aquifers, 2) delineating the area where ground water samples would be collected for laboratory analysis, and 3) monitoring the effects of the remedial cementing of the English No.1 Well. Gas readings are measured as a percent of the lower explosive limit (LEL). The LEL is the lowest concentration of gas in air that can result in an explosion if an ignition source is present. The LEL for methane is 5% by volume, or 50,000 parts per million (ppm). When this concentration is reached, gas-monitoring equipment will display a 100% LEL value. Table 2 compares LEL percentages to percent by volume and parts per million in the atmosphere.
Table 2: Example of Methane Gas Readings: % LEL % Volume ppm (part per million)
100 5 50,000 50 2.5 25,000 20 1 10,000 10 .5 5,000 1 .05 500
On December 29, 2007, DMRM, OVESC, and the Bainbridge Fire Department began a
coordinated monitoring program. Gas was monitored at either the water well casing or a combination of the hot and cold water taps and the living space of each home in the investigation area. On February 24, 2008, the monitoring plan was expanded to 84 homes (Figure 9). The 84 homes included homes with known gas readings and a buffer area that included at least 3 homes beyond the last home with a water supply where natural gas had been detected. Over the ensuing weeks, the monitoring schedule was modified, eliminating homes with consistent zero methane readings. The monitoring frequency was also reduced for certain homes at home-owner request.
REPORT ON THE BAINBRIDGE INVESTIGATIONPAGE 14

Monitoring Locations When DMRM representatives visit a home, they typically pump the well to reduce hydrostatic pressure and monitor methane concentrations as the well is pumped. When a well is pumped and the height of the column of water declines, water pressure is reduced, and natural gas that was not apparent before, may be released. The DMRM approach was intended to increase the likelihood of obtaining a positive detection. After pumping the well, the DMRM collects LEL readings at the following potential gas emission locations when they are made available by the landowner:
1. Water Well Head: The LEL meter tip is inserted into the well casing or vent to record the highest reading. This measurement was taken to identify the presence of natural gas in a water well and to identify the area where indoor monitoring and sampling should occur. These readings are essentially a screening tool and are not intended to indicate the risk of an indoor explosion.
2. Cold Water Tap: At the kitchen sink, the cold water tap is opened after closing the drain and the LEL meter tip is placed next to the faucet to obtain a reading. The tip is then moved inside the sink (without touching the water) to obtain and record the highest reading. Running tap water is intended to allow dissolved gas to exsolve (come out of solution as gas bubbles). By placing the tip of the gas detector at the surface of the water next to the running water, the potential to detect natural gas is maximized. This is essentially a screening process to determine whether gas should be monitored in the room.
3. Hot Water Tap: The LEL meter tip is placed next to the faucet at the hot water tap after closing the drain to obtain a reading. The tip is then moved inside the sink (without touching the water) to obtain and record the highest reading.
4. Inside the Home: The LEL meter is operating before entering the home. Air is monitored during the sampling of other locations. Any positive readings in the air of the home are recorded. For the purpose of protecting public safety, the most important step in the monitoring process was measuring gas concentrations within the rooms where gas could be exsolving. During each home visit, the DMRM measured gas concentrations within the rooms as a percent of the LEL.
Response to Natural Gas in a Home The DMRM recommended the following actions in response to LEL measurements within a home (Table 3). These action levels do not apply to measurements at the wellhead or measurements at the water tap.
REPORT ON THE BAINBRIDGE INVESTIGATIONPAGE 15
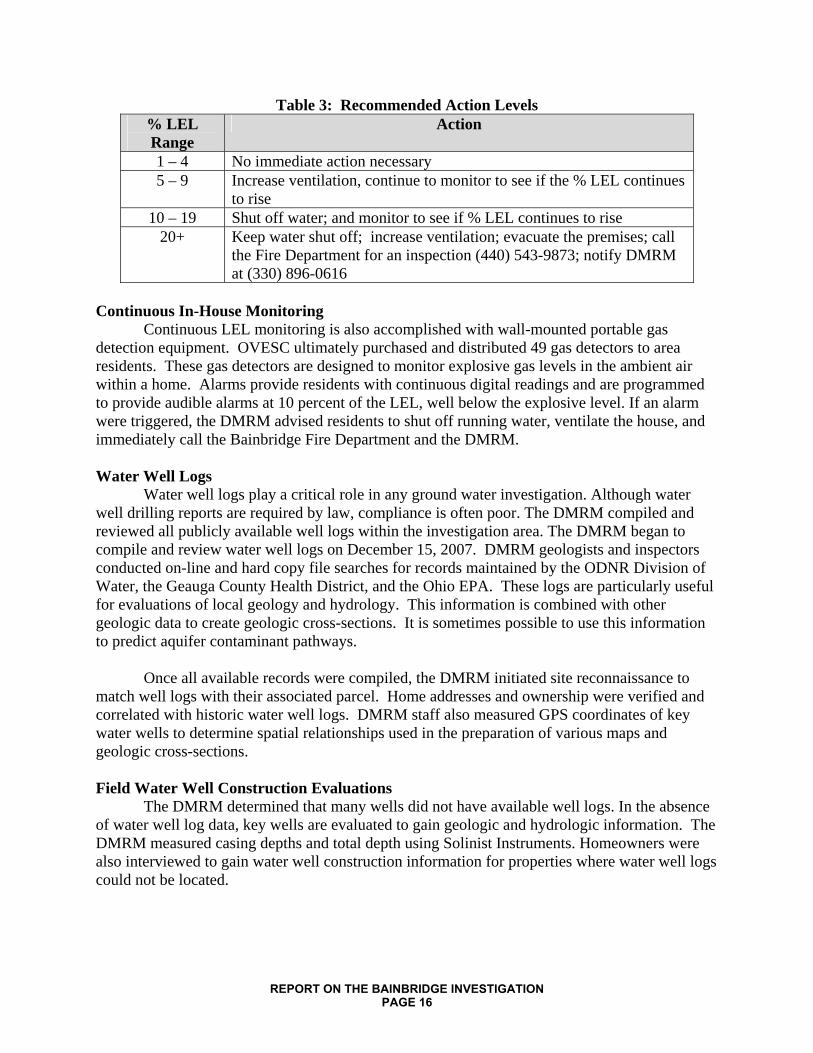
Table 3: Recommended Action Levels % LEL Range
Action
1 – 4 No immediate action necessary 5 – 9 Increase ventilation, continue to monitor to see if the % LEL continues
to rise 10 – 19 Shut off water; and monitor to see if % LEL continues to rise
20+ Keep water shut off; increase ventilation; evacuate the premises; call the Fire Department for an inspection (440) 543-9873; notify DMRM at (330) 896-0616
Continuous In-House Monitoring
Continuous LEL monitoring is also accomplished with wall-mounted portable gas detection equipment. OVESC ultimately purchased and distributed 49 gas detectors to area residents. These gas detectors are designed to monitor explosive gas levels in the ambient air within a home. Alarms provide residents with continuous digital readings and are programmed to provide audible alarms at 10 percent of the LEL, well below the explosive level. If an alarm were triggered, the DMRM advised residents to shut off running water, ventilate the house, and immediately call the Bainbridge Fire Department and the DMRM. Water Well Logs
Water well logs play a critical role in any ground water investigation. Although water well drilling reports are required by law, compliance is often poor. The DMRM compiled and reviewed all publicly available well logs within the investigation area. The DMRM began to compile and review water well logs on December 15, 2007. DMRM geologists and inspectors conducted on-line and hard copy file searches for records maintained by the ODNR Division of Water, the Geauga County Health District, and the Ohio EPA. These logs are particularly useful for evaluations of local geology and hydrology. This information is combined with other geologic data to create geologic cross-sections. It is sometimes possible to use this information to predict aquifer contaminant pathways.
Once all available records were compiled, the DMRM initiated site reconnaissance to match well logs with their associated parcel. Home addresses and ownership were verified and correlated with historic water well logs. DMRM staff also measured GPS coordinates of key water wells to determine spatial relationships used in the preparation of various maps and geologic cross-sections. Field Water Well Construction Evaluations
The DMRM determined that many wells did not have available well logs. In the absence of water well log data, key wells are evaluated to gain geologic and hydrologic information. The DMRM measured casing depths and total depth using Solinist Instruments. Homeowners were also interviewed to gain water well construction information for properties where water well logs could not be located.
REPORT ON THE BAINBRIDGE INVESTIGATIONPAGE 16

Water Level Measurements Water level measurements were collected and used in conjunction with water level data
reported on well logs. These measurements are used to estimate hydraulic head to evaluate localized ground water flow directions. This information may also be used to estimate ground water contaminate flow directions. The data may also be used to correlate water well construction information with aquifer production zones. Down-Hole Video Camera Surveys
The DMRM used a Marks Products Inc. Geovision Jr. M3 Color Downhole Video Camera at selected water wells. This downhole video camera is approximately two inches in diameter and is capable of being lowered into a well to a depth of 650 feet. The camera can be lowered into most water wells that are constructed using standard five-inch or greater well casings. This camera gives the DMRM the ability to observe down-hole wellbore and submersible pump conditions, geologic features, water flow, post pumping recharge and depths of natural gas entry into the wellbore. Water Well Sampling-Reconnaissance
Water well sampling is routinely accomplished in several phases. The first phase is a reconnaissance round. DMRM staff use selected chemical parameters as possible indicators of inorganic oilfield waste contamination. Brine, which is predominantly sodium chloride, is the most common oilfield waste.
The DMRM collected a limited number of water samples from area water wells as a
means to define an impact area. This limited sampling began on December 17, 2007. Sampling was expanded to include 11 homes between January 22 and 26, 2008. The DMRM selected water wells that were developed in different aquifers (Figure 10). Water Well Sampling-Comprehensive
A large-scale sampling event was scheduled and included an expanded parameter list. Seventy-nine water supplies were sampled between February 19 and March 25, 2008 (figure 11). The DMRM designed a comprehensive sampling and analysis plan to evaluate possible water chemistry changes related to the natural gas charging event. The sampling and analysis plan was designed to evaluate the presence and concentration of the following:
1. Dissolved natural gas constituents (methane, ethane, N-butane, and isobutane) 2. Volatile organic compounds (VOCs) 3. Inorganic parameters 4. Hydro-fracture fluid additives. 5. Physical parameters
Volatile organic compounds are water-soluble compounds that may be naturally
occurring or man-made. Crude oil is a complex blend of hydrocarbons. The lightest, most water-soluble, and most mobile hydrocarbon components of crude oil are VOCs. While the DMRM had not seen any evidence suggesting that crude oil had entered ground water in the investigation area, a small volume of crude oil circulated to surface during the hydro-fracture operation at the English No.1 Well.
REPORT ON THE BAINBRIDGE INVESTIGATIONPAGE 17

Furthermore, the black organic shales of the Ohio Shale Formation that underlie the Berea Sandstone aquifer are kerogen-rich and can contain crude oil. The DMRM tested ground water for VOCs to determine if natural gas migrating through fractures in the shale could have “transported” crude oil upward into the overlying aquifers.
The DMRM selected a set of inorganic parameters that would be useful in evaluating the presence of brine. The DMRM was interested in evaluating whether natural gas migrating through fractures in the Ohio Shale Formation could “transport” brackish, connate waters into the overlying aquifers resulting in increased salinity and hardness. The DMRM also selected inorganic parameters to evaluate whether natural gas migrating through the aquifer had altered ground water chemistry.
The DMRM also had ground-water samples analyzed for select components of the hydro-fracture fluid used at the English No.1 Well. Information from material safety data sheets (MSDS) was reviewed for drilling and hydro-fracture operations. Selected components include ethanol, ethylene glycol, and isopropyl alcohol. Pre-Site Meeting
On February 19, 2008, the DMRM Regional Supervisor met with teams that had gathered to initiate the primary water-sampling event. Representatives from DMRM, Biosolutions LLC (hired by OVESC), Hull and Associates (representing OVESC), Coshocton Environmental Laboratory (representing the law firm of Thraser, Dinsmore & Dolan), and the Geauga County General Health District were present. The DMRM lead a discussion regarding sampling methodologies, including pump times, collection methods, containers, and preservation. No objections were stated and all present agreed the methods, parameters, and practices being utilized were acceptable. Sample Collection
OVESC contracted Biosolutions LLC to coordinate and collect ground water samples for 79 sites selected by DMRM. Water samples were collected before any filtration or treatment systems in order to analyze samples that are representative of the aquifer or aquifers. At each site, saturated wellbore volumes were calculated, and water wells were pumped to purge at least three borehole volumes prior to collection of a sample. Biosolutions LLC collected six types of grab samples at each of the 79 sites. The sample types included: filtered and preserved, non-filtered preserved, non-filtered and non-preserved, VOCs, frac fluid components, and dissolved gases. The Geauga County Health District collected the total coliform bacteria sample after the other grab samples were collected to avoid cross contamination by either bleach or alcohol used to disinfect the sampling port.
Grab Samples Grab samples were collected sequentially and provided to Hull and Associates, BioSolutions, Inc., and DMRM. Coshocton Environmental Testing Laboratory personnel and Bill Wendell from the Geauga County Health District also participated in the sampling process. Sample Containers and Preservatives
Following established sampling protocol, VOCs and dissolved gas samples were collected in 40-ml glass vials with a PTFE-lined septum and an open top screw cap. Containers
REPORT ON THE BAINBRIDGE INVESTIGATIONPAGE 18

were filled in such a manner that no air bubbles were present in the sample. VOC samples were preserved with sorbic and hydrochloric acid.
Inorganic anion samples were collected in one-liter cubitainers that were neither filtered nor preserved. Metal samples were collected in 250 ml. containers. One sample was non-filtered and preserved, the second was filtered using a 0.45-micron filter apparatus and a syringe, and preserved. Samples were preserved with nitric acid and placed on ice from the time of collection until receipt by the laboratory. Sample Documentation
Sample collection, storage, and analysis descriptions were documented on the chain-of-custody forms. The original forms were sent to the laboratory with the samples and copies of the forms were kept by staff. A laboratory logbook is used to record all comments and observations associated with each water sample. Laboratory Analysis
BioSolutions Inc. coordinated delivery of samples to the appropriate laboratory based on parameter group (Table 4). Samples were handled, stored, and shipped in accordance with applicable EPA guidelines. The following table lists the testing laboratories by parameter group. All laboratories are EPA certified for tested parameters. (There is no EPA certification for the dissolved gases.)
Table 4: Testing Laboratory by Parameter Group
Parameter Group
Testing Laboratory
Dissolved Gases CWM, PA VOCs Brookside, New Knoxville, OH Metals Biosolutions, Chagrin Falls, OH Inorganic Anion Biosolutions, Chagrin Falls, OH Frac Components Test America, Dayton, OH
Water samples were analyzed for VOCs (EPA method 524.2), metals (EPA methods
200.7 and/or Standard Methods SM312OB, SM3111B, SM3111D), inorganic anions (EPA methods 150.1, 300.0, and/or SM3111B, SM2320B, SM2450C, SM2340B, SM4110B, and SM4500-C1-D), frac fluids (SW8105M) and for the dissolved gases methane, ethane, N-Butane, and Isobutane (ATSM Method D1945 R&D).
Water Quality Reports
The DMRM received the final analytical reports for the major sampling event in late April 2008. As analytical results were received, the DMRM reviewed the reports for completeness and accuracy. The results were compiled, tabulated, categorized, and compared to the Primary Maximum Contaminant Levels (PMCLs) Standards and the Secondary Maximum Contaminant Levels (SMCLs) established by the USEPA Safe Drinking Water Act (SDWA). The majority of the chemical letters were prepared and sent to homeowners by May 2, 2008. Some chemical letters were sent after additional sampling was performed. The remaining were
REPORT ON THE BAINBRIDGE INVESTIGATIONPAGE 19

sent to the homeowners by June 6, 2008. The letters provided the homeowners with a summary of the test results including the parameters that exceeded the PMCL and/or the SMCL Standards. Background Water Quality Assessment
In order to evaluate the possible changes in ground water quality in the Bainbridge Township investigation area, the DMRM conducted a literature search and reviewed Ohio EPA’s ambient water quality data files for the public water supply wells in Geauga County. The DMRM used background data to establish baselines and ranges in the quality of ground water prior to the December 2007 incident. The DMRM field staff interviewed citizens within the investigation area regarding observed changes in water quality since December 2007, and their experience with their domestic water supplies prior to December 2007. During the February-March sampling event, the DMRM selected six control sites to compare water quality results outside of the investigation area with ground water samples collected from wells within the DMRM defined investigation area. Control points are selected because they lie outside of the impact area and/or have data that precedes oil and gas well development.
REPORT ON THE BAINBRIDGE INVESTIGATIONPAGE 20

REGIONAL GEOLOGIC SETTING AND OIL AND GAS EXPLORATION
Geauga County lies on the western edge of the Appalachian Basin in northeastern Ohio. Sedimentary rocks in eastern Ohio dip and thicken in an east-southeasterly direction toward the axis of the basin. The Appalachian basin contains significant oil and gas resources that have been explored and developed in a nine state area beginning over 150 years ago.
The sedimentary rocks in eastern Ohio are relatively un-deformed, and there are few significant faults or structural features superimposed on the strata as it dips into the basin. There is occasional seismic activity in the Geauga County area. Based upon a gravity survey, Baranowski (2002) infers the presence of a fault in Pre-Cambrian metamorphic and igneous rocks that trends north northeastward through western Geauga County. Based upon a structural contour map of the top of the Onondaga Limestone, there appears to be a local structural anomaly in Bainbridge Township indicating local folding or faulting. Geologic interpretation of open-hole wire line logs from an offset oil and gas well (Permit 2-1946) also indicates fracturing in deeper formations including the Onondaga Limestone, Lockport Dolomite and “Packer Shell.” Down-hole video camera pictures taken by the Division of Mineral Resources Management (DMRM) in nearby water wells show natural fracturing immediately above the Berea Sandstone in the Cuyahoga Formation
The primary oil and gas-bearing reservoir in eastern Ohio is the Silurian “Clinton” sandstone. The “Clinton” is a driller’s term for a sequence of inter-bedded sandstones, siltstones, and shales that range from 60 to 200 feet thick in eastern Ohio. Over 79,000 wells have been drilled to the “Clinton sandstone” in eastern Ohio since 1897.
In Geauga County, the “Clinton” sandstone is the primary commercial oil and gas-producing reservoir. Since 1981, 132 permits have been issued to drill Clinton gas wells in Bainbridge Township. Of these, 82 are producing, 25 were drilled, produced and have been plugged, and 22 were permitted but not drilled. Those permits have expired. The English No.1 Well has been drilled and is currently shut-in. The “Clinton” is generally 3600 to 3900 feet below surface in Bainbridge Township.
When drilling to the “Clinton” sandstone in Bainbridge Township, contractors first drill through unconsolidated glacial deposits that generally range from 10 to over 60 feet thick. Figure 12 is a general schematic showing typical construction of a “Clinton” well in northwestern Ohio. In areas where glacial deposits exceed 20 feet in thickness, operators typically install 10-3/4 inch diameter conductor pipe through the deposits in order to prevent collapse of unconsolidated sediments during the remainder of the drilling operation. Contractors then drill through a sequence of Pennsylvanian and Mississippian aged sandstones and shales, including in descending order the Sharon Conglomerate, Cuyahoga Formation, and the Berea Sandstone that provide fresh groundwater resources. The Berea Sandstone is the deepest underground source of potable water in the area. Water wells provide drinking water to homes and businesses either from individual private or public water wells, or local community water well fields.
REPORT ON THE BAINBRIDGE INVESTIGATIONPAGE 21

Water well drillers and well owners have noted occasional shows of low-pressure naturally occurring natural gas in some of the Berea Sandstone water wells in Geauga County before December 2007.
The likely source of this nuisance gas is the Ohio Shale that underlies the Berea. Operators are required to set 8-5/8 inch surface casing at least 50 feet through the base of the Berea Sandstone and cement the casing to surface to seal and protect the freshwater aquifers prior to drilling deeper.
Below the Berea Sandstone, operators drill through the Devonian age Ohio Shale Formation. The Ohio Shale is a natural gas reservoir that is over 1800 feet thick in Bainbridge Township. According to Gray (1982), The Devonian shale in northeastern Ohio has been drilled for natural gas since the late 1800’s on a noncommercial (domestic) basis. Published reports by the U.S.D.O.E. and the ODNR Division of Geological Survey indicate that geologic conditions in southwestern Geauga County (Bainbridge Township) are favorable for the accumulation of natural gas in the Ohio Shale. Gray (1982) lists southwestern Geauga County as an area favorable for gas production in the Cleveland Shale Member, the uppermost member of the Ohio Shale. Natural gas is most likely to occur where closely spaced natural fracture systems intersect within organic rich source beds (Janssens, 1976; Gray, 1982; Schwietering, 1979). While gas is not present in commercial quantities, it is commonly encountered and vented to atmosphere or flared during air rotary drilling operations in northeastern Ohio.
Below the Ohio Shale, is a sequence of Devonian and Silurian aged carbonate (limestone
and dolomite) and evaporate (salt and anhydrite) deposits, known to drillers as the “Big Lime”. The “Big Lime” is approximately 1600 feet thick in Bainbridge Township. Within the “Big Lime”, there are two zones that are generally porous and permeable brine-bearing zones, but locally can contain natural gas. When natural gas is encountered in these zones it is generally in sub-commercial quantities. These zones are the Devonian Oriskany Sandstone and the Silurian “Newburg” dolomite. Local faulting or folding can influence the occurrence of gas in these zones. Gas from the “Newburg” often has a distinctive odor and can be sour (hydrogen sulfide bearing).
Below the “Big Lime”, there is a relatively thin (approximately 100 feet thick) sequence
of shales and limestones that overlie the “Clinton”. This sequence includes the driller’s “Packer shell”, typically an impermeable limestone that constitutes part of “caprock”, or confining unit over the “Clinton” sandstone. Once contractors drill through the “Clinton” and assess the properties of the reservoir, 4-1/2 inch diameter production pipe is run in the borehole and cement is circulated from total depth to 600-800 feet above the “Clinton” in accordance with standard industry practice. The “Clinton” sandstone is a tight, low permeability formation that must be stimulated through hydro-fracture to be commercially productive.
REPORT ON THE BAINBRIDGE INVESTIGATIONPAGE 22

HYDRO-GEOLOGIC SETTING Geauga County is located in northeastern Ohio, and is within the Glaciated Appalachian Plateau Physiographic Province. Geauga County consists of gently to steeply rolling hills comprised of bedrock, generally covered by glacial deposits (Totten, 1988). Bainbridge Township is located in the southwest corner of Geauga County. Within Bainbridge Township, surface elevations range from 1260 feet above mean sea level (AMSL) along the ridge top east of McFarland’s Corner, to a low of approximately 930 feet AMSL in the southwestern portion of the Township in the valley of McFarland Creek. The investigation area is located south of Bainbridge Road and west of Chillicothe (State Route 306) Road. The investigation area includes some of the homes and water wells on Bainbridge, English, Kingswood, Kenston Lake, and Scotland Drives. The area is gently rolling with elevations ranging between 1000 and 1160 feet (Figure 13). The glacial deposits in Bainbridge Township consist of thin deposits of till that are generally less than thirty feet thick in the upland areas (Figure 14). While permeable sand and gravel deposits may occur within the glacial draft deposits, most water wells are developed in the underlying sandstones and shales. Glacial deposits thicken in the valleys. According to Totten (1988) there is a narrow sand and gravel kame deposit that extends southwestward from Kenston Lake. According to water well logs, the thickness of glacial deposits in the Kenston Lake valley may exceed 115 feet (Figure 15). The kame and valley-fill deposits include sufficient deposits of sand and gravel for development of domestic water supplies. One water well driller recorded sand and gravel deposits (Figure 16) as thick as 90 feet east of the intersection of Kingswood and Kenston Lake Drives. Water well logs indicate that glacial deposits thicken to the west along Scotland Drive and can be developed locally for domestic water supply. The bedrock in Bainbridge Township consists of sandstones and conglomerates of the Pennsylvanian age Pottsville Group, and shale with inter-bedded siltstones and sandstones of the Mississippian age Cuyahoga Group (Figure 15). In Bainbridge Township, water wells are developed in the Pottsville Group, the Cuyahoga Group, the underlying Berea Sandstone, as well as glacial sand and gravel deposits (Figure 16). Rocks in Geauga County dip towards the south and southeast generally at 10 to 20 feet per mile. The bedrock formations that provide potable ground water in Geauga County are described as follows:
The Pottsville Group (Pennsylvanian): The Pottsville Group consists of sandstone with local channels of conglomerate and some shale that caps hilltops throughout the County. According to Walker (1978), the principle aquifer within the Pottsville Group is the Sharon Conglomerate. Walker (1978) reports that wells can produce sustained yields of as much as 50 gallons per minute. The Pottsville Group has a maximum thickness of 200 feet and is extensively developed as a ground water aquifer in Geauga County. Within the investigation area the sandstones of the Pottsville Group underlie Bainbridge Road east of Kenston Lake Drive, and portions of Chilocothe Road. There are several shallow mines where sandstone has been extracted from the Pottsville exposures within the investigation area north of Scotland Drive and west of English Drive.
REPORT ON THE BAINBRIDGE INVESTIGATIONPAGE 23

In the early 1950’s, many water wells were developed in the Pottsville Group aquifer along Bainbridge Road, northern English Drive, Kenston Lake, and Kingswood Drive. As more homes were built, the high demand and usage of the Pottsville Group aquifer, forced local residents to have their water wells re-drilled to deeper aquifers. According to the regional potentiometric map (Jagucki, 2001), ground water flows to the southwest in the Pottsville Group (Sandstone) aquifer within the investigation area (Figure 17). This conclusion is supported by DMRM static water level measurements.
The Cuyahoga Formation- (Mississippian): The Cuyahoga Formation consists predominantly of shale with interbedded layers of siltstone and sandstone and is the uppermost bedrock unit through most of the investigation area (Figure 16). Within the investigation area, many domestic water wells have been developed in the Cuyahoga Formation. The maximum thickness of the Cuyahoga Formation within the investigation area was 183 feet. The Cuyahoga Formation aquifer is recharged by vertical flow from the overlying glacial and Pottsville Group aquifers. Based upon static water level measurements, ground water flows in a southern-southwesterly direction in the investigation area.
The Berea Sandstone (Mississippian): The Berea Sandstone is the lowermost formation in the Mississippian system. It consists of sandstone and it is the deepest aquifer in Geauga County. The Berea Sandstone has a maximum thickness of 80 feet in the investigation area. Within the investigation area, the depth to the top of the Berea Sandstone ranged from 130 to 270 feet below ground surface. According to Jagucki (2001) ground water flows in a west-southwestward direction in the Bainbridge Township area (Figure 18). There are sixteen water wells drilled in the Berea Sandstone in the investigation area. Four of the sixteen wells were drilled through the entire Berea Sandstone aquifer into the underlying Devonian shale. Most wells developed in the Berea Sandstone are not cased through the overlying Cuyahoga Group. The Devonian Shale: The Devonian aged Bedford Shale Formation underlies the Berea sandstone aquifer. Beneath the Bedford Shale, the Ohio Shale Formation consists predominantly of shale and is subdivided into a variety of members. The uppermost members are known as the Cleveland Shale. The total thickness of the Ohio Shale is approximately 1800 feet in Geauga County. The Ohio Shale is known to produce natural gas in areas of Geauga County including Bainbridge Township. While the Ohio Shale is not an aquifer in Bainbridge Township, water well drillers often drill through the Berea Sandstone into the underlying Devonian Shale to add storage capacity to domestic water wells.
REPORT ON THE BAINBRIDGE INVESTIGATIONPAGE 24

BACKGROUND GROUND-WATER QUALITY Introduction
Ground water is the primary source of drinking water for 98 percent of the population in Geauga County. Approximately 78 percent of the population relies on ground water from domestic wells, while approximately 20 percent of the population relies on publicly supplied ground water provided by utilities serving 25 or more people. Ground water is obtained from four aquifers, listed in descending stratigraphic order: 1) Glacial sand and gravel deposits of the Quaternary System, Pleistocene Series; 2) Pennsylvanian Pottsville Group; 3) Mississippian Cuyahoga Formation; and 4) the Mississippian Berea Sandstone. Within the investigation area, there are water wells developed in all four aquifers including many wells developed in multiple-aquifers.
The purpose of this section is to characterize the background hydro-chemistry of the
various aquifers in Bainbridge Township, Geauga County prior to recent oilfield activities, and in particular, prior to December 2007, for comparison purposes. There is very little ground-water quality data available for domestic water wells within the investigation area prior to the DMRM investigation. In order to evaluate the affect of the December 2007 natural gas charging incident, the DMRM compiled historic ground-water quality data from Geauga County and the Bainbridge Township area to compare with post-incident ground-water quality data. The DMRM conducted a literature search, compiled water quality data from Ohio EPA public water system files, compiled water quality data for water wells sampled as required by Urban Drilling regulations, and collected and analyzed ground-water samples from selected control sites that are located outside of the investigation area.
Ground water is considered “contaminated” when measured concentrations of induced
chemical parameters of interest exceed “background” levels or ranges. Ground water is considered “polluted” when measured concentrations of induced chemical parameters of interest exceed background levels, or ranges, but there are no specific maximum concentrations or action levels specified by regulation or enforceable guideline.
The primary source of information for this report is the USGS Water-Resources Investigations Report 01-4160, titled Ground-Water Quality in Geauga County, Ohio – Review of Previous Studies, Status in 1999, and Comparison of 1986 and 1999 Data, (Martha L. Jagucki and Robert A. Darner, 2001). The USGS collected and analyzed 31 samples from domestic and public water supply wells between June 7 and July 1, 1999, using standard field techniques. Three of the 31 water wells sampled by USGS are in Bainbridge Township and represent the Pottsville Group (GE-23), the Cuyahoga Group (GE-228) and the Berea Sandstone (GE-103). Figure 19 shows the location of sampled wells by aquifer in Geauga County.
All samples were analyzed for Volatile Organic Compounds (VOC), sulfide, dissolved organic carbon, major ions, trace elements, alkalinity, total coliform and Escherichia coli bacteria. Fourteen of the samples were also analyzed for tritium for the purpose of age-dating the ground water. All sampled wells were completed in a single stratigraphic unit so that the chemistry of ground water from the four aquifers could be compared.
REPORT ON THE BAINBRIDGE INVESTIGATIONPAGE 25

The DMRM also reviewed ground-water chemical data from public water supplies (PWS) obtained from the Ohio EPA’s Northeast Ohio District (NEDO), Division of Drinking and Groundwater (Table 5). These include public water supply wells used by the Bainbridge Township Police Department, Settlers Park, and Montessori School well, Kinston Middle School, Kinston High School, Bainbridge Township Hall, Early Learning Center, the Lake Lucerne Community, and the Tanglewood Lake Community. The Tanglewood Community Water Company No. 9 well is a sampling site for Ohio’s Ambient Ground Water Monitoring Program and has a substantial sampling history since 1974.
Table 5: Ohio EPA Public Water Supply Wells
Well Name No. Completion Date
Casing Depth (ft)
Total Depth
(ft)
Uncased Interval
Bainbridge Twp. Police Dept. - 12/16/2002 138 280 Cuyahoga-Berea Ss Settlers Park - 10/21/1998 39 100 Pottsville Gap. Montessori School 3/6/1983 133 276 Cuyahoga-Berea Ss Kinston Middle School 5/25/1967 65 205 Pottsville Gap. Kinston High School Old 11/12/1974 91 205 Pottsville Gap. 1 5/17/2004 100 201 Pottsville Gap. 2 8/13/2004 100 203 Pottsville Gap. Bainbridge Twp. Hall - 10/27/1967 61 106 Pottsville Gap. Early Learning Center - 7/28/1998 105 145 Cuyahoga Fm Tanglewood Comm. 1 < 6/1995 40 50 Undetermined Tanglewood Comm. 2 < 1/1970 52 65 Undetermined Tanglewood Comm. 3 7/5/1972 33 40 Glacial Sand & Gravel Tanglewood Comm. 4 7/1994 27 36 Undetermined Tanglewood Comm. 5 7/15/1974 33 36 Glacial Sand & Gravel Tanglewood Comm. 8 7/20/1988 27 155 Pottsville Ss Tanglewood Comm. 9 11/22/1995 43 159 Pottsville Ss Lake Lucerne Stat. 1 1 4/17/1989 41 190 Cuyahoga Pottsville Fm Gp. Lake Lucerne Stat. 1 15 3/20/2002 32 230 Cuyahoga Pottsville Fm Gp. Lake Lucerne Stat. 2 2 2/14/1956 41 85 Pottsville Gp. Lake Lucerne Stat. 2 18 12/19/2006 80 120 Pottsville Gp. Lake Lucerne Stat. 3 6 50 230 Cuyahoga Fm, Berea Ss Lake Lucerne Stat. 3 11 7/29/1998 49 240 Cuyahoga Fm, Berea Ss Lake Lucerne Stat. 3 12 8/3/1998 54 240 Cuyahoga Fm, Berea Ss Lake Lucerne Stat. 3 13 5/11/1999 40 274 Cuyahoga Fm, Berea Ss Lake Lucerne Stat. 4 9 8/6/1971 53 208 Cuyahoga Fm, Berea Ss Lake Lucerne Stat. 4 16 11/26/2003 60 230 Cuyahoga Fm, Berea Ss Lake Lucerne Stat. 5 14 8/25/1999 51 230 Cuyahoga Fm, Berea Ss ODNR-DMRM selected six (6) water wells to be sampled as control points in the investigation. These water wells were selected for the following reasons:
1. Availability of historical water quality data for these water wells prior to the December 2007 incident,
2. Includes one water well known to have natural gas in the ground water prior to the December 2007 incident, as reported by the owner,
3. Three wells had no documented or reported natural gas in the ground water prior to the December 2007 incident as documented in Ohio EPA’s public water system files.
REPORT ON THE BAINBRIDGE INVESTIGATIONPAGE 26

4. Three water wells represent the Berea Sandstone Aquifer including two wells cased partially through the Cuyahoga Shale, 5. Two wells represent the Cuyahoga Shale aquifer, and 6. One well represents the Pottsville Group
The six (6) control points water wells were drilled in three of the four aquifers
documented in the investigation area. The water well depths, casing depth, and aquifer are summarized in Table 6. These water wells represent the majority of the water wells in the investigation area. The water well information was obtained from the ODNR website and the owner for 7780 Bainbridge Road.
Table 6: Control Points Water Wells Utilized in the Investigation of the Area Address
Identification Completion
Date Casing
Depth (ft) Total
Depth (ft)
Uncased Interval 8400 Bainbridge Rd (USGS GE-23)
December 1964
31 40 PottsvilleGroup-Sharon sandstone
Bainbridge Twp. Hall 17870 Chillicothe Rd (State Route 306)
10/27/1967 61 106 Cuyahoga Fm.
Early Learning Center 17826 Chillicothe Rd (State Route 306)
7/28/1998 105 145 Cuyahoga Fm.
Montessori School- 17892 Chillicothe Rd (State Route 306)
3/6/1983 133 276 Cuyahoga Fm - Berea sandstone
7780 Bainbridge Road 1950’s per the owner
unknown 200+ (pump set at 200)
Cuyahoga Fm - Berea sandstone-Ohio Shale*
17165 Abbey Rd- (USGS GE-122)
8/2/1979 94 135 Berea sandstone
*Owner reported natural gas prior to December 17, 2007 incident. The DMRM focused on parameters that are useful in evaluating chemical changes, if any,
caused by oilfield drilling and well completion practices. Background water quality data and water quality analyses obtained in 2008 through this investigation are compared to the primary and secondary public drinking-water concentration limits. Appendix 1 is a table listing all OEPA Primary and Secondary Maximum Contaminant Limits associated with the tested parameters) Summary of Previous Ground-Water Investigations in Bainbridge Township
Since 1981, 107 oil and gas wells have been drilled and completed in Bainbridge Township without a known or reported ground-water contamination incident. Prior to December 2007, the DMRM had only received one Bainbridge area complaint alleging ground-water contamination related to oil and gas exploration and production. The DMRM determined that gas in the 280 feet deep water well, developed in the Berea Sandstone, was natural in origin and unrelated to oil and gas exploration or production activities.
REPORT ON THE BAINBRIDGE INVESTIGATIONPAGE 27

During the 1980’s the Ohio Environmental Protection Agency completed four ground-water contamination investigations involving public water supplies in Geauga County. Three of the four contaminated sites are in Bainbridge Township. Two sites were identified in December 1987, and are located in the northern Bainbridge Township near McFarland’s Corner, approximately two miles north of the DMRM investigation area. These two sites cover about 285 acres and are separated by a ground-water divide. Since 1987, OEPA identified five separate plumes of contamination from industrial sources, including dry cleaning chemicals, affecting both the Sharon Member of the Pottsville Formation and the Berea Sandstone. Three of the plumes contain trichloroethylene, one contains 1, 1, 1-trichloroethane (TCE) and tetrachloroethylene (also known as perchloroethylene, PCE), and one contains benzene and PCE contamination. Benzene concentrations were found at approximately 10 times the USEPA maximum contaminant level (MCL), and PCE concentrations in one well were more than 200 times the MCL.
At a third site in the northwestern corner of Bainbridge Township, OEPA collected 51
ground-water samples from public water supplies and residential wells. The analysis of these samples confirmed the presence of diethyl ether, dichloroethane (DCA), and other volatile organic compounds (VOCs) (Ohio Environmental Protection Agency, 1984). In 1993, water lines were installed in the community to provide potable water to residents (Ohio Environmental Protection Agency, 1996b). Based upon personal communications with OEPA, the DMRM has determined that these contamination events should not affect aquifers or wells sampled and tested during the DMRM 2008 investigation. Stratigraphic Variation in Water Quality in Geauga County In general, Jagucki (2001) reported that most ground waters, regardless of aquifer, are dominated by the bicarbonate anion, with a variety of cation types ranging from calcium to mixed calcium-magnesium-sodium waters. Four of 31 samples plotted on trilinear diagrams as chloride type water. However, all four samples were considered affected by road salt and/or domestic sewage. Most aquifers in Geauga County would be classified as iron or sulfate reducing with the exception of the Pottsville Group. The shallow unconfined, fractured sandstones of the Pottsville Group typically have higher concentrations of dissolved oxygen and lower than average concentrations of iron and manganese and low pH values, relative to groundwater in the Cuyahoga Formation, Berea Sandstone, or glacial aquifers. According to Jagucki (2001) “No statistically significant differences in constituent concentrations between aquifer units were found for calcium, magnesium, sulfide, sulfate, chloride, bromide, silica, and manganese. Variability of constituent concentrations in the Cuyahoga and Berea waters likely is caused by the varying degrees of stratigraphic confinement of these units. For instance, in some places the full stratigraphic column is present, and recharging water must filter through all of these units before making its way to the lower bedrock aquifers.”
REPORT ON THE BAINBRIDGE INVESTIGATIONPAGE 28

Glacial Deposits Jagucki (2001) reported that “Waters of the glacial deposits generally are anoxic;
dissolved oxygen concentrations were at or below the detection limit of 0.1 mg/L in seven of the eight samples collected from wells completed in the glacial deposits.” According to Jagucki (2001), Total coliform concentrations are highly variable in the glacial deposits, and include the highest concentration found (120 col/100 mL), as well as the greatest median concentration (6 col/100 mL). Four of eight (50%) domestic wells developed in the glacial aquifers had total coliform concentrations exceeding the Geauga County Health Districts standard of zero. Chloride and TDS concentrations were well below US EPA Secondary Maximum Contaminant Levels (SMCLs). Chloride concentrations ranged from 1.0 to 74.0 mg/L (mean: 22.1 mg/L) while TDS concentrations ranged from 203 – 420 mg/l (mean: 304.9 mg/L).
Mean concentrations for nearly all tested parameters were higher for Ohio EPA Public Water Supply wells. According to Ohio EPA Public Water Supply (PWS) records and Jagucki (2001), mean concentrations of iron and manganese exceeded US EPA Secondary MCLs. The USGS reported concentrations of dissolved iron and manganese while OEPA reported concentrations of total iron and manganese. Table 7 lists the range and mean concentrations for selected parameters for background water quality data compiled as part of this investigation. The number of public water supply analyses used to calculate the mean concentration is included in parentheses. N/A indicates no analytical data. The USGS reported concentrations of dissolved iron and manganese while OEPA reported concentrations of total iron and manganese.
Table 7: Ground-Water Quality Summary (Selected Parameters) Aquifer: Glacial Sand and Gravel
Data Source Jagucki 2001 OEPA-PWS Number of Samples 8 1 - 8 Parameter Range
(mg/L) Mean (mg/L) Range (mg/L) Mean (mg/L)
PH (S.U.) 7.1 – 7.8 7.55 7.5 – 7.8 (7)Alkalinity 150 – 270 200 189 – 241 203 (8)Chloride 1 – 74 22.1 6 – 57 25.6 (8)Sulfate 5.7 – 97 38.96 32 – 80 56.5 (8)Calcium 37 –97 58.5 62 – 97 80.4 (8)Iron < .01 – 1.9 .765 <0.1 – 3.16 1.43 (8)Manganese .015 - .20 .104 0.08 – 0.8 0.22 (7)Sodium 3.4 – 120 29.71 5 – 63 17.5 (8)Aluminum N/A N/A N/A N/A Arsenic N/A N/A N/A N/ABarium N/A N/A <0.2 – 0.3 <0.3 (1)Total Dissolved Solids 203 – 420 304.9 300 – 398 363.7 (6)
REPORT ON THE BAINBRIDGE INVESTIGATIONPAGE 29

Pottsville Group In many areas of Geauga County, including the Bainbridge investigation area, the
sandstones of the Pottsville Group are unconfined, ridge top aquifers overlain by relatively thin glacial till deposits. In these settings, wells developed in the Pottsville, or partially cased through the Pottsville, can be susceptible to pollutants introduced by surficial contamination sources. Accordingly, Jagucki (2001) reported that “The Pottsville Group has the highest median concentration of dissolved oxygen (0.8 mg/L) and nitrate (0.3 mg/L as N) among the four stratigraphic units. Of the six locations at which nitrate was detected in this study, five were in Pottsville Formation.” Total coliform concentrations exceeded the Geauga County Health District standard of zero at six of ten (60%) sampled wells. Two wells had “unusually high total coliform concentrations.”
In addition, the USGS determined that “The median value of pH in the Pottsville waters was below (noncompliant) the SMCL range required by OEPA (1994) for drinking waters.” Based upon 15 field measurements at Tanglewood Water Company’s No.9 well, between May 1997 to October 2003 the mean pH was 6.73, below the OEPA’s SMCL of 7.0 S.U. The mean nitrate concentration was 3.61 mg/L. Chloride and Total Dissolved Solids (TDS) concentrations reported by Jagucki (2001) were generally well below SMCL with the exception of well GE-23 south of the intersection SR 422 and Chillicothe Road in Bainbridge Township. The chloride and TDS concentrations for well GE-23 were 240 and 820 mg/l, respectively, reflecting contamination by road salt. For the other nine wells sampled, the chloride concentration ranged from 3.2 – 43.0 mg/l (mean: 12.6 mg/L), and TDS ranged from 220 – 321 mg/L (mean: 272.3 mg/L). Based upon 15 samples collected from the Tanglewood Water Co. well No. 9, between May 1997 and October 2007, Ohio EPA’s Ambient Ground Water Monitoring Network Data Summary indicates chloride concentrations ranged from 20.1 to 61.7 mg/L (mean: 41.82 mg/L). The mean dissolved iron concentration reported by Jagucki (2001) was below US EPA’s Secondary MCL. The mean total iron concentration for 15 samples from OEPA’s Ambient Ground Water Monitoring Well (Tanglewood #9) was .113 mg/L, also below OEPA’s Secondary MCL. However, the mean total iron concentration for Ohio EPA’s public water supply samples, exceeds the Secondary MCL (0.3 mg/L). The mean manganese concentration recorded by Jagucki (2001), the OEPA Public Water Supply wells, slightly exceeded the US EPA’s Secondary MCL (0.05 mg/L). Jagucki (2001) recorded concentrations of dissolved iron. The Ohio EPA Ambient Ground Water Monitoring Program records total iron and manganese concentrations. The mean manganese concentration for 15 samples from OEPA’s Ambient Ground Water Monitoring Well (Tanglewood #9) was .012 mg/L, below OEPA’s Secondary MCL. The control well is anthropogenically contaminated and exceeds USEPA Secondary MCLs for chloride and TDS (250 and 500 mg/L respectively). Table 8 lists the range and mean concentrations for selected parameters for background water quality data compiled as part of this investigation.
REPORT ON THE BAINBRIDGE INVESTIGATIONPAGE 30
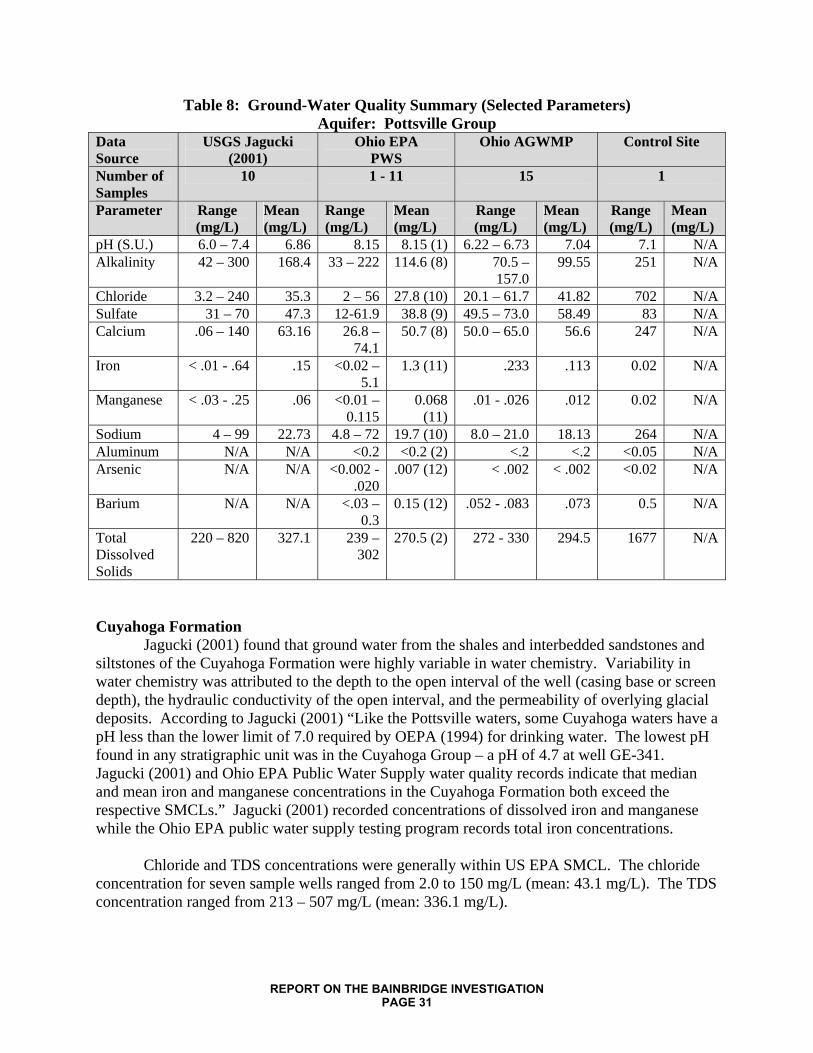
Table 8: Ground-Water Quality Summary (Selected Parameters) Aquifer: Pottsville Group
Data Source
USGS Jagucki (2001)
Ohio EPA PWS
Ohio AGWMP Control Site
Number of Samples
10 1 - 11 15 1
Parameter Range (mg/L)
Mean (mg/L)
Range (mg/L)
Mean (mg/L)
Range (mg/L)
Mean (mg/L)
Range (mg/L)
Mean (mg/L)
pH (S.U.) 6.0 – 7.4 6.86 8.15 8.15 (1) 6.22 – 6.73 7.04 7.1 N/AAlkalinity 42 – 300 168.4 33 – 222 114.6 (8) 70.5 –
157.099.55 251 N/A
Chloride 3.2 – 240 35.3 2 – 56 27.8 (10) 20.1 – 61.7 41.82 702 N/ASulfate 31 – 70 47.3 12-61.9 38.8 (9) 49.5 – 73.0 58.49 83 N/ACalcium .06 – 140 63.16 26.8 –
74.150.7 (8) 50.0 – 65.0 56.6 247 N/A
Iron < .01 - .64 .15 <0.02 – 5.1
1.3 (11) .233 .113 0.02 N/A
Manganese < .03 - .25 .06 <0.01 – 0.115
0.068 (11)
.01 - .026 .012 0.02 N/A
Sodium 4 – 99 22.73 4.8 – 72 19.7 (10) 8.0 – 21.0 18.13 264 N/AAluminum N/A N/A <0.2 <0.2 (2) <.2 <.2 <0.05 N/AArsenic N/A N/A <0.002 -
.020.007 (12) < .002 < .002 <0.02 N/A
Barium N/A N/A <.03 – 0.3
0.15 (12) .052 - .083 .073 0.5 N/A
Total Dissolved Solids
220 – 820 327.1 239 – 302
270.5 (2) 272 - 330 294.5 1677 N/A
Cuyahoga Formation Jagucki (2001) found that ground water from the shales and interbedded sandstones and siltstones of the Cuyahoga Formation were highly variable in water chemistry. Variability in water chemistry was attributed to the depth to the open interval of the well (casing base or screen depth), the hydraulic conductivity of the open interval, and the permeability of overlying glacial deposits. According to Jagucki (2001) “Like the Pottsville waters, some Cuyahoga waters have a pH less than the lower limit of 7.0 required by OEPA (1994) for drinking water. The lowest pH found in any stratigraphic unit was in the Cuyahoga Group – a pH of 4.7 at well GE-341. Jagucki (2001) and Ohio EPA Public Water Supply water quality records indicate that median and mean iron and manganese concentrations in the Cuyahoga Formation both exceed the respective SMCLs.” Jagucki (2001) recorded concentrations of dissolved iron and manganese while the Ohio EPA public water supply testing program records total iron concentrations. Chloride and TDS concentrations were generally within US EPA SMCL. The chloride concentration for seven sample wells ranged from 2.0 to 150 mg/L (mean: 43.1 mg/L). The TDS concentration ranged from 213 – 507 mg/L (mean: 336.1 mg/L).
REPORT ON THE BAINBRIDGE INVESTIGATIONPAGE 31

Table 9 lists the range and mean concentrations for selected parameters for background water quality data compiled as part of this investigation.
Table 9: Ground-Water Quality Summary (Selected Parameters)
Aquifer: Cuyahoga Formation Data Source USGS
Jagucki (2001) Ohio EPA
PWS Urban Drilling
Background Samples Number of Samples
7 1 - 5 3
Parameter Range (mg/L)
Mean (mg/L)
Range (mg/L)
Mean (mg/L)
Range (mg/L)
Mean (mg/L)
pH (S.U.) 4.7 – 7.4 6.83 5.7 – 7.4 ? (2) 7.16 – 7.66 7.44Alkalinity 4 – 360 169.1 17 – 191 118 (3) N/A N/AChloride 2 – 150 43.1 9 – 165 93.7 (3) 75 – 100 86Sulfate 12 – 120 48.7 29-77 53 (3) 35 – 50 41.7Calcium 21 – 84 51.7 44.8 – 45 44.9 (2) 63.41 –
76.91 67.8
Iron .028 – 2.1 1.11 .11 - .92 .45 (3) ND – 0.35 <0.35Manganese .009 - .26 0.14 .04 - .14 .73 (3) N/A N/ASodium 7.5 – 90 36.9 38.8 – 97 73.9 (3) 21.98 –
58.02 35.9
Aluminum N/A N/A N/A N/A N/A N/AArsenic N/A N/A <.002 - .02 .002 (5) N/A N/ABarium N/A N/A <0.1 – 0.2 0.15 (5) .01 - .14 .05Total Dissolved Solids
194 – 507 336.1 353 353 (1) 365 – 402 378
Berea Sandstone The Berea Sandstone is the only one of the four aquifers that does not crop out in Geauga County. Throughout much of Geauga County the Berea Sandstone is a confined or leaky confined aquifer overlain by shales of the Cuyahoga Group. In the deeper drift-filled valleys of Geauga County (Chagrin River and East Branch Chagrin River), the Berea Sandstone discharges to glacial deposits. According to Jagucki (2001), the Berea water wells (six) have the greatest average depth (182.7 feet).
Jagucki (2001) concluded that “Ground water within the Berea Sandstone can be distinguished from that of the other units on the basis of median constituent concentrations. Median concentrations of sodium, bicarbonate, alkalinity, ammonia, boron, and strontium in the Berea Sandstone are greater than those in the other three units and are significantly greater than those of the Pottsville Formation. The highest specific conductance and concentrations of hardness, calcium, magnesium, sulfate, and dissolved solids were found in ground-water samples from the Berea Sandstone. High concentrations of dissolved solids are consistent with the longer ground-water residence times in the Berea (70 to 4,800 years relative to residence times in the Pottsville Formation of 15 to 170 years) as estimated by Eberts and others (1990), which would
REPORT ON THE BAINBRIDGE INVESTIGATIONPAGE 32

allow for greater dissolution of aquifer minerals by ground water.” For six sampled water wells, Jagucki (2001) determined that the concentration of chloride were generally low ranging from 1.2 to 52 mg/L (mean: 16.0 mg/L). The chloride concentration was highly variable for Ohio EPA public water supply wells (17 – 198 mg/L) and for the three control sites selected for this investigation (10 – 158 mg/L). The concentration of TDS range varied considerably for the various sets of background water quality data. Mean iron concentrations exceeded Ohio EPAs Secondary MCL for Jagucki (2001), Ohio EPA Public Water System samples and the control sites. Jagucki (2001) recorded concentrations of dissolved iron. The Ohio EPA Public Drinking Water Program records total iron concentrations.
Table 10 lists the range and mean concentrations for selected parameters for background
water quality data compiled as part of this investigation.
Table 10: Ground-Water Quality Summary (Selected Parameters) Aquifer: Berea Sandstone
Data Source USGS Jagucki 2001
Ohio EPA Public Water System
Records
Urban Drilling Background Site
Control Sites
Number of Samples
6 4 - 15 1
Parameter Range (mg/L)
Mean (mg/L)
Range (mg/L)
Mean (mg/L)
Range (mg/L)
Mean (mg/L)
Range (mg/L)
Mean (mg/L)
pH (S.U.) 7.2 – 8.7 7.6 7.3 – 8.9 ? (7) 8.28 - 7.5 – 8.4 7.8Alkalinity 250 – 330 283.3 120 – 422 248 (8) N/A - 275 - 395 330Chloride 1.2 – 52 16.0 17 – 198 84.5 (8) 22 - 10 - 158 76Sulfate 0.1 – 530 106.4 <2-42 17.83 10 - <2 - 505 173Calcium 1.8 – 160 60.3 0.56 – 65 27.7 (8) 20.54 - 4.7 – 177 72Iron .009 – 1.2 0.46 .01 – 1.61 0.68 (9) ND - .05 – 1.91 .86Manganese .002 - .174 0.07 .01 - .21 .046 (9) N/A - ND – 0.08 .03Sodium 26 – 180 682 30 – 380 148.2 (8) 78.60 - 58 – 284 148Aluminum N/A N/A N/A N/A N/A - ND NDArsenic N/A N/A .002 - .024 .007 (15) N/A - ND NDBarium N/A N/A <0.1 - .83 0.42 (9) 0.04 - 0.1 – 0.2 0.16Total Dissolved Solids
301 – 1100 475.7 360 – 722 466.8 (4) 298 - 400 – 1073 713
Occurrence of Natural Gas in Geauga County Ground Water Neither the USGS report (Jagucki, 2001), nor previous ground-water studies referenced by this report, have evaluated the presence or concentration of dissolved natural gas in Geauga County aquifers. Jagucki (2001) reported that hydrogen sulfide was detected in 17 of 31 (55%) wells at a detection limit of 0.01 mg/L. In eight of 31 wells (26%), owners claimed to have chronic odor issues with their well water related to the presence of hydrogen sulfide gas.
The deepest water wells in the investigation area are developed in the Berea Sandstone – Bedford Shale sequence that is underlain by the Devonian Ohio Shale. The Ohio Shale is a known natural gas reservoir that is over 1800 feet thick in the vicinity of the investigation area.
REPORT ON THE BAINBRIDGE INVESTIGATIONPAGE 33
During the 1980s the potential for natural gas accumulation in the Ohio Shale was extensively evaluated through the U.S. Department of Energy’s (US DOE) Eastern Gas Shales Project. The US DOE estimates that there are up to 900 trillion cubic feet of natural gas in the Ohio Shale in the eastern United States (Hoover, 1960; Janssens, 1976; Gray, 1982; Schwietering, 1979) According to Gray (1982), the Devonian shales in northeastern and central Ohio have been drilled for natural gas since the late 1800’s on a noncommercial (domestic) basis. “Typically, a Devonian shale gas well is a low volume, low pressure, long payout venture, which in the past has not been economically attractive to the petroleum industry. Portions of the Devonian shales consist of dark-colored, organic-rich marine shales, which are believed to be the most important source of gas in the Devonian shale sequence.” Published reports by the US DOE and the ODNR Division of Geological Survey indicate that geologic conditions in southwestern Geauga County (Bainbridge Township) are favorable for the accumulation of natural gas in the Ohio Shale. Gray (1982) lists southwestern Geauga County as an area favorable for gas production in the Cleveland Shale Member, the uppermost member of the Ohio Shale. Natural gas is most likely to occur where closely spaced natural fracture systems intersect within organic rich source beds (Janssens, 1976; Gray 1982; Schweitering, 1979) There are two regions in Ohio that are known to have good potential for gas production from the Ohio Shale resulting from high fracture densities. One is a broad belt that runs parallel to the Lake Erie Shoreline (Jannsens, 1976; Gray 1982; Schweitering, 1979). Fractures extending to depths of approximately 900 feet are believed to be caused by glacial on and off-loading. The DMRM has determined that fracture density in the investigation area is likely enhanced by local faulting/folding activity. The DMRM concluded that lost circulation and well completion issues at the English No.1 Well, are indicative of local faulting/folding. The presence of a local fault/fold is also evidenced by gas observed in the “Newburg” member of the Lockport Dolomite at both the English No. 1 Well and the offset oil and gas well (Permit 2-1946). The occurrence of natural gas in ground water for wells developed in the Berea-Bedford sequence is common in Geauga County. This finding is based upon interviews with local residents, water well drillers, a review of records for the Bainbridge Police Dept. well, and measurements from the control sample sites. In October 2004, the DMRM conducted an investigation of a complaint regarding natural gas in the Bainbridge Township Fire Department public water supply well. The DMRM concluded that the presence of gas was natural occurring and resulted from completion of the well in the Devonian Shale sequence underlying the Berea Sandstone. Three control wells selected for sampling during this investigation were developed in the Berea Sandstone. The owner of the well on Bainbridge Road stated that their well had natural gas for a number of years prior to the December 2007 incident. Ground-water samples for two of the three control sites had measurable concentrations of dissolved methane (0.57 and 0.74 mg/L).
REPORT ON THE BAINBRIDGE INVESTIGATIONPAGE 34

Arsenic Metals in Geauga County Ground Water Arsenic is a common, naturally occurring element in the earth's crust. OEPA has concluded that most arsenic found in Ohio’s ground water is natural in origin. Jagucki (2001) did not analyze the 31 Geauga County ground-water samples for arsenic. However, there are other sources of information relevant to arsenic concentrations in Geauga County ground water including four water wells sampled in 1978 and analyses of public water supplies. In 1978, USGS analyzed four ground-water samples for dissolved arsenic. Two wells developed in the Berea sandstone had dissolved arsenic concentrations ranging from 1.0 ug/L to below the detection limit (<1.0 ug/L). Two wells developed in the Pottsville Group had dissolved arsenic concentrations ranging from 4.0 ug/L to below detection limit. While USGS did not test for arsenic in any wells developed in glacial aquifers, the USGS has concerns that reducing conditions documented in glacial aquifers appear to be favorable for dissolution of arsenic. Jagucki (2001) determined that seven of eight glacial wells sampled in 1999 had little or no oxygen and would be classified as iron or sulfate reducing ground waters. These conditions are similar to those evaluated by Thomas (2003) where elevated arsenic concentrations (greater than the OEPA PMCL of 10 mg/L) were found in 19 percent of ground-water samples collected from water wells developed in glacial aquifers in Ohio. OEPA has required several public water suppliers in Geauga County that produce waters from glacial deposits to install new treatment facilities to reduce arsenic levels. In January 2003, the first ground-water sample from the Bainbridge Police Department water well, developed in the Berea Sandstone, had an arsenic concentration of 24 ug/L, well over the OEPA PMCL of 10 ug/L. The arsenic concentration from seven subsequent samples collected in June and July of 2003, ranged from 5 – 8 ug/L. Volatile Organic Compounds in Geauga County Ground Water
Ohio EPA public water systems water quality records indicate VOCs have been detected at some concentration in 10 water wells between 1991 and 2005 (Table B). The VOCs detected were: Bromoform, Bromodichloromethane, Chloroform, Dibromochloromethane, Toluene, Chloroethane, Chloromethane, Dichlorodifluoromethane, Xylene, and Bromochloromethane.
TTHM was detected in seven public water supply wells at concentrations below the PMCL of 80 ug/L. Xylene was detected in one water well and toluene was detected in another well at concentrations below the PMCL standard established by the USEPA of 10,000 ug/L (10mg/L) and 1,000 ug/L (1.0 mg/L) respectively. Dichlorodifluoromethane was detected in two wells at concentrations ranging between 0.8 and 3.0 ug/L. Both water wells are developed in the Cuyahoga Shale and one is included in the sampling event as a control point water well. Bromochloromethane was detected at one water well at concentration of 1.87 ug/L.
The background water quality data evaluated by ODNR show that VOCs were detected in the ground water even though they were not detected again in many samples after the initial detection (Table 11). TTHM and dichlorodifluoromethane were detected in two control point water wells.
REPORT ON THE BAINBRIDGE INVESTIGATIONPAGE 35

Table 11: Summary of VOC Chemicals Detected in Public Water Supply Data (Ohio EPA)
Parameter MCL (Ug/L)
Ken
ston
Ear
ly
Lear
ning
C
ente
r
Mon
tess
ori
Scho
ol
Lake
Luc
erne
O
utsi
de
Stat
ion
#4Ta
ngle
woo
d W
ell #
10
Tang
lew
ood
Wel
l #3
Ken
ston
HS
New
- Wel
l #2
Ken
ston
M
iddl
e Sc
hool
Lake
Luc
erne
- St
atio
n #5
, O
utsi
de w
ell
8353
B
ainb
ridge
Rd
Lake
Luc
erne
-St
atio
n #1
, In
side
Wel
l
Dibromochloromethane 2.62 (2004)
Bromodichloromethane 0.55 (2005)
Chloroform (Trichloromethane)
0.7 (1995)
0.73 (2004)
1.8 (1992)
1.2 (1991) 1.98 (2005)
0.9 (1991), 1.2 (1991)
Bromoform
80
1.4 (1991)
0.82 (2004)
1.1 (1991)
Dichlorodifluoromethane N/A 2 (1991) 3. & 0.8 (1991)
Bromochloromethane N/A 1.87 (2004)
Chloromethane N/A
Chloroethane N/A
Dichloromethane (Methylene Chloride)
5
Total Xylene 10,000 2 (1992)
Toluene (Methylbenzene) 1,000 0.53 (2004)
Suitability of Ground Water for Drinking There are no regulatory standards that apply to the chemical quality of ground water produced by domestic water wells in Ohio. Jagucki (2001) compared water quality data from 31 domestic water wells to Ohio EPA standards that are only enforceable for public water supplies that serve 25 or more people. Ohio EPA’s public water standards are adopted from Maximum Contaminant Level (MCL) standards enacted by U.S. EPA for selected chemical parameters pursuant to the federal Safe Drinking Water Act. Ohio EPA has established both Primary and Secondary MCLs for public drinking water supplies. For the most part, the public drinking water standards that apply at the Federal level also apply at the State level. Primary MCLs are health-based limits and reflect the highest
REPORT ON THE BAINBRIDGE INVESTIGATIONPAGE 36

concentration that is allowable for a selected parameter in raw (untreated) water for a public water supply. Secondary MCL standards address aesthetic considerations such as taste, color, and odor, rather than hazards to human health. Appendix 1 is a listing of Ohio EPA Primary and Secondary MCLs for public drinking water supplies. It should be noted that untreated ground water may naturally have dissolved chemicals that exceed Primary or Secondary MCLs. One cannot assume that the exceedance of a MCLs indicates that ground water has been degraded or contaminated by a pollutant. During a ground-water investigation, water sample results must be compared to the water quality data from selected control sampling sites and pre-contamination event data in order to draw conclusions regarding degradation or contamination.
Jagucki (2001) also used the Geauga County General Health District’s standard for total coliform bacteria in raw water (zero colonies per 100 ml of water) from newly constructed wells to assess suitability for drinking. Jagucki (2001) evaluated the suitability of ground water in Geauga County for drinking purposes based upon standards for selected parameters. According to Jagucki “Previous studies of ground-water quality in the county have consistently reported that manganese and iron concentrations in ground water in Geauga County often exceed the U.S. Environmental Protection Agency (USEPA) Secondary Maximum Contaminant Level (SMCL) (Eberts etal, 1990; Nicols, 1980). Water from 16 of the 31 samples exceeded the Geauga County General Health District’s standard of 0 colonies of total coliform bacteria per 100 milliliters of water. Aesthetically based SMCLs were exceeded in the indicated number of wells for pH (8), sulfate (1), dissolved solids (3), iron (19), and manganese (18). Hydrogen sulfide was detected at or above the detection limit of 0.01 milligram per liter in 17 of the 31 water samples.” Table 12 summarizes findings reported by Jagucki (2001).
REPORT ON THE BAINBRIDGE INVESTIGATIONPAGE 37

Table 12: Ground-Water Quality Relative to Standards Parameter Standard Source of
Standard Number of
Wells Exceeding Standard
Percentage of Wells
Exceeding Standard
Coliform Bacteria 0 colonies per 100 mL
Geauga Co. General Health District
16 51.6
Nitrate 10 mg/L OEPA Primary MCL
0 0
Volatile Organic Compounds
• Benzene • Ethylbenzene • Toluene • Xylenes
0.005 mg/L0.7 mg/L1.0 mg/L
OEPA Primary MCL
0 0 0 0
0 0 0 0
pH >7.0, <10.5 S.U. OEPA
Secondary MCL 8 25.8
Iron 0.3 mg/L OEPA Secondary MCL
19 61.3
Manganese 0.05 mg/L OEPA Secondary MCL
18 58.1
Sulfate 250 mg/L OEPA Secondary MCL
1 3.2
Chloride 250 mg/L OEPA Secondary MCL
0 0
Total Dissolved Solids
500 mg/L OEPA Secondary MCL
3 9.7
Hardness 121 mg/L OEPA Secondary MCL
25 80.7
Controls on Water Quality Jagucki (2001) concluded that significant variations in ground-water chemistry could be attributed to the depth to top of the open sampling interval (base of water well casing or top of screened interval), differences in stratigraphic confinement, and anthropogenic effects. The USGS (Jagucki, 2001) analyzed ground-water samples for tritium to assess the age or residence time of ground water, as a means to evaluate susceptibility of ground water to contamination from surface sources. Jagucki (2001) states, “In terms of water quality, age of ground water is an indicator of susceptibility of an aquifer to human activities [anthropomorphic impacts] at or near land surface. Ground water that recharged the aquifer after about 1950 is more susceptible to near-surface contamination than older waters because relatively little time has passed to allow for attenuation of contaminants in the subsurface, and because regulated chemicals have been introduced into the environment in large quantities since the mid 1940’s,
REPORT ON THE BAINBRIDGE INVESTIGATIONPAGE 38

following World War II . . . Dating of 14 ground-water samples from Geauga County was done by use of tritium analyses . . .”. Tritium is the hydrogen isotope with an atomic weight of 3 is naturally occurring, but with concentrations that were dramatically increased following post WWII nuclear tests in the atmosphere which ended in 1964. Ground-water samples with tritium concentrations less than the detection limit of 1.8 TU [tritium units] are considered to have reached the water table as recharge prior to 1953 or are mixtures of pre-1953 waters and recent recharge with a low tritium concentration. Such waters are referred to as “old.” Conversely, waters with tritium concentrations greater than 1.8 TU are referred to as “young,” having at least a component of post-1953 recharge. (Page 21) Jagucki (2001) determined that anthropogenic effects influenced ground-water chemistry in Geauga County. The USGS evaluated concentrations of a number of parameters including nitrate, coliform bacteria, VOCs, and chloride to determine the influence of anthropogenic sources such as road salt, leaking septic systems, leaking underground storage tanks, and oil and gas operations. Jagucki (2001) reported the following: Nitrate Of the 31 samples from the USGS study, six (19.4%) had nitrate concentrations greater than 0.3 mg/L. B. Baker and others (1989) consider nitrate concentrations from 0 to 0.3 mg/L to represent background concentrations in Ohio (that is, concentrations that largely are unaffected by human activity). According to Baker and others (1989), concentrations of nitrate greater than 0.3 mg/L may represent anthropogenic effects. All six nitrate detections were found at depths of less than 95 feet. Sample depth in this context refers to distance, in feet, from land surface to the top of the screened or open interval in the well. Five of the six wells in which nitrate was detected are completed in the Pottsville Formation. Jagucki (2001) concluded that “leaking septic systems are the most likely source for nitrate in ground water at concentrations above background levels. Most residents in the county rely on domestic septic systems to treat their wastewater. Leaking septic systems, in addition to elevating nitrate concentrations, can cause elevated concentrations of total coliforms, E. coli, boron, sodium and chloride and other parameters in ground water.” Total Coliform Bacteria Total coliform levels exceeding the Geauga County Health Districts standard were detected in 16 of the 31 samples (52%) supporting the idea of possible contamination from septic systems. Five of the six samples with total coliform concentrations greater than 10 col/100 mL are from wells with depths less than 55 feet from land surface to the top of the open interval. Water from these five wells all were categorized as “young” by tritium dating. Chloride-to-Bromide Ratios Salt can enter aquifers from a variety of sources including road salt for ice control, water softener discharge via septic systems, upconing of brackish connate ground water contained in fractures in the Ohio Shale, and improper containment or disposal of oil-field brines produced during exploration or production operations (Jenkins, 1987; Eberts and others, 1990, Lesney, 1992, MacDonald, 1987; Eberts and others, 1990). According to Jagucki (2001) Geauga County
REPORT ON THE BAINBRIDGE INVESTIGATIONPAGE 39

receives, on average, more than 100 inches of snowfall each year, so use of salt to keep the roads clear is a common practice. The source(s) of chloride in ground water can be evaluated by comparing the weight ratios of chloride and bromide concentrations in a sample (Whittemore, 1988; Knuth and others, 1990; Davis and others, 1998). Chloride and bromide are useful indicators because they are; highly soluble, persistent (minimally affected by adsorption to sediment once dissolved in water), and non-reactive (not altered by oxidation-reduction reactions). The ratios of chloride to bromide for oilfield brine and dissolved salt differ significantly (Davis and others, 1998). As seawater evaporates, halite (NaCl) in the residual water becomes saturated and precipitates (crystallizes) first, leaving a residual brine in which bromide has concentrated. Ground water with dissolved halite, applied as road salt, or discharged by water softeners, will have a high chloride-to-bromide (Cl:Br) ratio. Oilfield or connate brines, which can be found in deep aquifers, will be enriched in bromide relative to chloride and will have a much lower Cl:Br ratio (Davis and others, 1998). Jagucki (2001) depicts simple binary mixing curves (Figure 20) following methods described in Whittemore (1988), to show how the Cl:Br ratio of dilute ground water would change with the addition of increasing amounts of saturated halite solution, oilfield brine, and domestic sewage. These solutions, as well as the dilute, unaffected ground water, are referred to as “end-members” because they represent the starting and stopping points of the possible mixing process. Waters having Cl:Br ratios greater than 400 and plotting near or between the mixing lines are considered to have been affected by road salt application or salt leaking from septic systems. Davis and others (1998) reported that shallow ground water, unaffected or only minimally affected by dissolution of halite, generally has a Cl:Br ratio of 100 to 200. Jagucki (2001) states that it is difficult to make definitive statements regarding anthropogenic effects on ground waters that have Cl:Br ratios between 200 and 400. Ground waters within this range may be affected by multiple sources. The Cl:Br ratio for oilfield brine is generally in the range of 80 – 100. Based upon an evaluation of chloride: bromide ratios, Jagucki concluded that:
1. Mixing of potable ground water with oilfield brine was not a widespread problem in Geauga County. Only one water well (GE-165) had a chloride:bromide ratio consistent with oilfield brine. The chloride concentration of this water well was only 20 mg/L, far below the Secondary MCL (250 mg/L).
2. Salt was found to affect ground-water quality in a total of eight samples (26%) from wells completed in the glacial deposits, Pottsville Formation, and the Cuyahoga Group. Ratios of chloride to bromide for the samples indicate that they are mixtures of dilute ground water with either a halite (salt) solution, or a combination of domestic sewage and halite.
3. Chloride concentration in ground water is somewhat inversely related to distance of the well from the road.
REPORT ON THE BAINBRIDGE INVESTIGATIONPAGE 40
Summary of Conclusions
1. Most waters, regardless of aquifer, are dominated by the bicarbonate anion. 2. It is common for deep water wells developed in the Berea-Bedford interval to emit
natural gas. 3. Ground water in Geauga County is typically hard. 4. Iron and manganese concentrations exceed secondary MCLs in over half of all wells
sampled . 5. Over half of all water wells sampled by the USGS, had coliform bacteria counts
exceeding the Geauga County General Health District standard (zero colonies per 100 mL).
6. Ground water in Geauga County does not typically exceed primary MCLs for VOCs, or secondary MCLs for chloride or Total Dissolved Solids except when anthropogenically affected.
7. Ground waters in glacial Cuyahoga Group and Berea Sandstone aquifers are commonly reducing.
REPORT ON THE BAINBRIDGE INVESTIGATIONPAGE 41

CAUSE OF AQUIFER NATURAL GAS INVASION AND EXPLOSION Permitting and Drilling the English No.1 Well
On October 2, 2007, the DMRM issued a permit (API 34-055-2-1983-00-00) to Ohio Valley Energy Systems Corporation (OVESC) to drill the English No.1 Well in Lot 21, Tract 2, Bainbridge Township, Geauga County. The permitted target formations were the Ohio Shale through the “Clinton” (total depth: 3926 feet below ground surface). The permit was issued subject to urban area drilling conditions. OVESC was required to drill the English No.1 Well using a fluid circulating medium due to a gas show encountered in the “Newburg” section of the Lockport Dolomite, at a depth of approximately 3300 feet below surface, on a nearby offset well that was drilled the previous month (Permit 2-1946). Fluid drilling through known gas bearing zones can suppress gas flow into the well bore and will help control gas when drilling through those zones. In addition, urban permit conditions require the driller to install a well control device or “blowout preventor”. The device is pressure tested prior to drilling out from under surface casing. This equipment is designed to control and divert any high-pressure gas that may be encountered while drilling. On the English No.1 Well, OVESC complied with all well-control conditions required by the permit.
OVESC commenced drilling the English No.1 Well on October 18, 2007. In accordance with the permitted casing plan, 88 feet of new 32 lb/ft API standard 11 ¾ inch diameter steel conductor casing was set through the glacial drift into bedrock (Cuyahoga Group). To further protect groundwater resources, 253 feet of new 23 lb/ft API standard 8 5/8 inch diameter steel surface casing was set more than 50 feet through the Berea aquifer and cemented to surface. The well was conditioned prior to cementing, circulation was established, and there were good cement returns to the surface. The cementing was witnessed and approved by Tom Hill, the DMRM oil and gas well inspector for Geauga County.
Following a 10 hour waiting period to allow the cement to set up, drilling proceeded without incident to a total depth of 3926 feet on October 26. Because the well was drilled on fluid, no shows of oil or gas were noted during the drilling; however, the driller did report a slight odor of “sour gas” at total depth while mixing gel to condition the well bore. An attempt to run an open hole geophysical log was unsuccessful due to an obstruction in the well bore at 3658 feet that would not allow the logging tool to reach the bottom of the well. The OVESC consultant believed that the obstruction was caused by a filter cake in the well at 3658 feet, the depth of the “Packer Shell”, a shaley dolomite that directly overlies the “Clinton” sand. Filter cake is a build up of drilling mud on the borehole wall and can be caused by an extremely porous and permeable zone where the mud accumulates adjacent to zones that are “thieving” fluids. The density component of the logging tool also did not work and the logging effort was abandoned.
OVESC then proceeded to set and cement production casing. New 10.5 lb/ft API
standard 4 ½ inch diameter steel production casing was run in the hole but could get no deeper than 3659 feet and had to be washed down to a depth of 3873 feet where the casing became differentially hung. Circulation of the borehole was established prior to cementing, but during the cementing operation, circulation was lost and the pump pressure increased to 1100 psi. Most of the remaining water on location was used to try to re-establish circulation and to complete the cement job. Circulation of the borehole was not re-established but cementing of the
REPORT ON THE BAINBRIDGE INVESTIGATIONPAGE 42

casing was accomplished. Due to the lost circulation during cementing, the OVESC consultant recommended that a cement bond log should be run to determine both the bond quality and the amount of cement outside the production casing. Completion of the English No.1 Well
On November 1, Appalachian Well Surveys ran a cement bond log. The log indicated that the top of the cement was at 3640 feet, the depth of the “Packer Shell” (Figure 21). Based upon the quantity of cement ordered by OVESC, the calculated fill up in the 4 ½ inch casing-borehole annulus should have been at least 700-800 feet above the “Clinton” and would have effectively sealed off the “Newburg” zone of the Lockport Dolomite, the formation where gas was released when drilling the offset well (Permit 2-1946). The “Newburg” in the English No.1 is approximately 3350 feet deep. The level of cement in the English No.1 Well indicates that most of the cement went into the “Packer Shell” at about the same depth where bore hole problems were noted on October 26 with the logging tool and the production casing. The consultant for OVESC believes that these occurrences give evidence of natural fracturing of the “Packer Shell” in the English No.1 Well. Despite the fact that the cement behind the casing was insufficient by standard industry practice, OVESC proceeded with the completion of the well. On November 5, the well was perforated by Appalachian Well Surveys in the “Clinton” section from 3720-3740 feet with 56 shots. Approximately 80 feet of cement covered the “Clinton” above the top perforation. Following perforation, Producers Service Corporation performed an acid breakdown of the “Clinton” in accordance with standard industry practice. The formation broke down at 1450 psi and 250 gallons of acid and 7500 gallons of fluid were displaced into the formation. Nothing out of the ordinary was noted during this acid job and OVESC decided to proceed with the pre-engineered, full hydraulic fracture stimulation treatment.
On November 13, 2007, Producers Service Corporation was scheduled to hydraulically fracture (frac) the well with 105,000 gallons of water and 600 sacks of proppant sand. After displacement of approximately 46,700 gallons of water and 290 sacks of proppant sand, circulation of fluid from the 8 5/8 inch annulus was observed indicating communication between the “Clinton” and the annular space between the 8 5/8 inch surface and 4 ½ inch production casings. At that point, the pump pressure and fluid displacement rate were reduced and another 4000 gallons of fresh water was pumped to flush and recover the sand that had been displaced. The frac operation was then discontinued and the pumps shut down. OVESC personnel estimated a total of 20 barrels of fluid including one-to-three barrels of oil was circulated out of the annulus.
Over the next three days, the well was swabbed and most of the frac fluid that had been displaced into the well during the frac treatment was recovered. Pressure on the production casing appeared to be normal for a “Clinton” well and tubing was run in the well on the third day. At this point, the annulus was shut in while work proceeded to complete construction of the wellhead and tank battery in preparation for production.
Post-Completion History of the English No.1 Well
From November 17 to December 14, 2007 there was no reported construction activity at the English No.1 Well. OVESC recorded periodic pressure readings taken on the surface-production casing annulus.
REPORT ON THE BAINBRIDGE INVESTIGATIONPAGE 43
On November 14th, the first day after the frac job, the recorded pressure was 90 psi. On the second day, the pressure increased to 180 psi. On the third day, the pressure increased and stabilized at 320 psi. Gas was periodically blown off to reduce the pressure, but the annulus was closed when company personnel were not on site over the next 31 days (Figure 22).
Subsequent to the explosion, it was reported that on December 12 gas had been detected
in the water well at the Bainbridge police station. This well is 280 feet deep, draws water from the Berea and is approximately 4700 feet to the northeast of the English No.1 Well. During the investigation, the DMRM learned that on December 14, there were reports of natural gas perturbation, turbidity increases, and artesian flow in the water wells of some of the homes on English Drive. The pressure on the annulus of the English No.1 Well was recorded at 360 psi. Early on the morning of December 15, methane gas entered the basement of a home at 17975 English Drive and ignited causing an explosion that seriously damaged the house. The two residents were at home but not injured. Local fire officials, DMRM inspectors and OVESC personnel responded shortly after being alerted that there was a problem and began checking gas levels in surrounding homes and water wells. By the end of December 15, residents of 19 homes had been evacuated. Remedial Action Taken in Response to Gas Invasion of the Aquifers
On the morning of December 15, OVESC determined that the probable source of the gas in the annulus on the English No.1 was from the “Newburg” member of the Lockport Dolomite. “Newburg” gas has a distinctive smell that was consistent with the odor noticed coming from the annulus. Remedial action called for cementing off the “Newburg” which would prevent the gas from entering the well bore. Water was pumped down the production casing to kill the “Clinton” gas and the tubing was removed from the well. The casing was then perforated from 3600-3602 feet with 9 shots and 800 sacks of cement were squeezed through these perforations to shut off the “Newburg” gas. Calculated fill up based on the volumetric amount of cement used should have returned the cement to surface. This did not occur but the job was successful in killing approximately “95-98%” of the gas in the annulus and the presence of “sour” smelling “Newburg” gas was no longer detected. DMRM oil and gas well inspectors witnessed this remedial phase. The annulus was not closed after this operation and the well was monitored by OVESC personnel.
On December 17, 2007, the annulus was still producing minor amounts of gas that was “not sour”. A second Appalachian Well Surveys cement bond log was run indicating that the squeeze had filled the annulus with cement to 2656’ significantly above the “Newburg” zone (Figure 23). A temperature log was also run that indicated several possible gas zones in the Ohio Shale in the uncemented portion of the annulus. To eliminate the remaining gas in the annulus, a second cement squeeze job was performed. The well was perforated with 9 shots from 2628-2630’ and another 800 sacks of cement were squeezed through these perforations. This second squeeze cement job returned 41 barrels of cement to the surface.
On December 19, it was reported that there was a “very minor flow” of gas in the
cemented surface-production casing annulus. A third Appalachian Well Surveys bond log was
REPORT ON THE BAINBRIDGE INVESTIGATIONPAGE 44

run. This log indicated there was possible gas channeling in the cement at 330’ which could account for the continued presence of gas in the annulus (Figure 24).
On March 3, 2008, following the recommendation of DMRM, OVESC had a Baker-Hughes Segmented Bond Log run in the well. This log showed what appears to be channeling in the cement from about 550 feet to surface. Below that level there appears to be good to excellent bond between the production casing and well bore. This would confirm that the deep high-pressure gas from the “Newburg” or other sources has been isolated from the surface-production casing annulus.
DMRM has determined that the gas still present in the annulus is near-surface low-pressure gas emanating from natural fractures in the Ohio Shale. In northeastern Ohio, it is common for small volumes of low-pressure shale gas to accumulate in the surface-production casing of oil and gas wells. Conclusions about the Cause of the Gas Invasion of the Aquifers
The DMRM has determined that accumulation and confinement of deep, high-pressure gas in the surface-production casing annulus of the English No.1 Well, between November 13 and December 15, resulted in over-pressurization of the annulus. This over-pressurized condition resulted in invasion of natural gas from the annulus of the well into natural fractures in the bedrock below the base of the cemented surface casing. This gas migrated vertically through fractures into the overlying aquifers and discharged through local water wells. Three successive events in the drilling and completion of the English No.1 Well are believed to be the primary contributing factors that led to the gas invasion of the shallow aquifers and subsequent explosion in the house on English Drive.
The first contributing factor was inadequate cementing of the production casing prior to remedial cementing on December 15. The industry standard for cementing production casing calls for sufficient cement to fill the annulus between the well bore and the casing 600-800 feet above the “Clinton”. At this height, the “Newburg” zone, which can be gas and/or brine bearing, is effectively sealed from the well bore and presents no further problem in completing the well. 175 sacks of Unitropic cement was ordered and run for the primary cement job for the English No.1. Theoretically, this amount should have provided more than enough fill up to cover and seal the “Newburg” at 3350 feet. However, the bond log run on November 1 indicates the top of cement was only at 3640 feet, the level of the “Packer Shell” and approximately 300 feet below the “Newburg”. It appears from the record that the “Packer Shell” in the English No.1 Well is naturally fractured to the extent that it “thieved” most of the cement that was pumped into the well. The result was that the borehole was exposed to high pressure gas from the “Newburg” and any other deep source of gas.
The second contributing factor was the decision to proceed with stimulating the well without addressing the issue of the minimal cement behind the production casing. Hydraulic fracture stimulation normally involves injecting fluids and sand into the oil and gas reservoir to enhance the flow of hydrocarbons to the well bore. When a well is properly constructed, the hydraulic fracture is confined between the permitted reservoir formation and the production casing. The abnormal circulation that was observed during the stimulation of the English No.1
REPORT ON THE BAINBRIDGE INVESTIGATIONPAGE 45

well indicates that the frac communicated directly with the well bore and was not confined within the “Clinton” reservoir. This communication could also have provided a conduit for “Clinton” gas to enter the annulus of the well.
While the out-of-zone hydraulic fracturing operation may have provided an avenue for “Clinton” gas to migrate up the surface-production casing annulus, the DMRM has concluded that it is highly unlikely that fluids used in the hydraulic fracturing process, or flow back fluids, escaped from the borehole or entered into local aquifers.
Based upon consideration of all records and available information, the DMRM has
determined that the valves on the surface production casing annulus remained open before, during, and after the hydraulic fracturing operation in accordance with standard industry practice. Producers Services Corp. and OVESC appropriately terminated the hydraulic fracturing operation as soon as fluids circulated to surface. Producers Services immediately reduced the pump rate and pressure, completed the sand flush, and shut the fracturing operation down. According to eyewitness accounts and job records, fluid circulation rates responded to pump rates, and when the pump shut down, annular flow stopped as soon as hydraulic equilibrium was attained, as expected.
Finally, the third and most critical contributing factor leading to the incident was the 31 day period after the fracturing stimulation of the Clinton formation during which the annular space between the surface and production casings was mostly shut in. This confined the deep, high-pressure gas from “Newburg” and/or “Clinton” within this restricted space. Readings taken and reported by OVESC during this shut in period were consistently 320 psi or greater. Typically, shallow shale gas does not register more than 30-60 psi on the annulus and can be closed in or vented without problem. Pressures of the order that were observed would indicate a deeper source of the gas present in the annulus. This was not recognized by OVESC personnel who opened the valve to blow off the pressure but continued to close the annulus valve when not on site. As pressure on the annulus built up, the gas migrated laterally and vertically through natural fractures in the surrounding bedrock. This over-pressurized gas infiltrated the local aquifers, discharged through local water wells, allowing gas to enter some area homes in varying concentrations, and resulting in the explosion at one home.
REPORT ON THE BAINBRIDGE INVESTIGATIONPAGE 46

ALTERNATIVE EXPLANATIONS
Introduction At approximately 7:30 AM, on December 15, 2007, a DMRM inspector received a call
from the Geauga County Emergency Management Agency (Geauga EMA). The Geauga EMA requested assistance with the investigation of an explosion in a house located at 17975 English Drive. Three DMRM inspectors met with Bainbridge Township Fire Chief Brian Phan, Assistant Chief Wayne Burge, and representatives from the Geauga EMA to discuss possible sources and extent of the natural gas problem.
DMRM staff began an immediate review of possible causes of the early morning explosion. Possible sources of explosive gases included 1) local oil and gas wells, 2) orphaned or plugged oil and gas wells, 3) the local natural gas distribution system, 4) explosive chemicals or gases on the premises, and 5) naturally occurring gases associated with shallow organic rich shale. While workers from Dominion East Ohio, the Bainbridge Fire Department, and DMRM continued to evaluate the extent and source of the explosive gas, other DMRM staff were researching files to better define possible sources of explosive gases. Sources of Explosive Gases
In an emergency situation such as this, the evaluation of possible sources is time critical. The review focuses on the most likely source but must consider the possibility of multiple sources. While early on December 15, the DMRM considered the English No.1 Well to be the most likely source, other sources were evaluated as possible contributors. The following summaries are provided as a review of the explosive gas source reviews on December 15, 2007. Explosive Gases or Chemicals on the Premises
Explosive materials on a location must be considered as a source of material leading to an explosion. Examples of such materials include propane tanks, gasoline, heating fuel oils, solvents, etc. These sources were ruled out very early as the teams monitoring for explosive gases reported highly variable, but relatively widespread, gas readings throughout the neighborhood.
The location of the initial gas readings was further evidence that these materials were not
a likely source of the explosive material. Natural gas was being detected in multiple domestic water wells and in some cases in water supplies inside homes. Unfortunately, with the source of the explosive material not yet identified, and the potential for additional explosions unknown, the teams either did not record the readings or at best were inconsistent when data was recorded.
Local Natural Gas Distribution System
Representatives from Dominion East Ohio were present and assisted with the initial monitoring. Failures in this natural gas delivery system have the potential to lead to an explosion. The tubulars or piping is typically buried at least several feet deep. These systems do occasionally leak. Gas detectors are used to locate leaks by monitoring natural gas levels evolving from the soil. During winter months, especially if the ground is frozen, monitoring and isolating such a leak may prove more difficult. System leaks may also develop within a house.
REPORT ON THE BAINBRIDGE INVESTIGATIONPAGE 47
With all these factors being considered, it was apparent fairly early on December 15 that multiple leaks or failures of the Dominion East Ohio system were not the likely source of the gases being detected. There were no initial reports that leaks in the system were detected by the teams. In addition, gas was being detected in some water wells and water supplies inside some homes. Since natural gas is lighter than air, natural gas leaking from a distribution system would tend to rise toward the lands surface. It is highly unlikely that natural gas from this type of delivery system would migrate downward into groundwater and eventually exsolve or discharge from domestic water wells.
Shallow, Naturally Occurring Gases
The shale bedrock that underlies the Berea Sandstone, the deepest underground source of drinking water in this area, is organic rich and is known to contain hydrocarbons, in particular, natural gas. Water well drillers encounter shows of natural gas while drilling some local water wells. This often happens in areas where oil and gas wells have not been drilled. These natural gases are known to enter water wells and, occasionally, enter buildings through foundations. Sudden discharges of shale gas are sometimes associated with earthquakes.
Based on a review of records from the ODNR Division of Geological Survey’s seismic
network, there were no recorded seismic events on or immediately before December 15 that could account for widespread detection of natural gas. Although relatively small volumes of natural gas may be present in domestic water wells, the observed volumes of gas at some water wells on December 15, 2007 were highly unusual according to area residents.
Abandoned or Orphaned Oil and Gas Wells
Oil and gas wells are an obvious potential source of explosive gases. As DMRM inspectors initiated an investigation of possible explosive gas sources, they focused on existing oil and gas wells within a one-mile radius of the initial incident. While these site reviews were being conducted, a database and map search was being completed for possible orphan or plugged well locations. Plugged wells are evaluated because of the potential for leaks. Orphan wells are wells that are abandoned, but have never been plugged, or were plugged using inadequate methods. DMRM has an orphan well plugging fund to properly plug and abandon such wells. The database search did not indicate plugged or orphan wells in the immediate area. There are no records for oil and gas wells in Bainbridge Township prior to 1950. Because of the relatively recent history of oil and gas exploration and production activities, the DMRM ruled out the possibility that orphaned wells caused or contributed to the problem.
Producing Oil and Gas Wells
Beginning on December 15, 2007, DMRM inspectors began to inspect five oil and gas wells within one-mile of the home explosion to evaluate the pressure and volume of natural gas in the surface-production casing annuli. As a well is constructed, heavy steel casing is placed into the drilled hole and cemented in place. Casings begin with a relatively large diameter and with depth, telescope to smaller and smaller diameters. The open space between each casing is called an annulus. Throughout much of Ohio, the annular space between the 8-5/8 inch diameter surface casing and the 4-1/2 inch diameter production casing contains small volumes of low pressure gas, generally less than 60 psi. At low volumes and pressures, this gas is either safely confined within the annulus by the cemented surface casing or vents slowly to the atmosphere if
REPORT ON THE BAINBRIDGE INVESTIGATIONPAGE 48
the annular valve is open. If gas is present in the surface-production casing annulus at higher pressures and volumes, this can be indicative of a well construction problem that could require corrective action such as remedial cementing.
When DMRM inspectors arrived on location on December 15, 2007, the surface production casing valve on the English No.1 Well was open. DMRM inspectors observed little change in apparent pressure or rate of flow after approximately two hours of venting. Based upon personnel communications with OVESC personnel, it was determined that there was high-pressure gas (370 psi) in the annular space of the English No.1 Well prior to venting and remedial cementing that OVESC initiated later that day.
During the week of December 17th, DMRM inspectors worked with local operators, including Range Resources, Summit Petroleum, and Transcontinental to expose surface-production casing annular valves at the casing-heads and remove bull-plugs, if necessary. DMRM inspectors found that the surface-production casing annular valves were either open to atmosphere, or held very little apparent pressure when opened. With the exception of the English No.1 Well there was little, if any, gas flow from the annuli.
In January 2008, the DMRM required operators to install pressure gauges and pressure
relief valves on surface-production casing annular valves for one week to further evaluate annular gas pressures. DMRM inspectors monitored annular pressures daily. The following Table 13 lists the maximum annular pressure recorded for the five wells.
Table 13: Maximum Annular Pressure
Owner Lease Name Permit No. Annular Pressure (psi)
Range Resources, Inc. Campane No.1 480 0 Range Resources, Inc. Mayer-Campane 482 16 Summit Petroleum, Inc. Weber No.1 1811 26 Transcontinental Szumilak No.1 1946 5 Ohio Valley Energy English No.1 1983 52
To further evaluate annular pressures and fluid levels, on January 11, 2008, the DMRM
met with a representative of Transcontinental Oil and Gas, Inc. at the Szumilak No.1 oil and gas well (permit no. 1946) to conduct an echometer test. The surface casing/production casing annulus was opened on the oil and gas well and there was no gas pressure detected.
The DMRM representatives attached the Echometer to the wellhead and shot three
different echometer readings in an effort to determine the fluid level in the Szumilak No.1 oil and gas well. The echometer wellhead attachment was pressured up to 250 pounds per square inch (psi) with carbon dioxide and the shots were released and recorded on the chart paper. An evaluation of the echometer shots on the chart paper did not show a fluid level within the annulus of the Szumilak No.1 oil and gas well. This means either there is no remaining fluid within the annular space of the oil and gas well or the fluid level is too deep to be detected by the echometer pulse.
REPORT ON THE BAINBRIDGE INVESTIGATIONPAGE 49

Based upon annular pressure measurements, well inspections, and a review of well construction records, the DMRM determined that the wells owned by Range Resources, Transcontinental, and Summit Petroleum did not cause or contribute natural gas to aquifers in the investigation area.
REPORT ON THE BAINBRIDGE INVESTIGATIONPAGE 50

CORRECTIVE ACTION AND REMEDIAL CEMENTING OF THE ENGLISH NO.1 WELL
Remedial Cementing
On December 15, 2007, in response to a natural gas explosion in one home and gas pressurization in the water wells of other nearby homes, OVESC initiated remedial cementing of the surface-production casing annulus to seal deep, high-pressure gas-bearing zones in the un-cemented portion of the well above the “Clinton Sandstone”. The OVESC consultant concluded that the probable source of the gas in the annulus on the English No.1 was from the “Newburg” member of the Lockport Dolomite. Sometimes described as “sour gas”, gas from the “Newburg” has a distinctive odor consistent with the odor associated with the gas venting from the annulus. DMRM inspectors who were present also noted the distinctive odor of the gas. The purpose of the remedial cement job was to seal and isolate deep, high-pressure gas-bearing zones including the “Newburg” behind effectively cemented pipe. Water was pumped down the production casing to kill the “Clinton Sandstone” gas. The casing was then perforated at 3600-3602 feet below surface, and 800 sacks of 50/50 pozmix cement was squeezed through perforations to shut off the deep, high-pressure gas. The volume of cement used was sufficient to fill the annulus to surface; however, return circulation was not achieved. According to the OVESC consultant who witnessed the remedial cement operation, the job was successful in reducing approximately “95-98%” of the gas in the annulus, and the “Newburg” gas odor was no longer present. DMRM inspectors who witnessed the squeeze job noted that the annular gas flow initially stopped but resumed approximately ten minutes later at a reduced flow rate.
On December 17, 2007, the OVESC consultant observed that the annulus was “still gassing at a substantially reduced flow” and the gas was “not sour”. OVESC had Appalachian Well Surveys run another cement bond log indicating that the first squeeze filled the annulus to a height of 2,656 feet below surface. A temperature log was also run that indicated several possible gas zones in the Devonian Shale. OVESC made the decision to try to eliminate the remaining gas by performing a second squeeze. The production casing was perforated at a depth of 2628-2630 feet below surface and the second squeeze cement job using another 800 sacks of 50/50 pozmix returned 41 barrels of cement to the surface.
On December 19, 2007, the consultant for OVESC reported that there was a “very
minor flow” of gas venting from the cemented surface-production casing annulus. Another Appalachian Well Surveys cement bond log was run and it was stated by the OVESC consultant that there was a “probable micro-annulus visible on the log from 330’ to 198’”.
The DMRM and OVESC continued to monitor the English No.1 Well surface-production casing annulus subsequent to the second remedial cementing operation. The DMRM determined that the existing Cement Bond Logs were inadequate to render a final determination regarding the quality and effectiveness of the remedial cementing measures. On March 3, 2008, per DMRM recommendation, OVESC hired Baker-Hughes to run a Segmented Cement Bond Log.
The advantage of a segmented bond log is that it provides a 360 degree evaluation of the cement bond between the pipe and the well bore whereas the standard cement bond logs
REPORT ON THE BAINBRIDGE INVESTIGATIONPAGE 51
previously run evaluate cement bond quality in one direction only and provide a basis for approximating the depth to the top of the cement. Based upon a review by four DMRM geologists, the Segmented Cement Bond Log indicates good to excellent bond between the casing and well bore from 2360 feet to approximately 550 feet below surface. The Segmented Cement Bond Log confirms channeling in the cement from about 550 feet to surface. This Segmented Cement Bond Log also confirms that the deep, high-pressure gas has been isolated from the well. DMRM geologists believe that the gas still present in the surface-production casing annulus is near-surface gas emanating from the shale, or a mixture of low-pressure shale gas mixed with remnant gas from the November-December 2007 charging event. When open, the annulus serves as an avenue for gas to vent to atmosphere. The cemented surface casing protects the local aquifers from gas migrating through the channelized cement in the annulus between the surface and production casing strings. Conclusions Regarding the Current Condition of the English No.1 Well
Based upon this evaluation, the DMRM concludes the following:
1. The well-construction issues that existed between completion of the English No.1 Well in mid-November 2007 and December 15, 2007 that resulted in the over-pressurization of the un-cemented annulus and release of natural gas into local aquifers have been eliminated through the following corrective actions:
• Inadequate primary cementing of the production casing has been remedied with the subsequent squeeze cementing operations;
• The deep high-pressure gas zones that were the source of over-pressurization of the aquifers have been isolated and sealed from the well bore through the squeeze cementing procedures;
• The confinement of annular gas, which caused the build up of pressure, has been eliminated.
2. Remedial cementing operations completed by OVESC in mid-December, 2007 have effectively isolated and sealed deep, high-pressure gas bearing zones. As a result, natural gas from deep formations can no longer migrate up the surface-production casing annulus of the English No.1 Well and charge local aquifers.
3. The “Clinton Sandstone” and “Newburg” are effectively sealed behind cemented production casing.
4. Production of “Clinton Sandstone” gas through the cemented production casing does not pose a threat to local aquifers or public health and safety.
5. When the valve on the 8-4” annulus is open, low-pressure shallow gas from the shale sequence between 550 to 253 feet below surface (surface casing shoe) should continue to migrate to surface through channelized cement and vent to the atmosphere.
REPORT ON THE BAINBRIDGE INVESTIGATIONPAGE 52

RISK ASSESSMENT/NEW PERMIT CONDITIONS
Beginning on Monday, December 17th, 2007 the DMRM began to compile records to complete a risk analysis for the Bainbridge incident. Based upon a review of records and personal communications with on-site personnel the DMRM determined that confinement of deep, high-pressure gas in the surface-production casing annulus of the English No.1 Well prior to December 15 resulted in over-pressurization of the annulus. This over-pressurized condition resulted in invasion of natural gas from the annulus into fractures in the bedrock below the base of the cemented surface casing. This gas migrated vertically through fractures into the overlying aquifers and continues to slowly discharge through water wells. Three successive events in the drilling and completion of the English No.1 Well are believed to be the primary contributing factors that led to the gas invasion of the shallow aquifers and subsequent home explosion on English Drive. These factors are as follows:
1. Inadequate primary cement job The first contributing factor was inadequate cementing of the production casing prior to remedial cementing on December 15. The industry standard for cementing production casing calls for sufficient cement to fill the annulus between the well bore and the casing 600 – 800 feet above the “Clinton.” At this height, the “Newburg” zone, which can be gas and/or brine bearing, is effectively sealed from the well bore and presents no further problem in completing the well. 175 sacks of Unitropic cement was ordered and run for the primary cement job for the English No.1 Well. Theoretically, this amount should have provided more than enough fill up to cover and seal the “Newburg” at 3350 feet. However, the bond long run on November 1 indicates the top of cement was only at 3640 feet, the level of the “Packer Shell” and approximately 300 feet below the “Newburg.” It appears from the record that the “Packer Shell” in the English No.1 Well is naturally fractured to the extent that it “thieved” most of the cement that was pumped into the well. The result was that the borehole was exposed to high-pressure gas from the “Newburg” and any other deep-seated sources of gas.
2. Well stimulation with deficient primary cement job The second contributing factor was the decision to proceed with stimulating the well without addressing the issue of the minimal cement behind the production casing. Hydraulic fracture stimulation normally involves injecting fluids and sand into the oil and gas reservoir to enhance the flow of hydrocarbons to the well bore. When a well is properly constructed, the hydraulic fracture is confined between the permitted reservoir formation and the production casing. The abnormal circulation that was observed during the stimulation of the English No.1 Well indicates that the frac communicated directly with the well bore and was not confined within the “Clinton” reservoir. The communication could have provided a conduit for “Clinton” gas to enter the annulus of the well. While the out-of-zone hydraulic fracturing operation may have provided an avenue for “Clinton” gas to migrate up the surface-production casing annulus prior to completion of the first squeeze job on December 15, 2007, the DMRM has determined that that fluids used in the hydraulic fracturing process, did not enter into local aquifers. Components of hydro-fracture fluids were not detected in any of the 76 water wells tested as part of this investigation.
REPORT ON THE BAINBRIDGE INVESTIGATIONPAGE 53

3. Confinement of Deep, High-Pressure Gas in the Surface-Production Casing Annulus Finally, the third and most critical contributing factor leading to the incident was the 31-day period after the stimulation during which the annular space between the surface and production casings was mostly shut in. This confined the deep, high-pressure gas from “Newburg” and/or “Clinton” within this restricted space. Readings taken during this time were consistently 320 psi or greater. Typically, shallow gas does not register more than 30 – 60 psi on the annulus and can be closed in or vented without problem. Pressures of the order that were observed would indicate a deeper source of the gas present in the annulus. OVESC personnel opened the valve to blow off the pressure but continued to close the annulus when not on site. As pressure on the annulus built up, the gas migrated laterally and vertically through natural fractures in the surrounding bedrock. The over-pressurized gas infiltrated the local aquifers, discharged through local water wells, allowed gas to enter some area homes in varying concentrations, and resulted in the explosion at one home.
The DMRM recognizes that other factors played a secondary role in the incident including:
1. Local structural geology – The DMRM has concluded the localized faulting/fracturing in this area of Bainbridge Township resulted in gas accumulations in the driller’s “Big Lime,” and created conditions that partially “thieved” the primary cement job. [Opritza, S. in The Atlas of Major Appalachian Plays (1996) reports that local folding and faulting can influence the accumulation of gas in the Oriskany pinch out play.] The Atlas of Major Appalachian Gas Plays (1996) identifies eight, small structurally influenced gas plays in northeastern Ohio. Patchen in The Atlas of Major Appalachian Plays (1996) confirms the strong structural control on the occurrence of gas fields in the “Newburg” Dolomite. While natural gas was not identified in the Oriskany Sandstone in the English No.1 Well, the DMRM based its new permit conditions on a broad range of scenarios, not just causation factors present at the Bainbridge incident. OVESC prepared a casing cementing plan that was consistent with industry best-management practices. The local faulting/ in Bainbridge Township resulted in the unusual permeability in the “Packer Shell” that partially thieved the primary cement job, leaving overlying gas-bearing zone(s) unsealed.
2. Fluid drilling requirements – Drilling on fluid effectively restricted release of gas to atmosphere during the drilling operation. It appears that OVESC was unaware of deep gas bearing zones that were unsealed as a result of the primary cement job during drilling operations and completion. 3. No geophysical log – As a result of filter cake build-up, OVESC could not lower the logging tools to total depth. In addition, the density tool was defective. Ohio oil and gas law does not require a geophysical log and OVESC elected to complete the well without the benefit of a log record. (Had OVESC resolved these issues and run a geophysical log suite,
REPORT ON THE BAINBRIDGE INVESTIGATIONPAGE 54
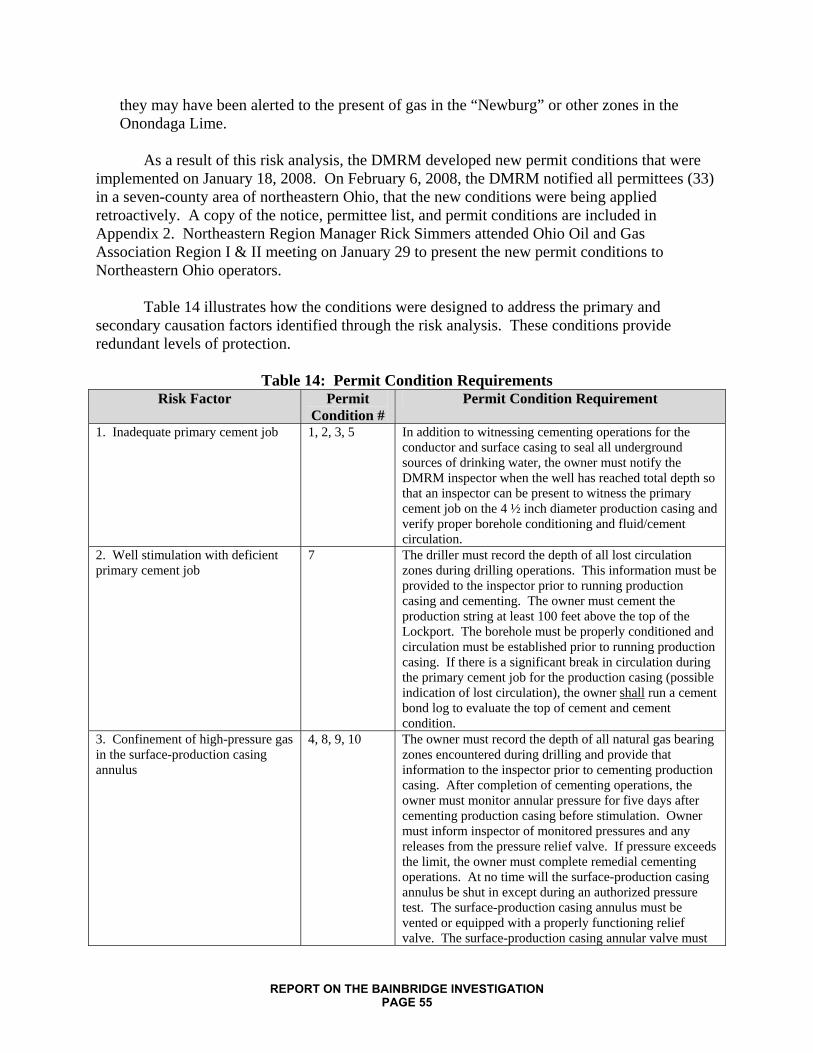
they may have been alerted to the present of gas in the “Newburg” or other zones in the Onondaga Lime.
As a result of this risk analysis, the DMRM developed new permit conditions that were
implemented on January 18, 2008. On February 6, 2008, the DMRM notified all permittees (33) in a seven-county area of northeastern Ohio, that the new conditions were being applied retroactively. A copy of the notice, permittee list, and permit conditions are included in Appendix 2. Northeastern Region Manager Rick Simmers attended Ohio Oil and Gas Association Region I & II meeting on January 29 to present the new permit conditions to Northeastern Ohio operators.
Table 14 illustrates how the conditions were designed to address the primary and
secondary causation factors identified through the risk analysis. These conditions provide redundant levels of protection.
Table 14: Permit Condition Requirements
Risk Factor Permit Condition #
Permit Condition Requirement
1. Inadequate primary cement job 1, 2, 3, 5 In addition to witnessing cementing operations for the conductor and surface casing to seal all underground sources of drinking water, the owner must notify the DMRM inspector when the well has reached total depth so that an inspector can be present to witness the primary cement job on the 4 ½ inch diameter production casing and verify proper borehole conditioning and fluid/cement circulation.
2. Well stimulation with deficient primary cement job
7 The driller must record the depth of all lost circulation zones during drilling operations. This information must be provided to the inspector prior to running production casing and cementing. The owner must cement the production string at least 100 feet above the top of the Lockport. The borehole must be properly conditioned and circulation must be established prior to running production casing. If there is a significant break in circulation during the primary cement job for the production casing (possible indication of lost circulation), the owner shall run a cement bond log to evaluate the top of cement and cement condition.
3. Confinement of high-pressure gas in the surface-production casing annulus
4, 8, 9, 10 The owner must record the depth of all natural gas bearing zones encountered during drilling and provide that information to the inspector prior to cementing production casing. After completion of cementing operations, the owner must monitor annular pressure for five days after cementing production casing before stimulation. Owner must inform inspector of monitored pressures and any releases from the pressure relief valve. If pressure exceeds the limit, the owner must complete remedial cementing operations. At no time will the surface-production casing annulus be shut in except during an authorized pressure test. The surface-production casing annulus must be vented or equipped with a properly functioning relief valve. The surface-production casing annular valve must
REPORT ON THE BAINBRIDGE INVESTIGATIONPAGE 55

be plumbed above grade for easy access. 4. Cement thief-zone related to localized structure
4 The geolograph and well completion report must include notation regarding all thief zones. The driller must inform the inspector of all thief zones prior to cementing production casing.
5. Gas detection inhibited by fluid drilling requirements
4, 6, 8, 9, 10 The operation must include notation of all oil and gas bearing zones encountered during drilling on the geolograph. The driller must inform the inspector prior to cementing production casing. Annular pressure monitoring is mandatory even if gas is not detected during drilling or post-drilling operations.
6. Gas detection inhibited by decision not to run logging tools
6 Geophysical logging is mandatory. Even if gas is not detected during fluid drilling operations, the owners must log the production-borehole with a suite of logging tools capable of identifying gas bearing zones. A copy of the log must be provided to the inspector prior to running production casing.
REPORT ON THE BAINBRIDGE INVESTIGATIONPAGE 56

WATER QUALITY
Ground-water samples were collected and analyzed for a range of parameters to evaluate potential impacts from oil and gas operations. For discussion, the parameters are grouped as represented in Table 15. The parameters include metals, non-metals and physical parameters, VOCs, frac related organic compounds, and dissolved gases.
Table 15: Water Quality Parameters
METALS Aluminum, Total Arsenic, Total Arsenic, Soluble Barium, Soluble –AA Barium, Total Bromide Iron, Soluble Iron, Total Magnesium, Total as Mg Magnesium (Mg), Total as CaCO3 Manganese, Total Potassium, Total Sodium, Total Strontium NON-METALS and PHYSICAL PARAMETERS Laboratory Ph Conductivity Alkalinity, Bicarbonate Alkalinity, Carbonate Alkalinity, Phenolphthalein Alkalinity, Hydroxide Solids, Total Dissolved Acidity Solids, Total Suspended Total Solids Chloride Sulfate As SO4 Calcium, Total as Ca Calcium, Total as aCO3 Hardness, Total (CaCO3) Nitrate Nitrite
VOCs Bromodichloromethane Bromoform Chloroform Dibromochloromethane (chlorodibromomethane) Benzene Bromobenzene N-Bromomethane Bromochloromethane Butylbenzene Sec-butylbenzene Tert-butylbenzene Carbon Tetrachloride Chlorobenzene Chloroethane Chloromethane 2-Chlorotoluene Dibromomethane 1,2-dichlorobenzene 1,3-dichlorobenzene 1,4-dichlorobenzene Dichlorodifluoromethane 1,1-dichloroethane 1,2-dichloroethane 1,1-dichloroethene Cis-1,2-dichloroethene Trans-1,2-dichloroethene Dichloromethane 1,2-dichloropropane 1,3-dichloropropane 2,2-dichloropropane 1,1-dichloropropene 1,3-dichloropropene Ethyl Benzene Hexachlorobutadiene 4-isopropyltoluene
Isopropultoluene Methyl-tert-butyl-ether Naphthalene Nitrobenzene N-propyl Benzene Styrene 1,1,1,2-tetrachloroethane 1,1,2,2-tetrachloroethane Toluene 1,1,1-trichloroethane Tetrachloroethene 1,2,3-trichlorobenzene 1,2,4-trichlorobenzene Trichloroethene 1,1,2-trichlorethane Trichlorofluoromethane 1,2,3-trichloropropane 1,2,4-trimethyl-benzene 1,3,5-trimethylbenzene Vinyl Chloride 1-chloro-2-methylbenzene 4-chlorotoluene HYDROFRACTURE RELATED ORGANIC COMPOUNDS Ethanol Ethylene Glycol Isopropyl Alcohol BACTERIALS E. Coli DISSOLVED GASES Methane Ethane N-Butane Isobutane
REPORT ON THE BAINBRIDGE INVESTIGATIONPAGE 57

This rather extensive list of parameters has been used as a whole to evaluate potential impacts to local ground-water resources. In the pages that follow, certain parameters will be the topic of a specific review. Parameter reviews will focus on those parameters with specific Ohio EPA Primary Maximum Contaminant Levels (PMCL) or Secondary Maximum Contaminant Levels (SMCL) or parameters that may serve as potential indicators of oilfield impacts. Parameters that are not specifically reviewed were either not detected, did not exceed either PMCL or SMCL standards, or are common components of ground water, but have no affect on health or safety. However, these parameters are important in evaluating the overall water chemistry. Certain parameters may be used to evaluate the “type” or overall characteristics of ground water. Other parameters either singly or in combination, may be used to evaluate potential contaminant sources or pathways. Many of the parameters are used to evaluate the relative accuracy of the analytical laboratory results.
Water samples were collected in the investigation area on a number of dates. Some water supplies had multiple chemical analyses, although not necessarily the same complete list of parameters. Furthermore, as part of the comprehensive water-sampling event in late February and March 2008, grab samples were collected by DMRM, OVESC’s contractor, and Coshocton Environmental Testing Laboratory representing the law firm of Thrasher, Dinsmore and Dolen. Most of the parameters analyzed in the two grab samples provide two sets of data for review. During the evaluation of this data, quality control checks were reviewed and outlier data points were scrutinized. For discussion and evaluation purposes, higher parameter values were used to establish parameter concentration ranges for comparison with Ohio EPA PMCL and SMCL standards. For the total chemistry of a given water supply, the higher (less conservative) parameter concentrations were reviewed, regardless of source (DMRM; OVESC). By selecting the higher of the two reported concentrations provided by the laboratories, the following discussion provides a worst-case scenario for evaluation of potential impacts.
It is not uncommon for Ohio EPA SMCL or PMCL standards to have an exceedence even without an outside contaminant source. Further, water chemistry is dynamic. Water samples collected from a given water supply on separate occasions are likely to have some variation in water chemistry. Many factors, such as aquifer recharge, well use, well construction, well maintenance history, the condition of the water well, and local variations in geology may affect the types and concentrations of materials in a water supply.
Background water quality information is also critical in the evaluation of any water supply. DMRM has conducted a thorough review of available background water data. This background data is very useful in evaluating trends. Most water supplies within the Bainbridge investigation area do not have water analyses predating local oil and gas activities. The DMRM evaluated water quality impacts by comparing water quality data for samples collected prior to December 2007, with water quality data for samples collected after the gas invasion event.
Control water sampling sites were selected to assist in this evaluation. These sites were
selected for a number of reasons. Most control points had somewhat complete water analyses that predate certain oil and gas activity. All control points are also believed to be outside of the impacted area. Comparisons of past water analyses with current water analyses provides a relative review of chemistry changes over time. Control points also prove useful in establishing
REPORT ON THE BAINBRIDGE INVESTIGATIONPAGE 58

certain baseline information. Discussions and reviews are based on total versus dissolved parameter concentrations. Ohio EPA MCL standards are based on total concentrations.
Natural gas is relatively common in ground water, but may be introduced from oil and gas operation or other sources. Monitoring of water wells and other point sources for explosive gas concentrations, or LEL’s, is another useful tool in the overall evaluation. This too has limits. Most water sources are not monitored for explosive gases, therefore natural gas background data for individual supplies are usually not available. Field observations and measurements are sometimes the most effective tool in the final review.
The parameter groups selected for this investigation were chosen to answer the following questions:
1. Is there evidence that oilfield brine contaminated or polluted public or private water
supplies within the investigation area? 2. Is there evidence that crude oil contaminated or polluted public or private water supplies
within the investigation area? 3. Is there evidence that chemical associated with hydrofracture operations contaminated or
polluted public or private water supplies within the investigation area? 4. Is there evidence that natural gas has affected public or private water supplies in the
investigation area? 5. Are concentrations of dissolved natural gas in public or private water supplies sufficient
to present an ongoing safety hazard or concern for residents within the investigation area?
6. Is there evidence that natural gas migrating through the aquifers has altered inorganic ground-water quality causing contamination or pollution of public or private water supplies within the investigation area?
Ground water is considered “contaminated” when measured concentrations of induced
chemical parameters of interest exceed “background” levels or ranges. Ground water is considered “polluted” when measured concentrations of induced chemical parameters of interest exceed “background” levels or ranges and exceed health-based concentrations prescribed by regulation. Ground water is considered “affected” where measured concentrations of induced chemical parameters of interest exceed background levels, or range, but there are no specific maximum concentrations or action levels specified by regulation. Metals Most metals found in ground water are commonly referred as trace metals. When present, trace metals generally occur at very low concentrations. There are exceptions however. Iron may be present in concentrations much greater than other trace metals. Trace metal concentrations may vary as a result of anthropogenic actions or natural processes. Sources of background metals data are discussed in the section on Background Water Quality. The Bainbridge investigation also included 79 sampling sites, six of which were used as control points. This data is also referenced in the section on Background Water Quality. Evaluations and discussions of trace metals reference total metal values.
REPORT ON THE BAINBRIDGE INVESTIGATIONPAGE 59
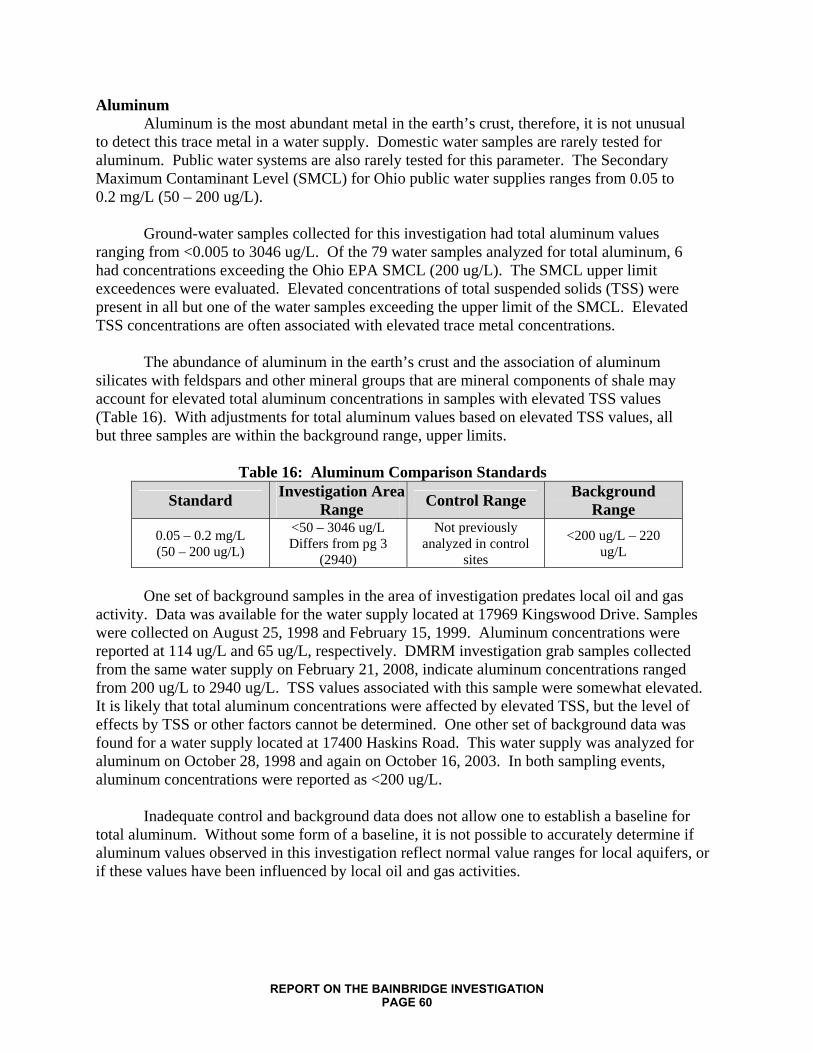
Aluminum Aluminum is the most abundant metal in the earth’s crust, therefore, it is not unusual to detect this trace metal in a water supply. Domestic water samples are rarely tested for aluminum. Public water systems are also rarely tested for this parameter. The Secondary Maximum Contaminant Level (SMCL) for Ohio public water supplies ranges from 0.05 to 0.2 mg/L (50 – 200 ug/L). Ground-water samples collected for this investigation had total aluminum values ranging from <0.005 to 3046 ug/L. Of the 79 water samples analyzed for total aluminum, 6 had concentrations exceeding the Ohio EPA SMCL (200 ug/L). The SMCL upper limit exceedences were evaluated. Elevated concentrations of total suspended solids (TSS) were present in all but one of the water samples exceeding the upper limit of the SMCL. Elevated TSS concentrations are often associated with elevated trace metal concentrations. The abundance of aluminum in the earth’s crust and the association of aluminum silicates with feldspars and other mineral groups that are mineral components of shale may account for elevated total aluminum concentrations in samples with elevated TSS values (Table 16). With adjustments for total aluminum values based on elevated TSS values, all but three samples are within the background range, upper limits.
Table 16: Aluminum Comparison Standards
Standard Investigation Area Range Control Range Background
Range 0.05 – 0.2 mg/L (50 – 200 ug/L)
<50 – 3046 ug/L Differs from pg 3
(2940)
Not previously analyzed in control
sites
<200 ug/L – 220 ug/L
One set of background samples in the area of investigation predates local oil and gas activity. Data was available for the water supply located at 17969 Kingswood Drive. Samples were collected on August 25, 1998 and February 15, 1999. Aluminum concentrations were reported at 114 ug/L and 65 ug/L, respectively. DMRM investigation grab samples collected from the same water supply on February 21, 2008, indicate aluminum concentrations ranged from 200 ug/L to 2940 ug/L. TSS values associated with this sample were somewhat elevated. It is likely that total aluminum concentrations were affected by elevated TSS, but the level of effects by TSS or other factors cannot be determined. One other set of background data was found for a water supply located at 17400 Haskins Road. This water supply was analyzed for aluminum on October 28, 1998 and again on October 16, 2003. In both sampling events, aluminum concentrations were reported as <200 ug/L. Inadequate control and background data does not allow one to establish a baseline for total aluminum. Without some form of a baseline, it is not possible to accurately determine if aluminum values observed in this investigation reflect normal value ranges for local aquifers, or if these values have been influenced by local oil and gas activities.
REPORT ON THE BAINBRIDGE INVESTIGATIONPAGE 60

Arsenic Arsenic is a common element in the earth’s crust. It complexes to form both inorganic and organic compounds. Ohio EPA has established a public drinking water standard of 0.010 mg/L (10 ug/L). Primary Maximum Contaminant Level (PMCL) is a health-based standard. Total arsenic was detected in 10 of the 79 samples collected. Nine of the samples were well below the PMCL. Concentrations in the nine samples ranged from 0.002 to 0.005 mg/l (2 – 5 ug/L). One sample collected at 17839 English Drive had an arsenic concentration at the PMCL of 0.010 mg/L (10 ug/L). This water supply also had total iron concentrations ranging from 103.5 mg/L to 235 mg/L in grab samples. The extremely high iron concentrations are believed to be associated with turbid water conditions. Although the water well was pumped for at least 20 minutes prior to sampling, the water sample was iron stained and turbid at the time of collection. Dissolved methane and ethane concentrations were reported to be less than their respective method detection limits. LEL monitoring data indicates natural gas was detected in one of four monitoring events. The LEL values for this event indicate the highest measurement was detected at a concentration of 1.1% at a hot water tap. The water supply was re-sampled on May 12, 2008. The water system was pumped until the water ran clear, then a sample was collected. Iron concentrations in the untreated water were reported at 11.8 mg/L. Water collected after flowing through an in-home treatment system had an iron concentration of 0.062 mg/L. Arsenic concentrations in the untreated follow-up sample were reported to be below method detection limits. Analytical results from resampling of this water supply indicate the elevated total iron and total arsenic concentrations are associated with solid phase constituents in the original sample. Research suggests the most important sources of arsenic in ground water are pyrite and iron oxides (Smeadley and Kinniburg, 2002). Although arsenic does appear to be present in the aquifer matrix, it does not appear to be present in the ground water itself. Table 17 includes background, control, and Bainbridge investigation area arsenic ranges.
Table 17: Arsenic Comparison Standards
Standard Investigation Area Range Control Range Background
Range 10 ug/L <0.002 – 10.0 ug/L <2 ug/L where tested <0.05 ug/L – 24 ug/L
The limited background data suggests arsenic is not commonly found in ground water
supplies, but when present it is typically below the OEPA PMCL. On occasion, individual supplies may exceed standards. Other than with public water supplies, arsenic is rarely tested. A sample collected for this investigation on February 22, 2008, at 8353 Bainbridge Road, had a reported arsenic concentration of 3.0 ug/L. This is a public water supply and was tested for arsenic from January, 2003 to present. A sample collected on January 14, 2003 had a reported arsenic concentration of 24 ug/L. The water supply was resampled on June 24, 2003. The arsenic concentration was reported at 7.0 ug/L. Six additional samples were collected between July 8, 2003 and July 18, 2003. Arsenic concentrations ranged from 5 to 8 ug/L for those sampling events. From September 21, 2004 to January 10, 2007, four samples were collected with reported arsenic concentrations <2.0 ug/L in each event. This public water supply well was
REPORT ON THE BAINBRIDGE INVESTIGATIONPAGE 61

developed in the Berea Sandstone and was also known to have encountered natural gas. The presence of natural gas is episodic. Higher arsenic concentrations in this well may be associated with the presence of natural gas. It may also be argued that naturally reducing conditions within the aquifer were transformed into a mildly reducing environment shortly after this water well was drilled. With time, natural gasses originally encountered in this well dissipated. With the reduction in measurable gas, arsenic concentrations were reduced to less than the method detection limit. Public water supply samples collected at 17419 Snyder Road, 17425 Snyder Road, and 9500 Bainbridge Road in 1999 and 2004 indicate arsenic concentrations ranging from 4 to 6 ug/L. A sample collected from a public water supply at 17400 Haskins Road on October 16, 2003 had a reported arsenic concentration of 14.2 ug/L. Samples collected from three public water supply wells at Lake Lucerne in 1999 and 2003, had reported arsenic concentrations from 2 – 3 ug/L. One of the Lake Lucerne water supplies is known to have natural gas present.
The background data from public water supplies demonstrates the variability of arsenic concentrations in local ground water. It also demonstrates that the presence of arsenic is not directly correlated with the presence of natural gas. Although it is possible to release arsenic into ground water under strongly reducing conditions, it is unlikely arsenic has been released by methanogenic processes in these wells. Natural gas has not been reported in a majority of the background water supplies. Therefore some other mechanism is likely responsible for the presence of arsenic in local ground-water supplies.
Evaluations of arsenic during this investigation were compared with background data.
The relative percentage of water supplies containing arsenic were similar. Arsenic values obtained during this investigation have a reported range of concentrations that lie well within the range of concentrations for background data. Even with an outlier data correction for the background data, the concentration relationships are maintained. The data suggest that total arsenic is present in Geauga County ground water, but the presence of arsenic cannot be reliably predicted. With few exceptions, the concentrations of arsenic would be expected to be well below Ohio EPA PMCL’s.
The presence or concentration of total arsenic cannot be predicted with reasonable
certainty. Arsenic is a poor indicator of impacts from an oil and gas operation. Arsenic values obtained through investigation water sampling efforts do not by themselves indicate ground-water supplies have been impacted by oilfield operations.
Barium
Barium is a naturally occurring trace metal. The mineral barite (BaSO4 ) can be used as a weighting agent in drilling muds. DMRM has verified that barium containing products were not used on the English No.1 Well location. Water tests required by Urban Drilling Regulations include this trace metal as a screening parameter. Barium was detected in most of the 79 water samples. Concentrations ranged from <100 ug/L to 2.5 mg/L. Ohio EPA has established a PMCL of 2.0 mg/L for barium. Table 18 includes background, control, and Bainbridge investigation water quality ranges for barium.
REPORT ON THE BAINBRIDGE INVESTIGATIONPAGE 62

Table 18: Barium Comparison Standards
Standard Investigation Area Range Control Range Background
Range
(200 ug/L) <50 ug/l – 2500 ug/L <100 ug/L – 300 ug/L <10 ug/L- 1400 ug/L
One water sample collected at 17970 Kingswood Drive had a barium concentration that exceeded the Ohio EPA PMCL. The highest DMRM analytical results reflect a soluble barium concentration of 2431 ug/L. BioSolutions reported a total barium concentration of 2500 ug/L. Data from the two labs are consistent. A comparison of the barium result with other data for this water supply indicates the value is accurate. This Ohio EPA PMCL exceedence was compared with data from control and background information. Background data for barium ranges from <10 ug/L to 1400 ug/L. Control data for this investigation ranged from <100 ug/L to 300 ug/L. A comparison of these data sets must take into consideration widely ranging method lower reporting limits. Certain data had method reporting limits as low as 10 ug/L while other method reporting limits were as high as 300 ug/L. Neither background or control data reflect Ohio EPA PMCL exceedences. Although this water supply does exceed Ohio EPA PMCL standards, the value appears to be an exception in the investigation area and the area in general. If this barium value is considered as an outlier value, barium concentrations for water supplies within the investigation area are below Ohio EPA PMCL’s and are very similar to ranges for background data. The elevated total barium concentration associated with the water supply at 17970 Kingswood Drive seems to be related to chemical composition of the aquifer. Other water supplies in close proximity to this water supply have slightly elevated total barium concentrations. Parameters that may be associated with oilfield brines are not elevated in concentration. The dissolved methane concentration was 0.02 mg/L. The highest LEL reading at the tap was 0.1%. There is no apparent correlation between barium and natural gas concentrations. Barium data would suggest there are localized variations in aquifer matrix chemistry that affect water chemistry. This barium PMCL exceedence cannot be correlated to oilfield activities. Iron Iron is a very abundant metal in many ground water aquifers. Iron may enter a water supply through a number of processes affecting minerals in sediments or rocks or components of the water system itself. The specific form iron takes is affected by water chemistry and may vary with physical or chemical changes to the system. Ohio EPA has established an SMCL of 0.3 mg/L for iron. Iron values ranged widely in the Bainbridge sampling events. Table 19 compares background, control, and Bainbridge investigation water quality ranges for iron.
REPORT ON THE BAINBRIDGE INVESTIGATIONPAGE 63

Table 19: Iron Comparison Standards
Standard Investigation Area Range Control Range Background
Range
300 ug/L < 20 – 234,500 ug/L 40 – 1930 ug/L < 20 - 5100 ug/L
Approximately 55 percent of water samples analyzed for total iron exceeded the Ohio EPA SMCL. This is about 6 percent less than the percentage of exceedences reported by Jagucki (2001). Percentage values are comparable, but the range of values associated with this investigation far exceed the background data. The highest total iron concentration was 234.5 mg/L. This sample result was discussed in the review of the arsenic data. Several other samples had total iron concentrations outside of the background range. Water samples collected at 7916 Scotland Drive, 7989 and 8010 Bainbridge Road, 17860 English Drive, and 17926 Kingswood Drive had total iron concentrations of 830ug/L, 60.1 ug/L, 20.42 ug/L, 25.54 ug/L, and 11.8 ug/L respectively. Total iron values for 3 of 5 samples are suspected to be elevated as indicated by elevated TSS concentrations. Arsenic was not detected in any of the five samples, so resampling for data verification was not initiated. As would be expected, concentrations of manganese are elevated in each water supply. The sample collected at 17926 Kingswood Drive does differ from other water samples in several ways. The sodium concentration is elevated to the point that the water is classified as sodium-calcium bicarbonate type water. The other waters are classified as calcium-magnesium bicarbonate. The pH of the other four supplies ranged from 6.1 – 6.4 S.U. Although it is believed all four water supplies are developed in the shale aquifer, there appears to be a strong influence from the Sharon sandstone. Historic surface mining of the Sharon sandstone, within or near the investigation area, may contribute to the overall oxic conditions. Elevated sodium concentrations appear to be from anthropogenic sources. Data suggests processes including road salting and water softener regeneration brines are contributing to an overall degradation of water quality. These effects are most prominent along the lower portion of English Drive, much of Scotland Drive, the lower limits of Kingswood Drive near Kenston Lake Drive, and at sampling locations at or near Bainbridge Road. A private pond on English Drive had elevated sodium and chloride concentrations at values very similar to ground-water samples in the immediate area. The total iron concentrations closely parallel background iron ranges. At least six water supplies have total iron concentrations far exceeding Ohio EPA SMCL’s and lie well outside of the background range. These water supplies reflect elevated concentrations as a result of elevated TSS concentrations. Further, oxidizing conditions appear to be influenced by historic surface mining operations. High iron concentrations cannot be correlated with dissolved methane concentrations. The overall water analyses do not seem to indicate total iron concentrations have increased as a result of oil and gas activities. Manganese
Like iron, manganese is fairly common in water supplies. Approximately 41 percent of
REPORT ON THE BAINBRIDGE INVESTIGATIONPAGE 64

the investigation area analytical results exceeded the Ohio EPA SMCL of 50 ug/L. Three of these water supplies had reported total manganese concentrations exceeding the background range upper limit. A sample collected at 17839 English Drive was discussed in the arsenic section. Samples collected at 7989 Bainbridge Road and 7916 Scotland Drive had total manganese concentrations of 2850 and 2305 ug/L, respectively.
Both these water supplies have elevated total manganese concentrations, but the waters
are very different in composition. The water from 7989 Bainbridge Road is a sodium-chloride type water while the water from 7916 Scotland is a calcium-bicarbonate type. The former seems to be affected by salt from anthropogenic sources, most likely in the form of road salt or water softener regenerating brine.
The latter is unusual in that calcium is the dominant cation. Both supplies have low pH,
elevated sulfate, and elevated iron. They are developed as predominantly shale wells. Pyrite and/or iron oxides are the likely source for these elevated values.
Table 20 compares background, control, and Bainbridge investigation area water quality
ranges for manganese. Table 20: Manganese Comparison Standards
Standard Investigation Area Range Control Range Background
Range
50 ug/L <10 – 2850 ug/L <10 – 92 ug/L <10 – 1150 ug/L
Non Metals and Physical Parameters Chloride Chloride concentrations in ground water may vary greatly. Chlorides are a natural component of many ground waters, but are often introduced through anthropogenic processes. Sources of chlorides may include certain minerals within sedimentary rocks, natural connate waters or brines, water softener regeneration brines, road salting, and brine produced by oil and gas explorations or production operations. Chlorides are a major constituent of oilfield brines and chloride containing fluids are routinely used or encountered during the drilling of oil and gas wells. Chloride has an Ohio EPA SMCL of 250 mg/L. Table 21 compares chloride value ranges for the Bainbridge investigation area, control sites, and background locations.
Table 21: Chloride Comparison Standards
Standard Investigation Area Range Control Range Background
Range
250 mg/L 2 – 532 mg/L 10 – 158 ug/L 1.2 – 240 mg/L
REPORT ON THE BAINBRIDGE INVESTIGATIONPAGE 65

Of the 79 samples collected for this investigation, two exceeded the Ohio EPA SMCL. Reported chloride exceedences were associated with water supplies at 17820 English Drive and 7989 Bainbridge Road. Chloride concentrations were 532 and 389 mg/L respectively. Bromide was detected in the water sample at 17820 English Drive. The presence of bromide allows contaminant sources to be indicated using a binary mixing curve for the chloride to bromide (Cl:Br) ratios. Data was plotted on a 1999 Geauga County Binary Mixing Curve (Jagucki, 2001). Plot information suggests this water supply is being affected by either domestic sewage and/or halite with possible influence from septic leachate and water softener regeneration brine. The likely source of elevated chloride in this water supply is from halite used for road de-icing. When outlier values are removed from each set of data, the range of values for chloride are very similar. Background data ranges from 1.2 – 240 mg/L while investigation area data ranges from 2 – 235 mg/L. Water samples collected at 7989 Bainbridge Road have chloride concentrations ranging from 360 – 389 mg/L. Bromide was not detected. This water supply has a low pH and very elevated iron and manganese. Sodium levels suggest sodium adsorption in clay particles. Dissolved methane and ethane were not detected. This water supply appears to be affected by road salt and is influenced by oxic conditions, possibly associated with historic mining of the Sharon sandstone. Both water supplies show evidence of anthropogenic effects. If these values are considered as outlier data, chloride values for the investigation lie within the range of values reported for background data. Chloride values exceeding 100 mg/L were also reviewed even though the values are below the Ohio EPA SMCL standard. Eight water analyses exceeded this limit. Six of the water supplies are clustered on the south end of English Drive with one supply on Scotland Drive and one on Bainbridge Road. This grouping of homes includes some of the water supplies closest to the English No.1 Well. Chloride: Bromide ratios for the Scotland Drive and Bainbridge Road samples plotted very close to the water sample collected from 17820 English Drive. The ratios do not indicate an oilfield impact, but do suggest an impact from road salt or water softener regeneration brines. OVESC collected ground water and surface water samples at 18019 English Drive prior to drilling of the English No.1 Well. Water well grab samples were collected for this water supply on February 19, 2008. Parameter values for the pre and post drilling water well samples are generally comparable, except chloride values were increased according to reports from one laboratory, but essentially unchanged by reports from a second laboratory. The lower reported value is indicated as being more accurate based on ionic balances with limited parameter availability. With this assumption, no significant changes are observed between samples collected prior to the drilling of the English No.1 Well and samples collected on February 19, 2008. Further, a comparison of the water samples collected from the pond and water well reflects common differences between surface and ground water.
A majority of ions analyzed have somewhat lower concentrations in the surface water. This is as would be expected. Surface waters generally have less contact time with minerals that
REPORT ON THE BAINBRIDGE INVESTIGATIONPAGE 66

may contribute to the overall chemistry of water. Sodium and potassium levels are slightly elevated relative to the ground-water sample.
Sodium levels, and to some degree potassium levels, are often elevated in surface waters
when anthropogenic processes contribute to soluble salt concentrations. In this case, if road salt or water softener regeneration brine have contributed to the overall concentrations of sodium and chloride, sodium concentrations would be elevated in the surface water because sodium adsorption on clays would be minimal due to surface area and residence time factors. Data suggest the concentrations of chloride on the south end of English Drive are elevated by road salt and/or water softener regeneration brines.
Sulfate Sulfate compounds contain sulfur and oxygen. These compounds may be derived from certain minerals, including pyrite. When conditions are right, sulfur reducing bacteria may oxidize sulfate compounds. Oxygen is removed and hydrogen sulfide gas may be produced. Ohio EPA has established a SMCL of 250 mg/L for sulfates. A review of the analytical results shows the concentration of sulfates vary widely in this area. Table 22 compares ranges of sulfate concentrations with control and background samples.
Table 22: Sulfate Comparison Standards
Standard Investigation Area Range Control Range Background
Range
250 mg/L <2 – 61.8 mg/L 11-90 mg/L <2-80 mg/L
Sulfate values are with a range that is expected for the area and aquifer types. Dissolved Gases Ground water commonly contains a variety of dissolved gases. Often times dissolved gases go unnoticed. The presence of natural gas in water is dependent on a number of factors. In the Bainbridge area, the Devonian shales that underlie the Berea Sandstone are known to bear natural gas.
Reports of natural gas are described in water well completion reports and are sometimes noted in drilling reports from oil and gas operations. Personal communications with area water well drillers provide further accounts of the widespread nature of shallow natural gas. The Background Water Quality section provides a discussion on the occurrence of natural gas in the Devonian Shale sequence of southwestern Geauga County.
Natural gas in ground water is a common enough problem in Geauga County. Prior to this incident, DMRM staff met with representatives of the Geauga County Health District to review water well drilling procedures necessary to avoid or control shallow natural gas. This meeting was in response to natural gas in water well complaints referred to DMRM by the health district. Certain of the complaints were in areas where no oil and gas wells had been drilled. Improperly constructed water wells, like their larger oil and gas counterparts, may allow natural gas to migrate between aquifers. Natural faulting, fracturing, and jointing of aquifers
REPORT ON THE BAINBRIDGE INVESTIGATIONPAGE 67

affect recharge, but may also provide migration pathways for contaminants migrating from the surface or upward from deeper sources. Water wells developed in the Berea Sandstone may produce water with dissolved gas present or natural gas may exsolve before pumping. In the first case, gas may go unnoticed, or exsolve in the water system and be observed as sputtering, cloudy water, or as tiny bubbles on the side of a glass. In the second case, gas may exsolve from the water before pumping and may be measurable in the water well or well vent itself. In some cases both occur. As gas exsolves from water within the water well, or is released as a bubble from the aquifer, the gas rises to the surface. Over time, air within the water well casing is pushed out of the well. When an LEL measurement is taken, a range of readings up to 100% may occur. Further, the readings will change with time. If natural gas enters a water well quickly, the LEL value will likely remain high. If natural gas enters the well slowly, wind, water well pumping, and other actions will draw ambient air into the water well. Lower LEL readings would be expected.
Even affects such as wind at the time of LEL measurements may affect the readings. Variable readings are not uncommon. Vary shallow natural gas has been encountered in many counties of Northeast Ohio for many years. DMRM has had a number of shallow gas drilling conditions in place since at least 1985. These drilling conditions require oil and gas operators to drill and construct wells in a manner necessary to avoid cross-contamination of fresh water aquifers.
The abundance of natural gas at various depths in Geauga County, and the commingling or cross-contamination of aquifers through natural or man-made pathways (i.e. water wells or oil and gas wells), has the potential to cause impacts on underground sources of drinking water. Certain dissolved components of natural gas were evaluated in an attempt to define potential impacts to area water well.
These dissolved gases included methane, ethane, N-butane, and isobutene. Natural gas generally contains these compounds plus a fairly complex array of other compounds. Natural gas may be generated by thermogenic or microbial processes. Gases generated by thermogenic processes often have a more complex composition. Gases generated by microbial processes are often less complex and contain mostly simple hydrocarbons such as methane and ethane.
U.S. EPA has not established a Primary or Secondary Maximum Contaminant Standard for dissolved methane or other components of natural gas. According to the Agency for Toxic Substances and Disease Registry (ASTDR) ingestion of water containing natural gas does not pose a direct health hazard. However, using the water in the home can allow dissolved natural gas to exsolve, releasing natural gas into rooms where water is used. If natural gas is dissolved in sufficient concentrations, and sufficient volumes of water are discharged there are potential safety issues.
The Federal Office of Surface Mining Reclamation and Enforcement (OSMRE) has developed a technical standard with specific action levels to address methane dissolved in ground water associated with active or abandoned coal mines. In 2001, the OSMRE published
REPORT ON THE BAINBRIDGE INVESTIGATIONPAGE 68

the conclusions of the Methane Work Group, in part to provide guidance to regulatory personnel that assess hazard potential while conducting investigations of citizens complaints involving dissolved methane in ground water (Eltshlager, Dieringer et. al, 2001). Table 23 includes the recommended action levies for methane in water.
Table 23: Action Levels for Methane in Water Dissolved Methane Concentration mg/L Action
>28 mg/L A dissolved methane concentration greater than 28 mg/L indicates that potentially explosive or flammable quantities of the gas are being liberated in the well and/or may be liberated in confined areas of the home. This concentration of methane should result in immediate ventilation of the wellhead to the atmosphere. Additionally, methane concentration in excess of 28 mg/L may require further mitigation and modifications to the water supply system.
>10 mg/L but <28 mg/L When a dissolved methane concentration exceeds 10 mg/L, it should be viewed as a warning that gas is not only present but that the concentration may be increasing. Appropriate actions would be to warn the occupants. This warning should include information that the concentration of methane is above 10 mg/L, and that remediation may be prudent to reduce the methane concentration to less than 10 mg/L. Additionally, the warning should include a recommendation that ignition sources be removed from the immediate area.
<10 mg/L Levels of methane less than 10 mg/L require no immediate action. Periodic monitoring should be performed to verify that the gas concentration has not changed.
The highest dissolved methane concentration reported during this investigation was 1.04
mg/L. At this level, OSMRE recommends periodic monitoring to verify changes in gas concentration. The DMRM LEL monitoring program and the in-house gas detection systems have not identified significant changes in in-house gas concentrations throughout the eight-month monitoring period, to date. The highest indoor gas concentration reading in the investigation area was 0.8 % LEL. At this concentration, natural gas would have to increase over 125-fold to result in explosive conditions.
The water samples analyzed for dissolved gases did not indicate the presence of N-butane or isobutene. A total of 46 samples indicated the presence of dissolved methane. The highest recorded concentration of methane was 1.04 mg/L. Ethane was detected in a total of 12 samples, with a maximum reported value of 0.98 mg/L. Dissolved gases of this type are not commonly analyzed and monitoring for such gases rarely occurs. Background data for this area is not available, however reports of natural gas are included in Ohio EPA records for the Bainbridge Police Department water well and other public water supplies. In addition, the occurrence of natural gas in ground water for wells developed in the Berea-Bedford sequence is common in Geauga County. This finding is based upon interviews with local residents, water well drillers, and a review of records for the Bainbridge Police Department. Control samples also indicate the presence of certain dissolved natural gases including methane and ethane.
REPORT ON THE BAINBRIDGE INVESTIGATIONPAGE 69

The presence of dissolved methane and/or ethane alone may not be used as evidence of oil and gas effects. The lack of background data for natural gases and the fact that natural gas is present in some shallow aquifers in Geauga County makes interpretation of analytical data very difficult. Natural gas from the English No. 1 Well has charged one or more aquifers in the investigation area. Records and personnel communications demonstrate the presence of natural gas in certain public water supplies, at least one control site, and several domestic water wells within the investigation area prior to drilling of the English No. 1 Well. Shallow, naturally occurring gases present in these water supplies have not been characterized. Based on water well construction information, it is likely the gases originate in the Devonian shales. Gases from this formation are expected to be similar in composition to deeper gases. Furthermore, migration of gases through bedrock and ground-water aquifers tend to change the composition of the gases, much like water chemistry is subject to change.
Dissolved gas analyses must be interpreted carefully and in conjunction with all other available data. The presence of gas, including gases with more complex chemistry, cannot be used as a sole indicator of oil and gas activity impacts.
U.S. EPA has not established a Primary or Secondary Maximum Contaminant Standard for dissolved methane or other components of natural gas. According to the Agency for Toxic Substances and Disease Registry (ASTDR) ingestion of water containing natural gas does not pose a direct health hazard. However, using tap water in the home can allow dissolved natural gas to exsolve, releasing natural gas into rooms where water is used. If natural gas is dissolved in sufficient concentrations, and sufficient volumes of water are discharged there are potential safety issues.
The Federal Office of Surface Mining Reclamation and Enforcement (OSMRE) has developed a technical support with specific action levels to address methane dissolved in ground water associated with active or abandoned coal mines. In 2001, the OSMRE published the conclusions of the Methane Work Group, in part to provide guidance to regulatory personnel that assess hazard potential while conducting investigations of citizens complaints involving dissolved methane in ground water (Eltshlager, Dieringer, et. al 2001). Frac Related Organic Compounds
As a comprehensive ground-water sampling plan was being developed, drilling and frac related materials used on the English No.1 Well were reviewed. Certain compounds that were present as additives in the water used to frac the English No.1 Well were identified and selected for analysis, including Ethanol, Ethylene glycol, and Isopropyl alcohol. The relative volume of material used in frac jobs is very small. These compounds are also quite common in non-oilfield applications.
Ethylene glycol is a primary component of antifreeze, certain deicing agents, and brake fluids. Other industrial applications are also common. Ethanol, or ethyl alcohol and Isopropyl alcohol are distilled products commonly used as solvents or in association with surfactants. These chemicals also have domestic and commercial uses. The simple detection of one of these compounds does not indicate source.
REPORT ON THE BAINBRIDGE INVESTIGATIONPAGE 70

Water analyses were completed for these compounds. The compounds were not detected in any water supply. The analytical results, combined with other screening parameter results indicate frac related fluids did not charge the aquifer. Primary Volatile Organic Compounds (VOCs)
The USEPA and Ohio EPA analyze water samples for volatile organic compounds through a standardized VOC test. This VOC test is designed to screen for some 56 volatile organic chemicals. Twenty-one of the listed chemicals have USEPA PMCLs. The PMCL standards are included in Appendix 1, entitled “Public Drinking Water Standards for Ohio, Revised September 26, 2005.” Many of the chemicals on this list are manmade and are not associated with oilfield activities. Certain VOCs, such as benzene, ethylbenzene, and toluene have many possible sources, including certain crude oils and oilfield brines. The VOCs that may be associated with oilfield brines or crude oil have varying degrees of solubility in water. This solubility may cause the dispersion and transport of these constituents at a faster rate than a free product such as crude oil. This allows such chemicals to be used to screen for oilfield contaminants earlier than screening for the principal contaminant alone. Although some VOCs may have multiple potential sources, others are fairly indicative of a source. Four chemicals included on the VOC list, Bromodichloromethane, Chloroform, Dibromochloromethane, and Bromoform, are known as Trihalomethanes (THHM). When detected in ground water, these compounds are commonly associated with the chlorination or bacterial disinfection of a water well. The PMCL for THHM as an aggregate concentration of the four chemicals is 80 ug/L (0.080 mg/L).
A total of seven VOCs were identified or tentatively identified in five of the seventy-nine water supplies tested. A water sample collected at 17926 Kingswood Drive tested positive for Dibromochloromethane, Bromodichloromethane, and Chloroform (Trichloromethane). These compounds belong to the group of chemicals commonly referred as THHM. The total concentration of the chemicals was reported at 7.94 ug/L. This is well below the Ohio EPA PMCL of 80 ug/L. One of the water well disinfection byproducts was also detected in a water sample collected at 17820 English Drive. Chloroform (Trichloromethane) was reported at a concentration of 11.88 ug/L. This water supply also contained Dichloromethane (Methylene Chloride) at a reported concentration of 1.04 ug/L. This chemical was detected at a concentration well below the Ohio EPA PMCL of 5 ug/L. Dichloromethane is likely present as a common laboratory contaminant. The THHM chemicals are commonly referenced as water well disinfection byproducts.
A water sample collected at 17968 Kingswood Drive had a reported concentration of Toluene of 1.12 ug/L. A second grab sample collected during this water-sampling event had a reported concentration below the method detection limit. The Ohio EPA PMCL for Toluene is 1000 ug/L. Although Toluene has many potential sources, such as glues or solvents for PVC piping, it is associated with certain crude oil and oilfield brine. Even though the reported concentration was very low, an additional sample was collected on May 14, 2008. The laboratory test results indicate Toluene was below the method detection limit. Two of the three chemical analyses reported Toluene concentrations below the method detection limit. The third chemical analysis reported Toluene very close to the method detection limit. It is possible that
REPORT ON THE BAINBRIDGE INVESTIGATIONPAGE 71

Toluene was in this water supply at very low concentrations, but it is more likely the chemical was misidentified.
Chloromethane was detected in a water sample collected at 17990 English Drive. It was also reported in a water sample collected at 8353 Bainbridge Road. The reported concentrations were 9.36 and 6.68 ug/L, respectively. In both cases, the chemical was not detected by a second laboratory analyzing grab samples collected during the same sampling event. The reporting laboratory noted that the “Chloromethane result may be a false positive due to interference by an unknown compound that the mass spec is identifying as propylene oxide or methyl-propane.” Similarly, Chloroethane was reported in the water sample from 8353 Bainbridge Road. One laboratory reported a concentration of 0.72 ug/L, while the second laboratory reported results below the method detection limit. The two water supplies were re-sampled on May 14, 2008. The laboratory had to raise the method detection limit for Chloromethane due to interferences. The laboratory report showed that none of the previously detected chemicals were detected in the May 14, 2008 samples. The analytical data would suggest the chemicals were misidentified due to lower range interferences.
The VOC data does not indicate volatile, soluble organic compounds associated with crude oil or oilfield brine have impacted local ground-water aquifers. Conclusions
Over the course of this investigation, many sources of data were reviewed before reaching a conclusion of impacts resulting from surface casing over-pressurization at the OVESC, English No.1 Well. Initially, explosive gas meters were used to define an area of immediate impact for safety purposes. The initial explosive gas monitoring was continued and is referenced as LEL monitoring. Water samples were collected and analyzed for a range of parameters. Early samples were designed as reconnaissance measures in an attempt to define impacts and the aerial extent of the problem. This was followed by a comprehensive water-sampling event that included at least 79 water supplies. Nearly 10,000 lines of analytical data were collected and reviewed. The analytical data was used to evaluate oilfield impacts to the ground-water system from natural gas, crude oil, deep formation brines, and hydraulic fracture related fluids.
As the various sources of data were gathered and reviewed, correlations between data were determined, where possible. Each set of data has certain value and certain limitations. The initial explosive gas monitoring established a baseline for safety, but is very limited in differentiating between naturally occurring gases and deeper, higher pressure gases that charged the aquifers. LEL monitoring is useful as a safety screening tool and may provide some information to differentiate natural gas sources. LEL data is also a somewhat effective tool for the evaluation of the effectiveness of water well pumping events to reduce hydrostatic pressures. The data has value in determining the potential migration of charged natural gas within the aquifers. LEL data is also limited in that it does not distinguish gas sources and without controls data may appear variable or random. Pumping of individual water wells has the potential to affect aquifer properties, which in turn have the potential to affect LEL readings.
REPORT ON THE BAINBRIDGE INVESTIGATIONPAGE 72

Water analyses are used to evaluate aquifer and individual water well chemistry. The water sample analytical results are compared to a variety of data sets including background and control-site analyses. The most useful comparison is a direct comparison of water well chemical data with historic chemical data from the same well. Unfortunately, for most private water supplies historic water samples do not exist. In the few instances were this data was found, the historic chemical analyses were very limited in scope. Background data is gathered from as many sources as possible in order to draw comparisons with data collected during the investigation. Background well or water characteristics have value. Field observations often times provide the most direct evidence of an impact. Even direct observations must be used carefully. An observed impact, such as turbid or cloudy water, may have a number of plausible explanations. DMRM has made every effort to approach this investigation in a fair and unbiased manner. A comprehensive approach to identify all possible information and evaluate this information using proper scientific methods was maintained throughout the course of this investigation. As a result of this comprehensive investigation and the data referenced in this report, DMRM has made the following determinations as official findings of fact.
1. The OVESC, English No.1 Well was originally constructed in such a manner as to allow the over-pressurization of the surface casing/production casing annulus. This over-pressurization ultimately caused local ground-water aquifers to become charged with natural gas originating in deep hydrocarbon reservoirs.
2. The DMRM has identified 23 water wells (22 private and one public supply) that were affected (disrupted) by gas invasion from the English No.1 Well. The magnitude and longevity of the affectment vary significantly. Natural gas affectment persists to this date in some of the wells and appears to have dissipated in others.
3. The highest concentration of dissolved methane found in the 79 water wells was 1.04 mg/L. At this concentration OSMRE guidelines state that no immediate action is necessary; rather, periodic monitoring should be performed to verify that gas concentrations are not changing.
4. The highest indoor LEL reading recorded during nine months of in-home monitoring
was 0.8 percent of the LEL. At this level, the concentration of natural gas would need to increase 125-fold to result in an explosive atmosphere in a confined area.
5. During the first nine-month monitoring period, there has not been a single incident in which the alarm of a wall-mounted natural gas detector has been triggered at any of the 49 monitored residences. Wall mounted gas detection systems are programmed to trigger an alarm at 10 percent of the LEL.
6. Based upon review of water quality data, the DMRM has determined that ground water has not been contaminated, polluted, or affected by oilfield brine.
REPORT ON THE BAINBRIDGE INVESTIGATIONPAGE 73
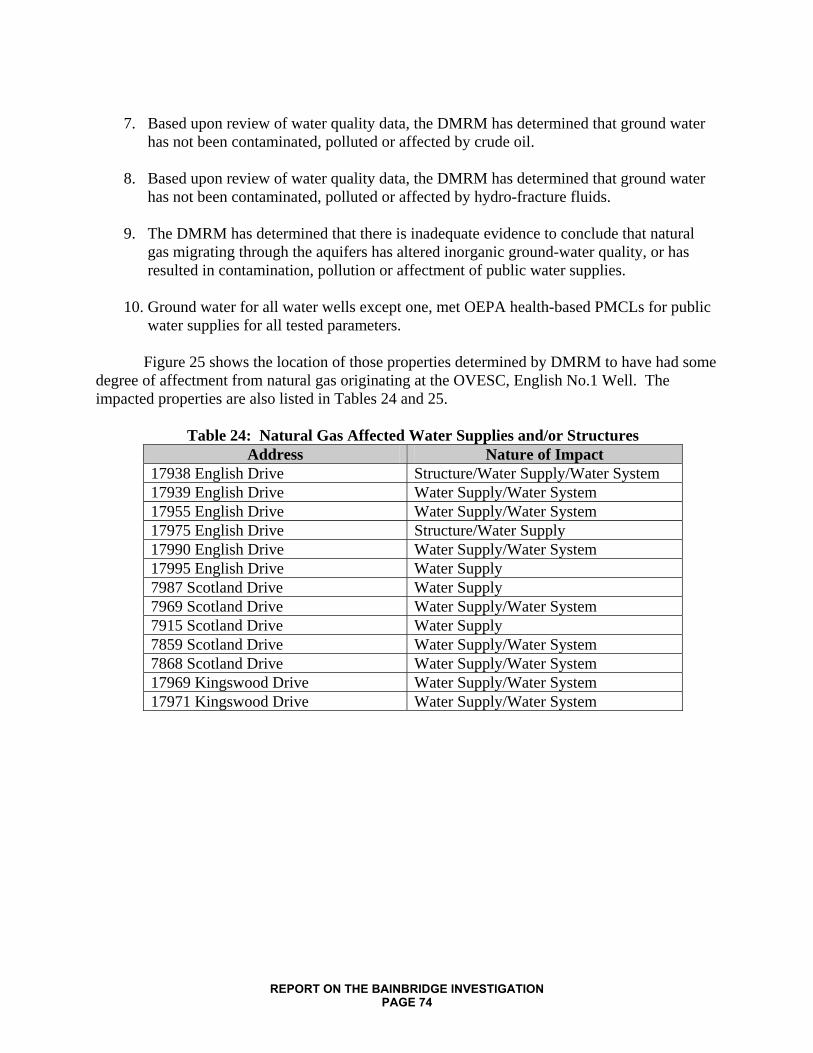
7. Based upon review of water quality data, the DMRM has determined that ground water
has not been contaminated, polluted or affected by crude oil.
8. Based upon review of water quality data, the DMRM has determined that ground water has not been contaminated, polluted or affected by hydro-fracture fluids.
9. The DMRM has determined that there is inadequate evidence to conclude that natural gas migrating through the aquifers has altered inorganic ground-water quality, or has resulted in contamination, pollution or affectment of public water supplies.
10. Ground water for all water wells except one, met OEPA health-based PMCLs for public water supplies for all tested parameters.
Figure 25 shows the location of those properties determined by DMRM to have had some degree of affectment from natural gas originating at the OVESC, English No.1 Well. The impacted properties are also listed in Tables 24 and 25.
Table 24: Natural Gas Affected Water Supplies and/or Structures Address Nature of Impact
17938 English Drive Structure/Water Supply/Water System 17939 English Drive Water Supply/Water System 17955 English Drive Water Supply/Water System 17975 English Drive Structure/Water Supply 17990 English Drive Water Supply/Water System 17995 English Drive Water Supply 7987 Scotland Drive Water Supply 7969 Scotland Drive Water Supply/Water System 7915 Scotland Drive Water Supply 7859 Scotland Drive Water Supply/Water System 7868 Scotland Drive Water Supply/Water System 17969 Kingswood Drive Water Supply/Water System 17971 Kingswood Drive Water Supply/Water System
REPORT ON THE BAINBRIDGE INVESTIGATIONPAGE 74

Table 25: Probable Natural Gas Affected Water Supplies and/or Structures Address Nature of Impact
17954 English Drive Water Supply 7955 Scotland Drive Water Supply 7941 Scotland Drive Water Supply 7927 Scotland Drive Water Supply 7846 Scotland Drive Water Supply 17926 Kingswood Drive Water Supply/Water System 17927 Kingswood Drive Water Supply/Water System 17936 Kingswood Drive Water Supply 17937 Kingswood Drive Water Supply 8353 Bainbridge Road Water Supply
REPORT ON THE BAINBRIDGE INVESTIGATIONPAGE 75
NEXT STEPS AND RECOMMENDATIONS
DMRM will remain involved monitoring the homes and aquifers associated with this investigation in Bainbridge Township until the affects of the natural gas charged aquifers are resolved. The charged natural gas may be present at varying levels for some time. Although the overall trend indicates the charged natural gas is dissipating, there may be lingering affects for a length of time that cannot be accurately estimated. DMRM will modify the LEL monitoring plan based on LEL trends. LEL monitoring locations will be selected in a manner that focuses on those water supplies that have higher LEL readings. Homeowners will be contacted as monitoring locations and schedules are revised. Additional water sampling will also be scheduled. The DMRM will use water sample analytical data from our previous efforts to establish this follow-up water-sampling program. Future sampling event(s) will focus on water supplies that were affected by the charged natural gas and will include water supplies developed in a variety of aquifers. Sample parameter lists will be modified. DMRM will assist all homeowners who wish to reconnect to existing water wells. For all residents that wish to reconnect to their domestic water supplies, OVESC will contract the services of a licensed water well contractor who will clean, re-develop, and disinfect wells in accordance with requirements established by the Ohio Department of Health. For those homes with a continued affect, other options will be reviewed with homeowners on a case-by-case basis. Options may include, but are not limited to one or more of the following:
• potential connection to a public water supply; • installation of a natural gas removal system in an existing water well; • modification of an existing water well; • drilling of a new water well, if feasible; • cleaning and disinfection of an existing water well, supply lines, and associated
equipment; • installation of in-line treatment equipment, if feasible.
Affected homeowners will be contacted by DMRM to review these and other options. Should you have any questions or comments, please address them in writing, or by e-mail, to Marlene Hall with the DMRM’s Uniontown Office. Mail: ODNR/DMRM 3575 Forest Lake Drive, Suite 150 Uniontown, Ohio 44685 E-Mail: [email protected]
REPORT ON THE BAINBRIDGE INVESTIGATIONPAGE 76

SUMMARY OF PUBLIC COMMUNICATIONS
The Bainbridge investigation presented unique communication challenges primarily due to the number of residents within the “investigation area,” the number of public records request, and the number and frequency of inquiries requiring written response. While working to complete the investigation the DMRM endeavored to keep citizens and local officials informed in the following ways:
1. Personal communication during natural gas monitoring events; 2. Communication through local media; 3. Public meetings; 4. Distribution of FAQs; 5. Update letters; 6. News releases; 7. Report chapter releases; 8. Response to e-mails and citizen phone calls; 9. Response to public records requests; 10. Meetings with local government officials; 11. Distribution of the final report.
The following is a chronological summary of key communication efforts following the
initial complaint received on Saturday, December 15, 2007. Copies of key communications are included in Appendix 3. 12/15/2007 DMRM field staff provided contact information to Emergency Responders with the Bainbridge Township Fire Department. 12/17/2007 Beginning the week of 12/17/2007, DMRM inspectors and geologists were in Bainbridge Township daily for weeks, then several days each week, often times
on Sunday, to answer questions while monitoring gas concentrations. 12/18/2007 DMRM Deputy Chief Kell contacted the Bainbridge Township Trustees and provided contact information for Oil and Gas Program administrators responsible for coordinating the investigation. (Deputy Chief Kell, Northeast Region Administrator Simmers) 1/18/2008 ODNR News Release
• Announced new protective permit conditions to prevent annular over- pressurization
• Stated that OVE’s remedial cementing prevented further migration of gas into the local aquifer
• Announced ongoing efforts to purge water wells/aquifers 1/29/2008 Letter to local affected residents
• Announced completion of preliminary investigation • English No.1 Well identified as the source
REPORT ON THE BAINBRIDGE INVESTIGATIONPAGE 77
• Stated DMRM’s conclusion that source of natural gas had been eliminated • Pledged continued monitoring to further evaluate success of corrective action
(remedial cementing) • Stated DMRM’s belief that gas was diminishing • Promised full report when water well testing was complete • Provided Water Sampling, Analysis and Monitoring Plan • Discussed methane in water wells and recommendation for
venting/continuous monitoring 1/30/2008 DMRM meeting with Senator Grendell/Bainbridge Township Trustees
• Presented conclusions on causation • Discussed new permit conditions • Requested input on DMRM’s role at the forthcoming public meeting
scheduled for February 7, 2008 2/7/2008 Bainbridge public meeting
• Presentations regarding cause (annular over-pressurization), corrective actions (remedial cementing), next steps in the investigation
• Presented the following summary regarding causation: “In conclusion, the DMRM believes that periodic confinement of deep-formation gases in the surface-production annulus of the English No.1 Well resulted in annular over pressurization and the escape of gas from the annulus into fractures in the surrounding bedrock. The DMRM has evaluated other oil and gas wells within one-mile of the incident and has not found evidence of other contributing sources to date. Since completion of remedial cementing operations at the English No.1 Well, measured concentrations of methane in local water wells have generally declined.
Contributing factors:
1. Inadequate identification of gas-occurrence in formations above the Clinton Sandstone
a. Fluid drilling b. Surmise that drilling fluid mud cake adjacent to fractured zone
prevented OVE’s contractor from getting logging tools to total depth
c. Log tool malfunction d. Decision to complete the well rather than wait on functional
logging tools 2. Fractured zones thieved the production casing cement resulting in
farless fill up than planned. 3. Deep formation (high pressure – 370 psi) gas was not constrained by
the initial cement job, entered the well annulus, and created the over-pressurized conditions (several viable explanations)
4. Annular gas was confined rather than vented or flared. • Geauga County Health District officials answered questions regarding
coliform bacteria
REPORT ON THE BAINBRIDGE INVESTIGATIONPAGE 78

• Provided information regarding forthcoming sampling event • Responded to citizen questions • Provided DMRM contact names/numbers
2/15/2008 Water Sampling Flier
• Announced plans to implement extensive ground-water sampling program beginning on February 19, 2008
• Assured residents that lab reports would be free of charge • DMRM geologists would be available to explain results • Provided DMRM contact information (directed e-mail and phone inquiries to
the DMRM Uniontown office) 2/29/2008 Letter from Deputy Chief Kell, including Coliform Bacteria FAQ
• Water sampling update • Coliform Bacteria FAQ with references • Provided contact names/numbers for State and local Health Dept. officials • Again, directed citizen questions to DMRM Uniontown office
3/14/2008 Letter from Deputy Chief Kell, including Natural Gas FAQ
• Includes explanation of monitoring methods • Meaning of results • Action levels • Safe ventilation and safety recommendations • Again, provided DMRM Uniontown office contact information and references
3/25/2008 Record of Natural Gas Monitoring
• Started use of new form to record gas monitoring results – left with resident after each monitoring event
4/1/2008 North Region Administrator Rick Simmers meeting with Bainbridge Township President Matthew Lynch
• Answered questions regarding investigation • Offered to provide regular update regarding investigation progress (via phone,
e-mail, hard-copy, or through personal meeting) 4/7/2008 Letter from Chief Husted
• Directed Bainbridge officials to continue routing inquiries through the DMRM Uniontown office
• Directed public records requests through Administrative Assistant Marissa Priest
• Pledged the North Region Administrator Rick Simmers would provide a weekly update through Bainbridge Township Zoning Inspector Mike Joyce
4/21/2008 Letter
• Announced continued general decline in gas concentrations
REPORT ON THE BAINBRIDGE INVESTIGATIONPAGE 79

• Announced that Biosolutions had completed analyses • Stated that DMRM would distribute lab reports ASAP after we receive copies • Again, provided DMRM Uniontown office contact information • Corrected misinformation about our sampling program presented at most
recent meeting of Township Trustees (we are testing for soluble components of crude oil)
4/25/2008 Letter from Deputy Chief Kell and Report on the Current Construction of the
English No.1 Well• Dispelled rumors that the English No.1 Well continues to charge local aquifers
with gas • Presents DMRM expert consensus position on current risks • Announced no final decision on fate of the well • Again, provided DMRM Uniontown office contact information
5/1/2008 Release of Water Quality Reports (80+) with cover letter
• Provided DMRM Uniontown office contact information 5/13/2008 Release of Final Findings Regarding Causation
• Confirmed conclusions that confinement of natural gas in the surface-production casing annulus at the English No.1 Well was the cause of the problem
5/21/2008 Letter from Deputy Chief Kell to Bainbridge Township Trustees
• Addressed questions regarding possible future drilling operations in vicinity of the Tanglewood Community public water supply
• Described extensive permit conditions imposed on potential drilling operations
• Offered to address questions in writing 6/9/2008 Public meeting with Bainbridge Township Trustees
• Informed residents regarding forthcoming resumption of oil and gas drilling operation(s) in Bainbridge Township
• Explained that proposed wells were not in the Source Water Protection Area of the Tanglewood Community Public Water System
• Explained purpose of permit conditions designed to protect fresh ground-water resources
• Provided an update on the status of the investigation 8/2008 Letters to selected residents regarding water well disinfection, cleaning, and water well reconnection process including FAQ prepared by ODH 9/1/08 Final Report Announcement Web Posting of Report
REPORT ON THE BAINBRIDGE INVESTIGATIONPAGE 80

REFERENCES Aller, Linda and Bellow, Karen, 1995, “Ground Water Pollution Potential of Geauga County,
Ohio”, Ohio Department of Natural Resources. Division of Water, Ground-Water Resources Section. Geodesy Inc. Report No. 12
“The Atlas of Major Appalachian Gas Plays”, 1996, West Virginia Geological and Economic
Survey, Roen, J.B. and B.J. Walker Baker, B. B., Wallrabenstein, L. K., Richards, R. P., and Creamer, N. L., 1989, “Nitrate and
pesticides in private wells of Ohio, a state atlas”, Tiffin, Ohio, Water Quality Laboratory, Heidelberg College (Part 2. County summaries), p. 97-100
Baranoski, M. T., 2002, “Structure Contour Map on the Pre-Cambrian Unconformity Surface in
Ohio and Related Basement Features”, Ohio Department of Natural Resources, Division of Geological Survey
Budavari, Susan, Editor, 1989, “The Merck Index and Encyclopedia of Chemicals, Drugs, and
Biologicals”, Merck & Co., Inc. Rahway, New Jersey, USA, Eleventh Edition Davis, S. N., Whittemore, D. O., and Fabryka-Martin, J., 1998, “Uses of chloride/bromide ratios
in studies of potable water”, Ground Water, v. 36, no. 2, p. 338-350 Driscoll, Ph.D., Fletcher G., 1986, “Groundwater and Wells”, Johnson Filtration Systems, Inc.,
St. Paul, Minnesota, Second Edition Eberts, S. M., Bair, E. S., and de Roche, J. T., 1990, “Geohydrology, ground-water quality, and
simulated ground-water flow”, Geauga County, Ohio, U. S. Geological Survey, Water-Resources Investigation Report 90-4026, 117p.
Eltschlager, Dieringer et al, 2001, “Technical Measures for the Investigation and Mitigation of
Fugitive Methane Hazards in Areas of Coal Mining”, U.S. Department of the Interior, Office of Surface Mining Reclamation and Enforcement, Pittsburgh, Pennsylvania
Fetter, C. W., 1980, “Applied Hydrogeology”, University of Wisconsin – Oshkosh. Charles E.
Merrill Publishing Company, Columbus Gray et al, 1982, “An Integrated Study of the Devonian-Age Black Shales in Eastern Ohio”, USDOE/ET/12131-1399 Gray et al, 1982, “Evaluation of Devonian Shale Potential in Ohio”, USDOE/METC-122 Harrison, S., 1983, “Evaluating System for Ground-water Contamination Hazards Due to Gas-
Well Drilling on the Glaciated Appalachian Plateau”, Ground Water, v. 21, no. 6, p. 689-700
REPORT ON THE BAINBRIDGE INVESTIGATION
PAGE 81

Hoover, K., 1960, “Devonian and Mississippian Shale Sequence in Ohio”, IC #27, ODNR, Division of Geological Survey
Jagucki, Martha L. and Darner, Robert A., 2001, “Ground-Water Quality in Geauga County,
Ohio – Review of Previous Studies, Status in 1999, and Comparison of 1986 and 1999 Data”, U.S. Department of the Interior, U.S. Geological Survey. Water-Resources Investigation Report 01-4160
Janssens, A. and deWitt, W., 1976, “Potential Natural Gas Resources in the Devonian Shales in
Ohio”, Geo Note #3, ODNR, Division of Geological Survey Jenkins, T. F., 1987, “The geology and groundwater resources of Chester Township”, Geauga
County, Ohio, Columbus, Ohio, AGW Consultants, Inc. 96 p. Jones, A. L., and Sroka, B. N., 1997, “Effects of highway deicing chemicals on shallow
unconsolidated aquifers in Ohio”, interim report, 1988-1993, U. S. Geological Survey Water-Resources Investigations Report 97-4027, 139 p.
Knuth, M., Jackson, J. L., and Whittemore, D. O., 1990, “An integrated approach to identifying
the salinity source contaminating a ground-water supply”, Ground Water, v. 28, no. 2, p. 207-214
Nichols, V. E., 1980, “Ground-water levels and chemical quality in Geauga County, Ohio”,
1978, U. S. Geological Survey Water-Resources Investigation Report 80-28, 17 p. Ohio Environmental Protection Agency, 1984, 1994, 1996b, 2008, Ohio Environmental Protection Agency data available on the World Wide Web, at www.epa.state.oh.us/ddagw Schwietering, J.F., 1979, “Devonian Shales of Ohio and Their Eastern and Southern
Equivalents”, USDOE/METC/CR-79/2 Slucher, E. R. and Larson, G. E., 2002, “Reconnaissance Bedrock Geology of the South Russell,
Ohio, Quadrangle”, Digital Map Series BG-R, Ohio Department of Natural Resources, Division of Geological Survey
Smedley, P.L., and Kinniburgh, D. G., 2002, “A review of the source, behaviour and distribution
of arsenic in natural waters”, Applied Geochemistry 17, p. 517-568 Swinford, E. Mac; Schumacher, Gregory A.; Shrake, Douglas L.; Larson, Glenn E.; and Slucher,
Ernie R., (Updated on November 22, 2000), “Descriptions of Geologic Map Units – A Compendium to Accompany Division of Geological Survey Open-File Bedrock-Geology Maps”, Ohio Department of Natural Resources, Division of Geological Survey. Open File Report 98-1
REPORT ON THE BAINBRIDGE INVESTIGATION
PAGE 82

Thomas, Mary Ann, 2007, “The Association of Arsenic with Redox Conditions, Depth, and Ground-Water Age in the Glacial Aquifer System of the Northern United States”, U.S. Department of the Interior, U.S. Geological Survey. Scientific Investigation Report 2007-5036
Todd, David Keith, 1976, “Groundwater Hydrology”, John Wiley and Sons, New York. 2nd
Edition Totten, S. M., 1988, “Glacial Geology of Geauga County, Ohio”, Report of Investigation No.
140, Ohio Department of Natural Resources, Division of Geological Survey Walker, Alfred C., 1978, “Ground-Water Resources of Geauga County”, Ohio Department of
Natural Resources, Division of Water, Ground-Water Resources Section Walton, William C., 1970, “Groundwater Resource Evaluation”, McGraw-Hill Book Company,
New York Weast, Ph.D., Robert C., 1971, “CRC Handbook of Chemistry and Physics, A Ready-Reference
Book of Chemical and Physical Data”, The Chemical Rubber Co., Cleveland, Ohio. 51st Edition
Whittemore, D.O., 1988, “Bromide as a tracer in ground-water studies—Geochemistry and
analytical determination”, in National Water Well Association, Ground Water Geochemistry Conference, Denver, Colo., February 16-18, 1988, Proceedings: p. 339-359
REPORT ON THE BAINBRIDGE INVESTIGATION
PAGE 83
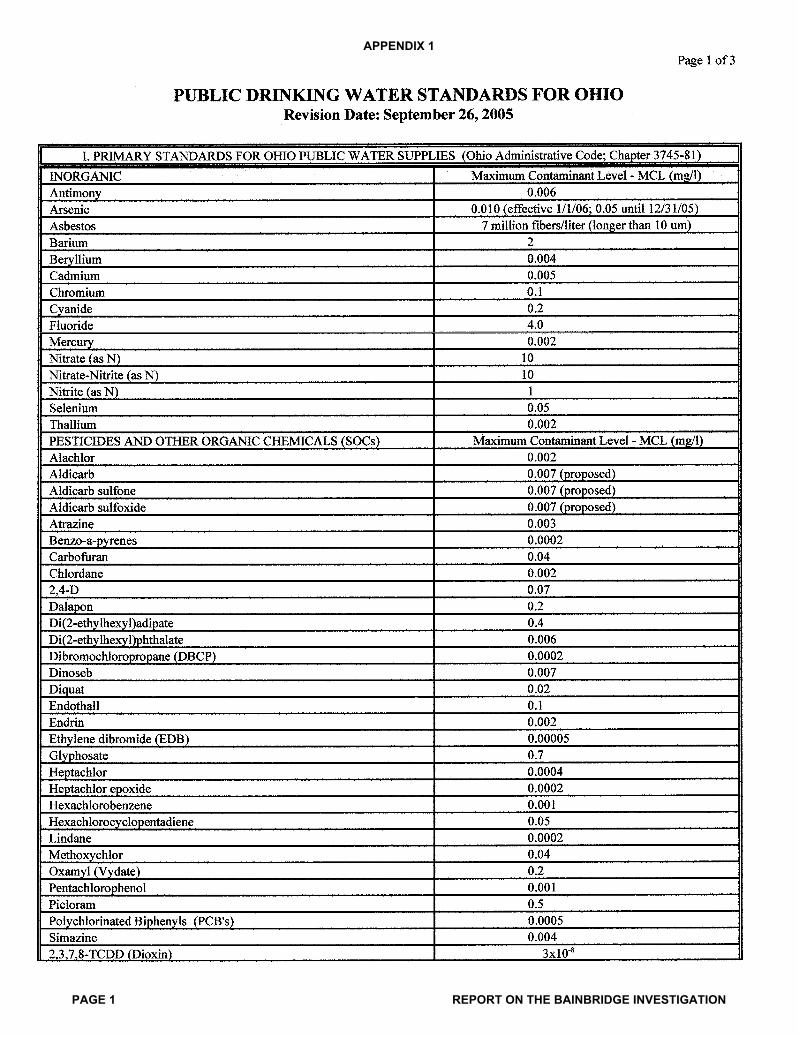
APPENDIX 1
PAGE 1 REPORT ON THE BAINBRIDGE INVESTIGATION

APPENDIX 1
PAGE 2 REPORT ON THE BAINBRIDGE INVESTIGATION

APPENDIX 1
PAGE 3 REPORT ON THE BAINBRIDGE INVESTIGATION

APPENDIX 2
PAGE 1 REPORT ON THE BAINBRIDGE INVESTIGATION
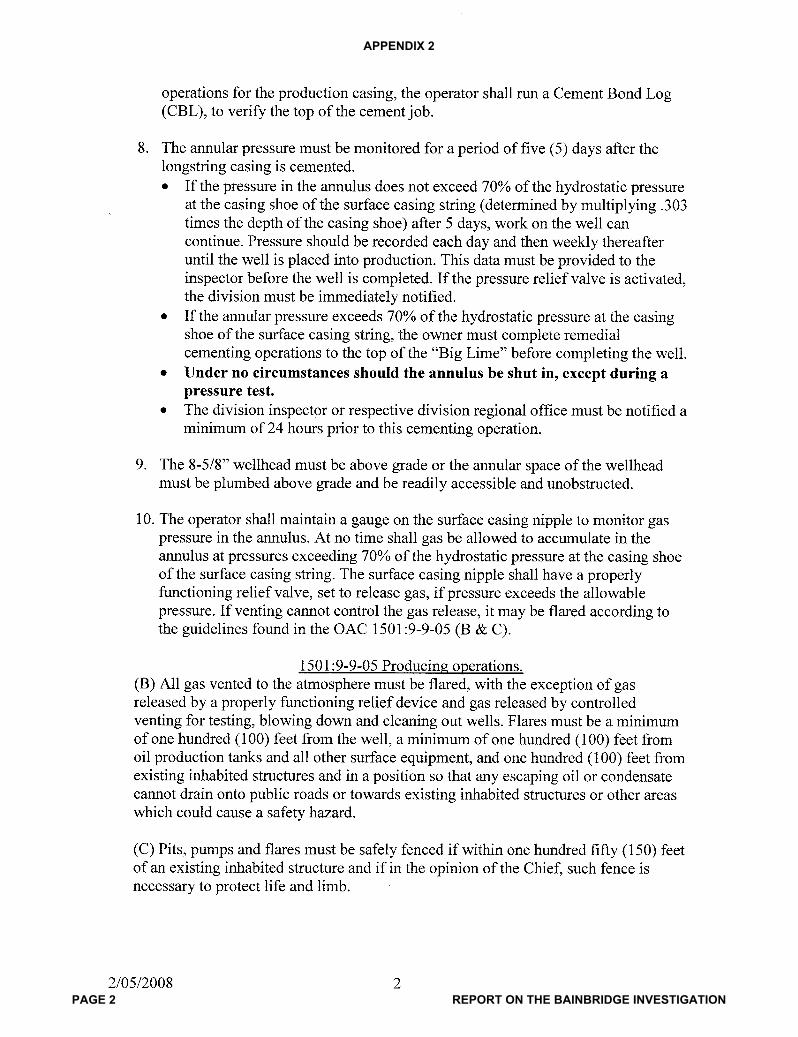
APPENDIX 2
PAGE 2 REPORT ON THE BAINBRIDGE INVESTIGATION

APPENDIX 3
PAGE 1 REPORT ON THE BAINBRIDGE INVESTIGATION

APPENDIX 3
PAGE 2 REPORT ON THE BAINBRIDGE INVESTIGATION

APPENDIX 3
PAGE 3 REPORT ON THE BAINBRIDGE INVESTIGATION
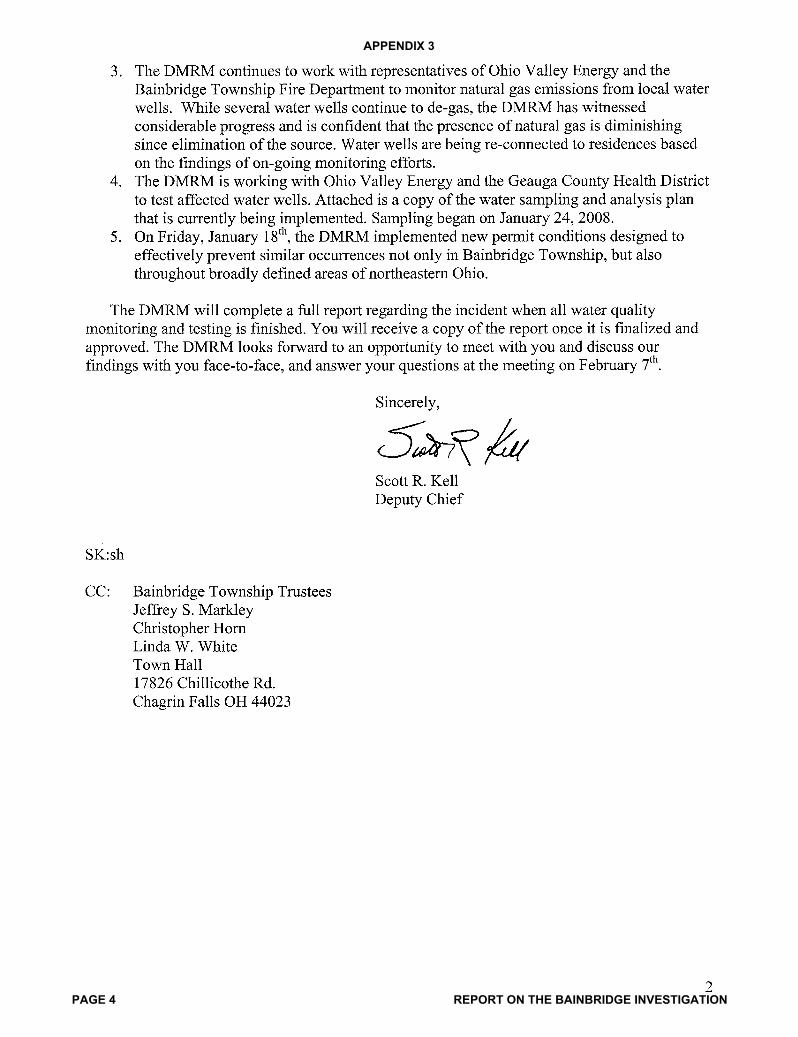
APPENDIX 3
PAGE 4 REPORT ON THE BAINBRIDGE INVESTIGATION

APPENDIX 3
PAGE 5 REPORT ON THE BAINBRIDGE INVESTIGATION

APPENDIX 3
PAGE 6 REPORT ON THE BAINBRIDGE INVESTIGATION

APPENDIX 3
PAGE 7 REPORT ON THE BAINBRIDGE INVESTIGATION

APPENDIX 3
PAGE 8 REPORT ON THE BAINBRIDGE INVESTIGATION

APPENDIX 3
PAGE 9 REPORT ON THE BAINBRIDGE INVESTIGATION

APPENDIX 3
PAGE 10 REPORT ON THE BAINBRIDGE INVESTIGATION

APPENDIX 3
PAGE 11 REPORT ON THE BAINBRIDGE INVESTIGATION

APPENDIX 3
PAGE 12 REPORT ON THE BAINBRIDGE INVESTIGATION

APPENDIX 3
PAGE 13 REPORT ON THE BAINBRIDGE INVESTIGATION
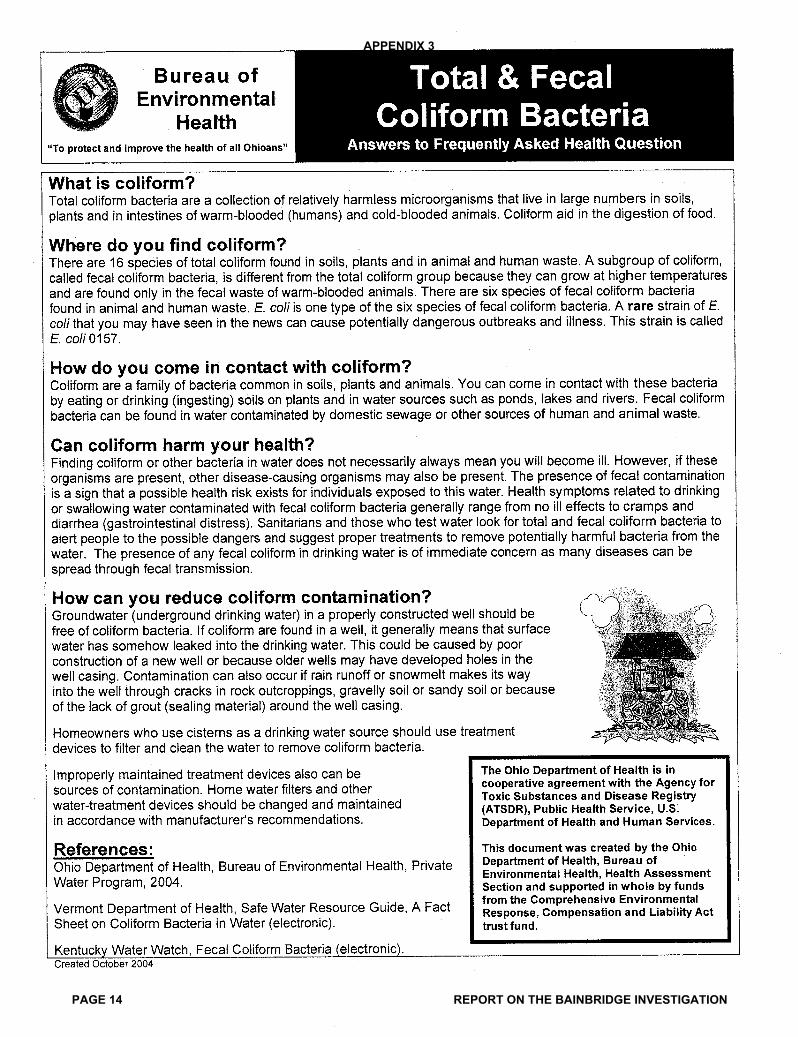
APPENDIX 3
PAGE 14 REPORT ON THE BAINBRIDGE INVESTIGATION

APPENDIX 3
PAGE 15 REPORT ON THE BAINBRIDGE INVESTIGATION

APPENDIX 3
PAGE 16 REPORT ON THE BAINBRIDGE INVESTIGATION

APPENDIX 3
PAGE 17 REPORT ON THE BAINBRIDGE INVESTIGATION

APPENDIX 3
PAGE 18 REPORT ON THE BAINBRIDGE INVESTIGATION
APPENDIX 3
PAGE 19 REPORT ON THE BAINBRIDGE INVESTIGATION

APPENDIX 3
PAGE 20 REPORT ON THE BAINBRIDGE INVESTIGATION

APPENDIX 3
PAGE 21 REPORT ON THE BAINBRIDGE INVESTIGATION
APPENDIX 3
PAGE 22 REPORT ON THE BAINBRIDGE INVESTIGATION

APPENDIX 3
PAGE 23 REPORT ON THE BAINBRIDGE INVESTIGATION
APPENDIX 3
PAGE 24 REPORT ON THE BAINBRIDGE INVESTIGATION

APPENDIX 3
PAGE 25 REPORT ON THE BAINBRIDGE INVESTIGATION

APPENDIX 3
PAGE 26 REPORT ON THE BAINBRIDGE INVESTIGATION

APPENDIX 3
PAGE 27 REPORT ON THE BAINBRIDGE INVESTIGATION

APPENDIX 3
PAGE 28 REPORT ON THE BAINBRIDGE INVESTIGATION

APPENDIX 3
PAGE 29 REPORT ON THE BAINBRIDGE INVESTIGATION

APPENDIX 3
PAGE 30 REPORT ON THE BAINBRIDGE INVESTIGATION

APPENDIX 3
PAGE 31 REPORT ON THE BAINBRIDGE INVESTIGATION

APPENDIX 3
PAGE 32 REPORT ON THE BAINBRIDGE INVESTIGATION

APPENDIX 3
PAGE 33 REPORT ON THE BAINBRIDGE INVESTIGATION

APPENDIX 3
PAGE 34 REPORT ON THE BAINBRIDGE INVESTIGATION

APPENDIX 3
PAGE 35 REPORT ON THE BAINBRIDGE INVESTIGATION

APPENDIX 3
PAGE 36 REPORT ON THE BAINBRIDGE INVESTIGATION

APPENDIX 3
PAGE 37 REPORT ON THE BAINBRIDGE INVESTIGATION

APPENDIX 3
PAGE 38 REPORT ON THE BAINBRIDGE INVESTIGATION
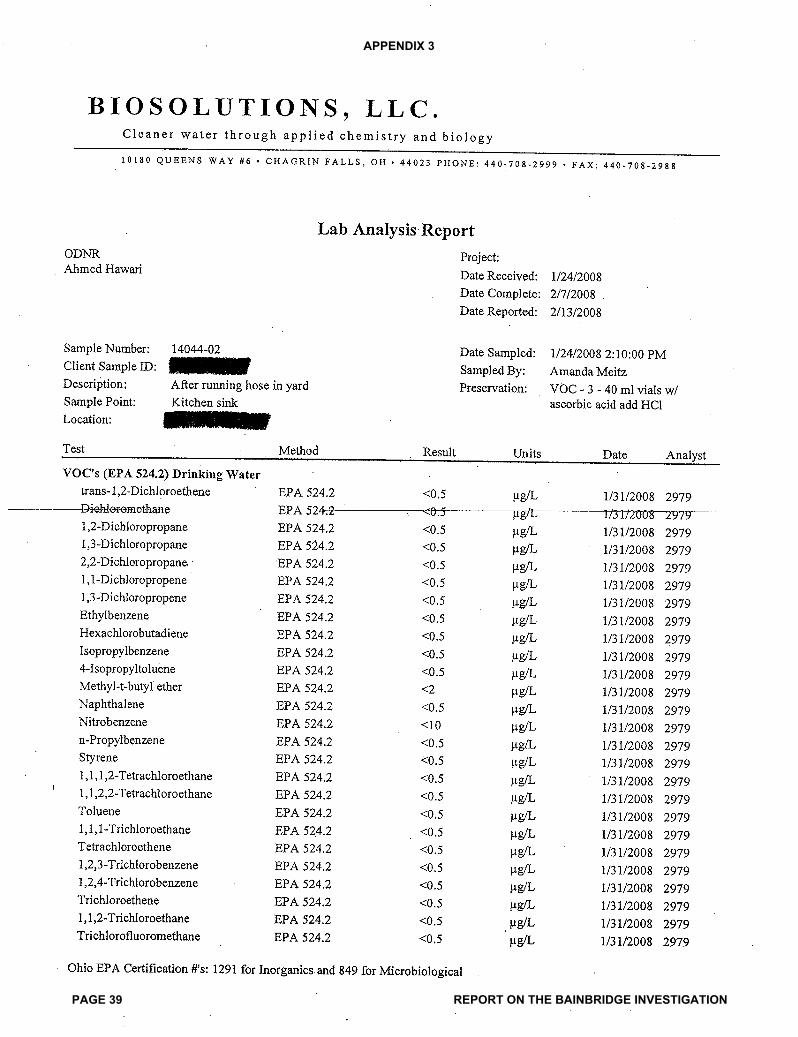
APPENDIX 3
PAGE 39 REPORT ON THE BAINBRIDGE INVESTIGATION
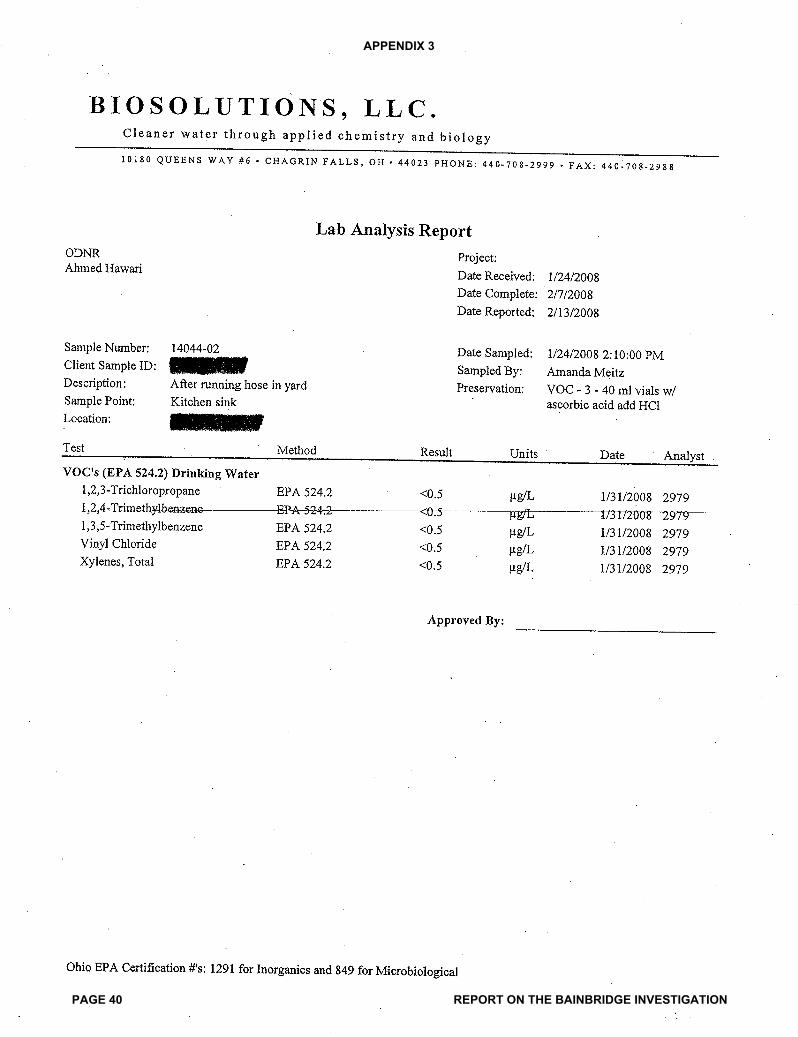
APPENDIX 3
PAGE 40 REPORT ON THE BAINBRIDGE INVESTIGATION
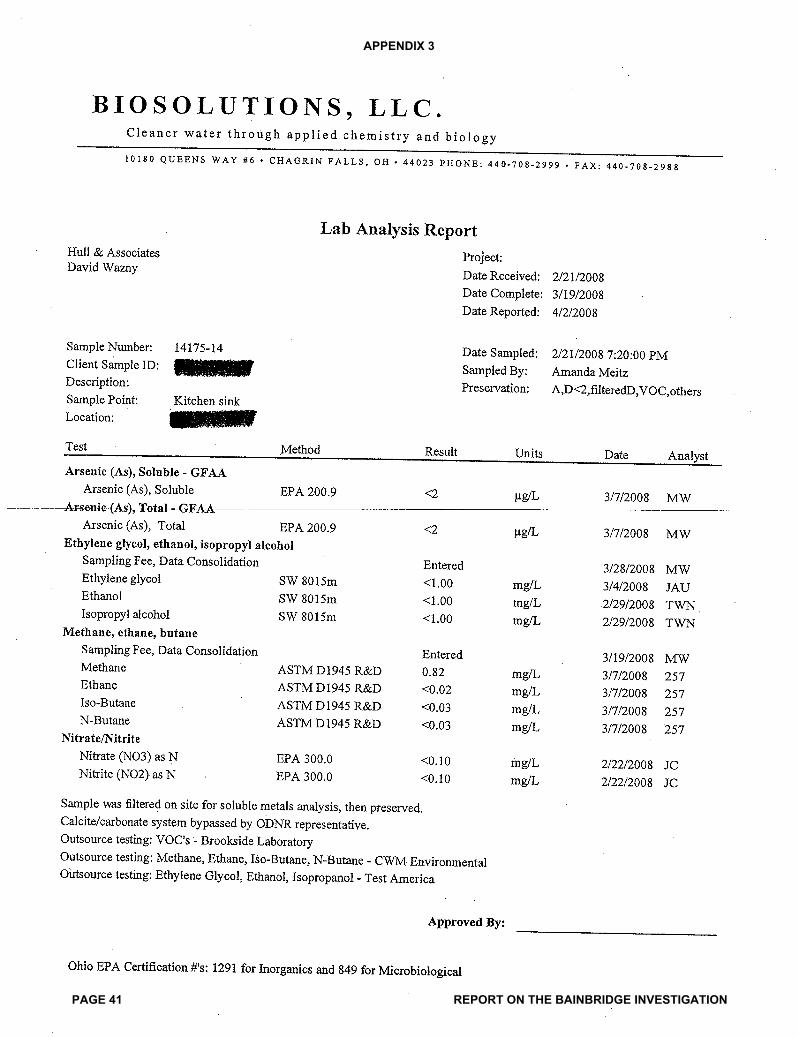
APPENDIX 3
PAGE 41 REPORT ON THE BAINBRIDGE INVESTIGATION

APPENDIX 3
PAGE 42 REPORT ON THE BAINBRIDGE INVESTIGATION

APPENDIX 3
PAGE 43 REPORT ON THE BAINBRIDGE INVESTIGATION

APPENDIX 3
PAGE 44 REPORT ON THE BAINBRIDGE INVESTIGATION

APPENDIX 3
PAGE 45 REPORT ON THE BAINBRIDGE INVESTIGATION

APPENDIX 3
PAGE 46 REPORT ON THE BAINBRIDGE INVESTIGATION

APPENDIX 3
PAGE 47 REPORT ON THE BAINBRIDGE INVESTIGATION

APPENDIX 3
PAGE 48 REPORT ON THE BAINBRIDGE INVESTIGATION

APPENDIX 3
PAGE 49 REPORT ON THE BAINBRIDGE INVESTIGATION
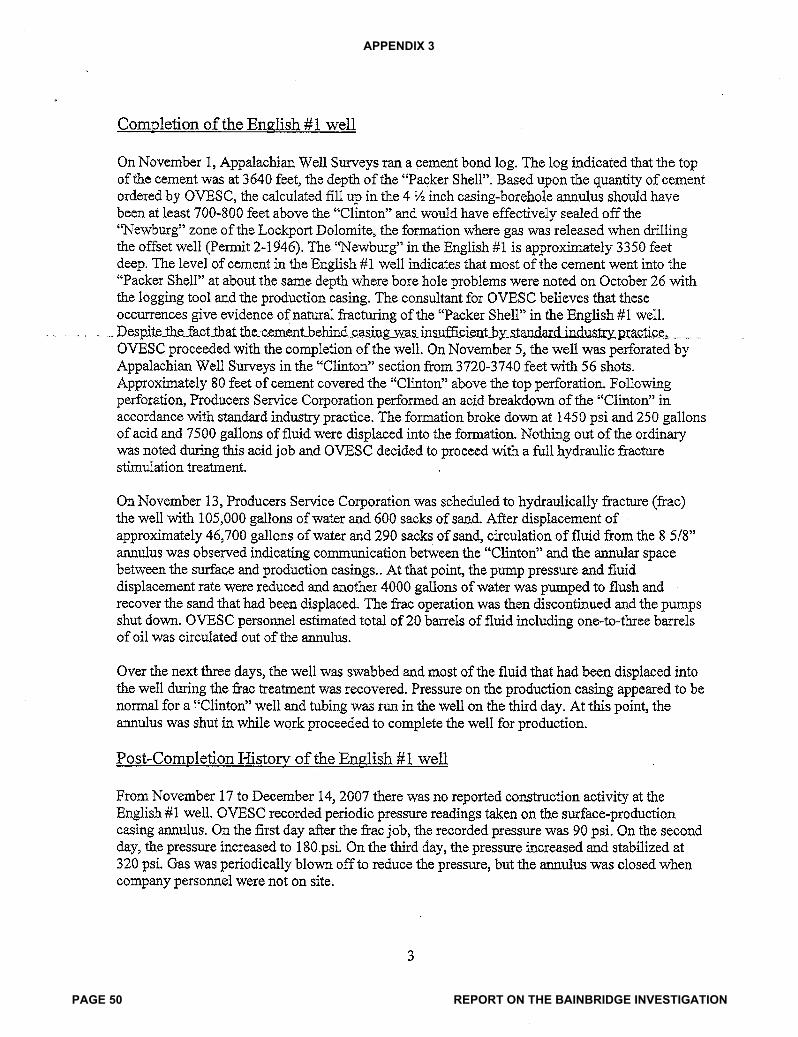
APPENDIX 3
PAGE 50 REPORT ON THE BAINBRIDGE INVESTIGATION

APPENDIX 3
PAGE 51 REPORT ON THE BAINBRIDGE INVESTIGATION

APPENDIX 3
PAGE 52 REPORT ON THE BAINBRIDGE INVESTIGATION
APPENDIX 3
PAGE 53 REPORT ON THE BAINBRIDGE INVESTIGATION

APPENDIX 3
PAGE 54 REPORT ON THE BAINBRIDGE INVESTIGATION

APPENDIX 3
PAGE 55 REPORT ON THE BAINBRIDGE INVESTIGATION
APPENDIX 3
PAGE 56 REPORT ON THE BAINBRIDGE INVESTIGATION
APPENDIX 3
PAGE 57 REPORT ON THE BAINBRIDGE INVESTIGATION

APPENDIX 3
PAGE 58 REPORT ON THE BAINBRIDGE INVESTIGATION

APPENDIX 3
PAGE 59 REPORT ON THE BAINBRIDGE INVESTIGATION

APPENDIX 3
PAGE 60 REPORT ON THE BAINBRIDGE INVESTIGATION

APPENDIX 3
PAGE 61 REPORT ON THE BAINBRIDGE INVESTIGATION

APPENDIX 3
PAGE 62 REPORT ON THE BAINBRIDGE INVESTIGATION

APPENDIX 3
PAGE 63 REPORT ON THE BAINBRIDGE INVESTIGATION

APPENDIX 3
PAGE 64 REPORT ON THE BAINBRIDGE INVESTIGATION