Report on the farm dam salinity audit of the Eastern Mount ... · Farm dam salinity audit of the...
25
South Australian Murray-Darling Basin Natural Resources Management Board FARM DAM SALINITY AUDIT OF THE EASTERN MOUNT LOFTY RANGES SOUTH AUSTRALIA June, 2008
Transcript of Report on the farm dam salinity audit of the Eastern Mount ... · Farm dam salinity audit of the...
South Australian Murray-Darling Basin Natural Resources Management Board
FARM DAM SALINITY AUDIT OF THE EASTERN MOUNT LOFTY RANGES
SOUTH AUSTRALIA June, 2008
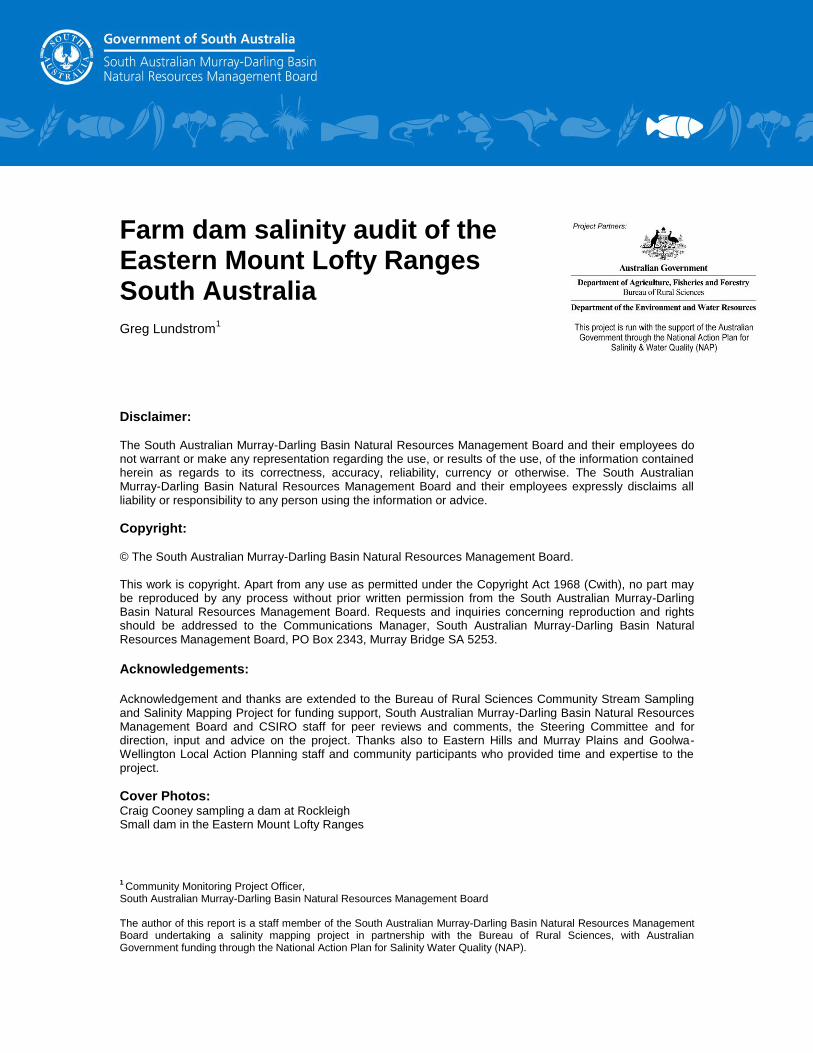
Farm dam salinity audit of the Eastern Mount Lofty Ranges South Australia Greg Lundstrom
1
Disclaimer:
The South Australian Murray-Darling Basin Natural Resources Management Board and their employees do not warrant or make any representation regarding the use, or results of the use, of the information contained herein as regards to its correctness, accuracy, reliability, currency or otherwise. The South Australian Murray-Darling Basin Natural Resources Management Board and their employees expressly disclaims all liability or responsibility to any person using the information or advice.
Copyright: © The South Australian Murray-Darling Basin Natural Resources Management Board. This work is copyright. Apart from any use as permitted under the Copyright Act 1968 (Cwith), no part may be reproduced by any process without prior written permission from the South Australian Murray-Darling Basin Natural Resources Management Board. Requests and inquiries concerning reproduction and rights should be addressed to the Communications Manager, South Australian Murray-Darling Basin Natural Resources Management Board, PO Box 2343, Murray Bridge SA 5253. Acknowledgements: Acknowledgement and thanks are extended to the Bureau of Rural Sciences Community Stream Sampling and Salinity Mapping Project for funding support, South Australian Murray-Darling Basin Natural Resources Management Board and CSIRO staff for peer reviews and comments, the Steering Committee and for direction, input and advice on the project. Thanks also to Eastern Hills and Murray Plains and Goolwa-Wellington Local Action Planning staff and community participants who provided time and expertise to the project.
Cover Photos: Craig Cooney sampling a dam at Rockleigh Small dam in the Eastern Mount Lofty Ranges
1 Community Monitoring Project Officer,
South Australian Murray-Darling Basin Natural Resources Management Board The author of this report is a staff member of the South Australian Murray-Darling Basin Natural Resources Management Board undertaking a salinity mapping project in partnership with the Bureau of Rural Sciences, with Australian Government funding through the National Action Plan for Salinity Water Quality (NAP).
Executive Summary:
Dams are the primary farm water storage on the eastern side of the Mount Lofty Ranges
(EMLR).
Studies have shown that currently in the EMLR there are 7,500 dams with an estimated
storage capacity of 30,000 megalitres (ML). Of these, 87% have a capacity of less than
5 ML and account for 35% of the total storage capacity.
Farm dams are supplied through run-off, through interception of shallow groundwater,
discharge of groundwater (spring fed), and where water quality permits, supplemented
by bore water or nearby surface water supplies. The combination of extraction rates,
evaporation (concentrating the salts), mobilised salt stores from groundwater discharge,
dryland salination and atmospheric deposition of cyclic salts (wind blown marine
aerosols deposited in rainwater) contribute to raising salinity levels in EMLR farm dams.
The audit conducted over 2007 on a representative sample of dams in the EMLR
showed seasonal variation in water quality and quantity. Dam conductivity readings
ranged from a low of 120 μs/cm EC to a high of 18,200 μs/cm EC. The hills zone dams
(the higher rainfall areas, on the elevated western side of the EMLR) recorded an
average conductivity decrease of 49% after winter rains, compared with an average
conductivity decrease of 32% for the plains zone dams (on the River Murray floodplain).
The highest median EC value recorded over the survey period of 2,000 μs/cm EC
occurred in the plains zone in May 2007, indicating that dam water generally remains
suitable for a variety of farm uses including irrigated crops and stock and domestic
purposes. Some dams recorded much higher salinities even at the end of winter and
were unsuitable for any of these uses.
Of the 75 dams surveyed 61 recorded a surrounding land use of grazing or a
combination of land uses including grazing (81.3%). Six hills dams and 8 plains dams
had other landuse activities, predominantly vineyards.
Approximately one quarter of all the dams surveyed in April were reported as having
overflowed before the second audit in September, a very similar percentage of dams in
both zones (25% plains zone and 23.6% for hills zone). Average percentage increase in
water volume estimated the hills zone dams at 53.42%; compared with plains zone
recording a 35.16% increase. Of the dams reaching full storage, all were under 2 ML
and all the plains zone dams were supplemented compared with half of the hills zone
dams. Two “in-stream” dams did not overflow over the study period.
Land use and rainfall tends to dictate dam type and size. Dams in the hills zone are
smaller in size, on smaller land holdings, supplemented less and having a lower water
demand, as most were used for watering of stock rather than large scale irrigation
activities. Dams on the plains zone were more often supplemented with groundwater
from equipped bores or River Murray water from Lake Alexandrina. Supplementary
water sources supplied to dams regularly reported elevated salinity levels, limiting its
use and increasing pressure on landholders to seek alternative supplies or change
management practices.
I
Participating landholders expressed concern about the effects of the dry conditions
experienced over the past decade. Going into the summer of 2007-8, 10 landholders
considered their dams were not of adequate storage, with a higher percentage of these
occurring in the plains zone. Some landholders indicated that they were considering
changes to stocking practices and actions to secure further water supplies.
Water resource management is currently under review through the water allocation plan
(WAP) process, a plan prepared and enacted as part of the process of prescription of
the water resource. It is a requirement as part of the WAP process that an assessment
of the water resource is made. Balancing landholder water use with environmental water
requirements over extended dry periods presents a challenge to water management
authorities. Building a better understanding of dam usage and adequacy will inform
decision making.
II
Table of Contents
Executive Summary………………………………………………………………...……..…I, II
Table of Contents………………………………………………………………………………III
List of Tables/Figures………………………………………….……………………….………IV
Introduction…………………………………………………………………………………….…1
Objective………………………………………………………………………………………….1
Methodology……………………………………………………………………………………...2
Types of dams audited…………………………………………………………………………..3
Rainfall…………………………………………………………………………………………….4
Seasonal Conductivity Comparisons…………………………………………………………..7
Dam Overflow and Dam Adequacy……………………………………………………………8
Landholder attitudes……………………………………………………………………………11
Discussion……………………………………………………………………………………....14
Recommendations………………………………………………………………………..........16
Acknowledgements……………………………………………………………….……………16
Bibliography………………………………………………………………………………….….16
III
List of Tables
Table 1 Lists the number of each dam type audited………………………………..……3
Table 2. Rainfall station locations…………………………………………………………...4
Table 3 Average Annual Rainfall 2001-2006 and 2007 Rainfall Comparisons………..5
Table 4 Mean rainfall figure comparisons over the 2007 study period…………..……. 6
Table 5 List of average and median values of conductivity in EC (µs/cm)…………….7
Table 6 Winter dam volume increase by % during the study period –
zone comparisons (all sites)……………………………………………..………..9
Table 7 Landholder comments hills and plains zones……………………..………12, 13
List of Figures
Figure 1 Approximate dam locations surveyed twice in 2007…………………..…….….1
Figure 2 Farm dam zones established for the study………………………….……….… 2
Figure 3 Average Annual Rainfall 2001-2006 and 2007 Rainfall Comparisons…..……5
Figure 4 Conductivity in µs/cm recorded for hills zone sites for May and September.. 7
Figure 5 Conductivity in µs/cm recorded for plains zone sites for
May and September…………………………………………………………..……8
Figure 6 Winter dam volume increase by % during the study period – zone
comparisons (all sites)…………………………………….………...……………10
IV
Introduction:
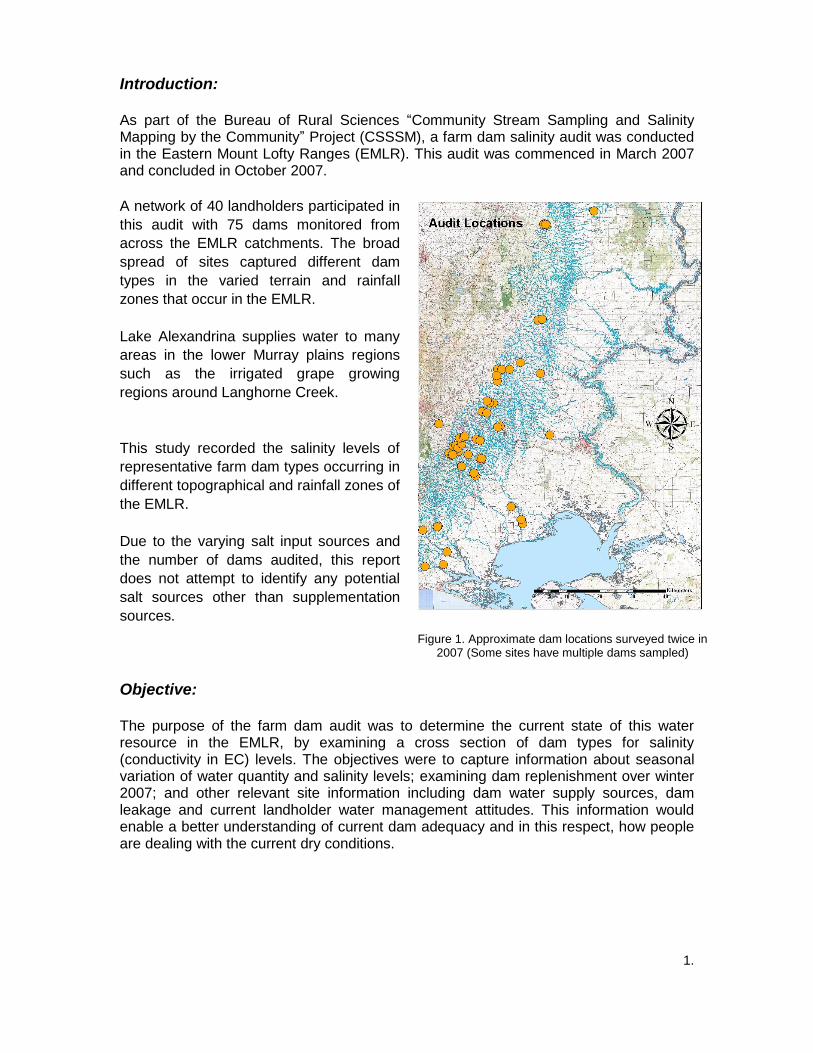
As part of the Bureau of Rural Sciences “Community Stream Sampling and Salinity Mapping by the Community” Project (CSSSM), a farm dam salinity audit was conducted in the Eastern Mount Lofty Ranges (EMLR). This audit was commenced in March 2007 and concluded in October 2007.
A network of 40 landholders participated in
this audit with 75 dams monitored from
across the EMLR catchments. The broad
spread of sites captured different dam
types in the varied terrain and rainfall
zones that occur in the EMLR.
Lake Alexandrina supplies water to many
areas in the lower Murray plains regions
such as the irrigated grape growing
regions around Langhorne Creek.
This study recorded the salinity levels of
representative farm dam types occurring in
different topographical and rainfall zones of
the EMLR.
Due to the varying salt input sources and
the number of dams audited, this report
does not attempt to identify any potential
salt sources other than supplementation
sources.
Objective:
The purpose of the farm dam audit was to determine the current state of this water resource in the EMLR, by examining a cross section of dam types for salinity (conductivity in EC) levels. The objectives were to capture information about seasonal variation of water quantity and salinity levels; examining dam replenishment over winter 2007; and other relevant site information including dam water supply sources, dam leakage and current landholder water management attitudes. This information would enable a better understanding of current dam adequacy and in this respect, how people are dealing with the current dry conditions.
1.
Figure 1. Approximate dam locations surveyed twice in 2007 (Some sites have multiple dams sampled)
Methodology: The first audit was conducted in March 2007 and continued until opening rains in early April 2007. Despite strong community interest in the survey and more willing participants coming forward, a halt was called to the audit to ensure the opening rains would not skew the result of salinity levels or dam volumes recorded. A second audit was conducted in September-October 2007, where the same dams were re-monitored over a period of two weeks. Data was collected on the dam replenishment through run-off over winter 2007. The two field audits were conducted by staff of the South Australian Murray-Darling Basin Natural Resources Management (SA MDB NRM) Board. Daily calibration of salinity meters and the use of trained and experienced staff ensured consistency and accuracy of data. On a few occasions salinity recordings were accepted from the community, and these recordings were only accepted from those that had
undertaken training in water quality monitoring within the past six months and who had a demonstrated capacity to meet the standards of monitoring and testing protocols consistent with the SA MDB NRM Board’s Community Monitoring Framework, Bureau of Rural Science’s CSSSM project and Waterwatch S.A.’s “Data categories” for water quality. Data collection was accompanied by background site information recorded for conditions at the time of sampling including surrounding land use; use of dam water; details of dam capacity in megalitres (ML). and % full; dam leakage; shade factor; if the dam had overflowed over winter 2007 (September survey); land management and historical site information from landholders such as dam adequacy. All participant landholders were surveyed to support the collection background data such as the percentage mix of dam water when supplemented from other sources, and to determining landholder attitudes and intentions on future farm water supply.
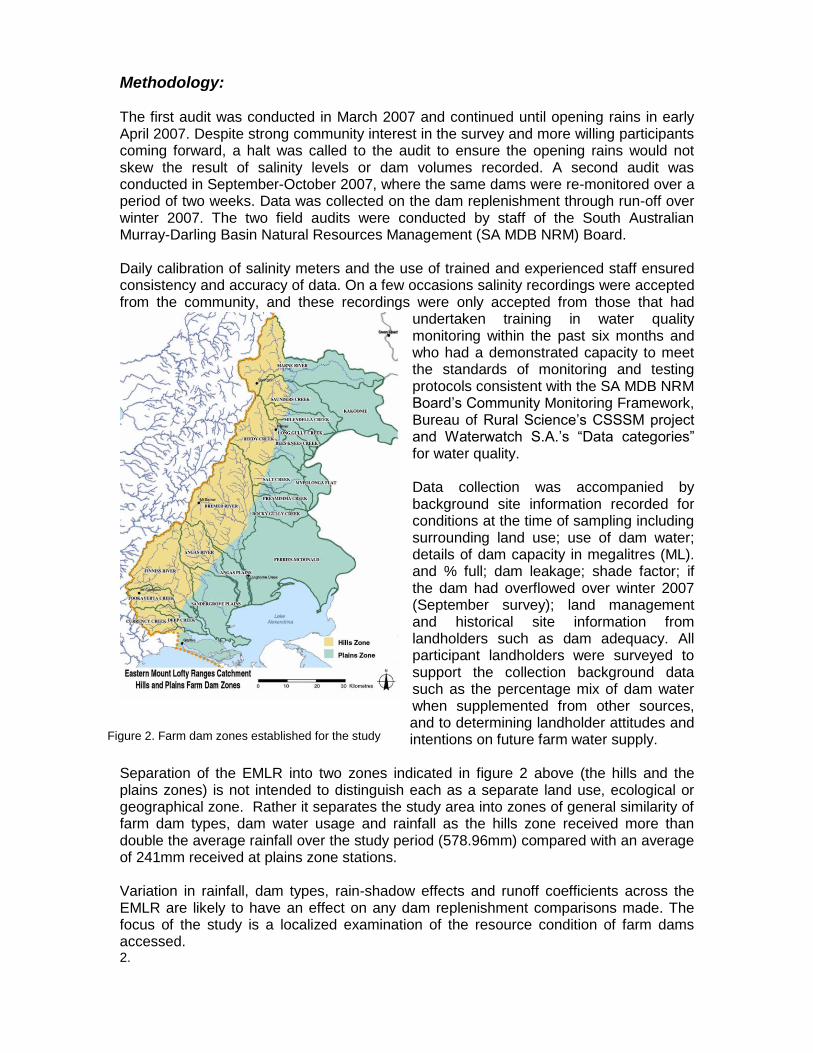
Separation of the EMLR into two zones indicated in figure 2 above (the hills and the plains zones) is not intended to distinguish each as a separate land use, ecological or geographical zone. Rather it separates the study area into zones of general similarity of farm dam types, dam water usage and rainfall as the hills zone received more than double the average rainfall over the study period (578.96mm) compared with an average of 241mm received at plains zone stations. Variation in rainfall, dam types, rain-shadow effects and runoff coefficients across the EMLR are likely to have an effect on any dam replenishment comparisons made. The focus of the study is a localized examination of the resource condition of farm dams accessed. 2.
Figure 2. Farm dam zones established for the study
Rainfall averages and means were sourced from the Bureau of Meteorology from 5 hills and 5 plains sites. These sites (see table 2) are located throughout the study area and were collectively used to determine temporal comparisons of rainfall across the two zones and rainfall averages over a six year period.
Types of Dams Audited: Dam types and landholder usage varies considerably between the hills zone and the Murray plains zone. Land use and rainfall tends to dictate dam type and size. Generally dams in the higher rainfall areas on the eastern side of the Mount Lofty Ranges are smaller in size, on smaller land holdings, supplemented less and having a lower water demand, as most were used for watering of stock rather than large scale irrigation activities. Dams on the River Murray floodplains area were more often supplemented with groundwater from operative equipped bores or lake water from Lake Alexandrina. “Turkey nest” dams are utilized for this purpose in many cases (often poly-lined). 75 dams were audited, with 20 of this number falling within the plains zone. The EMLR dams surveyed ranged in capacity from 82 ML to 0.3 ML. Whilst dam selection was driven by the willing participation of landholders involved, it was considered that those participating had dams that were representative of the farm dam types occurring in the two regions. For the purposes of this audit, dams sampled have been classified into 5 types:
1. Stock or domestic dams hills zone; 2. Stock or domestic dams plains zone; 3. Holding & irrigation dams hills zone; 4. Holding & irrigation dams plains zone;
(highly supplemented dams such as “turkey nest” dams); 5. Fenced or low usage dams
Table 1 – Lists the number of each dam type audited:
3.
Stock or domestic dams
Holding & Irrigation dams
Holding & irrigation dams plains zone
(highly supplemented dams such as “turkey
nest” dams)
Fenced or low usage dams
Hills Zone
49
4 0 2
Plains Zone
12
0 6 2
Rainfall: Rainfall medians and means were sourced from the Bureau of Meteorology for 5 hills and 5 plains sites. These sites (see table 2) are located throughout the study area and were collectively used to determine temporal comparisons of rainfall trends in the two zones. Table 2. – Rainfall station locations:
Hills Zone:
Bureau of Meteorology Station Number
Station Name Latitude Longitude Elevation in metres
23318 Tanunda 34.5169 138.9598 250
23730 Meadows 35.1782 138.7629 356
23733 Mount Barker 35.0639 138.8509 360
23735 Mount Compass 35.3497 138.6223 232
23801 Lenswood Research Centre
34.9482 138.8071 480
Plains Zone:
23825 Goolwa Barrage 35.5288 138.8067 1
24508 Callington 35.125 139.0433 96
24515 Langhorne Creek 35.2959 139.0328 18
24519 Milang 35.4068 138.9701 8
24531 Sedan 34.5719 139.2961 95
Table 3 and Figure 3 below show that 2007 was typical of the annual rainfall encountered over the study area in recent years. Hills zone recorded marginally less rainfall at 3 of the 5 sites while plains zone recorded marginally less rainfall at 2 of the 5 sites. Rainfall comparisons prior to 2001 were not made as it is assumed farm dam usage and practices have been adapted to current rainfall patterns, although it is acknowledged that drier than usual conditions are being experienced in both zones. 4.
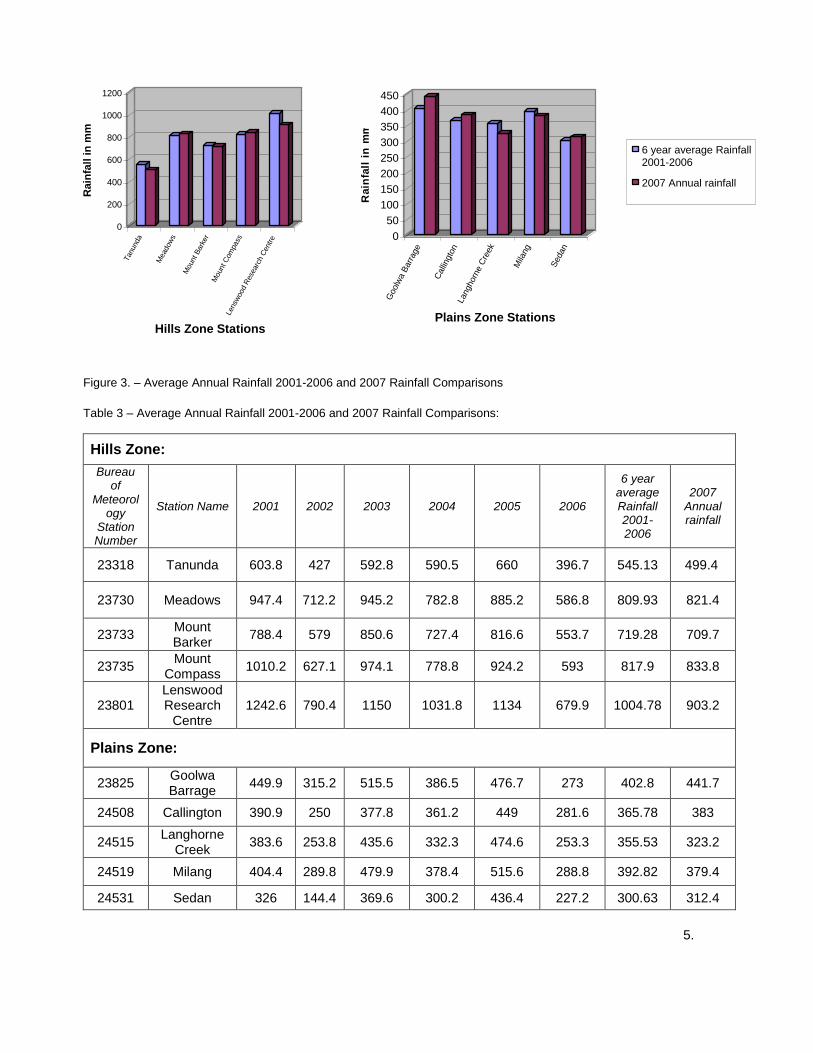
Figure 3. – Average Annual Rainfall 2001-2006 and 2007 Rainfall Comparisons
Table 3 – Average Annual Rainfall 2001-2006 and 2007 Rainfall Comparisons:
Hills Zone:
Bureau of
Meteorology
Station Number
Station Name 2001 2002 2003 2004 2005 2006
6 year average Rainfall 2001-2006
2007 Annual rainfall
23318 Tanunda 603.8 427 592.8 590.5 660 396.7 545.13 499.4
23730 Meadows 947.4 712.2 945.2 782.8 885.2 586.8 809.93 821.4
23733 Mount Barker
788.4 579 850.6 727.4 816.6 553.7 719.28 709.7
23735 Mount
Compass 1010.2 627.1 974.1 778.8 924.2 593 817.9 833.8
23801 Lenswood Research
Centre 1242.6 790.4 1150 1031.8 1134 679.9 1004.78 903.2
Plains Zone:
23825 Goolwa Barrage
449.9 315.2 515.5 386.5 476.7 273 402.8 441.7
24508 Callington 390.9 250 377.8 361.2 449 281.6 365.78 383
24515 Langhorne
Creek 383.6 253.8 435.6 332.3 474.6 253.3 355.53 323.2
24519 Milang 404.4 289.8 479.9 378.4 515.6 288.8 392.82 379.4
24531 Sedan 326 144.4 369.6 300.2 436.4 227.2 300.63 312.4
5.
0
200
400
600
800
1000
1200R
ain
fall
in
mm
Tanu
nda
Mead
ow
s
Moun
t B
ark
er
Moun
t C
ompa
ss
Len
swoo
d R
esear
ch C
ent
re
Hills Zone Stations
0
50
100
150
200
250
300
350
400
450
Ra
infa
ll i
n m
m
Goolw
a B
arr
age
Calli
ngto
nLanghorn
e C
reek
Mila
ng
Sedan
Plains Zone Stations
6 year average Rainfall2001-2006
2007 Annual rainfall
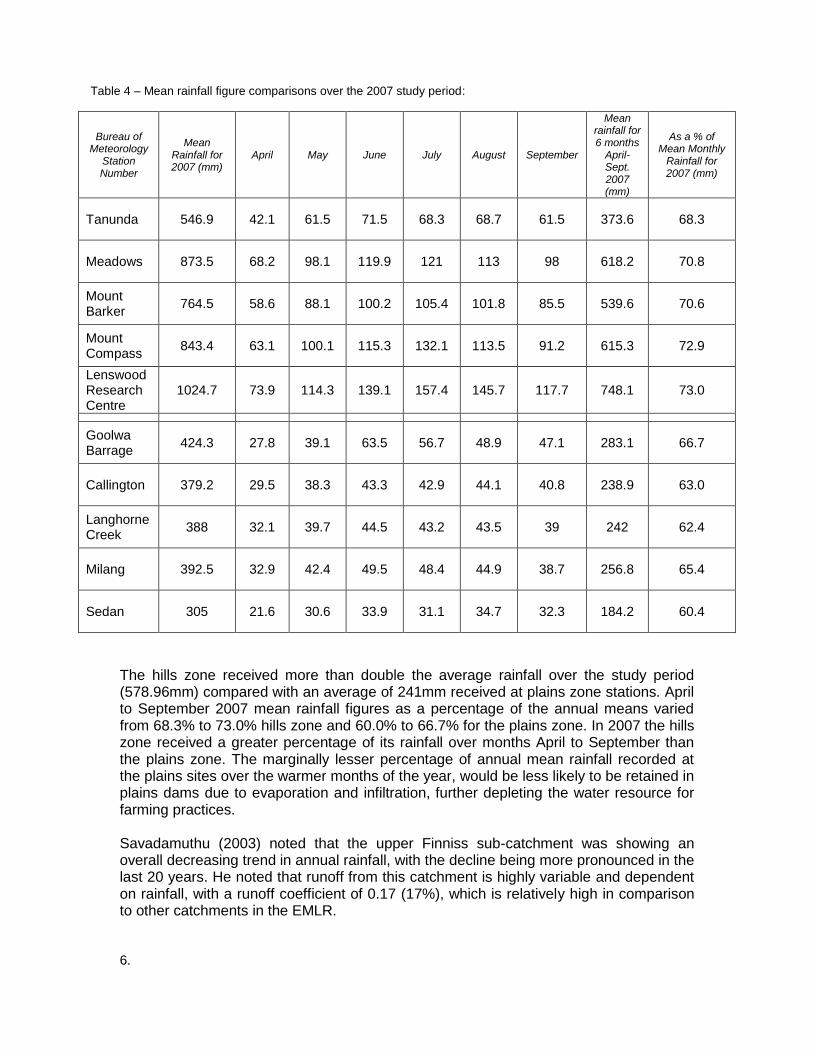
Table 4 – Mean rainfall figure comparisons over the 2007 study period:
Bureau of Meteorology
Station Number
Mean Rainfall for 2007 (mm)
April May June July August September
Mean rainfall for 6 months
April-Sept. 2007 (mm)
As a % of Mean Monthly
Rainfall for 2007 (mm)
Tanunda 546.9 42.1 61.5 71.5 68.3 68.7 61.5 373.6 68.3
Meadows 873.5 68.2 98.1 119.9 121 113 98 618.2 70.8
Mount Barker
764.5 58.6 88.1 100.2 105.4 101.8 85.5 539.6 70.6
Mount Compass
843.4 63.1 100.1 115.3 132.1 113.5 91.2 615.3 72.9
Lenswood Research Centre
1024.7 73.9 114.3 139.1 157.4 145.7 117.7 748.1 73.0
Goolwa Barrage
424.3 27.8 39.1 63.5 56.7 48.9 47.1 283.1 66.7
Callington 379.2 29.5 38.3 43.3 42.9 44.1 40.8 238.9 63.0
Langhorne Creek
388 32.1 39.7 44.5 43.2 43.5 39 242 62.4
Milang 392.5 32.9 42.4 49.5 48.4 44.9 38.7 256.8 65.4
Sedan 305 21.6 30.6 33.9 31.1 34.7 32.3 184.2 60.4
The hills zone received more than double the average rainfall over the study period (578.96mm) compared with an average of 241mm received at plains zone stations. April to September 2007 mean rainfall figures as a percentage of the annual means varied from 68.3% to 73.0% hills zone and 60.0% to 66.7% for the plains zone. In 2007 the hills zone received a greater percentage of its rainfall over months April to September than the plains zone. The marginally lesser percentage of annual mean rainfall recorded at the plains sites over the warmer months of the year, would be less likely to be retained in plains dams due to evaporation and infiltration, further depleting the water resource for farming practices. Savadamuthu (2003) noted that the upper Finniss sub-catchment was showing an overall decreasing trend in annual rainfall, with the decline being more pronounced in the last 20 years. He noted that runoff from this catchment is highly variable and dependent on rainfall, with a runoff coefficient of 0.17 (17%), which is relatively high in comparison to other catchments in the EMLR. 6.
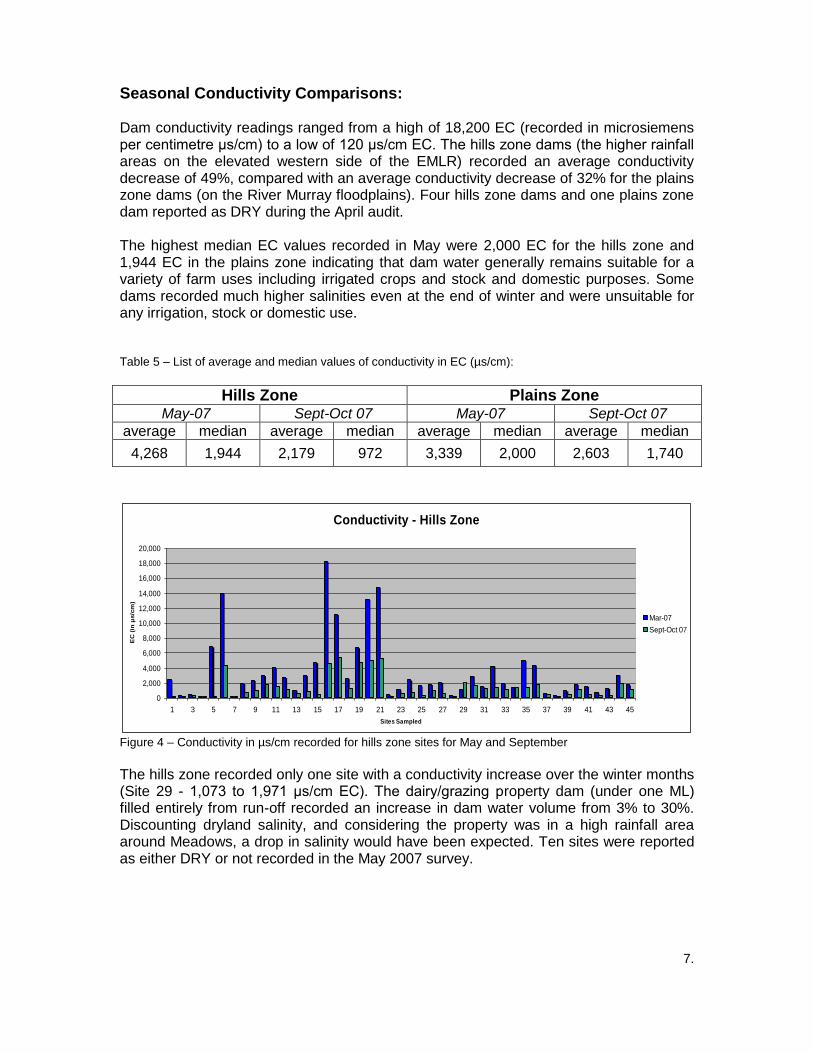
Seasonal Conductivity Comparisons: Dam conductivity readings ranged from a high of 18,200 EC (recorded in microsiemens per centimetre µs/cm) to a low of 120 μs/cm EC. The hills zone dams (the higher rainfall areas on the elevated western side of the EMLR) recorded an average conductivity decrease of 49%, compared with an average conductivity decrease of 32% for the plains zone dams (on the River Murray floodplains). Four hills zone dams and one plains zone dam reported as DRY during the April audit. The highest median EC values recorded in May were 2,000 EC for the hills zone and 1,944 EC in the plains zone indicating that dam water generally remains suitable for a variety of farm uses including irrigated crops and stock and domestic purposes. Some dams recorded much higher salinities even at the end of winter and were unsuitable for any irrigation, stock or domestic use. Table 5 – List of average and median values of conductivity in EC (µs/cm):
Hills Zone Plains Zone May-07 Sept-Oct 07 May-07 Sept-Oct 07
average median average median average median average median
4,268 1,944 2,179 972 3,339 2,000 2,603 1,740
Conductivity - Hills Zone
0
2,000
4,000
6,000
8,000
10,000
12,000
14,000
16,000
18,000
20,000
1 3 5 7 9 11 13 15 17 19 21 23 25 27 29 31 33 35 37 39 41 43 45
Sites Sampled
EC
(in
µs/c
m)
Mar-07
Sept-Oct 07
Figure 4 – Conductivity in µs/cm recorded for hills zone sites for May and September
The hills zone recorded only one site with a conductivity increase over the winter months (Site 29 - 1,073 to 1,971 μs/cm EC). The dairy/grazing property dam (under one ML) filled entirely from run-off recorded an increase in dam water volume from 3% to 30%. Discounting dryland salinity, and considering the property was in a high rainfall area around Meadows, a drop in salinity would have been expected. Ten sites were reported as either DRY or not recorded in the May 2007 survey.
7.
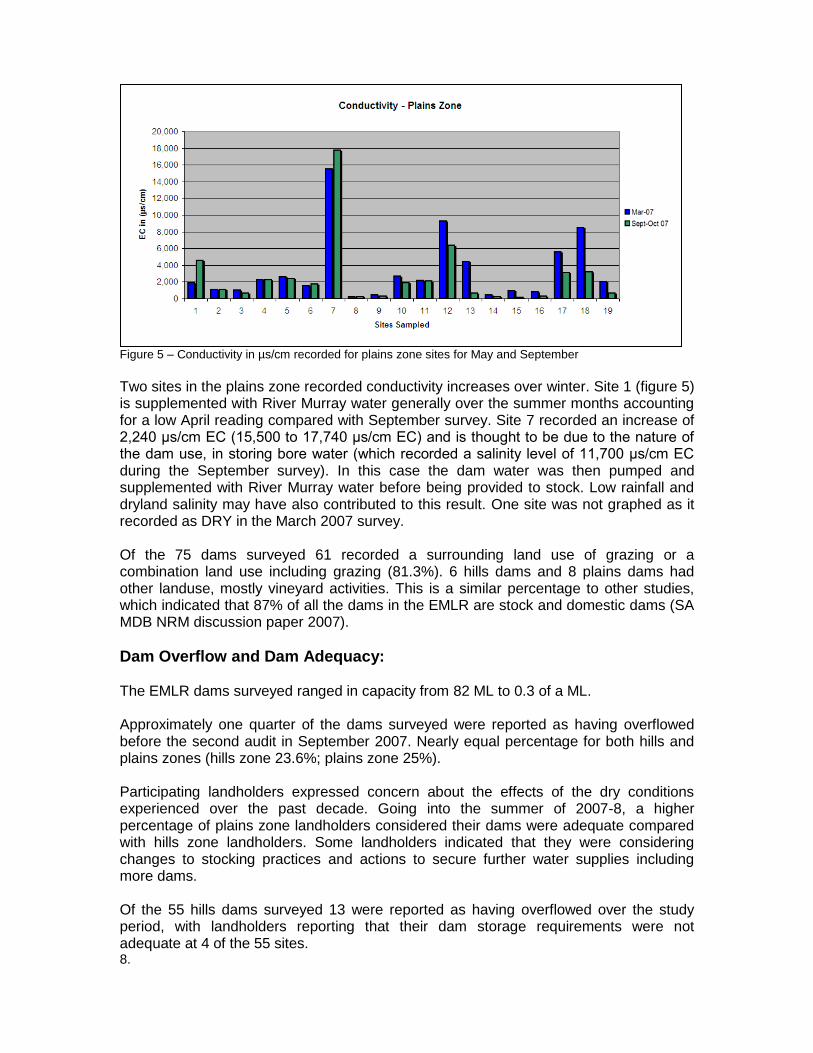
Figure 5 – Conductivity in µs/cm recorded for plains zone sites for May and September
Two sites in the plains zone recorded conductivity increases over winter. Site 1 (figure 5) is supplemented with River Murray water generally over the summer months accounting for a low April reading compared with September survey. Site 7 recorded an increase of 2,240 μs/cm EC (15,500 to 17,740 μs/cm EC) and is thought to be due to the nature of the dam use, in storing bore water (which recorded a salinity level of 11,700 μs/cm EC during the September survey). In this case the dam water was then pumped and supplemented with River Murray water before being provided to stock. Low rainfall and dryland salinity may have also contributed to this result. One site was not graphed as it recorded as DRY in the March 2007 survey. Of the 75 dams surveyed 61 recorded a surrounding land use of grazing or a combination land use including grazing (81.3%). 6 hills dams and 8 plains dams had other landuse, mostly vineyard activities. This is a similar percentage to other studies, which indicated that 87% of all the dams in the EMLR are stock and domestic dams (SA MDB NRM discussion paper 2007).
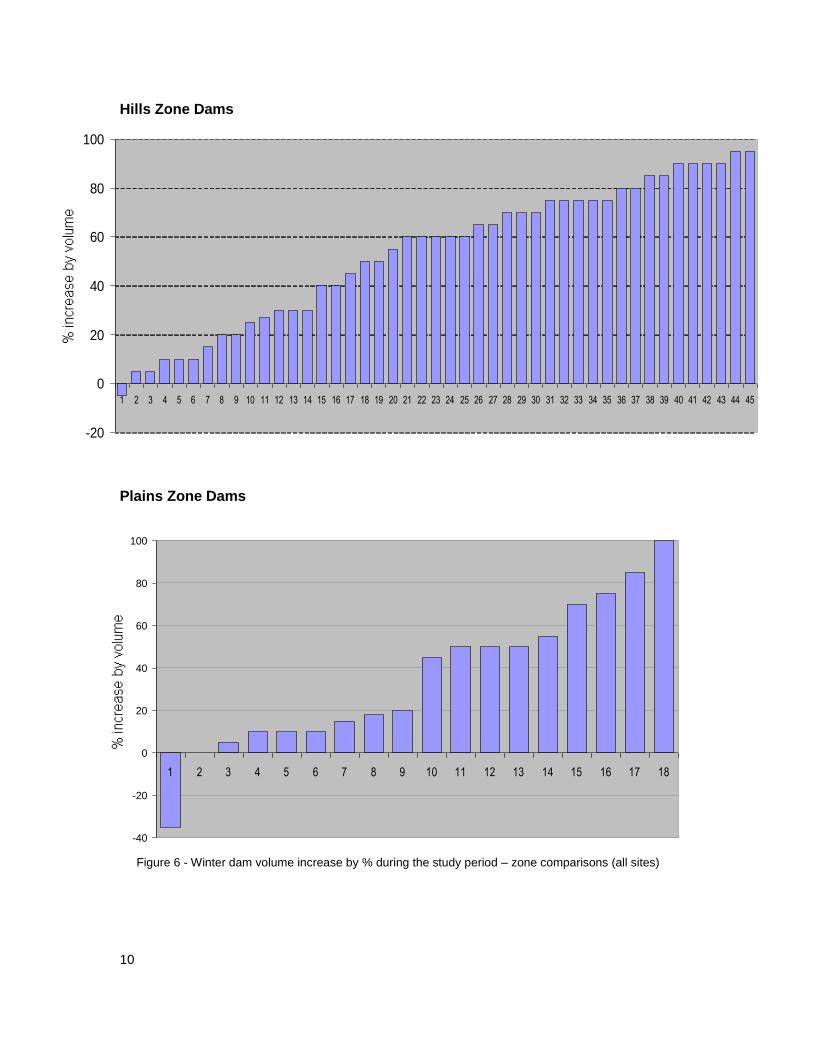
Dam Overflow and Dam Adequacy: The EMLR dams surveyed ranged in capacity from 82 ML to 0.3 of a ML. Approximately one quarter of the dams surveyed were reported as having overflowed before the second audit in September 2007. Nearly equal percentage for both hills and plains zones (hills zone 23.6%; plains zone 25%). Participating landholders expressed concern about the effects of the dry conditions experienced over the past decade. Going into the summer of 2007-8, a higher percentage of plains zone landholders considered their dams were adequate compared with hills zone landholders. Some landholders indicated that they were considering changes to stocking practices and actions to secure further water supplies including more dams. Of the 55 hills dams surveyed 13 were reported as having overflowed over the study period, with landholders reporting that their dam storage requirements were not adequate at 4 of the 55 sites. 8.
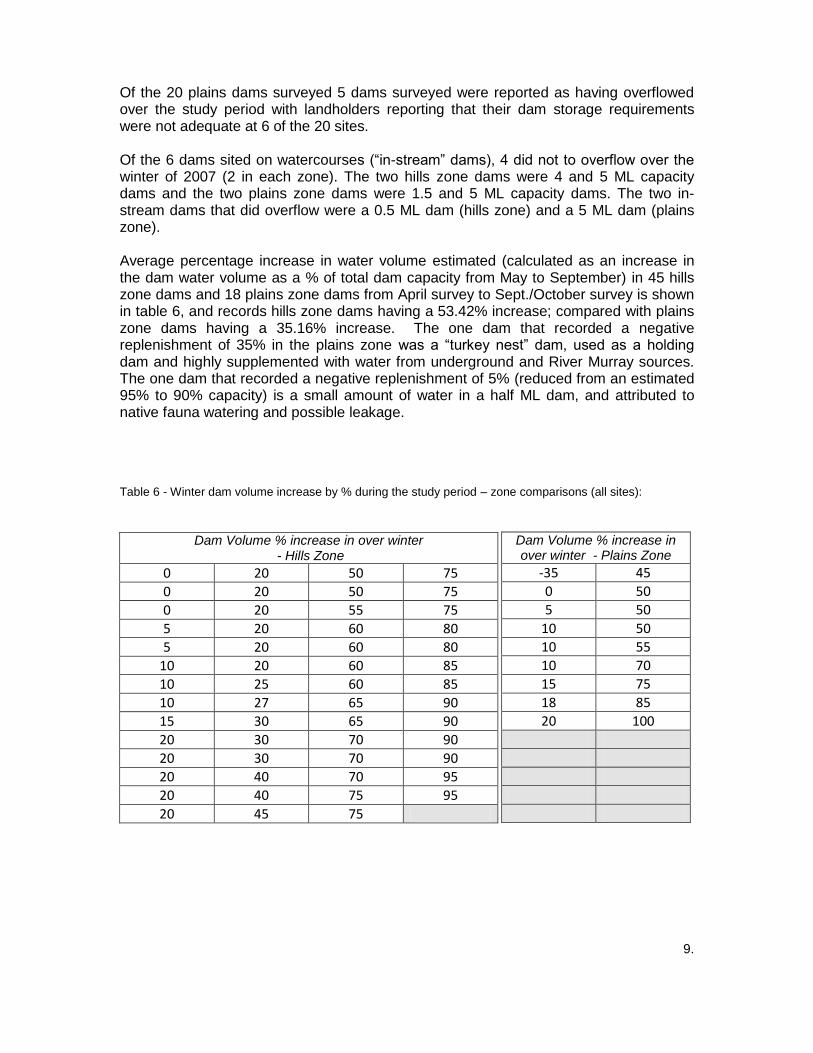
Of the 20 plains dams surveyed 5 dams surveyed were reported as having overflowed over the study period with landholders reporting that their dam storage requirements were not adequate at 6 of the 20 sites. Of the 6 dams sited on watercourses (“in-stream” dams), 4 did not to overflow over the winter of 2007 (2 in each zone). The two hills zone dams were 4 and 5 ML capacity dams and the two plains zone dams were 1.5 and 5 ML capacity dams. The two in-stream dams that did overflow were a 0.5 ML dam (hills zone) and a 5 ML dam (plains zone). Average percentage increase in water volume estimated (calculated as an increase in the dam water volume as a % of total dam capacity from May to September) in 45 hills zone dams and 18 plains zone dams from April survey to Sept./October survey is shown in table 6, and records hills zone dams having a 53.42% increase; compared with plains zone dams having a 35.16% increase. The one dam that recorded a negative replenishment of 35% in the plains zone was a “turkey nest” dam, used as a holding dam and highly supplemented with water from underground and River Murray sources. The one dam that recorded a negative replenishment of 5% (reduced from an estimated 95% to 90% capacity) is a small amount of water in a half ML dam, and attributed to native fauna watering and possible leakage. Table 6 - Winter dam volume increase by % during the study period – zone comparisons (all sites):
Dam Volume % increase in over winter - Hills Zone
0 20 50 75
0 20 50 75
0 20 55 75
5 20 60 80
5 20 60 80
10 20 60 85
10 25 60 85
10 27 65 90
15 30 65 90
20 30 70 90
20 30 70 90
20 40 70 95
20 40 75 95
20 45 75
9.
Dam Volume % increase in over winter - Plains Zone
-35 45
0 50
5 50
10 50
10 55
10 70
15 75
18 85
20 100
Hills Zone Dams
-20
0
20
40
60
80
100
1 2 3 4 5 6 7 8 9 10 11 12 13 14 15 16 17 18 19 20 21 22 23 24 25 26 27 28 29 30 31 32 33 34 35 36 37 38 39 40 41 42 43 44 45
Plains Zone Dams
-40
-20
0
20
40
60
80
100
1 2 3 4 5 6 7 8 9 10 11 12 13 14 15 16 17 18
Figure 6 - Winter dam volume increase by % during the study period – zone comparisons (all sites)
10
Supplementation information for dams (above catchment run-off) captured the percentages of bore water, lake and stream supplementation sources. 12 dams reported supplementation from 5%-95% during the April survey. Five dams were in the hills zone and four of these recorded current dam water as more than 50% supplementation. Seven dams were in the plains zone and five of these recorded current dam water as more than 50%. Dam leakage records that formed part of the audit whilst not quantifiable indicated that the dams surveyed are not considered to suffer great water losses this way. Landholders reported “moderate” leakage at 4 of the 75 sites, with the remainder reported as “low”, “a little” or “unknown”.
McMurray (2003) found 19% water usage through extraction and leakage for dams in a wide spread of catchments at 5 study areas in the hills zone of the Mount Lofty Ranges. Through the McMurray study, and what was reported during this audit, it is considered that leakage is a factor but likely to be minimal for the EMLR study area. Shade over dams was minimal with only 3 dams recording over 30% shade. The vast majority had no shade recorded (12 out of 55 hills dams and 2 out of 20 plains dams recording shade).
Landholder attitudes: Landholder attitudes were sought during the audits with some landholders contributing various points of view. Comments by landholders, quotes and field observations suggest current attitudes toward securing water resources are changing with future options being considered. For example landholders reported that supplementary water sources supplied to dams often have elevated salinity levels, limiting its use and increasing pressure to seek alternative supplies or to change management practices. Participating landholders expressed concern about the effects of the dry conditions experienced over the past decade. Going into the summer of 2007-8, a higher percentage of plains zone landholders considered their dams were not adequate (4 of 55 hills zone dams; 6 of 20 plains zones dams). Some landholders indicated that they were considering changes to stocking practices and actions to secure further water supplies. The extent of this change is unclear. Table 7 below summarizes the quotes given, while removing parts of the quote that would identify property locations. For confidentiality reasons, an undertaking was given to landholders not to identify their properties directly.
11.
Table 7. Landholder comments hills and plains zones:
Hills Zone – landholder comments (September 2007)
Dam doesn’t dry out but low levels over summer prevented pumping. Only overflowed twice in 13 years. Relies upon and uses bore more regularly.
A broken ball cock released 15% of volume
Changed farming practice of pumping from other dams for stock troughs and got a lot more hay feed this year. Would have to reduce stock numbers next year if similarly dry.
Box sheep at water sites
Dam came close to drying completely this year.
At the end of 2005 cattle numbers were reduced from 180 to 80
Dam overflowed once or twice only in 10 years. Relined with clay recent years. Stock reduced due to dry.
*Changed practices* Rely more on this dam now. Overflows most years
Unsure why dam became so salty over summer. Little pumping occurred. Not flushed for many years. Dried out in 1982.
Relies on Bore supplementing Dam. Bore thought to be 1300EC, but standing water level dropped 6 meters over the last 15 years
Don't use dam Recently acquired farm. Farm requires supplement with bore water
No bore water added since last reading Recently acquired farm. Lots of reeds. No Algae. Doesn't dry out. Springs above always flow but slower in summer
Added solar panel to pump around house side dams
Destocked somewhat partly due to paddock feed - partly water shortage. Needed to use rainwater for stock to get through summer. Algae Present.
5 ML dam proposed for 2nd title on the property. Dam application in for approval. Owner aims to value add for possible later sale.
Interest in revegetation only for this area.
Didn't cut hay last year as it was too short. Enough resources presently, but reducing stock a little.
De-stocked 3 years ago. Algae Present
No winter top up with salty bore water (4340 us/cm EC). Low dam salinity from winter runoff.
Last to dry - Never fills totally.
9 million gallons Tailings dam 200m away, but reclaimed
Have mains back up Never dries out
Well 100m away -1,990 EC
12.
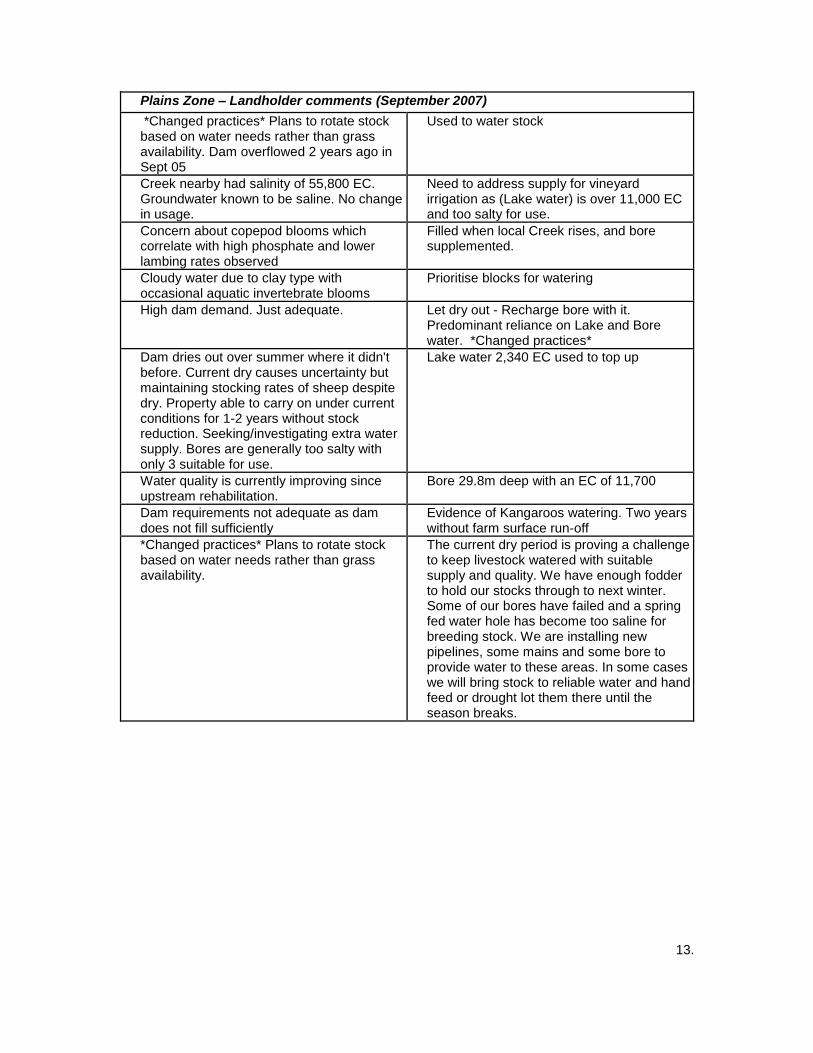
Plains Zone – Landholder comments (September 2007)
*Changed practices* Plans to rotate stock based on water needs rather than grass availability. Dam overflowed 2 years ago in Sept 05
Used to water stock
Creek nearby had salinity of 55,800 EC. Groundwater known to be saline. No change in usage.
Need to address supply for vineyard irrigation as (Lake water) is over 11,000 EC and too salty for use.
Concern about copepod blooms which correlate with high phosphate and lower lambing rates observed
Filled when local Creek rises, and bore supplemented.
Cloudy water due to clay type with occasional aquatic invertebrate blooms
Prioritise blocks for watering
High dam demand. Just adequate. Let dry out - Recharge bore with it. Predominant reliance on Lake and Bore water. *Changed practices*
Dam dries out over summer where it didn't before. Current dry causes uncertainty but maintaining stocking rates of sheep despite dry. Property able to carry on under current conditions for 1-2 years without stock reduction. Seeking/investigating extra water supply. Bores are generally too salty with only 3 suitable for use.
Lake water 2,340 EC used to top up
Water quality is currently improving since upstream rehabilitation.
Bore 29.8m deep with an EC of 11,700
Dam requirements not adequate as dam does not fill sufficiently
Evidence of Kangaroos watering. Two years without farm surface run-off
*Changed practices* Plans to rotate stock based on water needs rather than grass availability.
The current dry period is proving a challenge to keep livestock watered with suitable supply and quality. We have enough fodder to hold our stocks through to next winter. Some of our bores have failed and a spring fed water hole has become too saline for breeding stock. We are installing new pipelines, some mains and some bore to provide water to these areas. In some cases we will bring stock to reliable water and hand feed or drought lot them there until the season breaks.
13.
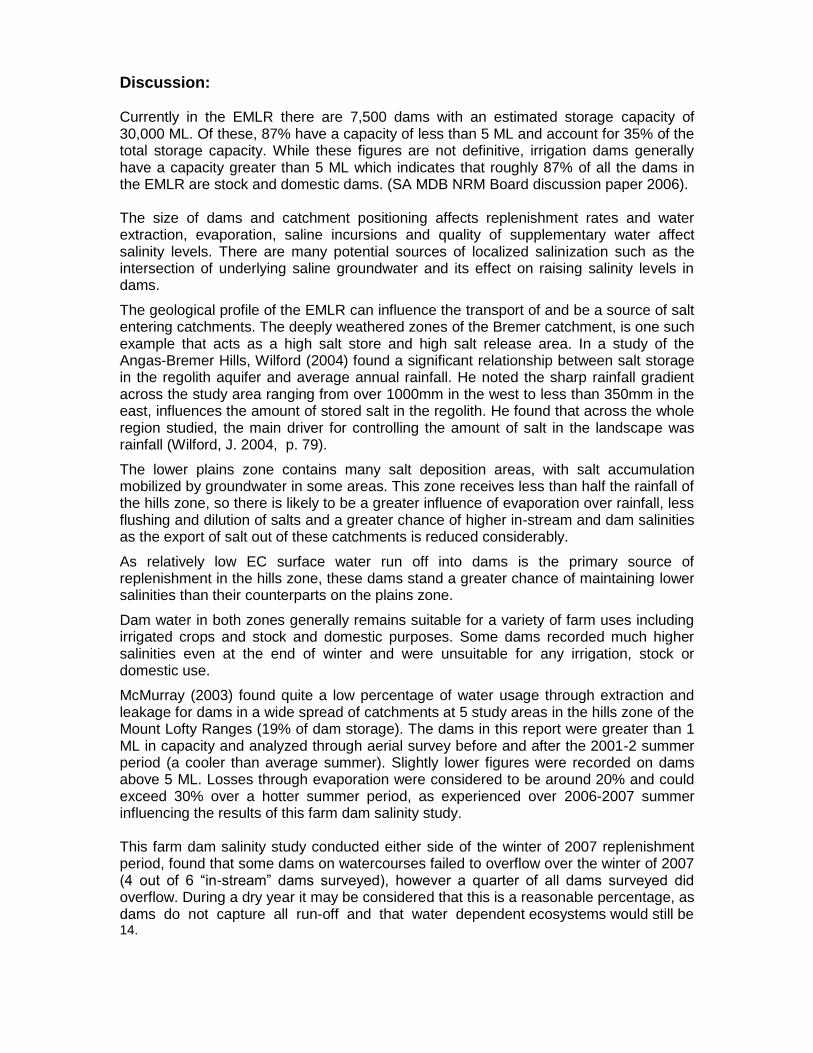
Discussion: Currently in the EMLR there are 7,500 dams with an estimated storage capacity of 30,000 ML. Of these, 87% have a capacity of less than 5 ML and account for 35% of the total storage capacity. While these figures are not definitive, irrigation dams generally have a capacity greater than 5 ML which indicates that roughly 87% of all the dams in the EMLR are stock and domestic dams. (SA MDB NRM Board discussion paper 2006). The size of dams and catchment positioning affects replenishment rates and water extraction, evaporation, saline incursions and quality of supplementary water affect salinity levels. There are many potential sources of localized salinization such as the intersection of underlying saline groundwater and its effect on raising salinity levels in dams.
The geological profile of the EMLR can influence the transport of and be a source of salt entering catchments. The deeply weathered zones of the Bremer catchment, is one such example that acts as a high salt store and high salt release area. In a study of the Angas-Bremer Hills, Wilford (2004) found a significant relationship between salt storage in the regolith aquifer and average annual rainfall. He noted the sharp rainfall gradient across the study area ranging from over 1000mm in the west to less than 350mm in the east, influences the amount of stored salt in the regolith. He found that across the whole region studied, the main driver for controlling the amount of salt in the landscape was rainfall (Wilford, J. 2004, p. 79).
The lower plains zone contains many salt deposition areas, with salt accumulation mobilized by groundwater in some areas. This zone receives less than half the rainfall of the hills zone, so there is likely to be a greater influence of evaporation over rainfall, less flushing and dilution of salts and a greater chance of higher in-stream and dam salinities as the export of salt out of these catchments is reduced considerably.
As relatively low EC surface water run off into dams is the primary source of replenishment in the hills zone, these dams stand a greater chance of maintaining lower salinities than their counterparts on the plains zone.
Dam water in both zones generally remains suitable for a variety of farm uses including irrigated crops and stock and domestic purposes. Some dams recorded much higher salinities even at the end of winter and were unsuitable for any irrigation, stock or domestic use.
McMurray (2003) found quite a low percentage of water usage through extraction and leakage for dams in a wide spread of catchments at 5 study areas in the hills zone of the Mount Lofty Ranges (19% of dam storage). The dams in this report were greater than 1 ML in capacity and analyzed through aerial survey before and after the 2001-2 summer period (a cooler than average summer). Slightly lower figures were recorded on dams above 5 ML. Losses through evaporation were considered to be around 20% and could exceed 30% over a hotter summer period, as experienced over 2006-2007 summer influencing the results of this farm dam salinity study. This farm dam salinity study conducted either side of the winter of 2007 replenishment period, found that some dams on watercourses failed to overflow over the winter of 2007 (4 out of 6 “in-stream” dams surveyed), however a quarter of all dams surveyed did overflow. During a dry year it may be considered that this is a reasonable percentage, as dams do not capture all run-off and that water dependent ecosystems would still be 14.
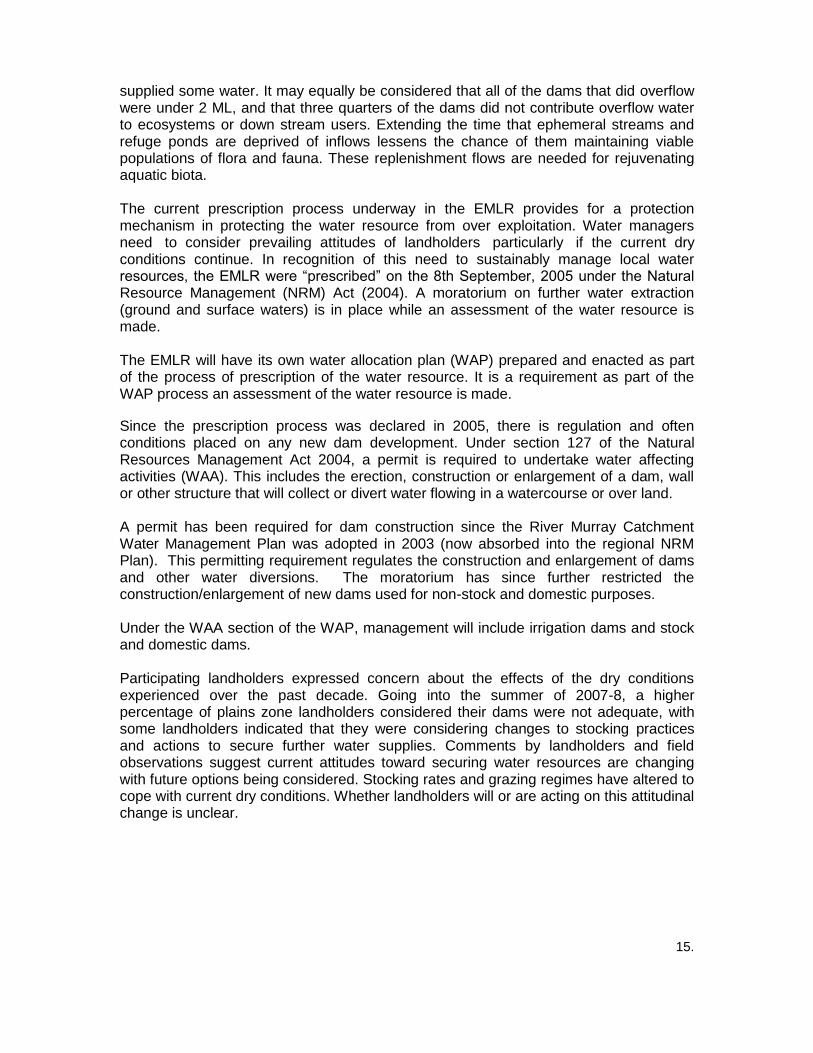
supplied some water. It may equally be considered that all of the dams that did overflow were under 2 ML, and that three quarters of the dams did not contribute overflow water to ecosystems or down stream users. Extending the time that ephemeral streams and refuge ponds are deprived of inflows lessens the chance of them maintaining viable populations of flora and fauna. These replenishment flows are needed for rejuvenating aquatic biota. The current prescription process underway in the EMLR provides for a protection mechanism in protecting the water resource from over exploitation. Water managers need to consider prevailing attitudes of landholders particularly if the current dry conditions continue. In recognition of this need to sustainably manage local water resources, the EMLR were “prescribed” on the 8th September, 2005 under the Natural Resource Management (NRM) Act (2004). A moratorium on further water extraction (ground and surface waters) is in place while an assessment of the water resource is made. The EMLR will have its own water allocation plan (WAP) prepared and enacted as part of the process of prescription of the water resource. It is a requirement as part of the WAP process an assessment of the water resource is made.
Since the prescription process was declared in 2005, there is regulation and often conditions placed on any new dam development. Under section 127 of the Natural Resources Management Act 2004, a permit is required to undertake water affecting activities (WAA). This includes the erection, construction or enlargement of a dam, wall or other structure that will collect or divert water flowing in a watercourse or over land. A permit has been required for dam construction since the River Murray Catchment Water Management Plan was adopted in 2003 (now absorbed into the regional NRM Plan). This permitting requirement regulates the construction and enlargement of dams and other water diversions. The moratorium has since further restricted the construction/enlargement of new dams used for non-stock and domestic purposes. Under the WAA section of the WAP, management will include irrigation dams and stock and domestic dams. Participating landholders expressed concern about the effects of the dry conditions experienced over the past decade. Going into the summer of 2007-8, a higher percentage of plains zone landholders considered their dams were not adequate, with some landholders indicated that they were considering changes to stocking practices and actions to secure further water supplies. Comments by landholders and field observations suggest current attitudes toward securing water resources are changing with future options being considered. Stocking rates and grazing regimes have altered to cope with current dry conditions. Whether landholders will or are acting on this attitudinal change is unclear.
15.
Recommendations: Further studies that could flow from this audit and that would inform natural resource management and in particular EMLR water allocation planning and reviews include:
Investigations into sources of dam salinity inputs and relationship to EMLR geology, groundwater flows and known salinity impact zones of dryland salinity or around 'deeply weathered zones' that are not extensively mapped.
Study water “mix” used by landholders and farm water management trends during dry periods and the impacts of these management decisions on local streams.
Repeating the same audit in 5 years time, expand sites and exploring climate
change effects, shifts in water resource and land usage, and conducting a detailed study of extraction rates from prescription metering information and from assessment of extraction by non-licensed users.
Acknowledgements: Bureau of Meteorology (Rainfall data) Mardi van der Wielen (SA Murray-Darling Basin NRM Board) Lyz Risby (SA Murray-Darling Basin NRM Board)
Bibliography: Barnett, S.R. and Zulfic, D. 2002, Mount Lofty Ranges Groundwater Assessment — Southern Fleurieu catchments. South Australia. Department for Water Resources. Report, DWR 2002/002. Carmichael, V.E. 2000, An assessment of water resources and recharge in the Hindmarsh River, Inman River and Currency Creek Catchments. University of Adelaide. M.AppSc thesis (unpublished).
Croft, S.J., Pedler, J.A. and Milne, T.I., (2005) Bushland Condition Monitoring Manual: Southern Mount Lofty Ranges (Vol. 3 – Vegetation Communities of the Southern Mount Lofty Ranges), Nature Conservation Society of SA Inc, Adelaide
Department for Water Resources 2001, South Australian River Murray Salinity Strategy 2001 - 2015, Adelaide, South Australia.
Department for Water Resources 2000, State Water Plan 2000, Adelaide, South Australia.
DWLBC 2004, Managing Salinity in the River Murray in South Australia. Consultation Workbook. Strategic Policy Division. Department of Water, Land and Biodiversity Conservation, Adelaide, February 2004
DWLBC 2004, Hydrometric Surface Water Monitoring - Fact Sheet 1 Department of Water, Land and Biodiversity Conservation, Adelaide. Available at: http://www.dwlbc.sa.gov.au/assets/files/fs1_hydrometric.pdf
16.
Dooley, T. and Henschke, C. 1999, Salinity management within the Goolwa to Wellington LAP area, Technical report, Goolwa-Wellington LAP, PIRSA Rural Solutions, Adelaide, S.A. Dooley, T. and Henschke, C. 2000, Dryland Salinity management within the Eastern Hills and Murray Plains LAP area, Technical report, Eastern Hills and Murray Plains LAP, PIRSA Rural Solutions, Adelaide, S.A. Dooley, T., Kuys, J., Ciganovic, P., Henschke, C., and Liddicoat, C. (2005) Recommended mechanisms for regional prioritisation and regional delivery for revegetation establishment and vegetation management programs in the SA MDB. Rural Solutions SA consultancy report for the SA MDB INRM Group. June 2005. Ecker, S. (1996). Local action planning in the Bremer Barker catchment. In: The Basin and Beyond. Proc of the Sixth Community Landcare Conference. Renmark SA, July 15 - 16, 1996. Ecker, S. (1998) Bremer Barker Local Action Plan - Draft. 14/10/98 Ecker, Saan (1998a) Groundwater modelling and salt balance analysis to determine target areas for recharge reduction in the Bremer Catchment. July 1998. A M.Sc. Thesis Dep't of Botany, Uni. of Adelaide. Ecker, S. and Natt, J. (1998) Community Driven Catchment Management in the Bremer Barker Catchment. In: Proceedings of the Seventh SA Community Landcare Conference, Tanunda SA. Community Landcare Conference Committee. Environmental Protection Agency (2006) River Murray and Lower Lakes catchment risk assessment for water quality: Results and management options Available at: http://www.epa.sa.gov.au/pdfs/risk (Riverland and other risk amanagement options available)
Hodson, A. 2002 Water and Salt in the Murray-Darling Basin – A national environmental problem, Educational Resource of Urrbrae Agricultural High School, Adelaide, South Australia
Jansen, A., Robertson, A., Thompson, L. and Wilson, A. (2005) Rapid Appraisal of Riparian Condition, River & Riparian Land Management Technical Guideline Number 4A, Land & Water, Canberra, Australia. Available at: http://www.lwa.gov.au/library/scripts/objectifyMedia.(Accessed 17-1-07) Jolly, I, Walker. G., Stace, P. van der Wel, B. & Leaney R., 2000 Assessing the Impacts of Dryland Salinity on South Australia’s water resources, CSIRO Land & Water Technical Report 9/00, Adelaide, South Australia. Available at: http://www.clw.csiro.au/publications/technical2000/tr9-00.pdf (Accessed 17-1-07) Knight, JH, Gilfedder, M., and Walker, GR, 2002, 'Impact of Irrigation and dryland development on groundwater discharge to rivers: A unit response approach to cumulative impacts analysis', CSIRO Land and Water technical Report 03/02, August 2002 Kuys, J., Stokes, Z. (2006) Regional Priorities for Revegetation within the Eastern Mount Lofty Ranges and Dryland Areas of the South Australian Murray-Darling Basin Paper 2: Prioritisation Processes, Priority Areas and Implementation Mechanism, Rural Solutions SA consultancy report for the SA MDB NRM Board, 2006 Leaney, F.W.J. and Herczeg, A.L., 1999. The origin of fresh groundwater in the SW Murray Basin and its potential for salinisation. CSIRO Division of Land and Water, Technical report, 7/99. McMurray, D. 2003. Assessment of Water Use from Farm Dams in the Mount Lofty Ranges South Australia. Department of Water, Land and Biodiversity Conservation.
17.
McMurray, D., 2001. Current and Potential Future Farm Dam Development in the Central Mount Lofty Ranges, South Australia. Department for Water Resources, South Australia. DWR 01.11.0001. Miles M.W., Kirk J.A. and Meldrum, D.D. (2001) Irrigation SIMPACT: A Salt Load Assessment Model for New Highland Irrigation along the River Murray in South Australia. Planning SA, Adelaide Miles, M. 2005, How SIMPACT 2 was used to generate the River Murray Salinity Impact Zone line. Department for Environment and Heritage (GIS methodology report) Adelaide, SA S.A. Murray-Darling Basin Natural Resources Management Board, 2006 Managing New Farm Dams in the Eastern Mount Lofty Ranges Water Affecting Activities – Permits for dam construction enlargement or diversion structures Discussion Paper 1. Avail. at: http://www.samdbnrm.sa.gov.au/ Savadamuthu, K. 2003, Surface Water Assessment of the Upper Finniss Catchment. South Australia. Department of Water, Land and Biodiversity Conservation. Report, DWLBC 2003/18. Schofield, N. Burt,A. and Connell, D. 2003, Environmental water allocation - Principals policies and practices, Land & Water Australia, Canberra Publishing & Printing On-line: http://www.lwa.gov.au/downloads/publications (Accessed: 24-9-06) Smitt, C. 2007 Updating Stream Salinity Curves for the Catchments of the Eastern Mount Lofty Ranges, Hyder Consulting Report, SA Murray-Darling Basin Natural Resources Management Board, South Australia. Smitt, C. Cox, J., Davies, P., (2004) Options Analysis for Salinity Management in the Lower Murray of South Australia: Milestone $: Catchment Salt Balances, , Land & Water Australia, Canberra Publishing & Printing On-line: http://www.lmi.org.au/downloads/salinity/lmi_milestone4.pdf Smitt, C., Cox, J., Herczeg, A., Wilford, J., Henschke, C. 2007 The origins, mobilisation and management of salt in the eastern Mt Lofty Ranges of South Australia Technical Report (Draft - Under review), CSIRO Land & Water, Adelaide, South Australia. Smitt, C., Herczeg, A., Davies, P., and Cox, J. (2004). Identifying Sources of Salt and its Mobilisation Processes in the Eastern Mt Lofty Ranges, South Australia. The 9th Murray-Darling Basin Groundwater Workshop. Smitt, C., Jolly, I., Dowling T. & Walker, G., 2002 Assessment of Historical Data for the Murray-Darling Basin Ministerial Council’s End-of-Valley Target Stations, Technical Report 40/02, CSIRO Land & Water, Adelaide, South Australia, Southern Hills Soil Conservation Board District Plan 1995, A guide to better land management in the Southern Hills Soil Conservation District, Primary Industies, SA, Adelaide. Spies, P. & Woodgate, P. (2005) Salinity Mapping Methods in an Australian Context, Department of the Environment and Heritage; and Agriculture, Fisheries and Forestry, Canberra, Australia Available at: http://www.nrm.gov.au/publications/salinity-mapping/pubs/salinity-mapping.pdf Walker, G., Cox, J., Wilford, J. and Liddicoat, C. (2004). Application of Airborne Geophysical Techniques to the Investigation of Salt Stores and Stream Salinity in the Bremer Hills, South Australia; A synthesis of research carried out under the South Australian Salinity Mapping and Management Support Project (SA AMMSP) Department of Water, Land and Biodiversity Conservation. Report, DWLBC 2004/ 38. ISBN 0-9756945-3-7. 18.
Walker, G., Cresswell, R.G., Munday, T. and Liddicoat, C. (2004). South Australian Salinity Mapping and Management Support Project: Final Report (Overall Project Summary Report), South Australia. Department of Water, Land and Biodiversity Conservation. Report, DWLBC 2004/ 39. ISBN 0-9756945-5-3. Ward, R. C. and Robinson, M., 2000, Principles of Hydrology, 4th Edition, McGraw-Hill, Berkshire, England. Wilford, J. 2004 Regolith-Landforms and salt stores in the Angas-Bremer Hills, PIRSA Rural Solutions, Adelaide, S.A. Walker, G., et.al. 1998, Historical stream salinity trends and catchment salt balances in the Murray–Darling Basin, Australia, CSIRO Land & Water Technical Report 33/98 Williams, J., Walker G.R. and Hatton, T.J., (undated) Dryland Salination: A Challenge for Land and Water Management in the Australian Landscape, CSIRO Land and Water, Canberra, Adelaide and Perth Laboratories, Report, Canberra ACT, Australia. Available at: http://www.clw.csiro.au/staff/WilliamsJ/Salinity_chapter_final_v11.pdf (Accessed 17-1-07) Williamson, D.R. (1990). Effect of dryland salinity on selected water resources in South Australia. CSIRO Division of Water Resources. Technical Report to Engineering and Water Supply Dept. South Australia. 19.