Report on the Annual Basic Benefits Valuation of the ...
57
Report on the Annual Basic Benefits Valuation of the School Employees Retirement System of Ohio Prepared as of June 30, 2018
Transcript of Report on the Annual Basic Benefits Valuation of the ...
Report on the Annual Basic Benefits Valuation of the School Employees Retirement System of Ohio
Prepared as of June 30, 2018

Off
Cavanaugh Macdonald CC OO NN SS UU LL TT II NN GG,, LL LL CC
The experience and dedication you deserve
3550 Busbee Pkwy, Suite 250, Kennesaw, GA 30144Phone (678) 388-1700 • Fax (678) 388-1730
www.CavMacConsulting.com Offices in Kennesaw, GA • Bellevue, NE
November 7, 2018
Board of Trustees School Employees Retirement System of Ohio 300 East Broad Street, Suite 100 Columbus, OH 43215-3746
Dear Members of the Board:
Presented in this report are the results of the annual actuarial valuation of the basic benefits provided under the School Employees Retirement System of Ohio (SERS) as of June 30, 2018. The purpose of the valuation was to measure the System’s funding progress and to determine the actuarially determined employer contribution rates for the fiscal year beginning July 1, 2018.
The valuation is based upon data, furnished by the SERS staff, concerning active, inactive and retiree members along with pertinent financial information. The complete cooperation of the SERS staff in furnishing materials requested is hereby acknowledged with appreciation.
Future actuarial results may differ significantly from the current results presented in this report due to such factors as the following: plan experience differing from that anticipated by the economic or demographic assumptions; changes in economic or demographic assumptions; increases or decreases expected as part of the natural operation of the methodology used for these measurements (such as the end of an amortization period or additional cost or contribution requirements based on the plan’s funded status); and changes in plan provisions or applicable law. Since the potential impact of such factors is outside the scope of a normal annual actuarial valuation, an analysis of the range of results is not presented herein.
The undersigned are members of the American Academy of Actuaries and meet the Qualification Standards of the American Academy of Actuaries to render the actuarial opinion contained herein.
Respectfully submitted,
Todd B. Green, ASA, FCA, MAAA John J. Garrett, ASA, FCA, MAAA Principal and Consulting Actuary Principal and Consulting Actuary
TBG/JJG:bvb
TABLE OF CONTENTS
Section Item Page
Executive Summary 1
I Summary of Principal Results 7
II Membership Data 9
III Assets 11
IV Comments on Valuation 12
V Derivation of Experience Gains and Losses 13
VI Actuarially Determined Contribution Rates 16
VII Schedule of Funding Progress 17
Schedule
A Valuation Balance Sheet and Solvency Test 18
B Development of Actuarial Value of Assets 20
C Statement of Actuarial Assumptions and Methods 21
D Summary of Benefit and Contribution Provisions 24
E Detailed Tabulations of the Data 30
F Gain/Loss Analysis Details 41
G Glossary 51
Appendix
A Actuarial Accrued Liabilities 52
B Breakdown of Total and Accrued Liabilities 53
C Comparative Schedule 54
Page 1
REPORT ON THE ANNUAL VALUATION OF THE SCHOOL EMPLOYEES RETIREMENT SYSTEM OF OHIO
PREPARED AS OF JUNE 30, 2018
EXECUTIVE SUMMARY
The School Employees Retirement System of Ohio (SERS or System) is a defined benefit public pension fund that provides pensions and access to health care coverage for retired school employees who are covered in nonteaching positions. This includes bus drivers, custodians, treasurers, business officials, administrative assistants, food service providers, and educational aides. This report presents the results of the June 30, 2018 actuarial funding valuation of the System. The primary purposes of performing the actuarial funding valuation are to:
determine the sufficiency of the Statutory Contribution Rate as set forth in the Ohio statutes; determine the experience of the System since the last valuation date; disclose asset and liability measures as of the valuation date; and analyze and report on trends in System contributions, assets, and liabilities over the past several
years.
Since the previous valuation, Senate Bill 8 (SB 8) was enacted, granting the Board authority to decide how many anniversaries a new benefit recipient must achieve before they become eligible to receive a COLA. The Board exercised its authority and set forth a rule that benefits that begin on and after April 1, 2018 must wait until the fourth anniversary to become eligible for a COLA.
The actuarial valuation results provide a “snapshot” view of the System’s financial condition on June 30, 2018. Actuarial gains and losses result when the actual experience of the plan (such as asset return, pay increases, turnover, deaths, etc.) is different from that expected by the actuarial assumptions. The System’s unfunded actuarial accrued liability (UAAL) was expected to be $5,895.6 million as of June 30, 2018, taking into account contributions from the employers and members of $759.9 million. The actual UAAL is $5,985.5 million. The net increase of $89.9 million is attributable to liability and investment gains and losses which are detailed in Section V. These losses were offset by the enactment of SB 8. The remaining amortization period of the UAAL is 26 years as of June 30, 2018.
The valuation is based on a set of actuarial assumptions which were adopted by the Board based on the five-year experience study for the period ending June 30, 2015. These assumptions are presented in Schedule C.
Page 2
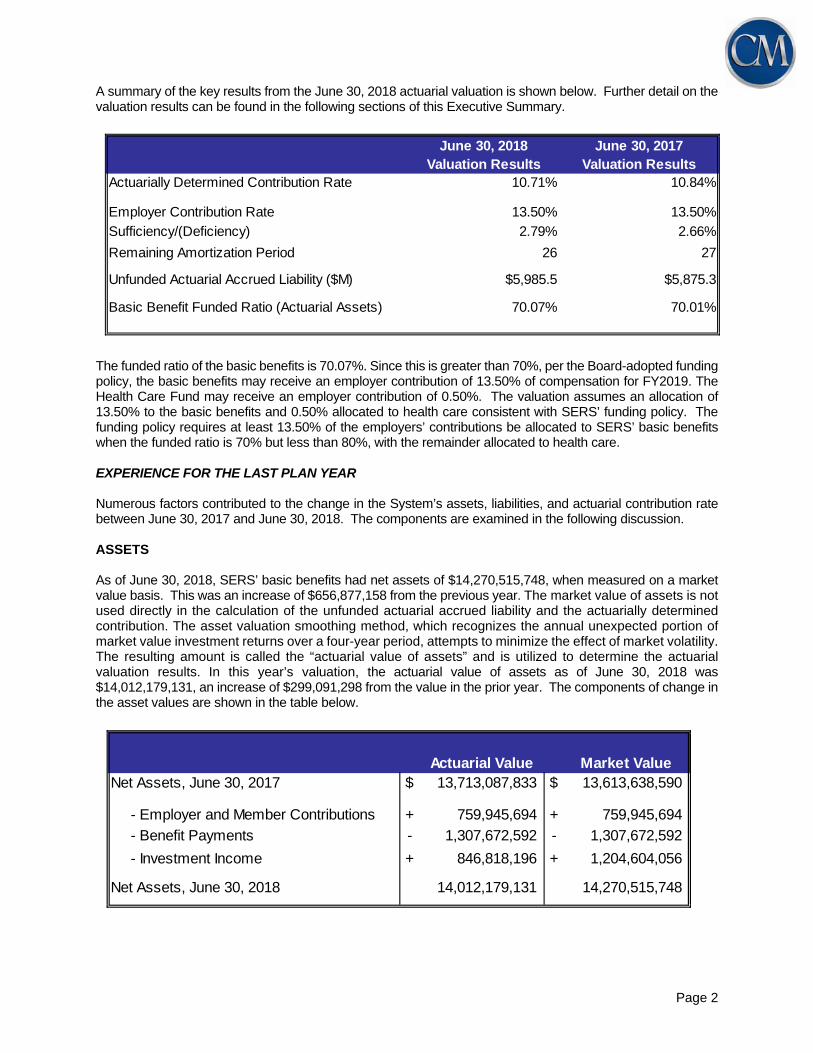
A summary of the key results from the June 30, 2018 actuarial valuation is shown below. Further detail on the valuation results can be found in the following sections of this Executive Summary.
June 30, 2018 June 30, 2017Valuation Results Valuation Results
Actuarially Determined Contribution Rate 10.71% 10.84%
Employer Contribution Rate 13.50% 13.50%
Sufficiency/(Deficiency) 2.79% 2.66%
Remaining Amortization Period 26 27
Unfunded Actuarial Accrued Liability ($M) $5,985.5 $5,875.3
Basic Benefit Funded Ratio (Actuarial Assets) 70.07% 70.01%
The funded ratio of the basic benefits is 70.07%. Since this is greater than 70%, per the Board-adopted funding policy, the basic benefits may receive an employer contribution of 13.50% of compensation for FY2019. The Health Care Fund may receive an employer contribution of 0.50%. The valuation assumes an allocation of 13.50% to the basic benefits and 0.50% allocated to health care consistent with SERS’ funding policy. The funding policy requires at least 13.50% of the employers’ contributions be allocated to SERS’ basic benefits when the funded ratio is 70% but less than 80%, with the remainder allocated to health care.
EXPERIENCE FOR THE LAST PLAN YEAR
Numerous factors contributed to the change in the System’s assets, liabilities, and actuarial contribution rate between June 30, 2017 and June 30, 2018. The components are examined in the following discussion.
ASSETS
As of June 30, 2018, SERS’ basic benefits had net assets of $14,270,515,748, when measured on a market value basis. This was an increase of $656,877,158 from the previous year. The market value of assets is not used directly in the calculation of the unfunded actuarial accrued liability and the actuarially determined contribution. The asset valuation smoothing method, which recognizes the annual unexpected portion of market value investment returns over a four-year period, attempts to minimize the effect of market volatility. The resulting amount is called the “actuarial value of assets” and is utilized to determine the actuarial valuation results. In this year’s valuation, the actuarial value of assets as of June 30, 2018 was $14,012,179,131, an increase of $299,091,298 from the value in the prior year. The components of change in the asset values are shown in the table below.
Actuarial Value Market ValueNet Assets, June 30, 2017 $ 13,713,087,833 $ 13,613,638,590
- Employer and Member Contributions + 759,945,694 + 759,945,694
- Benefit Payments - 1,307,672,592 - 1,307,672,592
- Investment Income + 846,818,196 + 1,204,604,056
Net Assets, June 30, 2018 14,012,179,131 14,270,515,748
Page 3
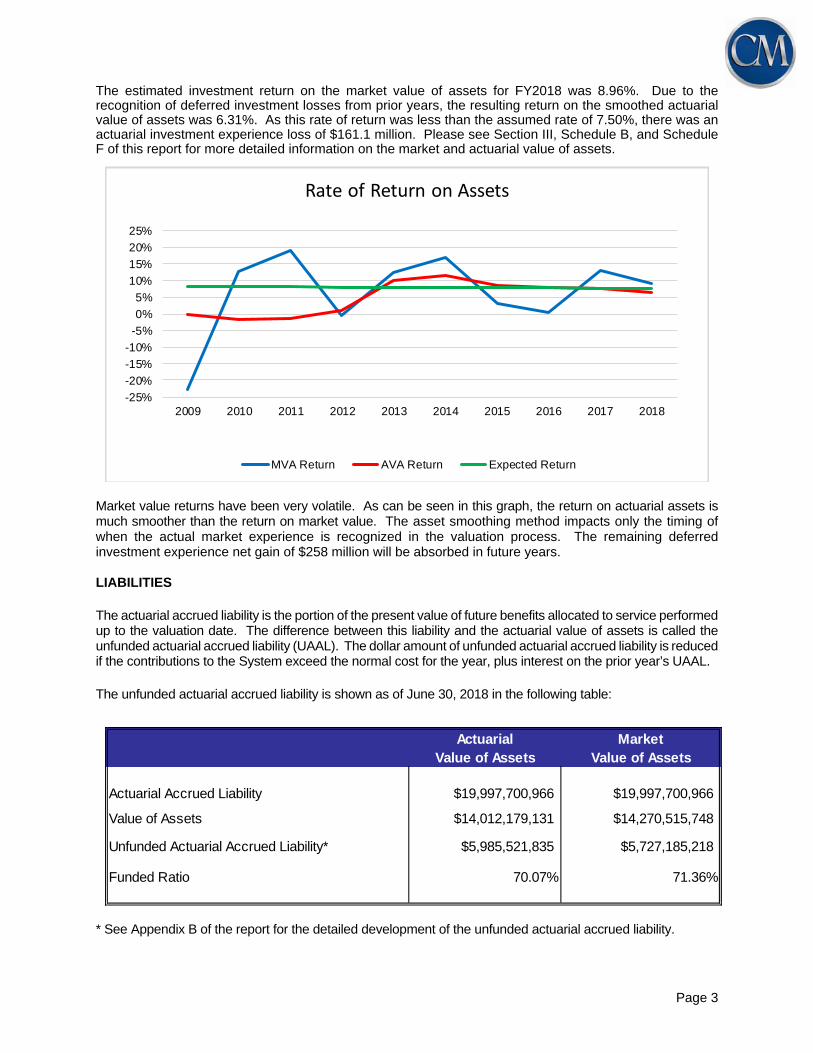
The estimated investment return on the market value of assets for FY2018 was 8.96%. Due to the recognition of deferred investment losses from prior years, the resulting return on the smoothed actuarial value of assets was 6.31%. As this rate of return was less than the assumed rate of 7.50%, there was an actuarial investment experience loss of $161.1 million. Please see Section III, Schedule B, and Schedule F of this report for more detailed information on the market and actuarial value of assets.
-25%
-20%
-15%
-10%
-5%
0%
5%
10%
15%
20%
25%
2009 2010 2011 2012 2013 2014 2015 2016 2017 2018
Rate of Return on Assets
MVA Return AVA Return Expected Return
Market value returns have been very volatile. As can be seen in this graph, the return on actuarial assets is much smoother than the return on market value. The asset smoothing method impacts only the timing of when the actual market experience is recognized in the valuation process. The remaining deferred investment experience net gain of $258 million will be absorbed in future years. LIABILITIES The actuarial accrued liability is the portion of the present value of future benefits allocated to service performed up to the valuation date. The difference between this liability and the actuarial value of assets is called the unfunded actuarial accrued liability (UAAL). The dollar amount of unfunded actuarial accrued liability is reduced if the contributions to the System exceed the normal cost for the year, plus interest on the prior year’s UAAL. The unfunded actuarial accrued liability is shown as of June 30, 2018 in the following table:
Actuarial MarketValue of Assets Value of Assets
Actuarial Accrued Liability $19,997,700,966 $19,997,700,966
Value of Assets $14,012,179,131 $14,270,515,748
Unfunded Actuarial Accrued Liability* $5,985,521,835 $5,727,185,218
Funded Ratio 70.07% 71.36%
* See Appendix B of the report for the detailed development of the unfunded actuarial accrued liability.
Page 4
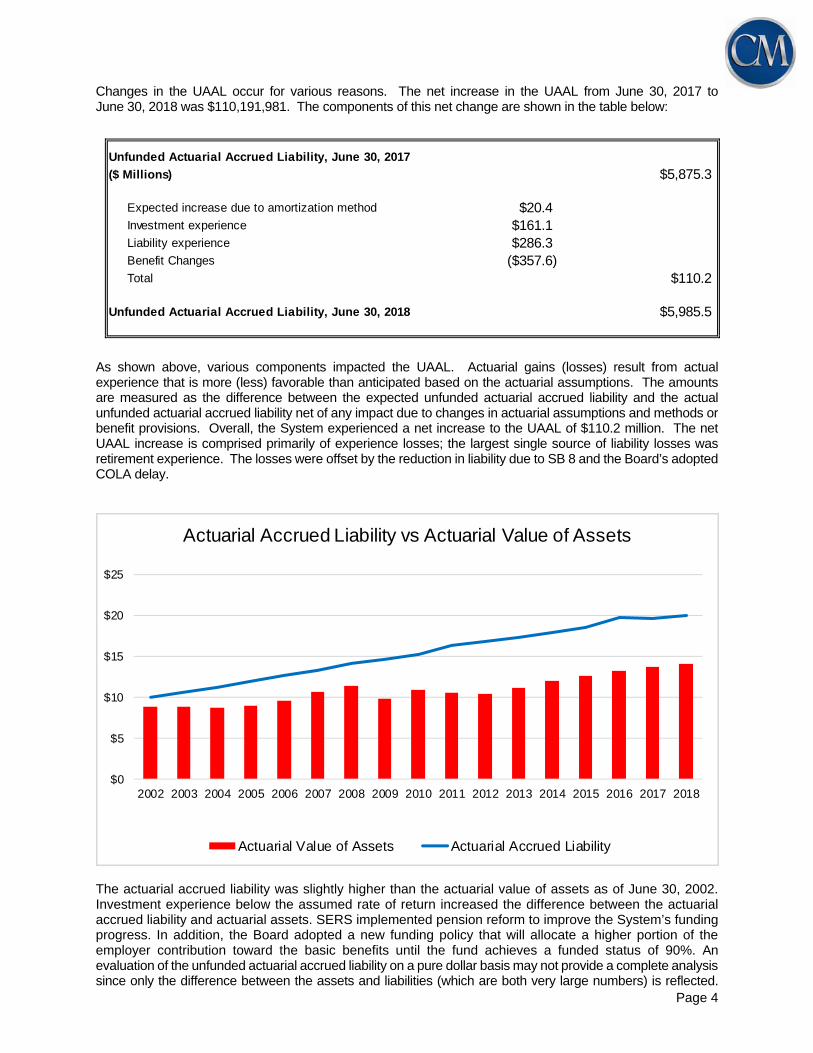
Changes in the UAAL occur for various reasons. The net increase in the UAAL from June 30, 2017 to June 30, 2018 was $110,191,981. The components of this net change are shown in the table below:
Unfunded Actuarial Accrued Liability, June 30, 2017
($ Millions) $5,875.3
Expected increase due to amortization method $20.4 Investment experience $161.1 Liability experience $286.3 Benefit Changes ($357.6) Total $110.2
Unfunded Actuarial Accrued Liability, June 30, 2018 $5,985.5
As shown above, various components impacted the UAAL. Actuarial gains (losses) result from actual experience that is more (less) favorable than anticipated based on the actuarial assumptions. The amounts are measured as the difference between the expected unfunded actuarial accrued liability and the actual unfunded actuarial accrued liability net of any impact due to changes in actuarial assumptions and methods or benefit provisions. Overall, the System experienced a net increase to the UAAL of $110.2 million. The net UAAL increase is comprised primarily of experience losses; the largest single source of liability losses was retirement experience. The losses were offset by the reduction in liability due to SB 8 and the Board’s adopted COLA delay.
$0
$5
$10
$15
$20
$25
2002 2003 2004 2005 2006 2007 2008 2009 2010 2011 2012 2013 2014 2015 2016 2017 2018
Actuarial Accrued Liability vs Actuarial Value of Assets
Actuarial Value of Assets Actuarial Accrued Liability
The actuarial accrued liability was slightly higher than the actuarial value of assets as of June 30, 2002. Investment experience below the assumed rate of return increased the difference between the actuarial accrued liability and actuarial assets. SERS implemented pension reform to improve the System’s funding progress. In addition, the Board adopted a new funding policy that will allocate a higher portion of the employer contribution toward the basic benefits until the fund achieves a funded status of 90%. An evaluation of the unfunded actuarial accrued liability on a pure dollar basis may not provide a complete analysis since only the difference between the assets and liabilities (which are both very large numbers) is reflected.

Page 5
Another way to evaluate the unfunded actuarial accrued liability and the progress made in its funding is to track the funded ratio, the ratio of the actuarial value of assets to the actuarial accrued liability.
6/30/14 6/30/15 6/30/16 6/30/17 6/30/18
Funded Ratio 67.30% 68.10% 66.66% 70.01% 70.07%
Unfunded Actuarial Accrued Liability ($M) 5,851.3$ 5,901.6$ 6,591.1$ 5,875.3$ $5,985.5
The longer-term historical funded ratio information is shown in the chart below.
89%
82%
77%74% 76%
80% 81%
67%
72%
64%62%
65%67% 68% 67%
70% 70%
50%
55%
60%
65%
70%
75%
80%
85%
90%
95%
2002 2003 2004 2005 2006 2007 2008 2009 2010 2011 2012 2013 2014 2015 2016 2017 2018
Funded Ratio
Investment returns are the primary source of decreases in the funded ratio as can be seen during the 2002-2003 “tech bubble” recession and the “great” recession of 2008-2009. CONTRIBUTION RATE Under the Entry Age Normal cost method, the actuarial contribution rate consists of two components: a "normal cost" for the portion of projected liabilities allocated by the actuarial cost method to service
of members during the year following the valuation date which is funded by both member and employer contributions, and
an "unfunded actuarial accrued liability contribution" for the excess of the portion of projected liabilities allocated to service-to-date over the actuarial value of assets.

Page 6
See Section VI of the report for the detailed development of these contribution rates which are summarized in the following table:
Contribution Rates June 30, 2018 June 30, 2017
1. Employer Portion of Normal Cost Rate (0.02%) 0.44%
2. UAAL Contribution Rate 10.73% 10.40%
3. Total Actuarial Determined Contribution Rate (1) + (2) 10.71% 10.84%
4. Funded Ratio 70.07% 70.01%
5. Total Employer Contribution Rate 14.00% 14.00%
6. Amount Allocated to Basic Benefits 13.50% 13.50%
As discussed earlier, SERS’ basic benefits includes retirement, disability and survivor benefits, along with Medicare Part B reimbursements and lump sum retiree death benefits. SERS also provides access to health care coverage for retiree members. The Health Care Fund is partially supported by employer contributions that are not required for actuarially funding basic benefits. The funding policy is expected to accelerate the pace at which SERS’ basic benefits will achieve a funded ratio equal to 90%.

Page 7
REPORT ON THE ANNUAL VALUATION OF THE SCHOOL EMPLOYEES RETIREMENT SYSTEM OF OHIO
PREPARED AS OF JUNE 30, 2018
SECTION I – SUMMARY OF PRINCIPAL RESULTS 1. This report, prepared as of June 30, 2018, presents the results of the annual actuarial valuation of
the basic benefits provided under the System, including pension, Medicare Part B reimbursement
and post-retirement death benefits. For convenience of reference, the principal results of the
valuation and a comparison with the preceding year’s results are summarized in the following table.
SUMMARY OF PRINCIPAL RESULTS
June 30, 2018 June 30, 2017
Active members included in valuation
Number 158,343 157,981
Annual Compensation $3,332,395,171 $3,302,805,662
Retirees
Number 81,332 79,157
Annual allowances $1,211,935,636 $1,162,015,515
Deferred Vesteds
Number 5,091 4,735
Annual deferred allowances $32,213,683 $24,428,538
Assets (net of Health Care Assets)
Market related actuarial value $14,012,179,131 $13,713,087,833
Market value $14,270,515,748 $13,613,638,590
Unfunded Accrued Liability $5,985,521,835 $5,875,329,854
Funded Ratio (MVA/AAL)
Pension Benefits 70.68% 70.70%
Medicare Part B 41.10% 38.00%
Post-retirement Death Benefits 61.58% 61.04%
Actuarially Determined Contribution Rate
Normal (0.02)% 0.44%
Accrued liability 10.73% 10.40%
Total 10.71% 10.84%
Funding Policy Contribution Rate 13.50% 13.50%
Accrued liability amortization period (years) 26 27

Page 8
2. The statute sets a contribution cap of 24% of payroll: 14% from employers and 10% from
employees. Employer contributions in excess of those required to support the basic benefits
may be allocated to retiree health care funding. If the funded ratio is less than 70%, the entire
14% employers’ contribution shall be allocated to SERS’ basic benefits. If the funded ratio is
70% but less than 80%, at least 13.50% of the employers’ contribution shall be allocated to
SERS’ basic benefits, with the remainder (if any) allocated to the Health Care Fund. If the
funded ratio is 80% but less than 90%, at least 13.25% of the employers’ contribution shall be
allocated to SERS’ basic benefits, with the remainder (if any) allocated to the Health Care Fund.
If the funded ratio is 90% or greater, the Health Care Fund may receive any portion of the
employers’ contribution that is not needed to fund SERS’ basic benefits.
3. The enactment of SB 8 granted authority to the Board to decide how many anniversaries a new
benefit recipient must achieve before they become eligible to receive a COLA. The Board
exercised its authority and set forth a rule that benefit recipients must wait until the fourth
anniversary to become eligible for a COLA. This change became effective for benefits
commencing on or after April 1, 2018.
4. The valuation balance sheet showing the results of the valuation is given in Schedule A.
5. Comments on the valuation results are given in Section IV, comments on the experience and
the sources of actuarial gains and losses during the valuation year are given in Section V, and
the rates of contribution payable by employers are given in Section VI.
6. Schedule B of this report presents the development of the actuarial value of assets. Schedule
C details the actuarial assumptions and methods employed. Schedule D gives a summary of
the benefit and contribution provisions of the plan.

Page 9
SECTION II – MEMBERSHIP DATA
Data regarding the membership of the System for use as a basis for the valuation were furnished by the
System’s staff. The following tables summarize the membership of the system as of June 30, 2018 upon
which the valuation was based. Detailed tabulations of the data are given in Schedule E.
Active Members
Number Payroll Salary Age Service
158,343 $3,332,395,171 $21,045 46.8 7.4
Group Averages
The total number of active members includes 47,793 vested members and 110,550 non-vested members.
Those who reach 25 years of service on or before August 1, 2017 were eligible to retire under the previous
age and service credit eligibility requirements.
The following table shows a six-year schedule of active member valuation data.
SCHEDULE OF SERS ACTIVE MEMBER VALUATION DATA
Valuation Annual Annual % Increase inDate Number Payroll Average Pay Average Pay
6/30/2013 121,642 $2,746,827,535 $22,581 (1.3)%6/30/2014 121,251 2,759,281,606 22,757 0.8 6/30/2015 122,855 2,845,443,802 23,161 1.8 6/30/2016 124,540 2,932,236,551 23,545 1.7 6/30/2017 157,981* 3,302,805,662 20,906 (11.2) 6/30/2018 158,343 3,332,395,171 21,045 0.7
*Effective in FY2017, the active member headcount reflects an increase of members who have been re-categorized from inactive to active status.
Page 10
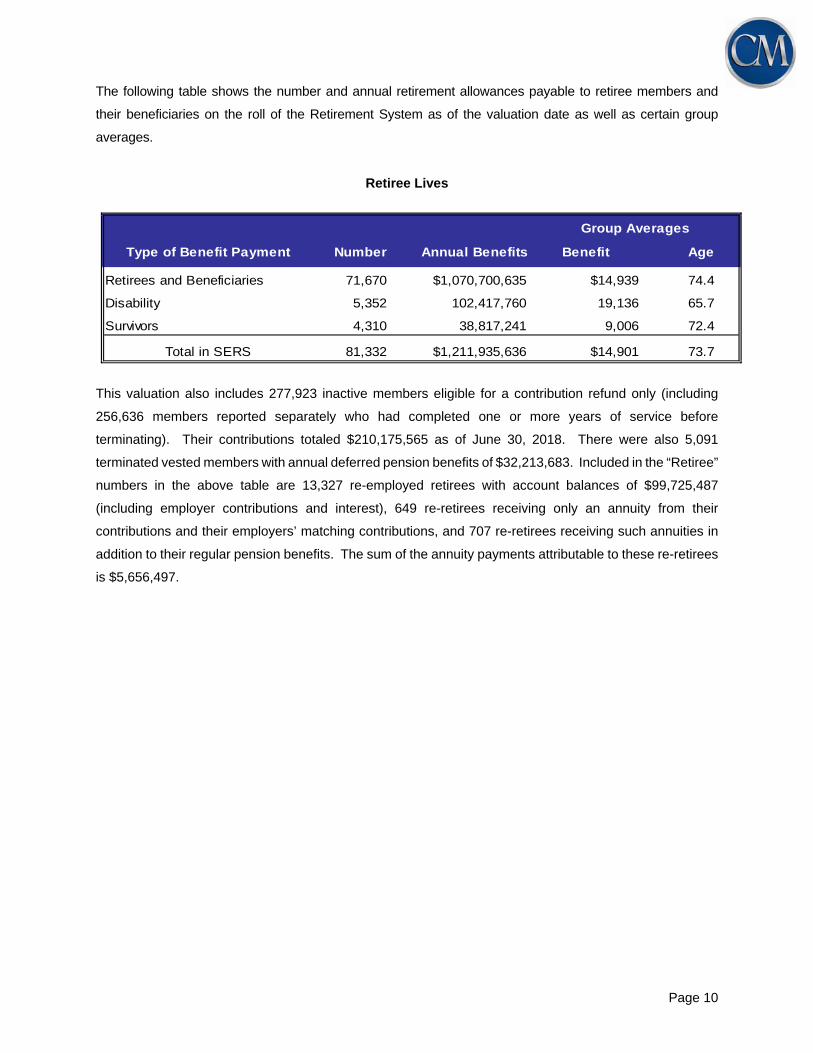
The following table shows the number and annual retirement allowances payable to retiree members and
their beneficiaries on the roll of the Retirement System as of the valuation date as well as certain group
averages.
Retiree Lives
Type of Benefit Payment Number Annual Benefits Benefit Age
Retirees and Beneficiaries 71,670 $1,070,700,635 $14,939 74.4
Disability 5,352 102,417,760 19,136 65.7
Survivors 4,310 38,817,241 9,006 72.4
Total in SERS 81,332 $1,211,935,636 $14,901 73.7
Group Averages
This valuation also includes 277,923 inactive members eligible for a contribution refund only (including
256,636 members reported separately who had completed one or more years of service before
terminating). Their contributions totaled $210,175,565 as of June 30, 2018. There were also 5,091
terminated vested members with annual deferred pension benefits of $32,213,683. Included in the “Retiree”
numbers in the above table are 13,327 re-employed retirees with account balances of $99,725,487
(including employer contributions and interest), 649 re-retirees receiving only an annuity from their
contributions and their employers’ matching contributions, and 707 re-retirees receiving such annuities in
addition to their regular pension benefits. The sum of the annuity payments attributable to these re-retirees
is $5,656,497.
Page 11
SECTION III – ASSETS
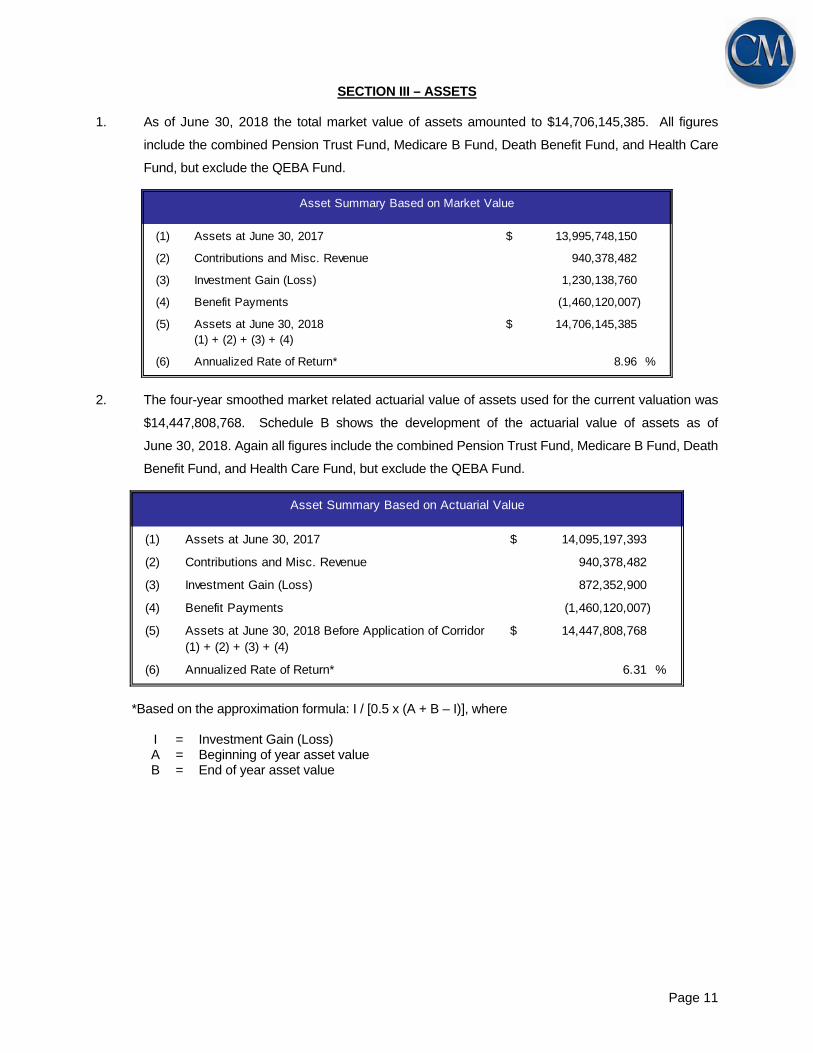
1. As of June 30, 2018 the total market value of assets amounted to $14,706,145,385. All figures
include the combined Pension Trust Fund, Medicare B Fund, Death Benefit Fund, and Health Care
Fund, but exclude the QEBA Fund.
(1) Assets at June 30, 2017 $ 13,995,748,150
(2) Contributions and Misc. Revenue 940,378,482
(3) Investment Gain (Loss) 1,230,138,760
(4) Benefit Payments (1,460,120,007)
(5) Assets at June 30, 2018 $ 14,706,145,385(1) + (2) + (3) + (4)
(6) Annualized Rate of Return* 8.96 %
Asset Summary Based on Market Value
2. The four-year smoothed market related actuarial value of assets used for the current valuation was
$14,447,808,768. Schedule B shows the development of the actuarial value of assets as of
June 30, 2018. Again all figures include the combined Pension Trust Fund, Medicare B Fund, Death
Benefit Fund, and Health Care Fund, but exclude the QEBA Fund.
(1) Assets at June 30, 2017 $ 14,095,197,393
(2) Contributions and Misc. Revenue 940,378,482
(3) Investment Gain (Loss) 872,352,900
(4) Benefit Payments (1,460,120,007)
(5) Assets at June 30, 2018 Before Application of Corridor $ 14,447,808,768(1) + (2) + (3) + (4)
(6) Annualized Rate of Return* 6.31 %
Asset Summary Based on Actuarial Value
*Based on the approximation formula: I / [0.5 x (A + B – I)], where
I = Investment Gain (Loss) A = Beginning of year asset value B = End of year asset value
Page 12
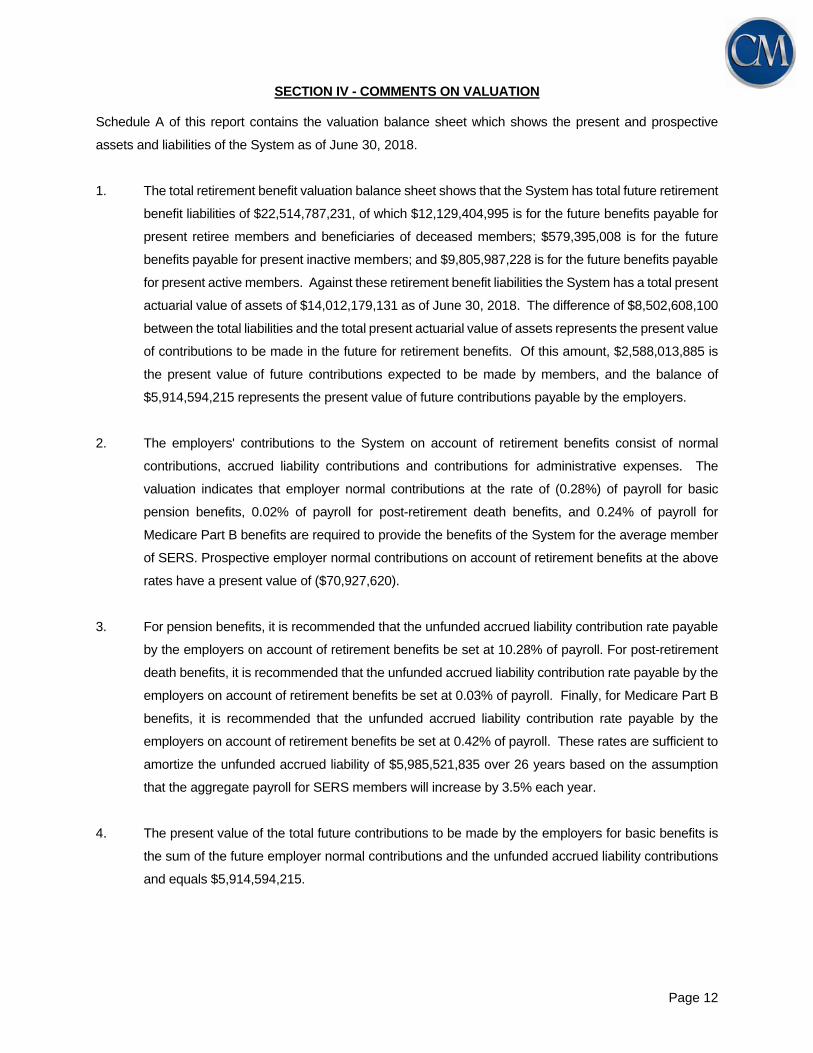
SECTION IV - COMMENTS ON VALUATION
Schedule A of this report contains the valuation balance sheet which shows the present and prospective
assets and liabilities of the System as of June 30, 2018.
1. The total retirement benefit valuation balance sheet shows that the System has total future retirement
benefit liabilities of $22,514,787,231, of which $12,129,404,995 is for the future benefits payable for
present retiree members and beneficiaries of deceased members; $579,395,008 is for the future
benefits payable for present inactive members; and $9,805,987,228 is for the future benefits payable
for present active members. Against these retirement benefit liabilities the System has a total present
actuarial value of assets of $14,012,179,131 as of June 30, 2018. The difference of $8,502,608,100
between the total liabilities and the total present actuarial value of assets represents the present value
of contributions to be made in the future for retirement benefits. Of this amount, $2,588,013,885 is
the present value of future contributions expected to be made by members, and the balance of
$5,914,594,215 represents the present value of future contributions payable by the employers.
2. The employers' contributions to the System on account of retirement benefits consist of normal
contributions, accrued liability contributions and contributions for administrative expenses. The
valuation indicates that employer normal contributions at the rate of (0.28%) of payroll for basic
pension benefits, 0.02% of payroll for post-retirement death benefits, and 0.24% of payroll for
Medicare Part B benefits are required to provide the benefits of the System for the average member
of SERS. Prospective employer normal contributions on account of retirement benefits at the above
rates have a present value of ($70,927,620).
3. For pension benefits, it is recommended that the unfunded accrued liability contribution rate payable
by the employers on account of retirement benefits be set at 10.28% of payroll. For post-retirement
death benefits, it is recommended that the unfunded accrued liability contribution rate payable by the
employers on account of retirement benefits be set at 0.03% of payroll. Finally, for Medicare Part B
benefits, it is recommended that the unfunded accrued liability contribution rate payable by the
employers on account of retirement benefits be set at 0.42% of payroll. These rates are sufficient to
amortize the unfunded accrued liability of $5,985,521,835 over 26 years based on the assumption
that the aggregate payroll for SERS members will increase by 3.5% each year.
4. The present value of the total future contributions to be made by the employers for basic benefits is
the sum of the future employer normal contributions and the unfunded accrued liability contributions
and equals $5,914,594,215.

Page 13
SECTION V – DERIVATION OF EXPERIENCE GAINS AND LOSSES Actual experience will never (except by coincidence) match exactly with assumed experience. It is assumed that gains and losses will be in balance over a period of years, but sizable year-to-year fluctuations are common. Detail on the derivation of the experience gain (loss) for the year ended June 30, 2018 is shown below in $ millions.
Experience (Gain/Loss)
Total Basic BenefitsJune 30: 2018 2017 2016 2015 2014 2013
(1) UAAL from last valuation $ 5,875.3 6,591.1 5,901.6 5,851.3 6,121.2 6,357.7
(2) Normal cost from last valuation 342.4 312.5 319.3 313.6 308.9 311.9
(3) Contributions 759.9 804.4 750.7 701.5 700.7 695.1
(4) Interest accrual: 437.8 487.6 453.0 450.5 471.2 490.0
[(1) + (2) - (3)*.5] x .075
(5) Expected UAAL before changes: $ 5,895.6 6,586.8 5,923.2 5,913.9 6,200.6 6,464.5
(1) + (2) - (3) + (4)
(6) Change due to plan amendments 357.6 998.5 0.0 0.0 0.0 27.8
(7) Change due to new actuarial 0.0 0.0 (668.2) 0.0 0.0 0.0
assumption or methods
(8) Expected UAAL after changes: $ 5,538.0 5,588.3 6,591.4 5,913.9 6,200.6 6,436.7
(5) - (6) - (7)
(9) Actual UAAL from this valuation $ 5,985.5 5,875.3 6,591.1 5,901.6 5,851.3 6,121.2
(10) Total Gain/(Loss): (8) - (9) $ (447.4) (287.0) 0.3 12.3 349.3 315.5
(11) Investment Gain/(Loss): $ (161.1) (12.2) 50.6 62.1 403.3 241.0
(12) Non-Investment Gain/(Loss) $ (286.3) (274.8) (50.3) (49.8) (54.0) 74.4
PensionJune 30: 2018 2017 2016 2015 2014 2013
(1) UAAL from last valuation $ 5,611.3 6,315.7 5,640.9 5,574.6 5,838.1 6,072.1
(2) Normal cost from last valuation 334.1 305.6 313.3 307.7 303.0 305.9
(3) Contributions 731.8 778.7 727.0 678.6 677.8 673.0
(4) Interest accrual: 418.5 467.4 433.3 429.6 449.7 468.2
[(1) + (2) - (3)*.5] x .075
(5) Expected UAAL before changes: $ 5,632.1 6,310.0 5,660.5 5,633.3 5,913.0 6,173.2
(1) + (2) - (3) + (4)
(6) Change due to plan amendments 357.6 998.5 0.0 0.0 0.0 27.1
(7) Change due to new actuarial 0.0 0.0 (643.5) 0.0 0.0 0.0
assumption or methods
(8) Expected UAAL after changes: $ 5,274.5 5,311.5 6,304.0 5,633.3 5,913.0 6,146.1
(5) - (6) - (7)
(9) Actual UAAL from this valuation $ 5,735.1 5,611.3 6,315.7 5,640.9 5,574.6 5,838.1
(10) Total Gain/(Loss): (8) - (9) $ (460.6) (299.8) (11.7) (7.6) 338.4 308.0
(11) Investment Gain/(Loss): $ (159.0) (12.3) 49.6 60.6 398.0 237.9
(12) Non-Investment Gain/(Loss) $ (301.6) (287.5) (61.3) (68.2) (59.6) 70.1

Page 14
SECTION V – DERIVATION OF EXPERIENCE GAINS AND LOSSES ($ Millions)
Medicare Part BJune 30: 2018 2017 2016 2015 2014 2013
(1) UAAL from last valuation $ 249.1 259.7 246.9 262.7 268.3 270.0
(2) Normal cost from last valuation 7.8 6.4 5.5 5.4 5.4 5.5
(3) Contributions 26.3 24.1 22.2 21.5 21.5 20.7
(4) Interest accrual: 18.3 19.0 18.7 19.9 20.4 20.5
[(1) + (2) - (3)*.5] x .075
(5) Expected UAAL before changes: $ 248.9 261.0 248.9 266.5 272.6 275.3
(1) + (2) - (3) + (4)
(6) Change due to plan amendments 0.0 0.0 0.0 0.0 0.0 0.6
(7) Change due to new actuarial 0.0 0.0 (22.4) 0.0 0.0 0.0
assumption or methods
(8) Expected UAAL after changes: $ 248.9 261.0 271.3 266.5 272.6 274.7
(5) - (6) - (7)
(9) Actual UAAL from this valuation $ 235.4 249.1 259.7 246.9 262.7 268.3
(10) Total Gain/(Loss): (8) - (9) $ 13.5 11.9 11.6 19.6 9.9 6.4
(11) Investment Gain/(Loss): $ (1.9) 0.1 0.9 1.3 4.5 2.6
(12) Non-Investment Gain/(Loss) $ 15.4 11.8 10.7 18.3 5.4 3.8
Post-Retirement Death BenefitsJune 30: 2018 2017 2016 2015 2014 2013
(1) UAAL from last valuation $ 14.9 15.7 13.8 14.0 14.8 15.6
(2) Normal cost from last valuation 0.5 0.5 0.5 0.5 0.5 0.5
(3) Contributions 1.8 1.6 1.5 1.5 1.4 1.4
(4) Interest accrual: 1.1 1.2 1.0 1.1 1.1 1.2
[(1) + (2) - (3)*.5] x .075
(5) Expected UAAL before changes: $ 14.7 15.8 13.8 14.1 15.0 15.9
(1) + (2) - (3) + (4)
(6) Change due to plan amendments 0.0 0.0 0.0 0.0 0.0 0.1
(7) Change due to new actuarial 0.0 0.0 (2.3) 0.0 0.0 0.0
assumption or methods
(8) Expected UAAL after changes: $ 14.7 15.8 16.1 14.1 15.0 15.8
(5) - (6) - (7)
(9) Actual UAAL from this valuation $ 15.0 14.9 15.7 13.8 14.0 14.8
(10) Total Gain/(Loss): (8) - (9) $ (0.3) 0.9 0.4 0.3 1.0 1.0
(11) Investment Gain/(Loss): $ (0.2) 0.0 0.1 0.2 0.8 0.5
(12) Non-Investment Gain/(Loss) $ (0.1) 0.9 0.3 0.1 0.2 0.5
Page 15
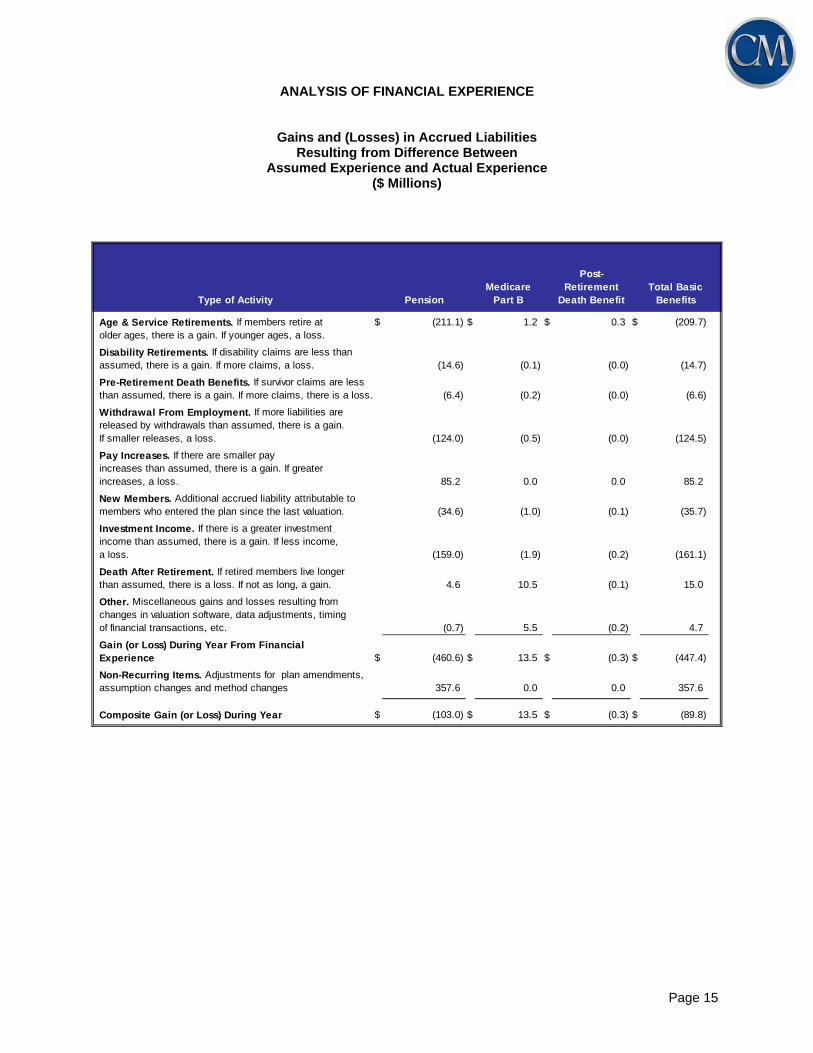
ANALYSIS OF FINANCIAL EXPERIENCE
Gains and (Losses) in Accrued Liabilities
Resulting from Difference Between Assumed Experience and Actual Experience
($ Millions)
Type of Activity PensionMedicare
Part B
Post- Retirement
Death Benefit
Age & Service Retirements. If members retire at $ (211.1) $ 1.2 $ 0.3 $ (209.7)older ages, there is a gain. If younger ages, a loss.
Disability Retirements. If disability claims are less thanassumed, there is a gain. If more claims, a loss. (14.6) (0.1) (0.0) (14.7)
Pre-Retirement Death Benefits. If survivor claims are lessthan assumed, there is a gain. If more claims, there is a loss. (6.4) (0.2) (0.0) (6.6)
Withdrawal From Employment. If more liabilities arereleased by withdrawals than assumed, there is a gain.If smaller releases, a loss. (124.0) (0.5) (0.0) (124.5)
Pay Increases. If there are smaller payincreases than assumed, there is a gain. If greaterincreases, a loss. 85.2 0.0 0.0 85.2
New Members. Additional accrued liability attributable tomembers who entered the plan since the last valuation. (34.6) (1.0) (0.1) (35.7)
Investment Income. If there is a greater investmentincome than assumed, there is a gain. If less income,a loss. (159.0) (1.9) (0.2) (161.1)
Death After Retirement. If retired members live longerthan assumed, there is a loss. If not as long, a gain. 4.6 10.5 (0.1) 15.0
Other. Miscellaneous gains and losses resulting fromchanges in valuation software, data adjustments, timingof financial transactions, etc. (0.7) 5.5 (0.2) 4.7
Gain (or Loss) During Year From FinancialExperience $ (460.6) $ 13.5 $ (0.3) $ (447.4)
Non-Recurring Items. Adjustments for plan amendments,assumption changes and method changes 357.6 0.0 0.0 357.6
Composite Gain (or Loss) During Year $ (103.0) $ 13.5 $ (0.3) $ (89.8)
Total Basic Benefits

Page 16
SECTION VI – ACTUARIALLY DETERMINED CONTRIBUTION RATES
The valuation balance sheet gives the basis for determining the percentage rates for contributions to be
made by employers to the Retirement System. The following table shows the rates of contribution payable
by employers.
Actuarially Determined Contribution Rates
Post-Retirement Medicare
Contribution for Pension Death Benefit Part B
A. Normal Cost:(1) Service retirement benefits(2) Disability benefits 0.67(3) Survivor benefits 0.23(4) Refunds 2.74(5) Total
B. Member Contributions
C. Employer Normal Cost: [A(5) - B]
D. Unfunded Actuarial Accrued Liability Contributions
E. Total Recommended Employer Contribution Rate:[C+D]
0.24%
10.00%
(0.02%)
10.71%
10.73%
Total
0.02%
0.00%
0.02%
6.08%
(0.28%)
9.72%
Basic Benefits
9.98%
0.05%10.00%
0.42%
10.00%
10.28% 0.03%
0.00%
0.24%
0.66%
The statute sets a contribution cap of 24% of payroll: 14% from employers and 10% from employees.
Employer contributions in excess of those required to support the basic benefits may be allocated to retiree
health care funding. If the funded ratio is less than 70%, all 14% of the employers’ contribution shall be
allocated to SERS’ basic benefits. If the funded ratio is 70% but less than 80%, at least 13.50% of the
employers’ contribution shall be allocated to SERS’ basic benefits, with the remainder (if any) allocated to
the Health Care Fund. If the funded ratio is 80% but less than 90%, at least 13.25% of the employers’
contribution shall be allocated to SERS’ basic benefits, with the remainder (if any) allocated to the Health
Care Fund. If the funded ratio is 90% or greater, the Health Care Fund may receive any portion of the
employers’ contribution that is not needed to fund SERS’ basic benefits.
Page 17
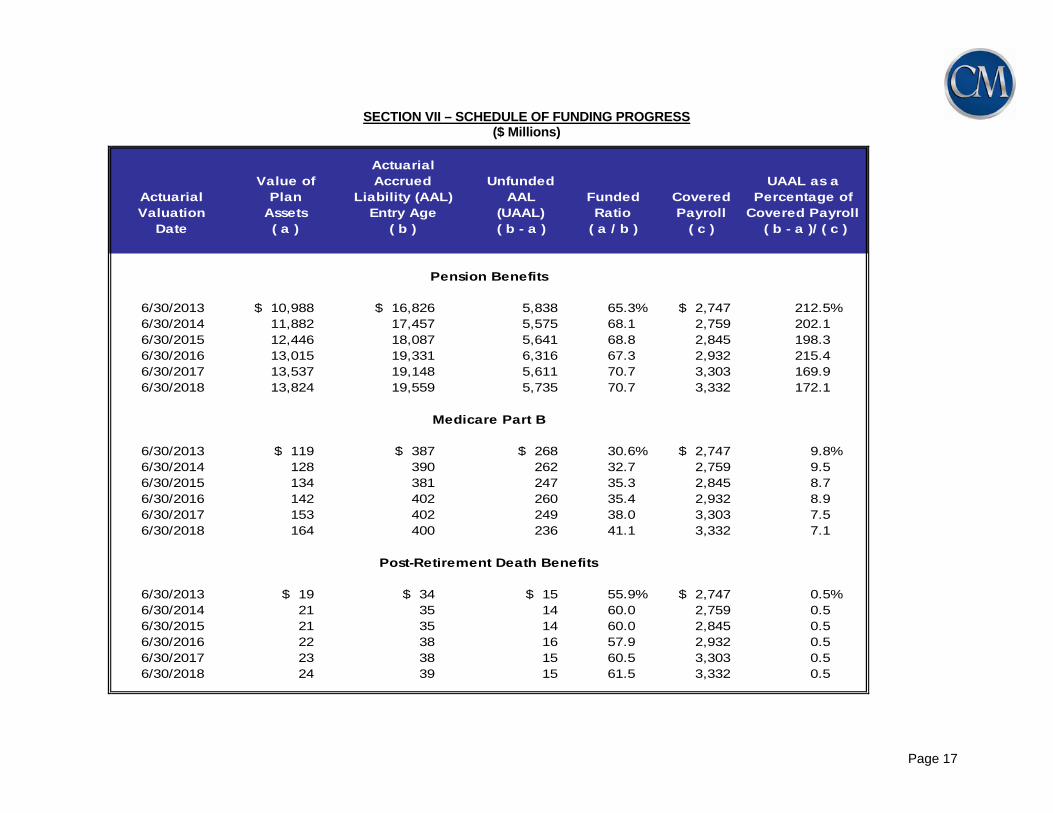
SECTION VII – SCHEDULE OF FUNDING PROGRESS ($ Millions)
ActuarialValue of Accrued Unfunded
Actuarial Plan Liability (AAL) AAL Funded CoveredValuation Assets Entry Age (UAAL) Ratio Payroll
Date ( a ) ( b ) ( b - a ) ( a / b ) ( c )
6/30/2013 $ 10,988 $ 16,826 5,838 65.3% $ 2,747 212.5%6/30/2014 11,882 17,457 5,575 68.1 2,759 202.16/30/2015 12,446 18,087 5,641 68.8 2,845 198.36/30/2016 13,015 19,331 6,316 67.3 2,932 215.46/30/2017 13,537 19,148 5,611 70.7 3,303 169.96/30/2018 13,824 19,559 5,735 70.7 3,332 172.1
6/30/2013 $ 119 $ 387 $ 268 30.6% $ 2,747 9.8%6/30/2014 128 390 262 32.7 2,759 9.56/30/2015 134 381 247 35.3 2,845 8.76/30/2016 142 402 260 35.4 2,932 8.96/30/2017 153 402 249 38.0 3,303 7.56/30/2018 164 400 236 41.1 3,332 7.1
6/30/2013 $ 19 $ 34 $ 15 55.9% $ 2,747 0.5%6/30/2014 21 35 14 60.0 2,759 0.56/30/2015 21 35 14 60.0 2,845 0.56/30/2016 22 38 16 57.9 2,932 0.56/30/2017 23 38 15 60.5 3,303 0.56/30/2018 24 39 15 61.5 3,332 0.5
Post-Retirement Death Benefits
Medicare Part B
UAAL as aPercentage of
Covered Payroll ( b - a )/ ( c )
Pension Benefits
Page 18
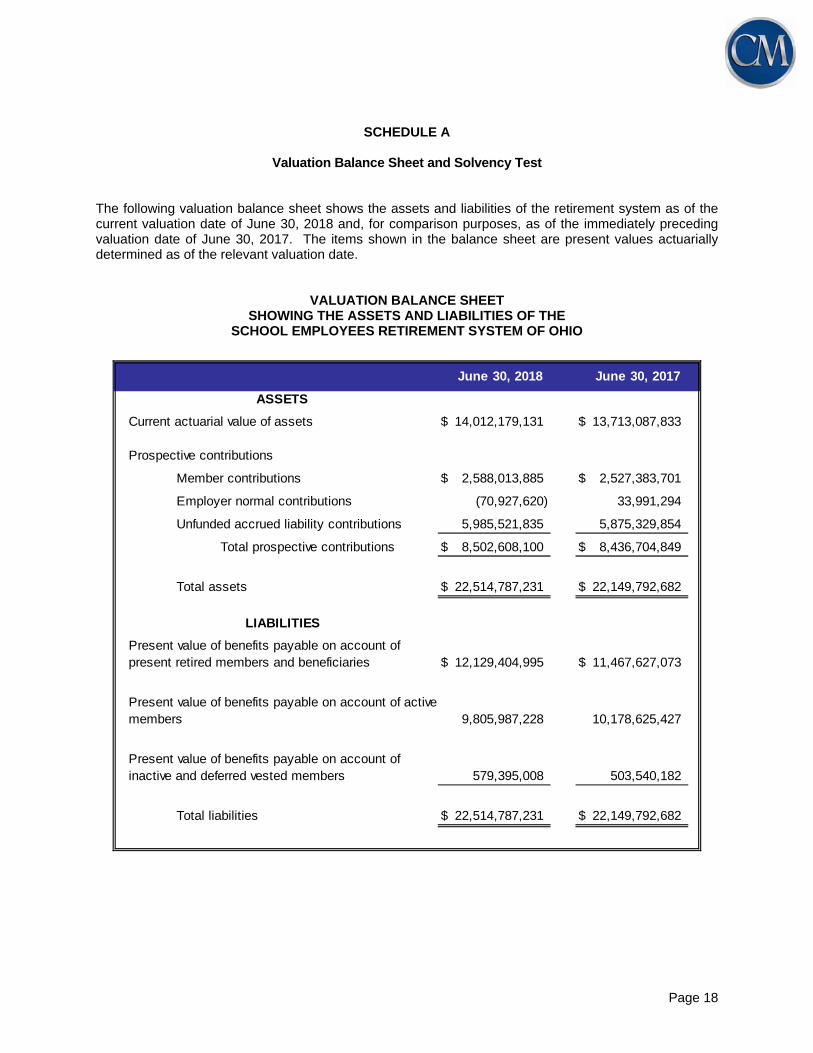
SCHEDULE A
Valuation Balance Sheet and Solvency Test
The following valuation balance sheet shows the assets and liabilities of the retirement system as of the current valuation date of June 30, 2018 and, for comparison purposes, as of the immediately preceding valuation date of June 30, 2017. The items shown in the balance sheet are present values actuarially determined as of the relevant valuation date.
VALUATION BALANCE SHEET SHOWING THE ASSETS AND LIABILITIES OF THE
SCHOOL EMPLOYEES RETIREMENT SYSTEM OF OHIO
June 30, 2018 June 30, 2017
ASSETS
Current actuarial value of assets $ 14,012,179,131 $ 13,713,087,833
Prospective contributions
Member contributions $ 2,588,013,885 $ 2,527,383,701
Employer normal contributions (70,927,620) 33,991,294
Unfunded accrued liability contributions 5,985,521,835 5,875,329,854
Total prospective contributions $ 8,502,608,100 $ 8,436,704,849
Total assets $ 22,514,787,231 $ 22,149,792,682
LIABILITIES
Present value of benefits payable on account ofpresent retired members and beneficiaries $ 12,129,404,995 $ 11,467,627,073
Present value of benefits payable on account of activemembers 9,805,987,228 10,178,625,427
Present value of benefits payable on account ofinactive and deferred vested members 579,395,008 503,540,182
Total liabilities $ 22,514,787,231 $ 22,149,792,682
Page 19
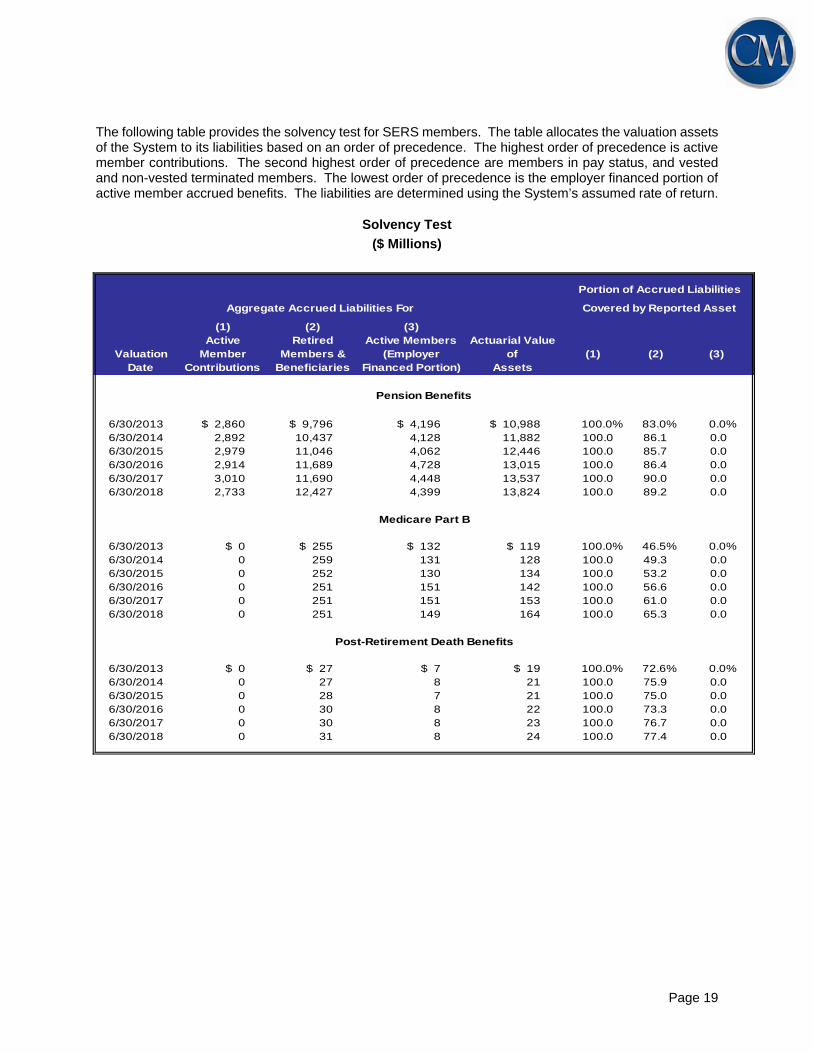
The following table provides the solvency test for SERS members. The table allocates the valuation assets of the System to its liabilities based on an order of precedence. The highest order of precedence is active member contributions. The second highest order of precedence are members in pay status, and vested and non-vested terminated members. The lowest order of precedence is the employer financed portion of active member accrued benefits. The liabilities are determined using the System’s assumed rate of return.
Solvency Test
($ Millions)
Aggregate Accrued Liabilities For
(1) (2) (3)Active Retired Active Members Actuarial Value
Valuation Member Members & (Employer of (1)Date Contributions Beneficiaries Financed Portion) Assets
6/30/2013 $ 2,860 $ 9,796 $ 4,196 $ 10,988 83.0% 0.0%6/30/2014 2,892 10,437 4,128 11,882 100.0 86.1 0.0 6/30/2015 2,979 11,046 4,062 12,446 100.0 85.7 0.0 6/30/2016 2,914 11,689 4,728 13,015 100.0 86.4 0.0 6/30/2017 3,010 11,690 4,448 13,537 100.0 90.0 0.0 6/30/2018 2,733 12,427 4,399 13,824 100.0 89.2 0.0
6/30/2013 $ 0 $ 255 $ 132 $ 119 46.5% 0.0%6/30/2014 0 259 131 128 100.0 49.3 0.0 6/30/2015 0 252 130 134 100.0 53.2 0.0 6/30/2016 0 251 151 142 100.0 56.6 0.0 6/30/2017 0 251 151 153 100.0 61.0 0.0 6/30/2018 0 251 149 164 100.0 65.3 0.0
6/30/2013 $ 0 $ 27 $ 7 $ 19 72.6% 0.0%6/30/2014 0 27 8 21 100.0 75.9 0.0 6/30/2015 0 28 7 21 100.0 75.0 0.0 6/30/2016 0 30 8 22 100.0 73.3 0.0 6/30/2017 0 30 8 23 100.0 76.7 0.0 6/30/2018 0 31 8 24 100.0 77.4 0.0
(3)(2)
Portion of Accrued Liabilities
Covered by Reported Asset
100.0%
Post-Retirement Death Benefits
Pension Benefits
Medicare Part B
100.0%
100.0%
Page 20
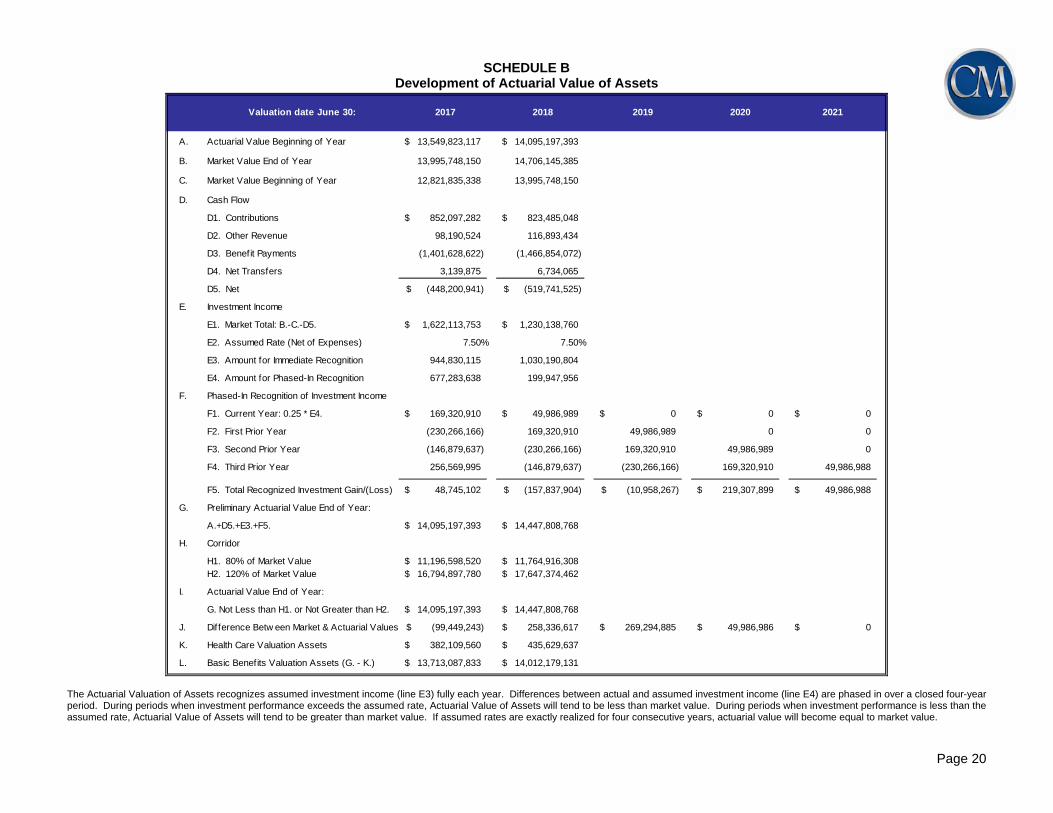
SCHEDULE B Development of Actuarial Value of Assets
Valuation date June 30: 2021
A. Actuarial Value Beginning of Year 13,549,823,117$ 14,095,197,393$
B. Market Value End of Year 13,995,748,150 14,706,145,385
C. Market Value Beginning of Year 12,821,835,338 13,995,748,150
D. Cash Flow
D1. Contributions 852,097,282$ 823,485,048$
D2. Other Revenue 98,190,524 116,893,434
D3. Benefit Payments (1,401,628,622) (1,466,854,072)
D4. Net Transfers 3,139,875 6,734,065
D5. Net (448,200,941)$ (519,741,525)$
E. Investment Income
E1. Market Total: B.-C.-D5. 1,622,113,753$ 1,230,138,760$
E2. Assumed Rate (Net of Expenses)
E3. Amount for Immediate Recognition 944,830,115 1,030,190,804
E4. Amount for Phased-In Recognition 677,283,638 199,947,956
F. Phased-In Recognition of Investment Income
F1. Current Year: 0.25 * E4. 169,320,910$ 49,986,989$ 0$ 0$ 0$
F2. First Prior Year (230,266,166) 169,320,910 49,986,989 0 0
F3. Second Prior Year (146,879,637) (230,266,166) 169,320,910 49,986,989 0
F4. Third Prior Year 256,569,995 (146,879,637) (230,266,166) 169,320,910 49,986,988
F5. Total Recognized Investment Gain/(Loss) 48,745,102$ (157,837,904)$ (10,958,267)$ 219,307,899$ 49,986,988$
G. Preliminary Actuarial Value End of Year:
A.+D5.+E3.+F5. 14,095,197,393$ 14,447,808,768$
H. Corridor
H1. 80% of Market Value 11,196,598,520$ 11,764,916,308$ H2. 120% of Market Value 16,794,897,780$ 17,647,374,462$
I. Actuarial Value End of Year:
G. Not Less than H1. or Not Greater than H2. 14,095,197,393$ 14,447,808,768$
J. Difference Betw een Market & Actuarial Values (99,449,243)$ 258,336,617$ 269,294,885$ 49,986,986$ 0$
K. Health Care Valuation Assets 382,109,560$ 435,629,637$
L. Basic Benefits Valuation Assets (G. - K.) 13,713,087,833$ 14,012,179,131$
7.50% 7.50%
2017 2018 2019 2020
The Actuarial Valuation of Assets recognizes assumed investment income (line E3) fully each year. Differences between actual and assumed investment income (line E4) are phased in over a closed four-year period. During periods when investment performance exceeds the assumed rate, Actuarial Value of Assets will tend to be less than market value. During periods when investment performance is less than the assumed rate, Actuarial Value of Assets will tend to be greater than market value. If assumed rates are exactly realized for four consecutive years, actuarial value will become equal to market value.
Page 21
SCHEDULE C
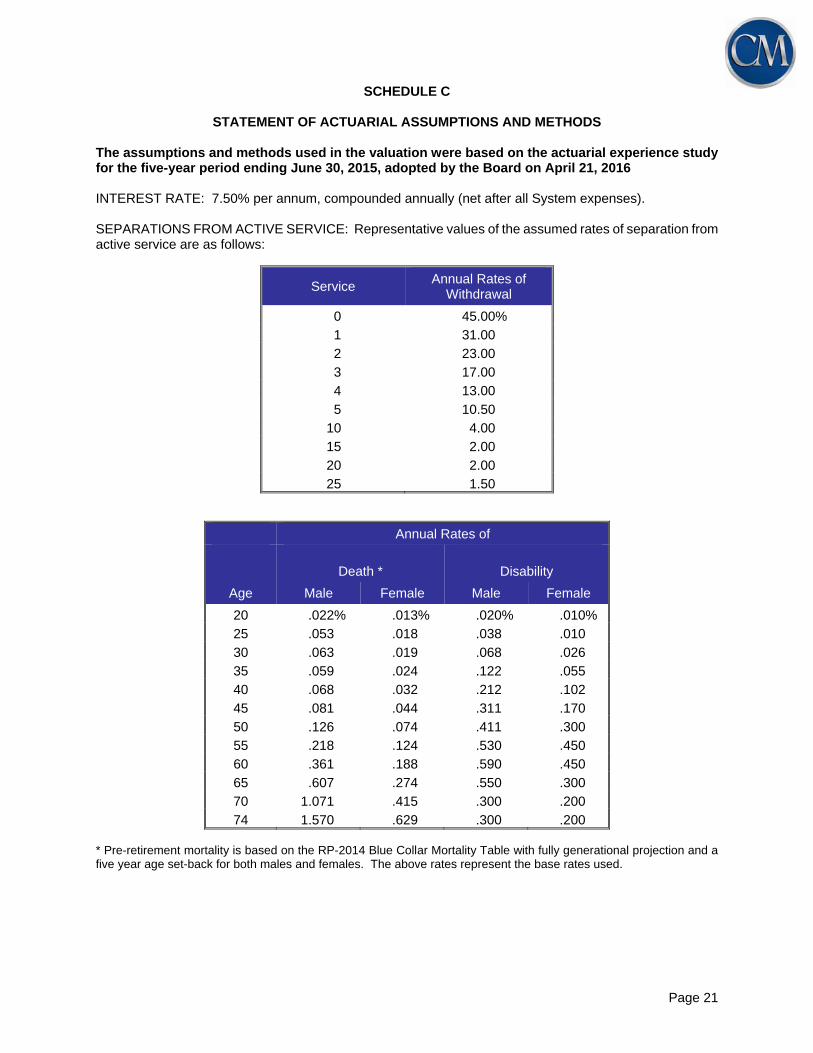
STATEMENT OF ACTUARIAL ASSUMPTIONS AND METHODS The assumptions and methods used in the valuation were based on the actuarial experience study for the five-year period ending June 30, 2015, adopted by the Board on April 21, 2016 INTEREST RATE: 7.50% per annum, compounded annually (net after all System expenses). SEPARATIONS FROM ACTIVE SERVICE: Representative values of the assumed rates of separation from active service are as follows:
Service Annual Rates of
Withdrawal
0 45.00%
1 31.00
2 23.00
3 17.00
4 13.00
5 10.50
10 4.00
15 2.00
20 2.00
25 1.50
Annual Rates of
Death *
Disability
Age Male Female Male Female
20 .022% .013% .020% .010%
25 .053 .018 .038 .010
30 .063 .019 .068 .026
35 .059 .024 .122 .055
40 .068 .032 .212 .102
45 .081 .044 .311 .170
50 .126 .074 .411 .300
55 .218 .124 .530 .450
60 .361 .188 .590 .450
65 .607 .274 .550 .300
70 1.071 .415 .300 .200
74 1.570 .629 .300 .200 * Pre-retirement mortality is based on the RP-2014 Blue Collar Mortality Table with fully generational projection and a five year age set-back for both males and females. The above rates represent the base rates used.
Page 22
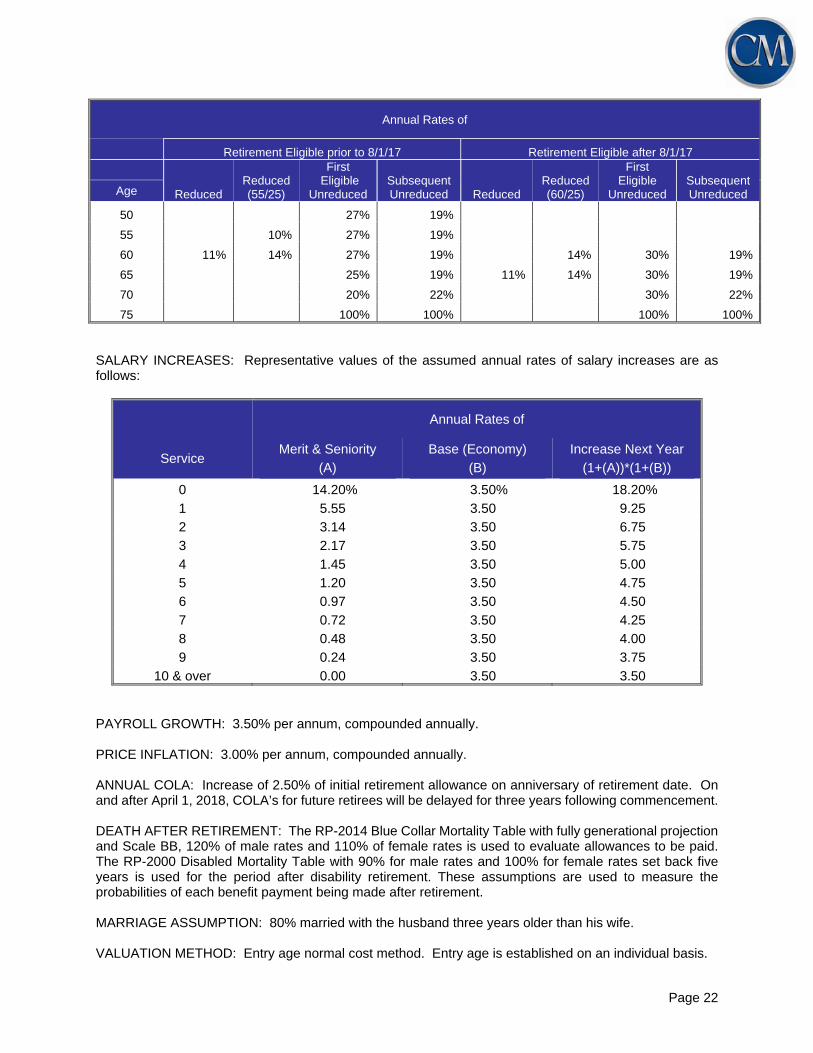
Annual Rates of
Retirement Eligible prior to 8/1/17 Retirement Eligible after 8/1/17
Reduced Reduced (55/25)
First Eligible
Unreduced Subsequent Unreduced Reduced
Reduced (60/25)
First Eligible
Unreduced Subsequent Unreduced Age
50 27% 19%
55 10% 27% 19%
60 11% 14% 27% 19% 14% 30% 19%
65 25% 19% 11% 14% 30% 19%
70 20% 22% 30% 22%
75 100% 100% 100% 100% SALARY INCREASES: Representative values of the assumed annual rates of salary increases are as follows:
Annual Rates of
Service Merit & Seniority
(A)
Base (Economy)
(B)
Increase Next Year
(1+(A))*(1+(B))
0 14.20% 3.50% 18.20%
1 5.55 3.50 9.25
2 3.14 3.50 6.75
3 2.17 3.50 5.75
4 1.45 3.50 5.00
5 1.20 3.50 4.75
6 0.97 3.50 4.50
7 0.72 3.50 4.25
8 0.48 3.50 4.00
9 0.24 3.50 3.75
10 & over 0.00 3.50 3.50 PAYROLL GROWTH: 3.50% per annum, compounded annually. PRICE INFLATION: 3.00% per annum, compounded annually. ANNUAL COLA: Increase of 2.50% of initial retirement allowance on anniversary of retirement date. On and after April 1, 2018, COLA’s for future retirees will be delayed for three years following commencement. DEATH AFTER RETIREMENT: The RP-2014 Blue Collar Mortality Table with fully generational projection and Scale BB, 120% of male rates and 110% of female rates is used to evaluate allowances to be paid. The RP-2000 Disabled Mortality Table with 90% for male rates and 100% for female rates set back five years is used for the period after disability retirement. These assumptions are used to measure the probabilities of each benefit payment being made after retirement. MARRIAGE ASSUMPTION: 80% married with the husband three years older than his wife. VALUATION METHOD: Entry age normal cost method. Entry age is established on an individual basis.
Page 23
ASSET VALUATION METHOD: Actuarial value, as developed in Schedule A. The actuarial value of assets recognizes a portion of the difference between the market value of assets and the expected market value of assets, based on the assumed valuation rate of return. The amount recognized each year is 25% of the difference between market value and expected market value. The actuarial value of assets cannot be less than 80% or more than 120% of market value. FUNDING POLICY: If the funded ratio is less than 70%, the entire 14% employers’ contribution shall be allocated to SERS’ basic benefits. If the funded ratio is 70% but less than 80%, at least 13.50% of the employers’ contribution shall be allocated to SERS’ basic benefits, with the remainder (if any) allocated to the Health Care Fund. If the funded ratio is 80% but less than 90%, at least 13.25% of the employers’ contribution shall be allocated to SERS’ basic benefits, with the remainder (if any) allocated to the Health Care Fund. If the funded ratio is 90% or greater, the Health Care Fund may receive any portion of the employers’ contribution that is not needed to fund SERS’ basic benefits.
Page 24
SCHEDULE D
SCHOOL EMPLOYEES RETIREMENT SYSTEM OF OHIO Summary of Benefit and Contribution Provisions
Contributions for Basic Benefits Members contribute 10% of pay and employers contribute 14% of pay. Employer contributions not required to finance basic benefits are allocated to the health care program.
Final Average Salary Average annual salary over the member’s three highest years
of service. Normal Retirement
Condition for Retirement Retire before August 1, 2017 or have 25 years of service or more on or before August 1, 2017
Attainment of age 65 with at least five years of creditable service, or completion of 30 years of creditable service, regardless of age.
Members attaining 25 years of service after August 1, 2017
Attainment of age 67 with at least ten years of creditable service, or attainment of age 57 with at least 30 years of creditable service. Buy-up option was available.
Amount of Allowance The annual retirement allowance payable shall not be greater
than 100% of final average salary, and is the greater of:
1. Money Purchase - the greater of: The sum of: a. An annuity based on the value of the member’s
accumulated contributions at retirement b. A pension equal to the annuity c. For members who have 10 or more years of
service credit prior to 10/1/1956, an annual benefit of $180.
2. Defined Benefit - the greater of:
The sum of: a. 2.2% of final average salary multiplied by the
member’s years of service up to 30, b. 2.5% of final average salary multiplied by the
member’s years of service in excess of 30, or: c. $86 multiplied by the years of service.
Page 25
Early Retirement
Condition for Early Retirement
Retire before August 1, 2017 or have 25 years of service or more on or before August 1, 2017
Not eligible for unreduced service retirement but has attained age 55 with at least 25 years of service, or age 60 with five years of service.
Members attaining 25 years of service after August 1, 2017
Attainment of age 62 with at least ten years of creditable service, or attainment of age 60 with at least 25 years of creditable service.
Amount of Allowance
Retire before August 1, 2017 or have 25 years of service or more on or before August 1, 2017
Normal retirement allowance accrued to the date of early retirement. The Defined Benefit amount determined above is adjusted by the following percentages based on attained age or years of service:
Attained Years of Ohio Age Service Credit Percentage
58 25 75% 59 26 80 60 27 85 61 88 28 90 62 91 63 94 29 95 64 97
Members attaining 25 years of service after August 1, 2017
Actuarial equivalent of the normal retirement allowance accrued to the date of early retirement. The Defined Benefit amount determined above is actuarially adjusted for the years before age 65 (age 67 if after August 1, 2017) or 30 years of service, whichever is shorter, but in no event is the adjusted benefit less than the following percentages of the Defined Benefit amount based on years of service:
Years of Ohio
Service Credit Percentage 25 75% 26 80 27 85 28 90 29 95
Disability Retirement
Condition for Retirement An allowance is paid upon becoming permanently disabled after completion of at least 5 years of total service credit.
Amount of Allowance 1. For those who were active members prior to July 29, 1992
and did not elect the benefit structure outlined below, an allowance based on service to date of disablement, plus, if the age at disablement is less than 60, continuous
Page 26
service to age 60. The allowance is computed in the same manner as the defined benefit service retirement allowance, subject to a minimum of 30% of FAS and a maximum of 75% of FAS. It is payable for life, unless terminated.
2. For those who became active members after July 28,
1992, and for those who were active members prior to July 29, 1992 who so elected, an allowance equal to the greater of (i) 45% of FAS, or (ii) the lesser of 60% of FAS, or the allowance computed in the same manner as the defined benefit service retirement allowance. The allowance will continue until:
a. The date the member is granted a service
retirement benefit, or b. The date the allowance is terminated, or c. The later of the date the member attains age 65
or the date the disability allowance has been paid for the minimum duration in accordance with the following schedule:
Minimum Duration
Age at Disability In Months 60 and earlier 60
61 60 62 48 63 48 64 36 65 36 66 24 67 24 68 24
69 and older 12
Death Benefits Prior to Retirement Death While Eligible to Retire If a member dies in service after becoming eligible to retire with
a service allowance and leaves a surviving spouse or other sole dependent beneficiary, the survivor may elect to receive the same amount that would have been paid had the member retired the last day of the month of death and elected the 100% joint and survivor form of payment.
Survivor (Death-in-Service) Allowances
Condition for Benefit Upon the death of a member with at least 1.5 years of Ohio service credit and with at least 0.25 year of Ohio contributing service credit within 2.5 years prior to the date of death, the survivor allowances are payable as follows:
1. Qualified Spouse: A monthly allowance commencing at
age 62, except that the benefit is payable immediately if: (1) the qualified deceased member had 10 or more years of Ohio service credit; or (2) is caring for a surviving child, or (3) is incompetent.
2. Qualified Child: For allowances that commenced before January 7, 2013, an allowance is payable to a deceased member’s qualified child who is under age 18 and never

Page 27
been married, under age 22 and in school, or adjudged incompetent prior to the member’s death and the child attaining age 18 or age 22 if attending school. For allowances that commence on or after January 7, 2013, an allowance is payable to a deceased member’s qualified child who is under age 19 and never been married or adjudged incompetent prior to the member’s death and the child attaining age 19.
3. Qualified Parent’s Allowance: A monthly allowance is payable to a dependent parent age 65 or more.
Amount of Allowances Except when survived by a qualified child(ren), upon the death
of a member prior to retirement, the accumulated contributions of the member without interest is payable. Alternatively, the beneficiary may elect the following amounts, payable monthly while eligible:
Number of Annual Benefit Minimum Qualified as Percent of Monthly Survivors Member’s FAS Allowance
1 25% $96 2 40 186 3 50 236 4 55 236
5 or more 60 236
If the deceased member had attained at least 20 years of service, the total benefits payable to all qualified survivors are not less than:
Years of Annual Benefit as Percent Service of Member’s FAS
20 29% 21 33 22 37 23 41 24 45 25 48 26 51 27 54 28 57 29 or more 60
Termination Benefits
Refund of Members’ Accumulated Contributions In the event a member leaves service before any monthly
benefits are payable on his/her behalf, the member’s accumulated contributions, without interest, may be refunded.
Deferred Benefits Members who retire prior to August 1, 2017 must have at least
5 years of service credit and those members who retire on and after August 1, 2017 must have at least 10 years of service credit and are eligible to draw the benefit the first of the month following their 62nd birthday.

Page 28
Normal Form of Benefit Single Life Annuity Optional Forms of Benefit A member upon retirement may elect to receive an allowance in
one of the following forms that are computed to be actuarially equivalent to the applicable retirement allowance:
Upon the death of a retiree, 50%, 100%, or some other percentage of his/her reduced retirement allowance shall be continued throughout the life of, and paid to, a designated beneficiary.
A reduced retirement allowance shall be continued throughout the life of the pensioner, but with further payment to the pensioner, his/her beneficiary or estate for a specified number of years certain.
A member can select a partial lump-sum option at retirement. Under this option, the partial lump- sum shall not be less than 6 times and not more than 36 times the unreduced monthly benefit, and the monthly benefit will be actuarially reduced. In addition, the monthly benefit payable cannot be less than 50% of the unreduced amount.
Post-Retirement Death Benefit Regardless of the form of benefit selected, a lump sum benefit
of $1,000 is paid at the death of the retiree. Post-Retirement Increases Pre 1/1/2018: On each anniversary of the initial date of
retirement, the allowances of all retirees and survivors are increased by 3% of the base benefit.
On and after 1/1/2018: On each anniversary of the initial
retirement, the allowance of all retirees and survivors are increased by the annual rate of increase in the CPI-W measured as of the June preceding the beginning of the applicable calendar year. The annual rate of increase shall not be less than 0% nor greater than 2.5%. COLA’s shall be suspended for calendar years 2018, 2019, and 2020.
On and after 4/1/2018: COLA’s for future retirees will be
delayed for three years following commencement. Medicare Part B Each recipient of a service retirement benefit, a disability
benefit, or a survivor benefit who was credited with at least 10 years of service and has paid Medicare Part B premiums and has chosen the health care option, is reimbursed $45.50 per month for premiums. The reimbursement will continue to the spouse upon the death of the retiree in cases where the retiree elected a Joint and Survivor payment form.

Page 29
Reemployed Retirants
Eligibility Effective July 1, 1991, service retirees of SERS, or service or disability retirees of one of the other four Ohio retirement systems who are employed in a SERS-covered position are required to contribute to a money purchase annuity, a type of defined contribution plan.
Amount of Allowance Upon termination of employment, a reemployed retirant who
has attained age 65 is eligible to receive an annuity based on the amount of his/her accumulated contributions, and an equal amount of employer contributions, plus interest to the effective date of retirement. Effective July 1, 2006 the amount of employer contributions will be determined by the Board. Interest is granted on the reemployed retirant’s prior fiscal year account balance, calculated using a rate determined by the SERS Board, compounded annually. The benefit is payable as a lump sum or as an annuity if the amount of such annuity is at least $25. Upon termination of employment, a reemployed retirant who has not attained age 65 may request a lump sum refund of his/her own contributions; there is no payment of employer contributions or interest.
Benefits Payable Upon Death If a reemployed retirant dies while employed, a lump sum
payment of the monthly annuity, discounted to the present value using the current actuarial assumption rate of interest, will be paid to his/her beneficiary.
If a reemployed retirant dies while receiving a monthly annuity, a lump sum payment will be made to a beneficiary in an amount equal to the excess, if any, of the lump sum payment the reemployed retirant would have received at the effective date of retirement over the sum of the annuity payments received by the reemployed retirant to the date of death.
Member Contributions Each reemployed retirant is required to contribute 10% of
his/her pay by payroll deductions. Employer Contributions Employer contributions are expressed as percents of member
covered payroll. Employers are required to contribute 14% of payroll.
Other Benefits Reemployed retirants of SERS are not eligible to receive any of
the other benefits provided to SERS members.
Member Contributions 10% of salary.

Page 30
SCHEDULE E
DETAILED TABULATIONS OF THE DATA
Schedule of Retiree Members Added to and Removed From Rolls Last Six Fiscal Years
Year Ending June 30: 2013 2014 2015 2016 2017 2018
Number of Retiree Members
Beginning of Year 69,038 70,771 72,605 74,372 76,280 79,157
Added 4,197 4,144 4,909 4,388 5,499 5,339
Removed 2,464 2,310 3,142 2,480 2,622 3,164
End of Year 70,771 72,605 74,372 76,280 79,157 81,332
Annual Retirement Allowances
Beginning of Year 838,076,567$ 898,267,601$ 958,537,700$ 1,020,368,894$ 1,083,621,579$ 1,162,015,515$
Added 62,841,820 61,331,002 70,608,680 66,860,652 70,973,748 74,311,354
Removed 2,650,786 1,060,903 8,777,486 3,607,967 (7,420,188) 24,391,233
End of Year 898,267,601$ 958,537,700$ 1,020,368,894$ 1,083,621,579$ 1,162,015,515$ 1,211,935,636$
% Increase inAllowances 7.18% 6.71% 6.45% 6.20% 7.23% 4.30%
Average AnnualAllowance 12,693$ 13,202$ 13,720$ 14,206$ 14,680$ 14,901$
Page 31
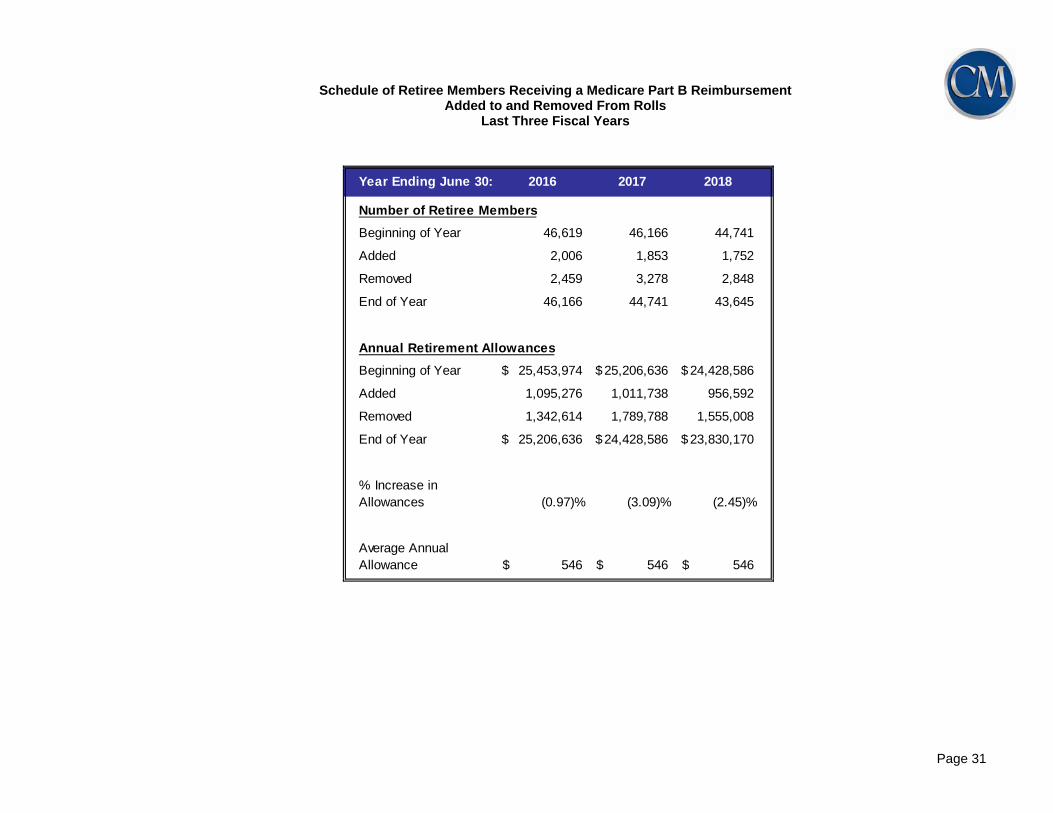
Schedule of Retiree Members Receiving a Medicare Part B Reimbursement
Added to and Removed From Rolls Last Three Fiscal Years
Year Ending June 30: 2016 2017 2018
Number of Retiree Members
Beginning of Year 46,619 46,166 44,741
Added 2,006 1,853 1,752
Removed 2,459 3,278 2,848
End of Year 46,166 44,741 43,645
Annual Retirement Allowances
Beginning of Year 25,453,974$ 25,206,636$ 24,428,586$
Added 1,095,276 1,011,738 956,592
Removed 1,342,614 1,789,788 1,555,008
End of Year 25,206,636$ 24,428,586$ 23,830,170$
% Increase inAllowances (0.97)% (3.09)% (2.45)%
Average AnnualAllowance 546$ 546$ 546$
Page 32
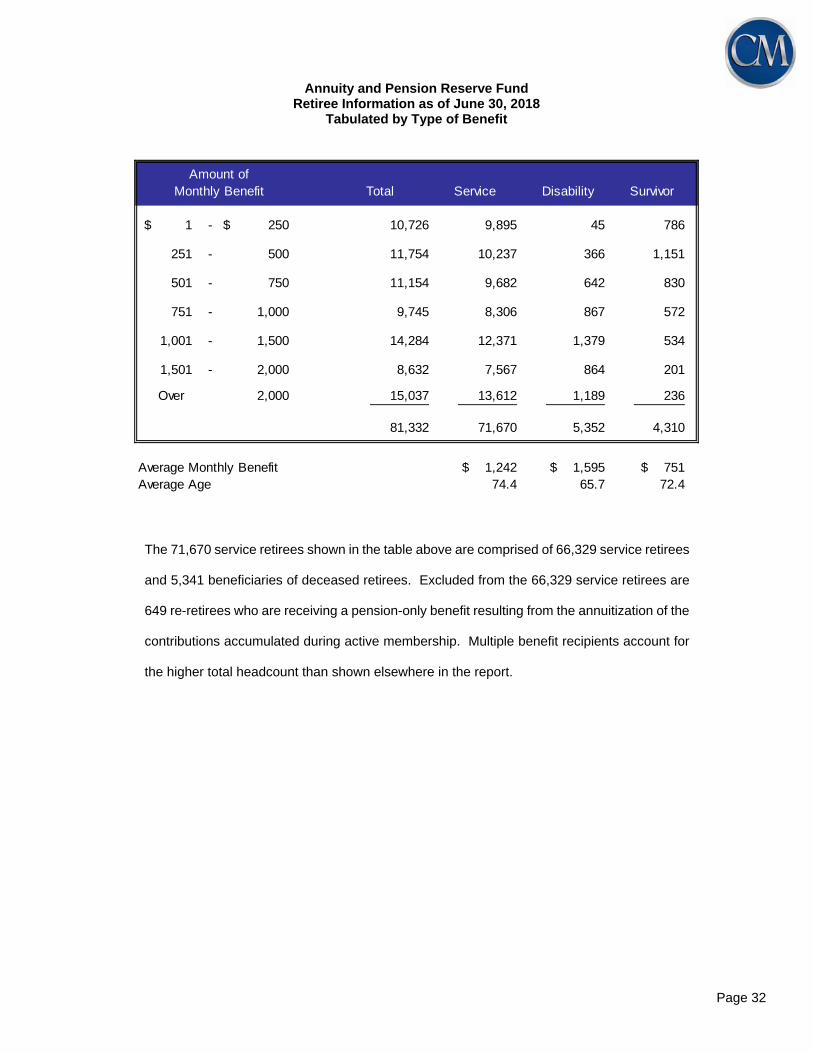
Annuity and Pension Reserve Fund
Retiree Information as of June 30, 2018 Tabulated by Type of Benefit
Total Service Disability Survivor
$ 1 - $ 250 10,726 9,895 45 786
251 - 500 11,754 10,237 366 1,151
501 - 750 11,154 9,682 642 830
751 - 1,000 9,745 8,306 867 572
1,001 - 1,500 14,284 12,371 1,379 534
1,501 - 2,000 8,632 7,567 864 201
Over 2,000 15,037 13,612 1,189 236
81,332 71,670 5,352 4,310
$ 1,242 $ 1,595 $ 751 74.4 65.7 72.4
Amount ofMonthly Benefit
Average Monthly BenefitAverage Age
The 71,670 service retirees shown in the table above are comprised of 66,329 service retirees
and 5,341 beneficiaries of deceased retirees. Excluded from the 66,329 service retirees are
649 re-retirees who are receiving a pension-only benefit resulting from the annuitization of the
contributions accumulated during active membership. Multiple benefit recipients account for
the higher total headcount than shown elsewhere in the report.

Page 33
Annuity and Pension Reserve Fund Retiree Information as of June 30, 2018
Tabulated by Attained Ages
Attained Annual Annual AnnualAge Number Benefits Number Benefits Number Benefits
Under 45 38 249,852$ 58 795,001$ 96 1,044,853$
45-49 38 563,585$ 158 2,523,847$ 196 3,087,433$
50-54 366 11,590,751$ 392 6,878,409$ 758 18,469,160$
55-59 1,811 57,913,703$ 921 18,407,765$ 2,732 76,321,467$
60-64 9,272 161,884,875$ 1382 26,660,269$ 10,654 188,545,144$
65-69 14,688 236,059,727$ 832 23,916,519$ 15,520 259,976,245$
70-74 13,597 209,665,660$ 622 11,701,595$ 14,219 221,367,256$
75-79 11,723 165,705,417$ 453 6,340,303$ 12,176 172,045,721$
80-84 9,518 120,608,036$ 296 3,325,849$ 9,814 123,933,885$
85-89 6,244 68,029,602$ 163 1,406,482$ 6,407 69,436,084$
90 & Over 4,375 36,134,811$ 75 461,721$ 4,450 36,596,532$
Totals 71,670 1,068,406,020$ 5,352 102,417,760$ 77,022 1,170,823,780$
TotalRetirement Disability Retirement
The 71,670 service retirees shown in the table above are comprised of 71,021 unique service retirees, and 649
unique re-retirees. The re-retirees included in the tabulation above are those who are receiving a pension-only
benefit resulting from the annuitization of the contributions accumulated during active membership.

Page 34
Annuity and Pension Reserve Fund Survivors of Annuitants Information as of June 30, 2018
Tabulated by Attained Ages
Attained Annual Annual AnnualAge Number Benefits Number Benefits Number Benefits
Under 45 38 249,852$ 0 -$ 38 249,852$
45-49 27 144,875$ 0 -$ 27 144,875$
50-54 45 325,875$ 0 -$ 45 325,875$
55-59 100 999,442$ 0 -$ 100 999,442$
60-64 216 2,908,469$ 1 18,261$ 217 2,926,730$
65-69 382 4,984,323$ 4 62,043$ 386 5,046,366$
70-74 606 6,940,396$ 10 141,220$ 616 7,081,616$
75-79 889 8,323,705$ 5 20,361$ 894 8,344,066$
80-84 1,119 9,921,309$ 4 99,418$ 1,123 10,020,727$
85-89 991 8,332,487$ 0 -$ 991 8,332,487$
90 & Over 904 6,013,413$ 0 -$ 904 6,013,413$
Totals 5,317 49,144,146$ 24 341,303$ 5,341 49,485,449$
Life Annuities Periods Certain Total
Page 35
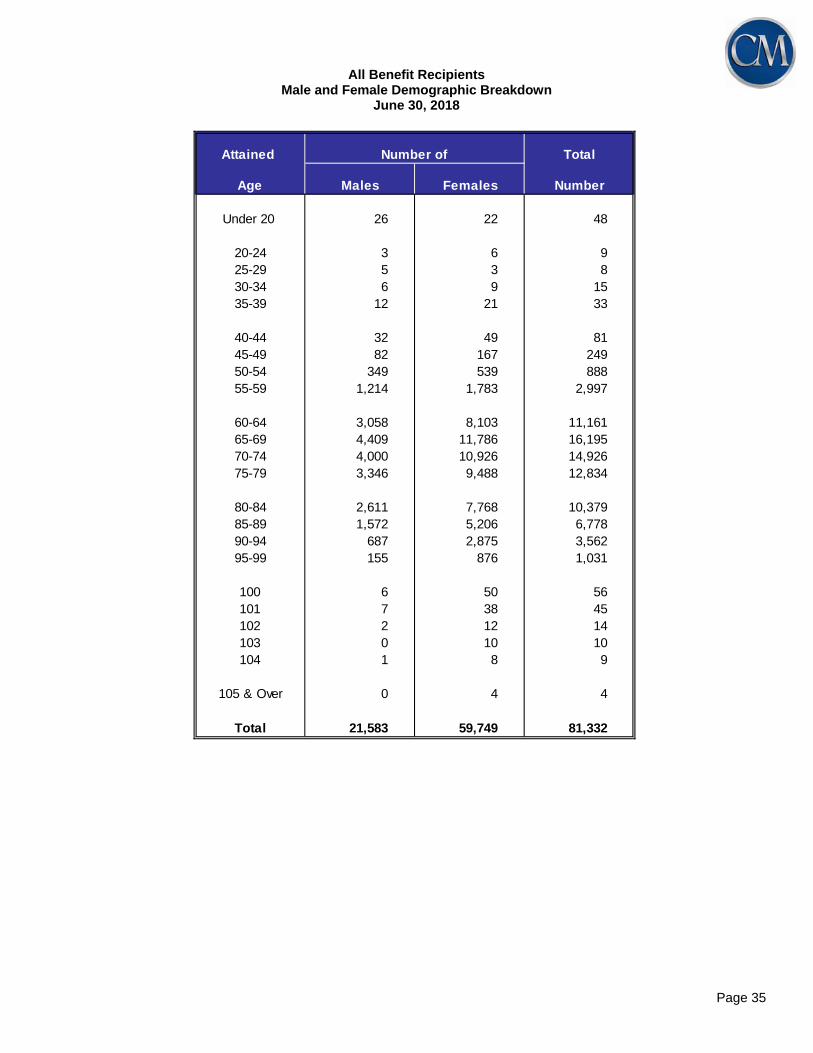
All Benefit Recipients Male and Female Demographic Breakdown
June 30, 2018
Attained Total
Age Males Females Number
Under 20 26 22 48
20-24 3 6 925-29 5 3 830-34 6 9 1535-39 12 21 33
40-44 32 49 8145-49 82 167 24950-54 349 539 88855-59 1,214 1,783 2,997
60-64 3,058 8,103 11,16165-69 4,409 11,786 16,19570-74 4,000 10,926 14,92675-79 3,346 9,488 12,834
80-84 2,611 7,768 10,37985-89 1,572 5,206 6,77890-94 687 2,875 3,56295-99 155 876 1,031
100 6 50 56101 7 38 45102 2 12 14103 0 10 10104 1 8 9
105 & Over 0 4 4
Total 21,583 59,749 81,332
Number of
Page 36
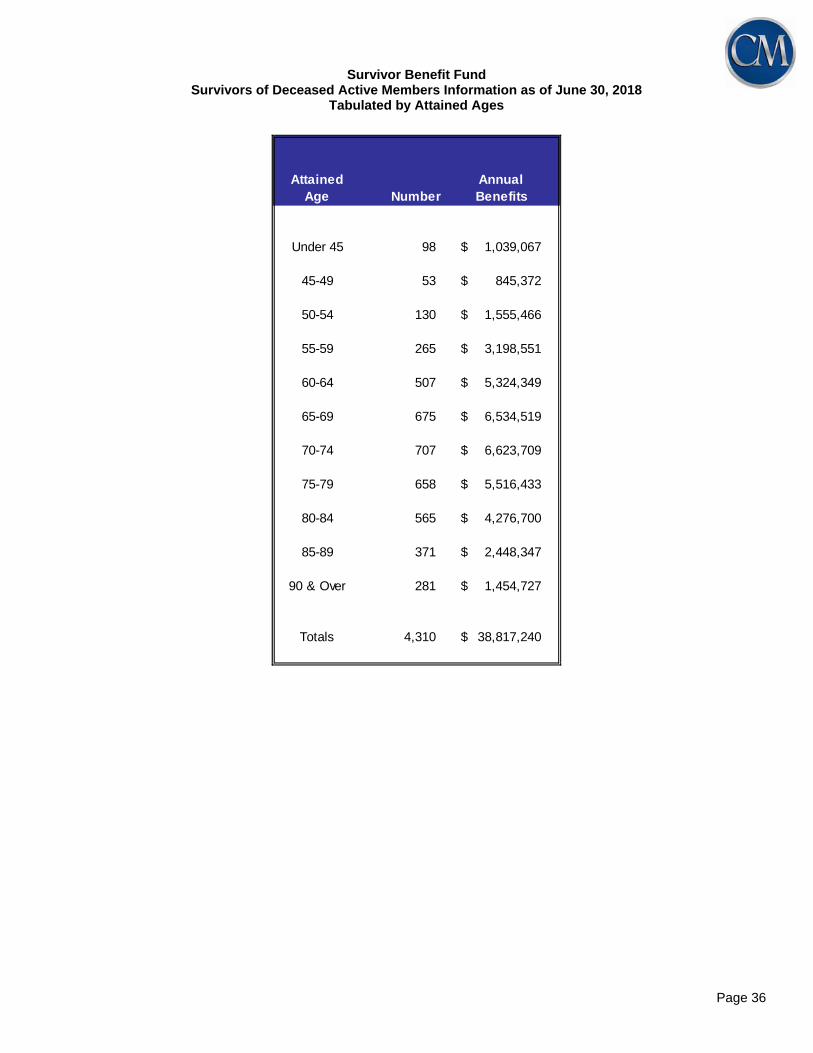
Survivor Benefit Fund Survivors of Deceased Active Members Information as of June 30, 2018
Tabulated by Attained Ages
Attained AnnualAge Number Benefits
Under 45 98 1,039,067$
45-49 53 845,372$
50-54 130 1,555,466$
55-59 265 3,198,551$
60-64 507 5,324,349$
65-69 675 6,534,519$
70-74 707 6,623,709$
75-79 658 5,516,433$
80-84 565 4,276,700$
85-89 371 2,448,347$
90 & Over 281 1,454,727$
Totals 4,310 38,817,240$
Page 37
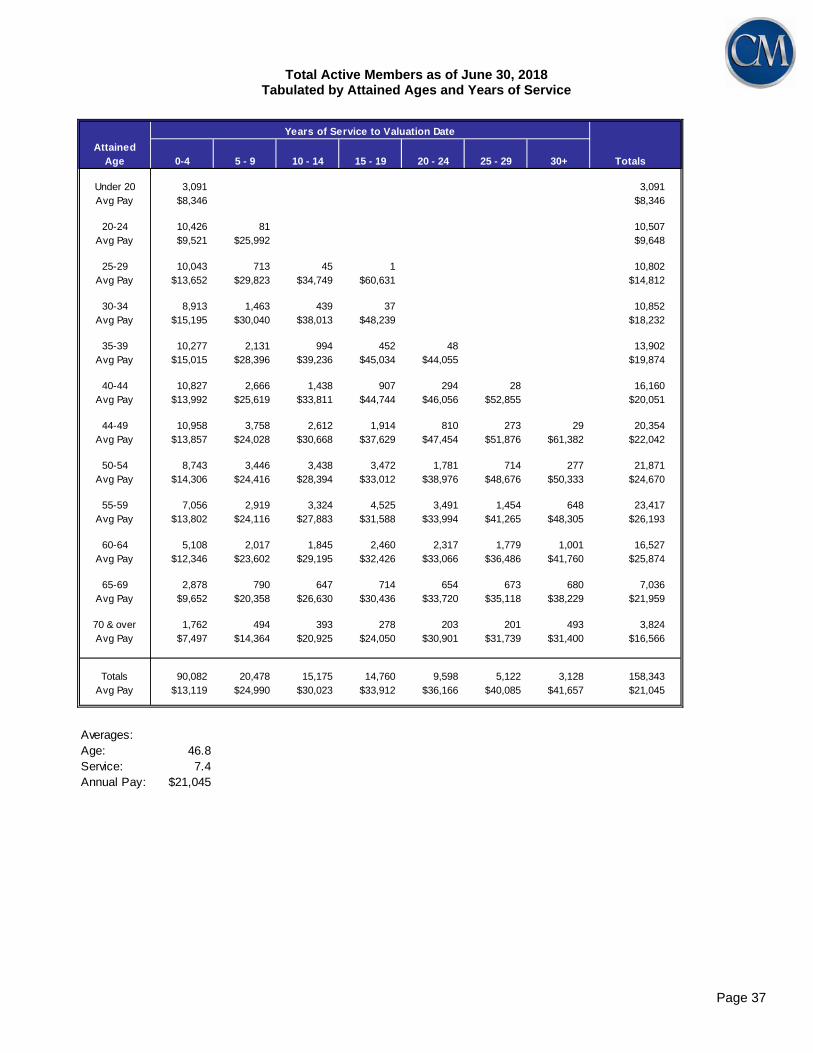
Total Active Members as of June 30, 2018 Tabulated by Attained Ages and Years of Service
Years of Service to Valuation Date
AttainedAge 0-4 5 - 9 10 - 14 15 - 19 20 - 24 25 - 29 30+ Totals
Under 20 3,091 3,091Avg Pay $8,346 $8,346
20-24 10,426 81 10,507Avg Pay $9,521 $25,992 $9,648
25-29 10,043 713 45 1 10,802Avg Pay $13,652 $29,823 $34,749 $60,631 $14,812
30-34 8,913 1,463 439 37 10,852Avg Pay $15,195 $30,040 $38,013 $48,239 $18,232
35-39 10,277 2,131 994 452 48 13,902Avg Pay $15,015 $28,396 $39,236 $45,034 $44,055 $19,874
40-44 10,827 2,666 1,438 907 294 28 16,160Avg Pay $13,992 $25,619 $33,811 $44,744 $46,056 $52,855 $20,051
44-49 10,958 3,758 2,612 1,914 810 273 29 20,354Avg Pay $13,857 $24,028 $30,668 $37,629 $47,454 $51,876 $61,382 $22,042
50-54 8,743 3,446 3,438 3,472 1,781 714 277 21,871Avg Pay $14,306 $24,416 $28,394 $33,012 $38,976 $48,676 $50,333 $24,670
55-59 7,056 2,919 3,324 4,525 3,491 1,454 648 23,417Avg Pay $13,802 $24,116 $27,883 $31,588 $33,994 $41,265 $48,305 $26,193
60-64 5,108 2,017 1,845 2,460 2,317 1,779 1,001 16,527Avg Pay $12,346 $23,602 $29,195 $32,426 $33,066 $36,486 $41,760 $25,874
65-69 2,878 790 647 714 654 673 680 7,036Avg Pay $9,652 $20,358 $26,630 $30,436 $33,720 $35,118 $38,229 $21,959
70 & over 1,762 494 393 278 203 201 493 3,824Avg Pay $7,497 $14,364 $20,925 $24,050 $30,901 $31,739 $31,400 $16,566
Totals 90,082 20,478 15,175 14,760 9,598 5,122 3,128 158,343Avg Pay $13,119 $24,990 $30,023 $33,912 $36,166 $40,085 $41,657 $21,045
Averages:Age: 46.8Service: 7.4Annual Pay: $21,045
Page 38
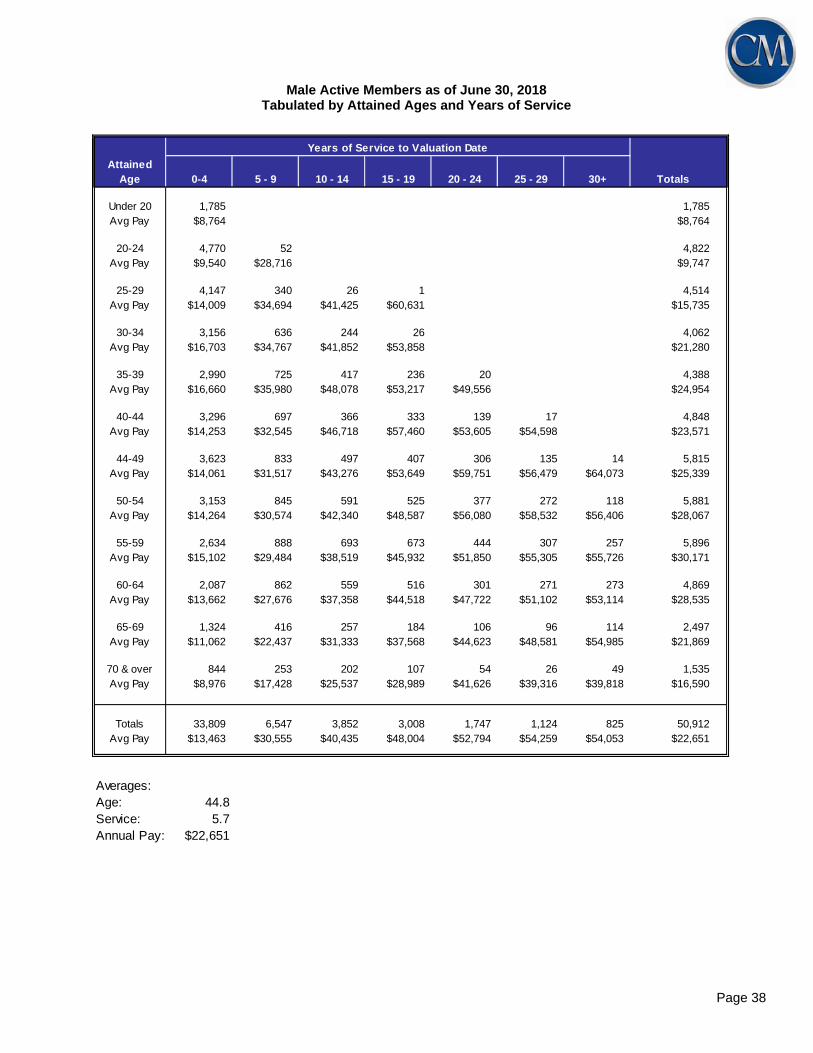
Male Active Members as of June 30, 2018
Tabulated by Attained Ages and Years of Service
Years of Service to Valuation Date
AttainedAge 0-4 5 - 9 10 - 14 15 - 19 20 - 24 25 - 29 30+ Totals
Under 20 1,785 1,785Avg Pay $8,764 $8,764
20-24 4,770 52 4,822Avg Pay $9,540 $28,716 $9,747
25-29 4,147 340 26 1 4,514Avg Pay $14,009 $34,694 $41,425 $60,631 $15,735
30-34 3,156 636 244 26 4,062Avg Pay $16,703 $34,767 $41,852 $53,858 $21,280
35-39 2,990 725 417 236 20 4,388Avg Pay $16,660 $35,980 $48,078 $53,217 $49,556 $24,954
40-44 3,296 697 366 333 139 17 4,848Avg Pay $14,253 $32,545 $46,718 $57,460 $53,605 $54,598 $23,571
44-49 3,623 833 497 407 306 135 14 5,815Avg Pay $14,061 $31,517 $43,276 $53,649 $59,751 $56,479 $64,073 $25,339
50-54 3,153 845 591 525 377 272 118 5,881Avg Pay $14,264 $30,574 $42,340 $48,587 $56,080 $58,532 $56,406 $28,067
55-59 2,634 888 693 673 444 307 257 5,896Avg Pay $15,102 $29,484 $38,519 $45,932 $51,850 $55,305 $55,726 $30,171
60-64 2,087 862 559 516 301 271 273 4,869Avg Pay $13,662 $27,676 $37,358 $44,518 $47,722 $51,102 $53,114 $28,535
65-69 1,324 416 257 184 106 96 114 2,497Avg Pay $11,062 $22,437 $31,333 $37,568 $44,623 $48,581 $54,985 $21,869
70 & over 844 253 202 107 54 26 49 1,535Avg Pay $8,976 $17,428 $25,537 $28,989 $41,626 $39,316 $39,818 $16,590
Totals 33,809 6,547 3,852 3,008 1,747 1,124 825 50,912Avg Pay $13,463 $30,555 $40,435 $48,004 $52,794 $54,259 $54,053 $22,651
Averages:Age: 44.8Service: 5.7Annual Pay: $22,651
Page 39
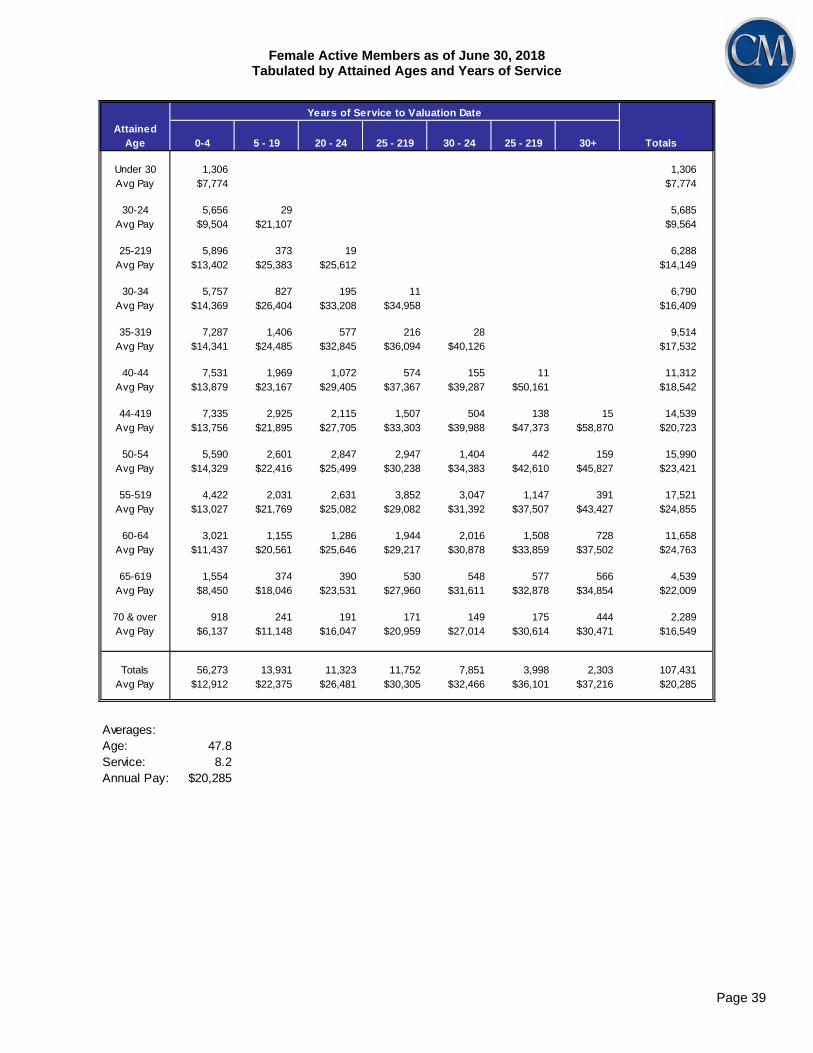
Female Active Members as of June 30, 2018 Tabulated by Attained Ages and Years of Service
Years of Service to Valuation Date
AttainedAge 0-4 5 - 19 20 - 24 25 - 219 30 - 24 25 - 219 30+ Totals
Under 30 1,306 1,306Avg Pay $7,774 $7,774
30-24 5,656 29 5,685Avg Pay $9,504 $21,107 $9,564
25-219 5,896 373 19 6,288Avg Pay $13,402 $25,383 $25,612 $14,149
30-34 5,757 827 195 11 6,790Avg Pay $14,369 $26,404 $33,208 $34,958 $16,409
35-319 7,287 1,406 577 216 28 9,514Avg Pay $14,341 $24,485 $32,845 $36,094 $40,126 $17,532
40-44 7,531 1,969 1,072 574 155 11 11,312Avg Pay $13,879 $23,167 $29,405 $37,367 $39,287 $50,161 $18,542
44-419 7,335 2,925 2,115 1,507 504 138 15 14,539Avg Pay $13,756 $21,895 $27,705 $33,303 $39,988 $47,373 $58,870 $20,723
50-54 5,590 2,601 2,847 2,947 1,404 442 159 15,990Avg Pay $14,329 $22,416 $25,499 $30,238 $34,383 $42,610 $45,827 $23,421
55-519 4,422 2,031 2,631 3,852 3,047 1,147 391 17,521Avg Pay $13,027 $21,769 $25,082 $29,082 $31,392 $37,507 $43,427 $24,855
60-64 3,021 1,155 1,286 1,944 2,016 1,508 728 11,658Avg Pay $11,437 $20,561 $25,646 $29,217 $30,878 $33,859 $37,502 $24,763
65-619 1,554 374 390 530 548 577 566 4,539Avg Pay $8,450 $18,046 $23,531 $27,960 $31,611 $32,878 $34,854 $22,009
70 & over 918 241 191 171 149 175 444 2,289Avg Pay $6,137 $11,148 $16,047 $20,959 $27,014 $30,614 $30,471 $16,549
Totals 56,273 13,931 11,323 11,752 7,851 3,998 2,303 107,431Avg Pay $12,912 $22,375 $26,481 $30,305 $32,466 $36,101 $37,216 $20,285
Averages:Age: 47.8Service: 8.2Annual Pay: $20,285
Page 40
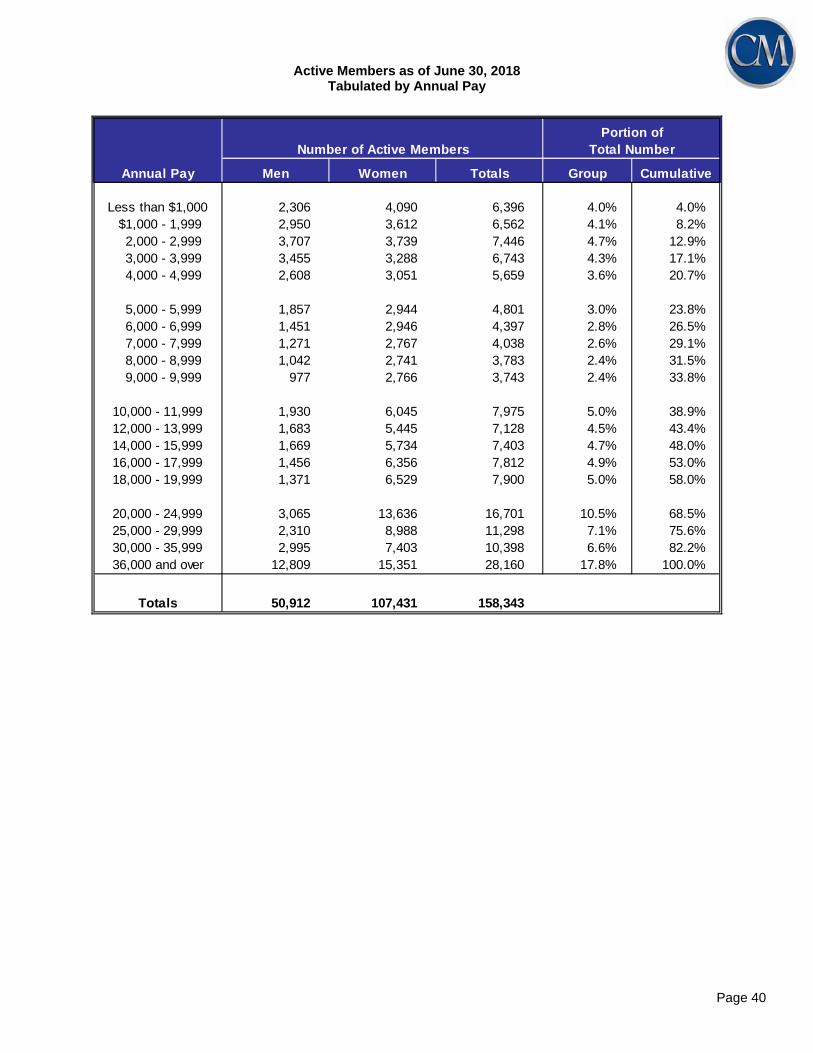
Active Members as of June 30, 2018
Tabulated by Annual Pay
Annual Pay Men Women Totals Group Cumulative
Less than $1,000 2,306 4,090 6,396 4.0% 4.0% $1,000 - 1,999 2,950 3,612 6,562 4.1% 8.2% 2,000 - 2,999 3,707 3,739 7,446 4.7% 12.9% 3,000 - 3,999 3,455 3,288 6,743 4.3% 17.1% 4,000 - 4,999 2,608 3,051 5,659 3.6% 20.7%
5,000 - 5,999 1,857 2,944 4,801 3.0% 23.8% 6,000 - 6,999 1,451 2,946 4,397 2.8% 26.5% 7,000 - 7,999 1,271 2,767 4,038 2.6% 29.1% 8,000 - 8,999 1,042 2,741 3,783 2.4% 31.5% 9,000 - 9,999 977 2,766 3,743 2.4% 33.8%
10,000 - 11,999 1,930 6,045 7,975 5.0% 38.9%12,000 - 13,999 1,683 5,445 7,128 4.5% 43.4%14,000 - 15,999 1,669 5,734 7,403 4.7% 48.0%16,000 - 17,999 1,456 6,356 7,812 4.9% 53.0%18,000 - 19,999 1,371 6,529 7,900 5.0% 58.0%
20,000 - 24,999 3,065 13,636 16,701 10.5% 68.5%25,000 - 29,999 2,310 8,988 11,298 7.1% 75.6%30,000 - 35,999 2,995 7,403 10,398 6.6% 82.2%36,000 and over 12,809 15,351 28,160 17.8% 100.0%
Totals 50,912 107,431 158,343
Number of Active MembersPortion of
Total Number

Page 41
SCHEDULE F
GAIN/LOSS ANALYSIS DETAILS
COMMENTS
Regular actuarial valuations measure the Retirement System's present financial position and contributions
adequacy by calculating and financing the liabilities created by the present benefit program. This process
involves discounting to present values the future benefit payments on behalf of present active and Retiree
members and their survivors. However, valuations do not produce information regarding the amount of
increases or decreases in unfunded actuarial accrued liabilities (UAAL) -- gain/loss analyses do.
The overall gain/loss to the Retirement System is the difference between the actual UAAL and the expected
UAAL. A gain/loss analysis shows the breakdown of the overall system gain/loss by economic and non-
economic risk areas. The economic risk areas are investment return and pay increases. The non-economic
risk areas are service retirement, disability retirement, death in active service, termination (vested and non-
vested), retiree mortality, and new members. Gains and losses resulting from data adjustments, timing of
financial transactions, etc. are included separately as a miscellaneous item.
It is expected that actual experience will not coincide with assumed experience. It is assumed that gains
and losses will be in balance over a period of years, but sizable year-to-year fluctuations are common.
Changes in actuarial assumptions should be made for risk areas when the differences between actual and
expected experience are consistently sizable over a period of years. Differences over a relatively short
period of time may or may not be indicative of long-term trends, which are the basis of actuarial
assumptions.
The actuarial assumptions used in this analysis were adopted by the Board in April 21, 2016.

Page 42
School Employees Retirement System of Ohio
Experience Gains and Losses By Risk Area
Comparative Schedule
($ Millions)
Year Age & DeathEnding Pay Service In New Retiree
June 30 Increases Investment Retirement Disability Service Withdrawal Members Mortality Other + $ % of AAL2009 107.5 (2,265.2) (50.8) (28.7) (0.6) (11.9) (50.4) 51.8 200.1 (2,048.2) (14.0)2010 182.5 390.5 (40.6) (23.4) (0.5) 11.0 (38.1) 46.5 (29.6) 498.3 3.42011 198.4 (1,082.9) (59.2) (28.1) (0.7) 15.4 (36.4) (1.0) (10.0) (1,004.5) (6.2)2012 178.7 (692.0) (154.8) (47.7) (0.2) 46.5 (29.8) 51.9 (6.2) (653.6) (3.9)2013 219.2 241.0 (121.9) (53.6) 0.0 61.1 (35.1) 2.9 1.9 315.5 1.8
2014 103.4 403.3 (122.6) (56.0) 0.1 48.3 (28.2) 3.1 (2.1) 349.3 2.02015 53.3 62.1 (123.0) (53.1) 0.0 65.1 (47.7) 55.8 (0.2) 12.3 0.1
2016 70.0 50.6 (140.9) (50.6) (28.5) 30.4 (44.0) 113.9 (0.6) 0.3 0.0 2017 (69.2) (12.0) (211.8) (37.7) (0.6) 21.9 (48.1) 97.3 (26.8) (287.0) (1.5)2018 85.2 (161.1) (209.7) (14.7) (6.6) (124.5) (35.7) 15.0 4.7 (447.4) (2.2)
Economic Non-EconomicGain (Loss) by Risk Area
+ Includes effect of changes in data, timing of financial transactions, etc.

Page 43
The market related actuarial value of assets is based on a four-year average of adjusted market value
returns. The difference between the actual returns at market value for the year and expected returns is
determined. Twenty-five percent (25%) of that difference is added to the expected value along with
corresponding amounts from each of the prior three years.
The actuarial value of assets for the basic benefits as of June 30, 2018 was $14,012,179,131. The value
for the previous year was $13,713,087,833.
School Employees Retirement System of OhioDevelopment of Gain (Loss) for Basic Benefits
From Investment ReturnFor the Year Ended June 30, 2018
($ Millions)
$ Millions
1. 13,713.1$
2.a. 14,012.2
b. 14,173.3
3. (161.1)$ Gain (Loss): 2a minus 2b
Actuarial value of assets as of June 30, 2017
Actuarial value of assets as of June 30, 2018Actual
If 7.50% assumed investment return were achieved for all phased-in years recognized in the asset method
Page 44
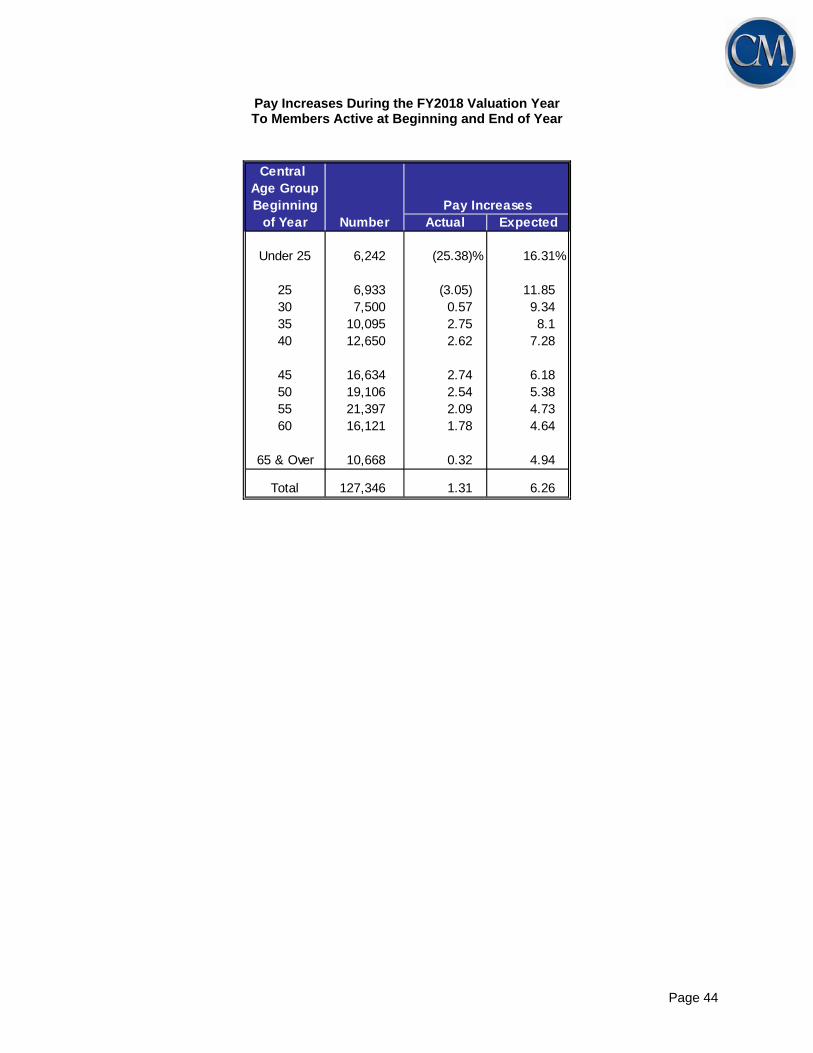
Pay Increases During the FY2018 Valuation Year To Members Active at Beginning and End of Year
Central Age GroupBeginning
of Year Number Actual Expected
Under 25 6,242 (25.38)% 16.31%
25 6,933 (3.05) 11.8530 7,500 0.57 9.3435 10,095 2.75 8.140 12,650 2.62 7.28
45 16,634 2.74 6.1850 19,106 2.54 5.3855 21,397 2.09 4.7360 16,121 1.78 4.64
65 & Over 10,668 0.32 4.94
Total 127,346 1.31 6.26
Pay Increases

Page 45
Members Who Became Age & Service Retirees During the FY2018 Valuation Year (Retirement With Allowance Beginning Immediately)
AttainedAge
Under 50 0 8 9 11 7 0 10 45
50 0 1 1 4 2 0 9 1751 0 0 0 2 0 0 12 1452 0 2 2 3 1 2 24 3453 0 2 2 3 1 1 30 3954 0 2 2 5 1 2 37 49
55 0 1 4 3 2 42 30 8256 0 3 5 7 2 13 39 6957 0 1 5 6 4 26 45 8758 0 1 3 8 2 15 40 6959 0 2 2 5 5 27 52 93
60 0 22 71 143 160 52 54 50261 0 36 54 98 98 38 54 37862 0 26 51 108 122 47 54 40863 0 30 34 91 98 40 44 33764 0 23 48 91 125 44 61 392
65 0 34 65 65 90 93 89 43666 0 21 22 34 28 34 50 18967 0 16 24 29 32 42 45 18868 0 13 17 22 20 27 35 13469 0 13 27 19 17 17 25 118
70 & Over 0 31 64 72 45 51 145 408
Totals 0 288 512 829 862 613 984 4,088
Avg. Monthly Benefit 0$ 369$ 595$ 938$ 1,263$ 1,603$ 2,545$ 1,410$ Avg. FAS 0$ 25,696$ 28,132$ 33,441$ 35,622$ 37,031$ 44,995$ 36,010$
Number of Retirees 0 288 512 829 862 613 984 4088
Average Age: 63.2Average Service: 22.2
0-4 5-9 10-14 15-19
0-4 5-9 10-14 15-19 25-29 30 plus Total
Years of Service to Valuation Date
Years of Service to Valuation Date
20-24 25-29 30 plus Total
20-24

Page 46
Members Who Died in the FY2018 Valuation Year With a Death-in-Service Allowance Payable
Central Age GroupBeginning
of Year Number
Under 25 025 030 235 140 3
45 950 655 1060 15
65 10
70 & Over 5
Total 61
Average Age: 55.1Average Service: 16.4
Page 47
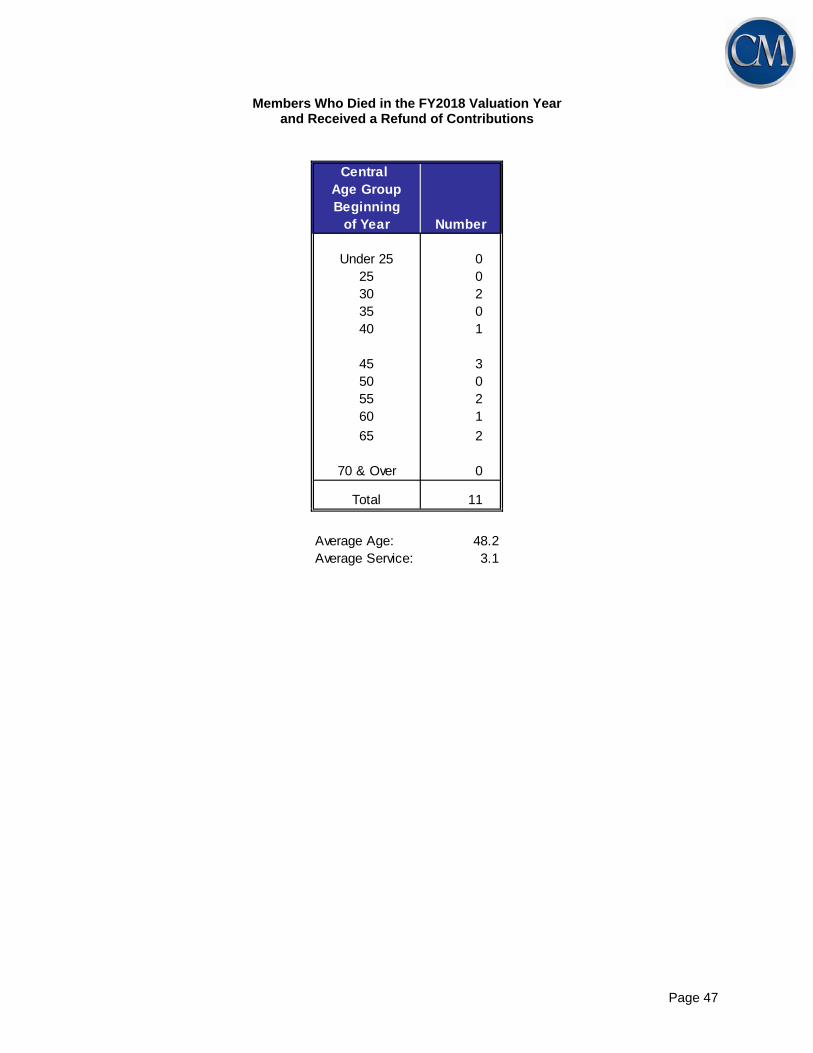
Members Who Died in the FY2018 Valuation Year and Received a Refund of Contributions
Central Age GroupBeginning
of Year Number
Under 25 025 030 235 040 1
45 350 055 260 1
65 2
70 & Over 0
Total 11
Average Age: 48.2Average Service: 3.1

Page 48
Members Who Became Disability Retirees During the FY2018 Valuation Year
Central Age GroupBeginning
of Year Number
Under 25 025 030 135 040 10
45 1550 3355 7660 70
65 17
70 & Over 1
Total 223
Average Age: 55.3Average Service: 17.5Average FAS: $32,403

Page 49
Members Receiving a Refund of Contributions or Becoming Inactive Without a Refund in
the FY2018 Valuation Year (Non-vested Terminations)
Central Age GroupBeginning
of Year Number
Under 25 3,80925 3,96830 2,28135 1,95340 2,085
45 2,12850 1,76355 1,35960 856
65 473
70 & Over 276
Total 20,951
Average Age: 37.1Average Service: 1.1
Page 50
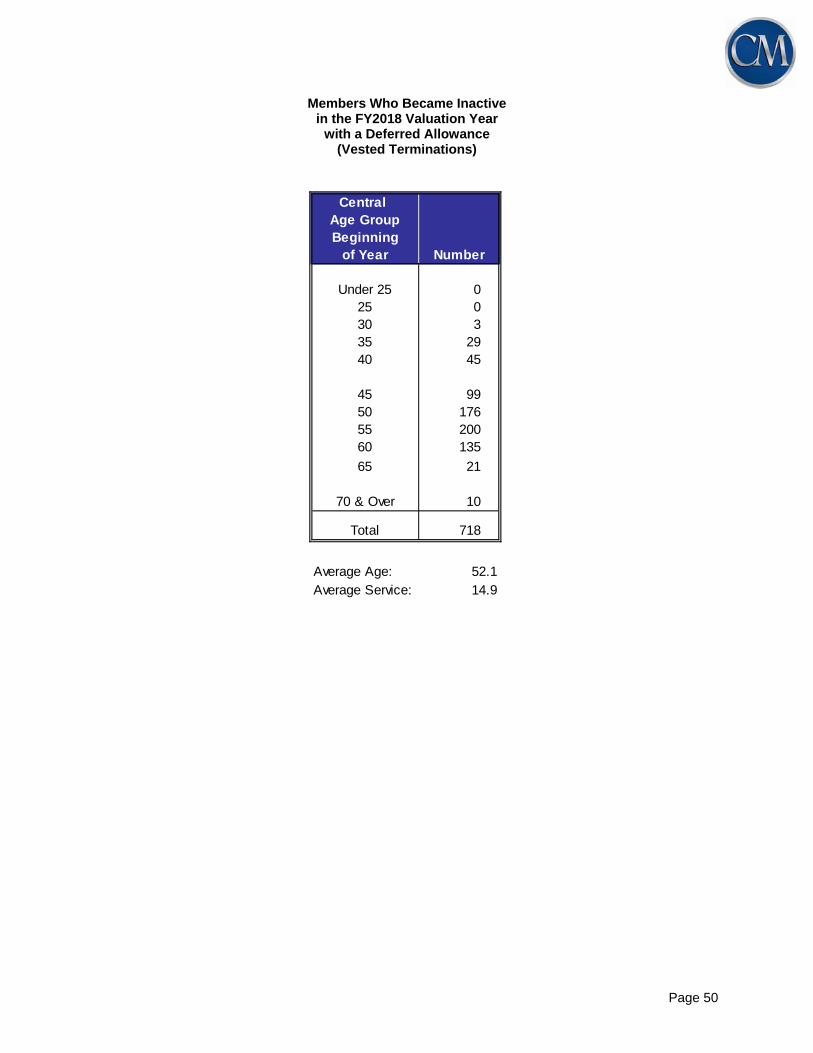
Members Who Became Inactive in the FY2018 Valuation Year
with a Deferred Allowance (Vested Terminations)
Central Age GroupBeginning
of Year Number
Under 25 025 030 335 2940 45
45 9950 17655 20060 135
65 21
70 & Over 10
Total 718
Average Age: 52.1Average Service: 14.9

Page 51
SCHEDULE G
GLOSSARY
Actuarial Accrued Liability. The difference between (i) the actuarial present value of future plan benefits, and (ii) the actuarial present value of future normal cost. Sometimes referred to as "accrued liability" or "past service liability". Accrued Service. The service credited under the plan which was rendered before the date of the actuarial valuation. Actuarial Assumptions. Estimates of future plan experience with respect to rates of mortality, disability, turnover, retirement, rate or rates of investment income and salary increases. Decrement assumptions (rates of mortality, disability, turnover and retirement) are generally based on past experience, often modified for projected changes in conditions. Economic assumptions (salary increases and investment income) consist of an underlying rate in an inflation-free environment plus a provision for a long-term average rate of inflation. Actuarial Cost Method. A mathematical budgeting procedure for allocating the dollar amount of the "actuarial present value of future plan benefits" between the actuarial present value of future normal cost and the actuarial accrued liability. Sometimes referred to as the "actuarial funding method". Actuarial Equivalent. A series of payments is called an actuarial equivalent of another series of payments if the two series have the same actuarial present value. Actuarial Present Value. The amount of funds presently required to provide a payment or series of payments in the future. It is determined by discounting the future payments at a predetermined rate of interest, taking into account the probability of payment. Amortization. Paying off an interest-bearing liability by means of periodic payments of interest and principal, as opposed to paying it off with a lump sum payment. Experience Gain (Loss). A measure of the difference between actual experience and that expected based upon a set of actuarial assumptions during the period between two actuarial valuation dates, in accordance with the actuarial cost method being used. Normal Cost. The annual cost assigned, under the actuarial funding method, to current and subsequent plan years. Sometimes referred to as "current service cost". Any payment toward the unfunded actuarial accrued liability is not part of the normal cost. Plan Termination Liability. The actuarial present value of future plan benefits based on the assumption that there will be no further accruals for future service and salary. The termination liability will generally be less than the liabilities computed on a "going concern" basis and is not normally determined in a routine actuarial valuation. Reserve Account. An account used to indicate that funds have been set aside for a specific purpose and are not generally available for other uses. Unfunded Actuarial Accrued Liability. The difference between the actuarial accrued liability and valuation assets. Sometimes referred to as "unfunded accrued liability". Valuation Assets. The value of current plan assets recognized for valuation purposes. Generally based on book value plus a portion of unrealized appreciation or depreciation.

Page 52
APPENDIX A
ACTUARIAL ACCRUED LIABILITIES
AS OF JUNE 30, 2018
Medicare Post-Retirement TotalPresent Value of: Part B Death Benefit Basic Benefits
Future benefits to presentretirees and survivors $11,862,831,988 $236,229,932 $30,343,075 $12,129,404,995
Benefits and refunds topresent inactive members 563,793,631 14,769,034 832,343 579,395,008
Allowances to presentactive members
Service 6,806,173,300 133,497,430 7,098,605 6,946,769,335Disability 230,742,933 3,805,769 440,003 234,988,705Survivor benefits 123,874,430 2,193,344 0 126,067,774Withdrawal (28,455,848) 9,137,386 393,611 (18,924,851)
Total Active AAL 7,132,334,815 148,633,929 7,932,219 7,288,900,963
Total AAL $19,558,960,434 $399,632,895 $39,107,637 $19,997,700,966
PensionBenefits

Page 53
APPENDIX B
BREAKDOWN OF TOTAL AND ACCRUED LIABILITIES AS OF JUNE 30, 2018
Total AccruedLiability Liability
Active Members
Retirement $8,345,505,278 $6,806,173,300
Death 176,813,971 123,874,430
Disability 404,439,835 230,742,933
Termination 667,414,362 (28,455,848)
Medicare Part B 200,802,637 148,633,929
Death after Retirement 11,011,145 7,932,219
Total $9,805,987,228 $7,288,900,963
Retirees
Retirement/Survivor/Disability $11,862,831,988 $11,862,831,988
Medicare Part B 236,229,932 236,229,932
Death after Retirement 30,343,075 30,343,075
Total $12,129,404,995 $12,129,404,995
Deferred Vested Members 269,493,956 269,493,956
Inactive Members 309,901,052 309,901,052
Total Actuarial Values $22,514,787,231 $19,997,700,966
Actuarial Value of Assets 14,012,179,131
Unfunded Actuarial Accrued Liability $5,985,521,835

Page 54
APPENDIX C
COMPARATIVE SCHEDULE AS OF JUNE 30, 2018
Accrued ValuationPayroll Active / Liability Assets UAAL
Number $ Millions $ % Increase Retired Retired $ Millions % of Payroll2009 125,465 2,787 22,216 4.2 65,757 1.9 693.8 24.9 14,582 9,836 4,7462010 126,015 2,843 22,558 1.5 66,127 1.9 729.9 25.7 15,222 10,909 4,3122011 125,337 2,852 22,758 0.9 67,221 1.9 777.9 27.3 16,325 10,513 5,8122012 121,811 2,788 22,889 0.6 69,038 1.8 838.1 30.1 16,755 10,397 6,3582013 121,642 2,747 22,581 (1.3) 70,771 1.7 898.3 32.7 17,247 11,126 6,121
2014 121,251 2,759 22,757 0.8 72,605 1.7 958.5 34.7 17,882 12,030 5,8512015 122,855 2,845 23,161 1.8 74,372 1.7 1,020.4 35.9 18,503 12,602 5,9022016 124,540 2,932 23,545 1.7 76,280 1.6 1,083.6 37.0 19,771 13,180 6,5912017 157,981 3,303 20,906 (11.2) 79,157 2.0 1,162.0 35.2 19,588 13,713 5,8752018 158,343 3,332 21,045 0.7 81,332 1.9 1,211.9 36.4 19,998 14,024 5,974
Valuation Date
June 30 $ Millions
Retired LivesNumber
Annual BenefitsAverage SalaryActive Members