Report on Scarcity Conditions in Maharashtra State due to ...
9
Report on Scarcity Conditions in Maharashtra State due to less rainfall during June 2014 1. The rainfall condition was good during last year. Correspondingly, there was increase in Ground Water level . Based on the situation of rainfall & Ground Water level during last year, It has been predicted during this year that scarcity conditions will be observed in 2431 villages from 100 blocks. There are 9 measures which are proposed under Scarcity Action Plan through district Collectors. As on 21.06.2014, out of 8634 borewell sites, the survey work is completed for 8121 sites and 4295 sites are found feasible for borewells. Out of this, 1786 borewells are drilled. 1095 Hand pumps & 18 power pumps are installed on 1541 successful borewells. Works are in progress in other places & 264 private drilling rigs are available with Zilla Parishads. During last year, 5060 tankers were deployed in the month June 2013.. As on 17 June 2014, 1393 tankers have been deployed in 1405 villages & 3436 habitations. 2. Ground water study for the month May 2014 : The study has been done in May 2014 regarding Ground Water levels. Accordingly, 2014 villages in 136 blocks have been identified for scarcity conditions. Sr. No. Category No.of Districts No. of Blocks No. of Villages 1 Less rainfall (> 20%) 4 5 81 2 Less rainfall ( 0 to 20%) 15 35 546 3 Less rainfall 27 96 1387 Total 136 2014 3. Rainfall 2014 : In Maharashtra State, the rainfall is during $ months, June, July, August & September & it helps for improvement in Water Level. Hence, drinking water shortage is not observed. As per Survey of Agriculture Department, there is 21% to 52 % rainfall up to 23.06.2014. Comparing with Average Rainfall, the region wise % of rainfall is as below : Konkan Region : 32.80 % Nashik Region- 21.40 % Pune Region- 52.40% Aurangabad Region- 25.10% Amravati Region – 25.70% Nagpur Region – 31.20 %
Transcript of Report on Scarcity Conditions in Maharashtra State due to ...

Report on Scarcity Conditions in Maharashtra State due to less rainfall
during June 2014
1. The rainfall condition was good during last year. Correspondingly, there was
increase in Ground Water level . Based on the situation of rainfall & Ground Water
level during last year, It has been predicted during this year that scarcity conditions
will be observed in 2431 villages from 100 blocks. There are 9 measures which are
proposed under Scarcity Action Plan through district Collectors. As on 21.06.2014,
out of 8634 borewell sites, the survey work is completed for 8121 sites and 4295
sites are found feasible for borewells. Out of this, 1786 borewells are drilled. 1095
Hand pumps & 18 power pumps are installed on 1541 successful borewells. Works
are in progress in other places & 264 private drilling rigs are available with Zilla
Parishads.
During last year, 5060 tankers were deployed in the month June 2013.. As on 17
June 2014, 1393 tankers have been deployed in 1405 villages & 3436 habitations.
2. Ground water study for the month May 2014 :
The study has been done in May 2014 regarding Ground Water levels.
Accordingly, 2014 villages in 136 blocks have been identified for scarcity conditions.
Sr. No. Category No.of Districts No. of Blocks No. of Villages 1 Less rainfall (> 20%) 4 5 81 2 Less rainfall ( 0 to
20%) 15 35 546
3 Less rainfall 27 96 1387 Total 136 2014
3. Rainfall 2014 :
In Maharashtra State, the rainfall is during $ months, June, July, August & September
& it helps for improvement in Water Level. Hence, drinking water shortage is not
observed. As per Survey of Agriculture Department, there is 21% to 52 % rainfall up
to 23.06.2014. Comparing with Average Rainfall, the region wise % of rainfall is as
below :
Konkan Region : 32.80 %
Nashik Region- 21.40 %
Pune Region- 52.40%
Aurangabad Region- 25.10%
Amravati Region – 25.70%
Nagpur Region – 31.20 %

Due to lesser rainfall the drinking water shortage will be observed during June
2014 in 136 blocks, where water level was depleted in May 2014. In other blocks
also drinking water shortage will be observed to some extent. ( excluding Konkan &
Nagpur Regions)

No.
of
Succ
essfu
l
Bore
well
Deep
Water
Level
Village Habitatio
ns
Bore
well /
Tube
Well
GSDA ZPPriva
teVill. Hab.
BW/Tu
be WellVill. Hab.
BW/Tu
be
Well
Vill. Hab.
BW /
Tube
Well
Vill. Hab.
BW /
Tube
Well
BW /
Tube
Well
BW /
Tube
Well
Hand
pump
Power
PumpGovt Private
1 2 3 4 5 6 7 8 9 10 11 12 13 14 15 16 17 18 19 20 21 22 23 24 25 26 27 28
1 Thane 199 394 593 4 1 0 199 394 593 150 221 371 371 141 227 368 107 170 277 196 23 150 0 0 9 0
2 Raigad 228 552 780 3 2 0 125 331 456 79 216 295 232 51 125 176 16 32 48 36 3 2 0 0 2 324
3 Ratnagiri 0 163 163 2 0 0 0 163 163 0 126 126 79 0 46 46 0 36 36 27 0 22 5 0 4 0
4 Sindhdurg 0 486 486 2 1 0 0 355 355 0 248 248 226 0 186 186 0 95 95 82 0 42 1 0 5 131
427 1595 2022 11 4 0 324 1243 1567 229 811 1040 908 192 584 776 123 333 456 341 26 216 6 0 20 455
5 Nashik 326 148 474 4 1 0 326 148 474 185 72 276 273 0 0 0 0 0 0 0 0 0 0 1 5 0
6 Dhule 20 7 51 2 1 0 20 7 51 1 2 12 12 1 1 11 1 1 2 1 0 1 0 1 2 0
18 39 73 0 0 0 18 39 73 15 38 69 56 13 30 56 10 23 43 19 0 11 0 0 0 0
7 Nandurbar 8 24 62 3 1 0 8 24 62 8 24 62 62 8 24 62 8 24 61 58 0 40 0 0 5 0
8 Jalgaon 0 0 0 3 0 0 0 0 0 0 0 0 0 0 0 0 0 0 0 0 0 0 0 0 6 0
9 Ahmednagar 201 490 695 4 1 0 201 490 695 143 307 450 622 110 130 240 86 113 199 197 7 149 0 1 6 0
573 708 1355 16 4 0 573 708 1355 352 443 869 1025 132 185 369 105 161 305 275 7 201 0 3 24 0
10 Pune 114 598 712 1 1 4 114 598 712 31 252 283 283 31 252 283 8 252 260 213 0 208 0 1 17 0
11 Satara 77 249 324 1 1 0 75 249 324 17 125 142 54 0 53 53 0 33 33 32 0 0 0 1 7 0
12 Sangli 15 65 80 2 1 0 12 65 80 3 8 11 11 3 8 11 0 0 0 0 0 0 0 0 5 0
13 Solapur 136 350 486 3 1 0 136 350 486 25 149 174 174 0 73 73 0 28 28 28 0 7 0 1 3 0
14 Kolhapur 63 230 293 2 2 0 63 230 293 34 105 139 38 4 13 17 3 13 16 12 4 6 2 0 4 0
405 1492 1895 9 6 4 400 1492 1895 110 639 749 560 38 399 437 11 326 337 285 4 221 2 3 36 0
15 Aurangabad 315 0 552 3 2 0 315 0 552 132 0 239 234 102 0 150 79 0 120 101 5 85 0 2 5 0
16 Jalna 28 14 42 3 2 0 28 14 42 23 0 23 18 0 0 0 0 0 0 0 0 0 0 0 13 0
17 Parbhani 0 0 0 3 0 1 0 0 0 0 0 0 0 0 0 0 0 0 0 0 0 0 0 0 0 0
18 Hingoli 174 0 179 1 2 0 174 0 179 35 0 40 25 0 0 0 0 0 0 0 0 0 0 0 7 0
19 Nanded 394 129 538 3 2 0 394 129 538 293 82 389 352 262 69 352 117 23 148 146 24 30 5 1 13 0
20 Latur 148 36 197 2 1 0 148 36 197 66 0 68 33 26 2 29 19 0 20 19 2 11 0 1 5 0
21 Osmanabad 212 6 283 2 2 0 212 6 283 90 0 90 61 16 20 41 15 14 37 29 16 8 5 1 3 0
22 Beed 101 271 372 5 1 0 101 271 372 42 121 163 148 19 105 130 10 84 97 90 7 63 0 1 7 0
1372 456 2163 22 12 1 1372 456 2163 681 203 1012 871 425 196 702 240 121 422 385 54 197 10 6 53 0
23 Amravati 186 0 217 4 1 0 186 0 183 37 0 51 41 29 0 29 13 0 13 12 0 0 0 1 7 34
24 Akola 8 0 9 4 1 0 6 0 9 8 0 9 9 8 0 9 5 0 6 6 0 6 0 0 12 0
25 Washim 31 0 31 3 1 0 31 0 31 31 0 31 31 28 0 28 28 0 28 28 0 28 0 0 2 0
Installation
of
Available
drilling
Machines
Remaini
ng
Program
for
Survey
of
BW/Tub
e wells
Kokan Region Total
Supplementary
Nashik Region
Statement Showing Bore well Survey under Scarcity Program as on 21.06.2014
Sr.
No.District
Proposed ProgramAvailable
Geologist
No. of Bore well site
Surveyed
Feasible Bore well
Sites after Survey
Proforma B
for No. of
Bore well
sites
Submitted
to The
Collector
Sanctioned
Program by the
Collector
No. of Bore well
Drilled
Pune Region Total
A.Bad Region Total

26 Buldhana 209 0 287 4 1 0 208 0 277 40 0 56 40 35 0 49 14 0 14 14 3 10 0 1 12 10
27 Yavatmal 47 0 47 3 2 0 47 0 47 27 0 27 27 27 0 27 10 0 10 10 0 6 0 0 6 0
481 0 591 18 6 0 478 0 547 143 0 174 148 127 0 142 70 0 71 70 3 50 0 2 39 44
28 Nagpur 124 0 149 4 3 0 124 0 149 117 0 142 149 109 0 136 65 0 85 82 0 55 0 2 23 0
69 0 105 0 0 0 55 0 91 54 0 90 90 38 0 68 0 0 0 0 0 0 0 0 0 14
29 Wardha 21 0 28 3 2 0 21 0 28 19 0 25 25 19 0 25 5 0 11 11 0 11 0 0 13 0
30 Bhandara 49 0 70 3 3 0 49 0 70 18 0 26 18 18 0 26 13 0 20 20 0 20 0 1 20 0
8 0 12 0 0 0 8 0 12 4 0 6 4 2 0 3 3 0 3 3 0 3 0 0 0 0
31 Chandrapur 164 0 168 4 3 0 164 0 168 106 0 106 127 78 0 93 48 0 60 54 1 45 0 0 13 0
32 Gadchiroli 3 3 6 3 2 0 3 3 6 3 3 6 6 3 3 6 3 3 6 5 0 0 0 0 15 0
33 Gondia 59 10 70 2 3 0 59 10 70 42 7 50 50 42 7 50 10 0 10 10 0 0 0 0 8 0
497 13 608 19 16 0 483 13 594 363 10 451 469 309 10 407 147 3 195 185 1 134 0 3 92 0
3755 4264 8634 95 48 5 3630 3912 8121 1878 2106 4295 3981 1223 1374 2833 696 944 1786 1541 95 1019 18 17 264 513Grand Total
Amravati Region
Supplementary
Supplementary
Nagpur Region

i) Rainfall deficit > 20 % and Groundwater level depletion > 1 m
> 3 m 2 to 3 m 1 to 2 m Total ( > 1 m)1 AURANGABAD KHULDABAD 0 0 23 232 BEED SHIRUR-KASAR 0 0 14 143 KOLHAPUR HATKANANGALE 0 0 3 34 KOLHAPUR RADHANAGARI 0 0 11 115 OSMANABAD BHUM 0 0 30 30
Total 0 0 81 81
ii) Rainfall deficit 0 to 20 % and Groundwater level depletion > 1 m
> 3 m 2 to 3 m 1 to 2 m Total ( > 1 m)1 AHMEDNAGAR KOPARGAON 3 8 49 602 AHMEDNAGAR NEVASA 0 2 8 103 AHMEDNAGAR SANGAMNER 4 9 56 694 AURANGABAD GANGAPUR 1 1 47 495 AURANGABAD PAITHAN 1 10 16 276 BEED ASHTI 0 8 11 197 BEED GEORAI 0 1 7 88 JALGAON JAMNER 0 0 1 19 JALGAON RAVER 7 0 3 10
10 JALNA BADNAPUR 0 2 2 411 KOLHAPUR PANHALA 0 0 2 212 KOLHAPUR SHIROL 1 0 3 413 LATUR AUSA 0 0 5 514 NANDED BILOLI 0 0 5 515 NANDED NAIGAON 0 0 10 1016 NASHIK DEOLA 0 0 3 317 NASHIK KALWAN 0 0 23 2318 NASHIK TRIMBAKESHWAR 0 1 5 619 NASHIK YEVLA 0 0 12 1220 OSMANABAD KALAMB 0 5 31 3621 OSMANABAD OSMANABAD 0 0 1 122 OSMANABAD PARANDA 5 7 7 1923 OSMANABAD TULJAPUR 0 0 6 624 OSMANABAD UMARGA 0 1 6 725 OSMANABAD WASHI 7 9 15 3126 PUNE VELHE 0 0 8 827 SANGLI JAT 3 2 6 1128 SANGLI KAVATHE-MAHANKAL 0 0 2 229 SATARA KARAD 0 0 1 130 SATARA KOREGAON 0 0 5 531 SATARA MAN 0 0 6 632 SOLAPUR BARSHI 2 2 2 633 SOLAPUR KARMALA 5 7 33 4534 SOLAPUR MOHOL 0 3 12 1535 THANE VIKRAMGAD 0 5 15 20
Total 39 83 424 546
Statement Showing groundwater depletion observed in May 2014
S.N. District Taluka No.of villages having Groundwater level depletion
S.N. District Taluka No.of villages having Groundwater level depletion
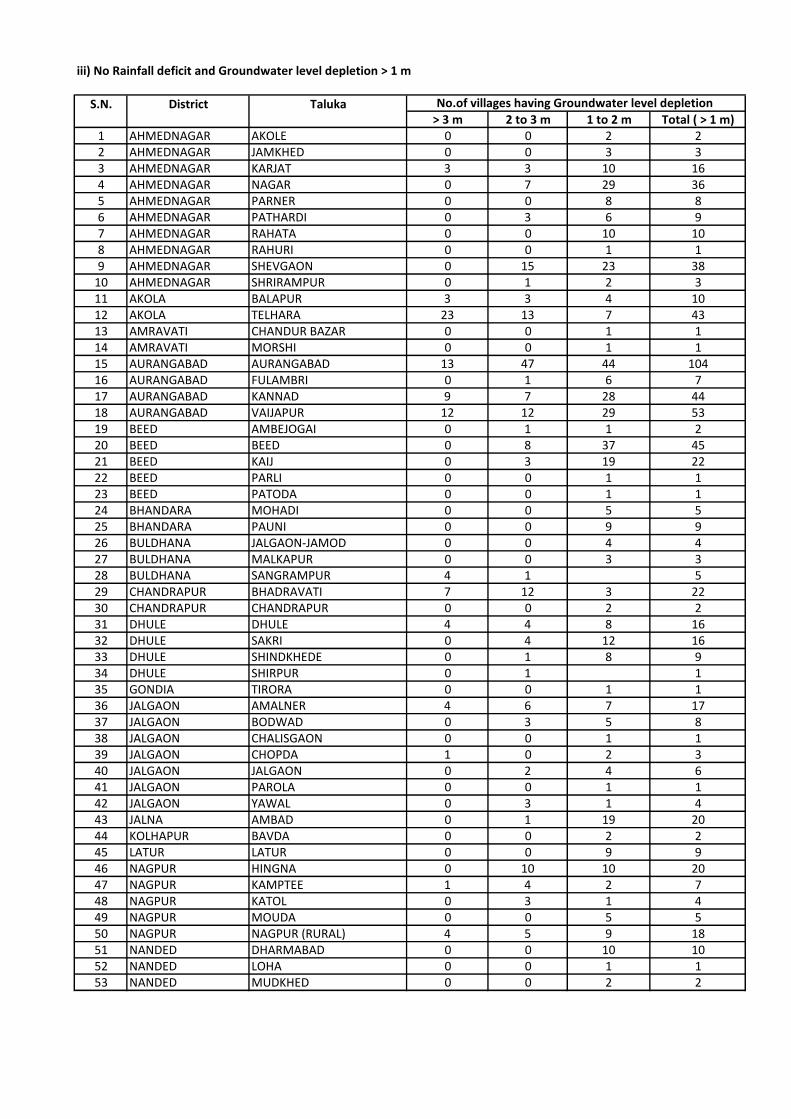
iii) No Rainfall deficit and Groundwater level depletion > 1 m
> 3 m 2 to 3 m 1 to 2 m Total ( > 1 m)1 AHMEDNAGAR AKOLE 0 0 2 22 AHMEDNAGAR JAMKHED 0 0 3 33 AHMEDNAGAR KARJAT 3 3 10 164 AHMEDNAGAR NAGAR 0 7 29 365 AHMEDNAGAR PARNER 0 0 8 86 AHMEDNAGAR PATHARDI 0 3 6 97 AHMEDNAGAR RAHATA 0 0 10 108 AHMEDNAGAR RAHURI 0 0 1 19 AHMEDNAGAR SHEVGAON 0 15 23 38
10 AHMEDNAGAR SHRIRAMPUR 0 1 2 311 AKOLA BALAPUR 3 3 4 1012 AKOLA TELHARA 23 13 7 4313 AMRAVATI CHANDUR BAZAR 0 0 1 114 AMRAVATI MORSHI 0 0 1 115 AURANGABAD AURANGABAD 13 47 44 10416 AURANGABAD FULAMBRI 0 1 6 717 AURANGABAD KANNAD 9 7 28 4418 AURANGABAD VAIJAPUR 12 12 29 5319 BEED AMBEJOGAI 0 1 1 220 BEED BEED 0 8 37 4521 BEED KAIJ 0 3 19 2222 BEED PARLI 0 0 1 123 BEED PATODA 0 0 1 124 BHANDARA MOHADI 0 0 5 525 BHANDARA PAUNI 0 0 9 926 BULDHANA JALGAON-JAMOD 0 0 4 427 BULDHANA MALKAPUR 0 0 3 328 BULDHANA SANGRAMPUR 4 1 529 CHANDRAPUR BHADRAVATI 7 12 3 2230 CHANDRAPUR CHANDRAPUR 0 0 2 231 DHULE DHULE 4 4 8 1632 DHULE SAKRI 0 4 12 1633 DHULE SHINDKHEDE 0 1 8 934 DHULE SHIRPUR 0 1 135 GONDIA TIRORA 0 0 1 136 JALGAON AMALNER 4 6 7 1737 JALGAON BODWAD 0 3 5 838 JALGAON CHALISGAON 0 0 1 139 JALGAON CHOPDA 1 0 2 340 JALGAON JALGAON 0 2 4 641 JALGAON PAROLA 0 0 1 142 JALGAON YAWAL 0 3 1 443 JALNA AMBAD 0 1 19 2044 KOLHAPUR BAVDA 0 0 2 245 LATUR LATUR 0 0 9 946 NAGPUR HINGNA 0 10 10 2047 NAGPUR KAMPTEE 1 4 2 748 NAGPUR KATOL 0 3 1 449 NAGPUR MOUDA 0 0 5 550 NAGPUR NAGPUR (RURAL) 4 5 9 1851 NANDED DHARMABAD 0 0 10 1052 NANDED LOHA 0 0 1 153 NANDED MUDKHED 0 0 2 2
S.N. District Taluka No.of villages having Groundwater level depletion

iii) No Rainfall deficit and Groundwater level depletion > 1 m
> 3 m 2 to 3 m 1 to 2 m Total ( > 1 m)54 NASHIK BAGLAN 0 0 24 2455 NASHIK CHANDVAD 0 2 6 856 NASHIK DINDORI 0 0 13 1357 NASHIK IGATPURI 0 0 2 258 NASHIK MALEGAON 0 0 7 759 NASHIK NANDGAON 0 0 13 1360 NASHIK NASHIK 0 0 4 461 NASHIK NIPHAD 2 3 10 1562 NASHIK SINNAR 3 12 23 3863 PARBHANI GANGAKHED 0 1 1 264 PARBHANI JINTUR 0 0 2 265 PARBHANI SELU 0 0 1 166 PUNE AMBEGAON 0 0 23 2367 PUNE BARAMATI 4 10 16 3068 PUNE BHOR 1 3 10 1469 PUNE DAUND 0 2 3 570 PUNE HAVELI 5 20 21 4671 PUNE INDAPUR 35 18 29 8272 PUNE JUNNAR 0 8 28 3673 PUNE KHED 0 1 31 3274 PUNE MAWAL 0 0 6 675 PUNE MULSHI 1 2 5 876 PUNE PUNE CITY 0 0 1 177 PUNE PURANDHAR 1 2 7 1078 PUNE SHIRUR 0 1 3 479 RAIGAD KARJAT 5 8 6 1980 RAIGAD PANVEL 0 0 5 581 SANGLI ATPADI 0 0 1 182 SATARA KHATAV 0 3 27 3083 SATARA PHALTAN 1 0 1 284 SOLAPUR MADHA 7 9 18 3485 SOLAPUR MALSHIRAS 7 2 3 1286 SOLAPUR SANGOLE 0 1 11 1287 THANE BHIWANDI 0 2 27 2988 THANE DAHANU 0 1 32 3389 THANE MURBAD 0 0 22 2290 THANE PALGHAR 10 15 6 3191 THANE VADA 0 0 3 392 WARDHA ASHTI 0 0 5 593 WARDHA KARANJA 2 3 0 594 WASHIM MALEGAON 0 0 2 295 YAVATMAL MAHAGAON 0 0 7 796 YAVATMAL WANI 10 4 4 18
Total 182 317 888 1387
S.N. District Taluka No.of villages having Groundwater level depletion

Sr. No. District Normal Rainfall Progressive
upto 23.6.2014
% To Normal
1 Thane 337.4 80.1 23.7
2 Raigad 498.8 70.8 14.2
3 Ratnagiri 627.1 290.3 46.3
4 Sindudurg 700.6 330.1 47.1
Konkan Region 541.0 192.8 32.8
5 Nashik 118.4 14.1 11.9
6 Dhule 89.5 23.5 26.3
7 Nandurbar 94.9 13.4 14.1
8 Jalgaon 99.7 19.7 19.8
9 Ahmednagar 77.7 27.3 35.1
Nashik Region 96.0 19.6 21.4
10 Pune 107.3 30.4 28.3
11 Solapur 78.2 32.8 41.9
12 Satara 114.5 67.4 58.9
13 Sangli 65.3 63.2 96.8
14 Kolhapur 259.0 95.7 37.0
Pune Region 124.8 57.9 52.6
15 Aurangabad 100.7 18.9 18.8
16 Jalna 106.5 13.2 12.4
17 Beed 98.1 30.9 31.5
18 Latur 111.6 45.1 40.4
19 Osmanabad 125.2 33.3 26.6
20 Nanded 126.3 25.9 20.5
21 Parbhani 97.1 33.5 34.5
22 Hingoli 129.2 20.6 15.9
Aurangabad Region 111.8 27.7 25.1
23 Buldana 108.7 19.4 17.8
24 Akola 103.7 15.5 15.0
25 Washim 125.7 42.2 33.6
26 Amravati 111.9 52.0 46.5
27 Yavatmal 134.8 21.1 15.7
Amravati Region 117.0 30.0 25.7
28 Wardha 131.4 42.7 32.5
29 Nagpur 132.9 56.0 42.1
30 Bhandara 150.2 47.3 31.5
31 Gondia 153.7 68.6 44.6
32 Chandrapur 142.5 11.2 7.9
33 Gadchiroli 155.8 44.5 28.6
Nagpur Region 144.4 45.1 31.2
Districtwise Rainfall as on 23-6-2014 (Rainfall in mm.)
( Source - Agriculture Department, GoM)

Habitation
(Nos)Activity Habitations (Nos) Activity
Habitations
(Nos)Activity
1Total no. of habitations affected
by drinking water scarcity
(A) Deepening (no. of wells) 734 719 54 26 57 55
(B) Rejuvenation, repair,
replacement of pumping
machinery, augmentation of
source, modification, ancillary
work, etc. –( in nos.)
(C) Rejuvenation/ repair of hand
pumps (Nos.)
No. of tube wells/ bore wells Habitation
(Nos)Bores/ Wells Habitation (Nos) Bores/ Wells
Habitation
(Nos)Bores/ Wells
(A) Bore with hand pumps 6311 6585 324 378 1300 1225
(B) Bore wells with mini power
pump schemes0 0 0 0 2 2
(C) Deep tube wells 50 58 0 0 9 9
(D) Construction of new wells 0 0 0 0 0 0
No. of tankers deployed to
transport drinking water
Habitation
(Nos)Tanker Habitation (Nos) Tanker
Habitation
(Nos)Tanker
(A) Tanker supply (daily 7704 2815 2086 785 2770 513
(B) Water transported daily
(lakh liter)
Transportation of water through
train wagons (Vol. of water
transported daily in lakh litre)
Habitation
(Nos)
No. of rakes/
vol. of waterHabitation (Nos)
No. of rakes
/ Vol. of
water
Habitation
(Nos)
No. of rakes/ Vol.
of water
i.) route and date of starting 0 0 0 0 0 0
6
Total funds utilised for drinking
water supply in rural areas with
drought like situation. (Rs. in
lakh)
Annexure-II
Progress report on drinking water mitigation activities 2014
Name of the State : MAHARASHTRA Report as on :
S.
No.Activities
Work planned as per
contingency plan
Work done in drought notified
habitations/ areas
Work done in non-notified
drought habitations/ areas
17733 2680 4672
2
No. of tube wells/bore wells deepened
407 0 23
2905 0
5
20094.64 1705.52 2589.58
2750
3
4
4552.86 644.94 1914.61