REPORT ON RESULT OF TASK 2 - DataCollection...
40
“Assistance for the monitoring of the implementation of national programmes for the collection, management and use of data in the fisheries sector”. Second Horizontal Specific Contract REPORT ON RESULT OF TASK 2 “Analysis of cross-cutting issues based on field work carried out in 2011-2012” Contract No.: Specific Contract No. 6 (SI2.623039) implementing Framework Contract MARE/2009/2010 Tasks: Task 2 Date of submission: 12.04.2013 Author(s): José CERVERA, Pavel SALZ, Christine ALBERTI, Anna MADRILES, Rafael ROBLES, Iosu PARADINAS, Ester AZORIN Version: v.1.0
-
Upload
trankhuong -
Category
Documents
-
view
216 -
download
2
Transcript of REPORT ON RESULT OF TASK 2 - DataCollection...
“Assistance for the monitoring of the implementation of national programmes for the
collection, management and use of data in the fisheries sector”. Second Horizontal
Specific Contract
REPORT ON RESULT OF TASK 2
“Analysis of cross-cutting issues based on field work
carried out in 2011-2012”
Contract No.: Specific Contract No. 6 (SI2.623039) implementing Framework Contract MARE/2009/2010
Tasks: Task 2
Date of submission: 12.04.2013
Author(s): José CERVERA, Pavel SALZ, Christine ALBERTI, Anna MADRILES, Rafael ROBLES, Iosu PARADINAS, Ester AZORIN
Version: v.1.0
Table of Content
Acronyms 3
Introduction 4
1. GENERAL ISSUES 5
2. BIOLOGICAL DATA- MÉTIER-RELATED VARIABLES 17
3. BIOLOGICAL DATA- STOCK 22
4. RECREATIONAL FISHERIES 25
5. TRANSVERSAL VARIABLES 27
6. RESEARCH SURVEYS AT SEA 28
7. ECONOMIC DATA - CATCHING SECTOR 29
8. ECONOMIC DATA – AQUACULTURE 35
9. ECONOMIC DATA - PROCESSING INDUSTRY 37
10. VARIABLES ON THE EFFECTS OF FISHERIES ON THE MARINE ECOSYSTEM 39
Acronyms
AEPRI Agricultural Economic and Policy Research Institute (Greece) AR Annual Report AZTI-Tecnalia Technological Institute, Fisheries and Food (Spain) CECAF Committee for the Eastern Central Atlantic Fisheries CV Coefficient of Variance GDFA General Directorate for Fisheries and Aquaculture (Italia) DGRM Directorate-General for Natural Resources, Safety and Maritime Services (Portugal) DOP Department of Oceanography and Fisheries of the Azores University (Portugal) DPMA Directorate for Sea Fisheries (France) DRPA Regional Directorate for Fisheries in Azores DRPM Regional Directorate for Fisheries in Madeira (Portugal) DTU-Aqua National Institute of Aquatic Resources (Denmark) DST Statistics Denmark DZV Sea Fisheries Service. Ministry of the Flemish Community (Belgium) FOI Institute of Food and Economic Resources (Denmark) FRI/INALE Fisheries Research Institute (Greece)
EC European Commission
GES Good Environmental Status
GFCM General Fisheries Commission for the Mediterranean
ICCAT International Commission for the Conservation of Atlantic Tunas
ICES International Council for the Exploration of the Sea
IEO Spanish Oceanographic Institute (Spain)
IFREMER French Research Institute for the Exploitation of the Sea (France) ILVO Institute for Agricultural and Fisheries Research (Belgium) IMBR Institute of Marine Biological Resources (Greece)
INE National Statistics Institute (Spain)
IO Institute of Oceanology (Bulgaria) IPMA Portuguese Institute for Sea and Atmosphere (Portugal) IREPA Institute for Economic Research in Fishery and Aquaculture (Italy) JRC Joint Research Centre MAGRAMA Ministry of Agriculture, Food and Environment (Spain) MPA Marine Protected Areas MS Member States MSFD Marine Strategy Framework Directive NAFA National Agency for Fisheries and Aquaculture (Bulgaria) NAFO Northwest Atlantic Fisheries Organisation NP National Programme NSIs National Statistical Institutes LEMNA Laboratory of Economics and Management of Nantes RFMOs Regional Fisheries Management Organisations SBS Structural Business Survey SGP General Secretariat of the Sea (Spain) VMS Vessels Monitoring System
Introduction
The purpose of the country missions was to verify whether and to which extent the programme
implementation is being followed up by the MS and if all the biological, technical, environmental and socio-
economic data specified in the programme are being collected according to the specified methods,
procedures and quality Missions were held in 8 countries (Denmark, Belgium, Spain, Greece, Bulgaria,
France, Italy and Portugal). This document explains where problems were identified during the mission
followed by recommendations as well as particular good practices which could be highlighted.
The analysis includes the following sections:
Section 1: General issues
Section 2: Biological data – Métier-related variables.
Section 3: Biological data – Stock-related variables.
Section 4: Recreational Fisheries.
Section 5: Transversal data.
Section 6: Research Survey at Sea.
Section 7: Economic data – Catching sector.
Section 8: Economic data – Aquaculture.
Section 9: Economic data - Processing Industry.
Section 10: Ecosystem data.
The text of this report reflects the situation encountered at the time of the missions:
1. Fieldwork mission to Denmark from 12 to 15 July 2011
2. Fieldwork mission to Belgium from 4 to 6 October 2011
3. First Fieldwork mission to Greece from 13 to 15 December 2011
4. Fieldwork mission to Spain from 26 to 29 March 2012
5. Second Fieldwork mission to Greece from 20 to 22 June 2012
6. Fieldwork mission to Bulgaria from 18 to 20 July 2012
7. Fieldwork mission to Italy from 13 to 16 November 2012
8. Fieldwork mission to France from 17 to 21 December 2012
9. Fieldwork mission to Portugal from 6 to 8 February 2013
1. GENERAL ISSUES
1.1. Organisation and management
Organisation in the MS and coordination among data producers
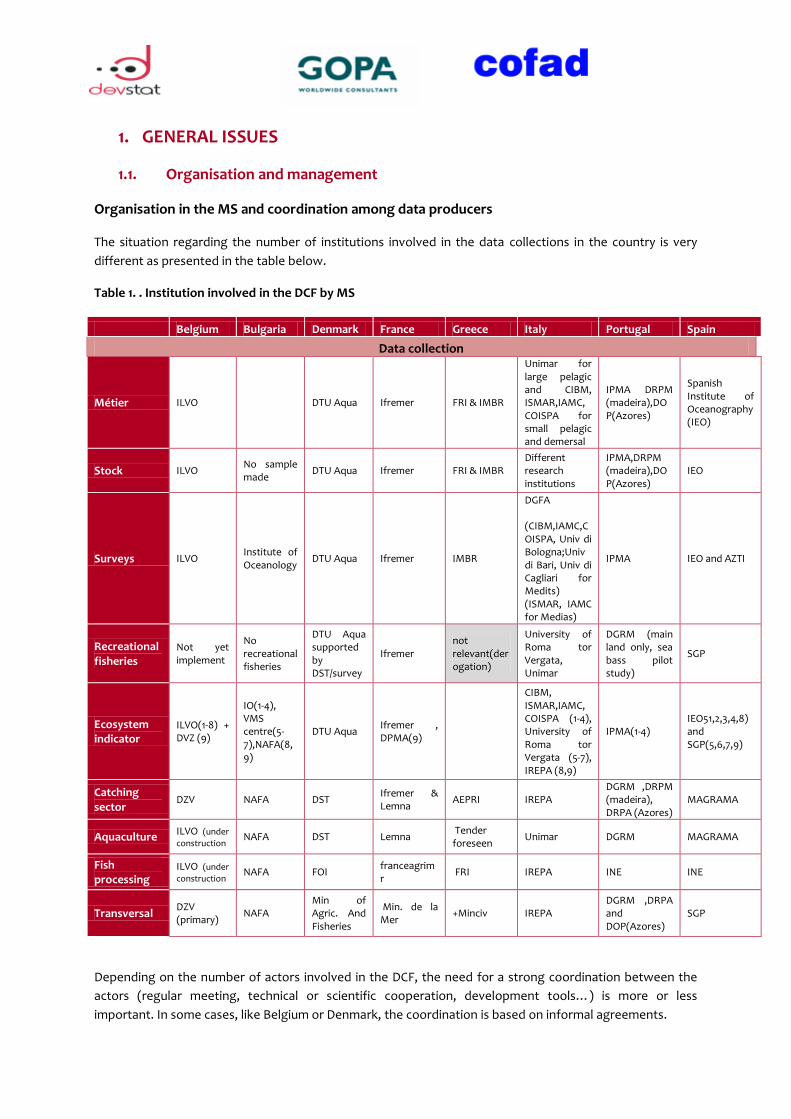
The situation regarding the number of institutions involved in the data collections in the country is very
different as presented in the table below.
Table 1. . Institution involved in the DCF by MS
Belgium Bulgaria Denmark France Greece Italy Portugal Spain
Data collection
Métier ILVO DTU Aqua Ifremer FRI & IMBR
Unimar for large pelagic and CIBM, ISMAR,IAMC, COISPA for small pelagic and demersal
IPMA DRPM (madeira),DOP(Azores)
Spanish Institute of Oceanography (IEO)
Stock ILVO No sample made
DTU Aqua Ifremer FRI & IMBR Different research institutions
IPMA,DRPM (madeira),DOP(Azores)
IEO
Surveys ILVO Institute of Oceanology
DTU Aqua Ifremer IMBR
DGFA (CIBM,IAMC,COISPA, Univ di Bologna;Univ di Bari, Univ di Cagliari for Medits) (ISMAR, IAMC for Medias)
IPMA IEO and AZTI
Recreational fisheries
Not yet implement
No recreational fisheries
DTU Aqua supported by DST/survey
Ifremer not relevant(derogation)
University of Roma tor Vergata, Unimar
DGRM (main land only, sea bass pilot study)
SGP
Ecosystem indicator
ILVO(1-8) + DVZ (9)
IO(1-4), VMS centre(5-7),NAFA(8,9)
DTU Aqua Ifremer , DPMA(9)
CIBM, ISMAR,IAMC, COISPA (1-4), University of Roma tor Vergata (5-7), IREPA (8,9)
IPMA(1-4) IEO51,2,3,4,8) and SGP(5,6,7,9)
Catching sector
DZV NAFA DST Ifremer & Lemna
AEPRI IREPA DGRM ,DRPM (madeira), DRPA (Azores)
MAGRAMA
Aquaculture ILVO (under
construction NAFA DST Lemna
Tender foreseen
Unimar DGRM MAGRAMA
Fish processing
ILVO (under
construction NAFA FOI
franceagrimr
FRI IREPA INE INE
Transversal DZV (primary)
NAFA Min of Agric. And Fisheries
Min. de la Mer
+Minciv IREPA DGRM ,DRPA and DOP(Azores)
SGP
Depending on the number of actors involved in the DCF, the need for a strong coordination between the
actors (regular meeting, technical or scientific cooperation, development tools…) is more or less
important. In some cases, like Belgium or Denmark, the coordination is based on informal agreements.
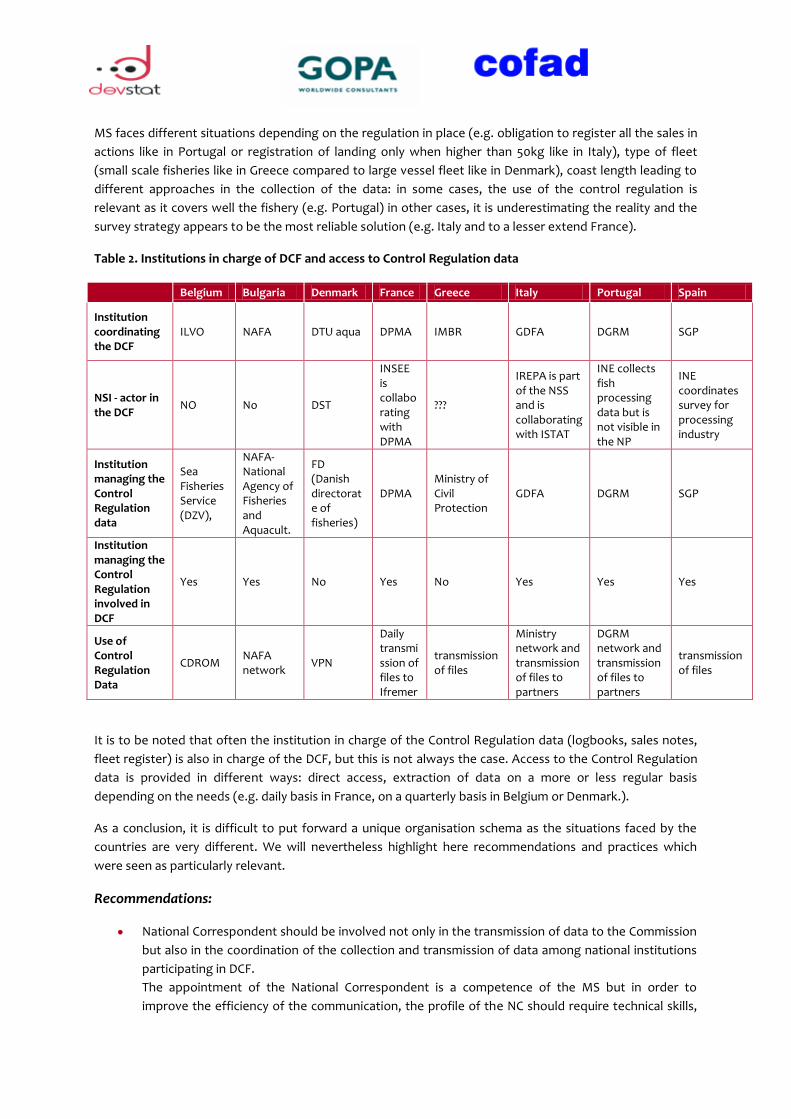
MS faces different situations depending on the regulation in place (e.g. obligation to register all the sales in
actions like in Portugal or registration of landing only when higher than 50kg like in Italy), type of fleet
(small scale fisheries like in Greece compared to large vessel fleet like in Denmark), coast length leading to
different approaches in the collection of the data: in some cases, the use of the control regulation is
relevant as it covers well the fishery (e.g. Portugal) in other cases, it is underestimating the reality and the
survey strategy appears to be the most reliable solution (e.g. Italy and to a lesser extend France).
Table 2. Institutions in charge of DCF and access to Control Regulation data
Belgium Bulgaria Denmark France Greece Italy Portugal Spain
Institution coordinating the DCF
ILVO NAFA DTU aqua DPMA IMBR GDFA DGRM SGP
NSI - actor in the DCF
NO No DST
INSEE is collaborating with DPMA
???
IREPA is part of the NSS and is collaborating with ISTAT
INE collects fish processing data but is not visible in the NP
INE coordinates survey for processing industry
Institution managing the Control Regulation data
Sea Fisheries Service (DZV),
NAFA- National Agency of Fisheries and Aquacult.
FD (Danish directorate of fisheries)
DPMA Ministry of Civil Protection
GDFA DGRM SGP
Institution managing the Control Regulation involved in DCF
Yes Yes No Yes No Yes Yes Yes
Use of Control Regulation Data
CDROM NAFA network
VPN
Daily transmission of files to Ifremer
transmission of files
Ministry network and transmission of files to partners
DGRM network and transmission of files to partners
transmission of files
It is to be noted that often the institution in charge of the Control Regulation data (logbooks, sales notes,
fleet register) is also in charge of the DCF, but this is not always the case. Access to the Control Regulation
data is provided in different ways: direct access, extraction of data on a more or less regular basis
depending on the needs (e.g. daily basis in France, on a quarterly basis in Belgium or Denmark.).
As a conclusion, it is difficult to put forward a unique organisation schema as the situations faced by the
countries are very different. We will nevertheless highlight here recommendations and practices which
were seen as particularly relevant.
Recommendations:
National Correspondent should be involved not only in the transmission of data to the Commission
but also in the coordination of the collection and transmission of data among national institutions
participating in DCF.
The appointment of the National Correspondent is a competence of the MS but in order to
improve the efficiency of the communication, the profile of the NC should require technical skills,
capacity of coordination at national level and availability of time and administrative resources to
undertake the coordination of the implementation of DCF.
The NSI should be more involved in the DCF programme (mainly in economic data) to ensure the
consistency of the statistical methods, possible integration in the national statistical system,
sharing of tools and support on statistical matters.
Including Fishery Statistics in the National Statistical Programmes, would allow using the
framework of the statistical law and the corresponding coordination tools (e.g.: working groups
under the National Statistical Council).
Regarding the relationship between MS and the EC, many MS requested to increase the
information flow between the EC and the MS. MS would also be keen to receive more feed back on
the use made with their data.
The communication between the MS and the EC should be improved with respect to approval of
derogations by the EC. The only information the MS receive on derogations is at the occasion of
approval of the NP.
Human Resources
Due to budgetary constraints, it is to be noted that the resources devoted to the DCF data collections are
sometimes very limited leading to a precarious situation in some countries. As examples in Portugal, all the
technical work related to the collection of economic data is laying on the shoulder of a single person. In
Belgium, the ILVO would be keen to develop a proper IT application for managing the DCF data but has no
human resource to do it.
Recommendations:
Synergies between the MS should be found. Possible synergies include:
o Sharing IT tools (including web applications) developed by one MS and used by others.
o Developing common questionnaires (e.g. processing industry statistics are obtained
through economic surveys responding the SBS Regulation; most MS use similar
questionnaires developed in collaboration with Eurostat).
o It is recommended to make an inventory of the tools that MS are willing to share, to
describe them (objective, expected results, condition of use, light description of the tool),
and to inform the MS on what is available.
A general rule could be to involve part time, people with statistical and IT skills that could help a lot
the different teams members on specific aspects.
Examples of good practice:
To automate as far as possible the work to be performed by developing ad hoc functions for generating automatically the expected results (e.g. Routines developed in Portugal for the preparation of the transversal variables).
To develop open source modules which could be easily connected to different databases (e.g. modules in R).
Participation in international meetings
MS shall ensure that their national experts participate in relevant meetings of regional fisheries
management organisations to which the Community is contracting party or observer and international
scientific bodies.
Recommendations
The teams involved in DCF are often very small and it becomes sometimes difficult for MS to
participate in all meetings. Possible implementation of electronic fora of exchange to discuss issues
could be a good way to increase the participation and understanding of different subjects.
In order to promote the use of common tools by MS, international meetings could include training sessions on such common tools.
1.2. Horizontal aspects: IT matters
Existence of national computerised databases
In all MS visited, the primary data are stored in independent databases which are more or less
sophisticated: it can range from Excel files up to powerful database management systems like Oracle. In
many MS, the databases were in place before the DCF was initiated and were adapted to fulfil the DCF
needs.
The biological data and economic data are often managed by different institutions. The confidential nature
of the economic data prevents many institutions from providing directly the primary data to other
institutes. The two types of data are never centralised at primary data level and rarely centralised at
aggregated level.
The national partners’ databases are not linked within a national computerised network in any of the visited
MS.
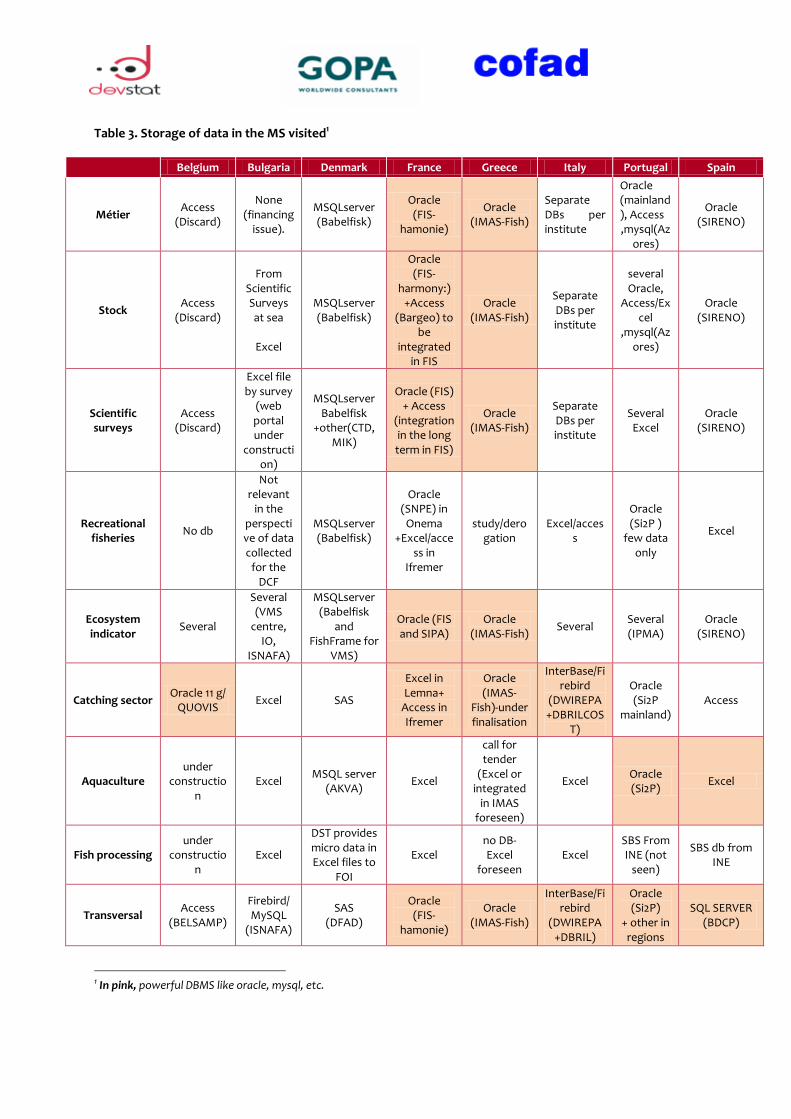
Table 3. Storage of data in the MS visited1
Belgium Bulgaria Denmark France Greece Italy Portugal Spain
Métier Access
(Discard)
None (financing
issue).
MSQLserver (Babelfisk)
Oracle (FIS-
hamonie)
Oracle (IMAS-Fish)
Separate DBs per institute
Oracle (mainland), Access ,mysql(Az
ores)
Oracle (SIRENO)
Stock Access
(Discard)
From Scientific Surveys at sea
Excel
MSQLserver (Babelfisk)
Oracle (FIS-
harmony:) +Access
(Bargeo) to be
integrated in FIS
Oracle (IMAS-Fish)
Separate DBs per institute
several Oracle,
Access/Excel
,mysql(Azores)
Oracle (SIRENO)
Scientific surveys
Access (Discard)
Excel file by survey
(web portal under
construction)
MSQLserver Babelfisk
+other(CTD, MIK)
Oracle (FIS) + Access
(integration in the long term in FIS)
Oracle (IMAS-Fish)
Separate DBs per institute
Several Excel
Oracle (SIRENO)
Recreational fisheries
No db
Not relevant
in the perspective of data collected
for the DCF
MSQLserver (Babelfisk)
Oracle (SNPE) in
Onema +Excel/acce
ss in Ifremer
study/derogation
Excel/access
Oracle (Si2P )
few data only
Excel
Ecosystem indicator
Several
Several (VMS
centre, IO,
ISNAFA)
MSQLserver (Babelfisk
and FishFrame for
VMS)
Oracle (FIS and SIPA)
Oracle (IMAS-Fish)
Several Several (IPMA)
Oracle (SIRENO)
Catching sector Oracle 11 g/
QUOVIS Excel SAS
Excel in Lemna+
Access in Ifremer
Oracle (IMAS-
Fish)-under finalisation
InterBase/Firebird
(DWIREPA +DBRILCOS
T)
Oracle (Si2P
mainland) Access
Aquaculture under
construction
Excel MSQL server
(AKVA) Excel
call for tender
(Excel or integrated
in IMAS foreseen)
Excel Oracle (Si2P)
Excel
Fish processing under
construction
Excel
DST provides micro data in Excel files to
FOI
Excel no DB- Excel
foreseen Excel
SBS From INE (not
seen)
SBS db from INE
Transversal Access
(BELSAMP)
Firebird/ MySQL
(ISNAFA)
SAS (DFAD)
Oracle (FIS-
hamonie)
Oracle (IMAS-Fish)
InterBase/Firebird
(DWIREPA +DBRIL)
Oracle (Si2P)
+ other in regions
SQL SERVER (BDCP)
1 In pink, powerful DBMS like oracle, mysql, etc.
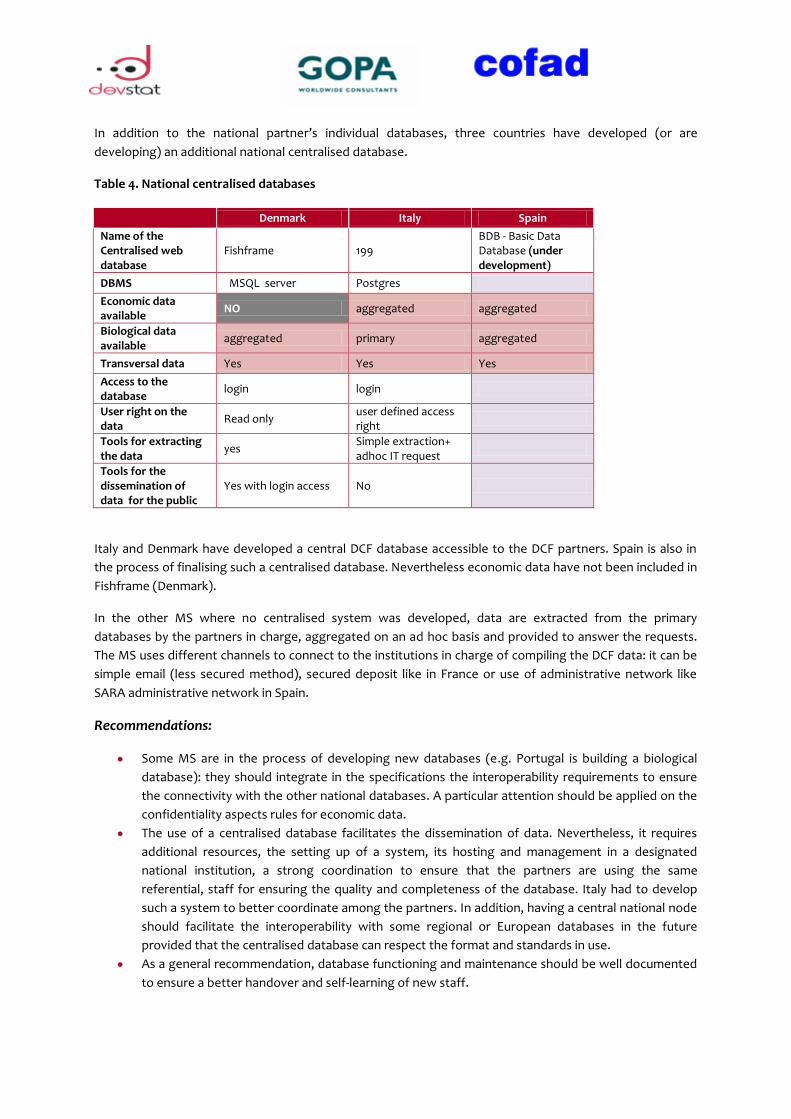
In addition to the national partner’s individual databases, three countries have developed (or are
developing) an additional national centralised database.
Table 4. National centralised databases
Denmark Italy Spain
Name of the Centralised web database
Fishframe 199 BDB - Basic Data Database (under development)
DBMS MSQL server Postgres
Economic data available
NO aggregated aggregated
Biological data available
aggregated primary aggregated
Transversal data Yes Yes Yes
Access to the database
login login
User right on the data
Read only user defined access right
Tools for extracting the data
yes Simple extraction+ adhoc IT request
Tools for the dissemination of data for the public
Yes with login access No
Italy and Denmark have developed a central DCF database accessible to the DCF partners. Spain is also in
the process of finalising such a centralised database. Nevertheless economic data have not been included in
Fishframe (Denmark).
In the other MS where no centralised system was developed, data are extracted from the primary
databases by the partners in charge, aggregated on an ad hoc basis and provided to answer the requests.
The MS uses different channels to connect to the institutions in charge of compiling the DCF data: it can be
simple email (less secured method), secured deposit like in France or use of administrative network like
SARA administrative network in Spain.
Recommendations:
Some MS are in the process of developing new databases (e.g. Portugal is building a biological
database): they should integrate in the specifications the interoperability requirements to ensure
the connectivity with the other national databases. A particular attention should be applied on the
confidentiality aspects rules for economic data.
The use of a centralised database facilitates the dissemination of data. Nevertheless, it requires
additional resources, the setting up of a system, its hosting and management in a designated
national institution, a strong coordination to ensure that the partners are using the same
referential, staff for ensuring the quality and completeness of the database. Italy had to develop
such a system to better coordinate among the partners. In addition, having a central national node
should facilitate the interoperability with some regional or European databases in the future
provided that the centralised database can respect the format and standards in use.
As a general recommendation, database functioning and maintenance should be well documented
to ensure a better handover and self-learning of new staff.
Accessibility of the data to the Commission and end-users
The Commission has not an effective and unhindered physical access to the national computerised
databases.
The system currently in place regarding the transmission of data is built on the answer to the data calls
launched by JRC (EC), or data requests from specific ICES working groups and some RFMOs which do not
require a specific access.
During the mission, the MS indicated the problems encountered in providing the information due to the
large amount of EC data calls, to the breakdowns requested for the economic and biological variables, to
the changes in the format requested and in the referenced nomenclatures used (e.g. area classification)
Consequently, responding to the request is time consuming. In addition, no automated extraction tool can
be built, the time required to check the aggregated data is longer as no common procedure can be applied
and the risk of errors increases.
It has been reported several times that the formats (tables) of the various data calls are modified very often
so that it constitutes an arduous work for MS to adapt the data available in certain format or aggregation
level to the new formats requested each time. The adaptation of the data often requires the involvement of
an IT expert for executing the appropriate data queries.
Recommendations:
For the time being, standardizing the format for data calls would allow building predefined output
and store the information in a supra national database which can be used by different end users.
International/regional users of DCF data should improve the coordination of their data request to
minimize the response burden of MS. In the next revision of the Regulatory Framework, the
relevance of each variable and breakdown requested should be assessed against the use that has
been or can be made of it.
In a later stage, if EC defines all requirements to be fulfilled by the national databases to become
interoperable, a direct access to the data could be envisaged at a national centralised level or
directly at national partner levels.
Security and backups
In the institutions visited during the missions, primary economic data are usually stored on a server only
accessible from the internal network. Sometimes access to the data is not limited to the person responsible
only, but to the service.
Examples of good practice:
The implementation of the central database for DCF as in Italy (“racoltadatti”) appears to be a good practice. It allows the institution in charge to define rules for the preparation of the data, checking and to follow up the data collection process, to make the data accessible to the partner, and to ensure the upload of the data by the partner themselves according to a unique and secured channel.
It is also to be noted that the security of the data is weakly ensured in certain stages of the processing (e.g.
data transmission by mail, the fact that Excel files can be copied on laptops).
Backups are usually regularly performed.
Except in Denmark and Spain where the institutions have to comply with a national security plan (including
among others for Denmark the setting up of a secured computer room, the storage of the documents in
the national archive for duration of 5 years, a disaster recovery plan, etc..), in most of the cases the backup
data are stored in the same building where the server is located, preventing saving of data in case disasters.
Recommendations:
Ensure the security of the primary data at all stages of the processing.
Ensure backups are saved in a secured place (it can be done automatically for example by mirroring
the application in a server located in another city).
1.3. Data quality checks
Various types of quality checks are carried out on national data. These checks concerns typing errors,
completeness, sample size, response rate, consistency among related indicators, variation from one period
to the next and calculation of statistical properties (coefficient of variation). Nevertheless, the national
quality checks are a responsibility of individual staff members, but they are not always formalized in
software or check lists.
Tests are applied at different levels:
1. Micro editing (checking individual records):
When the data are entered in the application: it is mainly typing errors tests.
Cross checking tests on the primary database.
Uploading tests in the centralised database when it exists.
2. Macro editing (checking aggregated data):
Consistency tests on aggregated data, e.g. comparison with previous years, ratios.
Biological data were checked either through tests embedded in the application in use (e.g. Italy, Denmark)
or in external applications. Some are of particular interests as they can be shared with other countries:
The R-based COST software was developed to assess the precision of the biological indicators, but
its use has been limited as the implementation is not easy and the software is not considered
suitable for complex fisheries (e.g. Spain).
R routine was also used in Portugal to assess the biological data: the use of the package developed
seems exportable as the source of the data file to be checked can easily be changed and the tests
developed are of interests.
Economic data are often compiled in small applications (except in Italy and Denmark) or Excel files. Tests
are then implemented directly in the file.
Recommendations:
Elaboration of a validation manual: lists of validation rules at the individual record and aggregated
levels could be established by experts groups, to be applied at MS level. For instance thresholds
levels for inter annual variations for economic variables or for biological ratios could be established
based on historical data. Some validation rules should be mandatory to ensure a minimum level of
quality of data provided. Based on the list defined, the list of tests applied could be included in an
annex in the AR.
Statistical tests and methods implemented in the country should be validated by the NSI to ensure
the correctness of the statistical procedure applied.
The COST software developed in R for the calculation of the coefficient of variance was provided for free (but it seems that MS face difficulties in using it).
In addition to the four accuracy indicators currently in use, also standard deviation should be
added as in indicator of the homogeneity of the sample. Standard deviation for selected variables
should be presented in the National report (table III-B-3).
For some indicators it is possible to compare values of the sample with those of the population.
This applies to: average vessels size (kW, GT and m, from fleet register) and value and volume of
catch (from logbooks / sales notes). Such comparison should be presented in the National Reports.
Common approach to data validation should be designed. At present some MS have a formalized
set of rules while others rely on visual checks. The common approach can be elaborated as a
checklist of:
o Relations between variables in one year;
o Changes of the variables from one year to next;
o Comparing characteristics of sample to the population.
There may be differences in approach to dealing with statistical outliers. Some MS eliminate them,
while others do not. It should be commonly determined what is considered as outlier and how to
deal with them.
1.4. Specific software developed by MS and available for sharing
The MS developed different application to cope with the DCF, some are proprietary and use commercial
software and some are open source oriented like the Fishframe application which could be provided for
free by the DTU aqua (DK).
Examples of good practice:
For the biological data, an external module for validation developed in R (open source) of particular interests was identified in Portugal.
Italy has also developed an Excel application called ISE using R libraries to calculate the coefficient of variation (CV) which is used to ensure the consistency and the quality of the Italian sample.
France has developed an R based script to calculate how many samples are required to achieve a certain precision level, which in some cases lead to huge numbers.
France developed a tool called WAO for ensuring the follow up of the data collection process.
Recommendations:
It would be interesting if the EC could play a catalyser role and could keep up to date a list of
applications (e.g. Fishframe) or tools (e.g. ISE or R validation modules developed respectively by
Italy and Portugal mentioned in chapter 1.3) which could be provided for free as well as the
corresponding technical requirements and contact person in the MS.
In a later stage, EC could also provide guidance towards the definition of a list of minimal
requirements to be respected or recommendations to be followed when designing new databases
system in a perspective of harmonisation and interoperability.
1.5. User requests management
According to the DCF regulation, each MS shall compile in computerized database information concerning
the data requests they have received and the responses they have provided.
Some MS do not keep formal and organized records on users’ data requests even if the response provided
is usually satisfactory. Better knowledge of users’ requests should allow MS to fine tune their production
and dissemination systems.
International and regional requests represent an imp0rtant workload for institutions participating in DCF.
The coordination of international and regional institutions using DCF data should focus on reducing the
overlaps in data requests and limit the modification of data call formats.
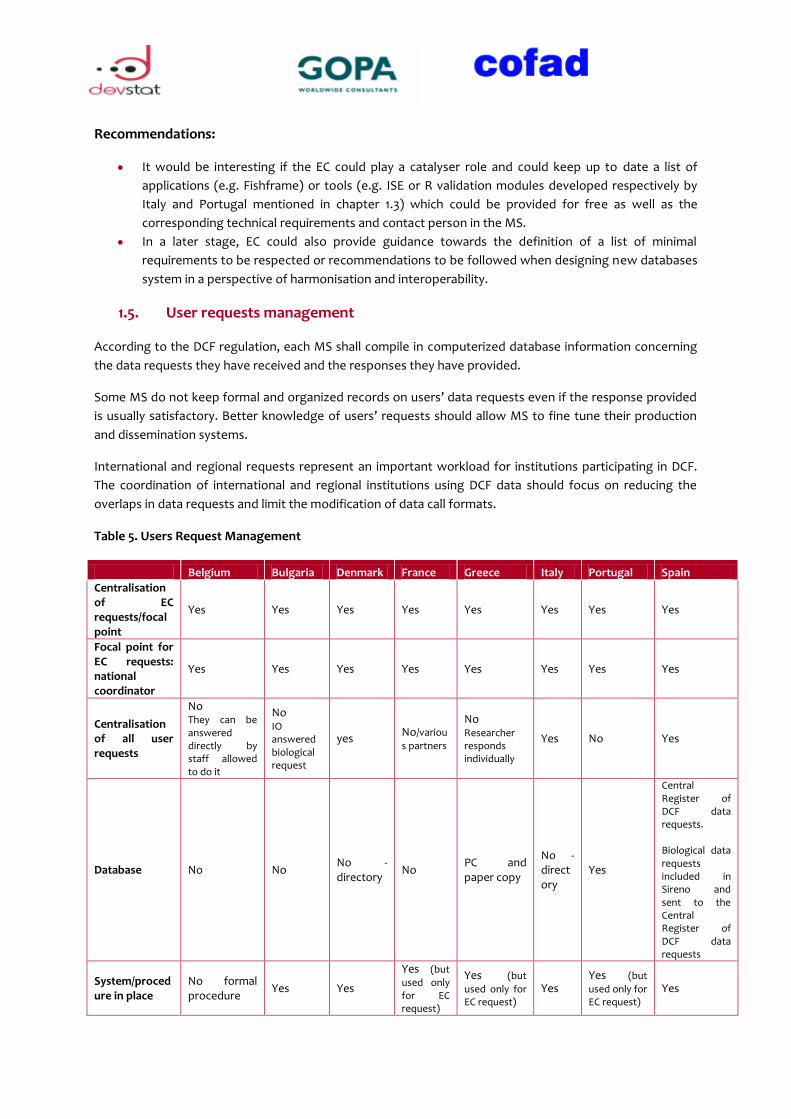
Table 5. Users Request Management
Belgium Bulgaria Denmark France Greece Italy Portugal Spain
Centralisation of EC requests/focal point
Yes Yes Yes Yes Yes Yes Yes Yes
Focal point for EC requests: national coordinator
Yes Yes Yes Yes Yes Yes Yes Yes
Centralisation of all user requests
No They can be answered directly by staff allowed to do it
No IO answered biological request
yes No/variou
s partners
No Researcher responds individually
Yes No Yes
Database No No No -directory
No PC and paper copy
No -directory
Yes
Central Register of DCF data requests. Biological data requests included in Sireno and sent to the Central Register of DCF data requests
System/procedure in place
No formal procedure
Yes Yes
Yes (but used only for EC request)
Yes (but
used only for EC request)
Yes Yes (but
used only for EC request)
Yes
In most countries, user requests are saved in a directory with the corresponding answers but no database
exists for the management of the user requests except in Spain and to a certain extend in Portugal.
Most of the time, the user requests are not kept in a single place. For example, a user request for biological
data for specific research projects will be directly taken over by the biological institute but not registered in
the national user requests database.
Recommendations:
User requests are not recorded in a specific database but in a directory. It is recommended to keep a register of the requests and answers. The Commission could call the attention of MS of the DCF requirements regarding the management of users’ requests.
The database should at least contain the following information: (a) the request, the date of the
request, the type and purpose of requested data, the specification of the end-user; (b) the
response, the date of response and the type of datatransmitted.as mentioned in the regulation.
Additional information such as feed back from the user on the data collected, use made with the
data (example: study report), user satisfaction survey could also complete the picture.
1.6. Central web site
According to the DCF regulation, each MS should have one central website serving as an information
deposit for all information related to the data collection framework. The situation is as follows:
Table 6. DCF websites in MS
Belgium Bulgaria Denmark France Greece Italy Portugal Spain
DCF web site
None None None
No DCF dedicated web pages But a part of the Ifremer web site is dedicated to the dissemination of some documentation related to the DCF. (http://sih.Ifremer.fr/Acquisition-des-donnees/Cadres-reglementaires/Data-Collection-Framework-DCF
None
http://raccoltadati.irepa.org/
http://www.dgrm.min-agricultura.pt/xportal/xmain
http://www.magrama.gob.es/es/pesca/temas/programa-nacional-datos-basicos/
DCF information deposit
No No No No No Yes Yes yes
DCF data deposit
No No No Yes No Yes No No
Examples of good practice:
Central Register of DCF data requests built in Spain.
Having a request form on the DCF web site interconnected with the user request database.
This type of forms is currently under construction in Italy.
From the 8 countries visited, 4 countries do not have a DCF web site at all. In some cases like Italy and
France, the DCF web site is also used as a safe deposit for the collection of data.
In Portugal, the open source “Lime survey” tool is used to run online web survey for catching sector and
aquaculture. The survey web forms are launched from the DCF web page. The data entered are directly
inserted in the production database and further checked later on.
Recommendations:
Contact persons should be indicated on the website. Emails should be provided.
Some predefined tables should be displayed in the website. MS should explore the possibility of
offering tailored tabulations.
Examples of good practice:
Use of the DCF web site as a safe deposit for the transmission of partner’s data.
Use of the DCF web site for collection of data directly from respondents (e.g. Lime survey tool
in Portugal).
2. BIOLOGICAL DATA- MÉTIER-RELATED VARIABLES
2.1. Concepts
Métier identification
Métier identification is mostly based on the fleet register, logbooks and sales notes (except in France where
a parallel system was built in) and in some vases cross-validated with survey information in order to
successfully identify which métier should be used as the main one (for those vessels that perform a variety
of métiers).
Checking the dominant gear is the most sensitive part when allocating a métier to a vessel.
The identification of a fishing trip to a métier is based on:
1. Logbook data.
2. Sales notes (also used for cross-checking logbook data).
3. Personal inquiries / interviews with fishermen or skippers/ survey.
Recommendations:
In the cases where the allocation of métier is still done manually, it is recommended to put more
efforts in introducing an automated process, especially, when correlating information from
different sources, since this remains quite time consuming, is difficult to do and can lead to errors.
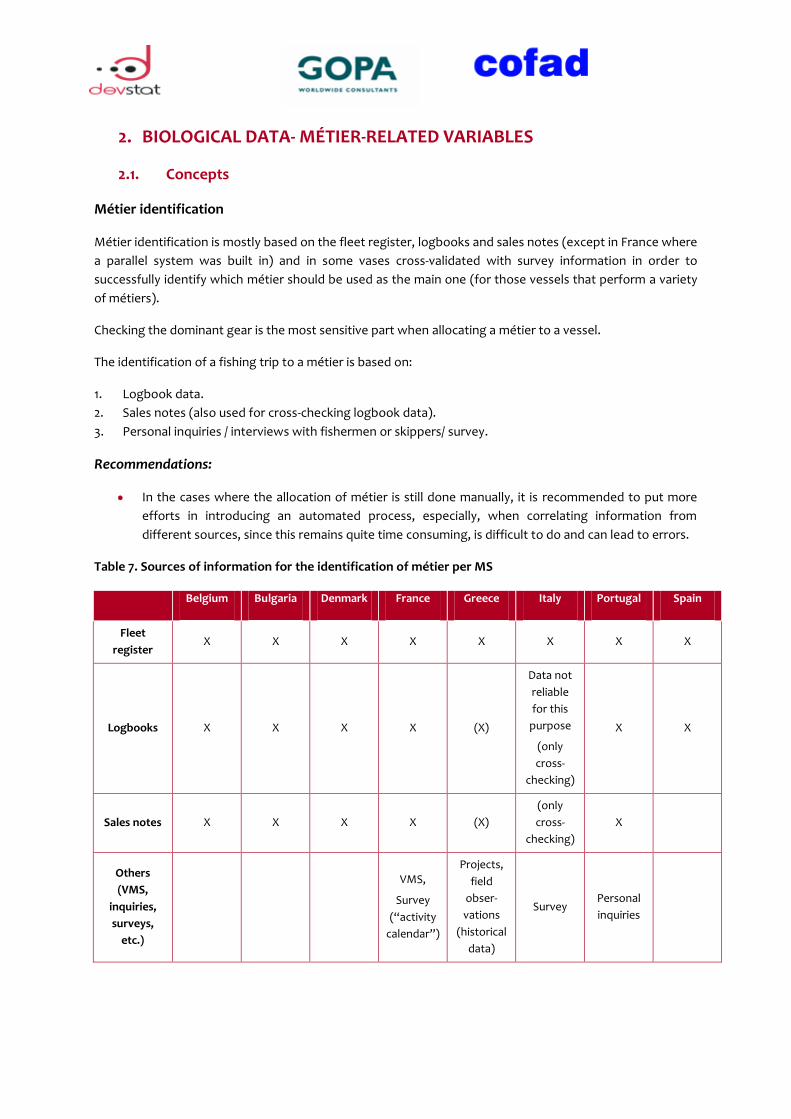
Table 7. Sources of information for the identification of métier per MS
Belgium Bulgaria Denmark France Greece Italy Portugal Spain
Fleet
register X X X X X X X X
Logbooks X X X X (X)
Data not
reliable
for this
purpose
(only
cross-
checking)
X X
Sales notes X X X X (X)
(only
cross-
checking)
X
Others
(VMS,
inquiries,
surveys,
etc.)
VMS,
Survey
(“activity
calendar”)
Projects,
field
obser-
vations
(historical
data)
Survey Personal
inquiries
2.2. Population frames
The population frames are constituted by the number of vessels that belong to a certain métier to be
sampled. However, if there are certain vessels that cannot be considered e. g. for doing on-board sampling
(due to technical constraints or to the refusal of skippers – see also On-board sampling below), then the
population frame does not include the whole population of a métier. This circumstance, which is the case
for most of the visited countries, might in some cases lead to bias in the randomisation of the sample.
2.3. Sampling
Selection of métiers
As defined by the DCF, the selection of métiers to be sampled is performed according the 90% ranking
system based on landing, value and effort of each métier. The regulation specifies that the average values
of the 2 previous years should be taken as reference.
In this context, it has to be highlighted that it is not clear whether the ranking system has to be calculated
(updated) every year (according to the Regulation, based on the previous 2 years) or only once when
preparing the multiannual country NP. If it is the case of the latter, this might bias the sampling of the
current status of the national fisheries (i.e. Portugal, Italy and France).
Sampling design
Sampling is directed at the selected métiers (by the ranking procedure) and vessels are chosen from the
population frame. The sampling strategy is designed on the basis of:
International survey standards (internationally used approaches in the sampling strategy).
Own/national studies or research projects.
Recommendations from coordination meetings with ICES (working groups), RFMOs, etc.
Volumes of catches of previous year.
In practice, the sample design is constrained by:
Budget available.
Personnel available (trained observers and auction samplers).
Technical constraints (see On-board sampling below).
When checking then actual sampling achievements on-shore and at sea in relation to what was planned in
the NP, it is understandable that many deviations are reported and difficulties arise. This is due among
others to the fact that the NP is giving prediction years ahead of the dynamic in the fishery. For obvious
reasons, the predictions do not always meet the reality, the more the reference period dates back. Other
reasons for failing the sampling objectives are mentioned below under On-board sampling.
Example of good practice:
Denmark: Incorporates the refusal rates from random selected fishermen who do not accept observers on board.
Recommendation:
Yearly update of the métiers to sample (90 % ranking system).
Once sample sizes are calculated, the sampling scheme is stratified by area, quarter and harbour/vessel.
When a certain métier requires discard sampling, the sampling is allocated both to on-board and on-shore
sampling. Otherwise, if discards cannot be collected, MS have to carry out a pilot study in order to be
entitled to ask for derogation. In latter cases, in general terms only on-shore sampling is performed as it is
easiest and cheapest approach.
On-shore sampling
It has been observed in various countries that, in order to compensate for low achievement rates for
sampling on-board, high sampling rates for sampling at port have been reported (leading in many cases to
oversampling). As said above, this is easier and cheaper and is also a fair attempt to achieve the overall
sampling objectives. However, discard sampling is neglected in this way.
On-board sampling
As said before, the objectives set for number of trips to be sampled on-board are very often not achieved.
In addition to the problems related to the NP (and predictions based on it), this is in practice also due to the
following issues:
Financial constraints (limited budget)
Technical constraints:
o Limited space on vessels
o Security issues
Other constraints:
o Refusal of skippers
All these restrictions are leading to the randomisation problems mentioned before in the population frame.
Recommendations:
The estimation of totals per métiers (e.g. total catches) could be improved using specific methods
that take into account the probabilities of selection. For instance, estimators based on weighting
individual data by (historical) catches (based on selection probabilities proportional to size – where
size is measured by catches), could achieve greater precision.
Sample sizes should be adjusted during the design phase based on the observed variability within
each métier (i.e. increase sample size for métiers with large variation of the variable of interest). To
this aim, standard deviations per métier should be calculated.
Achieved precision levels
During the different field missions, it has been observed and reported that, despite adequate or even larger
sampling sizes (oversampling has been noted in various occasions due to different reasons), the precision
levels indicated for biological variables by the DCF are not achieved, i. e. the CV values are higher than those
required. This is also applicable for stock-related data.
The problems related to the sampling design can be summarised as follows:
It is established by the Regulation that sample sizes have to be calculated proportionately to the effort and
the variability of the catches of each métier; some minimums in the sampling scheme are mentioned as
well. Besides this, there are no further specifications on the procedure for the calculation of these sample
sizes apart from the indication that collected data have to reach certain precision level in terms of the
coefficient of variation (CV).
Consequently, MS calculate sample sizes based on the budget allocated to sampling purposes as well as on
the effort (and possibly a subjective weighing of the variability of one métier).
All these facts lead to a very low degree of updating of sample sizes (mostly according to changes in effort)
and a “tradition” in oversampling some species (with the subsequent costs).
Recommendations
Further research on precision thresholds, integration of regional samples and further promotion of
the use of precision calculation software.
Yearly update of sample sizes.
Achievement of a specific precision could be based on all data collected by the different MS, not
one MS. This could lead to economizing on sampling.
Discards sampling
Discards sampling is intended to evaluate the quarterly volume of discards and this might condition the
sample allocation in a metier. Here as well, coefficients of variation by species are used as estimator of
precision and sample sizes are calculated proportionately to effort and variability.
Example of good practice:
Denmark: Incorporates the refusal rates from random selected fishermen who do not accept
observers on board.
Denmark, Portugal: Closer collaboration with fishermen associations can improve the
acceptance of observers on-board.
Denmark: Pilot studies on the use of CCTV-cameras on-board and sensors instead of
observers. Its purpose is to test whether they can be used to provide a full documentation of
the fishery. For future data collection, such systems could be used to avoid security problems
on board while reducing costs. This new method for collecting data at sea, once tested with
tangible results, could be extrapolated to other MS (currently also put in practice by Spain
with some vessels in certain fisheries).
Italy: Multivariate sampling design is performed based on the minimization of variances for
several variables of interest (Bethel method).
Recommendations:
Introduce a quality indicator for the discards at the métier level (such as the CV of the weight of
discards per haul or activity).
Update existing pilot studies on discards when the impossibility to sample discards persists in the
long term. However, with the foreseen introduction of the discard ban, it will be possible to sample
discards on-shore at landing.
Under certain circumstances, introduction of a self-sampling approach (in case of long-lasting
fishing trips) – but problems concerning the reliability of data should be carefully evaluated.
As said before, however, discards are often not reported due to the problems related to on-board sampling
(see above).
2.4. Data Collection
The data collected by samplers at the auction markets and observers on-board of vessels is first recorded in
writing in standard forms and afterwards introduced into the respective database in many cases by
themselves.
Recommendations:
Automatic data entry tools should be developed for the use by field work staff during data
collection. These tools should integrate data validation rules.
The refusals to take observers on board should be dealt with in collaboration with fishermen
associations.
3. BIOLOGICAL DATA- STOCK
3.1. Concepts
Individual information shall be collected on six variables: age, length, weight, sex, maturity and fecundity
that shall be associated with the corresponding information on species group and on space (area/stock)
and time stratum.
3.2. Population frames
Given the nature of biological data, there are no population frames for individuals. Population of métiers in
the stock-related data are species stocks assigned to a certain regional fishing ground. These population
frames can many times be shared by more than one MS. Sampling in these cases can be optimised with a
correct coordination of the sampling effort among MS.
3.3. Sampling
Many of the organisational aspects have already been described under the previous section (see métier-
related data).
In some countries, sample sizes are based on tradition and the sampling allocation for species measured on-
shore is correlated to the fishing effort during the year. In most countries, sample sizes are generally larger
than the planned number and the achieved sample sizes do not show relationship with targets. The
requirement of buying full boxes of different sizes or the maximization of the sampling time (i.e. concurrent
on-board sampling and maximization of the time sampling at the market) can explain the problem of
oversampling in certain cases. In some countries, another problem with landing sampling is the direct sales
from on-board customers, not recorded as landings.
Moreover, as highlighted before, despite appropriate or even large sampling sizes, the precision levels
indicated by the DCF are not achieved, i.e. the CV values are higher than expected.
The current practice of merging samples from different quarters for age measurements may present
problems from the statistical point of view, as different size distribution occurs at different points in time.
Statistical analyses should be carried out to justify this practice.
As it is the case for métier-related data, it is understandable also for stock-related sampling that many
difficulties arise when the fisheries dynamic is predicted years ahead in the NP. Most of the deviations from
the proposal are caused by incorrect numbers of planned samples for maturity and sex-ratio data in
particular. This is partly due to the fact that juvenile fish are matured but have not been assigned a sex. An
effort should be made to give better prognoses for collection of these data in the future.
Recommendations:
Further research is needed on precision thresholds, integration of quarterly and regional samples
and estimation software.
Conduct regional precision analysis where involved countries will upload their data to a regional
database (e.g. FishFrame in Denmark). These exercises will highlight the need for sampling
coordination between countries.
Coordination schemes have to be developed to improve and ease the task of age reading. This will
be of great help as not every country has the expertise for age readings for every species
Cooperation among the MS should be promoted, as the numbers of species to be read has
increased.
The frequent mistakes in the presentation of NP should be corrected, updated and indicated in
successive ARs.
The Regulation should provide for the possibility of updating the NP, e. g. through the actualisation
of the sampling needs and the validation through the AR.
3.4. Data collection
The variables are collected from different sources like research surveys, market or sea sampling and the
sampling strategy differs. In general, for most stocks, the sampling sources are listed and the results
presented in separate rows.
In some countries (e.g. Belgium) it has been strongly recommended revising and improving the efficiency of
the time on board of the available observers to avoid the great oversampling produced.
Recommendations
Training in statistical methods will be necessary and more time, coaching, experience and
coordination are needed for staff involved in DCF personnel to achieve better results.
Coordination among MS in data collection for common fishing grounds/shared stocks (e. g. NAFO
areas or other RFMOs; moreover, possible adaptation of sampling protocols to existing protocols
of RFMOs).
Data calls
As said for métier-related data, it has been reported also for stock-related data that the formats (tables) of
the various data calls are modified very often so that it constitutes an arduous work for MS to adapt the
Examples of good practice:
Denmark: As already mentioned in the chapter on métiers data, the use of VMS helps, among
other things, to daily plan the collection of data through an on-board observers programme.
Denmark: Regional precision analysis for North Sea cod (through FishFrame).
Spain/Denmark: Coordination scheme for the sharing of age readings (species-specific
expertise of each country) and collection of biological samples.
Portugal: For the fleet segment fishing in the NAFO and NEAFC areas (with fishing trips lasting
over various months), the sampling, which is done only on-board, is performed by qualified
staff (i.e. male nurses of the crew), who have been trained for this assignment.*
Portugal: On-board sampling is also implemented on those vessels fishing at ICCAT and IOTC
fishing grounds. A good relationship has been established with the skippers who, on a self-
reporting basis, are providing logbook-similar information on the landings to IPMA.*
* In these cases, problems concerning the reliability of data collected should be carefully evaluated in the
first place.
data available in certain format or aggregation level to the new formats requested each time. The
adaptation of the data often requires the involvement of an IT expert for executing the appropriate data
queries.
Recommendation:
Harmonisation: Decide on one table structure and aggregation level and maintain it over the long
term.
3.5. Quality documentation
Data quality checks
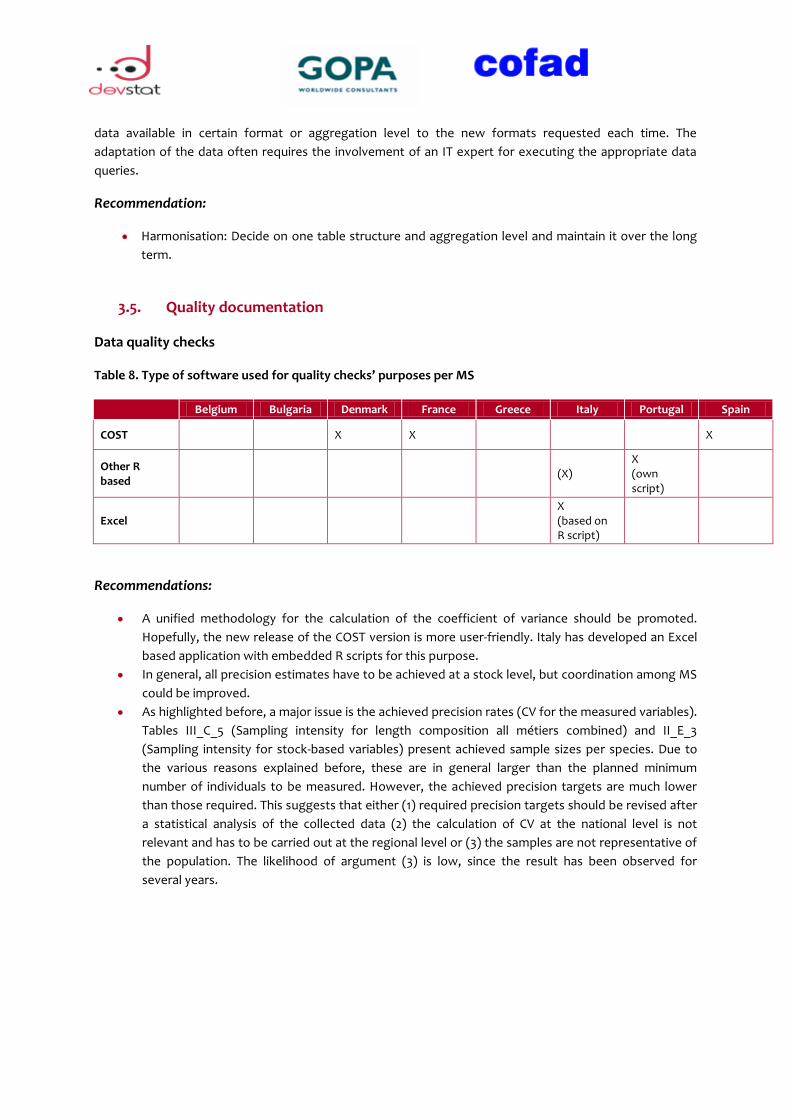
Table 8. Type of software used for quality checks’ purposes per MS
Belgium Bulgaria Denmark France Greece Italy Portugal Spain
COST X X X
Other R based
(X) X (own script)
Excel X (based on R script)
Recommendations:
A unified methodology for the calculation of the coefficient of variance should be promoted.
Hopefully, the new release of the COST version is more user-friendly. Italy has developed an Excel
based application with embedded R scripts for this purpose.
In general, all precision estimates have to be achieved at a stock level, but coordination among MS
could be improved.
As highlighted before, a major issue is the achieved precision rates (CV for the measured variables).
Tables III_C_5 (Sampling intensity for length composition all métiers combined) and II_E_3
(Sampling intensity for stock-based variables) present achieved sample sizes per species. Due to
the various reasons explained before, these are in general larger than the planned minimum
number of individuals to be measured. However, the achieved precision targets are much lower
than those required. This suggests that either (1) required precision targets should be revised after
a statistical analysis of the collected data (2) the calculation of CV at the national level is not
relevant and has to be carried out at the regional level or (3) the samples are not representative of
the population. The likelihood of argument (3) is low, since the result has been observed for
several years.
4. RECREATIONAL FISHERIES
4.1. Concepts
For those fisheries targeting the species listed in Appendix IV (1 to 5), MS shall estimate the quarterly
weight of the catches by recreational fisheries.
4.2. Population frames
In general, some of the few species included in the DCF have a non-negligible importance (up to 20% of the
total commercial catches in some cases, i.e. cod in Belgium) that could be even more important not-
licensed fishermen’s catches were taken into account. This implies the need to include these data in the
stock assessments for such species and, therefore, the need for a sustainable survey system.
The populations of interest are clearly described in Appendix IV for each Region. In order to waive data
collation in a given MS, pilot studies have to be carried out to estimate the importance of the recreational
fisheries for specific species. However, in many MS the execution of these pilot studies does not seem to
get a high priority.
Population frames for surveys are constituted by multiple frames (such as list trips of recreational fisheries
associations and their members).
4.3. Sampling
One of the sources of information on recreational fisheries are sport fishermen associations which might
provide data on the number (and type) of licences issued or even on (kept) catches reported by fishermen.
In the case of ’catch and release’ practice, often no information is provided on released specimens. The
degree of organisation of angling associations and the data they can provide vary much from one MS to the
other but also from marine to inland sport fishing. Other sources of information are coastal guards (e. g. for
catches on Bluefin tuna that have to be reported) telephone or internet survey/polls or also “field”
observations of sport fishing boats on port (e. g. boats equipped for tuna fishing).
Sampling schemes for the species cod, eel, sea bass, salmon and Bluefin tuna are generally quite
heterogeneous as different MS have different peculiarities.
As previously stated, in many MS the execution of these pilot studies does not seem to get a high priority.
Conversely, Spain is a good example because they are doing, since years ago, a follow-up of these fisheries
with pilot studies for all the species involved. In the case of eels, that have developed a management plan
under EC regulation (2007). Ever fishermen must possess a license to fish and a logbook must be
completed; this allows the total catch and catch per unit kg of effort (CPUEs) to be calculated for different
fishing methods and basins. For salmon, there is an obligation to issue a tag and movement guide of all
individuals that are caught, resulting in taking diverse biological data and the weight of the specimens, so
that annual statistical series are available.
Some other countries have already developed a few pilot surveys (telephone interviews, license lists) for
some species (not all) and some other MS have now something in progress. Portugal has one database to
store the recreational fisheries data; however, the reliability of this information is unclear and needs to be
tested.
Since recreational fisheries surveys, in general, are implemented by different organisms, stronger
coordination at all levels may be needed.
In all the cases, it is also of interest to estimate the total number of anglers targeting the most important
species in each country, in order to obtain reliable total catch estimations. The important issue is to ensure
the further use of such surveys in the calculation of total catch or precision level.
Recommendations:
To put more efforts in integrating survey results from recreational fisheries into the official report
of catches when considered of relevance, in order to incorporate the results into the assessments
of such species.
Since recreational fisheries surveys are implemented by different organisms, stronger
methodological coordination may be needed.
At regional/international levels, compendiums of practices for each species should be prepared.
4.4. Data collection
In most of the countries visited the knowledge about these fisheries is quite scarce, at least concerning
those species subject to the DCF (although there are exceptions in some countries for certain species). Only
in recent years MS have started to work on the recreational segment through pilot studies that have
demonstrated the difficulty to collect reliable data because of the great number of recreational fishermen
(licensed or not) and their wide dispersion along the coasts and rivers.
4.5. Quality documentation
Although some countries store the information on recreational fisheries in the central database on DCF
(bi0logical) data, it was reported most times that the data on sport fisheries (either from surveys or pilot
projects) are often kept in separate databases (e. g. Excel files, etc.).
Recommendations:
To include the data on recreational fisheries in the central database for DCF (biological) data,
particularly in those countries where sport fishing is of relevance and have a repercussions on
important fish stocks.
To approach angling associations in order to improve the access to data on catches.
While collaborating with fishing associations, provide feedback on the scientific results to those
fishermen who collaborate in order to strengthen the relation between both parties.
5. TRANSVERSAL VARIABLES
5.1. Concepts
The transversal data regards fleet register, logbooks, sales notes and VMS-registration. This data is
collected under the Control Regulation by the national authorities responsible for the implementation of
the CFP. Availability of the transversal data is essential for the definition of fleet segments and métiers,
which are the basis for the sampling schemes. As transversal data is based on census, it allows
extrapolation of the sample data collected under DCF to the whole population.
5.2. Population frames
All visited MS collect transversal data on census basis, with two exceptions Italy and Greece. In case of Italy
logbook data is considered unreliable, as an important part of landings of individual species is smaller than
50kg. Consequently, Italy collects transversal data on landings and effort on the basis of a sample.
5.3. Sampling
As stated ad 5.2 design of a sampling scheme is not an issue for the transversal data as the Control
Regulation requires a census approach.
However, it could be argued that in case of small scale fleets complementary sampling could generate
valuable information, because sales notes do not necessarily give a correct picture of landings and effort of
this part of the fleet.
6. RESEARCH SURVEYS AT SEA
6.1. Concepts
Surveys at Sea are very important for the estimation of a number of parameters on stock assessment but
not only. Other abiotic parameters and biotic variables can also be measured during research surveys at
sea. This demonstrates the use of the opportunity to generate comprehensive ecological primary and
secondary data needed to understand changes in the ecosystem or food web structure.
In the particular case of Bulgaria, no métier-related biological sampling is performed (neither on-board nor
on shore) but all data available are based on the three surveys carried out (2 BTS survey targeting turbot
and 1 hydro acoustic pelagic trawling survey targeting sprat and whiting).
In all the areas (and in particular in the North Atlantic) the results of such surveys are always incorporated
into the different specific national databases and sent to the ICES databases to facilitate the assessment of
the different shared stocks. In addition, the analysis of such information at national levels allows the
scientists presenting a number of scientific communications to different ICES WGs, to support the advice
that ICES gives to the EU.
In the same line, results are also sent to the GFCM in the Mediterranean and Black Sea (although it is not
the case for all the countries involved), CECAF in Central Eastern Africa and NAFO in North Atlantic waters.
The historical series of data that some countries have accumulated and the quality of the data taken are
really important in terms of scope and present as well as potential use.
6.2. Population frames
Research at sea surveys try to cover as much as possible the area of distribution of the stocks of the most
important species during the appropriate period of time.
There is no population frames as such, but areas and stocks of interest for which estimates are produced.
6.3. Sampling
The surveys follow internationally arranged methodologies and coverage rates are very good in general.
6.4. Data collection
Most of the countries belonging to ICES, have guaranteed the quality and comparability of the time series
of all these surveys by following the rules set up at the expert groups survey coordination meeting (e.g.
ICES, MEDIAS, etc.).
6.5. Quality documentation
Data quality checks
Quality checks are carried out in international working groups for the different research surveys.
7. ECONOMIC DATA - CATCHING SECTOR
General comments on economic data
The following remarks apply also to aquaculture and fish processing industry.
Data collection depends on its purpose. In case of collection of economic data on the fisheries sector
(fishing, aquaculture and processing), we assume that the purpose is to provide a statistically sound
indication of the economic results of these three sectors. The following recommendations are formulated
against the background of this purpose.
All MS have designed survey methods to collect economic data on fleet, aquaculture and in some cases fish
processing industry. These methods have been developed and implemented over span of many years. In
some countries they have been established long before DCF have become formulated. Although further
improvements of the national systems are possible, in general these systems work and produce the
required data.
As for many EU economic statistics, it is the harmonization of outputs which is relevant, while methods for
data collection have to be limited to national practices and available sources, it is not recommended to
pursue one common method of sampling / data collection or one common approach to database software
and structure. This would undoubtedly lead to major costs, delays in data collection and processing and
inconsistencies in data series.
The number of vessels, sampled in each MS, is relatively small. The largest sample of fishing vessels is
carried out in Italy (out of reviewed MS), with 1,600 vessels. This implies that advanced database software
is not required.
Recommendations:
Design of questionnaires.
Definition of DCF costs components based on much more detailed cost classification as applied for
example in Italy or Denmark.
7.1. Concepts
The economic results depend to a significant degree on the average utilization of the production capacity.
This is particularly important when there are large differences in the capacity utilization, as in the case of
many small scale fishing fleets (<12m).
7.2. Population frames
According to the regulation 10121/2009, the population of the fishing vessels is defined on the basis of the
fleet register. MS are obliged to collect economic data on all vessels. Distinction is made between active
and inactive vessels. Active vessels are defined as vessels ‘..that have been engaged in any fishing operation
(more than zero days) during a calendar year.’ Strict application of this definition implies that data must be
collected and will be aggregated on vessels which are ‘regularly’ active and represent sole, or at least
major, source of income to the fishermen employed on board and on vessels which are active only
occasionally, or as little as 1 day per year. Statistically this implies that the population is very heterogeneous,
which will come to expression in high relative standard deviation on all individual variables (although in case
of a census the coefficient of variation will be zero). Furthermore, with data available from logbooks and
sales notes, it is possible to distinguish well between vessel groups of different levels of utilisation.
When applying the present definition, three questions can be raised:
1. How likely it is that data from a good sample of this population can be obtained? It is very likely that the
data from vessels with low level of activity will be poor because they may not maintain detailed
records. This than affects negatively the average of the entire segment.
2. What do the collected statistics tell us in relation to what we wish to know? (Determination of
profitability and international comparisons). The profitability of and earnings from vessels with low
activity is by definition is low. Consequently, they depress the average performance indicators of the
entire segment and create impression that full time fishermen struggle with low earnings and
profitability. Consequently, such conclusions give wrong signals to the policy makers.
3. Is this cost efficient in relation to the information needs? Non-application of a threshold increases the
size of the population and consequently the costs of data collection. Collecting only data on ‘full time
fishing vessels’ (operating above an agreed threshold) allows to make estimates on the ‘low activity’
fleet without actually collecting data on it. This is likely to increase quality and reduce costs.
The present definition of populations raises major uncertainties about the quality of international
comparisons. Such comparisons assume that in the compared countries the average level of capacity
utilisation is similar. However, if this is not the case and one country has relatively many low activity vessels
while another country has relatively few, the comparison may be entirely distorted.
It should be noted that thresholds are also used by Eurostat, e.g. in the SBS data, Intra-stat data and many
other statistics, for reasons outlined above.
Recommendations:
The population to be surveyed should be based on vessels carrying out regular operations, which
serve as a basis of regular minimum level income for the owner and the crew. Present definition of
the active population (i.e. all vessels with one fishing day or more) leads to major distortion of the
evaluation of the economic performance and level of earnings of truly professional fishermen.
In case that, for overriding reasons, the present definition of active fleet must be maintained, we
recommend setting a threshold of ‘normal activity level’. This will greatly enhance the relevance and
precision of the results (improving the statistical values of the coefficient of variation and standard
deviation) and international comparability. Specifically:
In each segment distinction should be made between ‘group 1’ (activity above threshold) and
‘group 2’ (activity below threshold).
Data on catches and earnings is available for all vessels from logbooks and sales notes, and should
not be collected again in surveys.
Data on costs should be collected only on vessels in group 1.
Costs of vessels in group 2 can be estimated with the data on group 1.
Results of group 1 and group 2 should be presented separately.

7.3. Sampling
Clustering
When a small segment A is merged with a large segment B, three situations may occur:
1. Segment A is not represented at all in the sample, or it is underrepresented.
2. Segment A is overrepresented in the sample.
3. Segment A is proportionately represented in terms of number of vessels.
If segment A is over- or underrepresented, than extrapolation of the sample to the population will be
biased. This has again consequences for actual evaluation of the performance of the segment and for
international comparisons. Merging of segments leads to non-standard segment names, e.g. VL24XX, when
vessels over 40m are merged with a segment of 24-40m. etc.
Proportionate representation of segment A may be difficult to achieve and as only 1 vessel may be sampled,
it is uncertain how representative it is. Even if segment A is proportionately represented in the sample, but
the average size (and economic indicators) of the vessels is very different, than again the average values of
the total segment may be affected.
Creation of a segment ‘Other’ will assure correct interpretation and international comparison of all other
segments.
Recommendations:
Clustering of small segments (with less than 10 vessels) into ‘neighbouring’ segments should be
avoided. All ‘small’ segments should be placed in one ‘rest’ segments, e.g. called ‘Other’.
Statistical analysis of homogeneity of segments based on historical data should be carried out to
justify the soundness of segment clustering (e.g. discriminant 2 cluster analysis, non-parametric
tests form comparison of distributions, etc.)
Capital costs
Determination of the values related to capital costs (investment, depreciation, interest) has not yet been
properly homogenized. While most MS claim to adhere to the proposed common method (PIM) for the
calculation of the depreciation costs, determination of capital values themselves is not part of the method.
Consequently different MS follow different approaches using insurance value (Denmark)), vessel
construction index (Italy), regression of historical observations (Portugal), declarations of fishermen
(Bulgaria) or no approach at all (Spain). Some MS do not declare any historical value (Denmark, Belgium,
Portugal and France). The problems are illustrated in the table below:
Cyprus and Ireland have very high capital costs per GT.
Bulgaria, Estonia, Ireland, Italy and Slovenia have historical costs higher than replacement costs,
which would mean that vessel construction costs have decreased, which seems most unlikely.
Several countries do not calculate any historical costs.
Comparing ratio depreciation costs / replacement costs, there are two groups of countries = one
with a ratio of 1-6% and another in the range of 18-21%. These two groups seem to apply a different
approach, probably one using linear depreciation and the other degressive.
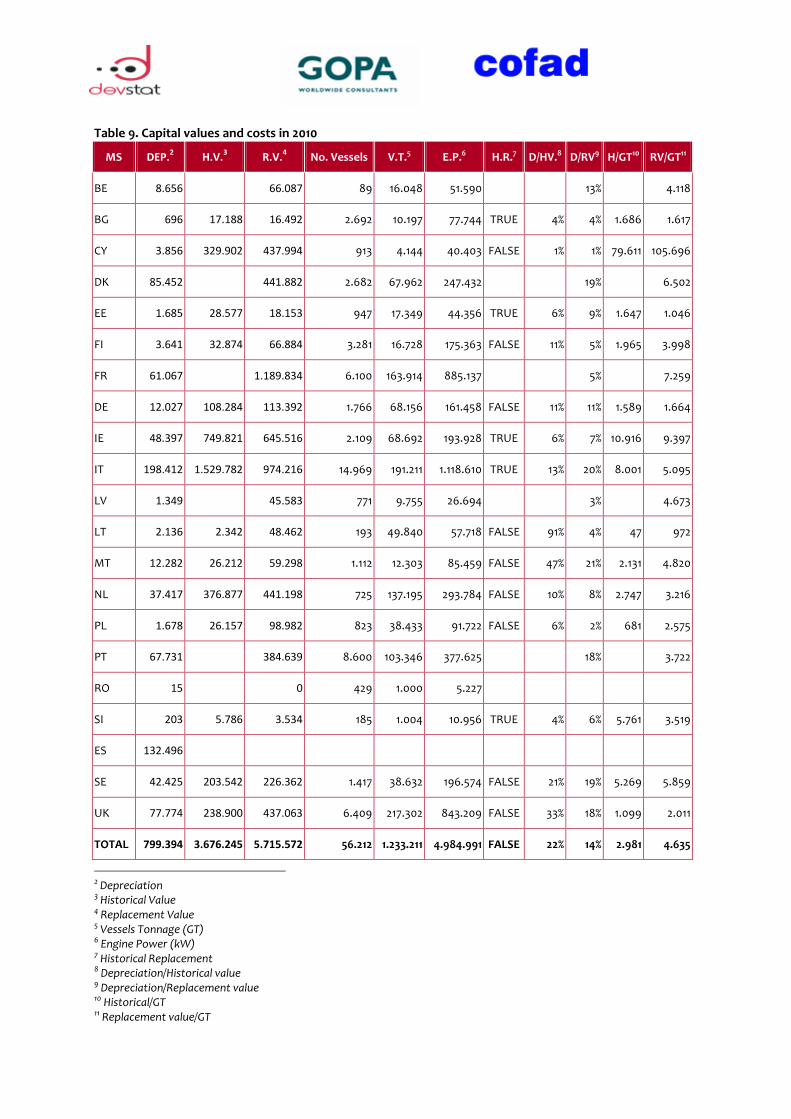
Table 9. Capital values and costs in 2010
MS DEP.2 H.V.
3 R.V.
4 No. Vessels V.T.5 E.P.6 H.R.7 D/HV.8 D/RV9 H/GT10 RV/GT11
BE 8.656 66.087 89 16.048 51.590 13% 4.118
BG 696 17.188 16.492 2.692 10.197 77.744 TRUE 4% 4% 1.686 1.617
CY 3.856 329.902 437.994 913 4.144 40.403 FALSE 1% 1% 79.611 105.696
DK 85.452 441.882 2.682 67.962 247.432 19% 6.502
EE 1.685 28.577 18.153 947 17.349 44.356 TRUE 6% 9% 1.647 1.046
FI 3.641 32.874 66.884 3.281 16.728 175.363 FALSE 11% 5% 1.965 3.998
FR 61.067 1.189.834 6.100 163.914 885.137 5% 7.259
DE 12.027 108.284 113.392 1.766 68.156 161.458 FALSE 11% 11% 1.589 1.664
IE 48.397 749.821 645.516 2.109 68.692 193.928 TRUE 6% 7% 10.916 9.397
IT 198.412 1.529.782 974.216 14.969 191.211 1.118.610 TRUE 13% 20% 8.001 5.095
LV 1.349 45.583 771 9.755 26.694 3% 4.673
LT 2.136 2.342 48.462 193 49.840 57.718 FALSE 91% 4% 47 972
MT 12.282 26.212 59.298 1.112 12.303 85.459 FALSE 47% 21% 2.131 4.820
NL 37.417 376.877 441.198 725 137.195 293.784 FALSE 10% 8% 2.747 3.216
PL 1.678 26.157 98.982 823 38.433 91.722 FALSE 6% 2% 681 2.575
PT 67.731 384.639 8.600 103.346 377.625 18% 3.722
RO 15 0 429 1.000 5.227
SI 203 5.786 3.534 185 1.004 10.956 TRUE 4% 6% 5.761 3.519
ES 132.496
SE 42.425 203.542 226.362 1.417 38.632 196.574 FALSE 21% 19% 5.269 5.859
UK 77.774 238.900 437.063 6.409 217.302 843.209 FALSE 33% 18% 1.099 2.011
TOTAL 799.394 3.676.245 5.715.572 56.212 1.233.211 4.984.991 FALSE 22% 14% 2.981 4.635
2 Depreciation 3 Historical Value 4 Replacement Value 5 Vessels Tonnage (GT) 6 Engine Power (kW) 7 Historical Replacement 8 Depreciation/Historical value 9 Depreciation/Replacement value 10 Historical/GT 11 Replacement value/GT
Recommendations:
Calculation of the capital value (historical and replacement) should be standardized.
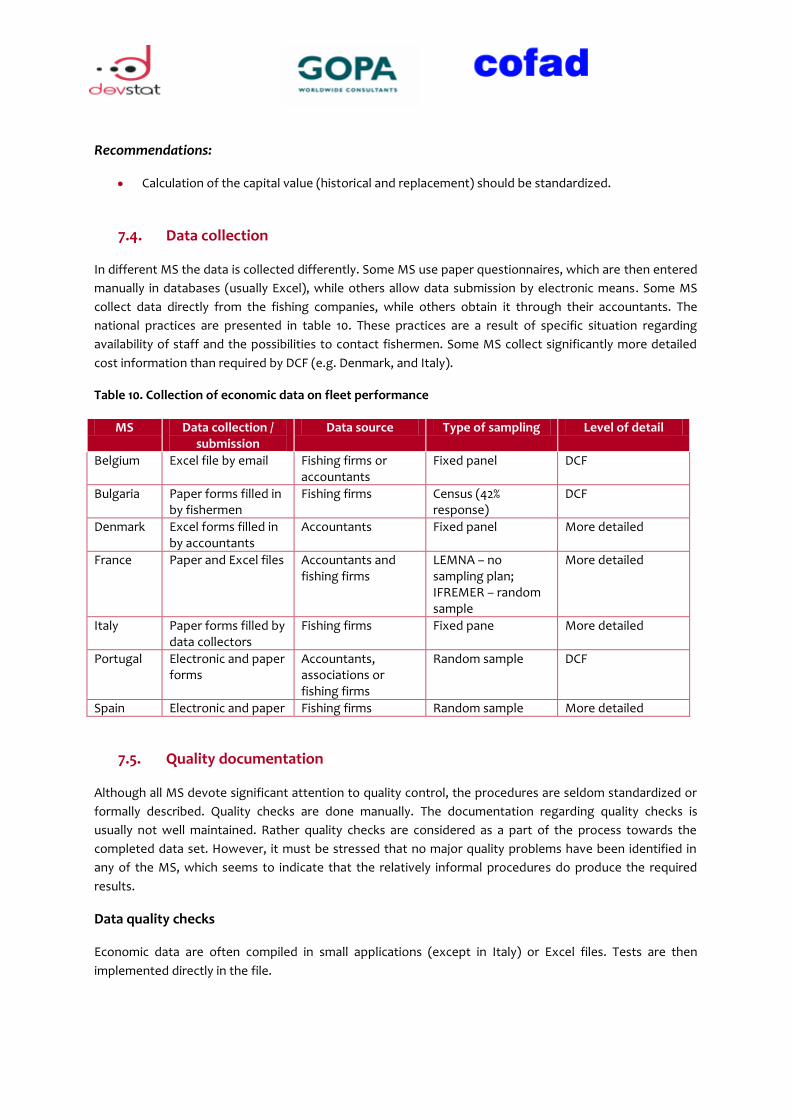
7.4. Data collection
In different MS the data is collected differently. Some MS use paper questionnaires, which are then entered
manually in databases (usually Excel), while others allow data submission by electronic means. Some MS
collect data directly from the fishing companies, while others obtain it through their accountants. The
national practices are presented in table 10. These practices are a result of specific situation regarding
availability of staff and the possibilities to contact fishermen. Some MS collect significantly more detailed
cost information than required by DCF (e.g. Denmark, and Italy).
Table 10. Collection of economic data on fleet performance
MS Data collection / submission
Data source Type of sampling Level of detail
Belgium Excel file by email Fishing firms or accountants
Fixed panel DCF
Bulgaria Paper forms filled in by fishermen
Fishing firms Census (42% response)
DCF
Denmark Excel forms filled in by accountants
Accountants Fixed panel More detailed
France Paper and Excel files Accountants and fishing firms
LEMNA – no sampling plan; IFREMER – random sample
More detailed
Italy Paper forms filled by data collectors
Fishing firms Fixed pane More detailed
Portugal Electronic and paper forms
Accountants, associations or fishing firms
Random sample DCF
Spain Electronic and paper Fishing firms Random sample More detailed
7.5. Quality documentation
Although all MS devote significant attention to quality control, the procedures are seldom standardized or
formally described. Quality checks are done manually. The documentation regarding quality checks is
usually not well maintained. Rather quality checks are considered as a part of the process towards the
completed data set. However, it must be stressed that no major quality problems have been identified in
any of the MS, which seems to indicate that the relatively informal procedures do produce the required
results.
Data quality checks
Economic data are often compiled in small applications (except in Italy) or Excel files. Tests are then
implemented directly in the file.
Recommendations:
The EC could consider defining a list of tests to be applied at MS level with illustrated thresholds or
methods for defining the threshold when required: some tests should be mandatory to ensure a
minimum level of quality of data provided and other tests could be complementary. Based on the
list defined, the list of tests applied could be mentioned as an annex in the annual report.
Statistical tests and method implemented should be validated by the NSI to ensure the correctness
of the statistical procedure applied (e.g. Denmark, Italy and France).
Examples of godd practice:
Denmark is a good example of collecting data through accountants, which can be an efficient approach under specific circumstance.
Italy has a well-developed system of working with staff in the field responsible for the data collection. Although this is a relatively more costly solution, it allows intensive contact with the sector and generates also lot of qualitative information.
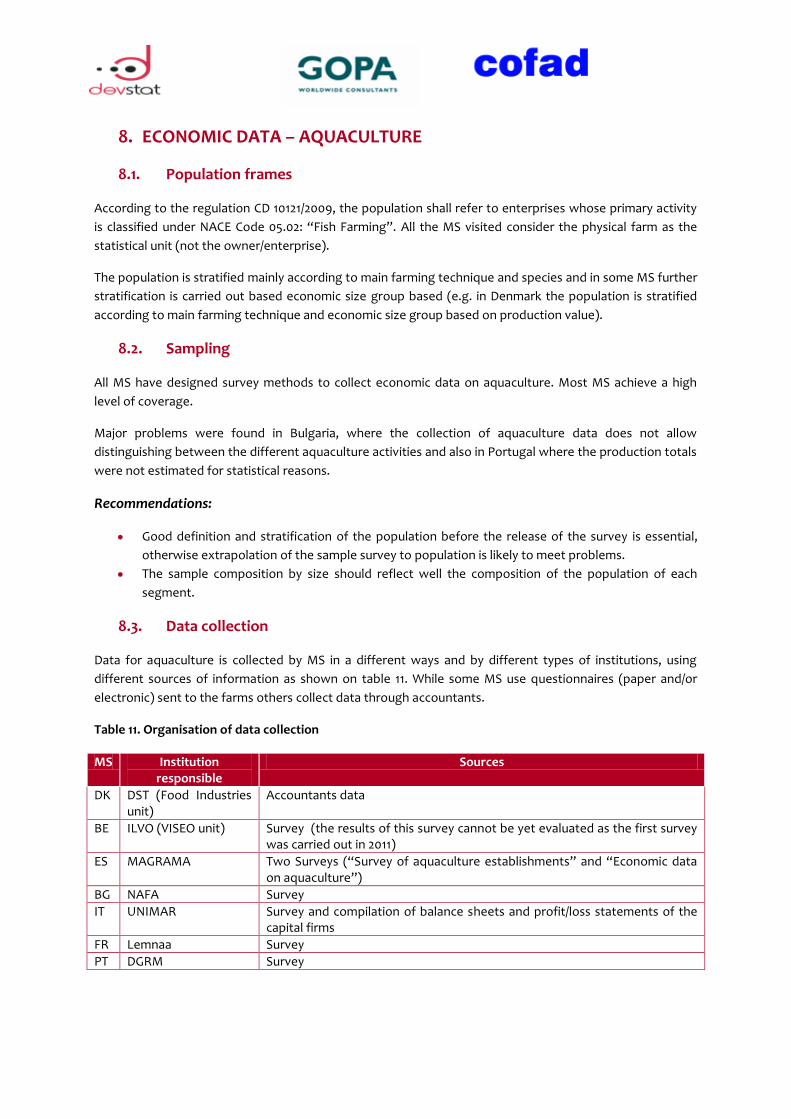
8. ECONOMIC DATA – AQUACULTURE
8.1. Population frames
According to the regulation CD 10121/2009, the population shall refer to enterprises whose primary activity
is classified under NACE Code 05.02: “Fish Farming”. All the MS visited consider the physical farm as the
statistical unit (not the owner/enterprise).
The population is stratified mainly according to main farming technique and species and in some MS further
stratification is carried out based economic size group based (e.g. in Denmark the population is stratified
according to main farming technique and economic size group based on production value).
8.2. Sampling
All MS have designed survey methods to collect economic data on aquaculture. Most MS achieve a high
level of coverage.
Major problems were found in Bulgaria, where the collection of aquaculture data does not allow
distinguishing between the different aquaculture activities and also in Portugal where the production totals
were not estimated for statistical reasons.
Recommendations:
Good definition and stratification of the population before the release of the survey is essential,
otherwise extrapolation of the sample survey to population is likely to meet problems.
The sample composition by size should reflect well the composition of the population of each
segment.
8.3. Data collection
Data for aquaculture is collected by MS in a different ways and by different types of institutions, using
different sources of information as shown on table 11. While some MS use questionnaires (paper and/or
electronic) sent to the farms others collect data through accountants.
Table 11. Organisation of data collection
MS Institution responsible
Sources
DK DST (Food Industries unit)
Accountants data
BE ILVO (VISEO unit) Survey (the results of this survey cannot be yet evaluated as the first survey was carried out in 2011)
ES MAGRAMA Two Surveys (“Survey of aquaculture establishments” and “Economic data on aquaculture”)
BG NAFA Survey
IT UNIMAR Survey and compilation of balance sheets and profit/loss statements of the capital firms
FR Lemnaa Survey
PT DGRM Survey
Recommendations:
NSIs should be explicitly included as partner in the DCF National Programme in order to participate
in the data collection phase and to facilitate specific DCF requests.
8.4. Quality documentation
See section 7.5
Recommendation:
Dissemination of quality indicators of estimates, particularly the accuracy and non-response
Examples of good practice:
Denmark and France are good examples for the organization of the data collection as a dialogue group composed by DST, accountants and representatives of the professionals organisations meets annually in order to discuss necessary adjustments.
Denmark: provides guidelines and forms for accountants that can be downloaded from the DST website.
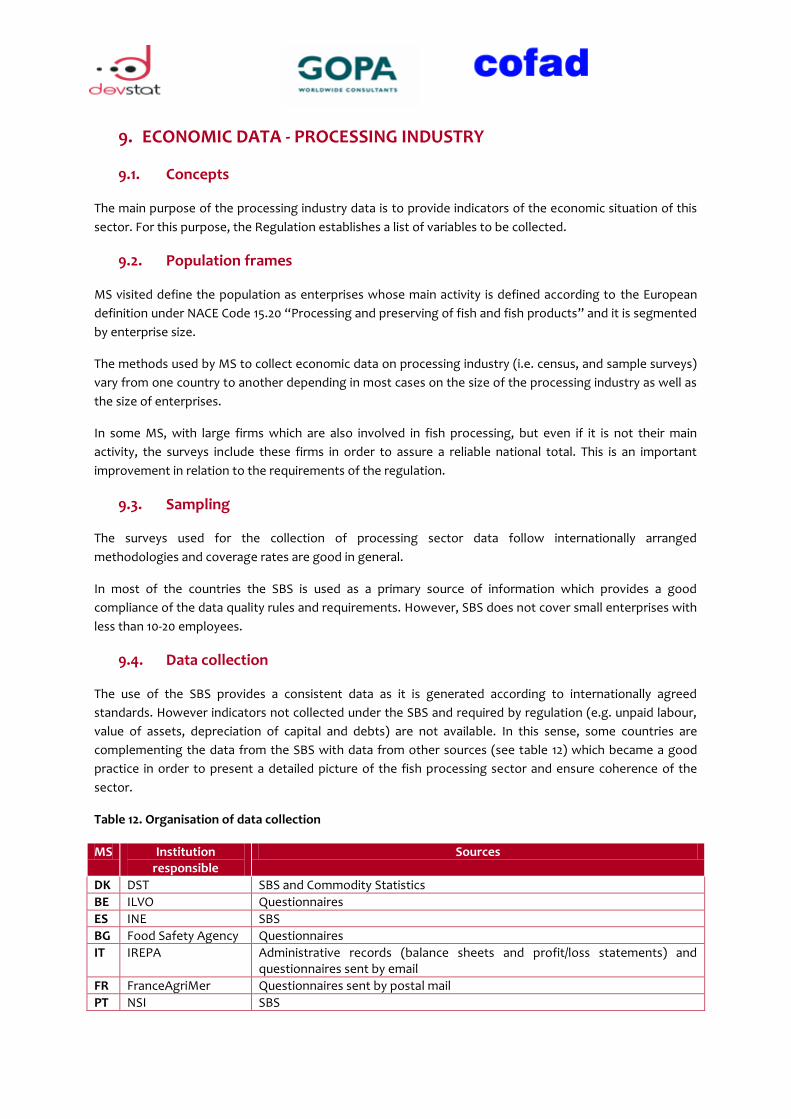
9. ECONOMIC DATA - PROCESSING INDUSTRY
9.1. Concepts
The main purpose of the processing industry data is to provide indicators of the economic situation of this
sector. For this purpose, the Regulation establishes a list of variables to be collected.
9.2. Population frames
MS visited define the population as enterprises whose main activity is defined according to the European
definition under NACE Code 15.20 “Processing and preserving of fish and fish products” and it is segmented
by enterprise size.
The methods used by MS to collect economic data on processing industry (i.e. census, and sample surveys)
vary from one country to another depending in most cases on the size of the processing industry as well as
the size of enterprises.
In some MS, with large firms which are also involved in fish processing, but even if it is not their main
activity, the surveys include these firms in order to assure a reliable national total. This is an important
improvement in relation to the requirements of the regulation.
9.3. Sampling
The surveys used for the collection of processing sector data follow internationally arranged
methodologies and coverage rates are good in general.
In most of the countries the SBS is used as a primary source of information which provides a good
compliance of the data quality rules and requirements. However, SBS does not cover small enterprises with
less than 10-20 employees.
9.4. Data collection
The use of the SBS provides a consistent data as it is generated according to internationally agreed
standards. However indicators not collected under the SBS and required by regulation (e.g. unpaid labour,
value of assets, depreciation of capital and debts) are not available. In this sense, some countries are
complementing the data from the SBS with data from other sources (see table 12) which became a good
practice in order to present a detailed picture of the fish processing sector and ensure coherence of the
sector.
Table 12. Organisation of data collection
MS Institution responsible
Sources
DK DST SBS and Commodity Statistics
BE ILVO Questionnaires
ES INE SBS
BG Food Safety Agency Questionnaires
IT IREPA Administrative records (balance sheets and profit/loss statements) and questionnaires sent by email
FR FranceAgriMer Questionnaires sent by postal mail
PT NSI SBS
Recommendations:
Combine different sources and/or to design approaches to estimate indicators which are not
standard collected under SBS.
NSIs should be explicitly included as partner in the DCF National Programme in order to strengthen
the cooperation and facilitate specific DCF requests.
Avoid double work by a more intensive use of the SBS data would be more effective and could be
only done if the DCF calendar is adapted to the SBS calendar. I (ex: FR The comparison with ESANE
can be only done after the DCF has been submitted to the EC, as the ESANE results become
available only with a significantly longer delay).
9.5. Quality documentation
See section 7.5
Examples of good practice:
Italy and France: Combination of administrative records and survey data to reduce response burden and ensure coherence. In this way it is possible to compile data on small and large firms, which presents a complete picture of the fish processing industry.
France included large firms which are involved in fish processing but not as a main activity in the surveys in order to assure a reliable national total.
10. VARIABLES ON THE EFFECTS OF FISHERIES ON THE MARINE
ECOSYSTEM
10.1. Concepts
The EU Marine Strategy Framework Directive points out the need of CFP to be involved in the
environmental impact of fishing activities in the context of the objectives of this Directive. The elaboration
of the initial assessment on the current of environmental status of marine waters through the
establishment of a number of descriptors and the impact of human activities on them was foreseen.
On the other side, the nine indicators selected within the DCF address the following aspects:
o Indicators 1 to 4: conservation status and condition of fish species, proportion of large fish, average
maximum size of fish and size at maturation of exploited species.
o Indicator 5, 6 and 7: distribution an aggregation of fishing activities and areas of sea bed not
impacted by mobile bottom fishing gears.
o Indicator 8: Percentage of discards of commercially exploited species.
o Indicator 9: Energy efficiency of fish catches.
In this context, a series of parallelisms and connections can be drawn between the descriptors defined
under the MSFD and the ecosystem indicators requested by the DCF.
10.2. Population frames
The idea, which originates from the Agreement on Biological Diversity, is to attain a world network on
Marine Protected Areas (MPA), theoretically by 2012.
Multi-annual national sampling programmes shall include a sampling design for ecosystem data including
the ecosystem approach for fisheries, that allows the impact of the fisheries sector on the marine
ecosystem to be estimated and that contributes to monitoring of the state of the marine ecosystem.
10.3. Sampling and data collection
Data related to indicators 1 to 4 are usually collected during the research surveys and also the biological
sampling and is stored in the biological databases. Regarding indicator 4, concerning the size at maturation,
planning problems can be found since research surveys do not generally cover all the spawning seasons of
the different species.
Data related to indicators 5 to 7 can be obtained through VMS data and has been done in the countries
where such VMS data are available, generally in vessels over 15 meters. Data are usually available within two
months of receipt.
As for Indicator 8, percentage of discards of commercially exploited species, countries are extracting such
percentage from the samples taken of commercial species and used to evaluate the degree of selectivity of
a fishing method and its impact on the ecosystem.
The indicator 9 refers to energy efficiency of fish catches. The calculation of this energy efficiency indicator
is calculated combining economic data on landings and fuel costs.
Belgium has informed that the multidisciplinary group called VISEO, will try to develop and coordinate
aspects concerning different issues: environment, socioeconomic, aquaculture and processing industry.
They have also informed that there is documentation from various advanced countries in DCF matters that
are going to be available to other MS concerning indicators 5, 6 and 7.
Recommendation:
As already done by some countries, the inclusion of ecosystem data into the databases dedicated
to DCF purposes might allow also for future use for MSFD purposes.
Improved data sharing between the institutions responsible would be valuable here.
10.4. Quality documentation
To collect the type of data required for it, Spain has two important and well maintained databases –SIRENO
and the SGP database- which compiles all of the information requested.
Examples of good practice:
Portugal: connects the requirements related to the DCF with those defined by the EU Marine Strategy Framework Directive (MSFD). Having internationally agreed on the use of DCF data for MSFD purposes, the institute has linked some indicators (1, 3 and 4) with the qualitative descriptors for determining the Good Environmental Status (GES) as defined in the MSFD, e. g. for Descriptor 1, Biological diversity, or also some aspects of Descriptor 4 of MSFD.
Italy: The methodology implemented for the ecosystem indicators 5, 6 and 7 could be interesting to be presented in international meetings. This approach estimates the daily spatial fishing activity combining data from the VMS signal, vessel characteristics and log-book/sales notes characteristics. All these results are stored and used for the calculation of indicators 5 to 7. The prediction quality of the spatial fishing activities has been proved to be very accurate after comparing the results with the reality using some badly calibrated VMS signals that resulted in higher signal resolution.