Plastic shrinkage cracking in conventional and low volume ...
Upload
austin-dada-eitCategory
view
52download
0
Synthetic Fiber-Reinforced Concrete Testing for the Mitigation of
Plastic Shrinkage Cracking
Study Performed for
A1 Concrete Fibers, LLC
By
The University of Alabama at Birmingham
Department of Civil, Construction, and Environmental Engineering
University of Alabama at Birmingham
Personnel:
Mentor: Dr. Fouad H. Fouad
Laboratory supervision: Mr. Richard Hawkins
Student: Austin Dada
May 5, 2009
`

Introduction
The use of fiber for the reinforcement of concrete and concrete-like matrices has been
employed since ancient times. Fiber-reinforced concrete became an attractive area for research
following the discoveries of the health hazards of high tensile strength asbestos fibers used in the
1960s and 70s. Materials such as ceramics, plastics, and gypsum products have featured the use
of fibers in order to enhance properties such as tensile and compressive strength, elastic modulus,
crack resistance and control, durability, and many other related properties.
There are four basic types of fiber-reinforced concrete: steel, glass, synthetic, and natural.
The first major inquiry into the use of steel fiber-reinforced concrete in the United States was
made in the 1960s and since then, a great deal of research has been carried out on the use of steel
fibers for residential and industrial applications. Preliminary studies on the use of synthetic
fibers as concrete reinforcement proved to be unsuccessful and deemed steel and glass fibers as
more sufficient means of concrete reinforcement. However, as more understanding of synthetic
fibers was gained and new synthetic fiber types and fabrication methods emerged, the use of
synthetic and natural organic fibers has been deemed to be just as effective as the use of steel and
glass for reinforcement pertaining to certain applications.
Traditional means for fiber reinforcement of concrete featured steel rebar reinforcement
or prestressed steel reinforcement, providing a uniform reinforcement and structural integrity to
concrete that exhibits general weakness in the area of tensile strength. Fiber reinforcement of
concrete is randomly distributed and even throughout the concrete matrix. It may also be used in
conjunction with conventional reinforcement. The flexibility and freedom to control the
methods of manufacturing and placing fiber-reinforced concrete generally proves an economic
advantage over conventional reinforcement methods. Fiber-reinforced concrete has a wide
variety of applications in construction due to the improved physical and mechanical properties of
the material. Synthetic fiber reinforced concrete has been utilized extensively in floor slabs and
slabs on grade. Synthetic and composite fibers for use in the reinforcement of concrete used in
construction elements have also been used. Synthetic fiber-reinforced products can exhibit high
ductility while still retaining their integrity.
2

Objective and Scope
The objective of the proposed work was to determine the behavior of concrete reinforced
with two different types of synthetic polypropylene fibers. The ASTM C1579 test standard was
followed in order to evaluate the plastic shrinkage cracking of the FRC.
Test Specimens
Two different synthetic fiber textures (ASTM C 1116 Type III) were used in the
respective mix designs of the specimens to be tested. It was decided upon that the performance
of the different fibers were to be compared after sufficient testing. The two fiber textures to be
used in the fiber-reinforced concrete samples were named A1-Micromesh and A1 Microfibers
(fibrillated fiber in varying lengths, ¼” to ½”). Control specimens were also molded, containing
no fibers, and tested in order to determine the effect of the respective fiber textures on the base
mix design and properties. The major test performed was the plastic shrinkage cracking test. A
battery of standard concrete tests were also performed on FRC and plain concrete specimens to
aid in the evaluation of the test results.
Two concrete slab specimens were created for each dosage, including the control dosage.
The dosage rates tested were ¾ lb, 1 lb, and 1 ½ lb of fiber per cubic yard of concrete also
including the control dosage with no fibers. The specimens were subjected to the same
environmental test conditions as per ASTM C1579. The two specimens per dosage were made
for each fiber texture, both of which were tested on separate occasions.
3

Table 1: Type of tests performed
Fiber Type Major Test Supporting Tests Fiber
Dosage
(lb/cu yd)
References
A1 Micro Mesh Plastic shrinkageASTM C1579
SlumpUnit weightCompressive strengthTime of Setting
¾, 1, 1 ½ FM 150NER 414
A1 Tough Mesh
Plastic shrinkageASTM C1579
SlumpUnit weightCompressive strengthTime of Setting
¾, 1, 1 ½ FM300ESR 1165
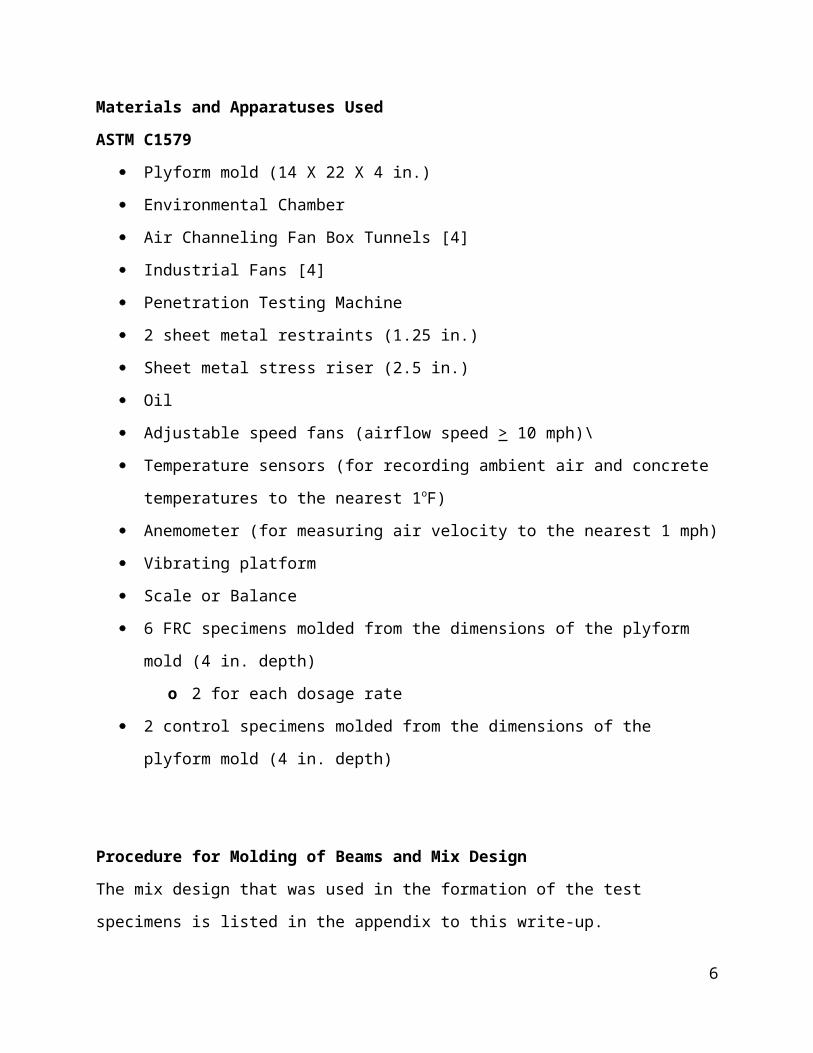
Materials and Apparatuses Used
ASTM C1579
Plyform mold (14 X 22 X 4 in.)
Environmental Chamber
Air Channeling Fan Box Tunnels [4]
Industrial Fans [4]
Penetration Testing Machine
2 sheet metal restraints (1.25 in.)
Sheet metal stress riser (2.5 in.)
Oil
Adjustable speed fans (airflow speed > 10 mph)\
Temperature sensors (for recording ambient air and concrete temperatures to the nearest
1oF)
Anemometer (for measuring air velocity to the nearest 1 mph)
Vibrating platform
Scale or Balance
6 FRC specimens molded from the dimensions of the plyform mold (4 in. depth)
o 2 for each dosage rate
2 control specimens molded from the dimensions of the plyform mold (4 in. depth)
4

Procedure for Molding of Beams and Mix Design
The mix design that was used in the formation of the test specimens is listed in the appendix to
this write-up.
Six FRC slabs of dimensions 14” X 22” X 4” were produced, where 2 slabs would
contain a certain dosage of fiber. Two control slabs of the same dimensions were made for
comparison purposes. The freshly mixed molds were also consolidated for 1 minute and 30
seconds using the vibrating table to avoid material segregation. Each slab specimen was then
screeded three times with an angled iron screed. The surface was then troweled with a
predetermined number of passes in order to smooth the slabs for ease of crack observation. The
slabs were then ready for testing in the fan box apparatus where two specimens of the same
dosage were placed under the same fan box.
Three 4” x 8” cylinders from each dosage were also produced from each concrete mix for
each fiber with three other control cylinders containing no fibers. The cylinders were then tested
for compressive strength to verify the strength of the mix and to identify any discernable effect
on strength by the fibers.
Table 2: Number and dimensions of test specimens for each fiber type tested
Fiber Type Compressive Strength
Cylinders [4” X 8”]
Plastic ShrinkageFRC Slabs [14” X 22” X 4”]
Control (No Fiber) 3 2
A1 Tough Mesh 9** 6*
A1 Micro Mesh 9** 6*
* Two specimens per dosage rate
** Three specimens per dosage rate
Plastic Shrinkage Cracking Test Procedure
The ready-molded FRC and control slabs were placed under the fan boxes in the selected
exposure area, downstream of the fans. The fans were then activated and the time of day
recorded. During the test, both the control and the FRC specimens were exposed to identical
drying conditions with a temperature of 92-95oF and 20-30% humidity. Times of setting
specimens were also created as per ASTM C403 and after the measure of final setting by the
same ASTM, the evaluation of cracking began. At the beginning of the test, and at every
subsequent 30 minute interval, the air temperature, relative humidity, and airflow velocity were
5
measured and recorded at outlet of air from the fan boxes. The time at which the first crack
occurred was also recorded for each specimen. Observations were continued for a minimum of 3
hours or until final set had occurred where measurement of cracking began. Cracks were
measured with the aid of a crack comparator where the largest width along each crack length was
measured and recorded. Transparencies were placed on the specimens that cracked and the
length of each crack was traced upon the transparencies.
6

Figure 1. Schematic of Plastic Shrinkage Mold
7

Data Collection
The following data recorded includes the time of setting graphs for each fiber type tested,
compressive strength data for each fiber type, and the width of the cracking from each test
specimen as well as the temperature and humidity records for the testing.
Time of Setting Testing for A1 Microfiber
8

Time of Setting Testing for A1 MicroMesh
9

Compressive Stength Data for A1 Microfiber Specimens
Dosage AgeLoad (lb)
Strength (psi)
Control 28 53590 4264Control 28 53220 4235Control 28 53140 4229Control 28 52510 4178Control 28 56790 4519Control 28 55500 44163/4 lbs 28 53380 42503/4 lbs 28 52150 41503/4 lbs 28 51390 40903/4 lbs 28 51720 41203/4 lbs 28 55160 43903/4 lbs 28 53590 4264
1 lb 28 57300 45601 lb 28 57310 45601 lb 28 58840 46821 lb 28 58120 46251 lb 28 56850 45241 lb 28 57780 4598
1.5 lb 28 58790 46781.5 lb 28 60340 48021.5 lb 28 60550 48191.5 lb 28 59580 47411.5 lb 28 59490 47341.5 lb 28 62180 4948
Compressive Strength Data for A1 MicroMesh Specimens
Dosage AgeLoad (lbs)
Strength (psi)
3/4 lbs 28 63970 50903/4 lbs 28 63150 50253/4 lbs 28 61230 4873
1 lb 28 66030 52551 lb 28 65370 52021 lb 28 64540 5136
1.5 lbs 28 65700 52281.5 lbs 28 62450 49701.5 lbs 28 61330 4880
Crack Widths of A1 Microfiber Specimens
10

Crack #Control
[1]3/4 lb
[1]3/4 lb
[2]1 lb [2]
1 0.15 0.08 0.115 0.082 0.125 0.175 0.275 0.1753 0.2 0.175 0.30667 0.1254 0.09 0.275 0.2 0.25 0.08 0.3 n/a 0.56 n/a 0.365 n/a 0.1757 n/a 0.33 n/a 0.158 n/a 0.3 n/a n/a9 n/a 0.175 n/a n/a
10 n/a 0.125 n/a n/a
Crack Widths of A1 MicroMesh Specimens
Crack #Control
[1] 1 lb [1]1 0.08 0.12 0.09 0.21253 0.1 0.254 0.45 0.1255 0.5 0.1256 0.45 0.087 0.45 0.098 0.365 0.089 0.4 0.125
10 0.275 0.1511 0.225 n/a
Temperature and Humidity Readings for Testing of A1 Microfiber
Control 3/4 lb 1 lb 1.5 lb
TimeWind Speed Humidity
Wind Speed Humidity
Wind Speed Humidity
Wind Speed Humidity
11:04 AM 6.8 m/s 95.5 F 7.5 m/s 96 F 7.4 m/s 97.3 F 7.5 m/s 97.1 F
11:32 AM 6.6 m/s 95.5 F 7.4 m/s 95.1 F 7.25 m/s 95 F 7.58 m/s 98 F
12:04 PM 6.7 m/s 94.5 F 7.6 m/s 94.6 F 7.1 m/s 94.6 F 7.65 m/s 94.4 F
12:38 PM 6.7 m/s 93.9 F 7.6 m/s 94.2 F 7.15 m/s 94.5 F 7.5 m/s 94.4 F
1:04 PM 6.5 m/s 94.1 F 7.1 m/s 94.6 F 6.77 m/s 95 F 7.5 m/s 95 F
Temperature and Humidity Readings for Testing of A1 MicroMesh
11

Control 3/4 lb 1 lb 1.5 lb
TimeWind Speed Humidity
Wind Speed Humidity
Wind Speed Humidity
Wind Speed Humidity
12:29 AM 8.2 m/s 93.3 F 7.2 m/s 93.5 F 8.0 m/s 93.7 F 7.5 m/s 93.9 F
1:00 PM 8.2 m/s 95.5 F 7.0 m/s 95.5 F 8.3 m/s 95.1 F 7.1 m/s 94.8 F
1:35 PM 7.8 m/s 96.8 F 6.9 m/s 96.9 F 7.9 m/s 96.9 F 6.7 m/s 96.6 F
2:05 PM 7.4 m/s 93.2 F 7.0 m/s 93.3 F 8.1 m/s 93.7 F 6.3 m/s 93.9 F
References
ASTM (C1579). “Standard Test Method for Evaluating Plastic Shrinkage Cracking of Restrained
Fiber Reinforced Concrete (Using a Steel Form Insert) West Conshohocken, Pa.
ASTM. (C1116). “Standard Specification for Fiber-Reinforced Concrete.” West Conshohocken,
Pa. (Approved January 1, 2008).
ACI 544.3R-08, “Guide for Specifying, Proportioning, Mixing, Placing, and Finishing Steel
Fiber Reinforced Concrete,” American Concrete Institute (ACI). P.O. Box 9094,
Farmington Hills, MI 48333.
ACI 544.2R-89, “Measurement of Properties of Fiber-Reinforced Concrete,” American Concrete
Institute (ACI). P.O. Box 9094, Farmington Hills, MI 48333.
ACI 544.1R-96, “State-of-the-Art Report on Fiber Reinforced Concrete,” American Concrete
Institute (ACI). P.O. Box 9094, Farmington Hills, MI 48333.
ICC-AC32, “Acceptance Criteria for Concrete with Synthetic Fibers,” ICC Evaluation Services,
Inc. Approved October 2003.
12