Report on IFAD’s Development Effectiveness · has slid from last year, ... The share of planned...
45
Note to Evaluation Committee members Dispatch delay due to late submission by the originator to the Office of the Secretary Focal points: Technical questions: Dispatch of documentation: Theresa Rice Operational Systems Advisor Tel.: +39 06 5459 2495 e-mail: [email protected] Hisham Zehni Strategic Planning Officer Tel.: +39 06 5459 2183 e-mail: [email protected] Deirdre McGrenra Head, Governing Bodies Office Tel.: +39 06 5459 2374 e-mail: [email protected] Evaluation Committee — Eighty-sixth Session Rome, 27 November 2014 For: Review Document: EC 2014/86/W.P.4 E Agenda: 5 Date: 17 November 2014 Distribution: Public Original: English Report on IFAD’s Development Effectiveness
Transcript of Report on IFAD’s Development Effectiveness · has slid from last year, ... The share of planned...
Note to Evaluation Committee members
Dispatch delay due to late submission bythe originator to the Office of the Secretary
Focal points:
Technical questions: Dispatch of documentation:
Theresa RiceOperational Systems AdvisorTel.: +39 06 5459 2495e-mail: [email protected]
Hisham ZehniStrategic Planning OfficerTel.: +39 06 5459 2183e-mail: [email protected]
Deirdre McGrenraHead, Governing Bodies OfficeTel.: +39 06 5459 2374e-mail: [email protected]
Evaluation Committee — Eighty-sixth SessionRome, 27 November 2014
For: Review
Document: EC 2014/86/W.P.4
EAgenda: 5Date: 17 November 2014Distribution: PublicOriginal: English
Report on IFAD’s DevelopmentEffectiveness
EC 2014/86/W.P.4
Note to Executive Board representatives
Focal points:
Technical questions: Dispatch of documentation:
Theresa RiceOperational Systems AdvisorTel.: +39 06 5459 2495e-mail: [email protected]
Hisham ZehniStrategic Planning OfficerTel.: +39 06 5459 2183e-mail: [email protected]
Deirdre McGrenraHead, Governing Bodies OfficeTel.: +39 06 5459 2374e-mail: [email protected]
Executive Board — 113th SessionRome, 15-16 December 2014
For: Review
Document: EB 2014/113/R.11
EAgenda: 6Date: 17 November 2014Distribution: PublicOriginal: English
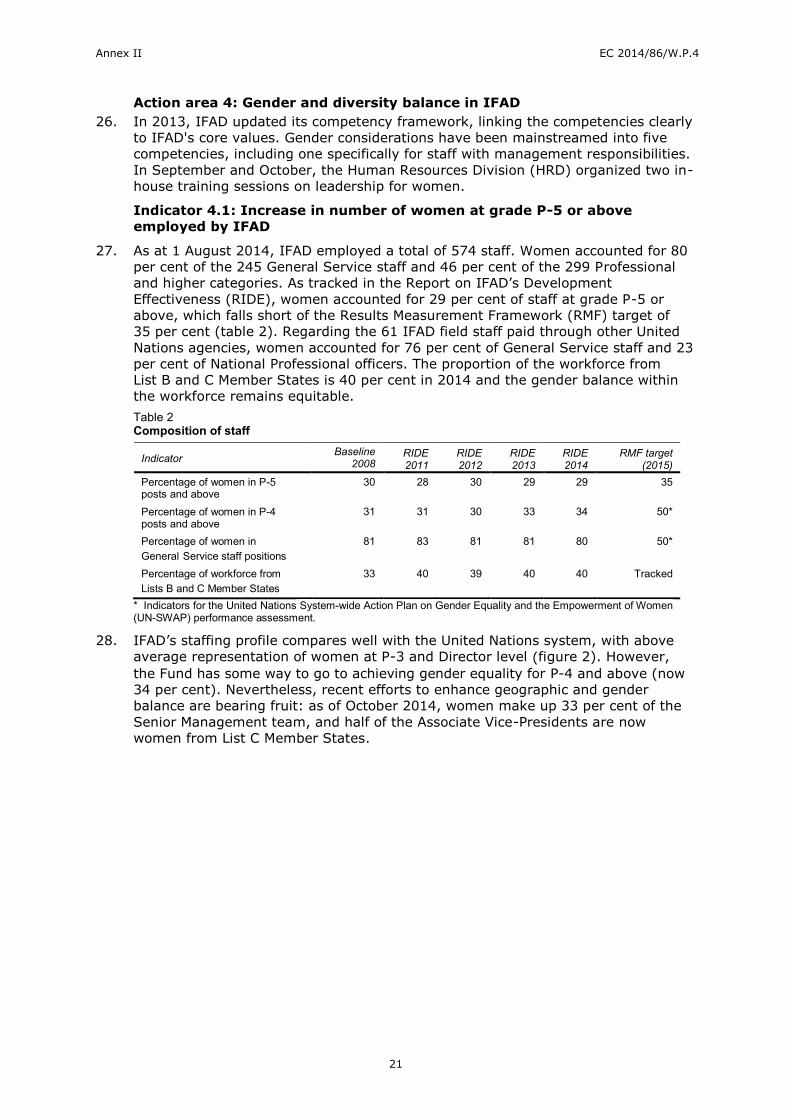
Report on IFAD’s DevelopmentEffectiveness
EC 2014/86/W.P.4
i
Contents
Abbreviations and acronyms iiSummary and conclusions iiiI. Introduction 1II. Global trends in poverty, hunger and agriculture 2III. IFAD’s contribution to development outcomes and impact 3IV. IFAD’s contribution to country programme and project outputs 5V. Operational effectiveness of country programmes and projects 6VI. Institutional effectiveness and efficiency 9
AnnexesI. IFAD9 Commitment Report 11II. Annual Report on IFAD Policy on Gender Equality and Women’s
Empowerment 16III. Implementation of the Istanbul Programme of Action for Least Developed
Countries 25IV. Annual report on quality assurance in IFAD’s projects and programmes 27V. Progress report on the Adaptation for Smallholder Agriculture Programme 31VI. Harmonized list of fragile states of those agreed on by multilateral
development banks and the Organisation for Economic Co-operation andDevelopment 38
EC 2014/86/W.P.4
ii
Abbreviations and acronyms
APR Asia and the Pacific DivisionASAP Adaptation for Smallholder Agriculture ProgrammeBOD Budget and Organizational Development UnitCALIP Climate Adaptation and Livelihood Protection ProjectCCAFS Climate Change, Agriculture and Food SecuriyCFS Committee on World Food SecurityCGIAR Consultative Group of International Agricultural ResearchCOM Communications DivisionCOSOP country strategic opportunities programmeCPM country programme managerCPO country programme officerCPMT country programme management teamCSSG Corporate Services Support GroupDSF Debt Sustainability FrameworkECD Environment and Climate DivisionEFA economic and financial analysisETH Ethics OfficeFAO Food and Agriculture Organization of the United NationsGEF Global Environment FacilityGIS Geographic Information SystemsHRD Human Resources DivisionIFPRI International Food Policy Research InstituteKfW KfW Development BankIEE Independent External Evaluation of IFADIFAD9 Ninth Replenishment of IFAD’s ResourcesIOE Independent Office of Evaluation of IFADIPoA Istanbul Programme of ActionIWD International Women’s dayLDC least developed countriesMDG Millennium Development GoalM&E monitoring and evaluationMOPAN Multilateral Organisation Performance Assessment NetworkODA official development assistanceOECD Organisation of Economic Co-operation and DevelopmentPoLG programme of loans and grantsPCR project completion reportPMD Programme Management DepartmentPRM Partnership and Resource Mobilization OfficePTA Policy and Technical Advisory DivisionQA quality assuranceQE quality enhancementRBA United Nations Rome-based AgenciesRB-COSOP results-based country strategic opportunities paperRIDE Report on IFAD’s Development EffectivenessRIMS Results and Impact Management SystemRMF Results Measurement FrameworkSECAP Environmental and Climate Assessment ProcessSIDS small island developing statesSKD Strategy and Knowledge DepartmentSSD Statistics and Studies DivisionUN-SWAP UN System-wide Action Plan on Gender Equality and the Empowerment
of WomenWCA West and Central Africa DivisionWEAI Women’s Empowerment in Agriculture IndexWFP World Food Programme
EC 2014/86/W.P.4
iii
Summary and conclusions
1. This is the second Report on IFAD’s Development Effectiveness (RIDE) in the NinthReplenishment of IFAD’s Resources (IFAD9) period (2013-2015). The RIDE’s mainpurpose is to report on performance against indicators contained in the IFAD9Results Measurement Framework (RMF) and the implementation of IFAD9commitments.1 In line with Executive Board requests to streamline performancereporting, the RIDE also reviews implementation progress relative to the IFADPolicy on Gender Equality and Women’s Empowerment, the Adaptation forSmallholder Agriculture Programme (ASAP), the quality assurance of IFAD'sprojects and programmes, and the Istanbul Programme of Action for LeastDeveloped Countries.
2. Significant commitments were undertaken for the IFAD9 period to strengthen andmore clearly demonstrate the Fund’s impact, especially in reducing poverty.Substantial progress has been made towards conducting the agreed 30 impactevaluations by 2015, and in enhancing the impact assessment component of IFAD’sself-evaluation system. The in-depth understanding gained of the impact of IFAD-supported interventions on poor rural peoples’ livelihoods will be invaluable toensuring that IFAD is fit for purpose in the post-2015 era, where the eradication ofpoverty, hunger and malnutrition will be central goals, and knowledge of effectiveapproaches to sustainable agriculture and rural development that benefit thepoorest people will be critical to their achievement.
3. Drawing on established measures of outcome and impact achievement in the RMF,this year’s RIDE shows that on the whole performance of IFAD-supportedprogrammes is at its highest ever, and some 2015 targets have already been met.Notably, this is the case for indicators of rural poverty impact, sustainability, genderequality, replication and scaling up, environment and natural resource management,and efficiency. These results are very encouraging, given that improvements inthese areas are essential to spurring vibrant and inclusive social and economicdevelopment in rural areas.
4. Although the 2015 target for project efficiency was surpassed this year,performance in this area needs to improve. Efforts in this direction are alreadyunder way, underpinned by implementation of the IFAD Consolidated Action Plan toEnhance Operational and Institutional Efficiency,2 endorsed by the Executive Boardin September 2013. Performance of projects in fragile states continues to berelatively weaker across-the-board, reconfirming the need for special attention toprojects in these countries, which IFAD is pursuing, inter alia, through aprogramme with the Food and Agriculture Organization of the United Nations (FAO)that focuses on addressing implementation issues in poorly performing projects insuch countries and contexts.
5. Total beneficiary outreach for projects under implementation in 2013 rose to about98.6 million, from 78.7 million in 2012 (an increase of 25 per cent), exceeding the2015 target of 90 million. The male:female ratio of beneficiaries is stable at 52:48,reflecting a high share of women beneficiaries. Similar to last year, rural financeprojects – which are critical in fostering financial inclusion and strengtheningbeneficiaries’ investment capacity – continue to have the highest outreach andshare of women beneficiaries. Significant increases were also recorded formarketing- and microenterprise-related indicators, arising from the increased focuson linking smallholders to markets through value chain projects.
1 The IFAD9 Commitment Matrix and Results Measurement Framework 2013-2015 are presented in annexes I and IIrespectively of the Report of the Consultation on the Ninth Replenishment of IFAD’s Resources (GC 35/L.4), approvedat the thirty-fifth session of the Governing Council in February 2012.2 Document EB 2013/109/R.12.
EC 2014/86/W.P.4
iv
6. IFAD’s performance as a partner at the country level improved (generallycorroborated by client survey results), reflecting the impact of reforms such asdirect supervision and decentralization introduced in recent years, which arehelping IFAD engage in partnership-building and policy dialogue activities atnational level more systematically. The overall quality of project design continues tobe strong; ratings for projects in fragile states and all other dimensions assessedhave improved; 2015 targets for monitoring and evaluation (M&E) and scaling uphave been exceeded. This year’s results with respect to portfolio management aresomewhat mixed. Time from project approval to first disbursement is stable, whileperformance relative to disbursement and withdrawal application processing timehas slid from last year, largely due to the transition to the new Loans and GrantsSystem (Flexcube) in October 2013, which gave rise to temporary delays. Remedialactions are being taken and improved performance is expected next year. On theother hand, project time overrun has been reduced to well below the 2015 target,reflecting IFAD Management’s more rigorous approach to project extensions.Project M&E-related indicators also show good progress, especially with regard tothe conduct of baseline surveys; improvements in this area owe a lot to theimpetus generated by the major focus on impact evaluation in IFAD9.
7. Pledges towards IFAD9 stand at a record high in absolute terms (US$1.42 billion)and relative to the target of US$1.5 billion (95 per cent). These figures includepledges of US$353 million for the ASAP, making it the largest global climate changeadaptation programme for smallholder farmers. The cofinancing ratio stands at1.22, down from last year, but by and large in line with long-term trends.Recognizing the value of cofinancing, particularly its contribution to scaling up,resource mobilization efforts have been significantly stepped up; however, meetingthe 2015 target will be challenging. While not representing cofinancing per se, therecent approval by the Executive Board of the framework agreement with KfWDevelopment Bank is an important advance in IFAD’s resource mobilization efforts.
8. A number of important human resources initiatives were implemented this year;the reward and recognition framework (an IFAD9 commitment) is the most notableone; akin to a pay-for-performance system, it represents an innovative modelwithin the United Nations system. The share of planned positions in IFAD countryoffices continues to rise reflecting IFAD’s push for decentralization. Recent efforts toenhance geographic and gender balance are bearing fruit: women make up 33 percent of the Senior Management team (half of the Associate Vice-Presidents are nowwomen); and half of the Senior Management team are from List B or C MemberStates. In line with IFAD9 commitments, efforts have been made to achieve cost-savings in various areas, and new efficiency indicators for key business processeswere developed to facilitate the identification of future opportunities forstreamlining. While results for some efficiency indicators are by and largeunchanged from last year (in part due to upfront expenditures related to theConsolidated Action Plan), the ratio of IFAD’s administrative budget to the plannedprogramme of loans and grants for 2015 shows notable improvement.
EC 2014/86/W.P.4
1
Report on IFAD’s Development EffectivenessI. Introduction1. The Report on IFAD’s Development Effectiveness (RIDE) is the principal mechanism
for communicating the Fund’s performance on the Results MeasurementFramework (RMF) 2013-2015 and the Commitment Matrix of the NinthReplenishment of IFAD’s Resources (IFAD9) to its governing bodies. Progresstowards meeting RMF targets is reported in sections II-VI below, and the status ofIFAD9 commitments is summarized in annex I. In line with Executive Boardrequests to streamline performance reporting, the following four reports areincluded as annexes II-V respectively: Annual Report on IFAD Policy on GenderEquality and Women’s Empowerment; Implementation of the Istanbul Programmeof Action for Least Developed Countries; Annual Report on Quality Assurance ofIFAD's Projects and Programmes; and Progress Report on the Adaptation forSmallholder Agriculture Programme.3
2. The RMF is organized in five levels. Each level assesses a different dimension ofperformance:
Level 1 tracks global progress in meeting the first Millennium DevelopmentGoal (MDG 1) targets for reducing poverty and hunger, together with officialdevelopment assistance (ODA) to, and public investment and productivity in,the agriculture sector (annexes I and II);
Level 2 indicators, discussed in section III, address the performance ofIFAD-supported projects at completion. These are considered relativelystrong indicators of impact on poverty and food insecurity. Responsibility forresults achieved is shared by client governments, other partners accountablefor project implementation and IFAD. These assessments are based onproject completion reports (PCRs) prepared by client governments, to whichratings are assigned through an internal IFAD review process. Since 2011,PCR ratings have been validated by the Independent Office of Evaluation ofIFAD (IOE). The difference between IFAD and IOE ratings (also known as the“disconnect”) is relatively small, especially for the critical measure of “ruralpoverty impact”;
Level 3 indicators, discussed in section IV, measure the number ofbeneficiaries reached and the outputs delivered through active projects.Responsibility for performance in this area is shared with client governmentsand other implementing partners, and is reported directly by the projectsthrough IFAD’s Results and Impact Management System (RIMS). Sinceoutputs vary according to the type of project, most indicators are trackedrather than targeted. A key exception is the number of people reached; and
Level 4 and 5 indicators, discussed in sections V and VI, involve variablesthat are more under the control of IFAD itself and more directly express itsmanagement performance. They are about what IFAD does to maximizeprogramme outcomes and impact and raise its value for money, in terms notonly of results but also of cost, timeliness and use of human resources.Several indicators are reported by external parties or at arm’s length, forexample by the Quality Assurance Group for project quality at entry, andthrough client surveys for country programme performance.
3 Principal authors of the annexes are: Jin Chung Kim, Partnership Officer, PRM (annex I); Clare Bishop-Sambrook,Lead Technical Specialist (Gender and Social Inclusion), PTA (annex II); Constanza Di Nucci, Researcher, SSD (annexIII); Kristofer Hamel, Programme Officer, QAG (annex IV); and Gernot Laganda, Officer-in-Charge, ECD (annex V).
EC 2014/86/W.P.4
2
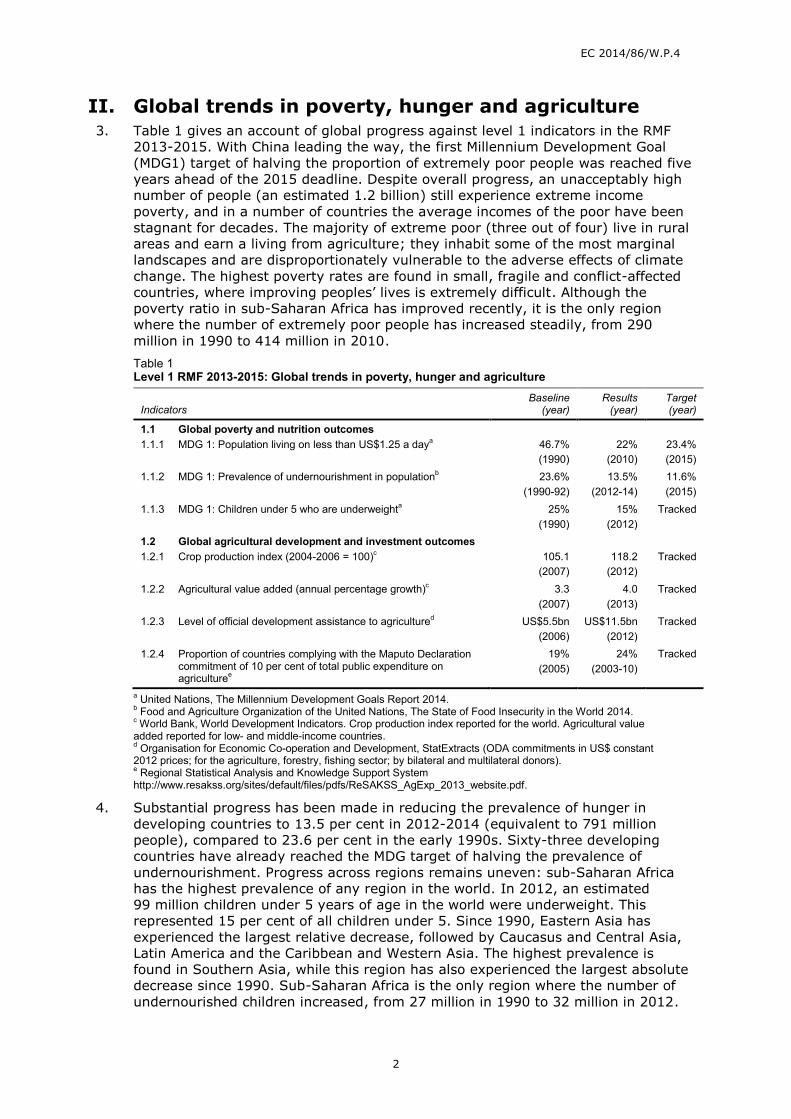
II. Global trends in poverty, hunger and agriculture3. Table 1 gives an account of global progress against level 1 indicators in the RMF
2013-2015. With China leading the way, the first Millennium Development Goal(MDG1) target of halving the proportion of extremely poor people was reached fiveyears ahead of the 2015 deadline. Despite overall progress, an unacceptably highnumber of people (an estimated 1.2 billion) still experience extreme incomepoverty, and in a number of countries the average incomes of the poor have beenstagnant for decades. The majority of extreme poor (three out of four) live in ruralareas and earn a living from agriculture; they inhabit some of the most marginallandscapes and are disproportionately vulnerable to the adverse effects of climatechange. The highest poverty rates are found in small, fragile and conflict-affectedcountries, where improving peoples’ lives is extremely difficult. Although thepoverty ratio in sub-Saharan Africa has improved recently, it is the only regionwhere the number of extremely poor people has increased steadily, from 290million in 1990 to 414 million in 2010.Table 1Level 1 RMF 2013-2015: Global trends in poverty, hunger and agriculture
IndicatorsBaseline
(year)Results
(year)Target(year)
1.1 Global poverty and nutrition outcomes1.1.1 MDG 1: Population living on less than US$1.25 a daya 46.7%
(1990)22%
(2010)23.4%(2015)
1.1.2 MDG 1: Prevalence of undernourishment in populationb 23.6%(1990-92)
13.5%(2012-14)
11.6%(2015)
1.1.3 MDG 1: Children under 5 who are underweighta 25%(1990)
15%(2012)
Tracked
1.2 Global agricultural development and investment outcomes1.2.1 Crop production index (2004-2006 = 100)c 105.1
(2007)118.2
(2012)Tracked
1.2.2 Agricultural value added (annual percentage growth)c 3.3(2007)
4.0(2013)
Tracked
1.2.3 Level of official development assistance to agricultured US$5.5bn(2006)
US$11.5bn(2012)
Tracked
1.2.4 Proportion of countries complying with the Maputo Declarationcommitment of 10 per cent of total public expenditure onagriculturee
19%(2005)
24%(2003-10)
Tracked
a United Nations, The Millennium Development Goals Report 2014.b Food and Agriculture Organization of the United Nations, The State of Food Insecurity in the World 2014.c World Bank, World Development Indicators. Crop production index reported for the world. Agricultural valueadded reported for low- and middle-income countries.d Organisation for Economic Co-operation and Development, StatExtracts (ODA commitments in US$ constant2012 prices; for the agriculture, forestry, fishing sector; by bilateral and multilateral donors).e Regional Statistical Analysis and Knowledge Support Systemhttp://www.resakss.org/sites/default/files/pdfs/ReSAKSS_AgExp_2013_website.pdf.
4. Substantial progress has been made in reducing the prevalence of hunger indeveloping countries to 13.5 per cent in 2012-2014 (equivalent to 791 millionpeople), compared to 23.6 per cent in the early 1990s. Sixty-three developingcountries have already reached the MDG target of halving the prevalence ofundernourishment. Progress across regions remains uneven: sub-Saharan Africahas the highest prevalence of any region in the world. In 2012, an estimated99 million children under 5 years of age in the world were underweight. Thisrepresented 15 per cent of all children under 5. Since 1990, Eastern Asia hasexperienced the largest relative decrease, followed by Caucasus and Central Asia,Latin America and the Caribbean and Western Asia. The highest prevalence isfound in Southern Asia, while this region has also experienced the largest absolutedecrease since 1990. Sub-Saharan Africa is the only region where the number ofundernourished children increased, from 27 million in 1990 to 32 million in 2012.
EC 2014/86/W.P.4
3
5. Agricultural growth in low- and middle-income countries has been steady over thelast few years with an annual growth of 4 per cent in agricultural value added. Thecrop production index for these countries stands at 125 compared to a worldwidefigure of 118. According to the OECD-FAO Agricultural Outlook 2014-2023,developing countries will remain the epicentre of most agricultural productiongrowth, accounting for more than 75 per cent of additional agricultural output overthe next decade. Expected growth rates are also promising for crop production, yetlower than those projected for livestock and biofuel production.
6. Following several years of decline, in recent years official development assistance(ODA) to agriculture increased steadily and significantly in absolute terms (fromUS$5.5 billion in 2006 to US$11.5 billion in 2012), as well as in share of totalsector allocable ODA (from 6 per cent to 8.2 per cent over the same period). Since2003, when the Maputo Declaration on Agriculture and Food Security in Africa wasadopted, public agriculture expenditure in Africa as a whole has increased, but at aslower pace than the growth in total expenditures. By 2010, 13 out of 54 Africancountries (24 per cent) had surpassed the target of allocating 10 per cent ofnational budgets to the agricultural sector.
III. IFAD’s contribution to development outcomes andimpact
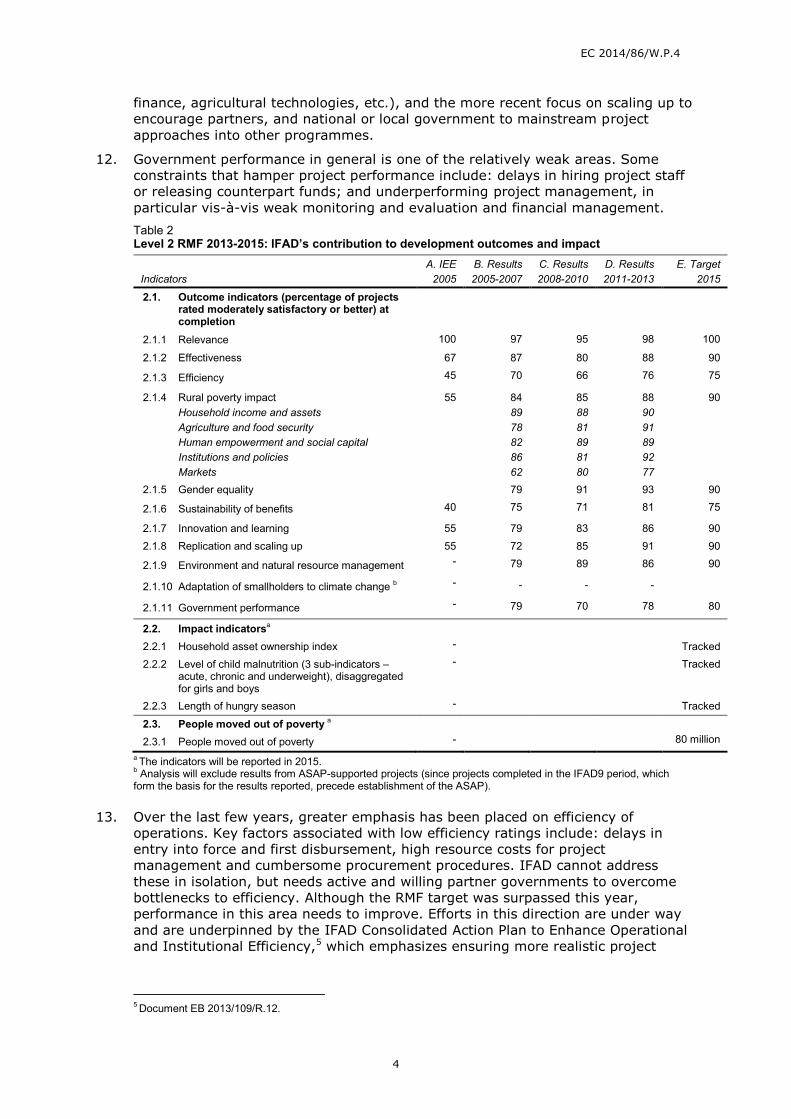
7. Table 2 summarizes progress against level 2 indicators in the RMF 2013-2015.Data are presented according to project completion date, and grouped into three-year cohorts, providing a firmer basis for assessing performance and trends.4 Thenumber of projects per cohort is as follows: 2005-2007 (58), 2008-2010 (66),2011-2013 (59), equivalent to a total 183 projects. Importantly, all were designedor approved prior to the introduction of key business model reforms launched in2006 following the 2005 Independent External Evaluation of IFAD (IEE).
8. Overall, results for projects completed in 2011-2013 (column D) stand at theirhighest ever, and in many cases 2015 targets (column E) have almost, or alreadybeen reached. These results represent improvements ranging from about 33 percent to more than 100 per cent over the 2005 IEE.
9. Targets for gender equality and sustainability of benefits have been exceeded.Success factors included: a gender mainstreamed approach during projectimplementation, in terms of both activities and operational aspects. Thesustainability indicator shows the largest improvement, more than 100 per centcompared to the 2005 IEE rating. Combined with the consistently strongperformance on rural poverty impact, and improving performance on environmentand natural resource management, the data suggest that IFAD-supported projectsare meaningfully contributing to inclusive and sustainable (in all its threedimensions) development.
10. Improvements relative to rural poverty impact and environment and naturalresource management have been highlighted in recent Annual Reports on Resultsand Impact of IFAD Operations (ARRIs). Among the rural poverty impact sub-indictors, agricultural and food security improved most evidently, and institutionsand policies is the domain with the strongest rating. Access to markets is thelowest-ranked domain, principally because it did not feature as a prominent aspectof designs until relatively recently.
11. Performance with respect to replication and scaling up has strengthenedconsiderably. This improved performance can be partially attributed to the fact thatIFAD projects often adopt features that are innovative at the local level (rural
4 Presenting data according to the year in which projects were completed ensures alignment with practice in the ARRI.In past years, data in the RIDE were presented according to the year project completion reports were received. Thus,data in this RIDE are not exactly comparable to data in last year’s report.
EC 2014/86/W.P.4
4
finance, agricultural technologies, etc.), and the more recent focus on scaling up toencourage partners, and national or local government to mainstream projectapproaches into other programmes.
12. Government performance in general is one of the relatively weak areas. Someconstraints that hamper project performance include: delays in hiring project staffor releasing counterpart funds; and underperforming project management, inparticular vis-à-vis weak monitoring and evaluation and financial management.Table 2Level 2 RMF 2013-2015: IFAD’s contribution to development outcomes and impact
IndicatorsA. IEE
2005B. Results2005-2007
C. Results2008-2010
D. Results2011-2013
E. Target2015
2.1. Outcome indicators (percentage of projectsrated moderately satisfactory or better) atcompletion
2.1.1 Relevance 100 97 95 98 100
2.1.2 Effectiveness 67 87 80 88 90
2.1.3 Efficiency 45 70 66 76 75
2.1.4 Rural poverty impactHousehold income and assetsAgriculture and food securityHuman empowerment and social capitalInstitutions and policiesMarkets
55 848978828662
858881898180
889091899277
90
2.1.5 Gender equality 79 91 93 90
2.1.6 Sustainability of benefits 40 75 71 81 75
2.1.7 Innovation and learning 55 79 83 86 902.1.8 Replication and scaling up 55 72 85 91 90
2.1.9 Environment and natural resource management - 79 89 86 90
2.1.10 Adaptation of smallholders to climate change b - - - -
2.1.11 Government performance - 79 70 78 80
2.2. Impact indicatorsa
2.2.1 Household asset ownership index - Tracked2.2.2 Level of child malnutrition (3 sub-indicators –
acute, chronic and underweight), disaggregatedfor girls and boys
- Tracked
2.2.3 Length of hungry season - Tracked
2.3. People moved out of poverty a
2.3.1 People moved out of poverty - 80 milliona The indicators will be reported in 2015.b Analysis will exclude results from ASAP-supported projects (since projects completed in the IFAD9 period, whichform the basis for the results reported, precede establishment of the ASAP).
13. Over the last few years, greater emphasis has been placed on efficiency ofoperations. Key factors associated with low efficiency ratings include: delays inentry into force and first disbursement, high resource costs for projectmanagement and cumbersome procurement procedures. IFAD cannot addressthese in isolation, but needs active and willing partner governments to overcomebottlenecks to efficiency. Although the RMF target was surpassed this year,performance in this area needs to improve. Efforts in this direction are under wayand are underpinned by the IFAD Consolidated Action Plan to Enhance Operationaland Institutional Efficiency,5 which emphasizes ensuring more realistic project
5 Document EB 2013/109/R.12.
EC 2014/86/W.P.4
5
designs, clearer institutional arrangements, timely deployment and high-qualityproject management teams.
14. As noted in previous RIDEs and ARRIs, IFAD-supported projects are largely aimedat the poorest people in remote and disadvantaged regions (often characterized byvery limited local-level institutional capacities and resources). This makesoperations challenging and costly; and achievement of effectiveness, sustainabilityand efficiency objectives simultaneously is undeniably complex in such contexts.Furthermore, a large share of IFAD-funded operations are located in fragile states.In 2013, IFAD developed a consolidated list of fragile countries using data frompartner institutions. With respect to the list of 48 countries considered fragile in2013, five have been added and four have been removed, bringing the total to 49in 2014 (see annex VI). About one third of projects assessed were in countriesconsidered fragile, thus this aspect weighs quite heavily on reported performance.
15. Projects in fragile states underperform compared to ones in non-fragile states in allareas. It is generally recognized that most fragile states are characterized by weakinstitutions. This is reflected in indicators related to efficiency and institutions andpolicies, which are the weakest overall, and significantly affect overall performanceof projects in fragile states. Overly complex project design, weak implementinginstitutions, a volatile context and security-related issues in fragile states (but alsofragile areas within non-fragile states) present challenges to fulfilment of projectsupervision and implementation functions and undermine the sustainability ofproject benefits.
16. Ratings of moderately satisfactory or better performance relative to policies andinstitutions for projects in fragile states are deteriorating, and the differential withnon-fragile states is widening. This reconfirms the need for special attention tostrengthening governance and institutional capacity within projects in fragile states.Towards this, IFAD launched a grant programme late last year with FAO mainlytargeting projects in fragile states; the programme became effective in 2014 andwill constitute an important mechanism to build capacities and strengthen projectperformance in fragile states, and provide lessons for the design of future projectsin such situations.
IV. IFAD’s contribution to country programme andproject outputs
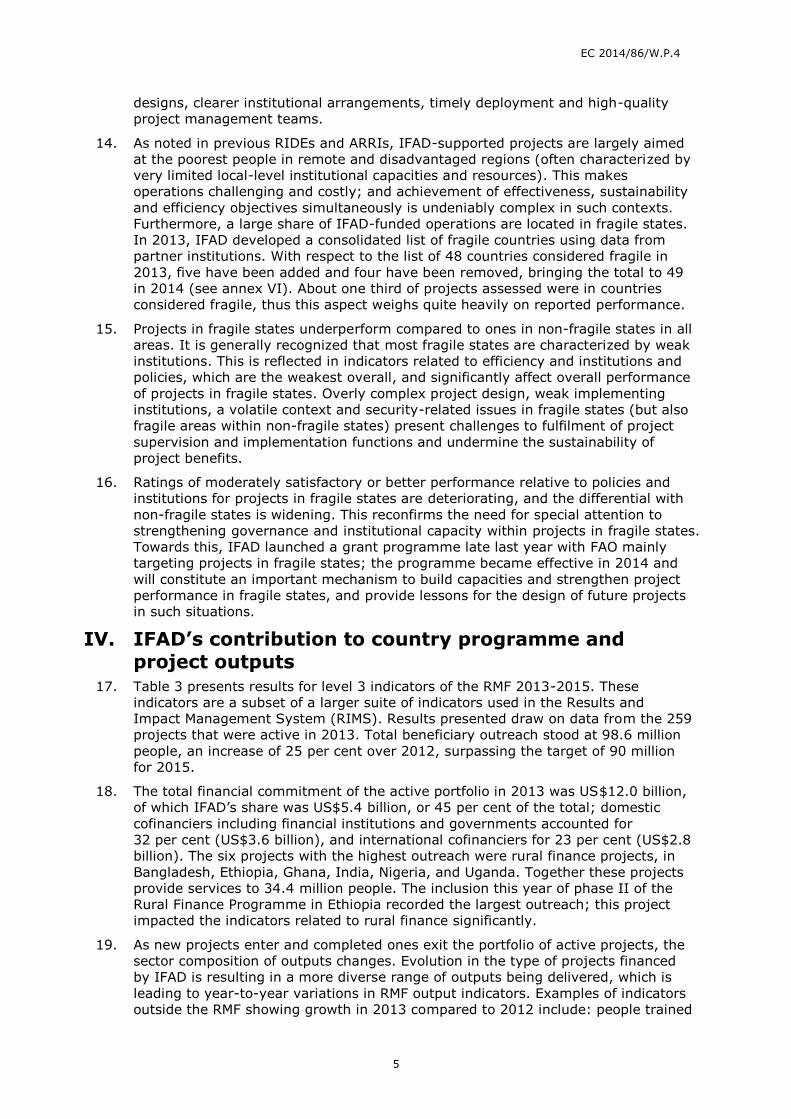
17. Table 3 presents results for level 3 indicators of the RMF 2013-2015. Theseindicators are a subset of a larger suite of indicators used in the Results andImpact Management System (RIMS). Results presented draw on data from the 259projects that were active in 2013. Total beneficiary outreach stood at 98.6 millionpeople, an increase of 25 per cent over 2012, surpassing the target of 90 millionfor 2015.
18. The total financial commitment of the active portfolio in 2013 was US$12.0 billion,of which IFAD’s share was US$5.4 billion, or 45 per cent of the total; domesticcofinanciers including financial institutions and governments accounted for32 per cent (US$3.6 billion), and international cofinanciers for 23 per cent (US$2.8billion). The six projects with the highest outreach were rural finance projects, inBangladesh, Ethiopia, Ghana, India, Nigeria, and Uganda. Together these projectsprovide services to 34.4 million people. The inclusion this year of phase II of theRural Finance Programme in Ethiopia recorded the largest outreach; this projectimpacted the indicators related to rural finance significantly.
19. As new projects enter and completed ones exit the portfolio of active projects, thesector composition of outputs changes. Evolution in the type of projects financedby IFAD is resulting in a more diverse range of outputs being delivered, which isleading to year-to-year variations in RMF output indicators. Examples of indicatorsoutside the RMF showing growth in 2013 compared to 2012 include: people trained
EC 2014/86/W.P.4
6
in natural resource management (NRM) (increased by some 24 per cent), people inNRM groups (up by about 11 per cent), processing facilitiesconstructed/rehabilitated (up by 64 per cent) and market facilitiesconstructed/rehabilitated (up by 75 per cent). Increases in the latter two indicatorsand those on marketing and microenterprises in table 3 are the result of the risingshare of value chain projects in the portfolio, while the increases in the indicatorsrelated to NRM indicate greater attention to environment and climate issues.
20. The strong performance of policies and institutions indicators, along with thecontinuing high overall share of women beneficiaries, reflect the successfulimplementation of IFAD’s policies and approaches to gender mainstreaming,targeting and inclusive development.Table 3Level 3 RMF 2013-2015: IFAD's contribution to country programme and project outputs
Indicators Baseline value *Results 2013
Natural resource management3.1 Common-property-resource land under improved
management practices (hectares)5.5 million 4.1 million
3.2 Area under constructed/rehabilitated irrigation schemes(hectares)
373 thousand 277 thousand
Agricultural technologies3.3 People trained in crop production practices/technologies 4.51 million 3.48 million
Male:female ratio 65:35 51:493.4 People trained in livestock production
practices/technologies1.2 million 2.91 million
Male:female ratio (percentage) 44:56 57:43Rural financial services3.5 Voluntary savers (cumulative) 7.86 million 19.06 million
Male: female ratio 47:53 28:723.6 Active borrowers 2.70 million 6.23 million
Male: female ratio 43:57 41:593.7 Value of savings mobilized (cumulative) US$495 million US$1.43 billion3.8 Value of gross loan portfolio US$338 million US$2.04 billionMarketing3.9 Roads constructed/rehabilitated (kilometres) 17.6 thousand 20.12 thousand3.10 Marketing groups formed/strengthened 13.2 thousand 35.17 thousandMicroenterprises3.11 People trained in business and entrepreneurship 716 thousand 1.21 million
Male:female ratio (percentage) 39:61 24:763.12 Enterprises accessing facilitated non-financial services 57 thousand 87.81 thousandPolicies and institutions3.13 People trained in community management topics 2.13 million 1.83 million
Male:female ratio (percentage) 33:67 24:763.14 Village/community action plans prepared 28 thousand 42.65 thousand3.15 People receiving services from IFAD-supported projects
(number)59.1 million
(target 2015: 90 million)98.64 million
Male: female ratio (percentage) 52:48 52:48
Source: Office records.* All baseline values are as at 2010, except for people receiving services, which refers to 2011.
V. Operational effectiveness of country programmesand projects
21. Progress against level 4 indicators in the RMF 2013-2015 is presented in multipletables (4-8) reflecting the different streams of work they embody.
EC 2014/86/W.P.4
7
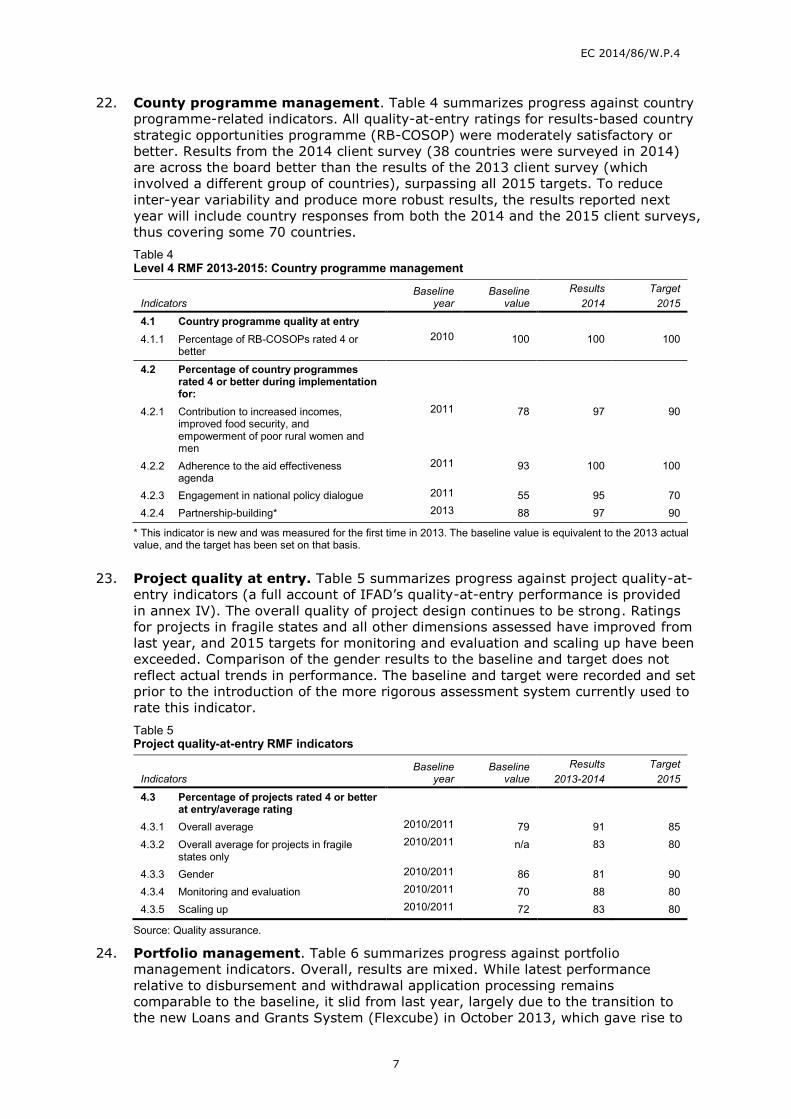
22. County programme management. Table 4 summarizes progress against countryprogramme-related indicators. All quality-at-entry ratings for results-based countrystrategic opportunities programme (RB-COSOP) were moderately satisfactory orbetter. Results from the 2014 client survey (38 countries were surveyed in 2014)are across the board better than the results of the 2013 client survey (whichinvolved a different group of countries), surpassing all 2015 targets. To reduceinter-year variability and produce more robust results, the results reported nextyear will include country responses from both the 2014 and the 2015 client surveys,thus covering some 70 countries.Table 4Level 4 RMF 2013-2015: Country programme management
IndicatorsBaseline
yearBaseline
valueResults
2014Target
2015
4.1 Country programme quality at entry4.1.1 Percentage of RB-COSOPs rated 4 or
better2010 100 100 100
4.2 Percentage of country programmesrated 4 or better during implementationfor:
4.2.1 Contribution to increased incomes,improved food security, andempowerment of poor rural women andmen
2011 78 97 90
4.2.2 Adherence to the aid effectivenessagenda
2011 93 100 100
4.2.3 Engagement in national policy dialogue 2011 55 95 704.2.4 Partnership-building* 2013 88 97 90
* This indicator is new and was measured for the first time in 2013. The baseline value is equivalent to the 2013 actualvalue, and the target has been set on that basis.
23. Project quality at entry. Table 5 summarizes progress against project quality-at-entry indicators (a full account of IFAD’s quality-at-entry performance is providedin annex IV). The overall quality of project design continues to be strong. Ratingsfor projects in fragile states and all other dimensions assessed have improved fromlast year, and 2015 targets for monitoring and evaluation and scaling up have beenexceeded. Comparison of the gender results to the baseline and target does notreflect actual trends in performance. The baseline and target were recorded and setprior to the introduction of the more rigorous assessment system currently used torate this indicator.Table 5Project quality-at-entry RMF indicators
IndicatorsBaseline
yearBaseline
valueResults
2013-2014Target
2015
4.3 Percentage of projects rated 4 or betterat entry/average rating
4.3.1 Overall average 2010/2011 79 91 854.3.2 Overall average for projects in fragile
states only2010/2011 n/a 83 80
4.3.3 Gender 2010/2011 86 81 904.3.4 Monitoring and evaluation 2010/2011 70 88 804.3.5 Scaling up 2010/2011 72 83 80
Source: Quality assurance.
24. Portfolio management. Table 6 summarizes progress against portfoliomanagement indicators. Overall, results are mixed. While latest performancerelative to disbursement and withdrawal application processing remainscomparable to the baseline, it slid from last year, largely due to the transition tothe new Loans and Grants System (Flexcube) in October 2013, which gave rise to
EC 2014/86/W.P.4
8
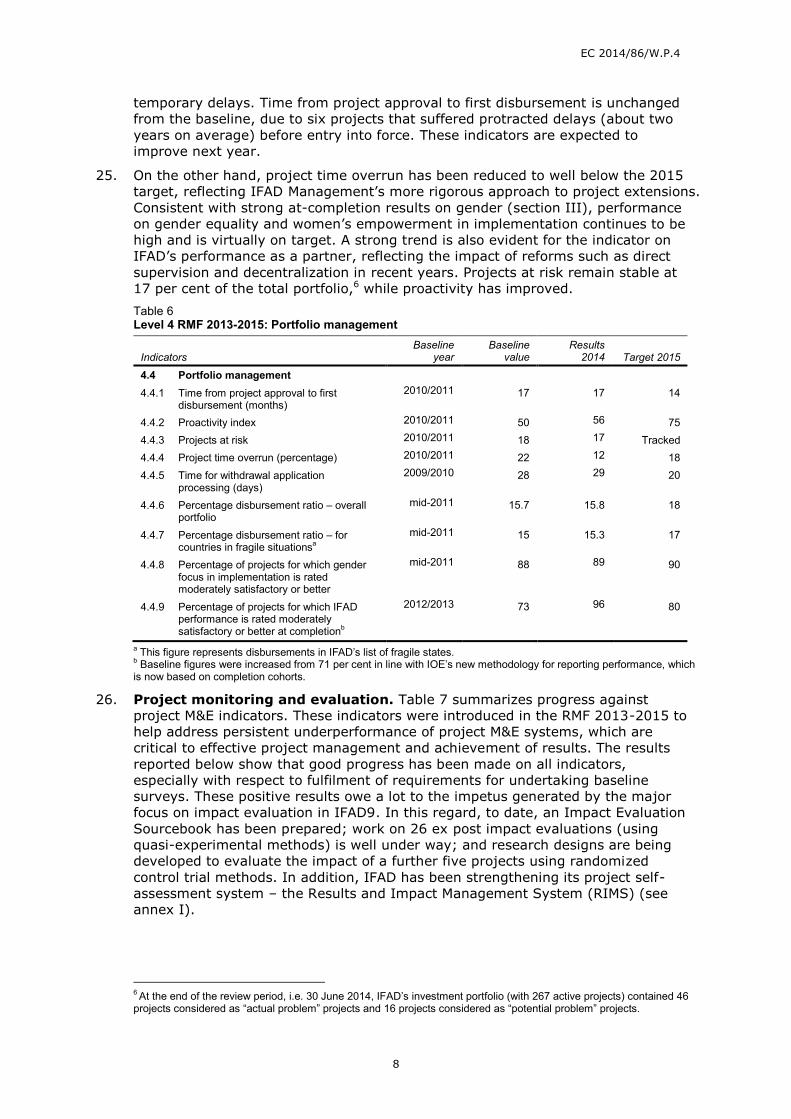
temporary delays. Time from project approval to first disbursement is unchangedfrom the baseline, due to six projects that suffered protracted delays (about twoyears on average) before entry into force. These indicators are expected toimprove next year.
25. On the other hand, project time overrun has been reduced to well below the 2015target, reflecting IFAD Management’s more rigorous approach to project extensions.Consistent with strong at-completion results on gender (section III), performanceon gender equality and women’s empowerment in implementation continues to behigh and is virtually on target. A strong trend is also evident for the indicator onIFAD’s performance as a partner, reflecting the impact of reforms such as directsupervision and decentralization in recent years. Projects at risk remain stable at17 per cent of the total portfolio,6 while proactivity has improved.Table 6Level 4 RMF 2013-2015: Portfolio management
IndicatorsBaseline
yearBaseline
valueResults
2014 Target 2015
4.4 Portfolio management4.4.1 Time from project approval to first
disbursement (months)2010/2011 17 17 14
4.4.2 Proactivity index 2010/2011 50 56 754.4.3 Projects at risk 2010/2011 18 17 Tracked4.4.4 Project time overrun (percentage) 2010/2011 22 12 184.4.5 Time for withdrawal application
processing (days)2009/2010 28 29 20
4.4.6 Percentage disbursement ratio – overallportfolio
mid-2011 15.7 15.8 18
4.4.7 Percentage disbursement ratio – forcountries in fragile situationsa
mid-2011 15 15.3 17
4.4.8 Percentage of projects for which genderfocus in implementation is ratedmoderately satisfactory or better
mid-2011 88 89 90
4.4.9 Percentage of projects for which IFADperformance is rated moderatelysatisfactory or better at completionb
2012/2013 73 96 80
a This figure represents disbursements in IFAD’s list of fragile states.b Baseline figures were increased from 71 per cent in line with IOE’s new methodology for reporting performance, whichis now based on completion cohorts.
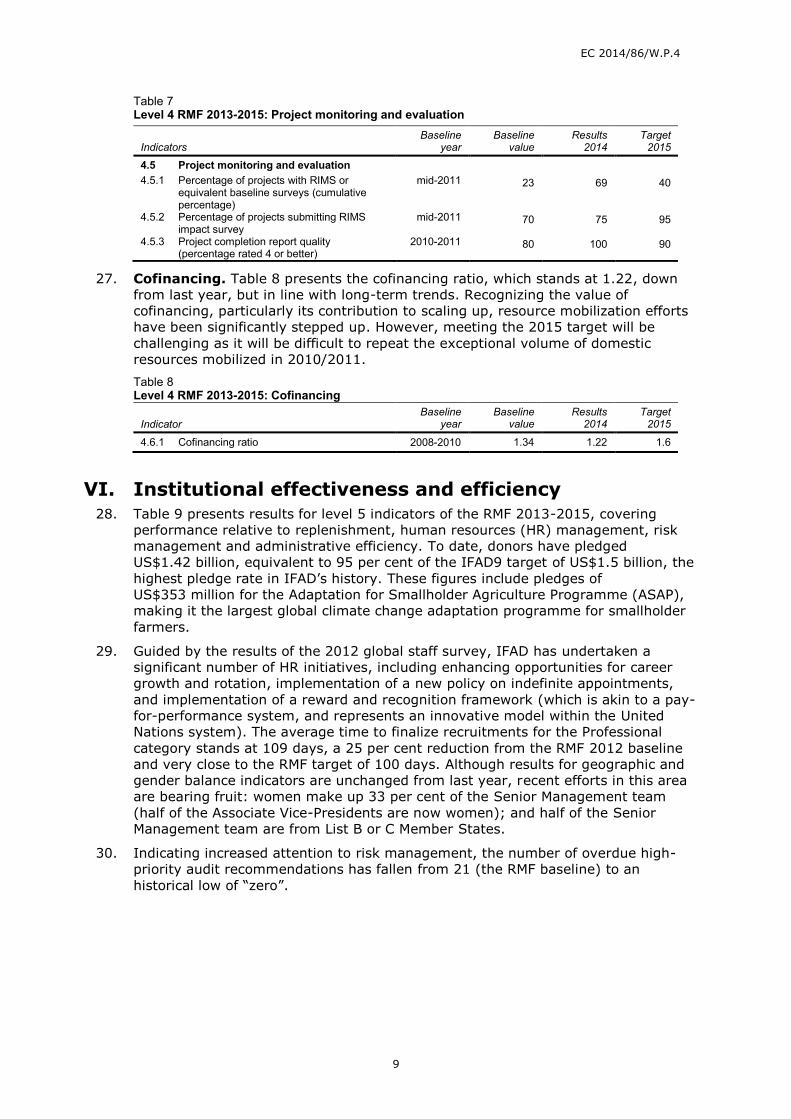
26. Project monitoring and evaluation. Table 7 summarizes progress againstproject M&E indicators. These indicators were introduced in the RMF 2013-2015 tohelp address persistent underperformance of project M&E systems, which arecritical to effective project management and achievement of results. The resultsreported below show that good progress has been made on all indicators,especially with respect to fulfilment of requirements for undertaking baselinesurveys. These positive results owe a lot to the impetus generated by the majorfocus on impact evaluation in IFAD9. In this regard, to date, an Impact EvaluationSourcebook has been prepared; work on 26 ex post impact evaluations (usingquasi-experimental methods) is well under way; and research designs are beingdeveloped to evaluate the impact of a further five projects using randomizedcontrol trial methods. In addition, IFAD has been strengthening its project self-assessment system – the Results and Impact Management System (RIMS) (seeannex I).
6 At the end of the review period, i.e. 30 June 2014, IFAD’s investment portfolio (with 267 active projects) contained 46projects considered as “actual problem” projects and 16 projects considered as “potential problem” projects.
EC 2014/86/W.P.4
9
Table 7Level 4 RMF 2013-2015: Project monitoring and evaluation
IndicatorsBaseline
yearBaseline
valueResults
2014Target
2015
4.5 Project monitoring and evaluation4.5.1 Percentage of projects with RIMS or
equivalent baseline surveys (cumulativepercentage)
mid-2011 23 69 40
4.5.2 Percentage of projects submitting RIMSimpact survey
mid-2011 70 75 95
4.5.3 Project completion report quality(percentage rated 4 or better)
2010-2011 80 100 90
27. Cofinancing. Table 8 presents the cofinancing ratio, which stands at 1.22, downfrom last year, but in line with long-term trends. Recognizing the value ofcofinancing, particularly its contribution to scaling up, resource mobilization effortshave been significantly stepped up. However, meeting the 2015 target will bechallenging as it will be difficult to repeat the exceptional volume of domesticresources mobilized in 2010/2011.Table 8Level 4 RMF 2013-2015: Cofinancing
IndicatorBaseline
yearBaseline
valueResults
2014Target
2015
4.6.1 Cofinancing ratio 2008-2010 1.34 1.22 1.6
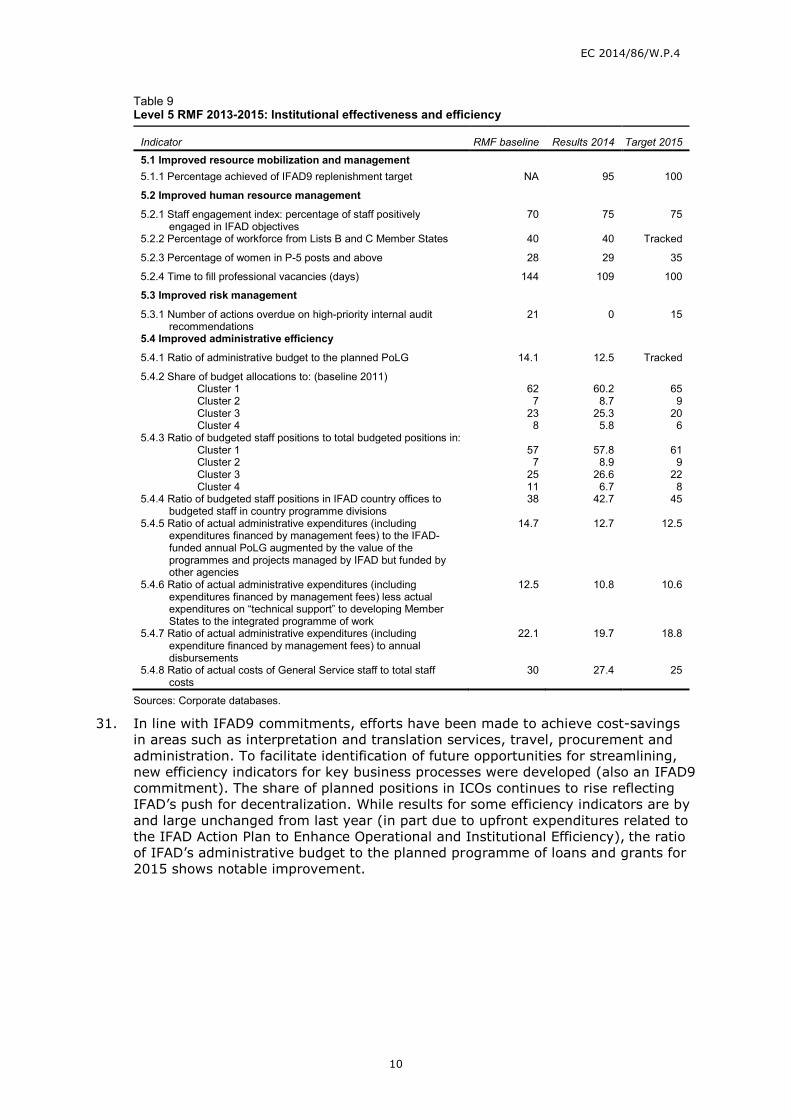
VI. Institutional effectiveness and efficiency28. Table 9 presents results for level 5 indicators of the RMF 2013-2015, covering
performance relative to replenishment, human resources (HR) management, riskmanagement and administrative efficiency. To date, donors have pledgedUS$1.42 billion, equivalent to 95 per cent of the IFAD9 target of US$1.5 billion, thehighest pledge rate in IFAD’s history. These figures include pledges ofUS$353 million for the Adaptation for Smallholder Agriculture Programme (ASAP),making it the largest global climate change adaptation programme for smallholderfarmers.
29. Guided by the results of the 2012 global staff survey, IFAD has undertaken asignificant number of HR initiatives, including enhancing opportunities for careergrowth and rotation, implementation of a new policy on indefinite appointments,and implementation of a reward and recognition framework (which is akin to a pay-for-performance system, and represents an innovative model within the UnitedNations system). The average time to finalize recruitments for the Professionalcategory stands at 109 days, a 25 per cent reduction from the RMF 2012 baselineand very close to the RMF target of 100 days. Although results for geographic andgender balance indicators are unchanged from last year, recent efforts in this areaare bearing fruit: women make up 33 per cent of the Senior Management team(half of the Associate Vice-Presidents are now women); and half of the SeniorManagement team are from List B or C Member States.
30. Indicating increased attention to risk management, the number of overdue high-priority audit recommendations has fallen from 21 (the RMF baseline) to anhistorical low of “zero”.
EC 2014/86/W.P.4
10
Table 9Level 5 RMF 2013-2015: Institutional effectiveness and efficiency
Indicator RMF baseline Results 2014 Target 2015
5.1 Improved resource mobilization and management5.1.1 Percentage achieved of IFAD9 replenishment target NA 95 100
5.2 Improved human resource management
5.2.1 Staff engagement index: percentage of staff positivelyengaged in IFAD objectives
70 75 75
5.2.2 Percentage of workforce from Lists B and C Member States 40 40 Tracked
5.2.3 Percentage of women in P-5 posts and above 28 29 35
5.2.4 Time to fill professional vacancies (days) 144 109 100
5.3 Improved risk management
5.3.1 Number of actions overdue on high-priority internal auditrecommendations
21 0 15
5.4 Improved administrative efficiency
5.4.1 Ratio of administrative budget to the planned PoLG 14.1 12.5 Tracked
5.4.2 Share of budget allocations to: (baseline 2011)Cluster 1Cluster 2Cluster 3Cluster 4
627
238
60.28.7
25.35.8
659
206
5.4.3 Ratio of budgeted staff positions to total budgeted positions in:Cluster 1Cluster 2Cluster 3Cluster 4
577
2511
57.88.9
26.66.7
619
228
5.4.4 Ratio of budgeted staff positions in IFAD country offices tobudgeted staff in country programme divisions
38 42.7 45
5.4.5 Ratio of actual administrative expenditures (includingexpenditures financed by management fees) to the IFAD-funded annual PoLG augmented by the value of theprogrammes and projects managed by IFAD but funded byother agencies
14.7 12.7 12.5
5.4.6 Ratio of actual administrative expenditures (includingexpenditures financed by management fees) less actualexpenditures on “technical support” to developing MemberStates to the integrated programme of work
12.5 10.8 10.6
5.4.7 Ratio of actual administrative expenditures (includingexpenditure financed by management fees) to annualdisbursements
22.1 19.7 18.8
5.4.8 Ratio of actual costs of General Service staff to total staffcosts
30 27.4 25
Sources: Corporate databases.
31. In line with IFAD9 commitments, efforts have been made to achieve cost-savingsin areas such as interpretation and translation services, travel, procurement andadministration. To facilitate identification of future opportunities for streamlining,new efficiency indicators for key business processes were developed (also an IFAD9commitment). The share of planned positions in ICOs continues to rise reflectingIFAD’s push for decentralization. While results for some efficiency indicators are byand large unchanged from last year (in part due to upfront expenditures related tothe IFAD Action Plan to Enhance Operational and Institutional Efficiency), the ratioof IFAD’s administrative budget to the planned programme of loans and grants for2015 shows notable improvement.
11
Annex I
EC 2014/86/W
.P.4
IFAD9 Commitment Report
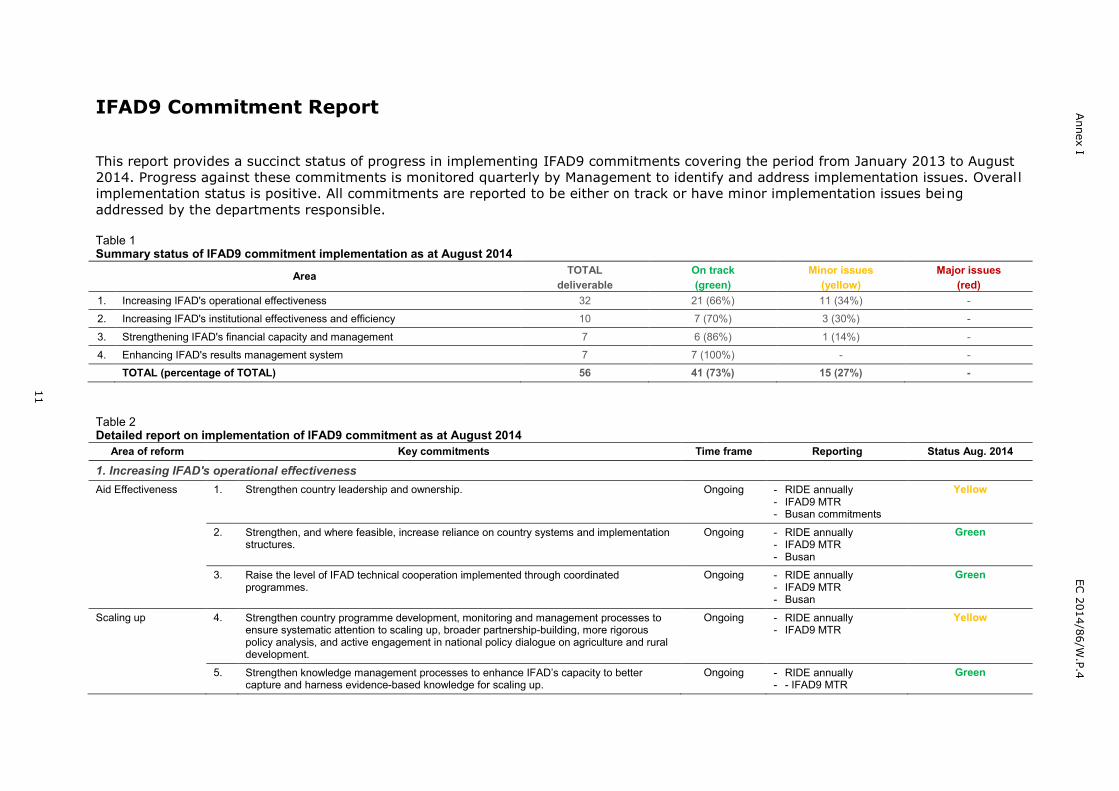
This report provides a succinct status of progress in implementing IFAD9 commitments covering the period from January 2013 to August2014. Progress against these commitments is monitored quarterly by Management to identify and address implementation issues. Overallimplementation status is positive. All commitments are reported to be either on track or have minor implementation issues beingaddressed by the departments responsible.
Table 1Summary status of IFAD9 commitment implementation as at August 2014
Area TOTALdeliverable
On track(green)
Minor issues(yellow)
Major issues(red)
1. Increasing IFAD's operational effectiveness 32 21 (66%) 11 (34%) -
2. Increasing IFAD's institutional effectiveness and efficiency 10 7 (70%) 3 (30%) -
3. Strengthening IFAD's financial capacity and management 7 6 (86%) 1 (14%) -
4. Enhancing IFAD's results management system 7 7 (100%) - -
TOTAL (percentage of TOTAL) 56 41 (73%) 15 (27%) -
Table 2Detailed report on implementation of IFAD9 commitment as at August 2014
Area of reform Key commitments Time frame Reporting Status Aug. 2014
1. Increasing IFAD's operational effectivenessAid Effectiveness 1. Strengthen country leadership and ownership. Ongoing - RIDE annually
- IFAD9 MTR- Busan commitments
Yellow
2. Strengthen, and where feasible, increase reliance on country systems and implementationstructures.
Ongoing - RIDE annually- IFAD9 MTR- Busan
Green
3. Raise the level of IFAD technical cooperation implemented through coordinatedprogrammes.
Ongoing - RIDE annually- IFAD9 MTR- Busan
Green
Scaling up 4. Strengthen country programme development, monitoring and management processes toensure systematic attention to scaling up, broader partnership-building, more rigorouspolicy analysis, and active engagement in national policy dialogue on agriculture and ruraldevelopment.
Ongoing - RIDE annually- IFAD9 MTR
Yellow
5. Strengthen knowledge management processes to enhance IFAD’s capacity to bettercapture and harness evidence-based knowledge for scaling up.
Ongoing - RIDE annually- - IFAD9 MTR
Green
12
Annex I
EC 2014/86/W
.P.4
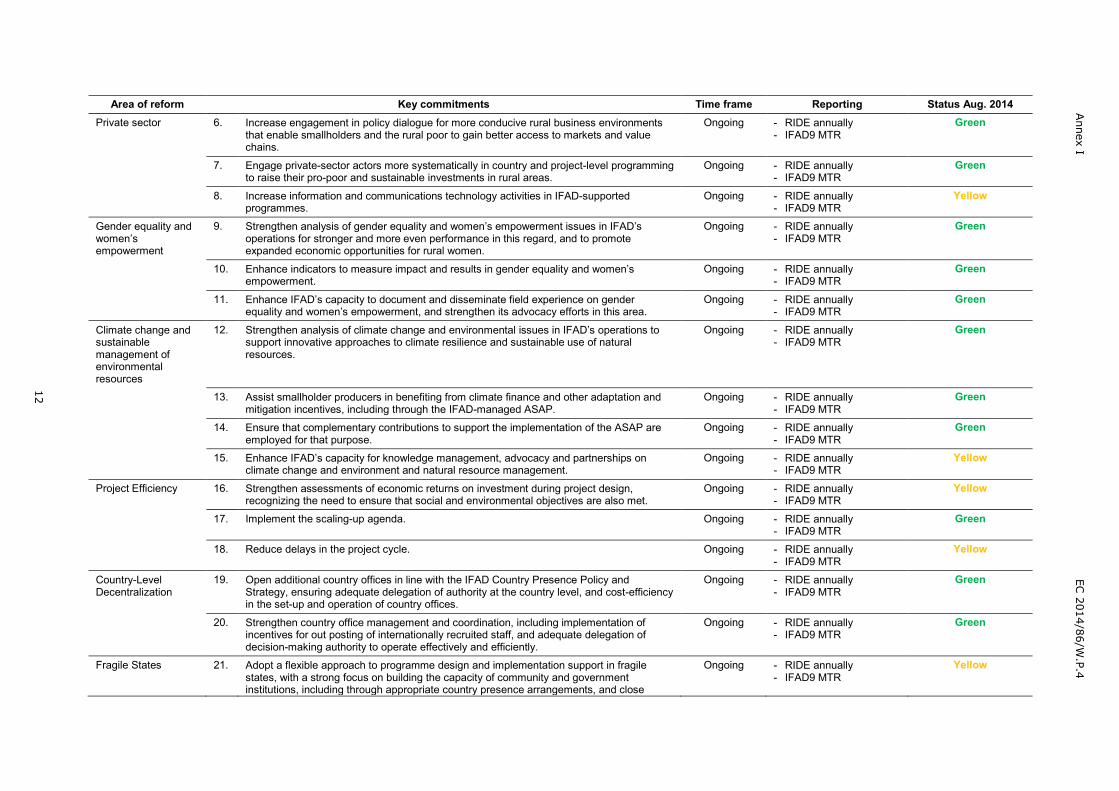
Area of reform Key commitments Time frame Reporting Status Aug. 2014Private sector 6. Increase engagement in policy dialogue for more conducive rural business environments
that enable smallholders and the rural poor to gain better access to markets and valuechains.
Ongoing - RIDE annually- IFAD9 MTR
Green
7. Engage private-sector actors more systematically in country and project-level programmingto raise their pro-poor and sustainable investments in rural areas.
Ongoing - RIDE annually- IFAD9 MTR
Green
8. Increase information and communications technology activities in IFAD-supportedprogrammes.
Ongoing - RIDE annually- IFAD9 MTR
Yellow
Gender equality andwomen’sempowerment
9. Strengthen analysis of gender equality and women’s empowerment issues in IFAD’soperations for stronger and more even performance in this regard, and to promoteexpanded economic opportunities for rural women.
Ongoing - RIDE annually- IFAD9 MTR
Green
10. Enhance indicators to measure impact and results in gender equality and women’sempowerment.
Ongoing - RIDE annually- IFAD9 MTR
Green
11. Enhance IFAD’s capacity to document and disseminate field experience on genderequality and women’s empowerment, and strengthen its advocacy efforts in this area.
Ongoing - RIDE annually- IFAD9 MTR
Green
Climate change andsustainablemanagement ofenvironmentalresources
12. Strengthen analysis of climate change and environmental issues in IFAD’s operations tosupport innovative approaches to climate resilience and sustainable use of naturalresources.
Ongoing - RIDE annually- IFAD9 MTR
Green
13. Assist smallholder producers in benefiting from climate finance and other adaptation andmitigation incentives, including through the IFAD-managed ASAP.
Ongoing - RIDE annually- IFAD9 MTR
Green
14. Ensure that complementary contributions to support the implementation of the ASAP areemployed for that purpose.
Ongoing - RIDE annually- IFAD9 MTR
Green
15. Enhance IFAD’s capacity for knowledge management, advocacy and partnerships onclimate change and environment and natural resource management.
Ongoing - RIDE annually- IFAD9 MTR
Yellow
Project Efficiency 16. Strengthen assessments of economic returns on investment during project design,recognizing the need to ensure that social and environmental objectives are also met.
Ongoing - RIDE annually- IFAD9 MTR
Yellow
17. Implement the scaling-up agenda. Ongoing - RIDE annually- IFAD9 MTR
Green
18. Reduce delays in the project cycle. Ongoing - RIDE annually- IFAD9 MTR
Yellow
Country-LevelDecentralization
19. Open additional country offices in line with the IFAD Country Presence Policy andStrategy, ensuring adequate delegation of authority at the country level, and cost-efficiencyin the set-up and operation of country offices.
Ongoing - RIDE annually- IFAD9 MTR
Green
20. Strengthen country office management and coordination, including implementation ofincentives for out posting of internationally recruited staff, and adequate delegation ofdecision-making authority to operate effectively and efficiently.
Ongoing - RIDE annually- IFAD9 MTR
Green
Fragile States 21. Adopt a flexible approach to programme design and implementation support in fragilestates, with a strong focus on building the capacity of community and governmentinstitutions, including through appropriate country presence arrangements, and close
Ongoing - RIDE annually- IFAD9 MTR
Yellow
13
Annex I
EC 2014/86/W
.P.4
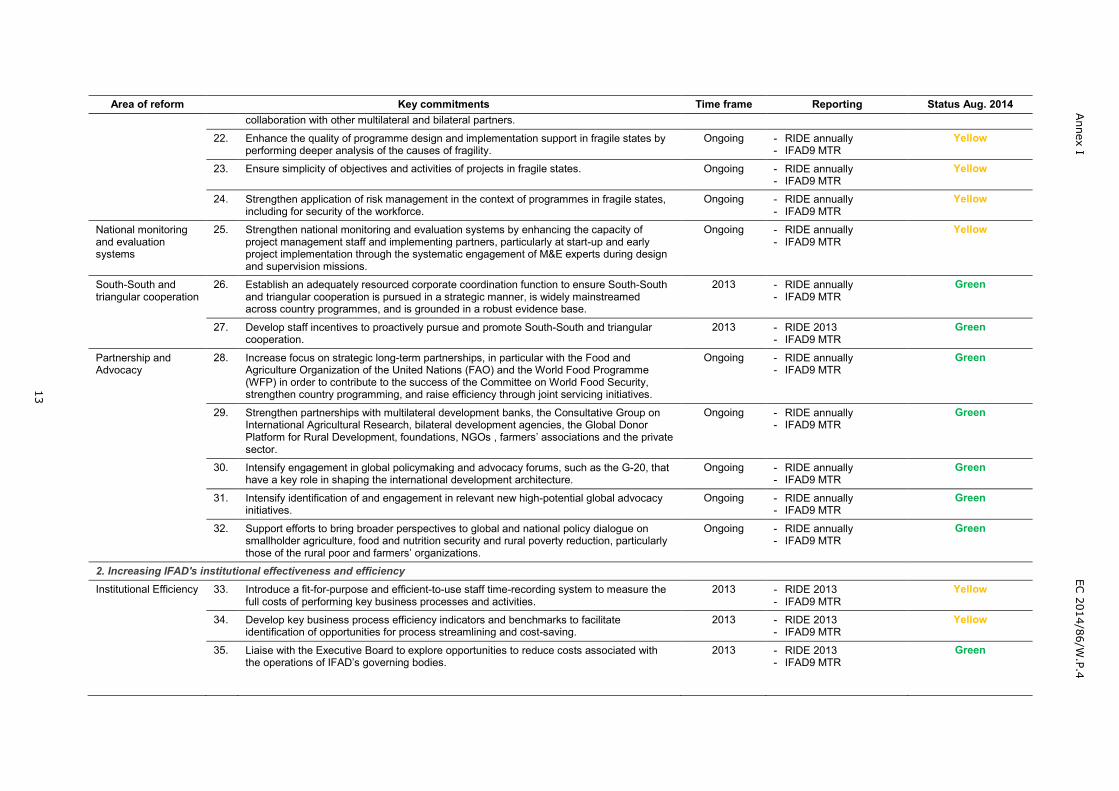
Area of reform Key commitments Time frame Reporting Status Aug. 2014collaboration with other multilateral and bilateral partners.
22. Enhance the quality of programme design and implementation support in fragile states byperforming deeper analysis of the causes of fragility.
Ongoing - RIDE annually- IFAD9 MTR
Yellow
23. Ensure simplicity of objectives and activities of projects in fragile states. Ongoing - RIDE annually- IFAD9 MTR
Yellow
24. Strengthen application of risk management in the context of programmes in fragile states,including for security of the workforce.
Ongoing - RIDE annually- IFAD9 MTR
Yellow
National monitoringand evaluationsystems
25. Strengthen national monitoring and evaluation systems by enhancing the capacity ofproject management staff and implementing partners, particularly at start-up and earlyproject implementation through the systematic engagement of M&E experts during designand supervision missions.
Ongoing - RIDE annually- IFAD9 MTR
Yellow
South-South andtriangular cooperation
26. Establish an adequately resourced corporate coordination function to ensure South-Southand triangular cooperation is pursued in a strategic manner, is widely mainstreamedacross country programmes, and is grounded in a robust evidence base.
2013 - RIDE annually- IFAD9 MTR
Green
27. Develop staff incentives to proactively pursue and promote South-South and triangularcooperation.
2013 - RIDE 2013- IFAD9 MTR
Green
Partnership andAdvocacy
28. Increase focus on strategic long-term partnerships, in particular with the Food andAgriculture Organization of the United Nations (FAO) and the World Food Programme(WFP) in order to contribute to the success of the Committee on World Food Security,strengthen country programming, and raise efficiency through joint servicing initiatives.
Ongoing - RIDE annually- IFAD9 MTR
Green
29. Strengthen partnerships with multilateral development banks, the Consultative Group onInternational Agricultural Research, bilateral development agencies, the Global DonorPlatform for Rural Development, foundations, NGOs , farmers’ associations and the privatesector.
Ongoing - RIDE annually- IFAD9 MTR
Green
30. Intensify engagement in global policymaking and advocacy forums, such as the G-20, thathave a key role in shaping the international development architecture.
Ongoing - RIDE annually- IFAD9 MTR
Green
31. Intensify identification of and engagement in relevant new high-potential global advocacyinitiatives.
Ongoing - RIDE annually- IFAD9 MTR
Green
32. Support efforts to bring broader perspectives to global and national policy dialogue onsmallholder agriculture, food and nutrition security and rural poverty reduction, particularlythose of the rural poor and farmers’ organizations.
Ongoing - RIDE annually- IFAD9 MTR
Green
2. Increasing IFAD's institutional effectiveness and efficiencyInstitutional Efficiency 33. Introduce a fit-for-purpose and efficient-to-use staff time-recording system to measure the
full costs of performing key business processes and activities.2013 - RIDE 2013
- IFAD9 MTRYellow
34. Develop key business process efficiency indicators and benchmarks to facilitateidentification of opportunities for process streamlining and cost-saving.
2013 - RIDE 2013- IFAD9 MTR
Yellow
35. Liaise with the Executive Board to explore opportunities to reduce costs associated withthe operations of IFAD’s governing bodies.
2013 - RIDE 2013- IFAD9 MTR
Green
14
Annex I
EC 2014/86/W
.P.4
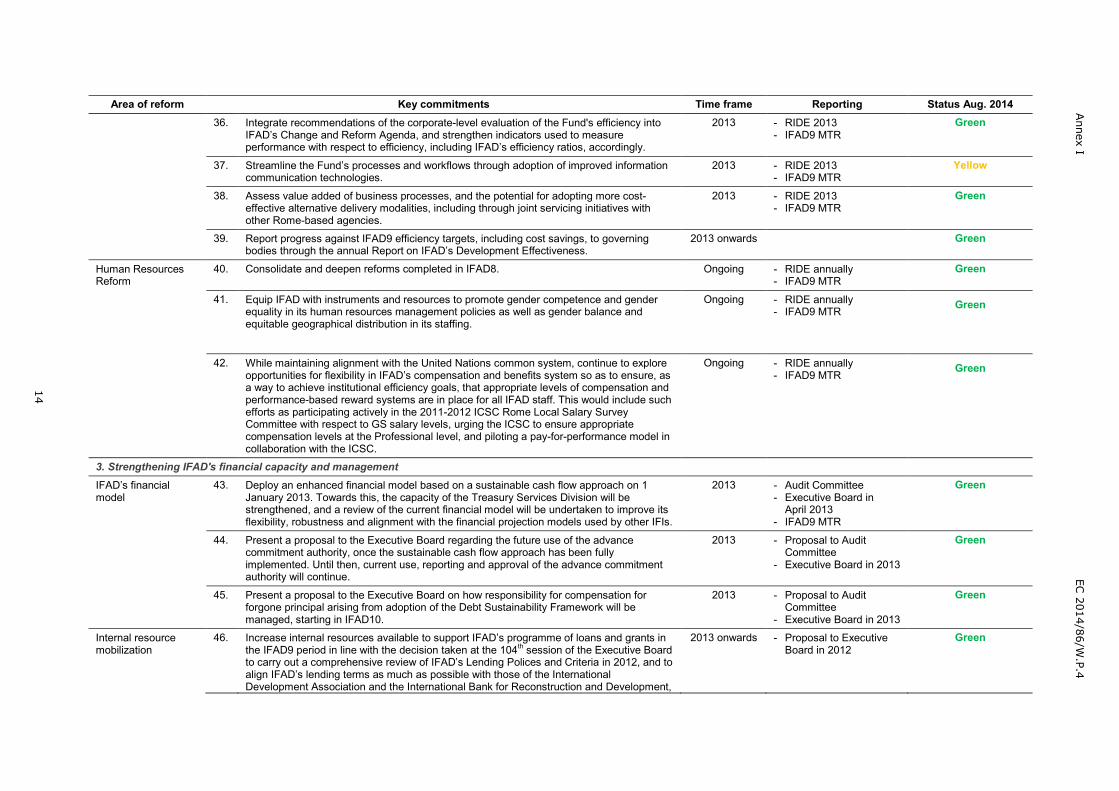
Area of reform Key commitments Time frame Reporting Status Aug. 201436. Integrate recommendations of the corporate-level evaluation of the Fund's efficiency into
IFAD’s Change and Reform Agenda, and strengthen indicators used to measureperformance with respect to efficiency, including IFAD’s efficiency ratios, accordingly.
2013 - RIDE 2013- IFAD9 MTR
Green
37. Streamline the Fund’s processes and workflows through adoption of improved informationcommunication technologies.
2013 - RIDE 2013- IFAD9 MTR
Yellow
38. Assess value added of business processes, and the potential for adopting more cost-effective alternative delivery modalities, including through joint servicing initiatives withother Rome-based agencies.
2013 - RIDE 2013- IFAD9 MTR
Green
39. Report progress against IFAD9 efficiency targets, including cost savings, to governingbodies through the annual Report on IFAD’s Development Effectiveness.
2013 onwards Green
Human ResourcesReform
40. Consolidate and deepen reforms completed in IFAD8. Ongoing - RIDE annually- IFAD9 MTR
Green
41. Equip IFAD with instruments and resources to promote gender competence and genderequality in its human resources management policies as well as gender balance andequitable geographical distribution in its staffing.
Ongoing - RIDE annually- IFAD9 MTR Green
42. While maintaining alignment with the United Nations common system, continue to exploreopportunities for flexibility in IFAD’s compensation and benefits system so as to ensure, asa way to achieve institutional efficiency goals, that appropriate levels of compensation andperformance-based reward systems are in place for all IFAD staff. This would include suchefforts as participating actively in the 2011-2012 ICSC Rome Local Salary SurveyCommittee with respect to GS salary levels, urging the ICSC to ensure appropriatecompensation levels at the Professional level, and piloting a pay-for-performance model incollaboration with the ICSC.
Ongoing - RIDE annually- IFAD9 MTR
Green
3. Strengthening IFAD's financial capacity and managementIFAD’s financialmodel
43. Deploy an enhanced financial model based on a sustainable cash flow approach on 1January 2013. Towards this, the capacity of the Treasury Services Division will bestrengthened, and a review of the current financial model will be undertaken to improve itsflexibility, robustness and alignment with the financial projection models used by other IFIs.
2013 - Audit Committee- Executive Board in
April 2013- IFAD9 MTR
Green
44. Present a proposal to the Executive Board regarding the future use of the advancecommitment authority, once the sustainable cash flow approach has been fullyimplemented. Until then, current use, reporting and approval of the advance commitmentauthority will continue.
2013 - Proposal to AuditCommittee
- Executive Board in 2013
Green
45. Present a proposal to the Executive Board on how responsibility for compensation forforgone principal arising from adoption of the Debt Sustainability Framework will bemanaged, starting in IFAD10.
2013 - Proposal to AuditCommittee
- Executive Board in 2013
Green
Internal resourcemobilization
46. Increase internal resources available to support IFAD’s programme of loans and grants inthe IFAD9 period in line with the decision taken at the 104th session of the Executive Boardto carry out a comprehensive review of IFAD’s Lending Polices and Criteria in 2012, and toalign IFAD’s lending terms as much as possible with those of the InternationalDevelopment Association and the International Bank for Reconstruction and Development,
2013 onwards - Proposal to ExecutiveBoard in 2012
Green
15
Annex I
EC 2014/86/W
.P.4
Area of reform Key commitments Time frame Reporting Status Aug. 2014taking into account IFAD’s specificity as outlined in the Agreement Establishing IFAD.
47. Enhance IFAD’s internal resources by soliciting payment of loan and contribution arrears,and exploring the possibility of loan prepayments with interested borrowing MemberStates.
Ongoing - Proposal to AuditCommittee andExecutive Board asappropriate
Yellow
New sovereigndonors andalternative financingmodalities
48. Engage non-Member States and groupings of States to contribute to and/or join the Fund. Ongoing - Proposal to GoverningCouncil and ExecutiveBoard as appropriate
Green
49. Explore the scope for raising financing from other sources to be submitted to the ExecutiveBoard, provided that any related agreements have no consequences for the governance ofthe Fund.
Ongoing - Proposal to ExecutiveBoard as appropriate
Green
4. Enhancing IFAD's results management systemImpact Evaluation 50. Raise the level of compliance with the requirement for projects to have a baseline survey
by the end of their first year of implementation.Ongoing - RIDE annually
- IFAD9 MTRGreen
51. Actively pursue partnerships with institutions specialized in impact evaluation, and mobilizeresources to develop adequate internal capacity to conduct/manage impact evaluationwork.
Ongoing - RIDE annually- IFAD9 MTR
Green
52. Present an information paper to the Executive Board on the methodologies IFAD willemploy in carrying out impact assessments and in measuring the new impact-levelindicators introduced in the RMF 2013-2015.
December2012
- Paper to ExecutiveBoard in December2012
Green
53. Conduct, synthesize and report on approximately 30 impact surveys over the IFAD9period. Three to six of these will use randomized control trials or other similarly rigorousmethodology, depending on cost-sharing opportunities, and interest and availability ofinstitutions specialized in impact evaluation to support this work.
2013 onwards - IFAD outcome report toExecutive Board from2014 onwards
Green
Results Reporting 54. Review and consolidate mechanisms for results reporting to governing bodies, towardsmore succinct accounts that are focused on impact and outcomes achieved.
April 2013 - Proposal to ExecutiveBoard in April 2013 Green
55. Report annually to the Executive Board and Evaluation Committee on performance againstRMF 2013-2015 indicators and targets through the Report on IFAD’s DevelopmentEffectiveness.
2013 onwards - RIDE annually- IFAD9 MTR
Green
56. Report annually to the Executive Board through the Audit Committee on enterprise riskmanagement activities in IFAD.
Annual - Reporting to AuditCommittee annually
- Annual Report onIFAD’s ERM Activities toExecutive Board
Green
Annex II EC 2014/86/W.P.4
16
Annual Report on IFAD Policy on Gender Equality andWomen’s Empowerment
1. This annex reports on progress in the implementation of the IFAD Policy on GenderEquality and Women’s Empowerment.
A. Results achieved in relation to the strategic objectives2. Women’s representation among people receiving services from IFAD-supported
projects has continued to increase numerically (from 28 million in 2011 to around49 million in 2013), and women now account for almost half of all beneficiaries(see table 3 in the main text). Women continue to dominate training in businessand entrepreneurship and community management topics, and they account foralmost half of those trained in crop and livestock production practices. Although thenumber of women engaged in rural financial services as borrowers has grown, theirpercentage share has fallen.
3. In the International Year of Family Farming, IFAD has promoted household-levelmethodologies to unlock the potential of family farming. By enabling householdmembers to create a shared vision, these methodologies bundle the often disparatestrategies pursued by women and men, adults and youth, into one coherentlivelihood strategy. In doing so, they empower households to realize theirdevelopment potential and create stronger, more resilient and sustainablesmallholder farming and rural livelihood systems. Knowledge management andcapacity-building events have taken place in Malawi, Mozambique and Uganda,benefiting from financial support from the Government of Japan and the Adaptationfor Smallholder Agriculture Programme.
4. The Gender Award was launched in 2013 by IFAD Management to recognize thebest-performing projects in addressing gender inequalities and empowering womenin each region. A special event was held on 25 November 2013, the InternationalDay for the Elimination of Violence against Women. The winning projects in 2013were the Sunamganj Community-based Resource Management Project inBangladesh, the Rural Development and Modernization Project for the EasternRegion in El Salvador, the Northern Rural Growth Programme in Ghana, theWestern Sudan Resources Management Programme in the Sudan, and the DistrictLivelihoods Support Programme in Uganda.
B. Results achieved in relation to the implementation plan5. The gender policy is implemented through five action areas, each with specific
output indicators. Action areas 1 to 3 relate to IFAD’s core activities, while actionareas 4 and 5 relate to the institutional structures and resources for policy delivery.
Action area 1: IFAD-supported country programmes and projects6. Specialist gender staff at headquarters and regional levels provide technical
support during the design and implementation of country programmes and projectsto strengthen gender equality and poverty targeting, by participating in missionsand as members of country programme management teams and by providinginputs to document reviews. With the support of the Programme ManagementDepartment (PMD) Front Office and the Statistics and Studies Division, theWomen’s Empowerment in Agriculture Index (WEAI) has been adapted and will bepiloted in selected impact and Results and Impact Management System (RIMS)studies in 2014-2015.
Indicator 1.1: Increase in the proportion of loans and grants with gender-specific objectives supported by clear budget allocations
7. A methodology was developed in 2013 for conducting an ex-ante analysis of thegender-sensitivity of the value of the IFAD loan portfolio. A score is assigned to
Annex II EC 2014/86/W.P.4
17
reflect the degree to which gender issues have been addressed in each loancomponent or subcomponent, using the IFAD six-point rating system.
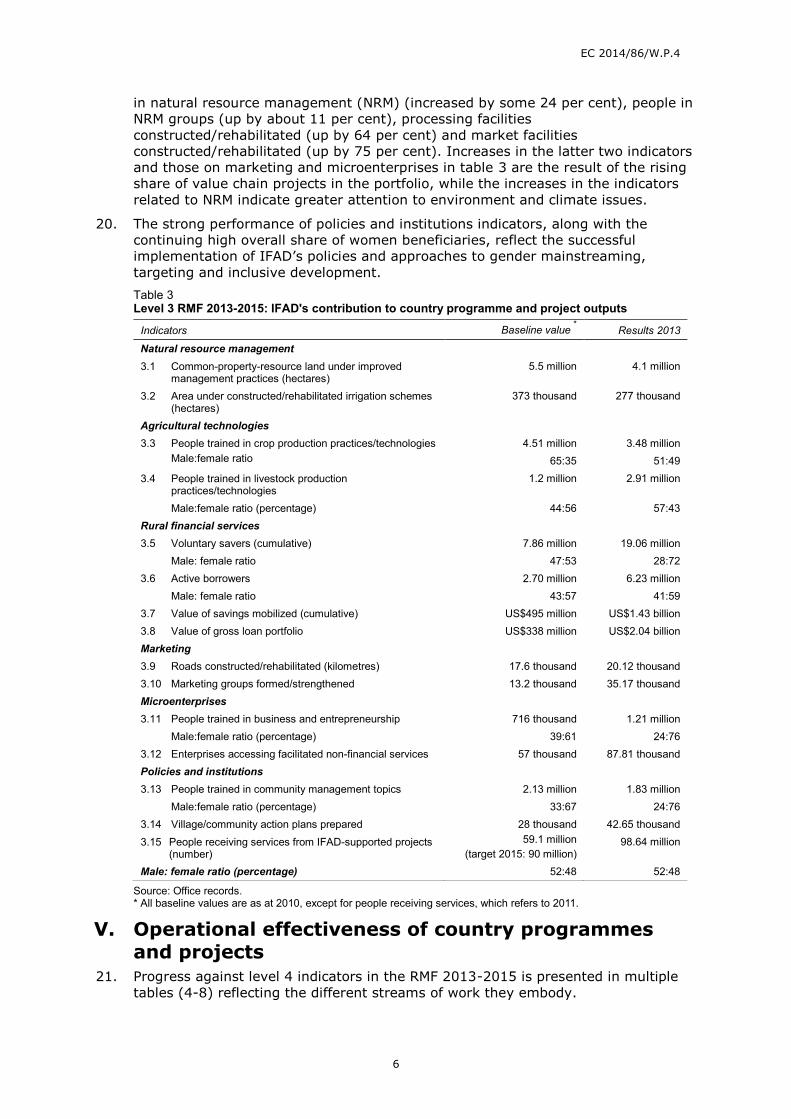
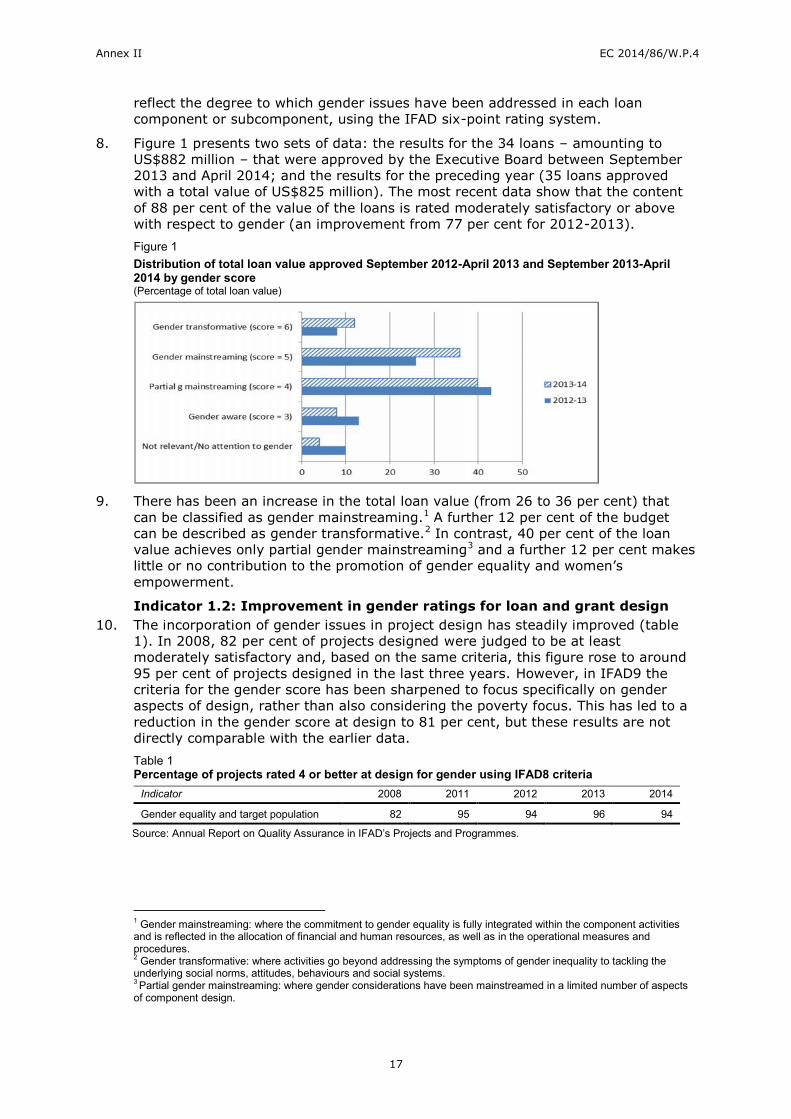
8. Figure 1 presents two sets of data: the results for the 34 loans – amounting toUS$882 million – that were approved by the Executive Board between September2013 and April 2014; and the results for the preceding year (35 loans approvedwith a total value of US$825 million). The most recent data show that the contentof 88 per cent of the value of the loans is rated moderately satisfactory or abovewith respect to gender (an improvement from 77 per cent for 2012-2013).Figure 1Distribution of total loan value approved September 2012-April 2013 and September 2013-April2014 by gender score(Percentage of total loan value)
9. There has been an increase in the total loan value (from 26 to 36 per cent) thatcan be classified as gender mainstreaming.1 A further 12 per cent of the budgetcan be described as gender transformative.2 In contrast, 40 per cent of the loanvalue achieves only partial gender mainstreaming3 and a further 12 per cent makeslittle or no contribution to the promotion of gender equality and women’sempowerment.
Indicator 1.2: Improvement in gender ratings for loan and grant design10. The incorporation of gender issues in project design has steadily improved (table
1). In 2008, 82 per cent of projects designed were judged to be at leastmoderately satisfactory and, based on the same criteria, this figure rose to around95 per cent of projects designed in the last three years. However, in IFAD9 thecriteria for the gender score has been sharpened to focus specifically on genderaspects of design, rather than also considering the poverty focus. This has led to areduction in the gender score at design to 81 per cent, but these results are notdirectly comparable with the earlier data.Table 1Percentage of projects rated 4 or better at design for gender using IFAD8 criteria
Indicator 2008 2011 2012 2013 2014
Gender equality and target population 82 95 94 96 94
Source: Annual Report on Quality Assurance in IFAD’s Projects and Programmes.
1 Gender mainstreaming: where the commitment to gender equality is fully integrated within the component activitiesand is reflected in the allocation of financial and human resources, as well as in the operational measures andprocedures.2 Gender transformative: where activities go beyond addressing the symptoms of gender inequality to tackling theunderlying social norms, attitudes, behaviours and social systems.3 Partial gender mainstreaming: where gender considerations have been mainstreamed in a limited number of aspectsof component design.
Annex II EC 2014/86/W.P.4
18
11. A total of 63 grants were approved between July 2013 and June 2014. Seven had astrong gender focus, 26 had a gender dimension, whereas 30 made little or noreference to gender issues.
Action area 2: IFAD as a catalyst for advocacy, partnerships andknowledge management
12. The nexus of partnerships, knowledge management and communication is a criticalfor advocacy and outreach.
Indicator 2.1: Increase in IFAD inputs on gender issues in internationalforums and publications
13. Key activities include:
Organizing a gender event on strengthening women’s participation andinfluence in farmers’ organizations at the biannual meeting of IFAD’s Farmers'Forum, 2014.
Contributing to the United Nations Educational, Scientific and CulturalOrganization/IFAD global seminar in Paris (February) reporting on results ofethnographic studies – supported by an IFAD grant – on young women andmen in rural villages in Cambodia, Egypt and Ethiopia.
Featuring, by the Near East, North Africa and Europe Division, of youth andwomen's employment as one of the key areas in an IFAD-led solutionexchange forum presented at the first-ever Arab States Regional South-SouthDevelopment Expo in Doha, Qatar (February).
Contributing to the annual session of the United Nations Inter-AgencyNetwork on Women and Gender Equality (IANGWE) and the fifty-eighthsession of the Commission on the Status of Women, United Nations, NewYork (March), where a joint side event was organized with the Food andAgriculture Organization of the United Nations (FAO) and the InternationalFood Policy Research Institute (IFPRI) on “Closing the knowledge gap ongender in agriculture”. A luncheon discussion on country-level policyengagement for rural women was organized for women ministers.
Presenting IFAD’s experiences on agricultural investment, gender and land atthe Multilateral Development Banks’ Working Group on Gender workshop inManila (June).
Hosting, by the Asia and the Pacific Division (APR), of a panel event on“Women as key agents for rural development” at the regional consultationfor the Asia-Pacific region on family farming, organized by the M. S.Swaminathan Research Foundation in Chennai, India (August).
Indicator 2.2: Inclusion in key IFAD policy documents and knowledgeproducts of references to gender equality and empowerment of women
14. Knowledge management and communications have been strengthened bydeveloping effective and evidence-based knowledge products and tools, includingregional/subregional briefs on gender and rural development, an e-newsletterpublished every two months, and the updated IFAD gender website with regionalwindows (http://www.ifad.org/gender/). This work has benefited from acollaborative relationship with the Communications Division (COM) and Strategyand Knowledge Department, and financial support from Finland.
15. Specific knowledge products include: a report by the Environment and ClimateDivision (ECD) highlighting the vital role that women smallholder farmers play inadapting to climate change; a Policy and Technical Advisory Division (PTA) reporton rural women’s leadership and the lessons learned from a programme funded byNorway in Madagascar, Nepal, the Philippines and Senegal; an APR paper on thechanging role of women in the economic transformation of family farming in Asia
Annex II EC 2014/86/W.P.4
19
and the Pacific; a West and Central Africa Division (WCA) video on women’seconomic empowerment in value chain development in Ghana; and an APR videoon women’s empowerment through engagement in decision-making in Papua,Indonesia.
Indicator 2.3: Increase in focus on gender issues in policy dialogue andscaling up
16. Together with the other two Rome-based agencies (RBAs) (FAO and the WorldFood Programme) and UN Women, IFAD is supporting the Committee on theElimination of Discrimination against Women in its efforts to prepare a generalrecommendation on rural women, which would indicate how parties should reporton the status of rural women in their periodic reports under the Convention on theElimination of All Forms of Discrimination against Women.
17. The PTA gender desk has participated in several activities linked to defining goalsand targets on gender equality, women’s rights and women’s empowerment for thepost-2015 development agenda, including the biennial workshop of the Inter-Agency Network on Women and Gender Equality and the Organisation for EconomicCo-operation and Development-Development Assistance Committee Network onGender Equality (October); a RBA-organized side event, at the eighth session(February) of the United Nations General Assembly's Open Working Group onSustainable Development Goals (SDGs), on gender equality and women’sempowerment, with a specific focus on rural women and the SDGs; and the RBA-led initiative on the post-2015 development agenda for agriculture and ruraldevelopment.
Indicator 2.4: Increase in joint initiatives on gender-related activities withother development agencies
18. In 2012, the RBAs and UN Women developed a five-year joint programme foraccelerating progress towards the economic empowerment of rural women. A high-level meeting with donors was held in Rome in October 2013 with a follow-upmeeting in June 2014. The Government of Norway made the first allocation to theMulti-Partner Trust Fund in June and this will facilitate country-level activities. IFADhas co-led activities with UN Women in Ethiopia, with financial support from Finland,and has undertaken research on the WEAI in the context of Guatemalan activities.
19. IFAD hosted two workshops on gender and agricultural productivity in sub-SaharanAfrica to share the findings from research carried out by the World Bank LivingStandards Measurement Study team, in collaboration with FAO and IFPRI(September and May), with grant support from WCA
20. The joint UN Women-IFAD grant-funded Broadening Economic Opportunities forRural Women Entrepreneurs in the Latin America and the Caribbean RegionProgramme was launched in EL Salvador in November.
Action area 3: Capacity-building of implementing partners and governmentinstitutions
21. The PTA gender desk has launched a series of innovative training and knowledge-sharing events. Monthly gender breakfasts, led by IFAD experts, explore differentthematic areas with a gender dimension – including youth, nutrition, self-helpgroups, monitoring and evaluation (M&E). Four technical webinars on gender andtargeting have reached a large audience in IFAD-supported operations and amongpartners; guest contributors have included the Vice-President, the Deputy Directorof the Independent Office of Evaluation of IFAD (IOE), the Deputy Director of thePartnership and Resource Mobilization Office and the East and Southern AfricaDivision (ESA) Regional Economist.
Annex II EC 2014/86/W.P.4
20
22. Regional and country initiatives in 2013-14 included:
ESA and ECD organized a knowledge management and capacity-buildingforum in Nairobi (October) on climate change and its impact on gender andland tenure for country teams from the region.
WCA organized a two-day learning and sharing forum on targeting, genderand youth in Kinshasa, Democratic Republic of the Congo (May), which wasattended by more than 70 gender focal points and M&E officers from 36projects.
The International Land Coalition, a global alliance of civil society and farmers’organizations, United Nations agencies, NGOs and research institutes, andProcasur, a non-profit organization focused on knowledge managementamong people linked to development projects, organized a learning route oninnovative tools and approaches for securing women’s land rights in Burundiand Rwanda in February.
The IFAD Country Office in Nepal organized a gender equality and socialinclusion workshop to share lessons from the IFAD/Women Organizing forChange in Agriculture and Natural Resource Management (WOCAN) grant-funded project on capacity-building for women's leadership in producerorganizations in the Asia and the Pacific region.
APR developed an e-learning course on M&E, with a gender dimension.
Indicator 3.1: Improvement in gender ratings for loan and grant portfolioat completion
23. There has been a steady improvement in project performance with regard to howmuch attention was given to gender issues during project implementation, whethera project was specifically designed to address the needs of women, and whetherthe project contributed to improving the situation of women in general (see table 2in the main report).
24. IOE is one of the few evaluation offices among the multilateral organizations tohave gender as a specific criterion in its evaluation methodology. In the 11th
Annual Report on Results and Impact of IFAD’s Operations (2013), just over 80per cent of the projects evaluated for the period 2011-2013 were rated as at leastmoderately satisfactory on gender. IOE challenges IFAD to improve its performanceso that a greater proportion of the projects are rated as satisfactory in the future.
Indicator 3.2: Increase in the number and quality of initiatives to supportgender equality and women’s empowerment undertaken by governmentinstitutions
25. Examples in 2013 -2014 include:
In India, the state of Madhya Pradesh has committed to state-wide scalingup of the Shaurya initiative of the IFAD-supported Madhya Pradesh TejaswiniRural Women's Empowerment Programme. Women members of self-helpgroups link up with men from their villages to form “courage brigades” totackle malnutrition, caste violence, domestic abuse and corruption.
In Uganda, the success of household mentoring under the DistrictLivelihoods Support Programme as a mechanism for social inclusion to workwith poorer households has been recognized by the Ministry of LocalGovernment.
In Malawi, the Ministry of Agriculture and Food Security has played a keyrole in promoting household methodologies, and there is a commitment tomainstream the methodology in the curriculum for training communitydevelopment workers.
Annex II EC 2014/86/W.P.4
21
Action area 4: Gender and diversity balance in IFAD26. In 2013, IFAD updated its competency framework, linking the competencies clearly
to IFAD's core values. Gender considerations have been mainstreamed into fivecompetencies, including one specifically for staff with management responsibilities.In September and October, the Human Resources Division (HRD) organized two in-house training sessions on leadership for women.
Indicator 4.1: Increase in number of women at grade P-5 or aboveemployed by IFAD
27. As at 1 August 2014, IFAD employed a total of 574 staff. Women accounted for 80per cent of the 245 General Service staff and 46 per cent of the 299 Professionaland higher categories. As tracked in the Report on IFAD’s DevelopmentEffectiveness (RIDE), women accounted for 29 per cent of staff at grade P-5 orabove, which falls short of the Results Measurement Framework (RMF) target of35 per cent (table 2). Regarding the 61 IFAD field staff paid through other UnitedNations agencies, women accounted for 76 per cent of General Service staff and 23per cent of National Professional officers. The proportion of the workforce fromList B and C Member States is 40 per cent in 2014 and the gender balance withinthe workforce remains equitable.Table 2Composition of staff
Indicator Baseline2008
RIDE2011
RIDE2012
RIDE2013
RIDE2014
RMF target(2015)
Percentage of women in P-5posts and above
30 28 30 29 29 35
Percentage of women in P-4posts and above
31 31 30 33 34 50*
Percentage of women inGeneral Service staff positions
81 83 81 81 80 50*
Percentage of workforce fromLists B and C Member States
33 40 39 40 40 Tracked
* Indicators for the United Nations System-wide Action Plan on Gender Equality and the Empowerment of Women(UN-SWAP) performance assessment.
28. IFAD’s staffing profile compares well with the United Nations system, with aboveaverage representation of women at P-3 and Director level (figure 2). However,the Fund has some way to go to achieving gender equality for P-4 and above (now34 per cent). Nevertheless, recent efforts to enhance geographic and genderbalance are bearing fruit: as of October 2014, women make up 33 per cent of theSenior Management team, and half of the Associate Vice-Presidents are nowwomen from List C Member States.
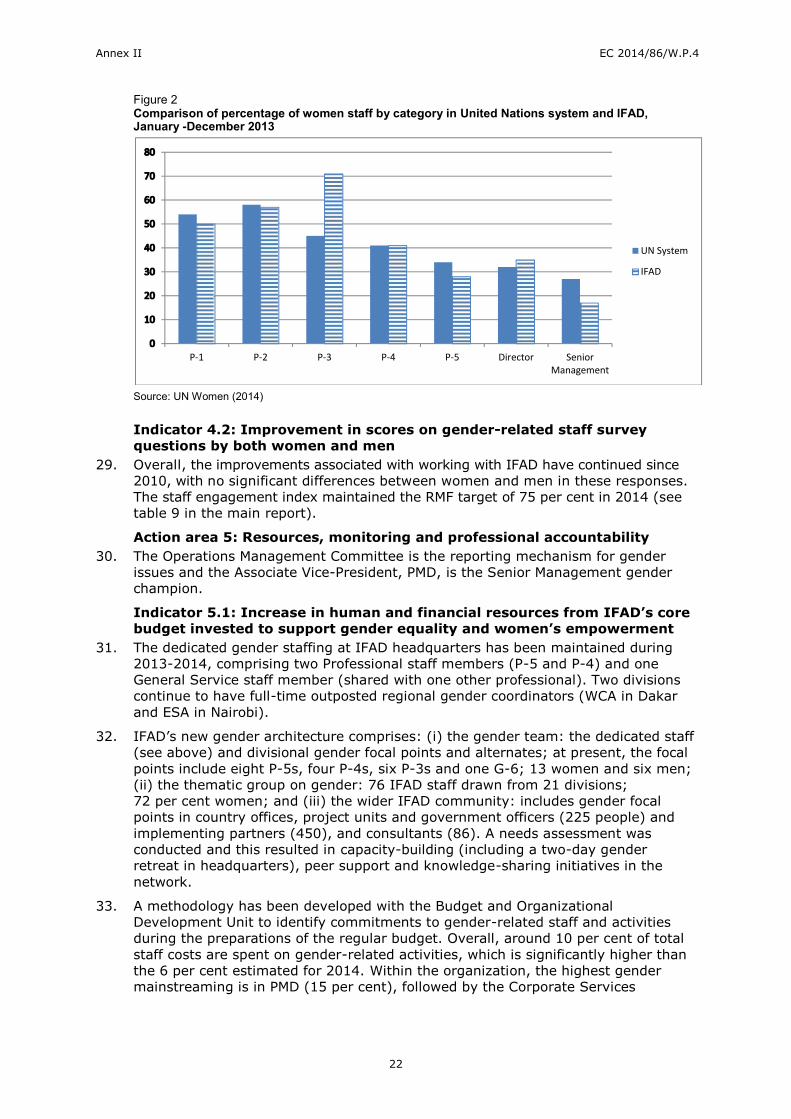
Annex II EC 2014/86/W.P.4
22
Figure 2Comparison of percentage of women staff by category in United Nations system and IFAD,January -December 2013
Source: UN Women (2014)
Indicator 4.2: Improvement in scores on gender-related staff surveyquestions by both women and men
29. Overall, the improvements associated with working with IFAD have continued since2010, with no significant differences between women and men in these responses.The staff engagement index maintained the RMF target of 75 per cent in 2014 (seetable 9 in the main report).
Action area 5: Resources, monitoring and professional accountability30. The Operations Management Committee is the reporting mechanism for gender
issues and the Associate Vice-President, PMD, is the Senior Management genderchampion.
Indicator 5.1: Increase in human and financial resources from IFAD’s corebudget invested to support gender equality and women’s empowerment
31. The dedicated gender staffing at IFAD headquarters has been maintained during2013-2014, comprising two Professional staff members (P-5 and P-4) and oneGeneral Service staff member (shared with one other professional). Two divisionscontinue to have full-time outposted regional gender coordinators (WCA in Dakarand ESA in Nairobi).
32. IFAD’s new gender architecture comprises: (i) the gender team: the dedicated staff(see above) and divisional gender focal points and alternates; at present, the focalpoints include eight P-5s, four P-4s, six P-3s and one G-6; 13 women and six men;(ii) the thematic group on gender: 76 IFAD staff drawn from 21 divisions;72 per cent women; and (iii) the wider IFAD community: includes gender focalpoints in country offices, project units and government officers (225 people) andimplementing partners (450), and consultants (86). A needs assessment wasconducted and this resulted in capacity-building (including a two-day genderretreat in headquarters), peer support and knowledge-sharing initiatives in thenetwork.
33. A methodology has been developed with the Budget and OrganizationalDevelopment Unit to identify commitments to gender-related staff and activitiesduring the preparations of the regular budget. Overall, around 10 per cent of totalstaff costs are spent on gender-related activities, which is significantly higher thanthe 6 per cent estimated for 2014. Within the organization, the highest gendermainstreaming is in PMD (15 per cent), followed by the Corporate Services
P-1 P-2 P-3 P-4 P-5 Director SeniorManagement
UN System
IFAD
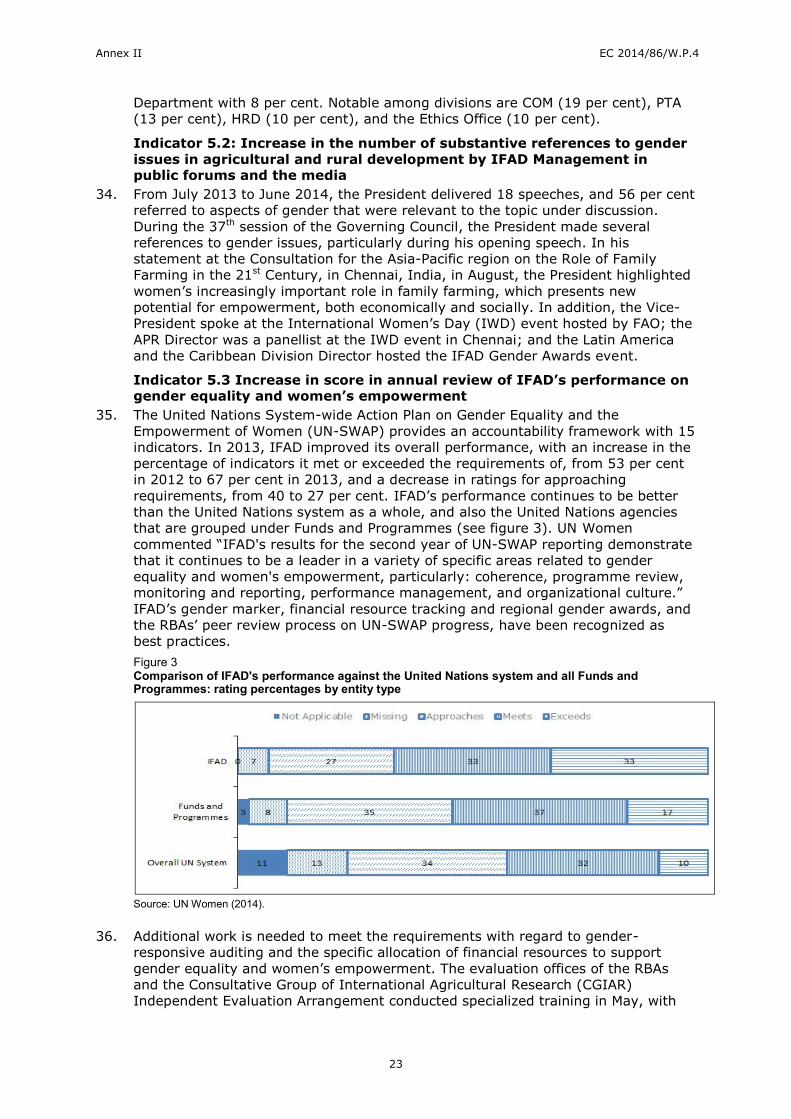
Annex II EC 2014/86/W.P.4
23
Department with 8 per cent. Notable among divisions are COM (19 per cent), PTA(13 per cent), HRD (10 per cent), and the Ethics Office (10 per cent).
Indicator 5.2: Increase in the number of substantive references to genderissues in agricultural and rural development by IFAD Management inpublic forums and the media
34. From July 2013 to June 2014, the President delivered 18 speeches, and 56 per centreferred to aspects of gender that were relevant to the topic under discussion.During the 37th session of the Governing Council, the President made severalreferences to gender issues, particularly during his opening speech. In hisstatement at the Consultation for the Asia-Pacific region on the Role of FamilyFarming in the 21st Century, in Chennai, India, in August, the President highlightedwomen’s increasingly important role in family farming, which presents newpotential for empowerment, both economically and socially. In addition, the Vice-President spoke at the International Women’s Day (IWD) event hosted by FAO; theAPR Director was a panellist at the IWD event in Chennai; and the Latin Americaand the Caribbean Division Director hosted the IFAD Gender Awards event.
Indicator 5.3 Increase in score in annual review of IFAD’s performance ongender equality and women’s empowerment
35. The United Nations System-wide Action Plan on Gender Equality and theEmpowerment of Women (UN-SWAP) provides an accountability framework with 15indicators. In 2013, IFAD improved its overall performance, with an increase in thepercentage of indicators it met or exceeded the requirements of, from 53 per centin 2012 to 67 per cent in 2013, and a decrease in ratings for approachingrequirements, from 40 to 27 per cent. IFAD’s performance continues to be betterthan the United Nations system as a whole, and also the United Nations agenciesthat are grouped under Funds and Programmes (see figure 3). UN Womencommented “IFAD's results for the second year of UN-SWAP reporting demonstratethat it continues to be a leader in a variety of specific areas related to genderequality and women's empowerment, particularly: coherence, programme review,monitoring and reporting, performance management, and organizational culture.”IFAD’s gender marker, financial resource tracking and regional gender awards, andthe RBAs’ peer review process on UN-SWAP progress, have been recognized asbest practices.Figure 3Comparison of IFAD's performance against the United Nations system and all Funds andProgrammes: rating percentages by entity type
Source: UN Women (2014).
36. Additional work is needed to meet the requirements with regard to gender-responsive auditing and the specific allocation of financial resources to supportgender equality and women’s empowerment. The evaluation offices of the RBAsand the Consultative Group of International Agricultural Research (CGIAR)Independent Evaluation Arrangement conducted specialized training in May, with
Annex II EC 2014/86/W.P.4
24
inputs from the PTA gender desk, to enhance evaluation skills from a genderperspective.
37. IFAD met all the requirements in gender mainstreaming assessment conducted bythe Global Environment Facility (GEF) Secretariat of GEF agencies in 2013.
Annex III EC 2014/86/W.P.4
25
Implementation of the Istanbul Programme of Action forLeast Developed Countries
BackgroundA.1. The least developed countries (LDCs) represent the poorest and weakest segment
of the international community. They comprise about 12 per cent of worldpopulation, but account for less than 2 per cent of world GDP and about 1 per centof global trade in goods. LDCs display the highest poverty incidence in the world.They have twice the share of their population in extreme poverty, as compared toall developing countries, and in some of them the poverty rate is higher than 80per cent. The same applies to the prevalence of hunger. They also face low levelsof social and human development. LDCs have 880 million people with lowestdevelopment indicators and the number of people living in current LDCs isexpected to double over the next 40 years. Their largely agrarian economies areaffected by a cycle of low productivity and low investment.
2. LDCs in IFAD-funded operations. LDCs represent a core IFAD constituency.Since the beginning of its operations in 1978, IFAD has allocated 43 per cent of itsresources to these countries, and in the last four years, that proportion hasincreased to 48 per cent (table 1).Table 1IFAD allocation 2010 – September 2014 (approved project financing)
US$ million
Total programme (including LDCs) 3 735.30
LDCs 1 807.30Percentage IFAD allocation to LDCs 48%
Source: Project and Portfolio Management System (PPMS), IFAD.
3. IFAD operates in 42 out of the 48 LDCs. Currently, it has funded 178 projects beingimplemented in LDCs (approved between 2001 and April 2014). Of these, 100 wereapproved over the last four years, which represents a significant increase in IFAD’sLDC portfolio.
4. Financing terms. Since IFAD’s financing terms are inter alia determined by percapita income, LDCs receive financing on softer terms for projects andprogrammes. Most of the operations are financed through highly concessionalloans, many times combined with Debt Sustainability Framework (DSF) grants, orgrants within the DSF (table 2).Table 2IFAD financing terms for LDCs (2010 – 2014)(Approved project financing)
Financing Terms US$ million No. loans and grants
DSF grant 509 797 37
DSF grant / highly concessional loan 469 938 32
Highly concessional loan 827 564 49
Total 1 807 299 118
Source: PPMS.
Istanbul Programme of Action for Least Developed CountriesB.5. The Istanbul Programme of Action (IPoA) was adopted at the Fourth United Nations
Conference on Least Developed Countries in Istanbul, Turkey (May 2011), andendorsed in 2012 by IFAD‘s Governing Council during its 35th session (GC 35/L.11;Resolution 170 / XXXV). The goal of the IPoA is to enable half of the LDCs to meet
Annex III EC 2014/86/W.P.4
26
the criteria for graduation by 2020, which represents significant attempt to addressstructural challenges faced by these countries.
6. IFAD contributes to the IPoA, mainly through the Inter-Agency Working Group onAgriculture, Food Security and Nutrition, and Rural Development that comprisesthe United Nations Office of the High Representative for the Least DevelopedCountries, Landlocked Developing Countries and Small Island Developing Statesand the Rome-based agencies (RBAs – IFAD, the World Food Programme – WFPand the Food and Agriculture Organization of the United Nations –FAO). Theworking group aims at articulating a development approach that is specificallyrelevant to LDCs and their efforts to reduce hunger and malnutrition and increasethe incomes of poor people in a sustainable manner.
7. Post-2015 development agenda. Among the LDCs, it has been recognized thatthe IPoA represents a good basis for discussions about the post-2015 agenda.Therefore, during the Tenth Inter-Agency Consultative Group Meeting on theImplementation of the IPoA (March 2014), IFAD provided inputs to the discussionregarding the strategy of LDCs in the post-2015 negotiations. Specifically, IFADpresented the work (developed jointly by the RBAs) on the identification of acommon set of target areas and possible indicators in the areas of food security,nutrition and sustainable agriculture.
8. Small Island Developing States. Among the LDCs, there is a distinct group ofdeveloping countries with specific social, economic, environmental, food andnutrition-related vulnerabilities. The Small Island Developing States (SIDS) includesome of the poorest countries in the world, nine of them LDCs.
9. In 2014, IFAD reviewed its approach to the SIDS, recognizing the specificchallenges and particular needs of food security in these countries and theobligation to take into account SIDS-specific vulnerabilities in defining the post-2015 development agenda. IFAD’s approach for these countries is focused on threethematic areas: i) sustainable small-scale fisheries and aquaculture;ii) opportunities and employment for smallholder agriculture; and iii) environmentand climate change. This approach is in line with the commitment to support theIPoA and to advance the sustainable development agenda of LDCs, and it waspresented during the Third International Conference on Small Island DevelopingStates (Samoa, September 2014).
10. IFAD’s renewed approach provides an opportunity to position IFAD as a partner ofchoice in addressing the needs of some of the most vulnerable LDCs, supportingthem to graduate from LDC status in light of the post-2015 agenda.
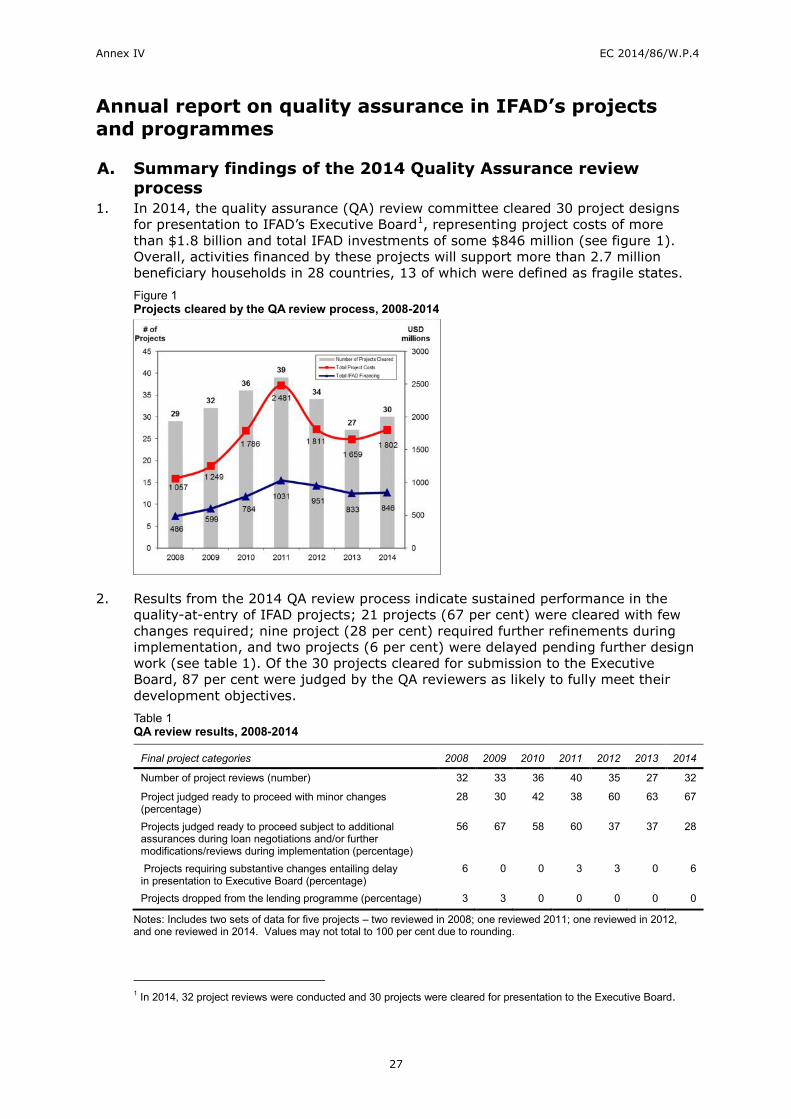
Annex IV EC 2014/86/W.P.4
27
Annual report on quality assurance in IFAD’s projectsand programmes
Summary findings of the 2014 Quality Assurance reviewA.process
1. In 2014, the quality assurance (QA) review committee cleared 30 project designsfor presentation to IFAD’s Executive Board1, representing project costs of morethan $1.8 billion and total IFAD investments of some $846 million (see figure 1).Overall, activities financed by these projects will support more than 2.7 millionbeneficiary households in 28 countries, 13 of which were defined as fragile states.Figure 1Projects cleared by the QA review process, 2008-2014
2. Results from the 2014 QA review process indicate sustained performance in thequality-at-entry of IFAD projects; 21 projects (67 per cent) were cleared with fewchanges required; nine project (28 per cent) required further refinements duringimplementation, and two projects (6 per cent) were delayed pending further designwork (see table 1). Of the 30 projects cleared for submission to the ExecutiveBoard, 87 per cent were judged by the QA reviewers as likely to fully meet theirdevelopment objectives.Table 1QA review results, 2008-2014
Final project categories 2008 2009 2010 2011 2012 2013 2014
Number of project reviews (number) 32 33 36 40 35 27 32
Project judged ready to proceed with minor changes(percentage)
28 30 42 38 60 63 67
Projects judged ready to proceed subject to additionalassurances during loan negotiations and/or furthermodifications/reviews during implementation (percentage)
56 67 58 60 37 37 28
Projects requiring substantive changes entailing delayin presentation to Executive Board (percentage)
6 0 0 3 3 0 6
Projects dropped from the lending programme (percentage) 3 3 0 0 0 0 0
Notes: Includes two sets of data for five projects – two reviewed in 2008; one reviewed 2011; one reviewed in 2012,and one reviewed in 2014. Values may not total to 100 per cent due to rounding.
1 In 2014, 32 project reviews were conducted and 30 projects were cleared for presentation to the Executive Board.
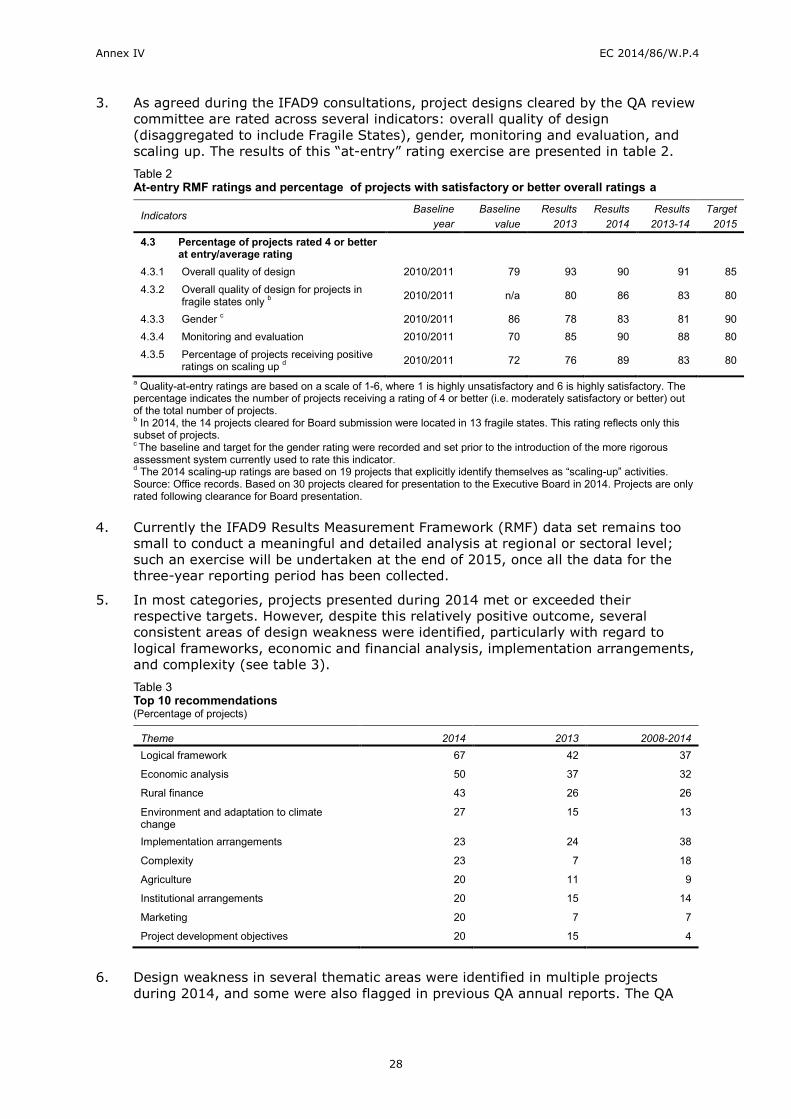
Annex IV EC 2014/86/W.P.4
28
3. As agreed during the IFAD9 consultations, project designs cleared by the QA reviewcommittee are rated across several indicators: overall quality of design(disaggregated to include Fragile States), gender, monitoring and evaluation, andscaling up. The results of this “at-entry” rating exercise are presented in table 2.Table 2At-entry RMF ratings and percentage of projects with satisfactory or better overall ratings a
Indicators Baselineyear
Baselinevalue
Results2013
Results2014
Results2013-14
Target2015
4.3 Percentage of projects rated 4 or betterat entry/average rating
4.3.1 Overall quality of design 2010/2011 79 93 90 91 854.3.2 Overall quality of design for projects in
fragile states only b 2010/2011 n/a 80 86 83 80
4.3.3 Gender c 2010/2011 86 78 83 81 904.3.4 Monitoring and evaluation 2010/2011 70 85 90 88 804.3.5 Percentage of projects receiving positive
ratings on scaling up d 2010/2011 72 76 89 83 80
a Quality-at-entry ratings are based on a scale of 1-6, where 1 is highly unsatisfactory and 6 is highly satisfactory. Thepercentage indicates the number of projects receiving a rating of 4 or better (i.e. moderately satisfactory or better) outof the total number of projects.b In 2014, the 14 projects cleared for Board submission were located in 13 fragile states. This rating reflects only thissubset of projects.c The baseline and target for the gender rating were recorded and set prior to the introduction of the more rigorousassessment system currently used to rate this indicator.d The 2014 scaling-up ratings are based on 19 projects that explicitly identify themselves as “scaling-up” activities.Source: Office records. Based on 30 projects cleared for presentation to the Executive Board in 2014. Projects are onlyrated following clearance for Board presentation.
4. Currently the IFAD9 Results Measurement Framework (RMF) data set remains toosmall to conduct a meaningful and detailed analysis at regional or sectoral level;such an exercise will be undertaken at the end of 2015, once all the data for thethree-year reporting period has been collected.
5. In most categories, projects presented during 2014 met or exceeded theirrespective targets. However, despite this relatively positive outcome, severalconsistent areas of design weakness were identified, particularly with regard tological frameworks, economic and financial analysis, implementation arrangements,and complexity (see table 3).Table 3Top 10 recommendations(Percentage of projects)
Theme 2014 2013 2008-2014Logical framework 67 42 37
Economic analysis 50 37 32
Rural finance 43 26 26
Environment and adaptation to climatechange
27 15 13
Implementation arrangements 23 24 38
Complexity 23 7 18
Agriculture 20 11 9
Institutional arrangements 20 15 14
Marketing 20 7 7
Project development objectives 20 15 4
6. Design weakness in several thematic areas were identified in multiple projectsduring 2014, and some were also flagged in previous QA annual reports. The QA
Annex IV EC 2014/86/W.P.4
29
Secretariat urges IFAD Management to revisit and strengthen the respectiveapproaches to design in the areas listed below.
7. Design and monitoring. IFAD could make better use of standard design andmonitoring tools (economic analysis, logical frameworks, lessons learned) to shapeprojects at the formulation stage and to manage them during implementation:
(a) Economic and financial analyses (EFA). While significantly improved inrecent years (due to improved/simplified guidelines and the vetting of theanalyses using in-house expertise), EFA continue to be undertaken in aninconsistent fashion (different methodologies employed; incompletepresentation of results; inconsistent linkage to logical frameworks and riskanalyses). Moreover, they are not consistently used as tool for selectingactivities. PTA’s current (good) efforts to standardize IFAD’s use of EFA shouldbe supported, and several quick wins that have emerged from this process(training regional economists to vet EFA; creating approved rosters of EFAconsultants; requiring presentation of EFA deliverables using certain technicaltemplates) should be given serious consideration.
(b) Logical frameworks. IFAD’s use of logical frameworks requires furtherimprovement, particularly regarding the number, nature and appropriatenessof indicators selected. Several reviews in 2014 and 2013 flagged theoverabundance of logical framework indicators and imprecision with respectto stating project goals. Moreover, the utility of collecting third-level Resultsand Impact Management System (RIMS) impact data (malnutrition andhousehold asset index) was questioned for a number of reasons, including theacknowledged problems in attributing the results to IFAD-funded activitiesand the lack of control groups.
(c) Lessons learned. Despite the push to scale up IFAD-supported projects,analysis of outcomes (lessons learned) from previous IFAD experience (orothers’ experience) is not consistently presented as a basis for informing orjustifying design approaches. This is not to say that reviewing lessons learnedis never done (indeed, during 2014, several designs were complimented forwork in this area), but rather to note that considerable scope remains toensure that the context of IFAD’s (and other donors’) history of engagementin a given environment is fully leveraged as a core aspect of every design.
(d) Complexity. IFAD is constantly striving to strike a balance between itsmandate to operate in remote and fragile areas targeting poor, oftenmarginalized, communities, and its need to deliver projects with considerableimpact (often by financing many different kinds of activities for beneficiaries).This dynamic, coupled with other factors (such as the constrained resourcesof a fragile state or the massive geographic scope of large states) can leaveprojects at risk of failure. In recent years, IFAD’s managers have opted todeal with such complexity by increasing funding for additional monitoring andsupervision work on a case-by-case basis. In some cases, phasing ofactivities was also proposed as a mitigating measure. In most cases,however, paring down and focusing project activities to core, achievable anddeliverable activities is the best remedy for reducing unwieldy designelements and increasing the likelihood of successful outcomes.
(e) Implementation arrangements. During 2014, a variety of implementation-related risks were identified; managing and mitigating such risks is aperennial concern for IFAD-supported projects, and although the traditionalapproach (relying on NGOs and similar organizations) has generally resultedin satisfactory outcomes, IFAD is increasingly seeking to leverage private-sector players in key implementation roles (cofinanciers, managers of projectactivities, members of steering committees, etc.). Given this shift and theevolving public-private-producers partnership (4 Ps) model, close attention
Annex IV EC 2014/86/W.P.4
30
will have to be paid to the extent to which the preferred implementationarrangements can influence project outcomes, and corrective measuresexpeditiously taken when problems arise.
(f) Thematic mainstreaming. As preparations are undertaken to fine-tuneembedding certain cross-cutting activities into all IFAD-funded projects overthe medium term, a consistent and integrated corporate approach needs tobe rolled out for such mainstreaming. With respect to climate-relatedactivities, IFAD’s definition of resilience is clear and flexible enough toaccommodate the wide range of activities supported by the Fund. Withrespect to nutrition, design teams are urged to be cautious of add-onactivities that may have little impact on the ground while adding complexityto the overall design. With respect to gender activities, an area that scoredslightly below the 2015 RMF target as noted in table 2, it is important toarticulate, consistently and carefully, a given project’s specific gender-relatedobjectives, activities and budget in the core design document, supported byassociated annexes and working papers.
B. Efficacy of IFAD’s quality assurance system8. Over the course of 2014, the Quality Assurance Secretariat undertook several
initiatives focused on strengthening the QA programme. Taken together, theseefforts – in conjunction with the recent restructuring of the Quality AssuranceGroup under the Vice-President – are aimed at improving the efficiency andconsistency of QA reviews for loans and grants.
9. QA at quality enhancement (QE) pilot. During 2014, the QA Secretariat, incoordination with the Quality Enhancement Review Secretariat, engaged reviewersto assess 20 projects earlier in the design cycle (at the QE stage) in order to gaugethe impact and efficacy of providing country programme managers (CPMs)feedback earlier in the design process (when time and budget still allow forsubstantive changes to be made). Following in-depth discussions with technicallead advisers and CPMs, the piloted approach received considerable supportprimarily due to the strategic and technical insights provided by the QA reviewers.Of the 13 projects in the pilot that completed the design cycle in 2014, all werecleared by the QA review committee; moreover, seven of the designs were clearedwith no major issues/recommendations and in three cases, it was recommendedthat the final QA discussion be waived entirely. Following these positive results, theQA Secretariat will explore options with other QA stakeholders for making the pilotoperational in 2015.
10. QE-QA workshop. In October 2014, PTA and the QA Secretariat co-hosted a two-day QE-QA workshop to ensure alignment between both Secretariats on a varietyof issues. During the workshop, five QA reviewers met with in-house experts todiscuss technical issues (gender, environment and climate adaptation, nutrition,private-sector partnerships, scaling-up, and economic and financial analysis). Inaddition, a three-hour session was held with CPMs, lead advisers and members ofSenior Management to discuss topics of strategic importance (the results of the QAat QE pilot, the quality at-entry RMF rating system, thematic mainstreaming, andIFAD’s environmental and social safeguards policy).
11. QUASAR system. During 2014, the QA Secretariat refined the functionality andexpanded the scope of the quality assurance archiving system (QUASAR) tosupport new workflows outside of the standard QA review process (concept notereviews as well as the collection of RMF data). By the end of 2014, the system willinclude other functionality related to data searching, filtering and reporting. In2014 the QUASAR project received additional corporate sponsorship to furtherexpand the platform in 2015, by supporting the workflows of other IFAD reviewprocesses, such as the Secretariat of the Operational Strategy and Policy GuidanceCommittee, grant proposals and QE reviews.
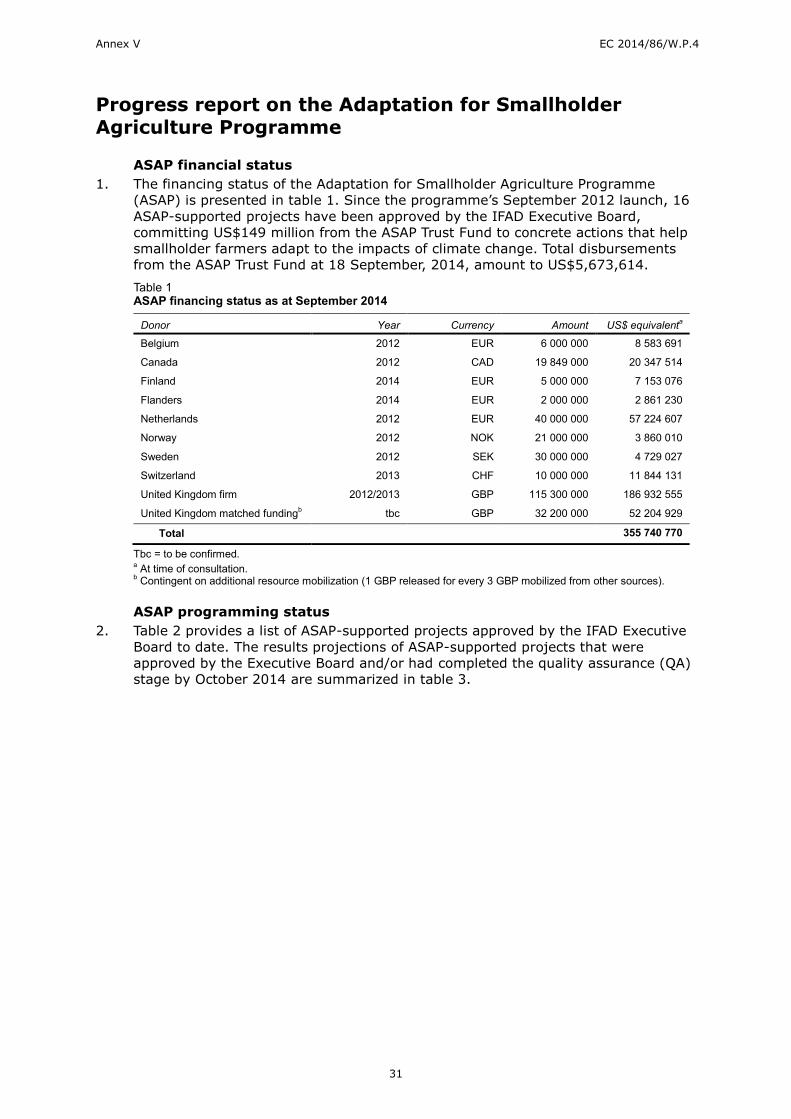
Annex V EC 2014/86/W.P.4
31
Progress report on the Adaptation for SmallholderAgriculture Programme
ASAP financial status1. The financing status of the Adaptation for Smallholder Agriculture Programme
(ASAP) is presented in table 1. Since the programme’s September 2012 launch, 16ASAP-supported projects have been approved by the IFAD Executive Board,committing US$149 million from the ASAP Trust Fund to concrete actions that helpsmallholder farmers adapt to the impacts of climate change. Total disbursementsfrom the ASAP Trust Fund at 18 September, 2014, amount to US$5,673,614.Table 1ASAP financing status as at September 2014
Donor Year Currency Amount US$ equivalenta
Belgium 2012 EUR 6 000 000 8 583 691
Canada 2012 CAD 19 849 000 20 347 514
Finland 2014 EUR 5 000 000 7 153 076
Flanders 2014 EUR 2 000 000 2 861 230
Netherlands 2012 EUR 40 000 000 57 224 607
Norway 2012 NOK 21 000 000 3 860 010
Sweden 2012 SEK 30 000 000 4 729 027
Switzerland 2013 CHF 10 000 000 11 844 131
United Kingdom firm 2012/2013 GBP 115 300 000 186 932 555
United Kingdom matched fundingb tbc GBP 32 200 000 52 204 929
Total 355 740 770
Tbc = to be confirmed.a At time of consultation.b Contingent on additional resource mobilization (1 GBP released for every 3 GBP mobilized from other sources).
ASAP programming status2. Table 2 provides a list of ASAP-supported projects approved by the IFAD Executive
Board to date. The results projections of ASAP-supported projects that wereapproved by the Executive Board and/or had completed the quality assurance (QA)stage by October 2014 are summarized in table 3.
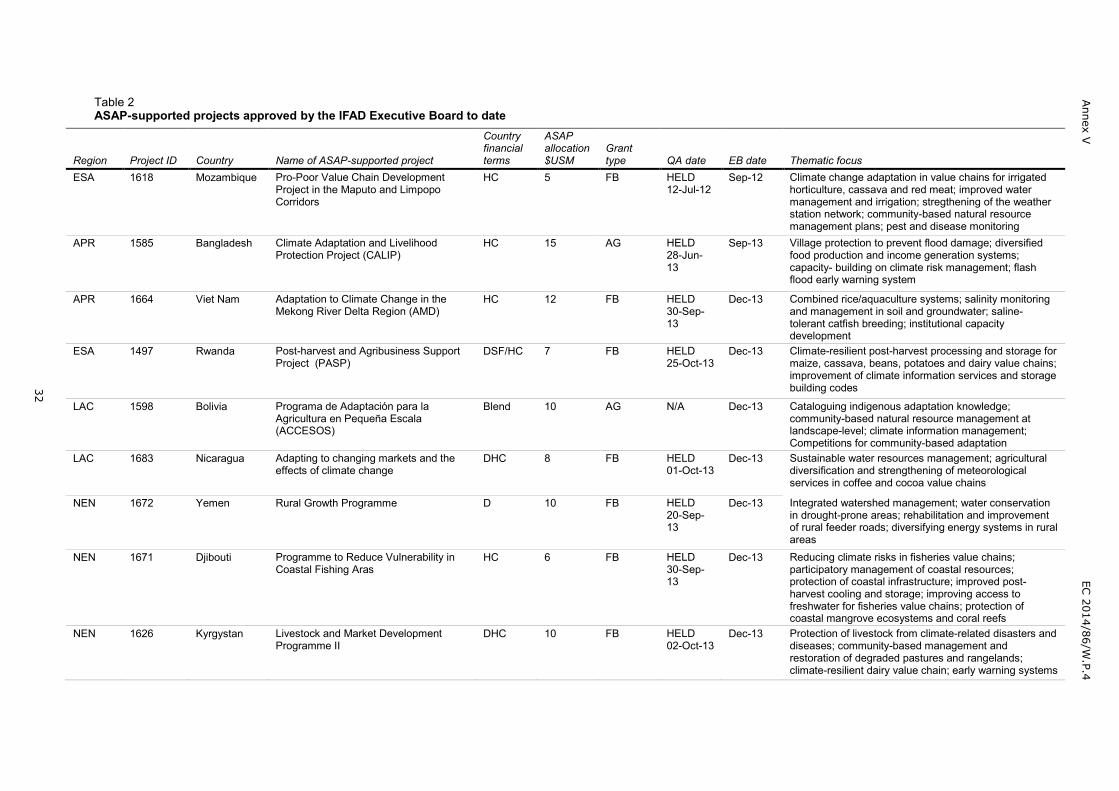
Annex
VEC
2014/86/W.P.4
32
Table 2ASAP-supported projects approved by the IFAD Executive Board to date
Region Project ID Country Name of ASAP-supported project
Countryfinancialterms
ASAPallocation$USM
Granttype QA date EB date Thematic focus
ESA 1618 Mozambique Pro-Poor Value Chain DevelopmentProject in the Maputo and LimpopoCorridors
HC 5 FB HELD12-Jul-12
Sep-12 Climate change adaptation in value chains for irrigatedhorticulture, cassava and red meat; improved watermanagement and irrigation; stregthening of the weatherstation network; community-based natural resourcemanagement plans; pest and disease monitoring
APR 1585 Bangladesh Climate Adaptation and LivelihoodProtection Project (CALIP)
HC 15 AG HELD28-Jun-13
Sep-13 Village protection to prevent flood damage; diversifiedfood production and income generation systems;capacity- building on climate risk management; flashflood early warning system
APR 1664 Viet Nam Adaptation to Climate Change in theMekong River Delta Region (AMD)
HC 12 FB HELD30-Sep-13
Dec-13 Combined rice/aquaculture systems; salinity monitoringand management in soil and groundwater; saline-tolerant catfish breeding; institutional capacitydevelopment
ESA 1497 Rwanda Post-harvest and Agribusiness SupportProject (PASP)
DSF/HC 7 FB HELD25-Oct-13
Dec-13 Climate-resilient post-harvest processing and storage formaize, cassava, beans, potatoes and dairy value chains;improvement of climate information services and storagebuilding codes
LAC 1598 Bolivia Programa de Adaptación para laAgricultura en Pequeña Escala(ACCESOS)
Blend 10 AG N/A Dec-13 Cataloguing indigenous adaptation knowledge;community-based natural resource management atlandscape-level; climate information management;Competitions for community-based adaptation
LAC 1683 Nicaragua Adapting to changing markets and theeffects of climate change
DHC 8 FB HELD01-Oct-13
Dec-13 Sustainable water resources management; agriculturaldiversification and strengthening of meteorologicalservices in coffee and cocoa value chains
NEN 1672 Yemen Rural Growth Programme D 10 FB HELD20-Sep-13
Dec-13 Integrated watershed management; water conservationin drought-prone areas; rehabilitation and improvementof rural feeder roads; diversifying energy systems in ruralareas
NEN 1671 Djibouti Programme to Reduce Vulnerability inCoastal Fishing Aras
HC 6 FB HELD30-Sep-13
Dec-13 Reducing climate risks in fisheries value chains;participatory management of coastal resources;protection of coastal infrastructure; improved post-harvest cooling and storage; improving access tofreshwater for fisheries value chains; protection ofcoastal mangrove ecosystems and coral reefs
NEN 1626 Kyrgystan Livestock and Market DevelopmentProgramme II
DHC 10 FB HELD02-Oct-13
Dec-13 Protection of livestock from climate-related disasters anddiseases; community-based management andrestoration of degraded pastures and rangelands;climate-resilient dairy value chain; early warning systems
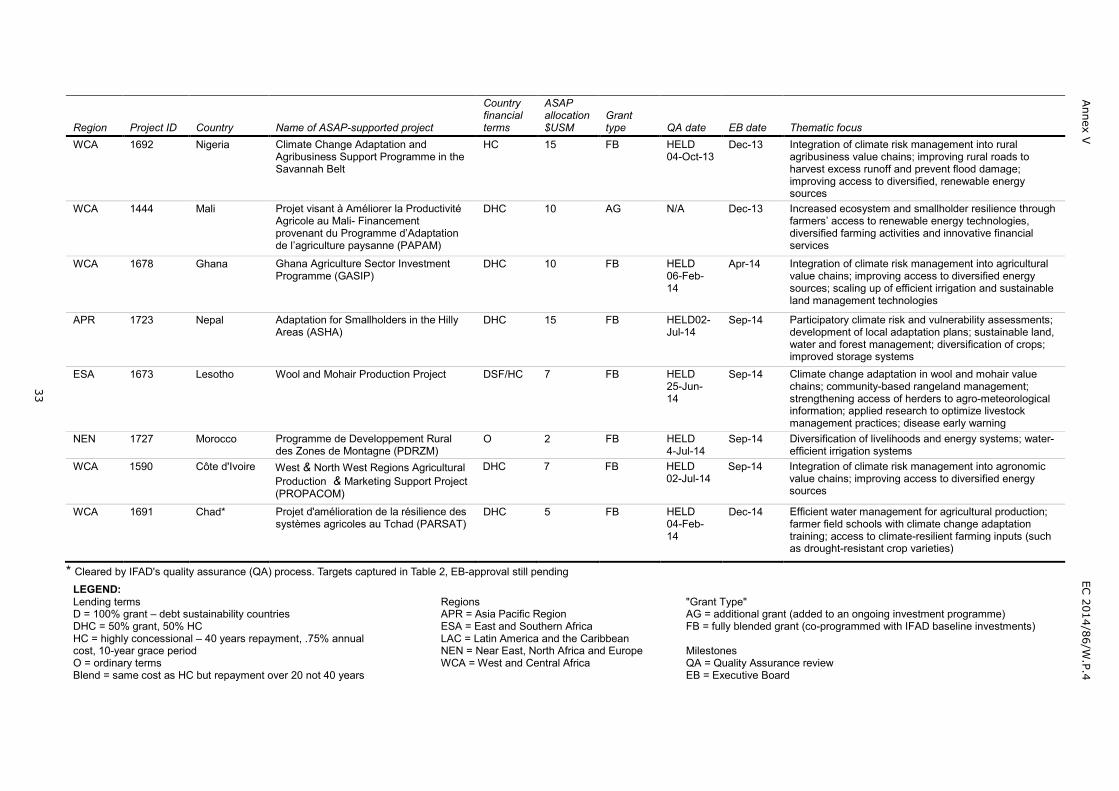
Annex
VEC
2014/86/W.P.4
33
Region Project ID Country Name of ASAP-supported project
Countryfinancialterms
ASAPallocation$USM
Granttype QA date EB date Thematic focus
WCA 1692 Nigeria Climate Change Adaptation andAgribusiness Support Programme in theSavannah Belt
HC 15 FB HELD04-Oct-13
Dec-13 Integration of climate risk management into ruralagribusiness value chains; improving rural roads toharvest excess runoff and prevent flood damage;improving access to diversified, renewable energysources
WCA 1444 Mali Projet visant à Améliorer la ProductivitéAgricole au Mali- Financementprovenant du Programme d’Adaptationde l’agriculture paysanne (PAPAM)
DHC 10 AG N/A Dec-13 Increased ecosystem and smallholder resilience throughfarmers’ access to renewable energy technologies,diversified farming activities and innovative financialservices
WCA 1678 Ghana Ghana Agriculture Sector InvestmentProgramme (GASIP)
DHC 10 FB HELD06-Feb-14
Apr-14 Integration of climate risk management into agriculturalvalue chains; improving access to diversified energysources; scaling up of efficient irrigation and sustainableland management technologies
APR 1723 Nepal Adaptation for Smallholders in the HillyAreas (ASHA)
DHC 15 FB HELD02-Jul-14
Sep-14 Participatory climate risk and vulnerability assessments;development of local adaptation plans; sustainable land,water and forest management; diversification of crops;improved storage systems
ESA 1673 Lesotho Wool and Mohair Production Project DSF/HC 7 FB HELD25-Jun-14
Sep-14 Climate change adaptation in wool and mohair valuechains; community-based rangeland management;strengthening access of herders to agro-meteorologicalinformation; applied research to optimize livestockmanagement practices; disease early warning
NEN 1727 Morocco Programme de Developpement Ruraldes Zones de Montagne (PDRZM)
O 2 FB HELD4-Jul-14
Sep-14 Diversification of livelihoods and energy systems; water-efficient irrigation systems
WCA 1590 Côte d'Ivoire West & North West Regions AgriculturalProduction & Marketing Support Project(PROPACOM)
DHC 7 FB HELD02-Jul-14
Sep-14 Integration of climate risk management into agronomicvalue chains; improving access to diversified energysources
WCA 1691 Chad* Projet d'amélioration de la résilience dessystèmes agricoles au Tchad (PARSAT)
DHC 5 FB HELD04-Feb-14
Dec-14 Efficient water management for agricultural production;farmer field schools with climate change adaptationtraining; access to climate-resilient farming inputs (suchas drought-resistant crop varieties)
* Cleared by IFAD's quality assurance (QA) process. Targets captured in Table 2, EB-approval still pendingLEGEND:Lending termsD = 100% grant – debt sustainability countriesDHC = 50% grant, 50% HCHC = highly concessional – 40 years repayment, .75% annualcost, 10-year grace periodO = ordinary termsBlend = same cost as HC but repayment over 20 not 40 years
RegionsAPR = Asia Pacific RegionESA = East and Southern AfricaLAC = Latin America and the CaribbeanNEN = Near East, North Africa and EuropeWCA = West and Central Africa
"Grant Type"AG = additional grant (added to an ongoing investment programme)FB = fully blended grant (co-programmed with IFAD baseline investments)
MilestonesQA = Quality Assurance reviewEB = Executive Board
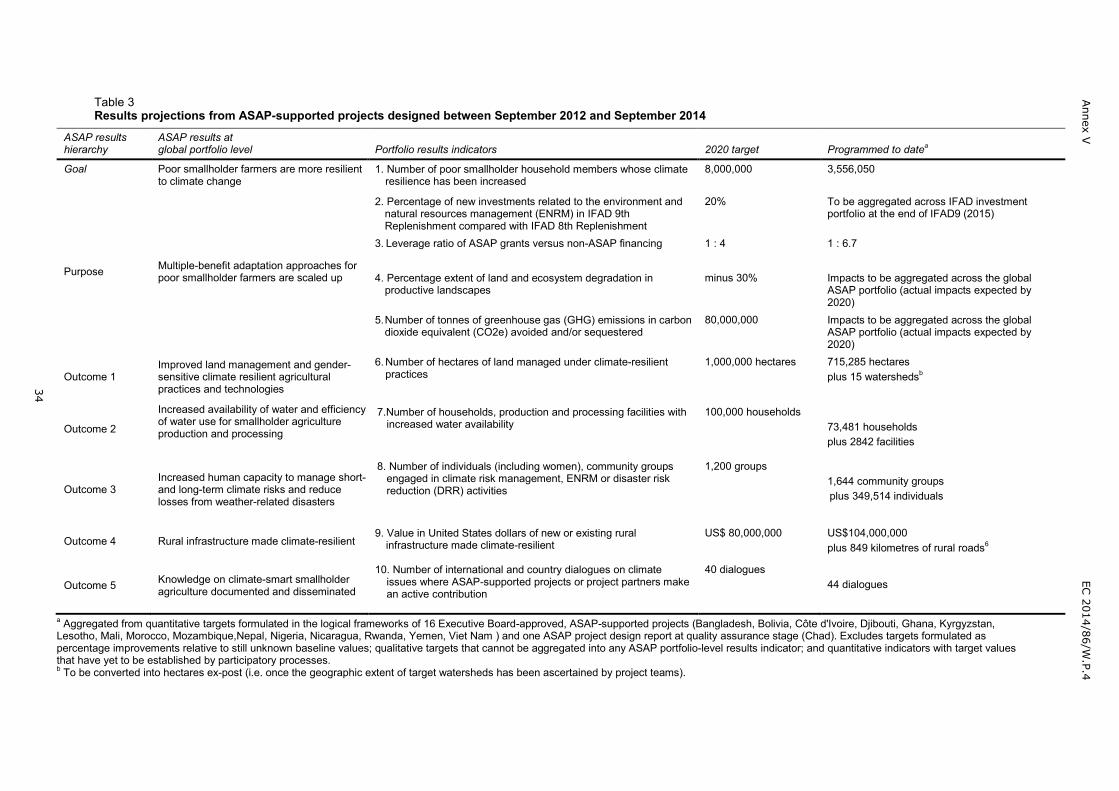
Annex
VEC
2014/86/W.P.4
34
Table 3Results projections from ASAP-supported projects designed between September 2012 and September 2014
ASAP resultshierarchy
ASAP results atglobal portfolio level Portfolio results indicators 2020 target Programmed to datea
Goal Poor smallholder farmers are more resilientto climate change
1. Number of poor smallholder household members whose climateresilience has been increased
8,000,000 3,556,050
Purpose Multiple-benefit adaptation approaches forpoor smallholder farmers are scaled up
2. Percentage of new investments related to the environment andnatural resources management (ENRM) in IFAD 9thReplenishment compared with IFAD 8th Replenishment
20% To be aggregated across IFAD investmentportfolio at the end of IFAD9 (2015)
3. Leverage ratio of ASAP grants versus non-ASAP financing 1 : 4 1 : 6.7
4. Percentage extent of land and ecosystem degradation inproductive landscapes
minus 30% Impacts to be aggregated across the globalASAP portfolio (actual impacts expected by2020)
5.Number of tonnes of greenhouse gas (GHG) emissions in carbondioxide equivalent (CO2e) avoided and/or sequestered
80,000,000 Impacts to be aggregated across the globalASAP portfolio (actual impacts expected by2020)
Outcome 1Improved land management and gender-sensitive climate resilient agriculturalpractices and technologies
6. Number of hectares of land managed under climate-resilientpractices
1,000,000 hectares 715,285 hectaresplus 15 watershedsb
Outcome 2
Increased availability of water and efficiencyof water use for smallholder agricultureproduction and processing
7.Number of households, production and processing facilities withincreased water availability
100,000 households73,481 householdsplus 2842 facilities
Outcome 3Increased human capacity to manage short-and long-term climate risks and reducelosses from weather-related disasters
8. Number of individuals (including women), community groupsengaged in climate risk management, ENRM or disaster riskreduction (DRR) activities
1,200 groups1,644 community groupsplus 349,514 individuals
Outcome 4 Rural infrastructure made climate-resilient9. Value in United States dollars of new or existing rural
infrastructure made climate-resilientUS$ 80,000,000 US$104,000,000
plus 849 kilometres of rural roads6
Outcome 5 Knowledge on climate-smart smallholderagriculture documented and disseminated
10. Number of international and country dialogues on climateissues where ASAP-supported projects or project partners makean active contribution
40 dialogues44 dialogues
a Aggregated from quantitative targets formulated in the logical frameworks of 16 Executive Board-approved, ASAP-supported projects (Bangladesh, Bolivia, Côte d'Ivoire, Djibouti, Ghana, Kyrgyzstan,Lesotho, Mali, Morocco, Mozambique,Nepal, Nigeria, Nicaragua, Rwanda, Yemen, Viet Nam ) and one ASAP project design report at quality assurance stage (Chad). Excludes targets formulated aspercentage improvements relative to still unknown baseline values; qualitative targets that cannot be aggregated into any ASAP portfolio-level results indicator; and quantitative indicators with target valuesthat have yet to be established by participatory processes.b To be converted into hectares ex-post (i.e. once the geographic extent of target watersheds has been ascertained by project teams).
Annex V EC 2014/86/W.P.4
35
ASAP impact on climate mainstreaming3. As a result of ASAP support, one half of all new country strategic opportunities
programmes and one third of all new project designs in IFAD now integrate climatechange adaptation measures. These climate mainstreaming efforts are workingthrough the following pathways:
Better analysis of climate risks and vulnerabilities. More project designs aretaking into account climate-related threats such as droughts, floods, tropicalstorms, sea-level rise and temperature extremes. Example: In Yemen, aclimate risk analysis is influencing the location and engineering design ofstone terraces and rural feeder roads.
More innovation. Adapting to new and emerging risks requires access toinnovative knowledge and technology, including when smallholders arealready in a changing context of increasing market integration. Examples: Asalinity monitoring system is tracking the effects of sea-level rise on riceproduction in Viet Nam; improved building codes and energy technology helpreduce the effects of extreme weather and pest infestations in post-harvestprocessing hubs in Rwanda.
Faster scaling up of sustainable agriculture techniques. IFAD’s track recordin natural resource management provides many platforms to scale upadaptation-relevant technologies. Examples: Agroforestry is being expandedin coffee and cocoa plantations in Nicaragua; watershed management isadopted in degraded landscapes in Bolivia; and sustainable rangelandmanagement in expanded in Kyrgyzstan and Lesotho.
4. In terms of business processes within IFAD, ASAP has catalysed the followinginnovations:
- Climate change adaptation indicators integrated in the Results and ImpactManagement System (RIMS);
- Climate markers integrated into QA review process;- Portfolio review guidelines and project completion report templates updated
to capture climate aspects;- Climate risk screening integrated in the revised social, environmental and
climate assessment process; and- Climate-inclusive economic and financial analysis piloted in selected
investment designs.
ASAP knowledge management5. ASAP is supporting the implementation of an IFAD knowledge management
strategy for climate change adaptation. Key deliverables in 2014 include:
- Learning Alliance for Adaptation in Smallholder Agriculture developed andfinanced jointly with the Consultative Group of International AgriculturalResearch (CGIAR) Programme on Climate Change, Agriculture and FoodSecurity(CCAFS);
- Climate-inclusive economic and financial analysis piloted in selectedinvestment designs;
- A strategy developed jointly with the World Food Programme (WFP) toincrease the use of earth observation and geographic information systems forinvestment design, risk analysis and monitoring;
- Climate change mainstreamed into the IFAD corporate training programmefor staff and project teams; and
- A new series of knowledge products developed.
6. Table 4 below presents ASAP communication and advocacy products developed anddisseminated in 2014 and table 5 the key achievements in ASAP-related advocacyand communications 2014.
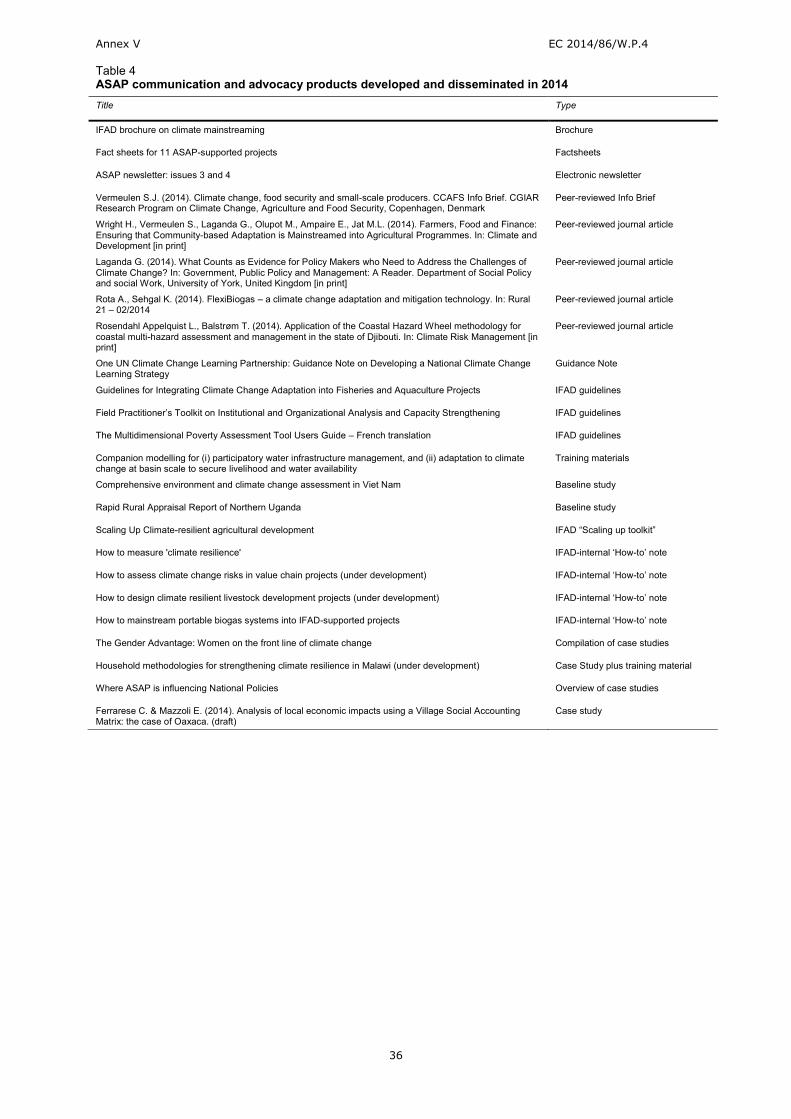
Annex V EC 2014/86/W.P.4
36
Table 4ASAP communication and advocacy products developed and disseminated in 2014Title Type
IFAD brochure on climate mainstreaming Brochure
Fact sheets for 11 ASAP-supported projects Factsheets
ASAP newsletter: issues 3 and 4 Electronic newsletter
Vermeulen S.J. (2014). Climate change, food security and small-scale producers. CCAFS Info Brief. CGIARResearch Program on Climate Change, Agriculture and Food Security, Copenhagen, Denmark
Peer-reviewed Info Brief
Wright H., Vermeulen S., Laganda G., Olupot M., Ampaire E., Jat M.L. (2014). Farmers, Food and Finance:Ensuring that Community-based Adaptation is Mainstreamed into Agricultural Programmes. In: Climate andDevelopment [in print]
Peer-reviewed journal article
Laganda G. (2014). What Counts as Evidence for Policy Makers who Need to Address the Challenges ofClimate Change? In: Government, Public Policy and Management: A Reader. Department of Social Policyand social Work, University of York, United Kingdom [in print]
Peer-reviewed journal article
Rota A., Sehgal K. (2014). FlexiBiogas – a climate change adaptation and mitigation technology. In: Rural21 – 02/2014
Peer-reviewed journal article
Rosendahl Appelquist L., Balstrøm T. (2014). Application of the Coastal Hazard Wheel methodology forcoastal multi-hazard assessment and management in the state of Djibouti. In: Climate Risk Management [inprint]
Peer-reviewed journal article
One UN Climate Change Learning Partnership: Guidance Note on Developing a National Climate ChangeLearning Strategy
Guidance Note
Guidelines for Integrating Climate Change Adaptation into Fisheries and Aquaculture Projects IFAD guidelines
Field Practitioner’s Toolkit on Institutional and Organizational Analysis and Capacity Strengthening IFAD guidelines
The Multidimensional Poverty Assessment Tool Users Guide – French translation IFAD guidelines
Companion modelling for (i) participatory water infrastructure management, and (ii) adaptation to climatechange at basin scale to secure livelihood and water availability
Training materials
Comprehensive environment and climate change assessment in Viet Nam Baseline study
Rapid Rural Appraisal Report of Northern Uganda Baseline study
Scaling Up Climate-resilient agricultural development IFAD “Scaling up toolkit”
How to measure 'climate resilience' IFAD-internal ‘How-to’ note
How to assess climate change risks in value chain projects (under development) IFAD-internal ‘How-to’ note
How to design climate resilient livestock development projects (under development) IFAD-internal ‘How-to’ note
How to mainstream portable biogas systems into IFAD-supported projects IFAD-internal ‘How-to’ note
The Gender Advantage: Women on the front line of climate change Compilation of case studies
Household methodologies for strengthening climate resilience in Malawi (under development) Case Study plus training material
Where ASAP is influencing National Policies Overview of case studies
Ferrarese C. & Mazzoli E. (2014). Analysis of local economic impacts using a Village Social AccountingMatrix: the case of Oaxaca. (draft)
Case study
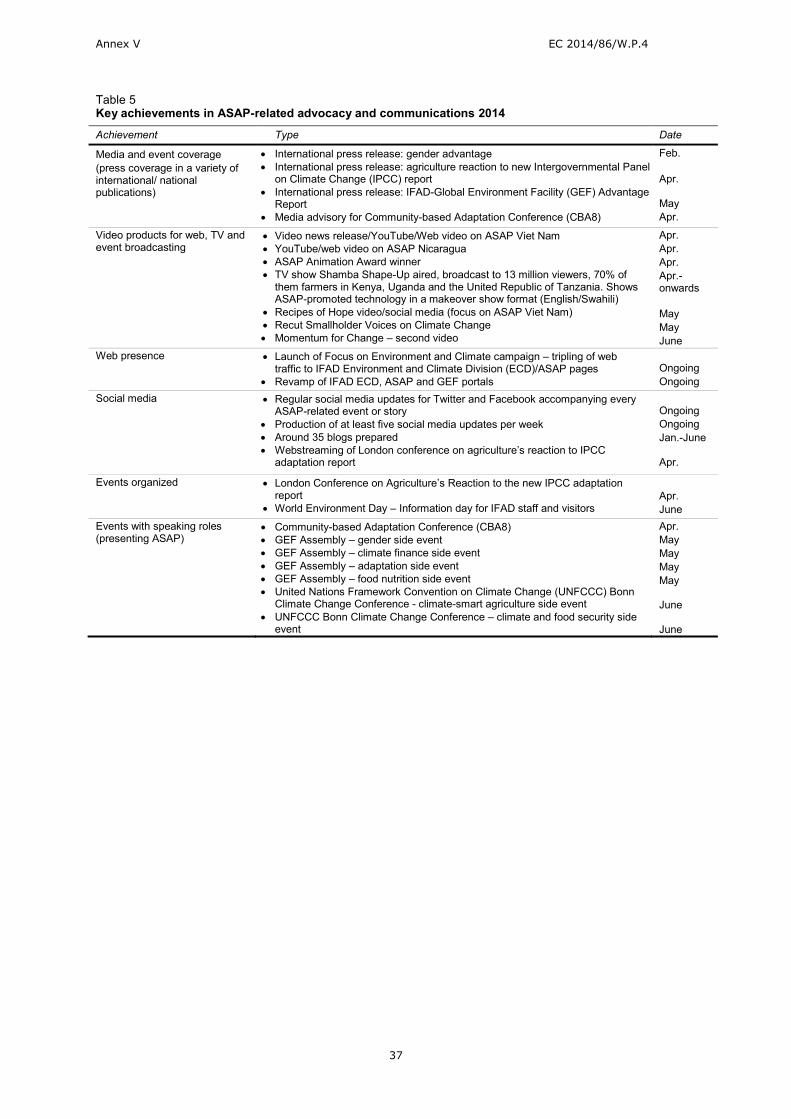
Annex V EC 2014/86/W.P.4
37
Table 5Key achievements in ASAP-related advocacy and communications 2014
Achievement Type Date
Media and event coverage(press coverage in a variety ofinternational/ nationalpublications)
International press release: gender advantage International press release: agriculture reaction to new Intergovernmental Panel
on Climate Change (IPCC) report International press release: IFAD-Global Environment Facility (GEF) Advantage
Report Media advisory for Community-based Adaptation Conference (CBA8)
Feb.
Apr.
MayApr.
Video products for web, TV andevent broadcasting
Video news release/YouTube/Web video on ASAP Viet Nam YouTube/web video on ASAP Nicaragua ASAP Animation Award winner TV show Shamba Shape-Up aired, broadcast to 13 million viewers, 70% of
them farmers in Kenya, Uganda and the United Republic of Tanzania. ShowsASAP-promoted technology in a makeover show format (English/Swahili)
Recipes of Hope video/social media (focus on ASAP Viet Nam) Recut Smallholder Voices on Climate Change Momentum for Change – second video
Apr.Apr.Apr.Apr.-onwards
MayMayJune
Web presence Launch of Focus on Environment and Climate campaign – tripling of webtraffic to IFAD Environment and Climate Division (ECD)/ASAP pages
Revamp of IFAD ECD, ASAP and GEF portalsOngoingOngoing
Social media Regular social media updates for Twitter and Facebook accompanying everyASAP-related event or story
Production of at least five social media updates per week Around 35 blogs prepared Webstreaming of London conference on agriculture’s reaction to IPCC
adaptation report
OngoingOngoingJan.-June
Apr.
Events organized London Conference on Agriculture’s Reaction to the new IPCC adaptationreport
World Environment Day – Information day for IFAD staff and visitorsApr.June
Events with speaking roles(presenting ASAP)
Community-based Adaptation Conference (CBA8) GEF Assembly – gender side event GEF Assembly – climate finance side event GEF Assembly – adaptation side event GEF Assembly – food nutrition side event United Nations Framework Convention on Climate Change (UNFCCC) Bonn
Climate Change Conference - climate-smart agriculture side event UNFCCC Bonn Climate Change Conference – climate and food security side
event
Apr.MayMayMayMay
June
June
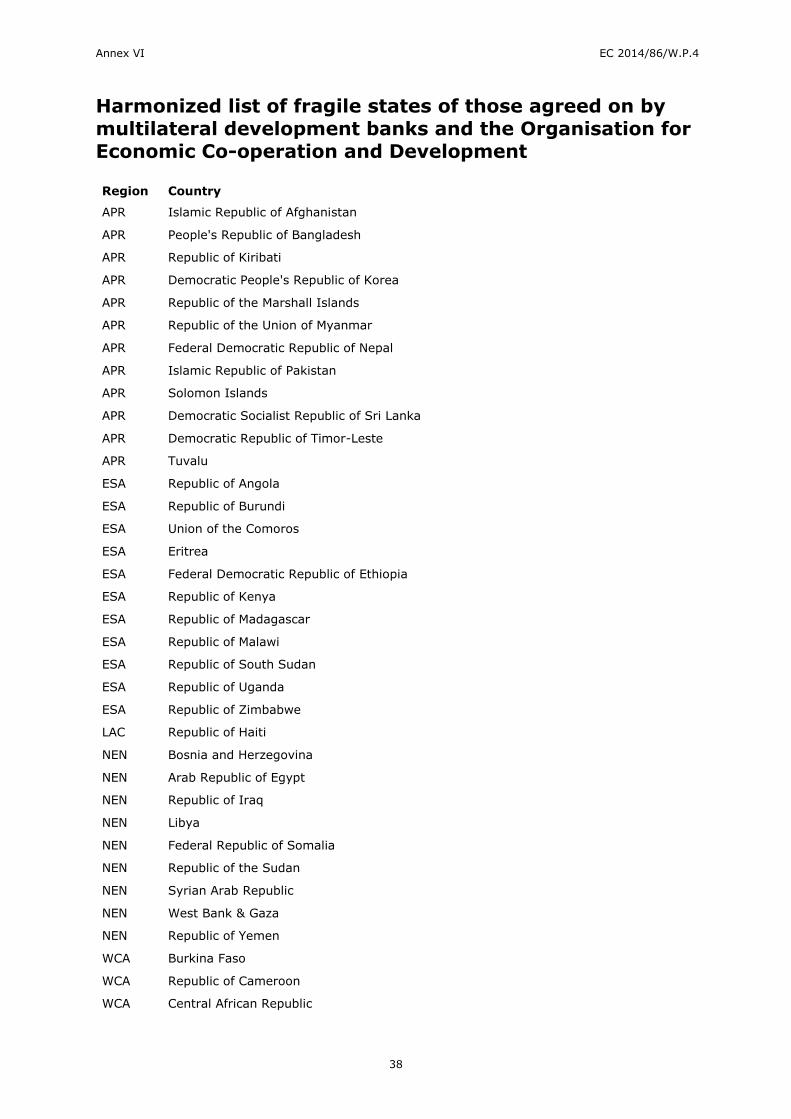
Annex VI EC 2014/86/W.P.4
38
Harmonized list of fragile states of those agreed on bymultilateral development banks and the Organisation forEconomic Co-operation and Development
Region Country
APR Islamic Republic of Afghanistan
APR People's Republic of Bangladesh
APR Republic of Kiribati
APR Democratic People's Republic of Korea
APR Republic of the Marshall Islands
APR Republic of the Union of Myanmar
APR Federal Democratic Republic of Nepal
APR Islamic Republic of Pakistan
APR Solomon Islands
APR Democratic Socialist Republic of Sri Lanka
APR Democratic Republic of Timor-Leste
APR Tuvalu
ESA Republic of Angola
ESA Republic of Burundi
ESA Union of the Comoros
ESA Eritrea
ESA Federal Democratic Republic of Ethiopia
ESA Republic of Kenya
ESA Republic of Madagascar
ESA Republic of Malawi
ESA Republic of South Sudan
ESA Republic of Uganda
ESA Republic of Zimbabwe
LAC Republic of Haiti
NEN Bosnia and Herzegovina
NEN Arab Republic of Egypt
NEN Republic of Iraq
NEN Libya
NEN Federal Republic of Somalia
NEN Republic of the Sudan
NEN Syrian Arab Republic
NEN West Bank & Gaza
NEN Republic of Yemen
WCA Burkina Faso
WCA Republic of Cameroon
WCA Central African Republic
Annex VI EC 2014/86/W.P.4
39
WCA Republic of Chad
WCA Democratic Republic of the Congo
WCA Republic of the Congo
WCA Republic of Côte d'Ivoire
WCA Republic of Guinea
WCA Republic of Guinea Bissau
WCA Republic of Liberia
WCA Republic of Mali
WCA Islamic Republic of Mauritania
WCA Republic of the Niger
WCA Federal Republic of Nigeria
WCA Republic of Sierra Leone
WCA Togolese Republic