Report on Grievance Trends in the Public Service for ... - PSC
96
1 Public Service Commission October 2008 Report on Grievance Trends in the Public Service for the periods 1 April 2006 to 31 March 2007 and 1 April 2007 to 31 March 2008
Transcript of Report on Grievance Trends in the Public Service for ... - PSC
1
Public Service Commission
October 2008
Report on Grievance Trends in the Public Service for the
periods1 April 2006 to 31 March 2007
and1 April 2007 to 31 March 2008
2
Vision
The Public Service Commission is an independent and impartial body created by the Constitution, 1996, to enhance excellence in governance within the Public Service by promoting a professional and ethical environment and adding value to a public administration that is accountable, equitable, efficient, effective, corruption-free and responsive to the needs of the people of South Africa.
Mission
The Public Service Commission aims to promote the constitutionally enshrined democratic principles and values of the Public Service by investigating, monitoring, evaluating, communicating and reporting on public administration. Through research processes, it will ensure the promotion of excellence in governance and the delivery of affordable and sustainable quality services.
3
Published in the Republic of South Africa by:
THE PUBLIC SERVICE COMMISSIONCommission House
Cnr. Hamilton & Ziervogel StreetsArcadia, 0083
Private Bag x121Pretoria, 0001
Tel: (012) 352-1000Fax: (012) 325-8382
E-mail: [email protected]: www.psc.gov.za
National Anti-Corruption Hotline Number for the Public Service:0800 701 701 (Toll-Free)
Compiled by Branch: Leadership and Management Practices
Distributed by Directorate: Communication and Information Services
Printed by: Silowa Printers
ISBN: 978-0-621-38465-9RP: 19/2009
Report on Grievance Trends in the Public Service for the periods
1 April 2006 to 31 March 2007 and1 April 2007 to 31 March 2008
i
ii
ForewordThe Public Service Commission (PSC) is pleased to release its second report on the Grievance Trends in the Public Service in terms of the provisions of section 196 of the Constitution of the Republic of South Africa, 1996 (as amended).
Although the objective of consideration of grievances by the PSC is amongst others to ensure that labour peace is promoted and to enhance service delivery, there is a need to continuously advise the stakeholders on all relevant observations made in the management of grievances in the Public Service. The PSC in accordance with its constitutional mandate as per section 196 (4) (f ) (ii) of the Constitution has over the last two financial years assessed the management of grievances referred to it for consideration, as well as the grievance resolution reports submitted by departments in terms of the Grievance Rules.
From the data collected and analysed from these two sources, the PSC is able to provide an incomparable indication of how far, if at all, departments have advanced in handling dissatisfactions in employer-employee relations. It is critical to continuously raise awareness on the possible causes of grievances and to empower managers to handle grievances effectively by revealing the consequences of failure to adhere to the applicable procedures and policies in the Public Service.
Unless a dissatisfaction is addressed as soon as it arises and as close as possible to the point of origin, the Public Service will not be able to improve and advance to the optimal utilisation of the resources at its disposal. The Public Service therefore, needs to ensure that all dissatisfactions are dealt with decisively and where short-comings are identified, these are addressed positively, effectively and within the prescribed period.
This report provides the findings on major causes of grievances, trends on the management of grievances of employees in the Public Service as well as recommendations on improving the shortcomings identified.
PROF SS SANGWENICHAIRPERSON: PUBLIC SERVICE COMMISSION
iii
Table of Contents FOREWORD iiLIST OF TABLES ivLIST OF FIGURES vGLOSSARY viEXECUTIVE SUMMARY vii
CHAPTER 1: INTRODUCTION 11.1 Introduction to the Study 21.2 Objectives of the Report 21.3 Legislative Framework and Context 31.4 Scope of the project 41.5 Methodology 41.6 Limitations 51.7 Structure of the Report 6 CHAPTER 2: OVERVIEW OF GRIEVANCE RESOLUTION IN THE PUBLIC SERVICE 72.1 Introduction 82.2 Grievance Procedures in the Public Service 82.3 Rules for dealing with the grievances of employees in the Public Service 102.4 Grievance resolution in the Public Service Co-ordinating Bargaining Council 11
CHAPTER 3: GRIEVANCE RESOLUTION WITHIN DEPARTMENTS 13 3.1 Introduction 143.2 Total number of grievances lodged with National and Provincial Departments 143.3 Grievance Resolution at National Level 143.3.1 Grievances lodged with national departments 143.3.2 Causes of grievances 163.3.3 Racial and gender distribution 163.3.4 Status of grievances within national departments 183.4 Grievance Resolution at Provincial Level 213.4.1 Eastern Cape Province 213.4.2 Free State Province 263.4.3 Gauteng Province 30 3.4.4 KwaZulu-Natal Province 353.4.5 Limpopo Province 393.4.6 Mpumalanga Province 443.4.7 Northern Cape Province 483.4.8 North West Province 523.4.9 Western Cape Province 57
CHAPTER 4: HANDLING OF GRIEVANCES BY THE PUBLIC SERVICE COMMISSION 624.1 Introduction 63 4.2 Mandate of the PSC in grievance resolution 634.2.1 Number of grievances referred to the PSC 64
iv
4.2.2 Grievances referred to the PSC prematurely 654.2.3 Status of grievances with the PSC 674.2.4 Causes of grievances referred to the PSC 674.2.5 Racial and gender distribution of aggrieved employees 684.3 Challenges faced by the PSC in the consideration of grievances 70
CHAPTER 5: GRIEVANCE TRENDS IN THE PUBLIC SERVICE 715.1 Introduction 725.2 Analysis of grievance trends in the Public Service 725.2.1 Number of grievances lodged in the Public Service 725.2.2 Underlying causes of grievances 725.2.3 Timely resolution of grievances 745.2.4 High number of unresolved grievances 75
CHAPTER 6: CONCLUSION AND RECOMMENDATIONS FOR THE IMPROVEMENT OF GRIEVANCE MANAGEMENT 766.1 Introduction 776.2 Responsibility of Managers 776.3 Number of grievances lodged in the Public Service 776.4 Underlying causes of grievances 776.5 Difficulties in adhering to time frames, low grievance resolution rates and a resultant high number of unresolved grievances 786.6 Recommendations 78
LIST OF TABLESTABLE 1: Grievance Procedures in the Public Service 8TABLE 2: Total number of grievances lodged with National and Provincial Departments 14TABLE 3: Number of grievances lodged with National Departments for the two reporting periods 15TABLE 4: Causes of Grievances in National Departments 16TABLE 5: Status of grievances per National Department 18TABLE 6: Reports of Provinces on grievance statistics for the reporting period 21TABLE 7: Causes of grievances in the Eastern Cape Province 22TABLE 8: Number of grievances lodged with the Eastern Cape Province 24TABLE 9: Causes of grievances in the Free State Province 27TABLE 10: Number and status of grievances in the Free State Province 29TABLE 11: Causes of grievances in the Gauteng Province 31TABLE 12: Number and status of grievances in the Gauteng Province 33TABLE 13: Causes of grievances in the KwaZulu-Natal Province 36TABLE 14: Number and status of grievances in the KwaZulu-Natal Province 38TABLE 15: Causes of grievances in the Limpopo Province 40TABLE 16: Number and status of grievances in the Limpopo Province 42TABLE 17: Causes of grievances in the Mpumalanga Province 45TABLE 18: Number and status of grievances in the Mpumalanga Province 46TABLE 19: Causes of grievances in the Northern Cape Province 49TABLE 20: Number and status of grievances in the Northern Cape Province 51TABLE 21: Causes of grievances in the North West Province 53TABLE 22: Number and status of grievances in the North West Province 55TABLE 23: Causes of grievances in the Western Cape Province 58TABLE 24: Number and status of grievances in the Western Cape Province 60
v
TABLE 25: Number of grievances referred to the PSC 65TABLE 26: Breakdown of grievances referred by the PSC 66TABLE 27: Status of grievances received by the PSC 67TABLE 28: Causes of grievances referred to the PSC 67TABLE 29: Number of grievances 72TABLE 30: Causes of grievances in the South African Public Service 73TABLE 31: Grievance finalisation rates (%) 75
LIST OF FIGURESFIGURE 1: Racial distribution of aggrieved employees in National Departments 17FIGURE 2: Gender distribution of aggrieved employees in National Departments 17FIGURE 3: Number of grievances per department for the two reporting periods 22FIGURE 4: Racial distribution of aggrieved employees in the Eastern Cape Province 23FIGURE 5: Gender distribution of aggrieved employees in the Eastern Cape Province 24FIGURE 6: Number of grievances per department for the two reporting periods 26FIGURE 7: Racial distribution of aggrieved employees in the Free State Province 28FIGURE 8: Gender distribution of aggrieved employees in the Free State Province 28FIGURE 9: Number of grievances per department for the two reporting periods 31FIGURE 10: Racial distribution of aggrieved employees in the Gauteng Province 32FIGURE 11: Gender distributions of aggrieved employees in the Gauteng Province 33FIGURE 12: Number of grievances per department for the two reporting periods 35FIGURE 13: Racial distribution of aggrieved employees in the KwaZulu-Natal Province 37FIGURE 14: Gender distribution of aggrieved employees in the KwaZulu-Natal Province 37FIGURE 15: Number of grievances per department for the two reporting periods 40FIGURE 16: Racial distribution of aggrieved employees in the Limpopo Province 41FIGURE 17: Gender distribution of aggrieved employees in the Limpopo Province 42FIGURE 18: Number of grievances per department for the two reporting periods 44FIGURE 19: Racial distribution of aggrieved employees in the Mpumalanga Province 45FIGURE 20: Gender distribution of aggrieved employees in the Mpumalanga Province 46FIGURE 21: Number of grievances per department for the two reporting periods 48FIGURE 22: Racial distribution of aggrieved employees in the Northern Cape Province 50FIGURE 23: Gender distribution of aggrieved employees in the Northern Cape Province 50FIGURE 24: Number of grievances per department for the two reporting periods 53FIGURE 25: Racial distribution of aggrieved employees in the North West Province 54FIGURE 26: Gender distribution of aggrieved employees in the North West Province 55FIGURE 27: Number of grievances per department for the two reporting periods 57FIGURE 28: Racial distribution of aggrieved employees in the Western Cape Province 59FIGURE 29: Gender distribution of aggrieved employees in the Western Cape Provincial Administration 59FIGURE 30: Number of grievances referred to the PSC 64FIGURE 31: Racial distribution of aggrieved employees 69FIGURE 32: Gender distribution of aggrieved employees 69

vi
Glossary
Day : refers to working daysEmployee : refers to an officer or employee as contemplated in section 2(1) of the Public Service Act, 1994 (as amended)EA : refers to an Executive Authority of a DepartmentGrievance : refers to a dissatisfaction regarding an official act or omission by the employer which adversely affects an employee in the employ- ment relationship, excluding an alleged unfair dismissalGrievance Rules, 2003 : refers to the Grievance Rules promulgated in Government Gazette No. 7722, Vol. 457 No. 25209 on 25 July 2003 Head of Department (HoD) : refers to a person as defined in section 12(2) of the Public Service Act, 1994 (as amended)HR : refers to human resourcesLine manager : refers to a member of the Senior Management Service charged with a range of responsibilities that are part of a department’s core functionLRA : refers to the Labour Relations Act 66 of 1995LR : refers to labour relationsManager : refers to a member of the Public Service’s Senior Management ServiceNational department/ department at national level : refers to a department listed in Schedule 2 of the Public Service Act, 1994 (as amended)PMDS : refers to the Public Service’s Performance Management and Deve- lopment SystemPFMA : refers to the Public Finance Management Act, 1999Prescribed timeframe : refers to the timeframe prescribed in the Grievance Rules within which a grievance must be lodged by an employee and or time- frame within which a grievance must be resolved by a departmentProvincial department/ department at provincial level : refers to a Public Service department that is part of one of the nine Provincial Administrations of the Republic of South AfricaPSC : refers to the Public Service Commission as established in terms of section 196 of the Constitution of the Republic of South Africa, 1996PSCBC : refers to the Public Service Co-ordinating Bargaining CouncilSupervisor : refers to any employee in charge of an organisational unit that is on a salary level below that of the Senior Management Service
vii
Executive Summary1. INTRODUCTION
The management of grievance resolution in the Public Service is one of the key factors in the promotion of labour peace. In order to address the discontent of employees, departments should ensure that grievances are resolved effectively and efficiently and as close to the point of origin as possible. In that way valuable capital and human resource utilisation by departments will focus on its central mandate, i.e. service delivery through employees that are more content and confident in the departments’ ability to address their grievances effectively and promptly.
As part of its constitutional mandate to enhance labour relations in the Public Service, the Public Service Commission (PSC) continues to consider grievances that are properly referred to it in terms of the Public Service Act, 1994 (as amended) and to monitor grievance resolution through the six monthly reports submitted to it by departments in terms of the Grievance Rules. As the grievance resolution reports were previously submitted in terms of a calendar year, one of the recommendations of the PSC in the first Grievance Trends Report was that the six monthly reports should be submitted in line with the financial year. The PSC then requested the Heads of Department (HoDs) to submit grievance resolution reports with effect from 1 April 2007 until March 2008.
The PSC captures the information on grievances that are referred to it for consideration in a database from which an analysis of trends is then done. A separate database was developed by the PSC to capture data from the six monthly reports that are submitted by the HoDs. Through these two databases the PSC continues to monitor and evaluate the grievance trends in the Public Service. Although the primary role of the PSC with regards to the resolution of grievances is to consider grievances that are properly referred after the internal departmental procedure has been finalised, the majority of cases are prematurely referred to the PSC. In these instances the PSC has continuously ensured that these matters are referred back to departments for compliance with the Grievance Rules and by following up with departments. HoDs who do not comply, are summonsed to appear before the PSC and give reasons why grievances remain unresolved over extended periods. Through these hearings arising from the summonsing the HoDs, the PSC has been able to establish the challenges experienced by departments in grievance resolution.
2. OBJECTIVES
As with the first Grievance Trends report, the objectives of this report are to -
provide a statistical overview of grievances in the Public Service, internal to departments and grievances • referred to the PSC for consideration; analyse grievance trends and causes of grievances in the Public Service; • assess overall management of grievance resolution in the Public Service;• provide a report on grievance trends in the Public Service; and• make• recommendations on the management of grievances in the Public Service.
3. METHODOLOGY
In order to meet the objectives of this research report, the following methodology was adopted:
Narrow literature review of publications relating to the promotion of labour relations with specific reference • to management of grievances was conducted.

viii
This was done in tandem with the analysis of databases that were developed by the PSC covering the following periods:
Limited reference to the 2005/2006 financial year data;• Data on six monthly reports submitted by departments for the periods 2006/2007 and 2007/2008 financial • years; andDatabase on grievances received by the PSC for the financial years 2006/2007 and 2007/2008. •
The departments were requested to use the following format for submission of grievance resolution reports:
The date on which a grievance was received by the Department.• Biographical data of the aggrieved employee such as name, gender, race and rank.• The nature of the grievance.• The status of the grievance as at the end of the reporting period.• The date on which the grievance was finalised.• The outcome of finalised grievances. • The name of the institution if the grievance has been referred.•
The PSC also considered feedback from continuous interaction with departments. These interactions occur when the PSC conducts workshops for departments upon request to raise awareness on challenges experienced in management of grievances. Furthermore when the HoDs are summonsed to provide the PSC with reasons for delays in handling of grievances that are prematurely referred to the PSC, the explanations that they give outline the difficulties that departments are faced with in the management of grievances.
4. LIMITATIONS
The limitations experienced during the study related largely to the collection of data for purpose of this report and are the following:
For the 2006/2007 financial year, 62% national and provincial departments and for the 2007/2008 financial • year, 46% national and provincial departments, submitted their reports after the due date indicated in the circulars. This resulted in the delay of the analysis into the reporting of grievances.
Despite being provided with a reporting format, 21% of departments still submitted inaccurate and incomplete • information to the PSC. In such cases the PSC had no choice but to return the reports to the said departments for accurate completion of the required data, resulting in further delays in updating the database of the PSC.
The departments submitted additional categories of nature of grievances over and above the ones determined • by the PSC. This made it difficult to capture on the database of the PSC, as the PSC had to interpret the categories of the departments to ensure that it fits in the categories determined by the PSC.
The accuracy of some statistics received from departments could not be verified due to capacity constraints • of conducting inspection in loco in all departments. The information received is taken at face value and a margin of error factor of 3 % may be used as a norm.
Due to the overlap of three months in the reporting period covered in this report with the first Grievance • Trends report, comparison could not be made on statistics submitted by departments.
ix
5. MAIN FINDINGS
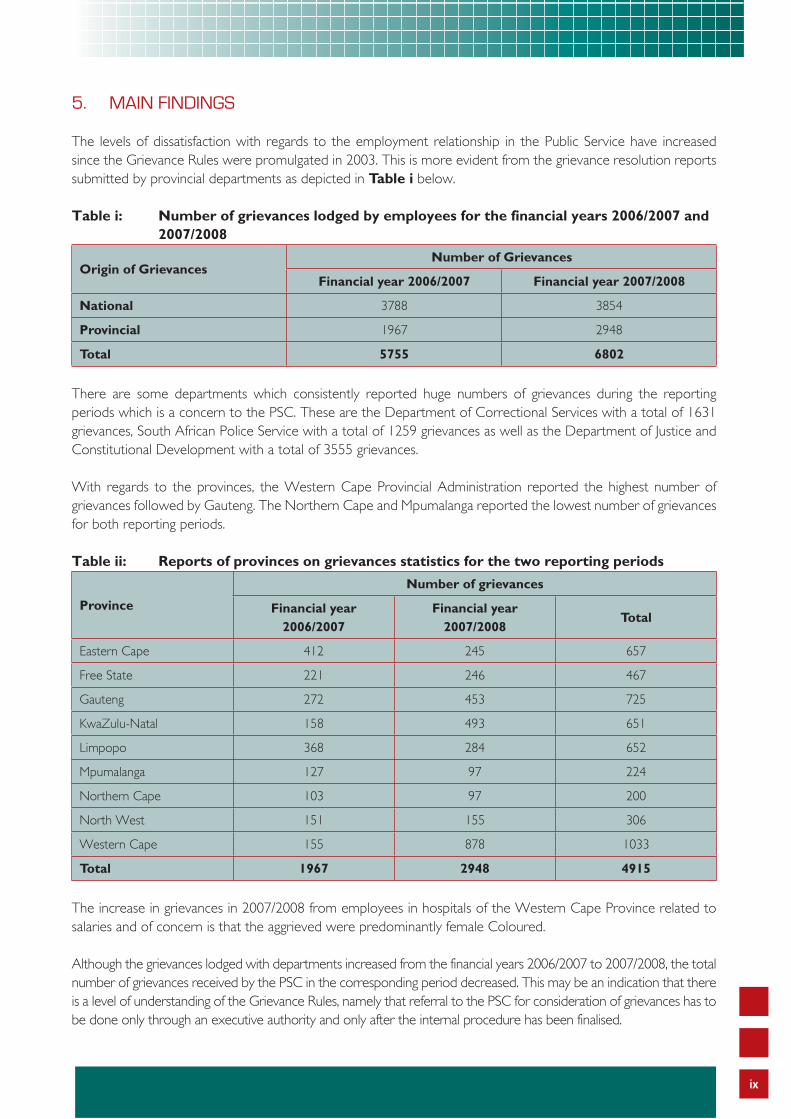
The levels of dissatisfaction with regards to the employment relationship in the Public Service have increased since the Grievance Rules were promulgated in 2003. This is more evident from the grievance resolution reports submitted by provincial departments as depicted in Table i below.
Table i: Number of grievances lodged by employees for the financial years 2006/2007 and 2007/2008
Origin of GrievancesNumber of Grievances
Financial year 2006/2007 Financial year 2007/2008
National 3788 3854
Provincial 1967 2948
Total 5755 6802
There are some departments which consistently reported huge numbers of grievances during the reporting periods which is a concern to the PSC. These are the Department of Correctional Services with a total of 1631 grievances, South African Police Service with a total of 1259 grievances as well as the Department of Justice and Constitutional Development with a total of 3555 grievances.
With regards to the provinces, the Western Cape Provincial Administration reported the highest number of grievances followed by Gauteng. The Northern Cape and Mpumalanga reported the lowest number of grievances for both reporting periods.
Table ii: Reports of provinces on grievances statistics for the two reporting periods
Province
Number of grievances
Financial year 2006/2007
Financial year 2007/2008
Total
Eastern Cape 412 245 657
Free State 221 246 467
Gauteng 272 453 725
KwaZulu-Natal 158 493 651
Limpopo 368 284 652
Mpumalanga 127 97 224
Northern Cape 103 97 200
North West 151 155 306
Western Cape 155 878 1033
Total 1967 2948 4915
The increase in grievances in 2007/2008 from employees in hospitals of the Western Cape Province related to salaries and of concern is that the aggrieved were predominantly female Coloured.
Although the grievances lodged with departments increased from the financial years 2006/2007 to 2007/2008, the total number of grievances received by the PSC in the corresponding period decreased. This may be an indication that there is a level of understanding of the Grievance Rules, namely that referral to the PSC for consideration of grievances has to be done only through an executive authority and only after the internal procedure has been finalised.
x
Performance assessment related problems remain the major cause for dissatisfaction among employees in the Public Service except for the Provincial Administrations of Gauteng (unfair treatment), Mpumalanga (unfair treatment) Northern Cape (unfair treatment) and Western Cape (salary problems). The nature of grievances referred to the PSC for consideration in both reporting periods are predominantly related to salary problems, followed by performance assessment matters.
Of concern is that the three major causes of dissatisfactions among employees consistently relate to the financial status and/or remuneration of employees in the Public Service. There is thus a need to broadly investigate practices and procedures in the application of policies on performance assessment, recruitment and selection as well as salary related matters. Hopefully, on the implementation of the Public Service Co-ordinating Bargaining Council’s (PSCBC) Resolution 1 of 2007 when the Agreement on Improvement of Salaries and Other Conditions of Service for the financial years 2007/2008 to 2010/2011 becomes enforceable, the main causes of grievances will ultimately be addressed. The PSC will continue to analyse grievance trends in the Public Service and the causes thereof.
The Grievance Rules provide for periods within which grievances have to be handled by both departments and the PSC. Compliance with time frames especially the 30 days within which departments must finalise processing grievances is met by not more than 20% of departments across the Public Service.
As a result of delays in finalisation of grievances internally, the aggrieved employees or their labour unions continue to refer cases to the PSC prematurely. These cases are then referred back to departments for compliance with the Grievance Rules until they are either internally resolved or referred to PSC by the executive authority, if the aggrieved remains dissatisfied and so requests. The PSC is invariably also unable to finalise grievances on time due to premature referrals and the submission of incomplete information when grievances are properly referred to it. The HoDs whose departments are not co-operative have been summonsed by the PSC to furnish reasons why there are delays in submission of information and or documents required.
6. CONCLUSION AND RECOMMENDATIONS
The failure by departments to timely provide the PSC with the complete and accurate reports on the resolution of grievances within departments, impacts negatively on the effective monitoring of the management of grievance resolution by departments. This also affects the PSC’s ability to accurately report to the National Assembly and provincial legislatures in terms of Rule I.2 of the Grievance Rules, 2003 read with section 196 (5) and (6) of the Constitution.
Non adherence to the prescribed time frames during processing of grievances, submission of inaccurate and insufficient information by departments to the PSC upon request, remain a major stumbling block for the PSC in carrying out its mandate to enhance labour relations in the Public Service.
The PSC found overwhelming evidence that departments fall short at keeping proper records on the management of grievances. These impact negatively on the departments’ ability to address employee dissatisfaction constructively as there are no mechanisms to establish what causes these problems, and how these are monitored internally to reduce recurrence.
In order to address these limitations the PSC will consider mechanisms to improve the collection of data which may be followed-up with random announced inspection in loco to verify the validity of reports submitted by departments. Furthermore the PSC will proceed to use its powers to summons relevant officials in terms of Section 10 (2) (a) of the Public Service Commission Act, 1997, to ensure that accurate information requested from HoDs is obtained on time and in the correct format.
xi
In this study the PSC was able to determine if there were any improvements with regard to challenges identified in the first Grievance Trends Report on grievance management. On the one hand, some of the supervisors appear not to have adequate skills and knowledge to manage dissatisfactions of employees. On the other hand labour relations practitioners seem not to provide the required support and advice to supervisors on human resource management and specifically the management of grievances.
The PSC recommends that departments give the following urgent attention:
Grievance management must be a standard item for inclusion into managers Performance Agreements and • supervisors Workplace Agreements.
Managers and supervisors should be provided with training and guidance on interpersonal and technical • skills to deal with grievances. This can easily be achieved by hosting in-house role-playing workshops to demonstrate typical approaches in dealing with emotionally laden situations by remaining calm, concentrating on facts and not respond to accusations, verbal hostility, emotional outbursts, etc. but to merely communicate understanding for employees feelings, and undertake to look into alleged acts or omissions that have upset employees. Managers and supervisors should also be encouraged to consult with HR and LR on the latter.
The PSC has come to realise that managers and supervisors do not receive adequate advisory and facilitation • support from human resource and labour relations practitioners. Managers and supervisors often do not have the requisite knowledge and skills to deal with grievances. This reinforces the critical importance that should be provided by HR and LR Practitioners, and calls for a repositioning of these practitioners to respond to such needs proactively.
HR and LR Practitioners should follow up on outstanding grievances and use this opportunity to provide • assistance and advice.
Departments should establish a monitoring system to analyse their own grievance trends in order to identify • typical policies and practices, and the manner in which these are applied, that are inclined cause high numbers of grievances, and address any shortcomings contained therein proactively to -
prevent further grievances of a similar nature from arising; and• assist in working down the large number of grievances that are pending.•
The PSC remains focused on ensuring that labour relations is enhanced and will continue to sensitise the different role-players in Public Service labour relations of their responsibilities and functions so that service delivery to the public is not adversely affected by dissatisfaction.
Cha
pter
One
Introduction
1
2
1.1 INTRODUCTION TO THE STUDY
An understanding of the grievance procedure is vital for the improvement of labour relations within a department. According to research conducted by Bohlander1 on the application of grievance procedures in the United States, the advantages of the effective application of a grievance procedure includes flexibility in the adjudication of labour related problems of employees. The grievance procedure may also provide a channel for employees to express their dissatisfaction in the employment relationship and decrease the “us vs. them” attitude. Bohlander2, in his research further states that one of the essentials for the effective application of the grievance procedure is the ability to identify practices, procedures, and administrative policies that are causing employees to complain so that changes can be considered. Grievances, when viewed in a positive manner, provide valuable feedback to managers regarding either sub unit or total departmental performance.
In order to promote sound labour relations within the Public Service and provide employees with the opportunity and procedure to raise issues that impact negatively on their employment relationship, the Grievance Rules for the Public Service were published in Government Gazette No. 25209 of 25 July 2003 (the Grievance Rules). The Grievance Rules are in line with fair labour principles such as consistency, transparency and the resolution of grievances as close to the point of origin as possible. The grievance procedure provided in the Grievance Rules should therefore be regarded as more than just a means of managing conflict in the workplace. It should be regarded as a management tool to ensure that labour harmony is maintained in the workplace. According to Grogan3, it is generally advisable for an employee to resort to the grievance procedure before any form of statutory relief can be considered. Furthermore, the labour court has held that the grievance procedure should be utilised to promote labour peace and that no employee should be victimised through dismissal or any form of prejudice because the employee utilised the internal grievance procedure4.
As the custodian of good governance, which includes the promotion of sound labour relations within the Public Service, the Public Service Commission (PSC) is in an ideal position to provide a deeper insight into the trends, practices and management approaches that impede, support and/or enhance the promotion of labour relations in the Public Service. As a result of the PSC’s investigation of grievances, and the impact on labour relations within the Public Service, the PSC drafted a Grievance Trends Report5 for the period 01 January 2005 to June 2006. This Report provided a statistical overview of grievances in the Public Service for the period under review, an analysis of the trends and causes of grievances, the management of grievances and provides recommendations on the improvement of grievance management within the Public Service.
This report is the second in a series of annual reports that will be produced by the PSC on Grievance Trends in the Public Service. It provides insight in the trends in the management of grievances in the Public Service. The first Grievance Trends report6 covered six monthly periods determined according to calendar year, in other words is from 1 January 2005 until June 2006. However, this report deals with the grievance resolution reports in the Public Service in respect of the reporting periods, namely the financials years 2006/2007 and 2007/2008, to be in line with all reporting in the Public Service. For this reason, the statistics in this report will include three months of the reporting period April to June 2006, which has already been reported on by the PSC in its first Grievance Trends report7.
1.2 OBJECTIVES OF THE REPORT
As with the first Grievance Trends report, the objectives of this report are to -
1 Bohlander George: Managing Human Resources, 14th edition South –West College, (February 7, 2006). 2 Ibid.3 Grogan J: Workplace Law 7th Edition 2003, Juta Law page 89.4 Mackay v ABSA and another (2000) 21 ILJ 2054 (LJ). 5 Republic of South Africa. Public Service Commission. Report on Grievance Trends in the Public Service 2007.6 Ibid page xiv.7 Ibid.

3
provide a statistical overview of grievances in the Public Service, internal to departments and grievances • referred to the PSC for consideration; analyse grievance trends and causes of grievances in the Public Service; • assess overall management of grievance resolution in the Public Service;• provide a report on grievance trends in the Public Service; and• make• recommendations on the management of grievances in the Public Service.
1.3 LEGISLATIVE FRAMEWORK AND CONTEXT
In terms of section 196 (4) of the Constitution of the Republic of South Africa, 19968 (the Constitution), the PSC is mandated -
“(a) to promote the values and principles set out in section 195, throughout the public service;(b) to investigate, monitor and evaluate the organisation and administration, and the personnel practices, of the
public service;(c) to propose measures to ensure effective and efficient performance within the public service;(d) to give directions aimed at ensuring the personnel procedures relating to recruitment, transfers, promotions
and dismissals comply with the values and principles set out in section 195;(e) to report in respect of its activities and the performance of its functions, including any finding it may give, and
to provide an evaluation of the extent to which the values and principles set out in section 195 are complied with; and
(f) either of its own accord or on receipt of any complaint –(i) to investigate and evaluate the application of personnel and public administration practices, and to report
to the relevant executive authority and legislature;(ii) to investigate grievances of employees in the public service concerning official acts of omissions, and
recommend appropriate remedies;(iii) to monitor and investigate adherence to applicable procedures in the public service; and(iv) to advise national and provincial organs of state regarding personnel practices in the public service,
including those relating to the recruitment, appointment, transfer, discharge and other aspects of the careers of employees in the public service.”
In terms of section 196 (5) of the Constitution, the PSC is accountable to the National Assembly. The PSC must also report in terms of section 196 (6) at least once a year to the National Assembly and in respect of its activities in a province to the legislature of the respective provinces.
It is further provided in section 11 of the Public Service Commission Act, 19979, that the PSC may make rules as to -
“(a) the investigation, monitoring and evaluation of those matters to which section 196 (4) of the Constitution relates…”
In terms of section 35(1) of the Public Service Act, 1994 (as amended)10, an officer or employee may, for the purpose of asserting his/her right in this regard, lodge a complaint or grievance concerning an official act or omission with the relevant executing authority under the circumstances/ conditions/ manner laid down by the PSC’s rules in this regard. If that complaint or grievance is not resolved to the satisfaction of such an officer or employee, the relevant executive authority (EA) shall submit the complaint or grievance to the PSC in the manner and time or within the period prescribed by the PSC.
8 Republic of South Africa: Constitution of South Africa, Act 108 of 1996.9 Republic of South Africa: Public Service Commission Act, Act no 46 of 1997.10 Republic of South Africa: Public Service Act, Act no 35 of 1994 (as amended).

4
The Rules for dealing with the grievances of employees in the Public Service (the Grievance Rules) were negotiated and agreed upon in the Public Service Co-ordinating Bargaining Council (PSCBC) as Resolution 14 of 2002 and were published in Government Gazette Number 25209 of 25 July 200311. The Grievance Rules subsequently came into effect on 19 September 2003. Rule I.1 of the Grievance Rules, 2003 determines that HoDs must ensure that grievance resolution is evaluated by maintaining a record of the number of grievances resolved from the beginning of each calendar year and report to the PSC on a six-monthly basis. In terms of Rule I.2 of the Grievance Rules, 2003, the PSC must report on the management of grievances and the efficiency of the grievance procedure at least once a year to the National Assembly and in respect of its activities in a Province to the legislature of that province.
Service departments falling outside the Public Service Act, 1994 (as amended) have in terms of the collective agreements developed their own grievance rules. These service departments are the South African Police Service (SAPS), the Department of Defence, the South African Secret Service (SASS), the National Intelligence Agency (NIA) and the Department of Correctional Services (DCS). However, such grievance procedures do not preclude the jurisdiction of the PSC to investigate grievances that emanate from these sectors. Before entering into such investigations however the PSC does allow for the internal process in accordance with the departmental grievance procedure to first run its course. Grievances from these service sector departments, if referred to the PSC for consideration, are investigated in terms of the powers as outlined in section 196 (4) (f) (ii) of the Constitution.
1.4 SCOPE OF THE PROJECT
The first Report on Grievance Trends in the Public Service12, reported on grievances received by the PSC and reported on by departments in their six-monthly reports13 for the period January 2005 until 30 June 2006. However, as all reporting by the PSC is in line with a financial year, a methodological shift was adopted by the PSC to bring the reporting of grievance resolutions in line with the financial year. This report therefore covers the reporting on resolution of grievances for the reporting periods 2006/2007 and 2007/2008. This means that there is an overlap of three months in the reporting for the financial year 2006/2007 with the reporting in the first Grievance Trends Report. Due to this overlap, this report will therefore not compare statistics in respect of grievances reported for the reporting periods 2006/2007 and 2007/2008 with the statistics reported in the first Grievance Trends Report. The inability to make a comparison of statistics between the two reports is an inevitable limitation. However, other trends emerging from the analysis of the statistics in respect of this report may be compared with trends identified in the first Grievance Trends Report.
1.5 METHODOLOGY
In order to meet the objectives of this research report, the following methodology was adopted:
Data collection
In order to inform HoDs of the strategic shift of requiring the submission of the departmental grievance resolution reports to be in line with a financial year, a circular dated 12 December 2007, was sent to departments. Subsequently, in a circular dated 3 March 2008, departments were requested to report on the resolution of grievances to the PSC as determined in Rule I.1 of the Grievance Rules14, for the financial year April 2007 until March 2008. In order to improve the accuracy of data, a reporting format was provided to departments to submit the following information in respect of grievances resolved within departments:
11 Republic of South Africa: Public Service Commission. Rules for dealing with the Grievances of Employees in the Public Service, Government Gazette number 25209 of 2003.
12 Republic of South Africa: Public Service Commission: Report on Grievance Trends in the Public Service, 2007.13 Republic of South Africa: Rule I.1 of the Rules for dealing with the Grievances of Employees in the Public Service, Government Gazette number 25209 of
2003.14 Republic of South Africa: Rules for dealing with the Grievances of Employees in the Public Service, Government Gazette number 25209 of 2003.
5
The date on which a grievance was received by the Department.• Biographical data of the aggrieved employee such as name, gender, race and rank.• The nature of the grievance.• The status of the grievance as at the end of the reporting period.• The date on which the grievance was finalised.• The outcome of finalised grievances. • The name of the institution if the grievance has been referred.•
Two databases containing information on grievances are being maintained by the PSC namely,
(i) the reports received from departments on grievance resolution on a six monthly basis which have been captured on a database of the PSC; and
(ii) an internal database, which reflects data captured on grievances that are referred to the PSC for consideration. The information captured on this database includes grievances that are referred to the PSC before the internal procedure has been finalised. Information captured on these two databases, reflect the following taxonomy:
The number of grievances lodged in each department; • The number of grievances finalised in each department; • The number of grievances finalised in each department within the prescribed time limit; • The number of grievances pending in each department as at end of reporting period; • A breakdown of the causes and or nature of grievances in each department; and • A breakdown of the race and gender distribution of the aggrieved in each department.•
The research in respect of this report is based on the above categories and a statistical analysis is provided in respect of each classification. In one instance, the levels of aggrieved employees were scrutinised due to the large volume of cases reported of a similar nature in one provincial department.
In addition to the above-mentioned information, a number of hearings were held by the PSC. During these hearings the HoDs were summonsed to account on why the grievances that were referred back to them for finalisation were not concluded within the specified periods. The level of understanding and problems experienced by the departments on grievance processing were identified during these hearings and are reflected in this report.
1.6 LIMITATIONS
The limitations experienced during the study related largely to the collection of data for purposes of this report and are the following:
In terms of the provisions of Rule I.1, HoDs must submit reports on the resolution of grievances within • their departments to the PSC on a six-monthly basis15. To remind HoDs, circulars for the 2006/2007 and 2007/2008 financial years, were sent on 16 January 2007 and 3 March 2008 respectively. However, regular reminders by way of e-mails and letters had to be sent to departments to request them to provide the PSC with the required information in respect of grievances received during the reporting period. As the PSC captures all reports of departments on a database, the non-compliance of departments, resulted in delays when capturing and analysing the data received.
For the 2006/2007 financial year, 62% national and provincial departments and for the 2007/2008 financial • year, 46% national and provincial departments submitted their reports after the due date indicated in the circulars. This resulted in the delay of the analysis into the reporting of grievances.
15 Republic of South Africa: Public Service Commission. Rules for dealing with the grievances of employees in the Public Service, Government gazette number 25209 of 2003.

6
Despite being provided with a reporting format, 21% of departments still submitted inaccurate and incomplete • information to the PSC. In such cases the PSC had no choice but to return the reports to the said departments for accurate completion of the required data, resulting in further delays in updating the database of the PSC.
The reporting format submitted to departments, provided categories of grievances and their definitions to be • provided to the PSC. However, departments used their own categories, which made it difficult to capture on the database of the PSC, as the PSC had to interpret the categories of the departments to ensure that it fits in the categories provided by the PSC.
The accuracy of some statistics received from departments could not be verified due to capacity constraints • of conducting inspection in loco in all departments. The information received is taken at face value and a margin of error factor of 3 % may be used as a norm.
Due to the overlap of three months in the reporting period covered in this report with the first Grievance • Trends report, comparison could not be made on statistics submitted by departments.
1.7 STRUCTURE OF THE REPORT
Chapter 2 gives an overview of the grievance resolution procedures and relevant applicable prescripts in the Public Service are discussed. Chapter 3 follows with a discussion of the management of grievance resolution within departments in detail, that is, within national and provincial departments. An overview of grievances handled by the PSC during the 2006/2007 and 2007/2008 reporting period is outlined in Chapter 4. This is followed in Chapter 5 with grievance trends in the Public Service. The report concludes in Chapter 6 with findings and recommendations to Departments and relevant stakeholders.
20
Cha
pter
Tw
o
Overview of Grievance Resolution in the Public Service
7
8
2.1 INTRODUCTION
In order to effectively manage dissatisfaction in the workplace, proper procedures for dealing with grievances are necessary. According to literature “dealing with grievances is a dynamic process of preventing grievances, handling grievances effectively when they arise and restoring the climate in the unit after resolution of the grievance in order to enhance labour peace and thus achieve the goals of the department”16. This confirms what was mentioned by Bendix about the management of grievances that the necessity for dealing in a consistent and proper manner with employee grievances arises not only from the fact that employees have a right to formal channels through which grievances may be expressed, but also from the very real danger that individual grievances may escalate and promote industrial unrest17.
In order to ensure a satisfied work force, employers should ensure that all efforts are made to handle a grievance immediately. In this regard, many grievances can be resolved quickly by correcting a misunderstanding or establishing clear communication channels between employees and supervisors. An effective grievance procedure which is applied correctly and consistently should save the Public Service time and resources thereby contributing to a pleasant working relationship and improved service delivery.
2.2 GRIEVANCE PROCEDURES IN THE PUBLIC SERVICE
Depending on the sector in which public servants are employed, all employees in the Public Service have access to a grievance procedure.
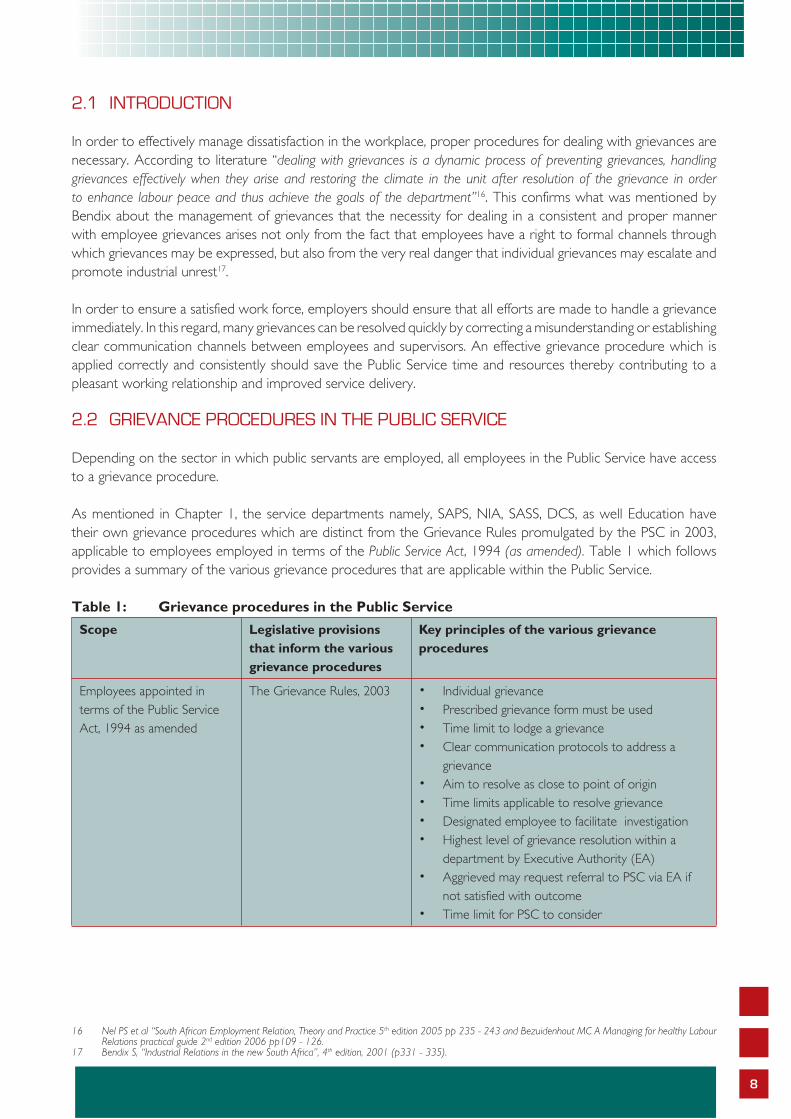
As mentioned in Chapter 1, the service departments namely, SAPS, NIA, SASS, DCS, as well Education have their own grievance procedures which are distinct from the Grievance Rules promulgated by the PSC in 2003, applicable to employees employed in terms of the Public Service Act, 1994 (as amended). Table 1 which follows provides a summary of the various grievance procedures that are applicable within the Public Service.
Table 1: Grievance procedures in the Public Service
Scope Legislative provisions that inform the various grievance procedures
Key principles of the various grievance procedures
Employees appointed in terms of the Public Service Act, 1994 as amended
The Grievance Rules, 2003 Individual grievance• Prescribed grievance form must be used• Time limit to lodge a grievance• Clear communication protocols to address a • grievanceAim to resolve as close to point of origin• Time limits applicable to resolve grievance• Designated employee to facilitate investigation• Highest level of grievance resolution within a • department by Executive Authority (EA) Aggrieved may request referral to PSC via EA if • not satisfied with outcomeTime limit for PSC to consider•
16 Nel PS et al “South African Employment Relation, Theory and Practice 5th edition 2005 pp 235 - 243 and Bezuidenhout MC A Managing for healthy Labour Relations practical guide 2nd edition 2006 pp109 - 126.
17 Bendix S, “Industrial Relations in the new South Africa”, 4th edition, 2001 (p331 - 335).
9
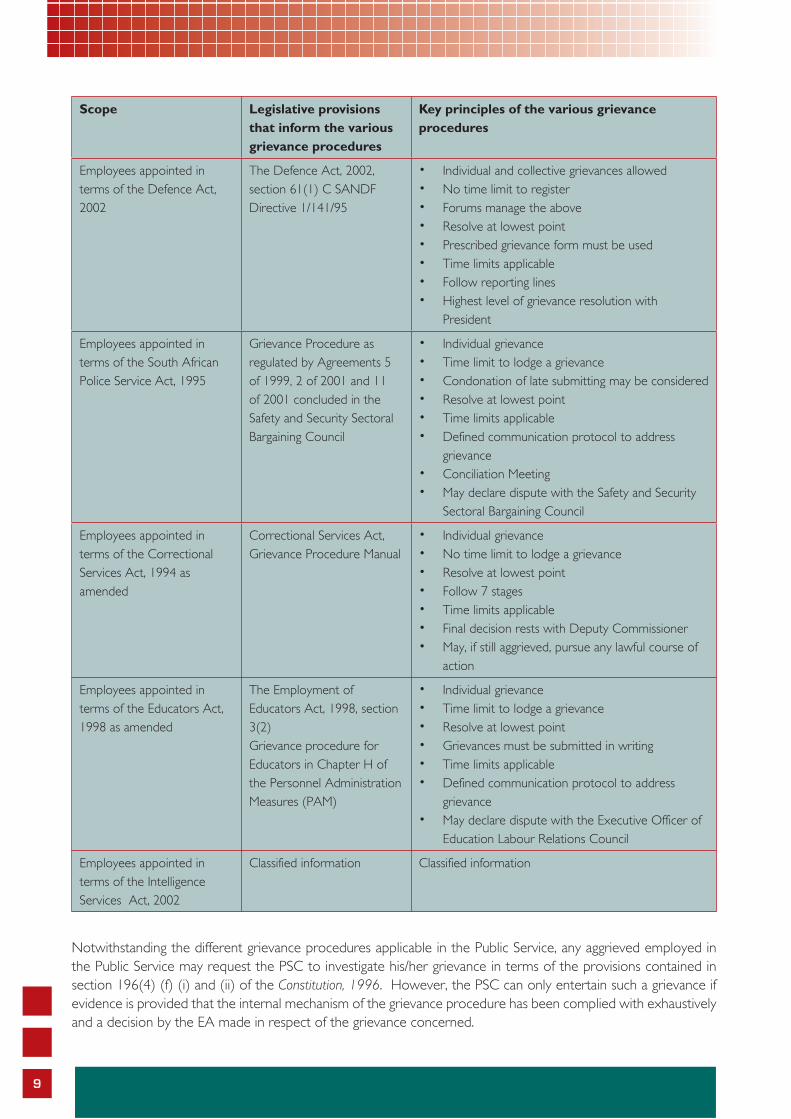
Scope Legislative provisions that inform the various grievance procedures
Key principles of the various grievance procedures
Employees appointed in terms of the Defence Act, 2002
The Defence Act, 2002, section 61(1) C SANDF Directive 1/141/95
Individual and collective grievances allowed• No time limit to register • Forums manage the above• Resolve at lowest point• Prescribed grievance form must be used • Time limits applicable• Follow reporting lines • Highest level of grievance resolution with • President
Employees appointed in terms of the South African Police Service Act, 1995
Grievance Procedure as regulated by Agreements 5 of 1999, 2 of 2001 and 11 of 2001 concluded in the Safety and Security Sectoral Bargaining Council
Individual grievance• Time limit to lodge a grievance• Condonation of late submitting may be considered• Resolve at lowest point• Time limits applicable• Defined communication protocol to address • grievanceConciliation Meeting • May declare dispute with the Safety and Security • Sectoral Bargaining Council
Employees appointed in terms of the Correctional Services Act, 1994 as amended
Correctional Services Act,Grievance Procedure Manual
Individual grievance• No time limit to lodge a grievance• Resolve at lowest point• Follow 7 stages • Time limits applicable• Final decision rests with Deputy Commissioner• May, if still aggrieved, pursue any lawful course of • action
Employees appointed in terms of the Educators Act, 1998 as amended
The Employment of Educators Act, 1998, section 3(2)Grievance procedure for Educators in Chapter H of the Personnel Administration Measures (PAM)
Individual grievance• Time limit to lodge a grievance • Resolve at lowest point• Grievances must be submitted in writing • Time limits applicable• Defined communication protocol to address • grievanceMay declare dispute with the Executive Officer of • Education Labour Relations Council
Employees appointed in terms of the Intelligence Services Act, 2002
Classified information Classified information
Notwithstanding the different grievance procedures applicable in the Public Service, any aggrieved employed in the Public Service may request the PSC to investigate his/her grievance in terms of the provisions contained in section 196(4) (f) (i) and (ii) of the Constitution, 1996. However, the PSC can only entertain such a grievance if evidence is provided that the internal mechanism of the grievance procedure has been complied with exhaustively and a decision by the EA made in respect of the grievance concerned.
10
2.3 RULES FOR DEALING WITH THE GRIEVANCES OF EMPLOYEES IN THE PUBLIC SERVICE
The focus of this report is on the procedure provided for in the Grievance Rules, 2003, published in Government Gazette No 25209, dated 25 July 2003, applicable to all employees appointed in terms of the Public Service Act, 1994.
The key underlying principles of the Grievance Rules are to promote the speedy, impartial and equitable handling of grievances, sound labour relations, and resolution of individual grievances at the lowest possible level in a department. The employer must ensure that a grievance is dealt with in a fair, impartial and objective manner and that the principles of natural justice are observed. No employee may be victimised or prejudiced, directly or indirectly as a result of lodging a grievance.
The Grievance Rules further provide for compulsory time frames to be adhered to, unless both parties agree to the extension of these time limits. According to these Rules, a grievance must be lodged with the employer within 90 days from the date on which the employee became aware of the official act or omission which adversely affects him/her. Furthermore, the department, including the EA, has 30 days to deal with a grievance, which period may be extended by mutual agreement in writing. Should the department fail to respond to the aggrieved employee’s grievance within the prescribed 30 days, the aggrieved employee may lodge his/her grievance –
(a) with the PSC directly; or(b) in the case of an alleged unfair labour practice, with the Public Service Co-ordinating Bargaining Council or the
relevant sectoral council (whichever is applicable) in terms of the resolution procedure.
In order to facilitate the resolution of grievances, the designated employee, who is responsible for the resolution of grievances in the department, must liaise with the relevant structures of authority in the department on the resolution of a grievance. Although the designated employee is responsible for the resolution of grievances, a grievance may be resolved by any person within the relevant structures of authority who has the requisite authority to do so.
A grievance must be lodged by an employee on the prescribed form annexed to the Grievance Rules, 2003. If a grievance is not resolved internally to the satisfaction of an aggrieved employee, he/she must confirm this in writing. If a grievance cannot be resolved, the EA must inform the aggrieved employee accordingly. An aggrieved employee may demand that his or her grievance be referred to the PSC within 10 days after he/she received the EA’s decision. The EA must then in terms of section 35(1) of the Public Service Act, 1994 (as amended) forward the grievance and all relevant documentation to the PSC for consideration. After the referral of a grievance to the PSC and it has received all the information from the EA, it must within 30 days, consider the grievance and inform the EA of its recommendation and the reasons for its decision in writing. Upon receipt of the PSC’s recommendation, the EA must, within five days, inform the employee and the PSC of his/her decision in writing.
According to the Grievance Rules, if a Head of a National Department has a grievance, he/she may submit the grievance to the President. However, a Head of a Provincial Department may submit his/her grievance to the relevant Premier. The President and the Premier also have 30 days within which they have to resolve the grievance and the period may be extended by mutual agreement in writing. HoDs may request that their grievances be referred to the PSC if they remain dissatisfied after finalisation of the internal process.
The Grievance Rules stipulate that HoDs must ensure that grievance resolution is evaluated by maintaining a record of grievances resolved from the beginning of each calendar year and report on a six monthly basis to the PSC. The PSC recommended, in the first Grievance Trends report, that the six monthly grievance resolution
11
reporting period be amended. In the meantime, the PSC has requested departments to align the reporting period with the financial year whilst awaiting the PSCBC to finalise the proposed amendment to the Grievance Rules.
2.4 GRIEVANCE RESOLUTION IN THE PUBLIC SERVICE CO-ORDINATING BARGAINING COUNCIL
The PSC is not the only arbiter of grievance resolution within the Public Service. In terms of Section 36 of the Labour Relations Act, 199518 (LRA) PSCBC19 may perform “…all the functions of a bargaining council …” The resolution of employee grievances within national and provincial departments should not be seen in isolation to the dispute resolution procedures concluded at the PSCBC. Numerous employee grievances are referred to the PSCBC as disputes. These disputes are typically noted as –
(a) disputes of rights/interest; (b) interpretation and application of a collective agreement; and (c) unfair labour practices (the majority of disputes are lodged in this regard).
In establishing the PSCBC, the LRA sought to provide a platform for the social partners, – the State as the employer, and the Public Service Unions, representing approximately 1,2 million employees – to engage constructively over matters of mutual interest. In addition and similar to the bargaining councils in the private sector, the purpose of establishing the PSCBC was to provide a forum whose sole purpose is to create and maintain sound labour relations in the Public Service through, among others, the collective bargaining process. In terms of its Constitution, the PSCBC20 has the following objectives-
(a) the promotion of relations between the parties; (b) providing a forum for the parties to engage in collective bargaining; and (b) providing a mechanism for dispute prevention and resolution.
The PSCBC’s Constitution also requires it to conclude, supervise and enforce collective bargaining agreements and deal with any other matters that may affect its organisational interest. The powers and duties of the PSCBC are to –
(a) negotiate and conclude collective agreements in respect of matters regulated by section 36(2) of the LRA; (b) supervise and enforce collective agreements concluded in the Council; (c) prevent and resolve labour disputes.
Should the parties fail to reach an agreement, the PSCBC’s own dispute resolution mechanism will apply. This however, does not preclude an aggrieved party from seeking any other recourse as provided for in terms of section 191 (13) of the LRA. This provision provides that an employee may refer a dispute concerning an alleged unfair labour practice to the labour court.
According to the PSCBC’s Annual Report for the period 2006/2007, 56% of the disputes that were referred to the PSCBC or Sectoral Bargaining Councils relate to an unfair labour practice, of which 49% related to promotion/ demotion/ training and benefits21. The PSCBC Report also indicates that 40% of the disputes that arose in the Free State Province, which were referred to the PSCBC for dispute resolution, related to the non-adherence by the employer to the time frames set out in the grievance procedure. As no detailed breakdown of disputes referred to the PSCBC or Sectoral Councils is provided in the PSCBC Annual Report for the period 2006/2007, no comparison can be made with statistics provided to the PSC by departments relating to grievances referred to either the PSC or another dispute resolution body.
18 Republic of South Africa; Labour Relations Act, 1995; S 36. 19 Republic of South Africa; Public Service Co-ordinating Bargaining Council: 2005/2006 Annual Report.20 Republic of South Africa; Public Service Co-ordinating Bargaining Council 2005/2006 Annual Report.21 Republic of South Africa; Public Service Co-ordinating Bargaining Council 2006/2007 Annual Report.
12
Overall the inability of departments to deal with grievances within the prescribed period remains a challenge. As such the employees with their representatives utilise external fora like the PSC and PSCBC and its sectoral bargaining councils to ensure timely resolutions to their grievances.
A discussion on the PSC’s experiences on grievance resolution in the Public Service follows in Chapter 4 where an extensive observation is made on the handling of grievances referred to the PSC for consideration. This is preceded by an analysis of grievance resolution within departments based on assessment of the reports submitted by departments to the PSC every six months.
26
Cha
pter
Thr
ee
Grievance Resolution within Departments
13
14
3.1 INTRODUCTION
As mentioned in Chapter 1, this report covers the financial year (1 April – 31 March) as opposed to the calendar year (1 January – 31 December) as was the case in the first Grievance Trends report. This Chapter reflects on the data as reported to the PSC by national and provincial departments in respect of the resolution of grievances. The reporting period covered in this report is in respect of the following reporting periods:
Period 1• : 1 April 2006 – 31 March 2007Period 2• : 1 April 2007 – 31 March 2008
In this chapter, the PSC analyses the patterns on the causes of grievances, the profiles of aggrieved employees in respect of race and gender, and the status of grievances as at the date of reporting and finally the time it has taken departments to finalise grievances when such cases are reported to have been finalised.
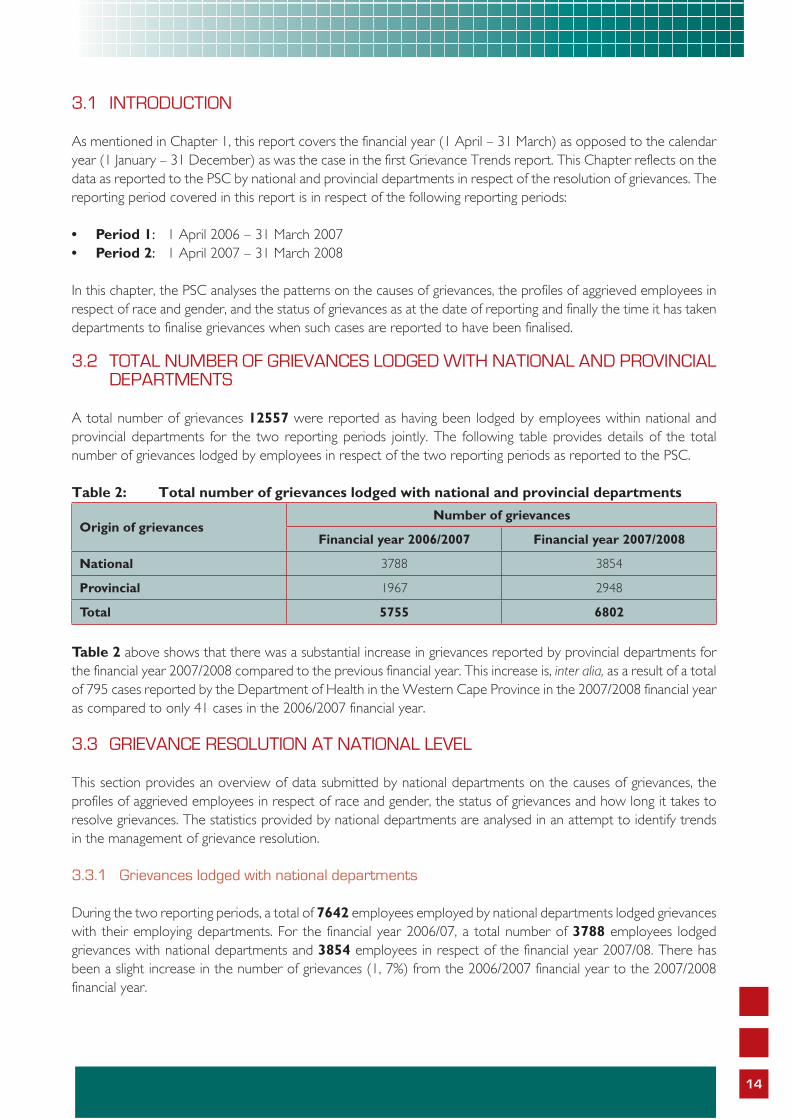
3.2 TOTAL NUMBER OF GRIEVANCES LODGED WITH NATIONAL AND PROVINCIAL DEPARTMENTS
A total number of grievances 12557 were reported as having been lodged by employees within national and provincial departments for the two reporting periods jointly. The following table provides details of the total number of grievances lodged by employees in respect of the two reporting periods as reported to the PSC.
Table 2: Total number of grievances lodged with national and provincial departments
Origin of grievancesNumber of grievances
Financial year 2006/2007 Financial year 2007/2008
National 3788 3854
Provincial 1967 2948
Total 5755 6802
Table 2 above shows that there was a substantial increase in grievances reported by provincial departments for the financial year 2007/2008 compared to the previous financial year. This increase is, inter alia, as a result of a total of 795 cases reported by the Department of Health in the Western Cape Province in the 2007/2008 financial year as compared to only 41 cases in the 2006/2007 financial year.
3.3 GRIEVANCE RESOLUTION AT NATIONAL LEVEL
This section provides an overview of data submitted by national departments on the causes of grievances, the profiles of aggrieved employees in respect of race and gender, the status of grievances and how long it takes to resolve grievances. The statistics provided by national departments are analysed in an attempt to identify trends in the management of grievance resolution.
3.3.1 Grievances lodged with national departments
During the two reporting periods, a total of 7642 employees employed by national departments lodged grievances with their employing departments. For the financial year 2006/07, a total number of 3788 employees lodged grievances with national departments and 3854 employees in respect of the financial year 2007/08. There has been a slight increase in the number of grievances (1, 7%) from the 2006/2007 financial year to the 2007/2008 financial year.
15
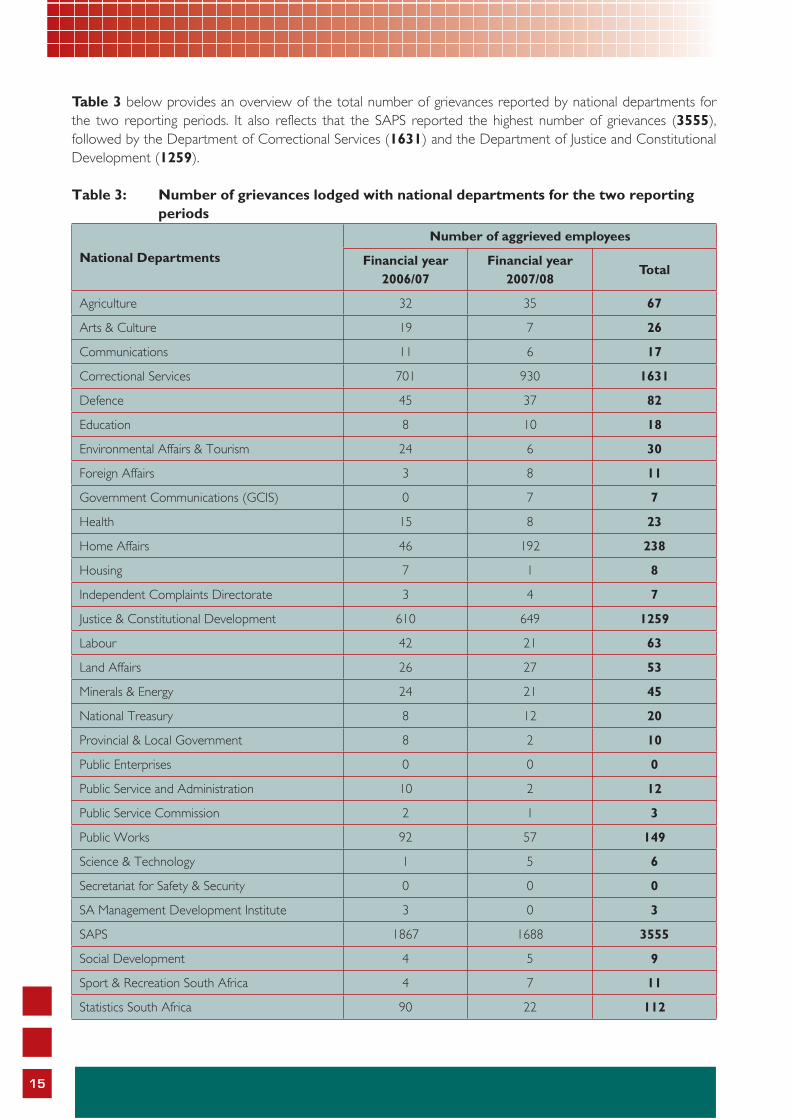
Table 3 below provides an overview of the total number of grievances reported by national departments for the two reporting periods. It also reflects that the SAPS reported the highest number of grievances (3555), followed by the Department of Correctional Services (1631) and the Department of Justice and Constitutional Development (1259).
Table 3: Number of grievances lodged with national departments for the two reporting periods
National Departments
Number of aggrieved employees
Financial year 2006/07
Financial year 2007/08
Total
Agriculture 32 35 67
Arts & Culture 19 7 26
Communications 11 6 17
Correctional Services 701 930 1631
Defence 45 37 82
Education 8 10 18
Environmental Affairs & Tourism 24 6 30
Foreign Affairs 3 8 11
Government Communications (GCIS) 0 7 7
Health 15 8 23
Home Affairs 46 192 238
Housing 7 1 8
Independent Complaints Directorate 3 4 7
Justice & Constitutional Development 610 649 1259
Labour 42 21 63
Land Affairs 26 27 53
Minerals & Energy 24 21 45
National Treasury 8 12 20
Provincial & Local Government 8 2 10
Public Enterprises 0 0 0
Public Service and Administration 10 2 12
Public Service Commission 2 1 3
Public Works 92 57 149
Science & Technology 1 5 6
Secretariat for Safety & Security 0 0 0
SA Management Development Institute 3 0 3
SAPS 1867 1688 3555
Social Development 4 5 9
Sport & Recreation South Africa 4 7 11
Statistics South Africa 90 22 112
16
National Departments
Number of aggrieved employees
Financial year 2006/07
Financial year 2007/08
Total
The Presidency 2 3 5
Trade and Industry 20 12 32
Transport 5 10 15
Water Affairs & Forestry 56 59 115
TOTAL 3788 3854 7642
The statistics reported show the highest number of grievance lodged by aggrieved employees to have been in the Services Departments. However, there was a decrease of 9,6% in the number of grievances lodged with SAPS for the financial year 2007/2008.
3.3.2 Causes of grievances
The causes of grievances cover a wide variety of dissatisfactions which for statistical purposes, have been classified into seven categories. Table 4 below depicts the total number of grievances per category in respect of the two reporting periods. It also reflects the aggregate ranking order of these causes.
Table 4: Causes of grievances in national departments
Causes of grievances
Number of grievances
2006/2007 2007/2008% increase/decrease
Total Ranking
Performance assessment 1382 1278 -7,5% 2660 1
Salary problem (adjustment/increase/payment etc)
723 880 21,7% 1603 2
Recruitment and selection 766 686 -10,4% 1452 3
Unfair treatment (other than what is listed)
517 590 14.1% 1107 4
Application approval/Refusal to approve application
165 220 33.3% 385 5
Disciplinary matter 146 113 -22,6% 259 6
Not listed 46 69 50% 115 7
Total 3788 3854 1.7% 7642
Table 4 illustrates that dissatisfaction around performance assessment was the main cause of grievances at national level, followed by salary problems and recruitment and selection in that order. This trend was identified in the Report on Grievance Trends in the Public Service, 2007 where the aggregate of ranking was the same for the period January 2005 until June 2006.
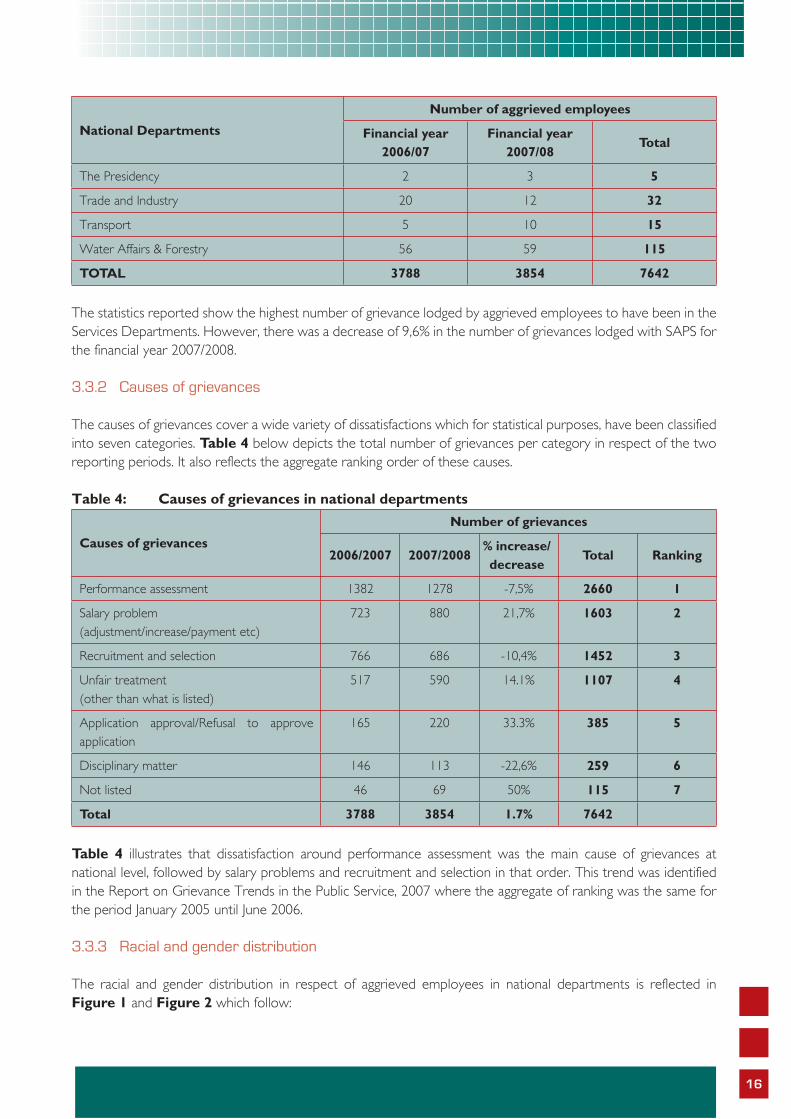
3.3.3 Racial and gender distribution
The racial and gender distribution in respect of aggrieved employees in national departments is reflected in Figure 1 and Figure 2 which follow:
17
Figure 1: Racial distribution of aggrieved employees in national departments
One of the limitations mentioned in Chapter 1, was the inadequate information submitted in grievance resolution reports by departments. As indicated in Figure 1 above, the largest percentage of aggrieved is constituted of Africans, followed by Whites, Coloured and then Indians. African and Coloured aggrieved employees increased whilst White and Indians decreased from reporting period 2006/2007 to 2007/2008.
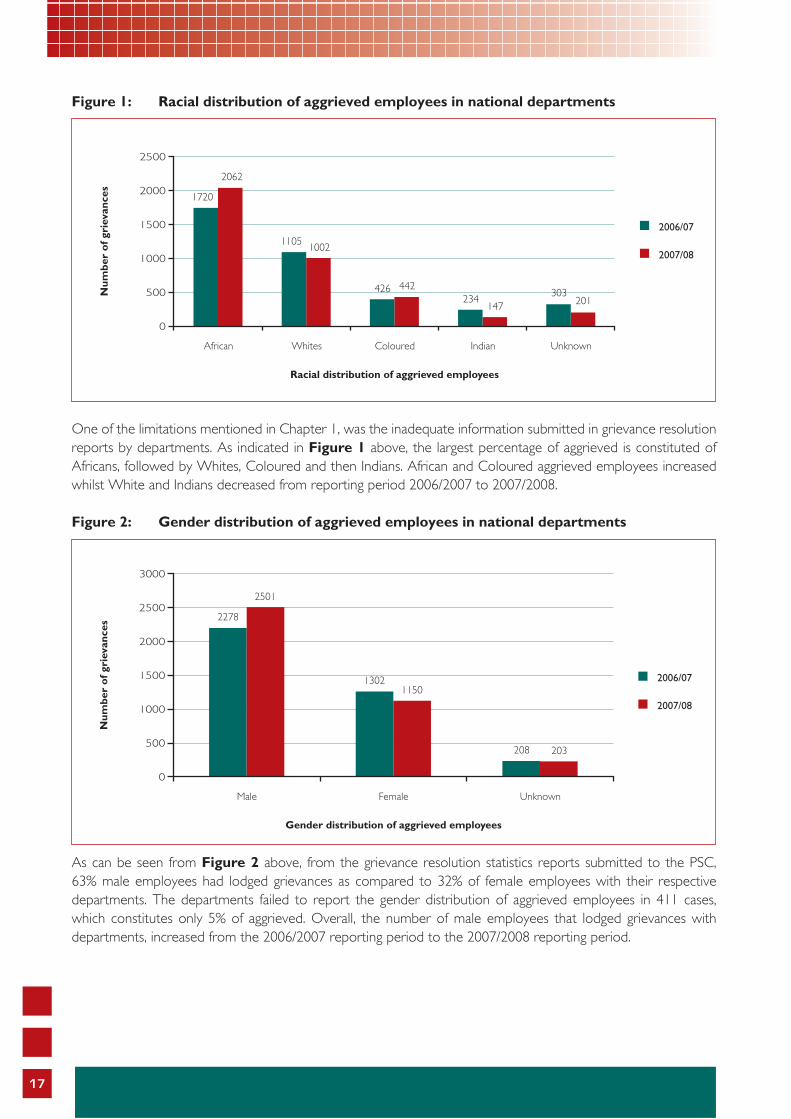
Figure 2: Gender distribution of aggrieved employees in national departments
As can be seen from Figure 2 above, from the grievance resolution statistics reports submitted to the PSC, 63% male employees had lodged grievances as compared to 32% of female employees with their respective departments. The departments failed to report the gender distribution of aggrieved employees in 411 cases, which constitutes only 5% of aggrieved. Overall, the number of male employees that lodged grievances with departments, increased from the 2006/2007 reporting period to the 2007/2008 reporting period.
18
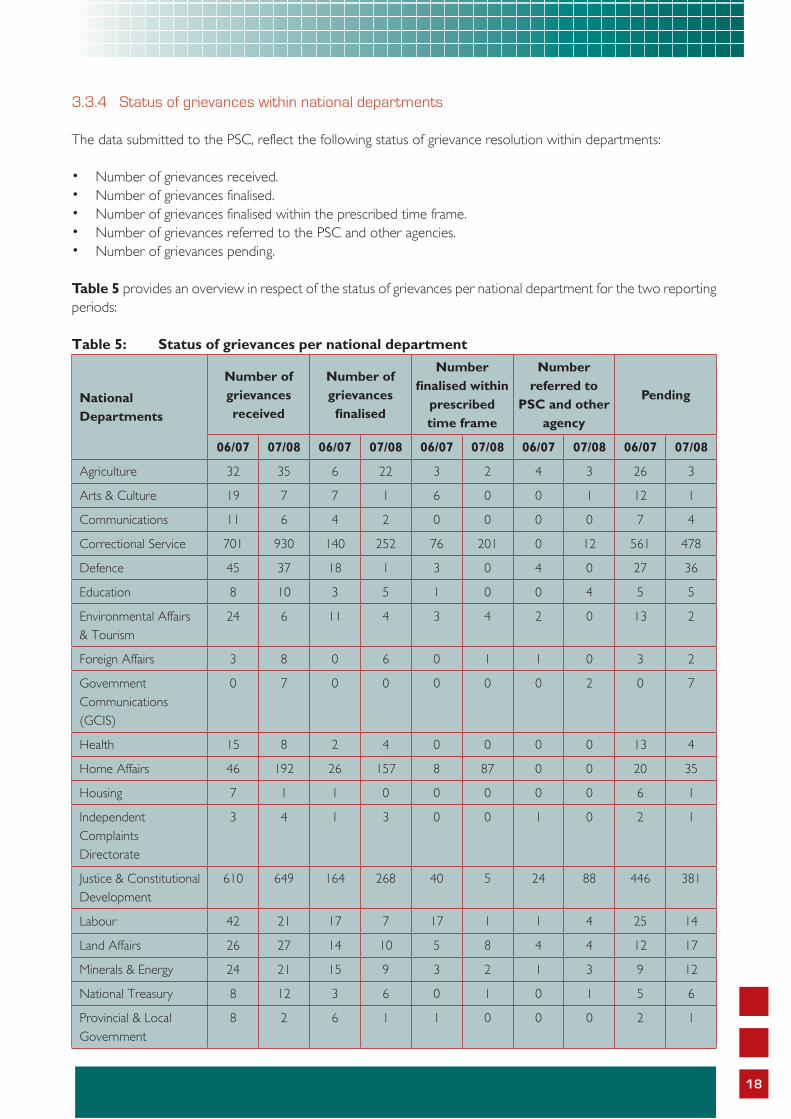
3.3.4 Status of grievances within national departments
The data submitted to the PSC, reflect the following status of grievance resolution within departments:
Number of grievances received.• Number of grievances finalised.• Number of grievances finalised within the prescribed time frame.• Number of grievances referred to the PSC and other agencies.• Number of grievances pending.•
Table 5 provides an overview in respect of the status of grievances per national department for the two reporting periods:
Table 5: Status of grievances per national department
National Departments
Number of grievances received
Number of grievances fi nalised
Number fi nalised within
prescribed time frame
Number referred to
PSC and other agency
Pending
06/07 07/08 06/07 07/08 06/07 07/08 06/07 07/08 06/07 07/08
Agriculture 32 35 6 22 3 2 4 3 26 3
Arts & Culture 19 7 7 1 6 0 0 1 12 1
Communications 11 6 4 2 0 0 0 0 7 4
Correctional Service 701 930 140 252 76 201 0 12 561 478
Defence 45 37 18 1 3 0 4 0 27 36
Education 8 10 3 5 1 0 0 4 5 5
Environmental Affairs & Tourism
24 6 11 4 3 4 2 0 13 2
Foreign Affairs 3 8 0 6 0 1 1 0 3 2
Government Communications (GCIS)
0 7 0 0 0 0 0 2 0 7
Health 15 8 2 4 0 0 0 0 13 4
Home Affairs 46 192 26 157 8 87 0 0 20 35
Housing 7 1 1 0 0 0 0 0 6 1
Independent Complaints Directorate
3 4 1 3 0 0 1 0 2 1
Justice & Constitutional Development
610 649 164 268 40 5 24 88 446 381
Labour 42 21 17 7 17 1 1 4 25 14
Land Affairs 26 27 14 10 5 8 4 4 12 17
Minerals & Energy 24 21 15 9 3 2 1 3 9 12
National Treasury 8 12 3 6 0 1 0 1 5 6
Provincial & Local Government
8 2 6 1 1 0 0 0 2 1
19
National Departments
Number of grievances received
Number of grievances fi nalised
Number fi nalised within
prescribed time frame
Number referred to
PSC and other agency
Pending
06/07 07/08 06/07 07/08 06/07 07/08 06/07 07/08 06/07 07/08
Public Enterprises 0 0 0 0 0 0 0 0 0 0
Public Service & Administration
10 2 1 1 0 1 0 0 9 1
Office of the Public Service Commission
2 1 2 0 0 0 0 1 0 1
Public Works 92 57 32 33 20 2 13 4 60 24
SA Management Development Institute
3 0 0 0 0 0 0 0 3 0
SAPS 1867 1688 1353 927 685 428 15 17 514 761
Science and Technology
1 5 0 2 0 1 0 0 1 3
Secretariat for Safety and Security
0 0 0 0 0 0 0 0 0 0
Social Development 4 5 2 3 0 0 0 0 2 2
Sport & Recreation South Africa
4 7 0 0 0 0 0 2 4 7
Statistics South Africa 90 22 77 13 9 10 0 0 13 9
The Presidency 2 3 0 1 0 0 1 5 2 2
Trade & Industry 20 12 4 8 1 0 1 0 16 4
Transport 5 10 4 9 1 8 0 0 1 1
Water Affairs & Forestry
56 59 23 21 2 3 0 0 33 38
TOTAL 3788 3854 1936 1976 884 765 72 146 1852 1878
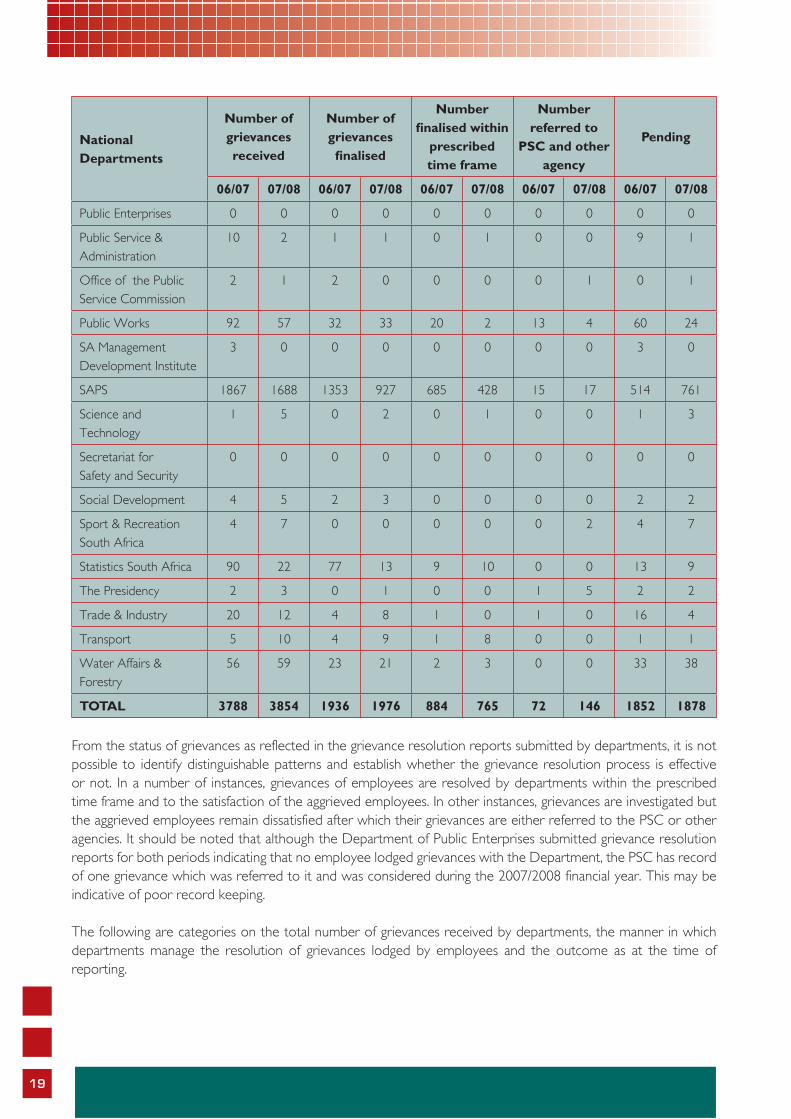
From the status of grievances as reflected in the grievance resolution reports submitted by departments, it is not possible to identify distinguishable patterns and establish whether the grievance resolution process is effective or not. In a number of instances, grievances of employees are resolved by departments within the prescribed time frame and to the satisfaction of the aggrieved employees. In other instances, grievances are investigated but the aggrieved employees remain dissatisfied after which their grievances are either referred to the PSC or other agencies. It should be noted that although the Department of Public Enterprises submitted grievance resolution reports for both periods indicating that no employee lodged grievances with the Department, the PSC has record of one grievance which was referred to it and was considered during the 2007/2008 financial year. This may be indicative of poor record keeping.
The following are categories on the total number of grievances received by departments, the manner in which departments manage the resolution of grievances lodged by employees and the outcome as at the time of reporting.
20
Grievances finalised
Depending on the grievance procedure applicable to the Department, a grievance is regarded as finalised if all provisions for resolution in terms of the grievance procedure are met. In terms of the Grievance Rules, grievances are regarded as finalised at departmental level once the internal investigation into the merits of a grievance has been finalised, which includes the decision by the EA, and the aggrieved employee has been informed of such decision. As indicated in Table 5 supra, departments had finalised 3912 grievances out of 7642 for the two reporting periods. This means that 51% of the cases were finalised during the two reporting periods.
For the 2006/2007 reporting period, the SAPS reported the highest number of grievances and had finalised 72% of these cases. However, during the following financial year (2007/2008), the SAPS had only finalised 55% of the cases. In comparison with the SAPS, the Department of Correctional Services only finalised 20% of the cases during the financial year 2006/2007 and 27% of the cases during the financial year 2007/2008.
The Department of Justice and Constitutional Development also did not fare well in finalising cases during the financial year 2006/2007 as the Department only managed to finalise 27% of the cases. However, the finalisation rate improved during the financial year 2007/2008, with the Department finalising 41% of its cases. The low rate of finalisation of grievances from the Department of Justice and Constitutional Development is also reflected in the higher number of times the PSC had summonsed the Head of Department to hearings as compared to other HoDs, to account on the reasons for the delays experienced by employees in finalisation of the investigation of their grievances.
Grievances finalised within the prescribed time frame
According to Nel PS et al22 “A neglected grievance, or a delayed response to it, is often the origin of a new grievance.” The necessity for prompt response in respect of the resolution of grievances is therefore endorsed in the Grievance Rules. From the reports submitted by national departments, 46% (884 out of 1936 finalised) grievances were finalised within the prescribed time frame for the financial year 2006/2007. In respect of the financial year 2007/2008, 39% (765 out of 1976 finalised) grievances were finalised within the prescribed time frame. Failure by departments to resolve grievances within the prescribed time frame remains a cause for concern.
Grievances that are pending
Grievances that are pending refer to grievances that have not been finalised within the reporting periods in question. As can be seen from Table 5, 49% of the grievances lodged during the two reporting periods, remain pending. The Department of Foreign Affairs received three (3) grievances during the financial year 2006/2007, and reported all three as pending. However, for the financial year 2007/2008, the Department improved on its performance as it received eight (8) grievances and reported two (2) cases as pending. The GCIS on the other hand, received seven (7) grievances during the financial year 2007/2008, and reported all seven cases as pending. The inability of the GCIS to finalise any of the grievances received during the financial year 2007/2008, is disappointing, especially as this Department did not receive any grievances during the 2006/2007 financial year.
The Department of Housing received seven (7) cases during the financial year 2006/2007, and reported six (6) cases as pending. For the financial year 2007/2008, the Department received one (1) grievance and reported this grievance as pending at the end of the financial year. The fact that departments reported grievances that are pending over a period of a financial year is disconcerting especially as delays in finalising cases may lead to further dissatisfaction.
The delay in finalisation of grievances within departments is confirmed by the cases referred directly to the PSC by aggrieved employees. The overwhelming majority of cases referred to the PSC for consideration are as a result
22 Nel PS et al, “Human Resources Management” Fifth Edition 2005 (pp 154).
21
of the departments’ inability to resolve grievances within the prescribed time frames and non-compliance with procedure to resolve grievances up to the level of the EA. Such grievances cannot be considered by the PSC and as such are referred back to departments for compliance with the grievance procedure.
3.4 GRIEVANCE RESOLUTION AT PROVINCIAL LEVEL
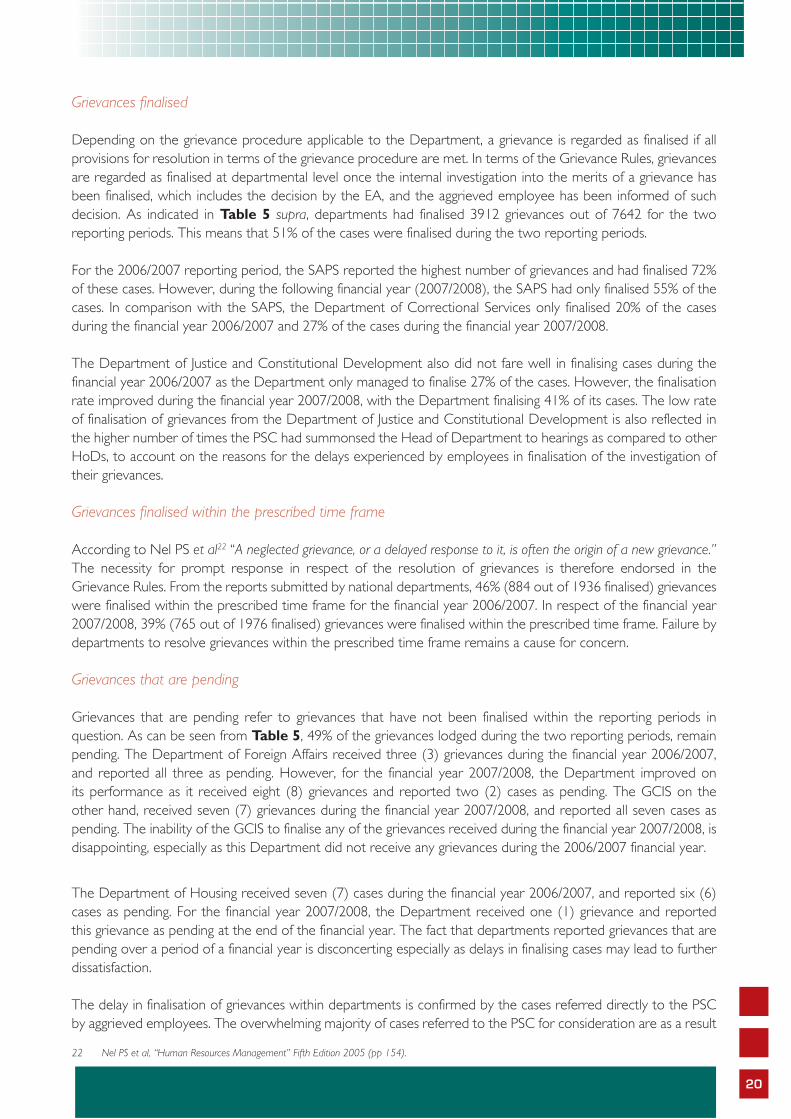
This section provides an overview in respect of data submitted by provincial departments regarding the causes of grievances, the racial and gender profile of aggrieved employees and the status of grievances. An analysis of the statistical information provides further information in respect of distinct trends in the management of grievance resolution within provincial administrations. Table 6 below provides an overview in respect of grievance resolution reports submitted by provinces for the two reporting periods.
Table 6: Reports of provinces on grievances statistics for the two reporting periods
Province
Number of grievances
2006/2007 2007/2008% increase/decrease
Total
Eastern Cape 412 245 -63.1% 657
Free State 221 246 11.3% 467
Gauteng 272 453 66.5% 725
KwaZulu-Natal 158 493 212% 651
Limpopo 368 284 -22.8% 652
Mpumalanga 127 97 -23.6% 224
Northern Cape 103 97 -5.8% 200
North West 151 155 2.6% 306
Western Cape 155 878 466.4% 1033
Total 1967 2948 49.8% 4915
Table 6 reflects that the Eastern Cape Province (21%) reported the highest number of grievances in respect of the financial year 2006/2007 which was followed by the Limpopo Province (19%) and the Gauteng Province (14%). In respect of the financial year 2007/2008, the Western Cape Province (30%) reported the highest number of grievances, followed by the KwaZulu-Natal Province (17%) and the Gauteng Province (15%). There is a noticeable sharp increase in the grievances reported during the financial year 2007/2008. Overall, the Western Cape Provincial Administration (21%) reported the highest number of grievances, followed by the Gauteng Provincial Administration (15%) and the Eastern Cape Provincial Administration (13%).
The analysis that follows below focuses on the individual provinces and reflects on trends that emerge.
3.4.1 Eastern Cape Province
3.4.1.1 Grievances lodged
Overall, departments in the Eastern Cape Province reported a total of 657 grievances lodged over the two reporting periods. Figure 3 which follows provides an overview in respect of the total number of grievances lodged over the two reporting periods per department:

22
Figure 3: Number of grievances per department for the two reporting periods
The Department of Health reported the highest number of grievances (161) for the financial year 2006/2007, followed by the Department of Education (104). The Department of Housing, Local Government and Traditional Affairs reported the third highest number of grievances (40). During the financial year 2007/2008, the Department of Education reported the highest number of grievances (74), followed by the Department of Housing, Local Government and Traditional Affairs (40) and the Department of Transport and Roads. Overall, the Department of Health reported the highest number of grievances over the two periods. The Office of the Premier and the Department of Safety and Liaison submitted a “nil” report in respect of both reporting periods.
3.4.1.2 Causes of grievances
The causes of grievances lodged per department for the two reporting periods, are reflected in Table 7 that follows.
Table 7: Causes of grievances in the Eastern Cape Province
Causes of grievances
Number of grievances
2006/07 2007/08% increase/decrease
Total Ranking
Performance assessment 225 83 -63.1% 308 1
Salary problem (adjustment/increase/payment etc)
81 46 -43.2% 127 2
Recruitment and selection 53 52 -1,8% 105 3
Unfair treatment (other than what is listed)
29 40 37.9% 69 4
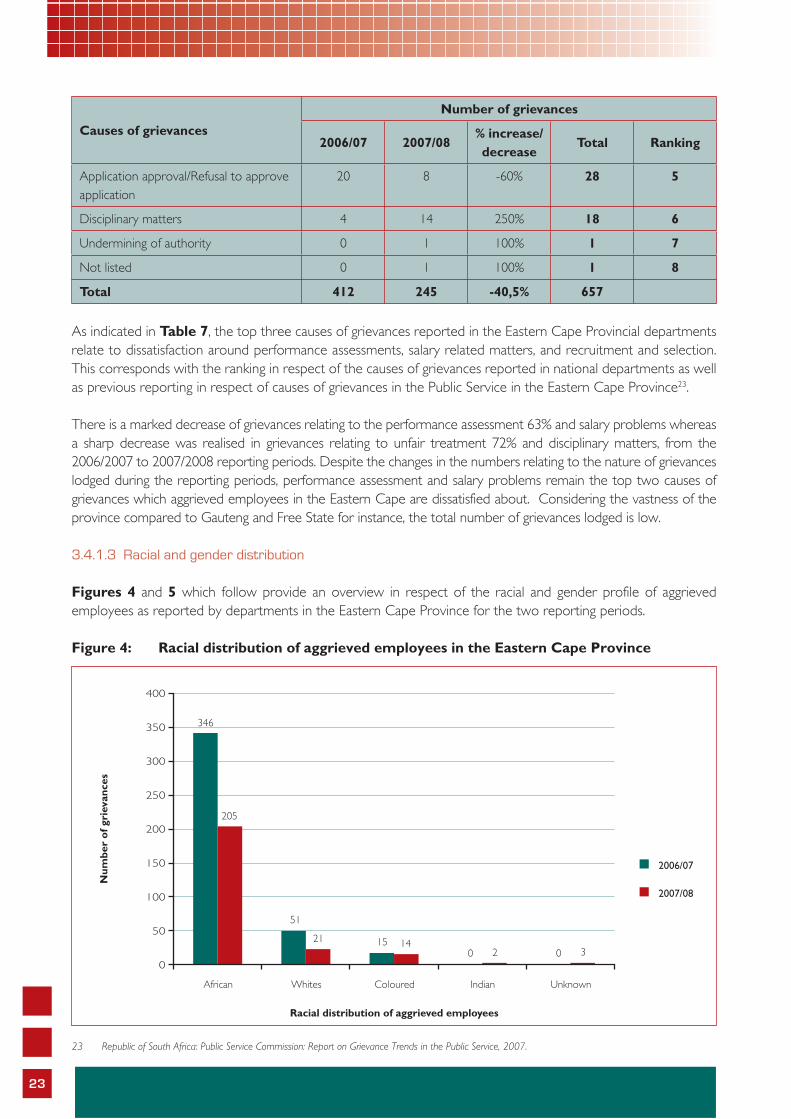
23
Causes of grievances
Number of grievances
2006/07 2007/08% increase/decrease
Total Ranking
Application approval/Refusal to approve application
20 8 -60% 28 5
Disciplinary matters 4 14 250% 18 6
Undermining of authority 0 1 100% 1 7
Not listed 0 1 100% 1 8
Total 412 245 -40,5% 657
As indicated in Table 7, the top three causes of grievances reported in the Eastern Cape Provincial departments relate to dissatisfaction around performance assessments, salary related matters, and recruitment and selection. This corresponds with the ranking in respect of the causes of grievances reported in national departments as well as previous reporting in respect of causes of grievances in the Public Service in the Eastern Cape Province23.
There is a marked decrease of grievances relating to the performance assessment 63% and salary problems whereas a sharp decrease was realised in grievances relating to unfair treatment 72% and disciplinary matters, from the 2006/2007 to 2007/2008 reporting periods. Despite the changes in the numbers relating to the nature of grievances lodged during the reporting periods, performance assessment and salary problems remain the top two causes of grievances which aggrieved employees in the Eastern Cape are dissatisfied about. Considering the vastness of the province compared to Gauteng and Free State for instance, the total number of grievances lodged is low.
3.4.1.3 Racial and gender distribution
Figures 4 and 5 which follow provide an overview in respect of the racial and gender profile of aggrieved employees as reported by departments in the Eastern Cape Province for the two reporting periods.
Figure 4: Racial distribution of aggrieved employees in the Eastern Cape Province
23 Republic of South Africa: Public Service Commission: Report on Grievance Trends in the Public Service, 2007.

24
Figure 4 supra depicts that 84% of the number of grievances were lodged by African employees. This figure should however, be considered against the demographics of the Public Service as reported in the Report on an Audit of Affirmative Action in the Public Service, 200624. This reports indicated that there are more African employees in the Eastern Cape than any other race group. Figure 5: Gender distribution of aggrieved employees in the Eastern Cape Province
In contrast to the reporting of National Departments in respect of the gender distribution, 41% of grievances were lodged by male employees against 59% female employees. This percentage of gender distribution of employees in the Eastern Cape is more aligned to the gender demographics in the province. However, in the absence of more information, neither race nor gender appears to be an added dimension in the lodging of grievances in the Province.
3.4.1.4 Status of grievances within departments
In the discussion on grievance trends in respect of national departments, reference was made to the differentiated patterns for analysis and the effectiveness of the management of grievance resolution. Table 8 below, provides an overview in respect of the status of grievances per department in the Eastern Cape Province:
Table 8: Number of grievances lodged with the Eastern Cape Province
DepartmentNumber of grievances received
Number of grievances fi nalised
Number of grievances fi nalised
within the prescribed time frame
Number of grievances referred to
the PSC and other agency
Pending
06/07 07/08 06/07 07/08 06/07 07/08 06/07 07/08 06/07 07/08
Agriculture 10 11 6 3 3 2 0 0 4 8
Economic Affairs, Environ & Tourism
2 11 0 5 0 2 0 0 2 6
Education 104 74 10 18 0 7 1 0 94 56
24 Republic of South Africa: Public Service Commission: Report on an Audit of Affirmative Action in the Public Service, 2006.
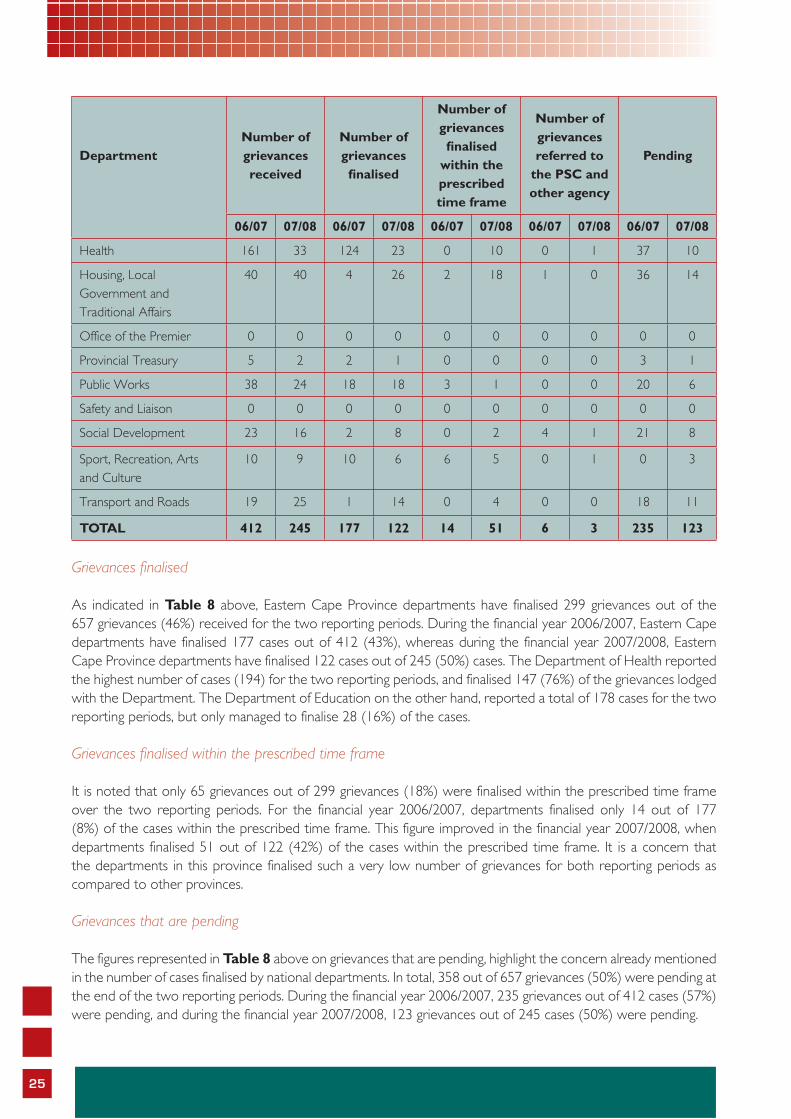
25
DepartmentNumber of grievances received
Number of grievances fi nalised
Number of grievances fi nalised
within the prescribed time frame
Number of grievances referred to
the PSC and other agency
Pending
06/07 07/08 06/07 07/08 06/07 07/08 06/07 07/08 06/07 07/08
Health 161 33 124 23 0 10 0 1 37 10
Housing, Local Government and Traditional Affairs
40 40 4 26 2 18 1 0 36 14
Office of the Premier 0 0 0 0 0 0 0 0 0 0
Provincial Treasury 5 2 2 1 0 0 0 0 3 1
Public Works 38 24 18 18 3 1 0 0 20 6
Safety and Liaison 0 0 0 0 0 0 0 0 0 0
Social Development 23 16 2 8 0 2 4 1 21 8
Sport, Recreation, Arts and Culture
10 9 10 6 6 5 0 1 0 3
Transport and Roads 19 25 1 14 0 4 0 0 18 11
TOTAL 412 245 177 122 14 51 6 3 235 123
Grievances finalised
As indicated in Table 8 above, Eastern Cape Province departments have finalised 299 grievances out of the 657 grievances (46%) received for the two reporting periods. During the financial year 2006/2007, Eastern Cape departments have finalised 177 cases out of 412 (43%), whereas during the financial year 2007/2008, Eastern Cape Province departments have finalised 122 cases out of 245 (50%) cases. The Department of Health reported the highest number of cases (194) for the two reporting periods, and finalised 147 (76%) of the grievances lodged with the Department. The Department of Education on the other hand, reported a total of 178 cases for the two reporting periods, but only managed to finalise 28 (16%) of the cases.
Grievances finalised within the prescribed time frame
It is noted that only 65 grievances out of 299 grievances (18%) were finalised within the prescribed time frame over the two reporting periods. For the financial year 2006/2007, departments finalised only 14 out of 177 (8%) of the cases within the prescribed time frame. This figure improved in the financial year 2007/2008, when departments finalised 51 out of 122 (42%) of the cases within the prescribed time frame. It is a concern that the departments in this province finalised such a very low number of grievances for both reporting periods as compared to other provinces.
Grievances that are pending
The figures represented in Table 8 above on grievances that are pending, highlight the concern already mentioned in the number of cases finalised by national departments. In total, 358 out of 657 grievances (50%) were pending at the end of the two reporting periods. During the financial year 2006/2007, 235 grievances out of 412 cases (57%) were pending, and during the financial year 2007/2008, 123 grievances out of 245 cases (50%) were pending.
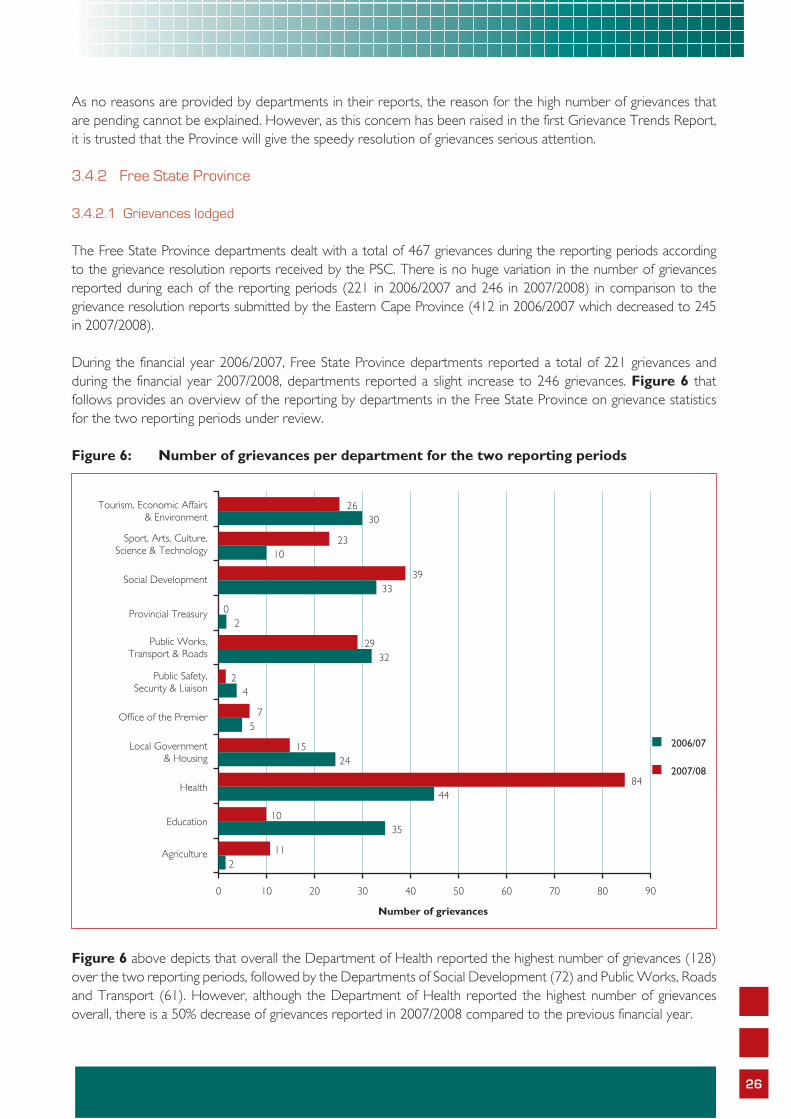
26
As no reasons are provided by departments in their reports, the reason for the high number of grievances that are pending cannot be explained. However, as this concern has been raised in the first Grievance Trends Report, it is trusted that the Province will give the speedy resolution of grievances serious attention.
3.4.2 Free State Province
3.4.2.1 Grievances lodged
The Free State Province departments dealt with a total of 467 grievances during the reporting periods according to the grievance resolution reports received by the PSC. There is no huge variation in the number of grievances reported during each of the reporting periods (221 in 2006/2007 and 246 in 2007/2008) in comparison to the grievance resolution reports submitted by the Eastern Cape Province (412 in 2006/2007 which decreased to 245 in 2007/2008).
During the financial year 2006/2007, Free State Province departments reported a total of 221 grievances and during the financial year 2007/2008, departments reported a slight increase to 246 grievances. Figure 6 that follows provides an overview of the reporting by departments in the Free State Province on grievance statistics for the two reporting periods under review.
Figure 6: Number of grievances per department for the two reporting periods
Figure 6 above depicts that overall the Department of Health reported the highest number of grievances (128) over the two reporting periods, followed by the Departments of Social Development (72) and Public Works, Roads and Transport (61). However, although the Department of Health reported the highest number of grievances overall, there is a 50% decrease of grievances reported in 2007/2008 compared to the previous financial year.
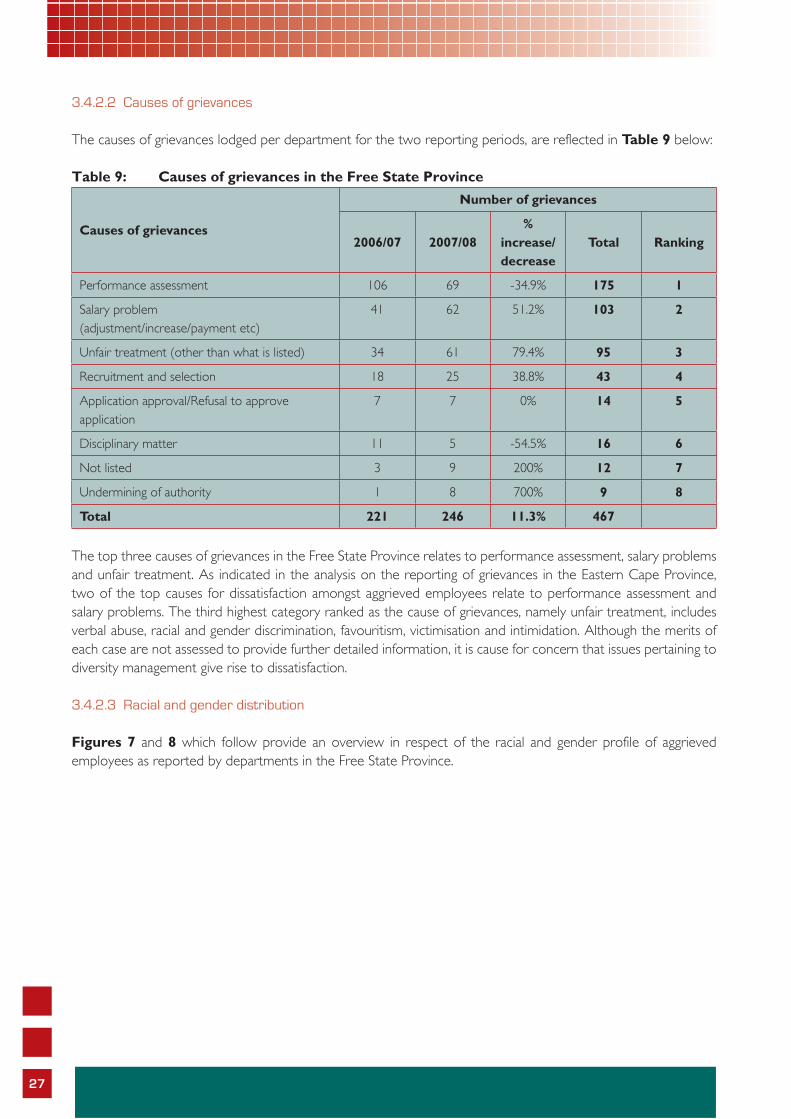
27
3.4.2.2 Causes of grievances
The causes of grievances lodged per department for the two reporting periods, are reflected in Table 9 below:
Table 9: Causes of grievances in the Free State Province
Causes of grievances
Number of grievances
2006/07 2007/08%
increase/decrease
Total Ranking
Performance assessment 106 69 -34.9% 175 1
Salary problem (adjustment/increase/payment etc)
41 62 51.2% 103 2
Unfair treatment (other than what is listed) 34 61 79.4% 95 3
Recruitment and selection 18 25 38.8% 43 4
Application approval/Refusal to approve application
7 7 0% 14 5
Disciplinary matter 11 5 -54.5% 16 6
Not listed 3 9 200% 12 7
Undermining of authority 1 8 700% 9 8
Total 221 246 11.3% 467
The top three causes of grievances in the Free State Province relates to performance assessment, salary problems and unfair treatment. As indicated in the analysis on the reporting of grievances in the Eastern Cape Province, two of the top causes for dissatisfaction amongst aggrieved employees relate to performance assessment and salary problems. The third highest category ranked as the cause of grievances, namely unfair treatment, includes verbal abuse, racial and gender discrimination, favouritism, victimisation and intimidation. Although the merits of each case are not assessed to provide further detailed information, it is cause for concern that issues pertaining to diversity management give rise to dissatisfaction.
3.4.2.3 Racial and gender distribution
Figures 7 and 8 which follow provide an overview in respect of the racial and gender profile of aggrieved employees as reported by departments in the Free State Province.
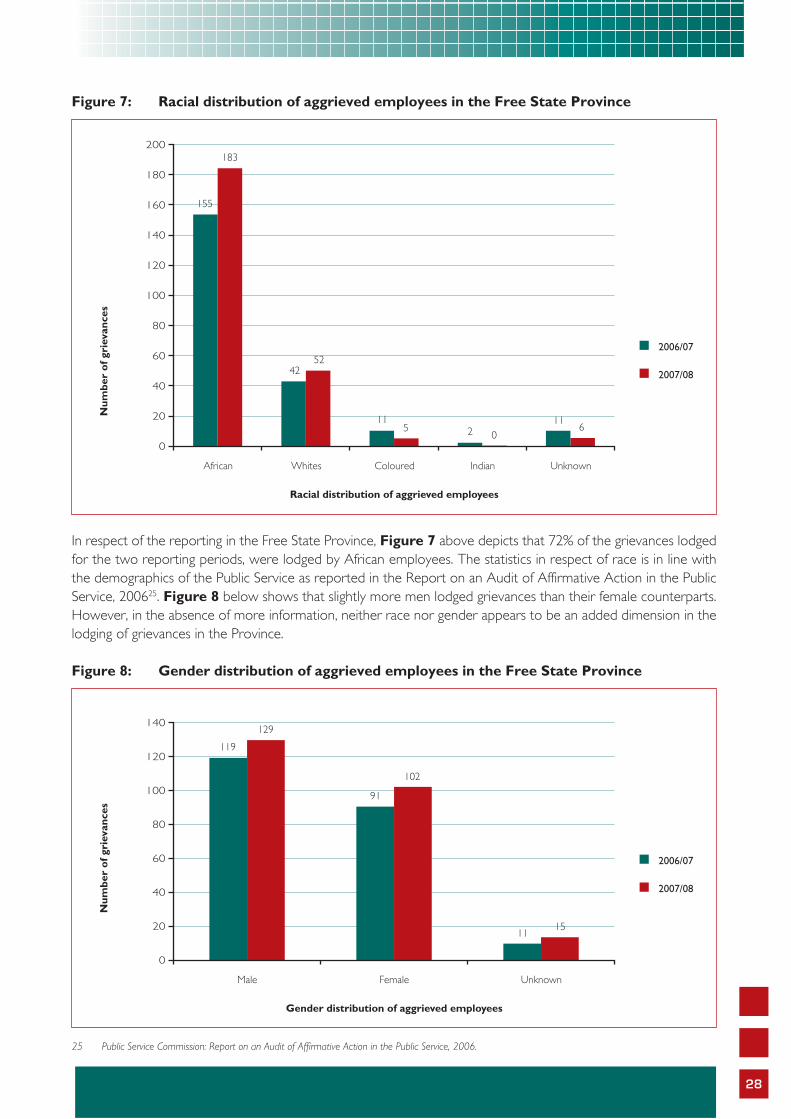
28
Figure 7: Racial distribution of aggrieved employees in the Free State Province
In respect of the reporting in the Free State Province, Figure 7 above depicts that 72% of the grievances lodged for the two reporting periods, were lodged by African employees. The statistics in respect of race is in line with the demographics of the Public Service as reported in the Report on an Audit of Affirmative Action in the Public Service, 200625. Figure 8 below shows that slightly more men lodged grievances than their female counterparts. However, in the absence of more information, neither race nor gender appears to be an added dimension in the lodging of grievances in the Province.
Figure 8: Gender distribution of aggrieved employees in the Free State Province
25 Public Service Commission: Report on an Audit of Affirmative Action in the Public Service, 2006.
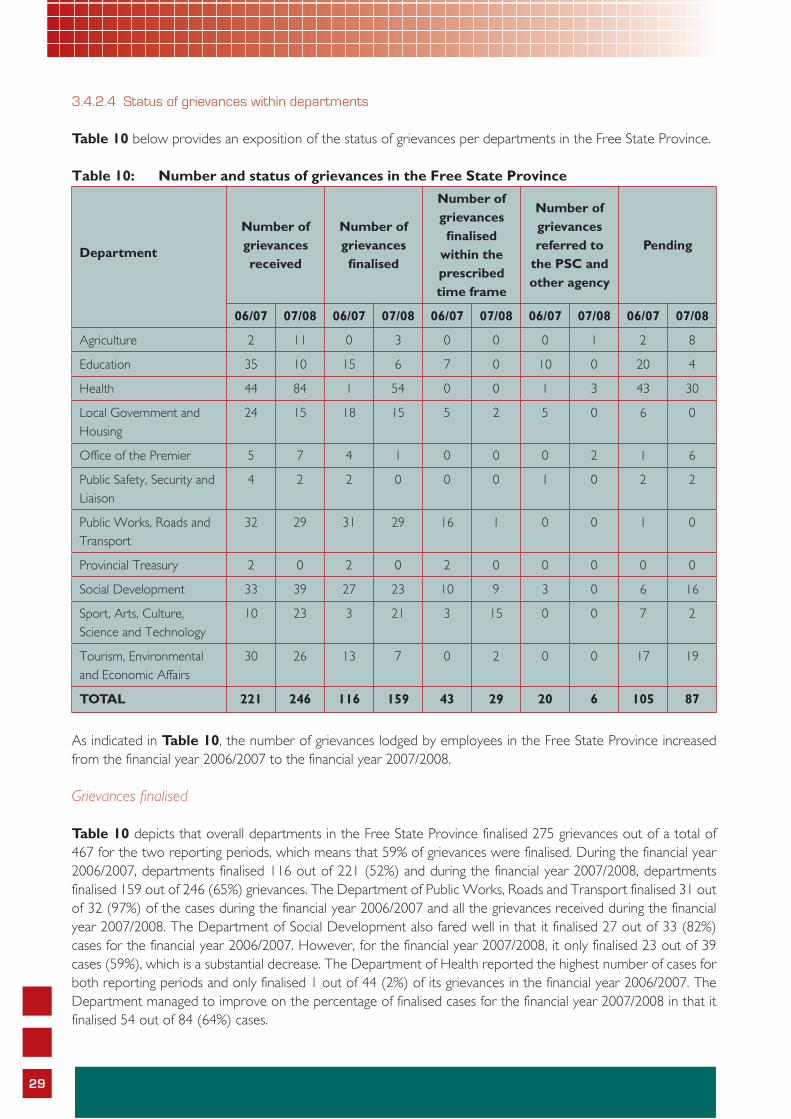
29
3.4.2.4 Status of grievances within departments
Table 10 below provides an exposition of the status of grievances per departments in the Free State Province.
Table 10: Number and status of grievances in the Free State Province
Department
Number of grievances received
Number of grievances fi nalised
Number of grievances fi nalised
within the prescribed time frame
Number of grievances referred to
the PSC and other agency
Pending
06/07 07/08 06/07 07/08 06/07 07/08 06/07 07/08 06/07 07/08
Agriculture 2 11 0 3 0 0 0 1 2 8
Education 35 10 15 6 7 0 10 0 20 4
Health 44 84 1 54 0 0 1 3 43 30
Local Government and Housing
24 15 18 15 5 2 5 0 6 0
Office of the Premier 5 7 4 1 0 0 0 2 1 6
Public Safety, Security and Liaison
4 2 2 0 0 0 1 0 2 2
Public Works, Roads and Transport
32 29 31 29 16 1 0 0 1 0
Provincial Treasury 2 0 2 0 2 0 0 0 0 0
Social Development 33 39 27 23 10 9 3 0 6 16
Sport, Arts, Culture, Science and Technology
10 23 3 21 3 15 0 0 7 2
Tourism, Environmental and Economic Affairs
30 26 13 7 0 2 0 0 17 19
TOTAL 221 246 116 159 43 29 20 6 105 87
As indicated in Table 10, the number of grievances lodged by employees in the Free State Province increased from the financial year 2006/2007 to the financial year 2007/2008.
Grievances finalised
Table 10 depicts that overall departments in the Free State Province finalised 275 grievances out of a total of 467 for the two reporting periods, which means that 59% of grievances were finalised. During the financial year 2006/2007, departments finalised 116 out of 221 (52%) and during the financial year 2007/2008, departments finalised 159 out of 246 (65%) grievances. The Department of Public Works, Roads and Transport finalised 31 out of 32 (97%) of the cases during the financial year 2006/2007 and all the grievances received during the financial year 2007/2008. The Department of Social Development also fared well in that it finalised 27 out of 33 (82%) cases for the financial year 2006/2007. However, for the financial year 2007/2008, it only finalised 23 out of 39 cases (59%), which is a substantial decrease. The Department of Health reported the highest number of cases for both reporting periods and only finalised 1 out of 44 (2%) of its grievances in the financial year 2006/2007. The Department managed to improve on the percentage of finalised cases for the financial year 2007/2008 in that it finalised 54 out of 84 (64%) cases.

30
Grievances finalised within the prescribed time frame
Overall, a total of 72 out of 275 grievances (26%) were finalised within the prescribed time frame. During the financial year 2006/2007, a total of 43 out of 116 (37%) grievances were finalised within the prescribed time frame and during the financial year 2007/2008, a total of 29 out of 159 (18%) grievances were finalised within the prescribed time frame. Although the percentage of grievances finalised by the Free State Province is slightly better than the percentage finalised by the Eastern Cape Province, it remains cause for concern that such a low percentage of grievances is finalised within the prescribed time frame.
Grievances that are pending
As indicated in Table 10, 41% of the grievances were pending at the end of the two reporting periods. During the financial year 2006/2007, 105 out of 221 (48%) grievances were pending and during the financial year 2007/2008, 87 out of 246 (35%) grievances were pending. The Department of Health reported the highest number of grievances for the two reporting periods (128) of which 73 (57%) grievances were pending. The Department of Social Development fared better in that it reported 72 grievances over the two reporting periods and had only 22 cases pending (31%).
3.4.3 Gauteng Province 3.4.3.1 Grievances lodged
A total of 725 grievances were reported by departments in the Gauteng Province for the two reporting periods. For the financial year 2006/2007, a total of 272 grievances were reported and for the financial year 2007/2008, a total of 453 grievances were reported.
The Department of Education did not submit a report for the financial year 2006/2007, which impacts on the accurate monitoring and evaluation and skews reporting on grievance management in the Public Service. The figure that follows provides an overview in respect of the number of grievances lodged per department for the two reporting periods.
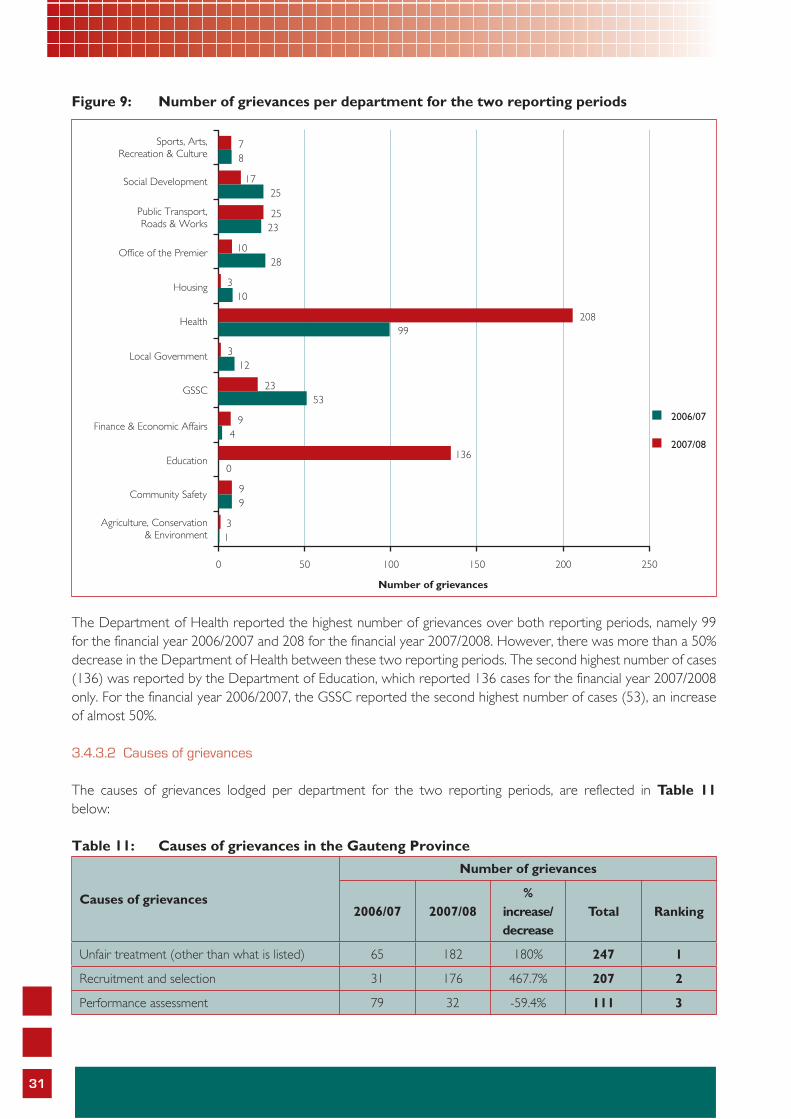
31
Figure 9: Number of grievances per department for the two reporting periods
The Department of Health reported the highest number of grievances over both reporting periods, namely 99 for the financial year 2006/2007 and 208 for the financial year 2007/2008. However, there was more than a 50% decrease in the Department of Health between these two reporting periods. The second highest number of cases (136) was reported by the Department of Education, which reported 136 cases for the financial year 2007/2008 only. For the financial year 2006/2007, the GSSC reported the second highest number of cases (53), an increase of almost 50%.
3.4.3.2 Causes of grievances
The causes of grievances lodged per department for the two reporting periods, are reflected in Table 11 below:
Table 11: Causes of grievances in the Gauteng Province
Causes of grievances
Number of grievances
2006/07 2007/08%
increase/decrease
Total Ranking
Unfair treatment (other than what is listed) 65 182 180% 247 1
Recruitment and selection 31 176 467.7% 207 2
Performance assessment 79 32 -59.4% 111 3
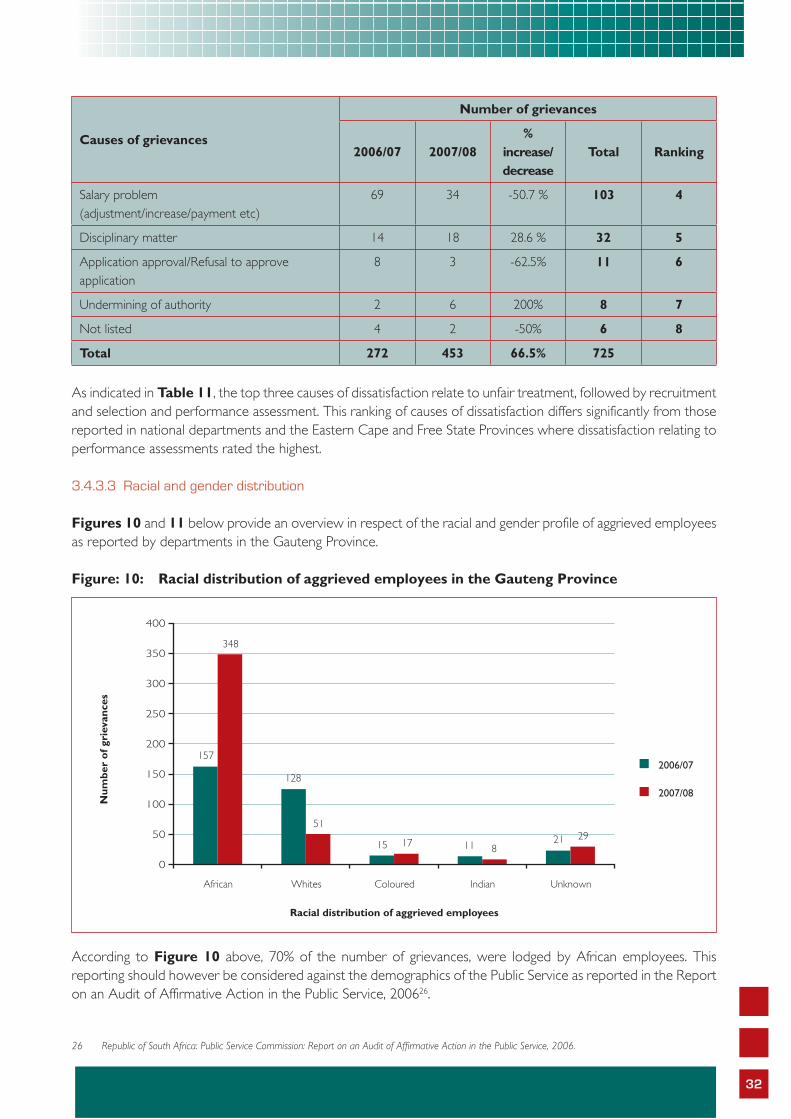
32
Causes of grievances
Number of grievances
2006/07 2007/08%
increase/decrease
Total Ranking
Salary problem (adjustment/increase/payment etc)
69 34 -50.7 % 103 4
Disciplinary matter 14 18 28.6 % 32 5
Application approval/Refusal to approve application
8 3 -62.5% 11 6
Undermining of authority 2 6 200% 8 7
Not listed 4 2 -50% 6 8
Total 272 453 66.5% 725
As indicated in Table 11, the top three causes of dissatisfaction relate to unfair treatment, followed by recruitment and selection and performance assessment. This ranking of causes of dissatisfaction differs significantly from those reported in national departments and the Eastern Cape and Free State Provinces where dissatisfaction relating to performance assessments rated the highest.
3.4.3.3 Racial and gender distribution
Figures 10 and 11 below provide an overview in respect of the racial and gender profile of aggrieved employees as reported by departments in the Gauteng Province. Figure: 10: Racial distribution of aggrieved employees in the Gauteng Province
According to Figure 10 above, 70% of the number of grievances, were lodged by African employees. This reporting should however be considered against the demographics of the Public Service as reported in the Report on an Audit of Affirmative Action in the Public Service, 200626.
26 Republic of South Africa: Public Service Commission: Report on an Audit of Affirmative Action in the Public Service, 2006.
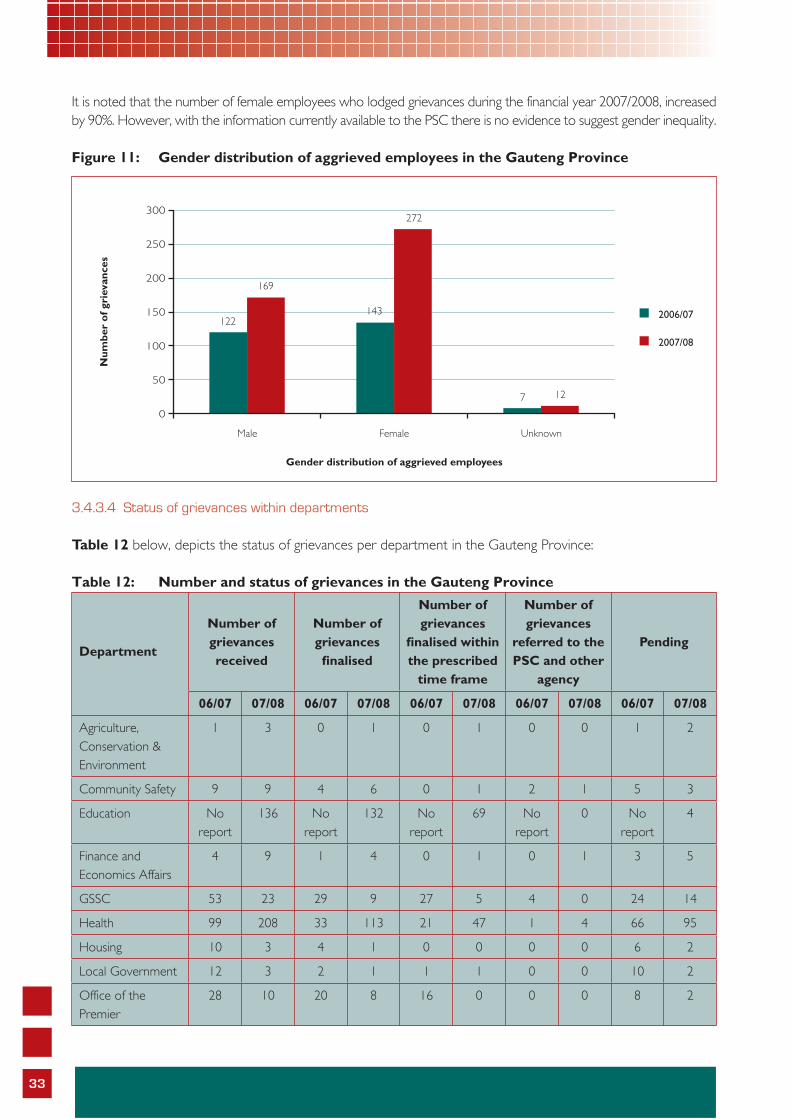
33
It is noted that the number of female employees who lodged grievances during the financial year 2007/2008, increased by 90%. However, with the information currently available to the PSC there is no evidence to suggest gender inequality.
Figure 11: Gender distribution of aggrieved employees in the Gauteng Province
3.4.3.4 Status of grievances within departments
Table 12 below, depicts the status of grievances per department in the Gauteng Province:
Table 12: Number and status of grievances in the Gauteng Province
Department
Number of grievances received
Number of grievances fi nalised
Number of grievances
fi nalised within the prescribed
time frame
Number of grievances
referred to the PSC and other
agency
Pending
06/07 07/08 06/07 07/08 06/07 07/08 06/07 07/08 06/07 07/08
Agriculture, Conservation & Environment
1 3 0 1 0 1 0 0 1 2
Community Safety 9 9 4 6 0 1 2 1 5 3
Education No report
136 No report
132 No report
69 No report
0 No report
4
Finance and Economics Affairs
4 9 1 4 0 1 0 1 3 5
GSSC 53 23 29 9 27 5 4 0 24 14
Health 99 208 33 113 21 47 1 4 66 95
Housing 10 3 4 1 0 0 0 0 6 2
Local Government 12 3 2 1 1 1 0 0 10 2
Office of the Premier
28 10 20 8 16 0 0 0 8 2
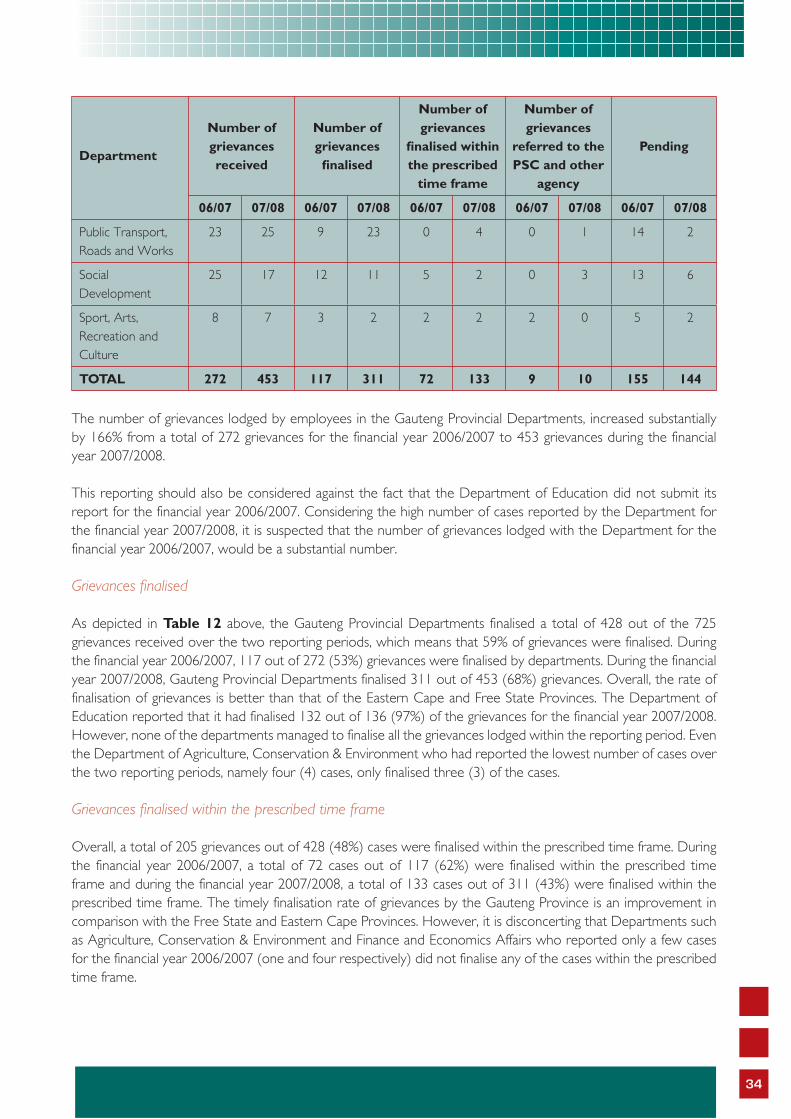
34
Department
Number of grievances received
Number of grievances fi nalised
Number of grievances
fi nalised within the prescribed
time frame
Number of grievances
referred to the PSC and other
agency
Pending
06/07 07/08 06/07 07/08 06/07 07/08 06/07 07/08 06/07 07/08
Public Transport, Roads and Works
23 25 9 23 0 4 0 1 14 2
Social Development
25 17 12 11 5 2 0 3 13 6
Sport, Arts, Recreation and Culture
8 7 3 2 2 2 2 0 5 2
TOTAL 272 453 117 311 72 133 9 10 155 144
The number of grievances lodged by employees in the Gauteng Provincial Departments, increased substantially by 166% from a total of 272 grievances for the financial year 2006/2007 to 453 grievances during the financial year 2007/2008.
This reporting should also be considered against the fact that the Department of Education did not submit its report for the financial year 2006/2007. Considering the high number of cases reported by the Department for the financial year 2007/2008, it is suspected that the number of grievances lodged with the Department for the financial year 2006/2007, would be a substantial number.
Grievances finalised
As depicted in Table 12 above, the Gauteng Provincial Departments finalised a total of 428 out of the 725 grievances received over the two reporting periods, which means that 59% of grievances were finalised. During the financial year 2006/2007, 117 out of 272 (53%) grievances were finalised by departments. During the financial year 2007/2008, Gauteng Provincial Departments finalised 311 out of 453 (68%) grievances. Overall, the rate of finalisation of grievances is better than that of the Eastern Cape and Free State Provinces. The Department of Education reported that it had finalised 132 out of 136 (97%) of the grievances for the financial year 2007/2008. However, none of the departments managed to finalise all the grievances lodged within the reporting period. Even the Department of Agriculture, Conservation & Environment who had reported the lowest number of cases over the two reporting periods, namely four (4) cases, only finalised three (3) of the cases.
Grievances finalised within the prescribed time frame
Overall, a total of 205 grievances out of 428 (48%) cases were finalised within the prescribed time frame. During the financial year 2006/2007, a total of 72 cases out of 117 (62%) were finalised within the prescribed time frame and during the financial year 2007/2008, a total of 133 cases out of 311 (43%) were finalised within the prescribed time frame. The timely finalisation rate of grievances by the Gauteng Province is an improvement in comparison with the Free State and Eastern Cape Provinces. However, it is disconcerting that Departments such as Agriculture, Conservation & Environment and Finance and Economics Affairs who reported only a few cases for the financial year 2006/2007 (one and four respectively) did not finalise any of the cases within the prescribed time frame.
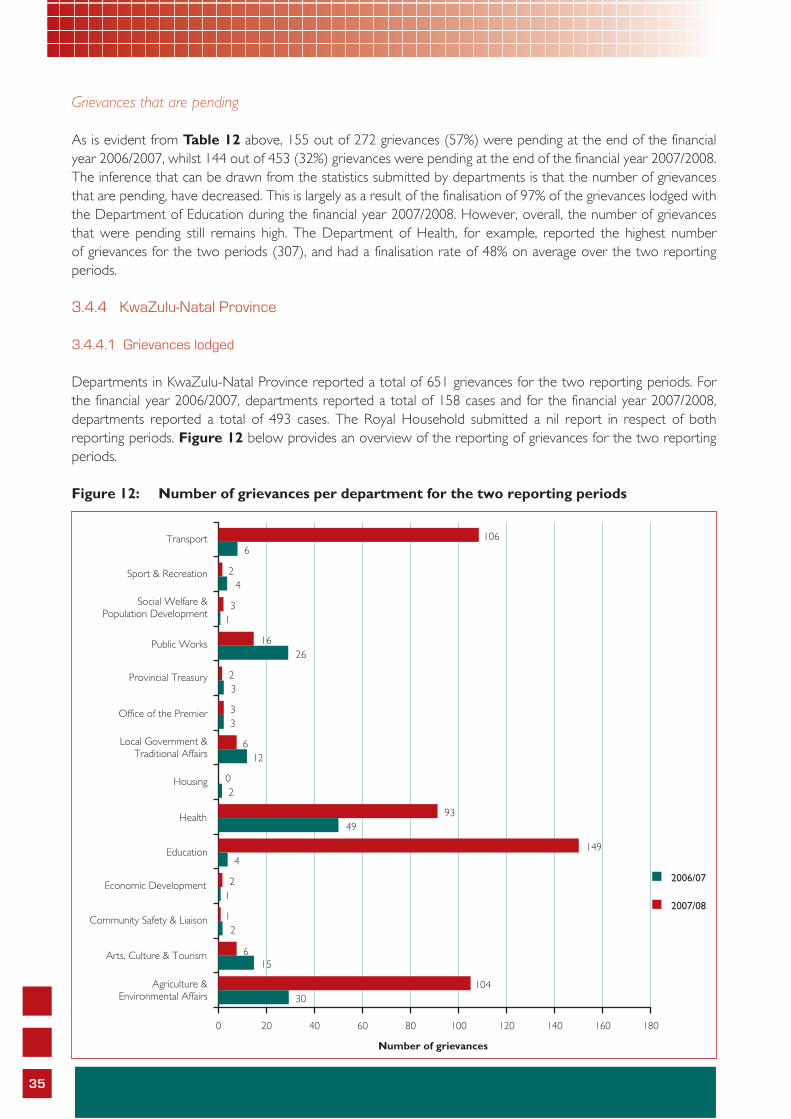
35
Grievances that are pending
As is evident from Table 12 above, 155 out of 272 grievances (57%) were pending at the end of the financial year 2006/2007, whilst 144 out of 453 (32%) grievances were pending at the end of the financial year 2007/2008. The inference that can be drawn from the statistics submitted by departments is that the number of grievances that are pending, have decreased. This is largely as a result of the finalisation of 97% of the grievances lodged with the Department of Education during the financial year 2007/2008. However, overall, the number of grievances that were pending still remains high. The Department of Health, for example, reported the highest number of grievances for the two periods (307), and had a finalisation rate of 48% on average over the two reporting periods.
3.4.4 KwaZulu-Natal Province
3.4.4.1 Grievances lodged
Departments in KwaZulu-Natal Province reported a total of 651 grievances for the two reporting periods. For the financial year 2006/2007, departments reported a total of 158 cases and for the financial year 2007/2008, departments reported a total of 493 cases. The Royal Household submitted a nil report in respect of both reporting periods. Figure 12 below provides an overview of the reporting of grievances for the two reporting periods.
Figure 12: Number of grievances per department for the two reporting periods
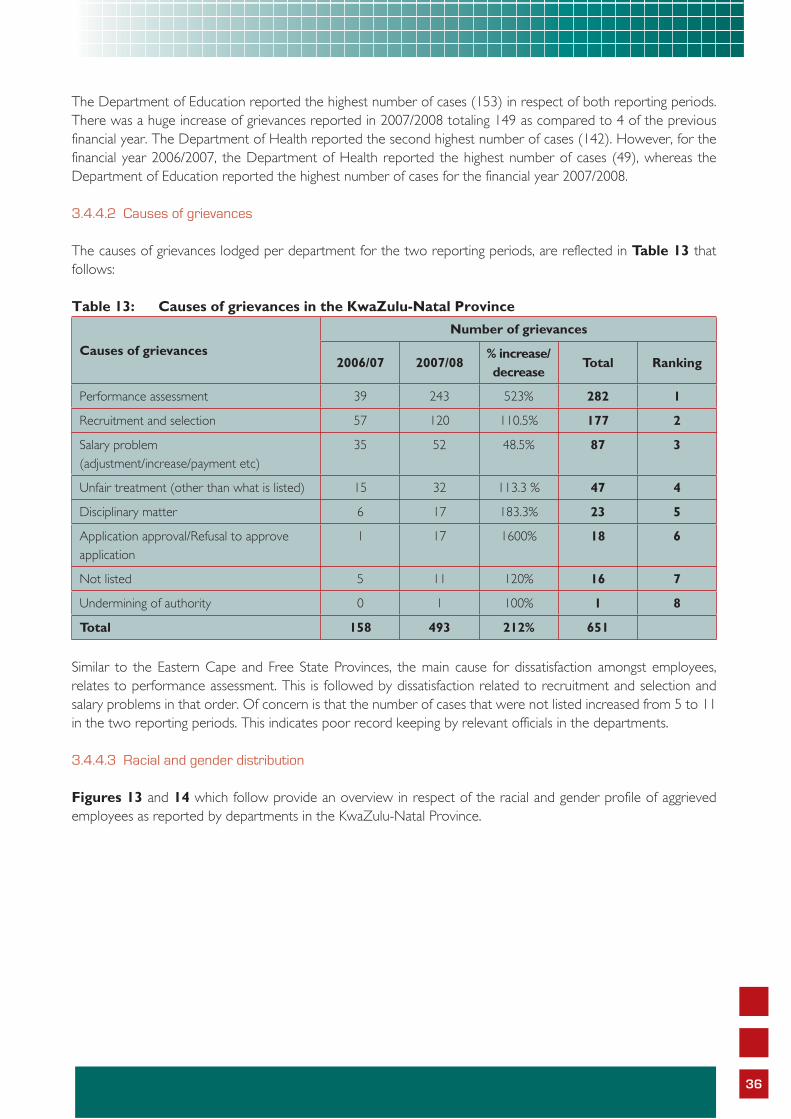
36
The Department of Education reported the highest number of cases (153) in respect of both reporting periods. There was a huge increase of grievances reported in 2007/2008 totaling 149 as compared to 4 of the previous financial year. The Department of Health reported the second highest number of cases (142). However, for the financial year 2006/2007, the Department of Health reported the highest number of cases (49), whereas the Department of Education reported the highest number of cases for the financial year 2007/2008.
3.4.4.2 Causes of grievances
The causes of grievances lodged per department for the two reporting periods, are reflected in Table 13 that follows:
Table 13: Causes of grievances in the KwaZulu-Natal Province
Causes of grievances
Number of grievances
2006/07 2007/08% increase/decrease
Total Ranking
Performance assessment 39 243 523% 282 1
Recruitment and selection 57 120 110.5% 177 2
Salary problem (adjustment/increase/payment etc)
35 52 48.5% 87 3
Unfair treatment (other than what is listed) 15 32 113.3 % 47 4
Disciplinary matter 6 17 183.3% 23 5
Application approval/Refusal to approve application
1 17 1600% 18 6
Not listed 5 11 120% 16 7
Undermining of authority 0 1 100% 1 8
Total 158 493 212% 651
Similar to the Eastern Cape and Free State Provinces, the main cause for dissatisfaction amongst employees, relates to performance assessment. This is followed by dissatisfaction related to recruitment and selection and salary problems in that order. Of concern is that the number of cases that were not listed increased from 5 to 11 in the two reporting periods. This indicates poor record keeping by relevant officials in the departments.
3.4.4.3 Racial and gender distribution
Figures 13 and 14 which follow provide an overview in respect of the racial and gender profile of aggrieved employees as reported by departments in the KwaZulu-Natal Province.
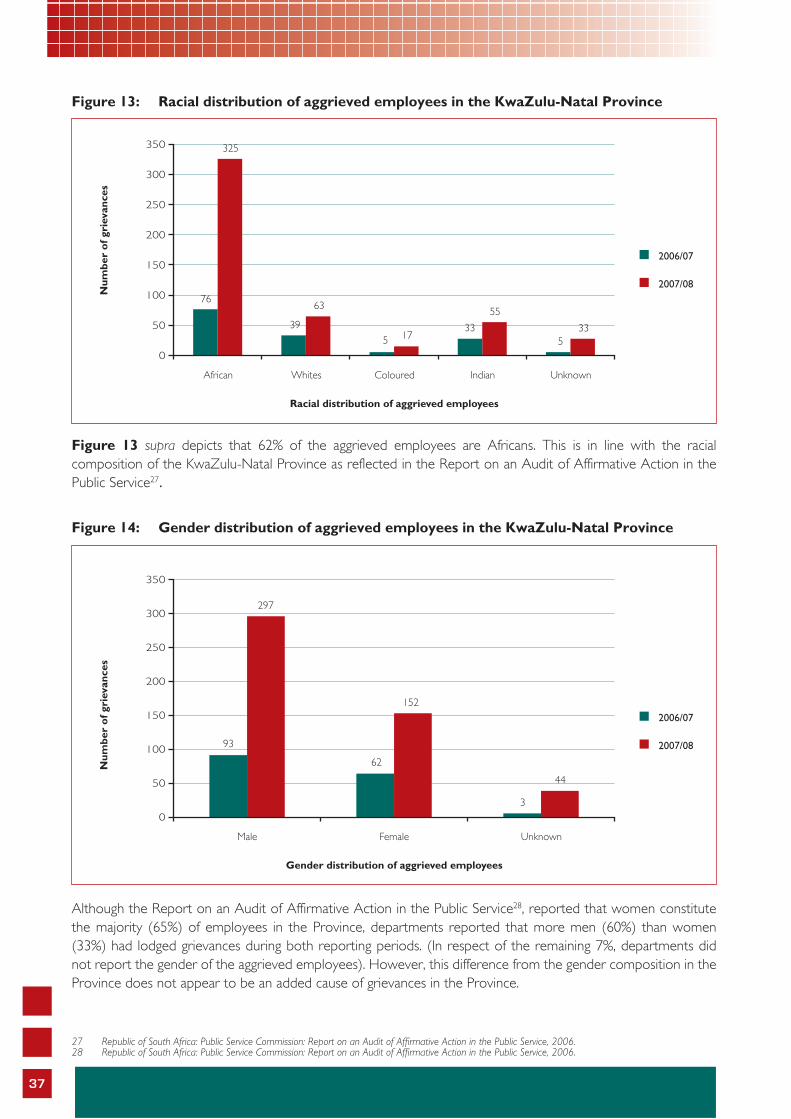
37
Figure 13: Racial distribution of aggrieved employees in the KwaZulu-Natal Province
Figure 13 supra depicts that 62% of the aggrieved employees are Africans. This is in line with the racial composition of the KwaZulu-Natal Province as reflected in the Report on an Audit of Affirmative Action in the Public Service27.
Figure 14: Gender distribution of aggrieved employees in the KwaZulu-Natal Province
Although the Report on an Audit of Affirmative Action in the Public Service28, reported that women constitute the majority (65%) of employees in the Province, departments reported that more men (60%) than women (33%) had lodged grievances during both reporting periods. (In respect of the remaining 7%, departments did not report the gender of the aggrieved employees). However, this difference from the gender composition in the Province does not appear to be an added cause of grievances in the Province.
27 Republic of South Africa: Public Service Commission: Report on an Audit of Affirmative Action in the Public Service, 2006.28 Republic of South Africa: Public Service Commission: Report on an Audit of Affirmative Action in the Public Service, 2006.
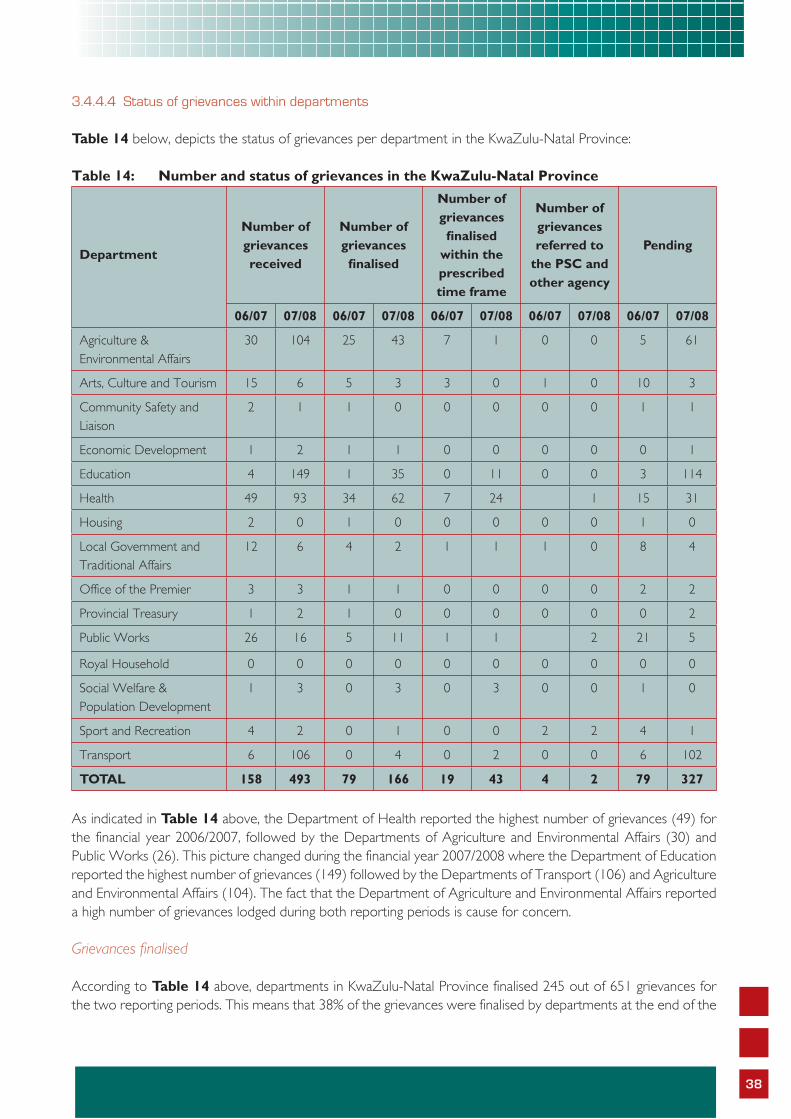
38
3.4.4.4 Status of grievances within departments
Table 14 below, depicts the status of grievances per department in the KwaZulu-Natal Province:
Table 14: Number and status of grievances in the KwaZulu-Natal Province
Department
Number of grievances received
Number of grievances fi nalised
Number of grievances fi nalised
within the prescribed time frame
Number of grievances referred to
the PSC and other agency
Pending
06/07 07/08 06/07 07/08 06/07 07/08 06/07 07/08 06/07 07/08
Agriculture & Environmental Affairs
30 104 25 43 7 1 0 0 5 61
Arts, Culture and Tourism 15 6 5 3 3 0 1 0 10 3
Community Safety and Liaison
2 1 1 0 0 0 0 0 1 1
Economic Development 1 2 1 1 0 0 0 0 0 1
Education 4 149 1 35 0 11 0 0 3 114
Health 49 93 34 62 7 24 1 15 31
Housing 2 0 1 0 0 0 0 0 1 0
Local Government and Traditional Affairs
12 6 4 2 1 1 1 0 8 4
Office of the Premier 3 3 1 1 0 0 0 0 2 2
Provincial Treasury 1 2 1 0 0 0 0 0 0 2
Public Works 26 16 5 11 1 1 2 21 5
Royal Household 0 0 0 0 0 0 0 0 0 0
Social Welfare & Population Development
1 3 0 3 0 3 0 0 1 0
Sport and Recreation 4 2 0 1 0 0 2 2 4 1
Transport 6 106 0 4 0 2 0 0 6 102
TOTAL 158 493 79 166 19 43 4 2 79 327
As indicated in Table 14 above, the Department of Health reported the highest number of grievances (49) for the financial year 2006/2007, followed by the Departments of Agriculture and Environmental Affairs (30) and Public Works (26). This picture changed during the financial year 2007/2008 where the Department of Education reported the highest number of grievances (149) followed by the Departments of Transport (106) and Agriculture and Environmental Affairs (104). The fact that the Department of Agriculture and Environmental Affairs reported a high number of grievances lodged during both reporting periods is cause for concern.
Grievances finalised
According to Table 14 above, departments in KwaZulu-Natal Province finalised 245 out of 651 grievances for the two reporting periods. This means that 38% of the grievances were finalised by departments at the end of the

39
reporting period. During the financial year 2006/2007, departments finalised 79 out of 158 (50%) grievances, and during the financial year 2007/2008, departments finalised 166 out of 493 cases (34%).
The Department of Health in KwaZulu-Natal Province fared the best in that it finalised 68% of the grievances for the two reporting periods. The Department of Transport only finalised 6 of the 112 grievances lodged during the two reporting periods, which means that only 4% of the grievances were finalised. In the absence of reasons provided for this poor performance, the most likely reason could be the lack of priority given to the management of grievances and/or a lack of expertise in managing grievances.
Grievances finalised within the prescribed time frame
KwaZulu-Natal departments finalised 62 out of 245 (25%) grievances within the prescribed time frame over the two reporting periods. In the financial year 2006/2007, departments finalised 19 out of the 79 grievances (24%) and in the financial year 2007/2008, departments finalised 43 out of 166 (26%) grievances. Departments are clearly unable to comply with the time frame provided for in the Grievances Rules 2003. This may be due to several procedural problems within departments or simply an inability to manage grievance resolution within departments.
Grievances that are pending
As indicated in Table 14 supra, 62% of the grievances lodged during the two reporting periods were pending at the end of the reporting periods. During the financial year 2006/2007, 79 out of 158 cases (50%) were pending and during the financial year 2007/2008, 327 out of 493 cases (66%) were pending. It is disconcerting that departments such as Economic Development, Housing and Sport and Recreation, who all reported but a few cases, still had an average of 80% of grievances pending.
3.4.5 Limpopo Province
3.4.5.1 Grievances lodged
A total of 652 grievances were received by the Limpopo Province during the two reporting periods. For the financial year 2006/2007, departments in the Limpopo Province reported a total of 368 grievances and for the financial year 2007/2008, a total of 284 grievances. Figure 15 provides an overview of the number of grievances reported by departments in the Limpopo Province for both reporting periods.
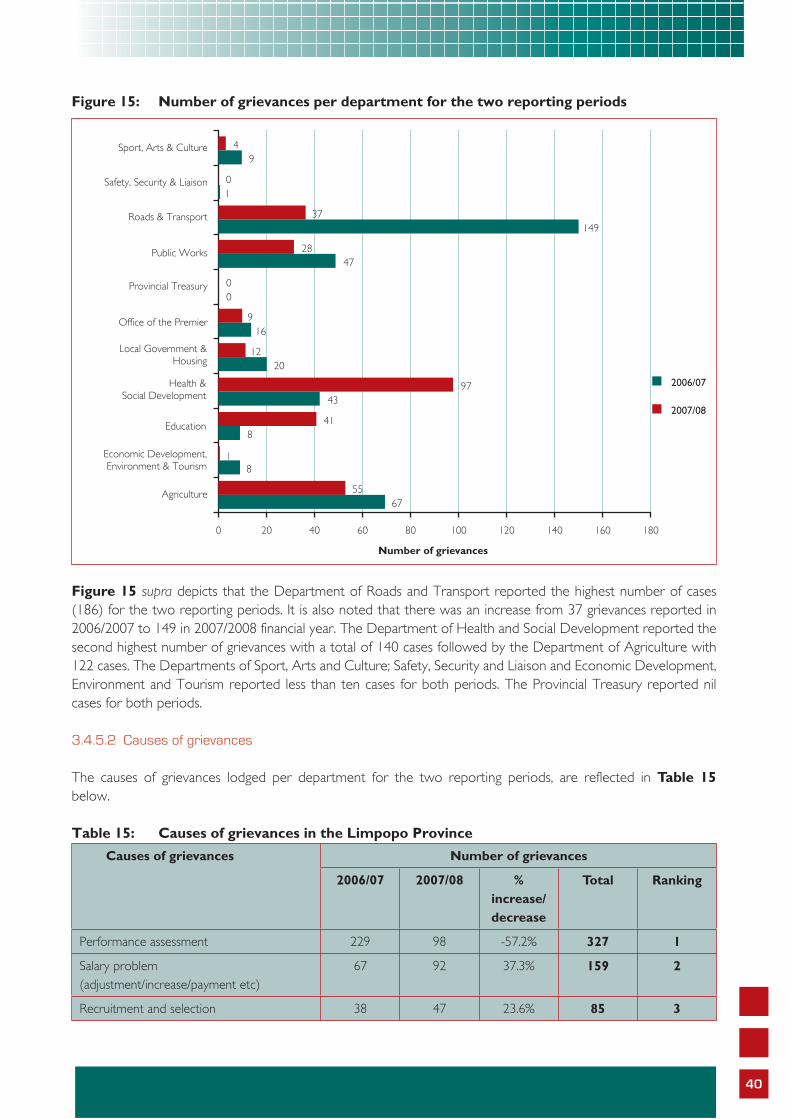
40
Figure 15: Number of grievances per department for the two reporting periods
Figure 15 supra depicts that the Department of Roads and Transport reported the highest number of cases (186) for the two reporting periods. It is also noted that there was an increase from 37 grievances reported in 2006/2007 to 149 in 2007/2008 financial year. The Department of Health and Social Development reported the second highest number of grievances with a total of 140 cases followed by the Department of Agriculture with 122 cases. The Departments of Sport, Arts and Culture; Safety, Security and Liaison and Economic Development, Environment and Tourism reported less than ten cases for both periods. The Provincial Treasury reported nil cases for both periods.
3.4.5.2 Causes of grievances
The causes of grievances lodged per department for the two reporting periods, are reflected in Table 15 below.
Table 15: Causes of grievances in the Limpopo Province
Causes of grievances Number of grievances
2006/07 2007/08 % increase/decrease
Total Ranking
Performance assessment 229 98 -57.2% 327 1
Salary problem (adjustment/increase/payment etc)
67 92 37.3% 159 2
Recruitment and selection 38 47 23.6% 85 3
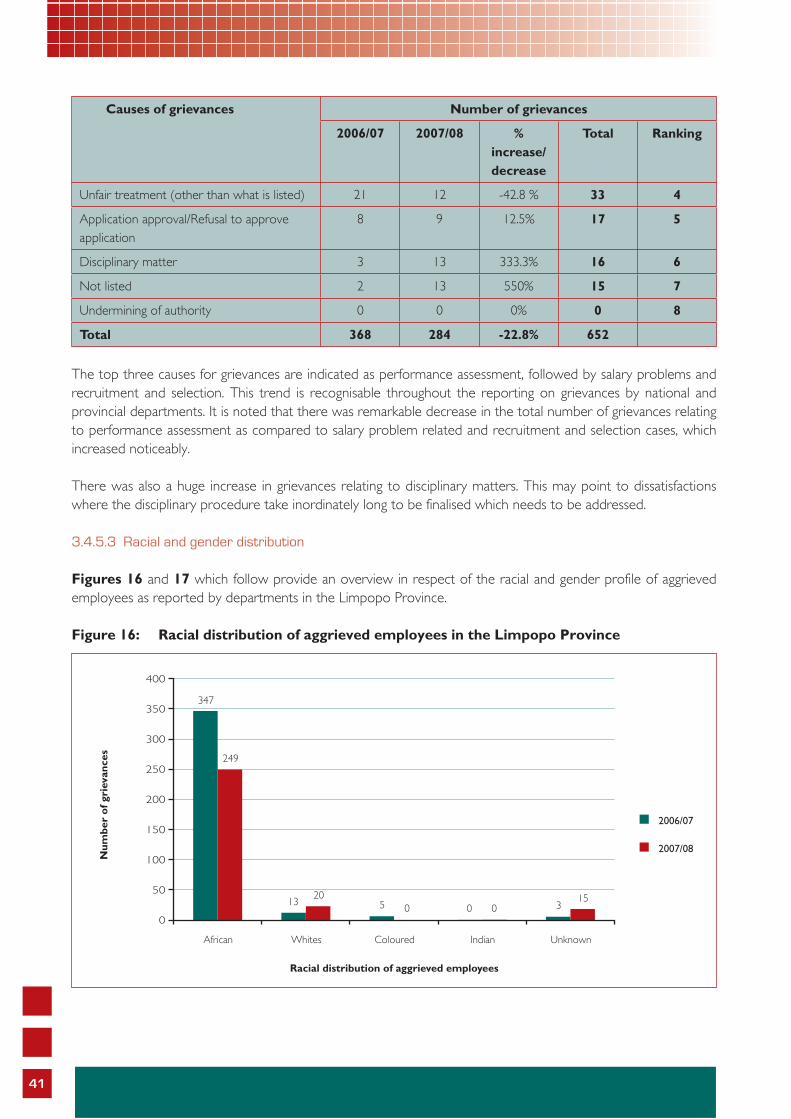
41
Causes of grievances Number of grievances
2006/07 2007/08 % increase/decrease
Total Ranking
Unfair treatment (other than what is listed) 21 12 -42.8 % 33 4
Application approval/Refusal to approve application
8 9 12.5% 17 5
Disciplinary matter 3 13 333.3% 16 6
Not listed 2 13 550% 15 7
Undermining of authority 0 0 0% 0 8
Total 368 284 -22.8% 652
The top three causes for grievances are indicated as performance assessment, followed by salary problems and recruitment and selection. This trend is recognisable throughout the reporting on grievances by national and provincial departments. It is noted that there was remarkable decrease in the total number of grievances relating to performance assessment as compared to salary problem related and recruitment and selection cases, which increased noticeably.
There was also a huge increase in grievances relating to disciplinary matters. This may point to dissatisfactions where the disciplinary procedure take inordinately long to be finalised which needs to be addressed.
3.4.5.3 Racial and gender distribution
Figures 16 and 17 which follow provide an overview in respect of the racial and gender profile of aggrieved employees as reported by departments in the Limpopo Province.
Figure 16: Racial distribution of aggrieved employees in the Limpopo Province
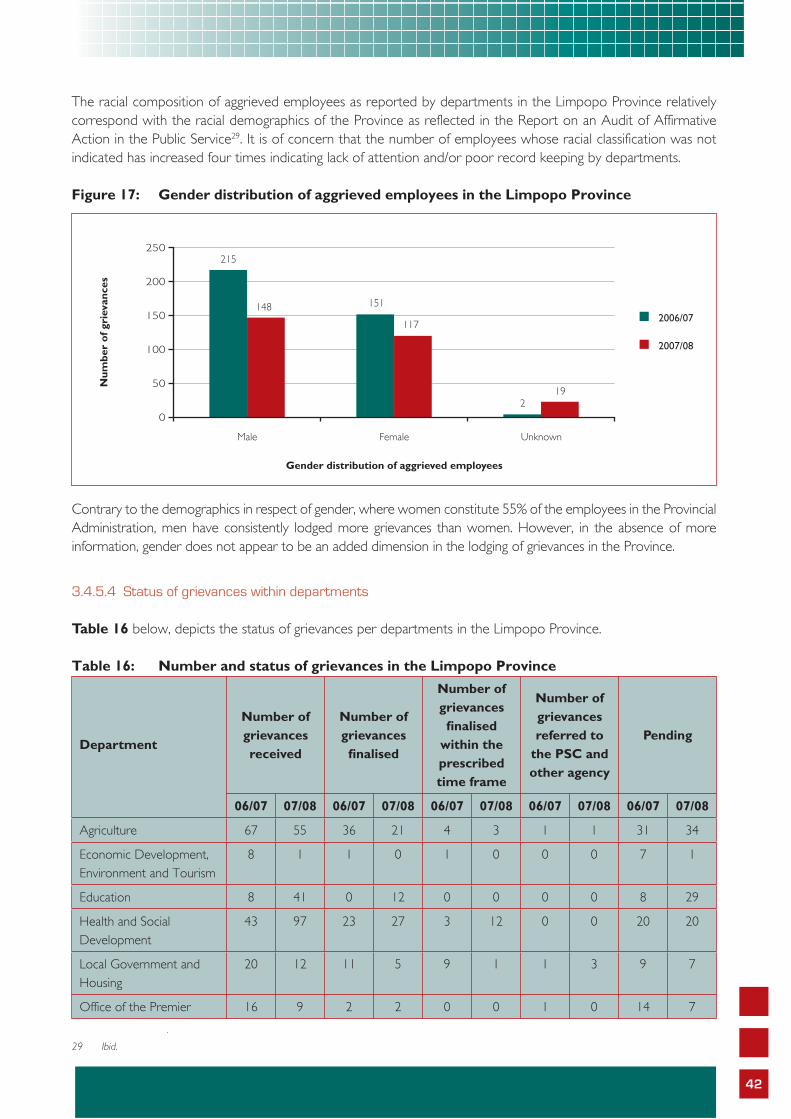
42
The racial composition of aggrieved employees as reported by departments in the Limpopo Province relatively correspond with the racial demographics of the Province as reflected in the Report on an Audit of Affirmative Action in the Public Service29. It is of concern that the number of employees whose racial classification was not indicated has increased four times indicating lack of attention and/or poor record keeping by departments.
Figure 17: Gender distribution of aggrieved employees in the Limpopo Province
Contrary to the demographics in respect of gender, where women constitute 55% of the employees in the Provincial Administration, men have consistently lodged more grievances than women. However, in the absence of more information, gender does not appear to be an added dimension in the lodging of grievances in the Province.
3.4.5.4 Status of grievances within departments
Table 16 below, depicts the status of grievances per departments in the Limpopo Province.
Table 16: Number and status of grievances in the Limpopo Province
Department
Number of grievances received
Number of grievances fi nalised
Number of grievances fi nalised
within the prescribed time frame
Number of grievances referred to
the PSC and other agency
Pending
06/07 07/08 06/07 07/08 06/07 07/08 06/07 07/08 06/07 07/08
Agriculture 67 55 36 21 4 3 1 1 31 34
Economic Development, Environment and Tourism
8 1 1 0 1 0 0 0 7 1
Education 8 41 0 12 0 0 0 0 8 29
Health and Social Development
43 97 23 27 3 12 0 0 20 20
Local Government and Housing
20 12 11 5 9 1 1 3 9 7
Office of the Premier 16 9 2 2 0 0 1 0 14 7
29 Ibid.
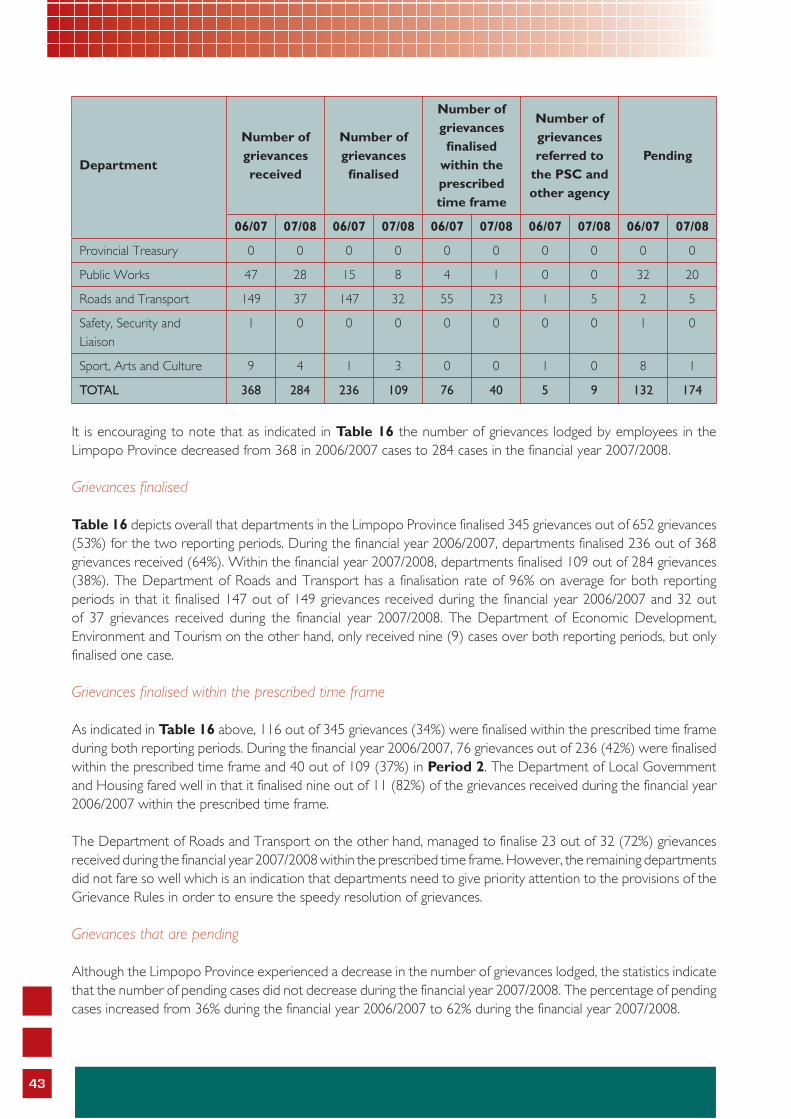
43
Department
Number of grievances received
Number of grievances fi nalised
Number of grievances fi nalised
within the prescribed time frame
Number of grievances referred to
the PSC and other agency
Pending
06/07 07/08 06/07 07/08 06/07 07/08 06/07 07/08 06/07 07/08
Provincial Treasury 0 0 0 0 0 0 0 0 0 0
Public Works 47 28 15 8 4 1 0 0 32 20
Roads and Transport 149 37 147 32 55 23 1 5 2 5
Safety, Security and Liaison
1 0 0 0 0 0 0 0 1 0
Sport, Arts and Culture 9 4 1 3 0 0 1 0 8 1
TOTAL 368 284 236 109 76 40 5 9 132 174
It is encouraging to note that as indicated in Table 16 the number of grievances lodged by employees in the Limpopo Province decreased from 368 in 2006/2007 cases to 284 cases in the financial year 2007/2008.
Grievances finalised
Table 16 depicts overall that departments in the Limpopo Province finalised 345 grievances out of 652 grievances (53%) for the two reporting periods. During the financial year 2006/2007, departments finalised 236 out of 368 grievances received (64%). Within the financial year 2007/2008, departments finalised 109 out of 284 grievances (38%). The Department of Roads and Transport has a finalisation rate of 96% on average for both reporting periods in that it finalised 147 out of 149 grievances received during the financial year 2006/2007 and 32 out of 37 grievances received during the financial year 2007/2008. The Department of Economic Development, Environment and Tourism on the other hand, only received nine (9) cases over both reporting periods, but only finalised one case. Grievances finalised within the prescribed time frame
As indicated in Table 16 above, 116 out of 345 grievances (34%) were finalised within the prescribed time frame during both reporting periods. During the financial year 2006/2007, 76 grievances out of 236 (42%) were finalised within the prescribed time frame and 40 out of 109 (37%) in Period 2. The Department of Local Government and Housing fared well in that it finalised nine out of 11 (82%) of the grievances received during the financial year 2006/2007 within the prescribed time frame.
The Department of Roads and Transport on the other hand, managed to finalise 23 out of 32 (72%) grievances received during the financial year 2007/2008 within the prescribed time frame. However, the remaining departments did not fare so well which is an indication that departments need to give priority attention to the provisions of the Grievance Rules in order to ensure the speedy resolution of grievances.
Grievances that are pending
Although the Limpopo Province experienced a decrease in the number of grievances lodged, the statistics indicate that the number of pending cases did not decrease during the financial year 2007/2008. The percentage of pending cases increased from 36% during the financial year 2006/2007 to 62% during the financial year 2007/2008.
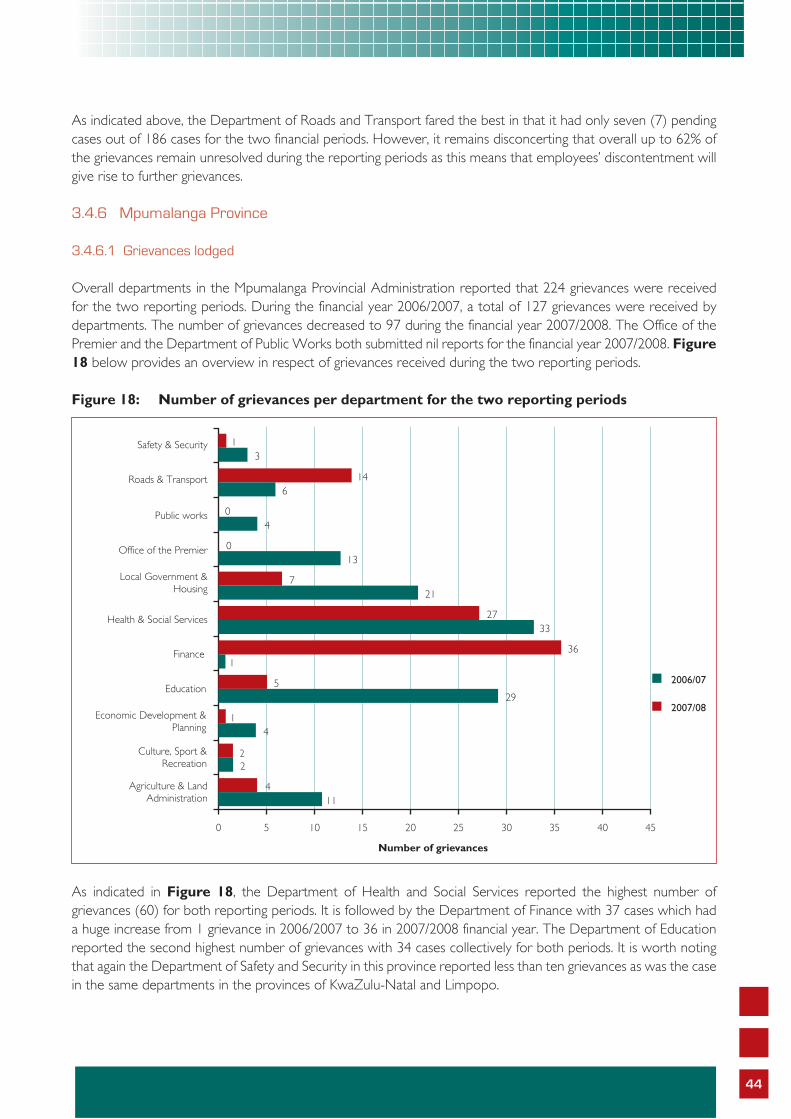
44
As indicated above, the Department of Roads and Transport fared the best in that it had only seven (7) pending cases out of 186 cases for the two financial periods. However, it remains disconcerting that overall up to 62% of the grievances remain unresolved during the reporting periods as this means that employees’ discontentment will give rise to further grievances.
3.4.6 Mpumalanga Province
3.4.6.1 Grievances lodged
Overall departments in the Mpumalanga Provincial Administration reported that 224 grievances were received for the two reporting periods. During the financial year 2006/2007, a total of 127 grievances were received by departments. The number of grievances decreased to 97 during the financial year 2007/2008. The Office of the Premier and the Department of Public Works both submitted nil reports for the financial year 2007/2008. Figure 18 below provides an overview in respect of grievances received during the two reporting periods.
Figure 18: Number of grievances per department for the two reporting periods
As indicated in Figure 18, the Department of Health and Social Services reported the highest number of grievances (60) for both reporting periods. It is followed by the Department of Finance with 37 cases which had a huge increase from 1 grievance in 2006/2007 to 36 in 2007/2008 financial year. The Department of Education reported the second highest number of grievances with 34 cases collectively for both periods. It is worth noting that again the Department of Safety and Security in this province reported less than ten grievances as was the case in the same departments in the provinces of KwaZulu-Natal and Limpopo.
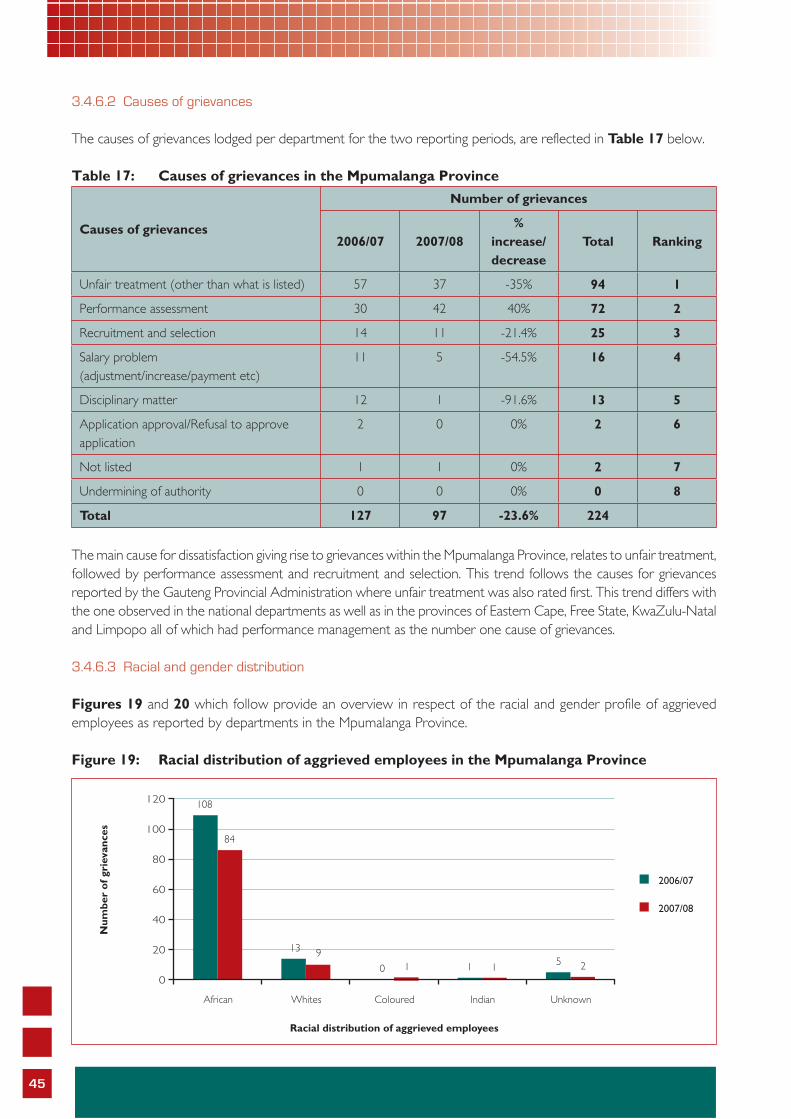
45
3.4.6.2 Causes of grievances
The causes of grievances lodged per department for the two reporting periods, are reflected in Table 17 below.
Table 17: Causes of grievances in the Mpumalanga Province
Causes of grievances
Number of grievances
2006/07 2007/08%
increase/decrease
Total Ranking
Unfair treatment (other than what is listed) 57 37 -35% 94 1
Performance assessment 30 42 40% 72 2
Recruitment and selection 14 11 -21.4% 25 3
Salary problem (adjustment/increase/payment etc)
11 5 -54.5% 16 4
Disciplinary matter 12 1 -91.6% 13 5
Application approval/Refusal to approve application
2 0 0% 2 6
Not listed 1 1 0% 2 7
Undermining of authority 0 0 0% 0 8
Total 127 97 -23.6% 224
The main cause for dissatisfaction giving rise to grievances within the Mpumalanga Province, relates to unfair treatment, followed by performance assessment and recruitment and selection. This trend follows the causes for grievances reported by the Gauteng Provincial Administration where unfair treatment was also rated first. This trend differs with the one observed in the national departments as well as in the provinces of Eastern Cape, Free State, KwaZulu-Natal and Limpopo all of which had performance management as the number one cause of grievances.
3.4.6.3 Racial and gender distribution
Figures 19 and 20 which follow provide an overview in respect of the racial and gender profile of aggrieved employees as reported by departments in the Mpumalanga Province.
Figure 19: Racial distribution of aggrieved employees in the Mpumalanga Province

46
The racial distribution of aggrieved employees in the Mpumalanga Province follows the demographics of the Public Service in the Province as depicted in the Report on an Audit of Affirmative Action in the Public Service, where Africans constitute 89.3% of employees in the Province.
Figure 20: Gender distribution of aggrieved employees in the Mpumalanga Province
According to the demographics of the distribution of gender in the Public Service in the Province, women constitute 62% of employees30. The statistics submitted by the departments in the Mpumalanga Province, however, indicate that 50% of the grievances lodged during the two reporting periods were lodged by women. However, in the absence of more information, gender does not appear to be an added dimension in the lodging of grievances in the Province. 3.4.6.4 Status of grievances within departments
Table 18 below, depicts the status of grievances per departments in the Mpumalanga Province.
Table 18: Number and status of grievances in the Mpumalanga Province
Department
Number of grievances received
Number of grievances fi nalised
Number of grievances fi nalised
within the prescribed time frame
Number of grievances referred to
the PSC and other agency
Pending
06/07 07/08 06/07 07/08 06/07 07/08 06/07 07/08 06/07 07/08
Agriculture & Land Administration
4 4 4 2 1 0 0 0 0 2
Culture, Sport & Recreation
2 2 1 2 0 1 0 0 1 0
30 Public Service Commission: Report on an Audit of Affirmative Action in the Public Service, 2006.
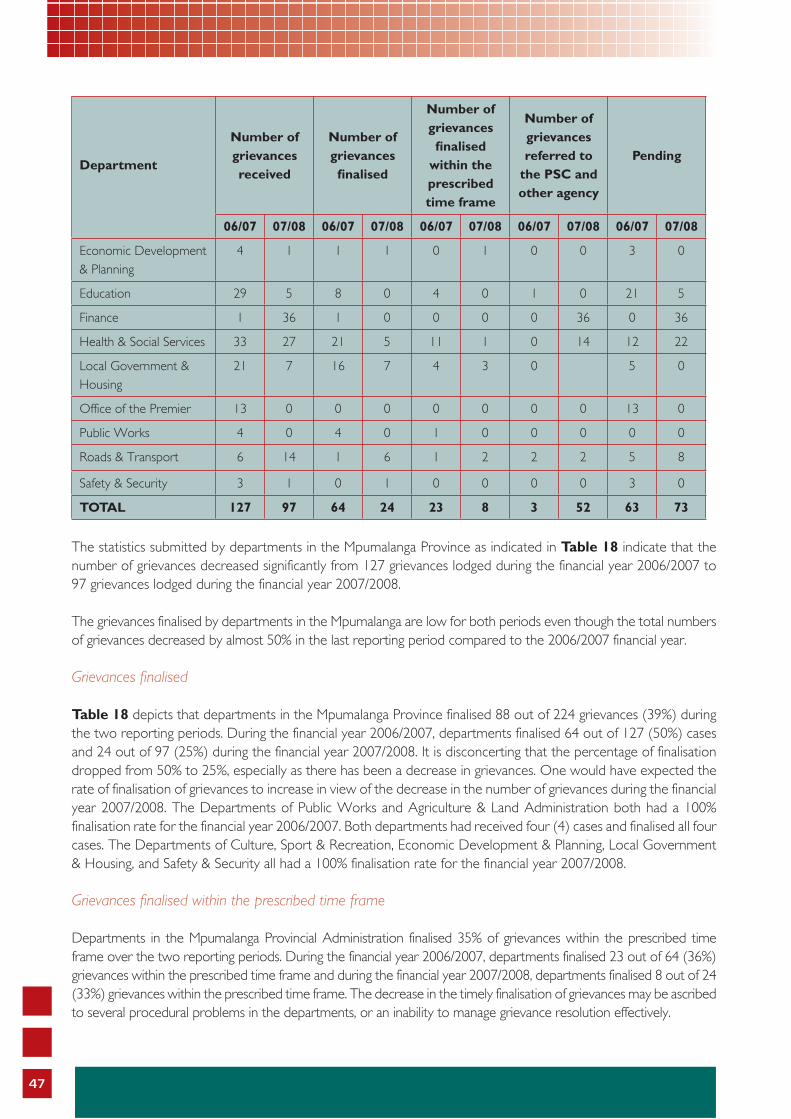
47
Department
Number of grievances received
Number of grievances fi nalised
Number of grievances fi nalised
within the prescribed time frame
Number of grievances referred to
the PSC and other agency
Pending
06/07 07/08 06/07 07/08 06/07 07/08 06/07 07/08 06/07 07/08
Economic Development & Planning
4 1 1 1 0 1 0 0 3 0
Education 29 5 8 0 4 0 1 0 21 5
Finance 1 36 1 0 0 0 0 36 0 36
Health & Social Services 33 27 21 5 11 1 0 14 12 22
Local Government & Housing
21 7 16 7 4 3 0 5 0
Office of the Premier 13 0 0 0 0 0 0 0 13 0
Public Works 4 0 4 0 1 0 0 0 0 0
Roads & Transport 6 14 1 6 1 2 2 2 5 8
Safety & Security 3 1 0 1 0 0 0 0 3 0
TOTAL 127 97 64 24 23 8 3 52 63 73
The statistics submitted by departments in the Mpumalanga Province as indicated in Table 18 indicate that the number of grievances decreased significantly from 127 grievances lodged during the financial year 2006/2007 to 97 grievances lodged during the financial year 2007/2008.
The grievances finalised by departments in the Mpumalanga are low for both periods even though the total numbers of grievances decreased by almost 50% in the last reporting period compared to the 2006/2007 financial year. Grievances finalised
Table 18 depicts that departments in the Mpumalanga Province finalised 88 out of 224 grievances (39%) during the two reporting periods. During the financial year 2006/2007, departments finalised 64 out of 127 (50%) cases and 24 out of 97 (25%) during the financial year 2007/2008. It is disconcerting that the percentage of finalisation dropped from 50% to 25%, especially as there has been a decrease in grievances. One would have expected the rate of finalisation of grievances to increase in view of the decrease in the number of grievances during the financial year 2007/2008. The Departments of Public Works and Agriculture & Land Administration both had a 100% finalisation rate for the financial year 2006/2007. Both departments had received four (4) cases and finalised all four cases. The Departments of Culture, Sport & Recreation, Economic Development & Planning, Local Government & Housing, and Safety & Security all had a 100% finalisation rate for the financial year 2007/2008.
Grievances finalised within the prescribed time frame
Departments in the Mpumalanga Provincial Administration finalised 35% of grievances within the prescribed time frame over the two reporting periods. During the financial year 2006/2007, departments finalised 23 out of 64 (36%) grievances within the prescribed time frame and during the financial year 2007/2008, departments finalised 8 out of 24 (33%) grievances within the prescribed time frame. The decrease in the timely finalisation of grievances may be ascribed to several procedural problems in the departments, or an inability to manage grievance resolution effectively.
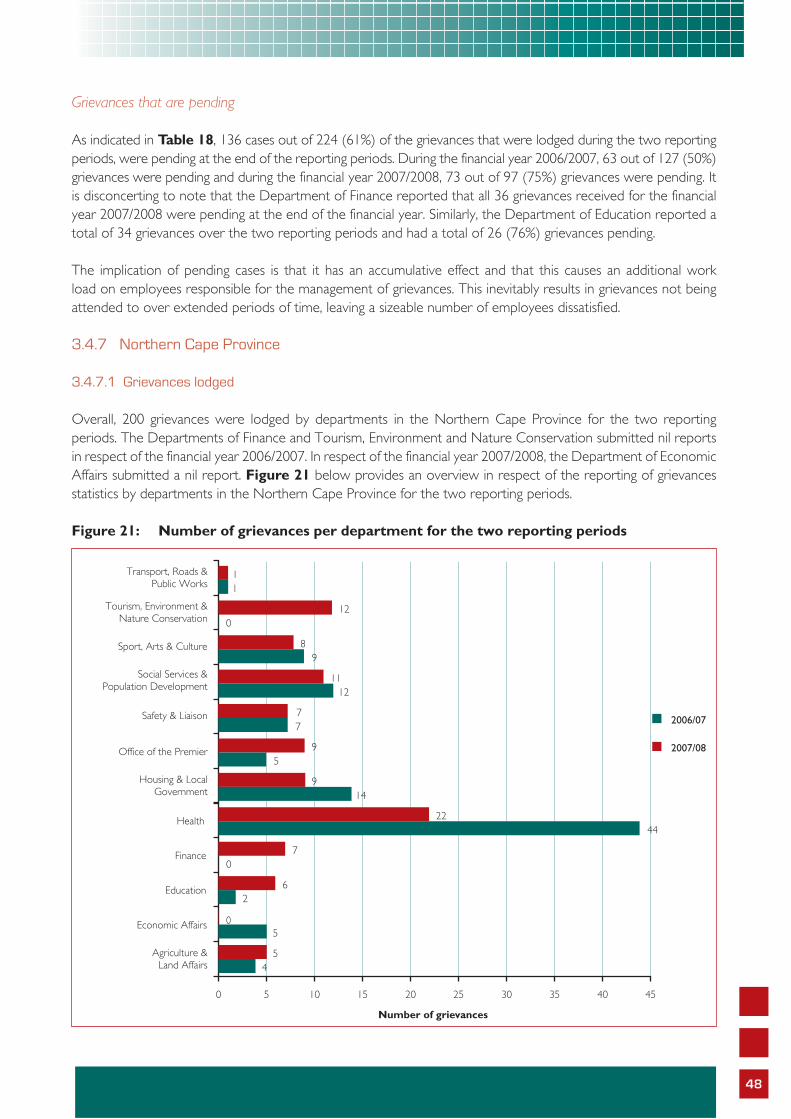
48
Grievances that are pending
As indicated in Table 18, 136 cases out of 224 (61%) of the grievances that were lodged during the two reporting periods, were pending at the end of the reporting periods. During the financial year 2006/2007, 63 out of 127 (50%) grievances were pending and during the financial year 2007/2008, 73 out of 97 (75%) grievances were pending. It is disconcerting to note that the Department of Finance reported that all 36 grievances received for the financial year 2007/2008 were pending at the end of the financial year. Similarly, the Department of Education reported a total of 34 grievances over the two reporting periods and had a total of 26 (76%) grievances pending.
The implication of pending cases is that it has an accumulative effect and that this causes an additional work load on employees responsible for the management of grievances. This inevitably results in grievances not being attended to over extended periods of time, leaving a sizeable number of employees dissatisfied.
3.4.7 Northern Cape Province
3.4.7.1 Grievances lodged
Overall, 200 grievances were lodged by departments in the Northern Cape Province for the two reporting periods. The Departments of Finance and Tourism, Environment and Nature Conservation submitted nil reports in respect of the financial year 2006/2007. In respect of the financial year 2007/2008, the Department of Economic Affairs submitted a nil report. Figure 21 below provides an overview in respect of the reporting of grievances statistics by departments in the Northern Cape Province for the two reporting periods.
Figure 21: Number of grievances per department for the two reporting periods
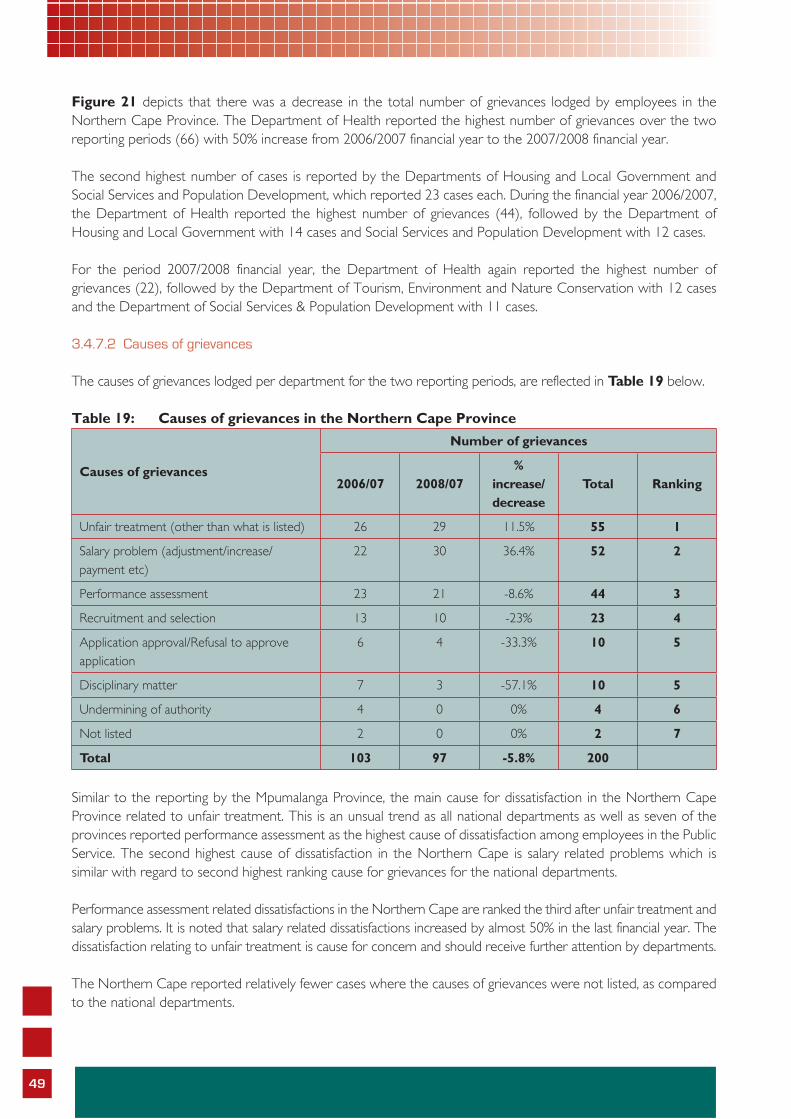
49
Figure 21 depicts that there was a decrease in the total number of grievances lodged by employees in the Northern Cape Province. The Department of Health reported the highest number of grievances over the two reporting periods (66) with 50% increase from 2006/2007 financial year to the 2007/2008 financial year.
The second highest number of cases is reported by the Departments of Housing and Local Government and Social Services and Population Development, which reported 23 cases each. During the financial year 2006/2007, the Department of Health reported the highest number of grievances (44), followed by the Department of Housing and Local Government with 14 cases and Social Services and Population Development with 12 cases.
For the period 2007/2008 financial year, the Department of Health again reported the highest number of grievances (22), followed by the Department of Tourism, Environment and Nature Conservation with 12 cases and the Department of Social Services & Population Development with 11 cases.
3.4.7.2 Causes of grievances
The causes of grievances lodged per department for the two reporting periods, are reflected in Table 19 below.
Table 19: Causes of grievances in the Northern Cape Province
Causes of grievances
Number of grievances
2006/07 2008/07%
increase/decrease
Total Ranking
Unfair treatment (other than what is listed) 26 29 11.5% 55 1
Salary problem (adjustment/increase/payment etc)
22 30 36.4% 52 2
Performance assessment 23 21 -8.6% 44 3
Recruitment and selection 13 10 -23% 23 4
Application approval/Refusal to approve application
6 4 -33.3% 10 5
Disciplinary matter 7 3 -57.1% 10 5
Undermining of authority 4 0 0% 4 6
Not listed 2 0 0% 2 7
Total 103 97 -5.8% 200
Similar to the reporting by the Mpumalanga Province, the main cause for dissatisfaction in the Northern Cape Province related to unfair treatment. This is an unsual trend as all national departments as well as seven of the provinces reported performance assessment as the highest cause of dissatisfaction among employees in the Public Service. The second highest cause of dissatisfaction in the Northern Cape is salary related problems which is similar with regard to second highest ranking cause for grievances for the national departments.
Performance assessment related dissatisfactions in the Northern Cape are ranked the third after unfair treatment and salary problems. It is noted that salary related dissatisfactions increased by almost 50% in the last financial year. The dissatisfaction relating to unfair treatment is cause for concern and should receive further attention by departments.
The Northern Cape reported relatively fewer cases where the causes of grievances were not listed, as compared to the national departments.
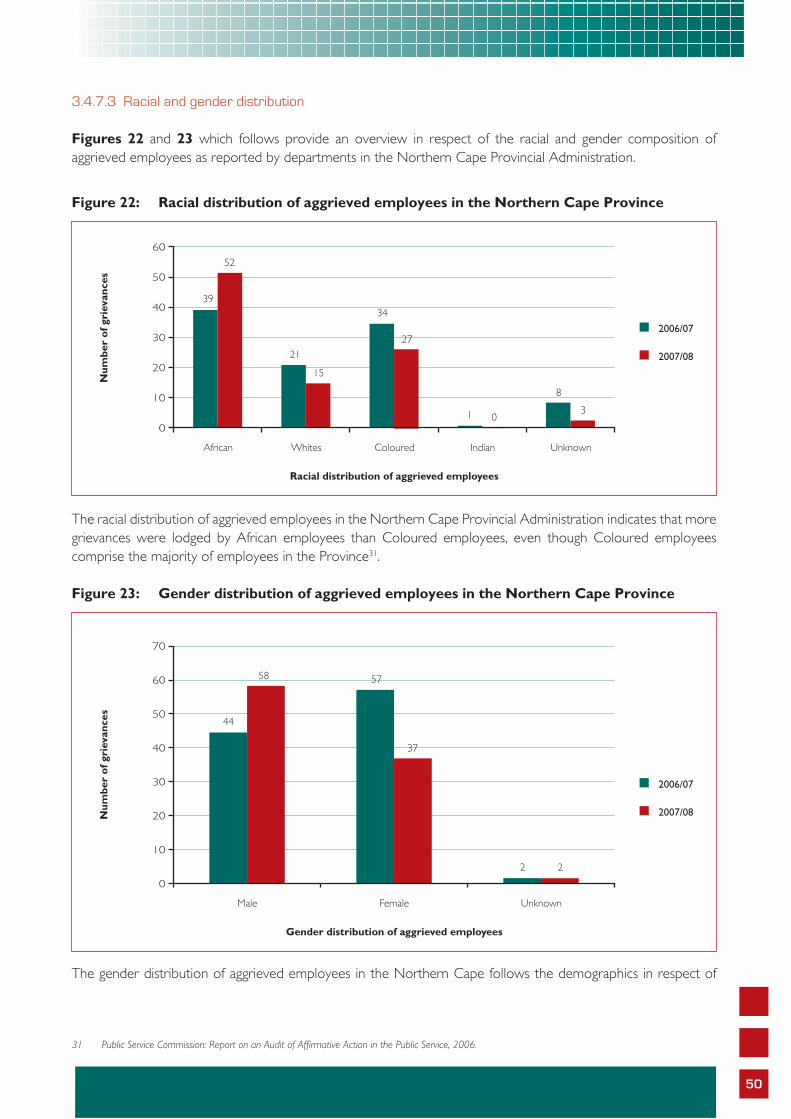
50
3.4.7.3 Racial and gender distribution
Figures 22 and 23 which follows provide an overview in respect of the racial and gender composition of aggrieved employees as reported by departments in the Northern Cape Provincial Administration.
Figure 22: Racial distribution of aggrieved employees in the Northern Cape Province
The racial distribution of aggrieved employees in the Northern Cape Provincial Administration indicates that more grievances were lodged by African employees than Coloured employees, even though Coloured employees comprise the majority of employees in the Province31. Figure 23: Gender distribution of aggrieved employees in the Northern Cape Province
The gender distribution of aggrieved employees in the Northern Cape follows the demographics in respect of
31 Public Service Commission: Report on an Audit of Affirmative Action in the Public Service, 2006.
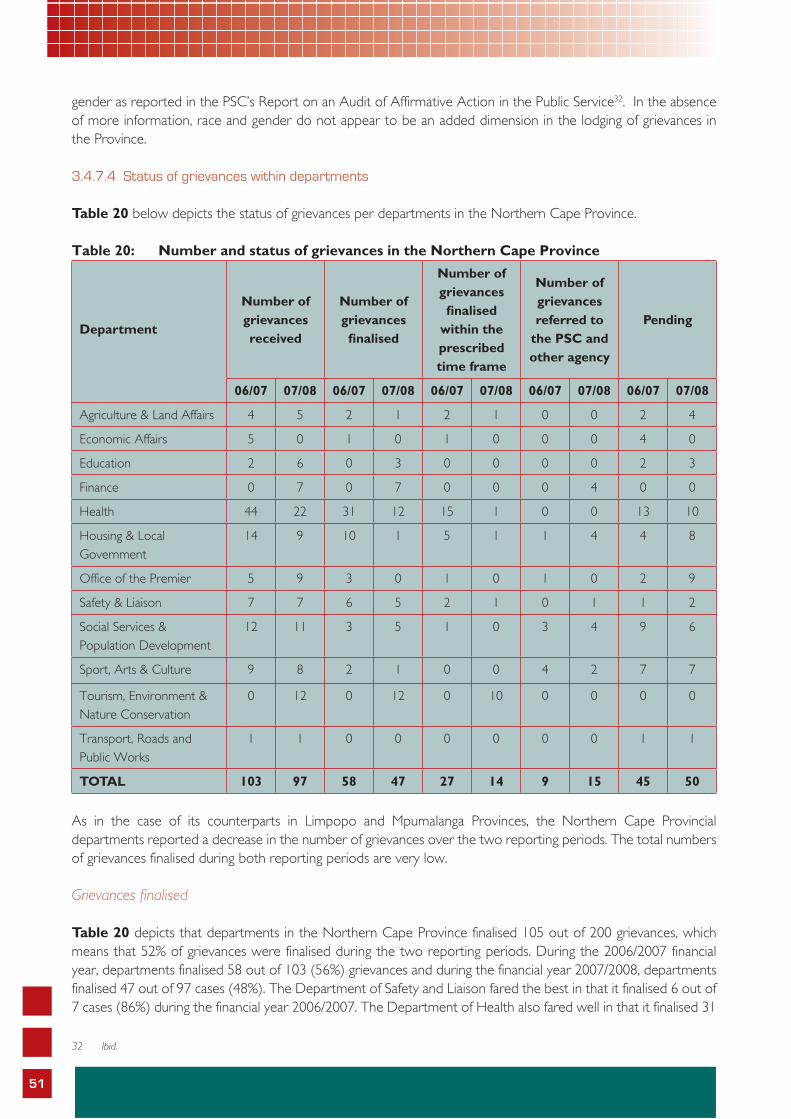
51
gender as reported in the PSC’s Report on an Audit of Affirmative Action in the Public Service32. In the absence of more information, race and gender do not appear to be an added dimension in the lodging of grievances in the Province.
3.4.7.4 Status of grievances within departments
Table 20 below depicts the status of grievances per departments in the Northern Cape Province.
Table 20: Number and status of grievances in the Northern Cape Province
Department
Number of grievances received
Number of grievances fi nalised
Number of grievances fi nalised
within the prescribed time frame
Number of grievances referred to
the PSC and other agency
Pending
06/07 07/08 06/07 07/08 06/07 07/08 06/07 07/08 06/07 07/08
Agriculture & Land Affairs 4 5 2 1 2 1 0 0 2 4
Economic Affairs 5 0 1 0 1 0 0 0 4 0
Education 2 6 0 3 0 0 0 0 2 3
Finance 0 7 0 7 0 0 0 4 0 0
Health 44 22 31 12 15 1 0 0 13 10
Housing & Local Government
14 9 10 1 5 1 1 4 4 8
Office of the Premier 5 9 3 0 1 0 1 0 2 9
Safety & Liaison 7 7 6 5 2 1 0 1 1 2
Social Services & Population Development
12 11 3 5 1 0 3 4 9 6
Sport, Arts & Culture 9 8 2 1 0 0 4 2 7 7
Tourism, Environment & Nature Conservation
0 12 0 12 0 10 0 0 0 0
Transport, Roads and Public Works
1 1 0 0 0 0 0 0 1 1
TOTAL 103 97 58 47 27 14 9 15 45 50
As in the case of its counterparts in Limpopo and Mpumalanga Provinces, the Northern Cape Provincial departments reported a decrease in the number of grievances over the two reporting periods. The total numbers of grievances finalised during both reporting periods are very low.
Grievances finalised
Table 20 depicts that departments in the Northern Cape Province finalised 105 out of 200 grievances, which means that 52% of grievances were finalised during the two reporting periods. During the 2006/2007 financial year, departments finalised 58 out of 103 (56%) grievances and during the financial year 2007/2008, departments finalised 47 out of 97 cases (48%). The Department of Safety and Liaison fared the best in that it finalised 6 out of 7 cases (86%) during the financial year 2006/2007. The Department of Health also fared well in that it finalised 31
32 Ibid.
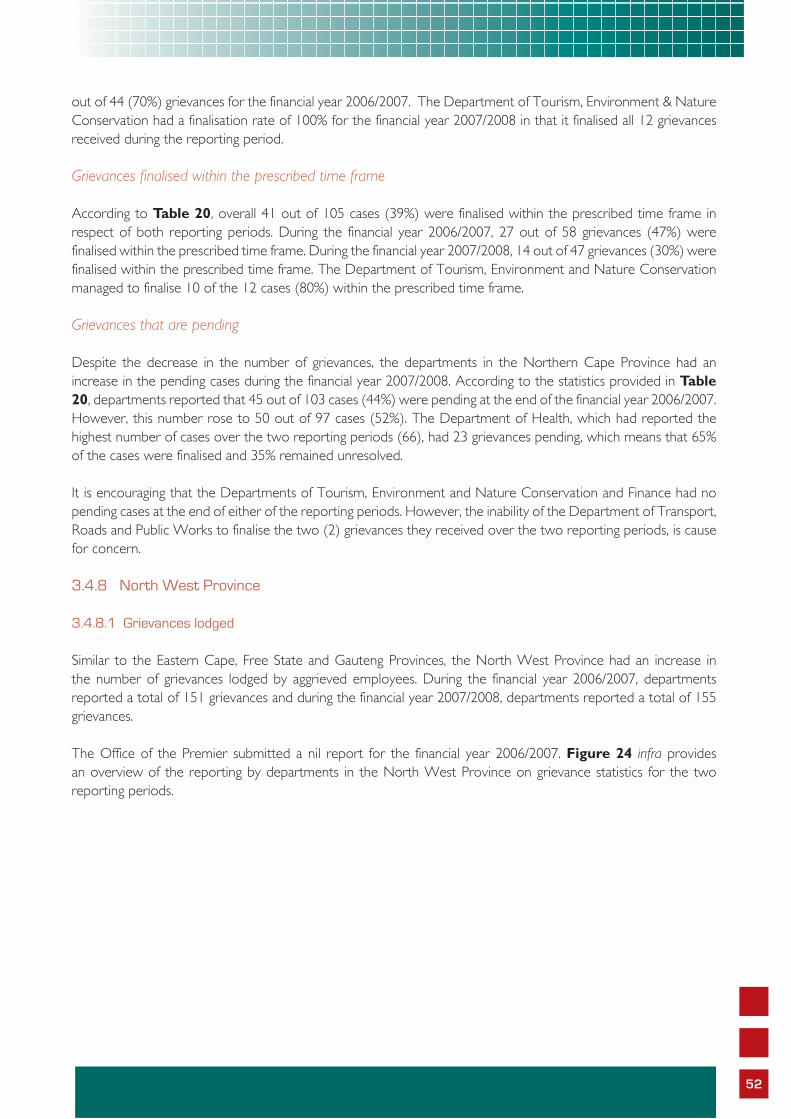
52
out of 44 (70%) grievances for the financial year 2006/2007. The Department of Tourism, Environment & Nature Conservation had a finalisation rate of 100% for the financial year 2007/2008 in that it finalised all 12 grievances received during the reporting period. Grievances finalised within the prescribed time frame
According to Table 20, overall 41 out of 105 cases (39%) were finalised within the prescribed time frame in respect of both reporting periods. During the financial year 2006/2007, 27 out of 58 grievances (47%) were finalised within the prescribed time frame. During the financial year 2007/2008, 14 out of 47 grievances (30%) were finalised within the prescribed time frame. The Department of Tourism, Environment and Nature Conservation managed to finalise 10 of the 12 cases (80%) within the prescribed time frame.
Grievances that are pending
Despite the decrease in the number of grievances, the departments in the Northern Cape Province had an increase in the pending cases during the financial year 2007/2008. According to the statistics provided in Table 20, departments reported that 45 out of 103 cases (44%) were pending at the end of the financial year 2006/2007. However, this number rose to 50 out of 97 cases (52%). The Department of Health, which had reported the highest number of cases over the two reporting periods (66), had 23 grievances pending, which means that 65% of the cases were finalised and 35% remained unresolved.
It is encouraging that the Departments of Tourism, Environment and Nature Conservation and Finance had no pending cases at the end of either of the reporting periods. However, the inability of the Department of Transport, Roads and Public Works to finalise the two (2) grievances they received over the two reporting periods, is cause for concern.
3.4.8 North West Province
3.4.8.1 Grievances lodged
Similar to the Eastern Cape, Free State and Gauteng Provinces, the North West Province had an increase in the number of grievances lodged by aggrieved employees. During the financial year 2006/2007, departments reported a total of 151 grievances and during the financial year 2007/2008, departments reported a total of 155 grievances.
The Office of the Premier submitted a nil report for the financial year 2006/2007. Figure 24 infra provides an overview of the reporting by departments in the North West Province on grievance statistics for the two reporting periods.
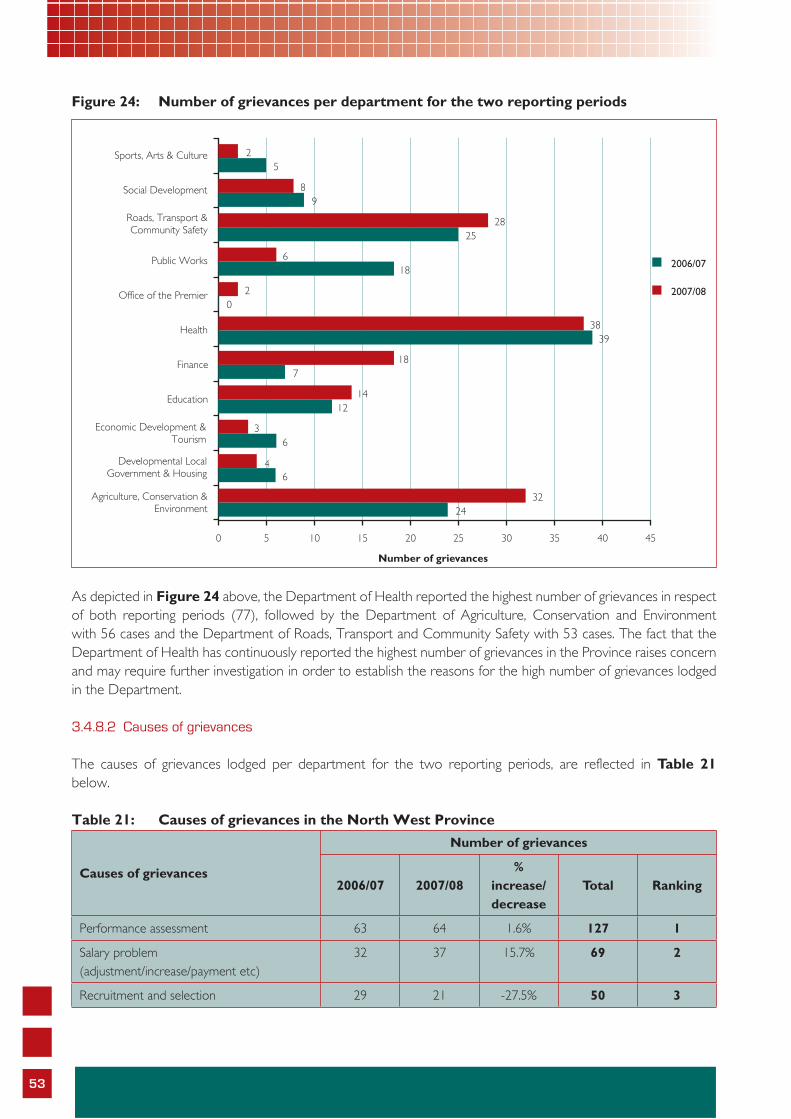
53
Figure 24: Number of grievances per department for the two reporting periods
As depicted in Figure 24 above, the Department of Health reported the highest number of grievances in respect of both reporting periods (77), followed by the Department of Agriculture, Conservation and Environment with 56 cases and the Department of Roads, Transport and Community Safety with 53 cases. The fact that the Department of Health has continuously reported the highest number of grievances in the Province raises concern and may require further investigation in order to establish the reasons for the high number of grievances lodged in the Department.
3.4.8.2 Causes of grievances
The causes of grievances lodged per department for the two reporting periods, are reflected in Table 21 below.
Table 21: Causes of grievances in the North West Province
Causes of grievances
Number of grievances
2006/07 2007/08%
increase/decrease
Total Ranking
Performance assessment 63 64 1.6% 127 1
Salary problem (adjustment/increase/payment etc)
32 37 15.7% 69 2
Recruitment and selection 29 21 -27.5% 50 3
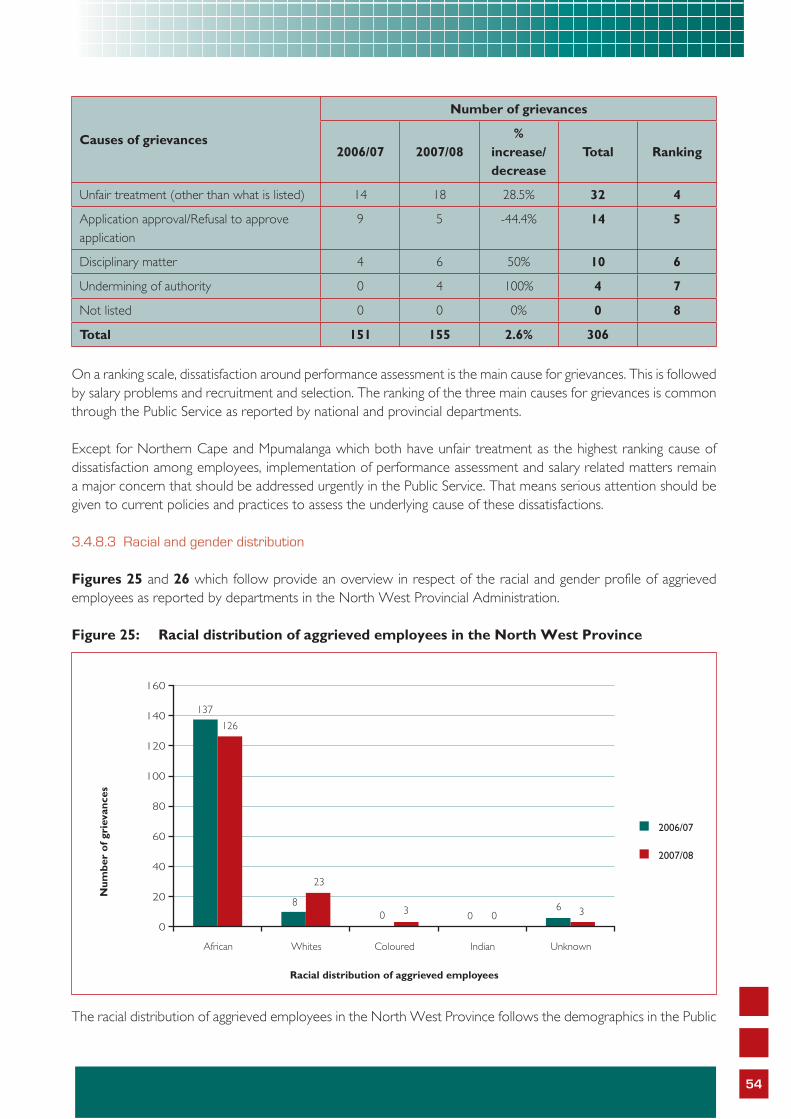
54
Causes of grievances
Number of grievances
2006/07 2007/08%
increase/decrease
Total Ranking
Unfair treatment (other than what is listed) 14 18 28.5% 32 4
Application approval/Refusal to approve application
9 5 -44.4% 14 5
Disciplinary matter 4 6 50% 10 6
Undermining of authority 0 4 100% 4 7
Not listed 0 0 0% 0 8
Total 151 155 2.6% 306
On a ranking scale, dissatisfaction around performance assessment is the main cause for grievances. This is followed by salary problems and recruitment and selection. The ranking of the three main causes for grievances is common through the Public Service as reported by national and provincial departments.
Except for Northern Cape and Mpumalanga which both have unfair treatment as the highest ranking cause of dissatisfaction among employees, implementation of performance assessment and salary related matters remain a major concern that should be addressed urgently in the Public Service. That means serious attention should be given to current policies and practices to assess the underlying cause of these dissatisfactions.
3.4.8.3 Racial and gender distribution
Figures 25 and 26 which follow provide an overview in respect of the racial and gender profile of aggrieved employees as reported by departments in the North West Provincial Administration. Figure 25: Racial distribution of aggrieved employees in the North West Province
The racial distribution of aggrieved employees in the North West Province follows the demographics in the Public
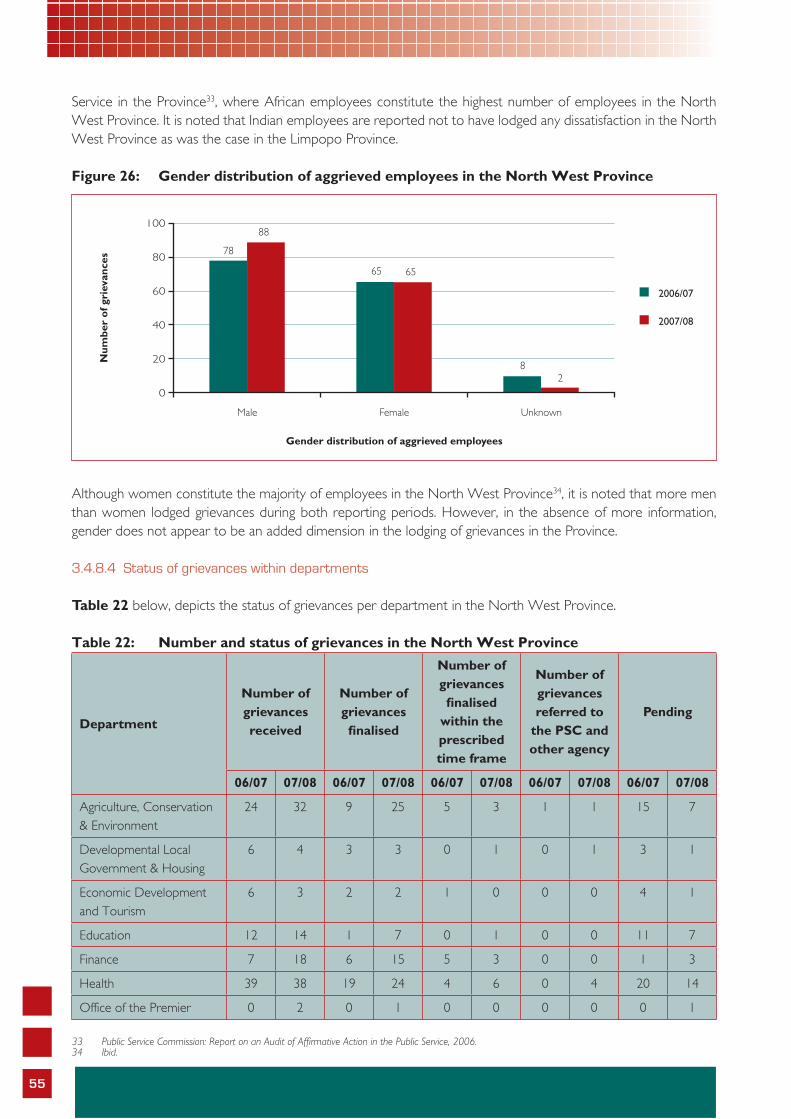
55
Service in the Province33, where African employees constitute the highest number of employees in the North West Province. It is noted that Indian employees are reported not to have lodged any dissatisfaction in the North West Province as was the case in the Limpopo Province. Figure 26: Gender distribution of aggrieved employees in the North West Province
Although women constitute the majority of employees in the North West Province34, it is noted that more men than women lodged grievances during both reporting periods. However, in the absence of more information, gender does not appear to be an added dimension in the lodging of grievances in the Province.
3.4.8.4 Status of grievances within departments
Table 22 below, depicts the status of grievances per department in the North West Province.
Table 22: Number and status of grievances in the North West Province
Department
Number of grievances received
Number of grievances fi nalised
Number of grievances fi nalised
within the prescribed time frame
Number of grievances referred to
the PSC and other agency
Pending
06/07 07/08 06/07 07/08 06/07 07/08 06/07 07/08 06/07 07/08
Agriculture, Conservation & Environment
24 32 9 25 5 3 1 1 15 7
Developmental Local Government & Housing
6 4 3 3 0 1 0 1 3 1
Economic Development and Tourism
6 3 2 2 1 0 0 0 4 1
Education 12 14 1 7 0 1 0 0 11 7
Finance 7 18 6 15 5 3 0 0 1 3
Health 39 38 19 24 4 6 0 4 20 14
Office of the Premier 0 2 0 1 0 0 0 0 0 1
33 Public Service Commission: Report on an Audit of Affirmative Action in the Public Service, 2006.34 Ibid.
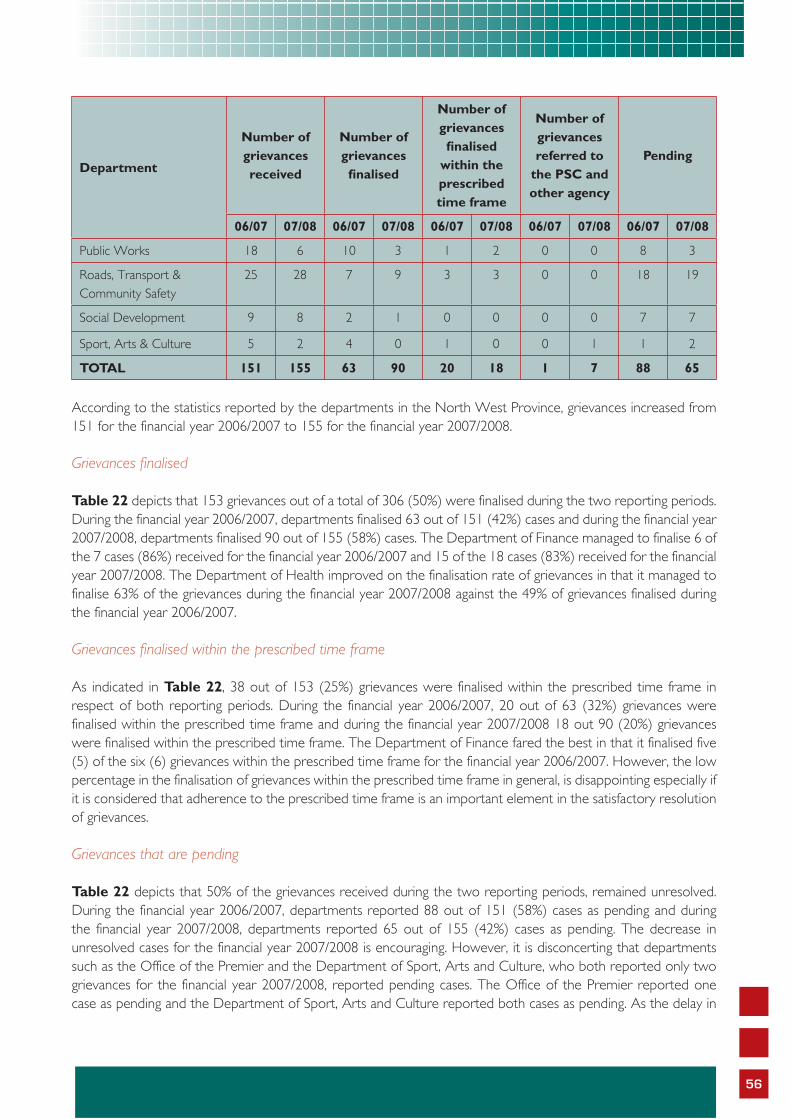
56
Department
Number of grievances received
Number of grievances fi nalised
Number of grievances fi nalised
within the prescribed time frame
Number of grievances referred to
the PSC and other agency
Pending
06/07 07/08 06/07 07/08 06/07 07/08 06/07 07/08 06/07 07/08
Public Works 18 6 10 3 1 2 0 0 8 3
Roads, Transport & Community Safety
25 28 7 9 3 3 0 0 18 19
Social Development 9 8 2 1 0 0 0 0 7 7
Sport, Arts & Culture 5 2 4 0 1 0 0 1 1 2
TOTAL 151 155 63 90 20 18 1 7 88 65
According to the statistics reported by the departments in the North West Province, grievances increased from 151 for the financial year 2006/2007 to 155 for the financial year 2007/2008.
Grievances finalised
Table 22 depicts that 153 grievances out of a total of 306 (50%) were finalised during the two reporting periods. During the financial year 2006/2007, departments finalised 63 out of 151 (42%) cases and during the financial year 2007/2008, departments finalised 90 out of 155 (58%) cases. The Department of Finance managed to finalise 6 of the 7 cases (86%) received for the financial year 2006/2007 and 15 of the 18 cases (83%) received for the financial year 2007/2008. The Department of Health improved on the finalisation rate of grievances in that it managed to finalise 63% of the grievances during the financial year 2007/2008 against the 49% of grievances finalised during the financial year 2006/2007.
Grievances finalised within the prescribed time frame
As indicated in Table 22, 38 out of 153 (25%) grievances were finalised within the prescribed time frame in respect of both reporting periods. During the financial year 2006/2007, 20 out of 63 (32%) grievances were finalised within the prescribed time frame and during the financial year 2007/2008 18 out 90 (20%) grievances were finalised within the prescribed time frame. The Department of Finance fared the best in that it finalised five (5) of the six (6) grievances within the prescribed time frame for the financial year 2006/2007. However, the low percentage in the finalisation of grievances within the prescribed time frame in general, is disappointing especially if it is considered that adherence to the prescribed time frame is an important element in the satisfactory resolution of grievances.
Grievances that are pending
Table 22 depicts that 50% of the grievances received during the two reporting periods, remained unresolved. During the financial year 2006/2007, departments reported 88 out of 151 (58%) cases as pending and during the financial year 2007/2008, departments reported 65 out of 155 (42%) cases as pending. The decrease in unresolved cases for the financial year 2007/2008 is encouraging. However, it is disconcerting that departments such as the Office of the Premier and the Department of Sport, Arts and Culture, who both reported only two grievances for the financial year 2007/2008, reported pending cases. The Office of the Premier reported one case as pending and the Department of Sport, Arts and Culture reported both cases as pending. As the delay in
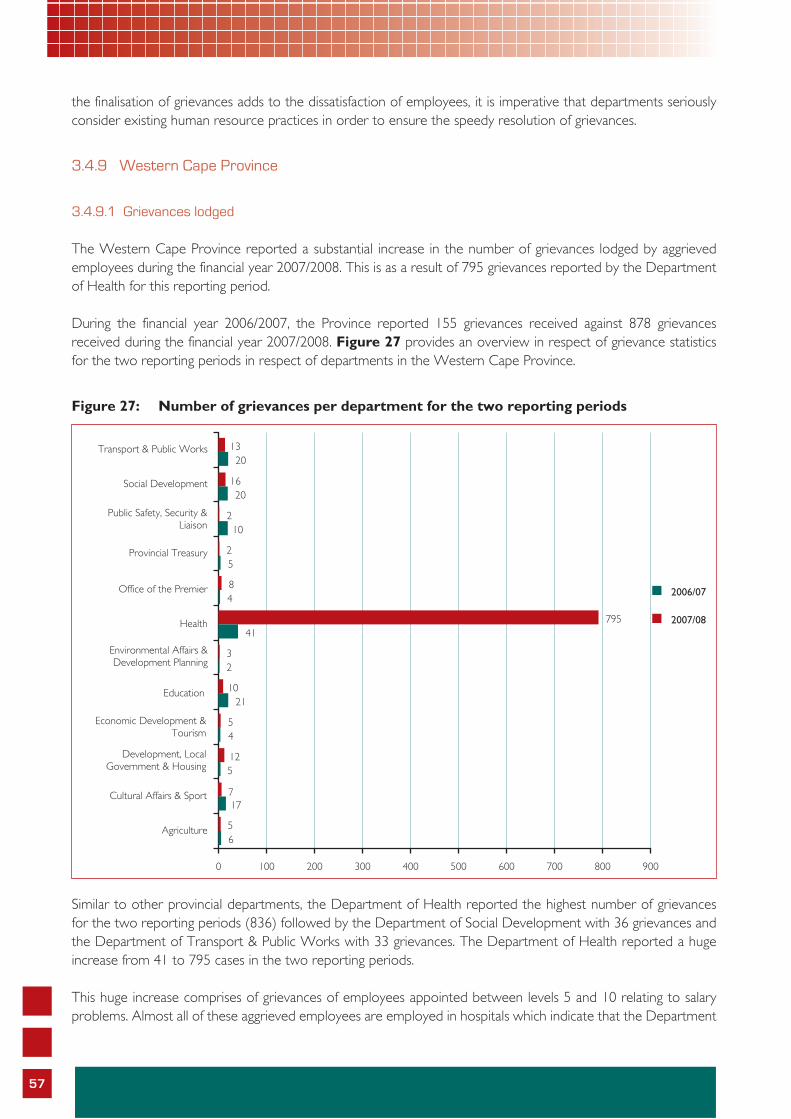
57
the finalisation of grievances adds to the dissatisfaction of employees, it is imperative that departments seriously consider existing human resource practices in order to ensure the speedy resolution of grievances.
3.4.9 Western Cape Province
3.4.9.1 Grievances lodged
The Western Cape Province reported a substantial increase in the number of grievances lodged by aggrieved employees during the financial year 2007/2008. This is as a result of 795 grievances reported by the Department of Health for this reporting period.
During the financial year 2006/2007, the Province reported 155 grievances received against 878 grievances received during the financial year 2007/2008. Figure 27 provides an overview in respect of grievance statistics for the two reporting periods in respect of departments in the Western Cape Province.
Figure 27: Number of grievances per department for the two reporting periods
Similar to other provincial departments, the Department of Health reported the highest number of grievances for the two reporting periods (836) followed by the Department of Social Development with 36 grievances and the Department of Transport & Public Works with 33 grievances. The Department of Health reported a huge increase from 41 to 795 cases in the two reporting periods.
This huge increase comprises of grievances of employees appointed between levels 5 and 10 relating to salary problems. Almost all of these aggrieved employees are employed in hospitals which indicate that the Department

58
of Health need to urgently address the salary related problems at hospitals as service delivery standards may be affected.
3.4.9.2 Causes of grievances
The causes of grievances lodged per department for the two reporting periods, are reflected in Table 23 below.
Table 23: Causes of grievances in the Western Cape Province
Causes of grievances
Number of grievances
2006/07 2007/08%
increase/decrease
Total Ranking
Salary problem (adjustment/increase/payment etc)
26 767 2850% 793 1
Performance assessment 48 34 -29.1% 82 2
Recruitment and selection 28 23 -17.8% 51 3
Unfair treatment (other than what is listed) 22 26 18.1% 48 4
Application approval/Refusal to approve application
18 13 -33.3% 31 5
Disciplinary matter 10 13 30% 23 6
Not listed 3 1 -66.6% 4 7
Undermining of authority 0 1 100% 1 8
Total 155 878 466.4% 1033
Table 23 depicts that the main cause for dissatisfaction in departments in the Western Cape Province relates to salary problems. This is largely as a result of the high number of grievances reported in the Department of Health relating to salary problems. The second cause for dissatisfaction in the Province relates to performance assessment, followed by dissatisfaction around recruitment and selection. Should the high number of grievances relating to salary problems not be considered the rating in respect of causes for dissatisfaction reflects the trend identified in national departments and several provinces.
3.4.9.3 Racial and gender distribution
Figures 28 and 29 which follow provide an overview in respect of the racial and gender profile of aggrieved employees as reported by departments in the Western Cape Province.
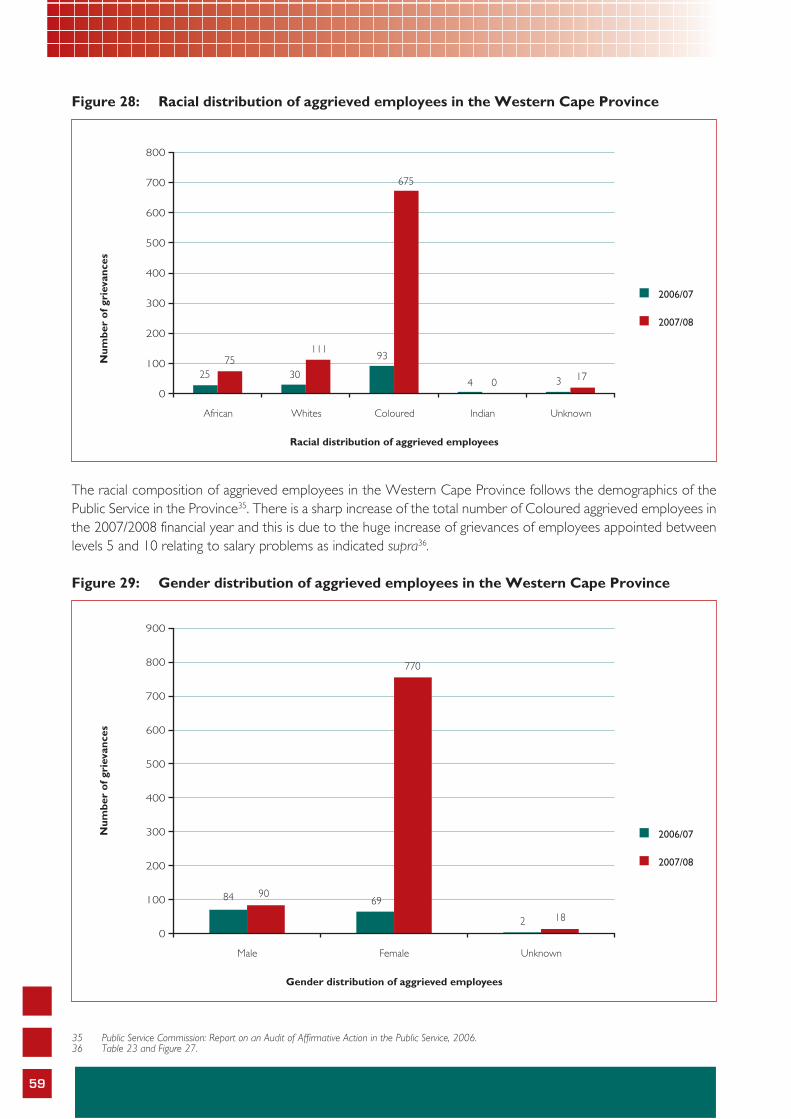
59
Figure 28: Racial distribution of aggrieved employees in the Western Cape Province
The racial composition of aggrieved employees in the Western Cape Province follows the demographics of the Public Service in the Province35. There is a sharp increase of the total number of Coloured aggrieved employees in the 2007/2008 financial year and this is due to the huge increase of grievances of employees appointed between levels 5 and 10 relating to salary problems as indicated supra36.
Figure 29: Gender distribution of aggrieved employees in the Western Cape Province
35 Public Service Commission: Report on an Audit of Affirmative Action in the Public Service, 2006.36 Table 23 and Figure 27.
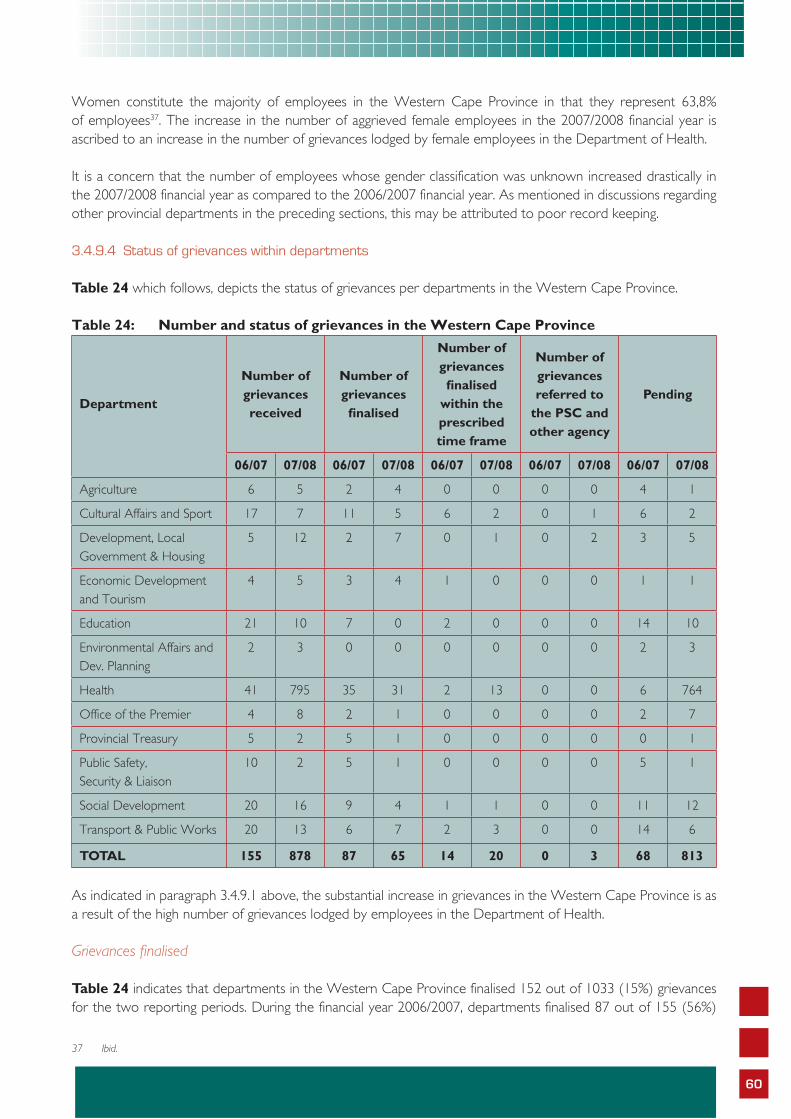
60
Women constitute the majority of employees in the Western Cape Province in that they represent 63,8% of employees37. The increase in the number of aggrieved female employees in the 2007/2008 financial year is ascribed to an increase in the number of grievances lodged by female employees in the Department of Health.
It is a concern that the number of employees whose gender classification was unknown increased drastically in the 2007/2008 financial year as compared to the 2006/2007 financial year. As mentioned in discussions regarding other provincial departments in the preceding sections, this may be attributed to poor record keeping.
3.4.9.4 Status of grievances within departments
Table 24 which follows, depicts the status of grievances per departments in the Western Cape Province.
Table 24: Number and status of grievances in the Western Cape Province
Department
Number of grievances received
Number of grievances fi nalised
Number of grievances fi nalised
within the prescribed time frame
Number of grievances referred to
the PSC and other agency
Pending
06/07 07/08 06/07 07/08 06/07 07/08 06/07 07/08 06/07 07/08
Agriculture 6 5 2 4 0 0 0 0 4 1
Cultural Affairs and Sport 17 7 11 5 6 2 0 1 6 2
Development, Local Government & Housing
5 12 2 7 0 1 0 2 3 5
Economic Development and Tourism
4 5 3 4 1 0 0 0 1 1
Education 21 10 7 0 2 0 0 0 14 10
Environmental Affairs and Dev. Planning
2 3 0 0 0 0 0 0 2 3
Health 41 795 35 31 2 13 0 0 6 764
Office of the Premier 4 8 2 1 0 0 0 0 2 7
Provincial Treasury 5 2 5 1 0 0 0 0 0 1
Public Safety, Security & Liaison
10 2 5 1 0 0 0 0 5 1
Social Development 20 16 9 4 1 1 0 0 11 12
Transport & Public Works 20 13 6 7 2 3 0 0 14 6
TOTAL 155 878 87 65 14 20 0 3 68 813
As indicated in paragraph 3.4.9.1 above, the substantial increase in grievances in the Western Cape Province is as a result of the high number of grievances lodged by employees in the Department of Health.
Grievances finalised
Table 24 indicates that departments in the Western Cape Province finalised 152 out of 1033 (15%) grievances for the two reporting periods. During the financial year 2006/2007, departments finalised 87 out of 155 (56%)
37 Ibid.
61
grievances. The finalisation rate decreased substantially during the financial year 2007/2008 in that departments only finalised 65 out of 878 (7%) grievances.
The Department of Health finalised 35 out of 41 cases (85%) received during the financial year 2006/2007. However, in view of the high number of grievances lodged with the Department of Health during the financial year 2007/2008, the Department only managed to finalise 31 out of 795 (4%). The Provincial Treasury received five cases during the financial year 2006/2007 and finalised all five cases. However, for the financial year 2007/2008, the Provincial Treasury received two cases, but only finalised one case. The most likely reason for the failure of department to finalise grievances received during the financial year, could be the lack of priority given to the managements of grievances and/or a lack of expertise in managing grievances.
Grievances finalised within the prescribed time frame
The Western Cape Provincial departments only finalised 34 out of 152 (22%) of grievances within the prescribed time frame in respect of the two reporting periods. In the financial year 2006/2007, departments finalised 14 out of 87 grievances (16%) and in respect of the financial year 2007/2008, departments finalised 20 out of 65 grievances (31%). The low finalisation of rate of grievances by departments, especially in respect of adherence to the prescribed time frame is very disappointing and indicates that departments are clearly unable to comply with the provisions of the Grievance Rules, 2003, pertaining to the adherence to time frames. This may be ascribed to several procedural problems within departments or simply an inability to manage grievance resolution within departments.
Grievances that are pending
As indicated in Table 24, 85% of the grievances lodged during the two reporting periods, were pending at the end of the two reporting periods. In respect of the financial year 2006/2007, 68 out of 155 cases (44%) were pending and for the financial year 2007/2008, 813 out of 878 (93%) grievances were pending. Apart from the increasing number of grievances that are pending as reported by the Department of Health for the 2007/2008 financial year (96%), the remaining departments in the Western Cape Province also reported a high number of grievances that are pending. The Department of Education for example reported 14 out of 21 cases (67%) for the financial year 2006/2007 as pending and 10 out of 10 cases (100%) for the financial year 2007/2008 as pending. The Department of Social Development on the other hand, reported 11 out of 20 cases (55%) for the financial year 2006/2007 as pending, and 12 out of 16 cases (75%) for the financial year 2007/2008 as pending. The Office of the Premier, who had reported eight cases for the financial year 2007/2008, indicated that seven cases were pending for the 2007/2008 financial year. The inability of departments to deal with grievances received during the reporting periods is regarded as an indictment against its management.

75
Cha
pter
Fou
r
Handling of Grievances by the Public Service Commission
62
63
4.1 INTRODUCTION
Chapter Three presented a detailed exposition of the management of grievances within national and provincial departments. However, the resolution of grievances does not end with the conclusion of the internal process. In terms of the provisions of Rule F.9 of the Grievance Rules, 2003 read with section 35 (1) and (2) of the Public Service Act, (as amended) the PSC has an important role to play in the resolution of grievances. If an aggrieved employee remains dissatisfied after an EA has considered his/her grievance, such a grievance may be referred to the PSC for consideration if the aggrieved so requests.
The failure by departments in general to finalise grievances or deal with grievances within the prescribed time frames was highlighted in Chapter Three as a point of concern. Rule F.11 of the Grievance Rules, 2003 provides for an employee to refer his/her grievance to the PSC, should the Department not deal with the grievance within the prescribed time period of 30 working days. The majority of the grievances referred to the PSC by aggrieved employees or labour unions are as a result of failure by departments to handle grievances within prescribed period.
All grievances referred to the PSC, are captured on a database. This Chapter provides a statistical overview and trends analysis of grievances referred to the PSC.
4.2 MANDATE OF THE PSC IN GRIEVANCE RESOLUTION
Section 196(4)(f)(ii) of the Constitution, 1996, provides the PSC with the mandate to investigate grievances of employees in the Public Service. This mandate is confirmed in section 35(1) of the Public Service Act, 1994 (as amended), which provides for an aggrieved employee to request the EA to refer his/her grievance to the PSC, if the employee remains dissatisfied after being informed of the outcome of a grievance dealt with by the Department. Such a referral must be done by the relevant EA only.
This means that the internal investigation into the merits of a grievance by a Department, including the decision by an EA, must be concluded prior to the referral of a grievance to the PSC. As the PSC acts as an arbiter in the resolution of a grievance of an employee in the Public Service, the internal departmental process must be exhausted before the PSC may consider such a grievance. However, Rule F.11 of the Grievance Rules, 2003 provides for an aggrieved employee to refer his/her grievance to the PSC, if the Department fails to attend to the matter within the prescribed time frame of 30 working days38. In such cases, the PSC does not have the mandate to consider the grievance of an employee in terms of section 35(1) of the Public Service Act, 1994 (as amended) as the internal grievance procedure has not been exhausted.
In such cases, the PSC facilitates in the resolution of the grievance of the aggrieved employee by strictly following the matter up with the Department, even to the extent of issuing summons upon HoDs in those cases where Departments do not respond to the PSC’s request to finalise grievances of employees. In this regard, section 10(2) of the Public Service Commission Act, 1997 (Act 46. 1997) provides that –
“For the purposes of the inquiry, the Commission may –
(a) summons any person who may be able to give information of material importance concerning the subject of the inquiry or who has in his or her possession or custody or under his or her control any book, document or object which may have a bearing on the subject of the inquiry, to appear before the Commission;
(b) call upon and administer an oath to, or accept an affirmation from any person present at the inquiry who has or might have been summoned in terms of paragraph (a);
38 Public Service Commission. Rules for dealing with the Grievances of Employees in the Public Service, Government Gazette number 25209 of 2003.
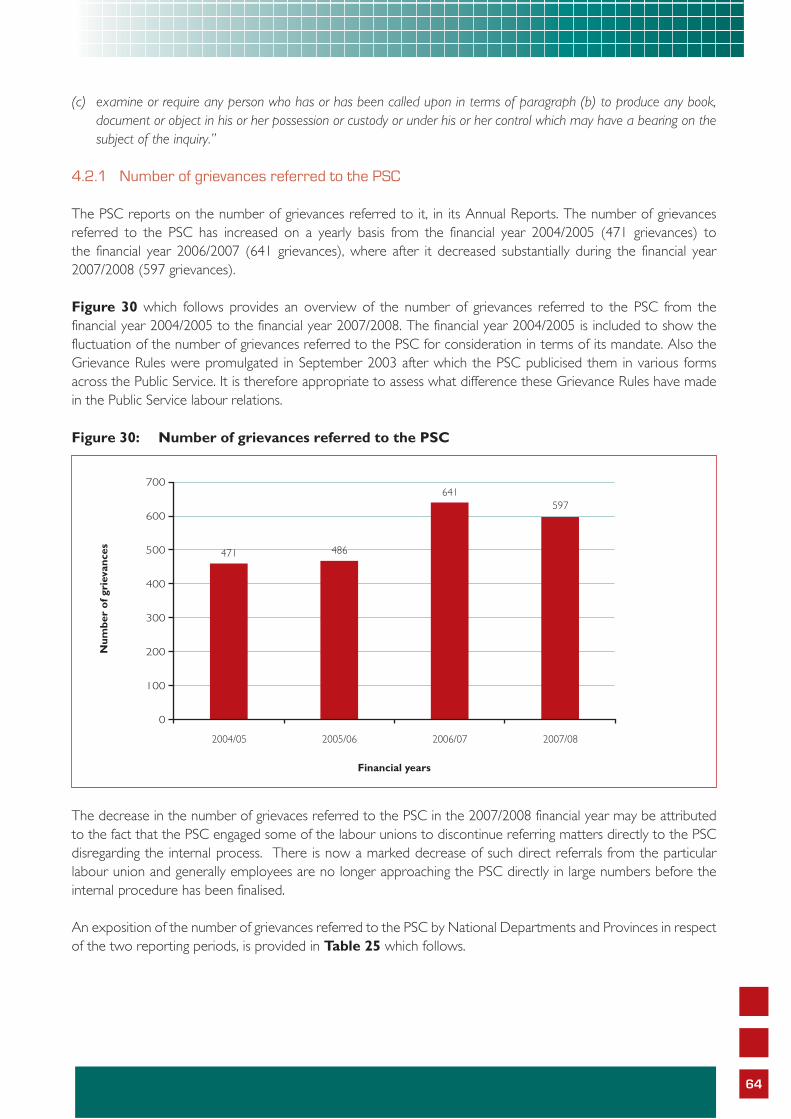
64
(c) examine or require any person who has or has been called upon in terms of paragraph (b) to produce any book, document or object in his or her possession or custody or under his or her control which may have a bearing on the subject of the inquiry.”
4.2.1 Number of grievances referred to the PSC
The PSC reports on the number of grievances referred to it, in its Annual Reports. The number of grievances referred to the PSC has increased on a yearly basis from the financial year 2004/2005 (471 grievances) to the financial year 2006/2007 (641 grievances), where after it decreased substantially during the financial year 2007/2008 (597 grievances).
Figure 30 which follows provides an overview of the number of grievances referred to the PSC from the financial year 2004/2005 to the financial year 2007/2008. The financial year 2004/2005 is included to show the fluctuation of the number of grievances referred to the PSC for consideration in terms of its mandate. Also the Grievance Rules were promulgated in September 2003 after which the PSC publicised them in various forms across the Public Service. It is therefore appropriate to assess what difference these Grievance Rules have made in the Public Service labour relations.
Figure 30: Number of grievances referred to the PSC
The decrease in the number of grievaces referred to the PSC in the 2007/2008 financial year may be attributed to the fact that the PSC engaged some of the labour unions to discontinue referring matters directly to the PSC disregarding the internal process. There is now a marked decrease of such direct referrals from the particular labour union and generally employees are no longer approaching the PSC directly in large numbers before the internal procedure has been finalised.
An exposition of the number of grievances referred to the PSC by National Departments and Provinces in respect of the two reporting periods, is provided in Table 25 which follows.
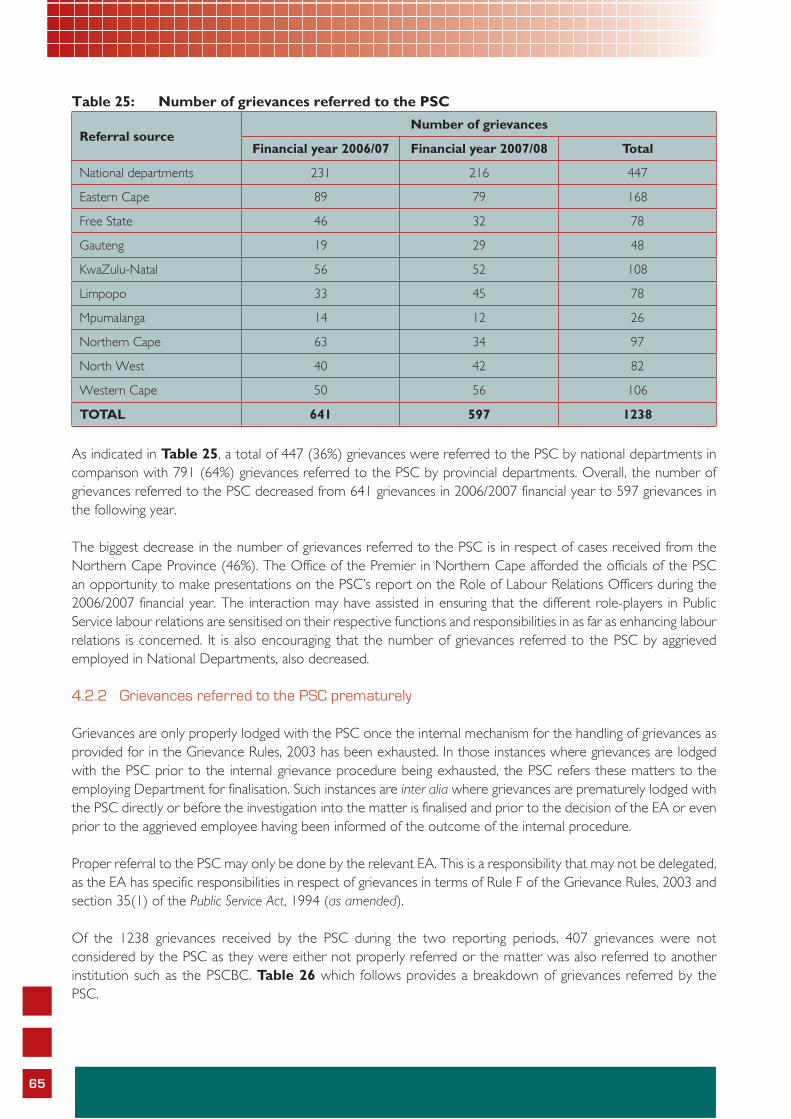
65
Table 25: Number of grievances referred to the PSC
Referral sourceNumber of grievances
Financial year 2006/07 Financial year 2007/08 Total
National departments 231 216 447
Eastern Cape 89 79 168
Free State 46 32 78
Gauteng 19 29 48
KwaZulu-Natal 56 52 108
Limpopo 33 45 78
Mpumalanga 14 12 26
Northern Cape 63 34 97
North West 40 42 82
Western Cape 50 56 106
TOTAL 641 597 1238
As indicated in Table 25, a total of 447 (36%) grievances were referred to the PSC by national departments in comparison with 791 (64%) grievances referred to the PSC by provincial departments. Overall, the number of grievances referred to the PSC decreased from 641 grievances in 2006/2007 financial year to 597 grievances in the following year.
The biggest decrease in the number of grievances referred to the PSC is in respect of cases received from the Northern Cape Province (46%). The Office of the Premier in Northern Cape afforded the officials of the PSC an opportunity to make presentations on the PSC’s report on the Role of Labour Relations Officers during the 2006/2007 financial year. The interaction may have assisted in ensuring that the different role-players in Public Service labour relations are sensitised on their respective functions and responsibilities in as far as enhancing labour relations is concerned. It is also encouraging that the number of grievances referred to the PSC by aggrieved employed in National Departments, also decreased.
4.2.2 Grievances referred to the PSC prematurely
Grievances are only properly lodged with the PSC once the internal mechanism for the handling of grievances as provided for in the Grievance Rules, 2003 has been exhausted. In those instances where grievances are lodged with the PSC prior to the internal grievance procedure being exhausted, the PSC refers these matters to the employing Department for finalisation. Such instances are inter alia where grievances are prematurely lodged with the PSC directly or before the investigation into the matter is finalised and prior to the decision of the EA or even prior to the aggrieved employee having been informed of the outcome of the internal procedure.
Proper referral to the PSC may only be done by the relevant EA. This is a responsibility that may not be delegated, as the EA has specific responsibilities in respect of grievances in terms of Rule F of the Grievance Rules, 2003 and section 35(1) of the Public Service Act, 1994 (as amended).
Of the 1238 grievances received by the PSC during the two reporting periods, 407 grievances were not considered by the PSC as they were either not properly referred or the matter was also referred to another institution such as the PSCBC. Table 26 which follows provides a breakdown of grievances referred by the PSC.
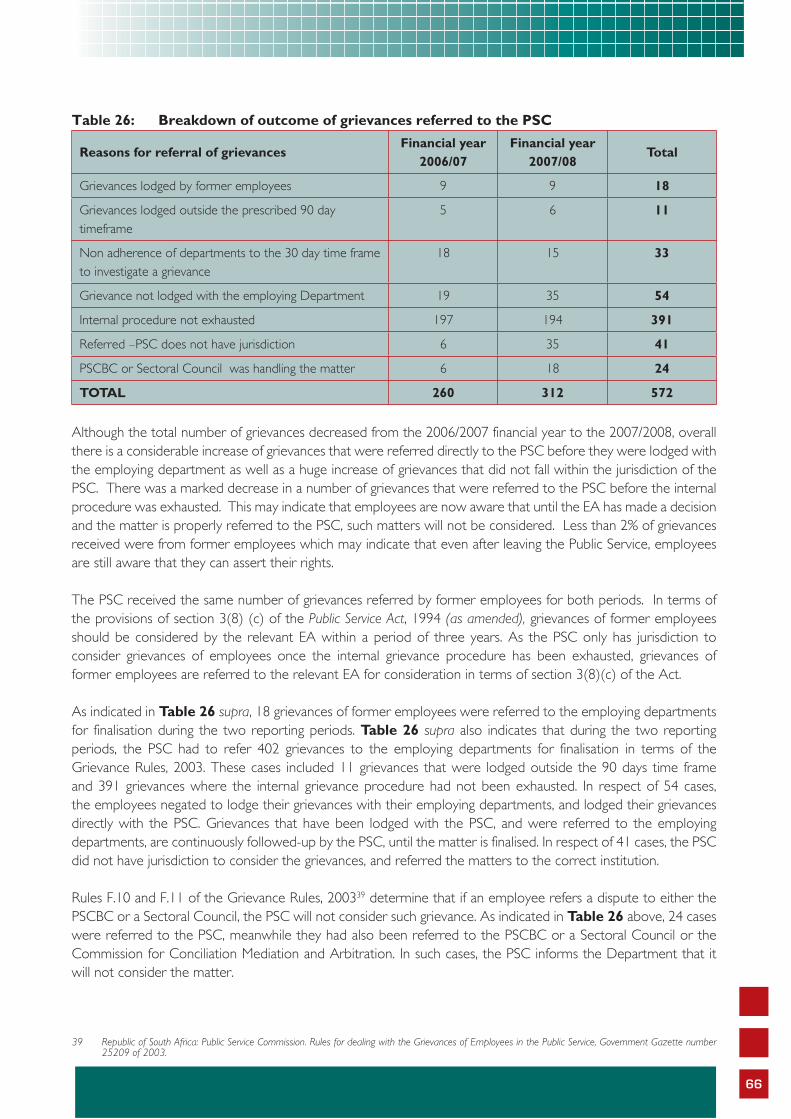
66
Table 26: Breakdown of outcome of grievances referred to the PSC
Reasons for referral of grievancesFinancial year
2006/07Financial year
2007/08Total
Grievances lodged by former employees 9 9 18
Grievances lodged outside the prescribed 90 day timeframe
5 6 11
Non adherence of departments to the 30 day time frame to investigate a grievance
18 15 33
Grievance not lodged with the employing Department 19 35 54
Internal procedure not exhausted 197 194 391
Referred –PSC does not have jurisdiction 6 35 41
PSCBC or Sectoral Council was handling the matter 6 18 24
TOTAL 260 312 572
Although the total number of grievances decreased from the 2006/2007 financial year to the 2007/2008, overall there is a considerable increase of grievances that were referred directly to the PSC before they were lodged with the employing department as well as a huge increase of grievances that did not fall within the jurisdiction of the PSC. There was a marked decrease in a number of grievances that were referred to the PSC before the internal procedure was exhausted. This may indicate that employees are now aware that until the EA has made a decision and the matter is properly referred to the PSC, such matters will not be considered. Less than 2% of grievances received were from former employees which may indicate that even after leaving the Public Service, employees are still aware that they can assert their rights.
The PSC received the same number of grievances referred by former employees for both periods. In terms of the provisions of section 3(8) (c) of the Public Service Act, 1994 (as amended), grievances of former employees should be considered by the relevant EA within a period of three years. As the PSC only has jurisdiction to consider grievances of employees once the internal grievance procedure has been exhausted, grievances of former employees are referred to the relevant EA for consideration in terms of section 3(8)(c) of the Act.
As indicated in Table 26 supra, 18 grievances of former employees were referred to the employing departments for finalisation during the two reporting periods. Table 26 supra also indicates that during the two reporting periods, the PSC had to refer 402 grievances to the employing departments for finalisation in terms of the Grievance Rules, 2003. These cases included 11 grievances that were lodged outside the 90 days time frame and 391 grievances where the internal grievance procedure had not been exhausted. In respect of 54 cases, the employees negated to lodge their grievances with their employing departments, and lodged their grievances directly with the PSC. Grievances that have been lodged with the PSC, and were referred to the employing departments, are continuously followed-up by the PSC, until the matter is finalised. In respect of 41 cases, the PSC did not have jurisdiction to consider the grievances, and referred the matters to the correct institution.
Rules F.10 and F.11 of the Grievance Rules, 200339 determine that if an employee refers a dispute to either the PSCBC or a Sectoral Council, the PSC will not consider such grievance. As indicated in Table 26 above, 24 cases were referred to the PSC, meanwhile they had also been referred to the PSCBC or a Sectoral Council or the Commission for Conciliation Mediation and Arbitration. In such cases, the PSC informs the Department that it will not consider the matter.
39 Republic of South Africa: Public Service Commission. Rules for dealing with the Grievances of Employees in the Public Service, Government Gazette number 25209 of 2003.
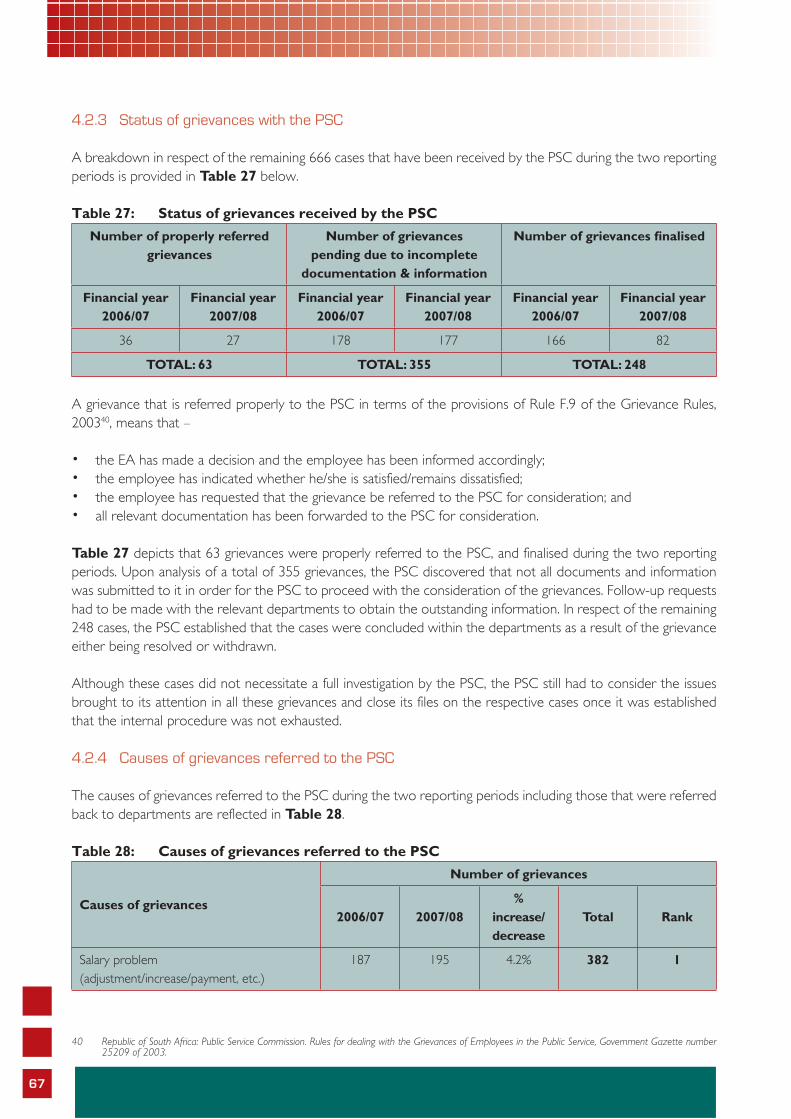
67
4.2.3 Status of grievances with the PSC
A breakdown in respect of the remaining 666 cases that have been received by the PSC during the two reporting periods is provided in Table 27 below.
Table 27: Status of grievances received by the PSC
Number of properly referredgrievances
Number of grievances pending due to incomplete
documentation & information
Number of grievances fi nalised
Financial year 2006/07
Financial year 2007/08
Financial year 2006/07
Financial year 2007/08
Financial year 2006/07
Financial year 2007/08
36 27 178 177 166 82
TOTAL: 63 TOTAL: 355 TOTAL: 248
A grievance that is referred properly to the PSC in terms of the provisions of Rule F.9 of the Grievance Rules, 200340, means that –
the EA has made a decision and the employee has been informed accordingly;• the employee has indicated whether he/she is satisfied/remains dissatisfied;• the employee has requested that the grievance be referred to the PSC for consideration; and• all relevant documentation has been forwarded to the PSC for consideration. •
Table 27 depicts that 63 grievances were properly referred to the PSC, and finalised during the two reporting periods. Upon analysis of a total of 355 grievances, the PSC discovered that not all documents and information was submitted to it in order for the PSC to proceed with the consideration of the grievances. Follow-up requests had to be made with the relevant departments to obtain the outstanding information. In respect of the remaining 248 cases, the PSC established that the cases were concluded within the departments as a result of the grievance either being resolved or withdrawn.
Although these cases did not necessitate a full investigation by the PSC, the PSC still had to consider the issues brought to its attention in all these grievances and close its files on the respective cases once it was established that the internal procedure was not exhausted.
4.2.4 Causes of grievances referred to the PSC
The causes of grievances referred to the PSC during the two reporting periods including those that were referred back to departments are reflected in Table 28.
Table 28: Causes of grievances referred to the PSC
Causes of grievances
Number of grievances
2006/07 2007/08%
increase/decrease
Total Rank
Salary problem (adjustment/increase/payment, etc.)
187 195 4.2% 382 1
40 Republic of South Africa: Public Service Commission. Rules for dealing with the Grievances of Employees in the Public Service, Government Gazette number 25209 of 2003.

68
Causes of grievances
Number of grievances
2006/07 2007/08%
increase/decrease
Total Rank
Performance assessment 164 146 -10.9% 310 2
Recruitment and selection 102 112 9.8% 214 3
Unfair treatment (other than what is listed) 110 96 -12.7% 206 4
Disciplinary matter 23 28 21.7% 51 5
Not listed 42 5 -88% 47 6
Application approval/Refusal to approve application
7 10 42.8% 17 7
Undermining of authority 6 5 -16.6% 11 8
TOTAL 641 597 -6.8% 1238
Table 28 indicates that the main cause for grievances referred to the PSC relates to salary problems, followed by dissatisfaction relating to performance assessment and recruitment and selection in the third position. This picture differs from the grievance resolution reports submitted by departments to the PSC during the reporting periods which indicated performance assessment as the major cause of dissatisfactions. That is except for the departments in the Mpumalanga and Northern Cape provinces which reported unfair treatment as the highest cause of dissatisfaction among employees in the Public Service.
This outcome also differs with the first Report on Grievance Trends in the Public Service41 where dissatisfactions with performance assessments were consistently ranked the highest cause of grievances, followed by salary matters and recruitment and selection respectively.
This report does not lend itself to in-depth analysis of the reasons giving rise to dissatisfaction relating to salary payments. It may however, be an indication of incorrect recruitment and selection processes which result in dissatisfaction with salaries offered by departments. Grievances relating to the payment of salaries will affect service delivery on the side of the departments. On the other, hand, it may point to employees being uninformed on matters relating to the payment of salary related issues.
4.2.5 Racial and gender distribution of aggrieved employees
Figures 31 and 32 which follow illustrate the racial and gender distribution of aggrieved employees whose grievances were referred to the PSC.
41 Republic of South Africa: Public Service Commission: Report on Grievance Trends in the Public Service, 2007.
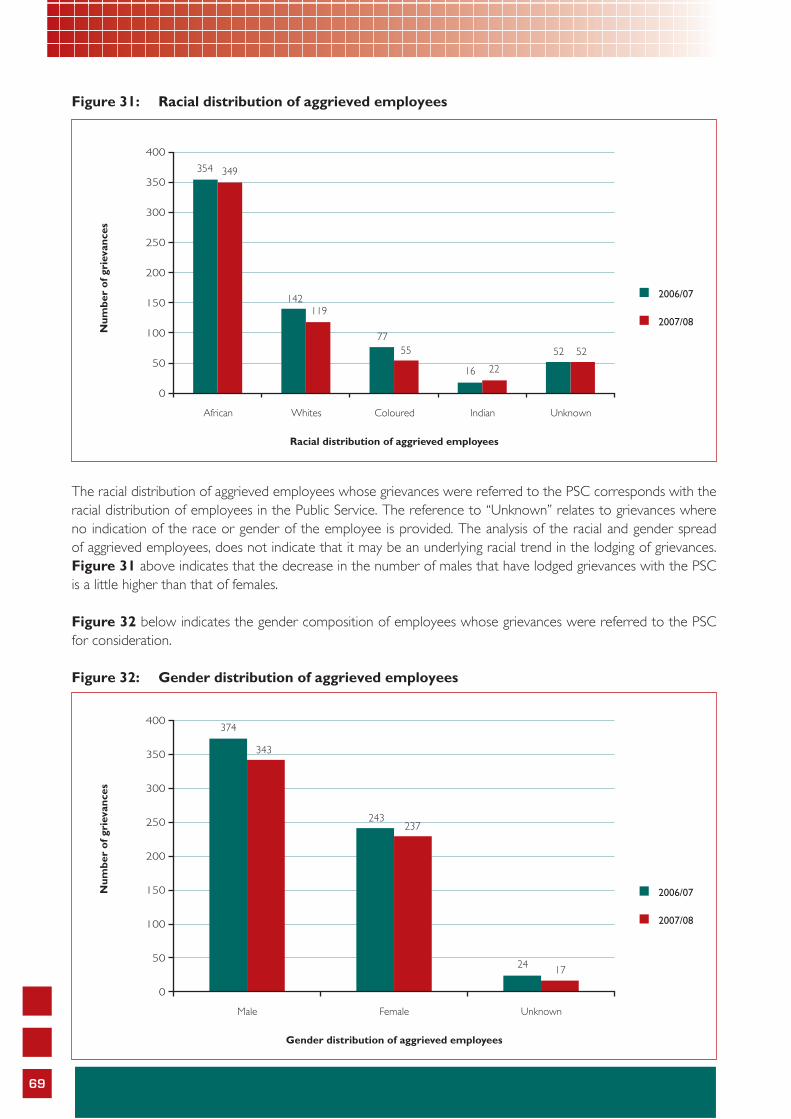
69
Figure 31: Racial distribution of aggrieved employees
The racial distribution of aggrieved employees whose grievances were referred to the PSC corresponds with the racial distribution of employees in the Public Service. The reference to “Unknown” relates to grievances where no indication of the race or gender of the employee is provided. The analysis of the racial and gender spread of aggrieved employees, does not indicate that it may be an underlying racial trend in the lodging of grievances. Figure 31 above indicates that the decrease in the number of males that have lodged grievances with the PSC is a little higher than that of females.
Figure 32 below indicates the gender composition of employees whose grievances were referred to the PSC for consideration.
Figure 32: Gender distribution of aggrieved employees
70
Although the Public Service has more (55%) female employees than (45%) males it appears that the latter are more inclined to lodge grievances than their female counterparts.
4.3 CHALLENGES FACED BY THE PSC IN THE CONSIDERATION OF GRIEVANCES
In the first Report on Grievance Trends in the Public Service42, the PSC highlighted the challenges faced in the consideration of grievances. The Report highlighted the fact that there is a general lack of compliance with the Grievance Rules, 2003, which creates major constraints in the consideration of grievances by the PSC. These constraints remained the same during the two reporting periods. As indicated in Table 26, the PSC had to refer a total of 572 grievances of 1238 grievances to the employing departments for consideration in terms of the applicable grievance procedures.
In Chapters Two and Three of the report, reference was made to the resolution of grievances of employees in the Service Departments such as the Department of Defence, SAPS, Correctional Services and the Department of Education. In terms of its constitutional mandate, the PSC is also responsible for the consideration of grievances of employees in these sectors. During the two reporting periods, the PSC received 112 grievances from employees employed in the Service Departments and the Department of Education, including the Provincial Departments of Education. In respect of 48 cases, the grievances were returned to the respective departments to be finalised in terms of the applicable grievance procedures.
As the arbiter of grievances in the Public Service, the PSC is responsible to follow-up on grievances prematurely referred to the PSC. This is done through continuous requests to departments to finalise grievances of employees. However, the PSC continuously finds that departments fail to respond to the PSC’s requests. The failure by departments to respond to the PSC’s requests, results in HoDs being summonsed to appear before an Inquiry of the PSC. Section 10(2) of the Public Service Commission Act, 1997 (Act 46. 1997) provides for the PSC to summons “… any person who may be able to give information of material importance concerning the subject of the inquiry or who has in his or her possession or custody or under his or her control any book, document or object which may have a bearing on the subject of the inquiry, to appear before the Commission;”
During the two reporting periods, the PSC issued 21 summonses to the following departments for failure to respond to requests from the PSC to finalise grievances referred to departments by the PSC:
Department of Defence.• Department of Public Works.• Department of Trade and Industry.• Department of Justice and Constitutional Development.• Department of Labour.• Department of Correctional Services.• Department of Health.• Department of Agriculture. • Department of Public Works: KwaZulu-Natal Province.•
The PSC regards the issuing of summons in a serious light and it is trusted that departments take the timely resolution of grievances to heart. Apart from the fact that it places considerable constraints on the ability of the PSC to consider grievances of employees, it also hampers the PSC’s ability to provide a speedy and effective service to its clients.
Chapter Five will discuss the trends in grievance resolution as identified in Chapters Three and Four, especially in relation to the experience of the PSC in the handling of grievances.
42 Republic of South Africa: Public Service Commission: Report on Grievance Trends in the Public Service, 2007.
84
Cha
pter
Fiv
e
Grievance Trends in the Public Service
71

72
5.1 INTRODUCTION
In order to ensure a satisfied workforce, it is imperative that the underlying causes of grievances are considered and measures put in place to address theses causes. If a particular practice results in dissatisfied employees, and grievances are handled in a carefully planned manner, it is expected that the number of dissatisfactions should decrease resulting in a more content Public Service workforce.
While the previous chapters tracked the number of grievances and grievance patterns, as based on the data contained in the six monthly reports43 from departments and the PSC’s database on grievances referred to the PSC during the reporting period in question, this Chapter analyses the grievance trends in the Public Service.
5.2 ANALYSIS OF GRIEVANCE TRENDS IN THE PUBLIC SERVICE
5.2.1 Number of grievances lodged in the Public Service
As is apparent from the statistics provided in Chapters Three and Four, the number of grievances lodged by employees increased substantially over the two reporting periods. The increasing number of grievances reported over the reporting period, is cause for concern. It would have been expected that departments would have by now, had sound management practices and policies in place to ensure minimum dissatisfaction amongst employees. On the other hand, the increase in the number of grievances may be an indication that employees are more familiar with the grievance procedures. Table 29 below, provides an aggregate of the total number of grievances for the two reporting periods:
Table 29: Number of grievances
Origin of grievances 2006/07 2007/08 % increase Total
National 4019 4070 1.2% 8089
Provincial 2377 3329 40.5% 5706
Total 6396 7399 15.6% 13795
The high number of grievances reported in respect of National Departments should be considered against the high number reported by the SAPS. However, in continuation of the first Report on Grievance Trends in the Public Service, it is imperative to emphasise the importance of the monitoring and evaluation of the causes of grievances by departments themselves. Such self-monitoring should reveal trends that could alert them to possible shortcomings in their own in-house policies and/or the application of such policies, the objective of which is to address such shortcomings proactively to prevent further grievances of a similar nature from arising.
5.2.2 Underlying causes of grievances
Grievances normally arise in the workplace as a result of an official act or omission. Such act or omission usually arises from the application of a regulatory framework. Table 30 reflects the top eight causes of grievances in the Public Service as –
reported in the previous Grievance Trends Report;• reported by national and provincial departments in respect of the two reporting periods covered by this • report; witnessed by the PSC on account of grievances referred to it; and• calculated in aggregate terms for the Public Service in its entirety.•
43 Republic of South Africa. Public Service Commission. Rule I.1, Rules for dealing with the grievances of employees in the Public Service were promulgated in Government Gazette number 25209 of 2003.

73
Table 30: Causes of grievances in the South African Public Service
Causes of grievances
Ranking of causes of grievances
Aggregate of
previous Report
NationalDepart-ments
ProvincialDepart-ments
Grievances referred to
the PSC
Aggregate for Public Service
Performance assessment 1 1 1 2 1
Salary problems (adjustment/increase/payment, etc.)
2 2 2 1 2
Recruitment and selection 3 3 4 3 3
Unfair treatment (other than what is listed)
5 4 3 6 4
Disciplinary Matter 4 6 6 5 5
Application approval/Refusal to approve application
7 5 5 7 6
Not listed 6 7 7 6 7
Undermining of authority 8 8 8 8 8
Table 30 shows that dissatisfactions around performance assessment, salary matters and recruitment and selection consistently emerged as the top three causes of grievances in the Public Service since January 2005.
Getting to the bottom of the causal factors of this trend, without a thorough purpose-designed investigation, is not easily achieved. However, drawing from the PSC’s research experience over the past number of years, it is fairly safe to assume that the following elements may individually, or in different forms of combination lie at the bottom of this fairly widespread dissatisfaction about salary matters, performance assessment and recruitment and selection:
The high number of dissatisfactions in especially performance management is an indication that the • management of the Performance Management Development System (PMDS) is not yet on par. In the first Report on Grievance Trends in the Public Service44, it was pointed out that there are serious problems in the application of the PMDS and the following root causes that give rise to such widespread dissatisfaction around performance assessments were highlighted:
There is a general lack of performance management which is reflected in the apparent haphazard approach • in managing performance. The PMDS is often regarded as a subjective system and the mismanagement of the System appears to justify concerns in this regard. The only remedy available to employees in addressing their dismay in the management of the System is through the lodging of grievances.
The report of the PSC’s study into the Management of Poor Performance• 45 confirms that the roll-out of the PMDS within departments was not done thoroughly. There is also widespread failure to uphold its underlying principles. Many managers appear not to have a thorough grasp of the constituent elements of the System and lack the necessary time, dedication and skills to make it work. The system is not utilised in the manner intended and activities in respect thereof are left to the last minute and are only done for purposes of compliance.
Dissatisfactions around salary related matters are again the second highest reported cause of grievances in • the Public Service. Many such grievances result from employees’ dissatisfaction regarding the payment of
44 Republic of South Africa: Public Service Commission: Report on Grievance Trends in the Public Service, 2007.45 Republic of South Africa: Public Service Commission: Investigation into the Management of Poor Performance in the Public Service, 2007.
74
merit awards, the alleged inequitable and unfair application of job evaluation results and the alleged incorrect application of Resolution 7 of 2000.
It is also disconcerting that recruitment and selection once more presented itself as the third highest cause • for grievances. Over the past 7 years, it has constantly been brought to the PSC’s attention that employees take issue with the validity, fairness, and objectivity of the selection process followed by departments in the filling of posts. Despite attempts by the PSC to address this shortcoming through its Toolkit on Recruitment and Selection46 which provides departments with a guide to better practices, this remains a contentious area, giving rise to many grievances.
5.2.3 Timely resolution of grievances
The importance of the timely resolution of grievances has been emphasised throughout this Report. The failure by departments to resolve grievances of employees within the prescribed time frame, fringes on an unfair labour practice. According to Du Toit et al47 “Unfair implies failure to meet an objective standard and may be taken to include arbitrary, capricious or inconsistent conduct, whether negligent or intended.” Although this statement may appear harsh, the trend identified throughout this Report indicates that departments continuously fail to comply with the standards provided in the Grievance Rules.
The issue around compliance by departments to resolve grievances within the prescribed timeframe has become a contentious point for the PSC. The reason for summonsing HoDs is mostly as a result of non-compliance by departments with the prescribed time frame in terms of which grievances should be finalised. Employees therefore, refer their grievances to the PSC out of frustration with departments’ inability to deal with their cases in terms of the prescribed time frame. As the Custodian of Good Governance, the PSC is responsible for the speedy resolution of grievances referred to it. However, the failure by departments to adhere to the prescribed time frame in respect of which grievance should be resolved, adds to the challenges faced by the PSC in dealing with grievances timeously.
During both reporting periods, the PSC had summonsed HoDs of the following departments and conducted hearings relating to 21 grievances. These grievances were prematurely referred to the PSC and remained unresolved even after the PSC had requested that they be finalised:
Department of Defence.• Department of Public Works.• Department of Trade and Industry.• Department of Justice and Constitutional Development.• Department of Labour.• Department of Correctional Services.• Department of Health.• Department of Agriculture. • Department of Public Works: KwaZulu-Natal Province. •
Despite referral back to the departments with requests that feedback be provided and that the cases should be finalised within prescribed time frames, those departments whose HoDs were summonsed had failed to comply. On average departments take more than two years in most cases before the grievances could be investigated and finalised. In two cases the Department of Justice and Constitutional Development only managed to resolve cases that were lodged initially by the aggrieved in 2003/2004 four years later, after the HoD was summonsed by the PSC. The PSC also had to summons the HoD of Public Works in KwaZulu-Natal for a grievance that remained unresolved for more than seven years.
46 Republic of South Africa. Public Service Commission. A Toolkit on Recruitment and Selection, 2003. 47 Du Toit D et al, “Labour Relations Law”, Third Edition, 2000 (p468).
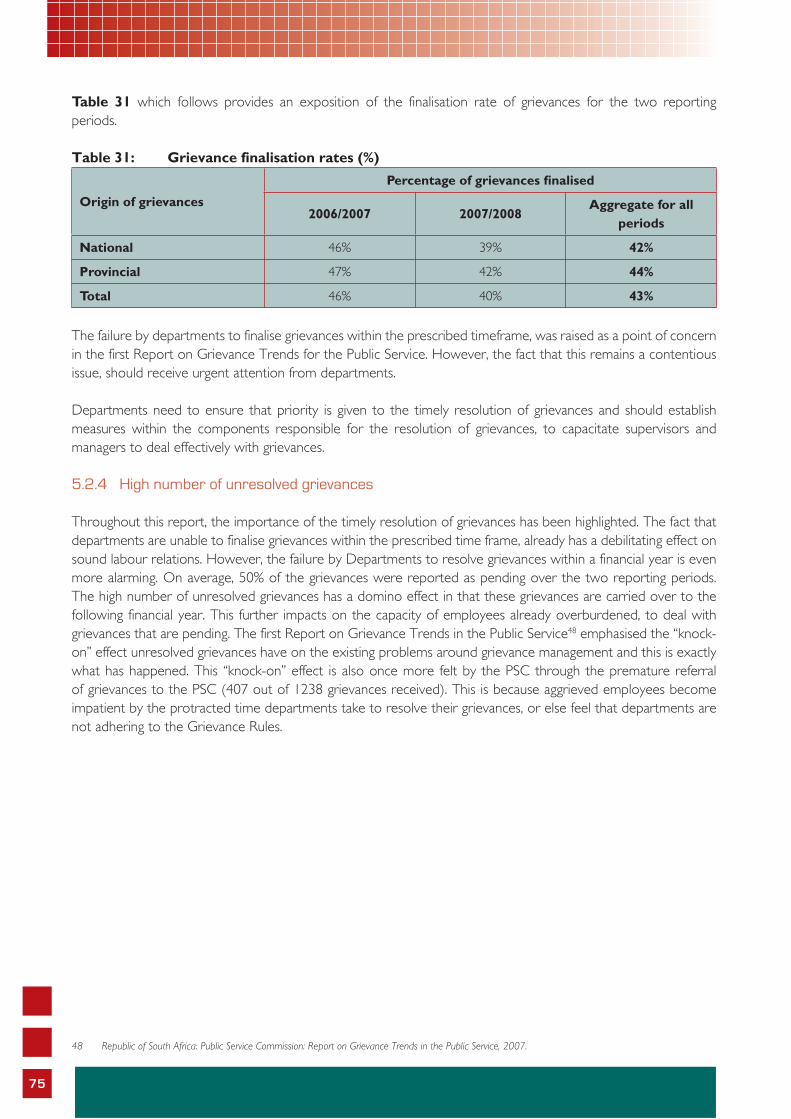
75
Table 31 which follows provides an exposition of the finalisation rate of grievances for the two reporting periods.
Table 31: Grievance finalisation rates (%)
Origin of grievances
Percentage of grievances fi nalised
2006/2007 2007/2008Aggregate for all
periods
National 46% 39% 42%
Provincial 47% 42% 44%
Total 46% 40% 43%
The failure by departments to finalise grievances within the prescribed timeframe, was raised as a point of concern in the first Report on Grievance Trends for the Public Service. However, the fact that this remains a contentious issue, should receive urgent attention from departments.
Departments need to ensure that priority is given to the timely resolution of grievances and should establish measures within the components responsible for the resolution of grievances, to capacitate supervisors and managers to deal effectively with grievances.
5.2.4 High number of unresolved grievances
Throughout this report, the importance of the timely resolution of grievances has been highlighted. The fact that departments are unable to finalise grievances within the prescribed time frame, already has a debilitating effect on sound labour relations. However, the failure by Departments to resolve grievances within a financial year is even more alarming. On average, 50% of the grievances were reported as pending over the two reporting periods. The high number of unresolved grievances has a domino effect in that these grievances are carried over to the following financial year. This further impacts on the capacity of employees already overburdened, to deal with grievances that are pending. The first Report on Grievance Trends in the Public Service48 emphasised the “knock-on” effect unresolved grievances have on the existing problems around grievance management and this is exactly what has happened. This “knock-on” effect is also once more felt by the PSC through the premature referral of grievances to the PSC (407 out of 1238 grievances received). This is because aggrieved employees become impatient by the protracted time departments take to resolve their grievances, or else feel that departments are not adhering to the Grievance Rules.
48 Republic of South Africa: Public Service Commission: Report on Grievance Trends in the Public Service, 2007.
89
Cha
pter
Six
Conclusion and Recommendations for the Improvement of Grievance
Management
76
77
6.1 INTRODUCTION The effective execution of the grievance procedure operates as an early warning system and alerts management to potential problems before they escalate. Public Service employees and managers should understand that utilising the grievance procedure effectively, facilitates in the effective use of resources, maintain good working relationships and support a positive overall experience. However, poor management of grievances not only squanders human and financial resources, but results in an increasing dissatisfied workforce. As is evident from Chapter 4, the number of grievances remains cause for concern as this indicates relatively high levels of dissatisfaction among public servants in the Public Service. This chapter provides recommendations to improve the situation.
6.2 RESPONSIBILITY OF MANAGERS
One of the underlying causes in the effective management of grievances is the lack of responsibility of managers to timely deal with grievances. As indicated in the previous Grievance Trends Report, managers indicated serious constraints in dealing with grievances and regarded grievance management as non-core line functions. However, the seriousness of the impact of poor grievance management cannot be regarded lightly. Despite the lack of capacity to deal effectively with grievances, managers should realise that grievance management forms part of their core management competencies functions.
6.3 NUMBER OF GRIEVANCES LODGED IN THE PUBLIC SERVICE
The number of grievances reported is cause for concern. As not all employees resort to formal grievances, the relatively high levels of dissatisfaction among public servants may even by higher. It is therefore imperative that departments afford grievance management the necessary priority attention. Departments, should as a matter of priority, analyse their own grievance trends in order to identify typical policies and practices, and the manner in which these are applied, that are inclined to cause high numbers of grievances, and address any shortcomings contained therein proactively to –
prevent further grievances of a similar nature from arising; and• assist in working down the large number of grievances that are pending.•
The latter is especially important since the apparent trend of a gradual increase in grievances may only compound the pressures already experienced by departments in not being able to stay on top of speedy grievance resolution.
6.4 UNDERLYING CAUSES OF GRIEVANCES
The report shows that dissatisfactions around performance assessment, salary matters and recruitment and selection consistently emerged as the top three causes of grievances in the Public Service since January 2005. It is therefore recommended that departments critically reflect on –
the present manner in which the PMDS is managed, with due regard to the following elements thereof:•
Job descriptions: These are, according to the PSC’s experience in this regard, often not well-compiled, and • require attention. The workload in this regard can be reduced by having each incumbent drawing up his/her own job description in accordance with guidelines, and then having these moderated within a group context of similar or comparable job contents.Performance standards: These are, again according to the PSC’s experience often vague and ill-formulated, • and need to be concretised in tangible and measurable terms. This can be achieved in a fairly short space of time by following the same procedure as in the case of job descriptions.
78
Performance monitoring and feedback: Once more, in the PSC’s experience this fairly simple procedure is • hugely neglected. The result is that employees often only hear after the fact, at the end of a performance cycle that their performance was either not up to standard, or that they have merely done what was expected of them. The problem in this regard is that if employees never receive feedback, and are never made aware of shortcomings, they may assume that they are actually performing well, creating room for otherwise unfounded expectations, especially when it comes to monetary awards.Cross-section departmental moderation: The PSC has discovered that managers’ and supervisors’ own • sense of what their departments demand in terms of outputs and standards are ill-informed, resulting in them being satisfied with their staff’s performance, only to discover that they are out of synch with what is generally prevailing in their departments. This obviously needs serious attention and a sound point of departure is to have a standard set of conventions and guidelines to guide managers in this regard.
Another major cause of grievances result from salary related matters. Most of the grievances in this area result • from the now defunct second and third notch awards and expectations arising from job evaluations. The PSC therefore recommends that a special effort be made to address long overdue outstanding issues. This will not only prevent further grievances from arising, but will also assist in resolving present grievances that are pending in this regard.
Recruitment and selection too often give rise to grievances. The PSC’s experience in this regard is that generally • there is much room for improvement in the way that departments approach this matter. The PSC released a Toolkit in this regard in 2003 to assist all role-players in a detailed manner, yet the impression gained is that the Toolkit is not consulted by departments as the same shortcomings identified through the PSC’s research in this regard that gave rise to the Toolkit still exist. Unless departments start paying attention to the validity and fairness of their procedures in this regard, grievances stemming from recruitment and selection practices will not decline. The PSC therefore recommends that serious attention be given to internalising sound, valid and fair recruitment and selection practices.
6.5 DIFFICULTIES IN ADHERING TO TIME FRAMES, LOW GRIEVANCE RESOLUTION RATES AND A RESULTANT HIGH NUMBER OF UNRESOLVED GRIEVANCES
The grievance resolution reports of all departments submitted to the PSC report reveals that adherence to 30 days prescribed within which a grievance must be resolved by a department remains a challenge. Despite the constant guidance provided by the PSC in communication with the departments once matters are referred back for compliance with Grievance Rules, the situation has not improved. Instead there is lot more cases that remained unresolved as during the reporting periods. This is despite written mutual agreement between aggrieved employees and the department for extension of the 30 days in accordance with the Grievance Rules. This is cause for concern as it leaves many employees aggrieved which is damaging the type of organisational culture departments require for optimal service delivery to the public.
6.6 RECOMMENDATIONS
The PSC recommends that departments give the following urgent attention:
The PSC is aware that line managers often lack the necessary time to deal with grievances as a result of staff • capacity problems, i.e. numbers of employees and skills. However, it is important that grievance management be given priority attention. It is therefore necessary to break the cycle where grievances are regarded as issues that can be shifted down the priority ladder. In order to achieve this, grievance management must henceforth be a standard item for inclusion into managers’ Performance Agreements and supervisors’ Workplace Agreements.
79
Managers and supervisors should be provided with training and guidance on interpersonal and technical • skills to deal with grievances. This can easily be achieved by hosting in-house role-playing workshops to demonstrate typical approaches in dealing with emotionally laden situations by remaining calm, concentrating on facts and not respond to accusations, verbal hostility, emotional outbursts, etc. but to merely communicate understanding for employees feelings, and undertake to look into alleged acts or omissions that have upset employees. Managers and supervisors should also be encouraged to consult with HR and LR on the latter.
The PSC has come to realise that managers and supervisors do not receive adequate advisory and facilitation • support from human resource and labour relations practitioners. Managers and supervisors often do not have the requisite knowledge and skills to deal with grievances. This reinforces the critical importance that should be provided by HR and LR Practitioners, and calls for a repositioning of these practitioners to respond to such needs proactively.
HR and LR Practitioners should follow up on outstanding grievances and use this opportunity to provide • assistance and advice.
Departments should establish a monitoring system to analyse their own grievance trends in order to identify • typical policies and practices, and the manner in which these are applied, that are inclined to cause high numbers of grievances, and address any shortcomings contained therein proactively to -
prevent further grievances of a similar nature from arising; and• assist in working down the large number of grievances that are pending.•
As the PSC is still awaiting consideration of its recommendations on suggested amendments to the Grievance Rules, it will be premature to come up with additional recommendations at this stage. However, the PSC remains focused on ensuring that labour relations are enhanced and will continue to sensitise the different role-players in Public Service labour relations of their responsibilities and functions so that service delivery to the public is not adversely affected by dissatisfactions.

80
Notes:
81
Notes:
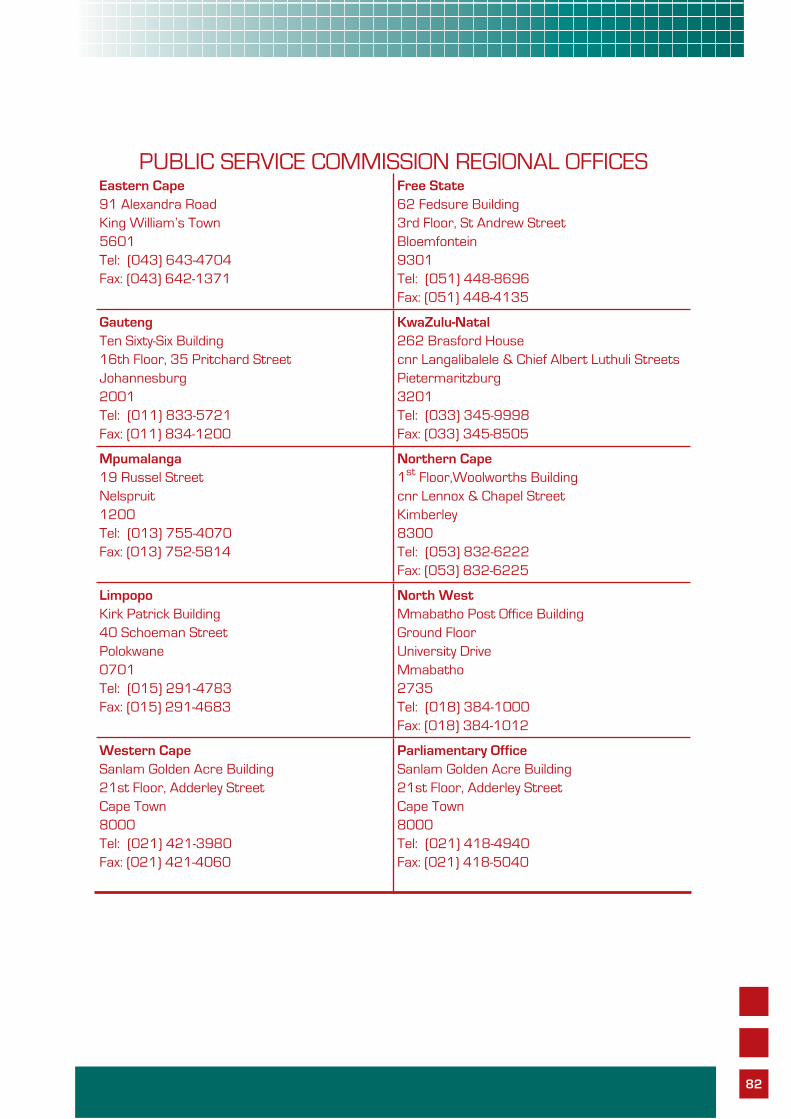
82
PUBLIC SERVICE COMMISSION REGIONAL OFFICESEastern Cape91 Alexandra RoadKing William’s Town 5601Tel: (043) 643-4704Fax: (043) 642-1371
Free State62 Fedsure Building3rd Floor, St Andrew StreetBloemfontein9301Tel: (051) 448-8696Fax: (051) 448-4135
GautengTen Sixty-Six Building16th Floor, 35 Pritchard StreetJohannesburg 2001Tel: (011) 833-5721Fax: (011) 834-1200
KwaZulu-Natal262 Brasford Housecnr Langalibalele & Chief Albert Luthuli StreetsPietermaritzburg 3201Tel: (033) 345-9998Fax: (033) 345-8505
Mpumalanga19 Russel StreetNelspruit 1200Tel: (013) 755-4070Fax: (013) 752-5814
Northern Cape1st Floor,Woolworths Buildingcnr Lennox & Chapel StreetKimberley 8300Tel: (053) 832-6222Fax: (053) 832-6225
LimpopoKirk Patrick Building40 Schoeman StreetPolokwane 0701Tel: (015) 291-4783Fax: (015) 291-4683
North WestMmabatho Post Office BuildingGround FloorUniversity DriveMmabatho 2735Tel: (018) 384-1000Fax: (018) 384-1012
Western CapeSanlam Golden Acre Building21st Floor, Adderley StreetCape Town8000Tel: (021) 421-3980Fax: (021) 421-4060
Parliamentary Office Sanlam Golden Acre Building21st Floor, Adderley StreetCape Town8000Tel: (021) 418-4940Fax: (021) 418-5040
96
Public Service Commission
Tel: +27 12 352-1000Fax: +27 12 325-8382Website: www.psc.gov.za
National Anti-Corruption Hotline for the Public Service: 0800 701 701
Republic of South Africa