Report on BENCHMARKING OF IRRIGATION SYSTEMS IN ... · Left bank irrigation canal from the Bhima...
238
Report on BENCHMARKING OF IRRIGATION SYSTEMS IN MAHARASHTRA STATE 2011-12 WATER RESOURCES DEPARTMENT Government of Maharashtra, India December 2015
Transcript of Report on BENCHMARKING OF IRRIGATION SYSTEMS IN ... · Left bank irrigation canal from the Bhima...

Report on BENCHMARKING OF IRRIGATION SYSTEMS
IN MAHARASHTRA STATE 2011-12
WATER RESOURCES DEPARTMENT Government of Maharashtra, India
December 2015

Details of photographs on cover page: 1. Bhandardara dam. 2. Left bank irrigation canal from the Bhima (Ujjani) dam.
3. Gate Controlled Spillway of Bhima (Ujjani) dam.
4. The 12 MW pumped storage powerhouse at the toe of the Bhima (Ujjani) dam on the left
bank.

REPORT ON BENCHMARKING OF IRRIGATION PROJECTS
IN MAHARASHTRA STATE
2011-12 * * * * * * * *
WATER RESOURCES DEPARTMENT GOVERNMENT OF MAHARASHTRA, INDIA
December 2015


Maharashtra Water Resources Development Centre, Aurangabad
Team Associated with Benchmarking Report
Name Designation
Shri Mohd. Mushtaque Executive Engineer
Shri S.D. Dongaonkar Executive Engineer
Smt M.N. Kulkarni Executive Engineer
Shri D. D. Joshi Executive Engineer
Smt. S. M. Razvi Assistant Engineer Grade-I
Smt. M. V. Tornale Assistant Engineer Grade-I
Shri T.C. Metkar Assistant Engineer Grade-I
Shri. V.A. Bhilegaonkar Sub divisional Engineer
Shri N. M. Shaikh Sub divisional Engineer
Shri. A. D. Mahajan Sub divisional Engineer
Shri. M. R. Mitthey Assistant Engineer Grade –II
Shri. B. A. Chivate Assistant Engineer Grade –II
Shri K. K. Barbind Sectional Engineer
Shri. S. A. Mulani Sectional Engineer
Shri. P. R. Manthekar Sectional Engineer
Ku V. S. Bhalerao Draftsman
Shri.D.U.Gadekar Dafter Karkoon
Shri A.B. Naybal Dafter Karkoon
Shri. N.A. Bansode Dafter Karkoon
Shri. V.V. Jaynure Dafter Karkoon
Shri. K.S. Misal Dafter Karkoon
Smt. M. S. Tupe Typist
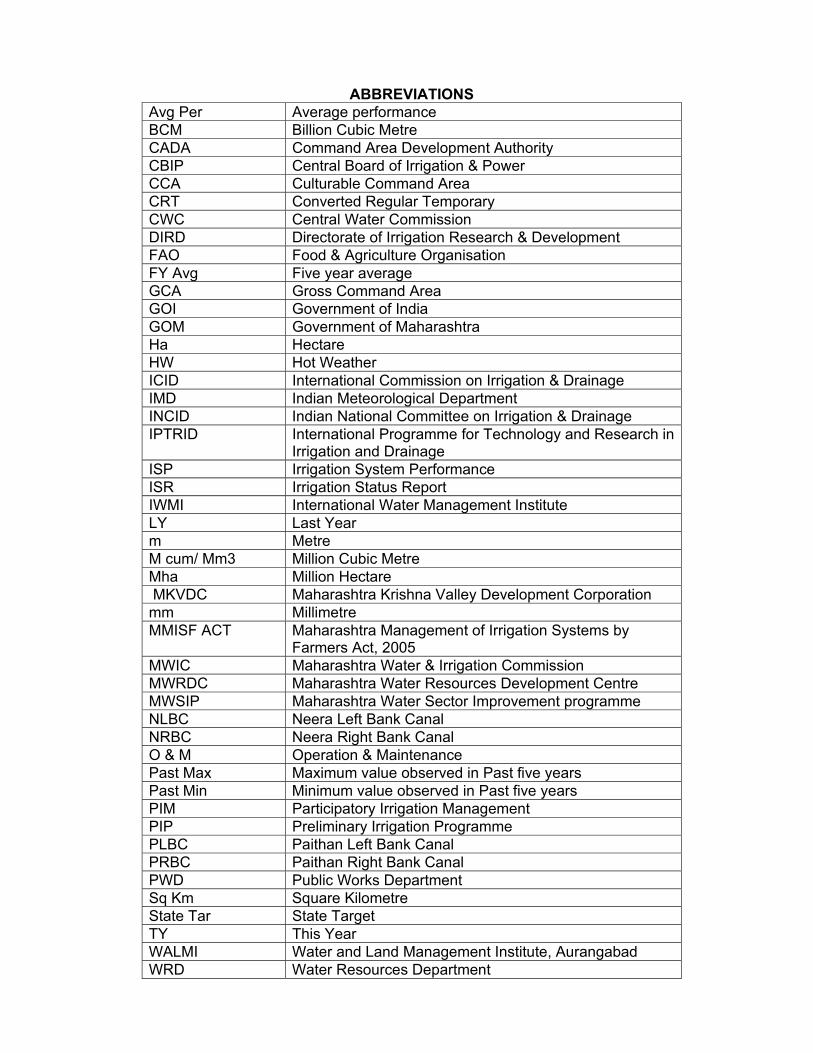
ABBREVIATIONS Avg Per Average performance BCM Billion Cubic Metre CADA Command Area Development Authority CBIP Central Board of Irrigation & Power CCA Culturable Command Area CRT Converted Regular Temporary CWC Central Water Commission DIRD Directorate of Irrigation Research & Development FAO Food & Agriculture Organisation FY Avg Five year average GCA Gross Command Area GOI Government of India GOM Government of Maharashtra Ha Hectare HW Hot Weather ICID International Commission on Irrigation & Drainage IMD Indian Meteorological Department INCID Indian National Committee on Irrigation & Drainage IPTRID International Programme for Technology and Research in
Irrigation and Drainage ISP Irrigation System Performance ISR Irrigation Status Report IWMI International Water Management Institute LY Last Year m Metre M cum/ Mm3 Million Cubic Metre Mha Million Hectare MKVDC Maharashtra Krishna Valley Development Corporation mm Millimetre MMISF ACT Maharashtra Management of Irrigation Systems by
Farmers Act, 2005 MWIC Maharashtra Water & Irrigation Commission MWRDC Maharashtra Water Resources Development Centre MWSIP Maharashtra Water Sector Improvement programme NLBC Neera Left Bank Canal NRBC Neera Right Bank Canal O & M Operation & Maintenance Past Max Maximum value observed in Past five years Past Min Minimum value observed in Past five years PIM Participatory Irrigation Management PIP Preliminary Irrigation Programme PLBC Paithan Left Bank Canal PRBC Paithan Right Bank Canal PWD Public Works Department Sq Km Square Kilometre State Tar State Target TY This Year WALMI Water and Land Management Institute, Aurangabad WRD Water Resources Department
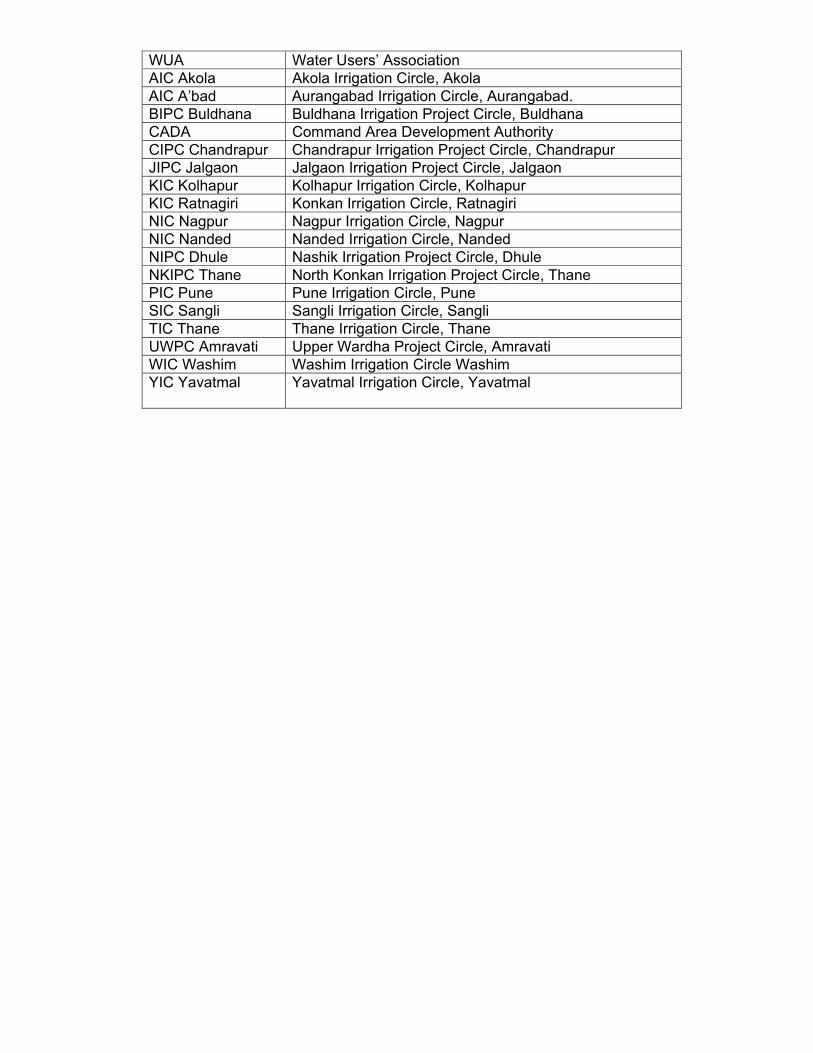
WUA Water Users’ Association AIC Akola Akola Irrigation Circle, Akola AIC A’bad Aurangabad Irrigation Circle, Aurangabad. BIPC Buldhana Buldhana Irrigation Project Circle, Buldhana CADA Command Area Development Authority CIPC Chandrapur Chandrapur Irrigation Project Circle, Chandrapur JIPC Jalgaon Jalgaon Irrigation Project Circle, Jalgaon KIC Kolhapur Kolhapur Irrigation Circle, Kolhapur KIC Ratnagiri Konkan Irrigation Circle, Ratnagiri NIC Nagpur Nagpur Irrigation Circle, Nagpur NIC Nanded Nanded Irrigation Circle, Nanded NIPC Dhule Nashik Irrigation Project Circle, Dhule NKIPC Thane North Konkan Irrigation Project Circle, Thane PIC Pune Pune Irrigation Circle, Pune SIC Sangli Sangli Irrigation Circle, Sangli TIC Thane Thane Irrigation Circle, Thane UWPC Amravati Upper Wardha Project Circle, Amravati WIC Washim Washim Irrigation Circle Washim YIC Yavatmal Yavatmal Irrigation Circle, Yavatmal

C O N T E N T S Sr. No.
Description Page No.
1 Executive Summary 1
2 Chapter – 1 : Introduction 3
3 Chapter – 2 : Overall status of State performance 13
4 Chapter – 3 : Benchmarking of Irrigation Projects 18
5 Chapter – 4 : Performance Indicators 20
Major Projects : Indicators I to XII(Except indicator IX, X) 24
Medium Projects : Indicators I to XII (Except indicator IX, X) 60
Minor Projects : Indicators I,II,VIII and XII(I+NI) 108
6 Chapter – 5: Action Taken for Improvement of Performance 112
7 Chapter – 6: Benchmarking of Water Users Associations 113
8 Chapter-7: Project wise review of Major and Medium Projects 137
9 Chapter -8: Benchmarking of WALMI 186
10 Chapter-9 Benchmarking of MERI 193
11 Chapter-10 Benchmarking of META 198
12 Appendices 205
Appendix I - Abstract of guide lines issued by GOM for Benchmarking of Irrigation Projects
205
Appendix II - State Target Values for indicators 206
Appendix III–Indicator wise Average Performance Calculations 209
Appendix IV -Overview of Projects selected for Benchmarking. 210
Appendix V - River Basins and Agro Climatic Zones of Maharashtra.
220
Appendix VI -Abstract of Water Rates for Irrigation, Domestic and Industrial Use.
225

Executive Summary
The methodology and main performance Indicators for Benchmarking are adopted as per the guidelines issued by Indian National Committee on Irrigation & Drainage (INCID) in 2002.
Benchmarking of Irrigation projects was initiated in the year 2001-02. Initially, the exercise was conducted for 84 projects in 2001-02 with 10 indicators. The number of projects increased to 254 in 2002-03 with 11 indicators. Instead of presenting the data of all these projects individually, an irrigation circle was considered as a unit for evaluation of performance. It was observed that some of the characteristics of projects under a circle are not identical and to make the comparison still on better grounds, projects under a circle in a plan group are grouped together and comparison is made with other projects in that plan group. Project wise performance is also included for major and medium projects.
In carrying out the Benchmarking exercise, following categorization of irrigation schemes into various types have been done for comparison.
Sr. No
Category
As per INCID Adopted in the State
A Type of control for Supply of water
Fixed proportional division, manual control, automatic Control
Manual control,
B Type of management Government agency, farmer managed
Government agency and WUA
C Method of allocation and distribution of water
Supply-oriented arranged-demand, on demand
On demand
D
Water Availability Abundant, Scarce Highly deficit to Abundant
E Water Source Surface water, groundwater or both.
Surface water
F Size Major, Medium, Minor All sizes
This is the Eleventh consecutive report of benchmarking of irrigation projects in
the State with 1241 projects and 12 indicators. The plan group wise number of projects selected for benchmarking during 2011-12 is as follows.
Sr. No.
Plan Group Major Medium Minor Total
1 Highly Deficit 1 30 173 204
2 Deficit 13 61 266 340
3 Normal 23 34 257 314
4 Surplus 3 26 104 133
5 Abundant 9 12 229 250
Total 49 163 1029 1241

Methodology:
The data presented in this report is based on information collected from each of the circle in-charge of the project. The following process was used in development of this report.
The data about water use and area irrigated is correlated with water accounts of 2011-12 of relevant projects.
The presentation for every indicator is done with past (5 year average), recent past (2010-11) and present year (2011-12) in order to compare the performance with predecessors as well as own performance of last year.
Based on performance for 2011-12, indicator wise average performance is found out for the plan group of circles under consideration, setting aside the exceptionally high/low values.
For financial indicator of output per unit irrigated area and output per unit irrigation water supply, prices of 1998-99 are considered to obviate effect of price rise.
Benchmarking of WUA
Till June 2011, potential to the tune of 4.535 Mha of State level projects is created.
By the end for April 2012 in all 2989 WUA were in full operation with operational area of 11.66 Lakh Ha. Besides this the number of WUA’s which have been registered during 2011-12 was 1544 covering an area of about 5.60 Lakh Ha. The WUA include those registered under Maharashtra Co-operative Act-1960 and Maharashtra Management of Irrigation system by farmer’s Act-2005.
During this year 12 WUA on 7 major projects are selected for with 9 indicators.
Observations:
The annual irrigation water supply per hectare in major projects slightly decreased, from 10251 Cum/Ha in 2010-11 to 9832 Cum/Ha in 2011-12 but still it is higher than the State norm. In medium projects form 7705 Cum/Ha in 2010-11 to 6534 Cum/Ha in 2011-12 Where as in minor projects with considerably increased from 5816 Cum/Ha in 2010-11 to 6544 Cum/Ha in 2011-12. For Medium & Minor projects, water utilized is within state norm.
The potential utilization in respect of major projects achieved above the state target (1.14) due to precise use of water as compared to last year, whereas in medium projects the utilization is 0.51 of the created potential. In minor projects only 0.56 of created potential is utilized.
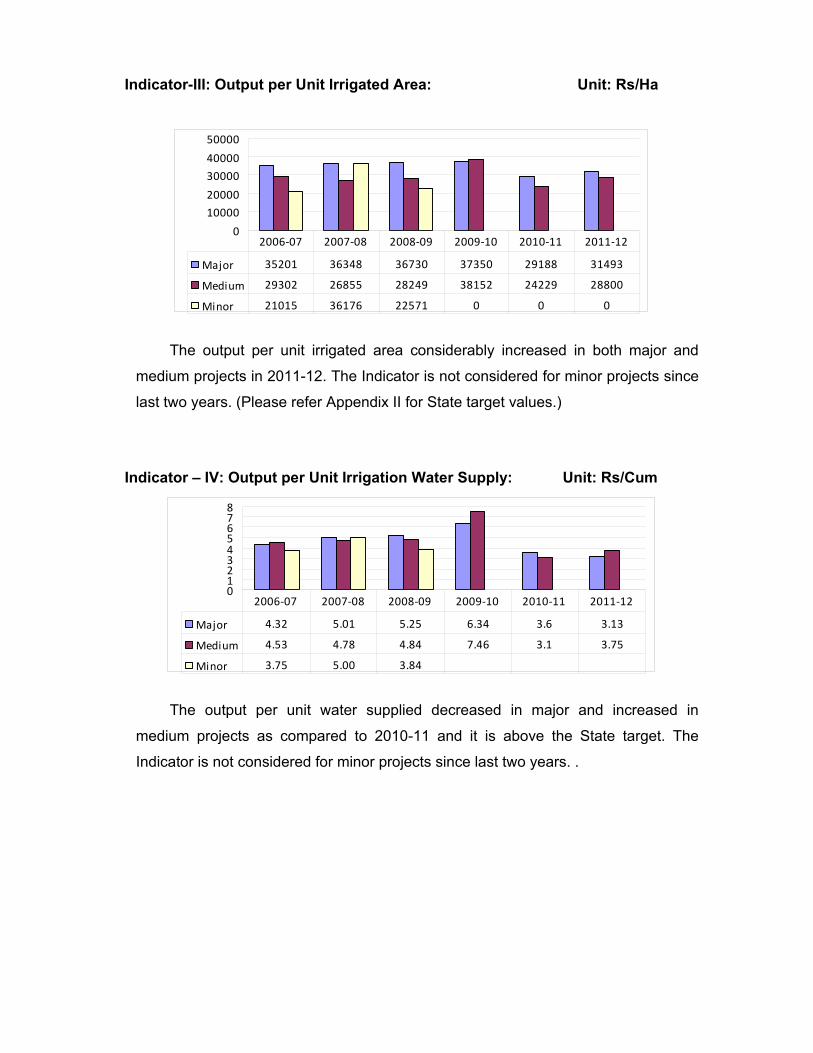
The output per unit irrigated area considerably increased in both major and medium projects in 2011-12. In major project it is 31493 & in medium it is 28800.
The output per unit water supplied decreased in major projects from 3.6 in 2010-11 to 3.13 in 2011-12. It is increased in medium projects from 3.1 in 2010-11 to 3.75 in 2011-12.
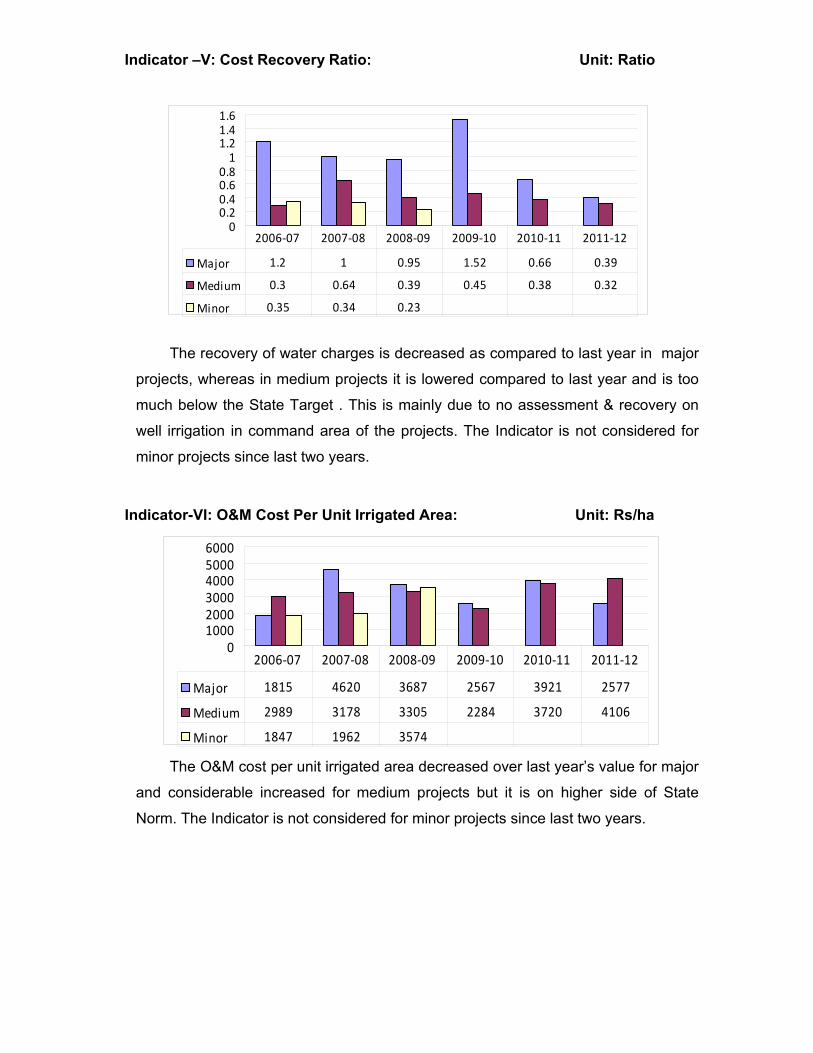
As Compared to last year the cost recovery ratio is decreased considerably in major projects from 0.66 in 2010-11 to 0.39 in 2011-12 and decreased slightly in medium projects from 0.38 in 2010-11 to 0.32 in 2011-12 due to increase in O & M cost per unit irrigated area.
Revenue per unit water supply decreased in major projects from 0.16 to 0.11 and in minor projects doubled from 0.07 to 0.14 as compared to last year average. In medium projects it is slightly decreased than last year from 0.10 to 0.09.
The recovery of non irrigation water supply increased in case of Major Projects from 0.79 to 0.92 and Medium Projects from 0.86 to 0.88 as compared to last year.
Chapter - 1
INTRODUCTION 1.0.0 Benchmarking is a very powerful management tool for analyzing and improving the performance of water resources projects. It is widely accepted all over the World. IPTRID, IWMI, ICID, World Bank & FAO advocate use of benchmarking for evaluation of performance.
For evaluation and improvement of performance of water resources projects, Government of Maharashtra has undertaken the benchmarking exercise in the State since 2000-01.
Benchmarking of selected 12 Water Users’ Associations on 7 major projects under different irrigation circles is also carried out for last 5 years. Objectives, indicators, performed for data collection and indicator values are given in detail in chapter 6 of this report. This will be helpful for improving the performance of WUA.
Maharashtra is the first State in India, to introduce the Benchmarking Technique for Irrigation Projects & now with our experience and Central Water Commission’s follow-up, other States are also adopting it.
The methodology and main Performance Indicators for Benchmarking are adopted as per the guidelines issued by Indian National Committee on Irrigation & Drainage (INCID) in 2002.
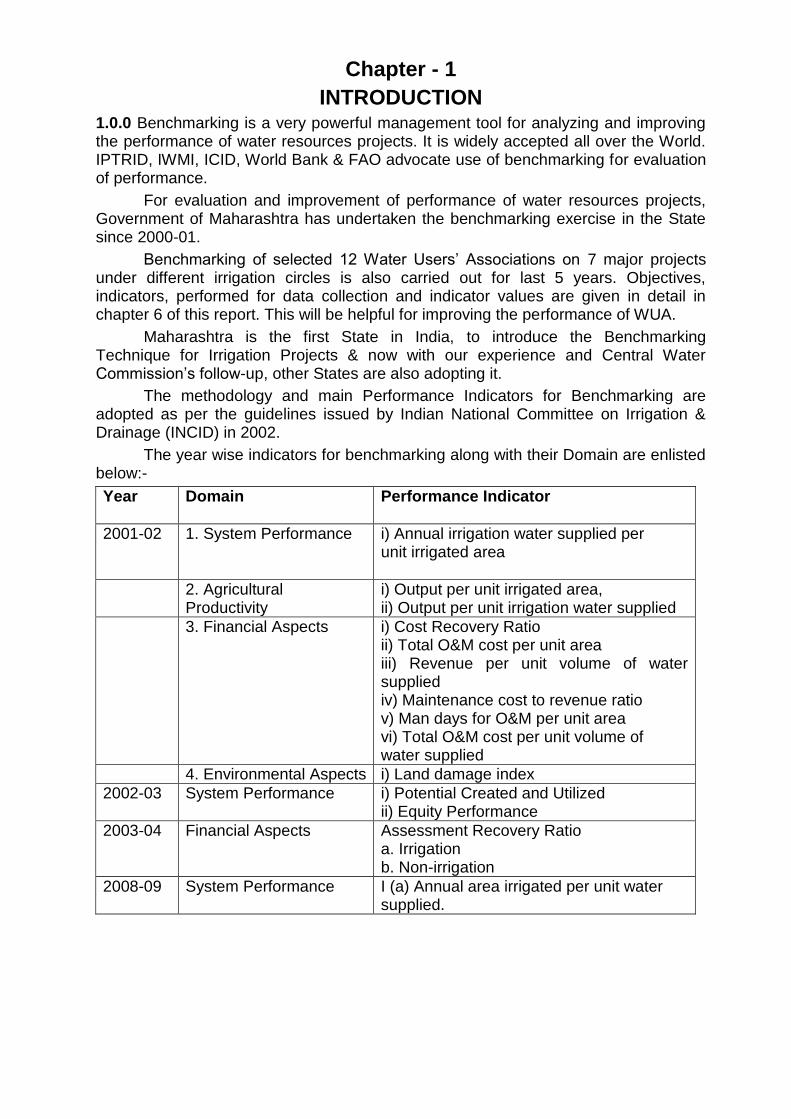
The year wise indicators for benchmarking along with their Domain are enlisted below:-
Year Domain Performance Indicator
2001-02
1. System Performance i) Annual irrigation water supplied per unit irrigated area
2. Agricultural Productivity
i) Output per unit irrigated area, ii) Output per unit irrigation water supplied
3. Financial Aspects i) Cost Recovery Ratio ii) Total O&M cost per unit area iii) Revenue per unit volume of water supplied iv) Maintenance cost to revenue ratio v) Man days for O&M per unit area vi) Total O&M cost per unit volume of water supplied
4. Environmental Aspects i) Land damage index
2002-03 System Performance i) Potential Created and Utilized ii) Equity Performance
2003-04 Financial Aspects Assessment Recovery Ratio a. Irrigation b. Non-irrigation
2008-09 System Performance I (a) Annual area irrigated per unit water supplied.
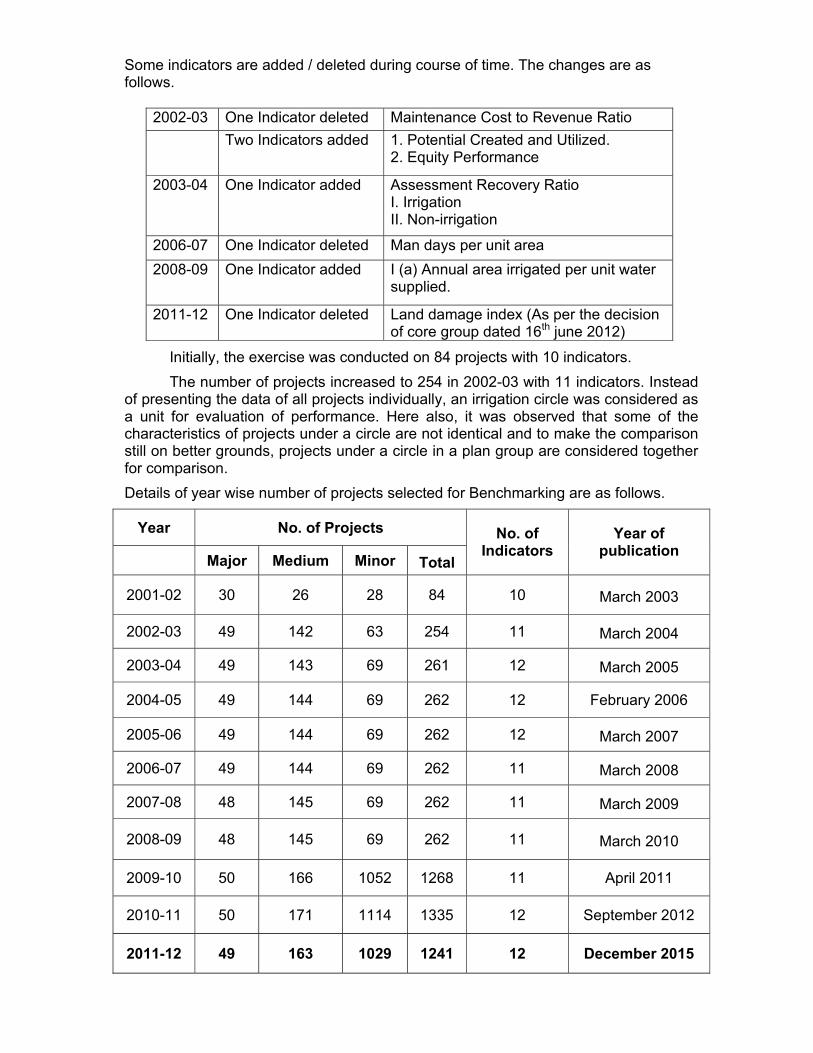
Some indicators are added / deleted during course of time. The changes are as follows.
2002-03 One Indicator deleted Maintenance Cost to Revenue Ratio Two Indicators added 1. Potential Created and Utilized.
2. Equity Performance
2003-04 One Indicator added Assessment Recovery Ratio I. Irrigation II. Non-irrigation
2006-07 One Indicator deleted Man days per unit area 2008-09 One Indicator added I (a) Annual area irrigated per unit water
supplied.
2011-12 One Indicator deleted Land damage index (As per the decision of core group dated 16th june 2012)
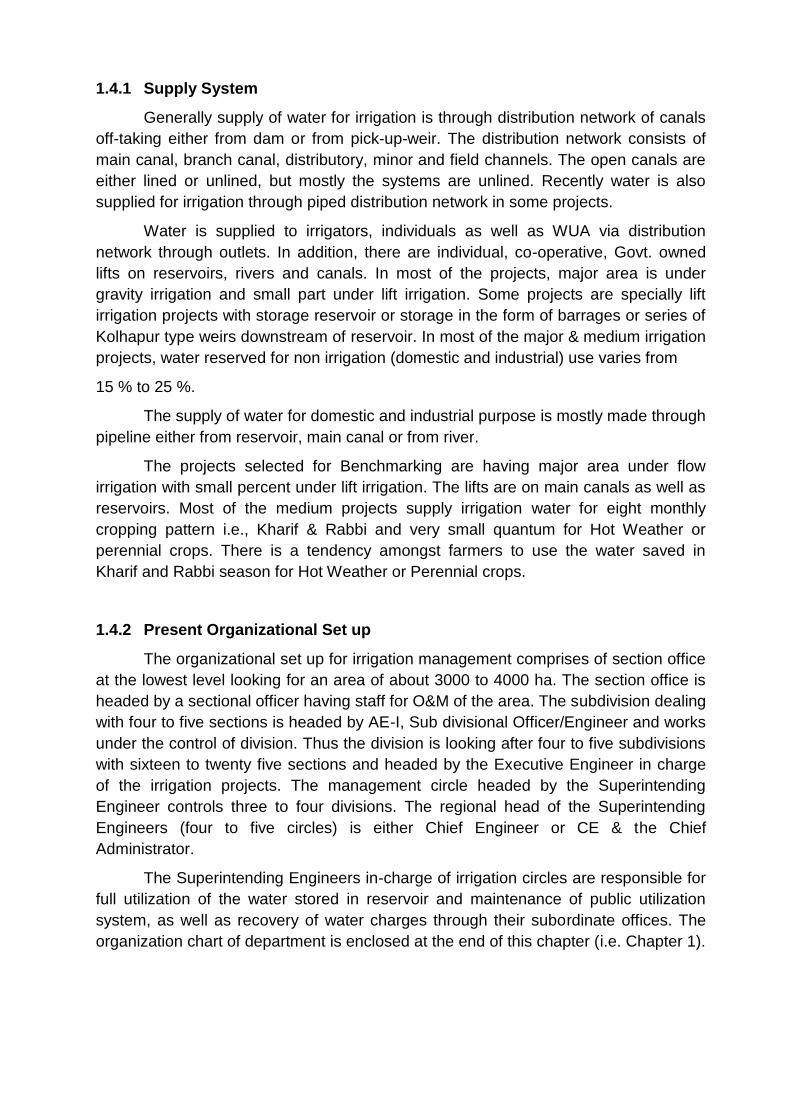
Initially, the exercise was conducted on 84 projects with 10 indicators. The number of projects increased to 254 in 2002-03 with 11 indicators. Instead of presenting the data of all projects individually, an irrigation circle was considered as a unit for evaluation of performance. Here also, it was observed that some of the characteristics of projects under a circle are not identical and to make the comparison still on better grounds, projects under a circle in a plan group are considered together for comparison. Details of year wise number of projects selected for Benchmarking are as follows.
Year No. of Projects
Major Medium Minor Total
No. of Indicators
Year of publication
2001-02 30 26 28 84 10 March 2003
2002-03 49 142 63 254 11 March 2004
2003-04 49 143 69 261 12 March 2005
2004-05 49 144 69 262 12 February 2006
2005-06 49 144 69 262 12 March 2007
2006-07 49 144 69 262 11 March 2008
2007-08 48 145 69 262 11 March 2009
2008-09 48 145 69 262 11 March 2010
2009-10 50 166 1052 1268 11 April 2011
2010-11 50 171 1114 1335 12 September 2012
2011-12 49 163 1029 1241 12 December 2015

1.1.0 Maharashtra at a glance
Maharashtra occupies main portion of the Indian Sub-continent. The
geographical location of the State is bounded between latitude 16.4o
to 22.1o
N and longitude 72.6o
to 80.9o
E and has an area of 307.71 thousand sq km, which is
about 9.4 percent of the total geographical area of India. The State has 720 Km long coastline along Arabian Sea. The western hill ranges are almost parallel to this coastline. The State is divided into two physiographic regions of Konkan and rest of the State (Deccan Plateau). The Deccan Plateau spread over on the east side of Ghat has west-east slope. In general, the altitude of the plateau varies between 300 to 600 m. Maharashtra is bounded by Gujarat, Dadra & Nagar Haveli on north-west, Madhya Pradesh on north, Chhattisgadh on east and Andhra Pradesh, Karnataka and Goa on south.
1.2.0 Physiography
The State is divided into five major regions physiographically:
i) Konkan strip on western side (ii) Sahyadri ranges iii) Plateau on eastern side (iv) Hilly ranges of Satpuda and adjacent area on north and (v) Hilly and forest region of north-south, Wainganga basin to the east of State.
1) Konkan Strip
The narrow strip of land extending from Damanganga basin in north to the border of Goa State in south is the Konkan. It has Sahyadri ranges on east and Arabian Sea on west. The Konkan strip is about 53 to 60 km wide and 500 km long along north-south. The widest stretch is about 100 km. Width decreases as one proceeds towards south. The region becomes hilly and altitude increases from the coastline towards east.
2) Sahyadri Ranges
These continuous mountain ranges extend almost parallel to the western coastline. It is known as Western Ghat. The average height of Sahyadri in Maharashtra is 900 m. It is more in the north and decreases towards south.
3) Eastern Plateau Region (Deccan Plateau)
The height of this plateau goes on decreasing from 600 m on western side to 300 m in the Wainganga basin on east. This region is formed from lava of igneous rocks. All the districts of Khandesh, Marathwada2, Western Maharashtra and the western districts of Vidarbha3
fall in this region. (1. Khandesh includes Dhule, Nandurbar & Jalgaon districts 2 Marathwada includes Aurangabad, Jalna,
Parbhani, Nanded, Osmanabad, Latur, Hingoli & Beed districts 3 Vidarbha includes Akola, Washim, Amravati, Yeotmal, Wardha, Nagpur, Bhandara, Gondia, Chandrapur, Buldhana & Gadchiroli districts.)
4) Satpuda Ranges and Tapi – Purna basin on North
Satpuda hill ranges lie on the northern boundary of the State. This region is spread over in the districts of Amravati, Akola, Jalgaon and Dhule.

5) Eastern Region Consisting of Wainganga basin
Eastern region comprises of eastern side of the State and flat paddy field region lies along both the banks of the river at an elevation of about 300 m. On the eastern side of this flat region along the Maharashtra - Chhattisgadh boundary are the hills of different geological formations other than the Deccan Trap. Many eastern tributaries of Wainganga originate from this hill range. The height of this hilly plateau is around 800 m.
Detailed information with regard to river basins, availability of water resources, climate, rainfall, agro climatic zones, etc of Maharashtra is given in Appendix-IV.
1.3.0 Rainfall during 2011-12
In the State generally the Rainfall starts on 7th June by South West Monsoon. In
the year 2011, the South-West monsoon arrived in Southern Konkan on
3rd June. In remaining parts of Konkan region and Kolhapur, Satara, Nasik & Nandurbar districts it reached by 5 th June. It advanced in eastern Vidarbha on 16 th June and in western Vidarbha and Marathwada on 22nd June. Thus, monsoon covered entire State by 22 nd June. Compared to last year, though the monsoon arrived earlier, the coverage of entire State was delayed by about two weeks.
During June, July, August, September and October the state received 94.7 %, 101.6 %, 122.3 %, 96.9 per cent and 58.9 per cent rainfall respectively against the normal. The total rainfall in the State during 2011 was 102.3%. Raigad, Ratnagiri, Sindhudurg and Satara districts received more than 120 % rainfall, while Osmanabad and Nanded districts received rainfall below 80 % compared to normal.
Out of 355 talukas (except Mumbai City & talukas in Mumbai Suburban District) in the sate, 13% talukas received excess rainfall, 59% talukas received normal rainfall and 28% talukas received deficient rainfall.
(Ref:https://www.maharashtra.gov.in/Site/PDF/EcoSurvey_2012_Eng.pdf ,page 83)
1.4.0 Irrigation Development during Post-independence Period
Maharashtra State came into existence in 1960. The increasing population was facing shortage of food grains. This has led to the need of increasing agricultural production. By giving priority to agricultural development, attempt has been made to achieve irrigation development in a planned manner.
Hardly, 0.274 Mha, irrigation potential was created in the State during preplan period i.e. before 1950. Agriculture has been the prominent occupation to provide food and fiber to the growing population of the State. Adequate, timely and guaranteed water supply is of paramount importance in agriculture production and irrigation development plays a key role in alleviating rural poverty. The state has created 45.35 Lakh ha irrigation potential using surface water resources by June 2011 through 82 major, 276 medium and state sector 3148 minor irrigation projects. The created irrigation potential, through local sector projects and other resources has been estimated as 1.555 Mha.
1.4.1 Supply System
Generally supply of water for irrigation is through distribution network of canals
off-taking either from dam or from pick-up-weir. The distribution network consists of
main canal, branch canal, distributory, minor and field channels. The open canals are
either lined or unlined, but mostly the systems are unlined. Recently water is also
supplied for irrigation through piped distribution network in some projects.
Water is supplied to irrigators, individuals as well as WUA via distribution
network through outlets. In addition, there are individual, co-operative, Govt. owned
lifts on reservoirs, rivers and canals. In most of the projects, major area is under
gravity irrigation and small part under lift irrigation. Some projects are specially lift
irrigation projects with storage reservoir or storage in the form of barrages or series of
Kolhapur type weirs downstream of reservoir. In most of the major & medium irrigation
projects, water reserved for non irrigation (domestic and industrial) use varies from
15 % to 25 %.
The supply of water for domestic and industrial purpose is mostly made through
pipeline either from reservoir, main canal or from river.
The projects selected for Benchmarking are having major area under flow
irrigation with small percent under lift irrigation. The lifts are on main canals as well as
reservoirs. Most of the medium projects supply irrigation water for eight monthly
cropping pattern i.e., Kharif & Rabbi and very small quantum for Hot Weather or
perennial crops. There is a tendency amongst farmers to use the water saved in
Kharif and Rabbi season for Hot Weather or Perennial crops.
1.4.2 Present Organizational Set up
The organizational set up for irrigation management comprises of section office
at the lowest level looking for an area of about 3000 to 4000 ha. The section office is
headed by a sectional officer having staff for O&M of the area. The subdivision dealing
with four to five sections is headed by AE-I, Sub divisional Officer/Engineer and works
under the control of division. Thus the division is looking after four to five subdivisions
with sixteen to twenty five sections and headed by the Executive Engineer in charge
of the irrigation projects. The management circle headed by the Superintending
Engineer controls three to four divisions. The regional head of the Superintending
Engineers (four to five circles) is either Chief Engineer or CE & the Chief
Administrator.
The Superintending Engineers in-charge of irrigation circles are responsible for
full utilization of the water stored in reservoir and maintenance of public utilization
system, as well as recovery of water charges through their subordinate offices. The
organization chart of department is enclosed at the end of this chapter (i.e. Chapter 1).

1.4.3 Crops Irrigated
There is significant variation in crops within the regions as well as in projects under a region. Details of principal crops grown in different regions and plan group wise are as below.
Region Plan group Principal crops grown
Eastern Vidarbha Abundant & Surplus Kharif Paddy, HW Paddy
Western Vidarbha Normal Cotton, Wheat, Gram, Sunflower,
Orange
Marathwada Normal & Deficit Cotton, Wheat, Rabi Jawar
Gram, Sunflower, Soyabean, Groundnut, Sugarcane, Banana
North Maharashtra Normal Rabi Jawar, Maize, Wheat, Bajara, Cotton, Vegetables
Grapes, Sugarcane, Banana
Western Maharashtra Normal & Abundant Maize, Wheat, Vegetables, Pomegranates, Sugarcane
Konkan Abundant Paddy, Vegetables, Mango
1.4.4 Management of Systems
The irrigation systems are constructed and mostly managed by the GOM. Operation and maintenance of irrigation projects is looked after by irrigation divisions, which are administratively controlled by circle office. GOM has taken a policy decision to supply water for irrigation through Water Users’ Associations only. Accordingly the MMISF Act was passed by the Government in year 2005. Irrigation management of area under jurisdiction of WUA is being transferred to them. Waghad Project in North Maharashtra region was handed over to Federation of WUA for irrigation management.
To corroborate the process of handing over the culturable command area (6,68,850 Ha) of selected 286 projects to the WUA within stipulated time frame, Maharashtra Water Sector Improvement Project has been taken up with the help of World Bank.
1.4.5 Area under modern irrigation methods Area under drip irrigation in the state by March 2012 was 8.48 Lakh Ha. The
agricultural zone wise area under drip irrigation is as follows:
Sr.No Agricultural Zone
Area Under Drip Irrigation in Ha.(Up to March 2012)
Percentage of Zone with State Area.
1. Konkan 13314 1.57
2. Nashik 279887 33.01
3. Pune 183032 21.59
4. Kolhapur 64617 7.62
5. Aurangabad 91187 10.76
6. Latur 91434 10.78
7. Amrawati 106896 12.61
8. Nagpur 17481 2.06
Maharastra State 847848 100.00
Ref: Irrigation Status Report 2011-12.

1.5.0 Present Status of Irrigation Utilization
0
5
10
15
20
25
30
35
40
45
50
Are
a i
n L
ac
Ha
Irrigation Potential Created 45.3547.3746.3444.8643.3141.3240.0339.1338.6338.12
Irrigation on Projects 20.5418.4116.5618.2518.9718.3516.1712.5912.4413.18
Irrigation on Wells 11.8611.148.879.078.678.465.974.44.415.24
Total Irrigation 32.429.5525.4327.3227.6426.8122.1416.9916.8518.42
2011-122010-112009-102008-092007-082006-072005-062004-052003-042002-03
(Ref: Irrigation Status Report 2011-12.Page 17)
In spite of various measures taken so far, there is a gap between potential created and utilized.
The overall reasons for less utilization are as follows
i) Low water yield in the reservoirs
ii) Diversion of irrigation water to non irrigation uses
iii) Tendency of farmers to grow high water intensive cash crops like sugarcane, banana
iv) Reduction in storage capacity due to silting
v) Lapses in assessment of the irrigated area in the command
vi) Non accounting of irrigated area outside the command (influence area)
vii) Poor maintenance of the infrastructure due to financial constraints
viii) Non participation of beneficiaries in irrigation management.
ix) Absentee landlords
x) Lack of infrastructure for transportation, storage & marketing of Agriculture produce.
Year wise data of potential created and actual utilization is exhibited in graph. From this information, it is clear that till the year 2004-05, actual maximum utilization (Projects + wells) was 48% of the potential created. Under utilization has always remained a point of concern. Therefore, based on past experience, circle wise targets are fixed from 2006-07. In the year 2011-12, the percent utilization of created irrigation potential is 71.44%.

1.6.0 Participation of Beneficiaries in Water Resources Management
National Water Policy 2002 and Maharashtra State Water Policy 2003
advocate Participatory Irrigation Management. In view of these, water users
associations are being setup in command areas of various projects in different parts
of the State. By the end for April 2012 in all 2989 WUA were in full operation with
operational area of 11.66 Lakh Ha. Besides this the number of WUAs which have
been registered during 2011-12 was 1544 covering an area of about 5.60 lakh Ha.
Looking at the slow pace of PIM in last decade and to bridge the gap between
irrigation potential created and its actual utilization and to optimize the benefits by
ensuring proper use of surface & ground water by increased efficiency in distribution,
delivery, application and drainage of irrigation systems and for achieving this
objective, to give statutory recognition to the constitution & operation of WUA, an act
has been passed by the State legislature. The act is known as "Maharashtra
Management of Irrigation Systems by Farmers Act, 2005”.As per this act, all the
beneficiaries in the command of distributaries / minor will become the members of
WUA, once the area is notified under the act.


2) SE, CIPC Chandrapur
2) SE, WIC Washim
1) SE, NIC Nagpur
1) SE, AIC Akola
DG, WALMI, Aurangabad
CE, WRD Aurangabad
1) SE, NIC Nanded
2) SE, AIC Aurangabad
3) SE, OIC Osmanabad
2) SE, BIPC Buldhana
CE, WRD, Amravati
3) SE, JPC, Aurangabad
1) SE, JIPC Jalgaon
2) SE, CADA Jalgaon
2) SE, CADA Beed
3) SE, NIPC Dhule
1) SE, TIC Thane
1) SE, SIPC Satara
1) SE, PIC Pune
1) SE, CADA Nashik
CE, WRD Nagpur
CE, WRD, (SP) Amravati
1) SE, CADA Aurangabad
1) SE, UWPC Amravati
1) SE, CADA Nagpur
CE, Pune (WR)
C E, WRD, NMR, Nashik
CE & Chief Administrator
CAD Aurangabad
CE, TIPC, Jalgaon
Organisation Chart of Irrigation ManagementSecretary (WRM & CAD) Mantralaya (Mumbai)
2) SE, Gosi (K) LIC Bhandara
2) SE, KIC Ratnagiri
2) SE, CADA Pune
2) SE, SIC Sangli
CE, Gosi (K) Nagpur (WR)
CE, WRD, Konkan Region
Mumbai
CE, (SP) Pune
2) SE, DIRD, Pune
1) CE, MWRDC,
Aurangabad
4) SE, SKIPC, Oros,
Sindhudurg
4) SE, BIPC, Parli (V)
3) SE, CADA Solapur
3) SE, NKIPC Kalwa, Thane
3) SE, YIC Yaotmal

Chapter 2 Overall Status of Performance of State
Indicator–I: Annual Irrigation Water Supply per Unit Irrigated Area: Cum/Ha
02000400060008000
1000012000
Major 10977 8289 10253 9141 10251 9832
Medium 7362 8449 7447 7001 7705 6534
Minor 7399 6910 6575 5242 5816 6544
2006‐07 2007‐08 2008‐09 2009‐10 2010‐11 2011‐12
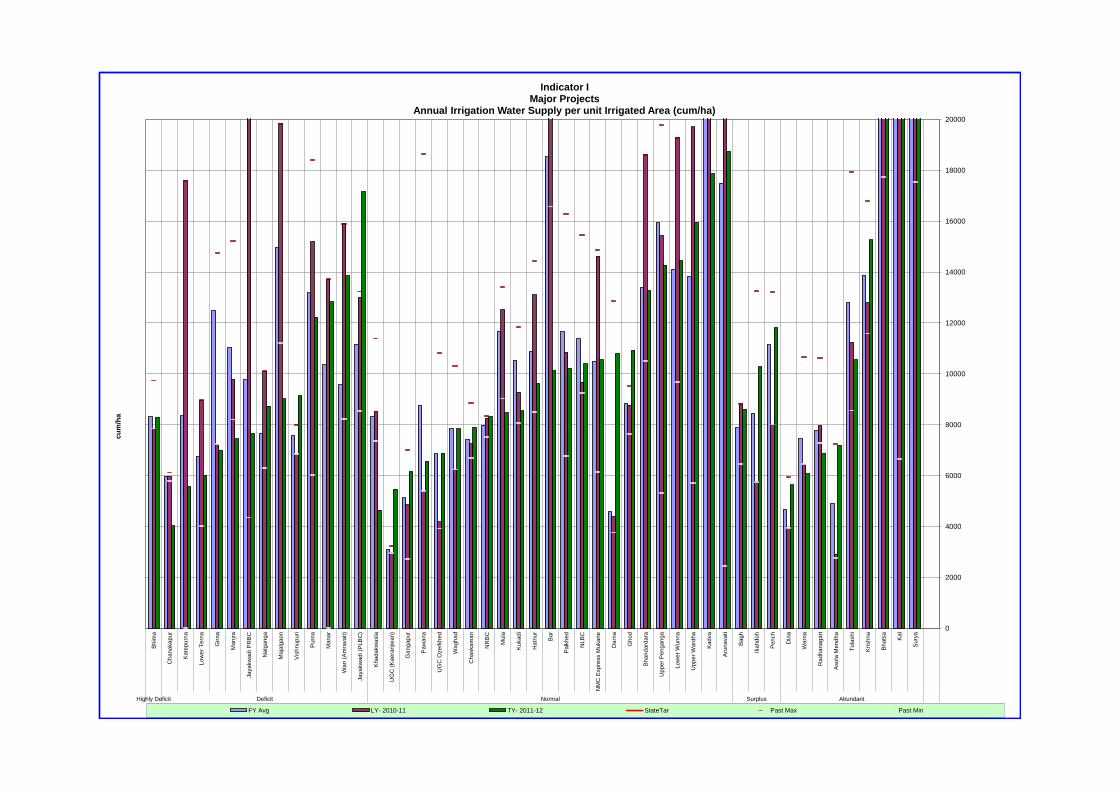
Irrigation water supplied for major projects in the State is slightly less in
2011-12 as compared to 2010-11. However, it is 28 percent on higher side of the
State Norm i.e.7692. For Medium and Minor projects water utilized is nearly as per
norm i.e.6534 & 6544 respectively.
Indicator –II: Potential Created and Utilized: Unit: Ratio
00.20.40.60.81
1.2
Major 0.91 0.88 0.8 1.07 0.8 1.14
Medium 0.65 0.73 0.74 0.71 0.58 0.51
Minor 0.89 0.71 0.63 0.75 0.71 0.56
2006‐07 2007‐08 2008‐09 2009‐10 2010‐11 2011‐12
The indicator value in respect of major projects increased from 0.8 to 1.14 as
compared to last year and it is slightly above the State Norm. Utilization of potential in
medium projects has slightly decreased from 0.58 to 0.51 this year. However, in minor
projects this year also there is reduction in indicator value from 0.71 to 0.56.
Indicator-III: Output per Unit Irrigated Area: Unit: Rs/Ha
0
10000
20000
30000
40000
50000
Major 35201 36348 36730 37350 29188 31493
Medium 29302 26855 28249 38152 24229 28800
Minor 21015 36176 22571 0 0 0
2006‐07 2007‐08 2008‐09 2009‐10 2010‐11 2011‐12
The output per unit irrigated area considerably increased in both major and
medium projects in 2011-12. The Indicator is not considered for minor projects since
last two years. (Please refer Appendix II for State target values.)
Indicator – IV: Output per Unit Irrigation Water Supply: Unit: Rs/Cum
012345678
Major 4.32 5.01 5.25 6.34 3.6 3.13
Medium 4.53 4.78 4.84 7.46 3.1 3.75
Minor 3.75 5.00 3.84
2006‐07 2007‐08 2008‐09 2009‐10 2010‐11 2011‐12
The output per unit water supplied decreased in major and increased in
medium projects as compared to 2010-11 and it is above the State target. The
Indicator is not considered for minor projects since last two years. .
Indicator –V: Cost Recovery Ratio: Unit: Ratio
00.20.40.60.81
1.21.41.6
Major 1.2 1 0.95 1.52 0.66 0.39
Medium 0.3 0.64 0.39 0.45 0.38 0.32
Minor 0.35 0.34 0.23
2006‐07 2007‐08 2008‐09 2009‐10 2010‐11 2011‐12
The recovery of water charges is decreased as compared to last year in major
projects, whereas in medium projects it is lowered compared to last year and is too
much below the State Target . This is mainly due to no assessment & recovery on
well irrigation in command area of the projects. The Indicator is not considered for
minor projects since last two years.
Indicator-VI: O&M Cost Per Unit Irrigated Area: Unit: Rs/ha
0100020003000400050006000
Major 1815 4620 3687 2567 3921 2577
Medium 2989 3178 3305 2284 3720 4106
Minor 1847 1962 3574
2006‐07 2007‐08 2008‐09 2009‐10 2010‐11 2011‐12
The O&M cost per unit irrigated area decreased over last year’s value for major
and considerable increased for medium projects but it is on higher side of State
Norm. The Indicator is not considered for minor projects since last two years.

Indicator – VII: O&M Cost Per Unit Water Supply: Unit: Rs/Cum
0
0.2
0.4
0.6
0.8
1
Major 0.18 0.40 0.28 0.33 0.36 0.58
Medium 0.43 0.22 0.37 0.36 0.44 0.58
Minor 0.32 0.35 0.45
2006‐07 2007‐08 2008‐09 2009‐10 2010‐11 2011‐12
The performance has increased over last year for major and medium projects
but it is more than the State target (0.16).The O&M cost per unit water supplied for
major and medium projects is increased from Rs.0.44/cum to Rs.0.58/cum and it is
more than three times the State target (0.16). The Indicator is not considered for
minor projects since last two years.
Indicator – VIII: Revenue Per Unit Water Supply: Unit: Rs/cum
00.10.20.30.40.50.60.70.8
Major 0.22 0.24 0.30 0.49 0.16 0.11
Medium 0.13 0.14 0.12 0.16 0.10 0.09
Minor 0.11 0.05 0.05 0.09 0.07 0.14
2006‐07 2007‐08 2008‐09 2009‐10 2010‐11 2011‐12
The performance is decreased in case of major & medium projects whereas for
minor projects it has increased for current year. In major projects the revenue is less
than the State target (0.11) as well as last year average (1.16). For medium projects,
the indicator value is slightly decreased i.e. (0.09) as compared to last year average.
In case of minor projects it has doubled (0.14) as compared to last year i.e. (0.07).

Indicator – XII: Assessment Recovery Ratio (Irrigation): Unit: Ratio
0
0.2
0.4
0.6
0.8
1
Major 0.49 0.40 0.37 0.54 0.54 0.53
Medium 0.43 0.51 0.33 0.56 0.60 0.60
Minor 0.43 0.51 0.56
2006‐07 2007‐08 2008‐09 2009‐10 2010‐11 2011‐12
The performance of major projects is somewhat reduced as that of last year’s
performance and it is below the State target (1.00). In case of minor projects the
indicator value for irrigation & non-irrigation is calculated in combination, hence it is
not mentioned.
Indicator – XII: Assessment Recovery Ratio (Non Irrigation): Unit: Ratio
0
0.2
0.4
0.6
0.8
1
Major 0.84 0.88 0.73 0.93 0.79 0.92
Medium 0.82 0.86 0.79 0.83 0.86 0.88
Minor 0.75 0.97 0.79
2006‐07 2007‐08 2008‐09 2009‐10 2010‐11 2011‐12
There is increase in the performance of major and medium projects for current
year and still it is below the State target (1.00). The reasons are mentioned in
executive summary.

Chapter - 3
Benchmarking of Irrigation Projects
Benchmarking can be defined as a systematic process for securing continual improvement through comparison with relevant and achievable internal or external norms and standards. 3.1.0 Background
This is the Eleventh consecutive report of benchmarking of irrigation projects in the State with 1241 projects and 12 indicators. The plan group wise number of projects selected for benchmarking during 2011-12 is as follows.
Sr. No.
Plan Group Major Medium Minor Total
1 Highly Deficit 1 30 173 204 2 Deficit 13 61 266 340 3 Normal 23 34 257 314 4 Surplus 3 26 104 133 5 Abundant 9 12 229 250 Total 49 163 1029 1241
3.2. 0 About this report Following 12 indicators are selected for benchmarking in 2011-12.
Sr. No.
Indicator No
Title of Indicator
System Performance 1 I Annual Irrigation Water Supply Per Unit Irrigated Area 2 I a Annual Area Irrigated per unit of water Supplied 3 II Potential Created and Utilised
Agricultural Productivity 4 III Output (Agricultural Production) Per Unit Irrigated Area 5 IV Output (Agricultural Production) Per Unit Irrigation Water Supply
Financial Aspects 6 V Cost Recovery Ratio 7 VI Total O&M Cost Per Unit Area 8 VII Total O&M Cost Per Unit Volume Of Water Supplied 9 VIII Revenue Per Unit Volume Of Water Supplied 10 XII(I) Assessment Recovery Ratio Irrigation 11 XII (NI) Assessment Recovery Ratio Non Irrigation
Social Aspects 12 XI Equity Performance
Indicator values for “Last year LY” in this report may be different from values for “This year TY” in the report for 2010-11 due to addition or transfer of projects amongst circles.

3.2.0 Methodology The data presented in this report is based on information collected from each of
the circle in-charge of the project. Following process was used in developing the report.
• Irrigation projects of different categories viz. major (CCA more than 10000 Ha), medium (CCA more than 2000 Ha and below 10000 Ha) and minor (CCA less than 2000 Ha) are considered.
• Data is collected in template files from the concerned project authorities and analyzed in MWRDC Office. An explanatory note containing detailed instructions about working out the figures of different indicators was issued to field officers.
• The data about water use and area irrigated is co-related with water accounts (2011-12) of relevant projects.
• The presentation for every indicator is done with past (5 year average), recent past (2010-11) and present year (2011-12) in order to compare the performance with predecessors as well as own performance of last year.
• The draft report is scrutinized in MWRDC, WALMI Aurangabad & WRD, Mantralaya, Mumbai.
• Reasons for deviation from last year’s performance and State norm are called from each circle.
• Based on performance during the year 2011-12, indicator wise average performance is evaluated for the plan group of circles under consideration, setting aside the exceptionally high/low values (Appendix III).
• State targets for indicator No III & IV are set as per plan group. However, for other Indicators, State target value is common for all plan groups. The targets are different for major, medium & minor projects for indicator no I, I a, VI, VII, & VIII.
• For financial indicator of output per unit irrigated area and output per unit irrigation water supply, prices of year 1998-99 are considered to obviate effect of price rise.
• Some circles are not having all types of projects i.e., major, medium or minor projects; therefore, only relevant circles are shown in graphs of each indicator. Thus total of circles may not tally in relevant graphs, for example for major projects category, there are only 17 circles.
• Indicator wise performance of the State is given in chapter 4.
3.3.0 Overview of Irrigation Projects An overview showing details such as sub basin, designed storage, Command Area, crops grown, etc. is enclosed as Appendix IV. 3.4.0 Benchmarking of WUA
Till June 2011, potential to the tune of 4.535 Mha has been created at State level. By April 2012, in all 2989 WUA are formed for an area of 11.66 Lakh Ha. Out of these, 1559 WUA are formed as per MMISF Act 2005, with an area of 6.75 Lakh Ha and remaining 1410 WUA are formed as per Maharashtra Co-operative Act of 1960 with an area of 4.91 Lakh Ha. Benchmarking of 12 WUA with 9 indicators is carried out.

Chapter - 4 Performance Indicators
4.0.0 As stated earlier, Chapter 3 of this report provides an idea about indicators relevant with the five domains, mentioned below.
a. System Performance
b. Agricultural Productivity
c. Financial Aspects
d. Social Aspects
4.1.0 System Performance
Providing facility of water for irrigation and other purposes is the main function of the project authorities. The water distribution system is influenced by physical, climatic, economic and other factors. In particular, the prevailing climatic conditions largely determine both, the available water resources and the crop water requirements in any season. The main task of the project in-charge is to manage the system so as to optimize the use of available resources in order to meet sanctioned quota in an effective and efficient manner.
4.1.1 Annual Irrigation Water Supply per Unit Irrigated Area
Annual irrigation water supply per unit irrigated area is the total quantity of water supplied for irrigation in all the seasons of a year compared to the total area irrigated in Kharif, Rabi & HW on canal, reservoir and river during irrigation year.
Annual irrigation water supply per unit irrigated area varies with water availability, cropping pattern, climate, soil type, system conditions, system management etc.
As a measure of efficiency of irrigation system, State target of 7692 cum/ha is set for major and medium projects and 6667 cum/ha for minor projects.
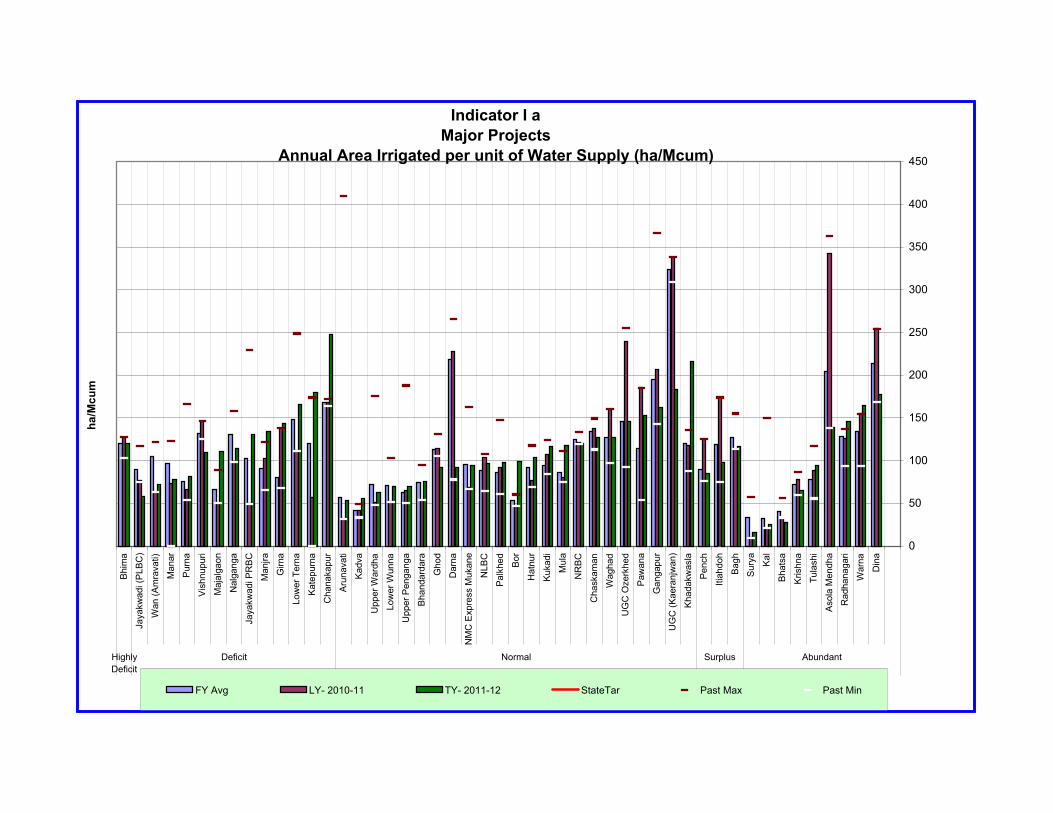
4.1.2 Annual Area irrigated per unit of water supplied (Ha./Mm3)
Area irrigated per unit of water supplied during Rabi season as 150 ha/Mcum and during H/W season is 110 ha/Mcum is set as target.
4.1.3 Potential Utilized & Created
This is the ratio of potential utilized (crop area measured) to created irrigation potential of the project. Crop area irrigated on canal, reservoir, wells, river in the command area is considered as potential utilization.
The irrigation potential created through large investments should be fully utilized. However, the utilization is governed by the availability of water in the reservoirs. Therefore, calculation of effective irrigation potential is made proportionate to availability of water for irrigation in that year.

4.2.0 Agricultural Productivity
In Maharashtra, more than 55% population depends on agriculture, thus production per unit area as well as per unit water is vital for State’s economy.
For this domain the indicators chosen are
1) Output per unit irrigated area.
2) Output per unit irrigation water supply.
4.2.1 Output per Unit Irrigated Area
Output per unit irrigated area is the output in rupees of agricultural production from irrigated area. Here the area irrigated means potential utilized.
As the population grows, the land holding per capita goes on reducing. Secondly, there are some constraints to bring additional lands under irrigation. Thus it is important that the output per unit area has to be increased with efficient water and land management, improved seeds and adoption of latest Agriculture technology.
The efforts have to be made to increase output by diversification of cropping pattern, better farm practices and judging the market needs. However, water is the only input in agriculture on which service provider has control. Therefore to have an idea about trend of production in the command, which depends upon timely supply of water in adequate quantity, this indicator has been adopted. The yield data for the year of various crops is collected from agriculture department. The market prices are obtained from Agricultural Produce Market Committees located in each taluka. In respect of sugarcane, prices are obtained from sugar factories in the command area and for cotton, from Cotton Federation. The prices of 1998-99 are considered as base prices for all the remaining years & output is worked out accordingly. The plan group wise targets set for different categories of projects are given in Appendix-II.
4.2.2 Output per Unit Irrigation Water Supply
Output per unit irrigation water supply is value in Rupees of agricultural production from irrigated area compared to total quantity of water supplied for irrigation. The output per unit irrigation water supply is an indicator of optimal use of water.
4.3 Financial Performance
Any system is to be termed as economically self-sustainable if the yearly O&M expenditure incurred on the project is met from its own revenue.
In Maharashtra, the water charges are recovered for all uses to encourage efficient water use. Presently, the practice of volumetric supply is in use for WUA, Domestic and Industrial water supply.
The indicators chosen for financial performance are given below.
1) Cost Recovery Ratio
2) Total O&M Cost per unit area
3) Total O&M Cost per unit Volume of Water Supplied
4) Revenue per unit water supplied
5) Assessment Recovery Ratio (Irrigation & Non Irrigation)

4.3.1 Cost Recovery Ratio
It is the ratio of recovery of water charges to the cost of providing the service. Recovery of water charges and O&M cost incurred during the period of irrigation year i.e. 1st July 2011 to 30th June 2012 is considered. Secondly the operation cost includes the salary of technical & ministerial staff working on irrigation management irrespective of its establishment type (i.e. Regular Temporary/Converted Regular Temporary/Work Charged/Daily rated). It is imperative to devise water rates and mechanism for recovery of water charges for irrigation use in such a manner to meet, at least, annual cost of management, O&M of system and recovery of some portion of capital investment on the projects in order to make the system self sustainable. Theoretically the cost recovery ratio should be at least equal to one.
Due to the efforts taken at all levels the recovery of water charges has improved and the O&M cost is comparatively low. This has resulted in enhancing the cost recovery ratio more than one.
4.3.2 Total O&M Cost per Unit Area
Total O&M cost per unit area is the ratio of total O&M cost incurred for management of the system and area irrigated (potential utilised) during the irrigation year. The total O&M cost includes cost of maintenance as well as all types of establishment charges. The annual maintenance cost incurred does not include cost of modernization and special repairs. Establishment charges include salary paid to staff working up to a management section.
The O&M cost per unit area should be as minimum as possible.
GOM has prescribed yearly O&M norms per hectare excluding establishment cost. The O&M cost per unit area is more in projects where there is less irrigation compared to created potential.
4.3.3 Total O&M Cost per Unit Water Supplied
Total O&M cost per unit water supplied is obtained by dividing total O&M cost by total quantity of water supplied for irrigation and non-irrigation use during the year.
Total O&M cost per unit volume of water supplied should be as minimum as possible to achieve economy in supply.
4.3.4 Revenue per Unit Water Supplied
It is the ratio of total revenue and quantity of water supplied for irrigation & non irrigation use during the irrigation year.
Revenue per unit volume of water supplied is very important measure as every drop of water is to be used efficiently and economically. The ratio also gives an idea about revenue realized against actual water supplied. The indicator will have more importance once the water is supplied on volumetric basis.
4.3.5 Assessment Recovery Ratio
This indicator is split up into two components viz.
a) Irrigation
b) Non Irrigation

In case of both the uses, there are arrears of water charges in many projects due to some or other reasons, one of the reasons being postponement of recovery during draught years.
It is the ratio of recovery of water charges during the irrigation year 2011-12 and assessment of charges for Kharif & Rabbi of 2011-12 for irrigation and for Hot Weather of 2010-11. For non-irrigation purpose assessment for water used during the year 2011-12 is considered.
The purpose of introducing this indicator is to check whether the water charges assessed during the irrigation year (1 July to 30 June) are totally recovered or not. For this indicator, recovery of arrears is not considered.
4.4 Environmental Aspects
4.4.1 Land Damage Index
Land damage index is expressed as percentage of land damaged to irrigable command area of the project.
The lands under irrigation become saline or waterlogged due to excessive use of water resulting in low productivity. This problem is faced in areas where high water intensive crops are grown year after year with unscientific methods of irrigation like flooding. Water logging and salinity occur in soils with poor drain ability. In Maharashtra, black cotton soil, which is highly impervious, is found on extensive area. Directorate Irrigation Research & Development, Pune is regularly monitoring & taking remedial measures for reclamation of damaged lands in commands of projects.
From this year this Indicator has not been included in the report as per the directions of Core Group, Govt. of Maharashtra.
4.5 Social Aspects
4.5.1 Equity Performance
Most of the schemes are gravity systems with canals and distribution system. The command area is divided equally as head, middle & tail reaches. Equity performance means ratio of sum of actual area irrigated in all three seasons (canal flow and lifts on canal) to projected irrigable command area in head, middle and tail reaches. It is expressed as percentage. This indicator gives clear picture as to whether or not the irrigation facility is provided equitably to head; middle & tail reach farmers in command area.
The benefit of irrigation should be given to the beneficiaries in head, middle & tail reach equitably. Ideally for equity, this ratio should be equal to one for head, middle as well as tail reaches.

Major Project

Plangroup Circle FY Avg LY 2010-11 TY 2011-12 Past Max Past Min AVG Per State TarHighly Deficit CADA Solapur 8601 7851 8302 9734 7851 8302Deficit AIC Akola 7373 12583 7163 12583 5972
BIPC Buldhana 9426 15908 5369 15908 8210CADA Abad 11012 13009 17162 13238 8541CADA Beed 11383 14812 7998 14812 8052CADA Jalgaon 13028 7237 6990 14749 7237CADA Nashik 5972 5968 4028 6119 5799NIC Nanded 12148 13264 11924 13970 6479
Normal AIC Abad 11136 14632 10550 14862 6130CADA Jalgaon 11564 13104 9619 14433 8499CADA Nagpur 14712 19281 14446 19281 9663CADA Nashik 11106 11923 9685 12868 8614CADA Pune 9706 9143 8997 11244 7937CIPC Chandrapur 18506 21342 10134 21342 16579NIC Nanded 16001 15431 14274 19785 5320PIC Pune 8852 8542 7968 9859 7898UWPC Amravati 14989 19709 15947 20665 5696YIC Yavatmal 15245 31962 18743 31962 2440
Surplus CADA Nagpur 10338 7810 10233 11806 7810 10233Abundant CADA Pune 14184 12804 15273 16784 11585
CIPC Chandrapur 5157 3458 6413 6578 3458SIC Sangli 8971 8403 6695 10367 7788TIC Thane 26549 48884 46126 48884 18712
Avg Per - zero value and value exeeding three times the state target are excluded.
7692
11680
9630
8600
Indicator IMajor Projects
Annual Irrigation Water Supply per unit Irrigated Area (cum/ha)
0
2000
4000
6000
8000
10000
12000
14000
16000
18000
20000
CAD
A So
lapu
r
AIC
Ako
la
BIPC
Bul
dhan
a
CAD
A Ab
ad
CAD
A Be
ed
CAD
A Ja
lgao
n
CAD
A N
ashi
k
NIC
Nan
ded
AIC
Aba
d
CAD
A Ja
lgao
n
CAD
A N
agpu
r
CAD
A N
ashi
k
CAD
A Pu
ne
CIP
CC
hand
rapu
r
NIC
Nan
ded
PIC
Pun
e
UW
PCAm
rava
ti
YIC
Yav
atm
al
CAD
A N
agpu
r
CAD
A Pu
ne
CIP
CC
hand
rapu
r
SIC
San
gli
TIC
Tha
ne
HighlyDeficit
Deficit Normal Surplus Abundant
cum
/ha
FY Avg LY 2010-11 TY 2011-12 StateTar Past Max Past Min
0
2000
4000
6000
8000
10000
12000
14000
16000
18000
20000
Bhim
a
Ch
an
aka
pu
r
Kate
purn
a
Lo
we
r T
ern
a
Gir
na
Man
jra
Ja
ya
kw
adi P
RB
C
Na
lgan
ga
Maja
lgao
n
Vis
hnup
uri
Purn
a
Man
ar
Wa
n (
Am
rava
ti)
Ja
yakw
adi (P
LB
C)
Kha
da
kw
asla
UG
C (
Ka
era
njw
an)
Ga
ng
ap
ur
Pa
wa
na
UG
C O
ze
rkh
ed
Wa
gha
d
Ch
aska
ma
n
NR
BC
Mula
Kukadi
Ha
tnu
r
Bor
Palk
hed
NL
BC
NM
C E
xp
ress M
uka
ne
Da
rna
Gh
od
Bh
an
da
rda
ra
Up
pe
r P
en
ga
ng
a
Lo
we
r W
unn
a
Up
pe
r W
ard
ha
Kad
va
Aru
na
vati
Bag
h
Itia
hd
oh
Pen
ch
Din
a
Wa
rna
Ra
dh
ana
ga
ri
Aso
la M
en
dh
a
Tula
shi
Kri
sh
na
Bha
tsa
Kal
Sury
a
Highly Deficit Deficit Normal Surplus Abundant
cu
m/h
a
Indicator I Major Projects
Annual Irrigation Water Supply per unit Irrigated Area (cum/ha)
FY Avg LY- 2010-11 TY- 2011-12 StateTar Past Max Past Min
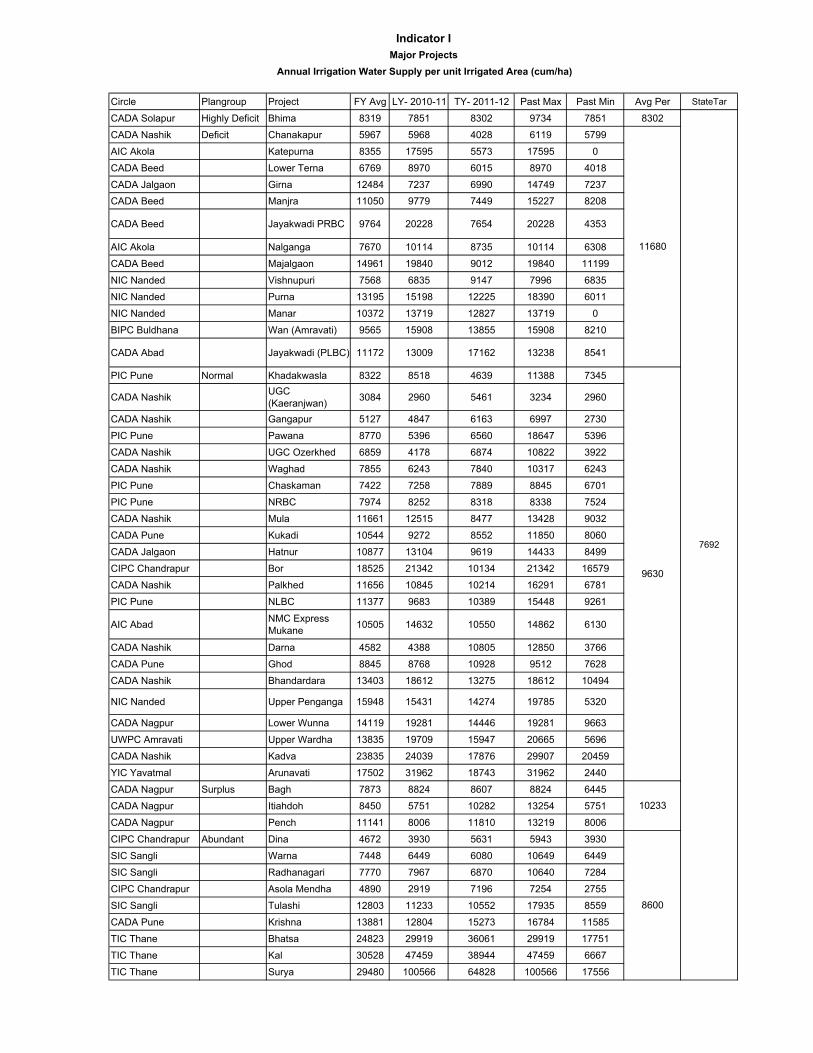
Circle Plangroup Project FY Avg LY- 2010-11 TY- 2011-12 Past Max Past Min Avg Per StateTar
CADA Solapur Highly Deficit Bhima 8319 7851 8302 9734 7851 8302
CADA Nashik Deficit Chanakapur 5967 5968 4028 6119 5799
AIC Akola Katepurna 8355 17595 5573 17595 0
CADA Beed Lower Terna 6769 8970 6015 8970 4018
CADA Jalgaon Girna 12484 7237 6990 14749 7237CADA Beed Manjra 11050 9779 7449 15227 8208
CADA Beed Jayakwadi PRBC 9764 20228 7654 20228 4353
AIC Akola Nalganga 7670 10114 8735 10114 6308
CADA Beed Majalgaon 14961 19840 9012 19840 11199
NIC Nanded Vishnupuri 7568 6835 9147 7996 6835
NIC Nanded Purna 13195 15198 12225 18390 6011
NIC Nanded Manar 10372 13719 12827 13719 0
BIPC Buldhana Wan (Amravati) 9565 15908 13855 15908 8210
CADA Abad Jayakwadi (PLBC) 11172 13009 17162 13238 8541
PIC Pune Normal Khadakwasla 8322 8518 4639 11388 7345
CADA Nashik UGC (Kaeranjwan) 3084 2960 5461 3234 2960
CADA Nashik Gangapur 5127 4847 6163 6997 2730
PIC Pune Pawana 8770 5396 6560 18647 5396
CADA Nashik UGC Ozerkhed 6859 4178 6874 10822 3922
CADA Nashik Waghad 7855 6243 7840 10317 6243
PIC Pune Chaskaman 7422 7258 7889 8845 6701
PIC Pune NRBC 7974 8252 8318 8338 7524
CADA Nashik Mula 11661 12515 8477 13428 9032
CADA Pune Kukadi 10544 9272 8552 11850 8060
CADA Jalgaon Hatnur 10877 13104 9619 14433 8499
CIPC Chandrapur Bor 18525 21342 10134 21342 16579
CADA Nashik Palkhed 11656 10845 10214 16291 6781
PIC Pune NLBC 11377 9683 10389 15448 9261
AIC Abad NMC Express Mukane 10505 14632 10550 14862 6130
CADA Nashik Darna 4582 4388 10805 12850 3766
CADA Pune Ghod 8845 8768 10928 9512 7628
CADA Nashik Bhandardara 13403 18612 13275 18612 10494
NIC Nanded Upper Penganga 15948 15431 14274 19785 5320
CADA Nagpur Lower Wunna 14119 19281 14446 19281 9663
UWPC Amravati Upper Wardha 13835 19709 15947 20665 5696
CADA Nashik Kadva 23835 24039 17876 29907 20459
YIC Yavatmal Arunavati 17502 31962 18743 31962 2440
CADA Nagpur Surplus Bagh 7873 8824 8607 8824 6445
CADA Nagpur Itiahdoh 8450 5751 10282 13254 5751
CADA Nagpur Pench 11141 8006 11810 13219 8006
CIPC Chandrapur Abundant Dina 4672 3930 5631 5943 3930
SIC Sangli Warna 7448 6449 6080 10649 6449
SIC Sangli Radhanagari 7770 7967 6870 10640 7284
CIPC Chandrapur Asola Mendha 4890 2919 7196 7254 2755
SIC Sangli Tulashi 12803 11233 10552 17935 8559
CADA Pune Krishna 13881 12804 15273 16784 11585
TIC Thane Bhatsa 24823 29919 36061 29919 17751
TIC Thane Kal 30528 47459 38944 47459 6667
TIC Thane Surya 29480 100566 64828 100566 17556
7692
Indicator IMajor Projects
Annual Irrigation Water Supply per unit Irrigated Area (cum/ha)
11680
9630
10233
8600
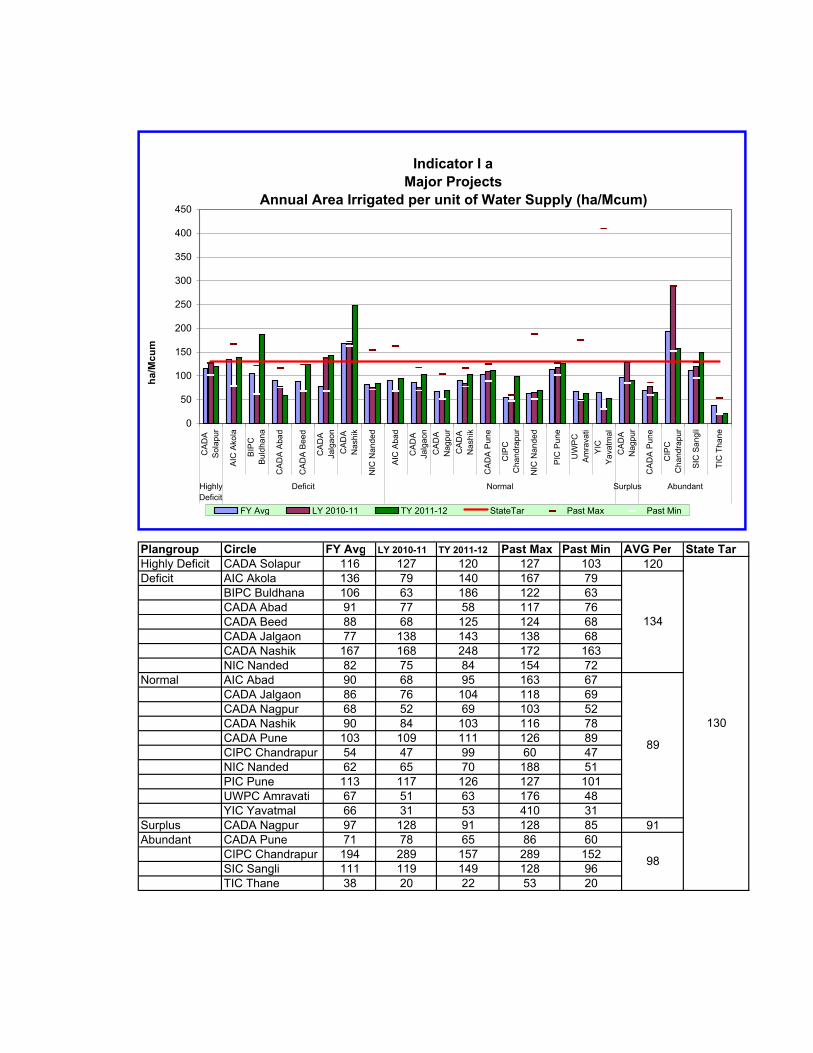
Plangroup Circle FY Avg LY 2010-11 TY 2011-12 Past Max Past Min AVG Per State TarHighly Deficit CADA Solapur 116 127 120 127 103 120Deficit AIC Akola 136 79 140 167 79
BIPC Buldhana 106 63 186 122 63CADA Abad 91 77 58 117 76CADA Beed 88 68 125 124 68CADA Jalgaon 77 138 143 138 68CADA Nashik 167 168 248 172 163NIC Nanded 82 75 84 154 72
Normal AIC Abad 90 68 95 163 67CADA Jalgaon 86 76 104 118 69CADA Nagpur 68 52 69 103 52CADA Nashik 90 84 103 116 78CADA Pune 103 109 111 126 89CIPC Chandrapur 54 47 99 60 47NIC Nanded 62 65 70 188 51PIC Pune 113 117 126 127 101UWPC Amravati 67 51 63 176 48YIC Yavatmal 66 31 53 410 31
Surplus CADA Nagpur 97 128 91 128 85 91Abundant CADA Pune 71 78 65 86 60
CIPC Chandrapur 194 289 157 289 152SIC Sangli 111 119 149 128 96TIC Thane 38 20 22 53 20
89
134
98
130
Indicator I aMajor Projects
Annual Area Irrigated per unit of Water Supply (ha/Mcum)
0
50
100
150
200
250
300
350
400
450C
AD
AS
olap
ur
AIC
Ako
la
BIP
CB
uldh
ana
CA
DA
Aba
d
CA
DA
Bee
d
CA
DA
Jalg
aon
CA
DA
Nas
hik
NIC
Nan
ded
AIC
Aba
d
CA
DA
Jalg
aon
CA
DA
Nag
pur
CA
DA
Nas
hik
CA
DA
Pun
e
CIP
CC
hand
rapu
r
NIC
Nan
ded
PIC
Pun
e
UW
PC
Am
rava
tiY
ICY
avat
mal
CA
DA
Nag
pur
CA
DA
Pun
e
CIP
CC
hand
rapu
r
SIC
San
gli
TIC
Tha
ne
HighlyDeficit
Deficit Normal Surplus Abundant
ha/M
cum
FY Avg LY 2010-11 TY 2011-12 StateTar Past Max Past Min
Indicator I aMajor Projects
Annual Area Irrigated per unit of Water Supply (ha/Mcum)
0
50
100
150
200
250
300
350
400
450
Bhi
ma
Jaya
kwad
i (P
LBC
)
Wan
(Am
rava
ti)
Man
ar
Pur
na
Vis
hnup
uri
Maj
alga
on
Nal
gang
a
Jaya
kwad
i PR
BC
Man
jra
Girn
a
Low
er T
erna
Kat
epur
na
Cha
naka
pur
Aru
nava
ti
Kad
va
Upp
er W
ardh
a
Low
er W
unna
Upp
er P
enga
nga
Bha
ndar
dara
Gho
d
Dar
na
NM
C E
xpre
ss M
ukan
e
NLB
C
Pal
khed Bor
Hat
nur
Kuk
adi
Mul
a
NR
BC
Cha
skam
an
Wag
had
UG
C O
zerk
hed
Paw
ana
Gan
gapu
r
UG
C (K
aera
njw
an)
Kha
dakw
asla
Pen
ch
Itiah
doh
Bag
h
Sur
ya Kal
Bha
tsa
Kris
hna
Tula
shi
Aso
la M
endh
a
Rad
hana
gari
War
na
Din
a
HighlyDeficit
Deficit Normal Surplus Abundant
ha/M
cum
FY Avg LY- 2010-11 TY- 2011-12 StateTar Past Max Past Min
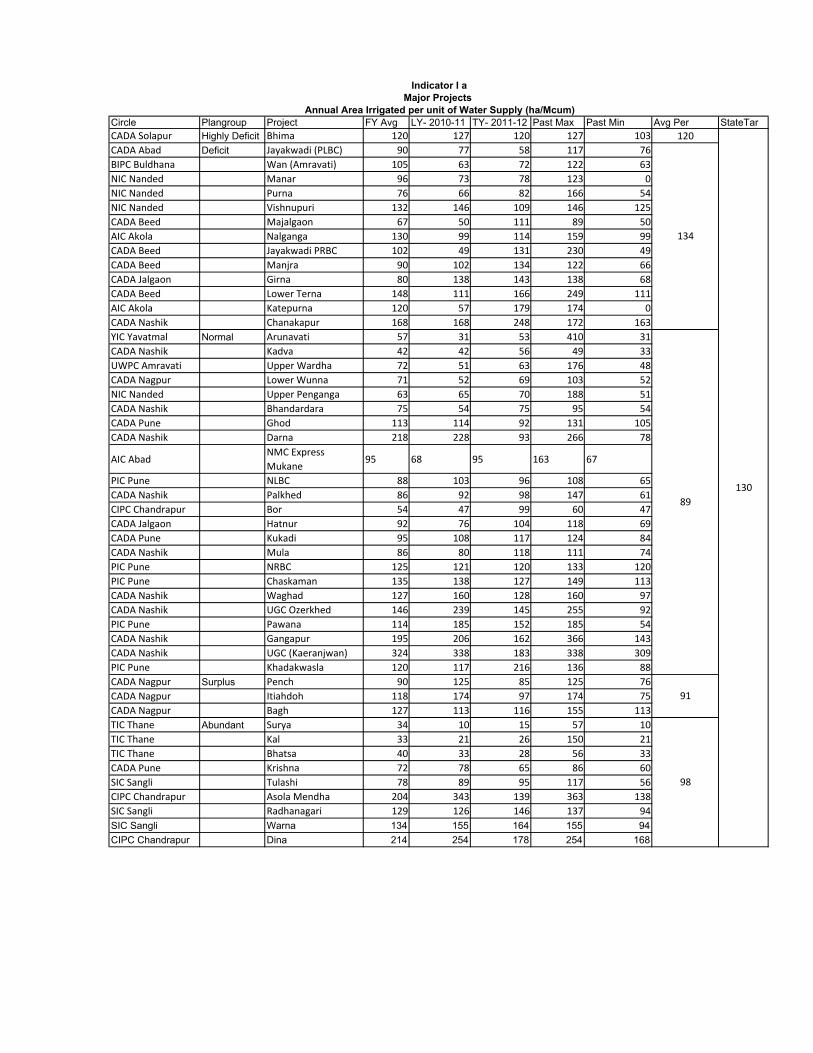
Circle Plangroup Project FY Avg LY- 2010-11 TY- 2011-12 Past Max Past Min Avg Per StateTarCADA Solapur Highly Deficit Bhima 120 127 120 127 103 120CADA Abad Deficit Jayakwadi (PLBC) 90 77 58 117 76BIPC Buldhana Wan (Amravati) 105 63 72 122 63NIC Nanded Manar 96 73 78 123 0NIC Nanded Purna 76 66 82 166 54NIC Nanded Vishnupuri 132 146 109 146 125CADA Beed Majalgaon 67 50 111 89 50AIC Akola Nalganga 130 99 114 159 99CADA Beed Jayakwadi PRBC 102 49 131 230 49CADA Beed Manjra 90 102 134 122 66CADA Jalgaon Girna 80 138 143 138 68CADA Beed Lower Terna 148 111 166 249 111AIC Akola Katepurna 120 57 179 174 0CADA Nashik Chanakapur 168 168 248 172 163YIC Yavatmal Normal Arunavati 57 31 53 410 31CADA Nashik Kadva 42 42 56 49 33UWPC Amravati Upper Wardha 72 51 63 176 48CADA Nagpur Lower Wunna 71 52 69 103 52NIC Nanded Upper Penganga 63 65 70 188 51CADA Nashik Bhandardara 75 54 75 95 54CADA Pune Ghod 113 114 92 131 105CADA Nashik Darna 218 228 93 266 78
AIC AbadNMC Express Mukane
95 68 95 163 67
PIC Pune NLBC 88 103 96 108 65CADA Nashik Palkhed 86 92 98 147 61CIPC Chandrapur Bor 54 47 99 60 47CADA Jalgaon Hatnur 92 76 104 118 69CADA Pune Kukadi 95 108 117 124 84CADA Nashik Mula 86 80 118 111 74PIC Pune NRBC 125 121 120 133 120PIC Pune Chaskaman 135 138 127 149 113CADA Nashik Waghad 127 160 128 160 97CADA Nashik UGC Ozerkhed 146 239 145 255 92PIC Pune Pawana 114 185 152 185 54CADA Nashik Gangapur 195 206 162 366 143CADA Nashik UGC (Kaeranjwan) 324 338 183 338 309PIC Pune Khadakwasla 120 117 216 136 88CADA Nagpur Surplus Pench 90 125 85 125 76CADA Nagpur Itiahdoh 118 174 97 174 75CADA Nagpur Bagh 127 113 116 155 113TIC Thane Abundant Surya 34 10 15 57 10TIC Thane Kal 33 21 26 150 21TIC Thane Bhatsa 40 33 28 56 33CADA Pune Krishna 72 78 65 86 60SIC Sangli Tulashi 78 89 95 117 56CIPC Chandrapur Asola Mendha 204 343 139 363 138SIC Sangli Radhanagari 129 126 146 137 94SIC Sangli Warna 134 155 164 155 94CIPC Chandrapur Dina 214 254 178 254 168
130
134
89
91
98
Indicator I aMajor Projects
Annual Area Irrigated per unit of Water Supply (ha/Mcum)
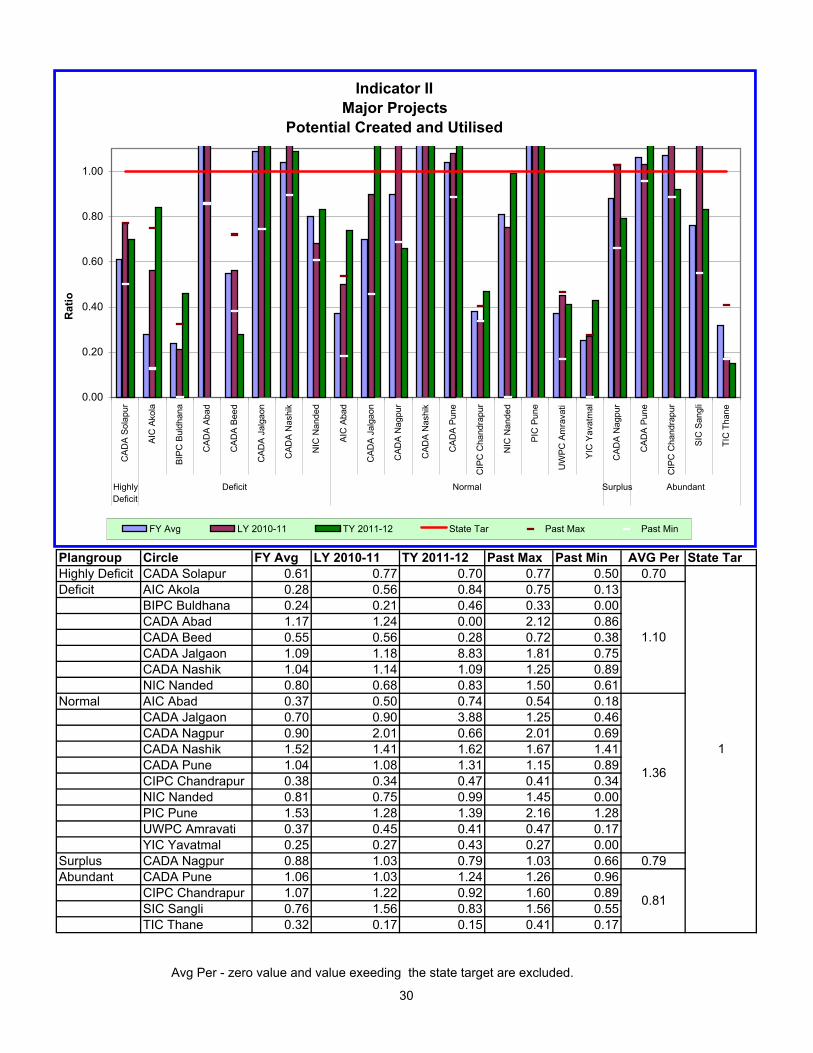
Plangroup Circle FY Avg LY 2010-11 TY 2011-12 Past Max Past Min AVG Per State TarHighly Deficit CADA Solapur 0.61 0.77 0.70 0.77 0.50 0.70Deficit AIC Akola 0.28 0.56 0.84 0.75 0.13
BIPC Buldhana 0.24 0.21 0.46 0.33 0.00CADA Abad 1.17 1.24 0.00 2.12 0.86CADA Beed 0.55 0.56 0.28 0.72 0.38CADA Jalgaon 1.09 1.18 8.83 1.81 0.75CADA Nashik 1.04 1.14 1.09 1.25 0.89NIC Nanded 0.80 0.68 0.83 1.50 0.61
Normal AIC Abad 0.37 0.50 0.74 0.54 0.18CADA Jalgaon 0.70 0.90 3.88 1.25 0.46CADA Nagpur 0.90 2.01 0.66 2.01 0.69CADA Nashik 1.52 1.41 1.62 1.67 1.41CADA Pune 1.04 1.08 1.31 1.15 0.89CIPC Chandrapur 0.38 0.34 0.47 0.41 0.34NIC Nanded 0.81 0.75 0.99 1.45 0.00PIC Pune 1.53 1.28 1.39 2.16 1.28UWPC Amravati 0.37 0.45 0.41 0.47 0.17YIC Yavatmal 0.25 0.27 0.43 0.27 0.00
Surplus CADA Nagpur 0.88 1.03 0.79 1.03 0.66 0.79Abundant CADA Pune 1.06 1.03 1.24 1.26 0.96
CIPC Chandrapur 1.07 1.22 0.92 1.60 0.89SIC Sangli 0.76 1.56 0.83 1.56 0.55TIC Thane 0.32 0.17 0.15 0.41 0.17
Avg Per - zero value and value exeeding the state target are excluded.
0.81
1
1.10
1.36
Indicator IIMajor Projects
Potential Created and Utilised
0.00
0.20
0.40
0.60
0.80
1.00
CAD
A So
lapu
r
AIC
Ako
la
BIPC
Bul
dhan
a
CAD
A Ab
ad
CAD
A Be
ed
CAD
A Ja
lgao
n
CAD
A N
ashi
k
NIC
Nan
ded
AIC
Aba
d
CAD
A Ja
lgao
n
CAD
A N
agpu
r
CAD
A N
ashi
k
CAD
A Pu
ne
CIP
C C
hand
rapu
r
NIC
Nan
ded
PIC
Pun
e
UW
PC A
mra
vati
YIC
Yav
atm
al
CAD
A N
agpu
r
CAD
A Pu
ne
CIP
C C
hand
rapu
r
SIC
San
gli
TIC
Tha
ne
HighlyDeficit
Deficit Normal Surplus Abundant
Rat
io
FY Avg LY 2010-11 TY 2011-12 State Tar Past Max Past Min
30

Indicator IIMajor Projects
Potential Created and Utilised
0.00
0.20
0.40
0.60
0.80
1.00
Bhim
aJa
yakw
adi
Jaya
kwad
iM
ajal
gaon
Wan
Low
er T
erna
Man
arM
anjra
Vish
nupu
riN
alga
nga
Kate
purn
aPu
rna
Cha
naka
pur
Girn
aU
pper
Arun
avat
iBo
rLo
wer
Wun
naC
hask
aman
NM
C E
xpre
ssPa
wan
aU
pper
Mul
aKh
adak
was
laKa
dva
UG
CKu
kadi
Palk
hed
NR
BCG
hod
Wag
had
UG
CD
arna
NLB
CBh
anda
rdar
aH
atnu
rG
anga
pur
Penc
hBa
ghIti
ahdo
hBh
atsa Ka
lSu
rya
Tula
shi
War
naD
ina
Asol
aR
adha
naga
ri
HighlyDeficit
Deficit Normal Surplus Abundant
Rat
io
Fy Avg LY- 2010-11 TY- 2011-12 State Tar

Circle PlanGroup Project Fy Avg LY- 2010-11 TY- 2011-12 Past Max Past Min Avg Per State TarCADA Solapur Highly Deficit Bhima 0.58 0.77 0.70 0.77 0.50 0.70CADA Abad Deficit Jayakwadi (PLBC) 1.28 1.24 0.00 2.12 0.86CADA Beed Jayakwadi PRBC 0.77 1.52 0.00 1.52 0.33CADA Beed Majalgaon 0.35 0.26 0.11 0.69 0.15BIPC Buldhana Wan (Amravati) 0.23 0.21 0.33 0.33 0.00CADA Beed Lower Terna 0.42 0.28 0.43 0.85 0.28NIC Nanded Manar 0.51 0.39 0.56 0.85 0.00CADA Beed Manjra 0.72 0.79 0.61 0.87 0.60NIC Nanded Vishnupuri 0.73 1.08 0.65 1.34 0.18AIC Akola Nalganga 0.20 0.81 0.80 0.81 0.00AIC Akola Katepurna 0.45 0.35 0.91 0.59 0.00NIC Nanded Purna 0.90 0.72 1.00 2.30 0.68CADA Nashik Chanakapur 1.05 1.14 1.09 1.25 0.89CADA Jalgaon Girna 1.07 1.18 8.83 1.81 0.75UWPC Amravati Normal Upper Wardha 0.38 0.45 0.41 0.47 0.17YIC Yavatmal Arunavati 0.25 0.27 0.43 0.27 0.00CIPC Chandrapur Bor 0.38 0.34 0.47 0.41 0.34CADA Nagpur Lower Wunna 0.92 2.01 0.66 2.01 0.69PIC Pune Chaskaman 0.81 0.78 0.73 0.94 0.60AIC Abad NMC Express
Mukane0.36 0.50 0.74 0.54 0.18
PIC Pune Pawana 0.40 0.39 0.76 0.44 0.27NIC Nanded Upper Penganga 0.88 0.75 0.99 1.45 0.00CADA Nashik Mula 1.16 1.09 1.01 1.36 1.06PIC Pune Khadakwasla 1.13 1.13 1.03 1.25 0.48CADA Nashik Kadva 1.06 1.27 1.14 1.27 0.75CADA Nashik UGC (Kaeranjwan) 1.64 1.62 1.18 1.66 1.62
CADA Pune Kukadi 0.96 1.04 1.28 1.06 0.77CADA Nashik Palkhed 1.55 1.23 1.29 1.78 1.23PIC Pune NRBC 1.68 1.19 1.43 3.44 1.19CADA Pune Ghod 1.73 1.29 1.45 2.41 1.29CADA Nashik Waghad 1.90 1.58 1.56 2.16 1.58CADA Nashik UGC Ozerkhed 2.28 1.46 1.87 2.99 1.46CADA Nashik Darna 0.26 0.61 2.20 1.37 0.00PIC Pune NLBC 2.38 2.58 2.58 2.60 1.91CADA Nashik Bhandardara 3.12 2.80 3.37 3.82 2.80CADA Jalgaon Hatnur 0.67 0.90 3.88 1.25 0.46CADA Nashik Gangapur 1.78 1.49 7.15 2.07 1.34CADA Nagpur Surplus Pench 0.77 0.90 0.71 0.91 0.53CADA Nagpur Bagh 1.07 1.32 1.00 1.32 1.00CADA Nagpur Itiahdoh 1.07 1.29 1.03 1.29 1.00TIC Thane Abundant Bhatsa 0.32 0.28 0.07 0.47 0.28TIC Thane Kal 0.46 0.13 0.16 1.00 0.13TIC Thane Surya 0.23 0.13 0.19 0.35 0.13SIC Sangli Tulashi 0.56 0.48 0.71 0.64 0.48SIC Sangli Warna 0.98 7.42 0.73 7.42 0.52CIPC Chandrapur Dina 1.24 1.59 0.89 1.60 1.00CIPC Chandrapur Asola Mendha 0.98 0.96 0.97 1.61 0.77SIC Sangli Radhanagari 0.97 0.97 1.01 1.01 0.96CADA Pune Krishna 1.08 1.03 1.24 1.26 0.96
Indicator IIMajor Projects
Potential Created and Utilised
1
1.10
1.36
0.79
0.81

Plangroup Circle FY Avg LY 2010-11 TY 2011-12 Past Max Past Min AVG Per State TarHighly Deficit CADA Solapur 46562 49453 37334 52374 43061 37334 23000Deficit AIC Akola 36541 32001 30776 42150 17633
BIPC Buldhana 17445 20308 65653 20593 14393CADA Abad 27483 29272 30396 36429 20282CADA Beed 28852 27333 53318 47369 19300CADA Jalgaon 15466 11798 28852 19250 11798CADA Nashik 22014 21830 23952 22827 21647NIC Nanded 20354 21386 17801 21386 19187
Normal AIC Abad 21862 23388 58319 25191 17968CADA Jalgaon 45630 42658 39139 77415 36315CADA Nagpur 10995 14175 16089 14823 1871CADA Nashik 60853 76625 89906 76625 40213CADA Pune 30007 32859 32524 45757 19262CIPC Chandrapur 20462 17585 12443 24650 17535NIC Nanded 24497 21869 22426 30010 21749PIC Pune 32592 32655 69349 34089 30298UWPC Amravati 27042 27971 34454 30047 24058YIC Yavatmal 16482 4981 6271 27839 4981
Surplus CADA Nagpur 26677 19422 7865 46835 19422 7865 25000Abundant CADA Pune 24645 24258 22083 26705 23352
CIPC Chandrapur 16010 2450 13948 24602 2450SIC Sangli 58486 58622 63269 64516 55495TIC Thane 77802 286435 95372 286435 35582
31285
Avg Per - zero value and value exeeding twice the state target are excluded.
23000
26000
32000
51841
29140
Indicator IIIMajor Projects
Output per unit Irrigated Area (Rs/ha)
0
5000
10000
15000
20000
25000
30000
35000
40000C
AD
A S
olap
ur
AIC
Ako
la
BIP
C B
uldh
ana
CA
DA
Aba
d
CA
DA
Bee
d
CA
DA
Jal
gaon
CA
DA
Nas
hik
NIC
Nan
ded
AIC
Aba
d
CA
DA
Jal
gaon
CA
DA
Nag
pur
CA
DA
Nas
hik
CA
DA
Pun
e
CIP
C C
hand
rapu
r
NIC
Nan
ded
PIC
Pun
e
UW
PC
Am
rava
ti
YIC
Yav
atm
al
CA
DA
Nag
pur
CA
DA
Pun
e
CIP
C C
hand
rapu
r
SIC
San
gli
TIC
Tha
ne
HighlyDeficit
Deficit Normal Surplus Abundant
Rs/
ha
FY Avg LY 2010-11 TY 2011-12 StateTar Past Max Past Min

Indicator IIIMajor Projects
Output per unit Irrigated Area
0
5000
10000
15000
20000
25000
30000
35000
40000
Bhim
aPu
rna
Wan
(Am
rava
ti)C
hana
kapu
rLo
wer
Ter
naKa
tepu
rna
Girn
aJa
yakw
adi (
PLBC
)N
alga
nga
Vish
nupu
riM
anjra
Man
arJa
yakw
adi P
RBC
Maj
alga
onAr
unav
ati
Bor
Low
er W
unna
Upp
er P
enga
nga
Gho
dC
hask
aman
NR
BCPa
wan
aKu
kadi
Kadv
aU
pper
War
dha
Hat
nur
Dar
naG
anga
pur
Bhan
dard
ara
NM
C E
xpre
ss M
ukan
eM
ula
Khad
akw
asla
NLB
CPa
lkhe
dU
GC
(Kae
ranj
wan
)W
agha
dU
GC
Oze
rkhe
dPe
nch
Bagh
Itiah
doh
Din
aKr
ishn
aAs
ola
Men
dha
Kal
Sury
aTu
lash
iR
adha
naga
riW
arna
Bhat
sa
HighlyDeficit
Deficit Normal Surplus Abundant
Rs/
ha
FY Avg LY- 2010-11 TY- 2011-12 StateTar

Circle Plangroup Project FY Avg LY- 2010-11 TY- 2011-12 Past Max Past Min Avg Per StateTarCADA Solapur Highly Deficit Bhima 45210 49453 37334 52374 43063 37334 23000NIC Nanded Deficit Purna 19622 20931 8574 20948 17635BIPC Buldhana Wan (Amravati) 18365 20308 20094 20593 14393CADA Nashik Chanakapur 22096 21830 23952 22827 21647CADA Beed Lower Terna 28697 33094 26973 33094 25052AIC Akola Katepurna 39687 30029 27739 47049 0CADA Jalgaon Girna 14661 11798 28852 19250 11798CADA Abad Jayakwadi (PLBC) 29140 29272 30396 36429 20282AIC Akola Nalganga 31560 33002 32838 45215 17633NIC Nanded Vishnupuri 22809 21166 34305 26031 19126CADA Beed Manjra 32511 45197 37664 64528 10602NIC Nanded Manar 20779 23722 45209 23722 0CADA Beed Jayakwadi PRBC 13849 12109 45641 49897 9280CADA Beed Majalgaon 34989 38200 95678 42640 31467YIC Yavatmal Normal Arunavati 15144 4981 6271 27839 4981CIPC Chandrapur Bor 21296 17585 12443 24650 17535CADA Nagpur Lower Wunna 10518 14175 16089 14823 1871NIC Nanded Upper Penganga 23357 21869 22426 30010 21749CADA Pune Ghod 25687 29448 27128 29448 20462PIC Pune Chaskaman 14796 14043 27387 23664 14043PIC Pune NRBC 27394 27109 29234 30235 26963PIC Pune Pawana 58684 48341 33630 94443 41597CADA Pune Kukadi 26529 33839 33945 53569 18625CADA Nashik Kadva 32805 30669 34091 42292 30303UWPC Amravati Upper Wardha 27770 27971 34454 30047 24058CADA Jalgaon Hatnur 42441 42658 39139 77415 36315CADA Nashik Darna 45475 52414 43118 52414 40330CADA Nashik Gangapur 51226 45188 43985 65707 25485CADA Nashik Bhandardara 28959 31194 50319 35984 27603AIC Abad NMC Express Mukane 22508 23388 58319 25191 17968CADA Nashik Mula 32921 36145 59749 36145 31155PIC Pune Khadakwasla 44257 46298 95007 49667 42982PIC Pune NLBC 38776 41121 170280 43194 28355CADA Nashik Palkhed 115685 165158 224763 165158 45023CADA Nashik UGC (Kaeranjwan) 211413 210210 226289 212752 210210CADA Nashik Waghad 151222 119147 226524 174574 88552CADA Nashik UGC Ozerkhed 201922 303695 243590 303695 53408CADA Nagpur Surplus Pench 29938 19066 1406 56908 19066CADA Nagpur Bagh 24263 19950 19950 33250 19950CADA Nagpur Itiahdoh 24022 19914 21045 33250 19914CIPC Chandrapur Abundant Dina 13445 2450 2450 24700 2450CADA Pune Krishna 24210 24258 22083 26705 23352CIPC Chandrapur Asola Mendha 13947 2450 27040 24500 2450TIC Thane Kal 31879 31149 31454 100000 31149TIC Thane Surya 92840 549933 37592 549933 0SIC Sangli Tulashi 56227 48140 50105 72396 48140SIC Sangli Radhanagari 55711 46446 51930 67344 46446SIC Sangli Warna 54810 67696 75223 67696 49379TIC Thane Bhatsa 140563 206998 529697 206998 56454
Indicator IIIMajor Projects
Output per unit Irrigated Area
31285 23000
51841
7865
29140
26000
25000
32000
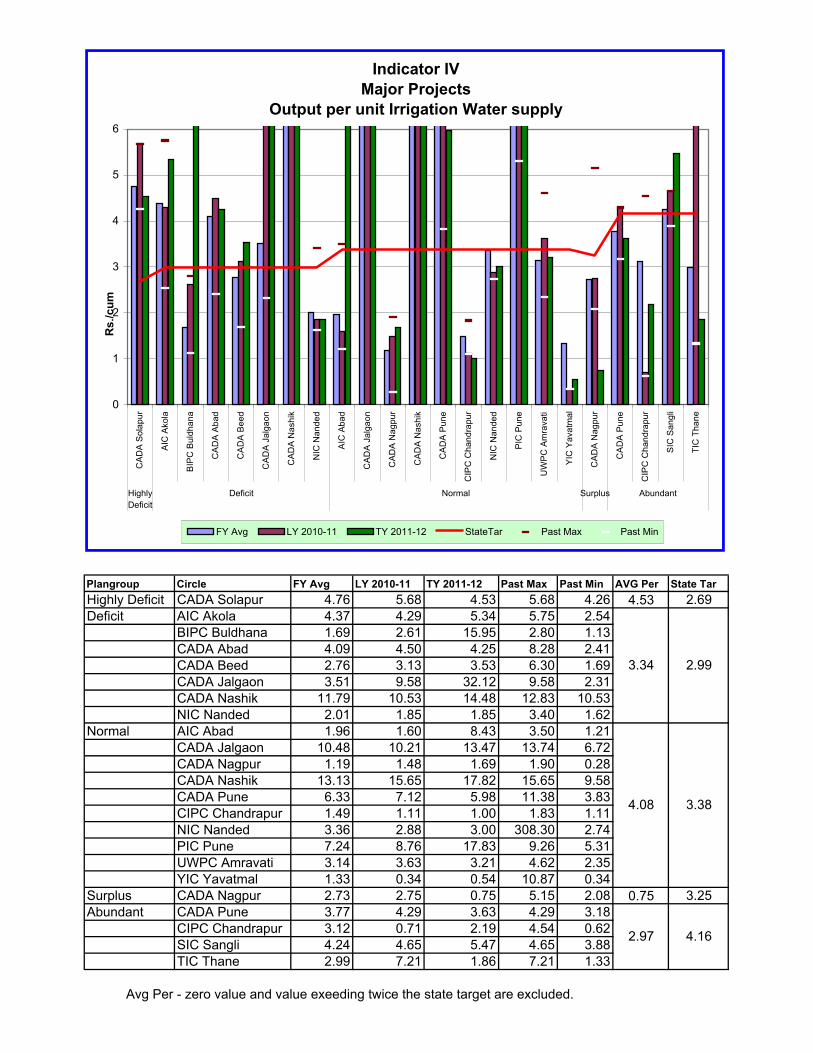
Plangroup Circle FY Avg LY 2010-11 TY 2011-12 Past Max Past Min AVG Per State TarHighly Deficit CADA Solapur 4.76 5.68 4.53 5.68 4.26 4.53 2.69Deficit AIC Akola 4.37 4.29 5.34 5.75 2.54
BIPC Buldhana 1.69 2.61 15.95 2.80 1.13CADA Abad 4.09 4.50 4.25 8.28 2.41CADA Beed 2.76 3.13 3.53 6.30 1.69CADA Jalgaon 3.51 9.58 32.12 9.58 2.31CADA Nashik 11.79 10.53 14.48 12.83 10.53NIC Nanded 2.01 1.85 1.85 3.40 1.62
Normal AIC Abad 1.96 1.60 8.43 3.50 1.21CADA Jalgaon 10.48 10.21 13.47 13.74 6.72CADA Nagpur 1.19 1.48 1.69 1.90 0.28CADA Nashik 13.13 15.65 17.82 15.65 9.58CADA Pune 6.33 7.12 5.98 11.38 3.83CIPC Chandrapur 1.49 1.11 1.00 1.83 1.11NIC Nanded 3.36 2.88 3.00 308.30 2.74PIC Pune 7.24 8.76 17.83 9.26 5.31UWPC Amravati 3.14 3.63 3.21 4.62 2.35YIC Yavatmal 1.33 0.34 0.54 10.87 0.34
Surplus CADA Nagpur 2.73 2.75 0.75 5.15 2.08 0.75 3.25Abundant CADA Pune 3.77 4.29 3.63 4.29 3.18
CIPC Chandrapur 3.12 0.71 2.19 4.54 0.62SIC Sangli 4.24 4.65 5.47 4.65 3.88TIC Thane 2.99 7.21 1.86 7.21 1.33
Avg Per - zero value and value exeeding twice the state target are excluded.
2.99
3.38
4.16
3.34
4.08
2.97
Indicator IVMajor Projects
Output per unit Irrigation Water supply
0
1
2
3
4
5
6C
AD
A S
olap
ur
AIC
Ako
la
BIP
C B
uldh
ana
CA
DA
Aba
d
CA
DA
Bee
d
CA
DA
Jal
gaon
CA
DA
Nas
hik
NIC
Nan
ded
AIC
Aba
d
CA
DA
Jal
gaon
CA
DA
Nag
pur
CA
DA
Nas
hik
CA
DA
Pun
e
CIP
C C
hand
rapu
r
NIC
Nan
ded
PIC
Pun
e
UW
PC
Am
rava
ti
YIC
Yav
atm
al
CA
DA
Nag
pur
CA
DA
Pun
e
CIP
C C
hand
rapu
r
SIC
San
gli
TIC
Tha
ne
HighlyDeficit
Deficit Normal Surplus Abundant
Rs.
/cum
FY Avg LY 2010-11 TY 2011-12 StateTar Past Max Past Min

Indicator IVMajor Projects
Output per unit Irrigation Water supply
0.00
1.00
2.00
3.00
4.00
5.00
6.00B
him
aP
urna
Jaya
kwad
i PR
BC
Wan
(Am
rava
ti)M
ajal
gaon
Jaya
kwad
i (P
LBC
)Lo
wer
Ter
naM
anar
Kat
epur
naV
ishn
upur
iM
anjra
Nal
gang
aC
hana
kapu
rG
irna
Aru
nava
tiB
orLo
wer
Wun
naU
pper
Pen
gang
aU
pper
War
dha
Gho
dP
awan
aK
adva
Kuk
adi
Cha
skam
anD
arna
NM
C E
xpre
ss M
ukan
eN
RBC
Mul
aB
hand
arda
raH
atnu
rG
anga
pur
Kha
dakw
asla
NLB
CU
GC
(Kae
ranj
wan
)W
agha
dP
alkh
edU
GC
Oze
rkhe
dP
ench
Itiah
doh
Bag
hD
ina
Kal
Sur
yaTu
lash
iK
rishn
aA
sola
Men
dha
Bha
tsa
Rad
hana
gari
War
na
HighlyDeficit
Deficit Normal Surplus Abundant
Rs.
/cum
FY Avg LY- 2010-11 TY- 2011-12 StateTar Past Max

Circle PlanGroup Project FY Avg LY- 2010-11 TY- 2011-12 Past Max Past Min Avg Per StateTarCADA Solapur Highly Deficit Bhima 4.84 5.68 4.53 5.68 4.26 4.53 2.69NIC Nanded Deficit Purna 1.98 1.55 0.84 4.06 1.35CADA Beed Jayakwadi PRBC 1.90 2.31 1.67 19.82 1.26BIPC Buldhana Wan (Amravati) 1.92 2.61 3.29 2.80 1.13CADA Beed Majalgaon 2.48 2.77 4.06 4.55 1.98CADA Abad Jayakwadi (PLBC) 4.61 4.50 4.25 8.28 2.41CADA Beed Lower Terna 3.75 3.26 4.48 6.05 3.16NIC Nanded Manar 2.34 2.33 4.68 3.31 0.00AIC Akola Katepurna 4.15 2.94 5.03 5.20 0.00NIC Nanded Vishnupuri 3.09 3.38 5.05 3.38 1.95CADA Beed Manjra 2.88 4.57 5.06 5.58 1.15AIC Akola Nalganga 4.60 5.44 5.53 5.75 2.54CADA Nashik Chanakapur 12.05 10.53 14.48 12.83 10.53CADA Jalgaon Girna 3.77 9.58 32.12 9.58 2.31YIC Yavatmal Normal Arunavati 1.19 0.34 0.54 10.87 0.34CIPC Chandrapur Bor 1.56 1.11 1.00 1.83 1.11CADA Nagpur Lower Wunna 1.21 1.48 1.69 1.90 0.28NIC Nanded Upper Penganga 3.27 2.88 3.00 308.30 2.74UWPC Amravati Upper Wardha 3.38 3.63 3.21 4.62 2.35CADA Pune Ghod 6.39 5.77 4.57 7.16 4.38PIC Pune Pawana 6.22 7.52 5.13 10.89 2.23CADA Nashik Kadva 5.54 5.43 5.64 8.57 5.34CADA Pune Kukadi 5.10 7.56 6.39 14.03 3.50PIC Pune Chaskaman 3.21 3.72 6.47 5.67 2.38CADA Nashik Darna 20.88 32.80 7.56 32.80 8.67AIC Abad NMC Express Mukane 2.14 1.60 8.43 3.50 1.21PIC Pune NRBC 7.59 8.65 8.79 8.65 5.44CADA Nashik Mula 4.84 5.20 9.10 7.40 4.06CADA Nashik Bhandardara 5.28 5.08 9.46 7.65 5.08CADA Jalgaon Hatnur 11.68 10.21 13.47 13.74 6.72CADA Nashik Gangapur 22.29 22.68 18.28 46.46 8.19PIC Pune Khadakwasla 9.68 10.22 29.14 14.03 4.30PIC Pune NLBC 7.38 8.99 30.76 9.80 4.91CADA Nashik UGC (Kaeranjwan) 83.81 83.74 51.21 83.89 83.74CADA Nashik Waghad 45.33 37.41 56.28 52.15 22.82CADA Nashik Palkhed 40.22 58.09 71.57 58.09 16.04CADA Nashik UGC Ozerkhed 114.74 229.47 81.40 229.47 32.16CADA Nagpur Surplus Pench 2.87 2.59 0.13 5.77 1.89CADA Nagpur Itiahdoh 3.04 4.47 2.05 4.47 1.88CADA Nagpur Bagh 3.10 2.31 2.37 5.16 2.31CIPC Chandrapur Abundant Dina 2.88 0.62 0.44 5.48 0.49TIC Thane Kal 1.04 0.66 0.81 1.24 0.66TIC Thane Surya 3.40 11.49 0.92 11.49 0.00SIC Sangli Tulashi 3.24 2.47 2.48 4.23 2.47CADA Pune Krishna 3.71 4.29 3.63 4.29 3.18CIPC Chandrapur Asola Mendha 2.88 0.84 3.76 3.89 0.84TIC Thane Bhatsa 5.68 7.01 4.04 10.13 3.18SIC Sangli Radhanagari 4.49 3.69 4.65 5.03 3.69SIC Sangli Warna 5.09 7.57 6.87 7.57 3.86
Indicator IVMajor Projects
Output per unit Irrigation Water supply
2.99
4.16
3.34
4.08
0.75
2.97
3.38
3.25
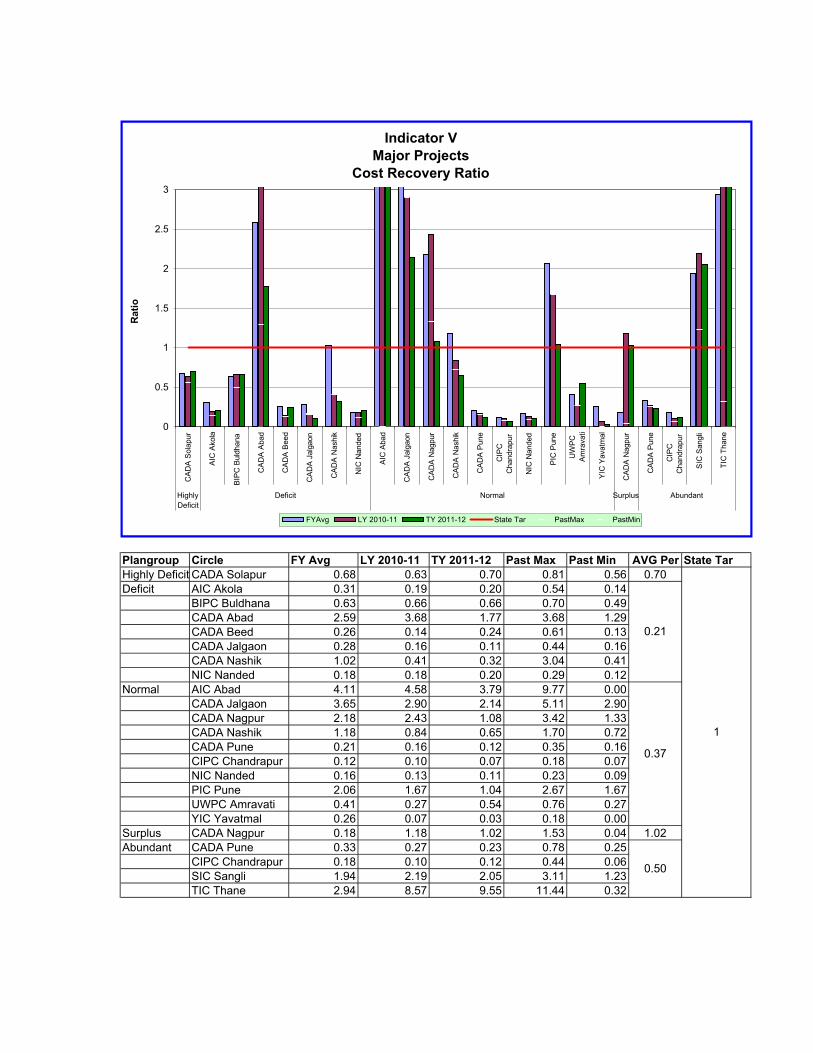
Plangroup Circle FY Avg LY 2010-11 TY 2011-12 Past Max Past Min AVG Per State TarHighly Deficit CADA Solapur 0.68 0.63 0.70 0.81 0.56 0.70Deficit AIC Akola 0.31 0.19 0.20 0.54 0.14
BIPC Buldhana 0.63 0.66 0.66 0.70 0.49CADA Abad 2.59 3.68 1.77 3.68 1.29CADA Beed 0.26 0.14 0.24 0.61 0.13CADA Jalgaon 0.28 0.16 0.11 0.44 0.16CADA Nashik 1.02 0.41 0.32 3.04 0.41NIC Nanded 0.18 0.18 0.20 0.29 0.12
Normal AIC Abad 4.11 4.58 3.79 9.77 0.00CADA Jalgaon 3.65 2.90 2.14 5.11 2.90CADA Nagpur 2.18 2.43 1.08 3.42 1.33CADA Nashik 1.18 0.84 0.65 1.70 0.72CADA Pune 0.21 0.16 0.12 0.35 0.16CIPC Chandrapur 0.12 0.10 0.07 0.18 0.07NIC Nanded 0.16 0.13 0.11 0.23 0.09PIC Pune 2.06 1.67 1.04 2.67 1.67UWPC Amravati 0.41 0.27 0.54 0.76 0.27YIC Yavatmal 0.26 0.07 0.03 0.18 0.00
Surplus CADA Nagpur 0.18 1.18 1.02 1.53 0.04 1.02Abundant CADA Pune 0.33 0.27 0.23 0.78 0.25
CIPC Chandrapur 0.18 0.10 0.12 0.44 0.06SIC Sangli 1.94 2.19 2.05 3.11 1.23TIC Thane 2.94 8.57 9.55 11.44 0.32
1
0.21
0.37
0.50
Indicator VMajor Projects
Cost Recovery Ratio
0
0.5
1
1.5
2
2.5
3C
AD
A S
olap
ur
AIC
Ako
la
BIP
C B
uldh
ana
CA
DA
Aba
d
CA
DA
Bee
d
CA
DA
Jal
gaon
CA
DA
Nas
hik
NIC
Nan
ded
AIC
Aba
d
CA
DA
Jal
gaon
CA
DA
Nag
pur
CA
DA
Nas
hik
CA
DA
Pun
e
CIP
CC
hand
rapu
r
NIC
Nan
ded
PIC
Pun
e
UW
PC
Am
rava
ti
YIC
Yav
atm
al
CA
DA
Nag
pur
CA
DA
Pun
e
CIP
CC
hand
rapu
r
SIC
San
gli
TIC
Tha
ne
HighlyDeficit
Deficit Normal Surplus Abundant
Rat
io
FYAvg LY 2010-11 TY 2011-12 State Tar PastMax PastMin

Indicator VMajor Projects
Cost Recovery Ratio
0.00
0.50
1.00
1.50
2.00
2.50
3.00
Bhi
ma
Man
ar
Jaya
kwad
i PR
BC
Nal
gang
a
Girn
a
Low
er T
erna
Pur
na
Maj
alga
on
Cha
naka
pur
Kat
epur
na
Vis
hnup
uri
Man
jra
Wan
(Am
rava
ti)
Jaya
kwad
i (P
LBC
)
Kad
va
Aru
nava
ti
Kuk
adi
Bor
Cha
skam
an
Wag
had
Upp
er P
enga
nga
UG
C O
zerk
hed
UG
C (K
aera
njw
an)
Mul
a
Gho
d
Dar
na
Bha
ndar
dara
Pal
khed
NLB
C
Upp
er W
ardh
a
NR
BC
Kha
dakw
asla
Low
er W
unna
Hat
nur
NM
C E
xpre
ssM
ukan
eG
anga
pur
Paw
ana
Itiah
doh
Bag
h
Pen
ch
Din
a
Aso
la M
endh
a
Kris
hna
Tula
shi
War
na
Sur
ya
Rad
hana
gari
Bha
tsa
Kal
HighlyDeficit
Deficit Normal Surplus Abundant
Rat
io
FY Avg LY- 2010-11 TY- 2011-12 StateTar Past Max Past Min

Circle PlanGroup Project FY Avg LY- 2010-11 TY- 2011-12 Past Max Past Min Avg Per StateTar
CADA Solapur Highly Deficit Bhima 0.67 0.63 0.70 0.81 0.56 0.70NIC Nanded Deficit Manar 0.04 0.04 0.04 0.13 0.01
CADA Beed Jayakwadi PRBC 0.11 0.09 0.09 0.47 0.09AIC Akola Nalganga 0.06 0.04 0.10 0.15 0.04
CADA Jalgaon Girna 0.27 0.16 0.11 0.44 0.16
CADA Beed Lower Terna 0.17 0.12 0.13 0.21 0.08
NIC Nanded Purna 0.14 0.17 0.20 0.18 0.08
CADA Beed Majalgaon 0.15 0.07 0.30 0.88 0.07
CADA Nashik Chanakapur 0.91 0.41 0.32 3.04 0.41
AIC Akola Katepurna 0.45 0.30 0.33 0.95 0.21
NIC Nanded Vishnupuri 0.29 0.32 0.39 1.11 0.03
CADA Beed Manjra 0.41 0.45 0.43 0.85 0.12
BIPC Buldhana Wan (Amravati) 0.65 0.66 0.55 0.70 0.49
CADA Abad Jayakwadi (PLBC) 2.95 3.68 1.77 3.68 1.29
CADA Nashik Normal Kadva 0.03 0.01 0.03 0.07 0.01
YIC Yavatmal Arunavati 0.28 0.07 0.03 0.18 0.00
CADA Pune Kukadi 0.10 0.07 0.07 0.21 0.07
CIPC Chandrapur Bor 0.11 0.10 0.07 0.18 0.07
PIC Pune Chaskaman 0.07 0.06 0.08 0.12 0.05
CADA Nashik Waghad 0.18 0.11 0.10 0.26 0.11
NIC Nanded Upper Penganga 0.15 0.13 0.11 0.23 0.09
CADA Nashik UGC Ozerkhed 0.15 0.13 0.12 0.22 0.12
CADA Nashik UGC (Kaeranjwan) 1.12 1.34 0.20 1.34 0.89
CADA Nashik Mula 0.24 0.17 0.21 0.34 0.17
CADA Pune Ghod 0.66 0.55 0.35 1.67 0.50
CADA Nashik Darna 1.39 0.76 0.37 2.87 0.76
CADA Nashik Bhandardara 0.61 0.46 0.39 1.00 0.45
CADA Nashik Palkhed 0.78 0.68 0.45 1.09 0.56
PIC Pune NLBC 1.38 1.34 0.48 2.22 1.23
UWPC Amravati Upper Wardha 0.38 0.27 0.54 0.76 0.27
PIC Pune NRBC 0.64 0.43 0.54 1.04 0.43
PIC Pune Khadakwasla 1.93 1.82 1.05 2.20 1.64
CADA Nagpur Lower Wunna 2.34 2.43 1.08 3.42 1.33
CADA Jalgaon Hatnur 3.63 2.90 2.14 5.11 2.90
AIC Abad NMC Express Mukane 4.55 4.58 3.79 9.77 0.00
CADA Nashik Gangapur 7.66 5.23 5.34 19.78 3.77
PIC Pune Pawana 13.23 11.69 8.61 24.22 8.05
CADA Nagpur Surplus Itiahdoh 0.01 0.09 0.11 0.13 0.00
CADA Nagpur Bagh 0.01 0.04 0.20 0.07 0.00
CADA Nagpur Pench 1.91 1.60 1.30 2.10 1.45
CIPC Chandrapur Abundant Dina 0.13 0.09 0.09 0.47 0.04
CIPC Chandrapur Asola Mendha 0.23 0.15 0.20 0.41 0.14
CADA Pune Krishna 0.36 0.27 0.23 0.78 0.25
SIC Sangli Tulashi 0.30 0.43 0.28 0.43 0.15
SIC Sangli Warna 0.71 0.69 1.61 1.20 0.49
TIC Thane Surya 1.82 1.86 2.31 4.00 1.13
SIC Sangli Radhanagari 3.63 3.82 3.04 5.11 1.09
TIC Thane Bhatsa 2.52 53.77 57.85 67.74 0.20
TIC Thane Kal 16.50 69.68 108.72 69.68 0.08
1
Indicator VMajor Projects
Cost Recovery Ratio
0.21
0.37
1.02
0.50

Plangroup Circle FY Avg LY 2010-11 TY 2011-12 Past Max Past Min AVG Per State TarHighly Deficit CADA Solapur 1666 2043 1375 2184 1278 1375Deficit AIC Akola 8155 7083 3215 27317 5046
BIPC Buldhana 3023 4598 1034 8510 1772CADA Abad 1678 1840 2313 3460 988CADA Beed 4673 6155 10001 8274 3477CADA Jalgaon 2105 2673 3916 2801 1460CADA Nashik 2129 5621 5388 5621 832NIC Nanded 3977 4133 2973 14444 2376
Normal AIC Abad 70 61 36 136 52CADA Jalgaon 3209 3300 3025 5071 2189CADA Nagpur 2284 1766 3296 3298 1766CADA Nashik 1944 2919 2915 2919 1493CADA Pune 1795 3031 3120 3031 834CIPC Chandrapur 3278 3775 2769 4927 2049NIC Nanded 3079 3162 2794 9741 2058PIC Pune 1262 1491 1671 1491 1047UWPC Amravati 1558 2232 1199 2515 658YIC Yavatmal 1028 2574 3811 2574 0
Surplus CADA Nagpur 14165 2201 2303 56450 2094 2303Abundant CADA Pune 3178 3590 2887 4389 1602
CIPC Chandrapur 873 1173 1154 1205 528SIC Sangli 1600 1456 1133 2176 1298TIC Thane 46456 26314 24000 124990 9204
1250
4140
2366
2699
Indicator VIMajor Projects
O&M Cost per unit area
0
1000
2000
3000
4000
5000
6000
7000
8000
9000
CA
DA
Sol
apur
AIC
Ako
la
BIP
C B
uldh
ana
CA
DA
Aba
d
CA
DA
Bee
d
CA
DA
Jal
gaon
CA
DA
Nas
hik
NIC
Nan
ded
AIC
Aba
d
CA
DA
Jal
gaon
CA
DA
Nag
pur
CA
DA
Nas
hik
CA
DA
Pun
e
CIP
CC
hand
rapu
r
NIC
Nan
ded
PIC
Pun
e
UW
PC
Am
rava
ti
YIC
Yav
atm
al
CA
DA
Nag
pur
CA
DA
Pun
e
CIP
CC
hand
rapu
r
SIC
San
gli
TIC
Tha
ne
HighlyDeficit
Deficit Normal Surplus Abundant
Rs.
/ha
FY Avg LY 2010-11 TY 2011-12 StateTar Past Max Past Min

Indicator VIMajor Projects
O & M Cost per unit area
0
200
400
600
800
1000
1200
1400
1600
1800
2000
Bhi
ma
Pur
na
Jaya
kwad
i (P
LBC
)
Wan
(Am
rava
ti)
Nal
gang
a
Kat
epur
na
Girn
a
Man
jra
Man
ar
Vis
hnup
uri
Cha
naka
pur
Low
er T
erna
Maj
alga
on
Jaya
kwad
i PR
BC
NM
C E
xpre
ss M
ukan
e
NR
BC
Upp
er W
ardh
a
NLB
C
Cha
skam
an
Gan
gapu
r
Bha
ndar
dara
Kad
va
Gho
d
Bor
Upp
er P
enga
nga
Wag
had
Pal
khed
UG
C O
zerk
hed
Hat
nur
Mul
a
Kuk
adi
Low
er W
unna
Dar
na
Aru
nava
ti
Kha
dakw
asla
Paw
ana
UG
C (K
aera
njw
an)
Bag
h
Itiah
doh
Pen
ch
Aso
la M
endh
a
War
na
Rad
hana
gari
Din
a
Kal
Kris
hna
Tula
shi
Bha
tsa
Sur
ya
HighlyDeficit
Deficit Normal Surplus Abundant
Rs.
/ha
FY Avg LY- 2010-11 TY- 2011-12 StateTar Past Min Past Max
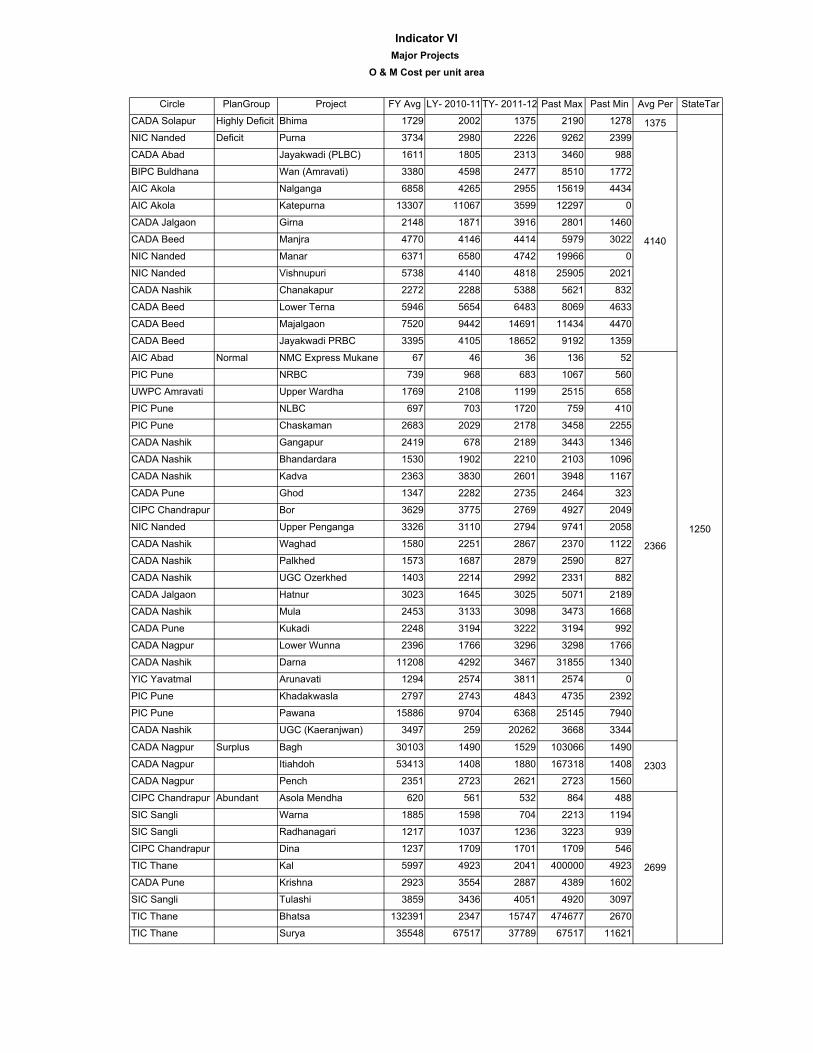
Circle PlanGroup Project FY Avg LY- 2010-11 TY- 2011-12 Past Max Past Min Avg Per StateTar
CADA Solapur Highly Deficit Bhima 1729 2002 1375 2190 1278 1375NIC Nanded Deficit Purna 3734 2980 2226 9262 2399
CADA Abad Jayakwadi (PLBC) 1611 1805 2313 3460 988
BIPC Buldhana Wan (Amravati) 3380 4598 2477 8510 1772
AIC Akola Nalganga 6858 4265 2955 15619 4434
AIC Akola Katepurna 13307 11067 3599 12297 0
CADA Jalgaon Girna 2148 1871 3916 2801 1460
CADA Beed Manjra 4770 4146 4414 5979 3022
NIC Nanded Manar 6371 6580 4742 19966 0
NIC Nanded Vishnupuri 5738 4140 4818 25905 2021
CADA Nashik Chanakapur 2272 2288 5388 5621 832
CADA Beed Lower Terna 5946 5654 6483 8069 4633
CADA Beed Majalgaon 7520 9442 14691 11434 4470
CADA Beed Jayakwadi PRBC 3395 4105 18652 9192 1359
AIC Abad Normal NMC Express Mukane 67 46 36 136 52
PIC Pune NRBC 739 968 683 1067 560
UWPC Amravati Upper Wardha 1769 2108 1199 2515 658
PIC Pune NLBC 697 703 1720 759 410
PIC Pune Chaskaman 2683 2029 2178 3458 2255
CADA Nashik Gangapur 2419 678 2189 3443 1346
CADA Nashik Bhandardara 1530 1902 2210 2103 1096
CADA Nashik Kadva 2363 3830 2601 3948 1167
CADA Pune Ghod 1347 2282 2735 2464 323
CIPC Chandrapur Bor 3629 3775 2769 4927 2049
NIC Nanded Upper Penganga 3326 3110 2794 9741 2058
CADA Nashik Waghad 1580 2251 2867 2370 1122
CADA Nashik Palkhed 1573 1687 2879 2590 827
CADA Nashik UGC Ozerkhed 1403 2214 2992 2331 882
CADA Jalgaon Hatnur 3023 1645 3025 5071 2189
CADA Nashik Mula 2453 3133 3098 3473 1668
CADA Pune Kukadi 2248 3194 3222 3194 992
CADA Nagpur Lower Wunna 2396 1766 3296 3298 1766
CADA Nashik Darna 11208 4292 3467 31855 1340
YIC Yavatmal Arunavati 1294 2574 3811 2574 0
PIC Pune Khadakwasla 2797 2743 4843 4735 2392
PIC Pune Pawana 15886 9704 6368 25145 7940
CADA Nashik UGC (Kaeranjwan) 3497 259 20262 3668 3344
CADA Nagpur Surplus Bagh 30103 1490 1529 103066 1490
CADA Nagpur Itiahdoh 53413 1408 1880 167318 1408
CADA Nagpur Pench 2351 2723 2621 2723 1560
CIPC Chandrapur Abundant Asola Mendha 620 561 532 864 488
SIC Sangli Warna 1885 1598 704 2213 1194
SIC Sangli Radhanagari 1217 1037 1236 3223 939
CIPC Chandrapur Dina 1237 1709 1701 1709 546
TIC Thane Kal 5997 4923 2041 400000 4923
CADA Pune Krishna 2923 3554 2887 4389 1602
SIC Sangli Tulashi 3859 3436 4051 4920 3097
TIC Thane Bhatsa 132391 2347 15747 474677 2670
TIC Thane Surya 35548 67517 37789 67517 11621
2699
1250
Indicator VIMajor Projects
O & M Cost per unit area
4140
2366
2303

Plangroup Circle FY Avg LY 2010-11 TY 2011-12 Past Max Past Min AVG Per State TarHighly Deficit CADA Solapur 0.16 0.22 0.16 0.23 0.12 0.16Deficit AIC Akola 0.67 0.72 0.40 1.60 0.39
BIPC Buldhana 0.25 0.46 0.22 0.77 0.13CADA Abad 0.22 0.25 0.29 0.60 0.14CADA Beed 0.39 0.59 0.54 0.85 0.26CADA Jalgaon 0.40 1.51 2.04 1.51 0.22CADA Nashik 0.41 1.10 1.05 1.10 0.15NIC Nanded 0.34 0.33 0.28 1.16 0.20
Normal AIC Abad 0.00 0.00 0.01 0.01 0.00CADA Jalgaon 0.31 0.39 0.43 0.46 0.18CADA Nagpur 0.23 0.17 0.32 0.38 0.15CADA Nashik 0.33 0.46 0.44 0.46 0.24CADA Pune 0.37 0.64 0.56 0.64 0.20CIPC Chandrapur 0.24 0.24 0.22 0.39 0.15NIC Nanded 0.37 0.41 0.34 2.03 0.22PIC Pune 0.19 0.25 0.28 0.25 0.14UWPC Amravati 0.16 0.25 0.10 0.31 0.06YIC Yavatmal 0.08 0.17 0.32 0.17 0.00
Surplus CADA Nagpur 1.23 0.25 0.20 4.59 0.17 0.20Abundant CADA Pune 0.48 0.63 0.46 0.66 0.20
CIPC Chandrapur 0.17 0.34 0.18 0.34 0.09SIC Sangli 0.11 0.11 0.09 0.13 0.09TIC Thane 0.35 0.12 0.08 1.25 0.08
0.16
0.40
0.36
0.34
IndicatorVIIMajor Projects
O&M cost per unit of Water supplied
0.00
0.05
0.10
0.15
0.20
0.25
0.30C
AD
A S
olap
ur
AIC
Ako
la
BIP
C B
uldh
ana
CA
DA
Aba
d
CA
DA
Bee
d
CA
DA
Jal
gaon
CA
DA
Nas
hik
NIC
Nan
ded
AIC
Aba
d
CA
DA
Jal
gaon
CA
DA
Nag
pur
CA
DA
Nas
hik
CA
DA
Pun
e
CIP
C C
hand
rapu
r
NIC
Nan
ded
PIC
Pun
e
UW
PC
Am
rava
ti
YIC
Yav
atm
al
CA
DA
Nag
pur
CA
DA
Pun
e
CIP
C C
hand
rapu
r
SIC
San
gli
TIC
Tha
ne
HighlyDeficit
Deficit Normal Surplus Abundant
Rs.
/cum
FY Avg LY 2010-11 TY 2011-12 StateTar Past Max Past Min

IndicatorVIIMajor Projects
O & M cost per unit of Water supplied
0.00
0.05
0.10
0.15
0.20
0.25
0.30
Bhim
aP
urna
Jaya
kwad
iW
anK
atep
urna
Man
jraV
ishn
upur
iN
alga
nga
Man
arM
ajal
gaon
Jaya
kwad
iLo
wer
Ter
naC
hana
kapu
rG
irna
NM
C E
xpre
ssU
pper
Paw
ana
NR
BC
Bor
Gan
gapu
rN
LBC
Low
er W
unna
Aru
nava
tiU
pper
Bha
ndar
dara
Kha
dakw
asla
Kad
vaG
hod
Mul
aH
atnu
rD
arna
Cha
skam
anK
ukad
iP
alkh
edW
agha
dU
GC
UG
CB
agh
Itiah
doh
Pen
chB
hats
aK
alW
arna
Aso
laR
adha
naga
riTu
lash
iD
ina
Sur
yaK
rishn
a
HighlyDeficit
Deficit Normal Surplus Abundant
Rs.
/cum
FY Avg LY- 2010-11 TY- 2011-12 StateTar Past Max Past Min
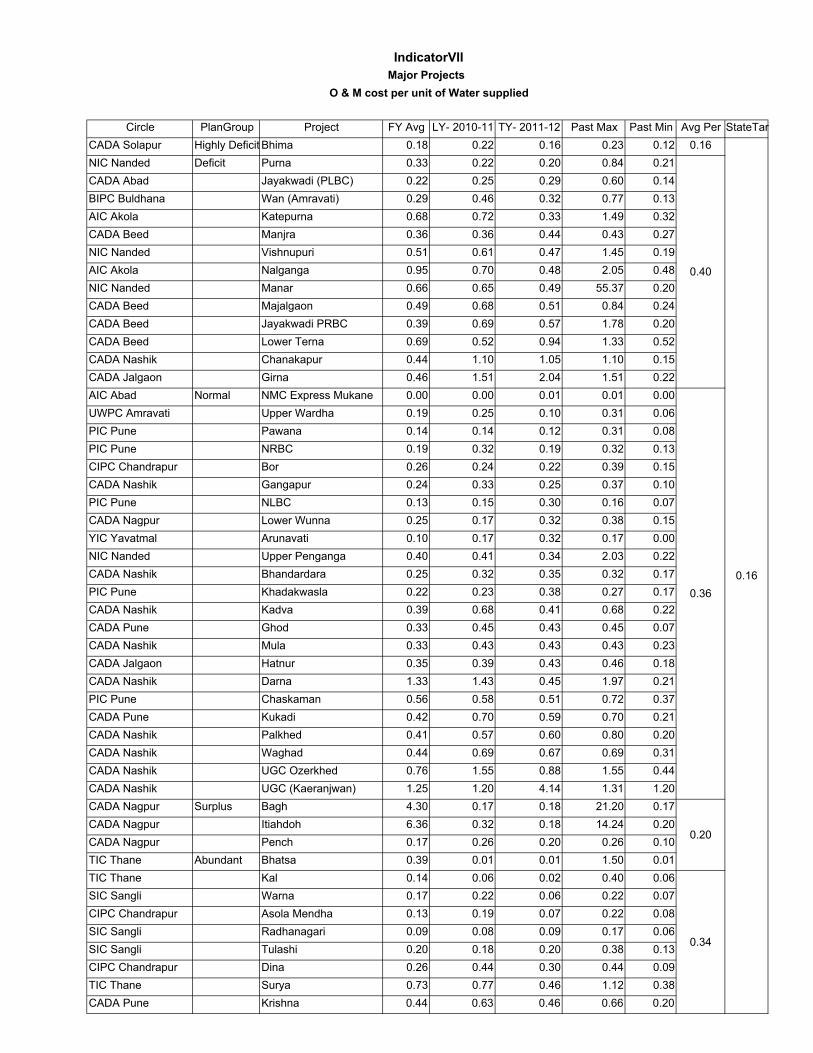
Circle PlanGroup Project FY Avg LY- 2010-11 TY- 2011-12 Past Max Past Min Avg Per StateTarCADA Solapur Highly Deficit Bhima 0.18 0.22 0.16 0.23 0.12 0.16NIC Nanded Deficit Purna 0.33 0.22 0.20 0.84 0.21CADA Abad Jayakwadi (PLBC) 0.22 0.25 0.29 0.60 0.14BIPC Buldhana Wan (Amravati) 0.29 0.46 0.32 0.77 0.13AIC Akola Katepurna 0.68 0.72 0.33 1.49 0.32CADA Beed Manjra 0.36 0.36 0.44 0.43 0.27NIC Nanded Vishnupuri 0.51 0.61 0.47 1.45 0.19AIC Akola Nalganga 0.95 0.70 0.48 2.05 0.48NIC Nanded Manar 0.66 0.65 0.49 55.37 0.20CADA Beed Majalgaon 0.49 0.68 0.51 0.84 0.24CADA Beed Jayakwadi PRBC 0.39 0.69 0.57 1.78 0.20CADA Beed Lower Terna 0.69 0.52 0.94 1.33 0.52CADA Nashik Chanakapur 0.44 1.10 1.05 1.10 0.15CADA Jalgaon Girna 0.46 1.51 2.04 1.51 0.22AIC Abad Normal NMC Express Mukane 0.00 0.00 0.01 0.01 0.00UWPC Amravati Upper Wardha 0.19 0.25 0.10 0.31 0.06PIC Pune Pawana 0.14 0.14 0.12 0.31 0.08PIC Pune NRBC 0.19 0.32 0.19 0.32 0.13CIPC Chandrapur Bor 0.26 0.24 0.22 0.39 0.15CADA Nashik Gangapur 0.24 0.33 0.25 0.37 0.10PIC Pune NLBC 0.13 0.15 0.30 0.16 0.07CADA Nagpur Lower Wunna 0.25 0.17 0.32 0.38 0.15YIC Yavatmal Arunavati 0.10 0.17 0.32 0.17 0.00NIC Nanded Upper Penganga 0.40 0.41 0.34 2.03 0.22CADA Nashik Bhandardara 0.25 0.32 0.35 0.32 0.17PIC Pune Khadakwasla 0.22 0.23 0.38 0.27 0.17CADA Nashik Kadva 0.39 0.68 0.41 0.68 0.22CADA Pune Ghod 0.33 0.45 0.43 0.45 0.07CADA Nashik Mula 0.33 0.43 0.43 0.43 0.23CADA Jalgaon Hatnur 0.35 0.39 0.43 0.46 0.18CADA Nashik Darna 1.33 1.43 0.45 1.97 0.21PIC Pune Chaskaman 0.56 0.58 0.51 0.72 0.37CADA Pune Kukadi 0.42 0.70 0.59 0.70 0.21CADA Nashik Palkhed 0.41 0.57 0.60 0.80 0.20CADA Nashik Waghad 0.44 0.69 0.67 0.69 0.31CADA Nashik UGC Ozerkhed 0.76 1.55 0.88 1.55 0.44CADA Nashik UGC (Kaeranjwan) 1.25 1.20 4.14 1.31 1.20CADA Nagpur Surplus Bagh 4.30 0.17 0.18 21.20 0.17CADA Nagpur Itiahdoh 6.36 0.32 0.18 14.24 0.20CADA Nagpur Pench 0.17 0.26 0.20 0.26 0.10TIC Thane Abundant Bhatsa 0.39 0.01 0.01 1.50 0.01TIC Thane Kal 0.14 0.06 0.02 0.40 0.06SIC Sangli Warna 0.17 0.22 0.06 0.22 0.07CIPC Chandrapur Asola Mendha 0.13 0.19 0.07 0.22 0.08SIC Sangli Radhanagari 0.09 0.08 0.09 0.17 0.06SIC Sangli Tulashi 0.20 0.18 0.20 0.38 0.13CIPC Chandrapur Dina 0.26 0.44 0.30 0.44 0.09TIC Thane Surya 0.73 0.77 0.46 1.12 0.38CADA Pune Krishna 0.44 0.63 0.46 0.66 0.20
IndicatorVIIMajor Projects
O & M cost per unit of Water supplied
0.16
0.40
0.36
0.20
0.34

Plangroup Circle FY Avg LY 2010-11 TY 2011-12 Past Max Past Min AVG Per State TarHighly Deficit CADA Solapur 0.11 0.14 0.11 0.14 0.08 0.11Deficit AIC Akola 0.21 0.14 0.08 0.42 0.14
BIPC Buldhana 0.16 0.30 0.14 0.54 0.07CADA Abad 0.56 0.91 0.51 1.60 0.28CADA Beed 0.10 0.08 0.13 0.21 0.04CADA Jalgaon 0.11 0.24 0.23 0.24 0.09CADA Nashik 0.42 0.45 0.33 0.47 0.31NIC Nanded 0.06 0.06 0.06 0.14 0.04
Normal AIC Abad 0.02 0.02 0.02 0.04 0.00CADA Jalgaon 1.14 1.14 0.92 1.58 0.70CADA Nagpur 0.49 0.40 0.34 1.29 0.20CADA Nashik 0.39 0.38 0.29 0.47 0.32CADA Pune 0.08 0.10 0.07 0.10 0.06CIPC Chandrapur 0.03 0.02 0.01 0.04 0.02NIC Nanded 0.06 0.05 0.04 0.18 0.05PIC Pune 0.39 0.41 0.29 0.43 0.32UWPC Amravati 0.06 0.07 0.05 0.18 0.04YIC Yavatmal 0.02 0.01 0.01 0.89 0.00
Surplus CADA Nagpur 0.22 0.29 0.20 0.29 0.14 0.04Abundant CADA Pune 0.16 0.17 0.11 0.17 0.15
CIPC Chandrapur 0.03 0.04 0.02 0.04 0.02SIC Sangli 0.21 0.24 0.18 0.27 0.15TIC Thane 1.04 1.03 0.81 2.06 0.38
0.18
0.15
0.12
0.10
Indicator VIIIMajor Projects
Revenue per unit of water supplied
0.00
0.05
0.10
0.15
0.20
0.25
0.30
CA
DA
Sol
apur
AIC
Ako
la
BIPC
Bul
dhan
a
CA
DA
Aba
d
CA
DA
Bee
d
CA
DA
Jalg
aon
CA
DA
Nas
hik
NIC
Nan
ded
AIC
Aba
d
CA
DA
Jalg
aon
CA
DA
Nag
pur
CA
DA
Nas
hik
CA
DA
Pun
e
CIP
CC
hand
rapu
r
NIC
Nan
ded
PIC
Pun
e
UW
PC
Am
rava
tiYI
CY
avat
mal
CA
DA
Nag
pur
CA
DA
Pun
e
CIP
CC
hand
rapu
r
SIC
San
gli
TIC
Tha
ne
HighlyDeficit
Deficit Normal Surplus Abundant
Rs.
/cum
FY Avg LY 2010-11 TY 2011-12 StateTar Past Max Past Min

Indicator VIIIMajor Projects
Revenue per unit of water supplied
0.00
0.05
0.10
0.15
0.20
0.25
0.30Bh
ima
Man
arP
urna
Nal
gang
aJa
yakw
adi P
RB
CK
atep
urna
Low
er T
erna
Maj
alga
onW
an (A
mra
vati)
Vis
hnup
uri
Man
jraG
irna
Cha
naka
pur
Jaya
kwad
i (P
LBC
)B
orK
adva
Aru
nava
tiN
MC
Exp
ress
Muk
ane
Cha
skam
anU
pper
Pen
gang
aK
ukad
iU
pper
War
dha
Wag
had
Mul
aN
RB
CU
GC
Oze
rkhe
dB
hand
arda
raG
hod
NLB
CD
arna
Pal
khed
Low
er W
unna
Kha
dakw
asla
UG
C (K
aera
njw
an)
Hat
nur
Paw
ana
Gan
gapu
rIti
ahdo
hB
agh
Pen
chA
sola
Men
dha
Din
aTu
lash
iW
arna
Kris
hna
Rad
hana
gari
Bha
tsa
Sur
ya Kal
HighlyDeficit
Deficit Normal Surplus Abundant
Rs.
/cum
FY Avg TY- 2011-12 LY- 2010-11 StateTar Past Min Past Max

Circle PlanGroup Project FY Avg LY- 2010-11 TY- 2011-12 Past Max Past Min Avg Per StateTarCADA Solapur Highly Deficit Bhima 0.12 0.14 0.11 0.14 0.08 0.11NIC Nanded Deficit Manar 0.02 0.02 0.02 0.72 0.01NIC Nanded Purna 0.05 0.04 0.04 0.07 0.03AIC Akola Nalganga 0.06 0.02 0.05 0.09 0.02CADA Beed Jayakwadi PRBC 0.04 0.06 0.05 0.20 0.02AIC Akola Katepurna 0.31 0.22 0.11 0.69 0.22CADA Beed Lower Terna 0.11 0.06 0.12 0.27 0.05CADA Beed Majalgaon 0.07 0.05 0.15 0.22 0.05BIPC Buldhana Wan (Amravati) 0.19 0.30 0.18 0.54 0.07NIC Nanded Vishnupuri 0.15 0.20 0.18 0.31 0.01CADA Beed Manjra 0.15 0.16 0.19 0.26 0.05CADA Jalgaon Girna 0.12 0.24 0.23 0.24 0.09CADA Nashik Chanakapur 0.40 0.45 0.33 0.47 0.31CADA Abad Jayakwadi (PLBC) 0.64 0.91 0.51 1.60 0.28CIPC Chandrapur Normal Bor 0.03 0.02 0.01 0.04 0.02CADA Nashik Kadva 0.01 0.01 0.01 0.02 0.01YIC Yavatmal Arunavati 0.03 0.01 0.01 0.89 0.00AIC Abad NMC Express Mukane 0.02 0.02 0.02 0.04 0.00PIC Pune Chaskaman 0.04 0.04 0.04 0.07 0.03NIC Nanded Upper Penganga 0.06 0.05 0.04 0.18 0.05CADA Pune Kukadi 0.04 0.05 0.04 0.07 0.03UWPC Amravati Upper Wardha 0.07 0.07 0.05 0.18 0.04CADA Nashik Waghad 0.08 0.08 0.06 0.09 0.05CADA Nashik Mula 0.08 0.07 0.09 0.09 0.07PIC Pune NRBC 0.12 0.14 0.10 0.14 0.10CADA Nashik UGC Ozerkhed 0.11 0.21 0.10 0.21 0.06CADA Nashik Bhandardara 0.15 0.14 0.14 0.17 0.13CADA Pune Ghod 0.22 0.25 0.15 0.25 0.11PIC Pune NLBC 0.18 0.20 0.15 0.20 0.15CADA Nashik Darna 1.85 1.09 0.17 2.93 0.24CADA Nashik Palkhed 0.32 0.39 0.27 0.45 0.19CADA Nagpur Lower Wunna 0.59 0.40 0.34 1.29 0.20PIC Pune Khadakwasla 0.42 0.43 0.39 0.48 0.31CADA Nashik UGC (Kaeranjwan) 1.40 1.61 0.85 1.61 1.17CADA Jalgaon Hatnur 1.28 1.14 0.92 1.58 0.70PIC Pune Pawana 1.90 1.62 1.01 2.48 1.49CADA Nashik Gangapur 1.84 1.73 1.36 2.25 1.38CADA Nagpur Surplus Itiahdoh 0.03 0.03 0.02 0.04 0.02CADA Nagpur Bagh 0.03 0.01 0.04 0.09 0.01CADA Nagpur Pench 0.33 0.41 0.26 0.41 0.19CIPC Chandrapur Abundant Asola Mendha 0.03 0.03 0.01 0.03 0.03CIPC Chandrapur Dina 0.03 0.04 0.03 0.06 0.01SIC Sangli Tulashi 0.06 0.08 0.06 0.08 0.04SIC Sangli Warna 0.12 0.15 0.10 0.15 0.09CADA Pune Krishna 0.16 0.17 0.11 0.17 0.15SIC Sangli Radhanagari 0.32 0.31 0.28 0.50 0.19TIC Thane Bhatsa 0.99 0.62 0.53 2.08 0.29TIC Thane Surya 1.32 1.43 1.05 1.50 0.81TIC Thane Kal 2.24 4.53 2.33 4.53 0.02
0.18
Indicator VIIIMajor Projects
Revenue per unit of water supplied
0.15
0.12
0.04
0.10

Head Middle TailHighly Deficit CADA Solapur 0.37 0.36 0.24Deficit AIC Akola 0.24 0.81 0.13
BIPC Buldhana 0.10 0.14 0.19CADA Abad 0.45 0.56 0.31CADA Beed 0.27 0.30 0.12CADA Jalgaon 0.04 0.04 0.02CADA Nashik 0.50 0.50 0.50NIC Nanded 0.73 0.74 0.54
Normal AIC Abad 0.21 0.09 0.07CADA Jalgaon 0.09 0.10 0.13CADA Nagpur 0.38 0.50 0.26CADA Nashik 0.56 0.75 0.60CADA Pune 0.49 0.49 0.49CIPC Chandrapur 0.30 0.43 0.41NIC Nanded 0.31 0.35 0.30PIC Pune 0.88 0.87 0.84UWPC Amravati 0.42 0.37 0.24YIC Yavatmal 0.61 0.43 0.24
Surplus CADA Nagpur 0.76 0.77 0.88Abundant CADA Pune 0.34 0.34 0.34
CIPC Chandrapur 0.92 0.96 0.89SIC Sangli 0.79 0.82 0.88TIC Thane 0.11 0.19 0.15
Plangroup 2011-12Circle
Indicator XI Major Projects
Equity Performance
0.00
0.20
0.40
0.60
0.80
1.00C
AD
AS
olap
ur
AIC
Ako
la
BIP
CB
uldh
ana
CA
DA
Aba
d
CA
DA
Bee
d
CA
DA
Jalg
aon
CA
DA
Nas
hik
NIC
Nan
ded
AIC
Aba
d
CA
DA
Jalg
aon
CA
DA
Nag
pur
CA
DA
Nas
hik
CA
DA
Pun
e
CIP
CC
hand
rapu
r
NIC
Nan
ded
PIC
Pun
e
UW
PC
Am
rava
tiY
ICY
avat
mal
CA
DA
Nag
pur
CA
DA
Pun
eC
IPC
Cha
ndra
pur
SIC
San
gli
TIC
Tha
ne
HighlyDeficit
Deficit Normal Surplus Abundant
Rat
io
Head Middle Tail

Indicator XI Major Projects
Equity Performance
0.00
0.20
0.40
0.60
0.80
1.00
Bhi
ma
Kat
epur
naN
alga
nga
Wan
(Am
rava
ti)Ja
yakw
adi (
PLB
C)
Jaya
kwad
i PR
BC
Low
er T
erna
Maj
alga
onM
anjra
Girn
aC
hana
kapu
rM
anar
Pur
naV
ishn
upur
iN
MC
Exp
ress
Muk
ane
Hat
nur
Low
er W
unna
Bha
ndar
dara
Dar
naG
anga
pur
Kad
vaM
ula
Pal
khed
UG
C (K
aera
njw
an)
UG
C O
zerk
hed
Wag
had
Gho
dK
ukad
iB
orU
pper
Pen
gang
aC
hask
aman
Kha
dakw
asla
NLB
CN
RB
CP
awan
aU
pper
War
dha
Aru
nava
tiB
agh
Itiah
doh
Pen
chK
rishn
aA
sola
Men
dha
Din
aR
adha
naga
riTu
lash
iW
arna
Bha
tsa
Kal
Sur
ya
HighlyDeficit
Deficit Normal Surplus Abundant
Rat
io
Head Middle Tail
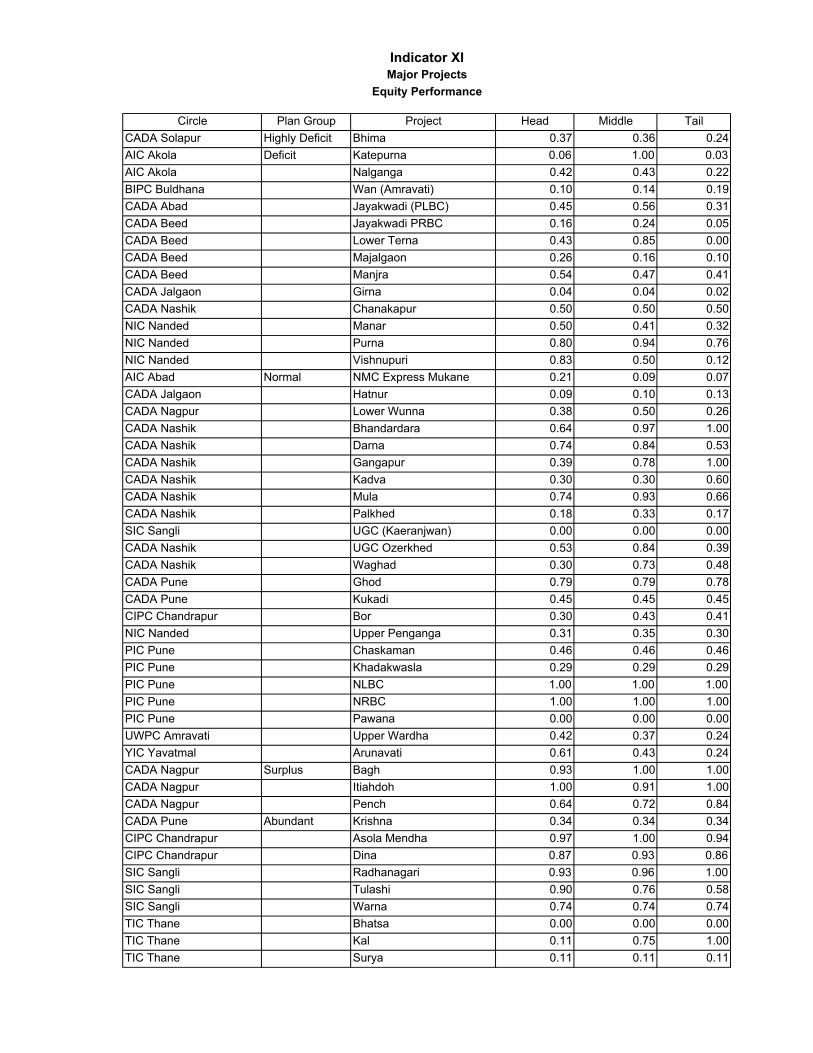
Circle Plan Group Project Head Middle TailCADA Solapur Highly Deficit Bhima 0.37 0.36 0.24AIC Akola Deficit Katepurna 0.06 1.00 0.03AIC Akola Nalganga 0.42 0.43 0.22BIPC Buldhana Wan (Amravati) 0.10 0.14 0.19CADA Abad Jayakwadi (PLBC) 0.45 0.56 0.31CADA Beed Jayakwadi PRBC 0.16 0.24 0.05CADA Beed Lower Terna 0.43 0.85 0.00CADA Beed Majalgaon 0.26 0.16 0.10CADA Beed Manjra 0.54 0.47 0.41CADA Jalgaon Girna 0.04 0.04 0.02CADA Nashik Chanakapur 0.50 0.50 0.50NIC Nanded Manar 0.50 0.41 0.32NIC Nanded Purna 0.80 0.94 0.76NIC Nanded Vishnupuri 0.83 0.50 0.12AIC Abad Normal NMC Express Mukane 0.21 0.09 0.07CADA Jalgaon Hatnur 0.09 0.10 0.13CADA Nagpur Lower Wunna 0.38 0.50 0.26CADA Nashik Bhandardara 0.64 0.97 1.00CADA Nashik Darna 0.74 0.84 0.53CADA Nashik Gangapur 0.39 0.78 1.00CADA Nashik Kadva 0.30 0.30 0.60CADA Nashik Mula 0.74 0.93 0.66CADA Nashik Palkhed 0.18 0.33 0.17SIC Sangli UGC (Kaeranjwan) 0.00 0.00 0.00CADA Nashik UGC Ozerkhed 0.53 0.84 0.39CADA Nashik Waghad 0.30 0.73 0.48CADA Pune Ghod 0.79 0.79 0.78CADA Pune Kukadi 0.45 0.45 0.45CIPC Chandrapur Bor 0.30 0.43 0.41NIC Nanded Upper Penganga 0.31 0.35 0.30PIC Pune Chaskaman 0.46 0.46 0.46PIC Pune Khadakwasla 0.29 0.29 0.29PIC Pune NLBC 1.00 1.00 1.00PIC Pune NRBC 1.00 1.00 1.00PIC Pune Pawana 0.00 0.00 0.00UWPC Amravati Upper Wardha 0.42 0.37 0.24YIC Yavatmal Arunavati 0.61 0.43 0.24CADA Nagpur Surplus Bagh 0.93 1.00 1.00CADA Nagpur Itiahdoh 1.00 0.91 1.00CADA Nagpur Pench 0.64 0.72 0.84CADA Pune Abundant Krishna 0.34 0.34 0.34CIPC Chandrapur Asola Mendha 0.97 1.00 0.94CIPC Chandrapur Dina 0.87 0.93 0.86SIC Sangli Radhanagari 0.93 0.96 1.00SIC Sangli Tulashi 0.90 0.76 0.58SIC Sangli Warna 0.74 0.74 0.74TIC Thane Bhatsa 0.00 0.00 0.00TIC Thane Kal 0.11 0.75 1.00TIC Thane Surya 0.11 0.11 0.11
Indicator XIMajor Projects
Equity Performance

Plangroup Circle FY Avg LY 2010-11 TY 2011-12 Past Max Past Min AVG Per State TarHighly Deficit CADA Solapur 0.64 0.49 0.63 0.80 0.49 0.63Deficit AIC Akola 0.21 0.55 0.00 0.55 0.04
BIPC Buldhana 0.31 0.85 0.77 1.13 0.00CADA Abad 0.13 0.20 0.07 0.29 0.10CADA Beed 0.29 0.51 0.21 0.60 0.10CADA Jalgaon 0.33 0.20 0.12 0.43 0.13CADA Nashik 0.77 1.00 1.00 1.00 0.60NIC Nanded 0.19 0.26 0.24 0.26 0.06
Normal AIC Abad 0.46 0.62 0.88 1.00 0.00CADA Jalgaon 0.25 0.30 0.26 0.32 0.18CADA Nagpur 0.41 0.32 0.36 1.00 0.28CADA Nashik 0.72 0.84 0.73 0.84 0.57CADA Pune 0.73 0.76 0.95 0.91 0.47CIPC Chandrapur 0.26 0.30 0.21 0.35 0.19NIC Nanded 0.07 0.14 0.02 0.50 0.00PIC Pune 0.70 0.73 0.71 0.73 0.67UWPC Amravati 0.51 0.29 0.79 1.06 0.29YIC Yavatmal 0.06 0.00 0.11 0.09 0.00
Surplus CADA Nagpur 0.59 0.87 0.49 0.87 0.45 0.49Abundant CADA Pune 0.35 0.38 0.60 0.49 0.24
CIPC Chandrapur 0.42 0.30 0.87 0.83 0.23SIC Sangli 0.53 0.75 0.82 0.75 0.35TIC Thane 0.30 0.11 0.95 0.72 0.11
1
0.11
0.65
0.76
Indicator XII -IMajor Projects
Assessment Recovery Ratio (Irrigation)
0.00
0.20
0.40
0.60
0.80
1.00
CA
DA
Sol
apur
AIC
Ako
la
BIP
CB
uldh
ana
CA
DA
Aba
d
CA
DA
Bee
d
CA
DA
Jalg
aon
CA
DA
Nas
hik
NIC
Nan
ded
AIC
Aba
d
CA
DA
Jalg
aon
CA
DA
Nag
pur
CA
DA
Nas
hik
CA
DA
Pun
e
CIP
CC
hand
rapu
r
NIC
Nan
ded
PIC
Pun
e
UW
PC
Am
rava
tiY
ICY
avat
mal
CA
DA
Nag
pur
CA
DA
Pun
e
CIP
CC
hand
rapu
r
SIC
San
gli
TIC
Tha
ne
HighlyDeficit
Deficit Normal Surplus Abundant
Rat
io
FY Avg LY 2010-11 TY 2011-12 State Tar Past Max Past Min

Indicator XII -IMajor Projects
Assessment Recovery Ratio (Irrigation)
0.00
0.20
0.40
0.60
0.80
1.00
Bhi
ma
Man
jra
Maj
alga
on
Jaya
kwad
i (P
LBC
)
Girn
a
Pur
na
Vis
hnup
uri
Man
ar
Jaya
kwad
i PR
BC
Kat
epur
na
Nal
gang
a
Wan
(Am
rava
ti)
Low
er T
erna
Cha
naka
pur
Upp
er P
enga
nga
Aru
nava
ti
Bor
Hat
nur
Low
er W
unna
NR
BC
Mul
a
Gan
gapu
r
Dar
na
Upp
er W
ardh
a
NLB
C
NM
C E
xpre
ss
Gho
d
Wag
had
Bha
ndar
dara
Kuk
adi
Pal
khed
UG
C O
zerk
hed
Cha
skam
an
Paw
ana
UG
C (K
aera
njw
an)
Kha
dakw
asla
Kad
va
Itiah
doh
Bag
h
Pen
ch
Kris
hna
Aso
la M
endh
a
War
na
Bha
tsa
Rad
hana
gari
Sur
ya
Din
a
Tula
shi
Kal
HighlyDeficit
Deficit Normal Surplus Abundant
Rat
io
FY Avg TY- 2011-12 LY- 2010-11 StateTar Past Min Past Max
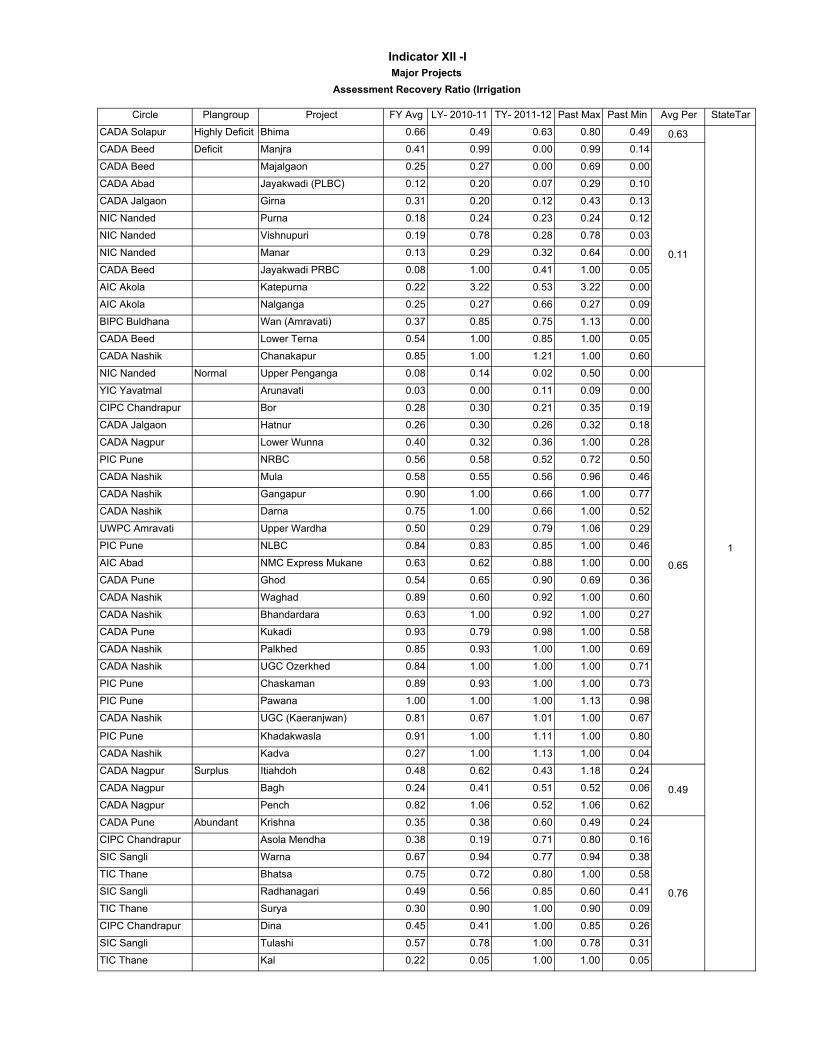
Circle Plangroup Project FY Avg LY- 2010-11 TY- 2011-12 Past Max Past Min Avg Per StateTar
CADA Solapur Highly Deficit Bhima 0.66 0.49 0.63 0.80 0.49 0.63CADA Beed Deficit Manjra 0.41 0.99 0.00 0.99 0.14
CADA Beed Majalgaon 0.25 0.27 0.00 0.69 0.00
CADA Abad Jayakwadi (PLBC) 0.12 0.20 0.07 0.29 0.10
CADA Jalgaon Girna 0.31 0.20 0.12 0.43 0.13
NIC Nanded Purna 0.18 0.24 0.23 0.24 0.12
NIC Nanded Vishnupuri 0.19 0.78 0.28 0.78 0.03
NIC Nanded Manar 0.13 0.29 0.32 0.64 0.00
CADA Beed Jayakwadi PRBC 0.08 1.00 0.41 1.00 0.05
AIC Akola Katepurna 0.22 3.22 0.53 3.22 0.00
AIC Akola Nalganga 0.25 0.27 0.66 0.27 0.09
BIPC Buldhana Wan (Amravati) 0.37 0.85 0.75 1.13 0.00
CADA Beed Lower Terna 0.54 1.00 0.85 1.00 0.05
CADA Nashik Chanakapur 0.85 1.00 1.21 1.00 0.60
NIC Nanded Normal Upper Penganga 0.08 0.14 0.02 0.50 0.00
YIC Yavatmal Arunavati 0.03 0.00 0.11 0.09 0.00
CIPC Chandrapur Bor 0.28 0.30 0.21 0.35 0.19
CADA Jalgaon Hatnur 0.26 0.30 0.26 0.32 0.18
CADA Nagpur Lower Wunna 0.40 0.32 0.36 1.00 0.28
PIC Pune NRBC 0.56 0.58 0.52 0.72 0.50
CADA Nashik Mula 0.58 0.55 0.56 0.96 0.46
CADA Nashik Gangapur 0.90 1.00 0.66 1.00 0.77
CADA Nashik Darna 0.75 1.00 0.66 1.00 0.52
UWPC Amravati Upper Wardha 0.50 0.29 0.79 1.06 0.29
PIC Pune NLBC 0.84 0.83 0.85 1.00 0.46
AIC Abad NMC Express Mukane 0.63 0.62 0.88 1.00 0.00
CADA Pune Ghod 0.54 0.65 0.90 0.69 0.36
CADA Nashik Waghad 0.89 0.60 0.92 1.00 0.60
CADA Nashik Bhandardara 0.63 1.00 0.92 1.00 0.27
CADA Pune Kukadi 0.93 0.79 0.98 1.00 0.58
CADA Nashik Palkhed 0.85 0.93 1.00 1.00 0.69
CADA Nashik UGC Ozerkhed 0.84 1.00 1.00 1.00 0.71
PIC Pune Chaskaman 0.89 0.93 1.00 1.00 0.73
PIC Pune Pawana 1.00 1.00 1.00 1.13 0.98
CADA Nashik UGC (Kaeranjwan) 0.81 0.67 1.01 1.00 0.67
PIC Pune Khadakwasla 0.91 1.00 1.11 1.00 0.80
CADA Nashik Kadva 0.27 1.00 1.13 1.00 0.04
CADA Nagpur Surplus Itiahdoh 0.48 0.62 0.43 1.18 0.24
CADA Nagpur Bagh 0.24 0.41 0.51 0.52 0.06
CADA Nagpur Pench 0.82 1.06 0.52 1.06 0.62
CADA Pune Abundant Krishna 0.35 0.38 0.60 0.49 0.24
CIPC Chandrapur Asola Mendha 0.38 0.19 0.71 0.80 0.16
SIC Sangli Warna 0.67 0.94 0.77 0.94 0.38
TIC Thane Bhatsa 0.75 0.72 0.80 1.00 0.58
SIC Sangli Radhanagari 0.49 0.56 0.85 0.60 0.41
TIC Thane Surya 0.30 0.90 1.00 0.90 0.09
CIPC Chandrapur Dina 0.45 0.41 1.00 0.85 0.26
SIC Sangli Tulashi 0.57 0.78 1.00 0.78 0.31
TIC Thane Kal 0.22 0.05 1.00 1.00 0.05
Indicator XII -IMajor Projects
Assessment Recovery Ratio (Irrigation
1
0.11
0.65
0.49
0.76

Plangroup Circle FY Avg LY 2010-11 TY 2011-12 Past Max Past Min AVG Per State TarHighly Deficit CADA Solapur 0.89 0.80 0.83 0.97 0.80 0.83Deficit AIC Akola 0.87 0.99 0.29 0.99 0.74
BIPC Buldhana 0.79 0.93 0.96 0.93 0.37CADA Abad 0.82 0.65 1.00 1.00 0.57CADA Beed 0.45 0.48 0.47 0.60 0.29CADA Jalgaon 0.85 0.70 0.68 1.00 0.70CADA Nashik 0.88 0.78 1.00 1.00 0.68NIC Nanded 0.63 0.67 0.59 0.85 0.29
Normal AIC Abad 1.00 1.00 0.00 1.00 0.00CADA Jalgaon 0.78 0.91 0.90 1.00 0.64CADA Nagpur 0.63 0.86 0.70 1.00 0.10CADA Nashik 0.91 0.90 0.96 0.93 0.89CADA Pune 0.92 0.99 0.92 0.99 0.84CIPC Chandrapur 0.91 1.00 0.00 1.00 0.60NIC Nanded 0.01 0.06 0.01 0.06 0.00PIC Pune 0.98 0.98 1.00 0.99 0.95UWPC Amravati 0.87 0.90 1.00 0.90 0.84YIC Yavatmal 0.39 0.48 1.00 0.70 0.00
Surplus CADA Nagpur 0.86 0.81 0.96 0.96 0.72 0.96Abundant CADA Pune 0.76 0.82 0.73 1.00 0.52
CIPC Chandrapur 1.25 0.00 0.00 1.53 0.00SIC Sangli 0.81 0.83 0.95 0.95 0.73TIC Thane 0.81 0.97 0.94 1.00 0.54
1
0.93
0.94
0.93
Indicator XII-NIMajor Projects
Assessment Recovery Ratio (Non Irrigation)
0.00
0.20
0.40
0.60
0.80
1.00C
AD
A S
olap
ur
AIC
Ako
la
BIP
C B
uldh
ana
CA
DA
Aba
d
CA
DA
Bee
d
CA
DA
Jal
gaon
CA
DA
Nas
hik
NIC
Nan
ded
AIC
Aba
d
CA
DA
Jal
gaon
CA
DA
Nag
pur
CA
DA
Nas
hik
CA
DA
Pun
e
CIP
C C
hand
rapu
r
NIC
Nan
ded
PIC
Pun
e
UW
PC
Am
rava
ti
YIC
Yav
atm
al
CA
DA
Nag
pur
CA
DA
Pun
e
CIP
C C
hand
rapu
r
SIC
San
gli
TIC
Tha
ne
HighlyDeficit
Deficit Normal Surplus Abundant
Rat
io
FY Avg LY 2010-11 TY 2011-12 State Tar Past Max Past Min

Indicator XII-NIMajor Projects
Assessment Recovery Ratio (Non Irrigation)
0.00
0.20
0.40
0.60
0.80
1.00
Bhi
ma
Jaya
kwad
i
Man
jra
Kat
epur
na
Pur
na
Girn
a
Vis
hnup
uri
Maj
alga
on
Man
ar
Nal
gang
a
Wan
(Am
rava
ti)
Jaya
kwad
i
Low
er T
erna
Cha
naka
pur
Bor
NM
C E
xpre
ss
Upp
er P
enga
nga
Low
er W
unna
Mul
a
Gho
d
Hat
nur
Dar
na
Gan
gapu
r
Pal
khed
NR
BC
NLB
C
Bha
ndar
dara
Wag
had
UG
C O
zerk
hed
UG
C
Kuk
adi
Cha
skam
an
Kha
dakw
asla
Paw
ana
Upp
er W
ardh
a
Aru
nava
ti
Kad
va
Itiah
doh
Pen
ch
Bag
h
Aso
la M
endh
a
Din
a
Kris
hna
Bha
tsa
Rad
hana
gari
Sur
ya
War
na
Tula
shi
Kal
HighlyDeficit
Deficit Normal Surplus Abundant
Rat
io
FY Avg TY- 2011-12 LY- 2010-11 StateTar Past Min Past Max

Circle Plangroup Project FY Avg LY- 2010-11 TY- 2011-12 Past Max Past Min Avg Per StateTar
CADA Solapur Highly Deficit Bhima 0.88 0.80 0.83 0.97 0.80 0.83CADA Beed Deficit Jayakwadi PRBC 0.25 0.35 0.17 0.61 0.17
CADA Beed Manjra 0.44 0.63 0.23 0.70 0.19
AIC Akola Katepurna 0.84 0.99 0.27 1.00 0.75
NIC Nanded Purna 0.22 0.39 0.39 0.39 0.01
CADA Jalgaon Girna 0.82 0.70 0.68 1.00 0.70
NIC Nanded Vishnupuri 0.92 0.77 0.72 1.00 0.00
CADA Beed Majalgaon 0.66 0.46 0.91 1.00 0.46
NIC Nanded Manar 0.88 0.96 0.92 1.00 0.00
AIC Akola Nalganga 0.85 1.00 0.95 1.00 0.11
BIPC Buldhana Wan (Amravati) 0.81 0.93 1.00 0.93 0.37
CADA Abad Jayakwadi (PLBC) 0.87 0.65 1.00 1.00 0.57
CADA Beed Lower Terna 0.63 0.39 1.00 1.00 0.13
CADA Nashik Chanakapur 0.87 0.78 1.00 1.00 0.68
CIPC Chandrapur Normal Bor 1.00 1.00 0.00 1.00 0.60
AIC Abad NMC Express Mukane 1.00 1.00 0.00 1.00 0.00
NIC Nanded Upper Penganga 0.02 0.06 0.01 0.06 0.00
CADA Nagpur Lower Wunna 0.59 0.86 0.70 1.00 0.10
CADA Nashik Mula 0.70 0.64 0.89 0.94 0.45
CADA Pune Ghod 0.93 0.99 0.89 0.99 0.87
CADA Jalgaon Hatnur 0.82 0.91 0.90 1.00 0.64
CADA Nashik Darna 0.94 0.90 0.92 1.00 0.73
CADA Nashik Gangapur 0.96 0.90 0.92 1.00 0.90
CADA Nashik Palkhed 0.96 1.00 0.95 1.00 0.73
PIC Pune NRBC 0.96 0.99 0.98 0.99 0.93
PIC Pune NLBC 0.99 1.00 0.99 1.00 0.96
CADA Nashik Bhandardara 0.58 0.99 1.00 1.00 0.31
CADA Nashik Waghad 0.76 0.69 1.00 1.00 0.60
CADA Nashik UGC Ozerkhed 0.97 1.00 1.00 1.00 0.89
CADA Nashik UGC (Kaeranjwan) 0.99 1.00 1.00 1.00 0.97
CADA Pune Kukadi 0.90 1.00 1.00 1.00 0.73
PIC Pune Chaskaman 0.97 1.00 1.00 1.00 0.85
PIC Pune Khadakwasla 0.98 0.98 1.00 1.00 0.92
PIC Pune Pawana 0.99 0.97 1.00 1.00 0.97
UWPC Amravati Upper Wardha 0.87 0.90 1.00 0.90 0.84
YIC Yavatmal Arunavati 0.41 0.48 1.00 0.70 0.00
CADA Nashik Kadva 1.00 1.00 1.00 1.00 1.00
CADA Nagpur Surplus Itiahdoh 0.10 0.03 0.44 1.00 0.00
CADA Nagpur Pench 0.85 0.82 0.97 0.96 0.72
CADA Nagpur Bagh 0.68 0.55 1.00 1.00 0.26
CIPC Chandrapur Abundant Asola Mendha 1.00 0.00 0.00 1.00 0.00
CIPC Chandrapur Dina 10.76 0.00 0.00 1.00 0.00
CADA Pune Krishna 0.80 0.82 0.73 1.00 0.52
TIC Thane Bhatsa 0.72 0.95 0.89 1.00 0.42
SIC Sangli Radhanagari 0.64 0.72 0.95 0.95 0.58
TIC Thane Surya 0.99 1.00 0.96 1.00 0.96
SIC Sangli Warna 0.91 0.93 0.98 1.00 0.80
SIC Sangli Tulashi 1.00 1.00 1.00 1.00 0.89
TIC Thane Kal 1.00 1.00 1.00 1.02 0.98
Indicator XII-NIMajor Projects
Assessment Recovery Ratio (Non Irrigation)
1
0.93
0.94
0.96
0.93
Medium Project
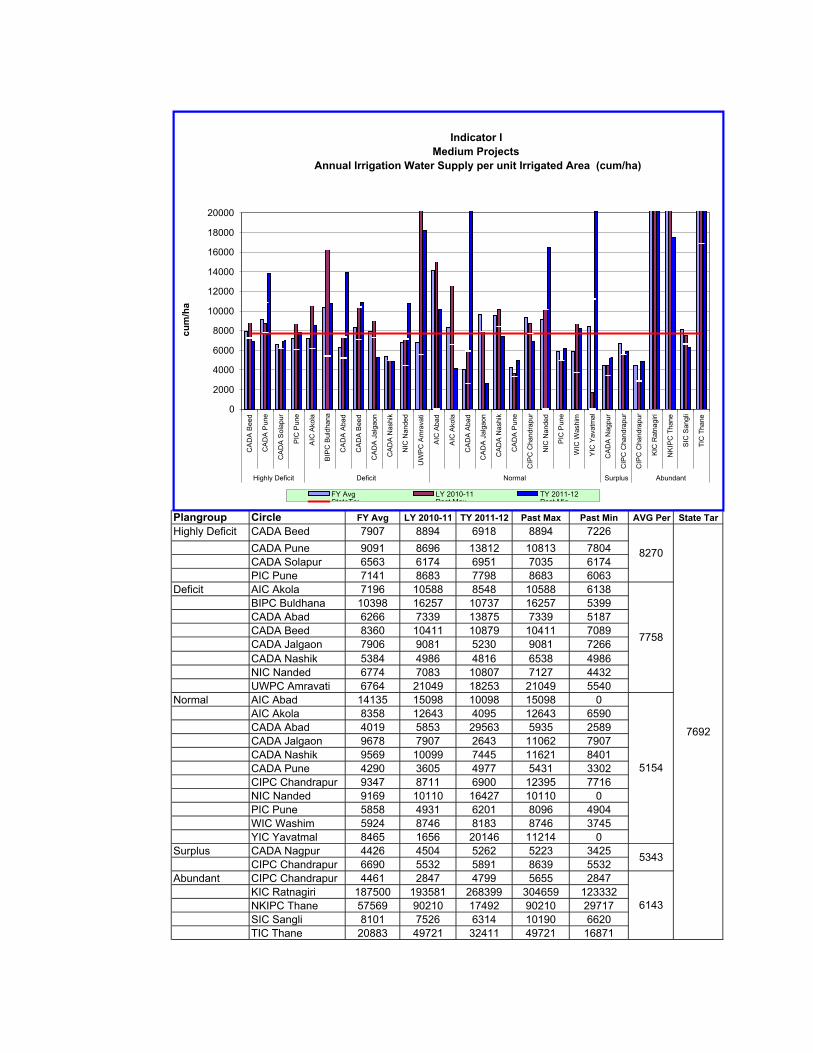
Plangroup Circle FY Avg LY 2010-11 TY 2011-12 Past Max Past Min AVG Per State TarHighly Deficit CADA Beed 7907 8894 6918 8894 7226
CADA Pune 9091 8696 13812 10813 7804CADA Solapur 6563 6174 6951 7035 6174PIC Pune 7141 8683 7798 8683 6063
Deficit AIC Akola 7196 10588 8548 10588 6138BIPC Buldhana 10398 16257 10737 16257 5399CADA Abad 6266 7339 13875 7339 5187CADA Beed 8360 10411 10879 10411 7089CADA Jalgaon 7906 9081 5230 9081 7266CADA Nashik 5384 4986 4816 6538 4986NIC Nanded 6774 7083 10807 7127 4432UWPC Amravati 6764 21049 18253 21049 5540
Normal AIC Abad 14135 15098 10098 15098 0AIC Akola 8358 12643 4095 12643 6590CADA Abad 4019 5853 29563 5935 2589CADA Jalgaon 9678 7907 2643 11062 7907CADA Nashik 9569 10099 7445 11621 8401CADA Pune 4290 3605 4977 5431 3302CIPC Chandrapur 9347 8711 6900 12395 7716NIC Nanded 9169 10110 16427 10110 0PIC Pune 5858 4931 6201 8096 4904WIC Washim 5924 8746 8183 8746 3745YIC Yavatmal 8465 1656 20146 11214 0
Surplus CADA Nagpur 4426 4504 5262 5223 3425CIPC Chandrapur 6690 5532 5891 8639 5532
Abundant CIPC Chandrapur 4461 2847 4799 5655 2847KIC Ratnagiri 187500 193581 268399 304659 123332NKIPC Thane 57569 90210 17492 90210 29717SIC Sangli 8101 7526 6314 10190 6620TIC Thane 20883 49721 32411 49721 16871
8270
7692
7758
5154
5343
6143
Indicator IMedium Projects
Annual Irrigation Water Supply per unit Irrigated Area (cum/ha)
0
2000
4000
6000
8000
10000
12000
14000
16000
18000
20000
CA
DA
Bee
d
CA
DA
Pun
e
CA
DA
Sol
apur
PIC
Pun
e
AIC
Ako
la
BIP
C B
uldh
ana
CA
DA
Aba
d
CA
DA
Bee
d
CA
DA
Jal
gaon
CA
DA
Nas
hik
NIC
Nan
ded
UW
PC
Am
rava
ti
AIC
Aba
d
AIC
Ako
la
CA
DA
Aba
d
CA
DA
Jal
gaon
CA
DA
Nas
hik
CA
DA
Pun
e
CIP
C C
hand
rapu
r
NIC
Nan
ded
PIC
Pun
e
WIC
Was
him
YIC
Yav
atm
al
CA
DA
Nag
pur
CIP
C C
hand
rapu
r
CIP
C C
hand
rapu
r
KIC
Rat
nagi
ri
NK
IPC
Tha
ne
SIC
San
gli
TIC
Tha
ne
Highly Deficit Deficit Normal Surplus Abundant
cum
/ha
FY Avg LY 2010-11 TY 2011-12StateTar Past Max Past Min

Circle Plangroup Project FY Avg LY- 2010-11 TY- 2011-12 Past Max Past Min Avg Per StateTar
CADA Beed Highly Deficit Rooty 10738 9148 0 28737 6914
CADA Beed Talwar 8150 8510 0 14286 6316
CADA Beed Mehakari 10568 8955 0 13835 8955
CADA Solapur Budhihal 3364 2393 0 9354 900
PIC Pune Nher 6711 5686 0 7316 0
CADA Beed Kambli 9501 8333 21 11739 8125
CADA Beed Turori 6348 8805 1174 8805 0
CADA Beed Kadi 12057 15707 4400 15707 9968
PIC Pune Andhali 7027 7462 4444 16364 0
CADA Beed Khasapur 6277 7375 4696 7375 5654
PIC Pune Ranand 5941 7612 5067 7612 5340
CADA Solapur Jawalgaon 6760 6909 5545 8612 6261
CADA Beed Khandeshwar 6456 7278 5667 7278 6008
CADA Beed Jakapur 8495 12459 5763 12459 0
CADA Beed Chandani 9410 10570 5966 11557 765
CADA Beed Ramganga 7159 11095 6917 11095 3159
CADA Beed Khandala 4291 7320 7036 7320 1469
CADA Solapur Hingani (Pangaon) 6898 6733 7210 7646 6441
CADA Solapur Ekrukh 6008 5117 7376 6627 4921
CADA Beed Sakat 6165 8506 7388 8506 3057
CADA Beed Kada 8749 9598 7553 11000 5432
CADA Beed Kurnoor 10597 8317 7733 11517 8317
PIC Pune Tisangi 8262 8283 7747 9626 6911
CADA Beed Banganga 7284 8088 8371 8881 5651
CADA Beed Benitura 12504 16840 9170 16840 10429
PIC Pune Mhaswad 7217 9779 9612 9779 4541
CADA Solapur Mangi 6630 6234 9964 7164 6133
CADA Beed Harni 8928 13286 11313 13286 6812
CADA Pune Khairy 6126 6336 12390 7420 3102
CADA Pune Sina 10207 9166 14316 12379 8923
CADA Abad Deficit Girja 6322 6332 0 8407 5059
CADA Abad Lahuki 4688 6771 0 6828 2601
CADA Jalgaon Bhokarbari 10349 9496 974 11735 6230
CADA Jalgaon Kanoli 7167 12781 2738 13205 3316
CADA Nashik Kelzar 4715 4780 2739 5651 3962
CADA Beed Rui 5339 7934 3018 7934 0
CADA Jalgaon Tondapur 2479 2798 3441 3097 0
CADA Jalgaon Burai 6305 8576 3780 8576 5242
CADA Jalgaon Rangawali 6844 9610 3809 9610 5790
CADA Abad Sukhna 5837 10111 3834 10111 2689
CADA Abad Jivrekha 7378 7569 4050 7569 0
CADA Beed Raigavan 6609 7902 4757 9075 3509
AIC Akola Uma 5914 9719 5326 9719 0
CADA Beed Devarjan 5791 6573 5338 9649 0
CADA Nashik Haranbari 5228 4657 5964 6186 4654
CADA Beed Mahasangvi 7230 5591 6014 9766 5591
CADA Jalgaon Manyad 9129 9493 6277 10183 8112
CADA Beed Saraswati 7707 8480 6580 9286 6154
CADA Abad Jui 3967 2578 6953 7667 0
CADA Beed Sakol 5551 6651 7563 6651 0
AIC Akola Dnyanganga 6051 7407 7611 7407 0
CADA Beed Sindphana 6458 10299 7745 10299 4435
NIC Nanded Mahalingi 6989 7527 7912 7527 0
CADA Jalgaon Agnawati 7879 8590 7926 8590 0
CADA Jalgaon Hiwara 7814 8146 8050 8261 5573
CADA Beed Bindusara 8503 6316 8451 10648 6316
AIC Akola Morna (Akola) 9689 13991 8792 13991 4545
CADA Nashik Nagyasakya 6569 6045 8862 8418 5513
NIC Nanded Kudala 6785 6497 9146 7795 4584
7758
8270 7692
Indicator I
Medium Projects
Annual Irrigation Water Supply per unit Irrigated Area (cum/ha)

Circle Plangroup Project FY Avg LY- 2010-11 TY- 2011-12 Past Max Past Min Avg Per StateTar
CADA Abad Kalyan Girja 5582 3103 9231 10017 1965
CADA Beed Bodhegaon 8772 9945 9442 14400 6140
CADA Beed Wan (Beed) 11132 12956 9468 12956 8835
CADA Beed Tiru 7514 11922 9557 11922 0
CADA Abad Khelna 5331 6273 9577 6667 0
NIC Nanded Karadkhed 5251 3094 9786 9034 0
AIC Akola Nirguna 7501 10373 9814 11356 5270
CADA Beed Kundlika 9033 11212 10390 12636 6921
BIPC Buldhana Mun 9992 17104 10737 17104 1636
CADA Abad Ajantha Andhari 9817 13069 10829 13069 2075
NIC Nanded Kundrala 7240 11603 11260 11603 2128
CADA Abad Gadadgad 4681 5099 11385 6225 3838
CADA Beed Sangameshwar
(Dokewadi)
8784 18571 11681 18571 5517
CADA Jalgaon Bori 8484 8268 11735 9547 6599
CADA Abad Purna Nevpur 3969 6660 11939 6955 1398
CADA Beed Borna 8883 8342 12355 12672 6834
CADA Beed Gharni 8119 8842 12397 10478 0
CADA Beed Terna 6165 5870 12713 8328 0
NIC Nanded Pethwadaj 8951 9134 14027 9134 0
CADA Abad Anjana Palashi 4238 8123 14290 8123 1573
CADA Beed Belpara 19369 22057 16312 28655 7565
AIC Akola Paldhag 8544 15277 17949 15277 5846
CADA Beed Tawarja 10166 11382 18055 13160 0
UWPC Amravati Shahanoor 9307 21049 18253 25631 5540
CADA Abad Dhamna 3924 3081 18321 6363 0
CADA Abad Karpara 7099 7730 18898 11856 3218
CADA Abad Galhati 12966 13079 27507 19632 8122
CADA Beed Renapur 11822 17529 28668 17529 7557
CADA Abad Masoli 10757 9612 31793 12885 0
CADA Beed Masalga 12083 16479 34288 16479 0
CADA Beed Whati 7614 7938 9407 11980 0
CADA Abad Pir Kalyan 4419 6252 38333 6692 0
CADA Abad Normal Narangi 4184 5552 0 5552 0
CADA Nashik Mand Ohol 11242 7542 0 14636 7542
CADA Nashik Bhojapur 9584 8538 0 16958 7942
CADA Abad Tembhapuri 3805 6128 0 6904 1475
CADA Jalgaon Panzra 6776 5168 1340 8996 5099
CADA Jalgaon Malangaon 8388 10257 2313 10257 5962
CADA Jalgaon Karwand 6502 7914 2914 8415 4728
AIC Akola Koradi 6757 12370 4095 12370 1000
CADA Jalgaon Aner 10091 8367 4162 15010 6622
PIC Pune Kasarsai 4831 4178 4316 7183 4178
CIPC Chandrapur Amal Nala 4630 2418 4852 7826 0
CADA Pune Visapur 4000 3605 4977 5431 3302
CADA Nashik Ghatshil Pargaon 6284 8255 5084 8255 4806
PIC Pune Vadiwale 4469 3972 5883 7227 3680
WIC Washim Sonal 6052 9030 6450 9030 0
CADA Nashik Adhala 11209 13307 6498 13683 9210
CIPC Chandrapur Dongargaon
(Wardha)
10025 8578 6769 13641 8282
CADA Jalgaon Abhora 7040 7064 6803 10582 5875
PIC Pune Nazare 6640 6997 8132 7076 5538
PIC Pune Shetphal 9024 8298 8207 14174 6795
CADA Abad Ambadi 5263 5506 8989 6235 339
CIPC Chandrapur Pothra 11197 12174 9339 12174 9409
NIC Nanded Nagzari 9556 8215 9889 10402 0
CADA Nashik Alandi 9519 10275 9920 10275 7797
WIC Washim Ekburji 5808 8214 9944 8214 3673
AIC Abad Shivna Takali 14135 15098 10098 15098 0
YIC Yavatmal Navargaon 8925 4077 12181 8977 0
CADA Jalgaon Suki 28872 17258 12386 37327 17258
CADA Abad Kolhi 6358 3772 12857 10946 2118
7758
5154
7692
7692

Circle Plangroup Project FY Avg LY- 2010-11 TY- 2011-12 Past Max Past Min Avg Per StateTar
NIC Nanded Dongargaon
(Nanded)
8949 12188 16471 12188 0
CADA Abad Dheku 4884 8750 17429 8750 2862
YIC Yavatmal Adan 6569 1402 21817 11572 0
NIC Nanded Loni 8993 10588 33185 10588 0
CADA Abad Bor Dahegaon 4732 5556 37174 12304 0
CADA Nagpur Surplus Rengepar 3351 3026 1689 3832 2976
CADA Nagpur Khairbanda 1553 1286 1690 2436 1286
CIPC Chandrapur Pakadigundam 4002 4916 2399 5163 0
CADA Nagpur Chorakhmara 2596 3014 2721 3288 2213
CADA Nagpur Sangrampur 2569 2434 3027 3270 2434
CADA Nagpur Sorna 2969 1873 3172 3956 1873
CADA Nagpur Bodalkasa 2841 3166 3207 3618 2499
CADA Nagpur Betekar Bothali 3137 3321 3438 4469 2003
CADA Nagpur Bagheda 1869 1770 3579 3039 1464
CIPC Chandrapur Chandai 4023 3216 4358 5479 3158
CADA Nagpur Chandpur 2124 2605 5090 7692 1723
CADA Nagpur Chulband 4590 4847 5093 5214 4058
CADA Nagpur Managadh 4388 4497 5331 6491 3010
CADA Nagpur Makardhokada-Saiki
Complex
6993 6891 6504 9066 4800
CADA Nagpur Pandhrabodi 5719 5839 6551 6620 0
CIPC Chandrapur Chargaon 7223 3993 7207 17915 3993
CIPC Chandrapur Labhansarad 5692 7350 8119 7350 3540
CADA Nagpur Kesarnala 12395 7081 9171 33035 7081
CIPC Chandrapur Panchadhara 18305 21133 10341 21133 15644
CADA Nagpur Umri 8784 8503 10410 12435 6461
CADA Nagpur Kanholibara 7895 9898 11120 9898 6469
CADA Nagpur Kolar 10130 12824 12094 16041 6498
CADA Nagpur Wunna 12189 17254 12989 17254 3433
CADA Nagpur Mordham 8755 10083 12990 10370 6733
CADA Nagpur Chandrabhaga
(Nagpur)
11542 13313 13884 13313 10532
CADA Nagpur Khekranala 25818 38716 15219 38716 12569
SIC Sangli Abundant Kadavi 8263 6872 3717 9408 6872
CIPC Chandrapur Naleshwar 3412 2566 4366 7000 2019
SIC Sangli Chikotra 6516 6954 4726 6954 5934
SIC Sangli Patgaon 10351 8678 4847 13201 8678
CIPC Chandrapur Ghorazari 4527 2994 4925 5876 2994
SIC Sangli Chitri 6781 4958 6121 21952 3982
SIC Sangli Jangamhatti 5940 6492 6153 6492 5177
SIC Sangli Kasari 8155 8042 8474 9208 6763
SIC Sangli Kumbhi 11496 11372 9084 12294 7988
NKIPC Thane Hetwane 62893 90210 17492 90210 29717
TIC Thane Wandri 41133 49721 32411 49721 27525
KIC Ratnagiri Natuwadi 217360 193581 268399 304659 123332
7692
5154
5343
6143
7692
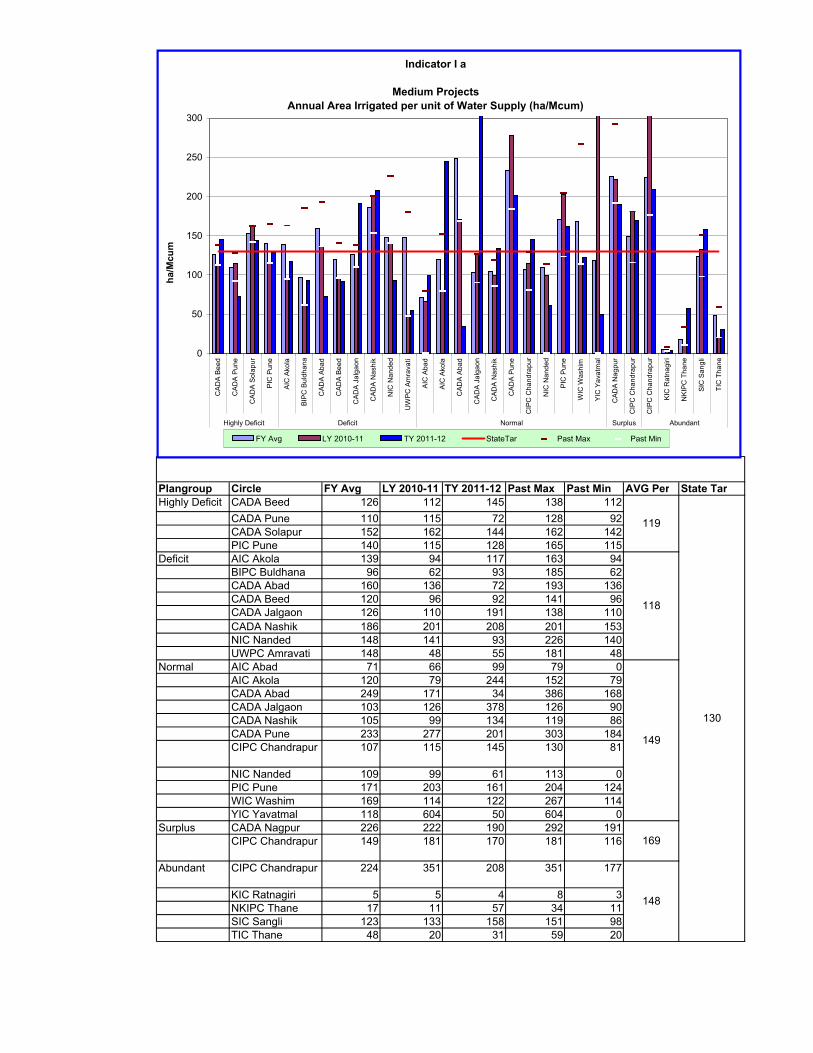
Plangroup Circle FY Avg LY 2010-11 TY 2011-12 Past Max Past Min AVG Per State TarHighly Deficit CADA Beed 126 112 145 138 112
CADA Pune 110 115 72 128 92CADA Solapur 152 162 144 162 142PIC Pune 140 115 128 165 115
Deficit AIC Akola 139 94 117 163 94BIPC Buldhana 96 62 93 185 62CADA Abad 160 136 72 193 136CADA Beed 120 96 92 141 96CADA Jalgaon 126 110 191 138 110CADA Nashik 186 201 208 201 153NIC Nanded 148 141 93 226 140UWPC Amravati 148 48 55 181 48
Normal AIC Abad 71 66 99 79 0AIC Akola 120 79 244 152 79CADA Abad 249 171 34 386 168CADA Jalgaon 103 126 378 126 90CADA Nashik 105 99 134 119 86CADA Pune 233 277 201 303 184CIPC Chandrapur 107 115 145 130 81
NIC Nanded 109 99 61 113 0PIC Pune 171 203 161 204 124WIC Washim 169 114 122 267 114YIC Yavatmal 118 604 50 604 0
Surplus CADA Nagpur 226 222 190 292 191CIPC Chandrapur 149 181 170 181 116
Abundant CIPC Chandrapur 224 351 208 351 177
KIC Ratnagiri 5 5 4 8 3NKIPC Thane 17 11 57 34 11SIC Sangli 123 133 158 151 98TIC Thane 48 20 31 59 20
130
119
118
149
169
148
Indicator I a
Medium ProjectsAnnual Area Irrigated per unit of Water Supply (ha/Mcum)
0
50
100
150
200
250
300
CAD
A Be
ed
CAD
A Pu
ne
CAD
A So
lapu
r
PIC
Pun
e
AIC
Ako
la
BIPC
Bul
dhan
a
CAD
A Ab
ad
CAD
A Be
ed
CAD
A Ja
lgao
n
CAD
A N
ashi
k
NIC
Nan
ded
UW
PC A
mra
vati
AIC
Aba
d
AIC
Ako
la
CAD
A Ab
ad
CAD
A Ja
lgao
n
CAD
A N
ashi
k
CAD
A Pu
ne
CIP
C C
hand
rapu
r
NIC
Nan
ded
PIC
Pun
e
WIC
Was
him
YIC
Yav
atm
al
CAD
A N
agpu
r
CIP
C C
hand
rapu
r
CIP
C C
hand
rapu
r
KIC
Rat
nagi
ri
NKI
PC T
hane
SIC
San
gli
TIC
Tha
ne
Highly Deficit Deficit Normal Surplus Abundant
ha/M
cum
FY Avg LY 2010-11 TY 2011-12 StateTar Past Max Past Min

Circle Plangroup Project FY Avg LY- 2010-11 TY- 2011-12 Past Max Past Min Avg Per StateTar
PIC Pune Highly Deficit Nher 149 176 0 176 0
CADA Solapur Budhihal 297 418 0 1111 107
CADA Beed Talwar 123 118 0 158 70
CADA Beed Rooty 93 109 0 145 35
CADA Beed Mehakari 95 112 0 112 72
CADA Pune Sina 98 109 70 112 81
CADA Pune Khairy 163 158 81 322 135
CADA Beed Harni 112 75 88 147 75
CADA Solapur Mangi 151 160 100 163 140
PIC Pune Mhaswad 139 102 104 220 102
CADA Beed Benitura 80 59 109 96 59
CADA Beed Banganga 137 124 119 177 113
PIC Pune Tisangi 121 121 129 145 104
CADA Beed Kurnoor 94 120 129 120 87
CADA Beed Kada 114 104 132 184 91
CADA Beed Sakat 162 118 135 327 118
CADA Solapur Ekrukh 166 195 136 203 151
CADA Solapur Hingani (Pangaon) 145 149 139 155 131
CADA Beed Khandala 233 137 142 681 137
CADA Beed Ramganga 140 90 145 317 90
CADA Beed Chandani 106 95 168 1308 87
CADA Beed Jakapur 118 80 174 190 0
CADA Beed Khandeshwar 155 137 176 166 137
CADA Solapur Jawalgaon 148 145 180 160 116
PIC Pune Ranand 168 131 197 187 131
CADA Beed Khasapur 159 136 213 177 136
PIC Pune Andhali 142 134 225 154 0
CADA Beed Kadi 83 64 227 100 64
CADA Beed Turori 158 114 852 222 0
CADA Beed Kambli 105 120 47619 123 85
CADA Abad Deficit Girja 158 158 0 198 119
CADA Abad Lahuki 213 148 0 384 146
CADA Abad Pir Kalyan 226 160 26 447 0
CADA Beed Masalga 83 61 29 190 0
CADA Abad Masoli 93 104 31 107 0
CADA Beed Renapur 85 57 35 132 57
CADA Abad Galhati 77 76 36 123 51
CADA Abad Karpara 141 129 53 311 84
CADA Abad Dhamna 255 325 55 325 0
UWPC Amravati Shahanoor 107 48 55 181 39
CADA Beed Tawarja 98 88 55 145 0
AIC Akola Paldhag 117 65 56 171 65
CADA Beed Belpara 52 45 61 132 35
CADA Abad Anjana Palashi 236 123 70 636 123
NIC Nanded Pethwadaj 112 109 71 159 0
CADA Beed Terna 162 170 79 170 0
CADA Beed Gharni 123 113 81 129 0
CADA Beed Borna 113 120 81 146 79
CADA Abad Purna Nevpur 252 150 84 716 144
CADA Jalgaon Bori 118 121 85 152 105
CADA Beed Sangameshwar
(Dokewadi)
114 54 86 181 54
CADA Abad Gadadgad 214 196 88 261 161
119
118
Indicator I a
Annual Area Irrigated per unit of Water
Medium Projects
130
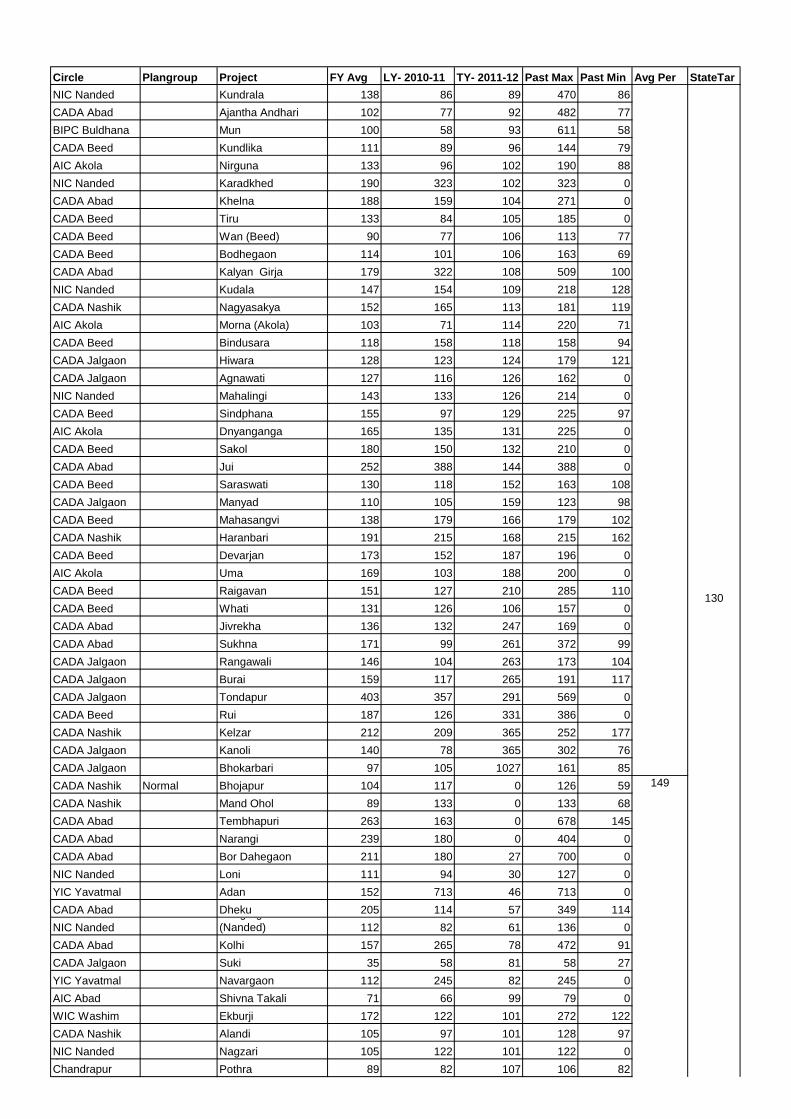
Circle Plangroup Project FY Avg LY- 2010-11 TY- 2011-12 Past Max Past Min Avg Per StateTar
NIC Nanded Kundrala 138 86 89 470 86
CADA Abad Ajantha Andhari 102 77 92 482 77
BIPC Buldhana Mun 100 58 93 611 58
CADA Beed Kundlika 111 89 96 144 79
AIC Akola Nirguna 133 96 102 190 88
NIC Nanded Karadkhed 190 323 102 323 0
CADA Abad Khelna 188 159 104 271 0
CADA Beed Tiru 133 84 105 185 0
CADA Beed Wan (Beed) 90 77 106 113 77
CADA Beed Bodhegaon 114 101 106 163 69
CADA Abad Kalyan Girja 179 322 108 509 100
NIC Nanded Kudala 147 154 109 218 128
CADA Nashik Nagyasakya 152 165 113 181 119
AIC Akola Morna (Akola) 103 71 114 220 71
CADA Beed Bindusara 118 158 118 158 94
CADA Jalgaon Hiwara 128 123 124 179 121
CADA Jalgaon Agnawati 127 116 126 162 0
NIC Nanded Mahalingi 143 133 126 214 0
CADA Beed Sindphana 155 97 129 225 97
AIC Akola Dnyanganga 165 135 131 225 0
CADA Beed Sakol 180 150 132 210 0
CADA Abad Jui 252 388 144 388 0
CADA Beed Saraswati 130 118 152 163 108
CADA Jalgaon Manyad 110 105 159 123 98
CADA Beed Mahasangvi 138 179 166 179 102
CADA Nashik Haranbari 191 215 168 215 162
CADA Beed Devarjan 173 152 187 196 0
AIC Akola Uma 169 103 188 200 0
CADA Beed Raigavan 151 127 210 285 110
CADA Beed Whati 131 126 106 157 0
CADA Abad Jivrekha 136 132 247 169 0
CADA Abad Sukhna 171 99 261 372 99
CADA Jalgaon Rangawali 146 104 263 173 104
CADA Jalgaon Burai 159 117 265 191 117
CADA Jalgaon Tondapur 403 357 291 569 0
CADA Beed Rui 187 126 331 386 0
CADA Nashik Kelzar 212 209 365 252 177
CADA Jalgaon Kanoli 140 78 365 302 76
CADA Jalgaon Bhokarbari 97 105 1027 161 85
CADA Nashik Normal Bhojapur 104 117 0 126 59
CADA Nashik Mand Ohol 89 133 0 133 68
CADA Abad Tembhapuri 263 163 0 678 145
CADA Abad Narangi 239 180 0 404 0
CADA Abad Bor Dahegaon 211 180 27 700 0
NIC Nanded Loni 111 94 30 127 0
YIC Yavatmal Adan 152 713 46 713 0
CADA Abad Dheku 205 114 57 349 114
NIC Nanded
Dongargaon
(Nanded) 112 82 61 136 0
CADA Abad Kolhi 157 265 78 472 91
CADA Jalgaon Suki 35 58 81 58 27
YIC Yavatmal Navargaon 112 245 82 245 0
AIC Abad Shivna Takali 71 66 99 79 0
WIC Washim Ekburji 172 122 101 272 122
CADA Nashik Alandi 105 97 101 128 97
NIC Nanded Nagzari 105 122 101 122 0CIPC
Chandrapur Pothra 89 82 107 106 82
118
130
130
149

Circle Plangroup Project FY Avg LY- 2010-11 TY- 2011-12 Past Max Past Min Avg Per StateTar
CADA Abad Ambadi 190 182 111 2950 160
PIC Pune Shetphal 111 121 122 147 71
PIC Pune Nazare 151 143 123 181 141
CADA Jalgaon Abhora 142 142 147 170 95CIPC
Chandrapur
Dongargaon
(Wardha) 100 117 148 121 73
CADA Nashik Adhala 89 75 154 109 73
WIC Washim Sonal 165 111 155 216 0
PIC Pune Vadiwale 224 252 170 272 138
CADA Nashik Ghatshil Pargaon 159 121 197 208 121
CADA Pune Visapur 250 277 201 303 184CIPC
Chandrapur Amal Nala 216 414 206 414 0
PIC Pune Kasarsai 207 239 232 239 139
CADA Jalgaon Aner 99 120 240 151 67
AIC Akola Koradi 148 81 244 1000 81
CADA Jalgaon Karwand 154 126 343 211 119
CADA Jalgaon Malangaon 119 97 432 168 97
CADA Jalgaon Panzra 148 193 746 196 111
CADA Nagpur Surplus Khekranala 39 26 66 80 26
CADA Nagpur Chandrabhaga
(Nagpur)
87 75 72 95 75
CADA Nagpur Mordham 114 99 77 149 96
CADA Nagpur Wunna 82 58 77 291 58
CADA Nagpur Kolar 99 78 83 154 62
CADA Nagpur Kanholibara 127 101 90 155 101
CADA Nagpur Umri 114 118 96 155 80CIPC
Chandrapur Panchadhara 55 47 97 64 47
CADA Nagpur Kesarnala 81 141 109 141 30CIPC
Chandrapur Labhansarad 176 136 123 283 136CIPC
Chandrapur Chargaon 138 250 139 250 56
CADA Nagpur Pandhrabodi 175 171 153 192 0
CADA Nagpur
Makardhokada-Saiki
Complex 143 145 154 208 110
CADA Nagpur Managadh 228 222 188 332 154
CADA Nagpur Chulband 218 206 196 246 192
CADA Nagpur Chandpur 471 384 196 580 130CIPC
Chandrapur Chandai 249 311 229 317 183
CADA Nagpur Bagheda 535 565 279 683 329
CADA Nagpur Betekar Bothali 319 301 291 499 224
CADA Nagpur Bodalkasa 352 316 312 400 276
CADA Nagpur Sorna 337 534 315 534 253
CADA Nagpur Sangrampur 389 411 330 411 306
CADA Nagpur Chorakhmara 385 332 368 452 304CIPC
Chandrapur Pakadigundam 250 203 417 272 0
CADA Nagpur Khairbanda 644 778 592 777 410
CADA Nagpur Rengepar 298 330 592 336 261
KIC Ratnagiri Abundant Natuwadi 5 5 4 8 3
TIC Thane Wandri 24 20 31 36 20
NKIPC Thane Hetwane 16 11 57 34 11
SIC Sangli Kumbhi 87 88 110 125 81
SIC Sangli Kasari 123 124 118 148 109
SIC Sangli Jangamhatti 168 154 163 193 154
SIC Sangli Chitri 147 202 163 251 46CIPC
Chandrapur Ghorazari 221 334 203 334 170
SIC Sangli Patgaon 97 115 206 115 76
SIC Sangli Chikotra 153 144 212 169 144CIPC
Chandrapur Naleshwar 293 390 229 495 143
SIC Sangli Kadavi 121 146 269 146 106
130
130
149
169
148

Plangroup Circle FY Avg LY 2010-11 TY 2011-12 Past Max Past Min AVG Per State Tar
Highly Deficit CADA Beed 0.42 0.48 0.15 0.49 0.35
CADA Pune 0.70 0.90 0.15 0.90 0.46
CADA Solapur 0.85 0.66 0.76 1.24 0.66
PIC Pune 0.89 1.10 0.42 1.10 0.59
Deficit AIC Akola 0.51 0.53 1.06 0.70 0.19
BIPC Buldhana 0.24 0.36 0.07 0.36 0.12
CADA Abad 0.86 0.78 0.00 0.99 0.74
CADA Beed 0.37 0.38 0.20 0.41 0.32
CADA Jalgaon 1.35 1.40 1.58 1.47 1.17
CADA Nashik 0.50 0.55 0.58 0.59 0.42
NIC Nanded 0.71 0.53 0.66 0.98 0.32
UWPC Amravati 0.32 0.27 0.26 0.40 0.24
Normal AIC Abad 0.11 0.16 1.71 0.16 0.00
AIC Akola 0.42 0.54 1.69 0.54 0.23
CADA Abad 0.68 0.63 0.00 1.02 0.35
CADA Jalgaon 1.48 1.57 2.44 1.63 1.23
CADA Nashik 0.16 0.98 1.20 1.17 0.00
CADA Pune 1.64 1.38 1.51 2.11 1.38
CIPC Chandrapur 0.41 0.39 0.43 0.56 0.27
NIC Nanded 0.54 0.41 0.40 0.85 0.00
PIC Pune 0.97 1.34 1.23 1.34 0.58
WIC Washim 0.55 0.57 1.12 0.87 0.12
YIC Yavatmal 0.44 0.29 0.46 0.86 0.00
Surplus CADA Nagpur 0.81 0.68 0.73 1.02 0.68
CIPC Chandrapur 0.52 0.63 0.51 0.63 0.30
Abundant CIPC Chandrapur 1.22 1.65 1.00 1.65 1.04
KIC Ratnagiri 0.06 0.06 0.04 0.10 0.00
NKIPC Thane 0.09 0.11 0.77 0.11 0.00
SIC Sangli 0.50 0.52 0.53 0.59 0.43
TIC Thane 0.53 0.19 0.29 0.69 0.19
1
0.45
0.28
0.69
0.61
0.50
0.00
0.10
0.20
0.30
0.40
0.50
0.60
0.70
0.80
0.90
1.00
1.10
CA
DA
Be
ed
CA
DA
Pu
ne
CA
DA
So
lap
ur
PIC
Pun
e
AIC
Akola
BIP
C B
uld
ha
na
CA
DA
Ab
ad
CA
DA
Be
ed
CA
DA
Ja
lgao
n
CA
DA
Na
sh
ik
NIC
Na
nd
ed
UW
PC
Am
rava
ti
AIC
Aba
d
AIC
Akola
CA
DA
Ab
ad
CA
DA
Ja
lgao
n
CA
DA
Na
sh
ik
CA
DA
Pu
ne
CIP
C C
ha
nd
rap
ur
NIC
Na
nd
ed
PIC
Pun
e
WIC
Wa
sh
im
YIC
Yava
tmal
CA
DA
Na
gpu
r
CIP
C C
ha
nd
rap
ur
CIP
C C
ha
nd
rap
ur
KIC
Ra
tna
giri
NK
IPC
Th
an
e
SIC
San
gli
TIC
Th
ane
Highly Deficit Deficit Normal Surplus Abundant
Rati
o
Indicator II Medium Projects
Potential Created and Utilised
FY Avg LY 2010-11 TY 2011-12 State Tar PastMax Past Min

Circle Plangroup Project FY Avg LY- 2010-11 TY- 2011-12 Past Max Past Min Avg Per StateTarCADA Beed Highly Deficit Mehakari 0.18 0.33 0.00 0.33 0.00PIC Pune Nher 0.64 0.67 0.00 0.69 0.00CADA Pune Sina 0.79 1.00 0.00 1.00 0.39CADA Beed Turori 0.88 1.00 0.00 1.00 0.00CADA Beed Talwar 0.35 0.36 0.00 0.50 0.00CADA Beed Rooty 0.11 0.14 0.00 0.14 0.00CADA Solapur Budhihal 1.13 0.17 0.00 8.09 0.17CADA Beed Jakapur 0.29 0.20 0.00 0.45 0.00CADA Beed Benitura 0.26 0.23 0.00 0.31 0.15CADA Beed Chandani 0.72 0.82 0.00 1.91 0.63CADA Beed Kambli 0.17 0.21 0.05 0.28 0.00CADA Beed Khandeshwar 0.65 0.57 0.06 0.92 0.53CADA Beed Kadi 0.42 0.36 0.08 0.71 0.14PIC Pune Andhali 0.27 0.69 0.09 0.69 0.00CADA Beed Sakat 0.51 0.44 0.12 2.50 0.34CADA Beed Kada 0.24 0.37 0.13 0.37 0.14CADA Beed Banganga 0.48 0.56 0.13 0.56 0.41CADA Beed Khasapur 0.68 0.58 0.19 0.78 0.58CADA Beed Kurnoor 0.54 0.53 0.24 0.64 0.46CADA Beed Ramganga 0.45 0.40 0.24 0.55 0.34CADA Beed Harni 0.42 0.26 0.26 0.82 0.26PIC Pune Mhaswad 1.40 1.51 0.30 1.65 0.78PIC Pune Ranand 0.83 1.15 0.32 1.15 0.46CADA Solapur Mangi 1.21 1.16 0.48 1.42 1.07CADA Beed Khandala 0.44 0.82 0.58 0.95 0.00CADA Pune Khairy 0.62 0.52 0.62 0.98 0.47CADA Solapur Ekrukh 1.90 0.80 0.69 37.63 0.80CADA Solapur Jawalgaon 0.61 0.63 0.72 0.89 0.33PIC Pune Tisangi 0.98 1.13 1.00 1.13 0.61CADA Solapur Hingani (Pangaon) 0.76 0.70 1.11 1.16 0.55CADA Beed Deficit Raigavan 0.53 0.79 0.00 0.79 0.00CADA Abad Khelna 1.01 1.11 0.00 2.67 0.58CADA Abad Lahuki 1.77 1.92 0.00 4.71 0.74CADA Abad Masoli 0.40 0.45 0.00 0.86 0.00CADA Abad Pir Kalyan 0.47 0.35 0.00 0.70 0.00CADA Abad Purna Nevpur 0.81 0.70 0.00 1.00 0.54CADA Beed Borna 0.20 0.18 0.00 1.80 0.14CADA Beed Rui 0.38 0.58 0.00 0.58 0.00CADA Jalgaon Bhokarbari 1.01 1.30 0.00 1.87 0.66CADA Abad Jivrekha 0.73 0.73 0.00 0.77 0.00CADA Abad Karpara 0.62 0.75 0.00 0.85 0.38CADA Abad Sukhna 2.33 1.20 0.00 3.27 1.17CADA Abad Jui 0.60 0.50 0.00 0.70 0.00CADA Abad Girja 1.17 0.91 0.00 1.38 0.91CADA Abad Galhati 0.56 0.39 0.00 1.00 0.39CADA Abad Gadadgad 0.63 0.60 0.00 0.97 0.56CADA Abad Dhamna 1.51 1.46 0.00 1.46 0.00CADA Abad Kalyan Girja 0.73 0.59 0.00 1.08 0.57CADA Abad Anjana Palashi 0.80 0.66 0.00 1.00 0.00CADA Abad Ajantha Andhari 0.61 0.64 0.00 0.74 0.00CADA Beed Bodhegaon 0.23 0.40 0.02 0.40 0.00CADA Beed Mahasangvi 0.32 0.32 0.03 0.52 0.23CADA Beed Wan (Beed) 0.23 0.23 0.04 0.37 0.16
Indicator IIMedium Projects
Potential Created and Utilised
1
0.45
0.28

Circle Plangroup Project FY Avg LY- 2010-11 TY- 2011-12 Past Max Past Min Avg Per StateTarCADA Beed Whati 0.41 0.47 0.40 0.47 0.00BIPC Buldhana Mun 0.23 0.34 0.07 0.34 0.13CADA Beed Saraswati 0.40 0.46 0.09 0.46 0.25CADA Beed Sangameshwar
(Dokewadi)0.44 0.41 0.09 0.60 0.12
CADA Beed Belpara 0.14 0.12 0.09 0.18 0.12CADA Beed Terna 0.58 0.75 0.11 0.75 0.00CADA Beed Kundlika 0.45 0.55 0.14 0.55 0.39CADA Beed Masalga 0.17 0.14 0.15 0.31 0.00CADA Beed Bindusara 0.33 0.22 0.16 0.56 0.22CADA Beed Renapur 0.27 0.20 0.18 0.59 0.20CADA Beed Tawarja 0.38 0.47 0.19 0.47 0.00UWPC Amravati Shahanoor 0.20 0.27 0.26 0.27 0.00CADA Beed Sindphana 0.56 0.31 0.26 0.90 0.31CADA Beed Devarjan 0.42 0.29 0.31 0.84 0.00CADA Nashik Haranbari 0.44 0.51 0.38 0.55 0.32CADA Beed Sakol 0.49 0.29 0.44 0.68 0.00CADA Nashik Nagyasakya 0.79 0.82 0.47 0.89 0.71CADA Beed Gharni 0.38 0.29 0.48 0.45 0.00NIC Nanded Pethwadaj 0.51 0.43 0.52 0.67 0.00NIC Nanded Karadkhed 0.50 0.50 0.54 0.76 0.00NIC Nanded Mahalingi 0.81 0.69 0.58 1.28 0.00CADA Beed Tiru 0.50 0.30 0.59 0.78 0.00AIC Akola Uma 0.75 0.50 0.81 1.01 0.00NIC Nanded Kundrala 0.60 0.42 0.88 1.45 0.42AIC Akola Morna (Akola) 0.53 0.68 0.90 0.77 0.18CADA Jalgaon Kanoli 1.46 1.27 1.00 1.72 1.04CADA Jalgaon Burai 1.76 1.62 1.00 1.98 0.95CADA Jalgaon Rangawali 1.05 0.57 1.08 1.41 0.57AIC Akola Paldhag 0.39 0.29 1.09 0.95 0.16CADA Jalgaon Manyad 1.49 1.81 1.25 2.03 1.13AIC Akola Nirguna 0.58 1.03 1.27 1.03 0.27CADA Nashik Kelzar 0.51 0.49 1.33 0.55 0.49NIC Nanded Kudala 0.99 0.88 1.34 1.32 0.82AIC Akola Dnyanganga 0.67 0.58 1.38 1.83 0.00CADA Jalgaon Tondapur 2.79 2.78 3.00 2.78 0.00CADA Jalgaon Bori 1.00 1.20 4.66 1.39 0.75CADA Jalgaon Hiwara 1.73 2.22 5.05 2.22 1.35CADA Jalgaon Agnawati 1.41 1.38 16.60 1.38 0.00CADA Abad Normal Bor Dahegaon 0.96 0.93 0.00 1.00 0.00CADA Nashik Mand Ohol 0.48 0.72 0.00 0.90 0.37CADA Abad Tembhapuri 0.50 0.35 0.00 1.00 0.35CADA Abad Narangi 1.28 1.87 0.00 1.87 0.00CADA Nashik Bhojapur 0.04 0.82 0.00 0.82 0.00CADA Abad Dheku 0.40 0.14 0.00 0.78 0.14CADA Abad Ambadi 0.69 1.12 0.00 1.12 0.00CADA Abad Kolhi 1.13 0.71 0.00 1.69 0.71NIC Nanded Loni 0.33 0.15 0.16 0.80 0.00CIPC Chandrapur Pothra 0.28 0.21 0.25 0.46 0.18YIC Yavatmal Navargaon 0.21 0.15 0.44 0.39 0.00YIC Yavatmal Adan 0.56 0.34 0.47 1.31 0.00NIC Nanded Dongargaon (Nanded) 0.57 0.57 0.66 0.77 0.00CIPC Chandrapur Dongargaon (Wardha) 0.61 0.71 0.75 0.72 0.47CIPC Chandrapur Amal Nala 0.62 1.59 0.84 1.59 0.00PIC Pune Kasarsai 0.62 0.67 0.89 0.73 0.31
0.69
1

Circle Plangroup Project FY Avg LY- 2010-11 TY- 2011-12 Past Max Past Min Avg Per StateTarNIC Nanded Nagzari 0.74 0.83 0.96 1.15 0.00CADA Jalgaon Panzra 1.93 1.39 1.00 2.53 1.39CADA Jalgaon Malangaon 2.09 2.07 1.00 2.39 1.74WIC Washim Sonal 0.47 0.61 1.02 1.02 0.00CADA Nashik Alandi 0.12 1.21 1.06 1.72 0.00PIC Pune Vadiwale 1.13 1.36 1.07 1.36 0.61PIC Pune Nazare 1.19 1.22 1.13 1.48 0.87CADA Nashik Adhala 1.16 0.97 1.22 1.54 0.97CADA Jalgaon Aner 1.25 1.42 1.25 1.61 0.95WIC Washim Ekburji 0.52 0.52 1.25 0.70 0.45CADA Pune Visapur 1.63 1.38 1.51 2.11 1.38AIC Akola Koradi 0.97 0.72 1.69 1.82 0.00AIC Abad Shivna Takali 0.11 0.16 1.71 0.16 0.00CADA Nashik Ghatshil Pargaon 0.87 0.74 1.91 1.23 0.66CADA Jalgaon Suki 1.64 2.48 2.40 2.55 0.17PIC Pune Shetphal 1.56 2.95 2.51 2.95 0.58CADA Jalgaon Abhora 1.79 2.00 2.66 2.04 0.27CADA Jalgaon Karwand 0.99 0.88 10.11 1.08 0.88CADA Nagpur Surplus Wunna 0.10 0.06 0.13 0.29 0.00CADA Nagpur Kesarnala 0.32 0.33 0.15 0.83 0.13CADA Nagpur Chandrabhaga
(Nagpur)0.32 0.19 0.20 0.58 0.19
CADA Nagpur Mordham 0.48 0.38 0.26 0.64 0.34CADA Nagpur Khekranala 0.20 0.11 0.28 0.52 0.11CIPC Chandrapur Labhansarad 0.53 1.59 0.29 1.59 0.29CIPC Chandrapur Panchadhara 0.28 0.22 0.32 0.34 0.22CADA Nagpur Kolar 0.35 0.25 0.48 0.63 0.22CIPC Chandrapur Chandai 0.48 1.59 0.51 1.59 0.36CADA Nagpur Umri 0.52 0.34 0.58 0.88 0.34CIPC Chandrapur Pakadigundam 0.48 0.32 0.59 0.86 0.00CADA Nagpur Managadh 0.69 0.63 0.62 1.24 0.47CADA Nagpur Khairbanda 1.10 0.92 0.64 1.32 0.92CADA Nagpur Makardhokada-Saiki
Complex0.72 0.56 0.69 1.23 0.48
CADA Nagpur Bagheda 1.15 0.72 0.76 7.61 0.66CADA Nagpur Bodalkasa 1.11 0.99 0.78 1.46 0.99CADA Nagpur Betekar Bothali 1.07 0.82 0.82 1.79 0.76CADA Nagpur Kanholibara 0.79 0.68 0.83 1.22 0.53CADA Nagpur Chorakhmara 1.12 0.97 0.90 1.49 0.94CIPC Chandrapur Chargaon 0.91 1.59 0.92 1.59 0.51CADA Nagpur Pandhrabodi 1.77 2.18 0.98 3.84 0.00CADA Nagpur Chulband 1.10 0.98 0.98 1.30 0.90CADA Nagpur Chandpur 1.58 1.01 1.13 2.36 0.83CADA Nagpur Sorna 1.53 1.35 1.21 2.56 1.07CADA Nagpur Rengepar 1.24 1.36 1.37 1.36 1.00CADA Nagpur Sangrampur 1.46 1.62 1.55 1.98 1.00KIC Ratnagiri Abundant Natuwadi 0.05 0.06 0.04 0.10 0.00SIC Sangli Kadavi 0.23 0.21 0.21 0.40 0.12TIC Thane Wandri 0.29 0.19 0.29 0.49 0.19SIC Sangli Kumbhi 0.35 0.37 0.36 0.38 0.27SIC Sangli Patgaon 0.35 0.38 0.39 0.41 0.28SIC Sangli Chikotra 0.53 0.50 0.53 0.56 0.48SIC Sangli Kasari 0.57 0.59 0.59 0.68 0.44NKIPC Thane Hetwane 0.10 0.11 0.77 0.11 0.00SIC Sangli Jangamhatti 0.91 0.82 0.88 1.32 0.82CIPC Chandrapur Ghorazari 1.26 1.59 1.00 1.59 1.06CIPC Chandrapur Naleshwar 1.31 1.79 1.00 1.91 1.00SIC Sangli Chitri 1.07 1.11 1.12 1.11 1.04
1
0.61
0.5

Plangroup Circle FY Avg LY 2010-11 TY 2011-12 Past Max Past Min AVG Per State TarHighly Deficit CADA Beed 22396 34020 133892 34020 11246
CADA Pune 23173 27808 199307 27808 17887CADA Solapur 31030 33779 35101 35123 23954PIC Pune 22530 24133 29183 25498 19907
Deficit AIC Akola 33755 30219 23375 41615 23764BIPC Buldhana 16669 26908 14897 26908 7785CADA Abad 24089 40178 29024 40178 16129CADA Beed 35920 43287 74596 45653 26155CADA Jalgaon 16566 14115 62752 19098 14115CADA Nashik 26883 26737 23863 28910 24669NIC Nanded 24263 27201 48700 28054 17507UWPC Amravati 58249 29252 36005 362176 12068
Normal AIC Abad 21606 21540 15887 27956 0AIC Akola 40486 33369 13559 55380 33369CADA Abad 15458 26832 8462 26832 5866CADA Jalgaon 33375 37612 29961 40754 10923CADA Nashik 48663 51897 97752 54692 26897CADA Pune 40847 35036 32670 62526 27929CIPC Chandrapur 21055 20587 10187 24018 18824NIC Nanded 20353 31626 91336 31626 10200PIC Pune 39664 41920 60580 49974 30365WIC Washim 27674 19346 21792 36543 19346YIC Yavatmal 10184 5241 6146 48325 0
Surplus CADA Nagpur 15186 12156 16163 28122 7999CIPC Chandrapur 13730 3191 15166 19083 3191
Abundant CIPC Chandrapur 15841 2623 23589 24500 2450KIC Ratnagiri 38003 47608 50293 47608 26368NKIPC Thane 11901 21678 19167 21678 7350SIC Sangli 49471 43008 52661 58033 43008TIC Thane 38495 14467 299973 54420 14467
31000
461087 40000
53244 23000
24900 25000
11210 25000
16053
Indicator IIIMedium Projects
Output per unit Irrigated Area
0
5000
10000
15000
20000
25000
30000
35000
40000
45000C
AD
A B
eed
CA
DA
Pun
e
CA
DA
Sol
apur
PIC
Pun
e
AIC
Ako
la
BIP
C B
uldh
ana
CA
DA
Aba
d
CA
DA
Bee
d
CA
DA
Jal
gaon
CA
DA
Nas
hik
NIC
Nan
ded
UW
PC
Am
rava
ti
AIC
Aba
d
AIC
Ako
la
CA
DA
Aba
d
CA
DA
Jal
gaon
CA
DA
Nas
hik
CA
DA
Pun
e
CIP
C C
hand
rapu
r
NIC
Nan
ded
PIC
Pun
e
WIC
Was
him
YIC
Yav
atm
al
CA
DA
Nag
pur
CIP
C C
hand
rapu
r
CIP
C C
hand
rapu
r
KIC
Rat
nagi
ri
NK
IPC
Tha
ne
SIC
San
gli
TIC
Tha
ne
Highly Deficit Deficit Normal Surplus Abundant
Rs.
/ha
FY Avg LY 2010-11 TY 2011-12 State Tar Past Max Past Min

Circle Plangroup Project FY Avg LY- 2010-11 TY- 2011-12 Past Max Past Min Avg Per StateTarPIC Pune Highly Deficit Nher 25572 26463 0 26579 0
CADA Beed Benitura 29311 38257 0 38257 19132
CADA Beed Chandani 25983 35771 0 35771 16401
CADA Beed Jakapur 28052 24280 0 31892 0
CADA Solapur Budhihal 9315 10303 0 10427 8174
CADA Pune Sina 23119 27239 0 27239 17769
CADA Beed Turori 26841 24696 0 31501 0
CADA Beed Talwar 10409 15982 0 15982 7290
CADA Beed Rooty 21368 40891 0 40891 8230
CADA Beed Mehakari 24542 44150 0 44150 8540
PIC Pune Andhali 40994 50861 14000 50861 0
PIC Pune Ranand 31592 27227 14771 54316 14878
CADA Beed Kambli 9619 18684 17771 19478 6555
CADA Beed Kada 9742 13637 20013 20659 6117
PIC Pune Tisangi 25623 26950 28482 37249 22183
CADA Solapur Hingani (Pangaon) 33672 40621 30357 40621 27968
CADA Pune Khairy 24551 31789 30512 31789 17872
CADA Solapur Ekrukh 34920 34383 37224 42060 30830
CADA Solapur Jawalgaon 28484 32942 37866 39424 24993
PIC Pune Mhaswad 16289 16208 37899 23201 13969
CADA Solapur Mangi 27387 32104 40268 32104 22449
CADA Beed Harni 28244 61896 54056 61896 9953
CADA Beed Ramganga 21219 27311 61032 35509 7983
CADA Beed Khandala 32099 51022 63497 56983 17321
CADA Beed Kadi 12171 26885 82267 26885 6912
CADA Beed Banganga 17175 20573 89377 22311 8015
CADA Beed Kurnoor 31465 52648 100691 52648 11853
CADA Beed Khasapur 22998 35041 178089 35041 9743
CADA Beed Sakat 30204 42824 263622 42824 7967
CADA Beed Khandeshwar 26388 39134 1123533 39134 10417
CADA Beed Deficit Rui 22608 23804 0 24842 0
CADA Beed Raigavan 51404 47466 0 112500 44891
CADA Beed Borna 35597 52319 0 52319 22482
CADA Abad Galhati 35162 41176 1391 41725 24352
AIC Akola Morna (Akola) 27529 30139 4704 49417 22279
AIC Akola Nirguna 40209 30129 5091 77719 30129
CADA Abad Pir Kalyan 26929 44654 7643 44654 0
CADA Abad Jui 20353 27327 9311 27327 11392
CADA Abad Girja 25203 35190 9804 35190 15376
CADA Jalgaon Bhokarbari 10977 11195 10469 12159 8854
CADA Abad Kalyan Girja 25449 40191 10673 40191 15219
BIPC Buldhana Mun 16489 27964 14897 27964 7824
CADA Jalgaon Kanoli 18277 15000 14920 33604 8149
CADA Beed Tiru 30013 24211 15053 38640 0
CADA Beed Whati 32665 35274 33075 56863 0
CADA Abad Karpara 18830 21509 15322 21509 12061
CADA Jalgaon Hiwara 22442 15485 17438 37283 13326
CADA Jalgaon Bori 12887 10415 18501 18738 10415
CADA Abad Purna Nevpur 11352 36150 20063 36150 0
CADA Nashik Kelzar 26500 27594 20090 39688 22764
CADA Abad Ajantha Andhari 26142 33752 20771 33752 11248
CADA Abad Dhamna 30473 34452 20889 34452 0
CADA Abad Jivrekha 20649 27826 21046 27826 0
NIC Nanded Pethwadaj 18684 23672 21547 23672 0
53244
24900
23000
Indicator III
25000
Medium ProjectsOutput per unit Irrigated Area

Circle Plangroup Project FY Avg LY- 2010-11 TY- 2011-12 Past Max Past Min Avg Per StateTarCADA Nashik Haranbari 29121 28970 25938 31169 27910
CADA Jalgaon Tondapur 23689 20189 27863 31938 20184
AIC Akola Paldhag 24478 27277 29319 39523 14177
CADA Nashik Nagyasakya 20684 20849 30134 24026 17065
AIC Akola Uma 34369 33363 32281 34971 0
CADA Beed Devarjan 40524 33768 33093 72356 0
CADA Abad Khelna 26259 38169 33107 38169 13773
CADA Jalgaon Agnawati 19584 17058 33305 29205 17058
CADA Abad Gadadgad 50029 65102 34689 65102 27359
UWPC Amravati Shahanoor 77177 29252 36005 362176 15019
CADA Beed Gharni 31460 24453 36150 44871 0
CADA Beed Bindusara 15770 38406 38571 38406 6479
CADA Abad Anjana Palashi 22890 49320 38806 49320 0
CADA Abad Lahuki 28742 43922 39188 43922 14795
CADA Beed Sakol 30468 27705 41055 56259 0
AIC Akola Dnyanganga 31359 32031 41183 40093 0
NIC Nanded Kudala 33695 30216 42252 40032 17950
CADA Beed Masalga 43488 48181 42341 56759 0
CADA Beed Sindphana 27403 48831 49357 48831 19005
NIC Nanded Kundrala 24094 32668 50901 32668 15928
CADA Jalgaon Rangawali 21267 24852 51366 27065 17464
NIC Nanded Mahalingi 17205 19781 52143 19781 0
CADA Beed Renapur 43640 51183 54289 64595 36419
CADA Beed Tawarja 45881 61396 55119 70475 0
NIC Nanded Karadkhed 31748 31336 70612 34690 0
CADA Abad Masoli 43023 47069 74111 50342 16056
CADA Beed Belpara 18189 41977 88456 41977 2872
CADA Abad Sukhna 23973 50338 90757 50338 15823
CADA Jalgaon Burai 15223 17130 101120 17932 13529
CADA Jalgaon Manyad 12089 10215 124617 26627 9365
CADA Beed Kundlika 36411 51169 137681 51169 25378
CADA Beed Saraswati 33903 51797 151957 51797 24603
CADA Beed Wan (Beed) 26707 41144 158957 57365 5555
CADA Beed Mahasangvi 12546 25429 189000 25429 6433
CADA Beed Terna 39377 46975 287384 46975 0
CADA Beed Sangameshwar (Dokewadi)
36303 57277 358203 95458 17206
CADA Beed Bodhegaon 32672 43017 597889 43017 16566
CADA Nashik Normal Bhojapur 31832 28384 0 56594 27067
YIC Yavatmal Adan 6531 925 927 61358 0
CADA Jalgaon Karwand 13889 14577 2584 19771 12046
CADA Abad Tembhapuri 15814 22728 3167 28953 0
CADA Abad Ambadi 24362 28024 4076 28024 18161
CADA Abad Bor Dahegaon 16422 26428 6378 26428 0
CADA Abad Dheku 21236 33094 6969 33094 16621
CADA Abad Kolhi 19858 23581 7307 23581 13034
CIPC Chandrapur Amal Nala 11216 1205 7756 17922 0
CIPC Chandrapur Pothra 21532 22538 12103 24175 16852
CADA Jalgaon Malangaon 22874 47809 12740 47809 9123
AIC Akola Koradi 21131 19670 13559 22870 416
CADA Jalgaon Aner 37650 53659 14522 53659 18478
CIPC Chandrapur Dongargaon (Wardha) 28802 36320 15474 36320 23025
AIC Abad Shivna Takali 21606 21540 15887 27956 0
CADA Nashik Ghatshil Pargaon 14586 13898 19327 17275 10649
WIC Washim Ekburji 27004 19751 21782 40757 19751
2500011210

Circle Plangroup Project FY Avg LY- 2010-11 TY- 2011-12 Past Max Past Min Avg Per StateTarWIC Washim Sonal 23794 19079 21801 31863 0
CADA Jalgaon Panzra 10737 10703 24773 11995 2277
CADA Nashik Mand Ohol 17540 15902 28125 19697 15902
CADA Pune Visapur 35254 35036 32670 62526 27929
YIC Yavatmal Navargaon 29414 38541 47933 38541 0
CADA Abad Narangi 13406 28302 51135 28302 0
PIC Pune Vadiwale 46950 45130 57946 75847 44591
PIC Pune Shetphal 39242 46574 58122 61175 20900
CADA Nashik Adhala 21241 25582 59049 25582 17472
PIC Pune Kasarsai 37631 39571 61687 44041 34446
PIC Pune Nazare 24676 31350 66552 46965 19135
NIC Nanded Dongargaon (Nanded) 17840 19849 81916 19849 10200
NIC Nanded Loni 19482 35545 95124 35545 0
NIC Nanded Nagzari 30229 38403 97097 38403 0
CADA Jalgaon Abhora 64108 48917 126186 94725 43377
CADA Nashik Alandi 82737 84651 137328 85326 56594
CADA Jalgaon Suki 94136 58791 141809 830511 34749
CIPC Chandrapur Surplus Chargaon 9690 1886 1831 18840 1886
CADA Nagpur Khairbanda 5805 5720 3080 9744 3190
CADA Nagpur Pandhrabodi 10929 9337 10364 13914 0
CADA Nagpur Sangrampur 9250 9680 11004 12091 1448
CADA Nagpur Makardhokada-Saiki Complex
13013 13525 11336 28878 496
CIPC Chandrapur Pakadigundam 13423 1100 11740 17879 0
CADA Nagpur Bodalkasa 11242 13255 13199 13255 6452
CADA Nagpur Chorakhmara 11330 11040 13201 16500 8800
CADA Nagpur Chulband 15226 14444 13509 15707 9912
CADA Nagpur Betekar Bothali 10945 10316 13810 14641 7425
CADA Nagpur Mordham 9253 9363 14435 14133 8869
CADA Nagpur Sorna 11070 10927 14506 18302 7423
CADA Nagpur Chandrabhaga (Nagpur)
13116 13501 14526 14352 10151
CIPC Chandrapur Panchadhara 19825 14963 14544 22916 14963
CADA Nagpur Bagheda 13394 14432 15372 16262 10508
CIPC Chandrapur Labhansarad 8294 1114 15403 13081 1114
CADA Nagpur Chandpur 13032 15067 17047 1240000 5183
CADA Nagpur Wunna 30810 20388 18425 67500 18938
CADA Nagpur Kesarnala 21824 19149 20316 58066 15221
CADA Nagpur Kanholibara 18059 10634 22438 2128045 7296
CADA Nagpur Umri 17488 20415 22540 20415 15777
CADA Nagpur Kolar 15730 16520 26711 18692 11459
CADA Nagpur Rengepar 10512 9737 27045 14399 5736
CADA Nagpur Khekranala 15527 21388 30579 21388 10485
CADA Nagpur Managadh 13395 11614 40000 19712 7245
CIPC Chandrapur Chandai 13619 2306 40013 24547 2304
CIPC Chandrapur Abundant Naleshwar 13674 2953 11690 24500 2450
NKIPC Thane Hetwane 12345 21678 19167 21678 7350
CIPC Chandrapur Ghorazari 13641 2450 27040 24500 2450
SIC Sangli Chitri 42276 42141 46460 43177 41510
SIC Sangli Jangamhatti 44999 43115 47797 59021 33379
SIC Sangli Chikotra 45336 36563 47919 49216 36563
SIC Sangli Kasari 48033 40434 48827 59819 34205
KIC Ratnagiri Natuwadi 38047 47608 50293 47608 26368
SIC Sangli Kumbhi 46096 45278 56877 87593 45278
SIC Sangli Patgaon 50386 44286 65577 61284 44160
SIC Sangli Kadavi 50843 57026 71979 60662 28917
TIC Thane Wandri 11297 14467 299973 18300 0
40000461087
3100016053

Plangroup Circle FY Avg LY 2010-11 TY 2011-12 Past Max Past Min AVG Per State TarHighly Deficit CADA Beed 3.03 4.76 6.05 4.76 1.59
CADA Pune 3.65 5.37 8.14 5.44 2.08CADA Solapur 7.06 9.45 7.64 9.45 5.07PIC Pune 5.14 6.07 9.65 6.07 4.42
Deficit AIC Akola 3.83 4.64 4.42 5.28 3.27BIPC Buldhana 1.88 2.45 1.52 4.45 0.90CADA Abad 7.21 11.56 12.75 11.56 5.19CADA Beed 4.35 5.06 4.12 5.06 3.88CADA Jalgaon 4.66 4.96 22.03 7.33 3.63CADA Nashik 6.33 6.67 6.37 7.00 5.65NIC Nanded 3.66 3.61 6.30 4.55 3.42UWPC Amravati 10.16 5.13 7.86 21.78 2.50
Normal AIC Abad 1.53 1.43 2.16 2.22 0.00AIC Akola 3.47 5.34 4.57 5.34 2.10CADA Abad 5.96 9.70 4.19 9.70 2.80CADA Jalgaon 12.23 20.72 30.28 20.72 2.97CADA Nashik 1.76 13.01 22.36 15.85 0.13CADA Pune 15.62 12.84 11.01 19.16 12.84CIPC Chandrapur 3.00 3.18 1.45 3.18 2.82NIC Nanded 3.37 5.34 8.85 5.34 0.00PIC Pune 7.89 10.29 12.77 10.29 4.42WIC Washim 4.05 3.47 4.46 9.76 3.47YIC Yavatmal 1.12 3.68 0.67 8.42 0.00
Surplus CADA Nagpur 3.57 2.79 3.31 5.90 2.41CIPC Chandrapur 2.29 0.60 2.31 3.13 0.60
Abundant CIPC Chandrapur 3.56 0.92 4.91 5.16 0.71KIC Ratnagiri 0.20 0.25 0.19 0.31 0.09NKIPC Thane 0.21 0.24 1.10 0.32 0.11SIC Sangli 4.03 3.72 4.33 4.96 3.24TIC Thane 1.84 0.29 9.26 3.06 0.29
3.78 3.15
5.53 2.99
2.30 3.15
2.90 4.05
4.37 5.40
Indicator IVMedium Projects
Output per unit Irrigation Water Supply
0.00
1.00
2.00
3.00
4.00
5.00
6.00
CA
DA
Bee
d
CA
DA
Pun
e
CA
DA
Sol
apur
PIC
Pun
e
AIC
Ako
la
BIP
C B
uldh
ana
CA
DA
Aba
d
CA
DA
Bee
d
CA
DA
Jal
gaon
CA
DA
Nas
hik
NIC
Nan
ded
UW
PC A
mra
vati
AIC
Aba
d
AIC
Ako
la
CA
DA
Aba
d
CA
DA
Jal
gaon
CA
DA
Nas
hik
CA
DA
Pun
e
CIP
C C
hand
rapu
r
NIC
Nan
ded
PIC
Pun
e
WIC
Was
him
YIC
Yav
atm
al
CA
DA
Nag
pur
CIP
C C
hand
rapu
r
CIP
C C
hand
rapu
r
KIC
Rat
nagi
ri
NK
IPC
Tha
ne
SIC
San
gli
TIC
Tha
ne
Highly Deficit Deficit Normal Surplus Abundant
Rs.
/cum
FY Avg LY 2010-11 TY 2011-12 State Tar Past Max Past Min

Circle Plangroup Project FY Avg LY- 2010-11 TY- 2011-12 Past Max Past Min Avg Per StateTarCADA Beed Highly Deficit Talwar 1.87 2.74 0.00 2.74 0.56PIC Pune Nher 8.17 11.51 0.00 11.51 0.00CADA Solapur Budhihal 6.81 10.40 0.00 97.41 5.57CADA Beed Rooty 2.29 4.95 0.00 4.95 0.42CADA Beed Mehakari 3.52 8.53 0.00 8.53 0.93CADA Beed Kada 1.33 2.30 1.09 2.30 0.76CADA Beed Banganga 2.70 2.91 2.61 4.52 1.23CADA Beed Harni 2.88 3.63 3.69 5.20 1.35CADA Beed Kadi 1.74 3.52 3.74 3.52 0.79CADA Beed Ramganga 3.06 2.32 3.85 5.18 1.58CADA Beed Benitura 2.37 2.27 4.29 4.38 1.59CADA Beed Khandala 7.87 9.21 4.69 11.97 4.12CADA Pune Khairy 4.73 6.35 5.31 7.92 3.23CADA Beed Kurnoor 3.05 7.64 5.53 7.64 1.13CADA Solapur Hingani (Pangaon) 8.68 12.21 5.81 12.21 5.21CADA Beed Jakapur 3.68 2.15 7.04 6.64 0.00CADA Solapur Jawalgaon 6.58 10.35 7.59 10.35 4.13PIC Pune Tisangi 5.75 7.21 7.81 7.21 4.18CADA Beed Chandani 2.74 4.66 8.12 19.48 1.27CADA Beed Sakat 5.02 5.35 8.62 7.76 1.20CADA Solapur Ekrukh 12.97 12.54 8.79 121.59 7.29CADA Pune Sina 3.59 5.24 9.00 5.62 1.87CADA Beed Khasapur 3.75 4.46 10.16 4.89 1.81CADA Solapur Mangi 4.86 6.18 13.38 6.18 3.02PIC Pune Ranand 12.62 12.62 13.41 14.64 3.69CADA Beed Khandeshwar 4.17 5.77 14.54 5.77 1.65PIC Pune Andhali 16.40 26.57 16.27 26.57 0.00PIC Pune Mhaswad 3.32 3.02 20.72 6.07 3.02CADA Beed Turori 6.53 7.08 31.22 7.53 0.00CADA Beed Kambli 1.12 3.66 311.00 3.66 0.61CADA Abad Deficit Galhati 5.73 7.02 0.51 8.70 3.57AIC Akola Nirguna 4.75 3.99 0.99 6.06 3.36AIC Akola Morna (Akola) 2.88 4.34 1.10 9.06 1.66CADA Beed Masalga 3.63 2.92 1.23 6.34 0.00BIPC Buldhana Mun 2.08 2.50 1.52 9.67 0.91CADA Beed Tiru 3.75 2.03 1.58 6.23 0.00CADA Beed Renapur 3.09 2.10 1.89 6.36 2.10CADA Beed Whati 4.47 4.51 3.52 5.94 0.00NIC Nanded Pethwadaj 2.06 2.11 1.98 8.30 0.00CADA Beed Belpara 0.91 1.40 2.12 2.17 0.13CADA Beed Gharni 3.36 2.75 2.92 3.92 0.00CADA Abad Karpara 3.59 4.40 3.01 5.53 1.49CADA Beed Tawarja 5.72 8.07 3.05 8.07 0.00CADA Beed Kundlika 5.33 7.16 3.29 7.16 2.63AIC Akola Paldhag 3.01 3.04 3.52 5.75 1.53CADA Beed Wan (Beed) 2.30 3.99 4.00 4.27 0.45CADA Beed Bodhegaon 4.45 8.46 4.10 8.46 1.32CADA Beed Mahasangvi 2.02 4.86 4.20 4.86 0.67CADA Beed Borna 2.85 3.60 4.41 4.07 2.08CADA Nashik Nagyasakya 4.07 4.65 4.50 4.65 3.31CADA Beed Bindusara 1.82 5.52 4.54 5.52 0.80CADA Beed Saraswati 4.77 8.09 4.61 8.09 3.21CADA Beed Sindphana 5.03 4.70 5.11 8.66 3.32NIC Nanded Kundrala 3.20 2.61 5.43 8.09 2.61
5.53
3.78 3.15
Indicator IVMedium Projects
Output per unit Irrigation Water Supply
2.99

Circle Plangroup Project FY Avg LY- 2010-11 TY- 2011-12 Past Max Past Min Avg Per StateTarCADA Beed Sakol 5.01 3.48 5.43 7.29 0.00CADA Jalgaon Kanoli 5.80 6.56 5.45 22.48 1.86CADA Nashik Haranbari 7.15 7.67 5.87 7.67 6.67CADA Jalgaon Bori 2.75 3.09 5.88 3.40 1.78CADA Beed Devarjan 5.85 4.76 6.20 8.27 0.00CADA Abad Pir Kalyan 8.09 8.65 6.71 11.99 0.00CADA Beed Terna 6.47 10.57 6.76 10.57 0.00AIC Akola Uma 5.00 4.73 6.77 5.11 0.00NIC Nanded Mahalingi 2.73 3.02 7.52 3.02 0.00NIC Nanded Kudala 4.86 6.18 7.65 6.18 1.84AIC Akola Dnyanganga 5.12 7.01 7.69 7.01 0.00UWPC Amravati Shahanoor 8.30 5.13 7.86 21.78 1.66CADA Beed Raigavan 10.58 11.91 8.16 16.67 5.61CADA Abad Purna Nevpur 3.34 10.09 8.40 10.09 0.00CADA Abad Kalyan Girja 10.61 32.71 8.64 32.71 5.19CADA Nashik Kelzar 6.73 6.83 8.98 11.77 6.04CADA Beed Sangameshwar
(Dokewadi)4.89 4.46 9.01 7.69 3.27
CADA Jalgaon Hiwara 14.31 10.04 9.47 24.12 6.92CADA Abad Masoli 4.17 4.90 9.92 4.90 0.00CADA Abad Jivrekha 5.13 7.88 11.25 7.88 0.00CADA Abad Jui 11.64 16.92 11.31 19.05 0.00NIC Nanded Karadkhed 6.35 8.09 13.24 8.09 0.00CADA Jalgaon Rangawali 6.39 5.49 13.49 9.39 3.14CADA Abad Khelna 11.60 13.21 14.73 43.33 0.00CADA Abad Ajantha Andhari 5.67 5.24 14.78 23.82 3.42CADA Abad Dhamna 14.26 27.78 15.56 27.78 0.00CADA Abad Anjana Palashi 7.84 25.21 17.39 25.21 0.00CADA Abad Gadadgad 17.82 22.37 18.44 22.37 11.52CADA Jalgaon Agnawati 11.45 9.00 19.03 31.83 0.00CADA Abad Girja 9.06 15.37 22.68 15.37 2.26CADA Abad Lahuki 20.21 29.89 30.37 29.89 7.72CADA Jalgaon Manyad 2.97 2.90 30.92 4.31 2.68CADA Jalgaon Tondapur 133.49 35.91 34.40 175.42 0.00CADA Jalgaon Burai 5.08 9.35 47.04 9.35 2.80CADA Beed Rui 5.19 7.24 62.03 7.52 0.00CADA Abad Sukhna 10.24 9.99 65.65 11.56 9.19CADA Jalgaon Bhokarbari 3.33 3.51 155.05 10.18 1.75CADA Nashik Normal Mand Ohol 2.29 3.04 0.00 3.04CADA Nashik Bhojapur 0.29 10.25 0.00 10.25 0.07YIC Yavatmal Adan 1.04 0.75 0.10 14.89 0.00CADA Abad Tembhapuri 6.33 7.16 1.17 14.66 0.00CIPC Chandrapur Pothra 2.29 2.11 1.23 2.81 1.76CADA Abad Ambadi 8.39 11.03 1.56 185.55 3.42CIPC Chandrapur Amal Nala 2.66 0.50 1.60 3.67 0.00AIC Abad Shivna Takali 1.53 1.43 2.16 2.22 0.00CIPC Chandrapur Dongargaon
(Wardha)5.17 7.60 2.50 7.60 3.32
CADA Abad Bor Dahegaon 5.85 13.74 2.98 13.74 0.00CADA Jalgaon Aner 10.30 24.60 3.49 24.60 2.88WIC Washim Ekburji 4.86 4.30 3.61 9.76 3.08CADA Nashik Ghatshil Pargaon 2.63 1.86 4.38 3.76 1.86AIC Akola Koradi 3.13 2.52 4.57 10.27 0.04CADA Jalgaon Malangaon 9.86 23.01 5.51 23.01 3.77YIC Yavatmal Navargaon 3.61 13.27 5.52 13.27 0.00WIC Washim Sonal 3.68 3.06 5.75 4.25 0.00NIC Nanded Loni 3.81 7.50 6.61 7.50 0.00
3.152.30

Circle Plangroup Project FY Avg LY- 2010-11 TY- 2011-12 Past Max Past Min Avg Per StateTarNIC Nanded Dongargaon
(Nanded)2.26 2.39 6.81 2.72 0.00
CADA Abad Dheku 7.38 4.66 7.75 11.80 4.03CADA Jalgaon Karwand 4.63 5.11 8.96 10.84 4.25PIC Pune Vadiwale 9.54 9.31 9.85 10.75 6.96CADA Pune Visapur 14.41 12.84 11.01 19.16 12.84CADA Nashik Adhala 3.78 4.10 11.49 5.44 2.58PIC Pune Nazare 6.72 7.88 12.28 10.35 5.21PIC Pune Kasarsai 6.52 7.23 14.29 7.38 4.43NIC Nanded Nagzari 5.39 8.13 14.96 8.13 0.00PIC Pune Shetphal 8.24 18.21 17.47 18.21 1.47CADA Jalgaon Panzra 6.37 6.14 18.49 7.41 1.48CADA Abad Kolhi 5.63 10.76 19.16 15.06 3.84CADA Nashik Alandi 2.19 34.01 33.51 44.38 0.07CADA Abad Narangi 4.23 10.44 48.70 10.44 0.00CADA Jalgaon Abhora 61.37 65.41 158.37 90.30 4.50CADA Jalgaon Suki 29.30 50.58 199.70 50.58 1.37CIPC Chandrapur Surplus Chargaon 1.60 0.47 0.25 2.25 0.45CADA Nagpur Chandrabhaga
(Nagpur)1.59 1.18 1.20 2.30 0.94
CADA Nagpur Mordham 1.62 1.68 1.31 1.73 1.56CADA Nagpur Wunna 3.25 1.18 1.42 16.59 1.18CIPC Chandrapur Panchadhara 1.74 1.22 1.46 2.15 1.22CADA Nagpur Khairbanda 3.74 4.45 1.82 5.67 1.91CADA Nagpur Pandhrabodi 2.07 1.60 1.87 2.60 0.00CIPC Chandrapur Labhansarad 1.56 0.15 1.90 2.43 0.15CADA Nagpur Makardhokada-Saiki
Complex2.40 2.56 2.17 7.41 0.13
CADA Nagpur Khekranala 0.71 0.59 2.17 1.16 0.59CADA Nagpur Kesarnala 1.81 2.78 2.22 2.78 1.49CADA Nagpur Umri 2.13 2.56 2.38 2.64 1.53CADA Nagpur Chulband 3.31 2.98 2.65 3.79 1.90CIPC Chandrapur Pakadigundam 3.35 0.22 2.90 4.87 0.00CADA Nagpur Kanholibara 2.00 1.22 3.15 4.40 1.12CADA Nagpur Kolar 1.80 1.39 3.31 2.97 1.05CADA Nagpur Chandpur 6.13 5.78 3.35 620.00 2.73CADA Nagpur Sangrampur 3.60 3.98 3.63 4.71 0.44CADA Nagpur Bodalkasa 3.96 4.19 4.12 4.75 1.78CADA Nagpur Betekar Bothali 3.49 3.11 4.17 3.71 3.11CADA Nagpur Bagheda 7.17 8.15 4.29 8.15 5.35CADA Nagpur Sorna 3.73 5.83 4.73 5.83 2.02CADA Nagpur Chorakhmara 4.36 3.66 4.85 6.07 3.66CADA Nagpur Managadh 3.05 2.58 7.50 6.55 1.45CIPC Chandrapur Chandai 3.45 0.72 9.18 5.90 0.72CADA Nagpur Rengepar 3.14 3.22 16.01 4.46 1.50KIC Ratnagiri Abundant Natuwadi 0.18 0.25 0.19 0.31 0.09NKIPC Thane Hetwane 0.20 0.24 1.10 0.32 0.11CIPC Chandrapur Naleshwar 4.06 1.15 2.67 5.93 1.15SIC Sangli Kumbhi 2.25 2.25 2.74 5.75 2.20SIC Sangli Kasari 3.68 3.21 3.51 5.22 2.32SIC Sangli Patgaon 2.85 2.98 4.52 3.63 2.29SIC Sangli Chikotra 4.53 3.62 4.67 5.70 3.62SIC Sangli Jangamhatti 5.08 4.47 4.85 6.88 3.97CIPC Chandrapur Ghorazari 3.01 0.82 5.49 4.89 0.59SIC Sangli Chitri 5.87 5.89 5.76 6.51 5.53SIC Sangli Kadavi 4.36 6.35 7.38 6.35 2.19TIC Thane Wandri 0.27 0.29 9.26 0.66 0.00
2.90
4.37
4.05
5.40

Plangroup Circle FY Avg LY 2010-11 TY 2011-12 Past Max Past Min AVG Per State TarHighly Deficit CADA Beed 0.05 0.28 0.31 0.85 0.00
CADA Pune 0.05 0.05 0.08 0.07 0.03CADA Solapur 0.31 0.21 0.38 0.44 0.21PIC Pune 0.50 0.73 0.25 0.73 0.18
Deficit AIC Akola 0.20 0.17 0.15 0.34 0.15BIPC Buldhana 0.35 0.37 8.57 0.50 0.23CADA Abad 0.30 0.33 1.19 0.52 0.12CADA Beed 0.09 0.28 0.08 0.72 0.02CADA Jalgaon 0.29 0.23 0.29 0.56 0.20CADA Nashik 0.31 0.11 0.06 0.47 0.11NIC Nanded 0.16 0.12 0.11 0.34 0.08UWPC Amravati 1.14 1.05 0.57 1.36 0.98
Normal AIC Abad 0.00 0.00 0.00 0.00 0.00AIC Akola 0.30 0.14 0.03 0.57 0.14CADA Abad 0.25 0.19 0.59 0.55 0.16CADA Jalgaon 0.28 0.32 0.22 0.54 0.17CADA Nashik 0.55 0.05 0.08 0.74 0.05CADA Pune 0.21 0.08 0.15 0.74 0.08CIPC Chandrapur 1.40 1.43 1.40 2.37 1.01NIC Nanded 0.09 0.14 0.07 0.32 0.03PIC Pune 1.87 1.53 0.77 2.74 1.10WIC Washim 0.35 0.80 0.33 0.80 0.18YIC Yavatmal 0.47 0.13 0.05 1.45 0.00
Surplus CADA Nagpur 1.02 0.66 0.34 1.45 0.66CIPC Chandrapur 0.06 0.07 0.07 0.35 0.02
Abundant CIPC Chandrapur 0.19 0.21 0.45 0.35 0.10KIC Ratnagiri 0.24 0.13 0.38 1.51 0.03NKIPC Thane 7.03 6.76 0.13 9.96 5.05SIC Sangli 0.73 0.87 0.69 0.87 0.52TIC Thane 0.04 0.21 0.04 0.21 0.02
0.25
1
0.68
0.17
0.10
0.42
Indicator VMedium Projects
Cost Recovery Ratio
0.00
0.20
0.40
0.60
0.80
1.00
CA
DA
Bee
d
CA
DA
Pun
e
CA
DA
Sol
apur
PIC
Pun
e
AIC
Ako
la
BIP
C B
uldh
ana
CA
DA
Aba
d
CA
DA
Bee
d
CA
DA
Jal
gaon
CA
DA
Nas
hik
NIC
Nan
ded
UW
PC
Am
rava
ti
AIC
Aba
d
AIC
Ako
la
CA
DA
Aba
d
CA
DA
Jal
gaon
CA
DA
Nas
hik
CA
DA
Pun
e
CIP
C C
hand
rapu
r
NIC
Nan
ded
PIC
Pun
e
WIC
Was
him
YIC
Yav
atm
al
CA
DA
Nag
pur
CIP
C C
hand
rapu
r
CIP
C C
hand
rapu
r
KIC
Rat
nagi
ri
NK
IPC
Tha
ne
SIC
San
gli
TIC
Tha
ne
Highly Deficit Deficit Normal Surplus Abundant
Rat
io
FY Avg LY 2010-11 TY 2011-12 Avg Per State Tar-1.0 Past Max Past Min
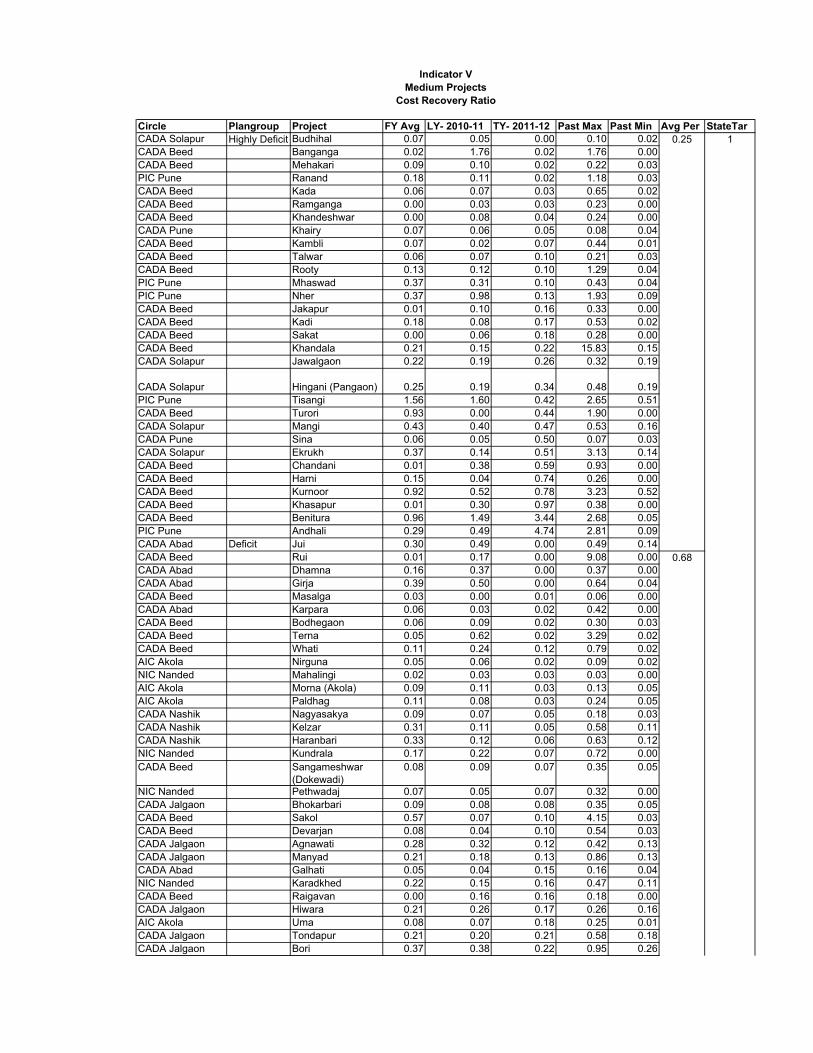
Circle Plangroup Project FY Avg LY- 2010-11 TY- 2011-12 Past Max Past Min Avg Per StateTarCADA Solapur Highly Deficit Budhihal 0.07 0.05 0.00 0.10 0.02CADA Beed Banganga 0.02 1.76 0.02 1.76 0.00CADA Beed Mehakari 0.09 0.10 0.02 0.22 0.03PIC Pune Ranand 0.18 0.11 0.02 1.18 0.03CADA Beed Kada 0.06 0.07 0.03 0.65 0.02CADA Beed Ramganga 0.00 0.03 0.03 0.23 0.00CADA Beed Khandeshwar 0.00 0.08 0.04 0.24 0.00CADA Pune Khairy 0.07 0.06 0.05 0.08 0.04CADA Beed Kambli 0.07 0.02 0.07 0.44 0.01CADA Beed Talwar 0.06 0.07 0.10 0.21 0.03CADA Beed Rooty 0.13 0.12 0.10 1.29 0.04PIC Pune Mhaswad 0.37 0.31 0.10 0.43 0.04PIC Pune Nher 0.37 0.98 0.13 1.93 0.09CADA Beed Jakapur 0.01 0.10 0.16 0.33 0.00CADA Beed Kadi 0.18 0.08 0.17 0.53 0.02CADA Beed Sakat 0.00 0.06 0.18 0.28 0.00CADA Beed Khandala 0.21 0.15 0.22 15.83 0.15CADA Solapur Jawalgaon 0.22 0.19 0.26 0.32 0.19
CADA Solapur Hingani (Pangaon) 0.25 0.19 0.34 0.48 0.19PIC Pune Tisangi 1.56 1.60 0.42 2.65 0.51CADA Beed Turori 0.93 0.00 0.44 1.90 0.00CADA Solapur Mangi 0.43 0.40 0.47 0.53 0.16CADA Pune Sina 0.06 0.05 0.50 0.07 0.03CADA Solapur Ekrukh 0.37 0.14 0.51 3.13 0.14CADA Beed Chandani 0.01 0.38 0.59 0.93 0.00CADA Beed Harni 0.15 0.04 0.74 0.26 0.00CADA Beed Kurnoor 0.92 0.52 0.78 3.23 0.52CADA Beed Khasapur 0.01 0.30 0.97 0.38 0.00CADA Beed Benitura 0.96 1.49 3.44 2.68 0.05PIC Pune Andhali 0.29 0.49 4.74 2.81 0.09CADA Abad Deficit Jui 0.30 0.49 0.00 0.49 0.14CADA Beed Rui 0.01 0.17 0.00 9.08 0.00CADA Abad Dhamna 0.16 0.37 0.00 0.37 0.00CADA Abad Girja 0.39 0.50 0.00 0.64 0.04CADA Beed Masalga 0.03 0.00 0.01 0.06 0.00CADA Abad Karpara 0.06 0.03 0.02 0.42 0.00CADA Beed Bodhegaon 0.06 0.09 0.02 0.30 0.03CADA Beed Terna 0.05 0.62 0.02 3.29 0.02CADA Beed Whati 0.11 0.24 0.12 0.79 0.02AIC Akola Nirguna 0.05 0.06 0.02 0.09 0.02NIC Nanded Mahalingi 0.02 0.03 0.03 0.03 0.00AIC Akola Morna (Akola) 0.09 0.11 0.03 0.13 0.05AIC Akola Paldhag 0.11 0.08 0.03 0.24 0.05CADA Nashik Nagyasakya 0.09 0.07 0.05 0.18 0.03CADA Nashik Kelzar 0.31 0.11 0.05 0.58 0.11CADA Nashik Haranbari 0.33 0.12 0.06 0.63 0.12NIC Nanded Kundrala 0.17 0.22 0.07 0.72 0.00CADA Beed Sangameshwar
(Dokewadi)0.08 0.09 0.07 0.35 0.05
NIC Nanded Pethwadaj 0.07 0.05 0.07 0.32 0.00CADA Jalgaon Bhokarbari 0.09 0.08 0.08 0.35 0.05CADA Beed Sakol 0.57 0.07 0.10 4.15 0.03CADA Beed Devarjan 0.08 0.04 0.10 0.54 0.03CADA Jalgaon Agnawati 0.28 0.32 0.12 0.42 0.13CADA Jalgaon Manyad 0.21 0.18 0.13 0.86 0.13CADA Abad Galhati 0.05 0.04 0.15 0.16 0.04NIC Nanded Karadkhed 0.22 0.15 0.16 0.47 0.11CADA Beed Raigavan 0.00 0.16 0.16 0.18 0.00CADA Jalgaon Hiwara 0.21 0.26 0.17 0.26 0.16AIC Akola Uma 0.08 0.07 0.18 0.25 0.01CADA Jalgaon Tondapur 0.21 0.20 0.21 0.58 0.18CADA Jalgaon Bori 0.37 0.38 0.22 0.95 0.26
0.68
Indicator VMedium Projects
Cost Recovery Ratio
10.25

Circle Plangroup Project FY Avg LY- 2010-11 TY- 2011-12 Past Max Past Min Avg Per StateTarCADA Beed Mahasangvi 0.14 0.20 0.25 0.20 0.07CADA Jalgaon Burai 0.15 0.10 0.27 0.33 0.10NIC Nanded Kudala 0.12 0.26 0.31 0.58 0.00CADA Beed Belpara 0.10 0.22 0.34 0.22 0.02CADA Abad Anjana Palashi 0.22 0.13 0.34 16.25 0.00CADA Beed Kundlika 0.30 0.22 0.34 0.43 0.22CADA Beed Saraswati 0.12 0.28 0.35 0.33 0.06CADA Abad Sukhna 0.30 0.27 0.40 0.42 0.23CADA Abad Lahuki 0.14 0.13 0.41 0.33 0.04CADA Jalgaon Kanoli 0.09 0.07 0.46 0.26 0.06AIC Akola Dnyanganga 0.91 0.51 0.48 1.80 0.51CADA Beed Bindusara 0.54 1.19 0.50 1.19 0.09CADA Beed Tiru 0.28 0.04 0.50 0.87 0.04CADA Beed Tawarja 0.43 0.33 0.55 0.73 0.27UWPC Amravati Shahanoor 1.21 1.05 0.57 1.36 0.98CADA Abad Kalyan Girja 0.10 0.04 0.59 0.51 0.04CADA Beed Sindphana 0.25 0.30 0.65 0.50 0.00CADA Beed Gharni 0.25 0.38 0.75 0.60 0.04CADA Beed Renapur 0.31 0.28 0.75 4.01 0.18CADA Beed Borna 0.52 0.01 0.81 1.12 0.01CADA Abad Gadadgad 0.16 0.13 0.85 0.32 0.00CADA Abad Jivrekha 0.09 0.07 1.31 0.18 0.00CADA Abad Khelna 0.53 0.19 1.63 1.48 0.16CADA Jalgaon Rangawali 0.45 0.35 2.10 0.46 0.00CADA Abad Purna Nevpur 0.41 0.18 2.47 49.83 0.00CADA Beed Wan (Beed) 0.87 0.87 4.08 2.24 0.37CADA Abad Masoli 1.43 5.16 4.12 5.16 0.12BIPC Buldhana Mun 0.47 0.45 8.57 1.00 0.23CADA Abad Ajantha Andhari 0.83 0.19 10.55 3.11 0.10CADA Abad Pir Kalyan 0.31 0.29 13.71 0.54 0.09YIC Yavatmal Normal Navargaon 0.00 0.00 0.00 0.00 0.00CADA Abad Narangi 0.77 0.51 0.00 6.80 0.00AIC Abad Shivna Takali 0.00 0.00 0.00 0.00 0.00CADA Abad Bor Dahegaon 0.06 0.01 0.00 0.01 0.00CADA Abad Ambadi 0.41 0.20 0.00 1.12 0.15NIC Nanded Loni 0.03 0.01 0.01 0.19 0.01CADA Nashik Mand Ohol 0.05 0.05 0.03 0.07 0.03CADA Nashik Ghatshil Pargaon 0.04 0.03 0.03 0.06 0.03AIC Akola Koradi 0.13 0.06 0.03 0.51 0.06YIC Yavatmal Adan 0.30 0.10 0.03 0.60 0.00WIC Washim Sonal 0.17 0.48 0.04 0.48 0.02CADA Nashik Bhojapur 0.71 0.09 0.07 0.75 0.00CIPC Chandrapur Dongargaon
(Wardha)0.13 0.14 0.08 0.32 0.09
NIC Nanded Dongargaon (Nanded)
0.18 0.36 0.09 0.36 0.01
CADA Jalgaon Malangaon 0.08 0.05 0.11 1.13 0.05CADA Nashik Adhala 0.09 0.06 0.11 0.26 0.06CADA Jalgaon Abhora 0.12 0.12 0.11 0.20 0.11CADA Nashik Alandi 0.62 0.04 0.12 0.75 0.02CIPC Chandrapur Pothra 0.07 0.05 0.14 0.12 0.05CADA Pune Visapur 0.18 0.08 0.15 0.74 0.08CADA Jalgaon Aner 0.29 0.36 0.17 0.36 0.24CADA Jalgaon Karwand 0.41 1.47 0.17 1.47 0.12NIC Nanded Nagzari 0.20 0.20 0.21 0.81 0.00CADA Jalgaon Panzra 0.26 0.11 0.22 1.05 0.11PIC Pune Kasarsai 0.43 0.40 0.23 0.60 0.25CADA Abad Tembhapuri 0.42 0.37 0.37 12.83 0.00CADA Jalgaon Suki 0.15 0.09 0.45 0.25 0.09PIC Pune Shetphal 0.92 0.96 0.56 1.01 0.76PIC Pune Vadiwale 3.15 3.00 0.61 7.01 0.11WIC Washim Ekburji 0.77 1.04 0.79 1.04 0.25CADA Abad Kolhi 0.08 0.06 0.89 0.53 0.06PIC Pune Nazare 2.12 0.89 3.08 5.20 0.89CADA Abad Dheku 0.07 0.09 3.19 0.09 0.04
0.17
1

Circle Plangroup Project FY Avg LY- 2010-11 TY- 2011-12 Past Max Past Min Avg Per StateTarCIPC Chandrapur Amal Nala 4.57 3.35 3.38 7.43 3.32
CIPC Chandrapur Surplus Chandai 0.02 0.03 0.02 0.05 0.00
CADA Nagpur Sangrampur 0.04 0.04 0.02 0.24 0.00CADA Nagpur Kanholibara 1.34 0.56 0.02 17.62 0.15CIPC Chandrapur Panchadhara 0.08 0.08 0.03 0.20 0.07CADA Nagpur Managadh 0.07 0.08 0.03 0.30 0.01CADA Nagpur Umri 0.55 0.20 0.04 0.82 0.20CADA Nagpur Rengepar 0.14 0.08 0.04 0.44 0.05CADA Nagpur Kesarnala 0.70 0.35 0.04 1.11 0.35CADA Nagpur Mordham 0.31 0.22 0.04 0.71 0.05CADA Nagpur Bagheda 0.02 0.02 0.04 0.05 0.00CADA Nagpur Chandrabhaga
(Nagpur)0.26 0.06 0.04 1.98 0.03
CADA Nagpur Betekar Bothali 0.07 0.08 0.05 0.15 0.04CADA Nagpur Sorna 0.10 0.10 0.07 0.22 0.05CIPC Chandrapur Labhansarad 0.07 0.06 0.10 0.19 0.03
CADA Nagpur Chorakhmara 0.14 0.08 0.10 0.91 0.00CIPC Chandrapur Pakadigundam 1.11 0.10 0.10 3.80 0.10CADA Nagpur Khekranala 1.50 0.43 0.11 2.42 0.07CADA Nagpur Chulband 0.31 0.48 0.11 0.86 0.05CADA Nagpur Makardhokada-
Saiki Complex1.76 1.71 0.12 2.93 0.85
CADA Nagpur Bodalkasa 0.33 0.23 0.12 0.79 0.03CIPC Chandrapur Chargaon 0.10 0.11 0.13 0.23 0.03CADA Nagpur Khairbanda 0.27 0.26 0.13 5.56 0.05CADA Nagpur Chandpur 0.14 0.13 0.14 0.51 0.07CADA Nagpur Kolar 1.45 1.32 0.48 3.05 0.67CADA Nagpur Pandhrabodi 1.56 2.43 0.77 2.43 0.61CADA Nagpur Wunna 23.54 141.58 6.16 141.58 17.54TIC Thane Abundant Wandri 0.05 0.21 0.04 0.21 0.02NKIPC Thane Hetwane 6.47 6.76 0.13 9.96 5.05CIPC Chandrapur Ghorazari 0.27 0.28 0.16 0.54 0.16SIC Sangli Kasari 0.36 0.83 0.38 0.83 0.05KIC Ratnagiri Natuwadi 0.53 0.13 0.38 1.51 0.03SIC Sangli Kadavi 0.32 0.56 0.50 0.56 0.21SIC Sangli Jangamhatti 0.89 0.56 0.52 1.25 0.56SIC Sangli Chikotra 0.47 0.57 0.54 0.60 0.38SIC Sangli Kumbhi 1.27 1.79 0.55 1.79 0.76CIPC Chandrapur Naleshwar 0.10 0.12 0.83 0.19 0.02SIC Sangli Patgaon 0.52 0.74 1.02 1.03 0.39SIC Sangli Chitri 1.77 1.55 1.36 2.29 1.55
1
0.10
0.42

Plangroup Circle FY Avg LY 2010-11TY 2011-12 Past Max Past Min AVG Per State TarHighly Deficit CADA Beed 15077 1429 13316 63399 1090
CADA Pune 3215 3119 6237 6090 2570CADA Solapur 1200 1477 1788 1477 1053PIC Pune 712 576 2053 1361 372
Deficit AIC Akola 8652 6955 8556 37112 6076BIPC Buldhana 1565 1186 8056 2440 1186CADA Abad 1691 2034 371 4389 1059CADA Beed 12597 2789 40755 41914 1755CADA Jalgaon 1239 1718 1760 1718 911CADA Nashik 2031 3447 3541 3447 1363NIC Nanded 4644 7973 5865 57780 1653UWPC Amravati 949 702 902 5807 187
Normal AIC Abad 0 0 0 0 0AIC Akola 6069 2651 2975 69315 2651CADA Abad 1369 1684 188 4139 590CADA Jalgaon 731 723 378 883 632CADA Nashik 8617 4319 6726 51224 1491CADA Pune 1686 3583 2386 3583 666CIPC Chandrapur 3831 4993 2460 7091 1391NIC Nanded 6484 8783 8314 705600 1129PIC Pune 805 1014 1046 1014 492WIC Washim 2925 1087 3705 6790 1087YIC Yavatmal 1514 3179 2442 3179 0
Surplus CADA Nagpur 1205 1481 2429 1580 618CIPC Chandrapur 13432 4620 4220 44177 2496
Abundant CIPC Chandrapur 1066 1075 1469 1185 888KIC Ratnagiri 21069 23399 22246 39276 3728NKIPC Thane 11533 5958 7283 19388 5958SIC Sangli 1825 1550 1714 2281 1360TIC Thane 5493 3198 8154 6867 3198
1200
3031
10912
2047
2625
1916
Indicator VIMedium Projects
O&M Cost per Unit Area
0
500
1000
1500
2000
CAD
A Be
ed
CAD
A Pu
ne
CAD
A So
lapu
r
PIC
Pun
e
AIC
Ako
la
BIPC
Bul
dhan
a
CAD
A Ab
ad
CAD
A Be
ed
CAD
A Ja
lgao
n
CAD
A N
ashi
k
NIC
Nan
ded
UW
PC A
mra
vati
AIC
Aba
d
AIC
Ako
la
CAD
A Ab
ad
CAD
A Ja
lgao
n
CAD
A N
ashi
k
CAD
A Pu
ne
CIP
C C
hand
rapu
r
NIC
Nan
ded
PIC
Pun
e
WIC
Was
him
YIC
Yav
atm
al
CAD
A N
agpu
r
CIP
C C
hand
rapu
r
CIP
C C
hand
rapu
r
KIC
Rat
nagi
ri
NKI
PC T
hane
SIC
San
gli
TIC
Tha
ne
Highly Deficit Deficit Normal Surplus Abundant
Rs.
/ha
FY Avg LY 2010-11 TY 2011-12 State Tar-1200 Past Max Past Min

Circle Plangroup Project FY Avg LY- 2010-11 TY- 2011-12 Past Max Past Min Avg Per StateTarCADA Beed Highly Deficit Benitura 1548 1807 0 3322 476CADA Beed Chandani 50509 910 0 228191 499CADA Beed Jakapur 42205 1328 0 1332 0PIC Pune Nher 826 215 0 2205 0CADA Solapur Budhihal 1444 1540 0 2356 1047CADA Pune Sina 2396 2368 0 6620 2190CADA Beed Turori 409 0 0 963 0CADA Beed Talwar 3114 2386 0 7500 2053CADA Beed Mehakari 3983 2406 0 9675 2406CADA Beed Rooty 3664 3259 0 4193 870PIC Pune Andhali 3060 1169 468 9452 0PIC Pune Tisangi 483 569 1134 569 372CADA Solapur Hingani (Pangaon) 1184 1730 1348 1867 514CADA Solapur Ekrukh 1220 1066 1861 2151 699CADA Beed Harni 1122 1312 1878 2088 711CADA Solapur Jawalgaon 1407 1721 2164 1785 1076CADA Solapur Mangi 826 925 2260 1821 710CADA Beed Khasapur 27653 794 3556 98674 399PIC Pune Mhaswad 427 513 3816 1043 357CADA Beed Kurnoor 1114 1319 4225 1523 655PIC Pune Ranand 808 930 4472 5433 97CADA Pune Khairy 4831 7887 5785 8046 2965CADA Beed Sakat 28607 957 5926 137805 469CADA Beed Khandala 1357 1633 7535 3856 672CADA Beed Banganga 44312 1283 10390 182090 1010CADA Beed Ramganga 43466 1865 11392 151656 708CADA Beed Kambli 6058 8765 24463 80609 1000CADA Beed Kadi 1226 1298 26400 2871 337CADA Beed Kada 10641 7310 36694 14202 479CADA Beed Khandeshwar 27997 1039 75267 129928 444CADA Beed Deficit Rui 88187 83 0 260720 0CADA Abad Jui 2760 916 0 11579 798CADA Abad Dhamna 2784 803 0 9527 0CADA Beed Raigavan 123263 929 0 453746 929CADA Beed Borna 8174 10492 0 11921 2058CADA Abad Girja 1324 1051 0 19168 474CADA Abad Pir Kalyan 3312 2555 36 5644 0CADA Abad Purna Nevpur 971 2095 45 2829 0CADA Abad Ajantha Andhari 5665 4053 66 12035 2055CADA Abad Jivrekha 4980 5061 83 5616 0CADA Abad Khelna 1740 914 158 3094 1008CADA Abad Kalyan Girja 1905 2644 161 3996 1072CADA Abad Lahuki 1481 949 200 15388 988CADA Abad Anjana Palashi 1349 1373 311 5840 0CADA Abad Gadadgad 2318 2797 314 4313 0CADA Abad Galhati 2097 3273 455 3273 826CADA Abad Masoli 1701 651 646 5970 840CADA Jalgaon Rangawali 373 747 746 786 0CADA Jalgaon Burai 554 896 764 1147 326CADA Beed Gharni 2599 885 879 1887 0CADA Beed Whati 4789 1147 2420 1471 0UWPC Amravati Shahanoor 1475 637 902 5807 601CADA Jalgaon Kanoli 1101 1001 1086 2235 764CADA Beed Renapur 1362 1147 1136 5451 94CADA Abad Sukhna 1290 2069 1155 2996 744
Indicator VIMedium Projects
O&M Cost per Unit Area
1200
3031
10912

Circle Plangroup Project FY Avg LY- 2010-11 TY- 2011-12 Past Max Past Min Avg Per StateTarCADA Jalgaon Hiwara 1118 623 1275 1625 863CADA Beed Tiru 1953 2728 1518 2728 0CADA Abad Karpara 1656 3132 1798 3132 451CADA Jalgaon Manyad 1173 1510 1947 1590 920CADA Nashik Kelzar 2081 2703 2033 3203 1573CADA Beed Sangameshwar
(Dokewadi)575 440 2572 1511 90
CADA Jalgaon Agnawati 1800 888 2575 2531 1467CADA Beed Sindphana 1629 2252 2747 2252 970CADA Beed Sakol 4024 4827 3084 5215 0CADA Beed Belpara 3250 2287 3301 5333 2287AIC Akola Uma 10190 9468 3317 374538 0CADA Jalgaon Bori 2687 2891 3429 3614 1667NIC Nanded Kudala 5179 2981 3451 37800 1246CADA Jalgaon Bhokarbari 3082 3358 3858 5067 1541CADA Jalgaon Tondapur 2264 584 3894 3305 1492CADA Beed Tawarja 4467 2911 3910 3706 0NIC Nanded Kundrala 7947 8096 4223 18920 582CADA Beed Devarjan 5538 5703 4370 5702 0CADA Nashik Haranbari 2148 2588 4686 3687 1301CADA Nashik Nagyasakya 1836 3197 5129 3197 1057NIC Nanded Karadkhed 7702 4237 6128 8345 0AIC Akola Dnyanganga 8280 4837 6722 9774 0NIC Nanded Pethwadaj 4786 9013 7486 9330 0AIC Akola Morna (Akola) 8566 6421 7871 49813 5259BIPC Buldhana Mun 1522 1101 8056 2436 1101NIC Nanded Mahalingi 6842 7120 8659 7364 0CADA Beed Bindusara 8182 4717 8991 15809 2890AIC Akola Paldhag 9832 8094 11366 17835 4889CADA Beed Kundlika 4041 3999 11664 7284 2177CADA Beed Masalga 18004 13298 12195 25184 0CADA Beed Saraswati 5301 3060 13285 29412 935CADA Beed Mahasangvi 1630 1779 17603 3751 1137AIC Akola Nirguna 9694 6604 18451 26049 6604CADA Beed Wan (Beed) 5535 6850 18798 11175 2132CADA Beed Bodhegaon 5654 3573 84267 9960 3760CADA Beed Terna 47731 667 1020232 148989 0CADA Abad Normal Narangi 654 588 0 827 0AIC Abad Shivna Takali 0 0 0 0 0CADA Abad Ambadi 2078 1094 0 4349 1129CADA Nashik Bhojapur 28607 1371 0 209986 1172CADA Abad Bor Dahegaon 827 810 0 870 0YIC Yavatmal Navargaon 0 0 0 0 0CADA Abad Dheku 2511 6667 15 6803 1179CADA Jalgaon Karwand 1767 1022 153 2643 707CADA Jalgaon Panzra 307 344 287 437 146CADA Abad Tembhapuri 924 973 434 1702 0PIC Pune Nazare 774 1930 504 1930 271CADA Abad Kolhi 5348 3568 572 14889 1510CADA Jalgaon Suki 915 589 623 7629 592CADA Jalgaon Aner 469 372 788 725 372PIC Pune Shetphal 533 495 892 774 354PIC Pune Kasarsai 1009 925 1038 2177 893CADA Jalgaon Abhora 739 767 1305 2947 631CADA Jalgaon Malangaon 1059 1587 1499 1587 556PIC Pune Vadiwale 909 957 1567 1140 281CIPC Chandrapur Amal Nala 2365 2401 1901 2401 0CADA Pune Visapur 1949 3402 2386 3583 666YIC Yavatmal Adan 2324 3591 2747 3591 0
1200
2047

Circle Plangroup Project FY Avg LY- 2010-11 TY- 2011-12 Past Max Past Min Avg Per StateTarCIPC Chandrapur Dongargaon
(Wardha)2244 2126 2868 4595 776
CADA Nashik Alandi 11294 3201 2895 209986 889WIC Washim Ekburji 2639 1248 2959 4274 1559AIC Akola Koradi 5566 3942 2975 456082 2499CIPC Chandrapur Pothra 4829 5793 3070 6632 2032NIC Nanded Nagzari 3510 2744 4146 3708 0WIC Washim Sonal 2916 522 4416 3111 0CADA Nashik Ghatshil Pargaon 4443 5691 6348 8437 1794NIC Nanded Dongargaon
(Nanded)4408 7069 6353 247100 1291
CADA Nashik Adhala 2870 5062 7969 5290 747NIC Nanded Loni 18267 24462 18251 36664 0CADA Nashik Mand Ohol 8253 7772 112302 14260 2892CADA Nagpur Surplus Khairbanda 508 668 839 668 20CADA Nagpur Pandhrabodi 690 340 956 1567 0CADA Nagpur Rengepar 1074 1395 994 1724 497CADA Nagpur Chulband 672 650 1194 1020 407CADA Nagpur Chorakhmara 868 1688 1210 1688 279CADA Nagpur Bodalkasa 498 1039 1522 1039 118CADA Nagpur Chandpur 1060 1333 1543 44866 466CADA Nagpur Kolar 1123 1176 1792 1940 414CADA Nagpur Bagheda 3429 3831 2127 4612 1949CADA Nagpur Sorna 1839 1457 2507 2690 985CADA Nagpur Makardhokada-Saiki
Complex580 316 2808 2153 316
CIPC Chandrapur Chargaon 3422 3696 3074 6703 1370CADA Nagpur Sangrampur 2891 2836 3253 5065 1509CIPC Chandrapur Labhansarad 3076 4833 3311 8097 1487CADA Nagpur Betekar Bothali 2156 1840 3343 3435 1370CIPC Chandrapur Pakadigundam 2687 3379 4024 3379 0CADA Nagpur Managadh 1823 3220 4914 3220 613CADA Nagpur Kanholibara 533 185 4923 6855 32CIPC Chandrapur Chandai 6380 6449 5328 210105 4547CADA Nagpur Umri 1281 1222 5414 2469 706CIPC Chandrapur Panchadhara 4457 5905 6008 5905 2892CADA Nagpur Khekranala 1934 2222 7874 4289 773CADA Nagpur Mordham 1984 1295 14639 10984 673CADA Nagpur Kesarnala 2178 2719 15160 6169 798CADA Nagpur Chandrabhaga 3743 7077 15680 36063 679CADA Nagpur Wunna 10559 3134 24290 41791 3134SIC Sangli Abundant Kumbhi 963 759 889 2024 611SIC Sangli Chitri 922 969 999 969 875CIPC Chandrapur Ghorazari 843 940 1062 967 610SIC Sangli Chikotra 2036 1833 1901 2808 1631SIC Sangli Jangamhatti 1704 1988 1953 1988 1470SIC Sangli Kasari 1353 770 1989 3259 71SIC Sangli Patgaon 4091 1961 2299 4771 2935CIPC Chandrapur Naleshwar 1422 1330 2875 1918 1330SIC Sangli Kadavi 3644 1690 3032 5114 2700NKIPC Thane Hetwane 10687 3881 7283 19388 5958TIC Thane Wandri 7016 3198 8154 14806 1776KIC Ratnagiri Natuwadi 12596 23010 22246 39276 3728
2625
1916
1200
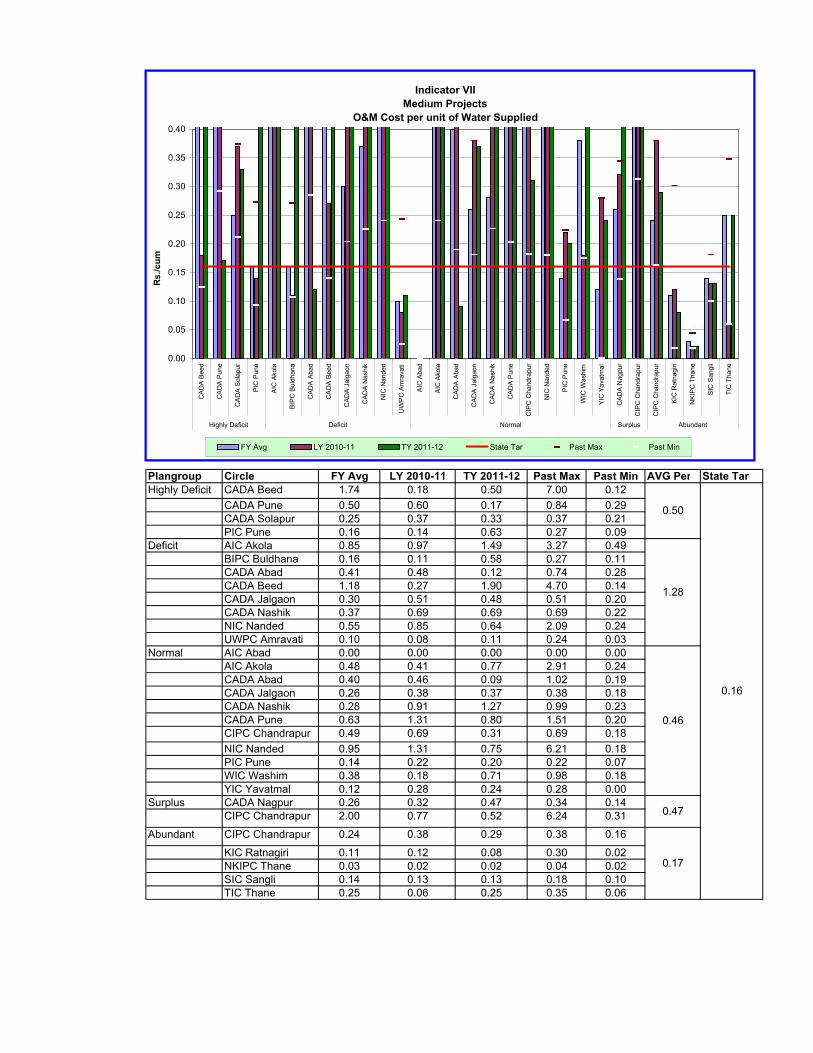
Plangroup Circle FY Avg LY 2010-11 TY 2011-12 Past Max Past Min AVG Per State TarHighly Deficit CADA Beed 1.74 0.18 0.50 7.00 0.12
CADA Pune 0.50 0.60 0.17 0.84 0.29CADA Solapur 0.25 0.37 0.33 0.37 0.21PIC Pune 0.16 0.14 0.63 0.27 0.09
Deficit AIC Akola 0.85 0.97 1.49 3.27 0.49BIPC Buldhana 0.16 0.11 0.58 0.27 0.11CADA Abad 0.41 0.48 0.12 0.74 0.28CADA Beed 1.18 0.27 1.90 4.70 0.14CADA Jalgaon 0.30 0.51 0.48 0.51 0.20CADA Nashik 0.37 0.69 0.69 0.69 0.22NIC Nanded 0.55 0.85 0.64 2.09 0.24UWPC Amravati 0.10 0.08 0.11 0.24 0.03
Normal AIC Abad 0.00 0.00 0.00 0.00 0.00AIC Akola 0.48 0.41 0.77 2.91 0.24CADA Abad 0.40 0.46 0.09 1.02 0.19CADA Jalgaon 0.26 0.38 0.37 0.38 0.18CADA Nashik 0.28 0.91 1.27 0.99 0.23CADA Pune 0.63 1.31 0.80 1.51 0.20CIPC Chandrapur 0.49 0.69 0.31 0.69 0.18NIC Nanded 0.95 1.31 0.75 6.21 0.18PIC Pune 0.14 0.22 0.20 0.22 0.07WIC Washim 0.38 0.18 0.71 0.98 0.18YIC Yavatmal 0.12 0.28 0.24 0.28 0.00
Surplus CADA Nagpur 0.26 0.32 0.47 0.34 0.14CIPC Chandrapur 2.00 0.77 0.52 6.24 0.31
Abundant CIPC Chandrapur 0.24 0.38 0.29 0.38 0.16
KIC Ratnagiri 0.11 0.12 0.08 0.30 0.02NKIPC Thane 0.03 0.02 0.02 0.04 0.02SIC Sangli 0.14 0.13 0.13 0.18 0.10TIC Thane 0.25 0.06 0.25 0.35 0.06
0.50
0.16
1.28
0.46
0.47
0.17
Indicator VIIMedium Projects
O&M Cost per unit of Water Supplied
0.00
0.05
0.10
0.15
0.20
0.25
0.30
0.35
0.40
CA
DA
Bee
d
CA
DA
Pun
e
CA
DA
Sol
apur
PIC
Pun
e
AIC
Ako
la
BIP
C B
uldh
ana
CA
DA
Aba
d
CA
DA
Bee
d
CA
DA
Jal
gaon
CA
DA
Nas
hik
NIC
Nan
ded
UW
PC
Am
rava
ti
AIC
Aba
d
AIC
Ako
la
CA
DA
Aba
d
CA
DA
Jal
gaon
CA
DA
Nas
hik
CA
DA
Pun
e
CIP
C C
hand
rapu
r
NIC
Nan
ded
PIC
Pun
e
WIC
Was
him
YIC
Yav
atm
al
CA
DA
Nag
pur
CIP
C C
hand
rapu
r
CIP
C C
hand
rapu
r
KIC
Rat
nagi
ri
NK
IPC
Tha
ne
SIC
San
gli
TIC
Tha
ne
Highly Deficit Deficit Normal Surplus Abundant
Rs.
/cum
FY Avg LY 2010-11 TY 2011-12 State Tar Past Max Past Min

Circle Plangroup Project FY Avg LY- 2010-11 TY- 2011-12 Past Max Past Min Avg Per StateTar
CADA Solapur Highly Deficit Budhihal 1.05 1.55 0.00 26.37 0.81CADA Beed Mehakari 0.57 0.47 0.00 1.41 0.17CADA Pune Sina 0.37 0.46 0.01 0.73 0.25PIC Pune Andhali 0.59 0.36 0.06 2.27 0.06CADA Beed Harni 0.11 0.08 0.13 0.26 0.08CADA Beed Sakat 4.07 0.12 0.18 20.64 0.08CADA Beed Khasapur 3.87 0.10 0.18 15.65 0.07CADA Beed Kurnoor 0.09 0.15 0.18 0.15 0.05CADA Beed Chandani 4.47 0.10 0.22 15.43 0.04CADA Solapur Ekrukh 0.28 0.27 0.24 1.18 0.18CADA Solapur Hingani (Pangaon) 0.28 0.52 0.24 0.52 0.09CADA Beed Benitura 0.10 0.08 0.25 0.24 0.04CADA Beed Jakapur 4.53 0.09 0.27 0.27 0.00CADA Beed Banganga 5.90 0.18 0.30 19.13 0.16PIC Pune Tisangi 0.11 0.15 0.31 0.15 0.06CADA Solapur Jawalgaon 0.33 0.56 0.43 0.56 0.23CADA Beed Khandala 0.25 0.27 0.49 0.60 0.15CADA Beed Turori 0.04 0.00 0.60 0.10 0.00CADA Solapur Mangi 0.14 0.18 0.69 0.29 0.12CADA Beed Ramganga 5.36 0.16 0.72 21.33 0.10CADA Beed Kadi 0.18 0.17 0.82 0.29 0.07CADA Beed Khandeshwar 3.96 0.15 0.97 13.58 0.08CADA Pune Khairy 0.92 1.60 1.00 1.81 0.52CADA Beed Kada 1.14 1.11 1.74 1.60 0.03PIC Pune Mhaswad 0.09 0.10 2.09 0.27 0.08CADA Beed Rooty 0.34 0.29 2.41 0.77 0.03CADA Beed Talwar 0.48 0.44 3.75 0.66 0.15PIC Pune Ranand 0.32 0.43 4.06 1.35 0.05CADA Beed Kambli 0.70 1.72 6.12 4.64 0.12PIC Pune Nher 0.26 0.09 68.00 6.48 0.07CADA Abad Deficit Jui 0.56 0.56 0.00 0.82 0.29CADA Abad Girja 0.38 0.41 0.00 1.84 0.12CADA Abad Dhamna 1.04 0.65 0.00 2.31 0.00CADA Abad Purna Nevpur 0.24 0.58 0.01 0.58 0.00CADA Abad Pir Kalyan 0.41 0.49 0.01 0.61 0.23CADA Abad Ajantha Andhari 0.58 0.55 0.03 1.29 0.24CADA Beed Renapur 0.07 0.04 0.04 0.22 0.01CADA Abad Khelna 0.38 0.30 0.04 0.79 0.30CADA Abad Jivrekha 1.08 1.33 0.04 1.33 0.00CADA Beed Sangameshwar
(Dokewadi)0.08 0.03 0.06 0.26 0.02
CADA Beed Gharni 0.23 0.09 0.07 5.63 0.09CADA Abad Masoli 0.13 0.07 0.07 0.58 0.07CADA Beed Belpara 0.16 0.08 0.08 0.39 0.08CADA Beed Whati 0.57 0.14 0.24 0.82 0.01UWPC Amravati Shahanoor 0.11 0.08 0.11 0.24 0.07CADA Abad Anjana Palashi 0.37 0.70 0.12 0.79 0.00CADA Abad Lahuki 0.95 0.67 0.13 2.07 0.58CADA Abad Kalyan Girja 0.79 2.15 0.13 3.21 0.27CADA Beed Tiru 0.17 0.18 0.13 0.33 0.09CADA Abad Gadadgad 0.82 0.96 0.15 1.48 0.00CADA Abad Galhati 0.34 0.56 0.17 0.56 0.15CADA Beed Raigavan 14.73 0.16 0.18 42.41 0.16CADA Beed Tawarja 0.44 0.33 0.19 2.81 0.16
0.50
Indicator VIIMedium Projects
O&M Cost per unit of Water Supplied
0.16

Circle Plangroup Project FY Avg LY- 2010-11 TY- 2011-12 Past Max Past Min Avg Per StateTar
CADA Jalgaon Rangawali 0.11 0.17 0.20 0.18 0.00CADA Beed Sindphana 0.26 0.22 0.23 0.33 0.17CADA Beed Kundlika 0.44 0.44 0.25 0.60 0.16CADA Jalgaon Kanoli 0.27 0.41 0.30 0.44 0.16CADA Abad Karpara 0.30 0.63 0.31 0.63 0.08CADA Jalgaon Burai 0.16 0.55 0.33 0.55 0.07CADA Beed Wan (Beed) 0.33 0.53 0.33 0.59 0.12CADA Beed Borna 0.65 0.72 0.35 1.02 0.22CADA Beed Masalga 0.93 0.70 0.35 1.72 0.00CADA Beed Mahasangvi 0.23 0.30 0.36 0.37 0.19CADA Beed Bindusara 0.34 0.29 0.37 0.65 0.16CADA Beed Sakol 0.58 0.64 0.38 4.98 0.11CADA Beed Saraswati 0.63 0.33 0.40 1.76 0.18NIC Nanded Kundrala 0.72 0.63 0.40 1.80 0.11CADA Beed Devarjan 0.77 0.73 0.40 0.73 0.00CADA Jalgaon Manyad 0.28 0.44 0.45 0.44 0.17NIC Nanded Kudala 0.60 0.68 0.50 2.09 0.22CADA Beed Bodhegaon 0.69 0.62 0.51 0.97 0.40CADA Jalgaon Bori 0.40 0.78 0.51 0.78 0.18BIPC Buldhana Mun 0.17 0.10 0.58 0.25 0.10AIC Akola Uma 1.33 1.35 0.58 10.75 0.49CADA Jalgaon Hiwara 0.48 0.40 0.60 0.99 0.36CADA Nashik Haranbari 0.35 0.69 0.64 0.69 0.16NIC Nanded Pethwadaj 0.47 0.80 0.67 4.65 0.00CADA Abad Sukhna 0.51 0.41 0.71 1.04 0.39NIC Nanded Karadkhed 0.79 1.09 0.72 1.68 0.22CADA Nashik Nagyasakya 0.36 0.71 0.76 0.71 0.20CADA Nashik Kelzar 0.44 0.68 0.77 0.68 0.32CADA Jalgaon Agnawati 0.67 0.47 0.91 1.35 0.00AIC Akola Dnyanganga 0.77 0.92 1.12 4.08 0.40NIC Nanded Mahalingi 1.06 1.10 1.20 1.10 0.00CADA Jalgaon Tondapur 0.92 1.04 1.27 1.15 0.52AIC Akola Paldhag 0.91 0.90 1.29 1.62 0.48AIC Akola Morna (Akola) 0.83 0.90 1.73 3.10 0.33AIC Akola Nirguna 1.11 0.88 3.60 2.60 0.44CADA Jalgaon Bhokarbari 0.83 1.06 4.56 3.28 0.29CADA Beed Terna 4.27 0.11 13.75 12.69 0.07CADA Beed Rui 9.89 0.12 86.31 30.09 0.01CADA Abad Normal Ambadi 0.48 0.41 0.00 0.75 0.34CADA Abad Narangi 0.12 0.22 0.00 34.83 0.00YIC Yavatmal Navargaon 0.00 0.00 0.00 0.00 0.00CADA Abad Bor Dahegaon 0.29 0.45 0.00 0.45 0.00AIC Abad Shivna Takali 0.00 0.00 0.00 0.00 0.00CADA Abad Dheku 0.83 0.94 0.02 1.02 0.52PIC Pune Nazare 0.16 0.37 0.08 0.37 0.06CADA Abad Tembhapuri 0.23 0.30 0.11 0.69 0.00CADA Jalgaon Aner 0.13 0.17 0.19 0.27 0.08CADA Jalgaon Panzra 0.17 0.23 0.20 0.23 0.09PIC Pune Kasarsai 0.17 0.17 0.24 0.22 0.16PIC Pune Vadiwale 0.16 0.18 0.25 0.24 0.04PIC Pune Shetphal 0.11 0.19 0.26 0.19 0.05CIPC Chandrapur Pothra 0.46 0.53 0.27 0.54 0.22YIC Yavatmal Adan 0.22 0.31 0.27 0.31 0.00CIPC Chandrapur Amal Nala 0.56 0.99 0.33 0.99 0.00CADA Abad Kolhi 0.88 1.62 0.35 1.77 0.42WIC Washim Ekburji 0.33 0.25 0.45 0.54 0.25
1.28
0.16
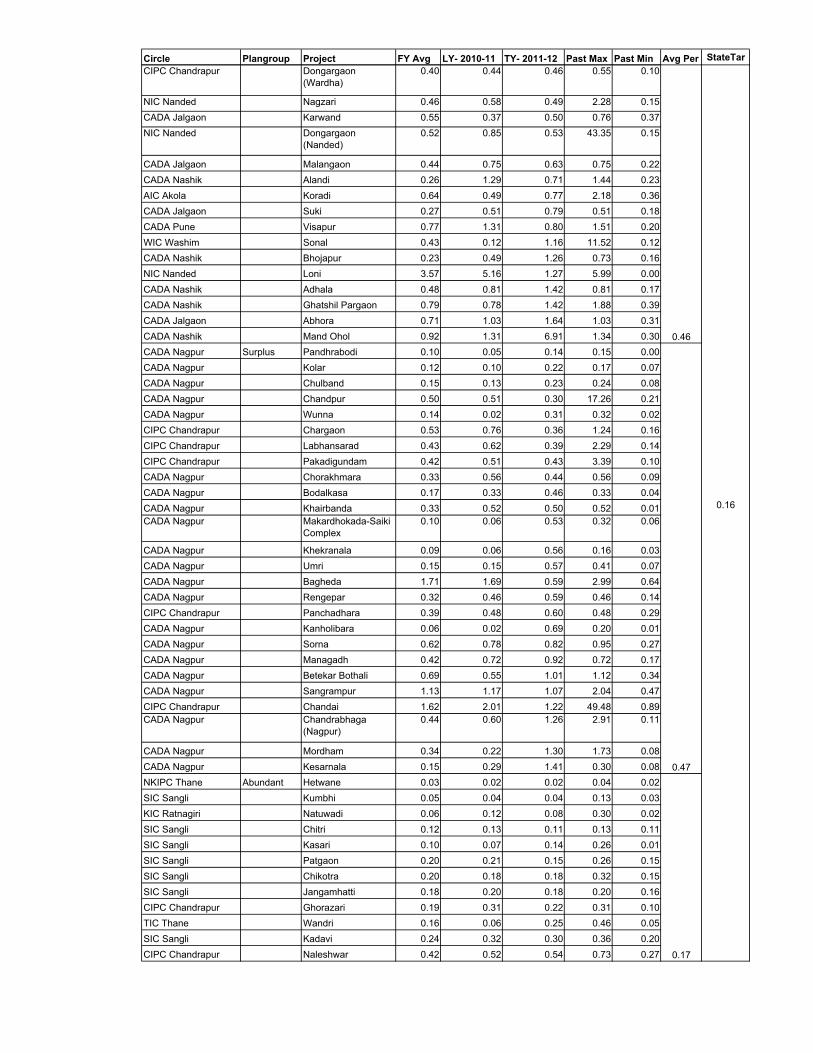
Circle Plangroup Project FY Avg LY- 2010-11 TY- 2011-12 Past Max Past Min Avg Per StateTarCIPC Chandrapur Dongargaon
(Wardha)0.40 0.44 0.46 0.55 0.10
NIC Nanded Nagzari 0.46 0.58 0.49 2.28 0.15CADA Jalgaon Karwand 0.55 0.37 0.50 0.76 0.37NIC Nanded Dongargaon
(Nanded)0.52 0.85 0.53 43.35 0.15
CADA Jalgaon Malangaon 0.44 0.75 0.63 0.75 0.22CADA Nashik Alandi 0.26 1.29 0.71 1.44 0.23AIC Akola Koradi 0.64 0.49 0.77 2.18 0.36CADA Jalgaon Suki 0.27 0.51 0.79 0.51 0.18CADA Pune Visapur 0.77 1.31 0.80 1.51 0.20WIC Washim Sonal 0.43 0.12 1.16 11.52 0.12CADA Nashik Bhojapur 0.23 0.49 1.26 0.73 0.16NIC Nanded Loni 3.57 5.16 1.27 5.99 0.00CADA Nashik Adhala 0.48 0.81 1.42 0.81 0.17CADA Nashik Ghatshil Pargaon 0.79 0.78 1.42 1.88 0.39CADA Jalgaon Abhora 0.71 1.03 1.64 1.03 0.31CADA Nashik Mand Ohol 0.92 1.31 6.91 1.34 0.30CADA Nagpur Surplus Pandhrabodi 0.10 0.05 0.14 0.15 0.00CADA Nagpur Kolar 0.12 0.10 0.22 0.17 0.07CADA Nagpur Chulband 0.15 0.13 0.23 0.24 0.08CADA Nagpur Chandpur 0.50 0.51 0.30 17.26 0.21CADA Nagpur Wunna 0.14 0.02 0.31 0.32 0.02CIPC Chandrapur Chargaon 0.53 0.76 0.36 1.24 0.16CIPC Chandrapur Labhansarad 0.43 0.62 0.39 2.29 0.14CIPC Chandrapur Pakadigundam 0.42 0.51 0.43 3.39 0.10CADA Nagpur Chorakhmara 0.33 0.56 0.44 0.56 0.09CADA Nagpur Bodalkasa 0.17 0.33 0.46 0.33 0.04CADA Nagpur Khairbanda 0.33 0.52 0.50 0.52 0.01CADA Nagpur Makardhokada-Saiki
Complex0.10 0.06 0.53 0.32 0.06
CADA Nagpur Khekranala 0.09 0.06 0.56 0.16 0.03CADA Nagpur Umri 0.15 0.15 0.57 0.41 0.07CADA Nagpur Bagheda 1.71 1.69 0.59 2.99 0.64CADA Nagpur Rengepar 0.32 0.46 0.59 0.46 0.14CIPC Chandrapur Panchadhara 0.39 0.48 0.60 0.48 0.29CADA Nagpur Kanholibara 0.06 0.02 0.69 0.20 0.01CADA Nagpur Sorna 0.62 0.78 0.82 0.95 0.27CADA Nagpur Managadh 0.42 0.72 0.92 0.72 0.17CADA Nagpur Betekar Bothali 0.69 0.55 1.01 1.12 0.34CADA Nagpur Sangrampur 1.13 1.17 1.07 2.04 0.47CIPC Chandrapur Chandai 1.62 2.01 1.22 49.48 0.89CADA Nagpur Chandrabhaga
(Nagpur)0.44 0.60 1.26 2.91 0.11
CADA Nagpur Mordham 0.34 0.22 1.30 1.73 0.08CADA Nagpur Kesarnala 0.15 0.29 1.41 0.30 0.08NKIPC Thane Abundant Hetwane 0.03 0.02 0.02 0.04 0.02SIC Sangli Kumbhi 0.05 0.04 0.04 0.13 0.03KIC Ratnagiri Natuwadi 0.06 0.12 0.08 0.30 0.02SIC Sangli Chitri 0.12 0.13 0.11 0.13 0.11SIC Sangli Kasari 0.10 0.07 0.14 0.26 0.01SIC Sangli Patgaon 0.20 0.21 0.15 0.26 0.15SIC Sangli Chikotra 0.20 0.18 0.18 0.32 0.15SIC Sangli Jangamhatti 0.18 0.20 0.18 0.20 0.16CIPC Chandrapur Ghorazari 0.19 0.31 0.22 0.31 0.10TIC Thane Wandri 0.16 0.06 0.25 0.46 0.05SIC Sangli Kadavi 0.24 0.32 0.30 0.36 0.20CIPC Chandrapur Naleshwar 0.42 0.52 0.54 0.73 0.27
0.16
0.46
0.47
0.17

Plangroup Circle FY Avg LY 2010-11 TY 2011-12 Past Max Past Min AVG Per State TarHighly Deficit CADA Beed 0.09 0.05 0.15 0.31 0.03
CADA Pune 0.03 0.03 0.01 0.03 0.02CADA Solapur 0.08 0.08 0.12 0.12 0.06PIC Pune 0.08 0.10 0.16 0.10 0.05
Deficit AIC Akola 0.17 0.16 0.22 0.49 0.08BIPC Buldhana 0.06 0.04 5.00 0.11 0.03CADA Abad 0.12 0.16 0.14 0.16 0.09CADA Beed 0.11 0.08 0.16 0.20 0.08CADA Jalgaon 0.09 0.12 0.14 0.13 0.04CADA Nashik 0.11 0.07 0.04 0.14 0.07NIC Nanded 0.09 0.10 0.07 0.16 0.07UWPC Amravati 0.11 0.08 0.06 0.24 0.03
Normal AIC Abad 0.02 0.03 0.06 0.03 0.00AIC Akola 0.15 0.06 0.02 0.79 0.06CADA Abad 0.10 0.09 0.05 0.16 0.09CADA Jalgaon 0.07 0.12 0.08 0.12 0.04CADA Nashik 0.15 0.05 0.10 0.17 0.02CADA Pune 0.13 0.10 0.12 0.21 0.09CIPC Chandrapur 0.68 0.99 0.43 0.99 0.43NIC Nanded 0.08 0.19 0.06 0.33 0.05PIC Pune 0.27 0.34 0.16 0.38 0.11WIC Washim 0.13 0.14 0.24 0.41 0.07YIC Yavatmal 0.06 0.04 0.01 0.35 0.02
Surplus CADA Nagpur 0.27 0.21 0.16 0.46 0.20CIPC Chandrapur 0.12 0.06 0.04 0.24 0.06
Abundant CIPC Chandrapur 0.05 0.08 0.13 0.08 0.03KIC Ratnagiri 0.03 0.02 0.03 0.06 0.01NKIPC Thane 0.23 0.12 0.00 0.37 0.12SIC Sangli 0.10 0.11 0.09 0.15 0.07TIC Thane 0.01 0.01 0.01 0.02 0.00
0.10
0.18
0.12
0.08
0.05
0.08
Indicator VIIIMedium Projects
Revenue per unit of Water Supplied
0.00
0.02
0.04
0.06
0.08
0.10
0.12
0.14
0.16
0.18
0.20C
AD
A B
eed
CA
DA
Pun
e
CA
DA
Sol
apur
PIC
Pun
e
AIC
Ako
la
BIP
C B
uldh
ana
CA
DA
Aba
d
CA
DA
Bee
d
CA
DA
Jal
gaon
CA
DA
Nas
hik
NIC
Nan
ded
UW
PC A
mra
vati
AIC
Aba
d
AIC
Ako
la
CA
DA
Aba
d
CA
DA
Jal
gaon
CA
DA
Nas
hik
CA
DA
Pun
e
CIP
C C
hand
rapu
r
NIC
Nan
ded
PIC
Pun
e
WIC
Was
him
YIC
Yav
atm
al
CA
DA
Nag
pur
CIP
C C
hand
rapu
r
CIP
C C
hand
rapu
r
KIC
Rat
nagi
ri
NK
IPC
Tha
ne
SIC
San
gli
TIC
Tha
ne
Highly Deficit Deficit Normal Surplus Abundant
Rs/
cum
FY Avg LY 2010-11 TY 2011-12 State Tar-0.18 Past Max Past Min

Circle Plangroup Project FY Avg LY- 2010-11 TY- 2011-12 Past Max Past Min Avg Per StateTar
CADA Beed Highly Deficit Mehakari 0.05 0.05 0.00 0.18 0.02
CADA Solapur Budhihal 0.07 0.08 0.00 2.74 0.02
CADA Beed Banganga 0.10 0.32 0.01 0.32 0.01
CADA Pune Sina 0.02 0.02 0.01 0.03 0.02
CADA Beed Ramganga 0.01 0.01 0.02 0.02 0.01
CADA Beed Sakat 0.01 0.01 0.03 0.02 0.01
CADA Beed Khandeshwar 0.02 0.01 0.04 0.03 0.01
CADA Beed Jakapur 0.02 0.01 0.04 0.04 0.00
CADA Pune Khairy 0.06 0.09 0.05 0.09 0.03
CADA Beed Kada 0.07 0.08 0.06 0.08 0.02
CADA Solapur Hingani (Pangaon) 0.07 0.10 0.08 0.11 0.03
PIC Pune Ranand 0.06 0.05 0.09 0.11 0.03
CADA Beed Harni 0.02 0.00 0.10 0.05 0.00
CADA Solapur Jawalgaon 0.07 0.10 0.11 0.10 0.05
CADA Beed Khandala 0.05 0.04 0.11 6.87 0.03
CADA Solapur Ekrukh 0.10 0.04 0.12 1.33 0.04
PIC Pune Tisangi 0.17 0.23 0.13 0.23 0.06
CADA Beed Chandani 0.04 0.04 0.13 9.20 0.02
CADA Beed Kurnoor 0.08 0.08 0.14 0.22 0.06
CADA Beed Kadi 0.03 0.01 0.14 0.05 0.00
CADA Beed Khasapur 0.03 0.03 0.17 0.03 0.01
PIC Pune Mhaswad 0.03 0.03 0.21 0.04 0.01
CADA Beed Rooty 0.05 0.04 0.24 0.07 0.03
CADA Beed Turori 0.04 0.00 0.26 0.14 0.00
PIC Pune Andhali 0.17 0.18 0.27 0.29 0.05
CADA Solapur Mangi 0.06 0.07 0.32 0.07 0.04
CADA Beed Talwar 0.03 0.03 0.39 0.04 0.02
CADA Beed Kambli 0.05 0.03 0.46 0.06 0.03
CADA Beed Benitura 0.09 0.12 0.86 0.12 0.01
PIC Pune Nher 0.10 0.09 9.07 2.26 0.05
CADA Beed Deficit Masalga 0.03 0.00 0.00 0.09 0.00
CADA Beed Sangameshwar
(Dokewadi)
0.01 0.00 0.00 0.01 0.00
CADA Abad Karpara 0.02 0.02 0.01 0.05 0.00
CADA Beed Bodhegaon 0.04 0.05 0.01 0.12 0.02
CADA Abad Galhati 0.02 0.02 0.03 0.02 0.01
CADA Beed Renapur 0.02 0.01 0.03 0.04 0.01
AIC Akola Paldhag 0.10 0.07 0.03 0.12 0.07
NIC Nanded Kundrala 0.12 0.14 0.03 0.19 0.00
CADA Beed Belpara 0.02 0.02 0.03 0.04 0.00
CADA Beed Raigavan 0.05 0.03 0.03 0.10 0.03
CADA Beed Sakol 0.33 0.04 0.04 0.91 0.04
CADA Beed Devarjan 0.06 0.03 0.04 0.08 0.00
CADA Beed Whati 0.06 0.03 0.03 0.16 0.03
CADA Abad Purna Nevpur 0.10 0.10 0.04 0.23 0.04
NIC Nanded Pethwadaj 0.03 0.04 0.04 0.04 0.00
CADA Nashik Nagyasakya 0.03 0.05 0.04 0.05 0.01
CADA Nashik Haranbari 0.12 0.08 0.04 0.20 0.08
CADA Nashik Kelzar 0.14 0.07 0.04 0.24 0.07
NIC Nanded Mahalingi 0.02 0.04 0.04 0.04 0.00
CADA Abad Anjana Palashi 0.08 0.09 0.04 0.10 0.04
CADA Abad Lahuki 0.14 0.08 0.05 0.36 0.04
AIC Akola Morna (Akola) 0.08 0.10 0.05 0.17 0.04
CADA Beed Gharni 0.06 0.03 0.05 0.24 0.03
CADA Abad Jivrekha 0.10 0.10 0.05 0.15 0.00
CADA Abad Khelna 0.20 0.06 0.06 0.98 0.06
CADA Jalgaon Manyad 0.06 0.08 0.06 0.14 0.03
Indicator VIII
Medium Projects
Revenue per unit of Water Supplied
0.18
0.10
0.12

Circle Plangroup Project FY Avg LY- 2010-11 TY- 2011-12 Past Max Past Min Avg Per StateTar
UWPC Amravati Shahanoor 0.13 0.08 0.06 0.24 0.08
CADA Beed Tiru 0.05 0.01 0.07 0.14 0.01
CADA Abad Kalyan Girja 0.08 0.08 0.08 0.32 0.05
CADA Jalgaon Burai 0.02 0.06 0.09 0.06 0.01
CADA Beed Mahasangvi 0.03 0.06 0.09 0.06 0.02
CADA Beed Kundlika 0.13 0.10 0.09 0.20 0.06
CADA Abad Dhamna 0.17 0.24 0.09 0.24 0.00
AIC Akola Nirguna 0.06 0.06 0.09 0.07 0.04
CADA Jalgaon Hiwara 0.10 0.11 0.10 0.19 0.06
AIC Akola Uma 0.10 0.09 0.10 0.41 0.06
CADA Beed Tawarja 0.19 0.11 0.11 0.75 0.08
CADA Jalgaon Agnawati 0.19 0.15 0.11 0.20 0.00
CADA Jalgaon Bori 0.15 0.29 0.11 0.29 0.07
NIC Nanded Karadkhed 0.18 0.16 0.12 0.19 0.10
CADA Abad Gadadgad 0.13 0.12 0.13 0.30 0.04
CADA Beed Saraswati 0.07 0.09 0.14 0.11 0.03
CADA Jalgaon Kanoli 0.03 0.03 0.14 0.12 0.02
NIC Nanded Kudala 0.07 0.18 0.15 0.18 0.00
CADA Beed Sindphana 0.06 0.06 0.15 0.12 0.00
CADA Abad Girja 0.15 0.20 0.15 0.24 0.02
CADA Beed Rui 0.07 0.02 0.17 0.25 0.00
CADA Abad Pir Kalyan 0.13 0.14 0.18 0.16 0.04
CADA Abad Jui 0.17 0.28 0.18 0.28 0.08
CADA Beed Bindusara 0.18 0.34 0.19 0.34 0.03
CADA Jalgaon Tondapur 0.19 0.21 0.27 0.60 0.11
CADA Abad Ajantha Andhari 0.48 0.11 0.27 2.01 0.04
CADA Beed Terna 0.23 0.06 0.28 0.46 0.06
CADA Abad Masoli 0.19 0.38 0.28 0.38 0.03
CADA Abad Sukhna 0.16 0.11 0.29 0.24 0.09
CADA Beed Borna 0.34 0.01 0.29 1.14 0.00
CADA Jalgaon Bhokarbari 0.08 0.08 0.36 0.15 0.04
CADA Jalgaon Rangawali 0.05 0.06 0.41 0.06 0.03
AIC Akola Dnyanganga 0.70 0.47 0.54 4.44 0.22
CADA Beed Wan (Beed) 0.29 0.46 1.36 0.46 0.22
BIPC Buldhana Mun 0.08 0.04 5.00 0.19 0.03
CADA Abad Normal Ambadi 0.20 0.08 0.00 0.84 0.08
CADA Abad Bor Dahegaon 0.02 0.01 0.00 0.07 0.00
YIC Yavatmal Adan 0.07 0.03 0.01 0.54 0.01
AIC Akola Koradi 0.08 0.03 0.02 0.33 0.03
NIC Nanded Loni 0.10 0.06 0.02 0.18 0.00
CADA Jalgaon Aner 0.04 0.06 0.03 0.06 0.02
CADA Jalgaon Panzra 0.04 0.03 0.04 0.13 0.02
CADA Abad Tembhapuri 0.10 0.11 0.04 0.23 0.01
CADA Nashik Ghatshil Pargaon 0.03 0.02 0.04 0.05 0.02
CIPC Chandrapur Pothra 0.03 0.03 0.04 0.05 0.02
CIPC Chandrapur Dongargaon
(Wardha)
0.05 0.06 0.04 0.06 0.03
WIC Washim Sonal 0.07 0.06 0.05 0.44 0.05
PIC Pune Kasarsai 0.07 0.07 0.05 0.10 0.05
CADA Abad Dheku 0.06 0.08 0.05 0.08 0.04
NIC Nanded Dongargaon
(Nanded)
0.09 0.30 0.05 0.77 0.00
YIC Yavatmal Navargaon 0.11 0.07 0.06 0.25 0.07
AIC Abad Shivna Takali 0.02 0.03 0.06 0.03 0.00
CADA Jalgaon Malangaon 0.04 0.04 0.07 0.33 0.03
CADA Jalgaon Karwand 0.23 0.55 0.08 0.55 0.09
CADA Nashik Bhojapur 0.16 0.05 0.09 0.17 0.00
CADA Nashik Alandi 0.16 0.06 0.09 0.17 0.01
NIC Nanded Nagzari 0.09 0.12 0.10 0.29 0.00
CADA Pune Visapur 0.14 0.10 0.12 0.21 0.09
CADA Abad Narangi 0.10 0.11 0.13 22.56 0.00
0.18
0.18
0.12
0.08

Circle Plangroup Project FY Avg LY- 2010-11 TY- 2011-12 Past Max Past Min Avg Per StateTar
CADA Nashik Adhala 0.04 0.05 0.15 0.06 0.03
PIC Pune Shetphal 0.10 0.18 0.15 0.18 0.05
PIC Pune Vadiwale 0.51 0.53 0.15 0.74 0.01
CADA Jalgaon Abhora 0.08 0.12 0.17 0.12 0.05
CADA Nashik Mand Ohol 0.04 0.07 0.19 0.07 0.02
PIC Pune Nazare 0.34 0.33 0.23 0.39 0.30
CADA Abad Kolhi 0.07 0.09 0.32 0.26 0.02
WIC Washim Ekburji 0.25 0.26 0.35 0.45 0.08
CADA Jalgaon Suki 0.04 0.04 0.36 0.06 0.03
CIPC Chandrapur Amal Nala 2.56 3.33 1.13 3.33 0.00
CADA Nagpur Surplus Kanholibara 0.08 0.01 0.01 0.25 0.01
CADA Nagpur Rengepar 0.04 0.04 0.02 0.09 0.02
CIPC Chandrapur Panchadhara 0.03 0.04 0.02 0.06 0.03
CIPC Chandrapur Chandai 0.03 0.05 0.02 0.06 0.01
CADA Nagpur Umri 0.08 0.03 0.02 0.33 0.03
CADA Nagpur Managadh 0.03 0.05 0.03 0.06 0.00
CADA Nagpur Chulband 0.04 0.06 0.03 0.07 0.01
CADA Nagpur Sangrampur 0.05 0.05 0.03 0.14 0.00
CADA Nagpur Bagheda 0.03 0.04 0.03 0.04 0.01
CIPC Chandrapur Labhansarad 0.03 0.04 0.04 0.08 0.02
CIPC Chandrapur Pakadigundam 0.47 0.05 0.04 2.68 0.05
CADA Nagpur Chandpur 0.07 0.06 0.04 8.85 0.04
CADA Nagpur Kesarnala 0.11 0.10 0.05 0.17 0.05
CADA Nagpur Chorakhmara 0.05 0.04 0.05 0.11 0.00
CADA Nagpur Mordham 0.11 0.05 0.05 0.26 0.05
CADA Nagpur Bodalkasa 0.06 0.07 0.05 0.12 0.00
CADA Nagpur Betekar Bothali 0.05 0.04 0.05 0.06 0.04
CIPC Chandrapur Chargaon 0.05 0.09 0.05 0.09 0.03
CADA Nagpur Chandrabhaga
(Nagpur)
0.12 0.03 0.05 0.36 0.03
CADA Nagpur Makardhokada-
Saiki Complex
0.18 0.10 0.06 0.47 0.07
CADA Nagpur Khekranala 0.13 0.03 0.06 0.39 0.01
CADA Nagpur Sorna 0.06 0.08 0.06 0.08 0.04
CADA Nagpur Khairbanda 0.09 0.14 0.07 0.17 0.01
CADA Nagpur Pandhrabodi 0.16 0.12 0.11 0.30 0.00
CADA Nagpur Kolar 0.17 0.13 0.11 0.38 0.07
CADA Nagpur Wunna 3.33 2.66 1.93 5.85 2.26
NKIPC Thane Abundant Hetwane 0.20 0.12 0.00 0.37 0.12
TIC Thane Wandri 0.01 0.01 0.01 0.01 0.00
SIC Sangli Kumbhi 0.06 0.07 0.02 0.11 0.04
CIPC Chandrapur Ghorazari 0.05 0.09 0.03 0.09 0.03
KIC Ratnagiri Natuwadi 0.03 0.02 0.03 0.06 0.01
SIC Sangli Kasari 0.04 0.06 0.05 0.06 0.00
SIC Sangli Jangamhatti 0.16 0.11 0.10 0.23 0.11
SIC Sangli Chikotra 0.09 0.10 0.10 0.12 0.07
SIC Sangli Kadavi 0.08 0.18 0.15 0.18 0.04
SIC Sangli Patgaon 0.10 0.15 0.15 0.16 0.08
SIC Sangli Chitri 0.21 0.20 0.15 0.29 0.20
CIPC Chandrapur Naleshwar 0.04 0.06 0.44 0.06 0.02
0.18
0.18
0.08
0.05
0.08

0.14 0.1
0.1 0.02
0.18 0.2
0.22 0.02
0.47 0.05
0.27 0.14
0.32 0.36
0.23 0.03
0.16 0.51
0.17 0.06
0.28 0.17
0.3 0
0.06 0
0.3 0.23
0.42 0.45
0 1
0.61 0.06
0.28 0.43
0.37 0
0.36 0.25
0 0
0.67 0.91
0.38 0.4
0.31 0.48
Head Middle Tail
Highly Deficit CADA Beed 0.14 0.12 0.04
CADA Pune 1.00 0.00 0.00
CADA Solapur 0.09 0.07 0.04
PIC Pune 0.10 0.13 0.08
Deficit AIC Akola 0.22 0.19 0.02
BIPC Buldhana 0.16 0.04 0.00
CADA Abad 0.28 0.23 0.10
CADA Beed 0.10 0.09 0.03
CADA Jalgaon 0.53 0.44 0.83
CADA Nashik 0.40 0.40 0.40
NIC Nanded 0.58 0.34 0.48
UWPC Amravati 0.10 0.08 0.02
Normal AIC Abad 0.30 0.43 0.14
AIC Akola 0.47 0.26 0.00
CADA Abad 0.09 0.09 0.00
CADA Jalgaon 1.00 1.00 1.00
CADA Nashik 0.44 0.39 0.43
CADA Pune 0.60 1.00 1.00
CIPC Chandrapur 0.32 0.38 0.38
NIC Nanded 0.33 0.22 0.18
PIC Pune 0.29 0.33 0.31
WIC Washim 0.50 0.24 0.13
YIC Yavatmal 0.73 0.65 0.15
Surplus CADA Nagpur 0.67 0.68 0.56
CIPC Chandrapur 0.34 0.35 0.35
Abundant CIPC Chandrapur 1.00 1.00 1.00
KIC Ratnagiri 0.02 0.08 0.02
NKIPC Thane 0.11 0.00 0.00
SIC Sangli 0.00 0.00 0.00
TIC Thane 0.33 0.33 0.33
2011-12Plangroup Circle
0.00
0.20
0.40
0.60
0.80
1.00
1.20C
AD
A B
ee
d
CA
DA
Pu
ne
CA
DA
So
lap
ur
PIC
Pu
ne
AIC
Ako
la
BIP
C B
uld
ha
na
CA
DA
Ab
ad
CA
DA
Bee
d
CA
DA
Jalg
ao
n
CA
DA
Nas
hik
NIC
Nan
de
d
UW
PC
Am
rav
ati
AIC
Ab
ad
AIC
Ako
la
CA
DA
Ab
ad
CA
DA
Jalg
ao
n
CA
DA
Nas
hik
CA
DA
Pu
ne
CIP
C C
ha
nd
rap
ur
NIC
Nan
de
d
PIC
Pu
ne
WIC
Wa
sh
im
YIC
Yav
atm
al
CA
DA
Nag
pu
r
CIP
C C
ha
nd
rap
ur
CIP
C C
ha
nd
rap
ur
KIC
Ratn
ag
iri
NK
IPC
Th
an
e
SIC
San
gli
TIC
Th
an
e
Highly Deficit Deficit Normal Surplus Abundant
Indicator XI Medium projects
Equity Performace
Head Middle Tail

Circle Plan Group Project Head Middle TailCADA Beed Highly Deficit Banganga 1.00 0.00 0.00CADA Beed Benitura 0.00 0.00 0.00CADA Beed Chandani 0.00 0.00 0.00CADA Beed Harni 0.34 0.32 0.09CADA Beed Jakapur 0.00 0.00 0.00CADA Beed Kada 0.40 0.36 0.18CADA Beed Kadi 0.05 0.02 0.01CADA Beed Kambli 0.04 0.03 0.03CADA Beed Khandala 0.29 0.21 0.00CADA Beed Khandeshwar 0.06 0.00 0.00CADA Beed Khasapur 0.24 0.13 0.00CADA Beed Kurnoor 0.18 0.20 0.12CADA Beed Mehakari 0.00 0.00 0.00CADA Beed Ramganga 0.50 0.27 0.03CADA Beed Rooty 0.00 0.00 0.00CADA Beed Sakat 0.28 0.05 0.00CADA Beed Talwar 0.00 0.00 0.00CADA Beed Turori 0.00 0.00 0.00CADA Pune Khairy 1.00 0.00 0.00CADA Pune Sina 0.00 0.00 0.00CADA Solapur Budhihal 0.00 0.00 0.00CADA Solapur Ekrukh 0.00 0.00 0.00CADA Solapur Hingani (Pangaon) 0.24 0.19 0.10SIC Sangli Jawalgaon 0.03 0.03 0.01CADA Solapur Mangi 0.00 0.00 0.00PIC Pune Andhali 0.00 0.00 0.00PIC Pune Mhaswad 0.03 0.03 0.01PIC Pune Nher 0.00 0.00 0.00PIC Pune Ranand 0.07 0.00 0.00PIC Pune Tisangi 0.34 0.36 0.25AIC Akola Deficit Dnyanganga 0.24 0.19 0.03AIC Akola Morna (Akola) 0.24 0.17 0.00AIC Akola Nirguna 0.14 0.00 0.00AIC Akola Paldhag 0.11 0.16 0.08AIC Akola Uma 0.47 0.77 0.00BIPC Buldhana Mun 0.16 0.04 0.00CADA Abad Ajantha Andhari 0.18 0.26 0.03CADA Abad Anjana Palashi 0.15 0.25 0.00CADA Abad Dhamna 0.11 0.08 0.00CADA Abad Gadadgad 0.23 0.25 0.00CADA Abad Galhati 0.15 0.14 0.00CADA Abad Girja 0.00 0.00 0.00CADA Abad Jivrekha 0.42 0.42 0.65CADA Abad Jui 0.15 0.15 0.00CADA Abad Kalyan Girja 0.06 0.18 0.00CADA Abad Karpara 0.31 0.27 0.22CADA Abad Khelna 0.30 0.28 0.13CADA Abad Lahuki 0.00 0.00 0.00CADA Abad Masoli 0.42 0.27 0.00CADA Abad Pir Kalyan 0.06 0.03 0.00CADA Abad Purna Nevpur 0.31 0.17 0.00CADA Abad Sukhna 0.00 0.00 0.00CADA Beed Belpara 0.11 0.11 0.04CADA Beed Bindusara 0.16 0.20 0.10CADA Beed Bodhegaon 0.03 0.02 0.00
Indicator XIMedium projects
Equity Performace

Circle Plan Group Project Head Middle TailCADA Beed Borna 0.00 0.00 0.00CADA Beed Devarjan 0.00 0.00 0.00CADA Beed Gharni 0.28 0.38 0.17CADA Beed Kundlika 0.14 0.11 0.28CADA Beed Mahasangvi 0.03 0.03 0.03CADA Beed Masalga 0.00 0.00 0.00CADA Beed Raigavan 0.00 0.00 0.00CADA Beed Renapur 0.00 0.00 0.00CADA Beed Rui 0.00 0.00 0.00CADA Beed Sakol 0.00 0.00 0.00CADA Beed Sangameshwar
(Dokewadi)0.09 0.14 0.00
CADA Beed Saraswati 0.12 0.16 0.00CADA Beed Sindphana 0.32 0.27 0.13CADA Beed Tawarja 0.08 0.08 0.00CADA Beed Terna 0.17 0.10 0.00CADA Beed Tiru 0.34 0.00 0.00CADA Beed Wan (Beed) 0.03 0.05 0.02CADA Beed Whati 0.25 0.00 0.00CADA Jalgaon Agnawati 0.03 0.10 0.06CADA Jalgaon Bhokarbari 0.00 0.00 0.00CADA Jalgaon Bori 0.16 0.17 0.16CADA Jalgaon Burai 1.00 1.00 1.00CADA Jalgaon Hiwara 0.21 0.16 0.16CADA Jalgaon Kanoli 1.00 1.00 1.00CADA Jalgaon Manyad 0.20 0.20 0.20CADA Jalgaon Rangawali 1.00 0.35 1.00CADA Jalgaon Tondapur 0.16 0.21 0.23CADA Nashik Haranbari 0.28 0.28 0.28CADA Nashik Kelzar 0.63 0.63 0.63CADA Nashik Nagyasakya 0.48 0.48 0.48NIC Nanded Karadkhed 0.40 0.25 0.21NIC Nanded Kudala 0.83 0.74 0.72NIC Nanded Kundrala 0.53 0.30 1.00NIC Nanded Mahalingi 0.80 0.46 0.26NIC Nanded Pethwadaj 0.63 0.31 0.26UWPC Amravati Shahanoor 0.10 0.08 0.02AIC Abad Normal Shivna Takali 0.30 0.43 0.14AIC Akola Koradi 0.47 0.26 0.00CADA Abad Ambadi 0.00 0.00 0.00CADA Abad Bor Dahegaon 0.00 0.00 0.00CADA Abad Dheku 0.00 0.00 0.00CADA Abad Kolhi 0.00 0.00 0.00CADA Abad Narangi 0.00 0.00 0.00CADA Abad Tembhapuri 0.00 0.00 0.00CADA Jalgaon Abhora 0.33 0.25 0.25CADA Jalgaon Aner 0.01 1.00 1.00CADA Jalgaon Karwand 1.00 1.00 1.00CADA Jalgaon Malangaon 1.00 1.00 1.00CADA Jalgaon Panzra 1.00 1.00 1.00CADA Jalgaon Suki 0.22 0.18 0.05CADA Nashik Adhala 0.47 0.49 0.44CADA Nashik Alandi 0.92 0.59 0.79CADA Nashik Bhojapur 0.00 0.00 0.00CADA Nashik Ghatshil Pargaon 0.49 0.73 0.73CADA Nashik Mand Ohol 0.00 0.15 0.00CADA Pune Visapur 0.60 1.00 1.00CIPC Chandrapur Amal Nala 0.84 0.84 0.84

Circle Plan Group Project Head Middle TailCIPC Chandrapur Dongargaon
(Wardha)0.36 0.41 0.41
CIPC Chandrapur Pothra 0.13 0.21 0.21NIC Nanded Dongargaon
(Nanded)0.65 0.43 0.30
NIC Nanded Loni 0.08 0.07 0.05NIC Nanded Nagzari 0.81 0.50 0.52PIC Pune Kasarsai 0.00 0.02 0.00PIC Pune Nazare 0.41 0.52 0.47PIC Pune Shetphal 1.00 1.00 1.00PIC Pune Vadiwale 0.00 0.00 0.00WIC Washim Ekburji 0.64 0.30 0.05WIC Washim Sonal 0.39 0.19 0.19YIC Yavatmal Adan 0.89 0.92 0.17YIC Yavatmal Navargaon 0.42 0.03 0.00CADA Nagpur Surplus Bagheda 1.00 1.00 1.00CADA Nagpur Betekar Bothali 0.82 0.86 0.75CADA Nagpur Bodalkasa 0.78 0.57 1.00CADA Nagpur Chandpur 1.00 1.00 1.00CADA Nagpur Chandrabhaga
(Nagpur)0.20 0.31 0.08
CADA Nagpur Chorakhmara 0.90 0.66 0.80CADA Nagpur Chulband 0.74 1.00 0.70CADA Nagpur Kanholibara 0.82 0.93 0.72CADA Nagpur Kesarnala 0.05 0.10 0.00CADA Nagpur Khairbanda 0.70 0.61 0.60CADA Nagpur Khekranala 0.24 0.28 0.20CADA Nagpur Kolar 0.28 0.44 0.12
CADA NagpurMakardhokada-Saiki Complex 0.54 0.76 0.28
CADA Nagpur Managadh 0.69 0.48 0.80CADA Nagpur Mordham 0.17 0.21 0.11CADA Nagpur Pandhrabodi 0.98 0.99 0.97CADA Nagpur Rengepar 1.00 1.00 1.00CADA Nagpur Sangrampur 1.00 1.00 1.00CADA Nagpur Sorna 1.00 1.00 1.00CADA Nagpur Umri 0.16 0.16 0.25CADA Nagpur Wunna 0.26 0.00 0.00CIPC Chandrapur Chandai 0.51 0.51 0.51CIPC Chandrapur Chargaon 0.92 0.92 0.92CIPC Chandrapur Labhansarad 0.29 0.29 0.29CIPC Chandrapur Pakadigundam 0.00 0.00 0.00CIPC Chandrapur Panchadhara 0.17 0.21 0.20CIPC Chandrapur Abundant Ghorazari 1.00 1.00 1.00CIPC Chandrapur Naleshwar 1.00 1.00 1.00KIC Ratnagiri Natuwadi 0.02 0.08 0.02NKIPC Thane Hetwane 0.11 0.00 0.00SIC Sangli Chikotra 0.00 0.00 0.00SIC Sangli Chitri 0.00 0.00 0.00SIC Sangli Jangamhatti 0.00 0.00 0.00SIC Sangli Kadavi 0.00 0.00 0.00SIC Sangli Kasari 0.00 0.00 0.00SIC Sangli Kumbhi 0.00 0.00 0.00SIC Sangli Patgaon 0.00 0.00 0.00TIC Thane Wandri 0.33 0.33 0.33
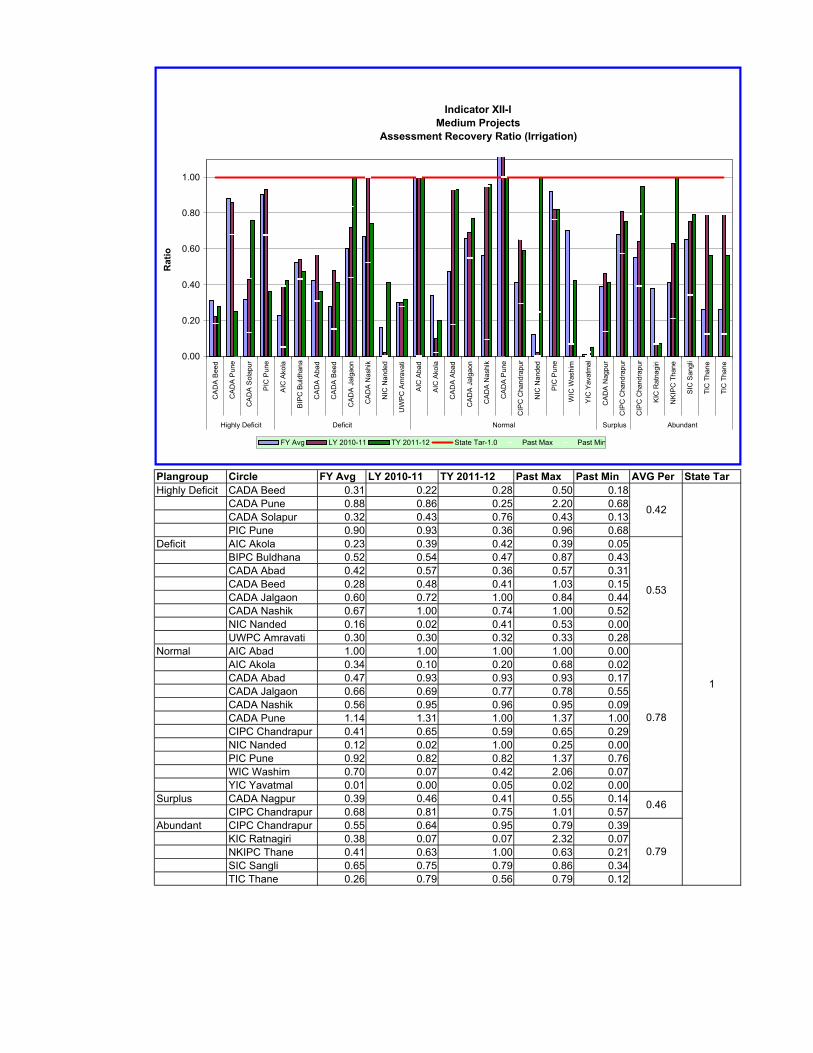
Plangroup Circle FY Avg LY 2010-11 TY 2011-12 Past Max Past Min AVG Per State TarHighly Deficit CADA Beed 0.31 0.22 0.28 0.50 0.18
CADA Pune 0.88 0.86 0.25 2.20 0.68CADA Solapur 0.32 0.43 0.76 0.43 0.13PIC Pune 0.90 0.93 0.36 0.96 0.68
Deficit AIC Akola 0.23 0.39 0.42 0.39 0.05BIPC Buldhana 0.52 0.54 0.47 0.87 0.43CADA Abad 0.42 0.57 0.36 0.57 0.31CADA Beed 0.28 0.48 0.41 1.03 0.15CADA Jalgaon 0.60 0.72 1.00 0.84 0.44CADA Nashik 0.67 1.00 0.74 1.00 0.52NIC Nanded 0.16 0.02 0.41 0.53 0.00UWPC Amravati 0.30 0.30 0.32 0.33 0.28
Normal AIC Abad 1.00 1.00 1.00 1.00 0.00AIC Akola 0.34 0.10 0.20 0.68 0.02CADA Abad 0.47 0.93 0.93 0.93 0.17CADA Jalgaon 0.66 0.69 0.77 0.78 0.55CADA Nashik 0.56 0.95 0.96 0.95 0.09CADA Pune 1.14 1.31 1.00 1.37 1.00CIPC Chandrapur 0.41 0.65 0.59 0.65 0.29NIC Nanded 0.12 0.02 1.00 0.25 0.00PIC Pune 0.92 0.82 0.82 1.37 0.76WIC Washim 0.70 0.07 0.42 2.06 0.07YIC Yavatmal 0.01 0.00 0.05 0.02 0.00
Surplus CADA Nagpur 0.39 0.46 0.41 0.55 0.14CIPC Chandrapur 0.68 0.81 0.75 1.01 0.57
Abundant CIPC Chandrapur 0.55 0.64 0.95 0.79 0.39KIC Ratnagiri 0.38 0.07 0.07 2.32 0.07NKIPC Thane 0.41 0.63 1.00 0.63 0.21SIC Sangli 0.65 0.75 0.79 0.86 0.34TIC Thane 0.26 0.79 0.56 0.79 0.12
0.42
1
0.53
0.78
0.46
0.79
Indicator XII-IMedium Projects
Assessment Recovery Ratio (Irrigation)
0.00
0.20
0.40
0.60
0.80
1.00
CA
DA
Bee
d
CA
DA
Pun
e
CA
DA
Sol
apur
PIC
Pun
e
AIC
Ako
la
BIP
C B
uldh
ana
CA
DA
Aba
d
CA
DA
Bee
d
CA
DA
Jal
gaon
CA
DA
Nas
hik
NIC
Nan
ded
UW
PC
Am
rava
ti
AIC
Aba
d
AIC
Ako
la
CA
DA
Aba
d
CA
DA
Jal
gaon
CA
DA
Nas
hik
CA
DA
Pun
e
CIP
C C
hand
rapu
r
NIC
Nan
ded
PIC
Pun
e
WIC
Was
him
YIC
Yav
atm
al
CA
DA
Nag
pur
CIP
C C
hand
rapu
r
CIP
C C
hand
rapu
r
KIC
Rat
nagi
ri
NK
IPC
Tha
ne
SIC
San
gli
TIC
Tha
ne
TIC
Tha
ne
Highly Deficit Deficit Normal Surplus Abundant
Rat
io
FY Avg LY 2010-11 TY 2011-12 State Tar-1.0 Past Max Past Min
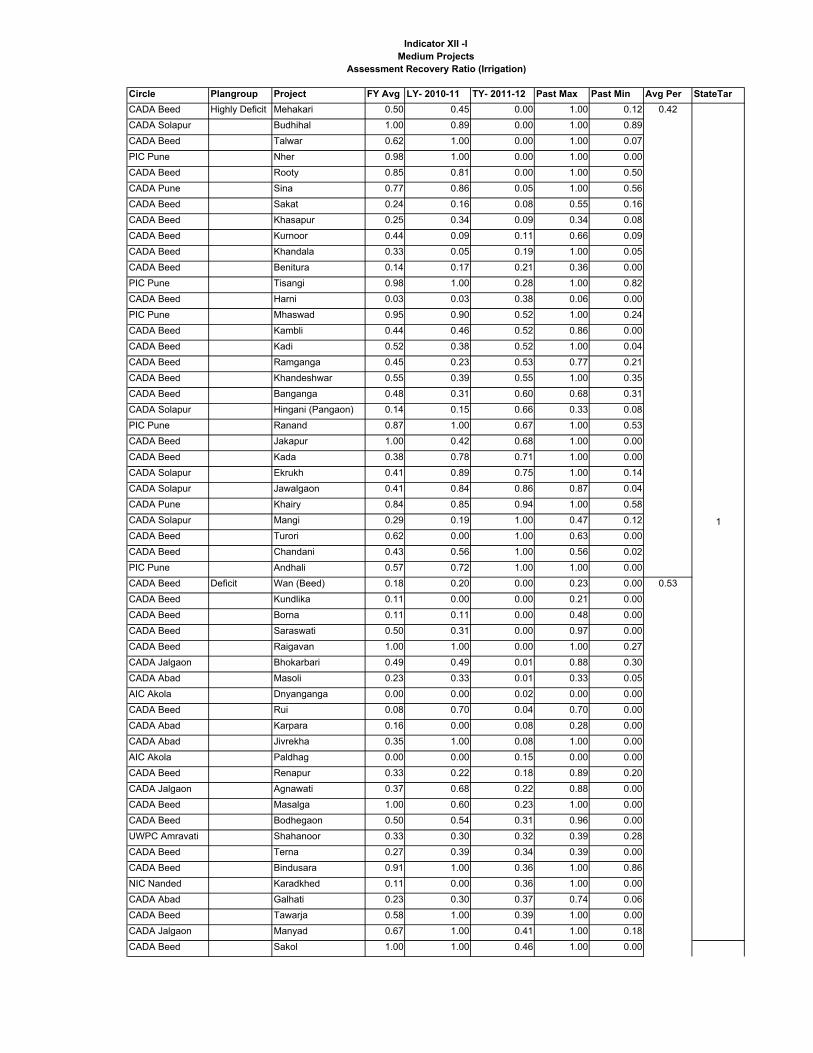
Circle Plangroup Project FY Avg LY- 2010-11 TY- 2011-12 Past Max Past Min Avg Per StateTarCADA Beed Highly Deficit Mehakari 0.50 0.45 0.00 1.00 0.12CADA Solapur Budhihal 1.00 0.89 0.00 1.00 0.89CADA Beed Talwar 0.62 1.00 0.00 1.00 0.07PIC Pune Nher 0.98 1.00 0.00 1.00 0.00CADA Beed Rooty 0.85 0.81 0.00 1.00 0.50CADA Pune Sina 0.77 0.86 0.05 1.00 0.56CADA Beed Sakat 0.24 0.16 0.08 0.55 0.16CADA Beed Khasapur 0.25 0.34 0.09 0.34 0.08CADA Beed Kurnoor 0.44 0.09 0.11 0.66 0.09CADA Beed Khandala 0.33 0.05 0.19 1.00 0.05CADA Beed Benitura 0.14 0.17 0.21 0.36 0.00PIC Pune Tisangi 0.98 1.00 0.28 1.00 0.82CADA Beed Harni 0.03 0.03 0.38 0.06 0.00PIC Pune Mhaswad 0.95 0.90 0.52 1.00 0.24CADA Beed Kambli 0.44 0.46 0.52 0.86 0.00CADA Beed Kadi 0.52 0.38 0.52 1.00 0.04CADA Beed Ramganga 0.45 0.23 0.53 0.77 0.21CADA Beed Khandeshwar 0.55 0.39 0.55 1.00 0.35CADA Beed Banganga 0.48 0.31 0.60 0.68 0.31CADA Solapur Hingani (Pangaon) 0.14 0.15 0.66 0.33 0.08PIC Pune Ranand 0.87 1.00 0.67 1.00 0.53CADA Beed Jakapur 1.00 0.42 0.68 1.00 0.00CADA Beed Kada 0.38 0.78 0.71 1.00 0.00CADA Solapur Ekrukh 0.41 0.89 0.75 1.00 0.14CADA Solapur Jawalgaon 0.41 0.84 0.86 0.87 0.04CADA Pune Khairy 0.84 0.85 0.94 1.00 0.58CADA Solapur Mangi 0.29 0.19 1.00 0.47 0.12CADA Beed Turori 0.62 0.00 1.00 0.63 0.00CADA Beed Chandani 0.43 0.56 1.00 0.56 0.02PIC Pune Andhali 0.57 0.72 1.00 1.00 0.00CADA Beed Deficit Wan (Beed) 0.18 0.20 0.00 0.23 0.00CADA Beed Kundlika 0.11 0.00 0.00 0.21 0.00CADA Beed Borna 0.11 0.11 0.00 0.48 0.00CADA Beed Saraswati 0.50 0.31 0.00 0.97 0.00CADA Beed Raigavan 1.00 1.00 0.00 1.00 0.27CADA Jalgaon Bhokarbari 0.49 0.49 0.01 0.88 0.30CADA Abad Masoli 0.23 0.33 0.01 0.33 0.05AIC Akola Dnyanganga 0.00 0.00 0.02 0.00 0.00CADA Beed Rui 0.08 0.70 0.04 0.70 0.00CADA Abad Karpara 0.16 0.00 0.08 0.28 0.00CADA Abad Jivrekha 0.35 1.00 0.08 1.00 0.00AIC Akola Paldhag 0.00 0.00 0.15 0.00 0.00CADA Beed Renapur 0.33 0.22 0.18 0.89 0.20CADA Jalgaon Agnawati 0.37 0.68 0.22 0.88 0.00CADA Beed Masalga 1.00 0.60 0.23 1.00 0.00CADA Beed Bodhegaon 0.50 0.54 0.31 0.96 0.00UWPC Amravati Shahanoor 0.33 0.30 0.32 0.39 0.28CADA Beed Terna 0.27 0.39 0.34 0.39 0.00CADA Beed Bindusara 0.91 1.00 0.36 1.00 0.86NIC Nanded Karadkhed 0.11 0.00 0.36 1.00 0.00CADA Abad Galhati 0.23 0.30 0.37 0.74 0.06CADA Beed Tawarja 0.58 1.00 0.39 1.00 0.00CADA Jalgaon Manyad 0.67 1.00 0.41 1.00 0.18CADA Beed Sakol 1.00 1.00 0.46 1.00 0.00
Indicator XII -IMedium Projects
Assessment Recovery Ratio (Irrigation)
0.42
1
0.53

Circle Plangroup Project FY Avg LY- 2010-11 TY- 2011-12 Past Max Past Min Avg Per StateTarBIPC Buldhana Mun 0.54 0.54 0.47 0.88 0.43CADA Beed Whati 1.00 0.75 0.48 1.00 0.00CADA Beed Devarjan 0.03 1.00 0.49 1.00 0.00CADA Jalgaon Tondapur 0.05 0.00 0.50 0.29 0.00CADA Beed Tiru 0.90 0.96 0.51 1.00 0.00NIC Nanded Mahalingi 0.13 1.00 0.51 1.00 0.00CADA Jalgaon Hiwara 0.61 0.71 0.53 0.71 0.08CADA Beed Sangameshwar
(Dokewadi)0.26 0.54 0.54 0.54 0.04
CADA Abad Lahuki 0.45 0.71 0.55 1.00 0.31AIC Akola Morna (Akola) 0.26 0.37 0.55 0.37 0.00CADA Jalgaon Bori 0.66 0.67 0.58 0.77 0.14CADA Abad Jui 0.65 0.81 0.61 1.00 0.00CADA Abad Sukhna 0.77 1.00 0.63 1.00 0.45CADA Nashik Kelzar 0.65 1.00 0.69 1.00 0.51CADA Beed Belpara 0.96 1.00 0.70 1.00 0.27AIC Akola Nirguna 0.33 0.51 0.72 0.51 0.09CADA Nashik Haranbari 0.60 1.00 0.72 1.00 0.33CADA Abad Kalyan Girja 0.47 1.00 0.73 1.00 0.22CADA Abad Girja 1.00 1.00 0.76 1.00 0.00CADA Beed Sindphana 0.89 1.00 0.79 1.00 0.50CADA Abad Dhamna 0.43 1.00 0.83 1.00 0.24CADA Abad Purna Nevpur 0.76 0.50 0.90 1.00 0.50CADA Beed Mahasangvi 0.86 0.53 0.90 1.00 0.53CADA Abad Ajantha Andhari 0.86 1.00 0.91 1.00 0.76CADA Nashik Nagyasakya 0.86 1.00 0.93 1.00 0.33CADA Beed Gharni 0.67 0.92 0.94 0.92 0.00CADA Abad Khelna 0.77 0.86 0.97 1.00 0.06CADA Abad Gadadgad 0.25 0.93 1.00 1.00 0.15AIC Akola Uma 0.37 1.00 1.00 1.00 0.00CADA Abad Anjana Palashi 0.98 0.94 1.00 1.00 0.00CADA Jalgaon Kanoli 0.86 0.52 1.00 1.00 0.52NIC Nanded Pethwadaj 0.16 0.50 1.00 0.50 0.00CADA Jalgaon Burai 0.57 0.00 1.00 1.00 0.00CADA Jalgaon Rangawali 0.55 0.67 1.00 0.81 0.35NIC Nanded Kundrala 0.07 0.00 1.00 1.00 0.00CADA Abad Pir Kalyan 0.81 1.00 1.00 1.00 0.00NIC Nanded Kudala 0.03 0.01 1.00 1.00 0.00YIC Yavatmal Normal Navargaon 0.00 0.00 0.00 0.00 0.00CADA Abad Ambadi 0.20 1.00 0.00 1.00 0.02CADA Abad Bor Dahegaon 0.19 1.00 0.00 1.00 0.00CADA Abad Narangi 0.81 1.00 0.00 1.00 0.00YIC Yavatmal Adan 0.01 0.00 0.06 0.02 0.00CADA Nashik Bhojapur 0.56 0.63 0.12 0.76 0.03AIC Akola Koradi 0.10 0.22 0.20 0.25 0.00CADA Jalgaon Abhora 0.20 0.08 0.21 0.35 0.08CIPC Chandrapur Pothra 0.31 0.33 0.27 0.34 0.17PIC Pune Nazare 1.00 1.00 0.34 1.00 0.73CADA Jalgaon Suki 0.38 0.41 0.35 0.50 0.32CIPC Chandrapur Dongargaon
(Wardha)0.47 0.66 0.40 0.66 0.19
WIC Washim Ekburji 0.69 0.12 0.40 1.00 0.12WIC Washim Sonal 0.68 0.04 0.42 1.00 0.00CADA Abad Kolhi 1.00 0.10 0.46 1.00 0.00CADA Nashik Mand Ohol 0.77 1.00 0.48 1.00 0.57CADA Jalgaon Malangaon 0.97 1.00 0.62 1.00 0.92CADA Jalgaon Karwand 0.74 0.72 0.66 1.00 0.55CADA Nashik Ghatshil Pargaon 0.66 1.00 0.72 1.00 0.26
1
0.78
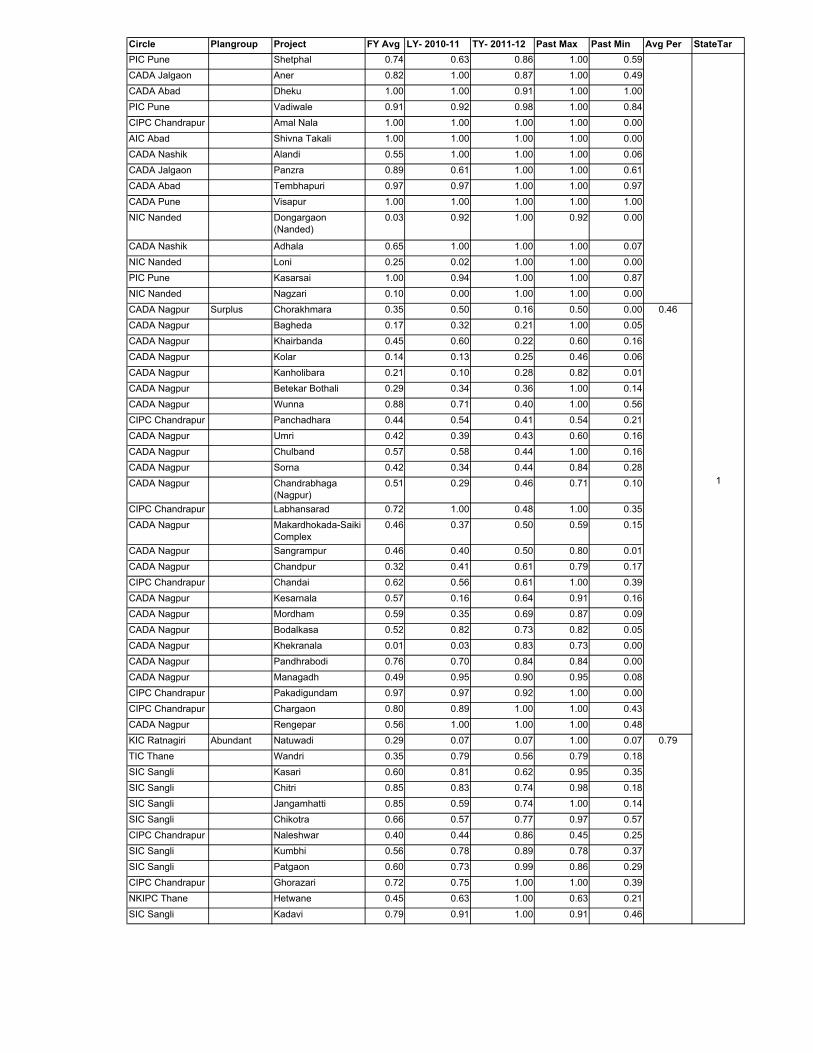
Circle Plangroup Project FY Avg LY- 2010-11 TY- 2011-12 Past Max Past Min Avg Per StateTarPIC Pune Shetphal 0.74 0.63 0.86 1.00 0.59CADA Jalgaon Aner 0.82 1.00 0.87 1.00 0.49CADA Abad Dheku 1.00 1.00 0.91 1.00 1.00PIC Pune Vadiwale 0.91 0.92 0.98 1.00 0.84CIPC Chandrapur Amal Nala 1.00 1.00 1.00 1.00 0.00AIC Abad Shivna Takali 1.00 1.00 1.00 1.00 0.00CADA Nashik Alandi 0.55 1.00 1.00 1.00 0.06CADA Jalgaon Panzra 0.89 0.61 1.00 1.00 0.61CADA Abad Tembhapuri 0.97 0.97 1.00 1.00 0.97CADA Pune Visapur 1.00 1.00 1.00 1.00 1.00NIC Nanded Dongargaon
(Nanded)0.03 0.92 1.00 0.92 0.00
CADA Nashik Adhala 0.65 1.00 1.00 1.00 0.07NIC Nanded Loni 0.25 0.02 1.00 1.00 0.00PIC Pune Kasarsai 1.00 0.94 1.00 1.00 0.87NIC Nanded Nagzari 0.10 0.00 1.00 1.00 0.00CADA Nagpur Surplus Chorakhmara 0.35 0.50 0.16 0.50 0.00CADA Nagpur Bagheda 0.17 0.32 0.21 1.00 0.05CADA Nagpur Khairbanda 0.45 0.60 0.22 0.60 0.16CADA Nagpur Kolar 0.14 0.13 0.25 0.46 0.06CADA Nagpur Kanholibara 0.21 0.10 0.28 0.82 0.01CADA Nagpur Betekar Bothali 0.29 0.34 0.36 1.00 0.14CADA Nagpur Wunna 0.88 0.71 0.40 1.00 0.56CIPC Chandrapur Panchadhara 0.44 0.54 0.41 0.54 0.21CADA Nagpur Umri 0.42 0.39 0.43 0.60 0.16CADA Nagpur Chulband 0.57 0.58 0.44 1.00 0.16CADA Nagpur Sorna 0.42 0.34 0.44 0.84 0.28CADA Nagpur Chandrabhaga
(Nagpur)0.51 0.29 0.46 0.71 0.10
CIPC Chandrapur Labhansarad 0.72 1.00 0.48 1.00 0.35CADA Nagpur Makardhokada-Saiki
Complex0.46 0.37 0.50 0.59 0.15
CADA Nagpur Sangrampur 0.46 0.40 0.50 0.80 0.01CADA Nagpur Chandpur 0.32 0.41 0.61 0.79 0.17CIPC Chandrapur Chandai 0.62 0.56 0.61 1.00 0.39CADA Nagpur Kesarnala 0.57 0.16 0.64 0.91 0.16CADA Nagpur Mordham 0.59 0.35 0.69 0.87 0.09CADA Nagpur Bodalkasa 0.52 0.82 0.73 0.82 0.05CADA Nagpur Khekranala 0.01 0.03 0.83 0.73 0.00CADA Nagpur Pandhrabodi 0.76 0.70 0.84 0.84 0.00CADA Nagpur Managadh 0.49 0.95 0.90 0.95 0.08CIPC Chandrapur Pakadigundam 0.97 0.97 0.92 1.00 0.00CIPC Chandrapur Chargaon 0.80 0.89 1.00 1.00 0.43CADA Nagpur Rengepar 0.56 1.00 1.00 1.00 0.48KIC Ratnagiri Abundant Natuwadi 0.29 0.07 0.07 1.00 0.07TIC Thane Wandri 0.35 0.79 0.56 0.79 0.18SIC Sangli Kasari 0.60 0.81 0.62 0.95 0.35SIC Sangli Chitri 0.85 0.83 0.74 0.98 0.18SIC Sangli Jangamhatti 0.85 0.59 0.74 1.00 0.14SIC Sangli Chikotra 0.66 0.57 0.77 0.97 0.57CIPC Chandrapur Naleshwar 0.40 0.44 0.86 0.45 0.25SIC Sangli Kumbhi 0.56 0.78 0.89 0.78 0.37SIC Sangli Patgaon 0.60 0.73 0.99 0.86 0.29CIPC Chandrapur Ghorazari 0.72 0.75 1.00 1.00 0.39NKIPC Thane Hetwane 0.45 0.63 1.00 0.63 0.21SIC Sangli Kadavi 0.79 0.91 1.00 0.91 0.46
1
0.46
0.79

Plangroup Circle FY Avg LY 2010-11 TY 2011-12 Past Max Past Min AVG Per State TarHighly Deficit CADA Beed 0.55 0.58 1.00 0.73 0.23
CADA Pune 0.77 0.73 0.54 1.00 0.67CADA Solapur 0.76 1.00 1.00 1.00 0.62PIC Pune 0.49 1.00 0.42 1.00 0.27
Deficit AIC Akola 0.70 0.96 0.59 0.96 0.19BIPC Buldhana 1.00 1.00 1.00 1.00 0.00CADA Abad 0.80 0.91 0.99 0.91 0.65CADA Beed 0.42 0.46 0.63 0.57 0.34CADA Jalgaon 0.57 0.57 0.84 0.73 0.37CADA Nashik 0.98 1.00 0.44 1.00 0.90NIC Nanded 0.86 0.95 0.87 1.00 0.69UWPC Amravati 1.00 1.00 1.00 1.00 1.00
Normal AIC Abad 1.00 1.00 0.61 1.00 0.00AIC Akola 0.92 0.77 0.13 0.98 0.62CADA Abad 0.71 0.63 1.00 1.00 0.55CADA Jalgaon 0.70 0.30 0.63 1.00 0.30CADA Nashik 0.94 1.00 1.00 1.00 0.58CADA Pune 0.73 0.38 1.00 1.00 0.38CIPC Chandrapur 0.94 0.97 1.00 1.00 0.84NIC Nanded 0.98 1.00 1.00 1.00 0.92PIC Pune 1.00 1.00 1.00 1.00 0.99WIC Washim 0.54 0.56 1.00 0.72 0.46YIC Yavatmal 0.48 0.11 0.09 0.95 0.11
Surplus CADA Nagpur 0.95 0.94 0.96 1.00 0.93CIPC Chandrapur 0.95 1.00 0.96 1.00 0.91
Abundant CIPC Chandrapur 1.00 0.00 0.00 1.00 0.00KIC Ratnagiri 1.00 1.00 1.00 1.00 0.70NKIPC Thane 1.00 1.00 0.94 1.00 0.97SIC Sangli 0.78 0.82 0.77 0.98 0.56TIC Thane 0.00 0.00 0.00 0.00 0.00
0.85
1
0.87
0.91
0.96
0.82
Indicator XII-NIMedium Projects
Assessment Recovery Ratio (Non-Irrigation)
0
0.2
0.4
0.6
0.8
1
CA
DA
Bee
d
CA
DA
Pun
e
CA
DA
Sol
apur
PIC
Pun
e
AIC
Ako
la
BIP
C B
uldh
ana
CA
DA
Aba
d
CA
DA
Bee
d
CA
DA
Jal
gaon
CA
DA
Nas
hik
NIC
Nan
ded
UW
PC
Am
rava
ti
AIC
Aba
d
AIC
Ako
la
CA
DA
Aba
d
CA
DA
Jal
gaon
CA
DA
Nas
hik
CA
DA
Pun
e
CIP
C C
hand
rapu
r
NIC
Nan
ded
PIC
Pun
e
WIC
Was
him
YIC
Yav
atm
al
CA
DA
Nag
pur
CIP
C C
hand
rapu
r
CIP
C C
hand
rapu
r
KIC
Rat
nagi
ri
NK
IPC
Tha
ne
SIC
San
gli
TIC
Tha
ne
Highly Deficit Deficit Normal Surplus Abundant
Rat
io
FY Avg LY 2010-11 TY 2011-12 State Tar-1.0 Past Max Past Min
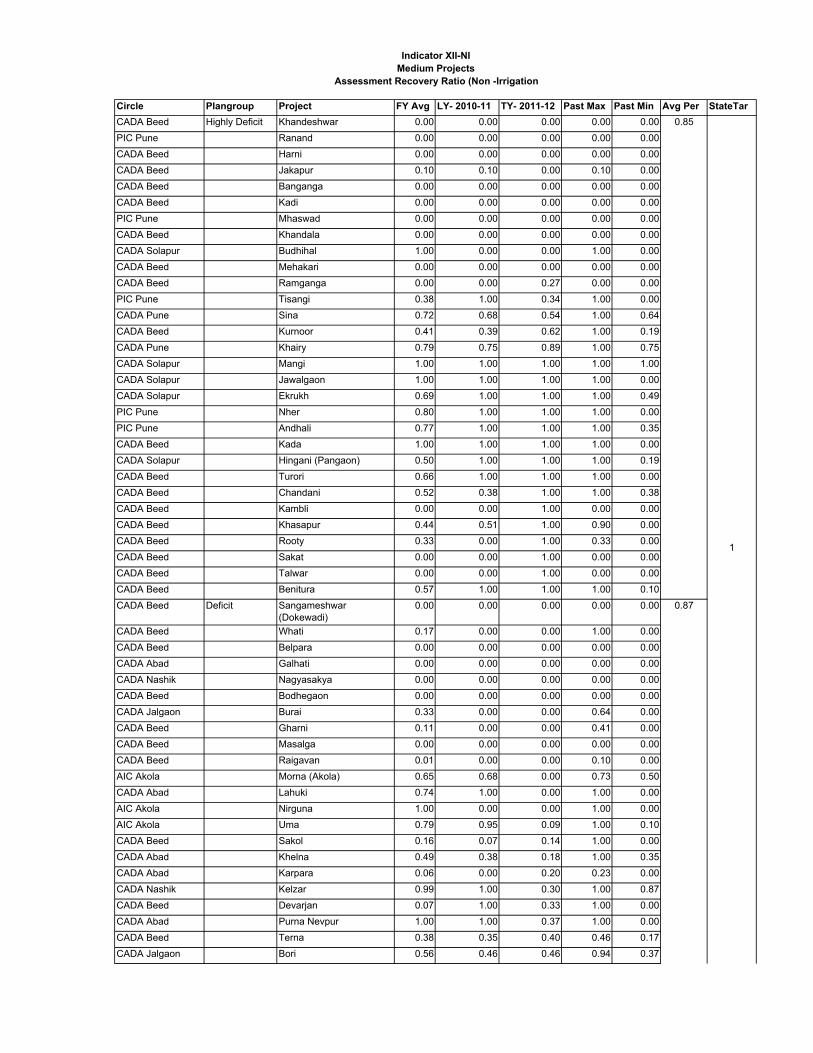
Circle Plangroup Project FY Avg LY- 2010-11 TY- 2011-12 Past Max Past Min Avg Per StateTarCADA Beed Highly Deficit Khandeshwar 0.00 0.00 0.00 0.00 0.00PIC Pune Ranand 0.00 0.00 0.00 0.00 0.00CADA Beed Harni 0.00 0.00 0.00 0.00 0.00CADA Beed Jakapur 0.10 0.10 0.00 0.10 0.00CADA Beed Banganga 0.00 0.00 0.00 0.00 0.00CADA Beed Kadi 0.00 0.00 0.00 0.00 0.00PIC Pune Mhaswad 0.00 0.00 0.00 0.00 0.00CADA Beed Khandala 0.00 0.00 0.00 0.00 0.00CADA Solapur Budhihal 1.00 0.00 0.00 1.00 0.00CADA Beed Mehakari 0.00 0.00 0.00 0.00 0.00CADA Beed Ramganga 0.00 0.00 0.27 0.00 0.00PIC Pune Tisangi 0.38 1.00 0.34 1.00 0.00CADA Pune Sina 0.72 0.68 0.54 1.00 0.64CADA Beed Kurnoor 0.41 0.39 0.62 1.00 0.19CADA Pune Khairy 0.79 0.75 0.89 1.00 0.75CADA Solapur Mangi 1.00 1.00 1.00 1.00 1.00CADA Solapur Jawalgaon 1.00 1.00 1.00 1.00 0.00CADA Solapur Ekrukh 0.69 1.00 1.00 1.00 0.49PIC Pune Nher 0.80 1.00 1.00 1.00 0.00PIC Pune Andhali 0.77 1.00 1.00 1.00 0.35CADA Beed Kada 1.00 1.00 1.00 1.00 0.00CADA Solapur Hingani (Pangaon) 0.50 1.00 1.00 1.00 0.19CADA Beed Turori 0.66 1.00 1.00 1.00 0.00CADA Beed Chandani 0.52 0.38 1.00 1.00 0.38CADA Beed Kambli 0.00 0.00 1.00 0.00 0.00CADA Beed Khasapur 0.44 0.51 1.00 0.90 0.00CADA Beed Rooty 0.33 0.00 1.00 0.33 0.00CADA Beed Sakat 0.00 0.00 1.00 0.00 0.00CADA Beed Talwar 0.00 0.00 1.00 0.00 0.00CADA Beed Benitura 0.57 1.00 1.00 1.00 0.10CADA Beed Deficit Sangameshwar
(Dokewadi)0.00 0.00 0.00 0.00 0.00
CADA Beed Whati 0.17 0.00 0.00 1.00 0.00CADA Beed Belpara 0.00 0.00 0.00 0.00 0.00CADA Abad Galhati 0.00 0.00 0.00 0.00 0.00CADA Nashik Nagyasakya 0.00 0.00 0.00 0.00 0.00CADA Beed Bodhegaon 0.00 0.00 0.00 0.00 0.00CADA Jalgaon Burai 0.33 0.00 0.00 0.64 0.00CADA Beed Gharni 0.11 0.00 0.00 0.41 0.00CADA Beed Masalga 0.00 0.00 0.00 0.00 0.00CADA Beed Raigavan 0.01 0.00 0.00 0.10 0.00AIC Akola Morna (Akola) 0.65 0.68 0.00 0.73 0.50CADA Abad Lahuki 0.74 1.00 0.00 1.00 0.00AIC Akola Nirguna 1.00 0.00 0.00 1.00 0.00AIC Akola Uma 0.79 0.95 0.09 1.00 0.10CADA Beed Sakol 0.16 0.07 0.14 1.00 0.00CADA Abad Khelna 0.49 0.38 0.18 1.00 0.35CADA Abad Karpara 0.06 0.00 0.20 0.23 0.00CADA Nashik Kelzar 0.99 1.00 0.30 1.00 0.87CADA Beed Devarjan 0.07 1.00 0.33 1.00 0.00CADA Abad Purna Nevpur 1.00 1.00 0.37 1.00 0.00CADA Beed Terna 0.38 0.35 0.40 0.46 0.17CADA Jalgaon Bori 0.56 0.46 0.46 0.94 0.37
Indicator XII-NIMedium Projects
Assessment Recovery Ratio (Non -Irrigation
1
0.85
0.87
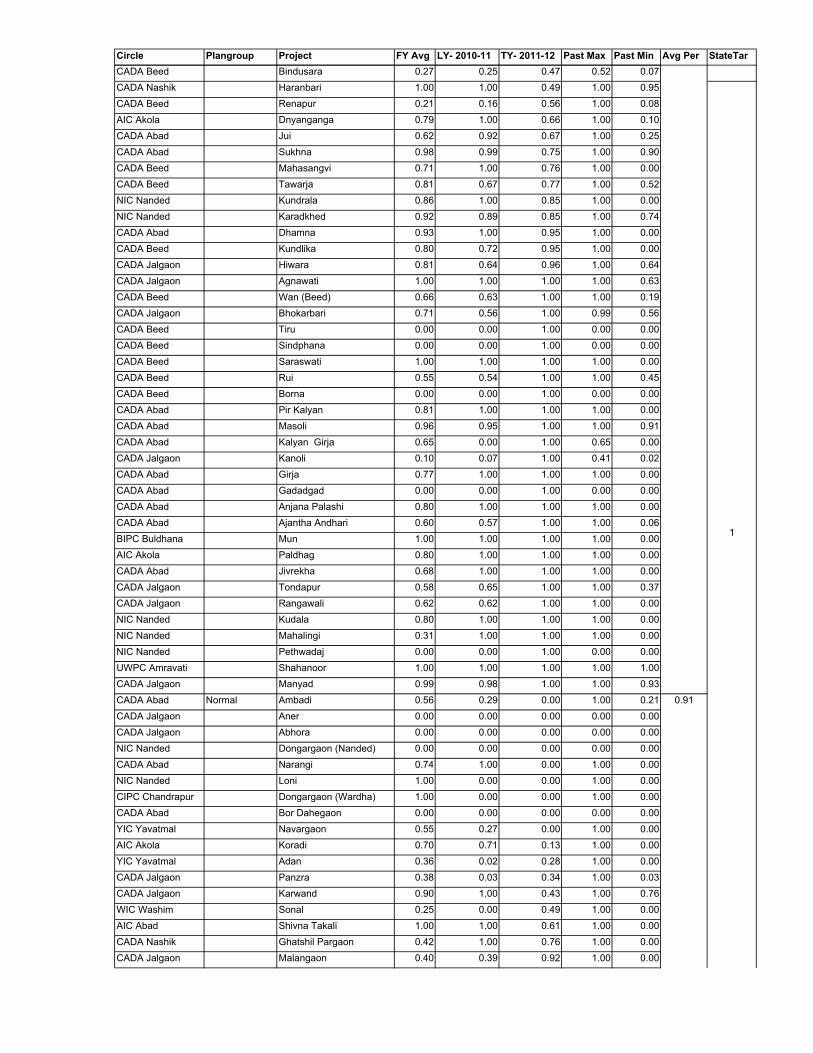
Circle Plangroup Project FY Avg LY- 2010-11 TY- 2011-12 Past Max Past Min Avg Per StateTarCADA Beed Bindusara 0.27 0.25 0.47 0.52 0.07CADA Nashik Haranbari 1.00 1.00 0.49 1.00 0.95CADA Beed Renapur 0.21 0.16 0.56 1.00 0.08AIC Akola Dnyanganga 0.79 1.00 0.66 1.00 0.10CADA Abad Jui 0.62 0.92 0.67 1.00 0.25CADA Abad Sukhna 0.98 0.99 0.75 1.00 0.90CADA Beed Mahasangvi 0.71 1.00 0.76 1.00 0.00CADA Beed Tawarja 0.81 0.67 0.77 1.00 0.52NIC Nanded Kundrala 0.86 1.00 0.85 1.00 0.00NIC Nanded Karadkhed 0.92 0.89 0.85 1.00 0.74CADA Abad Dhamna 0.93 1.00 0.95 1.00 0.00CADA Beed Kundlika 0.80 0.72 0.95 1.00 0.00CADA Jalgaon Hiwara 0.81 0.64 0.96 1.00 0.64CADA Jalgaon Agnawati 1.00 1.00 1.00 1.00 0.63CADA Beed Wan (Beed) 0.66 0.63 1.00 1.00 0.19CADA Jalgaon Bhokarbari 0.71 0.56 1.00 0.99 0.56CADA Beed Tiru 0.00 0.00 1.00 0.00 0.00CADA Beed Sindphana 0.00 0.00 1.00 0.00 0.00CADA Beed Saraswati 1.00 1.00 1.00 1.00 0.00CADA Beed Rui 0.55 0.54 1.00 1.00 0.45CADA Beed Borna 0.00 0.00 1.00 0.00 0.00CADA Abad Pir Kalyan 0.81 1.00 1.00 1.00 0.00CADA Abad Masoli 0.96 0.95 1.00 1.00 0.91CADA Abad Kalyan Girja 0.65 0.00 1.00 0.65 0.00CADA Jalgaon Kanoli 0.10 0.07 1.00 0.41 0.02CADA Abad Girja 0.77 1.00 1.00 1.00 0.00CADA Abad Gadadgad 0.00 0.00 1.00 0.00 0.00CADA Abad Anjana Palashi 0.80 1.00 1.00 1.00 0.00CADA Abad Ajantha Andhari 0.60 0.57 1.00 1.00 0.06BIPC Buldhana Mun 1.00 1.00 1.00 1.00 0.00AIC Akola Paldhag 0.80 1.00 1.00 1.00 0.00CADA Abad Jivrekha 0.68 1.00 1.00 1.00 0.00CADA Jalgaon Tondapur 0.58 0.65 1.00 1.00 0.37CADA Jalgaon Rangawali 0.62 0.62 1.00 1.00 0.00NIC Nanded Kudala 0.80 1.00 1.00 1.00 0.00NIC Nanded Mahalingi 0.31 1.00 1.00 1.00 0.00NIC Nanded Pethwadaj 0.00 0.00 1.00 0.00 0.00UWPC Amravati Shahanoor 1.00 1.00 1.00 1.00 1.00CADA Jalgaon Manyad 0.99 0.98 1.00 1.00 0.93CADA Abad Normal Ambadi 0.56 0.29 0.00 1.00 0.21CADA Jalgaon Aner 0.00 0.00 0.00 0.00 0.00CADA Jalgaon Abhora 0.00 0.00 0.00 0.00 0.00NIC Nanded Dongargaon (Nanded) 0.00 0.00 0.00 0.00 0.00CADA Abad Narangi 0.74 1.00 0.00 1.00 0.00NIC Nanded Loni 1.00 0.00 0.00 1.00 0.00CIPC Chandrapur Dongargaon (Wardha) 1.00 0.00 0.00 1.00 0.00CADA Abad Bor Dahegaon 0.00 0.00 0.00 0.00 0.00YIC Yavatmal Navargaon 0.55 0.27 0.00 1.00 0.00AIC Akola Koradi 0.70 0.71 0.13 1.00 0.00YIC Yavatmal Adan 0.36 0.02 0.28 1.00 0.00CADA Jalgaon Panzra 0.38 0.03 0.34 1.00 0.03CADA Jalgaon Karwand 0.90 1.00 0.43 1.00 0.76WIC Washim Sonal 0.25 0.00 0.49 1.00 0.00AIC Abad Shivna Takali 1.00 1.00 0.61 1.00 0.00CADA Nashik Ghatshil Pargaon 0.42 1.00 0.76 1.00 0.00CADA Jalgaon Malangaon 0.40 0.39 0.92 1.00 0.00
1
0.91

Circle Plangroup Project FY Avg LY- 2010-11 TY- 2011-12 Past Max Past Min Avg Per StateTarWIC Washim Ekburji 0.57 0.61 1.00 0.84 0.43PIC Pune Vadiwale 1.00 1.00 1.00 1.00 1.00PIC Pune Shetphal 1.00 1.00 1.00 1.00 0.00PIC Pune Nazare 0.99 0.98 1.00 1.00 0.98PIC Pune Kasarsai 1.00 1.00 1.00 1.00 0.87NIC Nanded Nagzari 0.97 1.00 1.00 1.00 0.00CADA Abad Kolhi 0.58 0.61 1.00 1.00 0.12CADA Abad Tembhapuri 0.97 1.00 1.00 1.00 0.00CIPC Chandrapur Pothra 1.00 1.00 1.00 1.00 0.00CIPC Chandrapur Amal Nala 1.00 1.00 1.00 1.00 0.99CADA Pune Visapur 0.71 0.38 1.00 1.00 0.38CADA Nashik Mand Ohol 0.86 1.00 1.00 1.00 0.36CADA Nashik Bhojapur 0.94 1.00 1.00 1.00 0.00CADA Nashik Alandi 0.94 0.00 1.00 0.94 0.00CADA Jalgaon Suki 0.48 0.00 1.00 1.00 0.00CADA Nashik Adhala 0.61 1.00 1.00 1.00 0.00CADA Abad Dheku 0.94 0.96 1.00 1.00 0.00CADA Nagpur Surplus Sangrampur 0.00 0.00 0.00 0.00 0.00CIPC Chandrapur Chandai 1.00 0.00 0.00 1.00 0.00CADA Nagpur Sorna 0.00 0.00 0.00 0.00 0.00CADA Nagpur Bagheda 1.00 1.00 0.00 1.00 0.00CADA Nagpur Chandpur 1.00 1.00 0.00 1.00 0.00CIPC Chandrapur Panchadhara 1.00 0.00 0.00 1.00 0.00CADA Nagpur Rengepar 0.00 0.00 0.00 0.00 0.00CADA Nagpur Chulband 0.00 0.00 0.00 0.00 0.00CADA Nagpur Betekar Bothali 0.00 0.00 0.00 0.00 0.00CADA Nagpur Khekranala 0.16 0.33 0.08 0.33 0.00CADA Nagpur Pandhrabodi 0.78 0.49 0.58 1.00 0.49CIPC Chandrapur Chargaon 0.57 1.00 0.68 1.00 0.03CIPC Chandrapur Labhansarad 0.35 0.00 0.73 1.00 0.00CADA Nagpur Kolar 0.66 0.66 0.91 1.00 0.41CADA Nagpur Umri 0.00 0.00 1.00 0.00 0.00CADA Nagpur Wunna 1.00 1.00 1.00 1.00 0.99CIPC Chandrapur Pakadigundam 0.99 0.00 1.00 1.00 0.00CADA Nagpur Managadh 0.00 0.00 1.00 0.00 0.00CADA Nagpur Makardhokada-Saiki
Complex0.99 1.00 1.00 1.00 0.86
CADA Nagpur Khairbanda 0.00 0.00 1.00 0.00 0.00CADA Nagpur Kanholibara 0.00 0.00 1.00 0.00 0.00CADA Nagpur Chorakhmara 0.00 0.00 1.00 1.00 0.00CADA Nagpur Chandrabhaga (Nagpur) 1.00 1.00 1.00 1.00 1.00CADA Nagpur Bodalkasa 0.52 1.00 1.00 1.00 0.30CADA Nagpur Kesarnala 0.86 1.00 1.00 1.00 0.00CADA Nagpur Mordham 0.55 1.00 1.00 1.00 0.00CIPC Chandrapur Abundant Ghorazari 1.00 0.00 0.00 1.00 0.00CIPC Chandrapur Naleshwar 1.00 0.00 0.00 1.00 0.00TIC Thane Wandri 0.00 0.00 0.00 0.00 0.00SIC Sangli Kumbhi 0.63 0.49 0.23 1.00 0.44SIC Sangli Patgaon 0.78 1.00 0.73 1.00 0.57SIC Sangli Chitri 0.93 0.98 0.82 1.00 0.82SIC Sangli Chikotra 1.00 1.00 0.85 1.00 0.99NKIPC Thane Hetwane 1.00 1.00 0.94 1.00 0.97SIC Sangli Jangamhatti 0.91 1.00 1.00 1.00 0.66SIC Sangli Kadavi 0.42 0.60 1.00 1.00 0.00SIC Sangli Kasari 1.00 0.00 1.00 1.00 0.00KIC Ratnagiri Natuwadi 0.91 1.00 1.00 1.00 0.70
0.82
1
0.96

Minor Project

Plangroup Circle FY Avg LY 2010-11 TY 2011-12 Past Max Past Min AVG Per State TarHighly Deficit CADA Beed 7053 9091 8687 68871 7024
CADA Pune 5954 5251 6972 170597 5251CADA Solapur 5933 4267 5913 6477 4261PIC Pune 5925 6123 7565 6586 4468SIC Sangli 12717 6632 8663 7994 5493
Deficit AIC Abad 7016 6698 5171 7214 5745AIC Akola 7796 4752 6033 7345 3617BIPC Buldhana 8535 5997 8864 8089 5997CADA Abad 5730 6467 5468 6551 1735CADA Beed 7735 9389 8789 75787 6880CADA Jalgaon 5908 4858 6154 33844 4858CADA Nashik 6359 5386 4844 6946 4866NIC Nanded 7197 6784 7433 44354 6215UWPC Amravati 8286 6844 7208 7918 5405WIC Washim 4406 4683 4144 16800 4683
Normal AIC Akola 4764 5014 3496 5463 3683CADA Jalgaon 7463 8612 7186 14634 5425CADA Nashik 5772 6230 7703 46341 5276CADA Pune 4134 3819 3407 4387 3518CIPC Chandrapur 6552 9591 7300 10318 7062NIC Nanded 7465 8469 9605 128585 2819PIC Pune 5781 6078 7377 12742 5081UWPC Amravati 9629 7296 8339 10013 6778YIC Yavatmal 3378 1514 9890 14692 0
Surplus CADA Nagpur 4001 4688 3519 4814 3337CIPC Chandrapur 4751 3626 3868 5283 3612
Abundant CADA Pune 6054 5431 4306 7751 3990CIPC Chandrapur 4175 2651 3744 5045 2651KIC Ratnagiri 17231 92473 69320 92473 15705NKIPC Thane 53907 66914 72334 80174 31900SIC Sangli 11441 9254 10395 11327 9125TIC Thane 18544 12790 12984 19414 12741
6667
7560
6411
7145
3694
28847
Indicator IMinor Projects
Annual Irrigation Water Supply per unit Irrigated Area (cum/ha)
0
1000
2000
3000
4000
5000
6000
7000
8000
9000
10000
CA
DA
Bee
d
CA
DA
Pun
e
CA
DA
Sol
apur
PIC
Pun
e
SIC
San
gli
AIC
Aba
d
AIC
Ako
la
BIP
C B
uldh
ana
CA
DA
Aba
d
CA
DA
Bee
d
CA
DA
Jal
gaon
CA
DA
Nas
hik
NIC
Nan
ded
UW
PC
Am
rava
ti
WIC
Was
him
AIC
Ako
la
CA
DA
Jal
gaon
CA
DA
Nas
hik
CA
DA
Pun
e
CIP
C C
hand
rapu
r
NIC
Nan
ded
PIC
Pun
e
UW
PC
Am
rava
ti
YIC
Yav
atm
al
CA
DA
Nag
pur
CIP
C C
hand
rapu
r
CA
DA
Pun
e
CIP
C C
hand
rapu
r
KIC
Rat
nagi
ri
NK
IPC
Tha
ne
SIC
San
gli
TIC
Tha
ne
Highly Deficit Deficit Normal Surplus Abundant
cum
/ha
FY Avg LY 2010-11 TY 2011-12 StateTar Past Max Past Min
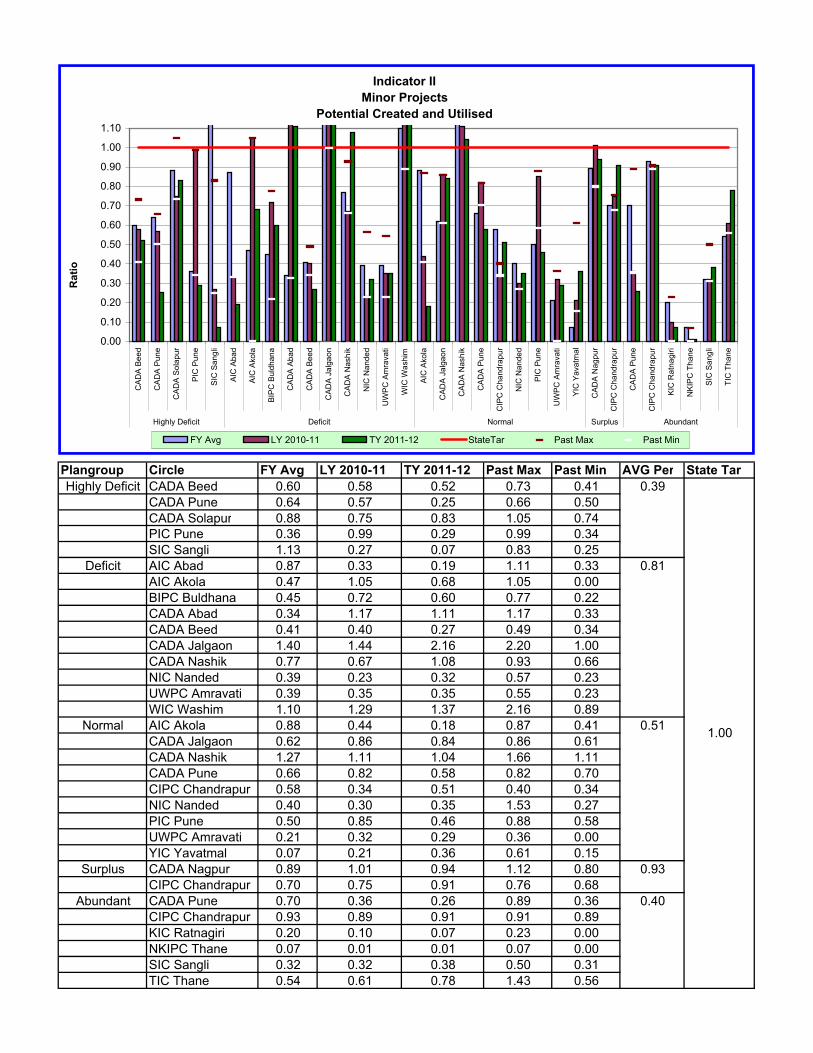
Plangroup Circle FY Avg LY 2010-11 TY 2011-12 Past Max Past Min AVG Per State TarHighly Deficit CADA Beed 0.60 0.58 0.52 0.73 0.41
CADA Pune 0.64 0.57 0.25 0.66 0.50CADA Solapur 0.88 0.75 0.83 1.05 0.74PIC Pune 0.36 0.99 0.29 0.99 0.34SIC Sangli 1.13 0.27 0.07 0.83 0.25
Deficit AIC Abad 0.87 0.33 0.19 1.11 0.33AIC Akola 0.47 1.05 0.68 1.05 0.00BIPC Buldhana 0.45 0.72 0.60 0.77 0.22CADA Abad 0.34 1.17 1.11 1.17 0.33CADA Beed 0.41 0.40 0.27 0.49 0.34CADA Jalgaon 1.40 1.44 2.16 2.20 1.00CADA Nashik 0.77 0.67 1.08 0.93 0.66NIC Nanded 0.39 0.23 0.32 0.57 0.23UWPC Amravati 0.39 0.35 0.35 0.55 0.23WIC Washim 1.10 1.29 1.37 2.16 0.89
Normal AIC Akola 0.88 0.44 0.18 0.87 0.41CADA Jalgaon 0.62 0.86 0.84 0.86 0.61CADA Nashik 1.27 1.11 1.04 1.66 1.11CADA Pune 0.66 0.82 0.58 0.82 0.70CIPC Chandrapur 0.58 0.34 0.51 0.40 0.34NIC Nanded 0.40 0.30 0.35 1.53 0.27PIC Pune 0.50 0.85 0.46 0.88 0.58UWPC Amravati 0.21 0.32 0.29 0.36 0.00YIC Yavatmal 0.07 0.21 0.36 0.61 0.15
Surplus CADA Nagpur 0.89 1.01 0.94 1.12 0.80CIPC Chandrapur 0.70 0.75 0.91 0.76 0.68
Abundant CADA Pune 0.70 0.36 0.26 0.89 0.36CIPC Chandrapur 0.93 0.89 0.91 0.91 0.89KIC Ratnagiri 0.20 0.10 0.07 0.23 0.00NKIPC Thane 0.07 0.01 0.01 0.07 0.00SIC Sangli 0.32 0.32 0.38 0.50 0.31TIC Thane 0.54 0.61 0.78 1.43 0.56
1.00
0.39
0.81
0.51
0.93
0.40
Indicator IIMinor Projects
Potential Created and Utilised
0.00
0.10
0.20
0.30
0.40
0.50
0.60
0.70
0.80
0.90
1.00
1.10C
ADA
Beed
CAD
A Pu
ne
CAD
A So
lapu
r
PIC
Pun
e
SIC
San
gli
AIC
Aba
d
AIC
Ako
la
BIPC
Bul
dhan
a
CAD
A Ab
ad
CAD
A Be
ed
CAD
A Ja
lgao
n
CAD
A N
ashi
k
NIC
Nan
ded
UW
PC A
mra
vati
WIC
Was
him
AIC
Ako
la
CAD
A Ja
lgao
n
CAD
A N
ashi
k
CAD
A Pu
ne
CIP
C C
hand
rapu
r
NIC
Nan
ded
PIC
Pun
e
UW
PC A
mra
vati
YIC
Yav
atm
al
CAD
A N
agpu
r
CIP
C C
hand
rapu
r
CAD
A Pu
ne
CIP
C C
hand
rapu
r
KIC
Rat
nagi
ri
NKI
PC T
hane
SIC
San
gli
TIC
Tha
ne
Highly Deficit Deficit Normal Surplus Abundant
Rat
io
FY Avg LY 2010-11 TY 2011-12 StateTar Past Max Past Min
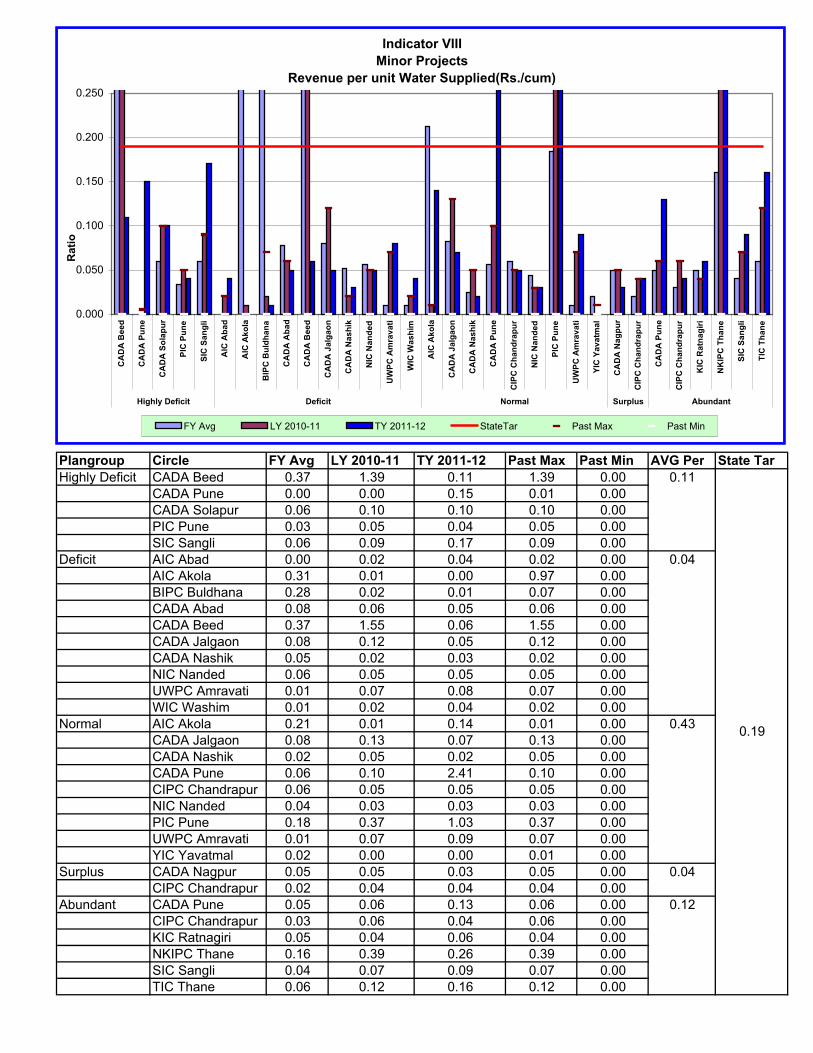
Plangroup Circle FY Avg LY 2010-11 TY 2011-12 Past Max Past Min AVG Per State TarHighly Deficit CADA Beed 0.37 1.39 0.11 1.39 0.00
CADA Pune 0.00 0.00 0.15 0.01 0.00CADA Solapur 0.06 0.10 0.10 0.10 0.00PIC Pune 0.03 0.05 0.04 0.05 0.00SIC Sangli 0.06 0.09 0.17 0.09 0.00
Deficit AIC Abad 0.00 0.02 0.04 0.02 0.00AIC Akola 0.31 0.01 0.00 0.97 0.00BIPC Buldhana 0.28 0.02 0.01 0.07 0.00CADA Abad 0.08 0.06 0.05 0.06 0.00CADA Beed 0.37 1.55 0.06 1.55 0.00CADA Jalgaon 0.08 0.12 0.05 0.12 0.00CADA Nashik 0.05 0.02 0.03 0.02 0.00NIC Nanded 0.06 0.05 0.05 0.05 0.00UWPC Amravati 0.01 0.07 0.08 0.07 0.00WIC Washim 0.01 0.02 0.04 0.02 0.00
Normal AIC Akola 0.21 0.01 0.14 0.01 0.00CADA Jalgaon 0.08 0.13 0.07 0.13 0.00CADA Nashik 0.02 0.05 0.02 0.05 0.00CADA Pune 0.06 0.10 2.41 0.10 0.00CIPC Chandrapur 0.06 0.05 0.05 0.05 0.00NIC Nanded 0.04 0.03 0.03 0.03 0.00PIC Pune 0.18 0.37 1.03 0.37 0.00UWPC Amravati 0.01 0.07 0.09 0.07 0.00YIC Yavatmal 0.02 0.00 0.00 0.01 0.00
Surplus CADA Nagpur 0.05 0.05 0.03 0.05 0.00CIPC Chandrapur 0.02 0.04 0.04 0.04 0.00
Abundant CADA Pune 0.05 0.06 0.13 0.06 0.00CIPC Chandrapur 0.03 0.06 0.04 0.06 0.00KIC Ratnagiri 0.05 0.04 0.06 0.04 0.00NKIPC Thane 0.16 0.39 0.26 0.39 0.00SIC Sangli 0.04 0.07 0.09 0.07 0.00TIC Thane 0.06 0.12 0.16 0.12 0.00
0.43 0.19
0.04
0.12
0.11
0.04
Indicator VIIIMinor Projects
Revenue per unit Water Supplied(Rs./cum)
0.000
0.050
0.100
0.150
0.200
0.250
CA
DA
Bee
d
CA
DA
Pun
e
CA
DA
Sol
apur
PIC
Pun
e
SIC
San
gli
AIC
Aba
d
AIC
Ako
la
BIP
C B
uldh
ana
CA
DA
Aba
d
CA
DA
Bee
d
CA
DA
Jal
gaon
CA
DA
Nas
hik
NIC
Nan
ded
UW
PC A
mra
vati
WIC
Was
him
AIC
Ako
la
CA
DA
Jal
gaon
CA
DA
Nas
hik
CA
DA
Pun
e
CIP
C C
hand
rapu
r
NIC
Nan
ded
PIC
Pun
e
UW
PC A
mra
vati
YIC
Yav
atm
al
CA
DA
Nag
pur
CIP
C C
hand
rapu
r
CA
DA
Pun
e
CIP
C C
hand
rapu
r
KIC
Rat
nagi
ri
NK
IPC
Tha
ne
SIC
San
gli
TIC
Tha
ne
Highly Deficit Deficit Normal Surplus Abundant
Rat
io
FY Avg LY 2010-11 TY 2011-12 StateTar Past Max Past Min

Plangroup Circle FY Avg LY 2010-11 TY 2011-12 Past Max Past Min AVG Per State TarHighly Deficit CADA Beed 0.33 0.00 0.23 1.00 0.00
CADA Pune 0.59 1.00 1.00 1.00 0.00CADA Solapur 0.69 0.80 0.59 1.00 0.66PIC Pune 0.97 1.00 1.00 1.00 0.93SIC Sangli 1.00 0.73 1.00 1.00 0.73
Deficit AIC Abad 0.66 0.87 1.00 1.00 0.45AIC Akola 0.28 0.00 0.00 1.00 0.00BIPC Buldhana 0.00 0.32 0.20 0.32 0.00CADA Abad 0.84 0.55 0.62 1.00 0.53CADA Beed 0.59 0.00 0.74 1.00 0.00CADA Jalgaon 0.69 0.83 0.75 1.00 0.00CADA Nashik 1.00 0.31 1.00 1.00 0.31NIC Nanded 0.14 0.88 1.00 1.00 0.05UWPC Amravati 0.85 0.78 0.79 1.00 0.62WIC Washim 0.01 0.01 0.04 1.00 0.00
Normal AIC Akola 0.26 1.00 0.67 1.00 0.17CADA Jalgaon 0.72 0.23 0.97 1.00 0.00CADA Nashik 0.71 0.85 0.72 1.00 0.00CADA Pune 0.77 0.57 1.00 1.00 0.57CIPC Chandrapur 0.78 0.63 0.54 1.00 0.41NIC Nanded 0.18 0.83 1.00 1.00 0.01PIC Pune 0.82 0.98 0.95 1.00 0.04UWPC Amravati 0.85 1.00 0.83 1.00 0.45YIC Yavatmal 0.82 1.00 1.00 1.00 0.04
Surplus CADA Nagpur 0.66 0.52 0.49 1.00 0.42CIPC Chandrapur 0.53 0.58 0.81 1.00 0.36
Abundant CADA Pune 0.63 0.42 0.81 1.00 0.42CIPC Chandrapur 0.35 0.19 0.92 1.00 0.17KIC Ratnagiri 0.93 0.57 1.00 1.00 0.57NKIPC Thane 1.00 0.84 1.00 1.00 0.50SIC Sangli 0.61 0.86 0.44 1.00 0.54TIC Thane 1.00 1.00 0.84 1.00 0.76
1
0.76
0.61
0.85
0.65
0.84
Indicator XII-I + NIMInor Projects
Assessment Recovery Ratio (Irrigation+ Non-Irrigation)
0
0.2
0.4
0.6
0.8
1
CA
DA
Bee
d
CA
DA
Pun
e
CA
DA
Sol
apur
PIC
Pun
e
SIC
San
gli
AIC
Aba
d
AIC
Ako
la
BIP
C B
uldh
ana
CA
DA
Aba
d
CA
DA
Bee
d
CA
DA
Jal
gaon
CA
DA
Nas
hik
NIC
Nan
ded
UW
PC
Am
rava
ti
WIC
Was
him
AIC
Ako
la
CA
DA
Jal
gaon
CA
DA
Nas
hik
CA
DA
Pun
e
CIP
C C
hand
rapu
r
NIC
Nan
ded
PIC
Pun
e
UW
PC
Am
rava
ti
YIC
Yav
atm
al
CA
DA
Nag
pur
CIP
C C
hand
rapu
r
CA
DA
Pun
e
CIP
C C
hand
rapu
r
KIC
Rat
nagi
ri
NK
IPC
Tha
ne
SIC
San
gli
TIC
Tha
ne
Highly Deficit Deficit Normal Surplus Abundant
Rat
io
FY Avg LY 2010-11 TY 2011-12 State Tar Past Max Past Min

Chapter-5 Action Taken Report
Benchmarking process involves number of steps, right from Indicators selection
to monitoring of results obtained through action taken on deficiencies in last year’s performance. Where the Benchmarking of irrigation projects has been a routine process of performance evaluation, preparation of a comprehensive, problem specific action plan for every individual irrigation project based on the outcome of last year’s performance & its effective implementation plays an important role in securing the desired improvement.
Since last Eleven years, Water Resources Department is using Benchmarking
as an effective tool to evaluate the performances of irrigation projects. Project wise, Indicator wise results along with probable causes for low performances compared to past achievement as well as State targets are made available to field officers with the intention and directives to prepare and implement a project wise consolidated action plan.
Project authorities are no doubt taking the cognizance of the low performance
and are taking suitable actions to seek the desired improvement in Irrigation Management. But the information gathered so far indicates that instead of preparing a detail, integrated action plan, actions are taken in the form of a single activity.
Not a single action plan is received from Project authorities for the year 2011-
12; hence it is not incorporated in this report.

Chapter 6 Benchmarking of Water Users Association’s
Till the end of June 2011, potential to the tune of 4.535 Mha has been created at State level. At present, the management of created irrigation potential is done at Department Level out of which 11.66 Lakh Ha is managed by 2989 Water User Association working on Major/ Medium and Minor Projects. Govt. of Maharashtra has categorically taken the decision of handing over the total created potential to the Water Users Associations. To obviate the problems in establishing WUA, an act namely MMISF Act 2005 has been passed in the State Assembly. At present, Maharashtra Water Sector Improvement Programme (MWSIP) is under implementation through which a potential to the tune of 0.67 Mha on 286 projects shall be handed over to1559 WUAs in the stipulated period. The MMISF act 2005 is made applicable to the projects under MWSIP. Above mentioned act is made applicable to all projects under MWSIP.
For evaluating the irrigation performance of irrigation projects and bringing about necessary improvement in Irrigation Water Management, the State is using Benchmarking as an effective management tool for last eleven years.
Considering huge investment through public exchequer, in construction of projects along with large amount of fund investment involved in rehabilitation of irrigation systems before handing over to WUA, evaluation of the performance of WUA using benchmarking is necessary. Benchmarking of WUA will help to determine and bring necessary improvement in the overall functioning. Also it will help the WR Department to ascertain whether the objectives of handing over the Irrigation Management to WUA are attained or not. 6.1 Objectives of Benchmarking of WUA
1. To determine the participation of beneficiaries in working of WUA. 2. To ascertain whether the WUA is getting the water as per sanctioned quota and
revenue collected as per the agreement and guidelines or not. 3 To enhance area irrigated and output after the irrigation management is
handed over to WUA 4 To determine per ha water use (excluding well/ river lift) in the jurisdiction of
WUA. 5 To check the conjunctive use of wells in the command of WUA. 6 To determine the financial status / self-sustainability of WUA. 7 To check whether water is equitably supplied to beneficiaries at head, middle
and tail reaches of the canal system under the jurisdiction of WUA. 8 To fix the area of problems so as to take suitable action to bring necessary
changes in the working of WUA and improve the performance of a distribution system, ultimately of the project.
9 To create a sense of responsibility/accountability among the office bearers of WUA and discipline among members of the association.
10 Changes in cropping pattern. 11 Adoption in water saving techniques. 12 Gender participation. 13 Upliftment of economically weaker sections of farming community.

6.2 Proforma for data submission for Benchmarking of WUA: For collecting the data for benchmarking of WUA, Proformae are designed in regional language (Marathi). These Proformae in English are shown on subsequent pages of this report. 6.3 Selection of WUA for benchmarking: Looking to the large number of WUA formed so far, initially data of two WUA on major and one from medium & minor project from each circle was collected. Secondly, preference is given to WUA which are functioning for a longer period. Accordingly, data for 12 WUA on 7 major projects from 5 irrigation circles has been analyzed. 6.4 Methodology adopted for Benchmarking: Considering the WUA selected are in limited numbers, benchmarking is carried out by - I) Comparing the performance of individual WUA with State target ii) Comparing the performance of two WUA on the same project, iii) Comparing the performance of two WUA from two different projects but from same plan group. 6.5 Targets: Targets for indicator I to III, VI, VII & IX are shown in Proforma 2 annexed and are self explanatory. Target for indicator IV (Annual water use per unit area irrigated) is 70 percent of that of project (7692 cum/ha) considering 30 % transit losses in canal as the water supplied to WUA is measured at off taking of the concerned Distributory / Minor. Thus target works out to 5384 cum/ha. Target for indicator V (Annual expenditure per ha for irrigation management) for a WUA is evaluated as follows: Total command area of a WUA: 200 ha (Presumption) Salary of Staff and other mandatory expenditure for IWM per annum
S.N. Item Amount 1 Salary of One Canal inspector Rs 36000 2 Salary of One Labour Rs 18000 3 Office Building Rent Rs 6000 4 Maintenance of distribution system Rs 4000 5 Telephone/ electricity bill Rs 12000 6 Report publication etc Rs 3000 7 Stationary Rs 1000 Total Rs 80000
Annual expenditure per unit area irrigated = 80000 200 =Rs400/ha

Prescribed format for Information to be submitted for Benchmarking of Water User Association (Proforma 1)
Irrigation Year : Name of Project Name of
Circle Basin No.
Name of Water User Association
Number of beneficiaries in
command of WUA
Number of WUA
members
Sanction Quota of WUA as per agreement (TCM)
Actual quota received to WUA (TCM)
Kharif Rabbi Hot weather Total Kharif Rabbi Hot
weather Total
1 2 3 4 5 6 7 8 9 10 11 12 13 14
Annual crop area measured in command of WUA before
establishment (ha)
Crop area measured
during irrigation year
(ha)
Total area irrigated in irrigation year (ha)
Expenditure on irrigation
management during irrigation year (Rs)
Water cess recovery during
irrigation year (Rs)
Water cess paid to Govt.
during irrigation year
(Rs.)
Annual income during
irrigation year (Rs.)
Number of WUA members in total length of channel
Number of WUA members as per actual
area irrigated during the year
Head Middle Tail Head Middle Tail
15 16 17 18 19 20 21 22 23 24 25 26 27
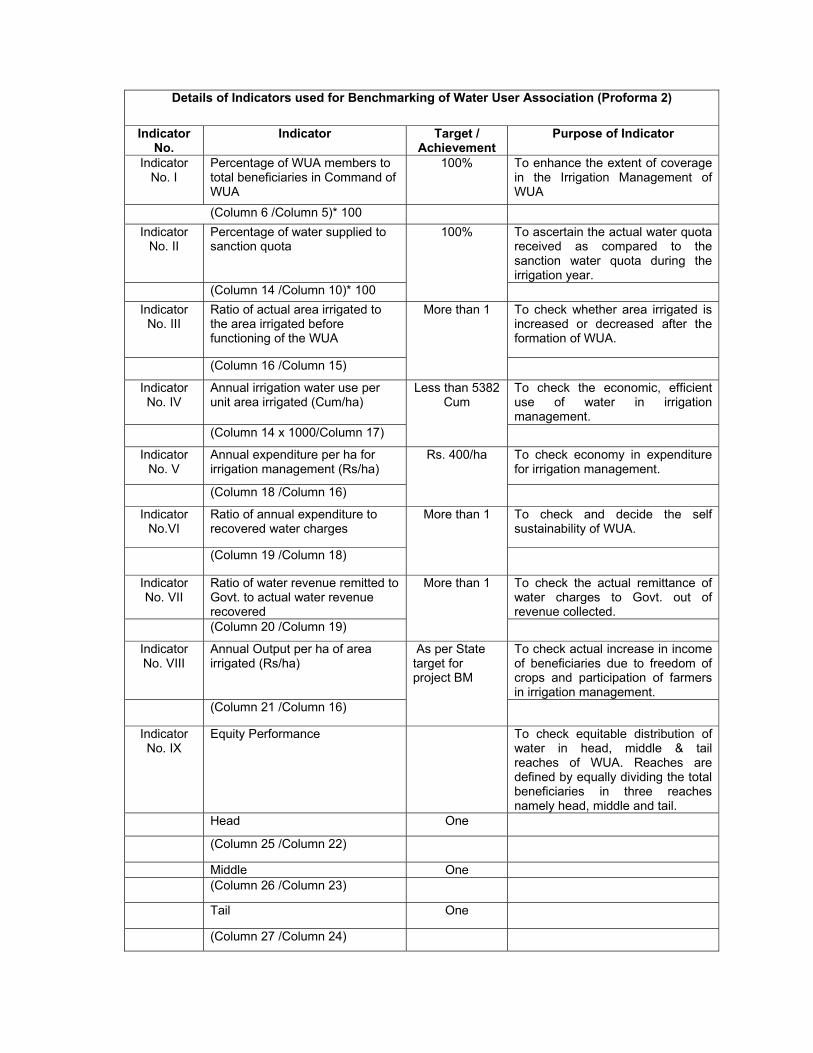
Details of Indicators used for Benchmarking of Water User Association (Proforma 2) Indicator
No. Indicator Target /
Achievement Purpose of Indicator
Indicator No. I
Percentage of WUA members to total beneficiaries in Command of WUA
100%
To enhance the extent of coverage in the Irrigation Management of WUA
(Column 6 /Column 5)* 100 Indicator
No. II Percentage of water supplied to sanction quota
100%
To ascertain the actual water quota received as compared to the sanction water quota during the irrigation year.
(Column 14 /Column 10)* 100 Indicator
No. III Ratio of actual area irrigated to the area irrigated before functioning of the WUA
More than 1
To check whether area irrigated is increased or decreased after the formation of WUA.
(Column 16 /Column 15) Indicator No. IV
Annual irrigation water use per unit area irrigated (Cum/ha)
Less than 5382 Cum
To check the economic, efficient use of water in irrigation management.
(Column 14 x 1000/Column 17) Indicator
No. V Annual expenditure per ha for irrigation management (Rs/ha)
Rs. 400/ha
To check economy in expenditure for irrigation management.
(Column 18 /Column 16) Indicator
No.VI Ratio of annual expenditure to recovered water charges
More than 1
To check and decide the self sustainability of WUA.
(Column 19 /Column 18)
Indicator No. VII
Ratio of water revenue remitted to Govt. to actual water revenue recovered
More than 1
To check the actual remittance of water charges to Govt. out of revenue collected.
(Column 20 /Column 19) Indicator No. VIII
Annual Output per ha of area irrigated (Rs/ha)
As per State target for project BM
To check actual increase in income of beneficiaries due to freedom of crops and participation of farmers in irrigation management.
(Column 21 /Column 16) Indicator No. IX
Equity Performance To check equitable distribution of water in head, middle & tail reaches of WUA. Reaches are defined by equally dividing the total beneficiaries in three reaches namely head, middle and tail.
Head One
(Column 25 /Column 22) Middle One (Column 26 /Column 23)
Tail One
(Column 27 /Column 24)

Circle wise Ancillary information of WUA in Highly Deficit & Abundant Plan group (Proforma 3)
Sr. No. Item /Circle CADA Solapur SIC Sangli
Project Bhima (Ujani) Warna Name of WUA Pandurang Nanaksingh 1 Jurisdiction of WUA Dy No.35 On Ujjani
LBC DO 1,2,3,4 & Dy No.1,2,3
2 ICA of WUA 117 ha 111.18 ha
3 Is WUA included in MWSIP? No No
4 Date of handing over of IWM (command area) to the WUA 12-12-1994 6-8-2004
5 No of wells in command area of WUA
a) Before handing over 50 0
b) Total as on today 61 0 6 Subsidy received during the irrigation year
80051.00 0
7 Year for which subsidy is not received Nil 2004-05 to 2009-10 & 2011-12
8 Dose the well water was used as an additional source for irrigation during the irrigation year
Yes No
9 Area under perennial crops during the irrigation year 165ha 30 ha
10 No. of staff employed for irrigation management by WUA 2 3
11 Does water supply was on volumetric basis or not yes yes
12 Assessment of water charges were on volumetric basis or as per crop area measurement
On volumetric basis On volumetric basis
13 Percentage of actual live storage to the design storage in the reservoir during the irrigation year
100% 100%
14 Reasons for less achievements compared to the state target during the irrigation year
1) The people getting benefit of irrigation from river are not becoming the members of WUAs. 2) There is conjunctive use of wells & canal.
1) Deterioted disnet system. 2) Full Irrigation potential is not created.

Circle wise Ancillary information of WUA in Deficit Plan group (Proforma 3)
Sr. No. Item /Circle CADA Beed Project Majalgaon Name of WUA Bhagwati Shukleshwar 1 Jurisdiction of WUA Minor No.1 to 7/ Tilsmukh
branch/ MRBC Minor No.8/ GM Branch Canal / MRBC
2 ICA of WUA 555 ha 725 ha
3 Is WUA included in MWSIP? No No
4 Date of handing over of IWM (command area) to the WUA 25-03-1998 9-10-1998
5 No of wells in command area of WUA
a) Before handing over 2 68
b) Total as on today 105 (45wells, 60 Bore wells) 172
6 Subsidy received during the irrigation year Nil Nil
7 Year for which subsidy is not received 2010-11 to 2011-12 2010-11 to 2011-12
8 Dose the well water was used as an additional source for irrigation during the irrigation year
Yes Yes
9 Area under perennial crops during the irrigation year 96ha 239.43 ha
10 No. of staff employed for irrigation management by WUA 3 2
11 Does water supply was on volumetric basis or not Yes Yes
12 Assessment of water charges were on volumetric basis or as per crop area measurement
On volumetric basis On volumetric basis
13
Percentage of actual live storage to the design storage in the reservoir during the irrigation year
100% 100%
14 Reasons for less achievements compared to the set target during the irrigation year
1) Less response from WUA members 2) Due to more number of wells in command ,there was low response to canal irrigation 3) Trend of cultivators towards cash crops

Sr. No. Item /Circle NIC Nanded Project Purna
Name of WUA Krishna Godawari
1 Jurisdiction of WUA Malegaon Minor /Dour Minor / camp colony DO No.5 to 9
Kamtha Minor 1,2,3/ Do No.10 to 15
2 ICA of WUA 1036.10 ha 619 ha 3 Is WUA included in MWSIP? No No
4 Date of handing over of IWM (command area) to the WUA
3.7.1991 3.7.1991
5 No of wells in command area of WUA
a) Before handing over 92 78 b) Total as on today 141 105 6 Subsidy received during the
irrigation year Rs.81535/- Rs.54695/-
7 Year for which subsidy is not received Nil Nil
8
Dose the well water was used as an additional source for irrigation during the irrigation year
Yes Yes
9 Area under perennial crops during the irrigation year 67.50 ha 2.60 ha
10 No. of staff employed for irrigation management by WUA
4 2
11 Does water supply was on volumetric basis or not Yes Yes
12
Assessment of water charges were on volumetric basis or as per crop area measurement
On volumetric basis On volumetric basis
13
Percentage of actual live storage to the design storage in the reservoir during the irrigation year
100% 100%
14 Reasons for less achievements compared to the set target during the irrigation year
Information not available

Circle wise Ancillary information of WUA in normal plan group (Proforma 3) Sr. No. Item /Circle CADA Nashik
Project Ozerkhed Palkhed
Name of WUA Parashari Saptashrangi Sant Muktabai Jai Ambika
1 Jurisdiction of WUA Godagaon &
Dhodgavhan Dy on Ozerkhed canal
Ambe pimpalgaon Dy & Antarveli
pimpalgaon minor on Ozerkhed canal
Dy.14 Palkhed Left Bank
Canal
Dy.10 & 11 Palkhed Left Bank
Canal
2 ICA of WUA 520 ha 583 ha 462 ha 534 ha
3 Is WUA included in MWSIP? No No No No
4 Date of handing over of IWM (command area) to the WUA
01/01/1993 29/07/1995 1/03/2006 01/ 11/2002
5 No of wells in command area of WUA
a) Before handing over 98 107 154 127
b) Total as on today 125 192 228 191
6 Subsidy received
during the irrigation year
Rs. 27744/- Rs. 28539/- Rs.23676 Rs.1769
7 Year for which subsidy is not received 2010 -11 2010-11 2008-09,
2009-10 2008-09, 2009-10
8
Dose the well water was used as an
additional source for irrigation during the
irrigation year
Yes Yes Yes Yes
9 Area under perennial
crops during the irrigation year
115 Ha. 225 ha 193 ha 223.30 ha
10 No. of staff employed
for irrigation management by WUA
2 1 1 1
11 Does water supply was on volumetric
basis or not Yes Yes Yes Yes
12
Assessment of water charges were on
volumetric basis or as per crop area measurement
On volumetric basis On volumetric basis
On volumetric basis
On volumetric basis
13
Percentage of actual live storage to the
design storage in the reservoir during the
irrigation year
100 % 42 % 95 % 95 %
14
Reasons for less achievements
compared to the set target during the
irrigation year
Due to more rain fall in command area there is
increase in level of water in wells and so maximum irrigation on
wells only
Due to less rain fall in catchment & command area
there is less utilization of water
. Due to less rain fall in command
area there is less utilization
of water
Due to less rain fall in command
area there is less utilization of water.

Sr. No. Item /Circle CADA Nashik
Project Mula
Name of WUA Datta Yogeshwar
1 Jurisdiction of WUA Dy No 7 of Mula Right Bank Canal.
Dy No 3, Minor No 2 of Mula Right Bank Canal.
2 ICA of WUA 361 Ha
201 Ha
3 Is WUA included in MWSIP? Yes Yes
4 Date of handing over of IWM (command area) to the WUA 30-06-1989 24-10-1997
5 No of wells in command area of WUA
a) Before handing over 162 112 b) Total as on today 185 109 6 Subsidy received during the
irrigation year Nil Nil
7 Year for which subsidy is not received
2001-02 to 2007-08 & 2011-12
2006-07, 2007-08 & 2011-12
8
Dose the well water was used as an additional source for irrigation during the irrigation year
Yes Yes
9 Area under perennial crops during the irrigation year 118.5 Ha 60 Ha
10 No. of staff employed for irrigation management by WUA 3 1
11 Does water supply was on volumetric basis or not Yes Yes
12 Assessment of water charges were on volumetric basis or as per crop area measurement
Volumetric basis Volumetric basis
13
Percentage of actual live storage to the design storage in the reservoir during the irrigation year
100 % 100 %
14 Reasons for less achievements compared to the set target during the irrigation year
-

Indicator I: Percentage of WUA'S member to total beneficiaries Plan group Circle Project W U A Value 2010-11 2011-12 Highly Deficit CADA Solapur Bhima Pandurang 61 61 Deficit CADA Beed Majalgaon Shukleshwar 59 59 Bhagwati 65 65 NIC Nanded Purna Krishna 70 70 Godawari 68 68 Normal CADA Nashik Ozerkhed Parashari 100 64 Saptashrangi 53 53 Palkhed St.Muktabai 54 54 Jai Ambika 85 85 Mula Datta 100 100 Yogeshwar 100 100 Abundant SIC Sangli Warna Nanaksingh 52 52.35
Indicator II: Percentage of water supplied to sanctioned water quota Plan group Circle Project W U A Value
2010-11 2011-12 Highly Deficit CADA Solapur Bhima Pandurang 104 117
Deficit CADA Beed Majalgaon Shukleshwar 60 68 Bhagwati 25 78 NIC Nanded Purna Krishna 21 21 Godawari 38 38
Normal CADA Nashik Ozerkhed Parashari 15 37.69 Saptashrangi 17 35.98 Palkhed St.Muktabai 16 4.97 Jai Ambika 2 5.03 Mula Datta 82 69.6 Yogeshwar 128 113
Abundant SIC Sangli Warna Nanaksingh 103 111.20 Indicator III: Ratio of Potential Utilisation to maximum Utilisation prior to formation of WUA
Plan group Circle Project W U A Value 2010-11 2011-12
Highly Deficit CADA Solapur Bhima Pandurang 2.17 2.45 Deficit CADA Beed Majalgaon Shukleshwar 1.92 2.56
Bhagwati 1.13 0.83 NIC Nanded Purna Krishna 1.07 1.01 Godawari 1.14 1.33
Normal CADA Nashik Ozerkhed Parashari 0.73 1.78 Saptashrangi 3.85 4.64 Palkhed St.Muktabai 2.29 0.63 Jai Ambika 1.37 0.56 Mula Datta 0.55 0.84 Yogeshwar 1.72 1.98
Abundant SIC Sangli Warna Nanaksingh 2.45 2.49

Indicator IV: Annual Irrigation water use per unit area Irrigated (Cum/ha)
Plan group Circle Project W U A Value 2010-11 2011-12
Highly Deficit CADA Solapur Bhima Pandurang 2965 2960 Deficit CADA Beed Majalgaon Shukleshwar 5501 4660
Bhagwati 2783 11944 NIC Nanded Purna Krishna 7201 7585 Godawari 10624 8006
Normal CADA Nashik Ozerkhed Parashari 695 2029.63 Saptashrangi 664 1032.21 Palkhed St.Muktabai 442 139.67 Jai Ambika 80 216.67 Mula Datta 6135 3255 Yogeshwar 4110 3014
Abundant SIC Sangli Warna Nanaksingh 6463 6927 Indicator V: Annual expenditure per ha by WUA for irrigation management (Rs /ha)
Plan group Circle Project W U A Value 2010-11 2011-12
Highly Deficit CADA Solapur Bhima Pandurang 187 73 Deficit CADA Beed Majalgaon Shukleshwar 136 136
Bhagwati 680 403 NIC Nanded Purna Krishna 126 118 Godawari 230 223
Normal CADA Nashik Ozerkhed Parashari 407 0 Saptashrangi 503 419.65 Palkhed St.Muktabai 61 167.71 Jai Ambika 167 141.50 Mula Datta 1048 857 Yogeshwar 533 288.8
Abundant SIC Sangli Warna Nanaksingh 523 484.85 Indicator VI: Cost recovery Ratio
Plan group Circle Project W U A Value 2010-11 2011-12
Highly Deficit CADA Solapur Bhima Pandurang 1.48 3.59 Deficit CADA Beed Majalgaon Shukleshwar 1.37 1.34
Bhagwati 2.59 3.07 NIC Nanded Purna Krishna 10.27 17.41 Godawari 2.03 2.00
Normal CADA Nashik Ozerkhed Parashari 5.06 29.53 Saptashrangi 1.64 1.9 Palkhed St.Muktabai 1.37 0.00 Jai Ambika 2.02 0.00 Mula Datta 1.55 1.26 Yogeshwar 0.98 1.8
Abundant SIC Sangli Warna Nanaksingh 3.54 3.77

Indicator VII: Ratio of water revenue remitted to Govt. to actual water revenue recovered
Plan group Circle Project W U A Value 2010-11 2011-12
Highly Deficit CADA Solapur Bhima Pandurang 0.90 0.6 Deficit CADA Beed Majalgaon Shukleshwar 1.00 1.00
Bhagwati 0.98 1.00 NIC Nanded Purna Krishna 0.33 0.37 Godawari 1.93 1.43
Normal CADA Nashik Ozerkhed Parashari 0.18 0.11 Saptashrangi 0.15 0.18 Palkhed St.Muktabai 1.00 0.00 Jai Ambika 0.18 1.00 Mula Datta 0.63 0.38 Yogeshwar 0.84 0.25
Abundant SIC Sangli Warna Nanaksingh 0.72 0.71 Indicator VIII: Annual Out put per ha of area irrigated (Rs/ha)
Plan group Circle Project W U A Value 2010-11 2011-12
Highly Deficit CADA Solapur Bhima Pandurang 53236 49043 Deficit CADA Beed Majalgaon Shukleshwar 68453 104773
Bhagwati 161305 124460 NIC Nanded Purna Krishna 27491 24539 Godawari 20091 17274
Normal CADA Nashik Ozerkhed Parashari 92082 554828 Saptashrangi 192719 284741 Palkhed St.Muktabai 206880 728968 Jai Ambika 295627 893094 Mula Datta 61930 52517 Yogeshwar 45492 39115
Abundant SIC Sangli Warna Nanaksingh 41169 40848

Indicator IX: Equity performance
Plan Group Circle Project WUA Reach Value 2010-11 2011-12
Highly Deficit CADA Solapur Bhima Pandurang H 0.58 0.58 M 0.74 0.72 T 0.44 0.44
Defiicit CADA Beed Majalgaon Shukleshwar H 0.59 0.82 M 0.50 0.72 T 0.30 0.44 Bhagawati H 0.92 0.89 M 0.67 0.64 T 0.67 0.60 NIC Nanded Purna Krishna H 1.00 1.00 M 1.00 1.00
T 1.00 1.00
Godavari H 1.00 1.00
M 0.95 1.00
T 0.94 1.00
Normal CADA Nashik Ozerkhed Parashari H 0.29 0.75 M 0.37 0.42 T 0.44 0.92 Saptashrangi H 0.65 0.96 M 1.00 1.08 T 0.56 2.20 Palkhed St. Muktabai H 0.48 0.53 M 1.00 1.44 T 1.00 2.29 Jai Ambika H 0.13 0.20 M 0.23 0.21 T 0.25 0.28 Mula Datta H 0.15 0.11 M 0.22 0.13 T 0.14 0.13 Yogeshwar H 0.32 0.32 M 0.47 0.44 T 0.30 0.29 Abundant SIC Sangli Warna Nanaksingh H 0.80 0.80 M 0.44 0.44 T 0.22 0.22

6.6 Indicator wise analysis Data of 2011-12 for benchmarking of WUA was received from some selected WUA in prescribed Proforma and indicator values are obtained. Indicator wise, WUA wise findings along with charts are given in Chart I to IX Indicator I: Percentage of WUA members to total beneficiaries in command of WUA All the WUA except Datta & Yogeshwar have membership ranging between 52 to 85%. It is required, to increase farmers’ participation in irrigation water management & to increase the efficiency of WUA, all beneficiaries should be members of WUA. Indicator II: Percentage of Water supplied to the sanctioned Water quota In Pandurang, Yogeshwar & Nanaksingh, water is supplied as per sanctioned water quota. However, in rest of the WUA, the percentage of water supplied ranges from 5 to 78 %. Indicator III: Ratio of potential utilization to Maximum utilization prior to formation of WUA.
In all the WUA except St.Muktabai (0.63) , Bhagawati (0.83) & Datta (0.84) the ratio is more than 1.
Indicator IV: Annual Irrigation water use per unit area Irrigated (Cum/ha) Except Pandurang, Shukleshwar, St.Muktabai, Godavari, Datta, Yogeshwar all WUA’s have more annual Irrigation water use per unit area Irrigated compared to last year. Indicator V : Annual expenditure per Ha by WUA for irrigation management (Rs /ha) Annual expenditure per ha for irrigation management in Bhagwati, Saptashringi, Nanaksingh & Datta exceeds State norm. They should take proper measures to maintain the economic sustainability. Indicator VI: Cost recovery ratio. All WUA have achieved the State target. Indicator VII: Ratio of Water revenue remitted to Govt. to Actual water revenue recovered Shukleshwar, Godawari, Bhagwati & Jai Ambika had paid the recovered water charges to the Govt. The remittance of revenue in rest of the WUAs ranges between 0 to 0.71. Indicator VIII: Annual Output per ha of area irrigated (Rs/ha) Output per ha of all WUA except Godawari (Rs.17274/ha) appears to be satisfactory as compared to the State norm.

Indicator IX: Equity performance From the available data it reveals that, water was not supplied to all beneficiaries in the command by respective WUA except Krishna & Godawari since last year. 6.7 Action Ahead
1. At present looking to large number of WUA, benchmarking of selected WUA on major projects is possible at State level. After handing over of total irrigation management of projects to WUA, benchmarking of apex (Canal, Distributory) WUA would be feasible at State level.
2. In case of medium and minor projects which are totally handed over to WUA for irrigation management, benchmarking could be entrusted to concerned Divisions and Sub divisions respectively. In case of major projects, benchmarking of WUA on main canal can be carried out at circle level.

Indicator-I Percentage of WUA members to total beneficiaries
0
20
40
60
80
100
120
Pand
uran
g
Shuk
lesh
war
Bhag
wat
i
Kris
hna
God
awar
i
Para
shar
i
Sapt
ashr
angi
St.M
ukta
bai
Jai A
mbi
ka
Dat
ta
Yoge
shw
ar
Nan
aksi
ngh
Bhima Majalgaon Purna Ozerkhed Palkhed Mula Warna
CADASolapur
CADA Beed NIC Nanded CADA Nashik SIC Sangli
HighlyDeficit
Deficit Normal Abundant
Perc
enta
ge
Value 2010-11 Value 2011-12

Indicator II: Percentage of water supplied to sanctioned water quota
020
4060
80100
120140
Pand
uran
g
Shuk
lesh
war
Bhag
wat
i
Kris
hna
God
avar
i
Para
shar
i
Sapt
ashr
angi
St.M
ukta
bai
Jai A
mbi
ka
Dat
ta
Yoge
shw
ar
Nan
aksi
ngh
Bhima Majalgaon Purna Ozerkhed Palkhed Mula Warna
CADASolapur
CADA Beed NIC Nanded CADA Nashik SICSangli
HighlyDeficit
Deficit Normal Abundant
Wat
er s
uppl
ied
(%)
Value 2010-11 Value 2011-12

Indicator III: Ratio of Potential Utilisation to maximum Utilisation prior to formation of WUA
00.5
11.5
22.5
33.5
44.5
5Pa
ndur
ang
Shuk
lesh
war
Bhag
wat
i
Kris
hna
God
avar
i
Para
shar
i
Sapt
ashr
angi
St.M
ukta
bai
Jai A
mbi
ka
Dat
ta
Yoge
shw
ar
Nan
aksi
ngh
Bhima Majalgaon Purna Ozerkhed Palkhed Mula Warna
CADA
CADA Beed NIC Nanded CADA Nashik SICSangli
HighlyDeficit
Deficit Normal Abundant
Rat
io
Value 2010-11 Value 2011-12

Indicator IV: Annual Irrigation water use per unit area Irrigated (Cum/ha)
02000400060008000
100001200014000
Pand
uran
g
Shuk
lesh
war
Bha
gwat
i
Kris
hna
God
avar
i
Par
asha
ri
Sapt
ashr
angi
St.M
ukta
bai
Jai A
mbi
ka
Dat
ta
Yog
eshw
ar
Nan
aksi
ngh
Bhima Majalgaon Purna Ozerkhed Palkhed Mula Warna
CADASolapur
CADA Beed NIC Nanded CADA Nashik SIC Sangli
HighlyDeficit
Deficit Normal Abundant
Wat
er u
se (C
um/h
a)
Value 2010-11 Value 2011-12

Indicator V: Annual expenditure per ha by WUA for irrigation management (Rs /ha)
0
200
400
600
800
1000
1200Pa
ndur
ang
Shuk
lesh
war
Bhag
wat
i
Kris
hna
God
avar
i
Para
shar
i
Sapt
ashr
angi
St.M
ukta
bai
Jai A
mbi
ka
Dat
ta
Yoge
shw
ar
Nan
aksi
ngh
Bhima Majalgaon Purna Ozerkhed Palkhed Mula Warna
CADASolapur
CADA Beed NIC Nanded CADA Nashik SICSangli
HighlyDeficit
Deficit Normal Abundant
Expe
nditu
re (R
s/ha
)
Value 2010-11 Value 2011-12
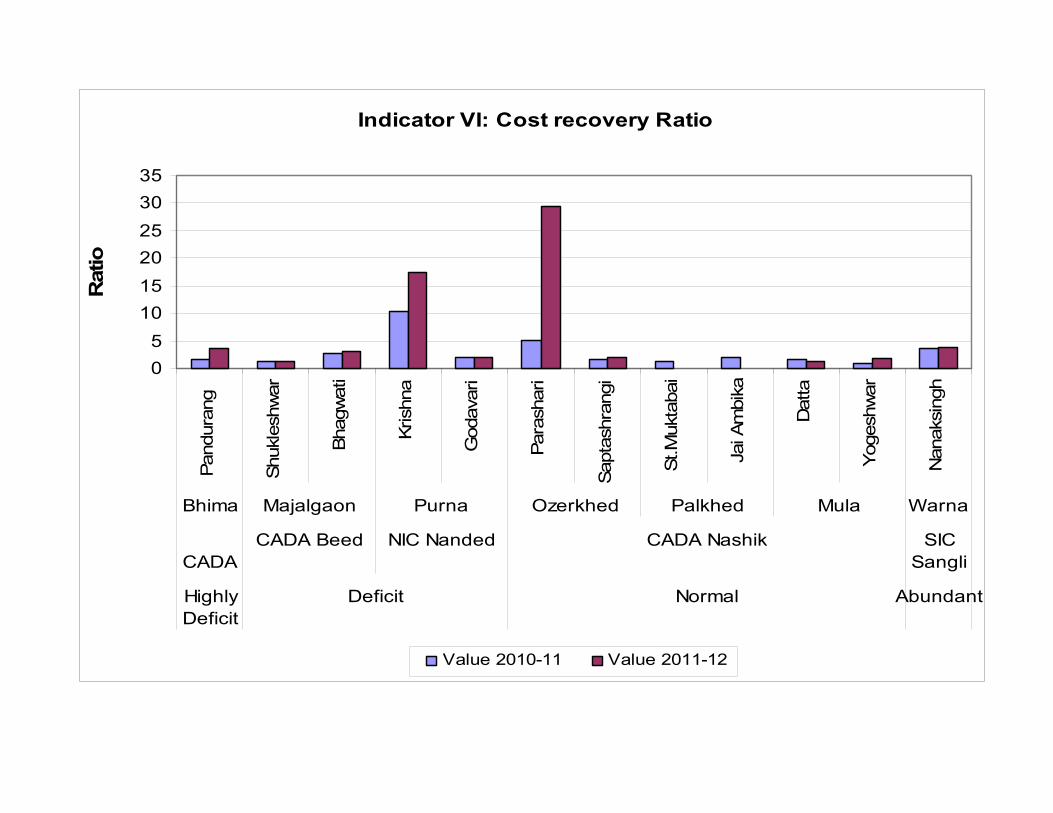
Indicator VI: Cost recovery Ratio
05
101520253035
Pand
uran
g
Shuk
lesh
war
Bhag
wat
i
Kris
hna
God
avar
i
Para
shar
i
Sapt
ashr
angi
St.M
ukta
bai
Jai A
mbi
ka
Dat
ta
Yoge
shw
ar
Nan
aksi
ngh
Bhima Majalgaon Purna Ozerkhed Palkhed Mula Warna
CADA
CADA Beed NIC Nanded CADA Nashik SICSangli
HighlyDeficit
Deficit Normal Abundant
Rat
io
Value 2010-11 Value 2011-12
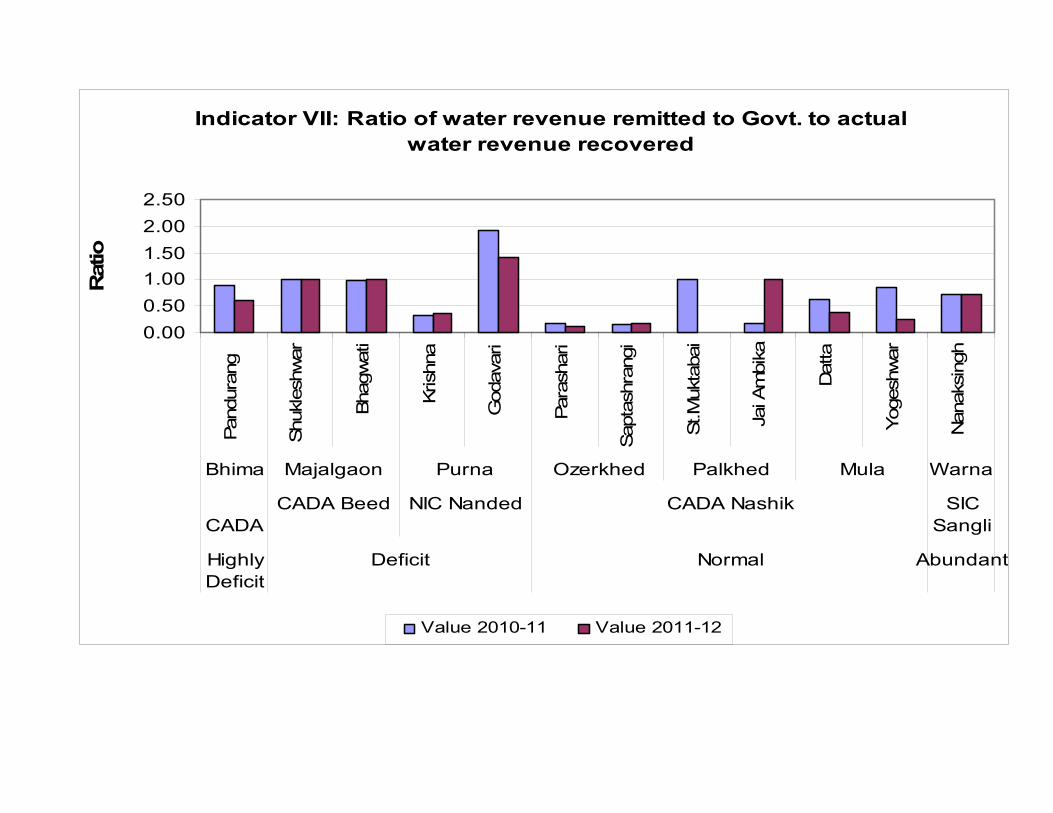
Indicator VII: Ratio of water revenue remitted to Govt. to actual water revenue recovered
0.000.501.001.502.002.50
Pand
uran
g
Shuk
lesh
war
Bhag
wat
i
Kris
hna
God
avar
i
Para
shar
i
Sapt
ashr
angi
St.M
ukta
bai
Jai A
mbi
ka
Dat
ta
Yoge
shw
ar
Nan
aksi
ngh
Bhima Majalgaon Purna Ozerkhed Palkhed Mula Warna
CADA
CADA Beed NIC Nanded CADA Nashik SICSangli
HighlyDeficit
Deficit Normal Abundant
Rat
io
Value 2010-11 Value 2011-12

Indicator VIII: Annual Out put per ha of area irrigated (Rs/ha)
0100000200000300000400000500000600000700000800000900000
1000000
Pan
dura
ng
Shu
kles
hwar
Bha
gwat
i
Kris
hna
God
avar
i
Par
asha
ri
Sap
tash
rang
i
St.M
ukta
bai
Jai A
mbi
ka
Dat
ta
Yog
eshw
ar
Nan
aksi
ngh
Bhima Majalgaon Purna Ozerkhed Palkhed Mula Warna
CADA
CADA Beed NIC Nanded CADA Nashik SICSangli
HighlyDeficit
Deficit Normal Abundant
Out
put (
Rs.
/ha)
Value 2010-11 Value 2011-12

Indicator IX: Equity performance
0.00
0.50
1.00
1.50
2.00
2.50
H M T H M T H M T H M T H M T H M T H M T H M T H M T H M T H M T H M T
Pandurang Shukleshw arBhagaw ati Krishna Godavari ParashariSaptashrangi St.Muktabai
Jai Ambika Datta Yogeshw arNanaksingh
Bhima Majalgaon Purna Ozerkhed Palkhed Mula Warna
CADASolapur
CADA Beed NIC Nanded CADA Nashik SIC Sangli
HighlyDeficit
Defiicit Normal Abundant
Ratio
Value 2010-11 Value 2011-12

Chapter – 7
Project wise Review of Major and Medium Projects
The Benchmarking Reports published for year 2003-04 to 2007-08 consist of the graphical representation of each indicator with circle as a unit. Project wise data for each indicator was not appearing any where in the said reports.
As per directives of Secretary (CAD) it is decided to incorporate project wise
data for last 5 years for all the major and medium projects in the Benchmarking report from year 2008-09.
Accordingly the project wise data for the years 2006-07 to 2011-12 is
incorporated in this report as follows. I) Name of project. II) Designed live storage in Mm3
III) Irrigable Command Area in Ha. IV) Irrigation year V) Year status VI) Live storage available as on 15th October VII) Water used for irrigation in Mm3
VIII) Irrigated Area in Ha. IX) Recovery for irrigation in Rs lac X) Recovery for Non irrigation in Rs lac
XI) Total Recovery for Irrigation & Non irrigation in Rs lac XII) Irrigation system performance in Ha/Mm3
Data for last five years of the above parameters for all major and medium
projects is tabulated here to have a project wise performance at a glance.
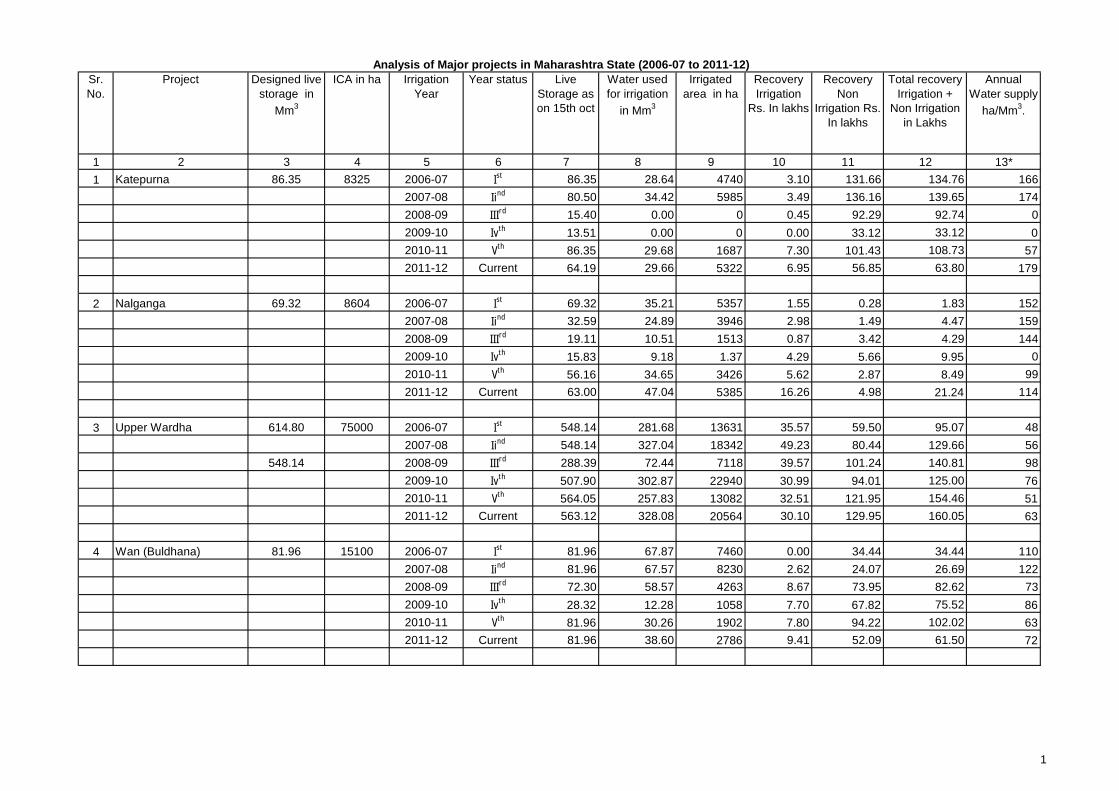
Sr.
No.
Project Designed live
storage in
Mm3
ICA in ha Irrigation
Year
Year status Live
Storage as
on 15th oct
Water used
for irrigation
in Mm3
Irrigated
area in ha
Recovery
Irrigation
Rs. In lakhs
Recovery
Non
Irrigation Rs.
In lakhs
Total recovery
Irrigation +
Non Irrigation
in Lakhs
Annual
Water supply
ha/Mm3.
1 2 3 4 5 6 7 8 9 10 11 12 13*
1 Katepurna 86.35 8325 2006-07 Ist 86.35 28.64 4740 3.10 131.66 134.76 166
2007-08 Iind 80.50 34.42 5985 3.49 136.16 139.65 174
2008-09 IIIrd 15.40 0.00 0 0.45 92.29 92.74 0
2009-10 Ivth
13.51 0.00 0 0.00 33.12 33.12 0
2010-11 Vth
86.35 29.68 1687 7.30 101.43 108.73 57
2011-12 Current 64.19 29.66 5322 6.95 56.85 63.80 179
2 Nalganga 69.32 8604 2006-07 Ist 69.32 35.21 5357 1.55 0.28 1.83 152
2007-08 Iind 32.59 24.89 3946 2.98 1.49 4.47 159
2008-09 IIIrd 19.11 10.51 1513 0.87 3.42 4.29 144
2009-10 Ivth
15.83 9.18 1.37 4.29 5.66 9.95 0
2010-11 Vth
56.16 34.65 3426 5.62 2.87 8.49 99
2011-12 Current 63.00 47.04 5385 16.26 4.98 21.24 114
3 Upper Wardha 614.80 75000 2006-07 Ist 548.14 281.68 13631 35.57 59.50 95.07 48
2007-08 Iind 548.14 327.04 18342 49.23 80.44 129.66 56
548.14 2008-09 IIIrd 288.39 72.44 7118 39.57 101.24 140.81 98
2009-10 Ivth
507.90 302.87 22940 30.99 94.01 125.00 76
2010-11 Vth
564.05 257.83 13082 32.51 121.95 154.46 51
2011-12 Current 563.12 328.08 20564 30.10 129.95 160.05 63
4 Wan (Buldhana) 81.96 15100 2006-07 Ist 81.96 67.87 7460 0.00 34.44 34.44 110
2007-08 Iind 81.96 67.57 8230 2.62 24.07 26.69 122
2008-09 IIIrd 72.30 58.57 4263 8.67 73.95 82.62 73
2009-10 Ivth
28.32 12.28 1058 7.70 67.82 75.52 86
2010-11 Vth
81.96 30.26 1902 7.80 94.22 102.02 63
2011-12 Current 81.96 38.60 2786 9.41 52.09 61.50 72
Analysis of Major projects in Maharashtra State (2006-07 to 2011-12)
1

Sr.
No.
Project Designed live
storage in
Mm3
ICA in ha Irrigation
Year
Year status Live
Storage as
on 15th oct
Water used
for irrigation
in Mm3
Irrigated
area in ha
Recovery
Irrigation
Rs. In lakhs
Recovery
Non
Irrigation Rs.
In lakhs
Total recovery
Irrigation +
Non Irrigation
in Lakhs
Annual
Water supply
ha/Mm3.
1 2 3 4 5 6 7 8 9 10 11 12 13*
5 Arunavati 169.92 20515 2006-07 Ist 168.10 70.91 6061 3.13 2.10 5.23 85
2007-08 Iind 108.68 66.27 5570 1.48 0.00 1.48 84
2008-09 IIIrd 23.87 2.72 279 0.00 0.00 0.00 103
2009-10 Ivth
17.32 1.63 670 0.00 9.25 9.25 410
2010-11 Vth
169.56 96.08 3006 0.00 8.17 8.17 31
2011-12 Current 160.97 119.23 4948 1.82 2.11 3.93 41
6 Pench 1374 101200 2006-07 Ist 1156.94 1028.00 80097 238.91 2113.05 2351.96 78
2007-08 Iind 1069.31 1062.03 80344 225.94 2216.21 2442.15 76
2008-09 IIIrd 658.17 544.78 52566 64.45 1491.29 1555.74 96
2009-10 Ivth
836.00 960.45 75928 117.29 3951.93 4069.22 79
2010-11 Vth
1119.51 614.69 76777 167.77 3084.90 3252.67 125
2011-12 Current 885.94 1096.84 92873 106.21 3129.57 3235.78 85
7 Bagh 268 23740 2006-07 Ist 186.74 186.00 25966 12.59 0.47 13.06 140
2007-08 Iind 221.53 241.62 30037 18.77 12.21 30.98 124
2008-09 IIIrd 76.06 151.18 23460 1.83 2.50 4.33 155
2009-10 Ivth
96.76 184.78 23416 16.40 2.21 18.61 127
2010-11 Vth
199.99 258.93 29344 16.40 2.21 18.61 113
2011-12 Current 210.18 240.38 27928 62.68 22.26 84.94 116
8 Itiahdoh 318.86 17500 2006-07 Ist 271.96 348.91 26325 38.03 1.63 39.66 75
2007-08 Iind 302.98 292.56 28249 45.30 2.43 47.73 97
2008-09 IIIrd 51.75 178.73 17530 5.32 0.00 5.32 98
2009-10 Ivth
116.70 126.20 17980 33.91 0.00 33.91 142
2010-11 Vth
287.08 125.12 20346 32.17 0.94 33.11 163
2011-12 Current 280.46 230.76 22443 43.59 3.77 47.36 97
2

Sr.
No.
Project Designed live
storage in
Mm3
ICA in ha Irrigation
Year
Year status Live
Storage as
on 15th oct
Water used
for irrigation
in Mm3
Irrigated
area in ha
Recovery
Irrigation
Rs. In lakhs
Recovery
Non
Irrigation Rs.
In lakhs
Total recovery
Irrigation +
Non Irrigation
in Lakhs
Annual
Water supply
ha/Mm3.
1 2 3 4 5 6 7 8 9 10 11 12 13*
9 Asola Mendha 56.38 9919 2006-07 Ist 36.70 77.63 10702 5.59 2.61 8.20 138
2007-08 Iind 56.38 69.28 10684 3.05 3.10 6.15 154
2008-09 IIIrd 12.66 65.96 9198 14.98 2.38 17.36 139
2009-10 Ivth
8.08 24.77 8990 7.64 0.00 7.64 363
2010-11 Vth
44.59 27.87 9548 7.86 0.00 7.86 343
2011-12 Current 39.96 69.24 9622 10.24 0.00 10.24 139
10 Dina 55.94 7826 2006-07 Ist 52.66 67.70 11392 24.08 0.00 24.08 168
2007-08 Iind 46.10 48.29 10794 5.82 1.63 7.45 224
68.3 2008-09 IIIrd 3.04 58.06 10913 14.54 0.21 14.75 188
2009-10 Ivth
30.36 54.20 10925 7.15 0.00 7.15 202
2010-11 Vth
27.58 42.84 10901 17.12 0.21 17.33 254
2011-12 Current 34.07 61.69 10955 17.54 0.00 17.54 178
11 Bor 127.42 13360 2006-07 Ist 88.45 79.88 4331 6.66 2.91 9.57 54
2007-08 Iind 127.35 85.27 4716 10.29 0.29 10.58 55
2008-09 IIIrd 57.44 40.21 2256 5.65 0.21 5.86 56
2009-10 Ivth
102.64 64.79 3908 2.37 15.65 18.02 60
2010-11 Vth
125.87 85.43 4003 6.94 2.15 9.09 47
2011-12 Current 126.99 95.53 9426 21.69 0.00 21.69 99
12 Lower Wunna 189.18 19500 2006-07 Ist 189.18 115.44 6855 10.37 222.08 232.45 59
2007-08 Iind 187.82 101.02 6000 3.58 120.25 123.83 59
2008-09 IIIrd 126.84 69.42 7185 3.85 71.78 75.63 104
2009-10 Ivth
168.74 68.66 5807 3.52 412.50 416.02 85
2010-11 Vth
189.18 108.51 5628 7.07 470.31 477.38 52
2011-12 Current 164.12 161.52 11181 6.76 590.00 596.76 69
3

Sr.
No.
Project Designed live
storage in
Mm3
ICA in ha Irrigation
Year
Year status Live
Storage as
on 15th oct
Water used
for irrigation
in Mm3
Irrigated
area in ha
Recovery
Irrigation
Rs. In lakhs
Recovery
Non
Irrigation Rs.
In lakhs
Total recovery
Irrigation +
Non Irrigation
in Lakhs
Annual
Water supply
ha/Mm3.
1 2 3 4 5 6 7 8 9 10 11 12 13*
13 Girna 525.06 69350 2006-07 Ist 523.55 321.02 21766 38.55 213.48 252.03 68
2007-08 Iind 519.65 378.07 27306 53.83 255.68 309.51 72
2008-09 IIIrd 484.58 335.64 23063 44.56 258.34 302.90 69
2009-10 Ivth
127.18 75.70 8705 11.24 184.70 195.94 115
2010-11 Vth
169.80 71.58 9891 8.77 172.04 180.81 138
2011-12 Current 206.31 36.78 5263 3.52 130.46 133.98 143
14 Hatnur 255 37838 2006-07 Ist 255.00 99.21 6874 7.29 1646.78 1654.07 69
2007-08 Iind 255.00 84.75 6950 9.11 1934.47 1943.58 82
2008-09 IIIrd 255.00 56.67 6668 7.86 2270.47 2278.33 118
2009-10 Ivth
255.00 72.99 7618 9.96 1936.00 1945.96 104
2010-11 Vth
255.00 97.48 7439 10.94 2196.04 2206.98 76
2011-12 Current 255.00 79.25 8239 13.79 1735.74 1749.53 104
15 Chanakapur 76.85 14042 2006-07 Ist 76.85 18.36 3065 6.78 133.24 140.02 167
2007-08 Iind 76.85 17.06 2788 7.82 173.19 181.01 163
2008-09 IIIrd 76.85 14.22 2452 3.81 189.68 193.49 172
2009-10 Ivth
76.85 13.57 2277 3.62 117.21 120.83 168
2010-11 Vth
76.85 17.79 2981 4.01 141.51 145.52 168
2011-12 Current 76.85 15.20 3774 6.34 349.5 355.83 248
16 Kadva 52.91 10117 2006-07 Ist 52.91 41.60 1391 0.60 0.08 0.68 33
2007-08 Iind 52.91 54.18 1965 0.80 0.62 1.42 36
2008-09 IIIrd 52.91 43.48 2125 5.96 1.16 7.12 49
2009-10 Ivth
52.91 52.19 2217 2.70 0.39 3.09 42
2010-11 Vth
47.60 56.80 2362 2.89 0.13 3.02 42
2011-12 Current 40.75 63.50 3552 5.54 2.36 7.90 56
4

Sr.
No.
Project Designed live
storage in
Mm3
ICA in ha Irrigation
Year
Year status Live
Storage as
on 15th oct
Water used
for irrigation
in Mm3
Irrigated
area in ha
Recovery
Irrigation
Rs. In lakhs
Recovery
Non
Irrigation Rs.
In lakhs
Total recovery
Irrigation +
Non Irrigation
in Lakhs
Annual
Water supply
ha/Mm3.
1 2 3 4 5 6 7 8 9 10 11 12 13*
17 Bhandardara 304.10 23077 2006-07 Ist 304.10 276.50 26348 143.95 213.85 357.80 95
2007-08 Iind 304.09 344.02 28554 94.31 174.03 268.34 83
2008-09 IIIrd 304.10 349.15 26744 57.06 131.72 188.78 77
2009-10 Ivth
332.18 343.08 29700 73.45 128.93 202.38 87
2010-11 Vth
407.88 367.92 19768 138.41 378.11 516.52 54
2011-12 Current 431.65 320.67 24157 132.86 389.55 522.41 75
18 Mula 608.82 82920 2006-07 Ist 608.82 497.22 43001 170.96 173.10 344.06 86
2007-08 Iind 608.82 638.35 52735 112.13 155.95 268.08 83
2008-09 IIIrd 608.82 549.79 40942 128.95 247.45 376.40 74
2009-10 Ivth
338.10 445.47 49324 100.65 295.29 395.94 111
2010-11 Vth
549.08 497.41 39746 81.10 220.76 301.86 80
2011-12 Current 603.10 530.40 62572 108.40 258.24 366.64 118
19 Gangapur 159.42 15960 2006-07 Ist 159.42 51.00 10553 25.18 3389.00 3414.18 207
2007-08 Iind 157.12 50.08 7196 43.65 3838.91 3882.56 144
2008-09 IIIrd 158.54 50.20 7174 25.18 3389.00 3414.18 143
2009-10 Ivth
125.61 27.21 26479 31.63 1783.35 1814.98 973
2010-11 Vth
157.13 47.04 9705 55.97 3529.05 3585.02 206
2011-12 Current 148.80 64.82 10517 33.65 3025.43 3059.08 162
20 Ozerkhed 60.32 10400 2006-07 Ist 60.31 33.16 3064 16.78 7.77 24.55 92
2007-08 Iind 60.11 44.47 4264 15.24 25.14 40.38 96
2008-09 IIIrd 60.32 41.50 4436 14.84 11.89 26.73 107
2009-10 Ivth
25.17 19.88 5068 15.33 16.52 31.85 255
2010-11 Vth
19.52 17.76 4252 14.66 17.66 32.32 239
2011-12 Current 40.23 45.52 6622 15.89 19.20 35.09 145
5
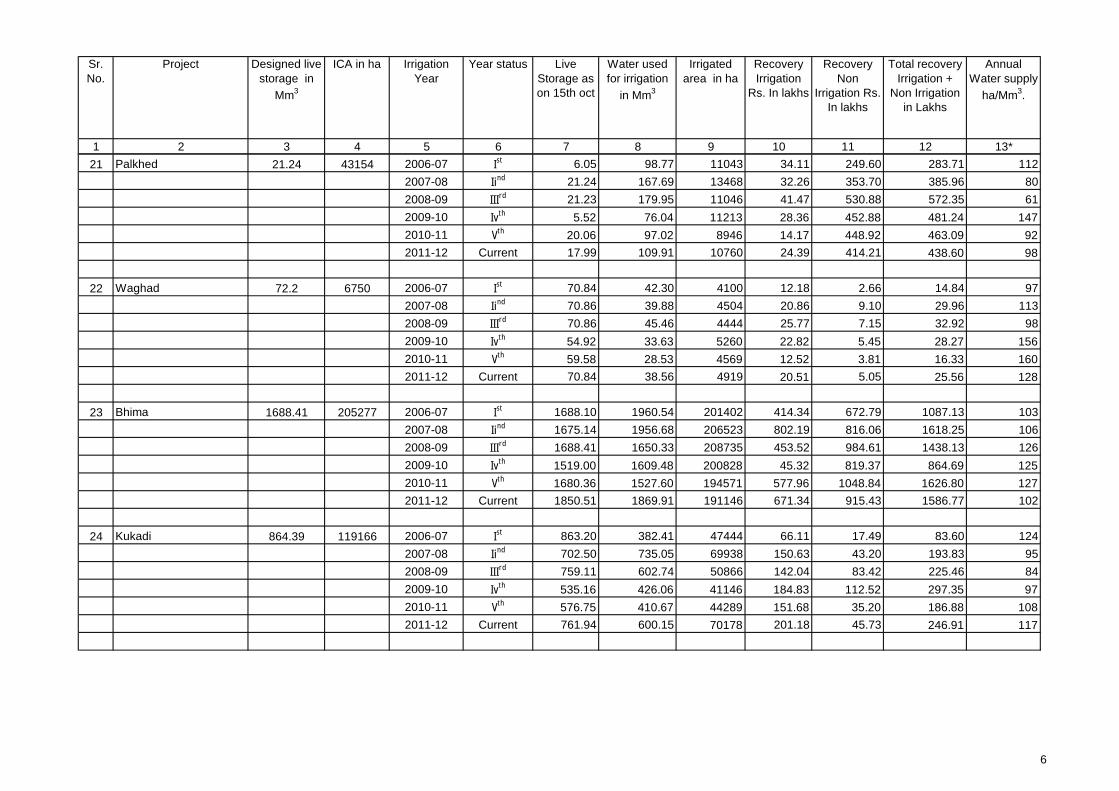
Sr.
No.
Project Designed live
storage in
Mm3
ICA in ha Irrigation
Year
Year status Live
Storage as
on 15th oct
Water used
for irrigation
in Mm3
Irrigated
area in ha
Recovery
Irrigation
Rs. In lakhs
Recovery
Non
Irrigation Rs.
In lakhs
Total recovery
Irrigation +
Non Irrigation
in Lakhs
Annual
Water supply
ha/Mm3.
1 2 3 4 5 6 7 8 9 10 11 12 13*
21 Palkhed 21.24 43154 2006-07 Ist 6.05 98.77 11043 34.11 249.60 283.71 112
2007-08 Iind 21.24 167.69 13468 32.26 353.70 385.96 80
2008-09 IIIrd 21.23 179.95 11046 41.47 530.88 572.35 61
2009-10 Ivth
5.52 76.04 11213 28.36 452.88 481.24 147
2010-11 Vth
20.06 97.02 8946 14.17 448.92 463.09 92
2011-12 Current 17.99 109.91 10760 24.39 414.21 438.60 98
22 Waghad 72.2 6750 2006-07 Ist 70.84 42.30 4100 12.18 2.66 14.84 97
2007-08 Iind 70.86 39.88 4504 20.86 9.10 29.96 113
2008-09 IIIrd 70.86 45.46 4444 25.77 7.15 32.92 98
2009-10 Ivth
54.92 33.63 5260 22.82 5.45 28.27 156
2010-11 Vth
59.58 28.53 4569 12.52 3.81 16.33 160
2011-12 Current 70.84 38.56 4919 20.51 5.05 25.56 128
23 Bhima 1688.41 205277 2006-07 Ist 1688.10 1960.54 201402 414.34 672.79 1087.13 103
2007-08 Iind 1675.14 1956.68 206523 802.19 816.06 1618.25 106
2008-09 IIIrd 1688.41 1650.33 208735 453.52 984.61 1438.13 126
2009-10 Ivth
1519.00 1609.48 200828 45.32 819.37 864.69 125
2010-11 Vth
1680.36 1527.60 194571 577.96 1048.84 1626.80 127
2011-12 Current 1850.51 1869.91 191146 671.34 915.43 1586.77 102
24 Kukadi 864.39 119166 2006-07 Ist 863.20 382.41 47444 66.11 17.49 83.60 124
2007-08 Iind 702.50 735.05 69938 150.63 43.20 193.83 95
2008-09 IIIrd 759.11 602.74 50866 142.04 83.42 225.46 84
2009-10 Ivth
535.16 426.06 41146 184.83 112.52 297.35 97
2010-11 Vth
576.75 410.67 44289 151.68 35.20 186.88 108
2011-12 Current 761.94 600.15 70178 201.18 45.73 246.91 117
6

Sr.
No.
Project Designed live
storage in
Mm3
ICA in ha Irrigation
Year
Year status Live
Storage as
on 15th oct
Water used
for irrigation
in Mm3
Irrigated
area in ha
Recovery
Irrigation
Rs. In lakhs
Recovery
Non
Irrigation Rs.
In lakhs
Total recovery
Irrigation +
Non Irrigation
in Lakhs
Annual
Water supply
ha/Mm3.
1 2 3 4 5 6 7 8 9 10 11 12 13*
25 Ghod 154.8 20500 2006-07 Ist 154.80 144.42 18932 40.39 147.34 187.73 131
2007-08 Iind 154.80 141.34 16645 71.15 224.98 296.13 118
2008-09 IIIrd 154.80 169.02 17769 46.15 225.32 271.47 105
2009-10 Ivth
80.19 124.69 14635 46.73 209.68 256.41 117
2010-11 Vth
154.79 134.57 15347 38.01 202.99 241.00 114
2011-12 Current 154.80 176.57 16156 96.55 190.10 286.65 91
26 Krishna 602.73 69269 2006-07 Ist 602.11 411.72 26048 113.02 151.01 264.03 63
2007-08 Iind 598.41 449.79 38826 102.12 270.57 372.69 86
2008-09 IIIrd 602.73 569.89 33954 76.96 158.54 235.50 60
2009-10 Ivth
528.05 491.76 33523 114.54 425.10 539.64 68
2010-11 Vth
536.31 425.53 33235 126.47 340.52 466.99 78
2011-12 Current 560.51 553.88 31458 144.20 274.98 419.18 57
27 Radhanagari 219.97 26560 2006-07 Ist 219.97 452.16 42495 120.43 359.21 479.64 94
2007-08 Iind 218.30 307.73 42245 121.23 501.45 622.68 137
2008-09 IIIrd 214.67 340.54 42245 128.40 720.00 848.40 124
2009-10 Ivth 217.64 311.67 40079 151.31 700.79 852.10 129
2010-11 Vth 219.17 323.94 40660 155.77 887.43 1043.20 126
2011-12 Current 219.74 300.24 26906 231.05 821.93 1052.98 90
28 Tulashi 91.92 4720 2006-07 Ist 91.92 43.04 5028 12.30 2.54 14.84 117
2007-08 Iind 91.92 60.89 3395 9.12 5.75 14.87 56
2008-09 IIIrd 91.92 37.79 2563 16.45 5.70 22.15 68
2009-10 Ivth
96.33 41.99 4445 21.01 6.00 27.01 106
2010-11 Vth
68.54 53.47 4760 24.05 5.84 29.89 89
2011-12 Current 91.92 67.66 3313 33.60 3.84 37.44 49
7
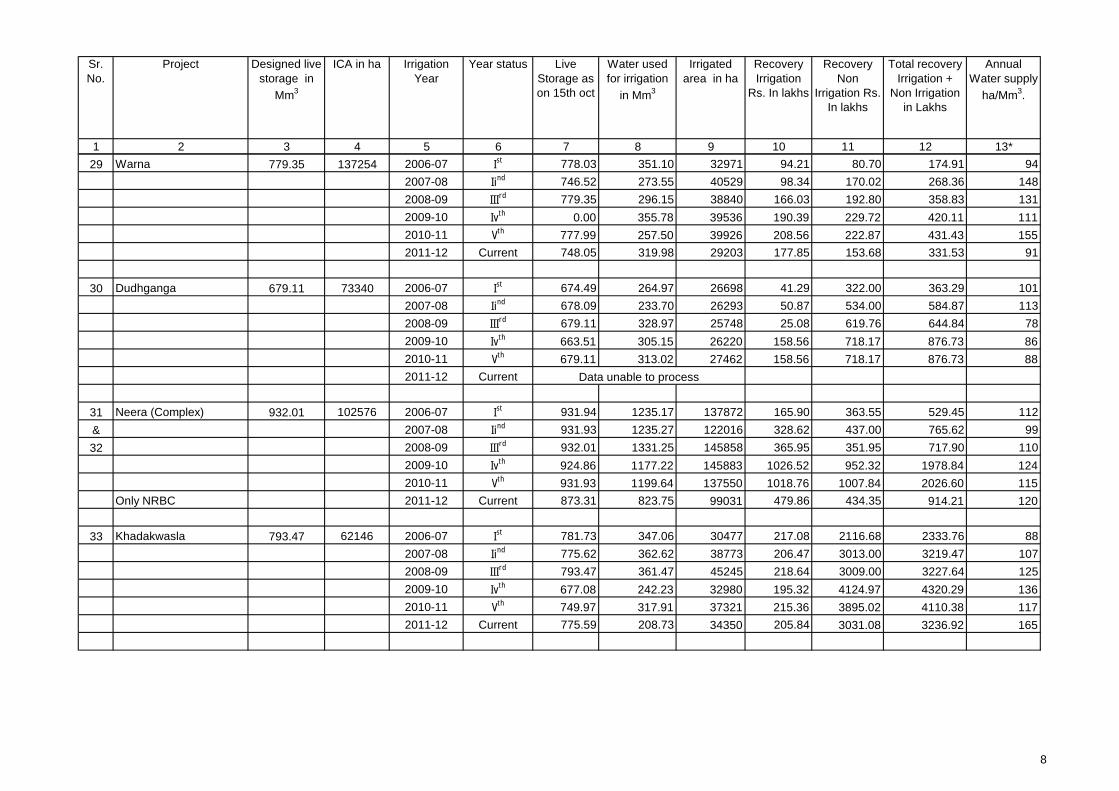
Sr.
No.
Project Designed live
storage in
Mm3
ICA in ha Irrigation
Year
Year status Live
Storage as
on 15th oct
Water used
for irrigation
in Mm3
Irrigated
area in ha
Recovery
Irrigation
Rs. In lakhs
Recovery
Non
Irrigation Rs.
In lakhs
Total recovery
Irrigation +
Non Irrigation
in Lakhs
Annual
Water supply
ha/Mm3.
1 2 3 4 5 6 7 8 9 10 11 12 13*
29 Warna 779.35 137254 2006-07 Ist 778.03 351.10 32971 94.21 80.70 174.91 94
2007-08 Iind 746.52 273.55 40529 98.34 170.02 268.36 148
2008-09 IIIrd 779.35 296.15 38840 166.03 192.80 358.83 131
2009-10 Ivth
0.00 355.78 39536 190.39 229.72 420.11 111
2010-11 Vth
777.99 257.50 39926 208.56 222.87 431.43 155
2011-12 Current 748.05 319.98 29203 177.85 153.68 331.53 91
30 Dudhganga 679.11 73340 2006-07 Ist 674.49 264.97 26698 41.29 322.00 363.29 101
2007-08 Iind 678.09 233.70 26293 50.87 534.00 584.87 113
2008-09 IIIrd 679.11 328.97 25748 25.08 619.76 644.84 78
2009-10 Ivth
663.51 305.15 26220 158.56 718.17 876.73 86
2010-11 Vth
679.11 313.02 27462 158.56 718.17 876.73 88
2011-12 Current
31 Neera (Complex) 932.01 102576 2006-07 Ist 931.94 1235.17 137872 165.90 363.55 529.45 112
& 2007-08 Iind 931.93 1235.27 122016 328.62 437.00 765.62 99
32 2008-09 IIIrd 932.01 1331.25 145858 365.95 351.95 717.90 110
2009-10 Ivth
924.86 1177.22 145883 1026.52 952.32 1978.84 124
2010-11 Vth
931.93 1199.64 137550 1018.76 1007.84 2026.60 115
Only NRBC 2011-12 Current 873.31 823.75 99031 479.86 434.35 914.21 120
33 Khadakwasla 793.47 62146 2006-07 Ist 781.73 347.06 30477 217.08 2116.68 2333.76 88
2007-08 Iind 775.62 362.62 38773 206.47 3013.00 3219.47 107
2008-09 IIIrd 793.47 361.47 45245 218.64 3009.00 3227.64 125
2009-10 Ivth
677.08 242.23 32980 195.32 4124.97 4320.29 136
2010-11 Vth
749.97 317.91 37321 215.36 3895.02 4110.38 117
2011-12 Current 775.59 208.73 34350 205.84 3031.08 3236.92 165
Data unable to process
8

Sr.
No.
Project Designed live
storage in
Mm3
ICA in ha Irrigation
Year
Year status Live
Storage as
on 15th oct
Water used
for irrigation
in Mm3
Irrigated
area in ha
Recovery
Irrigation
Rs. In lakhs
Recovery
Non
Irrigation Rs.
In lakhs
Total recovery
Irrigation +
Non Irrigation
in Lakhs
Annual
Water supply
ha/Mm3.
1 2 3 4 5 6 7 8 9 10 11 12 13*
34 Pawana 241.11 5304 2006-07 Ist 241.11 10.78 1562 10.99 3022.17 3033.16 145
2007-08 Iind 230.11 10.89 1812 10.41 4479.76 4490.17 166
2008-09 IIIrd 241.11 36.96 1982 12.14 4460.33 4472.47 54
2009-10 Ivth
240.97 18.36 2818 10.21 4043.19 4053.40 153
2010-11 Vth
238.94 13.15 2437 10.20 4625.87 4636.07 185
2011-12 Current 238.94 12.30 1817 9.64 2667.88 2677.52 148
35 Chaskaman 214.5 44170 2006-07 Ist 209.15 33.32 4678 11.61 10.69 22.30 140
2007-08 Iind 214.50 49.52 5599 17.88 13.93 31.81 113
2008-09 IIIrd 214.50 83.45 12454 17.24 7.82 25.06 149
2009-10 Ivth 209.72 95.44 12447 21.81 11.52 33.33 130
2010-11 Vth 214.50 90.96 12532 25.67 7.48 33.15 138
2011-12 Current 214.50 118.67 15046 46.71 1.62 48.33 127
36 Kal 528.19 12731 2006-07 Ist 398.50 110.02 4585 12.00 12.00 24.00 42
2007-08 Iind 405.21 105.84 4100 15.30 2.00 17.30 39
2008-09 IIIrd 423.19 103.51 3400 12.70 3263.41 3276.11 33
2009-10 Ivth
402.96 66.81 2120 21.17 3656.15 3677.32 32
2010-11 Vth 399.62 49.12 1035 11.33 3557.05 3568.38 21
2011-12 Current 381.15 49.42 1269 1.90 2813.14 2815.04 26
37 Bhatsa 942.1 47860 2006-07 Ist 810.83 50.40 2839 7.59 1968.55 1976.14 56
2007-08 Iind 787.26 67.98 2566 6.07 2405.65 2411.72 38
2008-09 IIIrd 782.34 62.84 2667 5.52 8214.07 8219.59 42
2009-10 Ivth
624.85 45.28 2279 8.55 16222.43 16230.98 50
2010-11 Vth
812.09 60.95 2037 6.04 5052.67 5058.71 33
2011-12 Current 771.46 64.91 1800 1.86 4507.74 4509.60 28
9

Sr.
No.
Project Designed live
storage in
Mm3
ICA in ha Irrigation
Year
Year status Live
Storage as
on 15th oct
Water used
for irrigation
in Mm3
Irrigated
area in ha
Recovery
Irrigation
Rs. In lakhs
Recovery
Non
Irrigation Rs.
In lakhs
Total recovery
Irrigation +
Non Irrigation
in Lakhs
Annual
Water supply
ha/Mm3.
1 2 3 4 5 6 7 8 9 10 11 12 13*
38 Surya 286.31 8988 2006-07 Ist 216.31 85.00 4300 4.00 1141.00 1145.00 51
2007-08 Iind 175.43 62.85 3580 3.27 1658.96 1662.23 57
2008-09 IIIrd 172.12 93.57 3683 5.98 1748.55 1754.53 39
2009-10 Ivth
216.41 79.42 2608 9.22 1975.00 1984.22 33
2010-11 Vth
263.65 78.04 776 8.98 2037.75 2046.73 10
2011-12 Current 237.12 94.39 2317 5.33 2016.08 2021.41 25
39 Jayakwadi 2171 183322 2006-07 Ist 2170.94 1210.14 113086 220.64 2915.73 3136.37 93
2007-08 Iind 2170.94 1183.10 126048 199.06 3515.20 3714.26 107
2008-09 IIIrd 2170.94 1548.90 104339 331.79 4892.11 5223.90 67
2009-10 Ivth
528.60 321.93 30285 88.46 6692.12 6780.58 94
2010-11 Vth
1275.39 668.30 77434 129.66 5859.59 5989.25 116
2011-12 Current 1363.28 1013.90 81055 251.50 5636.38 5887.88 80
40 Majalgaon 312 54737 2006-07 Ist 312.00 216.48 13349 108.23 284.52 392.75 62
2007-08 Iind 260.40 192.10 14979 49.21 86.08 135.29 78
2008-09 IIIrd 312.00 235.49 15465 86.35 25.39 111.74 66
2009-10 Ivth
112.00 52.85 4719 14.53 57.71 72.24 89
2010-11 Vth
312.00 185.54 9352 65.46 23.21 88.67 50
2011-12 Current 312.00 224.70 19427 0.00 338.58 338.58 86
41 Manjra 173.32 18223 2006-07 Ist 173.32 129.99 13008 81.28 51.29 132.57 100
2007-08 Iind 173.32 104.55 12738 52.47 86.39 138.86 122
2008-09 IIIrd 173.32 119.90 12553 23.21 96.00 119.21 105
2009-10 Ivth
106.15 66.08 7170 27.70 21.84 49.54 109
2010-11 Vth
176.96 117.36 12001 85.18 155.10 240.28 102
2011-12 Current 176.96 107.18 16831 0.00 68.00 68.00 157
10

Sr.
No.
Project Designed live
storage in
Mm3
ICA in ha Irrigation
Year
Year status Live
Storage as
on 15th oct
Water used
for irrigation
in Mm3
Irrigated
area in ha
Recovery
Irrigation
Rs. In lakhs
Recovery
Non
Irrigation Rs.
In lakhs
Total recovery
Irrigation +
Non Irrigation
in Lakhs
Annual
Water supply
ha/Mm3.
1 2 3 4 5 6 7 8 9 10 11 12 13*
42 Lower Terna 113.95 11610 2006-07 Ist 91.22 28.11 3926 6.50 0.65 7.15 140
2007-08 Iind 76.15 30.53 4616 2.03 1.15 3.18 151
2008-09 IIIrd 91.22 37.04 5154 17.25 0.96 18.21 139
2009-10 Ivth
27.61 13.81 3436 27.70 21.80 49.50 249
2010-11 Vth
91.22 32.70 3646 12.67 6.03 18.70 111
2011-12 Current 33.80 29.92 5024 27.08 12.88 39.96 168
43 Vishnupuri 80.79 28340 2006-07 Ist 39.49 96.20 12031 16.37 159.51 175.88 125
2007-08 Iind 28.67 87.96 11025 21.16 196.63 217.79 125
2008-09 IIIrd 80.02 94.00 12046 11.11 0.00 11.11 128
2009-10 Ivth
80.79 32.15 4108 0.00 1.08 1.08 128
2010-11 Vth
79.24 78.41 11472 6.76 120.77 127.53 146
2011-12 Current 80.79 61.98 10138 7.16 131.35 138.51 164
44 Manar 138.21 23310 2006-07 Ist 137.08 124.56 15304 28.17 1.90 30.07 123
2007-08 Iind 134.29 107.84 12495 15.58 8.63 24.21 116
2008-09 IIIrd 39.22 8.42 918 2.61 0.00 2.61 109
2009-10 Ivth
7.63 0.00 0 0.00 2.58 2.58 0
2010-11 Vth
138.33 93.67 6828 1.39 1.96 3.35 73
2011-12 Current 135.31 123.13 9872 1.94 2.98 4.92 80
45 Purna 890.22 57988 2006-07 Ist 890.22 670.33 36451 60.93 2.00 62.93 54
2007-08 Iind 437.70 373.42 23777 31.44 0.97 32.41 64
2008-09 IIIrd 265.32 219.68 20276 21.20 61.45 82.65 92
2009-10 Ivth
57.85 71.14 11834 4.94 23.50 28.44 166
2010-11 Vth
80.16 555.20 36532 71.02 20.49 91.51 66
2011-12 Current 702.11 589.42 41593 68.41 48.22 116.63 71
11

Sr.
No.
Project Designed live
storage in
Mm3
ICA in ha Irrigation
Year
Year status Live
Storage as
on 15th oct
Water used
for irrigation
in Mm3
Irrigated
area in ha
Recovery
Irrigation
Rs. In lakhs
Recovery
Non
Irrigation Rs.
In lakhs
Total recovery
Irrigation +
Non Irrigation
in Lakhs
Annual
Water supply
ha/Mm3.
1 2 3 4 5 6 7 8 9 10 11 12 13*
46 Upper Penganga 964.09 125495 2006-07 Ist 963.14 369.05 22843 1.07 1.07 2.14 62
2007-08 Iind 871.48 419.20 21188 1.28 2.34 3.62 51
2008-09 IIIrd 411.27 302.17 23131 42.65 3.45 46.10 77
2009-10 Ivth
53.98 1.36 256 42.65 16.59 59.24 188
2010-11 Vth
964.10 353.34 22898 15.10 4.19 19.29 65
2011-12 Current 896.13 462.36 32493 7.02 1.06 8.08 70
47 NMC Express Canal 0 34203 2006-07 Ist
0.00 18.28 1230 2.30 0.20 2.50 67
2007-08 Iind
0.00 17.10 852 1.72 1.35 3.07 50
2008-09 IIIrd
0.00 15.28 1441 2.11 1.98 4.09 94
2009-10 Ivth
0.00 13.93 807 3.30 5.35 8.65 58
2010-11 Vth
-29.29 38.19 2610 3.33 2.44 5.77 68
2011-12 Current 0.00 62.67 5214.00 5.15 0.00 5.15 83
NOTE :
1
2
3
4 Zero value in col. 13 due to non availability of water for irrigation.
Change in col.No.3 of designed live storage in respective years if any is due to revision in designed live storage capicity
In col. No.8 of water used for irrigation is more than col.No. 7 of live storage as on 15th Oct. of respictive year is due to water utilisation in kharif of east Vidharbha Region.
Col.No.9 of irrigated area is more than Col.No.4 of ICA is due to increase of area in kharif seasion in east Vidharbha region.
12

Sr.
No.
Project Designed live
storage in
Mm3
ICA in
ha
Irrigation
Year
Year status Live
Storage as
on 15th oct
Water used
for irrigation
in Mm3
Irrigated
area in ha
Recovery
Irrigation
Rs. In lakhs
Recovery
Non-
Irrigation Rs.
In lakhs
Total recovery
Irrigation +
Non irrigation
in Lakhs
Annual
Water
supply
ha/Mm3.
1 2 3 4 5 6 7 8 9 10 11 12 13
1 Morna 41.46 4633 2006-07 Ist 41.46 19.68 3150 1.19 2.84 4.03 160
2007-08 Iind 41.46 33.29 3606 4.07 5.19 9.26 108
2008-09 IIIrd 8.65 3.82 840 1.21 3.74 4.95 220
2009-10 Ivth 9.84 0.70 81 0.00 3.71 3.71 116
2010-11 Vth 41.45 19.69 1407 4.87 15.34 20.21 71
2011-12 Current 18.86 10.28 1220 3.80 0.00 3.80 119
2 Nirguna 28.85 5836 2006-07 Ist 28.85 23.84 3293 4.27 1.17 5.44 138
2007-08 Iind 20.03 14.85 2818 4.11 1.87 5.98 190
2008-09 IIIrd 14.48 9.69 1401 1.73 1.09 2.82 145
2009-10 Ivth 9.89 4.13 365 0.42 1.18 1.60 88
2010-11 Vth 28.85 20.58 1984 7.50 4.00 11.50 96
2011-12 Current 8.10 4.06 414 3.30 0.00 3.30 102
3 Uma 11.68 2241 2006-07 Ist 11.68 9.16 1533 2.12 2.44 4.56 167
2007-08 Iind 11.68 10.32 2066 4.46 2.81 7.27 200
2008-09 IIIrd 0.24 0.00 0 0.26 1.05 1.31 0
2009-10 Ivth 0.00 0.00 0 0.00 0.13 0.13 0
2010-11 Vth 7.24 4.85 499 3.44 1.63 5.07 103
2011-12 Current 7.30 4.56 856 2.87 0.31 3.18 188
4 Gyanganga 33.93 4249 2006-07 Ist 33.93 9.91 1795 0.00 5.04 5.04 181
2007-08 Iind 22.36 6.35 1428 0.00 53.00 53.00 225
2008-09 IIIrd 20.10 7.47 1188 0.00 72.69 72.69 159
2009-10 Ivth 9.34 0.00 0 0.00 57.62 57.62 0
2010-11 Vth 33.93 11.35 1532 0.00 49.70 49.70 135
2011-12 Current 24.36 9.02 1423 0.18 31.40 31.58 158
5 Paldhag 7.51 1932 2006-07 Ist 7.51 5.39 922 0.00 0.00 0.00 171
2007-08 Iind 7.23 4.87 809 0.00 2.62 2.62 166
2008-09 IIIrd 7.51 4.09 521 0.00 3.81 3.81 127
2009-10 Ivth 4.83 1.02 186 0.00 0.38 0.38 182
2010-11 Vth 7.51 6.34 415 0.00 1.03 1.03 65
2011-12 Current 7.51 6.40 356 0.50 0.71 1.21 56
Analysis of Medium projects in Maharashtra State (2006-07 to 2011-12)

Sr.
No.
Project Designed live
storage in
Mm3
ICA in
ha
Irrigation
Year
Year status Live
Storage as
on 15th oct
Water used
for irrigation
in Mm3
Irrigated
area in ha
Recovery
Irrigation
Rs. In lakhs
Recovery
Non-
Irrigation Rs.
In lakhs
Total recovery
Irrigation +
Non irrigation
in Lakhs
Annual
Water
supply
ha/Mm3.
1 2 3 4 5 6 7 8 9 10 11 12 13
6 Mas 22.04 4415 2006-07 Ist 15.04 11.55 1673 0.00 0.92 0.92 145
2007-08 Iind 12.96 8.23 1382 0.00 1.02 1.02 168
2008-09 IIIrd 7.85 2.64 564 0.00 5.40 5.40 214
2009-10 Ivth 6.03 0.56 223 0.00 0.30 0.30 398
2010-11 Vth 15.04 9.24 968 0.00 0.00 0.00 105
2011-12 Current 4.90 3.60 817 0.05 0.13 0.18 227
7 Koradi 20.7 4061 2006-07 Ist 20.70 16.95 4224 6.29 0.00 6.29 249
2007-08 Iind 18.47 13.75 3051 0.00 0.54 0.54 222
2008-09 IIIrd 1.90 0.43 98 0.02 4.95 4.97 228
2009-10 Ivth 0.35 0.01 11 0.00 5.12 5.12 1000
2010-11 Vth 15.12 15.78 1276 1.17 3.65 4.82 81
2011-12 Current 12.08 7.70 1879 1.09 0.59 1.68 244
8 Shahanoor 46.04 7466 2006-07 Ist 46.04 15.49 2796 7.02 38.32 45.34 181
2007-08 Iind 43.88 17.59 2847 6.82 52.61 59.43 162
2008-09 IIIrd 32.93 14.99 2495 7.01 13.44 20.45 166
2009-10 Ivth 36.25 21.87 563 4.93 14.11 19.04 26
2010-11 Vth 42.76 14.25 677 3.22 15.16 18.38 48
2011-12 Current 43.30 10.97 601 3.00 9.31 12.31 55
9 Saikheda 27.18 3116 2006-07 Ist 27.18 13.87 1482 0.04 1.68 1.72 107
2007-08 Iind 27.18 13.37 1726 0.13 3.18 3.31 129
2008-09 IIIrd 27.18 15.50 1450 1.06 6.92 7.98 94
2009-10 Ivth 7.37 0.00 0 0.00 5.56 5.56 0
2010-11 Vth 27.19 10.49 1332 0.10 3.14 3.24 127
2011-12 Current NA NA NA NA NA NA NA
10 Borgaon 6.61 2271 2006-07 Ist 6.61 5.49 130 1.13 0.09 1.22 24
2007-08 Iind 6.61 5.71 987 0.10 0.09 0.19 173
2008-09 IIIrd 1.69 0.41 182 0.10 0.09 0.19 444
2009-10 Ivth 1.39 0.12 77 0.00 0.09 0.09 642
2010-11 Vth 6.51 4.74 391 0.15 1.11 1.26 82
2011-12 Current NA NA NA NA NA NA NA

Sr.
No.
Project Designed live
storage in
Mm3
ICA in
ha
Irrigation
Year
Year status Live
Storage as
on 15th oct
Water used
for irrigation
in Mm3
Irrigated
area in ha
Recovery
Irrigation
Rs. In lakhs
Recovery
Non-
Irrigation Rs.
In lakhs
Total recovery
Irrigation +
Non irrigation
in Lakhs
Annual
Water
supply
ha/Mm3.
1 2 3 4 5 6 7 8 9 10 11 12 13
11 Sonal 16.92 2447 2006-07 Ist 16.92 13.81 2507 7.19 0.00 7.19 182
2007-08 Iind 16.92 13.05 2813 8.81 0.87 9.68 216
2008-09 IIIrd 0.00 0.00 0 0.00 1.02 1.02 0
2009-10 Ivth 1.11 0.07 10 0.21 0.02 0.23 146
2010-11 Vth 16.92 12.01 1330 0.16 0.00 0.16 111
2011-12 Current 9.60 5.25 814 1.67 1.00 2.67 155
12 Ekburji 11.97 2271 2006-07 Ist 11.97 8.79 1338 2.41 4.69 7.10 152
2007-08 Iind 11.97 7.92 1249 2.43 8.25 10.68 158
2008-09 IIIrd 9.29 2.82 753 1.02 11.09 12.11 267
2009-10 Ivth 5.24 1.41 385 0.80 15.00 15.80 272
2010-11 Vth 11.97 5.84 711 0.19 19.40 19.59 122
2011-12 Current 11.27 6.75 801 0.69 21.74 22.43 119
13 Lowerpus 59.63 6600 2006-07 Ist 59.63 47.49 4098 0.76 3.50 4.26 86
2007-08 Iind 59.50 40.55 4568 0.92 5.59 6.51 113
2008-09 IIIrd 54.30 34.72 4627 3.03 13.02 16.05 133
2009-10 Ivth 8.11 1.30 195 0.37 18.07 18.44 150
2010-11 Vth 59.63 28.90 1740 1.03 9.93 10.96 60
2011-12 Current
14 Mun 36.83 7804 2006-07 Ist 36.83 28.79 2618 0.12 0.00 0.12 91
2007-08 Iind 13.31 11.14 1056 9.87 0.71 10.58 95
2008-09 IIIrd 17.50 16.28 1903 6.02 1.16 7.18 117
2009-10 Ivth 15.55 6.47 1058 5.32 5.20 10.52 164
2010-11 Vth 36.83 32.70 1912 4.77 5.25 10.02 58
2011-12 Current 11.93 6.19 576 2.16 432.11 434.27 93
15 Torna 7.9 1465 2006-07 Ist 7.90 5.65 462 0.35 0.00 0.35 82
2007-08 Iind 1.26 0.04 27 0.00 0.00 0.00 675
2008-09 IIIrd 6.91 5.23 576 0.00 0.00 0.00 110
2009-10 Ivth 6.28 10.67 1202 0.65 0.07 0.72 113
2010-11 Vth 7.82 7.05 533 1.02 0.07 1.09 76
2011-12 Current 2.94 3.21 420 0.00 0.07 0.07 131
Data unable to process
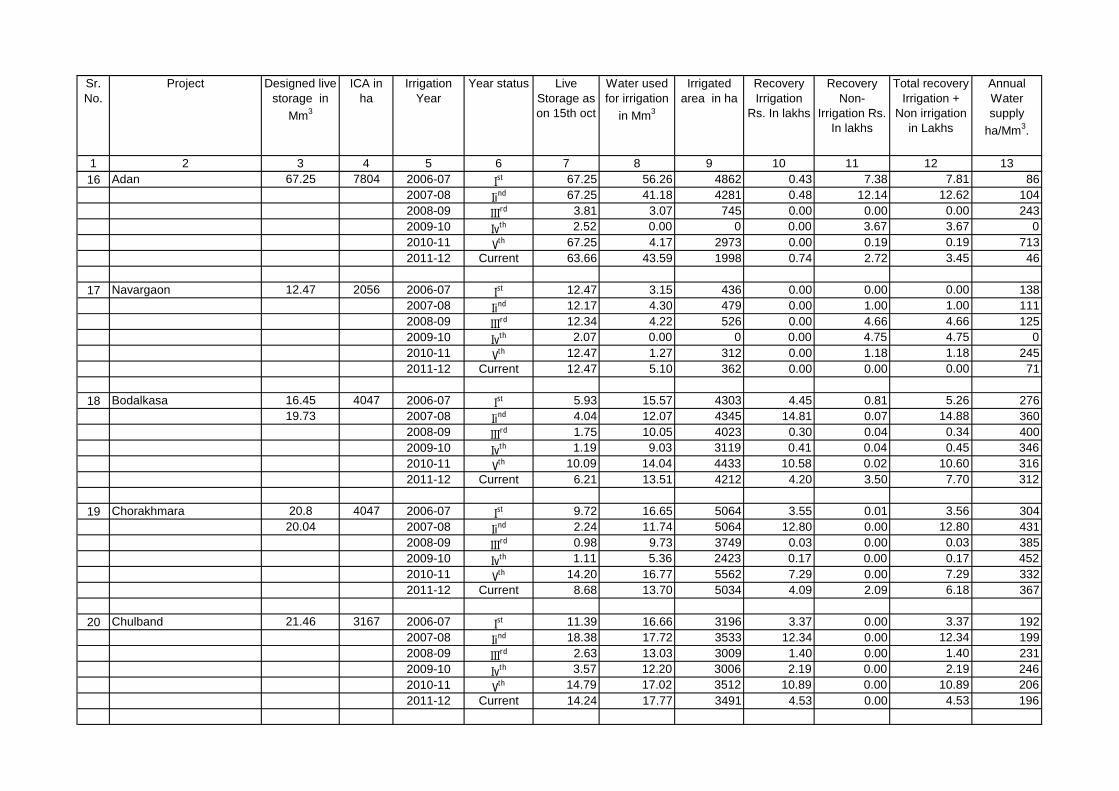
Sr.
No.
Project Designed live
storage in
Mm3
ICA in
ha
Irrigation
Year
Year status Live
Storage as
on 15th oct
Water used
for irrigation
in Mm3
Irrigated
area in ha
Recovery
Irrigation
Rs. In lakhs
Recovery
Non-
Irrigation Rs.
In lakhs
Total recovery
Irrigation +
Non irrigation
in Lakhs
Annual
Water
supply
ha/Mm3.
1 2 3 4 5 6 7 8 9 10 11 12 13
16 Adan 67.25 7804 2006-07 Ist 67.25 56.26 4862 0.43 7.38 7.81 86
2007-08 Iind 67.25 41.18 4281 0.48 12.14 12.62 104
2008-09 IIIrd 3.81 3.07 745 0.00 0.00 0.00 243
2009-10 Ivth 2.52 0.00 0 0.00 3.67 3.67 0
2010-11 Vth 67.25 4.17 2973 0.00 0.19 0.19 713
2011-12 Current 63.66 43.59 1998 0.74 2.72 3.45 46
17 Navargaon 12.47 2056 2006-07 Ist 12.47 3.15 436 0.00 0.00 0.00 138
2007-08 Iind 12.17 4.30 479 0.00 1.00 1.00 111
2008-09 IIIrd 12.34 4.22 526 0.00 4.66 4.66 125
2009-10 Ivth 2.07 0.00 0 0.00 4.75 4.75 0
2010-11 Vth 12.47 1.27 312 0.00 1.18 1.18 245
2011-12 Current 12.47 5.10 362 0.00 0.00 0.00 71
18 Bodalkasa 16.45 4047 2006-07 Ist 5.93 15.57 4303 4.45 0.81 5.26 276
19.73 2007-08 Iind 4.04 12.07 4345 14.81 0.07 14.88 360
2008-09 IIIrd 1.75 10.05 4023 0.30 0.04 0.34 400
2009-10 Ivth 1.19 9.03 3119 0.41 0.04 0.45 346
2010-11 Vth 10.09 14.04 4433 10.58 0.02 10.60 316
2011-12 Current 6.21 13.51 4212 4.20 3.50 7.70 312
19 Chorakhmara 20.8 4047 2006-07 Ist 9.72 16.65 5064 3.55 0.01 3.56 304
20.04 2007-08 Iind 2.24 11.74 5064 12.80 0.00 12.80 431
2008-09 IIIrd 0.98 9.73 3749 0.03 0.00 0.03 385
2009-10 Ivth 1.11 5.36 2423 0.17 0.00 0.17 452
2010-11 Vth 14.20 16.77 5562 7.29 0.00 7.29 332
2011-12 Current 8.68 13.70 5034 4.09 2.09 6.18 367
20 Chulband 21.46 3167 2006-07 Ist 11.39 16.66 3196 3.37 0.00 3.37 192
2007-08 Iind 18.38 17.72 3533 12.34 0.00 12.34 199
2008-09 IIIrd 2.63 13.03 3009 1.40 0.00 1.40 231
2009-10 Ivth 3.57 12.20 3006 2.19 0.00 2.19 246
2010-11 Vth 14.79 17.02 3512 10.89 0.00 10.89 206
2011-12 Current 14.24 17.77 3491 4.53 0.00 4.53 196

Sr.
No.
Project Designed live
storage in
Mm3
ICA in
ha
Irrigation
Year
Year status Live
Storage as
on 15th oct
Water used
for irrigation
in Mm3
Irrigated
area in ha
Recovery
Irrigation
Rs. In lakhs
Recovery
Non-
Irrigation Rs.
In lakhs
Total recovery
Irrigation +
Non irrigation
in Lakhs
Annual
Water
supply
ha/Mm3.
1 2 3 4 5 6 7 8 9 10 11 12 13
21 Khairbanda 15.95 6109 2006-07 Ist 15.95 12.76 5239 5.73 0.00 5.73 410
2007-08 Iind 6.93 9.09 5285 15.52 0.00 15.52 582
2008-09 IIIrd 1.23 8.44 5045 1.25 0.00 1.25 598
2009-10 Ivth 1.95 7.82 5110 2.31 0.00 2.31 653
2010-11 Vth 6.38 6.61 5140 9.01 0.00 9.01 777
2011-12 Current 2.75 6.08 3597 1.70 2.26 3.96 592
22 Sangrampur 3.87 1094 2006-07 Ist 0.64 3.59 1099 1.29 0.00 1.29 306
2007-08 Iind 1.17 2.58 1004 3.60 0.00 3.60 389
2008-09 IIIrd 0.16 1.96 792 0.01 0.00 0.01 404
2009-10 Ivth 0.27 2.60 925 0.09 0.00 0.09 356
2010-11 Vth 2.00 2.68 1100 1.26 0.00 1.26 411
2011-12 Current 2.24 3.00 990 0.79 0.00 0.79 330
23 Managadh 7.05 1700 2006-07 Ist 4.30 4.85 1008 1.20 0.00 1.20 208
2007-08 Iind 6.89 3.77 1251 2.31 0.00 2.31 332
2008-09 IIIrd 4.04 6.78 1045 0.15 0.00 0.15 154
2009-10 Ivth 0.35 3.49 929 0.81 0.00 0.81 266
2010-11 Vth 5.36 4.80 1067 2.59 0.00 2.59 222
2011-12 Current 4.47 5.60 1051 1.47 0.02 1.49 188
24 Rengepar 3.57 870 2006-07 Ist 1.42 3.44 943 1.84 0.00 1.84 274
2007-08 Iind 2.78 2.92 980 2.57 0.00 2.57 336
2008-09 IIIrd 0.65 3.62 945 0.79 0.00 0.79 261
2009-10 Ivth 1.38 3.41 948 1.17 0.00 1.17 278
2010-11 Vth 2.12 2.93 968 1.12 0.00 1.12 330
2011-12 Current 2.32 2.79 1649 0.62 0.00 0.62 591
25 Chandpur 28.87 6271 2006-07 Ist 11.71 1.00 130 41.00 41.00 82.00 130
2007-08 Iind 6.86 14.28 6390 9.23 0.00 9.23 448
2008-09 IIIrd 0.09 12.23 6448 2.91 0.00 2.91 527
2009-10 Ivth 0.68 11.25 6528 3.48 0.00 3.48 580
2010-11 Vth 20.40 18.34 7038 7.29 1.23 8.52 384
2011-12 Current 20.68 43.67 8551 10.91 0.00 10.91 196
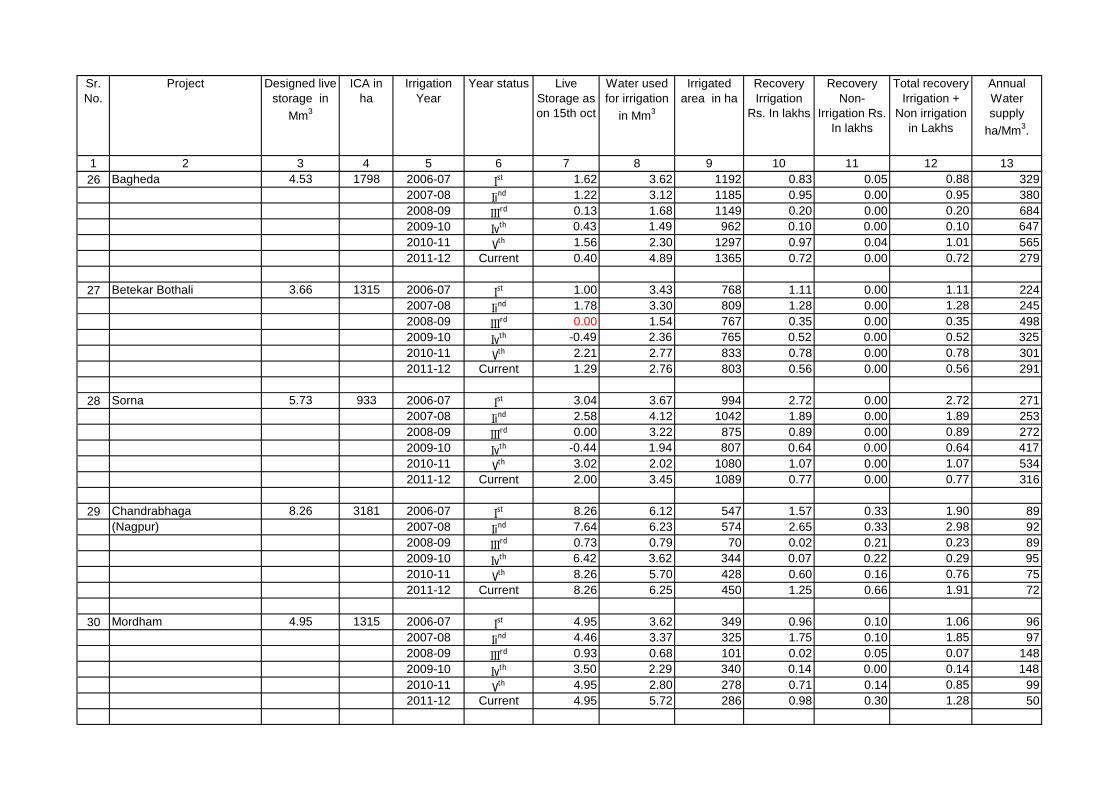
Sr.
No.
Project Designed live
storage in
Mm3
ICA in
ha
Irrigation
Year
Year status Live
Storage as
on 15th oct
Water used
for irrigation
in Mm3
Irrigated
area in ha
Recovery
Irrigation
Rs. In lakhs
Recovery
Non-
Irrigation Rs.
In lakhs
Total recovery
Irrigation +
Non irrigation
in Lakhs
Annual
Water
supply
ha/Mm3.
1 2 3 4 5 6 7 8 9 10 11 12 13
26 Bagheda 4.53 1798 2006-07 Ist 1.62 3.62 1192 0.83 0.05 0.88 329
2007-08 Iind 1.22 3.12 1185 0.95 0.00 0.95 380
2008-09 IIIrd 0.13 1.68 1149 0.20 0.00 0.20 684
2009-10 Ivth 0.43 1.49 962 0.10 0.00 0.10 647
2010-11 Vth 1.56 2.30 1297 0.97 0.04 1.01 565
2011-12 Current 0.40 4.89 1365 0.72 0.00 0.72 279
27 Betekar Bothali 3.66 1315 2006-07 Ist 1.00 3.43 768 1.11 0.00 1.11 224
2007-08 Iind 1.78 3.30 809 1.28 0.00 1.28 245
2008-09 IIIrd 0.00 1.54 767 0.35 0.00 0.35 498
2009-10 Ivth -0.49 2.36 765 0.52 0.00 0.52 325
2010-11 Vth 2.21 2.77 833 0.78 0.00 0.78 301
2011-12 Current 1.29 2.76 803 0.56 0.00 0.56 291
28 Sorna 5.73 933 2006-07 Ist 3.04 3.67 994 2.72 0.00 2.72 271
2007-08 Iind 2.58 4.12 1042 1.89 0.00 1.89 253
2008-09 IIIrd 0.00 3.22 875 0.89 0.00 0.89 272
2009-10 Ivth -0.44 1.94 807 0.64 0.00 0.64 417
2010-11 Vth 3.02 2.02 1080 1.07 0.00 1.07 534
2011-12 Current 2.00 3.45 1089 0.77 0.00 0.77 316
29 Chandrabhaga 8.26 3181 2006-07 Ist 8.26 6.12 547 1.57 0.33 1.90 89
(Nagpur) 2007-08 Iind 7.64 6.23 574 2.65 0.33 2.98 92
2008-09 IIIrd 0.73 0.79 70 0.02 0.21 0.23 89
2009-10 Ivth 6.42 3.62 344 0.07 0.22 0.29 95
2010-11 Vth 8.26 5.70 428 0.60 0.16 0.76 75
2011-12 Current 8.26 6.25 450 1.25 0.66 1.91 72
30 Mordham 4.95 1315 2006-07 Ist 4.95 3.62 349 0.96 0.10 1.06 96
2007-08 Iind 4.46 3.37 325 1.75 0.10 1.85 97
2008-09 IIIrd 0.93 0.68 101 0.02 0.05 0.07 148
2009-10 Ivth 3.50 2.29 340 0.14 0.00 0.14 148
2010-11 Vth 4.95 2.80 278 0.71 0.14 0.85 99
2011-12 Current 4.95 5.72 286 0.98 0.30 1.28 50

Sr.
No.
Project Designed live
storage in
Mm3
ICA in
ha
Irrigation
Year
Year status Live
Storage as
on 15th oct
Water used
for irrigation
in Mm3
Irrigated
area in ha
Recovery
Irrigation
Rs. In lakhs
Recovery
Non-
Irrigation Rs.
In lakhs
Total recovery
Irrigation +
Non irrigation
in Lakhs
Annual
Water
supply
ha/Mm3.
1 2 3 4 5 6 7 8 9 10 11 12 13
31 Kesarnala 3.93 780 2006-07 Ist 2.45 1.99 235 0.60 0.47 1.07 118
2007-08 Iind 3.52 3.40 324 0.99 0.00 0.99 95
2008-09 IIIrd 0.63 6.57 522 0.05 0.00 0.05 79
2009-10 Ivth 3.16 2.29 69 0.45 0.52 0.97 30
2010-11 Vth 1.73 0.79 111 0.18 0.80 0.98 141
2011-12 Current 1.47 1.07 117 0.09 0.54 0.63 109
32 Umri 5.14 12 2006-07 Ist 3.50 3.07 395 1.14 0.00 1.14 129
2007-08 Iind 4.51 4.89 393 0.58 0.00 0.58 80
2008-09 IIIrd 4.76 3.56 450 0.19 0.00 0.19 126
2009-10 Ivth 3.25 2.59 400 0.65 0.00 0.65 155
2010-11 Vth 5.15 3.23 380 0.44 0.00 0.44 118
2011-12 Current 4.61 3.83 368 0.37 0.05 0.42 96
33 Kolar 31.32 5940 2006-07 Ist 27.74 20.75 2814 2.83 9.81 12.64 136
2007-08 Iind 27.26 21.90 2587 0.62 15.77 16.39 118
2008-09 IIIrd 17.65 13.96 2148 0.70 4.92 5.62 154
2009-10 Ivth 31.32 20.23 1261 0.15 13.36 13.51 62
2010-11 Vth 31.32 22.16 1728 0.62 25.38 26.00 78
2011-12 Current 22.83 29.32 2424 0.76 20.30 21.06 83
34 Khekranala 23.81 2610 2006-07 Ist 21.72 16.99 522 0.58 0.00 0.58 31
2007-08 Iind 20.86 14.42 517 1.18 0.00 1.18 36
2008-09 IIIrd 8.68 6.57 522 0.05 0.00 0.05 79
2009-10 Ivth 23.19 11.74 418 0.06 0.75 0.81 36
2010-11 Vth 23.39 14.71 380 0.06 2.49 2.55 26
2011-12 Current 14.04 14.85 996 1.04 0.52 1.56 67
35 Wunna 21.64 1214 2006-07 Ist 6.17 0.36 72 0.05 228.28 228.33 202
2007-08 Iind 21.30 3.53 240 0.70 250.11 250.81 68
2008-09 IIIrd 12.39 0.18 44 0.07 259.35 259.42 244
2009-10 Ivth 15.09 0.23 67 0.63 255.90 256.53 291
2010-11 Vth 13.93 1.16 67 0.05 297.26 297.31 58
2011-12 Current 19.82 2.26 174 0.35 259.56 259.91 77

Sr.
No.
Project Designed live
storage in
Mm3
ICA in
ha
Irrigation
Year
Year status Live
Storage as
on 15th oct
Water used
for irrigation
in Mm3
Irrigated
area in ha
Recovery
Irrigation
Rs. In lakhs
Recovery
Non-
Irrigation Rs.
In lakhs
Total recovery
Irrigation +
Non irrigation
in Lakhs
Annual
Water
supply
ha/Mm3.
1 2 3 4 5 6 7 8 9 10 11 12 13
36 Kanholibara 20.49 3371 2006-07 Ist 20.48 15.42 1683 3.11 0.00 3.11 109
2007-08 Iind 20.49 13.05 1675 2.60 0.00 2.60 128
2008-09 IIIrd 18.00 13.86 1781 0.02 0.00 0.02 128
2009-10 Ivth 20.33 13.09 2149 0.20 0.00 0.20 164
2010-11 Vth 20.49 16.99 1716 0.62 0.00 0.62 101
2011-12 Current 15.04 16.89 1519 0.22 1.06 1.28 90
37 Pandhrabodi 13.14 862 2006-07 Ist 11.16 7.42 1422 2.11 3.50 5.61 192
2007-08 Iind 11.66 7.60 1427 2.00 4.49 6.49 188
2008-09 IIIrd 3.33 0.00 0 0.00 0.00 0.00 0
2009-10 Ivth 3.57 2.77 418 0.15 3.91 4.06 151
2010-11 Vth 11.07 8.76 1500 2.38 4.49 6.87 171
2011-12 Current 8.74 8.03 1225 1.50 4.66 6.16 153
38 Makardhokda Saiki 25.9 5477 2006-07 Ist 25.90 21.11 2890 7.34 2.41 9.75 137
Complex 2007-08 Iind 25.90 25.02 2760 6.00 5.89 11.89 110
2008-09 IIIrd 4.08 1.86 311 0.04 10.74 10.78 167
2009-10 Ivth 3.57 2.77 418 0.15 3.91 4.06 151
2010-11 Vth 25.90 16.92 2456 2.04 9.58 11.62 145
2011-12 Current 22.15 20.38 3133 4.21 4.25 8.46 154
39 Ghorazari 43.16 3846 2006-07 Ist 19.26 29.60 5912 9.92 1.75 11.67 200
2007-08 Iind 26.54 34.48 5868 3.38 1.81 5.19 170
2008-09 IIIrd 2.77 20.49 5844 0.63 0.18 0.81 285
2009-10 Ivth 3.50 23.24 5603 8.54 0.00 8.54 241
2010-11 Vth 10.12 17.25 5762 15.43 0.00 15.43 334
2011-12 Current 23.28 28.61 5810 9.67 0.00 9.67 203
40 Naleshwar 10.23 1888 2006-07 Ist 8.48 19.95 2850 3.89 0.48 4.37 143
2007-08 Iind 9.36 13.83 2795 1.63 0.18 1.81 202
2008-09 IIIrd 0.97 11.88 2876 1.93 0.02 1.95 242
2009-10 Ivth 1.08 5.51 2778 0.98 0.00 0.98 504
2010-11 Vth 5.88 7.76 3025 4.69 0.00 4.69 390
2011-12 Current 8.79 16.93 2955 5.00 0.00 5.00 175

Sr.
No.
Project Designed live
storage in
Mm3
ICA in
ha
Irrigation
Year
Year status Live
Storage as
on 15th oct
Water used
for irrigation
in Mm3
Irrigated
area in ha
Recovery
Irrigation
Rs. In lakhs
Recovery
Non-
Irrigation Rs.
In lakhs
Total recovery
Irrigation +
Non irrigation
in Lakhs
Annual
Water
supply
ha/Mm3.
1 2 3 4 5 6 7 8 9 10 11 12 13
41 Chandai 10.69 2056 2006-07 Ist 9.52 5.93 1340 1.80 0.27 2.07 226
2007-08 Iind 9.52 7.32 1336 0.79 0.42 1.21 183
2008-09 IIIrd 1.12 4.89 1178 0.29 0.13 0.42 241
2009-10 Ivth 5.33 3.91 1238 0.99 0.00 0.99 317
2010-11 Vth 6.63 4.10 1276 2.11 0.00 2.11 311
2011-12 Current 4.06 5.26 1207 1.31 0.00 1.31 229
42 Chargaon 19.87 1500 2006-07 Ist 18.24 16.44 1825 2.29 0.85 3.14 111
2007-08 Iind 18.28 16.41 916 1.89 2.26 4.15 56
2008-09 IIIrd 8.80 11.94 873 2.53 0.07 2.60 73
2009-10 Ivth 16.04 5.82 1073 1.08 0.66 1.74 185
2010-11 Vth 16.61 7.75 1942 3.13 5.00 8.13 250
2011-12 Current 14.23 14.12 1959 4.41 3.31 7.72 139
43 Labhansarad 7.35 2024 2006-07 Ist 7.35 6.70 1055 2.44 0.65 3.09 157
2007-08 Iind 7.35 6.07 877 1.01 0.39 1.40 144
2008-09 IIIrd 7.35 4.18 949 0.81 0.63 1.44 227
2009-10 Ivth 3.96 1.20 339 0.96 0.00 0.96 283
2010-11 Vth 7.15 4.18 568 1.77 0.00 1.77 136
2011-12 Current 6.46 4.65 573 1.26 0.58 1.84 123
44 Amal Nala 24.48 2962 2006-07 Ist 24.48 16.05 2051 5.21 176.08 181.29 128
2007-08 Iind 21.20 15.83 2571 2.38 204.81 207.19 162
2008-09 IIIrd 16.24 9.98 1768 2.71 189.31 192.02 177
2009-10 Ivth 6.07 0.00 0 1.09 205.23 206.32 0
2010-11 Vth 24.48 6.26 2587 4.77 203.42 208.19 414
2011-12 Current 22.19 15.85 3267 6.45 137.92 144.37 206
45 Panchadhara 10.39 1822 2006-07 Ist 9.80 9.21 525 0.40 0.00 0.40 57
Complex 2007-08 Iind 10.39 9.85 514 1.73 0.13 1.86 52
2008-09 IIIrd 9.82 9.82 500 1.27 0.11 1.38 51
2009-10 Ivth 9.56 7.83 435 1.03 0.00 1.03 56
2010-11 Vth 10.39 7.65 362 1.37 0.00 1.37 47
2011-12 Current 10.22 9.04 874 0.85 0.00 0.85 97
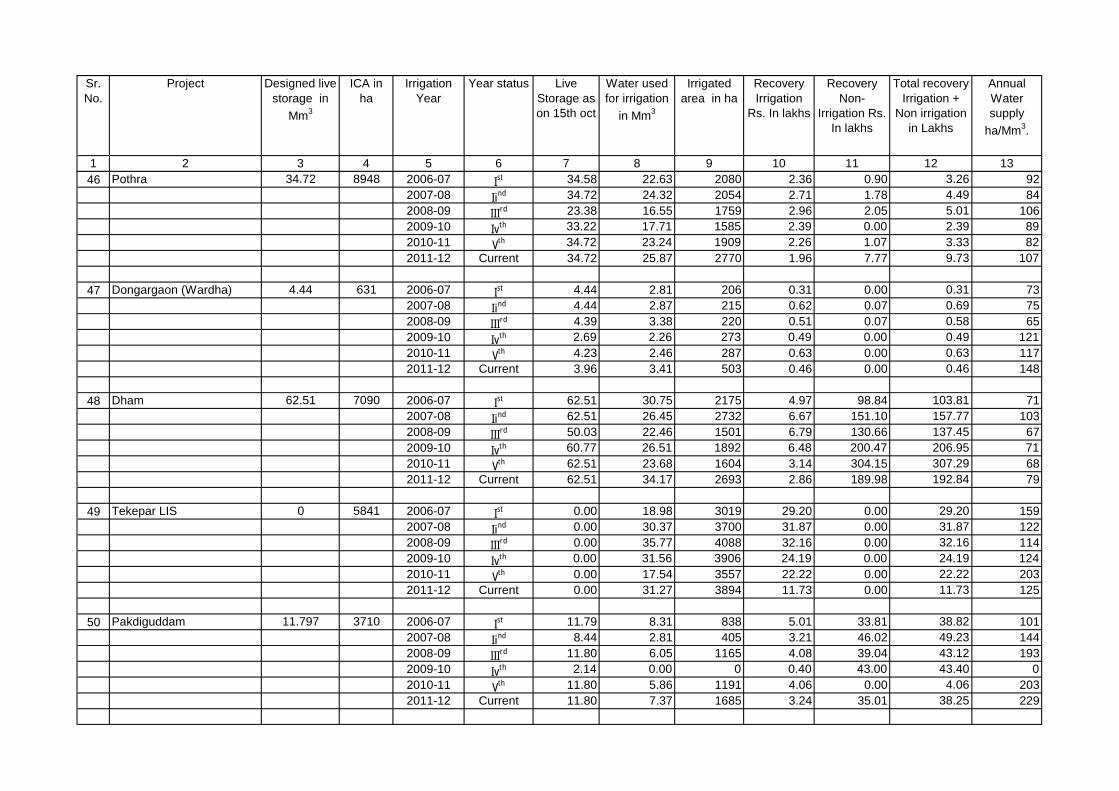
Sr.
No.
Project Designed live
storage in
Mm3
ICA in
ha
Irrigation
Year
Year status Live
Storage as
on 15th oct
Water used
for irrigation
in Mm3
Irrigated
area in ha
Recovery
Irrigation
Rs. In lakhs
Recovery
Non-
Irrigation Rs.
In lakhs
Total recovery
Irrigation +
Non irrigation
in Lakhs
Annual
Water
supply
ha/Mm3.
1 2 3 4 5 6 7 8 9 10 11 12 13
46 Pothra 34.72 8948 2006-07 Ist 34.58 22.63 2080 2.36 0.90 3.26 92
2007-08 Iind 34.72 24.32 2054 2.71 1.78 4.49 84
2008-09 IIIrd 23.38 16.55 1759 2.96 2.05 5.01 106
2009-10 Ivth 33.22 17.71 1585 2.39 0.00 2.39 89
2010-11 Vth 34.72 23.24 1909 2.26 1.07 3.33 82
2011-12 Current 34.72 25.87 2770 1.96 7.77 9.73 107
47 Dongargaon (Wardha) 4.44 631 2006-07 Ist 4.44 2.81 206 0.31 0.00 0.31 73
2007-08 Iind 4.44 2.87 215 0.62 0.07 0.69 75
2008-09 IIIrd 4.39 3.38 220 0.51 0.07 0.58 65
2009-10 Ivth 2.69 2.26 273 0.49 0.00 0.49 121
2010-11 Vth 4.23 2.46 287 0.63 0.00 0.63 117
2011-12 Current 3.96 3.41 503 0.46 0.00 0.46 148
48 Dham 62.51 7090 2006-07 Ist 62.51 30.75 2175 4.97 98.84 103.81 71
2007-08 Iind 62.51 26.45 2732 6.67 151.10 157.77 103
2008-09 IIIrd 50.03 22.46 1501 6.79 130.66 137.45 67
2009-10 Ivth 60.77 26.51 1892 6.48 200.47 206.95 71
2010-11 Vth 62.51 23.68 1604 3.14 304.15 307.29 68
2011-12 Current 62.51 34.17 2693 2.86 189.98 192.84 79
49 Tekepar LIS 0 5841 2006-07 Ist 0.00 18.98 3019 29.20 0.00 29.20 159
2007-08 Iind 0.00 30.37 3700 31.87 0.00 31.87 122
2008-09 IIIrd 0.00 35.77 4088 32.16 0.00 32.16 114
2009-10 Ivth 0.00 31.56 3906 24.19 0.00 24.19 124
2010-11 Vth 0.00 17.54 3557 22.22 0.00 22.22 203
2011-12 Current 0.00 31.27 3894 11.73 0.00 11.73 125
50 Pakdiguddam 11.797 3710 2006-07 Ist 11.79 8.31 838 5.01 33.81 38.82 101
2007-08 Iind 8.44 2.81 405 3.21 46.02 49.23 144
2008-09 IIIrd 11.80 6.05 1165 4.08 39.04 43.12 193
2009-10 Ivth 2.14 0.00 0 0.40 43.00 43.40 0
2010-11 Vth 11.80 5.86 1191 4.06 0.00 4.06 203
2011-12 Current 11.80 7.37 1685 3.24 35.01 38.25 229

Sr.
No.
Project Designed live
storage in
Mm3
ICA in
ha
Irrigation
Year
Year status Live
Storage as
on 15th oct
Water used
for irrigation
in Mm3
Irrigated
area in ha
Recovery
Irrigation
Rs. In lakhs
Recovery
Non-
Irrigation Rs.
In lakhs
Total recovery
Irrigation +
Non irrigation
in Lakhs
Annual
Water
supply
ha/Mm3.
1 2 3 4 5 6 7 8 9 10 11 12 13
51 Manyad 40.27 4864 2006-07 Ist 40.27 35.60 4105 0.95 9.48 10.43 115
2007-08 Iind 40.27 35.10 3941 4.47 3.55 8.02 112
2008-09 IIIrd 40.27 35.66 3502 5.55 7.88 13.43 98
2009-10 Ivth 40.42 32.82 4046 14.14 10.00 24.14 123
2010-11 Vth 40.49 33.84 3565 15.45 11.26 26.71 105
2011-12 Current 40.29 26.08 4155 6.41 4.60 11.01 159
52 Bori 25.15 4553 2006-07 Ist 25.15 16.35 1905 0.07 17.70 17.77 117
2007-08 Iind 25.15 20.63 2161 7.44 8.91 16.35 105
2008-09 IIIrd 25.15 15.00 1662 5.26 24.03 29.29 111
2009-10 Ivth 13.24 10.26 1555 4.33 17.28 21.61 152
2010-11 Vth 25.15 13.33 1613 4.42 19.06 23.48 121
2011-12 Current 24.93 11.76 1002 5.97 14.10 20.07 85
53 Bhokarbari 6.54 1205 2006-07 Ist 6.54 4.56 406 0.14 1.60 1.74 89
2007-08 Iind 6.54 4.87 415 1.15 0.45 1.60 85
2008-09 IIIrd 3.14 2.05 192 0.49 1.07 1.56 94
2009-10 Ivth 0.28 0.63 101 0.61 0.81 1.42 160
2010-11 Vth 3.23 2.45 258 0.20 0.88 1.08 105
2011-12 Current 0.35 0.04 38 0.01 1.37 1.38 1027
54 Suki 39.85 5128 2006-07 Ist 39.85 22.65 872 4.17 6.15 10.32 38
2007-08 Iind 39.85 33.38 945 3.91 4.62 8.53 28
2008-09 IIIrd 39.85 35.56 926 3.75 10.87 14.62 26
2009-10 Ivth 39.85 24.85 962 3.70 6.85 10.55 39
2010-11 Vth 39.85 16.34 947 3.07 0.00 3.07 58
2011-12 Current 39.85 9.72 785 2.38 6.11 8.49 81
55 Abhora 6.02 1115 2006-07 Ist 6.02 2.91 275 0.41 0.00 0.41 95
2007-08 Iind 6.02 2.35 400 0.87 0.00 0.87 170
2008-09 IIIrd 6.02 3.30 355 0.81 0.00 0.81 108
2009-10 Ivth 6.02 2.06 340 0.92 0.00 0.92 165
2010-11 Vth 6.02 2.09 296 0.26 0.00 0.26 142
2011-12 Current 6.02 2.21 325 0.62 0.00 0.62 147

Sr.
No.
Project Designed live
storage in
Mm3
ICA in
ha
Irrigation
Year
Year status Live
Storage as
on 15th oct
Water used
for irrigation
in Mm3
Irrigated
area in ha
Recovery
Irrigation
Rs. In lakhs
Recovery
Non-
Irrigation Rs.
In lakhs
Total recovery
Irrigation +
Non irrigation
in Lakhs
Annual
Water
supply
ha/Mm3.
1 2 3 4 5 6 7 8 9 10 11 12 13
56 Agnawati 2.76 605 2006-07 Ist 2.76 0.60 79 0.52 0.89 1.41 132
2007-08 Iind 0.00 0.00 0 0.00 0.77 0.77 0
2008-09 IIIrd 2.76 1.36 158 0.00 3.40 3.40 116
2009-10 Ivth 2.76 0.81 131 0.33 1.63 1.96 162
2010-11 Vth 2.76 1.34 156 0.59 2.54 3.13 116
2011-12 Current 2.75 1.40 176 0.22 1.95 2.17 126
57 Hiwara 9.6 2231 2006-07 Ist 9.60 5.19 679 0.09 2.26 2.35 131
2007-08 Iind 3.78 1.46 262 0.52 5.42 5.94 179
2008-09 IIIrd 9.60 6.59 844 0.20 4.86 5.06 128
2009-10 Ivth 9.60 6.17 747 1.30 6.05 7.35 121
2010-11 Vth 9.60 6.26 768 1.23 7.65 8.88 123
2011-12 Current 9.48 7.74 962 1.50 6.99 8.49 124
58 Tondapur 4.64 1060 2006-07 Ist 4.63 0.35 113 0.02 3.15 3.17 323
2007-08 Iind 3.10 0.13 74 0.07 2.69 2.76 569
2008-09 IIIrd 0.98 0.00 0 0.00 1.52 1.52 0
2009-10 Ivth 0.63 0.00 0 0.00 3.81 3.81 0
2010-11 Vth 6.30 0.47 168 0.00 4.46 4.46 357
2011-12 Current 4.59 0.79 229 0.29 6.25 6.54 290
59 Kanoli 8.45 1363 2006-07 Ist 8.45 5.48 415 1.33 6.92 8.25 76
2007-08 Iind 8.45 8.32 890 1.21 0.41 1.62 107
2008-09 IIIrd 8.45 9.13 1331 1.03 2.46 3.49 146
2009-10 Ivth 8.45 3.13 944 1.08 2.10 3.18 302
2010-11 Vth 8.45 4.78 374 0.64 0.25 0.89 78
2011-12 Current 8.45 5.41 1976 1.98 5.51 7.49 365
60 Burai 14.21 2760 2006-07 Ist 14.21 13.73 2619 3.49 0.00 3.49 191
2007-08 Iind 14.21 12.90 3767 2.24 0.00 2.24 292
2008-09 IIIrd 14.21 12.57 2368 1.30 0.00 1.30 188
2009-10 Ivth 14.21 8.34 1127 2.00 3.18 5.18 135
2010-11 Vth 11.17 7.47 871 0.00 0.00 0.00 117
2011-12 Current 14.21 9.79 2590 5.45 0.00 5.45 265

Sr.
No.
Project Designed live
storage in
Mm3
ICA in
ha
Irrigation
Year
Year status Live
Storage as
on 15th oct
Water used
for irrigation
in Mm3
Irrigated
area in ha
Recovery
Irrigation
Rs. In lakhs
Recovery
Non-
Irrigation Rs.
In lakhs
Total recovery
Irrigation +
Non irrigation
in Lakhs
Annual
Water
supply
ha/Mm3.
1 2 3 4 5 6 7 8 9 10 11 12 13
61 Malangaon 11.33 1587 2006-07 Ist 11.32 7.90 1325 2.46 1.20 3.66 168
2007-08 Iind 11.33 8.34 1090 2.38 0.00 2.38 131
2008-09 IIIrd 11.33 7.35 921 1.55 1.81 3.36 125
2009-10 Ivth 11.33 8.18 1048 1.49 0.52 2.01 128
2010-11 Vth 11.23 9.77 952 2.46 0.72 3.18 97
2011-12 Current 10.96 8.18 3537 2.41 3.52 5.93 432
62 Panzra 35.63 6868 2006-07 Ist 35.63 22.98 4507 8.86 25.28 34.14 196
2007-08 Iind 35.63 21.89 2994 9.28 15.27 24.55 137
2008-09 IIIrd 35.63 25.93 3538 5.63 0.91 6.54 136
2009-10 Ivth 23.79 18.09 2011 4.96 0.50 5.46 111
2010-11 Vth 35.72 25.81 4994 2.19 0.51 2.70 193
2011-12 Current 35.30 24.94 18613 10.03 1.69 11.72 746
63 Aner 59.21 7180 2006-07 Ist 59.20 48.78 3286 14.07 0.00 14.07 67
2007-08 Iind 59.21 45.75 4360 11.01 0.00 11.01 95
2008-09 IIIrd 59.21 46.62 3106 11.00 0.00 11.00 67
2009-10 Ivth 59.20 22.48 3395 14.38 0.00 14.38 151
2010-11 Vth 59.20 25.47 3044 13.67 0.00 13.67 120
2011-12 Current 59.20 41.05 9864 12.89 0.00 12.89 240
64 Karwand 21.39 4534 2006-07 Ist 21.39 7.64 1281 4.70 13.41 18.11 168
2007-08 Iind 20.73 9.72 1612 3.00 9.58 12.58 166
2008-09 IIIrd 18.04 14.87 3145 2.87 11.09 13.96 211
2009-10 Ivth 20.73 15.77 1874 3.87 10.37 14.24 119
2010-11 Vth 20.73 15.44 1951 6.27 11.60 17.87 126
2011-12 Current 20.73 15.67 5378 9.98 4.05 14.03 343
65 Rangawali 12.89 3124 2006-07 Ist 12.89 14.83 1938 2.63 1.83 4.46 131
2007-08 Iind 12.89 12.16 2052 3.31 0.00 3.31 169
2008-09 IIIrd 12.89 14.55 2513 4.80 0.00 4.80 173
2009-10 Ivth 11.83 9.26 1179 3.44 0.00 3.44 127
2010-11 Vth 12.89 11.59 1206 4.49 2.50 6.99 104
2011-12 Current 12.89 12.89 3384 26.10 26.80 52.90 263

Sr.
No.
Project Designed live
storage in
Mm3
ICA in
ha
Irrigation
Year
Year status Live
Storage as
on 15th oct
Water used
for irrigation
in Mm3
Irrigated
area in ha
Recovery
Irrigation
Rs. In lakhs
Recovery
Non-
Irrigation Rs.
In lakhs
Total recovery
Irrigation +
Non irrigation
in Lakhs
Annual
Water
supply
ha/Mm3.
1 2 3 4 5 6 7 8 9 10 11 12 13
66 Haranbari 33.02 9726 2006-07 Ist 33.02 16.26 3089 5.54 8.07 13.61 190
2007-08 Iind 33.02 16.63 2924 4.30 27.27 31.57 176
2008-09 IIIrd 33.02 15.80 2554 3.28 21.64 24.92 162
2009-10 Ivth 29.26 14.48 3111 5.05 30.08 35.13 215
2010-11 Vth 33.02 16.37 3515 6.12 20.31 26.43 215
2011-12 Current 33.02 14.88 2495 5.98 5.36 11.34 168
67 Kelzar 16.20 3394 2006-07 Ist 16.20 6.26 1512 2.04 13.06 15.10 242
2007-08 Iind 16.09 7.50 1893 2.65 14.69 17.34 252
2008-09 IIIrd 16.20 10.72 1897 4.46 13.38 17.84 177
2009-10 Ivth 12.11 8.07 1812 2.64 12.59 15.23 225
2010-11 Vth 16.22 9.02 1887 3.59 7.07 10.66 209
2011-12 Current 12.42 8.42 3074 3.03 1.12 4.15 365
68 Nagyasakya 11.24 2400 2006-07 Ist 11.24 9.05 1265 1.37 0.00 1.37 140
2007-08 Iind 11.24 9.03 1638 3.09 0.00 3.09 181
2008-09 IIIrd 11.24 11.55 1372 3.50 0.00 3.50 119
2009-10 Ivth 1.27 8.97 1372 0.82 0.00 0.82 153
2010-11 Vth 11.24 8.82 1459 3.11 0.00 3.11 165
2011-12 Current 11.24 7.71 870 2.15 0.00 2.15 113
69 Alandi 27.46 6296 2006-07 Ist 27.46 20.64 2258 15.00 0.00 15.00 109
2007-08 Iind 27.46 21.66 2288 15.44 0.00 15.44 106
2008-09 IIIrd 27.46 21.02 2173 1.21 0.00 1.21 103
2009-10 Ivth 20.82 15.19 1949 11.06 0.00 11.06 128
2010-11 Vth 27.46 19.01 1851 7.48 0.00 7.48 97
2011-12 Current 27.46 20.98 2115 11.52 6.79 18.31 101
70 Bhojapur 10.21 4500 2006-07 Ist 10.10 7.90 829 2.90 2.77 5.67 105
2007-08 Iind 10.19 9.45 820 2.59 3.71 6.30 87
2008-09 IIIrd 10.11 16.65 982 0.04 0.00 0.04 59
2009-10 Ivth 2.38 8.81 1109 2.00 0.00 2.00 126
2010-11 Vth 10.13 6.81 798 1.66 5.91 7.57 117
2011-12 Current 5.41 0.00 0 0.41 4.72 5.13 0
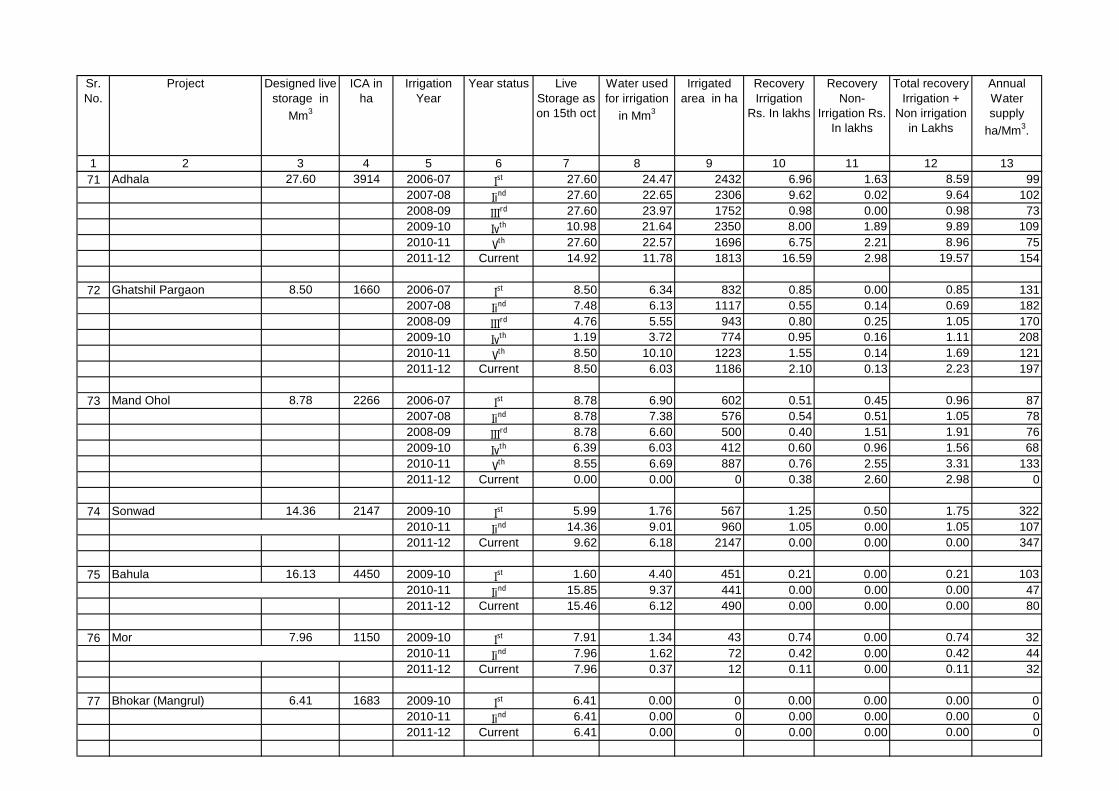
Sr.
No.
Project Designed live
storage in
Mm3
ICA in
ha
Irrigation
Year
Year status Live
Storage as
on 15th oct
Water used
for irrigation
in Mm3
Irrigated
area in ha
Recovery
Irrigation
Rs. In lakhs
Recovery
Non-
Irrigation Rs.
In lakhs
Total recovery
Irrigation +
Non irrigation
in Lakhs
Annual
Water
supply
ha/Mm3.
1 2 3 4 5 6 7 8 9 10 11 12 13
71 Adhala 27.60 3914 2006-07 Ist 27.60 24.47 2432 6.96 1.63 8.59 99
2007-08 Iind 27.60 22.65 2306 9.62 0.02 9.64 102
2008-09 IIIrd 27.60 23.97 1752 0.98 0.00 0.98 73
2009-10 Ivth 10.98 21.64 2350 8.00 1.89 9.89 109
2010-11 Vth 27.60 22.57 1696 6.75 2.21 8.96 75
2011-12 Current 14.92 11.78 1813 16.59 2.98 19.57 154
72 Ghatshil Pargaon 8.50 1660 2006-07 Ist 8.50 6.34 832 0.85 0.00 0.85 131
2007-08 Iind 7.48 6.13 1117 0.55 0.14 0.69 182
2008-09 IIIrd 4.76 5.55 943 0.80 0.25 1.05 170
2009-10 Ivth 1.19 3.72 774 0.95 0.16 1.11 208
2010-11 Vth 8.50 10.10 1223 1.55 0.14 1.69 121
2011-12 Current 8.50 6.03 1186 2.10 0.13 2.23 197
73 Mand Ohol 8.78 2266 2006-07 Ist 8.78 6.90 602 0.51 0.45 0.96 87
2007-08 Iind 8.78 7.38 576 0.54 0.51 1.05 78
2008-09 IIIrd 8.78 6.60 500 0.40 1.51 1.91 76
2009-10 Ivth 6.39 6.03 412 0.60 0.96 1.56 68
2010-11 Vth 8.55 6.69 887 0.76 2.55 3.31 133
2011-12 Current 0.00 0.00 0 0.38 2.60 2.98 0
74 Sonwad 14.36 2147 2009-10 Ist 5.99 1.76 567 1.25 0.50 1.75 322
2010-11 Iind 14.36 9.01 960 1.05 0.00 1.05 107
2011-12 Current 9.62 6.18 2147 0.00 0.00 0.00 347
75 Bahula 16.13 4450 2009-10 Ist 1.60 4.40 451 0.21 0.00 0.21 103
2010-11 Iind 15.85 9.37 441 0.00 0.00 0.00 47
2011-12 Current 15.46 6.12 490 0.00 0.00 0.00 80
76 Mor 7.96 1150 2009-10 Ist 7.91 1.34 43 0.74 0.00 0.74 32
2010-11 Iind 7.96 1.62 72 0.42 0.00 0.42 44
2011-12 Current 7.96 0.37 12 0.11 0.00 0.11 32
77 Bhokar (Mangrul) 6.41 1683 2009-10 Ist 6.41 0.00 0 0.00 0.00 0.00 0
2010-11 Iind 6.41 0.00 0 0.00 0.00 0.00 0
2011-12 Current 6.41 0.00 0 0.00 0.00 0.00 0

Sr.
No.
Project Designed live
storage in
Mm3
ICA in
ha
Irrigation
Year
Year status Live
Storage as
on 15th oct
Water used
for irrigation
in Mm3
Irrigated
area in ha
Recovery
Irrigation
Rs. In lakhs
Recovery
Non-
Irrigation Rs.
In lakhs
Total recovery
Irrigation +
Non irrigation
in Lakhs
Annual
Water
supply
ha/Mm3.
1 2 3 4 5 6 7 8 9 10 11 12 13
78 Ekrukh 61.16 6944 2006-07 Ist 12.98 2.89 482 2.51 33.82 36.33 167
2007-08 Iind 0.79 0.31 63 0.57 6.00 6.57 203
2008-09 IIIrd 61.15 6.71 1018 0.64 5.42 6.06 152
2009-10 Ivth 9.96 5.02 757 0.35 5.24 5.59 151
2010-11 Vth 50.33 5.70 1114 3.53 9.20 12.73 195
2011-12 Current 44.60 7.59 1791 5.36 11.57 16.93 236
79 Jawalgaon 2006-07 Ist 24.39 11.53 1339 2.50 1.54 4.04 116
2007-08 Iind 17.80 13.38 2137 3.09 3.99 7.08 160
2008-09 IIIrd 25.21 11.81 1656 0.37 3.79 4.16 140
2009-10 Ivth 19.18 13.33 1939 3.10 0.00 3.10 145
2010-11 Vth 29.18 10.73 1553 7.51 3.74 11.25 145
2011-12 Current 13.76 9.71 1944 6.95 3.21 10.16 200
80 Hingani (p) 31.97 6592 2006-07 Ist 31.97 17.71 2518 3.33 1.48 4.81 142
2007-08 Iind 31.97 21.77 3105 2.32 2.14 4.46 143
2008-09 IIIrd 31.97 10.93 1429 0.93 2.79 3.72 131
2009-10 Ivth 25.58 15.80 2452 1.65 1.81 3.46 155
2010-11 Vth 31.96 12.12 1800 1.65 1.81 3.46 149
2011-12 Current 31.96 18.60 3560 9.30 4.05 13.35 191
81 Budhihal 19.03 5578 2006-07 Ist 0.00 0.05 60 0.47 0.00 0.47 1111
2007-08 Iind 0.00 1.87 606 1.82 0.00 1.82 325
2008-09 IIIrd 3.70 2.13 1061 1.60 0.27 1.87 498
2009-10 Ivth -0.14 2.98 320 0.58 0.00 0.58 107
2010-11 Vth 0.00 0.73 305 2.41 0.00 2.41 418
2011-12 Current -4.10 0.00 0 0.00 0.00 0.00 0
82 Mangi 30.53 4646 2006-07 Ist 29.94 20.76 3127 4.95 0.68 5.63 151
2007-08 Iind 17.40 14.49 2026 6.07 7.06 13.13 140
2008-09 IIIrd 30.40 21.47 2997 0.49 3.19 3.68 140
2009-10 Ivth 27.91 18.01 2936 6.47 1.15 7.62 163
2010-11 Vth 30.40 18.79 3013 3.09 0.91 4.00 160
2011-12 Current 7.17 4.48 1490 3.00 0.90 3.90 333

Sr.
No.
Project Designed live
storage in
Mm3
ICA in
ha
Irrigation
Year
Year status Live
Storage as
on 15th oct
Water used
for irrigation
in Mm3
Irrigated
area in ha
Recovery
Irrigation
Rs. In lakhs
Recovery
Non-
Irrigation Rs.
In lakhs
Total recovery
Irrigation +
Non irrigation
in Lakhs
Annual
Water
supply
ha/Mm3.
1 2 3 4 5 6 7 8 9 10 11 12 13
83 Kasari 77.96 9995 2006-07 Ist 77.96 50.01 7063 19.81 3.81 23.62 141
2007-08 Iind 77.96 65.10 7437 16.92 6.13 23.05 114
2008-09 IIIrd 77.96 73.33 7963 26.74 6.13 32.87 109
2009-10 Ivth 77.96 57.50 8503 0.18 0.00 0.18 148
2010-11 Vth 77.97 70.28 87 33.00 0.00 33.00 1
2011-12 Current 77.97 77.75 5583 36.15 3.88 40.03 72
84 Patgaon 104.8 10000 2006-07 Ist 98.49 55.80 5170 14.18 5.25 19.43 93
2007-08 Iind 104.77 53.40 5376 13.48 22.74 36.22 101
2008-09 IIIrd 104.77 67.93 5146 38.90 15.83 54.73 76
2009-10 Ivth 105.99 49.91 5168 18.18 20.18 38.36 104
2010-11 Vth 105.02 45.84 5282 25.03 24.26 49.29 115
2011-12 Current 105.02 45.42 3131 37.79 24.94 62.73 69
85 Jangamhatti 33.21 4457 2006-07 Ist 31.88 28.24 5454 5.00 16.52 21.52 193
2007-08 Iind 26.87 26.74 4836 34.24 39.48 73.72 181
2008-09 IIIrd 33.21 33.21 4395 29.07 37.64 66.71 132
2009-10 Ivth 34.83 27.50 4714 36.62 8.42 45.04 171
2010-11 Vth 33.83 29.23 4502 20.28 13.70 33.98 154
2011-12 Current 33.83 31.89 3239 24.27 65.18 89.45 102
86 Kumbhi 76.5 9170 2006-07 Ist 60.58 37.79 4731 4.55 7.30 11.85 125
2007-08 Iind 68.08 52.47 4268 3.96 13.00 16.96 81
2008-09 IIIrd 76.50 65.67 5659 9.15 38.77 47.92 86
2009-10 Ivth 76.03 66.03 6031 8.73 6.85 15.58 91
2010-11 Vth 76.50 65.19 5733 9.42 12.05 21.47 88
2011-12 Current 76.50 65.90 3175 12.27 3.23 15.50 48
87 Chikotra 43.05 6863 2006-07 Ist 37.31 24.93 3688 19.45 4.75 24.20 148
2007-08 Iind 37.18 25.45 4085 17.36 0.89 18.25 161
2008-09 IIIrd 43.05 29.25 4221 16.00 4.50 20.50 144
2009-10 Ivth 32.89 24.20 4082 14.80 5.71 20.51 169
2010-11 Vth 37.79 28.44 4090 14.80 5.71 20.51 144
2011-12 Current 43.05 30.63 2988 23.67 2.27 25.94 98

Sr.
No.
Project Designed live
storage in
Mm3
ICA in
ha
Irrigation
Year
Year status Live
Storage as
on 15th oct
Water used
for irrigation
in Mm3
Irrigated
area in ha
Recovery
Irrigation
Rs. In lakhs
Recovery
Non-
Irrigation Rs.
In lakhs
Total recovery
Irrigation +
Non irrigation
in Lakhs
Annual
Water
supply
ha/Mm3.
1 2 3 4 5 6 7 8 9 10 11 12 13
88 Chitri 52.48 9160 2006-07 Ist 52.48 42.12 10578 12.58 19.91 32.49 251
2007-08 Iind 52.48 42.50 9136 44.83 40.49 85.32 215
2008-09 IIIrd 52.48 49.28 10339 48.34 35.19 83.53 210
2009-10 Ivth 53.41 45.50 8527 66.68 34.37 101.05 187
2010-11 Vth 52.48 46.37 9353 56.33 41.36 97.69 202
2011-12 Current 52.48 52.66 6528 53.71 34.74 88.45 124
89 Kadavi 70.56 9908 2006-07 Ist 70.56 15.22 1698 5.01 0.00 5.01 112
2007-08 Iind 70.56 22.98 2961 9.91 4.21 14.12 129
2008-09 IIIrd 70.56 22.93 2437 9.93 8.70 18.63 106
2009-10 Ivth 70.56 21.38 2328 8.78 4.43 13.21 109
2010-11 Vth 70.56 17 2473.00 13.66 18.09 31.75 145
2011-12 Current 70.56 19.18 1966 16.77 13.23 30.00 102
90 Vadiwale 30.39 4468 2006-07 Ist 30.39 21.33 2951 1.31 1.25 2.56 138
2007-08 Iind 29.90 22.04 3411 8.00 59.21 67.21 155
2008-09 IIIrd 30.39 30.08 6194 8.97 158.27 167.24 206
2009-10 Ivth 30.39 24.23 6584 10.20 195.60 205.80 272
2010-11 Vth 29.26 32.04 8066 7.25 182.38 189.63 252
2011-12 Current 28.75 30.75 5227 NA NA NA 170
91 Nher 11.79 2636 2006-07 Ist 11.79 4.26 735 2.14 0.39 2.53 173
2007-08 Iind 11.79 5.62 803 2.85 0.07 2.92 143
2008-09 IIIrd 3.46 0.00 0 0.00 0.43 0.43 0
2009-10 Ivth 11.79 6.05 827 2.10 2.12 4.22 137
2010-11 Vth 11.79 4.06 714 2.20 1.53 3.73 176
2011-12 Current 0.73 0.00 0 0.00 1.36 4.73 177
92 Ranand 6.42 1093 2006-07 Ist 6.42 2.14 291 0.95 0.00 0.95 136
2007-08 Iind 6.42 1.65 309 1.75 0.00 1.75 187
2008-09 IIIrd 6.42 2.37 427 0.80 0.00 0.80 180
2009-10 Ivth 6.42 2.38 442 1.35 0.00 1.35 186
2010-11 Vth 6.42 2.71 356 1.00 0.00 1.00 131
2011-12 Current 0.89 0.38 75 0.12 0.00 0.12 197
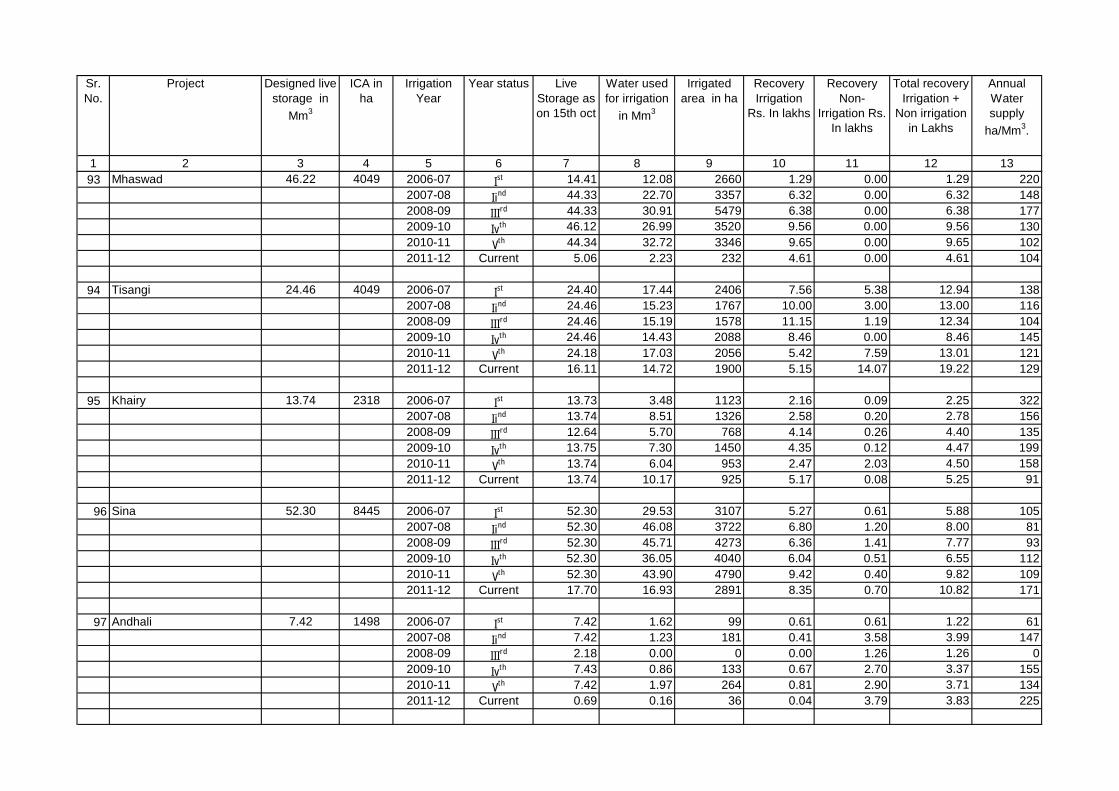
Sr.
No.
Project Designed live
storage in
Mm3
ICA in
ha
Irrigation
Year
Year status Live
Storage as
on 15th oct
Water used
for irrigation
in Mm3
Irrigated
area in ha
Recovery
Irrigation
Rs. In lakhs
Recovery
Non-
Irrigation Rs.
In lakhs
Total recovery
Irrigation +
Non irrigation
in Lakhs
Annual
Water
supply
ha/Mm3.
1 2 3 4 5 6 7 8 9 10 11 12 13
93 Mhaswad 46.22 4049 2006-07 Ist 14.41 12.08 2660 1.29 0.00 1.29 220
2007-08 Iind 44.33 22.70 3357 6.32 0.00 6.32 148
2008-09 IIIrd 44.33 30.91 5479 6.38 0.00 6.38 177
2009-10 Ivth 46.12 26.99 3520 9.56 0.00 9.56 130
2010-11 Vth 44.34 32.72 3346 9.65 0.00 9.65 102
2011-12 Current 5.06 2.23 232 4.61 0.00 4.61 104
94 Tisangi 24.46 4049 2006-07 Ist 24.40 17.44 2406 7.56 5.38 12.94 138
2007-08 Iind 24.46 15.23 1767 10.00 3.00 13.00 116
2008-09 IIIrd 24.46 15.19 1578 11.15 1.19 12.34 104
2009-10 Ivth 24.46 14.43 2088 8.46 0.00 8.46 145
2010-11 Vth 24.18 17.03 2056 5.42 7.59 13.01 121
2011-12 Current 16.11 14.72 1900 5.15 14.07 19.22 129
95 Khairy 13.74 2318 2006-07 Ist 13.73 3.48 1123 2.16 0.09 2.25 322
2007-08 Iind 13.74 8.51 1326 2.58 0.20 2.78 156
2008-09 IIIrd 12.64 5.70 768 4.14 0.26 4.40 135
2009-10 Ivth 13.75 7.30 1450 4.35 0.12 4.47 199
2010-11 Vth 13.74 6.04 953 2.47 2.03 4.50 158
2011-12 Current 13.74 10.17 925 5.17 0.08 5.25 91
96 Sina 52.30 8445 2006-07 Ist 52.30 29.53 3107 5.27 0.61 5.88 105
2007-08 Iind 52.30 46.08 3722 6.80 1.20 8.00 81
2008-09 IIIrd 52.30 45.71 4273 6.36 1.41 7.77 93
2009-10 Ivth 52.30 36.05 4040 6.04 0.51 6.55 112
2010-11 Vth 52.30 43.90 4790 9.42 0.40 9.82 109
2011-12 Current 17.70 16.93 2891 8.35 0.70 10.82 171
97 Andhali 7.42 1498 2006-07 Ist 7.42 1.62 99 0.61 0.61 1.22 61
2007-08 Iind 7.42 1.23 181 0.41 3.58 3.99 147
2008-09 IIIrd 2.18 0.00 0 0.00 1.26 1.26 0
2009-10 Ivth 7.43 0.86 133 0.67 2.70 3.37 155
2010-11 Vth 7.42 1.97 264 0.81 2.90 3.71 134
2011-12 Current 0.69 0.16 36 0.04 3.79 3.83 225

Sr.
No.
Project Designed live
storage in
Mm3
ICA in
ha
Irrigation
Year
Year status Live
Storage as
on 15th oct
Water used
for irrigation
in Mm3
Irrigated
area in ha
Recovery
Irrigation
Rs. In lakhs
Recovery
Non-
Irrigation Rs.
In lakhs
Total recovery
Irrigation +
Non irrigation
in Lakhs
Annual
Water
supply
ha/Mm3.
1 2 3 4 5 6 7 8 9 10 11 12 13
98 Kasarsai 16.25 4119 2006-07 Ist 15.82 15.85 1789 2.09 3.85 5.94 113
2007-08 Iind 14.94 13.07 2127 5.30 6.88 12.18 163
2008-09 IIIrd 16.06 14.11 3022 7.29 6.67 13.96 214
2009-10 Ivth 16.06 16.85 3475 4.11 3.30 7.41 206
2010-11 Vth 16.06 15.10 3614 4.38 4.02 8.40 239
2011-12 Current 16.06 15.82 3006 NA NA NA 190
99 Nazre 16.65 3195 2006-07 Ist 16.80 12.55 1946 12.60 49.80 62.40 155
2007-08 Iind 16.61 17.34 2451 12.73 51.30 64.03 141
2008-09 IIIrd 12.48 9.04 1632 7.44 43.31 50.75 181
2009-10 Ivth 16.62 13.85 2095 3.30 40.97 44.27 151
2010-11 Vth 16.65 15.48 2212 11.58 55.21 66.79 143
2011-12 Current 15.31 19.57 2343 NA NA NA 120
100 Visapur 25.61 5388 2006-07 Ist 25.61 31.74 5844 35.7 0.87 36.57 184
2007-08 Iind 25.61 24.65 5750 34.91 1.2 36.11 233
2008-09 IIIrd 25.61 29.9 6448 22.26 0.56 22.82 216
2009-10 Ivth 5.81 15.89 4812 28.7 5.54 34.24 303
2010-11 Vth 24.74 21.777 6041.4 20.71 2.24 22.95 277
2011-12 Current 16.27 25.73 5170 27.12 4.02 31.14 201
101 Shetphal 17.556 1920 2006-07 Ist NA 18.69 2126 12.07 0 12.07 114
2007-08 Iind NA 28.51 2011.4 15.28 0 15.28 71
2008-09 IIIrd NA 16.11 2371 13.65 0 13.65 147
2009-10 Ivth 16.93 14.753 2056 18.19 0 18.19 139
2010-11 Vth 16.93 14.496 1747 22.56 4.45 27.01 121
2011-12 Current 16.74 16.04 1519 NA NA NA 95
102 Wandri 35.94 4088 2006-07 Ist 35.94 27.53 1000 2.00 0.00 2.00 36
2007-08 Iind 33.16 26.56 620 1.96 0.00 1.96 23
2008-09 IIIrd 34.27 25.77 680 1.58 0.00 1.58 26
2009-10 Ivth 35.18 25.73 680 2.50 0.00 2.50 26
2010-11 Vth 34.98 19.59 394 2.69 0.00 2.69 20
2011-12 Current 33.78 19.47 601 1.93 0.00 1.93 31

Sr.
No.
Project Designed live
storage in
Mm3
ICA in
ha
Irrigation
Year
Year status Live
Storage as
on 15th oct
Water used
for irrigation
in Mm3
Irrigated
area in ha
Recovery
Irrigation
Rs. In lakhs
Recovery
Non-
Irrigation Rs.
In lakhs
Total recovery
Irrigation +
Non irrigation
in Lakhs
Annual
Water
supply
ha/Mm3.
1 2 3 4 5 6 7 8 9 10 11 12 13
103 Natuwadi 27.23 2050 2006-07 Ist 27.23 24.54 199 0.58 10.46 11.04 8
2007-08 Iind 26.37 24.89 125 0.17 6.53 6.70 5
2008-09 IIIrd 26.33 21.97 72 0.54 4.57 5.11 3
2009-10 Ivth 26.86 21.69 105 0.78 5.27 6.05 5
2010-11 Vth 26.90 24.40 126 0.08 3.39 3.47 5
2011-12 Current 26.53 22.41 84 0.08 5.90 5.98 4
104 Hetwane 144.98 1301 2006-07 Ist 75.29 2.81 95 0.18 135.69 135.87 34
2007-08 Iind 99.93 4.19 87 0.16 101.14 101.30 21
2008-09 IIIrd 124.67 4.48 125 0.50 93.38 93.88 28
2009-10 Ivth 132.36 9.54 140 0.48 88.77 89.25 15
2010-11 Vth 124.84 12.90 143 0.80 56.41 57.21 11
2011-12 Current 116.91 1.83 120 1.04 39.24 40.28 66
105 Kurnoor 32.28 3644 2006-07 Ist 20.26 14.16 1362 9.16 26.53 35.69 96
2007-08 Iind 32.28 22.11 1920 7.55 21.22 28.77 87
2008-09 IIIrd 32.28 19.99 1797 8.06 6.87 14.93 90
2009-10 Ivth 26.51 16.37 1486 10.06 3.79 13.85 91
2010-11 Vth 32.28 12.16 1462 1.41 3.50 4.91 120
2011-12 Current 22.18 11.02 1322 1.75 5.11 6.86 120
106 Khandala 5.24 830 2006-07 Ist 0.86 0.83 205 0.53 0.00 0.53 247
2007-08 Iind 3.17 2.42 569 0.53 0.00 0.53 235
2008-09 IIIrd 5.24 2.83 535 1.51 0.00 1.51 189
2009-10 Ivth 0.51 0.44 92 0.28 0.00 0.28 210
2010-11 Vth 2.22 3.59 491 0.20 0.00 0.20 137
2011-12 Current 2.69 2.13 442 0.60 0.00 0.60 208
107 Turori 6.2 830 2006-07 Ist 4.61 2.20 360 0.55 3.33 3.88 164
2007-08 Iind 6.20 2.20 488 0.55 3.33 3.88 222
2008-09 IIIrd 1.00 0.88 110 0.00 0.00 0.00 125
2009-10 Ivth 0.09 0.00 0 0.00 0.00 0.00 0
2010-11 Vth 6.20 2.58 293 0.00 0.00 0.00 114
2011-12 Current 1.55 0.22 60 1.34 2.29 3.63 273

Sr.
No.
Project Designed live
storage in
Mm3
ICA in
ha
Irrigation
Year
Year status Live
Storage as
on 15th oct
Water used
for irrigation
in Mm3
Irrigated
area in ha
Recovery
Irrigation
Rs. In lakhs
Recovery
Non-
Irrigation Rs.
In lakhs
Total recovery
Irrigation +
Non irrigation
in Lakhs
Annual
Water
supply
ha/Mm3.
1 2 3 4 5 6 7 8 9 10 11 12 13
108 Jakapur 7.96 1584 2006-07 Ist 1.81 1.39 185 0.47 0.00 0.47 133
2007-08 Iind 2.42 1.59 302 0.47 0.00 0.47 190
2008-09 IIIrd 0.00 0.00 0 0.00 0.00 0.00 0
2009-10 Ivth 0.00 0.00 0 0.00 0.00 0.00 0
2010-11 Vth 7.96 3.07 246 0.25 0.10 0.35 80
2011-12 Current 4.55 1.87 175 0.82 0.00 0.82 94
109 Mehakari 12.98 4048 2006-07 Ist 12.98 3.86 279 0.57 0.00 0.57 72
2007-08 Iind 8.60 6.53 560 0.18 0.00 0.18 86
2008-09 IIIrd 8.60 2.22 215 0.97 0.00 0.97 97
2009-10 Ivth 8.60 2.06 169 0.85 0.00 0.85 82
2010-11 Vth 8.60 4.62 516 2.14 0.00 2.14 112
2011-12 Current 0.00 0.00 0 0.00 0.00 0.00 0
110 Kadi 5.47 1084 2006-07 Ist 5.47 2.12 138 0.04 0.00 0.04 65
2007-08 Iind 5.21 3.11 312 0.04 0.00 0.04 100
2008-09 IIIrd 5.21 3.60 277 1.31 0.00 1.31 77
2009-10 Ivth 3.14 1.59 157 0.33 0.00 0.33 99
2010-11 Vth 5.85 3.00 191 0.40 0.00 0.40 64
2011-12 Current 1.99 0.66 75 0.15 0.00 0.15 114
111 Kada 8.56 1214 2006-07 Ist 8.55 1.70 176 0.03 0.34 0.37 104
2007-08 Iind 8.55 1.87 170 0.01 1.06 1.07 91
2008-09 IIIrd 8.55 2.38 249 0.52 1.91 2.43 105
2009-10 Ivth 8.55 1.32 243 0.50 0.00 0.50 184
2010-11 Vth 8.55 2.51 261 0.40 2.09 2.49 104
2011-12 Current 8.55 2.87 292 0.40 0.95 1.35 102
112 Galhati 13.84 2200 2006-07 Ist 13.84 4.86 328 0.25 0.00 0.25 68
2007-08 Iind 10.49 7.21 367 0.76 0.00 0.76 51
2008-09 IIIrd 7.90 5.90 411 1.40 0.00 1.40 70
2009-10 Ivth 11.84 5.18 638 1.09 0.00 1.09 123
2010-11 Vth 13.84 4.98 381 1.10 0.00 1.10 76
2011-12 Current 12.55 5.97 463 1.51 0.00 1.51 78

Sr.
No.
Project Designed live
storage in
Mm3
ICA in
ha
Irrigation
Year
Year status Live
Storage as
on 15th oct
Water used
for irrigation
in Mm3
Irrigated
area in ha
Recovery
Irrigation
Rs. In lakhs
Recovery
Non-
Irrigation Rs.
In lakhs
Total recovery
Irrigation +
Non irrigation
in Lakhs
Annual
Water
supply
ha/Mm3.
1 2 3 4 5 6 7 8 9 10 11 12 13
113 Karpara 24.9 2151 2006-07 Ist 24.83 6.93 816 0.79 2.49 3.28 118
2007-08 Iind 14.26 9.35 789 0.80 0.00 0.80 84
2008-09 IIIrd 8.37 3.00 934 0.00 0.00 0.00 311
2009-10 Ivth 24.33 8.37 1287 2.33 0.81 3.14 154
2010-11 Vth 24.90 7.75 1003 0.00 0.00 0.00 129
2011-12 Current 24.76 10.90 1145 0.00 0.00 0.00 105
114 Masoli 27.13 2591 2006-07 Ist 27.13 16.94 1776 2.02 2.31 4.33 105
2007-08 Iind 24.50 17.73 1376 1.69 4.27 5.96 78
2008-09 IIIrd 8.99 6.90 737 1.00 10.00 11.00 107
2009-10 Ivth 0.42 0.00 0 0.18 46.68 46.86 0
2010-11 Vth 27.14 15.72 1635 5.20 65.62 70.82 104
2011-12 Current 26.97 19.36 1699 0.18 46.68 46.86 88
115 Terna 19.66 1652 2006-07 Ist 19.63 8.60 1032 2.49 9.00 11.49 120
2007-08 Iind 19.39 6.88 1163 3.26 24.91 28.17 169
2008-09 IIIrd 19.66 7.64 1147 3.04 28.80 31.84 150
2009-10 Ivth 8.25 0.00 0 0.00 17.02 17.02 0
2010-11 Vth 19.66 5.53 942 2.48 2.63 5.11 170
2011-12 Current 16.80 6.41 675 3.04 28.80 31.84 105
116 Rui 8.61 1650 2006-07 Ist 6.47 2.14 371 0.00 1.80 1.80 173
2007-08 Iind 8.41 3.65 530 0.00 1.80 1.80 145
2008-09 IIIrd 8.41 1.51 583 0.07 0.00 0.07 386
2009-10 Ivth 1.90 0.00 0 0.00 3.37 3.37 0
2010-11 Vth 8.61 2.39 301 0.14 0.38 0.52 126
2011-12 Current 2.58 0.50 87 0.07 0.07 0.14 174
117 Raigavan 11.26 1700 2006-07 Ist 6.06 2.71 471 1.28 0.00 1.28 174
2007-08 Iind 4.21 1.33 379 1.88 0.00 1.88 285
2008-09 IIIrd 11.26 4.08 566 2.20 0.00 2.20 139
2009-10 Ivth 1.58 0.36 40 0.25 0.25 0.50 111
2010-11 Vth 11.26 4.50 570 0.57 0.00 0.57 127
2011-12 Current 6.41 3.33 683 0.00 0.00 0.00 205

Sr.
No.
Project Designed live
storage in
Mm3
ICA in
ha
Irrigation
Year
Year status Live
Storage as
on 15th oct
Water used
for irrigation
in Mm3
Irrigated
area in ha
Recovery
Irrigation
Rs. In lakhs
Recovery
Non-
Irrigation Rs.
In lakhs
Total recovery
Irrigation +
Non irrigation
in Lakhs
Annual
Water
supply
ha/Mm3.
1 2 3 4 5 6 7 8 9 10 11 12 13
118 Sukhna 18.49 2511 2006-07 Ist 18.49 8.57 1262 4.78 2.26 7.04 147
2007-08 Iind 16.28 7.87 1852 7.75 9.00 16.75 235
2008-09 IIIrd 9.79 8.90 1198 3.20 9.60 12.80 135
2009-10 Ivth 5.81 2.64 985 3.53 3.60 7.13 373
2010-11 Vth 12.37 9.88 977 7.50 3.26 10.76 99
2011-12 Current 8.03 4.05 1188 5.63 6.11 11.74 293
119 Girja 21.25 3443 2006-07 Ist 16.77 5.68 852 0.00 0.69 0.69 150
2007-08 Iind 11.91 5.54 1095 2.63 13.25 15.88 198
2008-09 IIIrd 15.60 12.10 1765 4.00 5.30 9.30 146
2009-10 Ivth 1.28 1.90 226 0.32 1.37 1.69 119
2010-11 Vth 21.23 6.18 976 1.92 3.73 5.65 158
2011-12 Current 11.50 2.65 388 1.11 3.96 5.07 146
120 Lahuki 5.21 1092 2006-07 Ist 4.31 2.81 412 0.06 0.00 0.06 146
2007-08 Iind 4.31 1.87 339 1.45 0.00 1.45 181
2008-09 IIIrd 4.31 1.20 479 1.50 3.00 4.50 399
2009-10 Ivth 1.10 0.45 145 0.44 0.48 0.92 322
2010-11 Vth 5.22 3.08 455 1.32 1.27 2.59 148
2011-12 Current 2.32 1.20 187 0.82 0.00 0.82 156
121 Dheku 11.53 2712 2006-07 Ist 10.13 2.86 631 0.01 0.00 0.01 221
2007-08 Iind 5.85 1.62 566 1.02 0.02 1.04 349
2008-09 IIIrd 9.99 3.00 768 1.30 0.00 1.30 256
2009-10 Ivth 9.38 2.55 355 0.18 0.18 0.36 139
2010-11 Vth 10.80 2.35 268 0.18 1.54 1.72 114
2011-12 Current 10.80 3.39 461 1.08 0.14 1.22 136
122 Kolhi 3.23 472 2006-07 Ist 2.84 1.81 235 0.00 3.39 3.39 130
2007-08 Iind 1.14 0.18 85 0.01 1.08 1.09 472
2008-09 IIIrd 2.92 2.40 222 0.70 0.10 0.80 93
2009-10 Ivth 0.74 0.55 135 0.06 1.08 1.14 245
2010-11 Vth 2.84 0.51 136 0.03 1.00 1.03 267
2011-12 Current 3.21 0.50 106 0.15 1.56 1.71 212

Sr.
No.
Project Designed live
storage in
Mm3
ICA in
ha
Irrigation
Year
Year status Live
Storage as
on 15th oct
Water used
for irrigation
in Mm3
Irrigated
area in ha
Recovery
Irrigation
Rs. In lakhs
Recovery
Non-
Irrigation Rs.
In lakhs
Total recovery
Irrigation +
Non irrigation
in Lakhs
Annual
Water
supply
ha/Mm3.
1 2 3 4 5 6 7 8 9 10 11 12 13
123 Ambadi 11.53 2147 2006-07 Ist 7.92 3.85 617 1.00 4.50 5.50 160
2007-08 Iind 0.00 0.04 118 0.69 7.67 8.36 2950
2008-09 IIIrd 9.42 2.50 471 0.70 10.20 10.90 188
2009-10 Ivth 7.06 2.28 377 0.21 2.26 2.47 165
2010-11 Vth 9.43 5.34 969 1.86 3.25 5.11 182
2011-12 Current 9.42 5.61 734 1.64 7.35 8.99 131
124 Khelna 11.07 2429 2006-07 Ist 11.07 3.27 887 2.85 4.65 7.50 271
2007-08 Iind 3.87 0.36 54 0.72 3.60 4.32 150
2008-09 IIIrd 3.81 0.00 0 0.10 19.60 19.70 0
2009-10 Ivth 11.07 4.18 958 2.57 2.00 4.57 229
2010-11 Vth 11.07 5.69 907 3.38 1.50 4.88 159
2011-12 Current 1.75 5.13 891 4.24 2.00 6.24 174
125 Gadadgad 4.64 1180 2006-07 Ist 3.61 1.79 432 3.89 0.00 3.89 241
2007-08 Iind 3.69 1.55 249 0.35 0.00 0.35 161
2008-09 IIIrd 4.64 1.70 405 2.20 2.00 4.20 238
2009-10 Ivth 4.64 1.64 427 0.05 0.00 0.05 261
2010-11 Vth 4.64 2.06 404 2.06 0.00 2.06 196
2011-12 Current 4.65 2.24 405 2.22 0.45 2.67 181
126 Ajantha Andhari 7.65 1576 2006-07 Ist 7.65 3.66 668 1.80 7.89 9.69 182
2007-08 Iind 2.84 0.83 84 0.08 6.22 6.30 101
2008-09 IIIrd 1.08 0.10 60 25.00 2.00 27.00 600
2009-10 Ivth 1.02 0.11 53 0.34 0.25 0.59 482
2010-11 Vth 5.65 3.42 262 0.24 4.14 4.38 77
2011-12 Current 5.87 2.58 346 1.53 3.53 5.06 134
127 Jui 6.03 2206 2006-07 Ist 6.03 1.89 303 1.28 0.75 2.03 160
2007-08 Iind 4.92 2.48 497 1.59 1.46 3.05 200
2008-09 IIIrd 2.60 0.00 0 0.50 2.50 3.00 0
2009-10 Ivth 1.38 0.23 30 0.00 3.00 3.00 130
2010-11 Vth 6.04 1.15 446 0.89 8.03 8.92 388
2011-12 Current 5.85 1.74 457 1.15 5.61 6.76 263

Sr.
No.
Project Designed live
storage in
Mm3
ICA in
ha
Irrigation
Year
Year status Live
Storage as
on 15th oct
Water used
for irrigation
in Mm3
Irrigated
area in ha
Recovery
Irrigation
Rs. In lakhs
Recovery
Non-
Irrigation Rs.
In lakhs
Total recovery
Irrigation +
Non irrigation
in Lakhs
Annual
Water
supply
ha/Mm3.
1 2 3 4 5 6 7 8 9 10 11 12 13
128 Jivrekha 6.13 1064 2006-07 Ist 6.13 3.45 583 1.97 0.00 1.97 169
2007-08 Iind 1.77 0.85 122 0.47 0.76 1.23 144
2008-09 IIIrd 5.14 4.00 543 1.90 1.40 3.30 136
2009-10 Ivth 0.00 0.00 0 0.00 0.00 0.00 0
2010-11 Vth 6.13 3.02 399 0.18 2.11 2.29 132
2011-12 Current 6.13 2.43 672 0.18 0.99 1.17 277
129 Dhamna 8.51 1280 2006-07 Ist 6.30 3.31 520 0.69 0.00 0.69 157
2007-08 Iind 1.60 2.24 428 0.37 1.72 2.09 191
2008-09 IIIrd 0.00 0.50 146 0.10 0.30 0.40 292
2009-10 Ivth 0.00 0.00 0 0.00 0.00 0.00 0
2010-11 Vth 5.05 1.71 555 0.49 4.96 5.45 325
2011-12 Current 7.87 2.40 555 1.12 2.34 3.46 231
130 Pir Kalyan 12.22 2020 2006-07 Ist 12.22 3.52 526 1.58 0.00 1.58 149
2007-08 Iind 6.40 1.17 523 2.62 6.45 9.07 447
2008-09 IIIrd 12.22 3.50 703 1.70 6.40 8.10 201
2009-10 Ivth -0.09 0.00 0 0.00 4.63 4.63 0
2010-11 Vth 10.39 2.55 408 0.24 1.15 1.39 160
2011-12 Current 6.06 2.31 367 0.55 4.15 4.70 159
131 Kalyan Girja 8.47 1377 2006-07 Ist 8.47 4.20 481 3.42 0.00 3.42 115
2007-08 Iind 5.37 2.09 402 1.64 0.00 1.64 192
2008-09 IIIrd 8.30 5.80 576 1.10 1.70 2.80 99
2009-10 Ivth 3.55 0.68 346 1.50 0.00 1.50 509
2010-11 Vth 8.47 1.44 464 1.05 0.00 1.05 322
2011-12 Current 8.47 2.60 413 0.20 0.09 0.29 159
132 Sakol 10.95 2064 2006-07 Ist 10.95 5.49 1152 2.95 0.00 2.95 210
2007-08 Iind 5.52 4.48 852 2.77 0.49 3.26 190
2008-09 IIIrd 8.34 4.85 970 4.10 0.00 4.10 200
2009-10 Ivth -0.56 0.00 0 0.61 0.19 0.80 0
2010-11 Vth 10.95 4.74 713 2.13 0.05 2.18 150
2011-12 Current 10.95 6.92 1070 2.59 0.20 2.79 155

Sr.
No.
Project Designed live
storage in
Mm3
ICA in
ha
Irrigation
Year
Year status Live
Storage as
on 15th oct
Water used
for irrigation
in Mm3
Irrigated
area in ha
Recovery
Irrigation
Rs. In lakhs
Recovery
Non-
Irrigation Rs.
In lakhs
Total recovery
Irrigation +
Non irrigation
in Lakhs
Annual
Water
supply
ha/Mm3.
1 2 3 4 5 6 7 8 9 10 11 12 13
133 Tawarja 20.34 3603 2006-07 Ist 17.30 8.38 1216 2.86 5.49 8.35 145
2007-08 Iind 11.55 7.89 1093 2.56 13.36 15.92 138
2008-09 IIIrd 18.42 8.87 674 3.38 19.80 23.18 76
2009-10 Ivth 1.38 0.00 0 2.59 9.53 12.12 0
2010-11 Vth 17.68 11.23 987 3.00 11.00 14.00 88
2011-12 Current 13.14 13.83 1186 4.86 11.59 16.45 86
134 Tiru 15.29 2348 2006-07 Ist 15.29 8.94 1160 3.08 0.00 3.08 130
2007-08 Iind 3.18 8.08 1195 2.41 0.00 2.41 148
2008-09 IIIrd 11.00 5.59 1036 5.21 6.00 11.21 185
2009-10 Ivth -4.22 0.00 0 0.94 0.00 0.94 0
2010-11 Vth 15.29 8.37 702 0.70 0.00 0.70 84
2011-12 Current 12.74 13.16 1048 2.94 5.92 8.86 80
135 Gharni 22.46 2234 2006-07 Ist 22.46 12.90 1231 7.45 2.20 9.65 95
2007-08 Iind 21.91 11.60 1440 5.34 3.00 8.34 124
2008-09 IIIrd 22.45 9.55 1236 5.60 1.50 7.10 129
2009-10 Ivth -1.46 0.00 0 1.41 0.00 1.41 0
2010-11 Vth 22.47 7.04 796 2.66 0.00 2.66 113
2011-12 Current 22.47 16.85 1506 7.84 0.00 7.84 89
136 Vati 8.27 1760 2006-07 Ist 8.03 5.50 459 3.05 0.14 3.19 83
2007-08 Iind 8.27 5.06 592 2.21 0.10 2.31 117
2008-09 IIIrd 8.27 4.08 641 1.93 3.22 5.15 157
2009-10 Ivth -0.61 0.00 0 0.71 0.00 0.71 0
2010-11 Vth 8.27 6.10 768 2.18 0.00 2.18 126
2011-12 Current 8.27 6.65 806 2.13 0.00 2.13 121
137 Masalga 13.59 1364 2006-07 Ist 9.64 2.81 80 0.25 0.00 0.25 28
2007-08 Iind 5.59 0.58 73 0.28 0.00 0.28 127
2008-09 IIIrd 3.18 0.40 76 0.95 0.00 0.95 190
2009-10 Ivth 0.00 0.00 0 0.07 0.00 0.07 0
2010-11 Vth 13.60 3.10 188 0.12 0.00 0.12 61
2011-12 Current 13.39 7.03 178 0.21 0.00 0.21 25

Sr.
No.
Project Designed live
storage in
Mm3
ICA in
ha
Irrigation
Year
Year status Live
Storage as
on 15th oct
Water used
for irrigation
in Mm3
Irrigated
area in ha
Recovery
Irrigation
Rs. In lakhs
Recovery
Non-
Irrigation Rs.
In lakhs
Total recovery
Irrigation +
Non irrigation
in Lakhs
Annual
Water
supply
ha/Mm3.
1 2 3 4 5 6 7 8 9 10 11 12 13
138 Devarjan 10.68 1882 2006-07 Ist 10.68 6.26 649 3.06 0.35 3.41 104
2007-08 Iind 3.98 3.50 627 2.48 0.00 2.48 179
2008-09 IIIrd 2.47 2.29 448 1.86 0.00 1.86 196
2009-10 Ivth -1.27 0.00 0 0.53 0.03 0.56 0
2010-11 Vth 10.68 3.69 562 0.44 0.15 0.59 152
2011-12 Current 10.68 2.72 882 2.10 0.45 2.55 324
139 Kundlika 37.69 2964 2006-07 Ist 37.69 15.10 1195 3.52 0.00 3.52 79
2007-08 Iind 37.69 7.48 787 0.79 5.43 6.22 105
2008-09 IIIrd 37.69 8.27 1195 3.70 5.20 8.90 144
2009-10 Ivth 37.69 8.28 911 0.00 19.49 19.49 110
2010-11 Vth 37.69 10.82 965 0.00 6.04 6.04 89
2011-12 Current 37.37 17.06 1257 NA NA 0.00 74
140 Wan (Beed) 19.34 5262 2006-07 Ist 19.34 6.22 682 1.91 16.30 18.21 110
2007-08 Iind 19.34 4.69 476 1.57 4.11 5.68 101
2008-09 IIIrd 19.34 9.17 743 1.63 24.09 25.72 81
2009-10 Ivth 16.44 4.17 472 0.00 9.76 9.76 113
2010-11 Vth 19.32 5.64 435 1.83 31.32 33.15 77
2011-12 Current 16.43 7.48 531 0.00 31.03 31.03 71
141 Kambli 3.1 972 2006-07 Ist 1.37 0.27 23 0.00 0.00 0.00 85
2007-08 Iind 1.37 1.27 120 0.00 0.00 0.00 94
2008-09 IIIrd 1.37 1.04 128 0.56 0.00 0.56 123
2009-10 Ivth 1.37 0.62 53 0.25 0.00 0.25 85
2010-11 Vth 1.37 0.50 60 0.17 0.00 0.17 120
2011-12 Current 1.37 0.00 35 0.13 0.44 0.57 0
142 Chandani 21.58 2024 2006-07 Ist 17.78 1.00 1308 1.00 41.00 42.00 1308
2007-08 Iind 13.66 13.95 1584 1.08 3.24 4.32 114
2008-09 IIIrd 16.18 12.47 1079 1.41 2.05 3.46 87
2009-10 Ivth 17.53 5.72 865 1.88 3.07 4.95 151
2010-11 Vth 18.21 9.65 913 1.88 2.51 4.39 95
2011-12 Current 0.82 1.76 193 0.55 3.79 4.34 110

Sr.
No.
Project Designed live
storage in
Mm3
ICA in
ha
Irrigation
Year
Year status Live
Storage as
on 15th oct
Water used
for irrigation
in Mm3
Irrigated
area in ha
Recovery
Irrigation
Rs. In lakhs
Recovery
Non-
Irrigation Rs.
In lakhs
Total recovery
Irrigation +
Non irrigation
in Lakhs
Annual
Water
supply
ha/Mm3.
1 2 3 4 5 6 7 8 9 10 11 12 13
143 Khasapur 13.04 2146 2006-07 Ist 13.04 8.92 1488 0.70 0.00 0.70 167
2007-08 Iind 13.04 8.91 1576 0.91 2.10 3.01 177
2008-09 IIIrd 13.04 7.99 1377 1.00 0.00 1.00 172
2009-10 Ivth 13.04 6.84 1051 1.04 1.85 2.89 154
2010-11 Vth 13.04 9.38 1272 1.04 1.85 2.89 136
2011-12 Current 7.23 3.95 790 0.26 1.34 1.60 200
144 Sakat 13.48 2355 2006-07 Ist 7.24 5.40 790 0.72 0.00 0.72 146
2007-08 Iind 6.96 4.45 870 1.16 0.00 1.16 195
2008-09 IIIrd 3.93 2.03 665 0.58 0.00 0.58 327
2009-10 Ivth 9.09 5.15 716 0.58 0.00 0.58 139
2010-11 Vth 13.48 8.15 958 0.58 0.00 0.58 118
2011-12 Current 6.40 4.13 480 0.15 0.60 0.75 116
145 Rooty 6.57 1862 2006-07 Ist 6.50 2.73 95 0.03 1.00 1.03 35
2007-08 Iind 6.57 3.13 151 0.09 1.06 1.15 48
2008-09 IIIrd 6.57 1.29 187 0.34 0.00 0.34 145
2009-10 Ivth 1.00 134 0.73 0.00 0.73 134
2010-11 Vth 10.28 2.04 223 1.00 0.00 1.00 109
2011-12 Current 0.17 0.00 0 0.00 0.61 0.61 0
146 Talwar 3.23 668 2006-07 Ist 3.23 0.90 63 0.04 0.00 0.04 70
2007-08 Iind 3.23 0.98 155 0.04 0.00 0.04 158
2008-09 IIIrd 3.23 1.30 140 0.26 0.00 0.26 108
2009-10 Ivth 2.01 0.77 86 0.13 0.00 0.13 112
2010-11 Vth 3.24 1.30 153 0.47 0.00 0.47 118
2011-12 Current 0.00 0.10 15 0.10 0.64 0.74 150
147 Banganga 4.96 906 2006-07 Ist 4.96 2.52 365 0.46 0.00 0.46 145
2007-08 Iind 3.99 2.43 430 0.47 0.00 0.47 177
2008-09 IIIrd 4.96 3.22 362 0.40 0.00 0.40 113
2009-10 Ivth 4.97 1.62 253 0.16 0.00 0.16 156
2010-11 Vth 4.96 3.49 432 0.16 0.00 0.16 124
2011-12 Current 2.67 2.64 216 0.15 0.00 0.15 82

Sr.
No.
Project Designed live
storage in
Mm3
ICA in
ha
Irrigation
Year
Year status Live
Storage as
on 15th oct
Water used
for irrigation
in Mm3
Irrigated
area in ha
Recovery
Irrigation
Rs. In lakhs
Recovery
Non-
Irrigation Rs.
In lakhs
Total recovery
Irrigation +
Non irrigation
in Lakhs
Annual
Water
supply
ha/Mm3.
1 2 3 4 5 6 7 8 9 10 11 12 13
148 Khandeshwar 8.78 1471 2006-07 Ist 7.76 5.42 886 0.97 0.00 0.97 163
2007-08 Iind 8.37 6.29 1047 1.30 0.00 1.30 166
2008-09 IIIrd 4.49 4.39 689 1.71 0.00 1.71 157
2009-10 Ivth 8.58 4.61 731 0.76 0.00 0.76 159
2010-11 Vth 8.78 5.63 774 0.67 0.00 0.67 137
2011-12 Current 2.92 2.32 347 0.86 0.00 0.86 150
149 Ramganga 5.34 963 2006-07 Ist 5.34 2.99 434 0.30 0.00 0.30 145
2007-08 Iind 4.54 3.77 493 0.88 0.00 0.88 131
2008-09 IIIrd 5.33 1.39 439 0.53 0.00 0.53 317
2009-10 Ivth 5.34 2.25 328 0.23 0.00 0.23 146
2010-11 Vth 5.34 4.55 410 0.23 0.00 0.23 90
2011-12 Current 3.58 2.50 373 0.52 0.15 0.67 149
150 Belpara 5.82 1093 2006-07 Ist 5.37 2.78 132 0.68 0.00 0.68 47
2007-08 Iind 5.37 3.41 119 0.60 0.00 0.60 35
2008-09 IIIrd 1.53 0.87 115 0.32 0.00 0.32 132
2009-10 Ivth 1.52 1.99 114 0.07 0.00 0.07 57
2010-11 Vth 5.82 3.86 175 0.66 0.00 0.66 45
2011-12 Current 5.82 3.84 270 0.40 0.00 0.40 70
151 Benitura 11.47 2293 2006-07 Ist 3.95 1.42 118 0.05 0.79 0.84 83
2007-08 Iind 5.47 2.72 261 0.25 3.81 4.06 96
2008-09 IIIrd 11.47 6.47 583 0.05 2.00 2.05 90
2009-10 Ivth 6.77 4.97 425 0.00 6.70 6.70 86
2010-11 Vth 11.47 6.64 394 0.25 9.00 9.25 59
2011-12 Current 6.77 2.75 160 0.40 17.20 17.60 58
152 Bindusara 7.112 1288 2006-07 Ist 7.11 1.32 192 0.88 8.00 8.88 145
2007-08 Iind 5.70 2.34 290 1.12 2.83 3.95 124
2008-09 IIIrd 7.11 2.30 216 0.10 1.35 1.45 94
2009-10 Ivth 7.11 1.73 204 0.81 15.58 16.39 118
2010-11 Vth 7.11 0.96 152 0.90 14.64 15.54 158
2011-12 Current 7.11 1.80 213 0.95 8.45 9.40 118

Sr.
No.
Project Designed live
storage in
Mm3
ICA in
ha
Irrigation
Year
Year status Live
Storage as
on 15th oct
Water used
for irrigation
in Mm3
Irrigated
area in ha
Recovery
Irrigation
Rs. In lakhs
Recovery
Non-
Irrigation Rs.
In lakhs
Total recovery
Irrigation +
Non irrigation
in Lakhs
Annual
Water
supply
ha/Mm3.
1 2 3 4 5 6 7 8 9 10 11 12 13
153 Bodhegaon 3.65 990 2006-07 Ist 3.72 1.19 85 1.46 0.00 1.46 71
2007-08 Iind 3.73 1.08 75 0.35 0.00 0.35 69
2008-09 IIIrd Nd 1.40 228 0.97 0.00 0.97 163
2009-10 Ivth 2.60 1.77 206 0.37 0.00 0.37 116
2010-11 Vth 3.65 1.82 183 1.17 0.00 1.17 101
2011-12 Current 3.65 2.63 175 0.32 0.00 0.32 67
154 Borna 8.972 1376 2006-07 Ist 8.97 3.66 384 0.23 0.00 0.23 105
2007-08 Iind 8.97 2.11 195 0.05 0.00 0.05 92
2008-09 IIIrd Nd 2.51 198 0.43 0.00 0.43 79
2009-10 Ivth 5.66 2.97 434 0.00 0.00 0.00 146
2010-11 Vth 8.97 3.69 442 0.17 0.00 0.17 120
2011-12 Current 8.74 4.98 472 0.00 13.92 13.92 95
155 Harni 11.17 1680 2006-07 Ist 4.99 3.77 287 0.00 0.00 0.00 76
2007-08 Iind 2.98 2.57 367 0.00 0.00 0.00 143
2008-09 IIIrd 11.17 5.21 705 0.20 0.00 0.20 135
2009-10 Ivth 2.49 2.03 298 0.10 0.00 0.10 147
2010-11 Vth 11.18 7.39 556 0.22 0.00 0.22 75
2011-12 Current 11.18 6.25 808 2.24 0.00 2.24 129
156 Mahasangvi 5.88 1943 2006-07 Ist 5.88 4.03 445 0.79 0.45 1.24 110
2007-08 Iind 5.88 4.17 427 0.92 0.24 1.16 102
2008-09 IIIrd 5.88 4.49 630 1.15 0.00 1.15 140
2009-10 Ivth 5.88 2.80 413 0.80 0.00 0.80 148
2010-11 Vth 5.88 2.84 508 0.62 1.51 2.13 179
2011-12 Current 5.74 3.32 334 0.06 1.51 1.57 101
157 Renapur 20.55 2445 2006-07 Ist 20.07 9.04 891 2.29 0.93 3.22 99
2007-08 Iind 8.13 3.79 501 0.71 0.51 1.22 132
2008-09 IIIrd 9.55 3.57 375 0.83 0.86 1.69 105
2009-10 Ivth 10.67 3.58 341 0.47 1.69 2.16 95
2010-11 Vth 18.24 10.61 604 0.45 0.96 1.41 57
2011-12 Current 17.77 12.61 1108 1.19 2.57 3.76 88

Sr.
No.
Project Designed live
storage in
Mm3
ICA in
ha
Irrigation
Year
Year status Live
Storage as
on 15th oct
Water used
for irrigation
in Mm3
Irrigated
area in ha
Recovery
Irrigation
Rs. In lakhs
Recovery
Non-
Irrigation Rs.
In lakhs
Total recovery
Irrigation +
Non irrigation
in Lakhs
Annual
Water
supply
ha/Mm3.
1 2 3 4 5 6 7 8 9 10 11 12 13
158 Sangameshwar 15.04 3350 2006-07 Ist 15.23 7.17 537 0.09 0.00 0.09 75
2007-08 Iind 15.03 7.52 1363 0.05 0.00 0.05 181
2008-09 IIIrd 15.04 6.95 1217 0.38 0.00 0.38 175
2009-10 Ivth 15.04 7.84 1010 0.96 0.00 0.96 129
2010-11 Vth 15.04 17.51 943 0.54 0.00 0.54 54
2011-12 Current 15.04 14.49 929 0.54 0.00 0.54 64
159 Saraswati 6.21 1230 2006-07 Ist 4.04 2.34 315 1.02 0.00 1.02 135
2007-08 Iind 6.07 2.88 468 1.70 0.00 1.70 163
2008-09 IIIrd Nd 3.72 480 1.19 0.00 1.19 129
2009-10 Ivth 5.36 2.60 280 1.41 2.55 3.96 108
2010-11 Vth 6.21 2.90 342 0.95 2.55 3.50 118
2011-12 Current 5.34 3.79 546 0.00 1.98 1.98 144
160 Sindphana 7.348 1782 2006-07 Ist 7.36 5.35 640 4.65 0.00 4.65 120
2007-08 Iind 7.36 4.45 748 5.40 0.00 5.40 168
2008-09 IIIrd 4.87 2.59 584 2.90 0.00 2.90 225
2009-10 Ivth 4.42 3.60 642 2.00 0.00 2.00 178
2010-11 Vth 7.35 5.65 549 367.00 0.00 367.00 97
2011-12 Current 7.35 4.19 489 3.15 3.95 7.10 117
161 Dongargaon (Nanded) 8.81 830 2006-07 Ist 8.47 5.43 609 0.71 0.00 0.71 112
2007-08 Iind 8.47 5.38 609 0.00 0.00 0.00 113
2008-09 IIIrd 8.47 4.49 610 1.54 0.00 1.54 136
2009-10 Ivth 6.17 0.00 10 0.00 0.00 0.00 0
2010-11 Vth 8.47 3.90 320 0.12 0.00 0.12 82
2011-12 Current 8.47 6.29 382 0.14 0.00 0.14 61
162 Loni 8.38 1377 2006-07 Ist 8.21 4.80 482 0.01 0.00 0.01 100
2007-08 Iind 8.12 4.41 558 1.55 0.00 1.55 127
2008-09 IIIrd 8.12 4.13 423 0.84 6.69 7.53 102
2009-10 Ivth 4.54 0.00 0 0.00 0.00 0.00 0
2010-11 Vth 8.38 1.26 119 0.04 0.00 0.04 94
2011-12 Current 8.20 5.21 157 0.12 0.00 0.12 30

Sr.
No.
Project Designed live
storage in
Mm3
ICA in
ha
Irrigation
Year
Year status Live
Storage as
on 15th oct
Water used
for irrigation
in Mm3
Irrigated
area in ha
Recovery
Irrigation
Rs. In lakhs
Recovery
Non-
Irrigation Rs.
In lakhs
Total recovery
Irrigation +
Non irrigation
in Lakhs
Annual
Water
supply
ha/Mm3.
1 2 3 4 5 6 7 8 9 10 11 12 13
163 Nagzari 6.56 960 2006-07 Ist 6.56 3.62 413 0.87 1.62 2.49 114
2007-08 Iind 6.45 4.38 440 1.72 3.58 5.30 101
2008-09 IIIrd 6.45 4.19 403 1.61 6.69 8.30 96
2009-10 Ivth 4.82 0.00 0 0.00 2.84 2.84 0
2010-11 Vth 6.44 3.13 381 0.00 3.67 3.67 122
2011-12 Current 6.38 4.01 405 0.08 2.98 3.06 101
164 Mahalingi 4.78 784 2006-07 Ist 3.05 3.29 703 0.49 0.00 0.49 214
2007-08 Iind 0.81 1.04 178 0.13 0.00 0.13 171
2008-09 IIIrd 1.29 1.18 176 0.00 0.00 0.00 149
2009-10 Ivth -0.70 0.00 0 0.00 0.00 0.00 0
2010-11 Vth 4.79 3.50 465 0.04 0.23 0.27 133
2011-12 Current 4.79 3.16 399 0.45 0.23 0.68 126
165 Pethwadaj 9.04 1478 2006-07 Ist 9.04 8.07 916 2.71 0.00 2.71 113
2007-08 Iind 9.04 7.21 807 2.46 0.00 2.46 112
2008-09 IIIrd 2.86 0.29 46 0.53 0.00 0.53 159
2009-10 Ivth 0.81 0.00 0 0.00 0.00 0.00 0
2010-11 Vth 9.04 6.83 748 0.21 0.00 0.21 109
2011-12 Current 9.05 8.25 592 0.16 0.09 0.25 72
166 Kudala 4.35 567 2006-07 Ist 4.35 3.14 685 1.27 0.00 1.27 218
2007-08 Iind 2.18 3.16 529 0.56 0.42 0.98 167
2008-09 IIIrd 4.29 3.77 484 1.76 5.66 7.42 128
2009-10 Ivth 1.42 0.78 111 0.00 1.90 1.90 142
2010-11 Vth 4.35 2.04 314 0.04 2.66 2.70 154
2011-12 Current 4.35 3.00 415 0.02 1.35 1.37 138
167 Karadkhed 11.01 1780 2006-07 Ist 11.01 5.61 621 1.19 2.73 3.92 111
2007-08 Iind 7.91 3.35 557 1.24 5.95 7.19 166
2008-09 IIIrd 7.78 4.17 543 2.95 8.38 11.33 130
2009-10 Ivth 4.53 0.00 0 0.00 4.90 4.90 0
2010-11 Vth 10.99 2.63 850 0.00 6.12 6.12 323
2011-12 Current 10.87 5.02 526 1.40 7.41 8.81 105

Sr.
No.
Project Designed live
storage in
Mm3
ICA in
ha
Irrigation
Year
Year status Live
Storage as
on 15th oct
Water used
for irrigation
in Mm3
Irrigated
area in ha
Recovery
Irrigation
Rs. In lakhs
Recovery
Non-
Irrigation Rs.
In lakhs
Total recovery
Irrigation +
Non irrigation
in Lakhs
Annual
Water
supply
ha/Mm3.
1 2 3 4 5 6 7 8 9 10 11 12 13
168 Kundrala 10.41 1012 2006-07 Ist 10.41 6.93 1259 0.46 1.87 2.33 182
2007-08 Iind 5.31 2.23 372 0.71 2.68 3.39 167
2008-09 IIIrd 3.65 1.51 301 1.59 3.47 5.06 199
2009-10 Ivth 2.50 0.27 125 0.00 1.08 1.08 463
2010-11 Vth 10.42 4.71 406 0.00 5.82 5.82 86
2011-12 Current 10.29 8.20 822 0.04 1.22 1.26 100
169 Anjana Palashi 2006-07 Ist 13.74 2.18 1386 0.50 1.00 1.50 636
2007-08 Iind 5.28 2.73 1147 1.19 1.67 2.86 420
2008-09 IIIrd 7.40 2.09 364 1.30 0.00 1.30 174
2009-10 Ivth 5.65 1.87 351 1.04 0.30 1.34 188
2010-11 Vth 13.74 2.51 309 0.60 2.19 2.79 123
2011-12 Current 13.42 4.71 568 0.47 0.66 1.13 121
170 Purna Nevpur 2006-07 Ist 9.34 2.07 1484 0.74 0.00 0.74 717
2007-08 Iind 5.11 2.86 1470 1.42 7.31 8.73 514
2008-09 IIIrd 9.34 5.39 1381 1.29 1.70 2.99 256
2009-10 Ivth 9.34 3.86 555 0.72 1.68 2.40 144
2010-11 Vth 9.34 3.49 524 0.60 3.42 4.02 150
2011-12 Current 9.34 2.42 529 0.72 0.91 1.63 219
171 Narangi 2006-07 Ist 11.39 3.38 916 0.00 0.00 0.00 271
2007-08 Iind 9.27 3.78 936 0.24 2.30 2.54 248
2008-09 IIIrd 11.39 0.95 384 0.22 1.77 1.99 404
2009-10 Ivth 0.00 0.00 0 0.00 3.83 3.83 0
2010-11 Vth 3.26 3.22 580 0.52 2.92 3.44 180
2011-12 Current 2.83 1.16 207 0.00 0.00 0.00 178
172 Tembhapuri 2006-07 Ist 19.01 2.89 1959 0.77 0.00 0.77 678
2007-08 Iind 7.23 3.10 1531 0.62 0.00 0.62 494
2008-09 IIIrd 14.85 1.00 145 0.60 1.37 1.97 145
2009-10 Ivth 14.17 2.73 501 1.93 4.28 6.21 184
2010-11 Vth 17.13 3.83 625 1.72 5.97 7.69 163
2011-12 Current 19.28 2.80 630 2.25 5.10 7.35 225

Sr.
No.
Project Designed live
storage in
Mm3
ICA in
ha
Irrigation
Year
Year status Live
Storage as
on 15th oct
Water used
for irrigation
in Mm3
Irrigated
area in ha
Recovery
Irrigation
Rs. In lakhs
Recovery
Non-
Irrigation Rs.
In lakhs
Total recovery
Irrigation +
Non irrigation
in Lakhs
Annual
Water
supply
ha/Mm3.
1 2 3 4 5 6 7 8 9 10 11 12 13
173 Shivana Takli 2006-07 Ist NA NA NA NA NA NA NA
2007-08 Iind 15.05 0.62 120 0.57 0.00 0.57 194
2008-09 IIIrd 34.85 7.59 542 0.73 0.00 0.73 71
2009-10 Ivth 19.10 5.45 432 0.90 0.17 1.07 79
2010-11 Vth 36.45 11.40 755 1.04 2.70 3.74 66
2011-12 Current 37.45 17.44 2083 6.96 2.09 9.05 119
174 Waghe Babhulgaon 3.74 769 2006-07 Ist NA NA NA NA NA NA NA
2007-08 Iind NA NA NA NA NA NA NA
2008-09 IIIrd NA NA NA NA NA NA NA
2009-10 Ivth 3.74 1.24 178 0.00 0.00 0.00 144
2010-11 Vth 3.74 1.95 172.00 0 3.82 3.82 0
2011-12 Current 3.74 1.34 118 0.06 4.49 4.49 0
175 Bor Dahegaon 11.47 1600 2006-07 Ist 11.47 1.90 135.00 0.00 0.00 NA NA
2007-08 Iind 2.98 1.50 209 0.00 0.00 0.00 139
2008-09 IIIrd 5.70 2.34 204 0.15 0.15 0.30 87
2009-10 Ivth 0.00 0.00 0 0.00 0.00 0.00 0
2010-11 Vth 11.42 2.85 513 0.18 0.00 0.18 180
2011-12 Current 6.40 3.42 173 0.00 0.00 0.00 51
176 Upper Dudhana 13.02 3401 2006-07 Ist 9.99 3.05 438.00 NA NA NA NA
2007-08 Iind 5.32 2.44 292 NA NA 0.00 120
2008-09 IIIrd 4.83 4.09 395 NA NA 0.00 97
2009-10 Ivth 0.84 1.20 231 0.05 0.92 0.97 193
2010-11 Vth 8.94 6.91 1007 2.09 2.86 4.95 146
2011-12 Current 8.20 5.97 805 3.46 1.81 5.27 135

Sr.
No.
Project Designed live
storage in
Mm3
ICA in
ha
Irrigation
Year
Year status Live
Storage as
on 15th oct
Water used
for irrigation
in Mm3
Irrigated
area in ha
Recovery
Irrigation
Rs. In lakhs
Recovery
Non-
Irrigation Rs.
In lakhs
Total recovery
Irrigation +
Non irrigation
in Lakhs
Annual
Water
supply
ha/Mm3.
1 2 3 4 5 6 7 8 9 10 11 12 13
177 Wakod 11.4 2217 2006-07 Ist 1.35 186.00 0.37 0.00 NA NA
2007-08 Iind 2.19 0.75 153 0.00 0.00 0.00 204
2008-09 IIIrd 3.46 0.17 50 0.17 0.00 0.17 294
2009-10 Ivth 0.00 0.00 0 0.00 0.00 0.00 0
2010-11 Vth 2.65 1.11 157 0.17 0.00 0.17 141
2011-12 Current 6.79 3.85 505 1.59 0.00 1.59 131
NOTE :
1 NA : Not available
2
3
4
Change in col.No.3 of designed live storage in respective years if any is due to revision in designed live storage capicity
In col. No.8 of water used for irrigation is more than col.No. 7 of live storage as on 15th Oct. of respective year is due to water utilisation in kharif.
Col.No.9 of irrigated area is more than Col.No.4 of ICA is due to increase of area in kharif seasion.

Chapter 8
BENCHMARKING OF WATER AND LAND MANAGEMENT INSTITUTE (WALMI), AURANGABAD
8.0 INTRODUCTION
WALMI, Aurangabad (Maharashtra) is a premier training institute for imparting the training on Irrigation Water Management. It is established on 1st October 1980 as an autonomous registered society under Water Resources Department, Government of Maharashtra.
8.1 OBJECTIVES
The main objectives of the institute are: ♦ To provide in-service training of interdisciplinary nature to staff engaged
in Irrigation Water Management and Land Development in Water Resources and Agriculture Departments
♦ Action and adaptive research pertaining to Irrigation Water management.
♦ Provide consultancy services and organizing farmers’ training programmes
Training is imparted by highly qualified, experienced and well-trained faculty
members. WALMI has five faculties namely:
♦ Faculty of Engineering ♦ Faculty of Agriculture ♦ Faculty of Science (Computer Applications & Hydraulics) ♦ Faculty of Social Sciences ♦ Faculty of Integrated Watershed Development & Management
The faculty consists of core faculty and senior field officers on deputation to
WALMI. It is one of the vital factors of this institute’s strength and performance. 8.2 BENCHMARKING OF WALMI
The benchmarking technique is introduced for the performance evaluation of the irrigation systems in the State of Maharashtra. Benchmarking is a continuous process of measuring one’s own performance and practices against the best competitors and is a sequential exercise of learning from other’s experience. The guidelines are available on the categories of performance indicators for Irrigation Systems. The benchmarking of WALMI, Aurangabad, which is a premier training institute in IWM is carried out by developing the performance indicators based on the activities of the institute. The performance is also compared with the requirement wherever possible.

WALMI has developed its own performance indicators on the basis of its functioning and objectives of the institute, as below: 1) Institutional performance 2) Qualitative performance 3) Environmental aspects 8.2.1 Institutional Performance
The institutional performance of the WALMI is assessed based on the following four indicators:
a) Annual training workload (trainee days)
The annual training workload is compared with the planned training workload and achievement for last five years average.
b) Annual training workload of long term courses (Participants)
The number of participants actually participated in long term courses (14 week’s duration) are compared with the potential strength of the long term courses for last five years average.
c) Annual Farmers’ training workload (Participants)
The number of participants actually participated in different farmer’s training programmes are compared with the average participants of last five years.
8.2.2 Qualitative Performance
The overall quality of institute’s activities is assessed based on the following
indicators: a) LTC Course evaluation b) Research activities c) Revisions & Development of publications d) Papers presented & published (state, national & international level)
8.2.3 Environmental Aspects
Environmental indicators will give information about involvement of participants in the training activities to acquire the knowledge, skills and attitudes for their jobs. It will also indicate the conduciveness of environment in the institute.
a) Referencing WALMI Library b) Visitors in WALMI

8.3 ASSESSMENT OF PERFORMANCE OF WALMI (YEAR 2011 – 2012)
(i) Annual training workload (trainee days)
Annual training workload (trainee days) in 2011-12 are the highest as compared to average workload of the last five years (Fig. 1). The average training workload of the last five years is about 32081. The actual training workload of last 5 years is ranging between 25786 to 35339. (ii) Annual training workload of long term courses (participants)
The number of participants actually attending the LTC for all the years were more than the planned strength (Fig. 2). This is because of efforts taken by the Institute and making it mandatory for all the nominated participants to attend the course.
(iii) Annual Farmers’ training workload (participants)
This indicator shows the year wise number of farmers participated in the courses during last five years (Fig. 3). In all the years up to 2008-09 the participation of farmers in the training programmes is more than the planned. However it is less than the planned from 2009 to 2012 due to poor response of farmers in MWSIP Courses. Special efforts are being taken to match the target number of farmers. More courses are planned on the field during 2012-13 for the farmers. (iv) End of course evaluation
In the method of end of course evaluation, the trainee officers are asked to give rating for various questions related to training. The average rating of end course evaluation for long term courses during 2011-2012 is 4.0 , which in near to 5 years average (Fig. 4). (v) Research activities
This activity is now taken up as supplemental activities along with the training activities of the Institute. (Fig. 5). The faculties are being motivated for taking up research projects.
(vi) Revisions & Development of publications
This can not be assessed exactly on yearly basis. The (Fig. 6 ) shows the actual status of this activity. (vii) Papers / Articles presented & published (state, national & international
level)
The total number of publications of papers/articles by the faculties are 6 which is less than the average publications of last five years (30). (Fig. 7). The faculties are being motivated in this regard.

(viii) Referencing WALMI Library
This indicates that use of library is increasing among the faculties, training participants and visitors (Fig. 8).
(ix) Visitors in WALMI
The visitors in WALMI are increasing each year which is a good indicator for the capabilities of the WALMI (Fig. 9).
Annual T raining Workload (T rainee days )
0
5000
10000
15000
20000
25000
30000
35000
40000
45000
F ig ure No.1
Tra
inee
day
s
P lanned 30630 24792 30302 30020 34572 30063 38393
A c hieved 25786 34366 34537 30377 35339 32081 35927
2006‐07 2007‐08 2008‐09 2009‐10 2010‐2011 5 Y rs A vg 2011‐12
Annual T raining Workload of L ong ‐term C ours es (L T C )(P artic ipants )
0
20
40
60
80
100
120
140
160
180
200
Par
ticip
ants
P lanned 120 120 160 160 160 140 160
A c hieved 151 181 174 175 163 170 162
2006‐07 2007‐08 2008‐09 2009‐10 2010‐11 5 Y rs Avg 2011‐12
F ig ure No.2

Annual F armers T raining Workload(P artic ipants )
0
1000
2000
3000
4000
5000
Par
ticip
ants
P lanned 480 1270 1970 2360 1578 1520 4625
A c hieved 658 2093 3990 1578 1195 2080 4084
2006‐07 2007‐08 2008‐09 2009‐10 2010‐11 5 Y rs Avg 2011‐12
F ig ure No.3
C ours e E valuation
0
1
2
3
4
5
Rat
ing
A v. R ating for L TC 4.06 4.23 3.99 3.99 4.5 4.07 4
2006‐07 2007‐08 2008‐09 2009‐10 2010‐11 5 Y rs Avg 2011‐12
F ig ure No.4
R es earc h Ac tiv ities
0
2
4
6
8
Nu
mb
er
R es earc h S tudies in hand 6 1 5 7 6 5 6
R es earc h S tudies c ompleted 3 3 1 4 1 3 2
2006‐07 2007‐08 2008‐09 2009‐10 2010‐11 5 Y rs Avg 2011‐12
F ig ure No.5
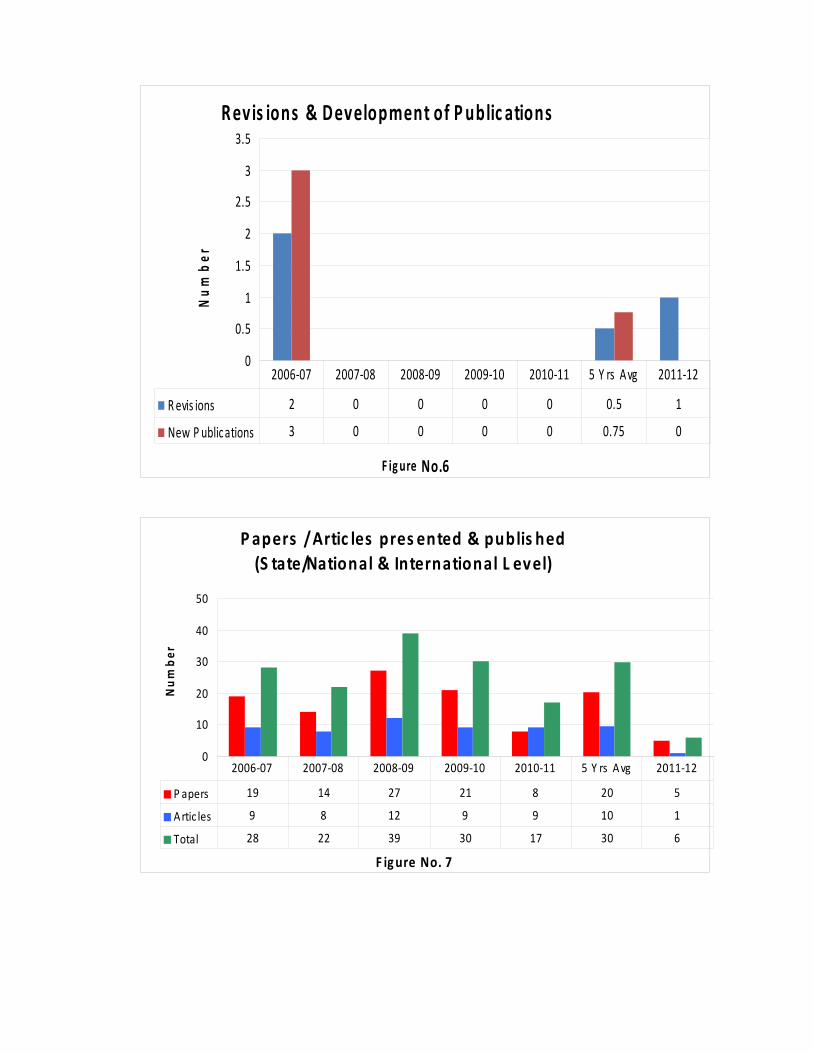
R evis ions & Development of P ublic ations
0
0.5
1
1.5
2
2.5
3
3.5
Nu
mb
er
R evis ions 2 0 0 0 0 0.5 1
New P ublic ations 3 0 0 0 0 0.75 0
2006‐07 2007‐08 2008‐09 2009‐10 2010‐11 5 Y rs A vg 2011‐12
F ig ure No.6
P apers / Artic les pres ented & publis hed(S tate/National & International L evel)
0
10
20
30
40
50
Nu
mb
er
P apers 19 14 27 21 8 20 5
Artic les 9 8 12 9 9 10 1
Total 28 22 39 30 17 30 6
2006‐07 2007‐08 2008‐09 2009‐10 2010‐11 5 Y rs A vg 2011‐12
F ig ure No. 7

R eferenc ing WAL MI L ibrary
0
5000
10000
15000
20000
25000
Nu
mb
er
R eading Material is s ued 2332 2113 1693 1355 2197 1873.25 1057
R eading material cons ulted 10374 17666 17292 12213 11869 14386.25 11214
Total 12706 19779 18985 13568 14066 16259.5 12271
2006‐07 2007‐08 2008‐09 2009‐10 2010‐11 5 Y rs Avg 2011‐12
F igure 8
Vis itors in WAL MI
0
1000
2000
3000
4000
5000
6000
Nu
mb
er
Offic ers & V IP s 465 160 45 425 55 274 161
S tudents 1845 3450 2900 2700 1996 2724 2500
F armers 2430 1750 1500 1600 1267 1820 1000
Total 4740 5360 4445 4725 3318 4818 3661
2006‐07 2007‐08 2008‐09 2009‐10 2010‐11 5 Y rs A vg 2011‐12
F ig ure 9

Chapter 9
BENCH MARKING OF
MAHARASHTRA ENGINEERING RESEARCH INSTITUTE, NASHIK
9.0 INTRODUCTION :
The setup of Maharashtra Engineering Research Institute, Nashik established
in April 1959. At present it comprises nine research divisions. The Institute is
headed by Director General.
The institute is largely dealing with basic research activities and field problems
of applied research pertaining to various projects. Being state Research Institute
its Jurisdiction is spread over the entire Maharashtra State covering Water
Resources and Public Works Department.
9.1 .1 OBJECTIVES : The main objectives of the institute are –
i) To provide facility of testing related with Quality Control. Services for
Testing of construction material like soil, Cement, Bricks, Tiles, R.C.C.
pipes, Aggregate, Steel, Rocks, asphalt and also concrete, masonry etc. is
provided for projects under Government and private schemes.
ii) To Study hydraulic performance of components of Irrigation projects as
per necessity to help the design organization. (Back water study & model
study)
iii) To provide services to field officers regarding instrumentation in dams.
iv) To act as a nodal agency regarding Seismic activities in the state.
v) To carry sedimentation survey for reservoirs.
vi) To provide services for crop mapping in commands of Irrigation Projects
using remote sensing method.
Applied / Basic research studies are carried out in the Institute related to the
points mentioned above.
9.1.2 Applied research problems are mainly referred by the field officers and Central
Design Organization. Problems of basic research are either “self sponsored” or

entrusted with the Institute by Government of India through various committees
related to Water Resources Department and Ministry of Surface Transport
(MOST), under different research schemes.
9.1.3 In addition to the usual activities of research and testing, this Institute has
following assignment:
a) Inspection of quality control laboratories established on Major and Medium
projects.
b) Periodical calibration of various equipments of the field laboratories.
c) Assistance to the Maharashtra Engineering Training Academy, Nashik by
delivering lectures, arranging practical and demonstrations, in the laboratories
of MERI to the trainees.
d) Compilation, editing and publication of “ स्थापत्य ” journal (“Sthapatya”)
e) Compilation, editing and publication of Seismicity Journals.
f) Participating in the activities at the Indian Standards Institute, CBIP, IRC, New
Delhi. Etc.
The nine research divisions in the Institute are as follows:
1) Hydrodynamics Research division No.1
2) Reservoir Sedimentation Survey Division.
3) Soil Mechanics Division No.1
4) Material Testing Division.
5) Structural Research and Physics Division.
6) Seismic Data and Analysis Division.
7) Instrumentation Research Division.
8) Remote Sensing and Geo-Informatics Division.
9) Highway Research Division No.1

9.2 BENCHMARKING OF MERI
9.2.1 Performance Indicators.
Benchmarking is a systematic process for securing continual improvement
through comparison with relevant and achievable internal or external norms and
standards. The overall aim of Benchmarking is to improve the performance of an
organization as measured against its mission and objectives. Benchmarking
implies comparison either with previous performance and desired future targets,
or performance of similar organization, performing similar functions.
MERI, being Research Institute has developed its own performance indicators
named as below:
i. Basic / Applied study
ii. Testing work
iii. Technical Research Paper
iv. Expenditure and Revenue, Earned.
Performance of MERI during last five years against norms is shown below in
the form of graphs.

2007-08 2008-09 2009-10 2010-11 2011-120
10
20
30
40
50
60
70
36
27
3932
65
BASIC / APPLIED STUDY
YEAR
NO
S
Norms (31 Nos)
2007-08 2008-09 2009-10 2010-11 2011-120
2000
4000
6000
8000
10000
12000
14000
16000
18000
14634 13990
16053
13568
11321
TESTING WORKS
YEAR
NO
S
Norms (13200 Nos)

2007-08 2008-09 2009-10 2010-11 2011-120
2
4
6
8
10
12
14
16
9
15
4
6
14
TECHNICAL PAPERS
YEAR
NO
S Norms (4 Nos)
2007-08 2008-09 2009-10 2010-11 2011-120
200
400
600
800
1000
1200
1400
1600
1800
1092.46 1028.74
1386.28
1704.45 1622.56
154.48353.02
149.13
477.96304.87
EXPENDITURE & REVENUE(Norms for Revenue=15% of Expenditure)
YEAR
EX
PE
ND
ITU
RE
& R
EV
EN
UE
14.1
4 %
14.1
4 %
34.3
2 %
10.7
6 %
28.0
4 %
18.7
9 %
14.1
4 %

Chapter 10
BENCH MARKING OF
MAHARASHTRA ENGINEERING TRAINING ACADEMY (META), NASHIK
10.0 INTRODUCTION:-
A proposal to establish a staff training college was initiated as long back as
1959. As the activities of the two departments of Irrigation & Planning and Building &
Construction went on increasing and expanding after the adoption of 5 year plans, the
need for meeting the shortage of trained technical staff became more and more
acute. The directly recruited Engineering officers were being trained by attaching
them to various Circles and Divisions. However, due to heavy workload and
increasing responsibilities in the field , proper attention to the systematic training of
these new recruits was not possible and they had to be left on their own study, learn
and pickup things by themselves. This was not considered to be a desirable feature
and hence the two Engineering departments (I&P and B&C) therefore decided to
systemize the training by establishing Staff training college.
Engineering Staff College, Nasik was opened on 20th May, 1964 to work on
seasonal basis to impart training to direct recruits of Maharashtra Service of
Engineers Class I and II & also promotees to these cadres vide government
Resolution No. TGO/4357/66258-E (4) dated 8th July 1964. First such course
proposed for the purpose was of 3 months duration. It started on 17th July, 1964 and
was inaugurated by Hon. Shri. Shankarrao Chavan, Minister I&P and B&C
Department. The college remained functioning up to 31st January 1965. It however
was reviewed again for second course for MSE Class I & II direct recruit and started
functioning from 4th May, 1965 as per orders contained in GR No.TGO 1063/40350-
E(4) dated 26th April 1965 and has since then being working continuously all the year
round.
Three regional training centres were established at Aurangabad, Nagpur in the
year 1983 and at Pune in the year 1984 headed by Executive Engineer and Principal.
The Regional Training Centre at Aurangabad and Nagpur is headed by Executive
Engineer (Civil) and Regional Training Centre at Pune is headed by Executive

Engineer (Mech.) from Water Resources Department. In the beginning only training
part was looked after by this Institute. In due course the work of Professional
Examination was also allotted to this Institute. In the year 1987 one post of
Superintending Engineer from WRD was elevated to Chief Engineer and the whole
Institute was brought under his control. In the year 1999 Govt. of Maharashtra,
Irrigation Dept., vide Resolution No. CRI 1098/13/99/P5/Mantralaya Mumbai 32 dated
1st Feb.1999 created new post of Director General MERI Nashik and Engineering
Staff College Nashik was brought under his control. In the year 2007, the name of the
Engineering Staff College was changed as Maharashtra Engineering Training
Academy with effect from 08/01/2007.
PROFESSIONAL EXAMINATION SECTION M.E.TA., NASHIK
The Professional Examination for AEE/SDE/SDO/AE-I/Junior Engr./Civil Engr.
Assistants are conducted by Maharashtra Engineering Training Academy (META),
Nashik. The examination for AEI/DE are being held since 1982. While Junior
Engineers examination is held since 1984. The Departmental examination for Civil
Engineering Assistants are held by META since 2004.
The professional Examination for D.E. & J.E. level are conducted for Civil,
Mechanical & Electrical wings of Water Resources & Public Work Departments. The
Engineers from Z.P./ Corporation / M.I.D.C. also an appear for these examination by
paying examination fee. The above examination are conducted according to the rules
mentioned in Public works manual (1984 edition)
Every newly appointed Engineer has to pass the professional examination
within stipulated time period of 3 years.
10.1 OBJECTIVES : The objectives can be summarized as under,
• To impart fundamental training to the University graduates recruited to
Maharashtra Service Engineers Class-I and II through Maharashtra Public
Service Commission so as to supplement their university education with
knowledge of rules, procedures and practical working of the two
Engineering departments.

• To train officers promoted from the ranks of Assistant Engineer Gr.II /
Sectional Engineer to gazette posts.
• To impart fundamental training to the overseers within one year of
appointment with the same objectives as for M.S.E. class I and II recruits.
• To refresh and update the knowledge of in service Engineers from Junior
Engineer to Superintending Engineer in subjects of prime importance viz.
soil mechanics, concrete, masonry , administration and management etc.
as per the requirement.
• To conduct the professional examinations for in-service technical officers
of WRD and PWD.
10.2 TRAINING COURSES CONDUCTED BY META
The calendar of META for training courses starts from 1st June to 31st July of
every year. In general 50 to 60 courses for Sub Divisional Engineer/ officers and
above cadres are conducted at META Nashik whereas average 50 courses are
conducted at Regional Training Centres at Pune, Aurangabad and Nagpur for
Assistant Engr. Grade II, Sectional Engineers and Junior Engineers. The subjects /
topics covered in training courses are generally 50% technical and 50% non technical
which cover Personal Management, Administration, Advance Management, Finance
and Accounts.
10.3 BENCH MARKING OF META 10.3.1 Performance Indicators. Benchmarking is a systematic process for securing continual improvement
through comparison with relevant and achievable internal or external norms and
standards. The overall aim of Benchmarking is to improve the performance of an
organization as measured against its mission and objectives. Benchmarking implies
comparison either with previous performance and desired future targets, or
performance of similar organization, performing similar functions.
Performance of META during last five years against norms is shown below in the form
of graphs.

Statement showing the Nos. of training courses and Nos. of Engrs. trained.
Year META Nasik
RTC A.bad
RTC Nagpur
RTC Pune
No. of training courses
No. of Engineers
trained 2006-07 64 46 36 37 183 5940
2007-08 80 33 41 39 193 6760
2008-09 71 44 50 52 217 8618
2009-10 59 35 41 41 176 6133
2010-11 79 28 41 43 191 7244
2011-12 46 35 48 48 177 7822
PROFESSIONAL EXAMINATION SECTION M.E.TA., NASHIK
The Professional Examination for Deputy Engineer / Junior Engineer are
conducted for newly appointed engineer in order to assess their technical capability
for working in respective Govt.Departments. The main objective of these examination
is to make these engineers technically perfect in order to work more efficiently on
field.
PROFESSIONAL EXAMINATION FOR AEE/ AE-I / DY.ENGR. (LAST 5 YRS. EXAMINATION )
YEAR TOTAL ADMITTED CANDIDATES TOTAL PASSED CONDIDATE
2008 - Exam was not held. 2009 198 137 2010 151 81 2011 103 63 2012 245 189

PROFESSIONAL EXAMINATION FOR Jr. ENGINEER (LAST 5 YRS.
EXAMINATION )
YEAR TOTAL ADMITTED CANDIDATES
TOTAL PASSED CONDIDATE
2007 - - 2008 761 119 2009 - - 2010 955 257 2011 1296 577 2012 Result Awaited


APPENDICES

Appendix-I
Abstract of guidelines issued by GOM for Benchmarking of Irrigation Projects
Governments of Maharashtra, Water Resources Department vide Letter No.
CDA 1004/(369/2004) CAD (works) dated 08.11.2004 issued guidelines while preparing Benchmarking report for the year 2003-04. Subsequently, additional instructions for the year 2004-05 were issued vide letter No. CDA 1004/ (369/2004) CAD – works dated 2.9.2005. Following procedure is adopted for preparation of benchmarking report (2011-12) based on guidelines.
1) Benchmarking is taken in hand after validation of data and linking it with
water audit data of the respective year. 2) The major, medium & minor Projects having 5 year data are considered for
2011-12 BM report. 3) Indicators No. IX Man days for O & M per unit area is deleted as per
suggestion of core group. 4) In equity performance the head, middle and tail reaches are decided
dividing the command area in to three equal parts. 5) Potential Utilised and Created is linked with availability of water. Effective
potential of each project is decided based on availability of water for irrigation during the year.
6) Agricultural output is calculated at 1998-99 prices. 7) Ind X of Land Damage Index is deleted as per the instructions issued by core group vide letter no. CDA-2010/(543/10)CAD(Works) Dated 4-07-12, para no.4.
The five year average values from 2006-07 to 2010-11 and values for 2010-
11 are considered for comparison, for all the indicators. Absurd (nil or very high values) are not considered while calculating the average.
Revenue means the actual recovery from Irrigation, non-irrigation water cess,
fishery, galper, tourism etc.
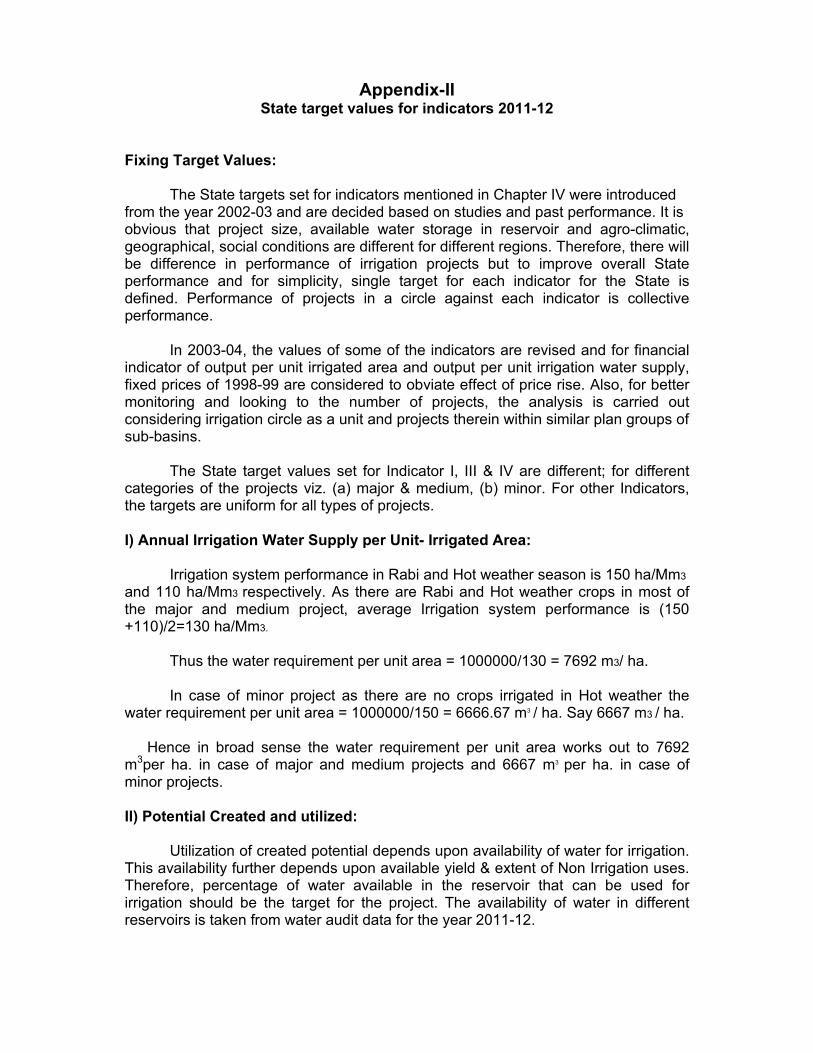
Appendix-II State target values for indicators 2011-12
Fixing Target Values:
The State targets set for indicators mentioned in Chapter IV were introduced from the year 2002-03 and are decided based on studies and past performance. It is obvious that project size, available water storage in reservoir and agro-climatic, geographical, social conditions are different for different regions. Therefore, there will be difference in performance of irrigation projects but to improve overall State performance and for simplicity, single target for each indicator for the State is defined. Performance of projects in a circle against each indicator is collective performance.
In 2003-04, the values of some of the indicators are revised and for financial
indicator of output per unit irrigated area and output per unit irrigation water supply, fixed prices of 1998-99 are considered to obviate effect of price rise. Also, for better monitoring and looking to the number of projects, the analysis is carried out considering irrigation circle as a unit and projects therein within similar plan groups of sub-basins.
The State target values set for Indicator I, III & IV are different; for different
categories of the projects viz. (a) major & medium, (b) minor. For other Indicators, the targets are uniform for all types of projects. I) Annual Irrigation Water Supply per Unit- Irrigated Area:
Irrigation system performance in Rabi and Hot weather season is 150 ha/Mm3
and 110 ha/Mm3 respectively. As there are Rabi and Hot weather crops in most of the major and medium project, average Irrigation system performance is (150 +110)/2=130 ha/Mm3.
Thus the water requirement per unit area = 1000000/130 = 7692 m3/ ha.
In case of minor project as there are no crops irrigated in Hot weather the
water requirement per unit area = 1000000/150 = 6666.67 m3 / ha. Say 6667 m3 / ha.
Hence in broad sense the water requirement per unit area works out to 7692 m3per ha. in case of major and medium projects and 6667 m3 per ha. in case of minor projects. II) Potential Created and utilized:
Utilization of created potential depends upon availability of water for irrigation. This availability further depends upon available yield & extent of Non Irrigation uses. Therefore, percentage of water available in the reservoir that can be used for irrigation should be the target for the project. The availability of water in different reservoirs is taken from water audit data for the year 2011-12.

III) Output per unit area:
The target is decided based on five years experience in 2004-05. The same targets are used for 2011-12.
The category wise values( Rs./ha) for different plan groups are as follows.
Plan group Major Medium Minor
Highly deficit 21000 23000 16000
Deficit 23000 25000 21000
Normal 26000 25000 21000
Surplus 25000 31000 27000
Abundant 32000 40000 36000
IV) Output per unit Water Supply (Rs./Cum):
Plan group Major Medium Minor
Highly deficit 2.69 2.80 2.40
Deficit 2.99 3.15 3.15
Normal 3.38 3.15 3.15
Surplus 3.25 4.05 4.05
Abundant 4.16 5.40 5.40
V) Cost Recovery Ratio:
Target is same for all categories and it is 1.
VI) Total O & M Cost Per Unit Area ( Rs./ha): Total O & M cost includes maintenance cost as well as operation cost of the
irrigation system. M & R charges are considered as per Govt. norms and establishment charges are taken for staff working in a section office for irrigation water management.
Major Medium MinorM & R 200 150 100Establishment charges 1050 1050 1050Total 1250 1200 1150
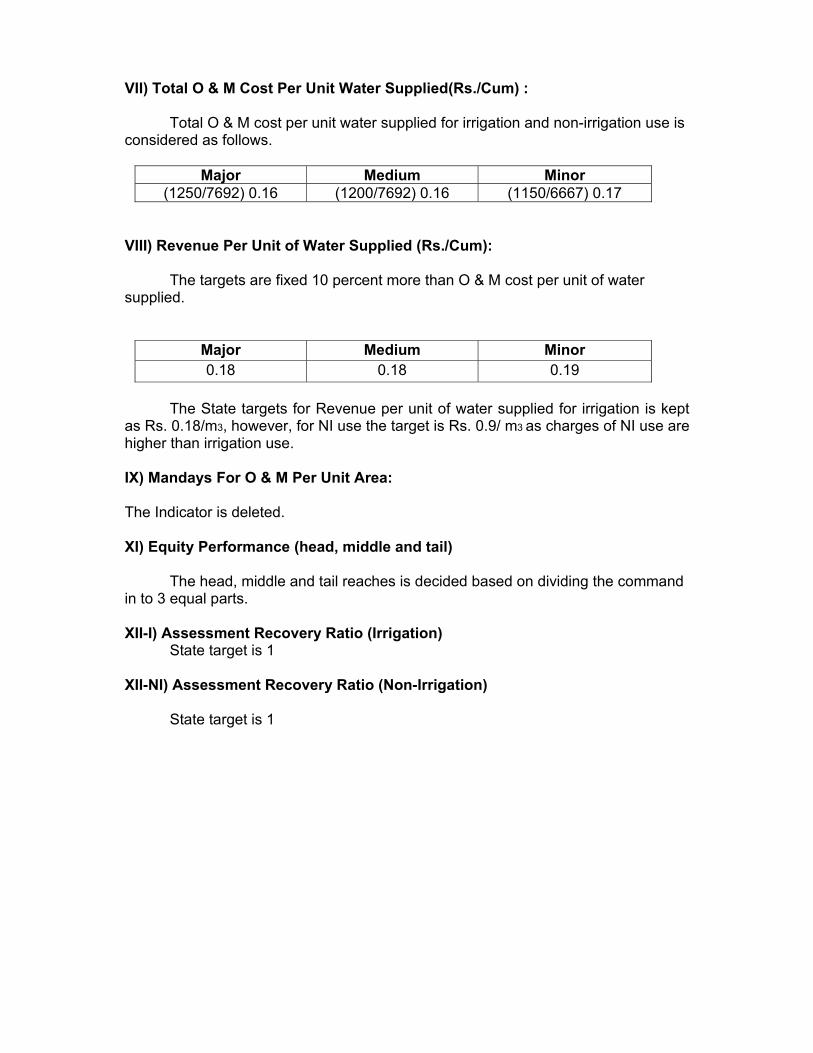
VII) Total O & M Cost Per Unit Water Supplied(Rs./Cum) :
Total O & M cost per unit water supplied for irrigation and non-irrigation use is considered as follows.
Major Medium Minor (1250/7692) 0.16 (1200/7692) 0.16 (1150/6667) 0.17
VIII) Revenue Per Unit of Water Supplied (Rs./Cum):
The targets are fixed 10 percent more than O & M cost per unit of water supplied.
Major Medium Minor 0.18 0.18 0.19
The State targets for Revenue per unit of water supplied for irrigation is kept
as Rs. 0.18/m3, however, for NI use the target is Rs. 0.9/ m3 as charges of NI use are higher than irrigation use.
IX) Mandays For O & M Per Unit Area: The Indicator is deleted. XI) Equity Performance (head, middle and tail)
The head, middle and tail reaches is decided based on dividing the command in to 3 equal parts.
XII-I) Assessment Recovery Ratio (Irrigation)
State target is 1
XII-NI) Assessment Recovery Ratio (Non-Irrigation)
State target is 1

Appendix-III
Indicator wise average performance calculations
Indicator
Assumptions
Indicator – I: Zero value and values exceeding 3 times the State target are excluded.
Indicator – I a: –do-
Indicator – II: Zero value is excluded and values exceeding State
target are considered as 1.
Indicator – III: Values exceeding twice the State target are excluded.
Indicator – IV: –do-
Indicator – V: Zero value is excluded and values exceeding State
target are considered as 1.
Indicator – VI: Zero value and values less than 50% of the State target are excluded.
Indicator – VII: –do-
Indicator – VIII: Zero value and values exceeding twice the State
target are excluded.
Indicator – XII (I): Actual figures are taken in to account
Indicator – XII (NI): –do-

Live Storage
Mm3
Water use for
Irrigation Mm3
Water use for
Non irrigation
Mm3
Proposed Handed over
1 2 3 4 5 6 7 8 9 10 11 12 13 14
18AA Bhima 500 1517.20 1444.70 116.43 1977 198035 182683 384 1 to 2.5 Sorghum, Wheat, Groundnut, Sugarcane
119609 31447
10 Katepurna 950 86.35 49.45 32.65 1972 11187 8325 30 1.5 to 2 Wheat, Peas, Cotton, Sunflower.
11187 7166
10 Nalganga 737 69.32 53.21 6.51 1963 9165 8604 31 1 to 2 Gram, Wheat, Cotton 9165 9165CADA Aurangabad
2 Jayakwadi (PLBC) 755 2171.00 1064.96 329.04 1975-76 183560 141640 355 1.5 to 2 Cottton, Wheat, Sorghum, Sunflower
CADA Beed2 Jayakwadi (PRBC) 700 2171.00 331.39 29.68 1976-77 53910 41682 99 1.57 Cotton,Wheat,Sorghum,
Sugarcane2 Majalgaon 840 312.00 680.28 46.88 1989-90 64295 54737 132 1 to 2 Wheat, Sorghum, Cotton,
Sugarcane33115 19749
4 Manjra 685 173.32 185.64 85.67 1980-81 23690 18223 80 2.03 -do- 23690 89864 Lower Terna 710 113.95 62.50 21.05 1997-98 14513 11610 63 1 to 1.5 Sorghum, Wheat,
Sunflower, Groundnut, Gram12464 0
11 Girna 743 525.06 549.66 0 1962-63 79293 69350 195 3 Sugarcane, Banana, Cotton, Wheat, Sorghum
79283 116
11 Chankapur 1067 76.85 146.59 0 1973 19173 14042 48 0.5 Bajri, Two seasonals, Paddy, Sorghum, Groundnut, Wheat, Gram
1861 0
CADA Solapur
AIC Akola
CADA Jalgaon
CADA Nashik
Highly deficit
Deficit
142921 71828
Area covered under WUA Ha
Culturable Command Area Ha
Irrigable command area Ha
No. of villages in
benefit zone
Main crops
Appendix-IVOverview of Projects selected for Benchmarking (Major Projects)
DesignedPlan Group
/SB No
Circle/ Project Avg. Annual Rainfall
mm
Year of Commence
ment of Irrigation
Avg. farm size Ha

1 2 3 4 5 6 7 8 9 10 11 12 13 14
2 Vishnupuri 910 80.79 275.18 54.37 1990 37785 28340 46 2.06 -do- 1599 03 Purna 685 890.22 732.33 68.67 1968-69 78485 57988 232 1 to 2 Cottton, Wheat, Sorghum 78485 20217
4 Manar 850 138.21 198.06 5.94 1968 27745 23310 96 1.55 Wheat, Gram, Sugarcane, Cotton, Groundnut, Sorghum
4523 4523
10 Wan 891 81.96 78.57 20.08 1998-99 22525 15100 54 1.5 -do- 22525 11675
6 Arunawati 913 169.92 121.65 15.62 1995 24135 20515 73 2 to 3 Cotton, Wheat, Sugarcane 24135 366
AIC Akola6 Pus 945 91.26 100.35 19.06 1972 13678 8215 40 1.5 to 3 Sugarcane, Sorghum,
Wheat, Gram, Cotton, Groundnut.
11814 7877
CADA Jalgaon13 Hatnur 743 255.00 500.12 90.53 1983 47360 37838 82 1.2 Sugarcane, Banana,
Groundnut21760 0
1 Bhandardara 3175 304.10 419.00 0 1926 63740 23077 110 4 to 5 Sorghum, Wheat, Grass, Maize, Sunflower, Sugarcane
9300 705
1 Mula 500 608.92 540.27 87.90 1972 138792 82920 160 4 to 5 . 107176 937661 Ozerkhed 746 60.32 31.59 2.19 1985 14856 10400 35 0.8 Wheat, Sorghum, Gram 10651 104161 Palkhed 661 21.40 82.90 46.85 1976 60704 43154 144 0.8 Gram, Sorghum 50254 478071 Waghad 964 72.20 36.53 3.50 1981 9642 6750 23 0.6 Paddy, Onion, Vegetables,
Groundnut, Bajri, Wheat, Gram, Sorghum
9587 9587
1 Darna 550 202.43 135.73 66.67 1918 88822 33170 146 2 Sugarcane, Sorghum, Bajri, Wheat, Gram, Fruits
8990 8930
1 Gangapur 500 159.42 86.78 117.07 1954 21900 15960 92 1.3 -do- 3711 21131 Kadwa 533 52.91 61.96 8.46 1997 15523 10117 42 0.47 -do- 1212 345
CADA Nashik
NIC Nanded
BIPC Buldhana
YIC YavatmalNormal

1 2 3 4 5 6 7 8 9 10 11 12 13 14
17 Kukadi (Complex) 790 864.39 951.29 0 1978 224699 156278 269 0.8 to 1 Wheat, Sorghum, Bajri, Vegetables, Sugarcane, Groundnut, Gram
58208 58208
17 Ghod 515 154.80 202.86 2.54 1965 41460 20500 54 1 Sugarcane, Sorghum, Bajri, Wheat, Grain
32457 26038
CIPC Chandrapur
7 Bor 1327 127.42 109.29 6.35 1967 24055 13360 77 1.5 to 2 Cotton, Wheat 18169 10761NIC Nagpur
7 Lower Wunna 1330 189.18 148.00 29 1991 21591 19500 109 2.5 Cotton, Wheat, Gram, Soybean, Sugarcane
17325 413
NIC Nanded6 Upper Penganga 825 964.09 782.69 15.16 1984-85 139438 125495 356 1 to 2 Cottton, Wheat, Sorghum, 22172 18263
PIC Pune17 Khadakwasla
(Complex)911 808.65 602.55 204 1970 83302 62146 96 0.5 to 5 Sorghum, Bajri, Maize,
Wheat, Sugarcane83302 3180
17 Pawana 2210 241.11 96.50 168.32 1975 7468 6365 30 0.5 to 2.5
Paddy, Sorghum, Bajri, Maize, Wheat, Sugarcane
ND
18 Bhatghar Dam N.L.B.C.
1953 666.00 386.58 33.92 1893 68767 60656 87 1 to 2 Sorghum, Wheat, Bajri, Sugarcane 68767 1252
18 N.R.B.C. (Veer Dam)
1067 266.44 860.99 0 1938 181266 65506 214 1.7 Sugarcane, Sorghum, Bajri, Wheat, Other Perenials 181266 390
UWPC Amravati7 Upper Wardha 840 548.14 302.78 99.72 1994-95 83300 75000 279 1.5 Cotton, Wheat, Hy. Jowar,
Chilli, Groundnut83300 340
CADA Nagpur8 Bagh (Complex) 1325 268.96 214.44 0 1971 0 0 0 1 to 2 -do- 31691 35118 Pench 1138 1374.00 689.00 243 1976 126913 101200 407 1 to 2 Paddy, Cotton, Chilly,
Wheat, Gram, Sunflower, Soybean
101824 2052
8 Itiadoh 1336 318.86 412.04 0 1971 22752 17500 100 1 to 2 Paddy 22854 22854
CADA Pune
Surplus

1 2 3 4 5 6 7 8 9 10 11 12 13 14
15 Krishna 872 602.73 602.73 0 1978-85 81400 74000 146 1 to 2 Sugarcane, Sorghum, Wheat, Gram
83452 13847
9 Asolamendha 1147 56.38 52.00 0 1918 37945 9919 67 1.5 to 2 Paddy 10317 09 Dina 1315 67.54 55.94 0 1974 12494 7826 66 1.5 to 2 -do- 12494 0
15 Radhanagari 3638 219.97 203.87 24.35 1955 35422 26560 91 0.5 to 1.5
Sugercane, Paddy, Wheat, Vegetables
47288 366
15 Tulashi 1870 91.92 91.92 42.50 1978 5711 4720 23 0.5 to 2 -do- 4495 015 Warna 2092 779.35 578.05 6.46 1986-87 123463 96919 332 0.8 -do- 148972 015 Dudhganga 2636 679.11 622.11 57 1993-94 46976 38388 125 1 to 2 Sugarcane, Paddy, Wheat 61032 2000
21 Surya 2286 285.31 145.42 31.06 1981-82 30547 14696 64 0.25 Paddy 12188 021 Bhatsa 2589 942.10 511.86 389.03 1985-86 29378 23000 149 0.39 -do- 601422 Kal-Amba 3020 528.13 156.41 54.70 1973-74 9558 7965 127 0.20 -do- 7931 0
ND= No Data
TIC Thane
AbundantCADA Pune
CIPC Chandrapur
SIC Sangli

Proposed Handed over
1 2 3 4 5 6 7 8 9 10 11 12 13 14
CADA Beed19 Banganga 685 4.96 6.35 0.59 1975 964 906 5.00 1 to 3 Groundnut, Sorghum,
Sunflower, Wheat540 310
19 Chandani 770 21.58 20.59 3.11 1966 2891 2024 10.00 2 to 3 Sorghum, Sunflower, Wheat, Pulses
434 434
19 Jakapur 770 7.96 7.43 0.00 1979 1600 1584 4.00 2 to 3 -do- No Data No Data19 Kada 589 8.56 8.38 0.18 1970 1804 1214 5.00 1 to 1.5 Soghum, Wheat, Groundnut,
Sugarcane, Maize, SunflowerNo Data No Data
19 Kadi 589 5.47 5.47 0.00 1965 1190 1084 4.00 0.5 to 4 Soghum, Wheat, Groundnut, Sugarcane, Sunflower
No Data No Data
19 Kambli 589 3.1 3.10 0.00 1958 1047 972 5.00 1 to 1.5 Soghum, Wheat, Groundnut, Sugarcane, Maize, Sunflower
639 0
19 Khasapur 770 13.04 13.30 2.55 1954 3575 2146 15.00 2 to 3 -do- No Data No Data19 Khendeshwar 685 8.78 11.28 0.00 1981 1710 1471 10.00 1 to 3 Groundnut, Sorghum,
Sunflower, WheatNo Data No Data
19 Khandala 770 5.24 5.24 0.00 1974 1328 830 2.00 2 to 3 -do- 296 019 Kurnoor 770 32.28 32.18 4.81 1968 6414 3644 9.00 2 to 3 Groundnut, Sugarcane,
Sorghum, Sunflower, Wheat1058 700
19 Mehakari 589 12.98 12.98 0.00 1966 5007 4048 8.00 1 to 1.5 Soghum, Wheat, Groundnut, Sugarcane, Maize, Sunflower
617 0
19 Ramganga 685 5.34 6.50 0.00 1977 1017 963 7.00 1 to 3 Groundnut, Sorghum, Sunflower, Wheat
1017 1017
19 Rooty 589 6.57 6.09 0.48 1938 1943 1862 5.00 1 to 1.5 Sorghum, Wheat, Vegetables, Sugarcane
No Data No Data
19 Sakat 770 13.48 15.17 0.00 1994 3140 2355 9.00 2 to 3 -do- 1057 105719 Talwar 589 3.23 3.23 0.00 1960 760 668 4.00 0.5 to 1.5 Soghum, Wheat, Groundnut,
Sugarcane, Maize, Sunflower3542 0
19 Turori 770 6.2 5.73 1.70 1984 900 830 8.00 2 to 3 -do- No Data No Data
19A Mangi 500 30.40 27.50 0 1966 4000 3117 21 0.5 to 4 Sorghum, Groundnut. Sugarcane, Maize, Sunflower
4036 0
19 Ekrukh 500 61.15 43.21 15.95 1871 6858 2610 11 1 to 1.5 Sorghum, Wheat, Vegetables, Sugarcane
1329 0
18 AA Buddhihal 500 27.95 15.08 0.00 1966 5448 4251 8 0.5 to 1.5 Sorghum, Wheat, Groundnut, Sugarcane, Maize, Sunflower
5553 0
19 Hingni (P) 500 32.00 37.83 1.68 1977 6482 5629 15 1 to 1.5 -do- 7253 3767
Overview of Projects selected for Benchmarking (Medium Projects)
CADA Solapur
Avg. farm size ( ha)
Main crops
Highly Deficit
Irrigable command
area (ha)
No. of villages
in benefit zone
Area covered under WUA (ha)
Plan group/ SB No
Designed Water use
for Non irrigation
(Mm3)
Year of Commence
ment of Irrigation
Culturable Command
Area (ha)
Circle/ Project
Avg. Annual Rainfall (mm)
Designed Live
Storage (Mm3)
Designed Water use
for Irrigation
use (Mm3)

1 2 3 4 5 6 7 8 9 10 11 12 13 1419 Javalgon 500 29.18 29.37 6.15 1997 5372 5341 13 1 to 1.5 -do- 4635 1985
19 Khairy 682 13.74 17.83 0 1989 2718 2318 14 2 Sorghum, Bajri, Wheat, Groundnut
2318 0
16 Nher 508 11.79 11.79 0 1886 4324 2636 18 1 Bajari, Sorghum, Wheat other Non Perennial
4324 0
19 Sina 562 52.3 67.09 0.2 1984 9677 8445 26 1 Sorghum, Bajri, Wheat, Maize, Kadwal
8445 0
18 Mhaswad 533 46.21 46.21 0 1881 5804 4049 11 1 Sorghum, Bajri, Groundnut 16130 018 Ranand 538 6.42 1.83 0 1953 3886 1093 6 Kadwal, Wheat, Sorghum 3896 16218 Tisangi 508 24.46 24.46 0 1965 5068 4049 0 1 Sorghum, Bajri, 5132 0
10 Dnyanganga 732 33.93 33.80 8.69 1971 4494 4249 21 1.5 to 2 Wheat, Gram, Cotton 4494 56810 Mas 696 22.04 21.48 8.09 1982 6107 4415 22 2 to 3 -do- 6107 72211 Morna 827 41.46 46.50 0.00 1972 6464 4633 29 1 to 3 Wheat, Gram, Cotton,
Hy.Jawar6539 1935
11 Nirguna 812 28.85 34.50 0.00 1979 6377 5836 20 1 to 2 Wheat, Gram, Cotton, Hy.Jawar, Groundnut
6377 2565
10 Paldhag 766 7.51 10.40 0.37 1978 3082 1932 14 1 to 2 Wheat, Gram, Cotton 3032 148510 Shahanur 1440 46.04 41.12 12.45 1990 9330 7466 47 1.27 Cotton, Sorghum, Wheat,
Gram, Orange9330 0
10 Uma 818 11.68 10.23 0.92 1982 3007 2241 21 1 to 3 Wheat, Gram, Cotton, Hy.Jawar
3007 267
10 Mun 761 36.83 45.10 0.00 1992-93 9735 7804 32 2.5 Cotton, Chilly, Sunflower 9735 95310 Torna 711 7.9 7.75 0.11 1994-95 1725 1465 7 2.5 -do- 1725 0
11 Ajantha Andhari 650 7.65 5.27 2.38 1984 1967 1578 3 3.93 -do- 385 03 Dhamna 677 8.51 8.34 0.15 1973 1682 1280 8 2.5 -do- 744 0
11 Gadadgad 840 4.64 3.97 0.67 1971 1448 1180 4 1.77 -do- 1449 14492 Galhati 598 13.84 7.08 4.34 1964 2812 2200 12 1 to 2 Sorghum, Wheat, Cotton, Tur No Data No Data
3 Girija 762 21.25 14.66 6.57 1990 3443 3443 10 0.77 -do- 2793 25403 Jivrekha 668 6.13 6.14 0.00 1964 2589 1064 6 2.5 -do- 1318 03 Jui 647 6.03 6.22 2.00 1960 2636 2206 14 2.5 -do- 477 03 Kalyan 567 12.22 7.35 3.03 1986 2693 2020 9 3 -do- 850 5543 Kalyan Girija 663 8.47 8.42 0.00 1972 1557 1377 9 3 Wheat, Sorghum, Sunflower 1655 03 Karpara 760 24.9 21.03 2.80 1974 2862 2151 7 1.5 -do- 597 5973 Khelna 650 11.07 4.74 6.33 1967 4935 2429 11 4.08 -do- 721 03 Lahuki 688 5.31 3.72 1.59 1977 1323 1092 4 0.96 -do- 484 02 Masoli 780 27.13 23.44 3.94 1982 3502 2591 7 1.5 -do- 1864 6733 Sukhana 688 18.49 16.56 1.93 1968 3136 2511 14 2.73 -do- 2847 1647
4 Devarjan 838 10.680 7.12 0.00 1997 2853 1882 7 2.04 Sorghum, Wheat, Gram, Sunflower
2173 0
4 Gharni 716 22.460 23.78 0.00 1969 3542 2834 14 2.10 Sugarcane, Groundnut, Sorghum, Cotton, Maize, Paddy, Vegetable, Wheat, Gram
4135 4135
BIPC Buldhana
CADA Aurangabad
CADA Beed
PIC Pune
DeficitAIC Akola

1 2 3 4 5 6 7 8 9 10 11 12 13 142 Kundlika 753 37.690 37.83 0.33 1988 3927 2964 13 3.91 Sugarcane, Groundnut,
Sorghum, Bajri, Cotton, Sunflower
287 287
4 Masalga 673 13.590 11.54 0.00 1996 1678 1364 11 1.73 Sorghum, Bajri, Cotton, Sunflower, Groundnut
1664 0
4 Raigavhvan 770 11.260 8.57 0.28 1992 2267 1700 8 1.30 -do- 1470 04 Rui 770 8.610 5.80 1.72 1994 1893 1650 7 1.20 -do- No Data No Data4 Sakol 850 10.950 8.40 0.00 1996 2174 2064 7 2.18 Sorghum, Chilli, Groundnut,
Maize, Paddy, Vegetables, Wheat, Gram
2174 0
4 Tavarja 744 20.340 10.98 3.92 1983 4907 3603 19 1.72 Sorghum, Sunflower, Wheat 4907 04 Terna 770 19.663 10.84 4.81 1964 1928 1652 9 1.50 Sugarcane 2233 04 Tiru 684 15.290 21.19 0.00 1978 2654 2348 14 1.40 Sorghum, Chilli, Groundnut,
Maize, Paddy, Vegetables, Wheat, Gram
2625 2625
4 Vhati 880 8.270 9.93 0.00 1983 1809 1760 7 2.15 Sorghum, Chilli, Groundnut, Maize, Paddy, Vegetables, Wheat, Gram, Fodder
1005 0
4 Wan 533 19.34 19.31 7.64 1967 7125 5262 22 1.54 Sorghum, Wheat, Sunflower, Cotton, Groundnut
265 0
11 Agnawati 743 2.76 2.90 0.58 1987 960 605 3 0.75 -do- 960 013 AA Bhokarbari 694 6.54 8.15 0.00 1993-94 1790 1205 5 1.5 -do- 1720 013 AA Bori 694 25.15 31.30 7.08 1985-76 6504 4553 15 2 -do- 6504 013 AA Burai 500 14.21 19.23* 0.87 1984-85 2981 2760 5 1 Wheat, Cotton, Gram, Bajri,
Sorghum, Onion, Maize3391 155
13 AA Kanoli 660 8.45 10.50 0.00 1974-75 1620 1363 8 1 to 2 Wheat, Cotton, Gram, Bajri, Sorghum
1704 0
11 Hiwara 810 9.6 12.30 0.00 1997 2923 2231 3 0.8 -do- 2927 011 Manyad 750 40.27 45.30 0.00 1973-74 6500 4864 12 2 Sugarcane, Banana, Cotton 6508 0
13 AA Rangavali 1055 12.89 23.05* 0.00 1983-84 5130 3134 21 2 to 2.5 Sorghum, Wheat, Cotton, Vegetables
5130 0
13 AA Tondapur 763 4.64 4.77 0.85 1998 1597 1060 2 0.8 -do- 1527 0
4 G.Pargaon 685 8.5 12.36 0.00 1984 2142 1660 15 3 to 4 -do- 747 011 Haranbari 795 33.02 47.66 0.00 1988-89 12966 9726 55 0.5 Paddy, Sorghum, Groundnut,
Wheat, Gram, Sugarcane2056 896
11 Kelzar 687 16.2 16.51 0.00 1988-89 5583 3394 19 0.5 Bajri, Two seasonals, Paddy, Sorghum, Groundnut, Wheat, Gram
740 740
11 Nagya Sakya 528 11.24 13.72 0.00 1992.93 2400 2400 11 0.5 Paddy, Sorghum, Groundnut, Wheat, Gram, Sugarcane
0 0
4 Karadkhed 650 11.01 11.34 6.56 1976 2510 1780 11 1.93 -do- 1652 16522 Kudala 700 4.35 5.54 1.38 1974 676 567 5 1.23 -do- No Data No Data
CADA Nashik
NIC Nanded
CADA Jalgaon

1 2 3 4 5 6 7 8 9 10 11 12 13 144 Kundrala 630 10.41 12.81 4.21 1981 1265 1012 7 1.61 Wheat, Gram, Sugarcane,
Cotton, Groundnut, Sorghum1792 1277
4 Mahalingi 775 4.78 4.06 1.68 1980 1015 784 6 1.8 -do- 1449 7844 Pethwadaj 850 9.04 13.52 1.31 1977 1970 1478 13 1 -do- 1970 0
YIC Yevatmal6 Adan 798 67.25 69.67 11.14 1979 10067 7804 32 0.56 Cotton, Tur, Sugarcane,
Groundnut10067 0
7 Nawargaon 1067 12.47 13.28 2.71 1999 2574 2056 15 0.56 -do- 2878 0
6 Borgaon 988 6.61 10.86 0.35 1992 3028 2271 16 1.5 to 3 Groundnut, Cotton, Sorghum, Wheat, Gram, Pulses
3028 3028
6 Ekburji 986 11.97 9.08 0.76 1964 2625 2429 11 1 to 2 Wheat, Gram 2625 06 Koradi 660 20.7 15.12 0.00 1981 5067 4061 26 1 to 2 Cotton, Sorghum, Wheat,
Groundnut5067 127
6 Lower Pus 852 59.63 70.50 2.42 1990 7606 6600 29 2 to 4 Sugarcane, Cotton, Sorghum, Wheat, Gram, Pulses, Vegetables
6740 0
6 Saikheda 1098 27.18 24.77 4.38 1972 3895 3116 18 1.5 to 3 Cotton, Sorghum, Wheat, Gram, Pulses, Vegetables
3239 0
10 Sonal 860 16.92 17.95 0.00 1981 3496 2447 46 1 to 2 Hy. Jawar, Sunflower, Cotton, Wheat, Gram
3293 764
1 Ambadi 650 9.42 6.92 2.50 1979 2375 2147 10 2.26 -do- 1467 14671 Dheku 600 11.53 6.55 5.60 1961 3564 2712 15 2.07 -do- 580 01 Kolhi 600 3.23 2.63 0.60 1967 1056 472 4 3.02 -do- 472 0
13 A Abhora 750 6.02 7.13 0.00 1985 1403 1115 2 0.8 -do- 1403 013 A Aner 970 59.21 79* 8.50 1976 9201 7180 10 0.5 Wheat, Groundnut, Cotton 7045 013 A Karvand 960 21.39 21.39 0.62 1968 7027 4534 14 0.4 -do- 7125 013 A Malangaon 780 11.32 15.02 0.00 1972 2674 1587 15 0.5 -do- 2674 012 Panzara 780 35.63 72.66* 0.71 1976 7328 6868 25 0.8 Maize, Bajra, Wheat 8286 0
13 A Suki 774 39.85 45.47 0.00 1985 8647 5128 8 0.9 Groundnut, Pulses, Sorghum, Cotton
8647 3639
7 Wunna 1100 21.64 9.49 11.55 1968 2000 1214 10 1.33 Wheat, Cotton, Orange, Gram, Vegetables
2000 0
1 Adhala 500 27.6 38.74 0.00 1977 6427 3914 16 3 to 4 Sorghum, Wheat, Grass, Bajri, Groundnut, Maize
1512 0
1 Alandi 614 27.46 21.00 5.67 1985 7408 6296 18 3 Vegetables, Grapes, Sorghum, Sugarcane, Wheat, Gram
2143 325
1 Bhojapur 393 10.22 8.15 2.55 1973 4580 4500 24 1.7 Bajri, Wheat, Sorghum, Gram 500 0
1 Mand Ohol 600 8.78 13.16 0.00 1983 2833 2266 15 3 to 4 Sorghum, Wheat, Grass, Maize, Sunflower, Sugarcane
2427 0
CADA Nashik
CADA Aurangabad
CADA Jalgaon
CADA Nagpur
Normal
AIC Akola

1 2 3 4 5 6 7 8 9 10 11 12 13 14
7 Amalnalla 1218 24.48 19.52 0.00 1981 4710 2962 22 1.5 to 2 Wheat, Cotton, Gram 4710 07 Labhansarad 1103 7.35 5.87 0.00 1987 2024 2024 11 1.5 to 2 Wheat, Cotton, Soybean 2024 07 Panchdhara 1103 10.39 8.43 0.00 1976 2262 1822 14 1.5 to 2 Cotton, Wheat 2667 25127 Pothral 1100 34.72 34.72 0.00 1984 10910 8948 33 1.5 to 2 -do- 10910 0
6 Loni 1150 8.38 9.51 0.91 1981 1835 1377 7 1.02 -do- 1750 06 Dongargaon 1150 8.81 11.55 0.00 1983 1008 830 5 1.8 -do- 1008 10086 Nagzari 1150 6.56 6.18 2.92 1983 1260 960 6 4.68 -do- 665 0
17 Vadiwale 2845 30.39 22.18 0 1990 5564 5000 26 0.15 to 1 Paddy, Wheat 5564 0
8 Bageda 1146 4.535 4.11 0.00 1974 1887 1798 10 0.85 Paddy 2566 6798 Betekar Bothali 1186 3.666 3.67 0.00 1989 1266 1315 4 0.75 -do- 1266 08 Bodalkasa 1281 19.73 16.45 2.73 1917 14665 4047 36 0.21 -do- 9839 08 Chandpur 1200 28.87 28.87 0.00 1916 10117 6271 40 0.9 -do- 10117 12708 Chorkhamara 1267 22.04 20.80 0.00 1917 13246 4047 25 0.35 -do- 13246 08 Chulband 1384 21.46 16.82 0.00 1976 3378 3167 21 1.1 -do- 3564 08 Kanholibara 1004 20.49 22.03 4.73 1976 4815 3371 22 3 HW Groundnut, Cotton,
Soybean, Wheat, Gram, Vegetables
6025 0
8 Kesarnala 979 3.93 4.28 0.00 1976 937 780 7 1.6 -do- 937 08 Khairbanda 870 16.48 12.22 0.00 1915 11271 6109 31 -do- 112267 08 Khekranala 963 23.81 29.54 0.00 1987 3810 2610 14 1.5 Cotton, Wheat, Gram, Orange,
Sugarcane, HW Groundnut, Soybean, Vegetables.
3144 0
8 Kolar 978 31.32 41.23 1.21 1984 8088 5940 43 2.1 -do- 8088 08 Makardhokada-Sai 963 25.9 27.37 1.45 1980-81 5835 5477 29 1.33 Paddy, Cotton, Chillies, Wheat,
Sorghum, Gram, Soybean, Vegetables
3512 0
8 Managadh 1609 7.05 7.83 0.00 1970 3390 1700 11 0.35 -do- 3390 08 Mordham 1016 4.95 4.91 0.05 No data 1423 1315 8 2.1 Orange, Wheat, Gram,
Vegetables, Cotton1423 0
8 Pandharabodi 1290 13.14 14.51 2.15 1974-75 1044 862 12 2.18 Paddy, Chillies, Wheat, Gram, Soybean, Sunflower.
2060 0
8 Rengepar 1138 3.57 5.86 0.00 1977 1305 870 7 0.75 -do- 1119 11198 Sangrampur 1281 3.868 8.87 0.46 1969 1536 1094 7 -do- 1994 08 Sorna 1255 5.733 5.73 0.00 1972 1553 933 8 0.75 -do- 1553 08 Umari 1064 5.14 5.85 0.00 1971-72 1802 1195 8 2 Wheat, Cotton, Orange, Gram,
Vegetables, Groundnut1902 0
8 Chandrabhaga 1016 8.262 8.25 0.02 1974-75 3181 2604 15 2.1 Orange, Wheat, Gram, Vegetable, Cotton
3181 0
8 Chandai 1205 21.58 9.28 0.00 1983 2565 2056 14 1.5 to 2 -do- 2565 08 Chargaon 1285 19.87 11.98 0.00 1983 1946 1500 12 1.5 to 2 Paddy, Wheat 1946 0
CIPC Chandrapur
NIC Nanded
PIC Pune
SurplusCADA Nagpur
CIPC Chandrapur

1 2 3 4 5 6 7 8 9 10 11 12 13 14
7 Dongargaon(Ward 1100 4.44 3.17 0.00 1974 972 631 9 1.5 to 2 -do- 608 6089 Ghorazari 1285 43.16 35.00 0.00 1923 12868 3846 65 1.5 to 2 Paddy 12868 09 Naleshwar 1147 10.23 4.29 0.00 1922 5035 1888 23 1.5 to 2 -do- 5035 0
23 Natuwadi 3632 27.230 27.23 0.00 1984 2139 2050 18 0.02 to 0.05 Paddy, Groundnut, Pulses, Mango
2050 0
15 Chikotra 1074 43.06 43.05 0.00 2001 6833 5630 27 1 to 2 Sugercane, Paddy, Wheat, Vegetables
6833 0
15 Chitri 1524 52.73 64.45 0.00 2001-02 9160 5850 54 0.55 -do- 9160 015 Jangamhatti 2190 33.21 26.37 6.84 1996-97 4450 3700 10 0.1 Sugercane, Maize,Chilly
Wheat,Potato, GrouNo Datanut4457 0
15 Kadavi 3418 70.56 70.56 0.00 2001 9908 9219 52 0.8 -do- 9908 015 Kasari 4560 77.96 61.57 0.00 1989 9995 5458 61 1 to 1.5 Sugercane, Paddy, Wheat 9995 015 Kumbhi 4985 76.5 74.81 1.68 2001 9170 8711 51 0.10 to 1 Sugercane, Wheat,
Groundnut, Sunflower9170 0
15 Patgaon 3486 104.77 78.58 26.19 1996 10000 8100 44 1 to 2 Sugercane, Paddy, Wheat 10000 0
21 Rajanala 339.140 32.00 0.00 1958-59 3050 2542 0.00 Paddy 400 667 021 Wandri 2540 35.938 35.94 0.00 1984.85 3066 2044 17 0.25 -do- 2044 0
CIPC Chandrapur
KIC Ratnagiri
SIC Sangli
TIC Thane
Abundant
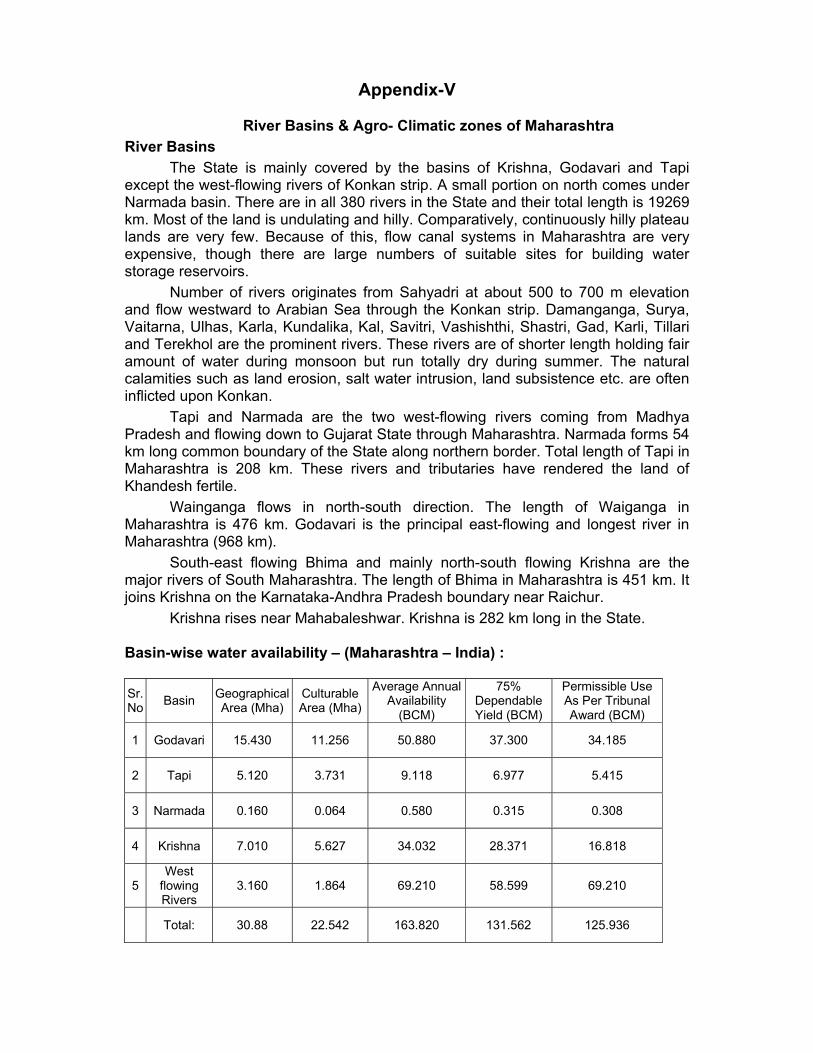
Appendix-V
River Basins & Agro- Climatic zones of Maharashtra River Basins The State is mainly covered by the basins of Krishna, Godavari and Tapi except the west-flowing rivers of Konkan strip. A small portion on north comes under Narmada basin. There are in all 380 rivers in the State and their total length is 19269 km. Most of the land is undulating and hilly. Comparatively, continuously hilly plateau lands are very few. Because of this, flow canal systems in Maharashtra are very expensive, though there are large numbers of suitable sites for building water storage reservoirs. Number of rivers originates from Sahyadri at about 500 to 700 m elevation and flow westward to Arabian Sea through the Konkan strip. Damanganga, Surya, Vaitarna, Ulhas, Karla, Kundalika, Kal, Savitri, Vashishthi, Shastri, Gad, Karli, Tillari and Terekhol are the prominent rivers. These rivers are of shorter length holding fair amount of water during monsoon but run totally dry during summer. The natural calamities such as land erosion, salt water intrusion, land subsistence etc. are often inflicted upon Konkan. Tapi and Narmada are the two west-flowing rivers coming from Madhya Pradesh and flowing down to Gujarat State through Maharashtra. Narmada forms 54 km long common boundary of the State along northern border. Total length of Tapi in Maharashtra is 208 km. These rivers and tributaries have rendered the land of Khandesh fertile.
Wainganga flows in north-south direction. The length of Waiganga in Maharashtra is 476 km. Godavari is the principal east-flowing and longest river in Maharashtra (968 km). South-east flowing Bhima and mainly north-south flowing Krishna are the major rivers of South Maharashtra. The length of Bhima in Maharashtra is 451 km. It joins Krishna on the Karnataka-Andhra Pradesh boundary near Raichur. Krishna rises near Mahabaleshwar. Krishna is 282 km long in the State. Basin-wise water availability – (Maharashtra – India) : Sr. No Basin Geographical
Area (Mha) Culturable Area (Mha)
Average Annual Availability
(BCM)
75% Dependable Yield (BCM)
Permissible Use As Per Tribunal Award (BCM)
1 Godavari 15.430 11.256 50.880 37.300 34.185
2 Tapi 5.120 3.731 9.118 6.977 5.415
3 Narmada 0.160 0.064 0.580 0.315 0.308
4 Krishna 7.010 5.627 34.032 28.371 16.818
5 West
flowing Rivers
3.160 1.864 69.210 58.599 69.210
Total: 30.88 22.542 163.820 131.562 125.936

Sub-basin wise planning : As per the recommendations laid down in the National Water Policy – 2002 and Maharashtra Water and Irrigation Commission’s Report, the State Water Policy has been adopted by GOM in 2003. The objectives of the Maharashtra State Water Policy are to ensure the sustainable development and optimal use and management of the State’s water resources, to provide the greatest economic and social benefit for the people of the State of Maharashtra and to maintain important ecological values within rivers and adjoining lands.
The Maharashtra State Water Policy mentions that - ‘To adopt an integrated and multi-sectoral approach to the water resources planning, development and management on a sustainable basis taking river basin/sub basin as a unit.’ The water resources of the State shall be planned, developed, managed with a river basin/ sub basin as a unit, adopting multicultural approach and treating surface and sub-surface water with unitary approach.’ The geographical area of the State is 308 lakh ha and cultivable area is 225 lakh ha. This geographical area is divided mainly into five major river basins of Godavari, Krishna, Tapi, Narmada and basin groups in Konkan. There are 22 narrow basins of west flowing rivers in Konkan. The Maharashtra Water and Irrigation Commission has proposed delineation of five river basins basically into 25 distinct sub basins for planning of water resources development in the State. The categorisation of sub basins proposed is solely on the basis of natural availability of water. The basic characteristics of sub basins are dictated by the hydrological regime, which in turn, is a function of climate, rainfall distribution and the draining area. The sub basins are as follows:
Sr. No.
River Basin Names of Sub basins Abbreviated name
Categorisation for planning on
the basis of availability of natural water
I Godavari 1) Upper Godavari (Up to Paithan Dam)
Upper Godavari Normal
2) Lower Godavari (D/S of Paithan Dam)
Lower Godavari Deficit
3) Purna (including Dudhana) Purna Dudhana Deficit 4) Manjra Manjra Deficit 5) Godavari-Sudha-Swarna Remaining
Godavari Normal
6) Painganga Painganga Normal 7) Wardha Wardha Normal 8) Middle Wainganga Middle
Wainganga Surplus
9) Lower Wainganga Lower Wainganga Abundant II Tapi 10) Purna (Tapi) Purna Tapi Deficit 11) Girna Girna Deficit
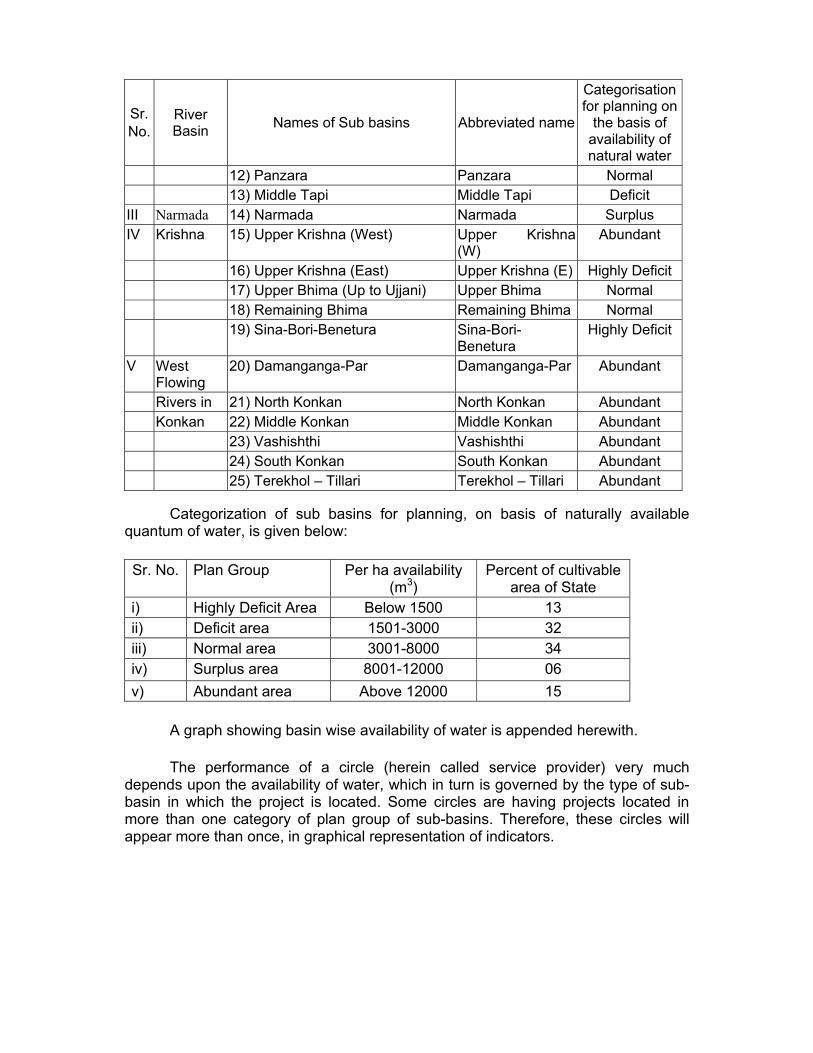
Sr. No.
River Basin Names of Sub basins Abbreviated name
Categorisation for planning on
the basis of availability of natural water
12) Panzara Panzara Normal 13) Middle Tapi Middle Tapi Deficit
III Narmada 14) Narmada Narmada Surplus IV Krishna 15) Upper Krishna (West) Upper Krishna
(W) Abundant
16) Upper Krishna (East) Upper Krishna (E) Highly Deficit 17) Upper Bhima (Up to Ujjani) Upper Bhima Normal 18) Remaining Bhima Remaining Bhima Normal 19) Sina-Bori-Benetura Sina-Bori-
Benetura Highly Deficit
V West Flowing
20) Damanganga-Par Damanganga-Par Abundant
Rivers in 21) North Konkan North Konkan Abundant Konkan 22) Middle Konkan Middle Konkan Abundant 23) Vashishthi Vashishthi Abundant 24) South Konkan South Konkan Abundant 25) Terekhol – Tillari Terekhol – Tillari Abundant
Categorization of sub basins for planning, on basis of naturally available quantum of water, is given below:
Sr. No. Plan Group Per ha availability
(m3) Percent of cultivable
area of State i) Highly Deficit Area Below 1500 13 ii) Deficit area 1501-3000 32 iii) Normal area 3001-8000 34 iv) Surplus area 8001-12000 06 v) Abundant area Above 12000 15
A graph showing basin wise availability of water is appended herewith. The performance of a circle (herein called service provider) very much
depends upon the availability of water, which in turn is governed by the type of sub-basin in which the project is located. Some circles are having projects located in more than one category of plan group of sub-basins. Therefore, these circles will appear more than once, in graphical representation of indicators.

Climate : Maharashtra is having mostly a seasonal climate. Four distinct seasons are noticeable in a year viz. (1) Monsoon: The rains start with the south - west winds. Mainly it rains during the four months from June to September, but it often extends up to October. (2) Post-monsoon season: October to mid December is a fair weather season with meagre rains. These are the initial months of the post-monsoon, Rabi crops and the condition of later depends upon the weather during these months. (3) Winter: It is generally a period of two or two-and-a-half months, from mid-December until end of February. Most of the Rabi crops are harvested during these months. (4) Summer: It lasts for at least three months - March to May. There is considerable variation in weather and rainfall among the five different geographical regions of Maharashtra. 1 The coastal districts of Konkan experience heavy rains but mild winter. The weather, however, is mostly humid throughout the year. The maximum and minimum temperatures here range between 270C and 400C and 140C to 270C respectively. The relative humidity is 81% to 95% during June to August while 30% to 65% during January - February. 2 The western parts of Nashik, Pune, Satara and Kolhapur districts show a steep reduction in rainfall from the mountainous regions towards the East. The maximum temperature ranges between 260C to 390C and the minimum temperature between 80C to 230C. The relative humidity is 81% to 99 % in August and only 20% to 39% in March.
Water Availability per ha of Culturable Area
8335
2957
2820
4644
3218 3595
8293
8990
2
3112
9063
4434
1
2911
8
4024
3
4876
1
3568
8
5976
6
4187
0
5809
6768
2131
1811 2122
1197 2374
6332
0
2000
4000
6000
8000
10000
12000
14000
16000
Upp
er G
odav
ari
Low
er G
odav
ari
Pur
na D
udha
na
Man
jra
Rem
aini
ng G
odav
ari
Pai
ngan
ga
War
dha
Mid
dle
Wai
ngan
ga
Low
er W
aing
anga
Pur
na T
api
Girn
a
Pan
jra
Mid
dle
Tapi
Nar
mad
a
Upp
er K
rishn
a (W
)
Upp
er K
rishn
a (E
)
Upp
er B
him
a
Rem
aini
ng B
him
a
Sin
a-B
ori-B
enitu
ra
Dam
anga
nga-
par
Nor
th K
onka
n
Mid
dle
Kon
kan
Vas
hist
hi
Sou
th K
onka
n
Tere
khol
-Tilla
ri
Subbasin
cum
Availability per ha.of CCA Avail 1500 Avail 3000 Avail 8000 Avail 12000
Values Exceeding 16000
3 The eastern part of the above four districts together with Ahmednagar, Sangli, Solapur, Aurangabad, Jalna, Beed and Osmanabad districts fall under the rain shadow of Sahyadri Mountains and therefore the beginning and end of the rainy season is quite uncertain in these parts. The rainfall is also meager. The climate is extreme. The summer temperature is high (maximum temperature 360C to 410C) but winter temperature is low (minimum temperature. 100C to 160C). The relative humidity in August is between 82% to 84% but only 19% to 26% in April. The rainfall increases as we go towards east viz. Parbhani, Nanded and Yavatmal. Many a times the eastern winds during the end of monsoon cause precipitation here. 4 Likewise the Tapi basin, the southern parts of Satpuda ranges and Dhule-Jalgaon districts towards west is low rainfall part like that of rain shadow region. But towards east Buldhana, Akola and Amravati districts experience a heavy rainfall. Summer temperature in this region is quite high (390C to 430C) and minimum winter temperature is found to be 120C to 150C. Relative humidity between May to August is 82% to 87% whereas in March-April it is 12% to 31%. 5 The Wainganga basin on east of Maharashtra and the hilly region still farther east is, on the whole, a zone having good rainfall, but as it is some what low lying area, the climate is even more extreme. The summer temperature is very high (390C to 450C) while it is cooler in winter as compared to other regions (120C to140C). Rainfall : Maharashtra gets rain both from the south-west and the north-east monsoon winds. The proportion of the rainfall derived from the north-east monsoon increases towards east. The average rainfall of the State is approximately 1360 mm. nearly 88% of the total average rainfall occurs between June to September, while nearly 8% occurs between October to December and 4% after December. There is a considerable variation in the reliability of the rains in different parts of the State. The steep decline in the rainfall to east of Sahyadri is strikingly noticeable. In the 30 to 50 km wide belt the average rainfall is observed to be less than 650 mm (as low as only 500 mm at some places). Thereafter, the rainfall increases steadily towards east and the average rainfall in the easternmost districts is observed to be 1400 mm. The pre-monsoon rain during March to May is maximum in Western Maharashtra (5%) while in Marathwada it is 4%, in Vidarbha it is 3% and the minimum is in Konkan (1%).
The number of average annual rainy days is maximum 95 in Konkan, 55 in Vidarbha, 51 in Western Maharashtra and the minimum 46 in Marathwada. Out of the total cultivable land in Maharashtra about 53% is under Kharif and about 30% is under Rabi crops. These mostly comprise of food grains and oilseeds. The rainfall during June to September affects both the Kharif and the Rabi crops. That is why the regularity of rainfall during this period is of importance. But it is seen that there is considerable fluctuation in the number of rainy days as well as the amount of rainfall from year to year. The fluctuation in rainfall is observed to be 25%, 40% and between 20% to 30% in Konkan, Central Maharashtra and Vidarbha respectively. Crop management on fields during this period thereby becomes quite difficult.

Appendix – 6 (A) Crop wise, Season wise rates based on area
Extract of Government (WRD) G.R. of water rates Dated – 29/06/2011
(Rs./ha)
Revised Rates Sr. No.
Crops Kharif Rabi HW
Remarks
Kharif 1. Food Grains & Other
Kh 240 -- --
2. Groundnut 350 700* * Rate in rabi of Prolonged kharif season
3. Vegetables & Onion 600 -- -- 4. Rice 240 480* -- * Rate in rabi of Prolonged kharif
season Rabi
5. Vegetables -- 1200 -- 6. Wheat -- 470 -- 7. Other Rabi -- 350 -- Two Seasonal
8. Chilly, Ginger, Pulse (Tur)
120 240 360
9. Cotton 450 900 1350 HW
10. Vegetables -- -- 1800 11. Groundnut -- 1050 12. Rice -- -- 720
Perennials 13. Sugarcane, Banana 1050 2100 3140 Total 6290 14. Horticulture 790 1580 2350 Total 4720

Appendix – 6 (B) Water rates for Farm – Private lift irrigation scheme
Extract of Government (WRD) G.R. of water rates Dated – 29/06/2011
(Rs./ha)
Sugarcane / Banana
Horticulture Other Crops Sr. No.
Source of water supply
Flow Drip Flow Drip Kharif Rabi HW1. Assured water supply-
Major / Medium reservoir / Storage tank having no canals
1500 1150 1150 860 85 120 240
2. Controlled water supply with conveyance losses- Controlled portion of river down stream of dam / canal lift / K.T. weir with backup of avajal reservoir
1150 860 860 650 40 60 120
3. Partially assured water supply- Small reservoir with canals / K.T. weir without backup of reservoir / Any uncontrolled portion of river without any K.T. weir or river in command area without any K.T. weir or barrage
750 580 580 430 35 35 60
4. Reservoir constructed by water user’s / Proportionate expenditure shared by water user’s - Expenditure shared by water user’s in Proportionate of project or constructed dam / Bandhara / Kachcha Bandhara / K.T. weir
500 380 380 290 -- 20 20
Note: Leakages to be borne by service provider.