Report on an Educational Program - Houston … University and Texaco STARS workshops were provided...
32
RESEARCH Report on an Educational Program HOUSTON URBAN LEARNING INITIATIVES IN A NETWORKED COMMUNITY 2001–2002 Houston Independent School District D e p a r t m e n t of R e s e a r c h a n d A c c o u n t a b i l i t y
Transcript of Report on an Educational Program - Houston … University and Texaco STARS workshops were provided...
RESEARCHReport on an Educational Program
HOUSTON URBAN LEARNING INITIATIVESIN A NETWORKED COMMUNITY
2001–2002
Houston Independent School District
D e p a r t m e n t of R e s e a r c h a n d A c c o u n t a b i l i t y

Kaye StriplingSUPERINTENDENT OF SCHOOLS
Robert StockwellCHIEF ACADEMIC OFFICER
Kathryn SánchezASSISTANT SUPERINTENDENT
DEPARTMENT OF RESEARCH AND ACCOUNTABILITY
HOUSTON INDEPENDENT SCHOOL DISTRICTBoard of Education
Esther Campos
Olga Gallegos
Lawrence Marshall
Jeff Shadwick
Laurie Bricker, PRESIDENT
Kevin Hoffman, FIRST VICE PRESIDENT
Karla Cisneros, SECOND VICE PRESIDENT
Arthur M. Gaines, Jr., SECRETARY
Dianne Johnson, ASSISTANT SECRETARY
Alfredo A. GavitoRESEARCH MANAGER
Harry SeligRESEARCH MANAGER
Venita HolmesRESEARCH SPECIALIST
Michael ThomasRESEARCH SPECIALIST
Cara StepanikRESEARCH SPECIALIST

1HISD RESEARCH AND ACCOUNTABILITY
HOUSTON URBAN LEARNING INITIATIVES IN A NETWORKED COMMUNITY: 2001–2002
EXECUTIVE SUMMARY
Overview of the SystemDuring the 2001-02 school year, there were
210,670 students enrolled in 286 schools in theHouston Independent School District. The largestethnic group, Hispanics, comprised 56.1% followedby African Americans with 31.3% of the student body.Economically disadvantaged students comprised79.0% of the HISD’s enrollment. In the first year(1999-2000) of the HU-LINC initiative 209,716 stu-dents were enrolled in 282 schools. Demographictrends were the same as the 2000-01 year: the largestethnic group, Hispanics, comprised 55.0% followedby African Americans with 32.1% of the student body.Similarly, 77.0% were economically disadvantaged.
Districtwide, there were 609 teachers dedicatedto teaching mathematics, and 558 assigned to teachscience during 2001-02. There were 6,751 teachersin elementary schools teaching all academic subjectareas including mathematics and science. In 2000-01, there were mathematics 589 teachers, and 558assigned to teach science. There were over 5,933teachers in elementary schools teaching all aca-demic subject areas including mathematics and sci-ence.
During 2001-02, professional development ac-tivities were conducted that impacted all students(210,670). HU-LINC sponsored training was pro-vided for 105 mathematics teachers and 173 scienceteachers, and 544 elementary teachers. Othertraining was provided for science to 1,124 teachersand for mathematics to 1,936 teachers in addition toall elementary teachers. The HU-LINC UniversityCoalition provided teacher training to 593 teachersand 72 teachers participated in sessions presentedby the HU-LINC Informal Coalition.
Continuing with the implementation of the HU-
LINC systemic initiative, the third of three cohorts ofschools began participation in HU-LINC sponsoredactivities. These cohorts provided the means tosystematically provide to school administrators andmathematics and science teachers with professionaldevelopment courses and other activities developedby the district and area universities and educationalsupport institutions. Professional development pro-grams were based on student achievement data andTexas Essential Knowledge and Skills in mathemat-ics, science, and technology developed by the TexasEducation Agency (TEA).
Summary Progress to DateProfessional Development – Curriculum
HU-LINC provided HISD science teachers withprofessional development in technology and the BaylorScience Leadership Program (BSLP) for ElementaryScience Lead Teachers (ESLT), elementary teach-ers, and those replacing ESLTs who left the initiative.Teachers continued to access the Electronic Com-munity of Teachers (ECOT) technology tutorials atRice University and Texaco STARS workshops wereprovided by the Houston Museum of Natural Sciencefor second grade teachers. TEXTEAMS training inScience Systems; constancy and change; and prop-erties, patterns and models was provided to ESLTsand elementary teachers. The Rice Model LabProgram for middle school teachers was conductedagain during this grant year. Summer training activi-ties included Inquiry-Based Science Kit Institutes,and Say Yes Summer Institute for ESLTs and elemen-tary teachers. HU-LINC training for secondary leadteachers included middle school science and Biology,Chemistry, and Physics.
All mathematics teachers participated in adistrictwide one day training workshop. In addition,HISD held training sessions throughout the year. Thedistrict also held mathematics model lessons for 2ndand 3rd grade teachers. TEXTEAM mathematicstraining addressing early elementary math, andproportionality and numeric reasoning for middleschool teachers, Algebra I, Algebra II, and Pre-Calculus. HU-LINC training included Algebra I/Inte-grated Physics and Chemistry (IPC) and Algebra II/Chemistry for high school teachers.
The Project CLEAR Summer 2001 Institute con-ducted professional development for both mathemat-
2 0 0 0 -2 0 0 1 2 0 0 1 -2 0 0 2
E th n ic ity N % N %
A fr. A m e r. 6 6 ,9 3 0 3 2 .1 6 5 ,9 5 1 3 1 .3A s ia n 6 ,0 9 8 2 .9 6 ,3 3 6 3 .0H is p a n ic 1 1 4 ,5 6 1 5 5 .0 1 1 8 ,2 0 0 5 6 .1N a t. A m e r. 1 1 6 < 0 .1 1 2 1 < 0 .1W h ite 2 0 ,7 5 7 1 0 .0 2 0 ,0 6 2 9 .5E c o n . D is a d v . 1 6 0 ,6 1 6 7 7 .0 1 6 6 ,4 2 9 7 9 .0T o ta l 2 0 8 ,4 6 2 1 0 0 .0 2 1 0 ,6 7 0 1 0 0 .0
Houston Independent School District StudentDemographics: 2000-2001 and 2001-2002
HOUSTON URBAN LEARNING INITIATIVES IN A NETWORKED COMMUNITY
2001–2002

2 HISD RESEARCH AND ACCOUNTABILITY
HOUSTON URBAN LEARNING INITIATIVES IN A NETWORKED COMMUNITY: 2001–2002
ics and science instruction for ESLTs school repre-sentatives. At the secondary level, activities wereheld for middle school mathematics and science leadteachers; middle and high school IPC lead teachers,Algebra I lead teachers; middle and high schoolscience IPC teachers. High school lead teachersparticipated in Biology, Chemistry, Physics, AlgebraI, Algebra II, and Geometry training.
Implementation of Project CLEAR included thedevelopment of mathematics model lesson plans andexemplars, and revision of the curricular materials forelementary mathematics and Algebra I. In science,curricula for K-8 and high school Chemistry and IPCwere revised. Science exemplars for K-8, IPC, andBiology were being developed. Also, model lessonplans were being developed for 6th grade, IPC, andBiology.Technology and Resource Support
During the 2001-2002 school year, HU-LINCwebsite capabilities were added beyond the previousyear. In addition, HU-LINC website links with informalscience coalition members and on-line applicationprocesses for training were updated and Texas Schol-ars information was added to the site.
In addition, HU-LINC teachers continued toreceive resources such as: laptop computers, largeT.V. monitors, carts, internet access in the classroomand at home, and computer microscopes.TEKSTOOLS Kits were developed Cohort 3 elemen-tary schools. Inquiry-Based Science Kits were avail-able for trained ESLTs. HU-LINC Specialists andSecondary School Mentors to elementary teachersand ESLTs.Parents and Community
Parent HU-LINC activities included: TexasScholars information to parents, HU-LINC scienceand mathematics Family Nights for elementaryschools, HISD television programming for parents,and Parent Reconnect Workshops.Coalitions
The HU-LINC University/College Coalitions pro-duced middle school offerings for mathematics andscience teachers, Algebra I/IPC institute, Algebra 2/Chemistry Institute, Project CLEAR and Texas As-sessment of Knowledge and Skills (TAKS) updates,presentation to coalition members, and collaboratedon grants. The HU-LINC Informal Science Coalitionorganized Family Adventures for elementary schoolsand collaborated with University/College coalitionsfor teacher course offerings, and worked with the HU-LINC Parent Task Force for catalog of field experi-
ences. In the HU-LINC Educational Support Coali-tion, Texas Instruments, Texas Science Center,Texas Region IV Education Science Center, andTexas State Systemic Initiative sponsored activitiesfor teachers to support training for mathematics andscience instruction. Collaborated with Harris CountyDepartment of Education for the GEMS Training. TheHU-LINC Business Task Force sponsored SECME,GCTAME, and Say Yes. The Texas Scholars pro-gram collaborated efforts with the Greater HoustonPartnership (GHP) to present the Texas Scholarsprogram to over 13,700 8th graders and 20,100 9th
graders in their classroom and held a luncheon tohonor 5,545 students in the class of 2002 as TexasScholars.Student Achievement
Texas Assessment of Academic Skills (TAAS)mathematics test performance for all students in-creased at the 3rd through 8th and 10th grade level,ranging from eight percentage points at the 3rd gradelevel to three percentage points at the 5th and 8th gradelevel. TAAS science test performance for all studentsat the 8th grade level increased by five percentagepoints. The gap between White and African Americanstudents on TAAS mathematics decreased at the 3rdthrough the 8th grade and the 10th grade level, with thelargest reduction at the 3rd and 6th grade levels byseven percentage points. The gap between White andAfrican American 8th grade students also decreasedby one percentage point on the TAAS science.
Stanford 9 mathematics test performance de-creased at all grade levels except 7th grade which hada gain of one NCE. Stanford 9 science test perfor-mance decreased at the 1st and 4th through 10th
grades, while no changes in NCEs occurred at 2nd, 3rd,
and 11th grade levels. Gaps between White andAfrican American students on the Stanford 9 math-ematics test decreased at all grade levels except 7th
grade which remained the same. Gaps betweenWhite and Hispanic students on the Stanford 9 math-ematics test decreased at all grade levels except 7th
remaining unchanged. Gaps between White andAfrican American students on the Stanford 9 sciencetest decreased at the 2nd, 3rd, 8th and the 10th grades;increased at the 1st, 4th, 5th, 6th, 7th and 9th; and NCEsat the 11th grade remained unchanged. Gaps betweenWhite and Hispanic students on the Stanford 9 sci-ence test decreased at the 2nd, 3rd, 8th, and 11th grade;increased at the 1st, 7th, and 9th grades; and the NCEgaps at the 4th, 5th, 6th, and 10th grades remainedconstant.

3HISD RESEARCH AND ACCOUNTABILITY
HOUSTON URBAN LEARNING INITIATIVES IN A NETWORKED COMMUNITY: 2001–2002
DRIVER 1: IMPLEMENTATION OF CURRICULA
Driver I sought to reveal the essential curriculumcomponents of a systemic reform that ultimately willlead to improved student outcomes. It is the goal ofHISD and HU-LINC to implement a comprehensivestandards-based curriculum in mathematics and sci-ence that can be implemented through instructionalpractice. By identifying key elements of the systemicreform initiative in the district’s mathematics andscience curriculum, the administrators for HISD andHU-LINC are accomplishing systemic reform through-out the district.
Beginning in the 1998–99 school year, the stateof Texas adopted a new set of standards, the TexasEssential Knowledge and Skills (TEKS), as the basicelements of knowledge that all students should pos-sess. Furthermore, HISD Board policy required adistrictwide curriculum that exceeded the state re-quirements. Project CLEAR (Clarifying Learning toEnhance Achievement Results) was the district’sresponse to guide HISD in the implementation of thesenew standards. Therefore, Project CLEAR is thedistrict’s instructional planning tool to clarify the newstandards, establish standards for student perfor-mance, and enable teachers to focus their planningtime in a uniform manner to teach the set standards.Project CLEAR provides teachers four basic catego-ries of information for each objective: 1) ContentSpecifications; 2) Prerequisites and Instructional Con-siderations; 3) Assessment Considerations; and 4)Connections to Other Objectives.
All Project Clear Mathematics documents wererevised to include updated assessment information.Elementary documents were updated to include prob-lem solving exemplars. Mathematics syllabi forgrades kindergarten K-8 were developed while theAlgebra I syllabi was revised. Algebra II documentswere in the process of being revised. The Supplemen-tal Mathematics Exemplars in grades K-5 were devel-oped while the Exemplars for grades 6-8 were beingcompleted. While grade 4 Mathematics Model Les-sons were in the process of being developed, theywere developed and implemented for grades 2, 3, and5. The Project CLEAR curriculum documents forAlgebra I, Algebra II, and Geometry were revisedduring this time period.
A K-5 Science Supplement was created to beused in conjunction with the 2000 Project CLEARScience edition. Science curriculum documents forgrades K-8 were revised, as were the documents for
Integrated Physics, Chemistry (IPC), and Biology.Chemistry and Physics documents were developedfor this year. The Science Exemplars for grades K-8 and Biology were in the process of being developed.In the process of being developed were ScienceModel Lessons for grade 6 and the Integrated Physicsand Chemistry (IPC). The Chemistry and Physicsdocuments were developed while the Integrated Phys-ics, Chemistry (IPC), and Biology documents wererevised.
HISD employs several forms of assessmenttests to provide objective and accurate measures ofthe academic levels of students. TAAS measures thestatewide curriculum in reading and mathematics atgrades 3 though 8 and the exit level at grade 10 andin science at grade 8. Spanish-version TAAS testsare administered at grades 3 through 6. Satisfactoryperformance on the TAAS exit level exam is aprerequisite for graduation.
HISD also administers the Stanford 9/Aprenda 2which is a standardized, norm-referenced test that isaligned with accepted curricula and objectives. TheStanford 9 tests students in grades 1-11 in thesubjects of Mathematics, Environment/Science, andother subjects. Students in grades 1 and 2 are giventhe Environment subtest while students in grade 3-11are given the Science subtest. Students with limitedEnglish proficiency (LEP), in grades 1-9, receivinginstruction in Spanish are administered the Aprenda2 in place of the Stanford 9.
Texas End-of-Course examinations measure thestatewide curriculum of certain high school coursesincluding Algebra I and Biology I in order to ensure thathigh academic standards are being met. Further-more, if students meet satisfactory performancelevels on the end-of course exams they will also havemet the requirements for graduation and can foregothe exit level TAAS.
The Mathematics Department works in collabo-ration with HU-LINC to provide support for Algebra I-IPC and Algebra II-Chemistry programs, TeachersTeaching with Technology, and Rice Universitycourses for teachers. The Mathematics Departmentalso works with the Department of Technology toimplement the Carnegie Program in high schools andto continue the Algebra I Initiative that providescomputers, software, and graphing calculators.Through Eisenhower funding, the Mathematics De-partment provides: Professional development sup-port for teachers of grades K-8 in implementingProject CLEAR; Summer training for elementary

4 HISD RESEARCH AND ACCOUNTABILITY
HOUSTON URBAN LEARNING INITIATIVES IN A NETWORKED COMMUNITY: 2001–2002
offered a number of training topics to teachers ofdifferent grade levels and subjects. During the thirdyear of the initiative, teachers participated in a num-ber of professional development opportunities spon-sored by local universities and scientific organiza-tions such as: The Museum of Health and MedicalScience, the University of Houston-Central Campus,Rice University, the University of Houston-ClearLake, the US Satellite Laboratory, the University ofHouston-Downtown, Baylor College of Medicine,Houston Community College, and Texas SouthernUniversity. These organizations developed coursesincluding: “My Health, My World” for ESLTs; Math forElementary Teachers; Environmental Interaction;Integrated Math/Science; Math in a Science Museum;Titanic/Nobel Laureates; Superconductivity Topics;Middle School Math Institute; Physics and Chemis-try, Teaching with Inquiry Kits; Technology in MiddleSchool Mathematics; Bayou Water Studies; Math-ematics for Teachers; Astronomy for Teachers;Nanoscience for Integrated Physics and Chemistry;Signals of Spring; The Air We Breathe; ExploringIntegrated Physics and Chemistry; Medical Myster-ies; Algebra for Elementary Teachers; Geometry;Middle School Mathematics Topics; and Physics andChemistry for Grades 5-7.
The Baylor College of Medicine in conjunctionwith Rice University and HISD provide an intensivethree week professional development for elementaryscience teachers as an induction to become anElementary Science Lead Teacher. There are 30hours of required HU-LINC professional developmentfollow-up training that occurs during the academicyear for ESLTs. Each training session is designed tomeet the needs of the ESLTs along one of the followingstrands: Assessment, Curriculum Connections/Inte-gration, Science Materials/Resources, or Science
teachers in implementing the use of manipulatives intheir classrooms; and Eisenhower two-day staff de-velopment modules. The Rice University SchoolMathematics Program (RUSMP) serves as a bridgebetween the Rice research community and HISD K-12 mathematics teachers and administrators. Thisprogram enhances teacher pedagogical knowledge ofmathematics and provides support for effective mathinstruction. RUSMP has developed an extensivearray of programs and courses that include long-term,intensive, professional development for teachers andday-long workshops.
The Science Department has produced severalinitiatives with various components. Many of theseinitiatives include professional development opportu-nities and enhanced curriculum instruction. TheSummer Training sessions provide curriculum imple-mentation and module delivery training for HU-LINCCohort science lead teachers, Project CLEAR sci-ence lead teachers, and Say Yes core teachers. Thetwo science programs, Southeast Consortium forMinorities in Engineering (SECME) and Gulf CoastTexas Alliance for Minorities in Engineering (GCTAME)agreed to pool their resources to increase the numberof minority students interested in pursuing careers inscience, mathematics, engineering, and technology.The annual Science Fair continues to generate tre-mendous students and staff participation. The MarcileHollingsworth Science Center (formally the LivingResource Center) supplies live specimens to teach-ers in grades K-12 for hands-on, laboratory instruc-tion. This year LRC staff members and HU-LINCSpecialists provided teacher inservices for ProjectCLEAR, HU-LINC, and school yard pond habitats.
HU-LINC and the HISD Curriculum Departmentcollaborated with local universities and organizationsto arrange and provide a plethora of professionaldevelopment opportunities for mathematics and sci-ence teachers during the year. The professionaldevelopment targeted all grade level teachers inmathematics and science. The table below providesa list of HU-LINC Coalition Partners and the numberof teachers that each trained during the third year ofthis reform initiative.
The HU-LINC University/College Coalition devel-oped courses to educate teachers in the subject areasof mathematics and science from the Fall of 2001through the Summer of 2002. All HU-LINC profes-sional development is based on student achievementdata, teacher needs surveys, technology integration,and Project CLEAR. Several of these institutions
HU-LINC Coalition PartnershipNumber ofTeachers
Baylor Coll. of Med./Rice Univ. 198Hou. Comm. Coll. 8Museum of Health & Med Sci. 35Museum of Natural Sci./Rice U. 15Rice Univ. 166Texas Southern Univ. 33Univ. of Houston 76Univ. of Houston-Downtown 108Univ. of Houston-Clear Lake 4U.S. Satellite Laboratory 37Totals: 10 Partnerships 680
Training Provided by HU-LINC Coalition Partners,Fall 2001 through Summer 2002

5HISD RESEARCH AND ACCOUNTABILITY
HOUSTON URBAN LEARNING INITIATIVES IN A NETWORKED COMMUNITY: 2001–2002
The professional development opportunities forScience teachers were numerous. HU-LINC ESLTsin Cohort’s 1,2, and 3 attended Technology Trainingfor Attrition and the Baylor Science Leadership Pro-gram for Attrition. Regular Science Classroom teach-ers attended both of these programs. ESLTs in allthree Cohorts and their mentors attended the HU-LINC Follow-up Sessions and after-school work-shops throughout the academic year. Cohort 1 and2 ESLTs attended Summer Institutes while ESLTs inCohort 3 were involved in the Inquiry-Based KitSummer 2002 Institutes.
Science teachers at all grade levels participatedin HU-LINC professional development training ses-sions. For example, second grade teachers couldattend the Texaco STARS workshops that wereprovided by the Houston Museum of Natural Science.Another unique training opportunity was the Elec-tronic Community of Teachers (ECOT) technologytutorials. These tutorials were held on Thursdays atRice University.
Other HU-LINC professional development oppor-tunities targeted entire grade levels. Elementaryteachers were able to attend the Say Yes SummerInstitute as well as the GEMS workshops. MiddleSchool teachers participated in the Rice Model LabProgram. Lastly, physics teachers at the high schoollevel were provided the opportunity to attend thePhysics Institute.
Several mathematics professional developmentsessions were completed throughout the academicyear. These tended to be a bit more global andencompassed a larger proportion of mathematicsteachers. The Mathematics and Algebra Initiativesthat are currently underway throughout the districthave spawned such professional development oppor-tunities as the Algebra Academy training program andthe HISD Model Lessons for second and third grade.Each year the district holds a districtwide Mathemat-ics In-service for all HISD teachers. Here, teachersof all subjects are shown ways to incorporate math-ematics concepts into their lessons. Additionally,HU-LINC integrated mathematics and science train-ing. High school teachers received 100 hours incontent integration, technology integration, and a two-week summer application institute in the subjects ofAlgebra I/Integrated Physics and Chemistry andAlgebra II/Chemistry.
HISD created a series of professional develop-ment training institutes during the summer to helpteachers become accustomed to Project CLEAR
Inquiry and Technology. The following Table showsthe HISD Elementary Science Lead Teacher Profes-sional Development Model.
Elementary Science Lead Teacher (ESLT)Professional Development Model
Tech/Baylor Sci.Summer-90 hours Leadership
Strands-Level 1;Year 1School Year- 30 hours TEXTEAMSSummer-30 hours Inquiry Kits
Strands-Level 2;Year 2School Year- 30 hours TEXTEAMS/PortfolioSummer-30 hours Level 2 Data Driven
Strands-Level 3;Year 3School Year- 30 hours TEXTEAMS/Portfolio
A major source of professional development inHISD is the Texas Teachers Empowered for Achieve-ment in Mathematics and Science (TEXTEAMS)program. This program, developed by the TexasState Systemic Initiative and the Dana Center, pro-vides professional development for elementary, middle,and high school mathematics and science educatorsin Texas. These programs are designed using stu-dent achievement data and provide materials de-signed to assist educators in understanding andimplementing the Texas Essential Knowledge andSkills (TEKS) and TEKS-based assessments. El-ementary Science Lead Teachers Local Leaders inCohort’s 1, 2, and 3 all participated in TEXTEAMSScience training. Cohort 1 ESLTs in grades 3-5received Science Systems training. Cohort 2 ESLTsin grades K-2 and 3-5 attended TEXTEAMS trainingin the areas of Science Properties, Patterns andModels. TEXTEAMS programs for Cohort 3 ESLTsin grades K-2 and 3-5 were held in the area of ScienceConstancy and Change. Apart from the three Cohortthat participated in these training sessions, otherelementary teachers participated in TEXTEAMS pro-grams for Science Systems, Constancy and Change,Properties, Patterns and Models while Middle Schoolteachers attended TEXTEAMS for Science Systems.
TEXTEAMS professional development trainingsessions were conducted for mathematics teachersof all grade levels. Teachers of grade levels PK-2attended TEXTEAMS Mathematics training. MiddleSchool teachers participated in TEXTEAMS trainingin the content areas of Proportionality and NumericalReasoning. In addition, TEXTEAMS programs wereheld for teachers in the following curriculum areas:Algebra 2002, Algebra I 2000 and Beyond, Algebra II,and Pre-Calculus.

6 HISD RESEARCH AND ACCOUNTABILITY
HOUSTON URBAN LEARNING INITIATIVES IN A NETWORKED COMMUNITY: 2001–2002
DRIVER 2: DEVELOPMENT OF POLICIES
The founding documents of HISD’s guiding prin-ciples are outlined in the District’s A Declaration ofBeliefs and Visions. This document was amended inMay 2001 to reflect the changing times and ideals. Itreaffirms HISD’s commitment to the sweepingdistrictwide reform called for in Beliefs and Visionsand encourages every facet of the district to helpHISD achieve its vision of assuring all children thehighest quality elementary and secondary educationavailable anywhere. Of utmost importance to thedistrict is its student’s success in the areas ofmathematics and science. Each of the policies thatwere created or modified for this school year incorpo-rate the areas of mathematics and science into thetheir designs.
The first step in making sure every learner has achance to succeed begins with developing a plan.HISD administration and Board Policy require centraloffice departments, administrative districts, andschools to create detailed Management Plans tosupport state and district goals.
Each school in HISD submits a School Improve-ment Plan (SIP). It is each school’s responsibility toidentify all the objectives they must meet for theappropriate time frame. Schools arrive at theseobjectives from state mandates and district-stated
goals. Mathematics and science objectives are listedalong with the appropriate strategies and initiatives toaccomplish the stated objectives. These plans alsorequire appropriate resources, both human and capi-tal, that will be needed and the specified time lines.Student performance data and any measure of perfor-mance is required to be disaggregated by all account-ability student groups including ethnicity and race,free and/or reduced lunch status, gender, and allstudent populations served by special programs.
At the beginning of the 2001–2002 school year,HISD raised the Promotion Standards to make stu-dent performance as close to grade level as possiblebefore promotion to the next grade. A student musthave a passing score on the TAAS test, an appropriatescore on the Stanford/Aprenda 2, and passing grades.A student who does not meet all three criteria forpromotion will be required to attend summer school orwill not be promoted to the next grade.
The Texas Education Agency (TEA) Accountabil-ity System is a method for evaluating school districtsand campuses with regard to their student perfor-mance on certain base indicators. One of thoseindicators is student performance in mathematics onthe Texas Assessment of Academic Skills (TAAS).To determine a campus’ or district’s classificationperformance on the TAAS, this indicator, as well asother indicators are examined for all students as wellas for each student group (African American, His-panic, White, and Economically Disadvantaged).Several changes were incorporated into the 2002 TEAAccountability System including raising the Academi-cally Acceptable/Acceptable TAAS passing rate stan-dard for all subjects including mathematics to 55.0percent from 50.0 in the previous year.
While all districts in the state of Texas mustadhere to the Texas Education Agency’s Accountabil-ity System, HISD also implemented its own account-ability systems. In addition of the TEA system, Boardpolicy requires HISD schools to adhere to the HISDAccountability System, Scholars Accountability Sys-tem, and the Performance Indictors. In previousyears in HISD, a campus’ Current Performance ratingwas based solely on its TAAS performance. For the2001–2002, a campus’ Current Performance ratingwas based on TAAS and Stanford 9/Aprenda 2 perfor-mance weighted differently at 70% and 30%, respec-tively. Both the TAAS and the Stanford 9/Aprenda 2have mathematics performance built into the calcula-tions used to assign ratings. Additionally, the Stanford9 assesses student performance in science. The
documents. This year, several Project CLEAR Sum-mer 2002 Institutes were offered for mathematics andscience teachers. Elementary math lead teachers ingrades K-5 attended the summer institutes whileelementary science teacher representatives attendeda similar summer session. Middle and high schoollead teachers for Integrated Physics and Chemistryclasses were actively engaged during the 2002 Sum-mer Institute. Project CLEAR summer training ses-sions were held for all high school mathematics andscience lead teachers in the following subjects: Biol-ogy, Chemistry, Physics, Algebra I, Algebra II, andGeometry. Finally, the Project CLEAR summerinstitutes were not limited to teachers. HISD admin-istrative staff also participated in the training. Princi-pal Institutes were held for Principals to provide themost current information concerning HISD math-ematics and science issues. In conjunction with thePrincipal Institutes, Instructional supervisors attendedsummer inservices on issues centered around theTAKS, Project CLEAR, and Science-Mathematics-Technology reform in HISD.

7HISD RESEARCH AND ACCOUNTABILITY
HOUSTON URBAN LEARNING INITIATIVES IN A NETWORKED COMMUNITY: 2001–2002
indicators that determine a campus’ Current Progressrating differ for elementary and secondary schoolsbut the use of mathematics performance as a keycomponent remains the same. HISD’s AccountabilitySystem only offers a few exemptions on the TAAS andincludes all students who take the test in English andSpanish. Only Limited English Proficient (LEP)students served in bilingual or English as a SecondLanguage (ESL) programs for less than two yearsmay be excluded from the accountability calcula-tions. Also, student’s Admission, Review, and Dis-missal (ARD) committees determine if special educa-tion students are exempt from taking the TAAS or theState Developed Alternative Assessment which isalso used in the accountability ratings.
There were several key changes made to theHISD Accountability System for the 2001–2002 schoolyear. Along with the performance on TAAS, theperformance of non-Special Education students onthe Stanford 9/Aprenda 2 was included. These twotests were weighted 70% and 30%, respectively.Performance on Stanford 9/Aprenda 2 is included indetermining the Current Progress Rating.
At the beginning of the school year, HISD ex-pressed a desire to have all students continue theireducation beyond high school. To meet this goal, thedistrict passed board policy requiring students tocomplete a more rigorous course of study beyond theminimum requirements. Implemented under HU-LINCwith the HU-LINC Business Coalition, the TexasScholars Program encourages students to take col-lege preparatory courses in high school. For ex-ample, students must earn three credits of mathemat-ics that include Algebra I, Geometry, and Algebra II.Also, students must earn three credits from four areasof science that include the following: Integrated Phys-ics and Chemistry; Biology, AP Biology, or IB Biology;Chemistry, AP Chemistry, or IB Chemistry; andPhysics, Principles of Technology I, AP Physics, orIB Physics. In addition to the math and sciencecourses, students are required to earn one credit inTechnology Applications. A student must take threeand one-half credits of electives to earn a scholarsdegree. Two of the three options include taking morecourses in mathematics, science, and/or Career andTechnology. To measure the extent that this goalwould be met, HISD created the Scholars Account-ability System. The District’s Scholars Accountabil-ity System gives high schools a rating based on twocomponents: (1) the percent of graduates who aredesignated as Texas Scholars by completing either
the Recommended High School Program or the Dis-tinguished Achievement Program, and (2) the percentof juniors taking the PSAT examination.
The HISD Performance Indicators report servesto provide schools and the community with the infor-mation to determine how well a school is performingat one glance and whether or not it is moving towardachieving the district’s goals. The performance indi-cators show how well a school is performing now, howwell HISD expects it to perform by the end of theschool year, and where the school should be by theend of the 2004 school year. It is important to note thatthe TAAS and Stanford 9/Aprenda 2 sections of thisreport include math performance by grade level.
Two major initiatives, the Algebra Initiative andthe Mathematics Initiative, support schools as theystrive to increase student achievement. The AlgebraInitiative supports teachers at the elementary, middle,and high school levels. At the high school level, theAlgebra Academy provides ongoing support for teach-ers new to Algebra I through 17 two-hour sessions.The middle school Algebra Initiative continues withweekly meetings on school-time, by grade levels, forgrades 6-8. At the elementary level, the AlgebraInitiative supports teachers in grades 2, 3, and 5 byproviding model lessons for the entire curriculum. Inaddition, one second grade master teacher coordina-tor and one third grade master teacher coordinatorfrom each elementary school meet with the Math-ematics Department for a total of 60 hours during theschool year of professional development to assistthem in sharing the Model Lessons with other teach-ers at their campus. Master teacher coordinators arerequired to conduct training for the teachers of theirgrade levels at their campus. Teachers must receive40 hours of professional development training frommaster teacher coordinators. Fifth grade teacherswho did not participate in some or all of the workshopslast year have the opportunity to attend this year.
No systemwide change can occur without theexpress consent of its top administrators and thegoverning bodies. The policies that were imple-mented and modified for the 2001–2002 school yearprovide a great deal of evidence that HISD supportsits goal of having all learners succeed in mathematicsand science. The areas of math and science areaddressed in the District’s top policies that includePromotion Standards, Management Plans, Account-ability Systems, TAAS exemptions, and the TexasScholars Program.

8 HISD RESEARCH AND ACCOUNTABILITY
HOUSTON URBAN LEARNING INITIATIVES IN A NETWORKED COMMUNITY: 2001–2002
DRIVER 3: CONVERGENCE OF RESOURCES
During the 2001–02 school year, the largestsources of district funds used to support NSF fundingwere applied to professional development and tech-nology support. According to the cost share analysisof HISD in-kind funds for the NSF budget during theactual budgeting period from April 1, 2001 to March31, 2002, total in-kind funds equaled $3,462,523.From this, $545,313 were budgeted for equipment,which included laptops, laptop cases, televisions withlarge screen projection, and television carts. Inaddition, $2,406,882 were budgeted across individualdepartments and initiatives such as Algebra andMathematics initiatives, Science Department, LivingResource Centers, and Rice Model Labs. Stipendsfor middle and high school science lead teachers andelementary, middle, and high school math lead teach-ers were funded by HISD for $175,392. Other items,budgeted at $334,937 by HISD, included connectivitycosts and high speed connections, internet accounts,Rice University’s Electronic Community of Teachers(ECOT), technology trainers, and on-line tests fortechnology training. In leveraging support fundsacross the district for the HU-LINC initiative, HU-LINC contributed to HISD’s providing of over fourtimes the standard 80% amount in support funds, inaddition to NSF’s 20% amount. The only personnelfunding not contributed through HU-LINC was pro-vided by HISD for a Project Manager’s halftime salaryfor technology.
Several grants were awarded to HISD because ofthe HU-LINC partnership between HISD and variousmembers of the Houston community. Through NSF’sGK-12 Teaching Fellows Program, Rice University,University of Houston - Downtown, and University ofHouston - Central supported grants that allowed forfellowships and associated training for graduate stu-dents and advanced undergraduate students in sci-ence, mathematics, engineering, and technology tomentor to middle school, mathematics and scienceteachers and students. As resources for science andmathematics teachers in HISD, improved communi-cation and teaching skills for the Fellows, enrichedlearning by middle school students, professionaldevelopment opportunities for the teachers, andstrengthened partnerships between institutions ofhigher education and HISD occurred. In addition,Baylor College of Medicine provided for a GK-12Teaching Fellows Grant to work with high schoolbiology teachers in the research labs.
A grant from Dell Computer Corporation providedfor laptop computers, and HISD’s Educational Tech-nology trained all teachers at Herod Elementary andJohnston Middle schools. HISD’s Department ofTechnology gave laptop computers, large screentelevisions with stands, Internet Service Providers,and computer microscopes to all cycles of Elemen-tary Science Lead Teachers (ESLT) teachers andmentors. HISD mathematics teachers were providedwith professional development opportunities throughEisenhower, Title II, Part B, and the HISD Mathemat-ics Department with funding from federal and districtsources of $141,819. The Rice University SchoolMathematics Project Summer Campus Program wasavailable for K-12 teachers through three Eisenhowergrants totaling $237,000 and a grant for $6,000 forWharton Elementary School teachers from AIM Man-agement Group. The Baylor College of Medicineprovided the Science Education Leadership Fellows(SELF) program, funded by Howard Hughes Founda-tion, that brought scientists and elementary educa-tors together in a mentoring relationship.
Funded by NSF with $280,000, the programEducation, Outreach, and Training, Partnership forAdvanced Computational Infrastructure (EOT-PACI)provided activities to HISD students and teachers.One activity, in collaboration with Girls, Inc., wasOperation Smart which impacted approximately 40high school girls. In addition, approximately 50elementary students participated in “Say YES toEngineering - National Engineering Week.” Alsofunded by EOT-PACI, nine HISD K-12 teachersparticipated in TeacherTECH.
Sponsored through the Department of Biochem-istry and Cell Biology at Rice University, severalscience education programs were offered for teach-ers in 2001–02. Yearlong programs, such as theElementary Physics and Chemistry Institute, theScience and Mathematics Institute, the Micro toMacro Institute, and the Force and Motion Institute,were funded through a combination of funding fromEisenhower grants (sum of approximately $225,000)and funds from the Howard Hughes Medical InstituteBiological Sciences Programs (estimated at $175,000).A joint project between Rice University and theUniversity of Texas Medical Branch at Galvestonoffered a professional development program on spacescience funded by the National Space BiomedicalResearch Institute at a level of about $75,000 a year.In addition, NSF funded the GK-12 Teaching FellowsProgram with about $450,000 a year.

9HISD RESEARCH AND ACCOUNTABILITY
HOUSTON URBAN LEARNING INITIATIVES IN A NETWORKED COMMUNITY: 2001–2002
Members from the Informal Science Coalition andthe University/College Coalition were able to accessexternal grants because of their connection andpartnership with HU-LINC and HISD. The Children’sMuseum of Houston received $20,000 for FamilyAdventures. Rice University received two grants,one with NASA and one with NSF. Texas SouthernUniversity was also awarded a grant with NASA. SanJacinto College received two grants by incorporatingdocumentation from a HU-LINC survey and a partici-pation agreement signed by HISD officials.
Moreover, the University of Houston - Downtownwas awarded a grant from the Shell Foundation. Thisgrant maintains and extends technologies in scienceteacher training, such as the Science Learning Centerand the Science Teacher Demonstration Lab. Con-tent and professional development strategies fromHU-LINC and incorporated into these workshops.Shell reported that they were very pleased about thecommitment towards training teachers utilizing thebest available technology. Some models and work-shop materials used for the HU-LINC teachers at theUniversity of Houston - Downtown were created us-ing a grant from the Shodor Foundation in conjunctionwith the National Computational Science Instituteand Education, Outreach and Training Partnershipfor Advanced Computing Infrastructure projects.Teachers were exposed to developing a mathemati-cal model using Stella Software and shown how toimplement lesson plans from Project Interactivate.
Several technology resources were provided byHISD and outside contributors to support science andmathematics education. The Center for TechnologyTeaching and Learning (CTTL) at Rice Universityexplored an approach to professional development bycreating the Electronic Community Of Teachers(ECOT) that used advanced networking and elec-tronic studios in a distributed community of practice.Experts and teachers in this linked community en-gaged in training, learning, and shared project work tobenefit classroom instruction.
In a collaborative effort, HISD, Baylor Col-lege of Medicine and Rice developed a plan for trainingHU-LINC participants during the initial three-weekHU-LINC summer session and follow-up phasesacross each year of HU-LINC. HISD provided oneweek of technology training which integrated mathand science with the technology. Applications werenot taught in isolation, but rather when appropriate andmodeled. ESLTs worked on their own HISD pur-chased laptops. ESLTs were introduced to using
FirstClass (the host environment for ECOT) by theRice’s CTTL staff. Technology was integrated through-out the remaining two weeks of training in science andmathematics content. Instructors modeled the use oftechnology in teaching by conducting presentationswith a laptop and projector; by accessing and storingresources in FirstClass; and by using Excel to createspreadsheets and to graph results of experiments,Inspiration for mindmapping, the Intel QX3 micro-scope to magnify, display and film specimens andother software for workshop activities. Trainees alsokept daily journals in FirstClass and communicatedwith each other using messaging systems and e-mail,posted presentations, and shared resources with oneanother, their specialists and HU-LINC family.
HISD’s Department of Technology provided eachHU-LINC teacher with technology training and sup-port, a laptop computer, an Internet Service Provideraccount for their home, a microscope which could belinked to the computer, a large classroom televisionmonitor which could be connected to the laptop, andan account in FirstClass. During the school year,CTTL held weekly technology tutorials covering ev-erything from making and sharing digital video tousing basic e-mail functions.
Staff from Rice University’s CTTL wrote a forma-tive, evaluation report in November of 2001. Thereport was available in the third year of HU-LINC withfindings focusing on the second year of HU-LINC.Results from the evaluation included information onFirstClass and ECOT exclusively. Based on the levelof activity on FirstClass and teacher responses, theECOT/HU-LINC project was successful. However,the interaction with peers throughout the sharedcommunity was not as successful. The evaluatorsconcluded that the ECOT/HU-LINC project did notappear to have resulted in an actively involved,electronic community of teachers within FirstClass.Since the ESLTs have Houston ISD e-mail accountsas well, it is difficult to assess how many teacherswere communicating via the district accounts ratherthan FirstClass accounts.
Expansion of the HU-LINC website in 2001–02,and the usage of leveraged resources, provided moreinformation on the Informal Science Coalition mem-ber institutions; on-line teacher registration forms formiddle school science and mathematics offerings;on-line applications and reapplications for secondaryschool mentors; on-line applications from universi-ties and colleges for middle school offerings; on-lineproposals from members of the Informal Science

10 HISD RESEARCH AND ACCOUNTABILITY
HOUSTON URBAN LEARNING INITIATIVES IN A NETWORKED COMMUNITY: 2001–2002
Coalition; and Texas Scholars information from Busi-ness Coalition members. According the HU-LINCwebmaster, access to the university and collegeMiddle School Offerings were the most frequentlyrequested applications through the website. TheRequest For Proposals on the website were modifiedto accept a wider range of course offerings andincluded the elementary and high school offerings inthe same format. The interactive applications con-tributed to a more organized application process,provided objective information for evaluation proce-dures, and assisted in the preparation of contractswith other HU-LINC participants. Two links that wereadded to the HU-LINC website in 2001–02 were to theHISD Curriculum Department and the Texas Assess-ment of Knowledge and Skills. Several changes werealso made to the web page containing contact infor-mation on HU-LINC specialists.
Members from the Informal Science and Univer-sity/College coalitions were submitted surveys byHISD’s Research and Accountability Department. Ofthose that responded to the survey, one-third reportedthe HU-LINC website to be helpful. Some respon-dents said the website brought new teachers fromvarious schools to their offerings. They said it waseasier, more convenient, and more reliable thanconventional mail. However, three responded that itwas not helpful.
Through teacher preparation courses and thecreation of learning environments that support sci-ence and mathematics education and specific recom-mendations of outside experts were used throughoutthe HU-LINC initiative. Coalition members providedprofessional development based on student achieve-ment data and Project CLEAR that included hands-on,inquiry-based, explorations, cooperative learning,and problem-solving investigations. Students, teach-ers, and parents participated in child-centered, sci-ence and mathematics activities and parent-childinteractions. Organizations specifically reinforcedscience and mathematics concepts for students inschool and at home.
Family Adventures, based on Project CLEAR,and other programs by the Informal Science Coalitionprovided children and their families with opportunitiesto learn science and mathematics. The Children’sMuseum of Houston, Houston Zoological Gardens,Houston Arboretum and Nature Center, Shell and theAmerican Landscape Museum, Friends of HermannPark, Museum of Health and Medical Science, NASAand the Space Center of Houston, the Nature Heritage
Society, and Houston Museum of Natural Scienceadopted all 182 elementary schools to provide FamilyAdventures and opportunities that promoted hands-on, inquiry-based learning. These environmentsreinforced science and mathematics concepts stu-dents were learning in school.
Universities, colleges, and businesses from thesurrounding Houston area supported science andmathematics education in HISD. The central campusof the University of Houston, University of Houston -Downtown, University of Houston - Clear Lake, RiceUniversity, Baylor College of Medicine, Texas South-ern University, San Jacinto College, and HoustonCommunity College provided science and mathemat-ics course work, based on student achievement dataand Project CLEAR, for elementary and secondaryteachers. The courses encompassed content suchas Algebra I, inquiry-based learning technology, as-tronomy, and geology. Members from the HU-LINCInformal Science Coalition worked with HU-LINCUniversity/College Coalition to provide professionaldevelopment. This cross collaboration, along withother HU-LINC Coaltions, occurred throughout theyear.
For students, coalition members began prepara-tions for a science and mathematics field experiencecatalog in 2001–02. Businesses and organizationssuch as Keep Houston Beautiful, Texas Instruments,Texaco, IBM, and Greater Houston Partnership pro-vided learning experiences for students and parents,as well as training for teachers. Several businessesfrom the surrounding area also participated in presen-tations through the Texas Scholars Program at HISD.In addition, the HISD Technology Department playeda significant role in providing education to teachers intechnology aspects of the science and mathematicscourses.
Other resources and areas of support for the HU-LINC initiative included mentors, specialists, inquiry-based kits, and other equipment for teachers. HU-LINC Secondary School Mentors worked with allcycles of ESLTs who participated in 2001–02. HU-LINC Specialists provided support for all three cyclesof schools. Hand-held technology and probes weregiven to middle and high school teachers in AlgebraI/IPC and Algebra II/Chemistry programs. HU-LINCcontinued to provide to Cohort 3 ESLTs, TEKSTOOLSKits, based on Project CLEAR and TEKS. Inquiry-based kits correlated with Project CLEAR were alsogiven to ESLTs and mentors in the first two cycles ofthe HU-LINC initiative.

11HISD RESEARCH AND ACCOUNTABILITY
HOUSTON URBAN LEARNING INITIATIVES IN A NETWORKED COMMUNITY: 2001–2002
teachers that participated in professional develop-ment activities were identified in Cycle 1999, Cycle2000, and Cycle 2001. As each year’s professionaldevelopment and training activities increased, so didteacher’s needs to attend and participate. Cycle 1999teachers wanted to attend additional training extend-ing the three-year program and, therefore, partici-pated in the summer of 2002. Overall, teachers fromeach cycle logged 4,267 hours of professional devel-opment in 2001–02.
From the Elementary Science Lead Teacher(ESLT) program, the number of training hours in-creased as teachers in all three cycles of HU-LINCparticipated. For the 2001–02 year, the total numberof hours in each cycle of teachers was as follows: 741hours in Cycle 1999, 928 hours in Cycle 2000, and1,987 hours in Cycle 2001. In order for a teacher tobecome an ESLT, they first attended a three-weekBaylor Science Leadership Program provided by theHISD Technology Department and Baylor College ofMedicine. From these two trainings, teachers ac-crued 3,618 hours from the Baylor Science Leader-ship Program and 1,920 hours from the TechnologyDepartment. There were a total of 398 participatingteachers from all three cycles, the Baylor ScienceLeadership Program, and the Technology Depart-ment.
Rice University offered science education pro-grams sponsored through the Department of Bio-chemistry and Cell Biology in 2001–02. The coreprofessional development programs included the El-ementary Physics and Chemistry Institute and theScience and Mathematics Institute for elementaryteachers, the Micro to Macro Institute and Force andMotion Institute for middle school teachers, and theGalveston Bay Project for both levels. Of the 54middle school and 74 elementary school teachers, atleast 90% were HISD teachers who participated inthese programs. In addition, Rice University offereda space science program for teachers through a jointproject with the University of Texas Medical Branchat Galveston and the Museum of Natural Science.There were approximately 8 HISD and 8 non-HISD/Houston area high school teachers. Rice University,University of Houston - Downtown, and University ofHouston - Central provided the GK-12 TeachingFellows Program which impacted 14 middle school,math and science teachers and their students, ap-proximately 2,100 students total. Baylor College ofMedicine’s GK-12 Program had research scientistsworking with high school biology teachers. The GK-
DRIVER 4: BROAD-BASED SUPPORT
Through the process of creating more efficientand systemic ways in coordinating efforts with HISDand its partners, HU-LINC leveraged resourcesthrough community coalitions, created parent en-gagement activities, integrated informal learning ex-periences, and provided access to content experts.To increase student performance, graduation rates,college admissions, and careers in science, math-ematics, and technology, HU-LINC utilized resourcesfrom community coalition members. Parents wereengaged as partners and experienced ways to helptheir children on becoming active learners throughfamily events, informal community learning opportu-nities, school Family Math/Science Nights, careerawareness, and college preparation. With the inte-gration of informal learning experiences, schoolspartner with HU-LINC Coalition members to provideexperiences for students, teachers, and parents byenriching the science and mathematics curriculum.Teachers and students also received regular accessto experts and mentors through a combination of fieldexperiences and technology-mediated activities. Di-rectly linked to the classroom instruction of scienceand mathematics, HU-LINC provided a program inHISD based on support from parents, policy makers,institutions of higher education, businesses and in-dustries, foundations, and community-based organi-zations.
The University/College Coalition developed andprovided inquiry-based learning through extensivecollaborative efforts with HU-LINC. One effort wasRequest For Proposals (RFPs) for the elementarysummer institutes, Middle School Offerings for sci-ence and mathematics teachers, Algebra I/IPC Insti-tute, and Algebra II/Chemistry Institute. The RFPsprovided a process by which universities, colleges,and other organizations could apply to provide forprofessional development programs designed by HISDmathematics and science teachers, based on studentachievement data and Project CLEAR, which in turnsupported the HISD/NSF Urban Systemic InitiativeProgram.
Professional development opportunities were alsogreatly enhanced through the University/College Coa-lition and the collaborations thereof. While teachermobility was a growing factor in tracking teachertraining and the use of cohorts became misrepre-sented, cycles of teachers became the new designa-tion for tracking and scheduling. The three cycles of

12 HISD RESEARCH AND ACCOUNTABILITY
HOUSTON URBAN LEARNING INITIATIVES IN A NETWORKED COMMUNITY: 2001–2002
were to be followed. Mentors received free internetaccounts for their home usage from HU-LINC, as wellas laptop computers, televisions and carts, member-ships in Rice University’s Electronic Community ofTeachers, weekly technology tutorials at Rice Uni-versity, and Intel Microscopes, all for professionaluse. For 2001–02, mentors participated in 556 hoursof mentor training, whether through school-spon-sored workshops, inservices, university and collegecourses, commercial workshops and agencies, HISDofferings, or HU-LINC offerings.
By networking programs to support HU-LINC, theInformal Science Coalition expanded its collaborativeefforts in the third year of the program. Houston areainformal science institutions and related organiza-tions provided quality learning experiences for stu-dents, teachers, and families that reflected local,state, and national learning objectives in science andmathematics. Aligned with Project CLEAR, FamilyAdventure activities in the Informal Science Coalitionwere expanded to each of the cycles or cohorts ofelementary schools in 2001–02. There were 152(83%) schools participating in Family Adventureactivities in 2001–02.
The Houston Arboretum and Nature Center par-ticipated with two elementary schools, Briargrove andEaster, through the Family Adventure activities. Therewere approximately 80 students from both schools.Briargrove Elementary students participated in aTexas wildflowers activity and Easter Elementarystudents examined animals in a pond study.
Shell and the American Landscape Museumparticipated with several schools over the 2001–02school year. There were approximately 30 studentsper school who toured the museum and were involvedin Family Adventure activities. According to theirsurvey results, both the students and teachers ben-efitted from the activities with Shell. The museumcoordinators found the teachers to be very helpful andsupportive, as well.
Friends of Hermann Park provided Family Adven-ture activities to nine schools, with approximately 540students, 12 teachers, and 60 parents. According totheir survey results, parents perceived the FamilyAdventure activities as excellent, overall, with re-gards to the science, mathematics, and technologylearning activities of their child’s experiences.
The Museum of Health and Medical Scienceoffered Family Adventure activities to 29 HISD schools,with approximately 1,500 students, 30 teachers, and250 parents. The number of schools participating
12 Teaching Fellows Program provided fellowshipsand associated training for graduate students andadvanced undergraduate students in science, math-ematics, engineering, and technology to serve asresources for middle and high school teachers. TexasSouthern University, Museum of Natural Science,Rice University, NASA, and University of Houston -Downtown provided two-week summer institutes forapplication integration for teachers participating in thehigh school Integrated Math/Science Program.
Of the Elementary School Offerings (ESO) andMiddle School Offerings (MSO), the number of hoursteachers were trained increased at each occurrence.The Fall 2001 ESO hours totaled 3,181 and increasedto 7,230 hours in the Summer 2002 ESO. Of the MSO,there were 608 hours logged from the Fall 2001, 1,902hours in the Spring 2002, and 2,313 hours in theSummer 2002. From the ESO and MSO, 396 teachersparticipated.
Texas Teachers Empowered for Achievement inMathematics and Science (TEXTEAMS) was pro-vided to HISD teachers in 2001–02. TEXTEAMS wasa TEKS/standards-based professional developmentprogram for elementary, middle, and high schoolmathematics and science educators.
Other educational support in 2001–02 was pro-vided through numerous collaborations with Houstonarea businesses and educational institutions. TexasInstruments and Vernier assisted in customizingAlgebra II/IPC and Algebra II/Chemistry Institutes.The Texas Region IV Educational Service Center forTEXTEAMS training continued their collaborativeefforts with HISD. The Harris County Department ofEducation partner with Shell Oil Company to bringGreat Explorations in Math and Science (GEMS)summer workshops to elementary and middle schoolteachers.
The HU-LINC Mentor Partner Program providedcurricular and instructional support in content andpedagogy for HU-LINC ESLTs. The Mentor Hand-book was developed as a guideline to implementingsuccessful mentor partnerships and the organiza-tional tools for documenting this process. With theexpanding program, meetings grew, follow-up ses-sions began, and a survey was started to track theprogress of the program. Each mentor and menteekept a log of contacts made, whether through face-to-face meetings, telephone conversations, or e-mailcontacts. Once a mentor was accepted into theprogram, a specified number of hours of professionaldevelopment and collaborations with ESLT partners

13HISD RESEARCH AND ACCOUNTABILITY
HOUSTON URBAN LEARNING INITIATIVES IN A NETWORKED COMMUNITY: 2001–2002
class.Presentations were given to 12,987 eighth grade
and 16,711 ninth grade students in 2001–02. Therewere a total of 466 presentations to eighth gradestudents and 302 presentations to ninth grade stu-dents. Increasing from 34 participating businessesand organizations in 2000–01, there were 46 differentbusinesses and organizations presenting in 2001–02.The majority of presentations were given by employ-ees of Bank of America, Duke Energy, GreaterHouston Partnership, Houston Community College,Reliant Energy, Southwestwern Bell, Sterling Bankand Wells Fargo. The Hispanic Forum gave apresentation on Texas Scholars to parents, in additionto the students.
The Shell Foundation was also a member of theBusiness/Industry Task Force where career aware-ness activities were provided to HISD students, inaddition to Texas Scholars; Greater Houston Partner-ship; Science, Engineering, Communication, Math-ematics Enhancement (SECME); and the Gulf CoastAlliance of the Texas Alliance for Minorities in Engi-neering, Inc. (GC TAME). From Shell’s “Say YES”activities In 1999–2000, there were a total of 97campus events and field trips attended by over 9,000students and their family members. In 2000–01, therewere 111 total activities attended by over 9,800students and their families. This number grew againin 2001–02 whereby 113 total activities were attendedby approximately 10,980 students and their families.These campus events included various science,mathematics, and technology field trips to placessuch as the Nature Heritage Society, The HoustonShip Channel, Texas Parks and Wildlife, Texas Expo,Math/Science Olympics, and Engineering Week atRice University.
While over 290 students competed in the ScienceEngineering Fair of Houston, approximately 600 middleschool and 375 high school, students and teachers,participated in SECME and GCTAME activities in2001–02. From the regional competition, approxi-mately 200 students participated. From the scienceand mathematics competition, there were approxi-mately 200 students who participated. In addition,there were over 40 teachers involved with SECMEand GCTAME activities in 2001–02.
Technology companies, in collaboration with theGreater Houston Partnership, provided higher levelcomputer courses and industry certification coursesto HISD high school students. Two of these programs
increased by 50% from the previous year. Increaseswere also found among the number of students,teachers, and parents participating from the previousyear, by 30%, 50%, and 40%, respectively. Inaddition, parents perceived the activities to be goodexperiences for their children.
The Children’s Museum of Houston providedFamily Adventure activities to 36 schools, and tomore than 6,000 students, teachers, and parents.Overall, parents said the Family Adventure activitieswere excellent for their children’s learning experi-ences.
The Children’s Museum of Houston providedParent Stars sponsored by the Touch Science Pro-gram of the Texaco Foundation and Family Adven-tures activities aligned with Project CLEAR and theTexas Essential Knowledge and Skills (TEKS), andcollaboratively funded by HISD and Texaco. ParentStars was designed to increase scientific thinking andunderstanding of science and parent’s commitment totheir child’s achievements. Through Parent Stars,seven schools, including students, parents, teach-ers, and principals, were served in HISD in 2001–02.
NASA and the Space Center of Houston invitedthe same three elementary schools from the previousyear to participate. One school did participate bring-ing approximately 150 students and 15 adults, bothteachers and parents. The other two schools reportedto the Space Center coordinator that they were notaware of the opportunities available to them with theSpace Center of Houston, and were therefore notprepared to participate in the Family Adventure activi-ties.
The Houston Zoo had 148 people, 99 students and49 adults, to attend their Family Adventure activitiesfrom Milam, Port Houston, Rice, Stevenson, andTurner elementary schools. Workbooks and tourguides were provided in both English and Spanish. AllHISD third grade students participated in field expe-riences at the zoo based on Project CLEAR.
The Business Task Force, to be developed intothe Business/Industry Coalition, included membersof the Greater Houston Partnership who assisted inthe collaboration of the Texas Scholars Program.Through this collaboration, over 196 business part-ners of the Greater Houston Partnership were trained.These business partners presented the Texas Schol-ars Program to eighth and ninth grade students. ATexas Scholars luncheon was held in honor of the5,545 Texas Scholars from the 2002 graduating

14 HISD RESEARCH AND ACCOUNTABILITY
HOUSTON URBAN LEARNING INITIATIVES IN A NETWORKED COMMUNITY: 2001–2002
provided by Keep Houston Beautiful and the Mayor ofHouston’s Keep Houston Clean.
In addition to collecting information from coalitionmembers in regards to their participation with HU-LINC, a survey was submitted to all coalition mem-bers by the HISD Research and Accountability De-partment. The 11 coalition members that respondedto the survey said they did develop an evaluation toolto analyze the effectiveness of the activities that wereoffered. These members said they found the toolprovided honest input regarding the offerings. Teach-ers wanted to participate in more programs, madesuggestions, and applied what they learned.
When coalition members were asked about theextent to which the goals of their institution had beenaccomplished because of their partnership with HU-LINC, 17% said their goals were fully met, while goalswere partially met by 83% of respondents. Memberswere asked from whom they received strong supportfor the HU-LINC initiative. Citing multiple sources,the respondents cited HU-LINC specialists, 75%;HISD administrators, 50%; HISD teachers, 42%;local businesses and community members, 25%;federal and other financial resources, 17%; and othersources including their own institution, 8%.
Coalition members were also asked to identifyHU-LINC factors that reduced their effectiveness.Most frequently cited responses were poor supportfrom parents, 25%; HISD administrators, 17%; HISDteachers, 17%; other support systems, 17%; andfederal funding and other financial resources, 8%.Examples of other support systems were slow con-tract negotiations, paperwork being lost in the mail,and the coalition member’s own institution doing apoor job of relaying information to HISD principals andteachers in a timely manner. Actions taken bycoalition members to improve support included handdelivering paperwork, creating a stronger program toincrease teacher enthusiasm, using more coordina-tion in ordering school buses for students, and im-proving communication with teachers and adminis-trators.
Coalition members were asked if the HU-LINCinitiative should be continued, and if so, why. Eighty-three percent of respondents said the initiative shouldbe continued, while 17% said they were undecided.No reasons were given from the 17% who wereundecided; however, there were several reasonsgiven for continuing the partnerships, such as:• “There is still a large number of teachers whose
were Microsoft’s Authorized Academic Training Pro-gram and Cisco’s Networking Academy. SouthernMethodist University provided Microsoft training forteachers and students in three HISD high schools.Ten high schools participated in Cisco NetworkingAcademies in 2001–02.
HISD was selected as one of three sites acrossthe country to pilot the Skills4Success program, partof the Cisco Softskills Program. The SoftskillsProgram is a companion curriculum for the CiscoNetworking Academy, jointly developed by Cisco andTECH CORPS. HISD underserved schools thatpiloted the program were Davis, Kashmere, Reagan,and Washington high schools, and Middle College forTechnology Careers. The Houston Area TechnologyAdvancement Center provided volunteer coachesfrom information technology companies in Houston.In addition, Technology for All, a nonprofit organiza-tion that provided Technology Learning Centers tounderserved areas of Houston, opened the MilbyOutreach Center in 2001–02.
HU-LINC’s Community/Government Coalitionalso involved Houston area organizations such as theMayor of Houston’s Keep Houston Clean and KeepHouston Beautiful. The Adopt-a-Block Program withHISD schools continued its development throughKeep Houston Beautiful’s partnership with HISD. Bystimulating public awareness about the impact of litterand waste in the environment, Keep Houston Beau-tiful developed comprehensive public education andtraining programs for students and educators.
Through Keep Houston Beautiful, four “CleanGetaway” performances involved three HISD el-ementary schools, approximately 1,460 studentsacross all grade levels, and parents who volunteeredto help. The Little Kids Litter Party, with the HoustonInternational Festival, incorporated about 8,300 Hous-ton area students. Students in the Youth AdvisoryBoard from Chavez, Davis, and Bellaire high schoolscoordinated and participated in various activitiessuch as the “Keep Houston Beautiful Day” and EarthDay booths. Several schools in the South adminis-trative district of HISD either participated in the Adopt-A-Block Program, Waste Audit, or teacher training onthe Waste In Place curriculum. Keep Houston Beau-tiful also worked with the Greater East End Manage-ment District in providing litter prevention educationalprogramming at Edison Middle School in HISD. TheYouth Environmental Conference for high schoolstudents was held again in 2001–02 which was

15HISD RESEARCH AND ACCOUNTABILITY
HOUSTON URBAN LEARNING INITIATIVES IN A NETWORKED COMMUNITY: 2001–2002
subject matter skills need enhancing in light of thenew mathematics standards...HISD and the uni-versity are committed to assist teachers as theyseek to become certified. The teaching of math-ematics is becoming increasingly difficult be-cause of certain urban environmental factors.”
• “Any partnership that, ultimately, improves stu-dent success is beneficial.”
• “In order to be able to continue to improve theteaching of mathematics, teachers need accessto high quality professional development basedon their needs. HU-LINC makes these programspossible.”
• “I want to see HU-LINC continue because itprovides a very good model for university andschool partnership where I as a university sci-ence faculty member can work to improve sci-ence education K-16 instead of complaining thatthe students that we get don’t know any science.”
• “Provides opportunity to reach a different audi-ence and to work with other universities/net-works. Excellent opportunity for teachers.”
• “It offers families the opportunity to enjoy theresources of the city and broadens the knowledgeof the students.”
• “HU-LINC initiatives align closely with our pro-gram objectives to help underprivileged studentsand their families experience (coalition member)through a meaningful, exciting learning experi-ence.”
DRIVER 5: ENHANCING STUDENT ACHIEVEMENT
DRIVER 6: IMPROVING ALL STUDENT ACHIEVE-MENT, INCLUDING THOSE UNDERSERVED
HU-LINC provided evidence that the programwas enhancing student performance and eliminatingacademic achievement gaps among students thatwere historically underserved. The Texas Assess-ment of Academic Skills (TAAS), the Stanford 9thEdition (Stanford 9), the Algebra I End-of-Courseexamination, and the Biology End-of-Course exami-nation were among the assessment instruments usedto document outcomes. TAAS, a criterion-referencedtest, emphasized higher order thinking and problemsolving skills. The Stanford 9, a norm-referenced testdetermined the relative standing of HISD students’academic performance compared to the performanceof students throughout the United States. Further, theend-of-course examinations, aligned with national
standards for selected high school courses, mea-sured academic performance in major subject areas.
Consequently, HISD students were rated on twodimensions–the state system, based on absolutestandards and HISD standards, as well as on nationalstandards.
Methods
DesignThis was a retrospective analysis of academic
and program performance of HU-LINC. A non-randomized sample of students represented the studypopulation. These students were followed longitudi-nally for the study period during the 2000–01 and the2001–02 academic years.Data Collection
Student achievement data were the result ofStanford 9 and TAAS districtwide testing that oc-curred in the spring 2001 and 2002. Algebra I andBiology End-of-Course examination data were theresult of the state-mandated, end-of-course exami-nations administered to students in May 2001 andMay 2002. The test results represented the percent-age of all students tested and the passing rate of thosestudents. These data were retrieved from the PublicEducation Information Management System (PEIMS)of the Houston Independent School District.
Data AnalysisQualitative and quantitative procedures were
applied to data gathered in this study. Descriptivestatistics were used to examine the data. Furtherstatistical analysis was conducted on student perfor-mance data over the years tracked. The criteria ofacceptance for statistical significance was at the .05level.
While TAAS results included the percentagepassing the mathematics subtest at all grade levelsand the science subtest at the 8th grade level,Stanford 9 results included Normal Curve Equiva-lents (NCEs) on the mathematics and science subtestsat grades 3–11, and the mathematics and environ-mental science subtests at grades one and two.
Academic performance gaps between minorityand non-minority students were computed by firstsubtracting percentage passing for TAAS and bysubtracting the NCEs for Stanford 9 within the sameyear. Lastly, to determine if there were gap reductionsbetween the groups, the 2001 performance gap wassubtracted from the 2002 performance gap.

16 HISD RESEARCH AND ACCOUNTABILITY
HOUSTON URBAN LEARNING INITIATIVES IN A NETWORKED COMMUNITY: 2001–2002
Results
What were the enrollment and completion rates inhigher level mathematics and science courses ofHISD students in 2000–01 compared to 2001–02?
Enrollment and completion rates of HISD stu-dents in higher level mathematics and science coursesfor specified academic years can be seen in Table 1.Additional data including students who enrolled andwere “eligible to complete” and obtain full credit of 1.0for the course were incorporated for review. Thefindings shown in Table 1 reflected an increase in thetotal number of students enrolled in both mathematicsand science courses from 2000–01 to 2001–02. Thehighest increase in enrollment for mathematics wasin Algebra II by 1,494 students, and the lowestincrease was in Calculus by 57 students. At the sametime, the largest increase in science was in ChemistryI by 1,162 students, and the lowest increase was inBiology by 1,021 students. The findings also revealedan increase in the number of students who wereeligible to complete and obtain full credit for allmathematics and science courses, except Physics Iand Integrated Physics/Chemistry.
The completion rates in mathematics and sci-ence courses can be found in Table 1. It is evident thatthe completion rates for Calculus was the highestamong all higher level mathematics courses in 2001and 2002 (92% and 98%, respectively). Compara-tively, Physics I had the highest completion rates
2000–01 2001–02
EnrollElig to
Complete CompletedCompletion
Rate EnrollElig to
Complete CompletedCompletion
Rate
MathAlgebra I 17,224 11,009 7,321 67 18,397 12,818 9,705 76Algebra II 7,968 6,707 5,281 79 9,462 7,167 6,413 89Geometry 12,542 10,420 7,581 73 13,332 11,066 9,153 83Calculus 898 782 721 92 955 873 856 98Total Math 38,632 28,918 20,932 72 42,146 31,924 26,127 82
ScienceBiology 14,223 11,794 7,990 68 15,244 13,317 10,631 80Chemistry I 7,958 7,137 5,715 80 9,120 8,151 7,199 88Physics I 2,343 2,128 1,908 90 2,288 2,093 2,031 97IntegratedPhysics/Chem 17,504 15,340 10,192 66 16,812 14,609 11,306 77Total Science 42,028 36,399 25,815 71 43,464 38,170 31,167 82
Table 1: Enrollment and Completion Rates of HISD Students in Advanced Academic Mathematics and ScienceCourses, 2000–01 and 2001–02
among all higher level science courses during thesame period (90% and 97%, respectively). More-over, in all subject areas, the majority of students whowere eligible to complete and earn full credit for thecourses completed the courses. Increases in comple-tion rates were seen at all levels.
How successful were HISD students in mathemat-ics and science courses for the 2000–01 and the2001–02 school years?
To determine the success of HISD students inmathematics and science courses for the 2000–01and 2001–02 school years, the results from theAlgebra I End-of-Course and the Biology End-of-Course examinations were used. The percentage ofHISD students passing the tests in spring 2001 andspring 2002 are presented in Figure 1. According toFigure 1, the majority of students who took the BiologyEnd-of-Course Examination passed in both years(72% and 73%, respectively). Simultaneously, fewerthan the majority of students who took the Algebra IEnd-of-Course examination passed (47% and 49%,respectively). However, on both examinations, therewas an increase in the percentage of students whopassed over the years tracked. For the Algebra I End-of-Course examination, the increase was by twopercentage points; and for the Biology End-of-Courseexamination, the increase was by one percentagepoint.

17HISD RESEARCH AND ACCOUNTABILITY
HOUSTON URBAN LEARNING INITIATIVES IN A NETWORKED COMMUNITY: 2001–2002
Class of 2000 Class of 2001N % N %
*Advanced 3 0.0 N/A N/A*DistinguishedAchievement
145 1.9 191 2.5
*Recommended 2,240 29.0 2,982 39.1Regular/Minimum 5,232 67.6 4,285 56.1Special Ed 115 1.0 174 2.3Total Graduates 7,735 99.5 7,632 99.5
*College Prep Diploma
What were the high school graduation rates ofHISD students prepared to enter college?
The high school graduation rates of HISD stu-dents prepared to enter college were measured usingthe types of diplomas earned. The findings arepresented in Table 2. (Information regarding the 2002rates is not available from the Texas EducationAgency until January 2003 and will be reflected in theYear Four report). As shown in Table 2, the largestnumber of graduation diplomas earned were Regular/Minimum for the class of 2000 and the class of 2001(5,232 versus 4,285, respectively). However, thelargest number of diplomas earned by students pre-pared to enter college was with the Recommendeddiploma (2,240 versus 2,982, respectively). Studentswho earned the Advanced and Distinguished Achieve-ment diplomas also were considered to be preparedto enter college. The combined totals were 148 in2000 and 191 in 2001. The Texas Education Agencyphased out the Advanced Honors and Advanceddiplomas during the 1998–99 and 1999–2000 schoolyears for students who were enrolled in ninth gradeafter the 1994–95 school year.
Figure 2 shows the number of students preparedfor college, all graduates, and the graduation rates for
college prepared students in 2000 and 2001. Asindicated in Figure 2, there was a difference of 785students who graduated prepared to enter college in2000 compared to 2001. The difference indicated that40% of the students who graduated in 2000 wereprepared to enter college compared to 42% of thestudents who graduated in 2001 were prepared toenter college. Findings reflected a substantial in-crease of 11 percentage points from year to year.
To what extent are students attaining higher scoresin 2000–01 compared to 2001–02 on mathematicsand science tests?
Figure 1: End-of Course Results, Spring 2001, 2002.
72%
47%
73%
49%
0
20
40
60
80
Algebra I End-of Course Biology End-of-Course
2001 2002
Table 2: Graduates by Diploma Types, 2000, 2001
2,388
3,173
7,735 7,632
31%
42%
0
2,000
4,000
6,000
8,000
Class of 2000 Class of 2001
Num
ber
0
20
40
60
80
100
Percent
College Prep. Grad.All Grads.% College Prep
Figure 2: College Prep vs All Grads, 2000, 2001.
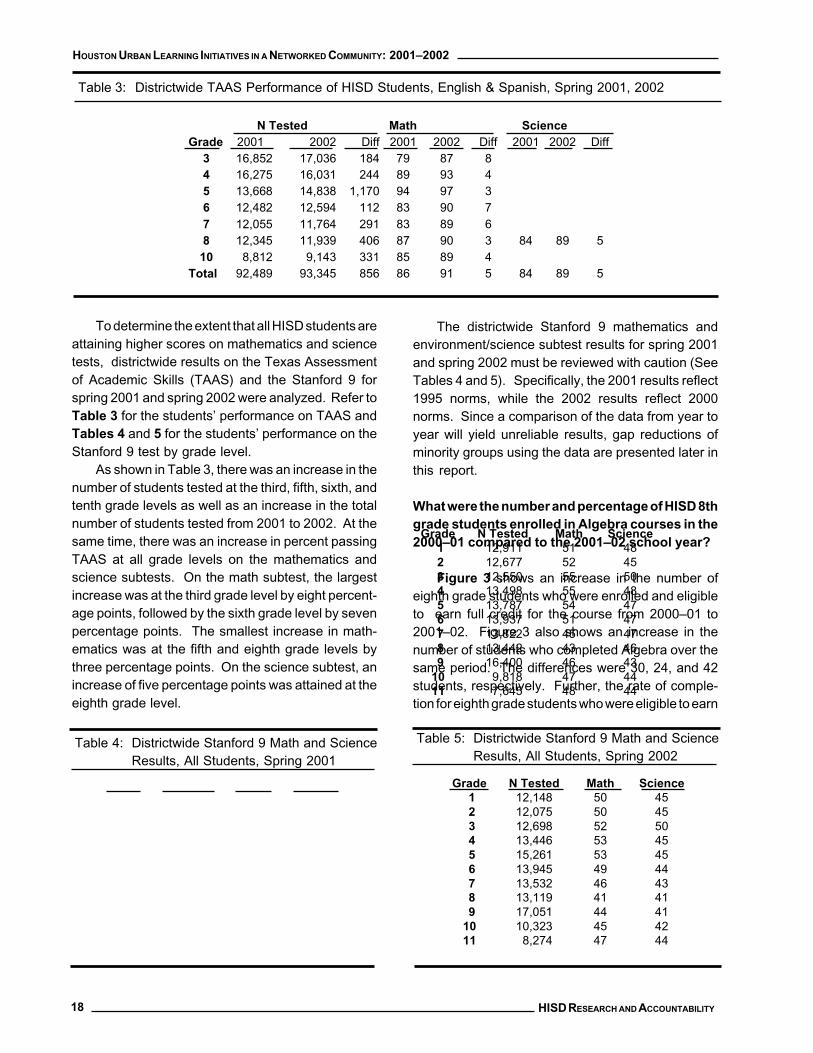
18 HISD RESEARCH AND ACCOUNTABILITY
HOUSTON URBAN LEARNING INITIATIVES IN A NETWORKED COMMUNITY: 2001–2002
To determine the extent that all HISD students areattaining higher scores on mathematics and sciencetests, districtwide results on the Texas Assessmentof Academic Skills (TAAS) and the Stanford 9 forspring 2001 and spring 2002 were analyzed. Refer toTable 3 for the students’ performance on TAAS andTables 4 and 5 for the students’ performance on theStanford 9 test by grade level.
As shown in Table 3, there was an increase in thenumber of students tested at the third, fifth, sixth, andtenth grade levels as well as an increase in the totalnumber of students tested from 2001 to 2002. At thesame time, there was an increase in percent passingTAAS at all grade levels on the mathematics andscience subtests. On the math subtest, the largestincrease was at the third grade level by eight percent-age points, followed by the sixth grade level by sevenpercentage points. The smallest increase in math-ematics was at the fifth and eighth grade levels bythree percentage points. On the science subtest, anincrease of five percentage points was attained at theeighth grade level.
The districtwide Stanford 9 mathematics andenvironment/science subtest results for spring 2001and spring 2002 must be reviewed with caution (SeeTables 4 and 5). Specifically, the 2001 results reflect1995 norms, while the 2002 results reflect 2000norms. Since a comparison of the data from year toyear will yield unreliable results, gap reductions ofminority groups using the data are presented later inthis report.
What were the number and percentage of HISD 8thgrade students enrolled in Algebra courses in the2000–01 compared to the 2001–02 school year?
Figure 3 shows an increase in the number ofeighth grade students who were enrolled and eligibleto earn full credit for the course from 2000–01 to2001–02. Figure 3 also shows an increase in thenumber of students who completed Algebra over thesame period. The differences were 30, 24, and 42students, respectively. Further, the rate of comple-tion for eighth grade students who were eligible to earn
Table 3: Districtwide TAAS Performance of HISD Students, English & Spanish, Spring 2001, 2002
Grade N Tested Math Science1 12,911 51 482 12,677 52 453 12,550 55 504 13,498 55 485 13,787 54 476 13,937 51 477 13,822 45 478 13,442 43 469 16,400 46 43
10 9,818 47 4411 7,645 48 44
Table 4: Districtwide Stanford 9 Math and ScienceResults, All Students, Spring 2001
Grade N Tested Math Science1 12,148 50 452 12,075 50 453 12,698 52 504 13,446 53 455 15,261 53 456 13,945 49 447 13,532 46 438 13,119 41 419 17,051 44 41
10 10,323 45 4211 8,274 47 44
Table 5: Districtwide Stanford 9 Math and ScienceResults, All Students, Spring 2002
N Tested Math ScienceGrade 2001 2002 Diff 2001 2002 Diff 2001 2002 Diff
3 16,852 17,036 184 79 87 84 16,275 16,031 244 89 93 45 13,668 14,838 1,170 94 97 36 12,482 12,594 112 83 90 77 12,055 11,764 291 83 89 68 12,345 11,939 406 87 90 3 84 89 5
10 8,812 9,143 331 85 89 4Total 92,489 93,345 856 86 91 5 84 89 5

19HISD RESEARCH AND ACCOUNTABILITY
HOUSTON URBAN LEARNING INITIATIVES IN A NETWORKED COMMUNITY: 2001–2002
full credit for the course was 95% in 2000–01, and 97%in 2001–02. The change reflected an increase of twopercentage points over the years tracked.
Was there an increase in the enrollment of HISDminority students in higher level mathematics andscience courses in 2000–01 compared to 2001–02?
Student enrollment in advanced mathematicsand science courses are presented by ethnicity,gender, and economic status. The results are as
follows.
Enrollment in Math and Science Courses byEthnicity
Tables 6 and 7 reveal an increase in the totalnumber of students in all ethnic groups who wereenrolled in advanced mathematics courses from2000–01 to 2001–02. Significant findings were notedfor Hispanic students who showed an increase in totalenrollment by 2,839 students. African Americanstudents followed with an increase in total enrollmentof 545 students. The data also reflects that the highestincrease in enrollment for African American studentswas in Algebra II by 276 students, while the highestincrease in enrollment for Hispanic students was inAlgebra I by 1,104 students.
Tables 6 and 7 also show an increase in the totalnumber of students in all ethnic groups enrolled inscience courses from 2000–01 to 2001–02. Thelargest increase in total enrollment was by Hispanicswith a difference of 1,162 students followed by AfricanAmericans with a difference of 147 students. Inconsideration of all advanced science courses, His-panic students had the largest increase in ChemistryI by 782 students, and African Americans had thelargest increase in Biology by 613 students. At thesame time, Hispanic students showed a slight de-crease in Physics enrollment by 35 students, whileAfrican Americans showed a substantial decrease inIntegrated Physics/Chemistry enrollment by 573 stu-
Figure 3: Algebra Students, Eighth Grade, 2001,2002.
1,080
1,037
989
1,110
1,061
1,031
0 200 400 600 800 1,000 1,200
Enrolled
Elig to Complete
Completed
2000-01 2001-02
Asian African American Hispanic2000–01 2001–02 Diff 2000–01 2001–02 Diff 2000–01 2001–02 Diff
MathAlgebra I 449 512 63 5,596 5,734 138 9,381 10,485 1,104Algebra II 402 440 38 2,849 3,125 276 3,335 4,423 1,088Geometry 440 431 -9 4,225 4,343 118 6,233 6,878 645Calculus 198 204 6 190 203 13 239 241 2Total Math 1,489 1,587 98 12,860 13,405 545 19,188 22,027 2,839
ScienceBiology 594 623 29 4,472 5,085 613 7,318 7,697 379Chemistry I 429 440 11 2,857 3,006 149 3,465 4,247 782Physics 257 267 10 625 583 -42 829 794 -35IntegratedPhysics/Chem 471 518 47 5,978 5,405 -573 9,184 9,220 36Total Science 1,751 1,848 97 13,932 14,079 147 20,796 21,958 1,162
Algebra 8th gr. 116 169 53 261 243 -18 402 417 15
Table 6: Student Enrollment in Higher Level Mathematics and Science Courses by Ethnicity, Past Two Years

20 HISD RESEARCH AND ACCOUNTABILITY
HOUSTON URBAN LEARNING INITIATIVES IN A NETWORKED COMMUNITY: 2001–2002
dents.
Enrollment in Math and Science Courses byGender
Refer to Table 8 for enrollment results by gender.As evident in Table 8, males attained a slightly higherincrease in enrollment in advanced mathematics andscience courses than females. Specifically, thedifference in mathematics course enrollment was1,795 males compared to 1,719 females. Simulta-
neously, the difference in science course enrollmentwas 751 males compared to 685 females. Addition-ally, concerning mathematics courses, both femalesand males showed the largest increase in enrollmentin Algebra II by 807 and 687 students, respectively.Relative to science courses, both groups showed thelargest increase in Chemistry I, which was 533 femalestudents compared to 629 male students. Further,there was a decrease in enrollment in IntegratedPhysics/Chemistry by 286 females and 406 males.
Native American White2000–01 2001–02 Diff 2000–01 2001–02 Diff
MathAlgebra I 6 13 7 1,792 1,653 -139Algebra II 2 3 1 1,380 1,471 91Geometry 5 7 2 1,639 1,673 34Calculus 1 0 -1 270 307 37Total Math 14 23 9 5,081 5,104 23
ScienceBiology 6 4 -2 1,833 1,835 2Chemistry I 4 6 2 1,203 1,421 218Physics 1 1 0 631 643 12IntegratedPhysics/Chem
6 12 6 1,865 1,657 -208
Total Science 17 23 6 5,532 5,556 24
Algebra 8th gr 1 3 2 300 278 -22
Table 7: Student Enrollment in Higher Level Mathematics and Science Courses by Ethnicity, Past Two Years
Female Male2000–01 2001–02 Diff 2000–01 2001–02 Diff
MathAlgebra I 8,413 8,998 585 8,811 9,399 588Algebra II 4,282 5,089 807 3,686 4,373 687Geometry 6,515 6,798 283 6,027 6,534 507Calculus 486 530 44 412 425 13Total Math 19,696 21,415 1,719 18,936 20,731 1,795
0 0Science 0 0Biology 7,048 7,548 500 7,175 7,696 521Chemistry I 4,328 4,861 533 3,630 4,259 629Physics I 1,260 1,198 -62 1,083 1,090 7Integrated Physics/Chem 8,423 8,137 -286 9,081 8,675 -406Total Science 21,059 21,744 685 20,969 21,720 751
Algebra 8th gr 632 619 -13 448 491 43
Table 8: Student Enrollment in Higher Level Mathematics and Science Courses by Gender, Past Two Years

21HISD RESEARCH AND ACCOUNTABILITY
HOUSTON URBAN LEARNING INITIATIVES IN A NETWORKED COMMUNITY: 2001–2002
Econ Disadvantaged NonEcon Disadvantaged2000–01 2001–02 Diff 2000–01 2001–02 Diff
MathAlgebra I 10,596 12,187 1,591 6,628 6,210 -418Algebra II 3,753 5,000 1,247 4,215 4,462 247Geometry 6,877 7,832 955 5,665 5,500 -165Calculus 268 328 60 630 627 -3Total Math 21,494 25,347 3,853 17,138 16,799 -339
ScienceBiology 8,084 9,185 1,101 6,139 6,059 -80Chemistry I 3,965 4,798 833 3,993 4,322 329Physics 902 881 -21 1,441 1,407 -34Integrated Physics/Chem 10,681 10,830 149 6,823 5,982 -841Total Science 23,632 25,694 2,062 18,396 17,770 -626
Algebra 8th gr 541 604 63 539 506 -33
Table 9: Student Enrollment in Higher Level Mathematics and Science Courses by Economic Status, Past TwoYears
Enrollment in Math and Science Courses byEconomic Status
Table 9 depicts enrollment in mathematics andscience courses by economic status. As evident inTable 9, a substantial increase in enrollment figureswas noted for economically disadvantaged studentscompared to a slight decrease in enrollment figuresfor non-economically disadvantaged students overthe two-year period. Specifically, economically dis-advantaged students showed total enrollment in math-ematics and science courses of 3,853 and 2,062students, respectively. At the same time, non-economically disadvantaged students showed totalenrollment decreases in mathematics and sciencecourses of 339 and 626 students, respectively. Thelargest increase in mathematics courses for eco-nomically disadvantaged students was in Algebra I by1,591 students, and the largest increase in sciencecourses was in Biology by 1,101 students. Also, non-economically disadvantaged students increased en-rollment in Algebra II by 247 students and in Chem-istry by 329 students.
Enrollment in Math and Science Courses byInstructional Placement
According to Table 10, total enrollment in math-ematics and science courses from 2000–01 to 2001–02 increased for special education and regular edu-cation students. Special education students in-creased enrollment in mathematics courses by 272students and increased enrollment in science courses
by 391 students. Regular education students in-creased enrollment in mathematics courses by 3,242and increased enrollment in science courses by1,045. The largest increase in mathematics andscience courses for special education students wasin Geometry by 127 students and in Biology by 303students. The largest increase in mathematics andscience courses for regular education students wasin Algebra II by 1,455 students and in Chemistry I by1,064 students. Additionally, there was a decrease inthe enrollment of both groups in Physics and Inte-grated Physics/Chemistry.
Was there an increase in the enrollment of HISDminority students in Algebra at the 8th grade levelin 2000–01 compared to 2001–02?
Enrollment of minority students in Algebra at the8th grade level is presented by ethnicity, gender,economic status, and instructional placement. Referto Tables 6 and 7 for enrollment by ethnic group. Asindicated in Tables 6 and 7, there was an increase inthe enrollment of Asian, Hispanic, and Native Ameri-can students from 2000–01 to 2001–02. Asian stu-dents had the largest increase by 53 students, fol-lowed by Hispanic students with an increase of 15students. Over the same period, enrollment of AfricanAmerican and White students in Algebra at the 8thgrade level decreased by 18 and 22 students,respectively.
Table 8 reveals gender differences in Algebra at

22 HISD RESEARCH AND ACCOUNTABILITY
HOUSTON URBAN LEARNING INITIATIVES IN A NETWORKED COMMUNITY: 2001–2002
Special Education Regular Education2000–01 2001–02 Diff 2000–01 2001–02 Diff
MathAlgebra I 1,217 1,319 102 16,007 17,078 1,071Algebra II 240 279 39 7,728 9,183 1,455Geometry 544 671 127 11,998 12,661 663Calculus 4 8 4 894 947 53Total Math 2,005 2,277 272 36,627 39,869 3,242
ScienceBiology 1,113 1,416 303 13,110 13,828 718Chemistry I 265 363 98 7,693 8,757 1,064Physics 32 27 -5 2,311 2,261 -50Integrated Physics/Chem 1,782 1,777 -5 15,722 15,035 -687Total Science 3,192 3,583 391 38,836 39,881 1,045
Algebra 8th gr 15 11 -4 1,065 1,099 34
Table 10:Student Enrollment in Higher Level Mathematics and Science Courses by Instructional Placement, PastTwo Years
the eighth grade level. Specifically, there was a largernumber of females than males who enrolled in 2000–01 and in 2001–02. Simultaneously, there was adecrease in the number of females by 13 students,while there was an increase in the number of malesby 43 students.
Course enrollment for eighth graders by eco-nomic status is reflected in Table 9. It is evident thatmore economically disadvantaged students enrolledin Algebra at the 8th grade level, while fewer non-economically disadvantaged students enrolled in Al-gebra at the 8th grade level over the past two years.The difference for economically disadvantaged stu-dents was an increase of 63, and the difference fornon-economically disadvantaged students was adecrease of 33.
Table 10 shows enrollment by instructional place-ment in Algebra at the 8th grade level. The numberof special education students decreased by 4 stu-dents, while the number of regular education studentsincreased by 34 students from 2000–01 to 2001–02.
How did the performance of HISD minority stu-dents compare to HISD non-minority students inmathematics and science courses for the 2001–01and the 2001–02 school years?
Test results on the Algebra I and the Biology End-of-Course (EOC) examinations by ethnicity, gender,economic status, and instructional program wereused to compare the performance of minority and non-minority students in mathematics and science courses
during the 2000–01 and the 2001–02 school years.These results are provided in Table 11.
Algebra I End-of-Course ExaminationAs indicated in Table 11, African American stu-
dents showed the highest increase in percentagepassing the Algebra I End-of-Course examinationamong the represented ethnic groups (six percentagepoints). Although the percentage passing rate ofHispanic students exceeded that of African Americanstudents in 2001 (43% versus 38%, respectively),both groups attained a rate of 44% in 2002. White andAsian students also experienced increases in pass-ing rates from 2001 to 2002 by two and one percent-age points, respectively.
Gender differences on the Algebra I End-of-Course examination show that a higher percentage ofmales passed in 2001 compared to a higher percent-age of females in 2002. This was the result of adecrease in the proportion of males who passed byone percentage point and an increase in the proportionof females who passed by four percentage points overthe two-year period.
Both economically and non-economically disad-vantaged student groups attained an increase inpercentage passing the test in 2001 and 2002. How-ever, the difference in the passing rate of economi-cally disadvantaged students was three percentagepoints compared to two percentage points for the non-economically disadvantaged student group.
Students in regular education and special educa-tion programs achieved an increase in percentage

23HISD RESEARCH AND ACCOUNTABILITY
HOUSTON URBAN LEARNING INITIATIVES IN A NETWORKED COMMUNITY: 2001–2002
Algebra I End-of-Course Biology End-of Course2001 2002 Diff 2001 2002 Diff
EthnicityAfri Amer 38 44 6 69 69 0Asian 78 79 1 87 87 0Hispanic 43 44 1 64 67 3White 75 77 2 94 92 -2
GenderMales 48 47 -1 73 73 0Female 47 51 4 71 73 2
Econ StatusEcon Disadv 42 45 3 63 65 2Not Econ Disadv 53 55 2 80 81 1
Instructional ProgSpecial Ed 22 23 1 38 35 -3Regular Ed 49 51 2 74 76 2
Table 11:Algebra I and Biology End-of-Course Examination Results by Ethnicity, Gender, Economic Status, andInstructional Program, Percentage Passing, Spring 2001, Spring 2002
passing the Algebra I End-of-Course examinationover the years tracked. For special education stu-dents, the difference was one percentage point, andfor regular education students, the difference was twopercentage points.
Biology End-of-Course ExaminationHispanic students attained the largest increase in
percentage passing on the Biology End-of-Courseexamination than any of the represented ethnic groups(three percentage points). African American andAsian students showed no increase, while Whitestudents showed a decrease by two percentagepoints. In spite of these results, White students hadthe highest percentage passing rate in 2001 and 2002(94% and 92%, respectively), while Hispanic stu-dents had the lowest percentage passing rate for bothyears (64% and 67%, respectively).
Males exceeded females in percentage passingthe Biology End-of-Course examination in 2001 (73%versus 71%). By 2002, both groups had comparablepercentage passing rates (73%).
Non-economically disadvantaged students main-tained higher passing rates than economically disad-vantaged students on the test in 2001 and 2002.However, economically disadvantaged students ex-perienced an increase of two percentage points andnon-economically disadvantaged students experi-enced an increase of one percentage point over theyears tracked.
There was a decline in the passing rate of specialeducation students by three percentage points and aone point increase in the passing rate of regulareducation students from 2001 to 2002. Additionally,
the majority of regular education students comparedto less than the majority of special education studentscontinued to pass the examination over the yearstracked.
Was there an increase in the high school gradua-tion rates of HISD minority students compared toHISD non-minority students in 1999–2000 and2000–2001?
The high school graduation rates of minoritystudents compared to non-minority students for the1999–2000 and the 2000–2001 academic years arepresented in Table 12. The graduation rates arebased on twelfth grade enrollment during the yearpresented. Enrollment is counted at the end ofOctober and the graduates is based on a cumulativecount for the entire school year.
According to Table 12, the high school gradua-tion rate for African American students exceeded thatof all ethnic groups in the 1999–2000 academic year(99.6%). The findings for other ethnic groups followin order of the highest rate to the lowest rate: White,96.7%; Asian, 94.0%; Hispanic, 93.8%; and NativeAmerican, 60.0%. By 2000–2001, African Americanstudents had the second highest (97.5%) and Asianstudents had the highest graduation rate (100.0%).Moreover, from 2000 to 2001, there was an increasein the graduation rate for Hispanic, Asian, and NativeAmerican students by 1.1, 6.0, and 6.7 percentagepoints, respectively.
The graduation rate for males was lower, while thegraduation rate for females was higher over the two-year period. Specifically, the male graduation rate

24 HISD RESEARCH AND ACCOUNTABILITY
HOUSTON URBAN LEARNING INITIATIVES IN A NETWORKED COMMUNITY: 2001–2002
1999–2000 2000–200112th
Enroll. Grad Rate12th
Enroll. Grad RateRateDiff
EthnicityAfrican American 2,684 2,673 99.6 2,677 2,609 97.5 -2.1Hispanic 3,787 3,554 93.8 3,671 3,483 94.9 1.1White 1,184 1,145 96.7 1,228 1,173 95.5 -1.2Asian 383 360 94.0 365 365 100.0 6Native American 5 3 60.0 3 2 66.7 6.7
GenderMales 3,702 3,461 93.5 4,190 3,509 83.7 -9.8Female 4,341 4,274 98.5 3,754 4,123 *109.8 11.3
Economic StatusEcon Disadv 3,510 2,926 83.4 3,940 3,127 79.4 -4Not Econ Disadv 4,533 4,809 *106.1 4,004 4,505 *112.5 6.4
Instructional ProgRegular Ed 7,160 7,156 99.9 7,113 7,016 98.6 -1.3Special Ed 883 579 65.6 831 616 74.1 8.5
*Graduates obtained from different file than total 12thgrade population
declined by 9.8 percentage points, while the femalegraduation rate increased by 11.3 percentage pointsfrom 1999–2000 to 2000–2001.
The 1999–2000 high school graduation rates byeconomic status indicated that non-economicallydisadvantaged students were more likely to graduatethan economically disadvantaged students (83.4%versus 106.1%). In 2000–2001, the graduation ratefor economically disadvantaged students declined byfour percentage points and the graduation rate fornon-economically disadvantaged students increasedby 6.4 percentage points.
The graduation rates for students in regulareducation exceeded the graduation rates of specialeducation students during both years tracked. How-ever, there was a decrease in the graduation rate ofregular education students and a substantial increasein the graduation rate of special education studentsover the two-year period (-1.3 and 8.5, respectively).
Was there an increase in the applications andadmissions to post-secondary educational insti-tutions of HISD minority and non-minority stu-dents from 1999–2000 to 2000–2001?
To determine if there was an increase in theapplications and admissions of minority and non-minority students to post-secondary educational in-stitutions, data related to the type of diplomas earnedwere presented. Specifically, students earning theAdvanced Honors, Advanced, Distinguished Achieve-
ment, and Recommended diplomas were consideredto be prepared for college. Results were presentedby ethnic group in Table 13 and by gender, economicstatus, and instructional placement in Table 14 for the1999–2000 and the 2000–2001 academic years. The2001–02 rates will not be available until January 2003and will be reflected in the Year 4 report.
According to Table 13, the total number of gradu-ates prepared for college increased from 2,388 in1998–1999 to 4,476 in 1999–2000 (87%). Increaseswere evident among all ethnic groups, except NativeAmerican students. The rate of increase for AfricanAmerican students was 162%; Hispanic students,92%; and White students, 37%.
Table 14 shows the number and percentage ofstudents prepared for college by gender. Accordingto Table 14, the number of males and femalesincreased over the years tracked by 967 and 1,121students, respectively. The rate of increase formales was 105% compared to 76% for females overthe years tracked.
As evident in Table 14, the number of economi-cally disadvantaged students earning diplomas forcollege increased by 987, while the number of non-economically disadvantaged students increased by1,101 from 1998–99 to 1999–2000. However, the rateof increase for economically disadvantaged studentsexceeded the rate of increase for non-economicallydisadvantaged students (139% versus 66%, respec-tively).
Refer to Table 14 for the number of special
Table 12:Graduation Rates by Ethnicity, Gender, Economic Status, and Instructional Program, 1999–2000 and2000–2001
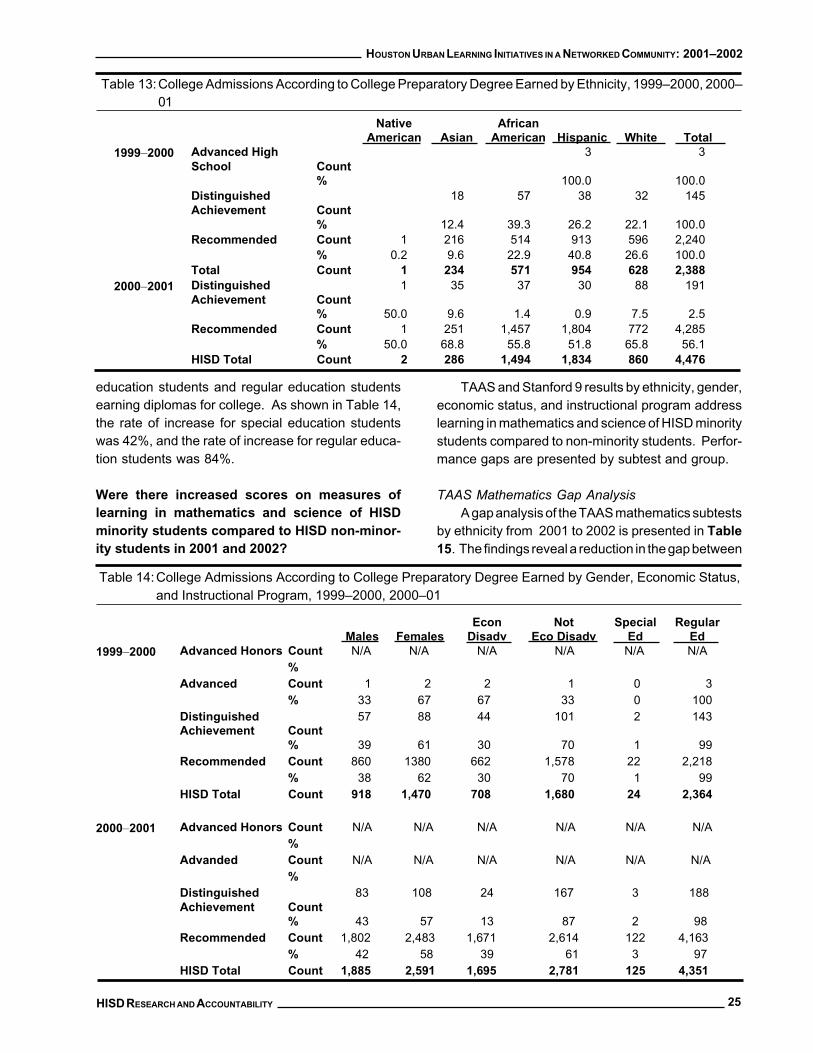
25HISD RESEARCH AND ACCOUNTABILITY
HOUSTON URBAN LEARNING INITIATIVES IN A NETWORKED COMMUNITY: 2001–2002
Males FemalesEcon
DisadvNot
Eco DisadvSpecial
EdRegular
Ed1999–2000 Advanced Honors Count N/A N/A N/A N/A N/A N/A
%Advanced Count 1 2 2 1 0 3
% 33 67 67 33 0 100DistinguishedAchievement Count
57 88 44 101 2 143
% 39 61 30 70 1 99Recommended Count 860 1380 662 1,578 22 2,218
% 38 62 30 70 1 99HISD Total Count 918 1,470 708 1,680 24 2,364
2000–2001 Advanced Honors Count N/A N/A N/A N/A N/A N/A%
Advanded Count N/A N/A N/A N/A N/A N/A%
DistinguishedAchievement Count
83 108 24 167 3 188
% 43 57 13 87 2 98Recommended Count 1,802 2,483 1,671 2,614 122 4,163
% 42 58 39 61 3 97HISD Total Count 1,885 2,591 1,695 2,781 125 4,351
NativeAmerican Asian
AfricanAmerican Hispanic White Total
1999–2000 Advanced HighSchool Count
3 3
% 100.0 100.0DistinguishedAchievement Count
18 57 38 32 145
% 12.4 39.3 26.2 22.1 100.0Recommended Count 1 216 514 913 596 2,240
% 0.2 9.6 22.9 40.8 26.6 100.0Total Count 1 234 571 954 628 2,388
2000–2001 DistinguishedAchievement Count
1 35 37 30 88 191
% 50.0 9.6 1.4 0.9 7.5 2.5Recommended Count 1 251 1,457 1,804 772 4,285
% 50.0 68.8 55.8 51.8 65.8 56.1HISD Total Count 2 286 1,494 1,834 860 4,476
education students and regular education studentsearning diplomas for college. As shown in Table 14,the rate of increase for special education studentswas 42%, and the rate of increase for regular educa-tion students was 84%.
Were there increased scores on measures oflearning in mathematics and science of HISDminority students compared to HISD non-minor-ity students in 2001 and 2002?
TAAS and Stanford 9 results by ethnicity, gender,economic status, and instructional program addresslearning in mathematics and science of HISD minoritystudents compared to non-minority students. Perfor-mance gaps are presented by subtest and group.
TAAS Mathematics Gap AnalysisA gap analysis of the TAAS mathematics subtests
by ethnicity from 2001 to 2002 is presented in Table15. The findings reveal a reduction in the gap between
Table 13:College Admissions According to College Preparatory Degree Earned by Ethnicity, 1999–2000, 2000–01
Table 14:College Admissions According to College Preparatory Degree Earned by Gender, Economic Status,and Instructional Program, 1999–2000, 2000–01

26 HISD RESEARCH AND ACCOUNTABILITY
HOUSTON URBAN LEARNING INITIATIVES IN A NETWORKED COMMUNITY: 2001–2002
WhiteAfrAm White
AfrAm White Hisp White Hisp
Math%
Pass%
Pass%
Pass%
Pass01–02Gap
%Pass
%Pass
%Pass
%Pass
01–02Gap
Grd 2001 2001 Gap 2002 2002 Gap Diff 2001 2001 Gap 2002 2002 Gap Diff3 91 70 21 95 81 14 -7 91 73 18 95 84 11 -74 96 84 12 96 89 7 -5 96 89 7 96 93 3 -45 98 93 5 99 96 3 -2 98 95 3 99 97 2 -16 95 81 14 95 88 7 -7 96 82 14 95 90 5 -97 93 80 13 97 86 11 -2 94 81 13 97 88 9 -48 97 85 12 97 89 8 -4 97 87 10 97 90 7 -310 97 82 15 96 87 9 -6 97 82 15 96 86 10 -5
SciGrd 8 97 81 16 98 87 11 -5 97 83 14 98 89 9 -5
White and African American students and betweenWhite and Hispanic students at all grade levels on themathematics subtest. For White and African Ameri-can students, the largest reduction occurred at thethird and sixth grade levels by seven percentagepoints. The smallest reduction in the gap occurred atthe fifth and seventh grade levels by two percentagepoints. Concerning White and Hispanic students, thelargest reduction in the gap occurred at the sixth gradelevel by nine percentage points, followed by the thirdgrade level by seven percentage points. Additionally,for White and Hispanic students, the smallest reduc-tion in the gap occurred at the fifth grade level by onepercentage point.
TAAS gap analysis by gender in Table 16 revealsa decrease in the gap at the fourth, sixth througheighth, and the tenth grade levels. There was no
reduction in the gap at the third and fifth grade levels.The gap between economically disadvantaged
and non-economically disadvantaged students wasdiminished at all grade levels. The largest reductionwas apparent at the third and sixth grade levels, whilethe smallest reduction was apparent at the fifth andseventh grade levels.
Table 17 presents the gap analysis for specialand regular education students. According to Table17, there was a reduction in the gap at all grade levels,except the tenth grade. At the tenth grade level, therewas no gap reduction. The largest decrease in the gapoccurred at the seventh grade level by nine percent-age points, and the smallest decrease in the gapoccurred at the third grade level by two percentagepoints.
Table 15: Districtwide Performance Gaps on TAAS Mathematics Test All Students by Grade and Ethnicity, 2001,2002
M F M F EcoDNon
EcoD EcoDNon
EcoD
Math%
Pass%
Pass%
Pass%
Pass01–02Gap
%Pass
%Pass
%Pass
%Pass
01–02Gap
Grd 2001 2001 Gap 2002 2002 Gap Diff 2001 2001 Gap 2002 2002 Gap Diff3 76 75 1 84 85 1 0 71 87 16 82 93 11 -54 88 89 1 92 92 0 -1 86 94 8 91 96 5 -35 94 95 1 96 97 1 0 94 97 3 96 98 2 -16 80 86 6 89 91 2 -4 81 92 11 89 95 6 -57 80 85 5 88 90 2 -3 81 90 9 87 95 8 -18 86 88 2 91 90 1 -1 86 93 7 89 93 4 -310 86 84 2 89 88 1 -1 82 89 7 86 91 5 -2
SciGrd 8 84 83 1 90 89 1 0 81 92 11 88 93 5 -6
Table 16:Districtwide Performance Gaps on TAAS Mathematics and Science Subtests All Students by GradeLevel, Gender, Socio-Econ. Status, 2001, 2002

27HISD RESEARCH AND ACCOUNTABILITY
HOUSTON URBAN LEARNING INITIATIVES IN A NETWORKED COMMUNITY: 2001–2002
SpEd Reg SpEd Reg
Math
%Pass2001 Gap
%Pass2002 Gap
01-02GapDiff
Grd3 62 76 14 73 85 12 -24 77 89 12 86 92 6 -65 84 95 11 89 97 8 -36 55 85 30 68 92 24 -67 55 85 30 69 90 21 -98 64 89 25 73 91 18 -7
10 61 86 25 65 90 25 0
SciGrd 8 57 87 30 73 90 17 -13
TAAS Science Subtest Gap AnalysisTable 15 also presents the gap analysis by
ethnicity on the TAAS science subtest in 2001 and in2002. As shown in Table 15, there was a reduction inthe gap between White and African American stu-dents as well as between White and Hispanic studentsat the eighth grade level. For both groups, thedifference was five percentage points.
Stanford 9 Mathematics Subtest by Ethnicity According to Table 18, the performance gap
between White and African American students rangedfrom 15 NCEs to 27 NCEs in 2001. The smallest gapwas at the first grade level, while the largest gap was
Table 17:Districtwide Performance Gaps on TAASMath and Science Subtests All Students byInstructional Program, 2001, 2002 (2001Results Based on 1995 Norms, 2002Results Based on 2000 Norms)
at the eleventh grade level. By 2002, the performancegap between White and African American studentsranged from 11 NCEs to 25 NCEs. The smallest gapwas at the first grade level, and the largest gap wasat the eleventh grade level. Over the two-year period,there was a reduction in the gap at all grade levels,except the seventh grade which had no gap.
Also shown in Table 18 is the gap analysisbetween White and Hispanic students. The gapbetween these ethnic groups ranged from 14 NCEsto 25 NCEs in 2001. The smallest gap was at the first,fourth, and fifth grade levels, while the largest gapwas at the eleventh grade level. By 2002, theperformance gap between White and Hispanic stu-dents ranged from 10 NCEs to 22 NCEs. The smallestgap was at the first grade level, while the largest gapwas at the eleventh grade level.
Table 19 shows the performance gap by genderon the Stanford 9 mathematics subtest. As evidentin Table 19, the gap between males and femalesranged from zero to three NCEs in 2001 and from zeroto two NCEs in 2002. From 2001 to 2002, there wasa reduction in the gap at the third, fourth, and sixthgrade levels. There was no gap at the second,seventh, eighth, and eleventh grade levels.
Table 19 also shows the performance gap be-tween economically disadvantaged and non-eco-nomically disadvantaged students in 2001 and 2002.As reflected in Table 19, the gap between thesegroups ranged from eight NCEs to 17 NCEs in 2001and from eight NCEs to twelve NCEs in 2002. In 2001,the smallest gap was at the ninth grade level, while
Table 18:Districtwide Performance Gaps on Stanford 9 Mathematics Test by Grade and Ethnicity, 2001, 2002(2001 Results Based on 1995 Norms, 2002 Results Based on 2000 Norms)
WhiteAfr
Amer WhiteAfr
Amer 01–02 White Hisp White Hisp 01–02NCE NCE NCE NCE Gap NCE NCE NCE NCE Gap
Grd 2001 2001 Gap 2002 2002 Gap Diff 2001 2001 Gap 2002 2002 Gap Diff1 63 48 15 59 48 11 -4 63 49 14 59 49 10 -42 67 47 20 63 45 18 -2 67 51 16 63 50 13 -33 68 51 17 64 48 16 -1 68 53 15 64 51 13 -24 69 50 19 66 48 18 -1 69 55 14 66 53 13 -15 67 50 17 65 49 16 -1 67 53 14 65 52 13 -16 69 47 22 64 46 18 -4 69 49 20 64 47 17 -37 62 41 21 63 42 21 0 62 43 19 63 44 19 08 63 39 24 57 39 18 -6 63 41 22 57 39 18 -49 65 42 23 62 41 21 -2 65 44 21 62 43 19 -2
10 66 40 26 61 39 22 -4 66 43 23 61 42 19 -411 68 41 27 65 40 25 -2 68 43 25 65 43 22 -3

28 HISD RESEARCH AND ACCOUNTABILITY
HOUSTON URBAN LEARNING INITIATIVES IN A NETWORKED COMMUNITY: 2001–2002
M F M F 01–02 EcoDNon
EcoD EcoDNon
EcoD 01–02NCE NCE NCE NCE Gap NCE NCE NCE NCE Gap
Grd 2001 2001 Gap 2002 2002 Gap Diff 2001 2001 Gap 2002 2002 Gap Diff1 51 51 0 51 50 1 1 47 60 13 48 56 8 -52 52 52 0 50 50 0 0 47 64 17 47 58 11 -63 54 55 1 52 52 0 -1 51 64 13 49 60 11 -24 54 56 2 53 53 0 -2 52 65 13 50 62 12 -15 54 55 1 54 52 2 1 51 64 13 51 61 10 -36 50 53 3 50 48 2 -1 48 61 13 47 58 11 -27 44 45 1 46 45 1 0 41 53 12 43 55 12 08 43 43 0 41 41 0 0 40 51 11 39 49 10 -19 46 46 0 45 44 1 1 43 51 8 42 51 9 1
10 47 46 1 44 46 2 1 41 51 10 41 50 9 -111 49 47 2 46 48 2 0 42 53 11 41 53 12 1
SpEd Reg SpEd Reg 01–02
GrdNCE2001 Gap
NCE2002 Gap
GapDiff
1 37 52 15 42 51 9 -62 36 53 17 37 51 14 -33 35 57 22 35 54 19 -34 35 58 23 35 55 20 -35 33 57 24 35 56 21 -36 31 55 24 30 52 22 -27 28 48 20 28 48 20 08 28 46 18 26 44 18 09 33 48 15 31 46 15 0
10 30 48 18 30 46 16 -211 32 49 17 28 48 20 3
Table 19:Districtwide Performance Gaps on Stanford 9 Mathematics Test by Gender, Socio-Econ. Status, 2001,2002 (2001 Results Based on 1995 Norms, 2002 Results Based on 2000 Norms)
Table 20:Districtwide Performance Gaps on Stanford9 Math Test by Instructional Placement,2001, 2002 (2001 Results Based on 1995Norms, 2002 Results Based on 2000Norms)
the largest gap was at the second grade level. In 2002,the smallest gap was at the first grade level, while thelargest gap was at the fourth and seventh grade levels(8 NCEs versus 12 NCEs, respectively). Over thetwo year period, there was a reduction in the gap atthe first through the sixth, the eighth, and the tenthgrade levels. There was no gap at the seventh gradelevel.
Table 20 reveals the performance gaps betweenspecial education and regular education students. Asevident in Table 20, the gap between the groupsranged from 15 NCEs to 24 NCEs in 2001 and fromnine NCEs to 22 NCEs in 2002. From year to year,a reduction in the gap existed at the first through sixth,and the tenth grade levels. There was no gap at theseventh through ninth grade levels.
Stanford 9 Environment/Science SubtestTable 21 shows the performance gap between
White and African American students on the Stanford9 environment/science subtest. According to Table21, in 2001, the smallest gap between these ethnicgroups was at the first grade level and the largest gapwas at the eighth and eleventh grade levels (17 NCEsand 26 NCEs, respectively). By 2002, the smallestgap was at the first grade level, while the largest gapwas at the eleventh grade level (18 NCEs versus 26NCEs, respectively). From 2001 to 2002, there wasa reduction in the gap a the second, third, eighth, andtenth grade levels. There was no gap at the eleventhgrade level.
The performance gap between White and His-panic students was presented in Table 21. Asreflected in Table 21, in 2001, the smallest gap wasat the first grade level, while the largest gap was at theeleventh grade level (16 NCEs versus 26 NCEs,respectively). In 2002, the smallest gap was at thefirst, second, and fourth grade levels, while the largestgap was at the eleventh grade level (17 NCEs versus24 NCEs, respectively). Over the two years, therewas a reduction in the gap at the second, third, eighth,and eleventh grade levels. There were no gaps at thefourth through sixth and the tenth grade levels.
Refer to Table 22 for the performance gap bygender on the Stanford 9 environment/science subtest.As can be seen in Table 22, in 2001, the smallest gapbetween males and females occurred at the fifththrough seventh and tenth grade levels, and thelargest gap occurred at the second and eleventhgrade levels (1 NCE versus 2 NCEs, respectively).There was no gap at all other grade levels. By 2002,

29HISD RESEARCH AND ACCOUNTABILITY
HOUSTON URBAN LEARNING INITIATIVES IN A NETWORKED COMMUNITY: 2001–2002
Table 22:Districtwide Performance Gaps on Stanford 9 Environmental/Science Test by Gender, Socio-Econ.Status, 2001, 2002 (2001 Results Based on 1995 Norms, 2002 Results Based on 2000 Norms)
the smallest gap occurred at the majority of gradelevels, including the first, third, fourth, and sixththrough tenth (1 NCE). At the same time, the largestgap occurred at the second and eleventh grade levels(2 NCEs). There was no gap at the fifth grade level.From 2001 to 2002, there was a reduction in the gapat the fifth grade level by one NCE. There were nogaps at the second, sixth, seventh, tenth, and elev-enth grade levels.
Table 22 shows the performance gap betweeneconomically disadvantaged and non-economicallydisadvantaged students. In 2001, the gaps rangedfrom eight NCEs to 16 NCEs. The smallest gap wasat the ninth grade level, while the largest gap was atthe third, fifth, and sixth grade levels. In 2002, thegaps ranged from seven NCEs to fifteen NCEs. Thesmallest gap was at the ninth grade level, while thelargest gap was at the sixth grade level. Over the two-year period, there was a reduction in the gap at the firstthrough sixth, the eighth and ninth grade levels. There
was no gap at the seventh grade level.The performance gap between special education
and regular education students is revealed in Table23. The findings indicate that the largest gap was atthe fifth and sixth grade levels in 2001 (20 NCEs),while the smallest gap was at the second grade level(9 NCEs). By 2002, the largest gap was at the sixth,eighth, and eleventh grade levels (19 NCEs), while thesmallest gap was at the first grade level (6 NCEs).From 2001 to 2002, there was a reduction in the gapat the first through third, fifth through seventh, and theninth through tenth grade levels. Additionally, therewas no gap at the fourth and the eighth grade levels.
Was there interest in pursuing mathematics, sci-ence, and other technology-based careers forHISD students in 2001–02?
As indicated in Table 24, a total of 800 studentsand 73 teachers participated in Say “YES” to a
WhiteAfr
Amer WhiteAfr
Amer 01–02 White Hisp White Hisp 01–02NCE NCE NCE NCE Gap NCE NCE NCE NCE Gap
Grd 2001 2001 Gap 2002 2002 Gap Diff 2001 2001 Gap 2002 2002 Gap Diff1 62 45 17 60 42 18 1 62 46 16 60 43 17 12 62 40 22 61 40 21 -1 62 44 18 61 44 17 -13 68 45 23 67 45 22 -1 68 49 19 67 49 18 -14 63 44 19 60 40 20 1 63 46 17 60 43 17 05 64 43 21 63 41 22 1 64 45 19 63 44 19 06 68 44 24 65 40 25 1 68 45 23 65 42 23 07 66 43 23 64 39 25 2 66 45 21 64 41 23 28 68 42 26 61 38 23 -3 68 44 24 61 39 22 -29 59 40 19 58 38 20 1 59 41 18 58 39 19 1
10 63 39 24 60 38 22 -2 63 41 22 60 38 22 011 65 39 26 63 37 26 0 65 39 26 63 39 24 -2
Table 21: Districtwide Performance Gaps on Stanford 9 Environment/Science Test by Ethnic Group, Spring 2001and 2002 (2001 Results Based on 1995 Norms, 2002 Results Based on 2000 Norms)
M F M F 01–02 EcoDNon
EcoD EcoDNon
EcoD 01–02NCE NCE NCE NCE Gap NCE NCE NCE NCE Gap
Grd 2001 2001 Gap 2002 2002 Gap Diff 2001 2001 Gap 2002 2002 Gap Diff1 48 48 0 46 45 1 1 44 58 14 42 53 11 -32 46 44 2 44 46 2 0 41 56 15 42 54 12 -33 50 50 0 49 50 1 1 46 62 16 46 60 14 -24 48 48 0 44 45 1 1 44 58 14 41 54 13 -15 48 47 1 45 45 0 -1 43 59 16 42 56 14 -26 47 48 1 44 43 1 0 43 59 16 40 55 15 -17 47 46 1 42 43 1 0 43 56 13 39 52 13 08 46 46 0 40 41 1 1 42 55 13 37 49 12 -19 43 43 0 39 38 1 1 40 48 8 36 43 7 -1
10 45 44 1 40 39 1 0 39 49 10 35 46 11 111 45 43 2 39 41 2 0 38 49 11 34 46 12 1

30 HISD RESEARCH AND ACCOUNTABILITY
HOUSTON URBAN LEARNING INITIATIVES IN A NETWORKED COMMUNITY: 2001–2002
SpEd Reg SpEd Reg 01–02
GrdNCE2001 Gap
NCE2002 Gap
GapDiff
1 38 48 10 40 46 6 -42 37 46 9 38 45 7 -23 33 52 19 36 51 15 -44 33 50 17 30 47 17 05 30 50 20 31 47 16 -46 30 50 20 27 46 19 -17 32 49 17 29 45 16 -18 30 49 19 25 44 19 09 32 45 13 30 42 12 -1
10 29 46 17 29 43 14 -311 29 45 16 26 45 19 3
Table 23:Districtwide Performance Gaps onStanford 9 Environment/Science Test byInstructional Program, 2001, 2002 (2001Results Based on 1995 Norms, 2002Results Based on 2000 Norms)
Event/Activity AudienceNumber of
ParticipantsSay “YES” Teachers 73Say “YES” Students 800Science Fair Students 292SECME/GCTAMERegional Competition Students 200SECME GCTAME Teachers 43SECME/GCTAME Mathand Science Competition
Students 200
SECME/GCTAME Campusmembership
MiddleSchool
600
HighSchool
375
Table 24: Participation in Science and Math Activities,2001–02
Youngster’s Future. This program was designed toincrease knowledge as well as to stimulate interest inmathematics, science, and technology for urbanminority and female students, their families, and theirteachers. Parental and community involvement,strong business partnerships, cultural heritage con-nections, and special teacher training were essentialcomponents of Say "YES." Additionally, 292 studentsparticipated in science fairs, competing with studentsthroughout Houston and the state of Texas. Campusmemberships to organizations that focused on sci-ence, mathematics, and technology occurred at themiddle school as well as at the high school studentslevels. Interest was apparent as nearly 1,000 stu-dents joined organizations such as Science, Engi-neering, Communication, Mathematics Enhancement(SECME) and the Gulf Coast Texas Alliance forMinorities in Engineering, Inc. (GCTAME). Math andscience competitions resulted in the participation of200 students at the regional level and 200 students atthe local level.