Report of the Working Group on Mixed Fisheries Advice ... Reports/Expert Group Report/acom... ·...
51
ICES WGMIXFISH-METH REPORT 2015 ICES ADVISORY COMMITTEE ICES CM 2015/ACOM:22 REF. ACOM Report of the Working Group on Mixed Fisheries Advice Methodology (WGMIXFISH-METH) 5–9 October 2015 DTU-Aqua, Charlottenlund, Denmark
Transcript of Report of the Working Group on Mixed Fisheries Advice ... Reports/Expert Group Report/acom... ·...
ICES WGMIXFISH-METH REPORT 2015 ICES ADVISORY COMMITTEE
ICES CM 2015/ACOM:22
REF. ACOM
Report of the Working Group on Mixed Fisheries Advice Methodology
(WGMIXFISH-METH)
5–9 October 2015
DTU-Aqua, Charlottenlund, Denmark

International Council for the Exploration of the Sea Conseil International pour l’Exploration de la Mer
H. C. Andersens Boulevard 44–46 DK-1553 Copenhagen V Denmark Telephone (+45) 33 38 67 00 Telefax (+45) 33 93 42 15 www.ices.dk [email protected]
Recommended format for purposes of citation:
ICES. 2015. Report of the Working Group on Mixed Fisheries Advice Methodology (WGMIXFISH-METH), 5–9 October 2015, DTU-Aqua, Charlottenlund, Denmark. ICES CM 2015/ACOM:22. 51 pp.
For permission to reproduce material from this publication, please apply to the Gen-eral Secretary.
The document is a report of an Expert Group under the auspices of the International Council for the Exploration of the Sea and does not necessarily represent the views of the Council.
© 2015 International Council for the Exploration of the Sea

ICES WGMIXFISH-METH REPORT 2015 | i
Contents
Executive summary ................................................................................................................ 1
1 Introduction .................................................................................................................... 2
1.1 Background............................................................................................................ 2 1.2 Terms of Reference ............................................................................................... 2
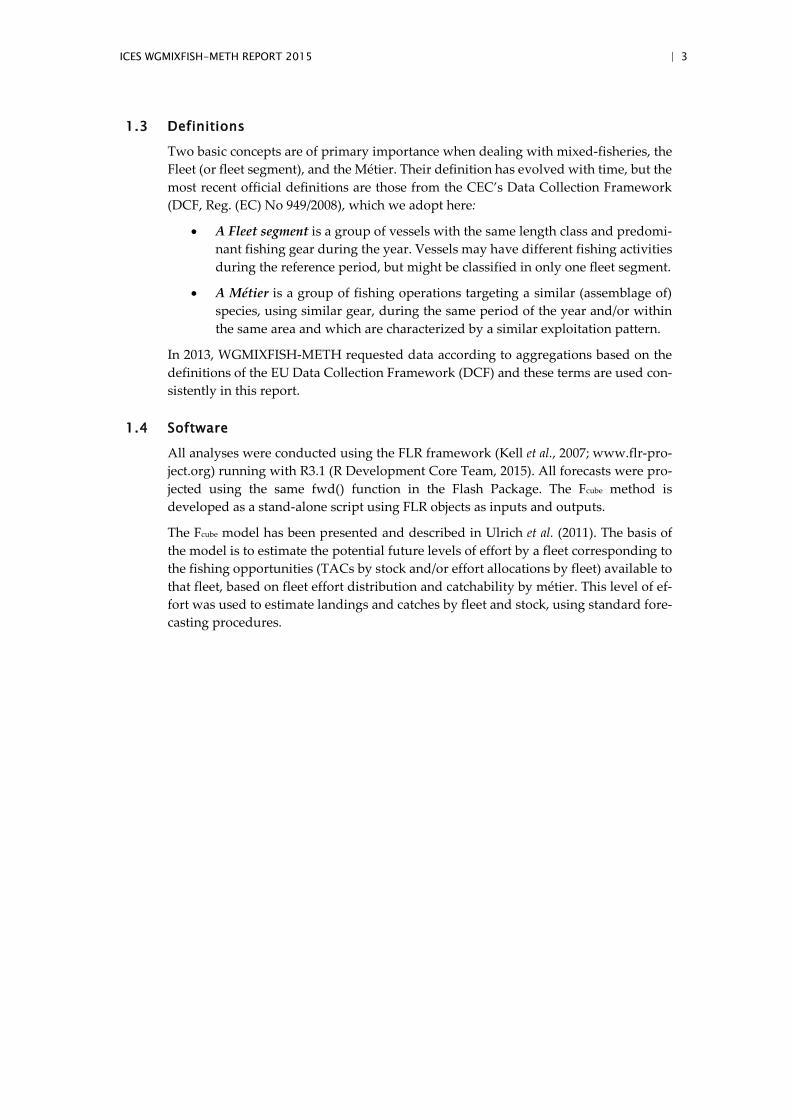
1.3 Definitions ............................................................................................................. 3
1.4 Software ................................................................................................................. 3
2 Terms of Reference A .................................................................................................... 4
2.1 Short term catch forecasting methods, including methods to incorporate data-poor stocks taking account of uncertainties ........................ 4 2.1.1 Characterising variance in CPUE .......................................................... 4 2.1.2 Evaluating accuracy of multiple methods of forecasting
catch ........................................................................................................... 5 2.2 Incorporation of advice on protected, endangered and threatened
(PET) species into mixed fisheries advice. ......................................................... 9 2.3 Incorporation of FMSY ranges into forecasting procedure to provide
advice which minimises incompatibility between management advice for multiple stocks exploited in mixed fisheries. ............................... 12 2.3.1 Using single-stock MSY F ranges to identify target F that
reduce tensions and mismatches in the system. ................................ 12 2.3.2 FMSY ranges given mixed fisheries interactions in the Celtic
Sea. ........................................................................................................... 20 2.4 Application of methodology to other ICES regions, fisheries and
stocks .................................................................................................................... 21 2.4.1 Mixed Fisheries West of Scotland and Influence of a top
predator ................................................................................................... 21 2.4.2 Analysis of métier coherence within the Celtic Sea .......................... 32
3 Terms of Reference B .................................................................................................. 33
3.1 Undertake a Principle Components Analysis (PCA) on the WGMIXFISH métier data used in North Sea mixed fishery forecasts to inform a minimum fleet aggregation for use in ecosystem models ............................................................................................................................... 33
4 Additional issues considered .................................................................................... 40
4.1 Developing Fcube at age for the North Sea ........................................................ 40 4.1.1 Data .......................................................................................................... 40 4.1.2 Software .................................................................................................. 40 4.1.3 Results ..................................................................................................... 40
5 References ..................................................................................................................... 42
Annex 1: List of Participants............................................................................................... 43
Annex 2: Recommendations ............................................................................................... 45

ii | ICES WGMIXFISH-METH REPORT 2015
Annex 3: List of Stock Annexes ......................................................................................... 46
Annex 4: Proposed ToRs for 2016 WGMIXFISH-METH Meeting .............................. 47

ICES WGMIXFISH-METH REPORT 2015 | 1
Executive summary
The ICES Working Group on Mixed Fisheries Methods, WGMIXFISH-METH, (Chair: Youen Vermard (FR)) met at Charlottenlund Castle, DTU-Aqua, Charlottenlund 5–9 October 2015 to:
• Develop short term catch forecasting methods, including methods to incorpo-rate data-poor stocks taking account of uncertainties.
• Incorporate advice on protected, endangered and threatened (PET) species.
• Incorporate FMSY ranges into forecasting procedures to provide advice which minimizes incompatibilities between management advices for multiple stocks exploited in mixed fisheries.
• Undertake a Principle Component Analysis (PCA) on the WGMIXFISH métier data used in North Sea mixed fishery forecasts to inform a minimum fleet ag-gregation for use in ecosystem models.
In addition to these core issues, the working group also considered the inclusion of top predators (seals) in the West of Scotland Fcube models and its influence on mixed fish-eries forecast. The group also investigated the coherence of metier defined in the Celtic Sea data call in order to make recommendation for the joint WGMIXFISH/WGCSE data call.
Following some initiatives developed during WGMIXFISH-METH last year, during STECF NSMAP 2015 (2015–05) and in the MYFISH European project, methods to in-corporate FMSY ranges to the forecasting procedures were further developed during the Working Group. The approach developed minimizes the differences in catches be-tween the min and max (or min and sq) scenarios by searching the appropriate F values for the different stocks. Such an approach allows for reducing the inconsistencies be-tween management advices while staying between the boundaries of the ranges.
Following the joint WGMIXFISH/WGSAM conclusions from last year, an analysis was conducted on the métiers data used for WGMIXFISH to assess the possibility of reduc-ing the number of segments in order to transfer the partial mortality rates from the mixed fisheries models to the multi species models. This work is likely to be progressed further in the coming months (during WGSAM and latter) as part of developing inte-grated ecosystem advice which takes into account both multispecies (biological) and mixed fishery (technical) interactions.
The group decided to write a concise report and to focus on scientific papers around the FMSY ranges and their incorporation in the advice and the work developed around the data-poor and PET species.

2 | ICES WGMIXFISH-METH REPORT 2015
1 Introduction
1.1 Background
The mixed fisheries methods working group (WGMIXFISH-METH) was formed in re-sponse to the need to further develop how ICES provides mixed fisheries advice and to progress application of methods to areas other than the North Sea, independent of the annual advisory meeting (ICES, 2015a). WGMIXFISH-METH met in Charlotten-lund 5–9 October 2015 to consider the following issues:
• Develop short term catch forecasting methods, including methods to incorpo-rate data-poor stocks taking account of uncertainties.
• Incorporate advice on protected, endangered and threatened (PET) species.
• Incorporate FMSY ranges into forecasting procedures to provide advice which minimizes incompatibilities between management advices for multiple stocks exploited in mixed fisheries.
• Undertake a Principle Component Analysis (PCA) on the WGMIXFISH métier data used in North Sea mixed fishery forecasts to inform a minimum fleet ag-gregation for use in ecosystem models
In addition to these core issues, the working group also considered the inclusion of top predators (seals) in the West of Scotland Fcube model and gave some thought on the reformulation of the joint WGMIXFISH/WGCSE data call.
1.2 Terms of Reference
The terms of reference for WGMIXFISH-METH in 2015 were as follows
2014/2/ACOM23 The Working Group on Mixed Fisheries Advice Methodology (WGMIXFISH-METH), chaired by Youen Vermard, France, will meet in Copenhagen, 5–9 October 2015 to:
a. Review progress on mixed fisheries methodologies, including work under EU projects MYFISH and DISCARDLESS and consider how they might be taken forward and incorporated into the advisory process. In particular, fo-cus should be given to the following priorities: - Short term catch forecasting methods, including methods to incorporate data-poor stocks taking uncertainties into account; - Incorporation of advice on protected, endangered and threatened (PET) species into mixed fisheries advice; - Incorporation of FMSY ranges into forecasting procedure to provide advice which minimises incompatibility between management advice for multiple stocks exploited in mixed fisheries. This may be developed through robust medium term Management Strategy Evaluation approaches building on work developed under MYFISH; - Application of methodology to other ICES regions, fisheries and stocks.
b. Undertake a Principle Components Analysis (PCA) on the WGMIXFISH métier data used in North Sea mixed fishery forecasts to inform a minimum fleet aggregation for use in ecosystem models.
ICES WGMIXFISH-METH REPORT 2015 | 3
1.3 Definitions
Two basic concepts are of primary importance when dealing with mixed-fisheries, the Fleet (or fleet segment), and the Métier. Their definition has evolved with time, but the most recent official definitions are those from the CEC’s Data Collection Framework (DCF, Reg. (EC) No 949/2008), which we adopt here:
• A Fleet segment is a group of vessels with the same length class and predomi-nant fishing gear during the year. Vessels may have different fishing activities during the reference period, but might be classified in only one fleet segment.
• A Métier is a group of fishing operations targeting a similar (assemblage of) species, using similar gear, during the same period of the year and/or within the same area and which are characterized by a similar exploitation pattern.
In 2013, WGMIXFISH-METH requested data according to aggregations based on the definitions of the EU Data Collection Framework (DCF) and these terms are used con-sistently in this report.
1.4 Software
All analyses were conducted using the FLR framework (Kell et al., 2007; www.flr-pro-ject.org) running with R3.1 (R Development Core Team, 2015). All forecasts were pro-jected using the same fwd() function in the Flash Package. The Fcube method is developed as a stand-alone script using FLR objects as inputs and outputs.
The Fcube model has been presented and described in Ulrich et al. (2011). The basis of the model is to estimate the potential future levels of effort by a fleet corresponding to the fishing opportunities (TACs by stock and/or effort allocations by fleet) available to that fleet, based on fleet effort distribution and catchability by métier. This level of ef-fort was used to estimate landings and catches by fleet and stock, using standard fore-casting procedures.
4 | ICES WGMIXFISH-METH REPORT 2015
2 Terms of Reference A
2.1 Short term catch forecasting methods, including methods to incorpo-rate data-poor stocks taking account of uncertainties
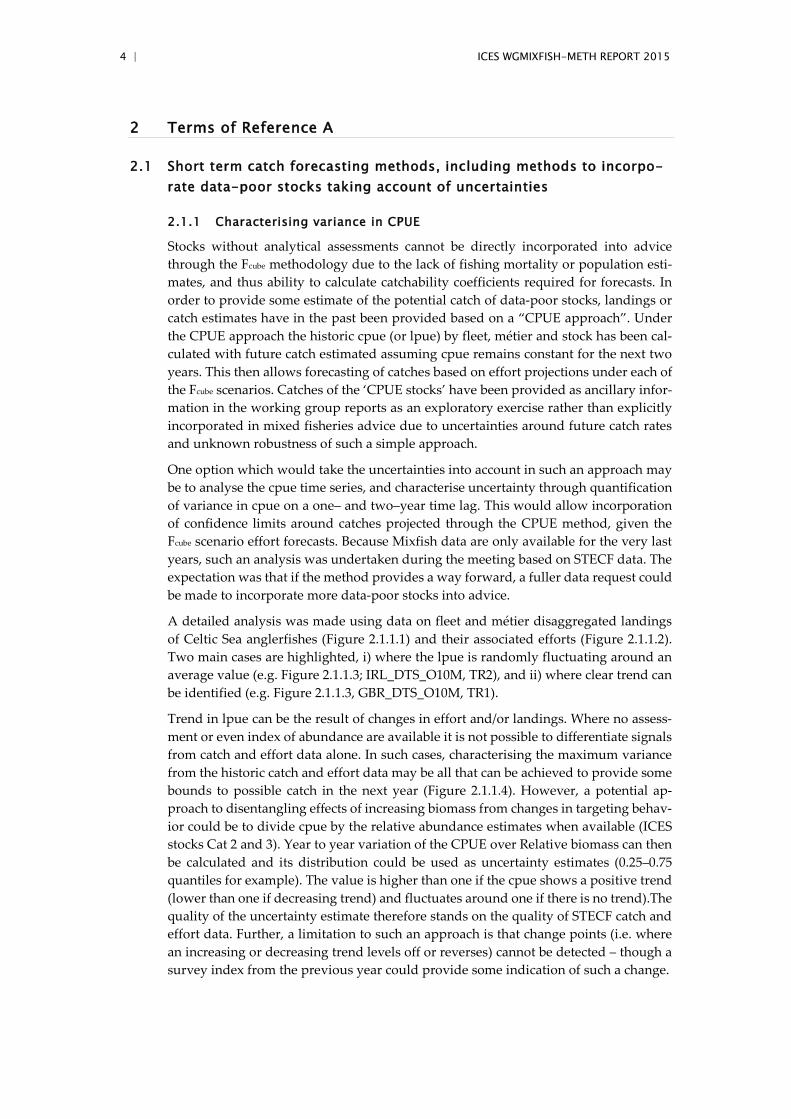
2.1.1 Characterising variance in CPUE
Stocks without analytical assessments cannot be directly incorporated into advice through the Fcube methodology due to the lack of fishing mortality or population esti-mates, and thus ability to calculate catchability coefficients required for forecasts. In order to provide some estimate of the potential catch of data-poor stocks, landings or catch estimates have in the past been provided based on a “CPUE approach”. Under the CPUE approach the historic cpue (or lpue) by fleet, métier and stock has been cal-culated with future catch estimated assuming cpue remains constant for the next two years. This then allows forecasting of catches based on effort projections under each of the Fcube scenarios. Catches of the ‘CPUE stocks’ have been provided as ancillary infor-mation in the working group reports as an exploratory exercise rather than explicitly incorporated in mixed fisheries advice due to uncertainties around future catch rates and unknown robustness of such a simple approach.
One option which would take the uncertainties into account in such an approach may be to analyse the cpue time series, and characterise uncertainty through quantification of variance in cpue on a one– and two–year time lag. This would allow incorporation of confidence limits around catches projected through the CPUE method, given the Fcube scenario effort forecasts. Because Mixfish data are only available for the very last years, such an analysis was undertaken during the meeting based on STECF data. The expectation was that if the method provides a way forward, a fuller data request could be made to incorporate more data-poor stocks into advice.
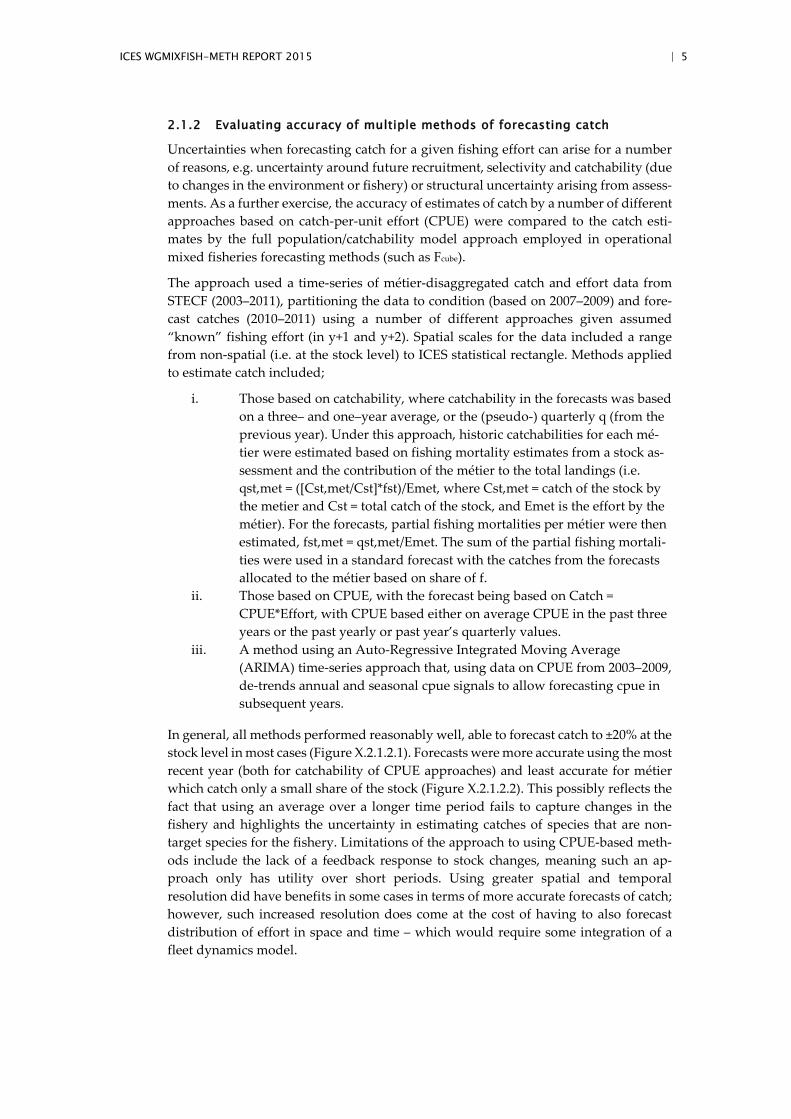
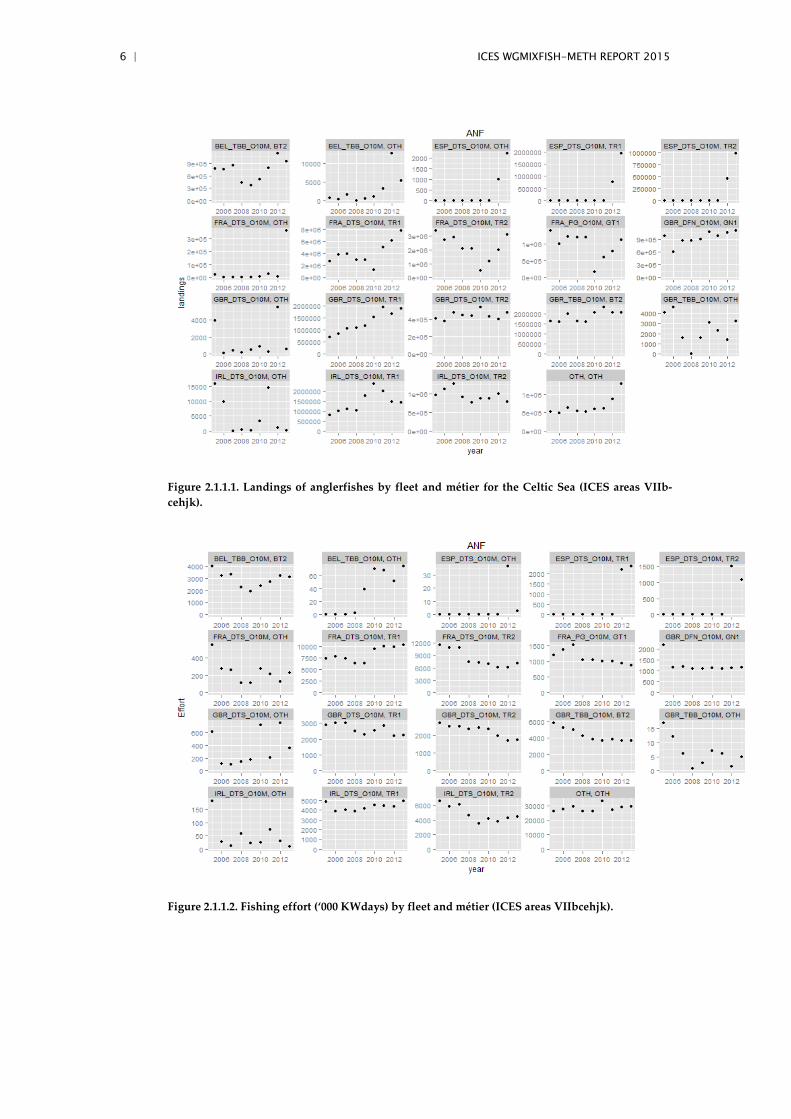
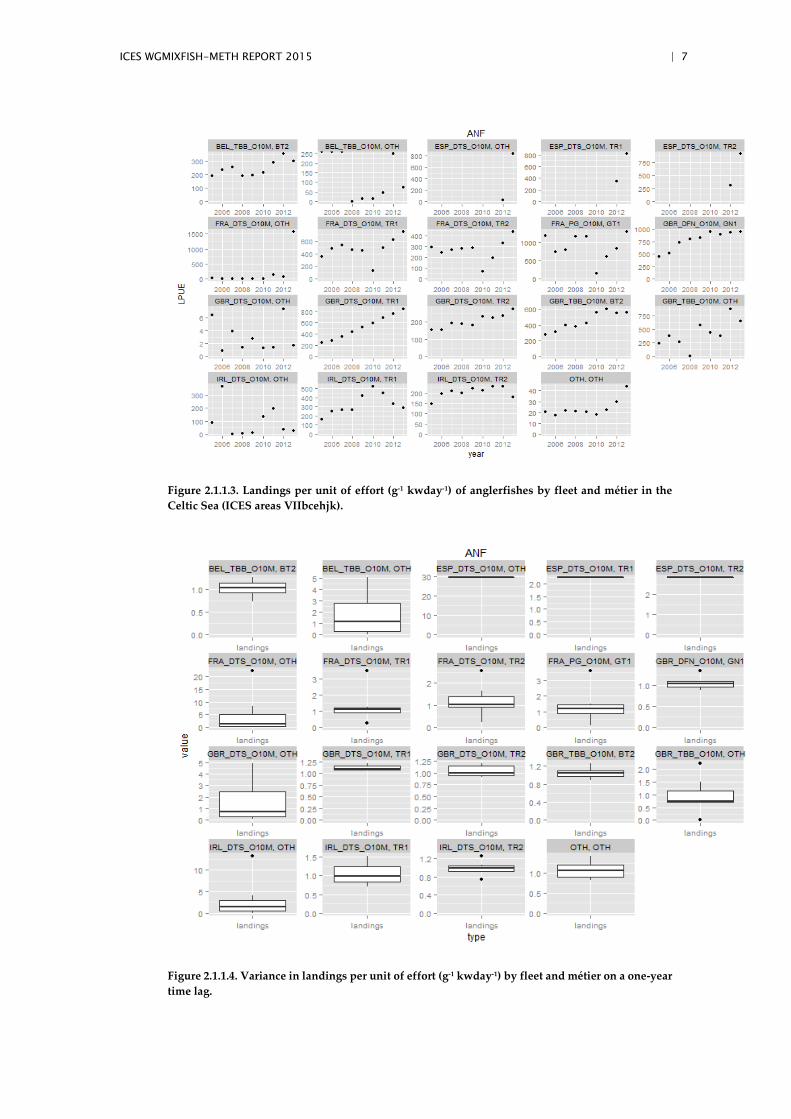
A detailed analysis was made using data on fleet and métier disaggregated landings of Celtic Sea anglerfishes (Figure 2.1.1.1) and their associated efforts (Figure 2.1.1.2). Two main cases are highlighted, i) where the lpue is randomly fluctuating around an average value (e.g. Figure 2.1.1.3; IRL_DTS_O10M, TR2), and ii) where clear trend can be identified (e.g. Figure 2.1.1.3, GBR_DTS_O10M, TR1).
Trend in lpue can be the result of changes in effort and/or landings. Where no assess-ment or even index of abundance are available it is not possible to differentiate signals from catch and effort data alone. In such cases, characterising the maximum variance from the historic catch and effort data may be all that can be achieved to provide some bounds to possible catch in the next year (Figure 2.1.1.4). However, a potential ap-proach to disentangling effects of increasing biomass from changes in targeting behav-ior could be to divide cpue by the relative abundance estimates when available (ICES stocks Cat 2 and 3). Year to year variation of the CPUE over Relative biomass can then be calculated and its distribution could be used as uncertainty estimates (0.25–0.75 quantiles for example). The value is higher than one if the cpue shows a positive trend (lower than one if decreasing trend) and fluctuates around one if there is no trend).The quality of the uncertainty estimate therefore stands on the quality of STECF catch and effort data. Further, a limitation to such an approach is that change points (i.e. where an increasing or decreasing trend levels off or reverses) cannot be detected – though a survey index from the previous year could provide some indication of such a change.
ICES WGMIXFISH-METH REPORT 2015 | 5
2.1.2 Evaluating accuracy of multiple methods of forecasting catch
Uncertainties when forecasting catch for a given fishing effort can arise for a number of reasons, e.g. uncertainty around future recruitment, selectivity and catchability (due to changes in the environment or fishery) or structural uncertainty arising from assess-ments. As a further exercise, the accuracy of estimates of catch by a number of different approaches based on catch-per-unit effort (CPUE) were compared to the catch esti-mates by the full population/catchability model approach employed in operational mixed fisheries forecasting methods (such as Fcube).
The approach used a time-series of métier-disaggregated catch and effort data from STECF (2003–2011), partitioning the data to condition (based on 2007–2009) and fore-cast catches (2010–2011) using a number of different approaches given assumed “known” fishing effort (in y+1 and y+2). Spatial scales for the data included a range from non-spatial (i.e. at the stock level) to ICES statistical rectangle. Methods applied to estimate catch included;
i. Those based on catchability, where catchability in the forecasts was based on a three– and one–year average, or the (pseudo-) quarterly q (from the previous year). Under this approach, historic catchabilities for each mé-tier were estimated based on fishing mortality estimates from a stock as-sessment and the contribution of the métier to the total landings (i.e. qst,met = ([Cst,met/Cst]*fst)/Emet, where Cst,met = catch of the stock by the metier and Cst = total catch of the stock, and Emet is the effort by the métier). For the forecasts, partial fishing mortalities per métier were then estimated, fst,met = qst,met/Emet. The sum of the partial fishing mortali-ties were used in a standard forecast with the catches from the forecasts allocated to the métier based on share of f.
ii. Those based on CPUE, with the forecast being based on Catch = CPUE*Effort, with CPUE based either on average CPUE in the past three years or the past yearly or past year’s quarterly values.
iii. A method using an Auto-Regressive Integrated Moving Average (ARIMA) time-series approach that, using data on CPUE from 2003–2009, de-trends annual and seasonal cpue signals to allow forecasting cpue in subsequent years.
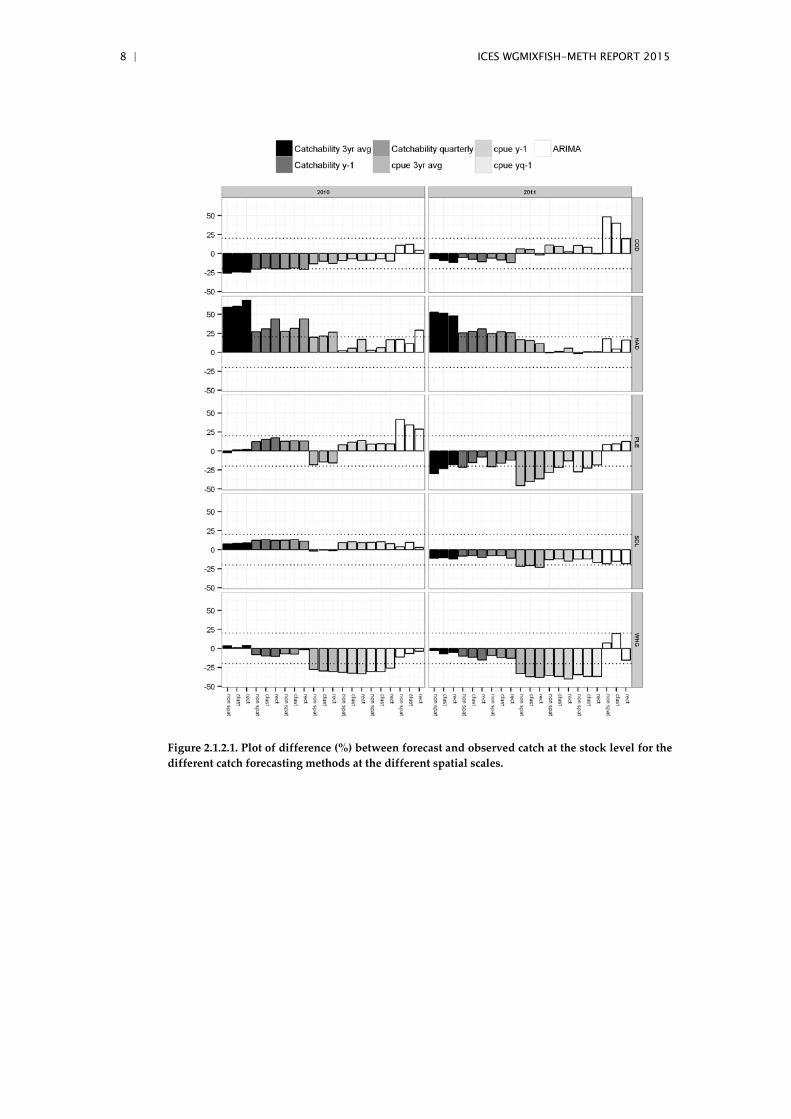
In general, all methods performed reasonably well, able to forecast catch to ±20% at the stock level in most cases (Figure X.2.1.2.1). Forecasts were more accurate using the most recent year (both for catchability of CPUE approaches) and least accurate for métier which catch only a small share of the stock (Figure X.2.1.2.2). This possibly reflects the fact that using an average over a longer time period fails to capture changes in the fishery and highlights the uncertainty in estimating catches of species that are non-target species for the fishery. Limitations of the approach to using CPUE-based meth-ods include the lack of a feedback response to stock changes, meaning such an ap-proach only has utility over short periods. Using greater spatial and temporal resolution did have benefits in some cases in terms of more accurate forecasts of catch; however, such increased resolution does come at the cost of having to also forecast distribution of effort in space and time – which would require some integration of a fleet dynamics model.
6 | ICES WGMIXFISH-METH REPORT 2015
Figure 2.1.1.1. Landings of anglerfishes by fleet and métier for the Celtic Sea (ICES areas VIIb-cehjk).
Figure 2.1.1.2. Fishing effort (‘000 KWdays) by fleet and métier (ICES areas VIIbcehjk).
ICES WGMIXFISH-METH REPORT 2015 | 7
Figure 2.1.1.3. Landings per unit of effort (g-1 kwday-1) of anglerfishes by fleet and métier in the Celtic Sea (ICES areas VIIbcehjk).
Figure 2.1.1.4. Variance in landings per unit of effort (g-1 kwday-1) by fleet and métier on a one-year time lag.
8 | ICES WGMIXFISH-METH REPORT 2015
Figure 2.1.2.1. Plot of difference (%) between forecast and observed catch at the stock level for the different catch forecasting methods at the different spatial scales.

ICES WGMIXFISH-METH REPORT 2015 | 9
Figure 2.1.2.2. Plot of log (observed catch+1) against log (EstCatch+1) across five species (cod, had-dock, whiting, plaice, sole) under seven forecasting methods each at three spatial scales. Methods and spatial scales described in text.
2.2 Incorporation of advice on protected, endangered and threatened (PET) species into mixed fisheries advice.
One of the Strategic priorities of ACOM is to further develop integrated advice on fish-eries. WGMIXFISH is one of the key groups in furthering this integration. The current advice on fish stocks and fisheries does not include any integration of bycatch issues beyond that of target fish species. Advice on bycatch of Protected, Endangered and Threatened (PET) species is provided separately with no consideration of wider fish-eries issues. Integration of the advice would enable managers to consider the two is-sues together rather than separately. ACOM has provided a steer that it might be best to start with consideration of the bycatch of cetaceans and to consider other bycatch (e.g. of PET elasmobranches) later.
10 | ICES WGMIXFISH-METH REPORT 2015
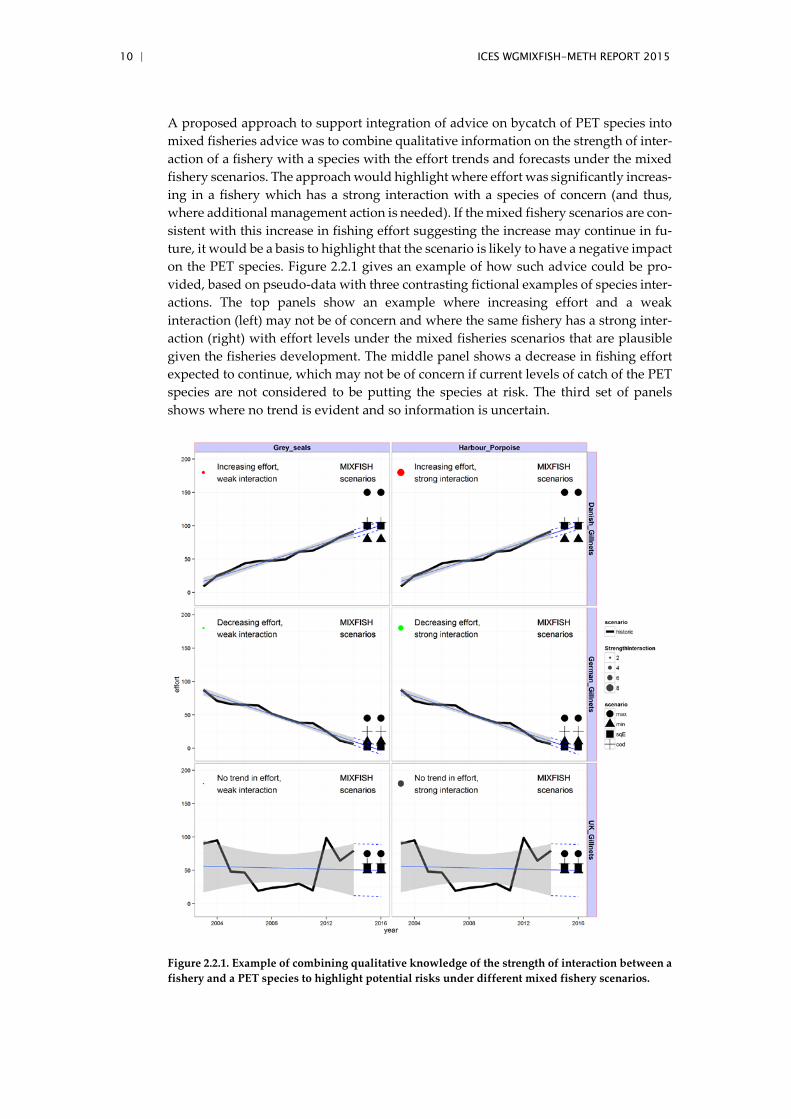
A proposed approach to support integration of advice on bycatch of PET species into mixed fisheries advice was to combine qualitative information on the strength of inter-action of a fishery with a species with the effort trends and forecasts under the mixed fishery scenarios. The approach would highlight where effort was significantly increas-ing in a fishery which has a strong interaction with a species of concern (and thus, where additional management action is needed). If the mixed fishery scenarios are con-sistent with this increase in fishing effort suggesting the increase may continue in fu-ture, it would be a basis to highlight that the scenario is likely to have a negative impact on the PET species. Figure 2.2.1 gives an example of how such advice could be pro-vided, based on pseudo-data with three contrasting fictional examples of species inter-actions. The top panels show an example where increasing effort and a weak interaction (left) may not be of concern and where the same fishery has a strong inter-action (right) with effort levels under the mixed fisheries scenarios that are plausible given the fisheries development. The middle panel shows a decrease in fishing effort expected to continue, which may not be of concern if current levels of catch of the PET species are not considered to be putting the species at risk. The third set of panels shows where no trend is evident and so information is uncertain.
Figure 2.2.1. Example of combining qualitative knowledge of the strength of interaction between a fishery and a PET species to highlight potential risks under different mixed fishery scenarios.
ICES WGMIXFISH-METH REPORT 2015 | 11
However, illustrations such as these would not provide an easy way for managers to recognise how a fisheries catch option might relate to an environmental target – for example an indicator under DCF or MSFD or a target set in another legal/policy con-text. Thus for example, there is an OSPAR common indicator (M6) on numbers of mammals being bycaught in relation to population; a similar knowledge requirement exists under the EU’s Habitats Directive and EU Regulation 812/2004 (and ICES has a standing request to advise annually on these issues).
A solution to this might be to develop an algorithm that sits alongside the current sys-tem for examining the consequences of various management scenarios on fisheries. This would give a calculation of bycatch based upon observed rates (maximum, mini-mum, realistic) per gear. Separate rates could be used if some mitigation is in place (e.g. acoustic pingers on gill nets to reduce harbour porpoise bycatch). If a limit (or warning level) for a certain bycatch has been agreed at the policy/political level then this could also be provided with advise on the risk of infringing the limit.
At present there is relatively limited information on bycatch rates of marine mammals, with only some gears/areas/species believed to be problematic. The initial algorithm could thus be relatively simple (e.g. by ignoring gears unlikely to have measurable bycatch).
One identified issue is the metric used for effort. Bycatch in static nets is related best to km of net x soak time, but effort in the static net fleet is in WGMIXFISH measured in days at sea (or kW x days at sea). The relationship of this metric of effort to bycatch rate will have a wider confidence interval than would a better effort metric, but this need not inhibit development of the algorithm or any advice.
Once catch rates and confidence intervals are computed and provided to WGMIXFISH, numbers of PET species bycaught by metiers can easily be computed as
NByCaught = 𝐶𝐶𝐶𝐶 ∗ 𝐸𝐸𝐸𝐸𝐸𝐸𝐸𝐸𝐸𝐸𝐸𝐸𝐸𝐸𝐸𝐸𝐸𝐸𝐸𝐸𝐸𝐸𝐸𝐸𝐸𝐸𝐸𝐸𝐸𝐸𝐸𝐸
These numbers of PET species bycaught do not take into account the dynamics of PET species stocks. However, when dealing with cetaceans, it is probable that their num-bers will stay quite stable from one year to another given that they are long-lived spe-cies.
These numbers can then be confronted to the defined “maximum acceptable catches” (Figure 2.2.2).

12 | ICES WGMIXFISH-METH REPORT 2015
Figure 2.2.2. Theoretical number of Harbour Porpoise catches by WGMIXFISH scenarios.
2.3 Incorporation of FMSY ranges into forecasting procedure to provide ad-vice which minimises incompatibility between management advice for multiple stocks exploited in mixed fisheries.
2.3.1 Using single-stock MSY F ranges to identify target F that reduce ten-sions and mismatches in the system.
This work built further on some initiatives developed during WGMIXFISH last year, and also during STECF NSMAP 2015 (2015–05). Methods and results are summarized here, and more in-depth scientific publications are under preparation. Also, these were presented to the ICES MYFISH Symposium (27–30 October 2015), with a presentation available at
http://www.myfishproject.eu/images/MYFISH/symposium/Talks/Day3/ClaraUlrich.pdf

ICES WGMIXFISH-METH REPORT 2015 | 13
Background
The concept of ranges for FMSY, corresponding to fishing mortality values leading to at least 95% of the maximum long term yields (ICES, 2015b) while not resulting in a prob(SSB < Blim) larger than 5%, was developed to introduce more flexibility in the management system. In a mixed fisheries context, STECF and WGMIXFISH has worked to explore whether the FMSY ranges could be used to reduce the incompatibili-ties between the single species TACs, that are currently leading either to over catching some species to reach the TAC of other species caught by the same fleets, or not reach-ing the TAC for some species when the TAC for other species is fully taken. Basically, if the ranges were in use the target F for species for which the TAC is limiting the fish-ery may in principle be increased up to the upper limit of the FMSY range (and the op-posite non limiting species) so that the risk of overshooting the TAC for limiting stocks (and/or under shooting the TAC for the other species) is minimised.
During WGMIXFISH-METH, the potential benefits from making use of the ranges to set the TAC in the North Sea mixed fisheries context was investigated further. The ap-proach taken consisted of using an optimisation procedure to find, within the FMSY ranges of each species, the fishing mortality values which would result in the smallest possible incompatibility between single species TACs in the mixed fisheries context.
Methods
It must be kept in mind, that all scenarios below are performed under the assumption of full implementation of the landings obligation for all stocks and fisheries in 2016, consistent with the choices made by ICES in June 2015 for providing advice. Results are likely to be different in the case of a partial LO as is now established in the Dele-gated Act for the North Sea
(http://ec.europa.eu/fisheries/cfp/fishing_rules/discards/doc/c-2015-7145_en.pdf).
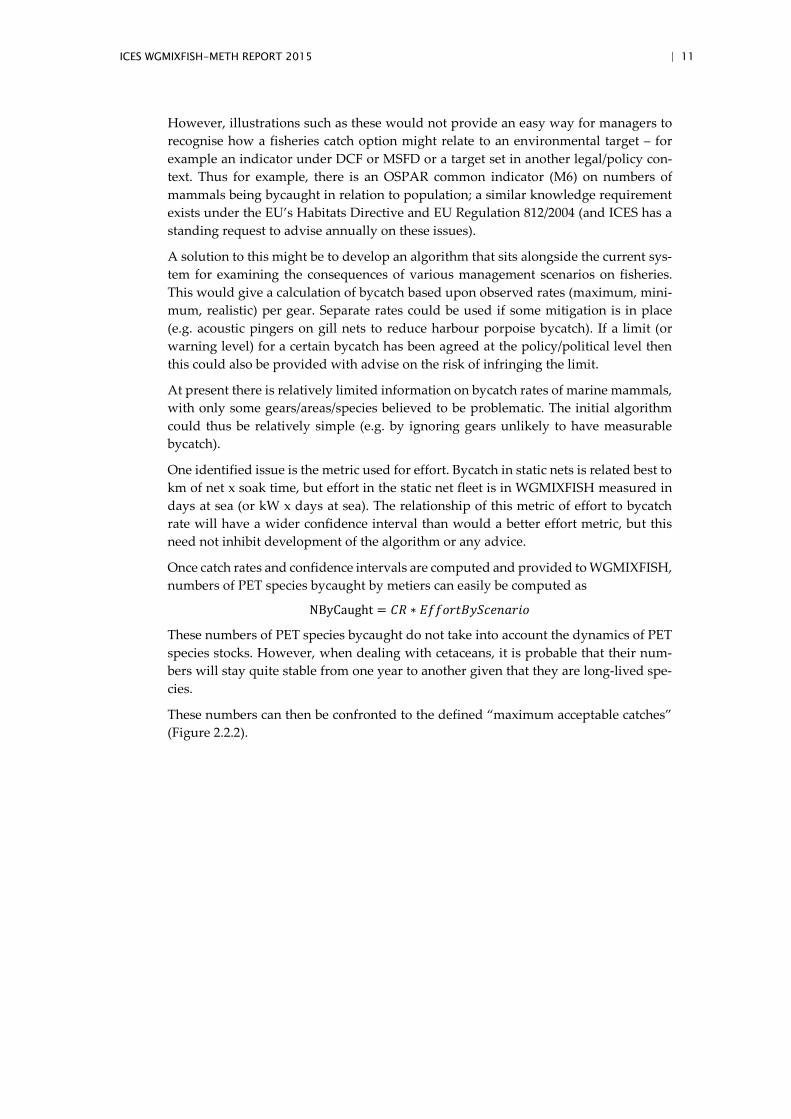
The minimisation criteria chosen to represent this incompatibility was the unbalance between the total catches expected under two Fcube scenarios. In the first case, we min-imised the difference between the two extremes “max” and ”min”, as an indicator of the global unbalance in the overall system. This expressed as the sum across species of the squared differences of catches 𝐶𝐶"max",species and 𝐶𝐶"min" ,species corresponding to these 2 scenarios:
∆𝐶𝐶𝑚𝑚𝐸𝐸𝑚𝑚−𝑚𝑚𝐸𝐸𝐸𝐸 = �(𝐶𝐶"max",𝑠𝑠𝐸𝐸𝐸𝐸𝐸𝐸𝑠𝑠 − 𝐶𝐶"𝑚𝑚𝐸𝐸𝐸𝐸",𝑠𝑠𝐸𝐸𝐸𝐸𝐸𝐸𝑠𝑠)𝑠𝑠𝐸𝐸𝐸𝐸𝐸𝐸𝑠𝑠
2
In a second case, the same exercise was done but minimising the difference between the current situation (“sq_E”) and the “min”, as an indicator of the “choke species” effect, i.e. which species would first stop the fleets:
∆𝐶𝐶𝑠𝑠𝑠𝑠−𝑚𝑚𝐸𝐸𝐸𝐸 = �(𝐶𝐶"sq_E",𝑠𝑠𝐸𝐸𝐸𝐸𝐸𝐸𝑠𝑠 − 𝐶𝐶"𝑚𝑚𝐸𝐸𝐸𝐸",𝑠𝑠𝐸𝐸𝐸𝐸𝐸𝐸𝑠𝑠)𝑠𝑠𝐸𝐸𝐸𝐸𝐸𝐸𝑠𝑠
2
14 | ICES WGMIXFISH-METH REPORT 2015
Figure 2.3.1.1. Illustration of Fcube unbalance indicators.
This optimisation was done for five of the main demersal fish stocks in the North Sea based on the 2015 assessment output (ICES, 2015c) and the latest FMSY estimates (ICES, 2015b). The whiting was excluded from the analyses because no range values were available for this species.
The optimisation was carried out using a genetic algorithm using the function rbga() from the R package genalg. This function takes as input minimum and maximum val-ues for the F to optimize (the FMSY ranges defined above) and an evaluation function that runs for each set of F values the ‘min’ and ‘max’ scenarios and returns the required ∆C. This type of algorithm then finds an optimal solution by mimicking a natural se-lection process: at each generation, the performance of a number (here 30) of sets of candidate fishing mortality values (one per species) for the advice year (2016) is eval-uated. For each set of values, the corresponding single species TACs are calculated based on these candidate F values. This conditioning is then used to run Fcube for the two scenarios and the optimisation criteria, ∆C, is calculated. Once all candidates in a generation are evaluated, only the best performing candidates (here 6) are kept to gen-erate, by recombination and occasionally mutation, a new generation of 30 candidates. This way the overall performance of the population improves at each generation. When the algorithm has converged, the best performing set of values of the last gener-ation is returned as output of the optimisation. In order to optimize the algorithm con-vergence, the initial population, set as suggestions in the function rbga(), corresponds to a Latin Hypercube Sample drawn from the five FMSY ranges seen as uniform distri-butions using the function optimumLHS() from the R package lhs.
In addition to this optimisation procedure, an ad hoc method suggested by STECF NSMAP 2015 (2015–05) to set the Ftarget values within the FMSY ranges was investigated. This so-called “balanced” strategy consisted in setting the TAC based on FMSYlow, the lower bound of the FMSY range, for species currently exploited at Fbar < FMSYlow, using the upper bound of the range, FMSYhigh, for species currently exploited at Fbar > FMSYhigh, and the point estimate FMSY for species currently at FMSYlow ≤ Fbar ≤ FMSYhigh.
The consequences in term of realised catches in the different Fcube scenarios are then compared between the defaults ICES TAC setting procedure (MSY Advice rule), a TAC setting procedure using the optimum values and one based on the “balanced” strategy.

ICES WGMIXFISH-METH REPORT 2015 | 15
NB: in the optimum values, the ICES Advice Rule is included, i.e. the FMSYhigh is reduced if SSB < MSYBtrigger. This rule was accounted for in the estimation of FMSYhigh by ICES WKMSYREF3 (ICES, 2015b).
Results
The genetic algorithm was run over 30 generations and the optimisation profile sug-gested that the optimisation criteria did not improve after the 15th generation, indicat-ing that a stable solution was reached. Figure 2.3.1.2 shows the fishing mortality values obtained from the optimisation for both ∆Cmax-min and ∆Csq-min, together with the range values and point estimated for FMSY. The optimal fishing mortality values are close to the lower bound of the FMSY range for haddock and plaice, while they are higher than the FMSY value for cod, saithe and sole, approximately halfway between FMSY and FMSYhigh. Given the current values of F, the “balanced” strategy corresponded to using the point estimate FMSY for all species, except for the haddock for which the FMSYlow was used. Therefore, this strategy is not shown in the figure below. This situation is differ-ent from when the rule was suggested by STECF NSMAP 2015 (2015–05), where F for North Sea cod was largely above the FMSY available at that time (the values of reference points has later been updated by the ICES WGNSSK in June 2015).
It is noticeable that the optimisation ∆Cmax-min returns F values (red dots) that are quite close to current fishing mortalities (purple crosses).
Figure 2.3.1.2. Fishing mortality values to be used in 2016 minimising the incompatibilities between single species TAC (max-min in red, sq-min in orange), compared to the FMSY value (in blue) and associated FMSY range (in green), and to the current (2014) fishing mortality.
Fcube was then run to mimic the mixed fisheries advice for the three alternative man-agement scenarios: 1) single species advice based on the ICES MSY Advice Rule, 2) single species advice based on the F values resulting of the optimisation within the
16 | ICES WGMIXFISH-METH REPORT 2015
ranges and 3) single species advice based on the “balanced” strategy. The outcome for these management options were then compared for the Fcube scenarios “max” and “min”.
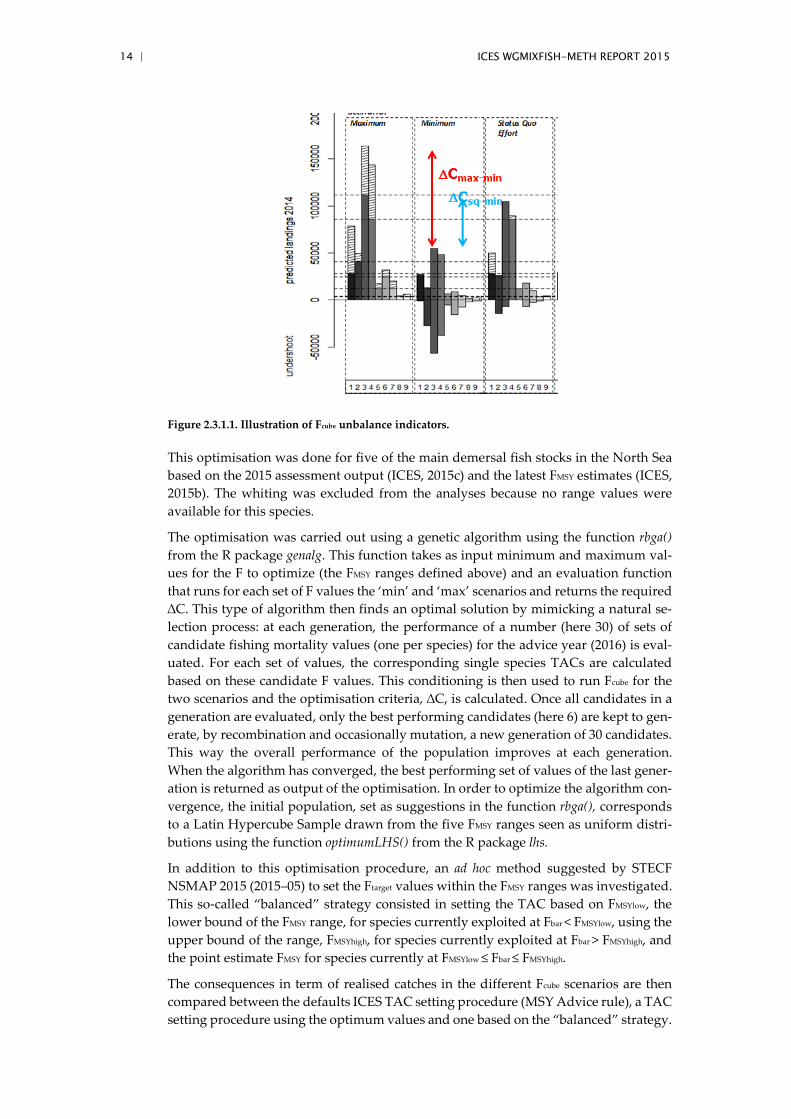
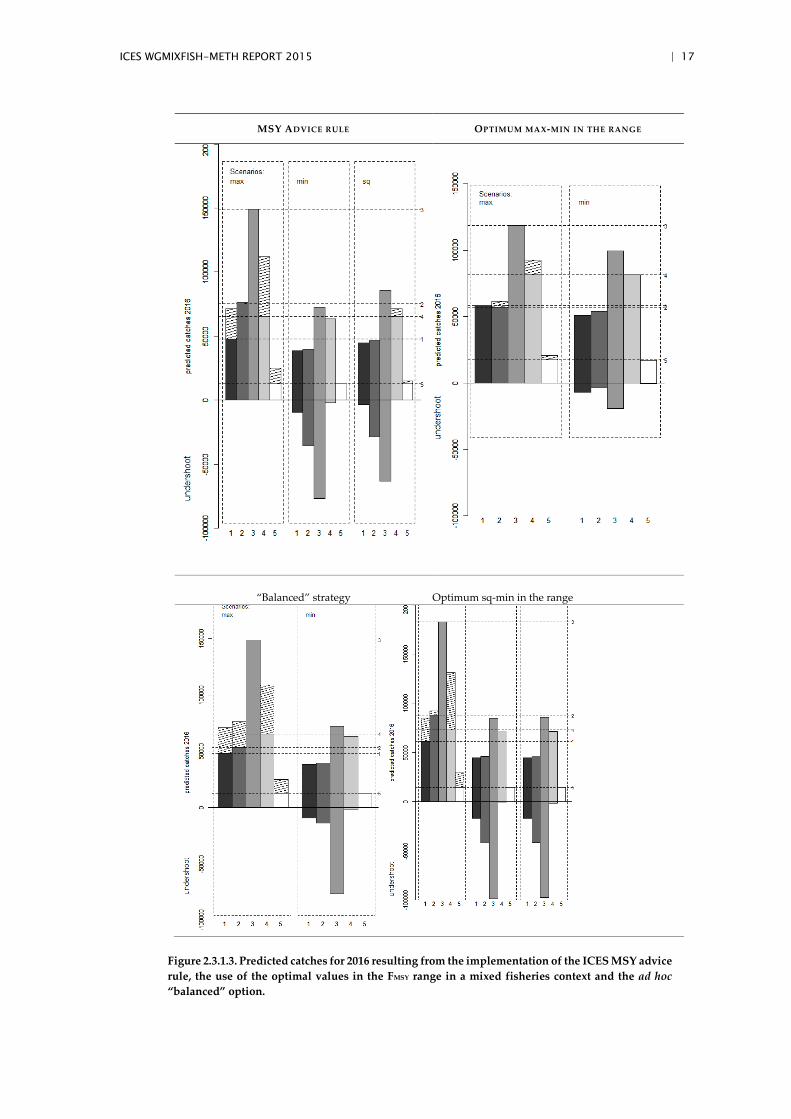
The differences in the 2016 TACs (horizontal bars on Figure 2.3.1.3) are direct conse-quences of the different Ftarget applied in the three management scenarios. Managing based on the F values from the optimisation procedure results in larger TACs for cod, saithe and sole, and smaller TAC for plaice and haddock. In this case, as in the case of the ICES Advice Rule, the TAC requiring the largest effort and the last to be fully caught is for plaice. In the Fcube scenario “max”, the effort required to catch the plaice TAC being smaller and the TACs for cod, saithe and sole being larger, the overall TAC overshoot is much smaller than for the ICES advice rule. In the Fcube scenario “min”, the limiting TAC (for sole) being higher, and the largest TACs being reduced, the over-all magnitude of the TAC under-consumption is also reduced. The overall difference in the predicted 2016 catches between the “max” and “min” scenarios is much smaller when the single species TAC are given based on the optimum values.
The predicted catches for the “balanced” strategy are similar to the catches for the ICES Advice Rule. The only difference is that the “balanced” strategy results in a smaller TAC for the haddock which leads to a larger overshoot of the TAC for this species in the Fcube scenario “max”, and a smaller undershoot in the scenario “min”. This TAC not being influential for the amount of effort to be deployed by the fleets, there are no dif-ferences observed for the catches of the other species.
ICES WGMIXFISH-METH REPORT 2015 | 17
MSY ADVICE RULE OPTIMUM MAX-MIN IN THE RANGE
“Balanced” strategy
Optimum sq-min in the range
Figure 2.3.1.3. Predicted catches for 2016 resulting from the implementation of the ICES MSY advice rule, the use of the optimal values in the FMSY range in a mixed fisheries context and the ad hoc “balanced” option.

18 | ICES WGMIXFISH-METH REPORT 2015
The consequences for the SSB in 2017 (the year following the year for which the advice is given) are shown in Figure 2.3.1.4 for the optimised Fcube scenarios “max” - “min”, and “sq”-“min”. In a “max” situation, using the optimal values within the FMSY ranges leads to higher 2017 SSB values than the implementation of the ICES MSY Advice Rule. Interestingly, for cod, the SSB increases from 2016 to 2017 when the optimum values are used, while it decreases with the ICES Advice Rule. On the opposite, in a “min” situation, using the optimum fishing mortality values lead to lower 2017 SSB vales. There is virtually no difference in the SSB trajectories between the ICES Advice Rule and the “balanced” strategies.
When optimising on the difference between “sq” and “min”, the main changes come from a further reduction of saithe SSB (as in the status quo projection), whereas it sta-bilises at a higher biomass level with all F at FMSY.
Figure 2.3.1.4. SSB trajectories over the years 2015–2017, resulting of management based on the op-timum F values in the FMSY ranges or for the application of the ICES Advice Rule for the two Fcube scenarios “max” and “min” (top panels) and (“sq” and “min”) (bottom panels).
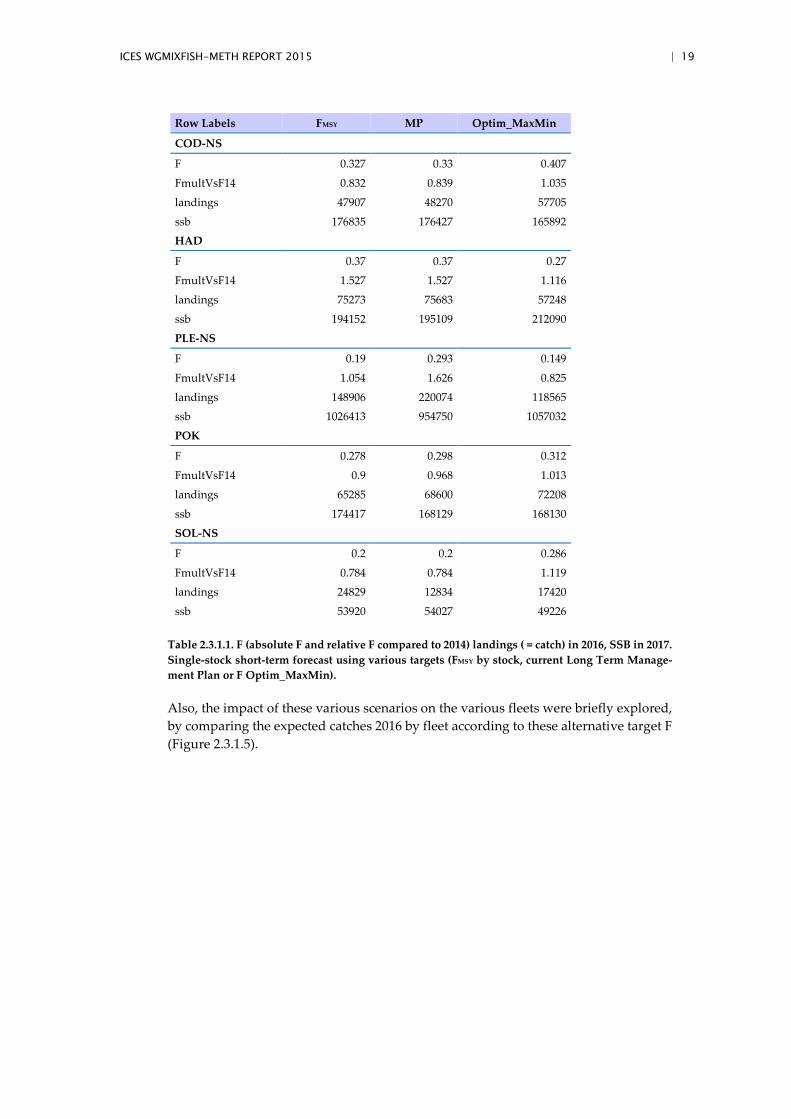
Applying the F obtained in the single-stock projection (baseline) returns the following short-term forecast (F and landings (= catch) in 2016, SSB in 1 January 2017) (Table 2.3.1.1).
ICES WGMIXFISH-METH REPORT 2015 | 19
Row Labels FMSY MP Optim_MaxMin
COD-NS
F 0.327 0.33 0.407
FmultVsF14 0.832 0.839 1.035
landings 47907 48270 57705
ssb 176835 176427 165892
HAD
F 0.37 0.37 0.27
FmultVsF14 1.527 1.527 1.116
landings 75273 75683 57248
ssb 194152 195109 212090
PLE-NS
F 0.19 0.293 0.149
FmultVsF14 1.054 1.626 0.825
landings 148906 220074 118565
ssb 1026413 954750 1057032
POK
F 0.278 0.298 0.312
FmultVsF14 0.9 0.968 1.013
landings 65285 68600 72208
ssb 174417 168129 168130
SOL-NS
F 0.2 0.2 0.286
FmultVsF14 0.784 0.784 1.119
landings 24829 12834 17420
ssb 53920 54027 49226
Table 2.3.1.1. F (absolute F and relative F compared to 2014) landings ( = catch) in 2016, SSB in 2017. Single-stock short-term forecast using various targets (FMSY by stock, current Long Term Manage-ment Plan or F Optim_MaxMin).
Also, the impact of these various scenarios on the various fleets were briefly explored, by comparing the expected catches 2016 by fleet according to these alternative target F (Figure 2.3.1.5).

20 | ICES WGMIXFISH-METH REPORT 2015
Figure 2.3.1.5. Total catches by fleet in 2016 with the Fcube “val” scenario for target Fs set using the optimisation procedure compared to the point estimate FMSY.
Conclusions
These results show the potential interest of making use of the FMSY ranges to reduce the unbalance between TACs defined on a single species basis. Here, the objective was the minimisation of the differences between the “max” and the “min” situations. Alterna-tively, other considerations of relevance for the managers (e.g. discard minimisation, catch maximisation of a given species, economic considerations) can be incorporated in the optimisation procedure.
The benefits of the optimisation as carried out here are a reduction of the magnitude of the TAC overshoot in a “max” situation, and a reduction of the TAC undershoot in a “min” situation. Therefore, the management procedure presented here offers the pos-sibility of setting TACs which are more likely to be effectively followed by the fleets.
2.3.2 FMSY ranges given mixed fisheries interactions in the Celtic Sea.
Some work to model mixed fisheries interactions in the Celtic Sea under the EU LOT project DAMARA (MARE 2012/22) using the FLBEIA (Bio-economic Impact Assess-ment in FLR; García et al., 2012) was presented. The model developed a decision sup-port tool (DST) to support managers and stakeholders in evaluating different management options for the highly mixed demersal fisheries of the Celtic Sea (ICES subareas VII f,g). The work presented builds on work undertaken during the STECF NSMAP 2015 (2015–05) meeting to evaluate a proposed Multi-Annual Plan (MAP) for the North-Western Waters (more detail in the STECF report (STECF, 2015)). The model incorporates technical interactions among 16 different fleets fishing in several different métier, taking into account catches of nine species (cod, haddock, whiting, hake, me-grim, plaice and sole as age-structured stocks; Nephrops in Functional Unit 22 as a bio-dynamic stock; anglerfishes as s fixed population stock). The modelling framework has been developed in a modular, flexible way to allow incorporation of different dynam-ics through operating and management procedure models. Through this approach it is possible to incorporate a range of different single- and multi-stock harvest control rules and different management measures to evaluate the biological consequences for
ICES WGMIXFISH-METH REPORT 2015 | 21
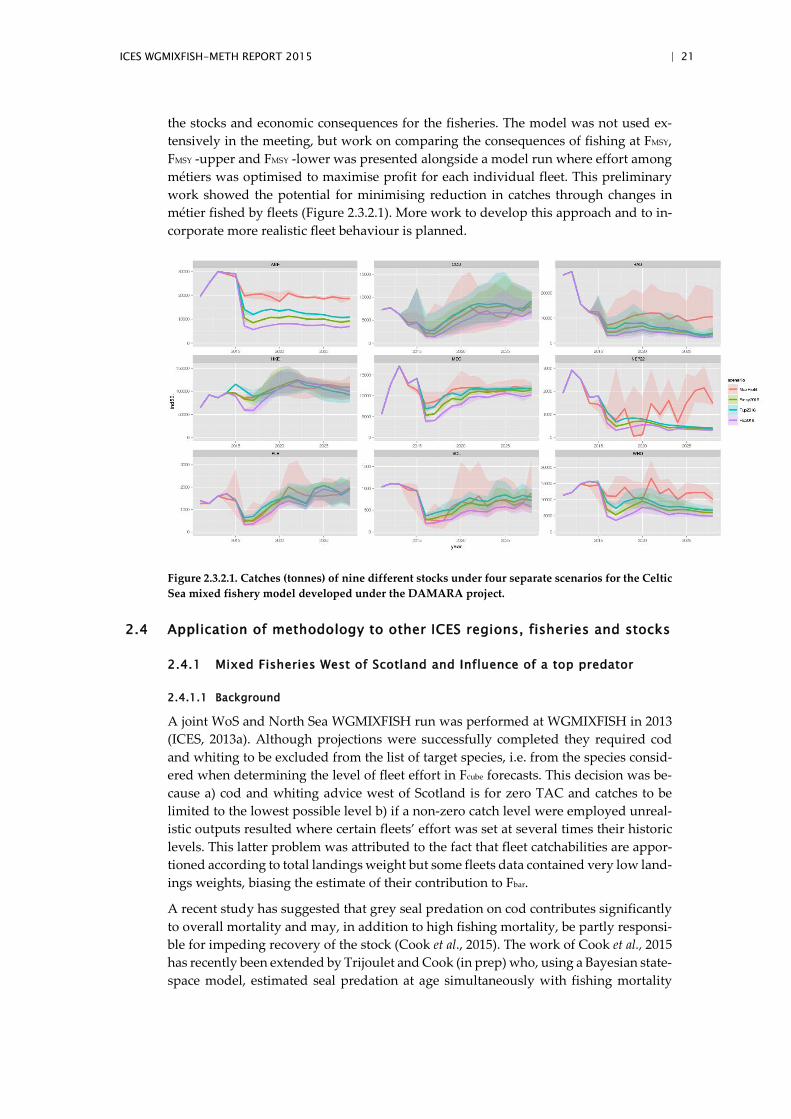
the stocks and economic consequences for the fisheries. The model was not used ex-tensively in the meeting, but work on comparing the consequences of fishing at FMSY, FMSY -upper and FMSY -lower was presented alongside a model run where effort among métiers was optimised to maximise profit for each individual fleet. This preliminary work showed the potential for minimising reduction in catches through changes in métier fished by fleets (Figure 2.3.2.1). More work to develop this approach and to in-corporate more realistic fleet behaviour is planned.
Figure 2.3.2.1. Catches (tonnes) of nine different stocks under four separate scenarios for the Celtic Sea mixed fishery model developed under the DAMARA project.
2.4 Application of methodology to other ICES regions, fisheries and stocks
2.4.1 Mixed Fisheries West of Scotland and Influence of a top predator
2.4.1.1 Background
A joint WoS and North Sea WGMIXFISH run was performed at WGMIXFISH in 2013 (ICES, 2013a). Although projections were successfully completed they required cod and whiting to be excluded from the list of target species, i.e. from the species consid-ered when determining the level of fleet effort in Fcube forecasts. This decision was be-cause a) cod and whiting advice west of Scotland is for zero TAC and catches to be limited to the lowest possible level b) if a non-zero catch level were employed unreal-istic outputs resulted where certain fleets’ effort was set at several times their historic levels. This latter problem was attributed to the fact that fleet catchabilities are appor-tioned according to total landings weight but some fleets data contained very low land-ings weights, biasing the estimate of their contribution to Fbar.
A recent study has suggested that grey seal predation on cod contributes significantly to overall mortality and may, in addition to high fishing mortality, be partly responsi-ble for impeding recovery of the stock (Cook et al., 2015). The work of Cook et al., 2015 has recently been extended by Trijoulet and Cook (in prep) who, using a Bayesian state-space model, estimated seal predation at age simultaneously with fishing mortality

22 | ICES WGMIXFISH-METH REPORT 2015
and underlying natural mortality. Their results gave increased SSB estimates and low-ered fishing mortality compared to ICES assessments but overall trends in stock that remained much the same because of very similar estimates of overall mortality, Z.
In this section a means of incorporating the effect of seal predation on cod – while still making use of the single species assessment results that do not themselves take this top predator into account – was trialled to see if the approach was feasible and if so, the degree to which it changed the perception of the effect of mixed fisheries on the west of Scotland cod stock.
2.4.1.2 Approach to the incorporation of seal predation
The work of Trijoulet and Cook indicate the overall natural mortality profile of the other main gadoid stocks west of Scotland (haddock and whiting) are largely unaf-fected by seal predation. Two alternatives were postulated for inclusion of seals into the Fcube simulations
a) Seals as an additional ‘fleet’, with a catch of cod but no other species.
b) Seal predation used to adjust the natural mortality at age on cod – adjusting F at age accordingly to maintain Z at age as before – in the forward projection.
The second approach was trialled during the meeting.
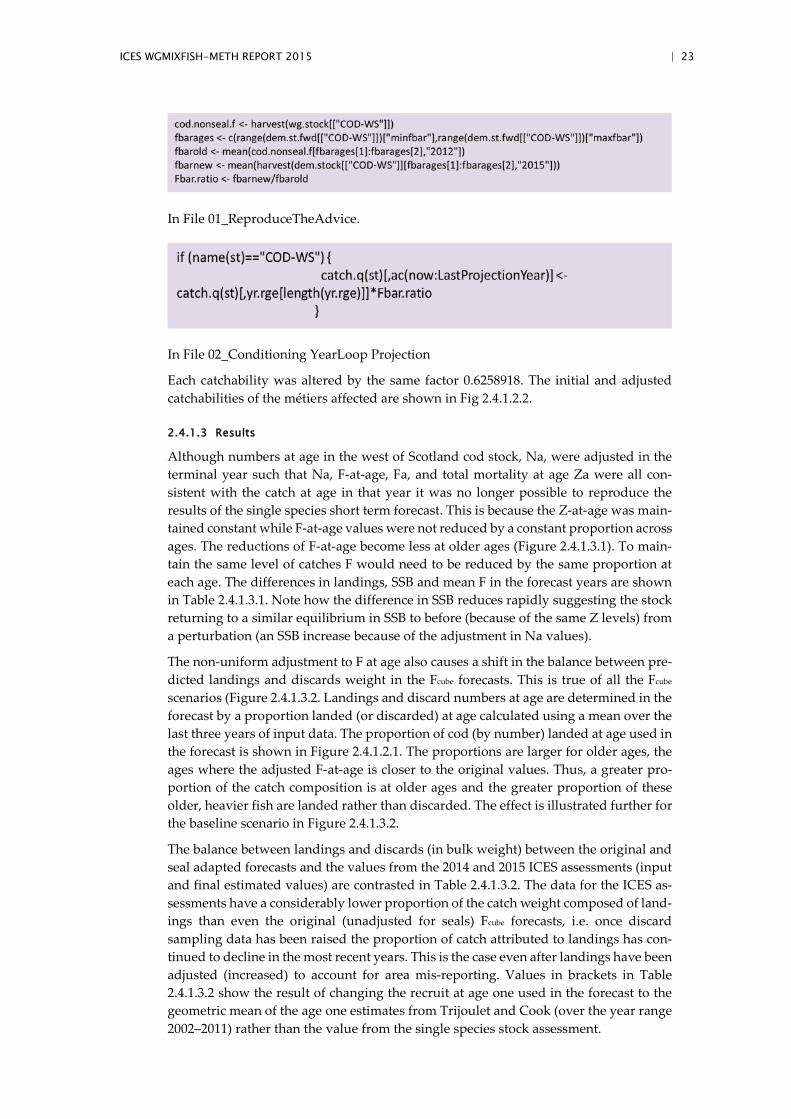
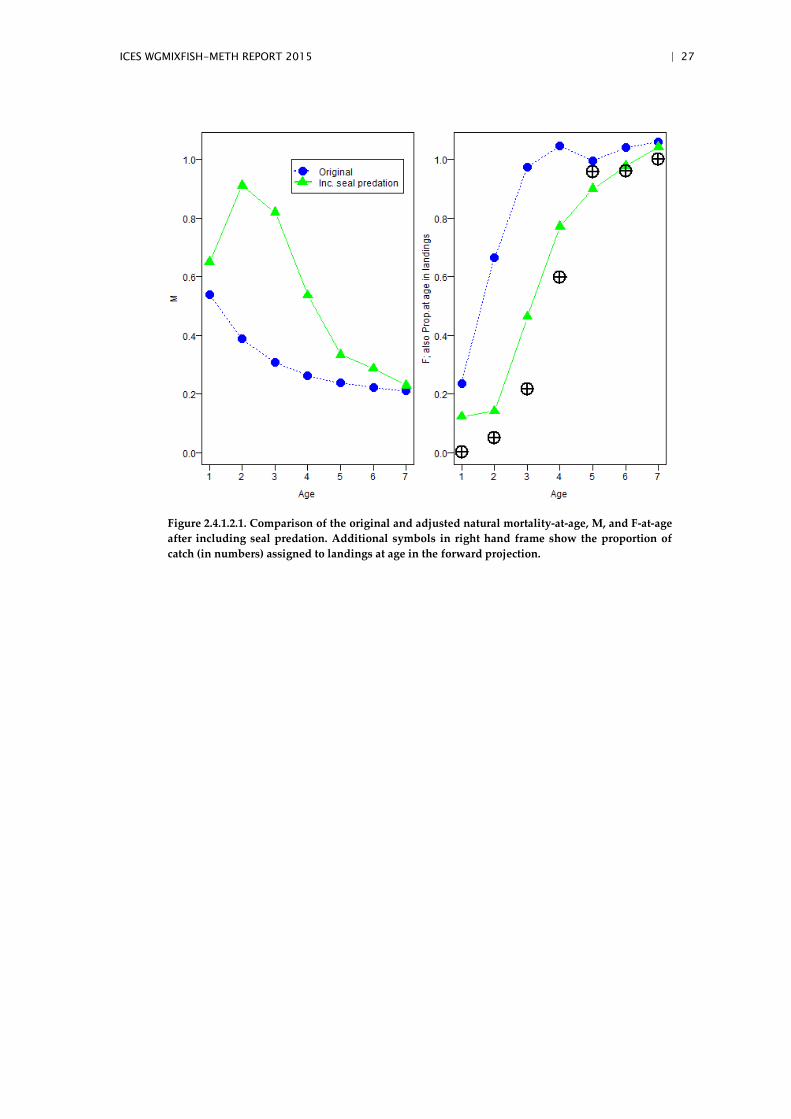
The natural mortality-at-age was set to the value generated by Trijoulet and Cook (in prep) for 2012 and includes mortality related to seal predation (Fig 2.4.1.2.1 left hand panel). Fishing mortality in 2012 was set to the difference between the total mortality and the natural mortality (Fig 2.4.1.2.1 right hand panel and Table 2.4.1.2.1). These new mortalities were used in each year of the forecast (2013–2015). Stock abundance in the terminal year was adjusted to maintain consistency between the fishing catch numbers at age in that year and the new F at age values by solving the Baranov catch equation for stock numbers at age Na. The code was adjusted as follows:
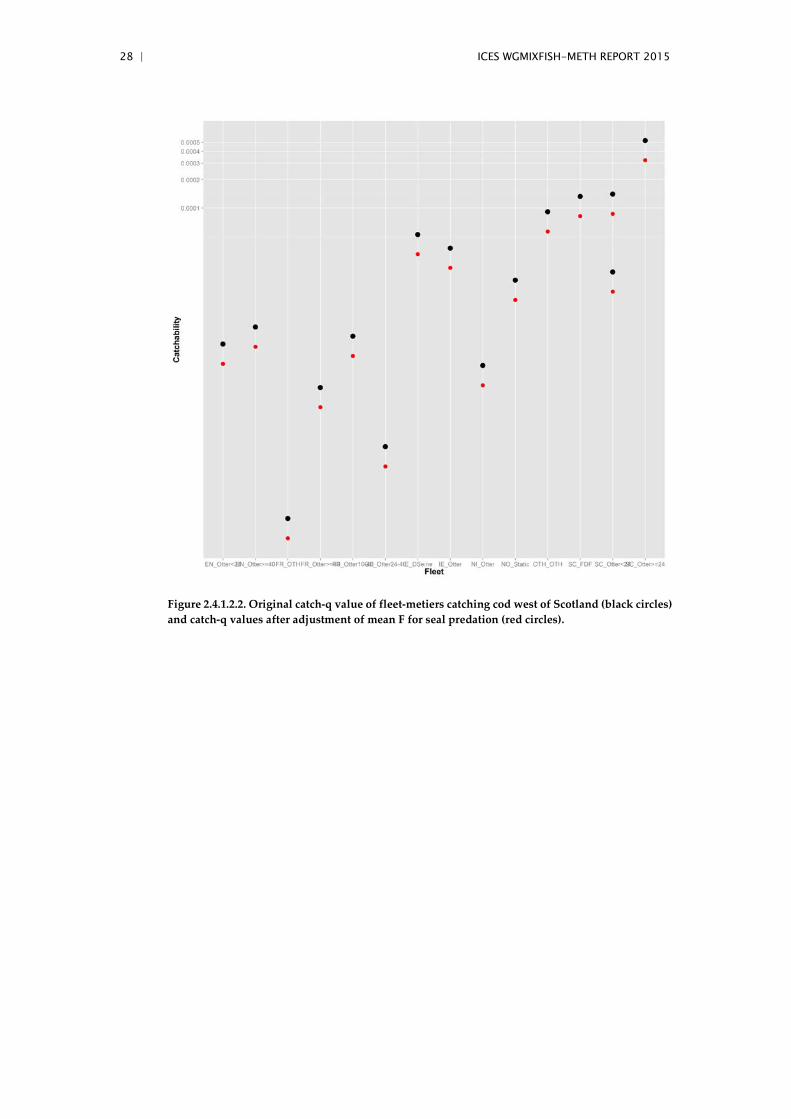
Mean F for West of Scotland cod, Fbar, is over ages 2 to 5. The catchability Q of each fleet was adjusted by the ratio of the new Fbar (using F at age after seal predation) and the original Fbar.
ICES WGMIXFISH-METH REPORT 2015 | 23
In File 01_ReproduceTheAdvice.
In File 02_Conditioning YearLoop Projection
Each catchability was altered by the same factor 0.6258918. The initial and adjusted catchabilities of the métiers affected are shown in Fig 2.4.1.2.2.
2.4.1.3 Results
Although numbers at age in the west of Scotland cod stock, Na, were adjusted in the terminal year such that Na, F-at-age, Fa, and total mortality at age Za were all con-sistent with the catch at age in that year it was no longer possible to reproduce the results of the single species short term forecast. This is because the Z-at-age was main-tained constant while F-at-age values were not reduced by a constant proportion across ages. The reductions of F-at-age become less at older ages (Figure 2.4.1.3.1). To main-tain the same level of catches F would need to be reduced by the same proportion at each age. The differences in landings, SSB and mean F in the forecast years are shown in Table 2.4.1.3.1. Note how the difference in SSB reduces rapidly suggesting the stock returning to a similar equilibrium in SSB to before (because of the same Z levels) from a perturbation (an SSB increase because of the adjustment in Na values).
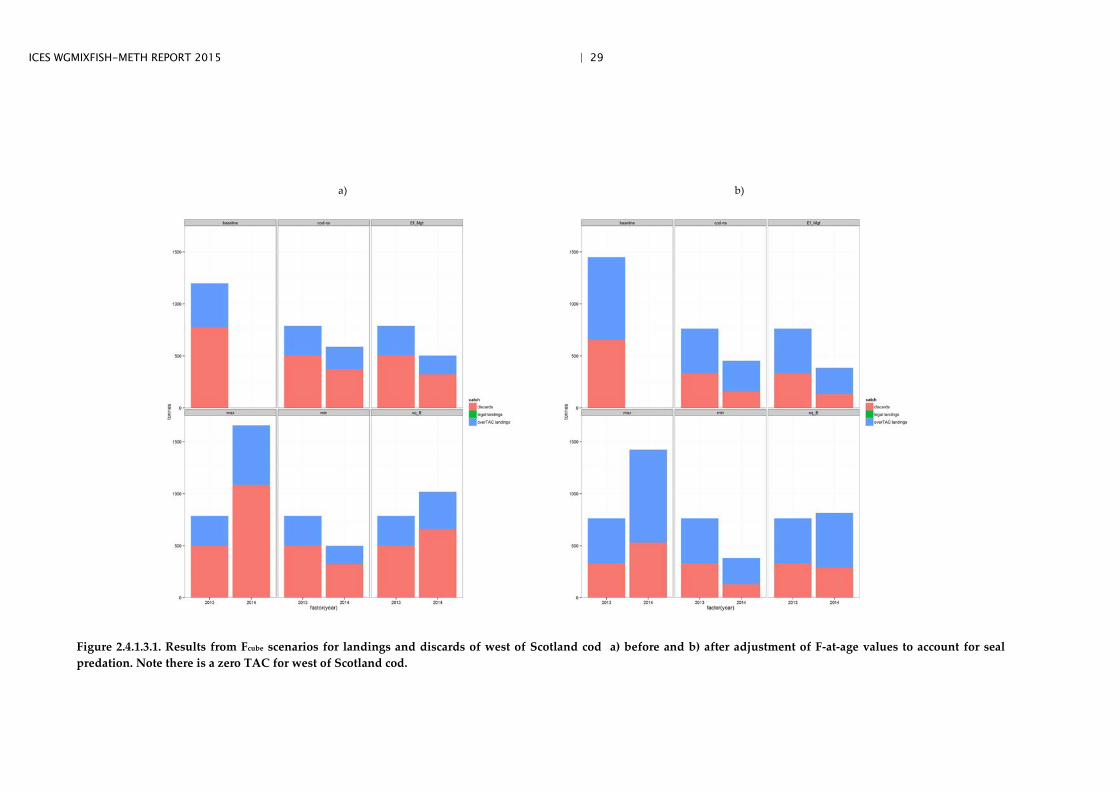
The non-uniform adjustment to F at age also causes a shift in the balance between pre-dicted landings and discards weight in the Fcube forecasts. This is true of all the Fcube scenarios (Figure 2.4.1.3.2. Landings and discard numbers at age are determined in the forecast by a proportion landed (or discarded) at age calculated using a mean over the last three years of input data. The proportion of cod (by number) landed at age used in the forecast is shown in Figure 2.4.1.2.1. The proportions are larger for older ages, the ages where the adjusted F-at-age is closer to the original values. Thus, a greater pro-portion of the catch composition is at older ages and the greater proportion of these older, heavier fish are landed rather than discarded. The effect is illustrated further for the baseline scenario in Figure 2.4.1.3.2.
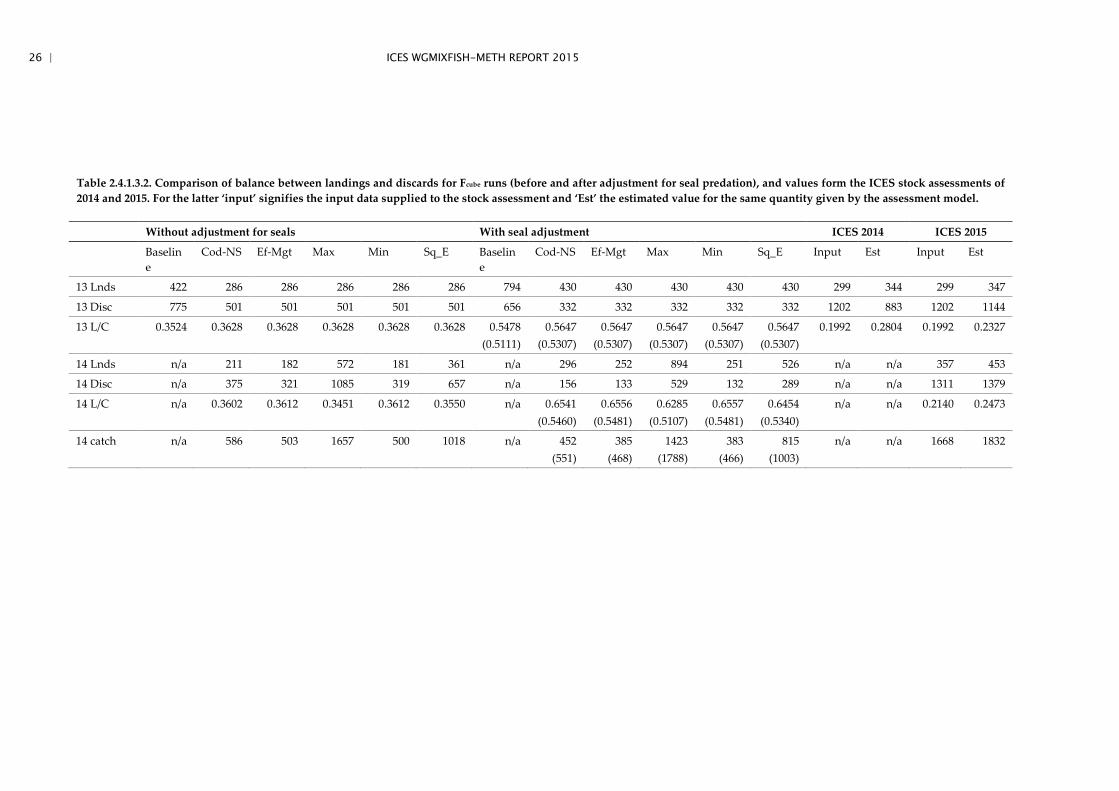
The balance between landings and discards (in bulk weight) between the original and seal adapted forecasts and the values from the 2014 and 2015 ICES assessments (input and final estimated values) are contrasted in Table 2.4.1.3.2. The data for the ICES as-sessments have a considerably lower proportion of the catch weight composed of land-ings than even the original (unadjusted for seals) Fcube forecasts, i.e. once discard sampling data has been raised the proportion of catch attributed to landings has con-tinued to decline in the most recent years. This is the case even after landings have been adjusted (increased) to account for area mis-reporting. Values in brackets in Table 2.4.1.3.2 show the result of changing the recruit at age one used in the forecast to the geometric mean of the age one estimates from Trijoulet and Cook (over the year range 2002–2011) rather than the value from the single species stock assessment.

24 | ICES WGMIXFISH-METH REPORT 2015
2.4.1.4 Discussion
Adjusting the F-at-age values in the terminal year, including changing the selection pattern causes a balance between landings and discards in the subsequent Fcube predic-tions that are not supported by more recent census and survey data. Adjusting recruit-ment at age one to be consistent with the seal predation model brings the ratio closer to the ‘empirical’ data; SSB predictions for the stock meanwhile are higher than under the conventional forecasts.
The approach of adjusting cod M at age and F at age was chosen primarily because time constraints did not allow for a new FLR fleets object to be constructed. A joint WoS and North Sea WGMIXFISH run was performed at WGMIXFISH-METH in 2013. Adapting this model run allowed the focus to be on the consequences of attempting to incorporate seal predation. The fleets object available already contained metier catcha-bilities based on the share of the single species stock assessment fishing mortality un-adjusted for seals.
If seals were included as a fleet a means would need to be found to prevent that fleet from being subject to any effort constraints. This is not a problem in the sq_E and Ef_Mgt scenarios but an intervention would be needed for the other scenarios.
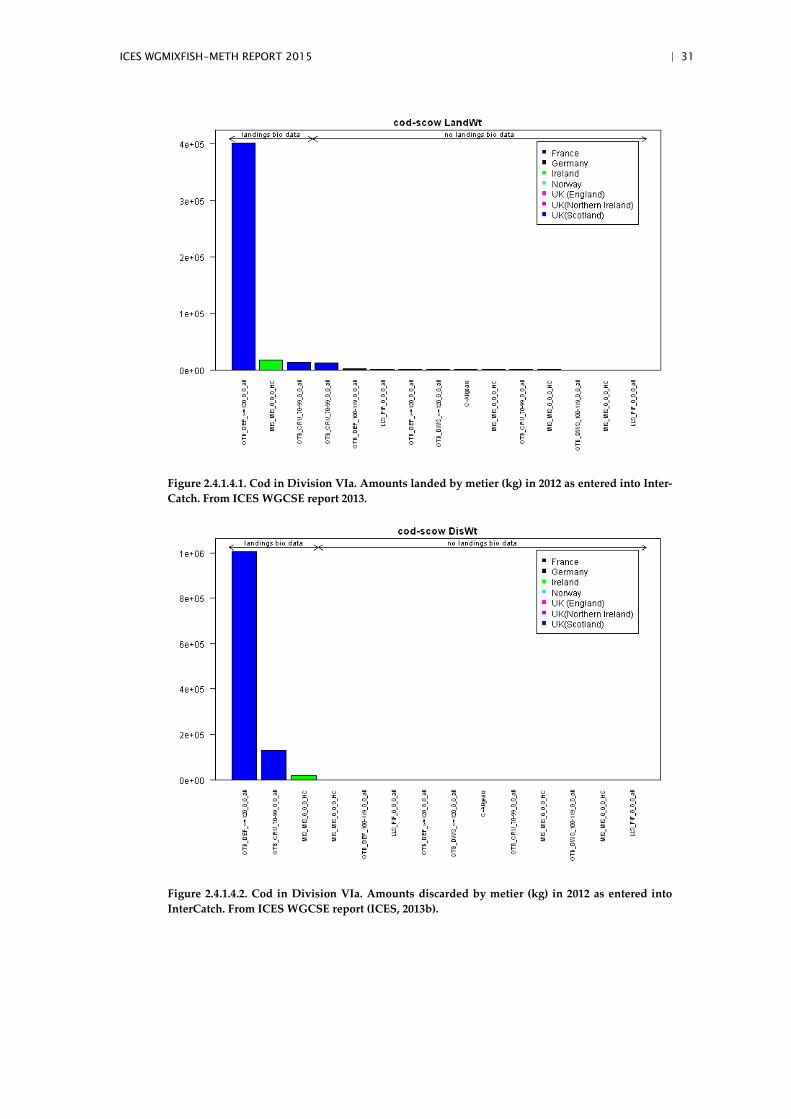
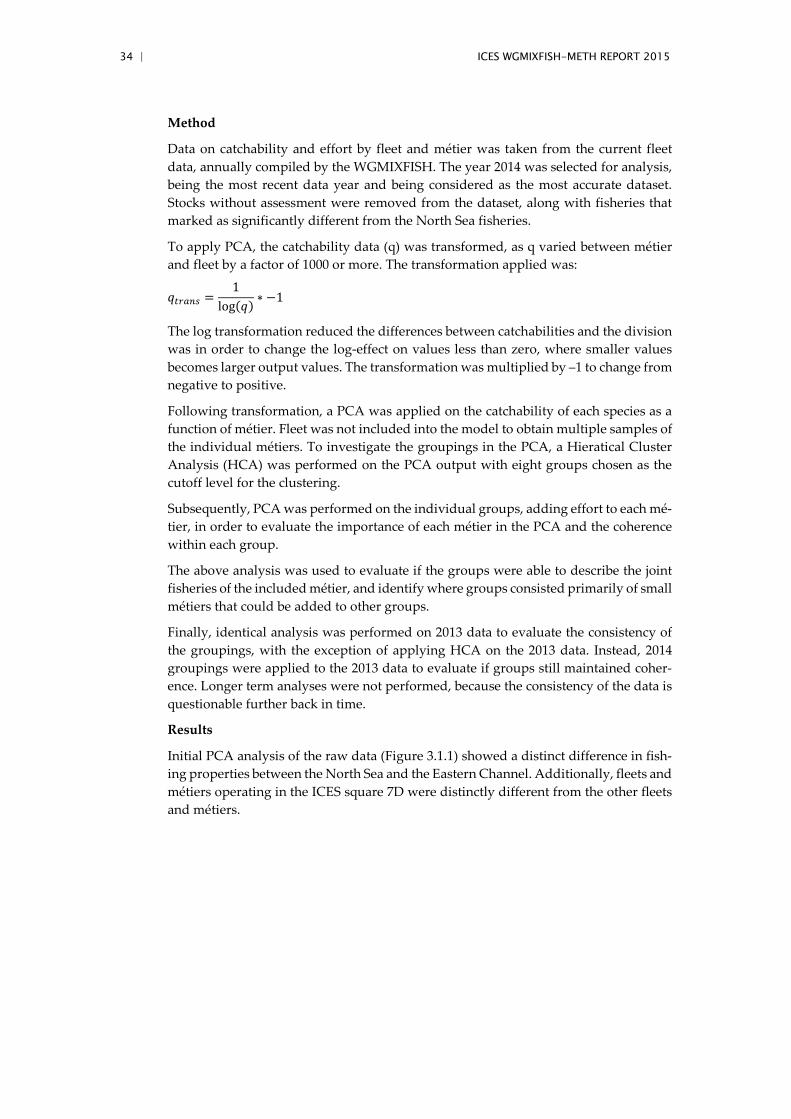
It may be possible to incorporate seal predation in a way that allows hind casts con-sistent with recorded data but this is of academic interest only if the predicted status of the stock (SSB) is also as before. Visiting this issue has, however, also been a re-minder of the inability of Fcube currently to accept west of Scotland cod as a stock to include when determining the level of fleet effort in Fcube forecasts. Considering the fleets data it is clear how, for this stock, a single metier is dominant as shown in Figures 2.4.1.4.1 and 2.4.1.4.2 which are reproduced from the ICES stock assessment report (ICES, 2013b). It is possible forecasts might be little affected if metiers with very low catchabilities were treated as if they did not catch the stock at all (or alternatively, as if they were entitled no quota). Once effort levels from the Fcube scenarios were deter-mined catch of cod by these fleets could be determined using the catchability values originally computed for them (in the manner done for all fleets currently).
An update of the stocks data object was completed during the meeting such that an updated fleets object (with or without incorporation of a seals ‘fleet’) would allow a run incorporating the west of Scotland using 2014 as the terminal year.

ICES WGMIXFISH-METH REPORT 2015 | 25
Table 2.4.1.2.1. Comparison of original fishing mortality (from stock assessment) and new fishing mortalities.
AGE ORIGINAL F IN
2012 NEW F IN 2012,
2013, 2014 RATIO (FNEW/FORIGI-
NAL)
1 0.23457 0.12200 0.52010
2 0.66365 0.14064 0.21191
3 0.97428 0.46273 0.47495
4 1.04488 0.77041 0.73732
5 0.99572 0.89890 0.90276
6 1.04052 0.97681 0.93877
7 1.05959 1.04173 0.98315
Table 2.4.1.3.1. Results from Fcube baseline forecast compared to the single species advice for cod-scow.
26 | ICES WGMIXFISH-METH REPORT 2015
Table 2.4.1.3.2. Comparison of balance between landings and discards for Fcube runs (before and after adjustment for seal predation), and values form the ICES stock assessments of 2014 and 2015. For the latter ‘input’ signifies the input data supplied to the stock assessment and ‘Est’ the estimated value for the same quantity given by the assessment model.
Without adjustment for seals With seal adjustment ICES 2014 ICES 2015
Baseline
Cod-NS Ef-Mgt Max Min Sq_E Baseline
Cod-NS Ef-Mgt Max Min Sq_E Input Est Input Est
13 Lnds 422 286 286 286 286 286 794 430 430 430 430 430 299 344 299 347
13 Disc 775 501 501 501 501 501 656 332 332 332 332 332 1202 883 1202 1144
13 L/C 0.3524 0.3628 0.3628 0.3628 0.3628 0.3628 0.5478 (0.5111)
0.5647 (0.5307)
0.5647 (0.5307)
0.5647 (0.5307)
0.5647 (0.5307)
0.5647 (0.5307)
0.1992 0.2804 0.1992 0.2327
14 Lnds n/a 211 182 572 181 361 n/a 296 252 894 251 526 n/a n/a 357 453
14 Disc n/a 375 321 1085 319 657 n/a 156 133 529 132 289 n/a n/a 1311 1379
14 L/C n/a 0.3602 0.3612 0.3451 0.3612 0.3550 n/a 0.6541 (0.5460)
0.6556 (0.5481)
0.6285 (0.5107)
0.6557 (0.5481)
0.6454 (0.5340)
n/a n/a 0.2140 0.2473
14 catch n/a 586 503 1657 500 1018 n/a 452 (551)
385 (468)
1423 (1788)
383 (466)
815 (1003)
n/a n/a 1668 1832
ICES WGMIXFISH-METH REPORT 2015 | 27
Figure 2.4.1.2.1. Comparison of the original and adjusted natural mortality-at-age, M, and F-at-age after including seal predation. Additional symbols in right hand frame show the proportion of catch (in numbers) assigned to landings at age in the forward projection.
28 | ICES WGMIXFISH-METH REPORT 2015
Figure 2.4.1.2.2. Original catch-q value of fleet-metiers catching cod west of Scotland (black circles) and catch-q values after adjustment of mean F for seal predation (red circles).
ICES WGMIXFISH-METH REPORT 2015 | 29
a)
b)
Figure 2.4.1.3.1. Results from Fcube scenarios for landings and discards of west of Scotland cod a) before and b) after adjustment of F-at-age values to account for seal predation. Note there is a zero TAC for west of Scotland cod.

30 | ICES WGMIXFISH-METH REPORT 2015
Figure 2.4.1.3.2. Baseline results for 2014 from projections made before and after adjustment for seal predation. Bars show balance of weight caught at age between discards and landings. Solid circles show the cumulative total catch weight up to and including that age. Seal adjusted version includes alteration of recruitment at age one in the forecast years.
ICES WGMIXFISH-METH REPORT 2015 | 31
Figure 2.4.1.4.1. Cod in Division VIa. Amounts landed by metier (kg) in 2012 as entered into Inter-Catch. From ICES WGCSE report 2013.
Figure 2.4.1.4.2. Cod in Division VIa. Amounts discarded by metier (kg) in 2012 as entered into InterCatch. From ICES WGCSE report (ICES, 2013b).

32 | ICES WGMIXFISH-METH REPORT 2015
2.4.2 Analysis of métier coherence within the Celtic Sea
The purpose of analysis was twofold, firstly to identify if there are any natural métier aggregation levels apparent within the Celtic Sea. Secondly, to examine the appropri-ateness of running mixed fisheries simulations on the fleet categories of the cod long term management plan (TR1, TR2, TR3, BT1, BT2, GN1, LL1, GTR1) as used for mixed fisheries advice within the North Sea.
Irish and French data were made available during the meeting, additionally English data were provided after the meeting, to perform a preliminary analysis. Landings dis-aggregated by métier (DCF level 6), year, vessel length categories (< 10 m, 10–24 m, 24–40 m, ≥ 40 m), and species for the last five years were made available. Species selected for analysis were limited to those of particular interest to demersal mixed fisheries. Selected as national top 90% by landings or value excluding pelagic and shellfish (bar Nephrops), narrowed down to those under TAC restrictions within the area. All other species were submitted as "other" to allow examination of the full landings profile. Species alignment between nations was good. The one or two species of importance for one nation and not another were subsequently retained by each nation.
Preliminary analysis applied principle component analysis and hierarchical clustering to métier level landings, carried out on two data sets, one with each year separately, the other aggregating over the five years. There was good agreement in identified clus-ters between the output of the year and the five year aggregated analyses. The individ-ual year analysis identified the same overall species composition patterns of the five year aggregated analysis, although annual variation in specific proportions of individ-ual species could be observed.
From this, we can see there is:
- Low impact of vessel length categories, many of the length categories are found mixed together within identified clusters.
- Mixing of mesh size ranges, particularly the 70–99 and 100–119 mesh sizes, which would imply application of fleet segments separated based on mesh size is inappropriate.
- Species is an important factor, with identification of different whitefish tar-gets, as well as Nephrops, anglerfish, ray, and flatfish target groupings.
- Gear is an important factor in species composition, with instances of clus-ters separating out demersal trawls, from seine trawls, netting and beam trawling.
- There is a separation of some areas, including VIIe and VIIf where land-ings compositions are quite different from other areas. These are areas with English and French fisheries and less participation from Irish vessels.
- There are a number of cases where English, French, and Irish métier land-ing profiles are similar enough to be grouped together. This is the case with the two closely related Nephrops métiers distinguished by the level of fish species present within the landings. While England and Ireland are in the "clean" cluster, all three nations are present in the more mixed Nephrops cluster.
This work represents a preliminary, partial analysis of métier species compositions within the Celtic Sea. Based on the informative outcome, the group recommends pur-suing this analysis further to encompass all nations with fishing practices within the

ICES WGMIXFISH-METH REPORT 2015 | 33
area (in particular, Spain and Belgium). To achieve this additional national data provi-sion is required:
1. Full landings information provided, aggregated to the following list:
ANF (aggregated ANF, MON, MNZ), COD, HAD, HKE, LEZ (aggregated LEZ, MEG), LIN, NEP, PLE, POK, POL, RJA (aggregated RJC, SKA, RAJ, RJA, RJB, RJC, RJE, RJF, RJH, RJI, RJM, RJN, RJO, RJR, SKA, SKX, SRX), SDV (aggregated DGS, DGH, DGX, DGZ, SDV), SOL, WHG. All remaining landings to be aggregated into a catch all 'OTH' class.
2. For this specific analysis Nephrops landings would need to be divided by ICES division to match the aggregation level of all other species.
3. Annual data for the last five years.
4. Separation of OTB and OTT gears into different métiers rather than grouped, the differences in species composition are particularly important in relation to Nephrops fisheries and have different spatial distributions.
5. Nations to check the species classifications and thresholds used to identify the target species part of the métier, to ensure consistency between nations. Par-ticularly the DEF and CRU classifications.
3 Terms of Reference B
3.1 Undertake a Principle Components Analysis (PCA) on the WGMIXFISH métier data used in North Sea mixed fishery forecasts to inform a minimum fleet aggregation for use in ecosystem models
Introduction
Currently the mix fisheries models used in the WGMIXFISH and the multi species models used in WGSAM are not interacting. Both model types are very complex and thus, it is not currently possible to let either model feed into the other. A reduction in complexity is needed to circumvent the challenge of combining complex models. The primary input into the mixed fisheries model in the North Sea (Fcube) is the catch and effort data aggregated by fleet and métier (ICES, 2015a). It has been suggested that the partial F from the métiers could be used in multi species models such as SMS, to con-strain the variability of the F of the individual stocks upon that of stocks that are caught conjointly. However, the métier system for the North Sea demersal fisheries used in ICES WGMIXFISH includes around a hundred of categories defined as a combination of country * fleet segment * métier (area and gear type). Thus, an aggregation of these métiers is needed if the partial mortality rates from the mixed fisheries models are to be transferred to the multi species models.
In the current study, we applied principal component analysis (PCA) to the catchabil-ity of each métier and fleets used in the mix fisheries models to investigate if fleets and métiers could be aggregated into a more manageable number of groups, while still contain the same information on catch composition and catchability of each species.
34 | ICES WGMIXFISH-METH REPORT 2015
Method
Data on catchability and effort by fleet and métier was taken from the current fleet data, annually compiled by the WGMIXFISH. The year 2014 was selected for analysis, being the most recent data year and being considered as the most accurate dataset. Stocks without assessment were removed from the dataset, along with fisheries that marked as significantly different from the North Sea fisheries.
To apply PCA, the catchability data (q) was transformed, as q varied between métier and fleet by a factor of 1000 or more. The transformation applied was:
𝑠𝑠𝑡𝑡𝑡𝑡𝑡𝑡𝑡𝑡𝑡𝑡 =1
log(𝑠𝑠) ∗ −1
The log transformation reduced the differences between catchabilities and the division was in order to change the log-effect on values less than zero, where smaller values becomes larger output values. The transformation was multiplied by –1 to change from negative to positive.
Following transformation, a PCA was applied on the catchability of each species as a function of métier. Fleet was not included into the model to obtain multiple samples of the individual métiers. To investigate the groupings in the PCA, a Hieratical Cluster Analysis (HCA) was performed on the PCA output with eight groups chosen as the cutoff level for the clustering.
Subsequently, PCA was performed on the individual groups, adding effort to each mé-tier, in order to evaluate the importance of each métier in the PCA and the coherence within each group.
The above analysis was used to evaluate if the groups were able to describe the joint fisheries of the included métier, and identify where groups consisted primarily of small métiers that could be added to other groups.
Finally, identical analysis was performed on 2013 data to evaluate the consistency of the groupings, with the exception of applying HCA on the 2013 data. Instead, 2014 groupings were applied to the 2013 data to evaluate if groups still maintained coher-ence. Longer term analyses were not performed, because the consistency of the data is questionable further back in time.
Results
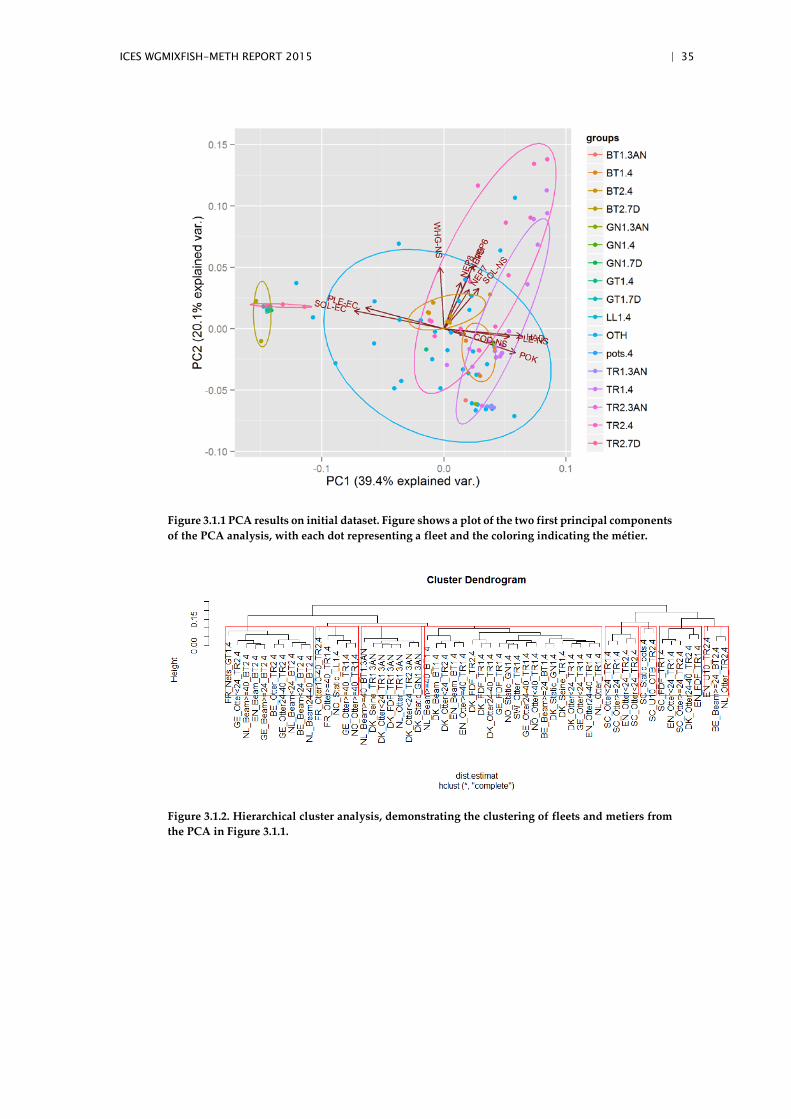
Initial PCA analysis of the raw data (Figure 3.1.1) showed a distinct difference in fish-ing properties between the North Sea and the Eastern Channel. Additionally, fleets and métiers operating in the ICES square 7D were distinctly different from the other fleets and métiers.
ICES WGMIXFISH-METH REPORT 2015 | 35
Figure 3.1.1 PCA results on initial dataset. Figure shows a plot of the two first principal components of the PCA analysis, with each dot representing a fleet and the coloring indicating the métier.
Figure 3.1.2. Hierarchical cluster analysis, demonstrating the clustering of fleets and metiers from the PCA in Figure 3.1.1.
36 | ICES WGMIXFISH-METH REPORT 2015
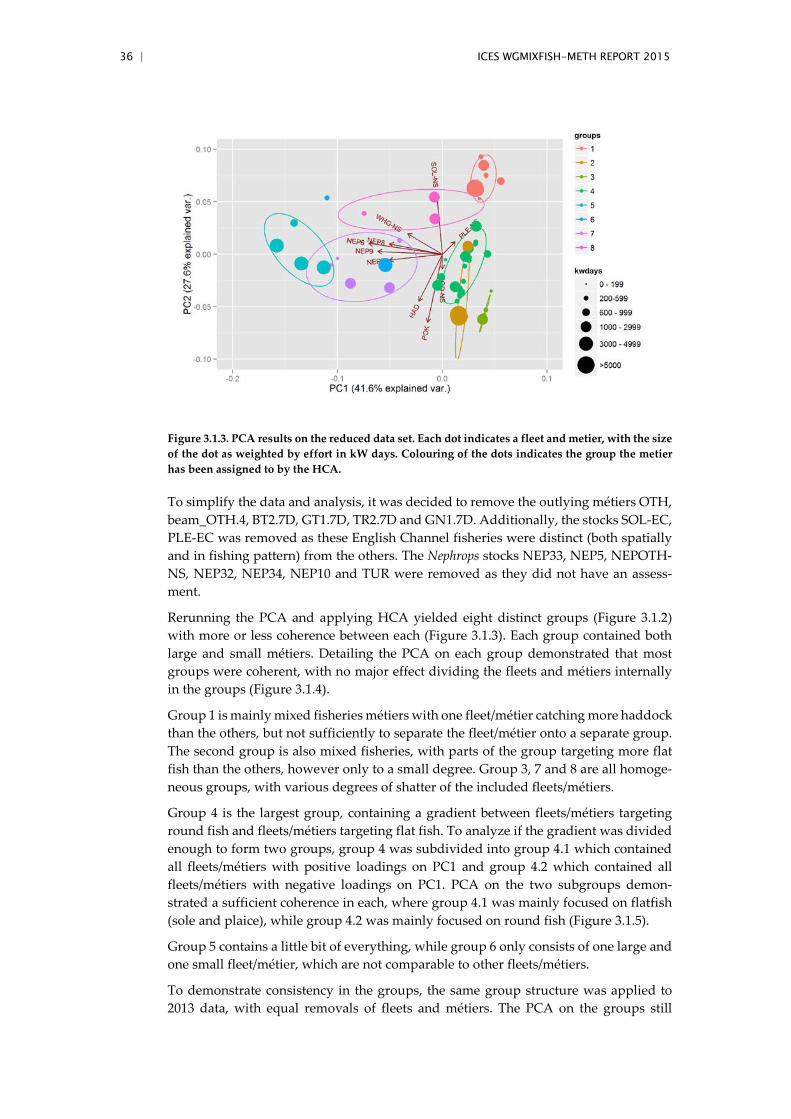
Figure 3.1.3. PCA results on the reduced data set. Each dot indicates a fleet and metier, with the size of the dot as weighted by effort in kW days. Colouring of the dots indicates the group the metier has been assigned to by the HCA.
To simplify the data and analysis, it was decided to remove the outlying métiers OTH, beam_OTH.4, BT2.7D, GT1.7D, TR2.7D and GN1.7D. Additionally, the stocks SOL-EC, PLE-EC was removed as these English Channel fisheries were distinct (both spatially and in fishing pattern) from the others. The Nephrops stocks NEP33, NEP5, NEPOTH-NS, NEP32, NEP34, NEP10 and TUR were removed as they did not have an assess-ment.
Rerunning the PCA and applying HCA yielded eight distinct groups (Figure 3.1.2) with more or less coherence between each (Figure 3.1.3). Each group contained both large and small métiers. Detailing the PCA on each group demonstrated that most groups were coherent, with no major effect dividing the fleets and métiers internally in the groups (Figure 3.1.4).
Group 1 is mainly mixed fisheries métiers with one fleet/métier catching more haddock than the others, but not sufficiently to separate the fleet/métier onto a separate group. The second group is also mixed fisheries, with parts of the group targeting more flat fish than the others, however only to a small degree. Group 3, 7 and 8 are all homoge-neous groups, with various degrees of shatter of the included fleets/métiers.
Group 4 is the largest group, containing a gradient between fleets/métiers targeting round fish and fleets/métiers targeting flat fish. To analyze if the gradient was divided enough to form two groups, group 4 was subdivided into group 4.1 which contained all fleets/métiers with positive loadings on PC1 and group 4.2 which contained all fleets/métiers with negative loadings on PC1. PCA on the two subgroups demon-strated a sufficient coherence in each, where group 4.1 was mainly focused on flatfish (sole and plaice), while group 4.2 was mainly focused on round fish (Figure 3.1.5).
Group 5 contains a little bit of everything, while group 6 only consists of one large and one small fleet/métier, which are not comparable to other fleets/métiers.
To demonstrate consistency in the groups, the same group structure was applied to 2013 data, with equal removals of fleets and métiers. The PCA on the groups still

ICES WGMIXFISH-METH REPORT 2015 | 37
demonstrated a suitable coherence within groups, to allow the assumption that groups are temporally coherent (Figure 3.1.6).
Discussion
Currently, there is a considerable amount of métiers, which are used, among other things, as basis for the mixed fisheries models and advice. In order to incorporate mixed fisheries models into multi species models it has proven necessary to aggregate the métiers in order to simplify the information.
The current analysis demonstrated that it was possible to aggregate the North Sea fleets and métiers into nine coherent groups (plus several outliers), each group containing a various number of fleets and métiers. Each group had a fair amount of internal coher-ence, with no significant outliers. This result indicates that it should be possible to sim-plify the existing métier system by aggregating into groups of similar métiers, in order to reach a manageable set that could be incorporated into multispecies models such as SMS.

38 | ICES WGMIXFISH-METH REPORT 2015
Figure 3.1.4. PCA analysis of the individual groups selected through the HCA analysis. Dot colour indicates the métier and dot size indicates the kW days consumption of the individual fleet and métier.

ICES WGMIXFISH-METH REPORT 2015 | 39
Figure 3.1.5. Subdivision of group 4 into one group that mainly focuses on flatfish (4.1) and one group focusing on round fish (4.2). Both groups show good coherence.
Figure 3.1.6. PCA on 2013 catchability data, with identical groupings at identified by HCA on the 2014 data. Colour indicates group and dot size indicates effort of the individual fleet/métier.
40 | ICES WGMIXFISH-METH REPORT 2015
4 Additional issues considered
4.1 Developing Fcube at age for the North Sea
In 2015, effort was made to parameterize and run an age-based version of Fcube, with differences in selectivity by fleet accounted for in the projections. Some attempts had been previously investigated, but were not pursued further because of inconsistencies in the dataset, where e.g. the summing up of age information by stock and fleet from the STECF effort database was too different from the total age distribution by stock used in the stock assessment and created inconsistencies in the model. These inconsist-encies triggered the development of the joint data call and data raising procedures for ICES WGNSSK and ICES WGMIXFISH.
4.1.1 Data
The increased quality of the data submitted and the consistencies between data sets made the linkage possible this year and a first version of the North Sea aged-based version was run during the Working Group. InterCatch was used to derive age struc-ture of landings and discards as well as discard ratio, whereas WGMIXFISH database was used to get the landings and efforts by métiers. In fact, even if the two data bases are becoming more and more consistent, there are still differences in the landings by métiers and in order to be able to compute catchabilities the right way, land-ings/catches and effort should come from the same source.
The different procedures followed to produce the age structure of the catches used in the aged-based version of Fcube are the following:
• When landings and discards where provided quarterly in InterCatch, discards ratios and age structures were computed and applied quarterly to the Fcube landings to be consistent with the exploitation patterns provided by InterCatch. If landings or dis-cards were provided annually in InterCatch, then everything was aggregated by year and raising was done at that temporal scale.
• The discard ratio observed in InterCatch was then use to compute the discards in Fcube from the provided landings.
• Age structure of the landings and discards coming from the raising procedures were then applied to the Fcube Landings and Discards.
• Aged-based Fcube data were checked using the Sum of Products (using the mean weight at age from InterCatch).
4.1.2 Software
The Fcube code was updated to run with the additional age-dimension for each fleet. The landings selectivity by fleet, which was previously calculated as the simple ratio between landings and catch in tonnage, is now calculated as the ratio between landings and catch in number at age averaged over the age ranges used in the Fbar for each stock, making thus the fleet projections more consistent with the stock projections.
4.1.3 Results
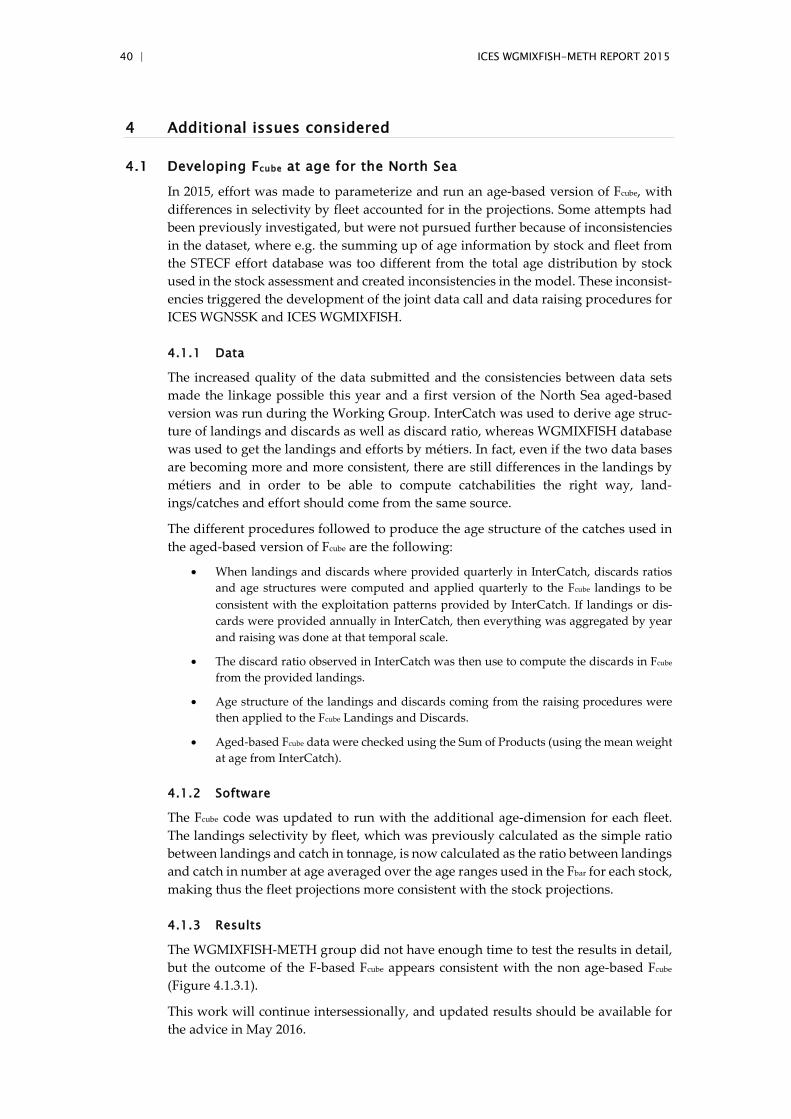
The WGMIXFISH-METH group did not have enough time to test the results in detail, but the outcome of the F-based Fcube appears consistent with the non age-based Fcube (Figure 4.1.3.1).
This work will continue intersessionally, and updated results should be available for the advice in May 2016.
ICES WGMIXFISH-METH REPORT 2015 | 41
Figure 4.1.3.1. Comparison of Fcube projections with (upper) and without (lower) age-based fleet se-lectivity.

42 | ICES WGMIXFISH-METH REPORT 2015
5 References
Garcia, D., Prellezo, R., Sanchez, S., Andres, M., & Santurtun, M. (2012). FLBEIA: A toolbox to conduct Bio-Economic Impact Assessment of fisheries management strategies, 1–28.
ICES. 2013a. Report of the Working Group on Mixed Fisheries Advice for the North Sea (WGMIXFISH), 26 August–30 August 2013, ICES Headquarters, Copenhagen, Denmark. ICES CM 2013/ACOM:80. 70 pp.
ICES. 2013b. Report of the Working Group for Celtic Seas Ecoregion (WGCSE), 8–17 May 2013, Copenhagen, Denmark. ICES CM 2013/ACOM:12. 1986 pp.
ICES. 2015a. Report of the Working Group on Mixed Fisheries Advice (WGMIXFISH-ADVICE), 25–29 May 2015, ICES HQ, Copenhagen, Denmark. ICES CM 2015/ACOM:21. 171 pp.
ICES. 2015b. Report of the Joint ICES-MYFISH Workshop to consider the basis for FMSY ranges for all stocks (WKMSYREF3), 17–21 November 2014, Charlottenlund, Denmark. ICES CM 2014/ACOM:64. 156 pp.
ICES. 2015c. Report of the Working Group on the assessment of Demersal Stocks in the North Sea and Skagerrak (WGNSSK), 28 April–7 May 2015, ICES Headquarters, Copenhagen, Denmark. ICES CM 2015/ACOM:13. 1182 pp.
Kell, L., T., Mosqueira, I., Grosjean, P., Fromentin, J-M., Garcia, D., Hillary, R., Jardim, E., Mardle, S., Pastoors, M. A., Poos, J. J., Scott, F., and R.D. Scott (2007). FLR: an open-source framework for the evaluation and development of management strategies. ICES Journal of Marine Sci-ence, 64: 640–646.
R Development Core Team (2015). R: A language and environment for statistical computing. R Foundation for Statistical Computing, Vienna, Austria. URL: http://www.R-project.org.
Robin M. Cook, R., M., Holmes, S., J. and Fryer, R., J. 2015. Grey seal predation impairs recovery of an overexploited fish stock. Journal of Applied Ecology, 52, 969–979.
STECF. 2015 (2015-05). Scientific, Technical and Economic Committee for Fisheries (STECF) – Evaluation of management plans: Evaluation of the multi-annual plan for the North Sea demersal stocks (STECF-15-04). 2015. Publications Office of the European Union, Luxem-bourg, EUR 27232 EN, JRC 95959, 152 pp.
Ulrich, C., Reeves, S. A., Vermard, Y., Holmes, S. J., and Vanhee, W. 2011. Reconciling single-species TACs in the North Sea demersal fisheries using the Fcube mixed-fisheries advice framework. – ICES Journal of Marine Science, 68: 1535–1547.
ICES WGMIXFISH-METH REPORT 2015 | 43
Annex 1: List of Participants
NAME ADDRESS PHONE/FAX EMAIL
Megan Atcheson Marine Stewardship Council Marine House 1 Snow Hill London EC1A 2DH United Kingdom
Thomas Brunel IMARES
1970 AB Ijmuiden
Netherlands
Phone: +31 317 487 161
Harriet Cole Scottish Government
Marine Laboratory, PO Box 101
375 Victoria Road
Aberdeen AB11 9DB
United Kingdom
Robin Cook Department of Mathematics and Statistics University of Strathclyde
26 Richmond Street Room LT805 Glasgow, Scotland
GL1 1XH United Kingdom
Phone: +44 141 548 3808
Sarah Davie Marine Institue Ireland Rinville, Oranmore Co. Galway, Ireland
Paul Dolder Centre for Environment, Fisheries and Aquaculture Science (CEFAS)
Pakefield Road
NR33 0HT Lowestoft Suffolk
United Kingdom
Phone: +44 (0)1502 52 4259
Steven Holmes Fisheries and Aquaculture Sector
IPSC Maritime Affairs Unit
EC Joint Research Center
TP 051, Via Enrico Fermi 2749
I-21027 Ispra (VA), Italy
Phone: : +39 0332 78 9648
Fax: +39 0332 78 9658
44 | ICES WGMIXFISH-METH REPORT 2015
NAME ADDRESS PHONE/FAX EMAIL
Daniel Howell Institute of Marine Research
Nordnes
5817 Bergen Norway
Phone: +47 55 23 86 79
Fax: +47 55 23 8531
Lars Olof Mortensen DTU Aqua - National Institute of Aquatic Resources
Jægersborg Allé 1
DK-2920 Charlottenlund
Denmark
Lionel Pawlowski Ifremer Lorient Station
8, rue François Toullec
56100 Lorient
France
Phone: +33 297 8738 46
Fax: +33 2 97 87 38 36
Marianne Robert Ifremer Lorient Station
8, rue François Toullec
56100 Lorient
France
Phone: +33 297 8738 23
Fax: +33 2 97 87 38 36
Mark Tasker Joint Nature Conservation Committee
Inverdee House Baxter Street Aberdeen AB11 9QA United Kingdom
Phone: +44 1 224 266551
Fax: +44 1 224 896170
Clara Ulrich DTU Aqua - National Institute of Aquatic Resources
Jægersborg Allé 1
DK-2920 Charlottenlund
Denmark
Phone: +45 3588 3395
Fax: +45 3588 3833
Youen Vermard Ifremer Boulogne-surMer
Centre
P.O. Box 699
62321 Boulogne Cédex
France
Phone: +33 321995 686
Fax: +33 321 995601
ICES WGMIXFISH-METH REPORT 2015 | 45
Annex 2: Recommendations
RECOMMENDATION FOR FOLLOW UP BY:
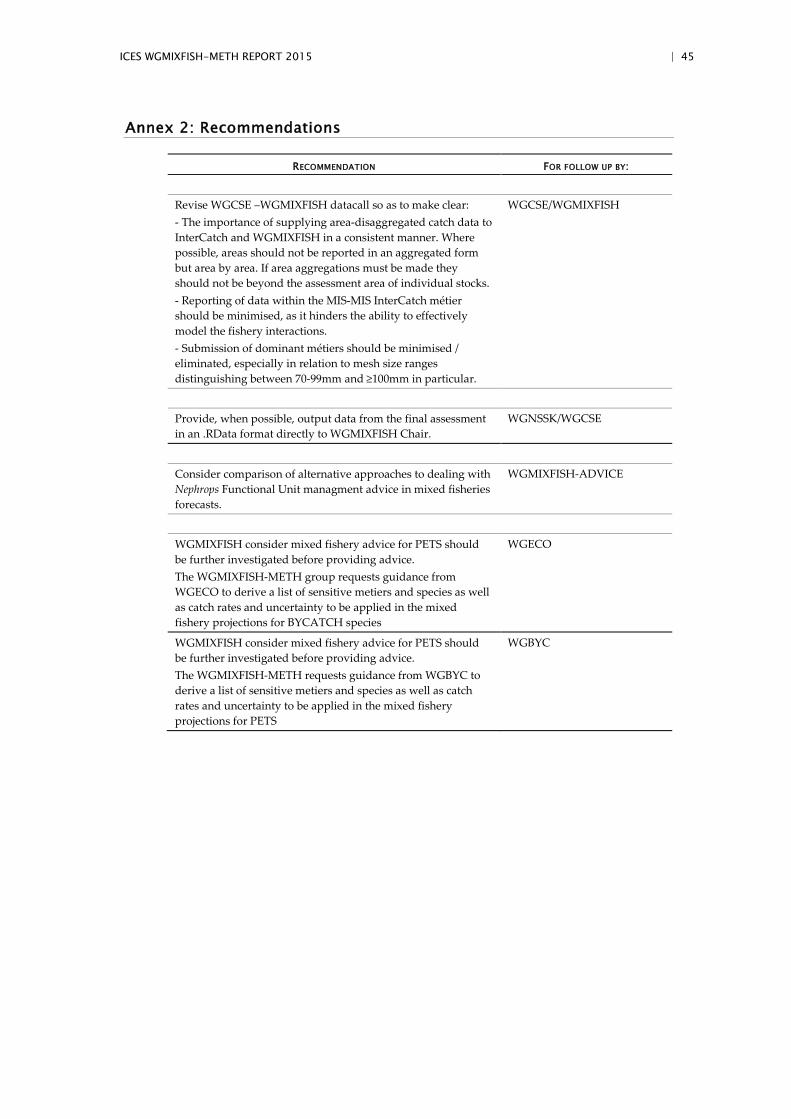
Revise WGCSE –WGMIXFISH datacall so as to make clear: - The importance of supplying area-disaggregated catch data to InterCatch and WGMIXFISH in a consistent manner. Where possible, areas should not be reported in an aggregated form but area by area. If area aggregations must be made they should not be beyond the assessment area of individual stocks. - Reporting of data within the MIS-MIS InterCatch métier should be minimised, as it hinders the ability to effectively model the fishery interactions. - Submission of dominant métiers should be minimised / eliminated, especially in relation to mesh size ranges distinguishing between 70-99mm and ≥100mm in particular.
WGCSE/WGMIXFISH
Provide, when possible, output data from the final assessment in an .RData format directly to WGMIXFISH Chair.
WGNSSK/WGCSE
Consider comparison of alternative approaches to dealing with Nephrops Functional Unit managment advice in mixed fisheries forecasts.
WGMIXFISH-ADVICE
WGMIXFISH consider mixed fishery advice for PETS should be further investigated before providing advice. The WGMIXFISH-METH group requests guidance from WGECO to derive a list of sensitive metiers and species as well as catch rates and uncertainty to be applied in the mixed fishery projections for BYCATCH species
WGECO
WGMIXFISH consider mixed fishery advice for PETS should be further investigated before providing advice. The WGMIXFISH-METH requests guidance from WGBYC to derive a list of sensitive metiers and species as well as catch rates and uncertainty to be applied in the mixed fishery projections for PETS
WGBYC

46 | ICES WGMIXFISH-METH REPORT 2015
Annex 3: List of Stock Annexes
WGMIXFISH are looking after three Mixed Fisheries Stock Annexes:
• North Sea Mixed Fisheries Annex
• Iberian Waters Mixed Fisheries Annex
• Celtic Sea Mixed Fisheries Annex
All three annexes can be found in Annex 7 of the WGMIXFISH-ADVICE 2015 Report
(ICES, 2015a).

ICES WGMIXFISH-METH REPORT 2015 | 47
Annex 4: Proposed ToRs for 2016 WGMIXFISH-METH Meeting
WGMIXFISH-METH – Working Group on Mixed Fisheries Advice Methodology
2015/2/ACOM23 The Working Group on Mixed Fisheries Advice Methodology (WGMIXFISH-METH), chaired by Youen Vermard, FR, will meet in week 40 or 41 (exact dates and location to be confirmed) to:
WGMIXFISH-METH will summarise the ongoing knowledge around mixed-fish-eries issues, and will provide some evaluation of the state of implementation of the landings obligation
WGMIXFISH-METH will report by XX November 2016 for the attention of ACOM.
Supporting Information
Priority: The work is essential for ICES to progress in the development of its capacity to provide advice on multi-species fisheries. Such advice is necessary to fulfil the requirements stipulated in the MoUs between ICES and its client commissions.
Scientific justification and relation to action plan:
The issue of providing advice for mixed fisheries remains an important one for ICES. However, in practice all recent advice in this area has resulted from the work and analyses done by sub-groups of STECF rather than ICES. The Aframe project, which started on 1 April 2007 and finished on 31 march 2009 developed further methodologies for mixed fisheries forecasts. The work under this project included the development and testing of the Fcube approach to modelling and forecasts. In 2008, SGMIXMAN produced an outline of a possible advisory format that included mixed fisheries forecasts. Subsequently, WKMIXFISH was tasked with investigating the application of this to North Sea advice for 2010. AGMIXNS further developed the approach when it met in November 2009 and produced a draft template for mixed fisheries advice. WGMIXFISH has continued this work in 2010 to 2012.
Resource requirements:
No specific resource requirements, beyond the need for members to prepare for and participate in the meeting.
Participants: Experts with qualifications regarding mixed fisheries aspects, fisheries management and modelling based on limited and uncertain data.
Secretariat facilities:
Meeting facilities, production of report.
Financial: None
Linkages to advisory committee:
ACOM
Linkages to other committees or groups:
SCICOM through the WGMG. Strong link to STECF.
Linkages to other organizations:
This work serves as a mechanism in fulfilment of the MoU with EC and fisheries commissions. It is also linked with STECF work on mixed fisheries.