Report of the Results of the 2015 Survey of Portland Made ... · there were 126 members, in 2015...
34
Report of the Results of the 2015 Survey of Portland Made Members Charles Heying, Ph.D Associate Professor Stephen Marotta Graduate Student and Research Assistant Austin Cummings Graduate Student and Research Assistant Nohad A. Toulan School of Urban Studies and Planning Portland State University May 26, 2016
Transcript of Report of the Results of the 2015 Survey of Portland Made ... · there were 126 members, in 2015...

Report of the Results of the 2015 Survey of Portland Made Members
Charles Heying, Ph.D Associate Professor
Stephen Marotta
Graduate Student and Research Assistant
Austin Cummings Graduate Student and Research Assistant
Nohad A. Toulan School of Urban Studies and Planning
Portland State University
May 26, 2016

Portland Made Collective – Survey Results 2015 – Page 2
Table of Contents
Report Highlights ……………………………………………………………………………………………………………………. 3
Introduction …………………………………………………………………………………………………………………………… 5
Analysis ………………………………………………………………………………………………………………………………… 6
Respondents by Revenue Category …………………………………………………………………………. 6
Products and Services ………………………………………………………………………………………………. 7
Years in Operation ……………………………………………………………………………………………………. 8
Employment …………………………………………………………………………………………………………….. 9
Employment and Revenue Projections ……………………………………………………………………… 10
Revenue Growth ………………………………………………………………………………………………………. 11
Sales Methods …………………………………………………………………………………………………………… 13
Direct to Customer Sales Venues ………………………………………………………………………………. 13
Web-based Sales ………………………………………………………………………………………………………. 14
Market Location ……………………………………………………………………………………………………….. 15
Commentary on Marketing ………………………………………………………………………………………. 16
Where Work Gets Done ……………………………………………………………………………………………. 16
Who Uses Collaborative or Maker Spaces …………………………………………………………………. 18
Where are Materials Sourced ……………………………………………………………………………………. 18
Where are Products Made ………………………………………………………………………………………… 18
How do Makers Make ……………………………………………………………………………………………….. 19
How do PMC Members Want their Enterprises to Grow …………………………………………….. 20
What Services do Members Want from PMC ……………………………………………………………… 21
PMC Member Geography …………………………………………………………………………………………… 22
Workspace Affordability …………………………………………………………………………………………….. 24
Identity ………………………………………………………………………………………………………………………. 26
Conclusion …………………………………………………………………………………………………………………. 29
Appendix: Portland Made Collective Survey Form …………………………………………………………………… 31

Portland Made Collective – Survey Results 2015 – Page 3
Report Highlights Portland Made is Growing: When we surveyed members of the Portland Made Collective (PMC) in 2014 there were 126 members, in 2015 there were 342 members. Reassuring Similarities between 2014 and 2015 Surveys: The profile of respondents based on revenues, cumulative years in operation, and location of markets exhibit mirror-like symmetry between surveys of Portland Made Collective members conducted in 2014 and 2105. This lends confidence to our belief that the respondent profile is representative of all PMC members. PMC Respondents Cluster at Two Poles: The two most well represented revenue categories were the $0-20,000 (26 enterprises) and the $100,000-$500,000 (24 enterprises). In 2014 and 2015, these two categories, when combined, constituted 61% and 60% of respondents respectively. Mostly Young: Eighty-three percent (83%) of Portland Made Collective (PMC) enterprises have been in operation ten years or less, 62% five years or less, 31% two years or less. These figures from the 2015 survey closely match the 2014 survey results for the same categories (82%, 61%, 26% respectively). Positive Revenue Growth: Respondents reported strongly positive revenue growth in 2014 and 2015. On average, annual revenue growth was 37%, substantial by any measure. Maker Identity Favored. In the 2014 survey, artisan and maker closely contended for the top choice identity. No more, artisan dropped to the least favored identity in the 2015 survey, with maker and entrepreneur now the top choices. However, maker is the more intensely held identity among current respondents and because it was first in 2014 and a close second in 2015, we believe it should be the identity of choice when referring to members of the Portland Made Collective. Portland Made Collective Impacts Local Economy: We estimate that members if the Portland Made Collective employ 2361 workers and produce $316 million in revenues. Sweet Spot: In 2014 we discovered that when enterprises reach the threshold category of $500,000 to $1 million in revenues they enter a “sweet spot” were there is a spurt of hiring full time employees. Before that revenue threshold the ratio of part time to full time employees is roughly equal. The same pattern emerged from our 2015 survey. In addition, we found some other phenomenon that suggests this is an important category. Concern for future work space affordability spikes appreciably for this revenue group, suggesting concern over expansion to accommodate extra workers. And it is a “sweet spot” for another reason; it is the size of enterprise overwhelmingly preferred by PMC respondents. Power of the Personal: Direct to customer marketing accounts for 51% of all sales. Web Facilitates Sales: Web facilitated sales account for 38% of all interactions across all marketing methods and venues. While the comparison is not symmetric, in 2016, E-commerce retail sales in the US were just over 7%.
Portland Made Collective – Survey Results 2015 – Page 4
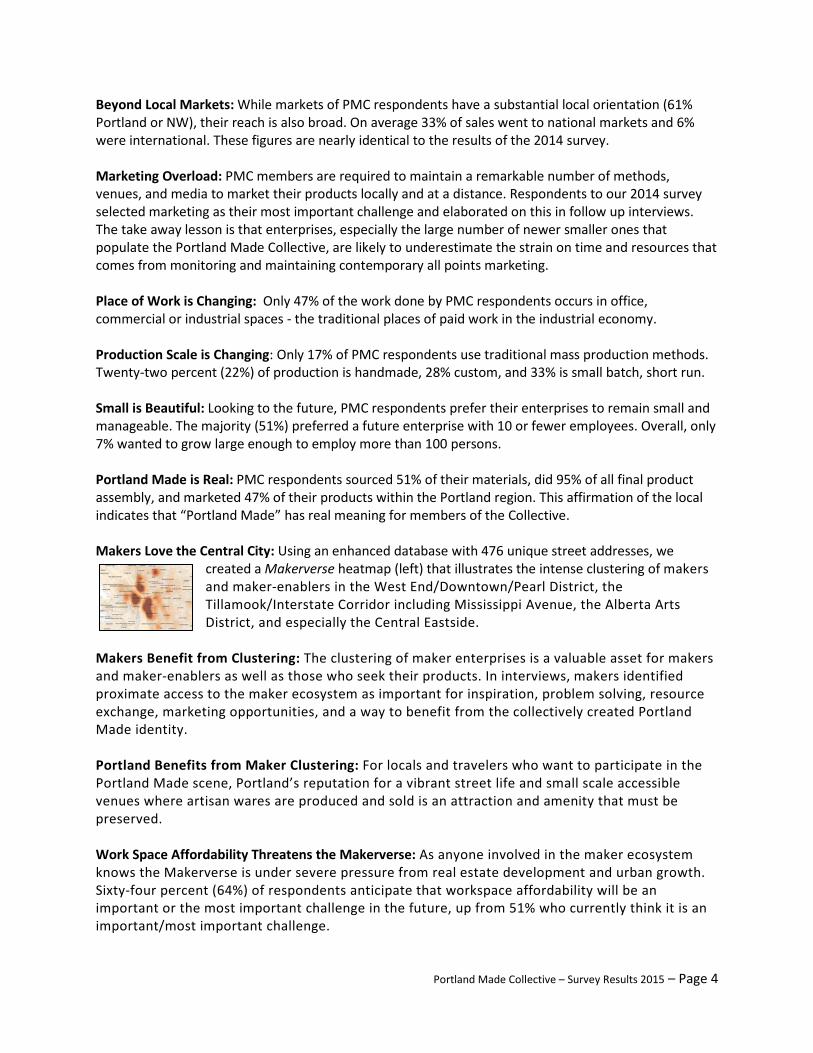
Beyond Local Markets: While markets of PMC respondents have a substantial local orientation (61% Portland or NW), their reach is also broad. On average 33% of sales went to national markets and 6% were international. These figures are nearly identical to the results of the 2014 survey. Marketing Overload: PMC members are required to maintain a remarkable number of methods, venues, and media to market their products locally and at a distance. Respondents to our 2014 survey selected marketing as their most important challenge and elaborated on this in follow up interviews. The take away lesson is that enterprises, especially the large number of newer smaller ones that populate the Portland Made Collective, are likely to underestimate the strain on time and resources that comes from monitoring and maintaining contemporary all points marketing. Place of Work is Changing: Only 47% of the work done by PMC respondents occurs in office, commercial or industrial spaces - the traditional places of paid work in the industrial economy. Production Scale is Changing: Only 17% of PMC respondents use traditional mass production methods. Twenty-two percent (22%) of production is handmade, 28% custom, and 33% is small batch, short run. Small is Beautiful: Looking to the future, PMC respondents prefer their enterprises to remain small and manageable. The majority (51%) preferred a future enterprise with 10 or fewer employees. Overall, only 7% wanted to grow large enough to employ more than 100 persons. Portland Made is Real: PMC respondents sourced 51% of their materials, did 95% of all final product assembly, and marketed 47% of their products within the Portland region. This affirmation of the local indicates that “Portland Made” has real meaning for members of the Collective. Makers Love the Central City: Using an enhanced database with 476 unique street addresses, we
created a Makerverse heatmap (left) that illustrates the intense clustering of makers and maker-enablers in the West End/Downtown/Pearl District, the Tillamook/Interstate Corridor including Mississippi Avenue, the Alberta Arts District, and especially the Central Eastside.
Makers Benefit from Clustering: The clustering of maker enterprises is a valuable asset for makers and maker-enablers as well as those who seek their products. In interviews, makers identified proximate access to the maker ecosystem as important for inspiration, problem solving, resource exchange, marketing opportunities, and a way to benefit from the collectively created Portland Made identity. Portland Benefits from Maker Clustering: For locals and travelers who want to participate in the Portland Made scene, Portland’s reputation for a vibrant street life and small scale accessible venues where artisan wares are produced and sold is an attraction and amenity that must be preserved. Work Space Affordability Threatens the Makerverse: As anyone involved in the maker ecosystem knows the Makerverse is under severe pressure from real estate development and urban growth. Sixty-four percent (64%) of respondents anticipate that workspace affordability will be an important or the most important challenge in the future, up from 51% who currently think it is an important/most important challenge.

Portland Made Collective – Survey Results 2015 – Page 5
Introduction “Portland Made is a self-sustaining collective of makers, artisans and manufacturers that advocates and supports its members by providing education and marketing, a shared resource hub, and a brand that promotes their products locally and globally.” The Portland Made Collective (PMC) is a project of ADX (Art Design) Portland, a makerspace owned and operated by Kelley Roy. This report summarizes the results of a survey of the members of the Portland Made Collective conducted in the spring and summer of 2015. It is the second in a series of annual surveys of PMC members, the first being conducted in 2014. The survey requested information about primary products and services, revenues, employment characteristics, orientation to certain identities, location of markets, specific challenges, and desired goals for PMC membership (see Appendix A for a full text of the survey). At the time of the survey, PMC had 342 members. The survey was sent to all 342 members electronically. We received 85 responses, distributed roughly evenly across four weekly electronic mailings. This calculates to a response rate of 25%, well above the average response rate (roughly 10-15%) for an electronic survey. Responses reflected a broad distribution of enterprises by size and product type. Considering the diversity of responses and the 25% response rate, we are reasonably confident that those who responded reflect the population of PMC members as a whole. We thank Kelley Roy for her ongoing assistance with this project. We include a special thank you to Professor Greg Schrock for his comments on the draft survey and Will Roberts for his assistance on the survey’s construction and distribution. Finally, we acknowledge all PMC members who have participated in this research. We hope this report will contribute to the wellbeing of the Portland Made Collective and we appreciate the willingness members to answer surveys and emails, and even sit down and speak with us in person. For this, we are very grateful.
Portland Made Collective – Survey Results 2015 – Page 6
Analysis
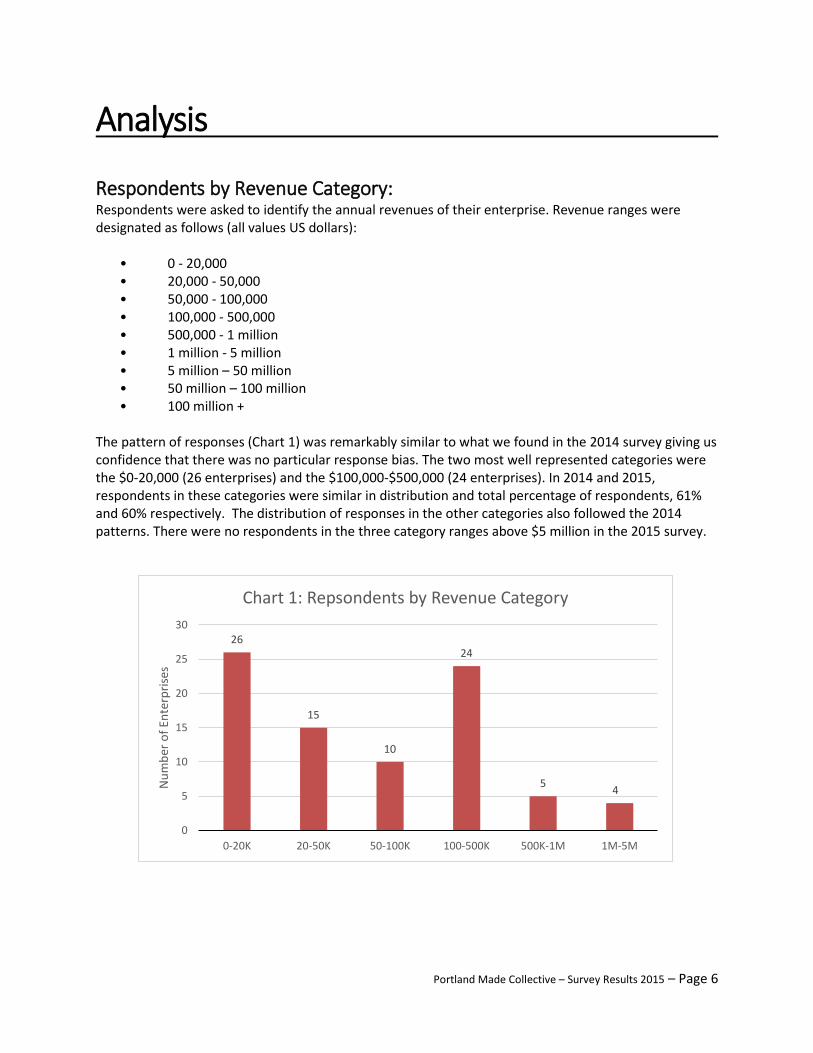
Respondents by Revenue Category: Respondents were asked to identify the annual revenues of their enterprise. Revenue ranges were designated as follows (all values US dollars):
• 0 - 20,000 • 20,000 - 50,000 • 50,000 - 100,000 • 100,000 - 500,000 • 500,000 - 1 million • 1 million - 5 million • 5 million – 50 million • 50 million – 100 million • 100 million +
The pattern of responses (Chart 1) was remarkably similar to what we found in the 2014 survey giving us confidence that there was no particular response bias. The two most well represented categories were the $0-20,000 (26 enterprises) and the $100,000-$500,000 (24 enterprises). In 2014 and 2015, respondents in these categories were similar in distribution and total percentage of respondents, 61% and 60% respectively. The distribution of responses in the other categories also followed the 2014 patterns. There were no respondents in the three category ranges above $5 million in the 2015 survey.
26
15
10
24
5 4
0
5
10
15
20
25
30
0-20K 20-50K 50-100K 100-500K 500K-1M 1M-5M
Num
ber o
f Ent
erpr
ises
Chart 1: Repsondents by Revenue Category

Portland Made Collective – Survey Results 2015 – Page 7
Products and Services: Table 1 depicts the wide array of unique goods and services PMC members provide. PMC’s makers produce everything from dog bowties to robots to handmade paper. Additionally, PMC members include a range of businesses: makers, retailers, designers, fine artists, and gift box curators are all members. In other words, PMC members are most likely a good representation, of Portland’s broader maker ecosystem.
Table 1: Primary Product or Service
Fermented hot sauce, made from organic ingredients
Manufacturing, mostly industrial sewn goods Paper Goods (Cards & Prints)
Handmade Aprons Design, print Retailer of handmade goods
Engraved drinking cups Handmade paper Architectural hardware
Custom bicycle design and fabrication. iPhone, iPad, Apple Watch accessories Fine furniture
Art and craft supplies Industrial/interior design services & fabrication Local gift boxes
Manufacturing Culinary incubator / Bagel bakery Sale of local handcrafted goods
Design Jewelry Architecture and Design
Furniture Design and build Handmade jewelry Cloth menstrual pads
Apparel made in house Clothing Production / Retail Ceramic tile
Women's Apparel Manufacturing Leather and wood gadget covers Handcrafted leather MacKenzie Walker golf bags and golf accessories
Consulting Blown glass lighting, decor, table top Brigadeiros
Art Athletic clothing Bath & Body
T-shirts Robots Baby apparel
Hand Forged Knives Lighting Knives
Women’s jeans Straight Razor Manufacturing (&Other Men's Grooming Products) Fine art photography
Custom Bottle Openers Rescued Material Dog Bow Ties
Drumstick bags and other instrument accessories
Millinery Sharpening service Design consulting, 3D printing
Foundry production Bags Wine
Millinery and garments Leather goods Action Mount and Grip Stand
Makerspace Microphones Specialty Preserves
Cocktail Bitters Leather products and Soft Goods Manufacturing Bags
Consulting services Handmade jewelry Ceramic art and pottery
Freelance illustration Custom Flags and Flagpoles Books
Retail of Portland made goods Laser cut goods Clothing
Art Skis & Snowboards Furniture and furnishings
Hand drawn coloring pages Organic ketchup Leather Goods
Natural soap Jewelry Woven plastic fabric
Artisan body care Roadgoing outdoor vehicles Kombucha starter kits

Portland Made Collective – Survey Results 2015 – Page 8
Years in Operation It is no surprise that most PMC member enterprises are rather young. (Chart 2) Of the 84 usable responses for the question of how long their enterprise has been in operation, the largest numbers of respondents were in the 1-2 year category and the 3-5 year category, both with 26 respondents.
Chart 3 presents the cumulative years of operation. This type of aggregation illustrates even more strongly the relative youth of PMC member enterprises. Over 83% of PMC members have been in operation for ten years or less, while 62% have been operation five years or less, and 31% in operation two years or less. The residual category of all others describes a wide range of enterprises operating from 11 to 51+ years. With the exception of a slightly larger percentage of enterprises in the 2 years or less category for the 2015 survey, these percentages are nearly identical to what we found in our 2014 survey. While the number of PMC members grew from 126 to 342, the pattern for cumulative years in operation stayed nearly the same, again reinforcing our sense that our respondent profile of maker firms is relatively robust.
26 26
18
6 5
2 1
0
5
10
15
20
25
30
1-2 Years 3-5 Years 6-10 Years 11-15 Years 16-30 Years 31-50 Years 51+ Years
Num
ber o
f Firm
s
Chart 2: Years in Operation

Portland Made Collective – Survey Results 2015 – Page 9
Employment: The survey asked each PMC member to identify the number of persons, including themselves, that are employed in their enterprise full time and part time. Chart 4 displays the results by revenue category. In comparison with the profile of our 2014 response set, we are more confident in our numbers for the 2015 survey. In 2014, it was unclear whether or not the owner of the enterprise should include themselves in the count. In the 2015 survey, the question was explicit that the owner should be included in the count. Perhaps because of this, we did see a small upward shift in number of full time employees especially in the categories below $500,000. But overall, the pattern of responses was similar to 2014. Results indicate that the revenue necessary for firms to be able to support a spurt in the hiring full time employees is in the revenue range of $500,000 to $1 million and this increases exponentially as the size of the enterprise grows. This is the same “sweet spot” we found in the 2014 survey which gives us more confidence that this also is a reliable finding.
31%
62%
83%
17%
0%
10%
20%
30%
40%
50%
60%
70%
80%
90%
2 years or less 5 years or less 10 years or less All others
Years in Operation
Chart 3: Years of Operation - Cumulative

Portland Made Collective – Survey Results 2015 – Page 10
One note of caution on the number of full time employees in the $1-5 million revenue category, one firm in this category had an outsized impact on this number so it is perhaps higher than what would be expected especially in comparison with the 2014 findings for this category. However, when we excluded the enterprise from the category, the undercount in comparison with 2014 survey was equally significant. We chose to leave the enterprise in the count but also include this caveat for the reader.
Employment and Revenue Projections: In this section, we make some projections about employment and revenue impacts for the whole PMC membership based on what we know from our survey respondents (Table 2). In all, the 83 respondents who answered this question employed 138 part time employees and 281 full time employees for a total of 419 employees. Using a simple proportional multiplier, we estimate the total population of 342 PMC members employs 569 part time employees and 1158 full time employees for a total of 1727 employees.
Table 2: Employment of Respondents and Estimated for Total PMC Population
Survey Respondents Only Estimated for all 342 PMC Members Part Time 138 569 Full Time 281 1158 TOTAL 419 1727
0.6 1.0 1.6 2.5
10.0
31.3
0.5 0.6 0.8 2.4
5.4 6.0
0.0
5.0
10.0
15.0
20.0
25.0
30.0
35.0
0-20K 20-50K 50-100K 100-500K 500K-1M 1M-5M
Chart 4: Average Employment
Full Time
Part Time

Portland Made Collective – Survey Results 2015 – Page 11
Using the mean value for each revenue category, we calculate that the 84 PMC respondents who answered the revenue question generated $24.5 million in revenues. Using a simple proportional multiplier, we estimate that the revenue for all 342 PMC is $99.7 million (Table 3).
Table 3: Annual Revenue of Respondents and Estimated for Total PMC Population
Survey Respondents Only Estimated for all 342 PMC Members TOTAL Annual Revenue $24,485,000 $99,689,000
These estimates are complicated by a difference between how we reported our 2014 data and how we are reporting the 2015 data. The major difference is that we did not use supplemental data for the current report, so our calculations are completely reliant on the responses we got from PMC members. The advantage to this approach is that we don’t introduce outside “noise” to our survey data set, which protects the integrity of our reporting. The disadvantage, however, is that we cannot accurately project revenue impact for all PMC members because we learned in developing our 2014 report that PMC has a few very large member firms that dramatically skew the data. Since these enterprises did not respond to the survey, we believe that the above projections considerably underestimate the aggregate impact of PMC’s members. However, this presents a problem. If we include the data for the three largest enterprises we skew the data one way, if we do not, we skew it another way. Each type of projection has a measure of accuracy that the other lacks and the reader should be aware that all projections are only as good as the operative assumptions in making the calculations. With that disclaimer, we made a second estimate with the revenues and employment of the three largest PMC members included. Using data derived from the ReferenceUSA database, we found that the three largest PMC members produce an additional $216 million in revenues and add 634 employees for a combined estimate of 2361 employees and $316 million in revenues for the total PMC population.
Table 4: Revised Annual Revenue and Employment Estimates for Total PMC Population
Total Full and Part Time Employees Revenues Estimate based on Respondent Profile 1727 $99,689,000 Additional Data from Three Largest Firms 634 $216,405,000 TOTAL 2361 $316,094,000
Revenue Growth: PMC members were asked about revenue growth for 2013 and 2014. While there were two reports of negative growth, respondents overwhelmingly reported positive growth in both years (Table 5). The overall average for the two years was 37% which is substantial by any measure.

Portland Made Collective – Survey Results 2015 – Page 12
Table 5: Average Revenue Growth for PMC Members for 2013 and 2014
Average Growth 2013 Average Growth 2014 Overall Average Growth 34% 39% 37%
When we considered how this played out based on revenue category, the results were both expected and unexpected (Chart 5). As shown by the overall trendline (both years were similar, so only 2015 is shown), smaller enterprises grew considerably faster than larger enterprises. That is to be expected. The one outlier of 21% growth in the $0-20K category for 2014 can be explained by the high number of enterprises who indicated zero growth in that year. Since enterprises in this category may only be one year old, the zero growth probably indicates they were not in business in 2014, thus skewing that data.
In terms of unexpected findings, a consistent uptick for both years in the reported growth of enterprises in the $100-500K category is interesting. Since this question was structured quite differently in the 2014 survey, we can make no legitimate comparison, but if this pattern is repeated in future surveys, it would be something to examine more closely. We do know that full time employment is ramped up in the $500K-1M category (Chart 4) so it is possible that strong revenue growth in enterprises in the $100-500K category is prompting them to step up their hiring to meet demand. This revenue growth and hiring spurt launches them into the next highest revenue category. This makes some sense, but it is speculative and we would need more than one year’s data and further exploration to confirm the hypothesis.
21%
52%
37%
41%
16% 16%
50%
37%
26%
48%
18%
13%
0%
10%
20%
30%
40%
50%
60%
0-20K 20-50K 50-100K 100-500K 500K-1M 1M-5M
Revenue Category
Chart 5: Average Revenue Growth
2014
2015
Linear (2015)

Portland Made Collective – Survey Results 2015 – Page 13
Sales Methods: The survey asked PMC members to identify the primary method of sales used. The most common response for sales method was direct to customer with respondents collectively identifying 51% of sales in this category (Chart 6). The least common sales method was 11% contract/subcontract. It is interesting to note that respondents identified only 16% of sales in the direct to retail category. Given that there appear to be so many opportunities and outlets for this type of sale, that seems a fairly low number especially since retail outlets seem an ideal way to attract a larger customer base.
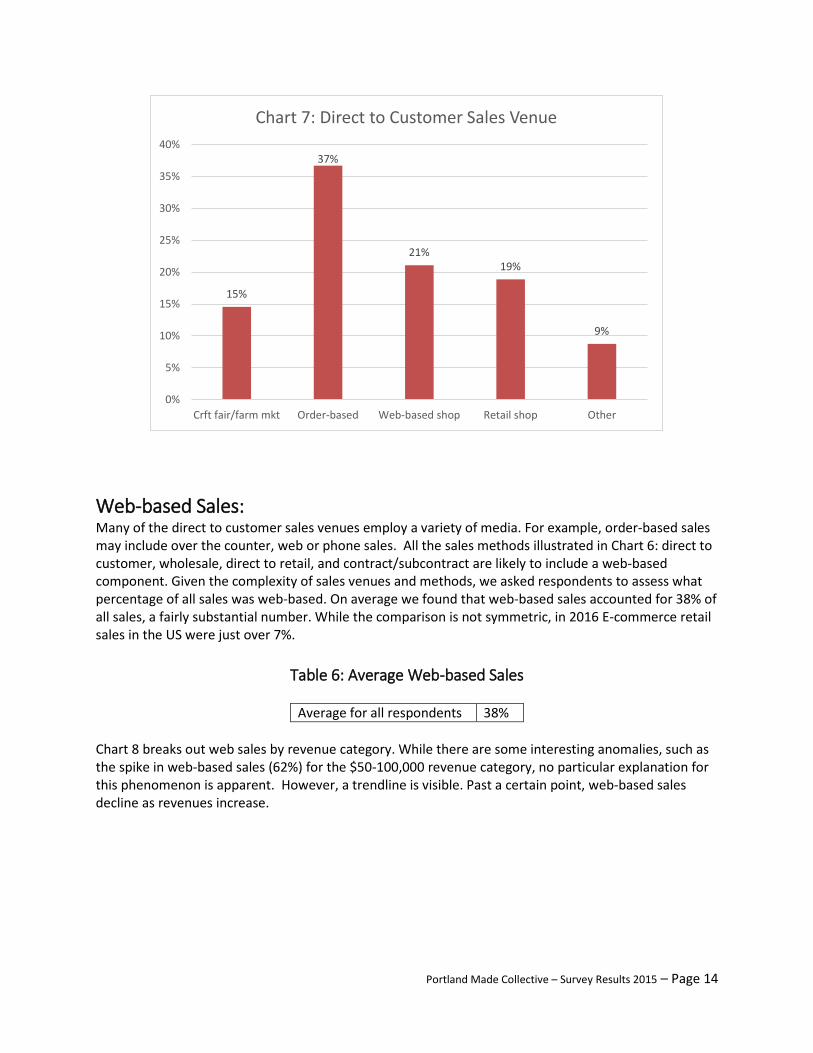
Direct to Customer Sales Venues: We anticipated that direct to customer would be the most preferred method of sales for PMC’s members. Seeking to probe this more deeply, we asked a follow-up question about what direct to customer venues were most often used (Chart 7). The most preferred method (37%) of selling products directly is through orders from customers. Web based orders are also a fairly large component, with 21% of sales made through this venue. Our follow-up interviews largely confirmed this, as many PMC members discussed the importance of personal relationships with customers, largely stewarded over social media outlets and email communication.
22%
16%
11%
51%
0%
10%
20%
30%
40%
50%
60%
Wholesale Direct to retail Contract/sub-contract Direct to consumer
Chart 6: Sales Method
Portland Made Collective – Survey Results 2015 – Page 14
Web-based Sales: Many of the direct to customer sales venues employ a variety of media. For example, order-based sales may include over the counter, web or phone sales. All the sales methods illustrated in Chart 6: direct to customer, wholesale, direct to retail, and contract/subcontract are likely to include a web-based component. Given the complexity of sales venues and methods, we asked respondents to assess what percentage of all sales was web-based. On average we found that web-based sales accounted for 38% of all sales, a fairly substantial number. While the comparison is not symmetric, in 2016 E-commerce retail sales in the US were just over 7%.
Table 6: Average Web-based Sales
Average for all respondents 38% Chart 8 breaks out web sales by revenue category. While there are some interesting anomalies, such as the spike in web-based sales (62%) for the $50-100,000 revenue category, no particular explanation for this phenomenon is apparent. However, a trendline is visible. Past a certain point, web-based sales decline as revenues increase.
15%
37%
21% 19%
9%
0%
5%
10%
15%
20%
25%
30%
35%
40%
Crft fair/farm mkt Order-based Web-based shop Retail shop Other
Chart 7: Direct to Customer Sales Venue

Portland Made Collective – Survey Results 2015 – Page 15
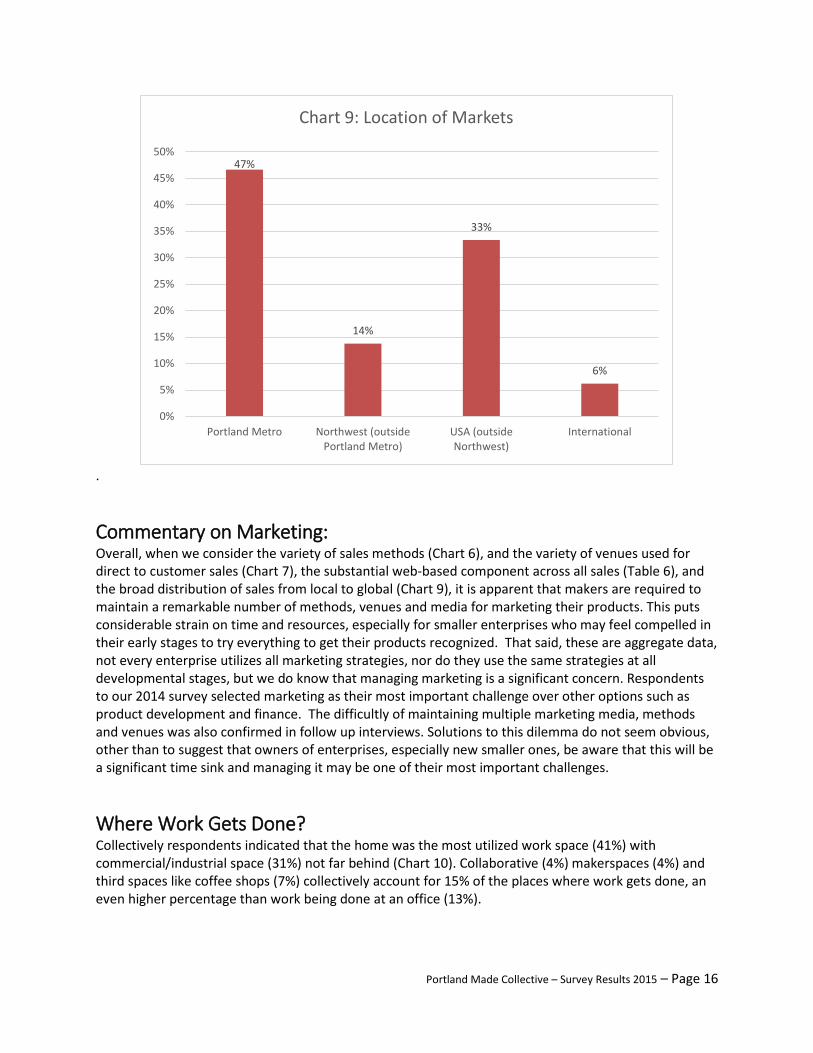
Market Location: The largest percentage of members’ sales could be considered local at 61%, a figure arrived at by combining sales from Portland Metro (47%) and the Northwest, outside of Portland (14%) (Chart 9). While PMC member markets are strongly local, their reach is also broad. On average 33% of sales went to national markets and 6% of respondent sales were international. It is likely that Internet-based sales venues are responsible for this market spread, and indeed, the responses for sales venues indicated order-based (often done through electronic means) and web-based platforms as the most prominent venues for sales.
43%
31%
62%
35%
30%
6%
0%
10%
20%
30%
40%
50%
60%
70%
0-20K 20-50K 50-100K 100-500K 500K-1M 1-5M
Chart 8: Web-based Sales by Revenue Category
Portland Made Collective – Survey Results 2015 – Page 16
.
Commentary on Marketing: Overall, when we consider the variety of sales methods (Chart 6), and the variety of venues used for direct to customer sales (Chart 7), the substantial web-based component across all sales (Table 6), and the broad distribution of sales from local to global (Chart 9), it is apparent that makers are required to maintain a remarkable number of methods, venues and media for marketing their products. This puts considerable strain on time and resources, especially for smaller enterprises who may feel compelled in their early stages to try everything to get their products recognized. That said, these are aggregate data, not every enterprise utilizes all marketing strategies, nor do they use the same strategies at all developmental stages, but we do know that managing marketing is a significant concern. Respondents to our 2014 survey selected marketing as their most important challenge over other options such as product development and finance. The difficultly of maintaining multiple marketing media, methods and venues was also confirmed in follow up interviews. Solutions to this dilemma do not seem obvious, other than to suggest that owners of enterprises, especially new smaller ones, be aware that this will be a significant time sink and managing it may be one of their most important challenges.
Where Work Gets Done? Collectively respondents indicated that the home was the most utilized work space (41%) with commercial/industrial space (31%) not far behind (Chart 10). Collaborative (4%) makerspaces (4%) and third spaces like coffee shops (7%) collectively account for 15% of the places where work gets done, an even higher percentage than work being done at an office (13%).
47%
14%
33%
6%
0%
5%
10%
15%
20%
25%
30%
35%
40%
45%
50%
Portland Metro Northwest (outsidePortland Metro)
USA (outsideNorthwest)
International
Chart 9: Location of Markets

Portland Made Collective – Survey Results 2015 – Page 17
We can learn something more when we combine figures for percentage of work in office space (13%) with percentage in commercial/industrial space (31%). These work spaces (44 % total) are most often associated with paid work in the traditional industrial economy (Chart 11). If we compare that figure to the 41% of work that respondents identify as being done at home (formerly a place of unpaid labor) and combine that with the 15% of work being done in collaborative, makerspace and third spaces, we see that a significant transformation is underway in terms of where work gets done in the post-industrial era.
41%
13%
31%
4% 4% 7%
0%
5%
10%
15%
20%
25%
30%
35%
40%
45%
Home Office Comrcl/Indspace
Collab space Makerspace Third Spaces
Chart 10: Where Work Gets Done
Off/Com/Inds 44%
Home 41%
Coll/Maker/Third 15%
Chart 11: Where Work Gets Done - Post-industrial Era

Portland Made Collective – Survey Results 2015 – Page 18
Who uses Collaborative or Maker Spaces? We also wanted to determine the characteristics of the 19 respondents who did some, most, or all of their work in collaborative or maker spaces. We found that:
• 79% have been in business 4 years or less • 86% had 2 or fewer full time employees (including themselves), • 79% have annual revenues of $100,000 or less, • They are most likely to identify as entrepreneurs and makers. • In comparison to all respondents, they are more likely to source their materials locally.
This affirms what is commonly understood about those who use collaborative or maker spaces.
Where are Materials Sourced? We asked PMC members where they source their materials. Results were split down the middle, with roughly 51% of materials, supplies and components sourced within the Portland region and roughly 49% sourced outside the region (Table 7). While we assume that respondents were considering primarily first level sourcing (local producer, supplier or distributor) 51% is a substantial amount of local sourcing given access to alternatives such as online, national and global suppliers.
Table 7: Sourcing of Materials
Within the Portland Region 51% Outside the Portland Region 49%
Where are Products Made? While sourcing of materials is an important aspect of local production, it is equally important to learn where materials are assembled into a final product. PMC members were asked what percentage of their product or service is created, built, or assembled in house, by contract within the region, or by contract outside the Portland region.
Portland Made Collective – Survey Results 2015 – Page 19
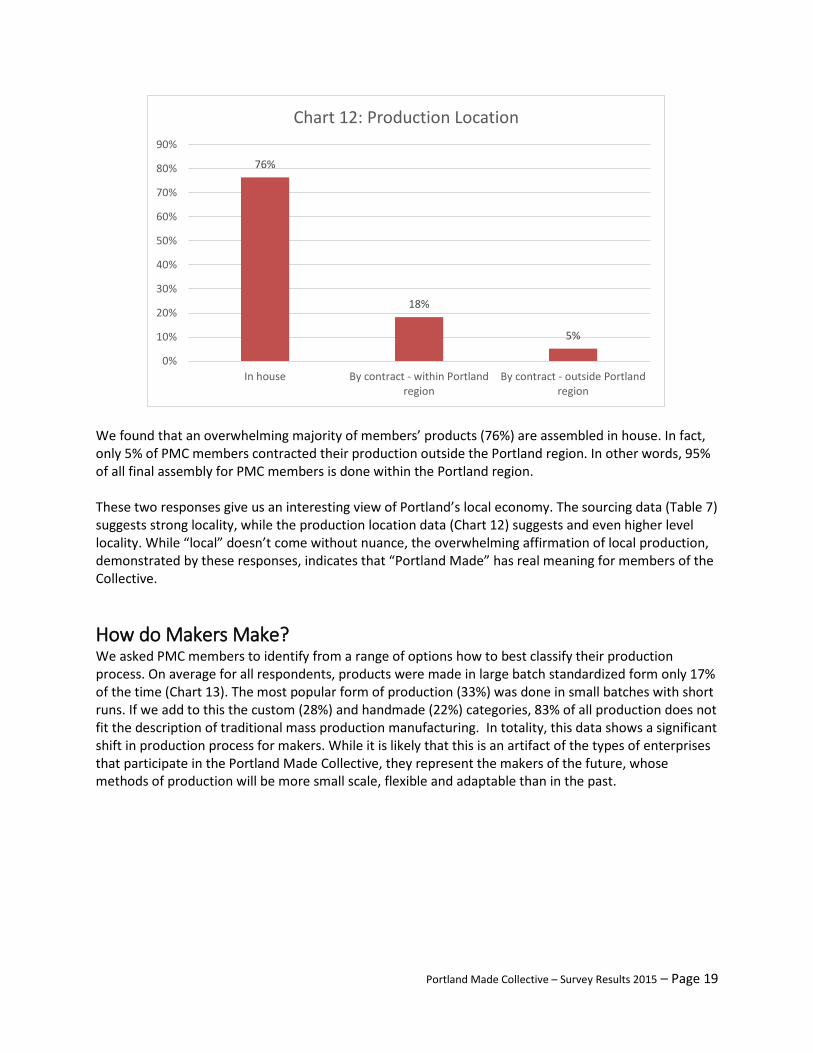
We found that an overwhelming majority of members’ products (76%) are assembled in house. In fact, only 5% of PMC members contracted their production outside the Portland region. In other words, 95% of all final assembly for PMC members is done within the Portland region. These two responses give us an interesting view of Portland’s local economy. The sourcing data (Table 7) suggests strong locality, while the production location data (Chart 12) suggests and even higher level locality. While “local” doesn’t come without nuance, the overwhelming affirmation of local production, demonstrated by these responses, indicates that “Portland Made” has real meaning for members of the Collective.
How do Makers Make? We asked PMC members to identify from a range of options how to best classify their production process. On average for all respondents, products were made in large batch standardized form only 17% of the time (Chart 13). The most popular form of production (33%) was done in small batches with short runs. If we add to this the custom (28%) and handmade (22%) categories, 83% of all production does not fit the description of traditional mass production manufacturing. In totality, this data shows a significant shift in production process for makers. While it is likely that this is an artifact of the types of enterprises that participate in the Portland Made Collective, they represent the makers of the future, whose methods of production will be more small scale, flexible and adaptable than in the past.
76%
18%
5%
0%
10%
20%
30%
40%
50%
60%
70%
80%
90%
In house By contract - within Portlandregion
By contract - outside Portlandregion
Chart 12: Production Location

Portland Made Collective – Survey Results 2015 – Page 20
How do PMC Members Want their Enterprises to Grow? When asked about the ideal size of their future enterprise, PMC members prefer smaller sized firms (Chart 14). Fifty one percent (51%) of respondents indicated their desire for a firm that employed 10 people or less. Only 7% of the respondents indicated a desire for a firm with more than 100 employees, and none of the respondents indicated a desire for a publicly traded firm.
17%
33% 28%
22%
0%
5%
10%
15%
20%
25%
30%
35%
Large batch, long run,standardized product
Small batch, shortrun, flexible
product/service
Custom, on demandproduct service
Handmade,autonomous design,
one off
Chart 13: Production Process
11%
51%
31%
7%
0%
0% 10% 20% 30% 40% 50% 60%
Self Employed
10 employees or less
10-100 employees
100+ employees
Publicly traded, 100+
Chart 14: Ideal Size of Enterprise

Portland Made Collective – Survey Results 2015 – Page 21
When we consolidate the data into two categories of small and large enterprises, we see the strength of the preference to remain small in scale (Chart 15). We called “small” anything with 100 employees or less. One hundred employees may sound comparatively large, but the Small Business Administration defines a small manufacturing business as having fewer than 500 employees. The finding here is clear: PMC members generally do not want to grow their business into the “large” category. Members desire small businesses in which they can maintain personal relationships with their workforce. Additionally, bigger operations require investors, which means ceding control to outside forces; PMC members seem resistant to that.
What Services do Members Want from PMC? We asked PMC members to rate the importance of various services that PMC offers or may offer in the future (Chart 16). While there was some variance across categories, no category particularly stood out. That said, advertising on PMC website and offering a rewards card scored on the lower end. The options with the highest average responses were expanding networks through events and targeted workshops. Add to this a preference for an online forum hosted by PMC, and it suggests that options that connect and educate are higher on the list of services preferred by PMC members.
2.3 2.6 2.5
2.3 2.2 2.0
1.7
0.0
1.0
2.0
3.0
4.0
ElectronicForum
ExpandNetworksThroughEvents
TargetedWorkshops
BrandingProducts
PostPremiumContent
Advertisingon PMCWebsite
RewardsCard
Aver
age
Scor
e
Chart 16: Importance of PMC Service
Small 93%
Large 7%
Chart 15: Preference for Small or Large Enterprise

Portland Made Collective – Survey Results 2015 – Page 22
PMC Member Geography: We asked PMC members to identify the zip code where their products are made. The distribution (Table 8) reflects the density of member enterprises in the central city. Zip codes in and around the Central Eastside are well represented with 36 PMC members. Close-in N and NE neighborhoods were home to another 17 members, while Downtown, The Pearl, and Northwest/Alphabet District were home to 7 members. Overall, we saw very few PMC members from suburban cities such as Beaverton or Gresham, and no survey respondents claimed to be from north of the Columbia.
Table 8: Member Locations
Zip Count Location 97202 12 CES 97206 5 CES 97214 11 CES 97215 4 CES 97232 4 CES 97201 1 DT/PRL 97205 1 DT/PRL 97209 4 DT/PRL 97210 1 DT/PRL
97211 6 N-NE 97212 3 N-NE 97213 2 N-NE 97217 3 N-NE 97227 3 N-NE 97003 1 97008 1 97030 1 97036 1 97080 2
97203 2 97208 2 97216 1 97219 1 97222 1 97229 2 97230 1 97282 1 97470 1
Map 1: Clustering of PMC Enterprises
Map 1: Clustering of PMC Enterprises provides a visual representation of the clustering of PMC enterprises around the central neighborhoods of Portland.

Portland Made Collective – Survey Results 2015 – Page 23
Map 2: Portland’s Makerverse
Map 2: Portland’s Makerverse is similar to Map 1 in scale, although somewhat more focused on the central neighborhoods of Portland. For this map, we utilized data available from a study that we are conducting to better understand the ecology of maker-enabling resources in Portland. This map illustrates the clustering of Portland’s “makerverse.” In addition to PMC members (orange), we included: makerspaces (green), collaborative or community workspaces (yellow), shops and boutiques that feature local maker wares (red), tool libraries (purple), and other resources (blue) such as trade schools. Map 3: Heatmap of Portland’s Makerverse provides the most definitive view of maker clustering. A heatmap uses color to represent data. As individual data points cluster, the intensity of the color increases. The data used for this heatmap comes from a variety of sources including 69 usable responses from the 2015 PMC survey, 90 maker-enabling enterprises shown in Map 2, and 317 artisan/makers identified in a previous research effort. All duplicates were eliminated and only those enterprises with a specific street address were used (no PO boxes). Map 3 is derived from the 476 unique street addresses identified from the above described data sources.
KEY
Orange = PMC members Green = makerspaces Yellow = collaborative space Red = shops/boutiques Purple = tool libraries Blue = other resources

Portland Made Collective – Survey Results 2015 – Page 24
Map 3: Heatmap of Portland’s Makerverse
From Map 2 and especially Map 3 we can easily see the spaces that makers and maker-enablers value: the West End/Downtown/Pearl District, the Tillamook/Interstate Corridor including Mississippi Avenue, the Alberta Arts District, and especially the Central Eastside. The clustering of these enterprises is a valuable asset for makers and maker-enablers as well as those who seek their products. In interviews, makers identified proximate access to this maker ecosystem as important for inspiration, problem solving, resource exchange, marketing opportunities, and a way to benefit from the collectively created Portland Made identity. For those customers who want to participate in the Portland Made scene, Portland’s reputation for a vibrant street life and small scale accessible venues where artisan wares are produced and sold is an attraction and amenity that must be preserved. But as anyone involved in the maker ecosystem knows, all of these spaces are under severe pressure from real estate development and urban growth.
Workspace Affordability: With this potential concern in mind, we asked PMC members to access what level of challenge they faced in finding affordable work space now and in the future (Chart 17). For current affordability (left column) 49% of the respondents thought it a minor/moderate challenge and 51% considered it an important/most important challenge.

Portland Made Collective – Survey Results 2015 – Page 25
However, when we asked respondents the same question as it would apply to the future challenge of finding affordable workspace, the same comparison of minor/moderate versus important/most important tells a different story. PMC members responded with considerable more concern: 64% of respondents see future affordability as either an important/most important challenge for their enterprise. This reflects the growing apprehension around the rapid neighborhood change taking place in industrial spaces such as the Central Eastside. We took a deeper look to see if responses varied based on revenue category. Chart 18 compares the percentages of respondents by revenue category who considered current and future affordability of workspaces to be either an important or most important challenge. Some patterns emerge, some of which suggest an explanation and others that are interesting but not easily explained. Overall, those in the $1-5 million category are the least concerned either in current or future times about affordability. Perhaps respondents in this category are more likely to own their facility or to have negotiated a long term lease. While their concern for the affordability is generally lower than others, it is important to note that their concern for future space has doubled from 25% to 50%. This is a very large increase and was only observed in one other revenue category, $50-100,000. For respondents in that group, the change from current to future more than doubles from 30% to 67%. We have no explanation for why that revenue category is so different from others.
49% 36%
51% 64%
0%
10%
20%
30%
40%
50%
60%
70%
80%
90%
100%
Current Future
Chart 17: Current vs Future Work Space Affordability
Important/Most Important
Minor/Moderate

Portland Made Collective – Survey Results 2015 – Page 26
Respondents in the $0-20,000 category are also less concerned about the present, probably because more in this group are working from their homes. But their future concern for affordable workspace rises significantly, perhaps as they anticipate moving from their home to a rented workspace. The other group that stands out is the $500,000 – 1 million revenue category. While their concern level for their current situation (60%) is considerably above the norm (51%), their concern level for the future rockets to 80%, the highest of all revenue categories. This seems to make sense as this is the group where we have seen, in both the 2014 and 2015 surveys, a pattern of ramping up their employment of full time workers. More employees require a larger space, hence the heightened concern for affordability. This again suggests that we bring special focus to the “sweet spot” in enterprise evolution. It is a critical time of revenue growth, space expansion and growth in the number of full time employees.
Identity: The identity question in the survey gave respondents four identity prompts: maker, entrepreneur, artisan, and business person that we assumed would be popular. Respondents were asked to rate how strongly they identify with each term on a scale of 1-5. Respondents showed a strong preference for the entrepreneur and maker identities, with entrepreneur being the most strongly preferred identity (Chart 19). The weakest identity in the 2015 survey was artisan. A similar question was asked on the 2104 survey. In that survey, maker was the most preferred identity followed very closely by artisan. However, the comparison is problematic because of a methodological difference between the 2015 survey and the 2014 survey. In 2014 we listed the response options in static order, meaning all respondents saw the options in the exact same order. In 2015 we randomized the order of the options to account for the possibility of first order bias. In other words, respondents saw the options in a variety of orders.
42%
60%
30%
63% 60%
25%
62% 67% 67%
63%
80%
50%
0%
10%
20%
30%
40%
50%
60%
70%
80%
90%
0-20K 20-50K 50-100K 100-500K 500K-1M 1-5M
Chart 18: Current vs Future Affordability by Revenue Category
Current
Future
Portland Made Collective – Survey Results 2015 – Page 27
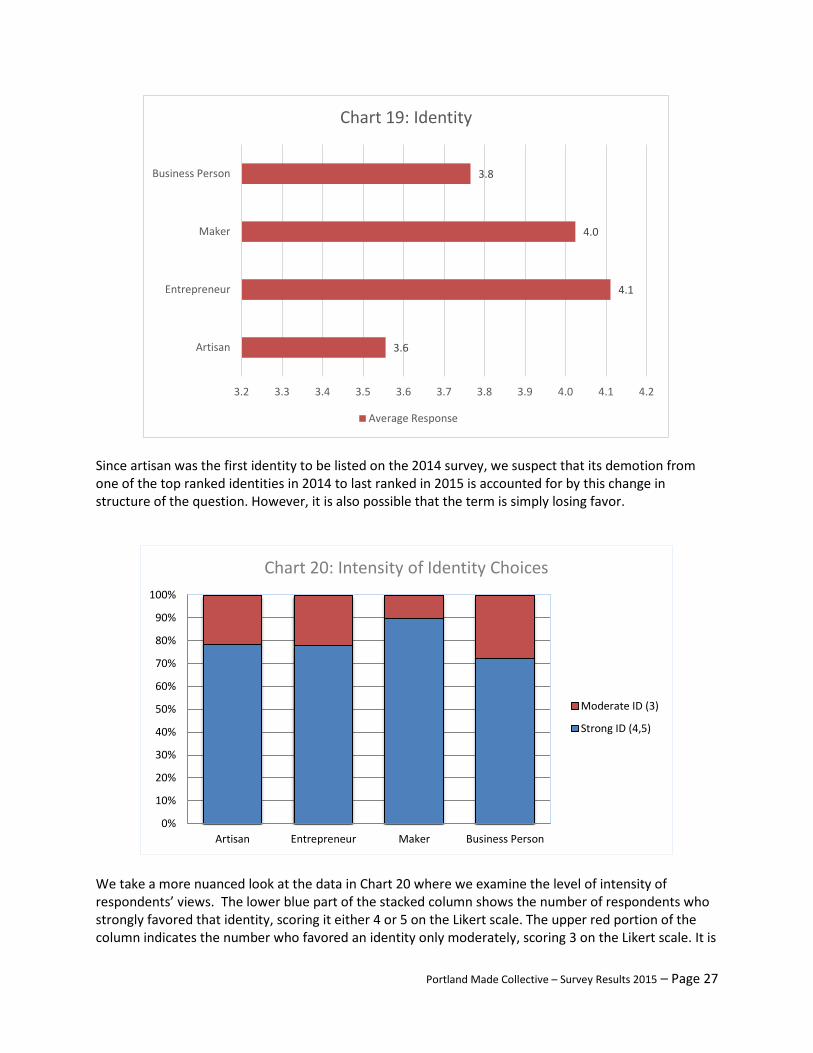
Since artisan was the first identity to be listed on the 2014 survey, we suspect that its demotion from one of the top ranked identities in 2014 to last ranked in 2015 is accounted for by this change in structure of the question. However, it is also possible that the term is simply losing favor.
We take a more nuanced look at the data in Chart 20 where we examine the level of intensity of respondents’ views. The lower blue part of the stacked column shows the number of respondents who strongly favored that identity, scoring it either 4 or 5 on the Likert scale. The upper red portion of the column indicates the number who favored an identity only moderately, scoring 3 on the Likert scale. It is
3.6
4.1
4.0
3.8
3.2 3.3 3.4 3.5 3.6 3.7 3.8 3.9 4.0 4.1 4.2
Artisan
Entrepreneur
Maker
Business Person
Chart 19: Identity
Average Response
0%
10%
20%
30%
40%
50%
60%
70%
80%
90%
100%
Artisan Entrepreneur Maker Business Person
Chart 20: Intensity of Identity Choices
Moderate ID (3)
Strong ID (4,5)

Portland Made Collective – Survey Results 2015 – Page 28
evident that those respondents who selected Maker as an identity favored it more strongly than respondents who choose any other identity. Given that the Maker identity was the top choice in the 2014 survey and a very close second in the 2015 survey, and considering that the Maker identity is a more strongly held identity by those who selected it, we believe it is the most robust of all identity options and that it has currency and meaning to members of the Portland Made Collective. In future surveys, we should probe more deeply as to what particular meaning is attributed to each identity term and what are the perceived limitations of alternative labels. Identity labels have important meanings for shared values, work processes, environments and expectations. Much could be learned by asking makers to make sense of the identity they prefer.

Portland Made Collective – Survey Results 2015 – Page 29
Conclusion
This report summarized the results of a survey of the members of the Portland Made Collective conducted in the spring and summer of 2015. It is the second in a series of annual surveys of PMC members, the first being conducted in 2014. When we surveyed PMC members in 2014 there were 126 members, by 2015 there were 342 members – the obvious conclusion - Portland Made is growing. In comparing our two annual surveys we found some reassuring similarities. The profile of respondents based on revenues, cumulative years in operation, and location of markets exhibit mirror-like symmetry between 2014 and 2105 surveys. Given similar respondent profiles of the two surveys and the respectable survey response rate of 25% for our 2015 survey, we are confident that what we say about our respondents accurately reflects the population of PMC members. In creating a profile of PMC enterprises, we find that they cluster at two poles. The two most well represented revenue categories are the $0-20,000 (26 enterprises) and the $100,000-$500,000 (24 enterprises). Combined, 60% of respondents fall in those two categories. PMC enterprises are mostly young. Sixty-two percent (62%) have been in operation five years or less. And they are growing quickly. For the last two years, respondents reported an average annual revenue growth of 37%, substantial by any measure. The identity they favor is maker. In the 2014 survey, artisan and maker closely contended for the top choice identity. No more; artisan dropped to the least favored identity in the 2015 survey, with maker and entrepreneur now the top choices. The Portland Made Collective contributes significantly to Portland’s economy. We estimate that PMC members employ 2361 workers and produce $316 million in revenues. However, we add a disclaimer. As we discuss in the paper, calculating impact is a complicated process. On the one hand, if we relied on the survey data alone for our projected economic impact that would have underestimated what we know to be PMC members’ real impact. On the other hand, by including supplemental data about the three largest enterprises (who did not answer the survey), we introduced other problems and biases. We found that the “sweet spot” is still with us. In 2014 we discovered that when enterprises reach the threshold category of $500,000 to $1 million in revenues they enter a “sweet spot” were there is a spurt of hiring full time employees. Before that revenue threshold, the ratio of part time to full time employees is roughly equal. The same pattern emerged from our 2015 survey. It is telling that enterprises in this revenue group were significantly more concerned than average about future work space affordability. Since marketing was identified as the most important challenge for respondents of our 2014 survey, we included more specific questions in the 2015 survey. We found that marketing is very personal for PMC members. Direct to customer marketing accounts for 51% of all sales. Paradoxically, but maybe not, web facilitated sales account for 38% of all interactions across all marketing methods and venues. While markets of PMC respondents have a substantial local orientation (61% Portland or NW), their reach is also broad. On average 33% of sales went to national markets and 6% were international. But what came across most clearly is that PMC members are required to maintain a remarkable number of methods, venues, and media to market their products locally and at a distance. In follow up interviews, respondents expressed the difficulty of staying on top of the demand to manage their marketing interface. The take away lesson is that enterprises, especially the large number of newer smaller ones that populate the Portland Made Collective, are likely to underestimate the strain on time and resources that comes from monitoring and maintaining contemporary all points marketing.

Portland Made Collective – Survey Results 2015 – Page 30
For makers, work is changing in terms of where and how it is done and what size of enterprise is preferred. Remarkably, only 47% of the work done by PMC respondents occurs in office, commercial or industrial spaces - the traditional places of paid work in the industrial economy. The majority of work takes place in the home (formerly the place of unpaid labor) or in shared, maker or third spaces like coffee shops. Production scale is also shifting. Only 17% of PMC production is traditional industrial scale mass production. Twenty-two percent (22%) of production is handmade, 28% custom/on demand, and 33% is small batch, short run. Looking to the future, PMC respondents prefer their enterprises to remain small and manageable. The majority (51%) preferred a future enterprise with 10 or fewer employees. Overall, only 7% wanted to grow large enough to employ more than 100 persons. Much ink has been spilled on the complexities of local and place-based economies. Of course, local economies are never as local as we think they are. Our findings here, however, indicate that going local is more than a romantic ideal. PMC respondents sourced 51% of their materials, did 95% of all final product assembly, and marketed 47% of their products within the Portland region. This affirmation of the local indicates that “Portland Made” has real meaning for members of the Collective. Overall, we feel comfortable concluding that PMC members have indeed generated something of a distinctive local economy. While such a finding is nuanced – for example, PMC members are still a small segment of Portland’s regional economy – it does confirm two major points: first, that PMC members generally practice what they preach, and second, that “local” can be done effectively and intentionally. Makers love the central city. Using an enhanced database with 476 unique street addresses, we created a Makerverse heatmap that dramatically illustrates the intense clustering of makers and maker-enablers in the West End/Downtown/Pearl District, the Tillamook/Interstate Corridor including Mississippi Avenue, the Alberta Arts District, and especially the Central Eastside. The clustering of maker enterprises is a valuable asset for makers and maker-enablers as well as those who seek their products. In interviews, makers identified proximate access to the maker ecosystem as important for inspiration, problem solving, resource exchange, marketing opportunities, and a way to benefit from the collectively created Portland Made identity. For locals and travelers who want to participate in the Portland Made scene, Portland’s reputation for a vibrant street life and small scale accessible venues where artisan wares are produced and sold is an attraction and amenity that must be preserved. As anyone involved in the maker ecosystem knows, the Makerverse is under severe pressure from real estate development and urban growth. Sixty-four percent (64%) of respondents anticipate that workspace affordability will be an important or the most important challenge in the future, up from 51% who currently think it is an important/most important challenge. At a time when Portland’s manufacturing space is being threatened by rising ground rents, however, we think the need for data such as those discussed above is critical. Even a small amount of data – the survey was barely 30 questions – can result in significant new ways to understand the impacts, challenges, and needs of Portland’s small manufacturers. We conclude that support for an annual survey that collects these data and can comparatively analyze such data longitudinally is a paramount concern.

Portland Made Collective – Survey Results 2015 – Page 31
Appendix Portland Made Collective - Second Annual Member Survey Welcome [name]. Please review the consent information below. You have been invited to participate in this study based on your membership in the Portland Made Collective. Your participation is completely voluntary. All data will be securely stored, and all respondents will remain anonymous. In all publications and presentations, data will be reported in such a way that keeps sensitive information about you and your enterprise anonymous. If you have any questions regarding the research, please contact Charles Heying, [email protected]. If you have concerns about your rights as a research subject, please contact PSU Office of Research Integrity, phone (503) 725-2227. By taking this survey you indicate that you understand the above information and agree to take part in this study.
Your Name (1) Name of enterprise (11) Address of enterprise (12) Zip (18) Web address (4) Preferred phone (5) Preferred email (6) Years in operation (7) Primary product or service (8)
Including yourself, how many workers do you employ? ______ Full Time (1) ______ Part Time (2) On a scale of 1 to 5, how well does each of the following describe you?
1 (1) 2 (2) 3 (3) 4 (4) 5 (5)
Artisan (1)
Entrepreneur (2)
Maker (3)
Business Person (4) What is the range of your annual revenue? 0 - 20,000 (1) 20,000 - 50,000 (2) 50,000 - 100,000 (3) 100,000 - 500,000 (4) 500,000 - 1 million (5) 1 million - 5 million (6) 5 million – 50 million (7) 50 million – 100 million (8) 100 million + (9)

Portland Made Collective – Survey Results 2015 – Page 32
What percentage did your annual revenues grow... ? (if negative, enter negative number) ______ Last Year (2014) (1) ______ Two Years Ago (2013) (2) How do you sell your product/service?
None (1) Some (2) Most (3) All (4)
Wholesale (1)
Contract / subcontract (5)
Direct to retail (2)
Direct to customer (6) When you sell direct to a customer, where do you sell?
None (1) Some (2) Most (3) All (4)
Craft fairs/farmer's markets (1)
Order-based (web, phone, etc.) (2)
Web-based shop (Etsy, Amazon, etc.) (3)
Retail shop (5)
Other (4) What percentage of your market is in...
Combined answers should be = 100% (1)
Portland Metro (1)
Northwest (outside Portland Metro) (2)
USA (outside Northwest) (3)
International (4) What percentage of your total sales are web based?
Web-based (1)

Portland Made Collective – Survey Results 2015 – Page 33
Where does your enterprise work get done?
None (2) Some (3) Most (4) All (5)
Home (1)
Commercial/industrial space (4)
Office (3)
Collaborative work space (5)
Makerspace (6)
On site (7)
Third spaces (coffee shops, libraries, pubs) (8)
Other (2) What percentage of your materials, supplies, and components are sourced...
Combined answers should be = 100% (1)
Within the Portland region (1)
Outside the Portland region (2) What percentage of your product/service is created, built, or assembled...
Combined answers should be = 100% (1)
In house (1)
By contract - within Portland region (2)
By contract - outside Portland region (3) In comparison to other challenges that your enterprise faces, how important is the affordability of your current location? Minor challenge (1) Moderate challenge (2) Important challenge (3) Most important challenge (4)
In the future, do you think that maintaining an affordable location for your enterprise will be a concern that is… ? Minor challenge (1) Moderate challenge (2) Important challenge (3) Most important challenge (4)

Portland Made Collective – Survey Results 2015 – Page 34
How would you describe the work process of your enterprise?
None (1) Some (2) Most (3) All (4)
Large batch, long run, standardized product/service (1)
Small batch, short run, flexible product/service (2)
Custom, on demand product/service (3)
Hand made, autonomous design, one off product/service (4)
As you look to the future, what is the ideal operational size of your enterprise? Self employed, autonomous, no employees (1) Small scale, owner-operated, 10 employees or less (2) Medium scale, owner-operated, 10 -100 employees (3) Large scale, owner-operated, 100 plus employees (4) Large scale, publicly traded, stockholder owned, 100 plus employees (5) As a member of the Portland Made Collective, how important are the following?
Not that Important (1)
Somewhat Important (2)
Important (3) Very Important (4)
Electronic forum (e.g.google group) to connect with members for business collaboration etc. (1)
Expand your networks through member events. (2)
Targeted workshops (e.g. real estate, marketing, finance, etc.) (3)
Brand your products (stickers, hang tags, etc) (4)
Post premium content (text, videos) on PMC site. (5)
Opportunity to advertise on PMC site. (6)
PMC/Supportland rewards card. (7)
Other (8) Would you be willing to do a follow-up interview? Yes (1) No (2) Are there any comments you would like to add? Thank you! To complete the survey, click the "SUBMIT" button to the lower right.