REPORT OF JANUARY 2015 VAPOR INTRUSION MONITORING ...
100
REPORT OF JANUARY 2015 VAPOR INTRUSION MONITORING (“Springs Area” Residences) CTS OF ASHEVILLE, INC. SUPERFUND SITE 235 Mills Gap Road Asheville, Buncombe County, North Carolina EPA ID: NCD003149556 CERCLA Docket No. CERCLA-04-2012-3762 Prepared for: CTS Corporation 2375 Cabot Drive Lisle, Illinois 60532 Prepared by: Amec Foster Wheeler Environment & Infrastructure, Inc. 1308 Patton Avenue Asheville, North Carolina 28806 Amec Foster Wheeler Project 6252-12-0006 March 6, 2015
Transcript of REPORT OF JANUARY 2015 VAPOR INTRUSION MONITORING ...

REPORT OF JANUARY 2015 VAPOR INTRUSION MONITORING (“Springs Area” Residences)
CTS OF ASHEVILLE, INC. SUPERFUND SITE 235 Mills Gap Road
Asheville, Buncombe County, North Carolina EPA ID: NCD003149556
CERCLA Docket No. CERCLA-04-2012-3762
Prepared for:
CTS Corporation 2375 Cabot Drive
Lisle, Illinois 60532
Prepared by:
Amec Foster Wheeler Environment & Infrastructure, Inc. 1308 Patton Avenue
Asheville, North Carolina 28806
Amec Foster Wheeler Project 6252-12-0006
March 6, 2015
RSASKOWS
REDACTED

CTS of Asheville, Inc. Superfund Site Report of January 2015 Vapor Intrusion Monitoring (“Springs Area” Residences) Amec Foster Wheeler Project 6252-12-0006 March 6, 2015
i
TABLE OF CONTENTS
List of Tables ........................................................................................................................ ii List of Figures ....................................................................................................................... ii List of Appendices ................................................................................................................ ii List of Acronyms ................................................................................................................... ii EXECUTIVE SUMMARY ..................................................................................................... I
1.0 INTRODUCTION .......................................................................................................... 1
1.1 Site Description ..................................................................................................... 1 1.2 Site Operational History ........................................................................................ 2 1.3 Previous Environmental Investigations ................................................................. 2
1.3.1 December 2007 and August 2008 Air Sampling ....................................... 3 1.3.2 October 2012 Air Sampling ....................................................................... 4 1.3.3 April 2014 Air Sampling ............................................................................. 4 1.3.4 June 2014 Air Sampling ............................................................................ 5 1.3.5 October and November 2014 Air Sampling ............................................... 6
1.4 Objective of the Vapor Intrusion Monitoring .......................................................... 6
2.0 VAPOR INTRUSION MONITORING ACTIVITIES ....................................................... 7
2.1 Sampling Activities ................................................................................................ 7 2.1.1 Access to Sample Off-Site Properties ....................................................... 7 2.1.2 Crawlspace and Indoor Sample Locations ................................................ 7 2.1.3 Ambient Air Sample Locations .................................................................. 9 2.1.4 Sample Collection ..................................................................................... 9
2.2 Analysis of Air Samples ...................................................................................... 10
3.0 ANALYTICAL RESULTS AND DATA USABILITY ................................................... 11
3.1 Data Validation .................................................................................................... 11 3.2 Data Usability Summary ...................................................................................... 11
4.0 INDOOR AIR SCREENING-LEVEL RISK EVALUATION ......................................... 13
4.1 Exposure Assessment ........................................................................................ 13 4.2 Toxicity Assessment ........................................................................................... 13 4.3 Risk Characterization .......................................................................................... 15 4.4 Uncertainty Analysis ............................................................................................ 16 4.5 Comparison to Previous Air Investigations ......................................................... 17
5.0 DISCUSSION AND CONCLUSIONS ......................................................................... 18
6.0 REFERENCES ........................................................................................................... 20
CTS of Asheville, Inc. Superfund Site Report of January 2015 Vapor Intrusion Monitoring (“Springs Area” Residences) Amec Foster Wheeler Project 6252-12-0006 March 6, 2015
ii
LIST OF TABLES
1 Summary of Air Samples and Sampling Conditions – January 2015 2 Summary of January 2015 and Historical Laboratory Analytical Results with Risk Assessment Evaluation Summary
LIST OF FIGURES
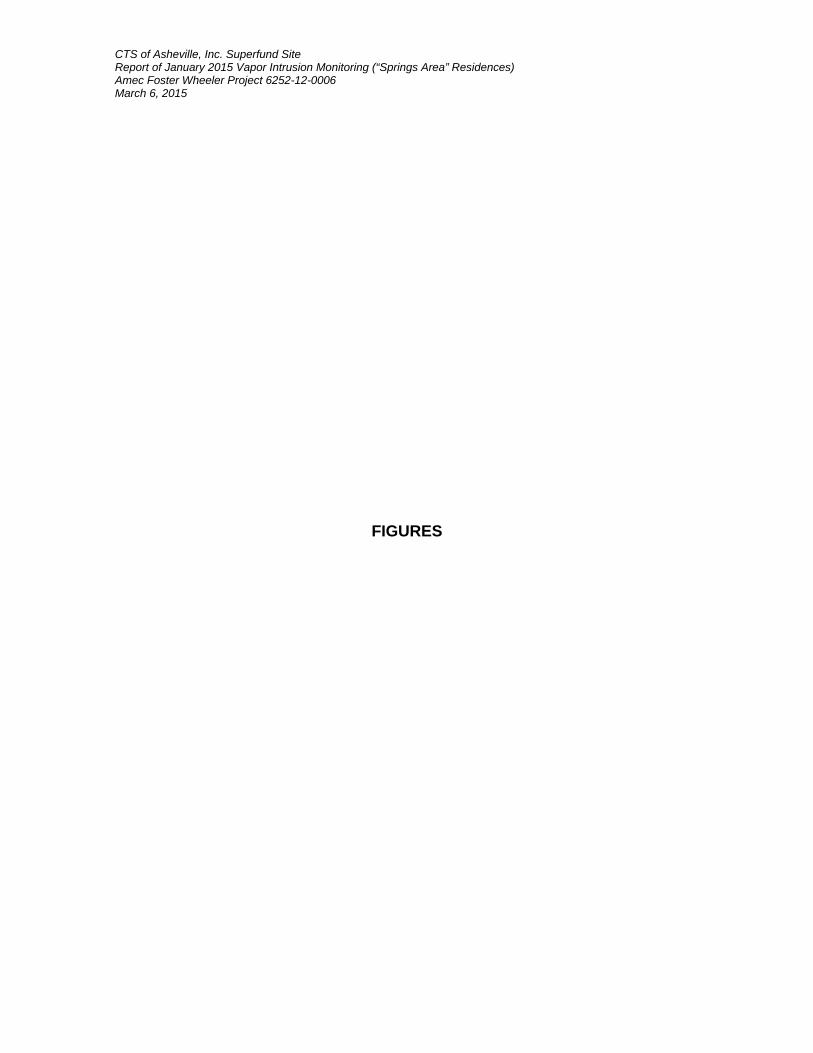
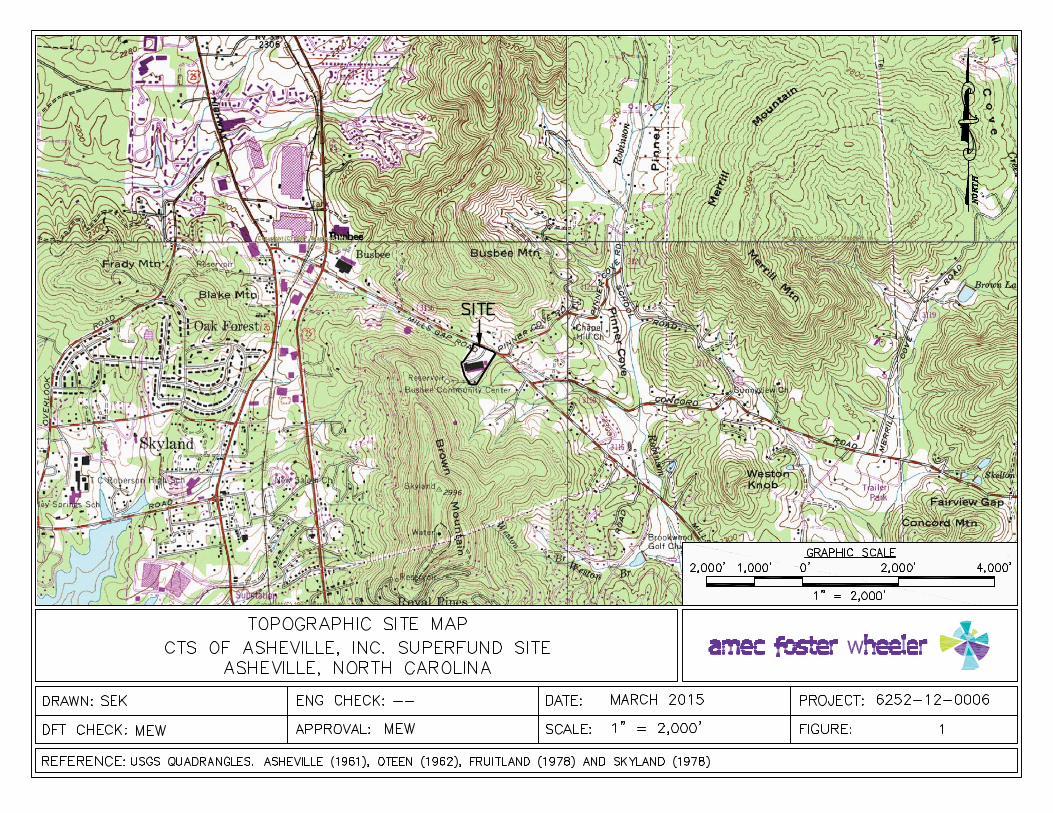
1 Topographic Site Map 2 Site Map 3 Air Sample Locations
LIST OF APPENDICES
A Photographs of Sampling Activities B Logbook and Field Data Records C Laboratory Individual Certification Documents D Laboratory Analytical Report E Data Validation F Risk Assessment Calculation Tables
LIST OF ACRONYMS
cis-1,2-DCE cis-1,2-dichloroethene COPC constituent of potential concern HI Hazard Index IRIS Integrated Risk Information System MDL method detection limit g/m3 micrograms per cubic meter MGRA Mills Gap Road Associates NHL non-Hodgkin lymphoma PID photoionization detector RfC reference concentration RSL Regional Screening Level SIM selective ion monitoring trans-1,2-DCE trans-1,2-dichloroethene TCE trichloroethene (also, trichloroethylene) USEPA United States Environmental Protection Agency VI vapor intrusion VISL Vapor Intrusion Screening Level VOC volatile organic compound

CTS of Asheville, Inc. Superfund Site Report of January 2015 Vapor Intrusion Monitoring (“Springs Area” Residences) Amec Foster Wheeler Project 6252-12-0006 March 6, 2015
I
EXECUTIVE SUMMARY
Amec Foster Wheeler Environment & Infrastructure, Inc. (Amec Foster Wheeler), on behalf of CTS Corporation, has prepared this Report of January 2015 Vapor Intrusion Monitoring (“Springs Area” Residences; VI Report) for the CTS of Asheville, Inc. Superfund Site (Site). This VI Report describes work conducted in accordance with the Supplement to Vapor Intrusion Assessment Work Plan, Revision 4 (VI Work Plan), dated June 11, 2014 (Amec Foster Wheeler, 2014), which was conditionally-approved by the United States Environmental Protection Agency (USEPA) in a letter dated June 13, 2014. The schedule and sampling locations for this monitoring event were described in the Springs Removal Action Work Plan, dated September 2, 2014, which was approved with modifications by USEPA on September 9, 2014. The vapor intrusion monitoring was conducted pursuant to Section 1.3.4 of the Scope of Work contained in Appendix A of the Administrative Settlement Agreement and Order on Consent for Remedial Investigation/Feasibility Study (Settlement Agreement) between the USEPA and CTS Corporation (effective date January 26, 2012). This VI Report describes the activities that were undertaken to monitor vapor intrusion at residences located east of the Site. The objective of this VI monitoring was to monitor Site-related volatile organic compounds (VOCs) at three residences located east of the Site. In its letter of September 19, 2014, USEPA approved with modifications the Springs Removal Action Work Plan, which indicated monthly air sampling at the three residences adjacent to the springs east of the Site for a period of three months and quarterly thereafter. The detected analytes were compared to risk-based screening values to determine the potential for the occurrence of vapor intrusion to pose a potential risk to the residential receptors. Previous investigations have identified VOCs at the Site, primarily trichloroethene (TCE). The TCE groundwater plume generally extends from the area of the former facility to areas east and west of the Site, coincident with the direction of shallow groundwater flow. Groundwater discharge zones are located east and west of the Site at seeps and springs. Unnamed tributaries form at these seep/spring areas and flow topographically away from those areas. Indoor and crawlspace air samples were collected at three residences located east of the Site. Ambient air samples were collected between the seep/spring area and the indoor/crawlspace sample locations. The air samples were submitted for Site-specific VOCs according to USEPA Method TO-15 SIM (selective ion monitoring). The data collected for the monitoring are considered 100 percent complete and usable for meeting the objectives presented in the VI Work Plan and the Supplemental VI Work Plan. Concentrations of TCE and cis-1,2-dichloroethene were detected in the collected air samples. Concentrations above the method detection limit and estimated concentrations (i.e., above the method detection limit, but below the laboratory reporting limit) of trans-1,2-dichloroethene and vinyl chloride were detected in the air samples. Concentrations of detected constituents during this VI monitoring are generally less than those constituent concentrations detected during previous sampling events conducted by USEPA and Amec Foster Wheeler. Concentrations of the four detected volatile compounds were compared to USEPA risk-based screening levels for residential indoor air. Only TCE exceeded the screening
CTS of Asheville, Inc. Superfund Site Report of January 2015 Vapor Intrusion Monitoring (“Springs Area” Residences) Amec Foster Wheeler Project 6252-12-0006 March 6, 2015
II
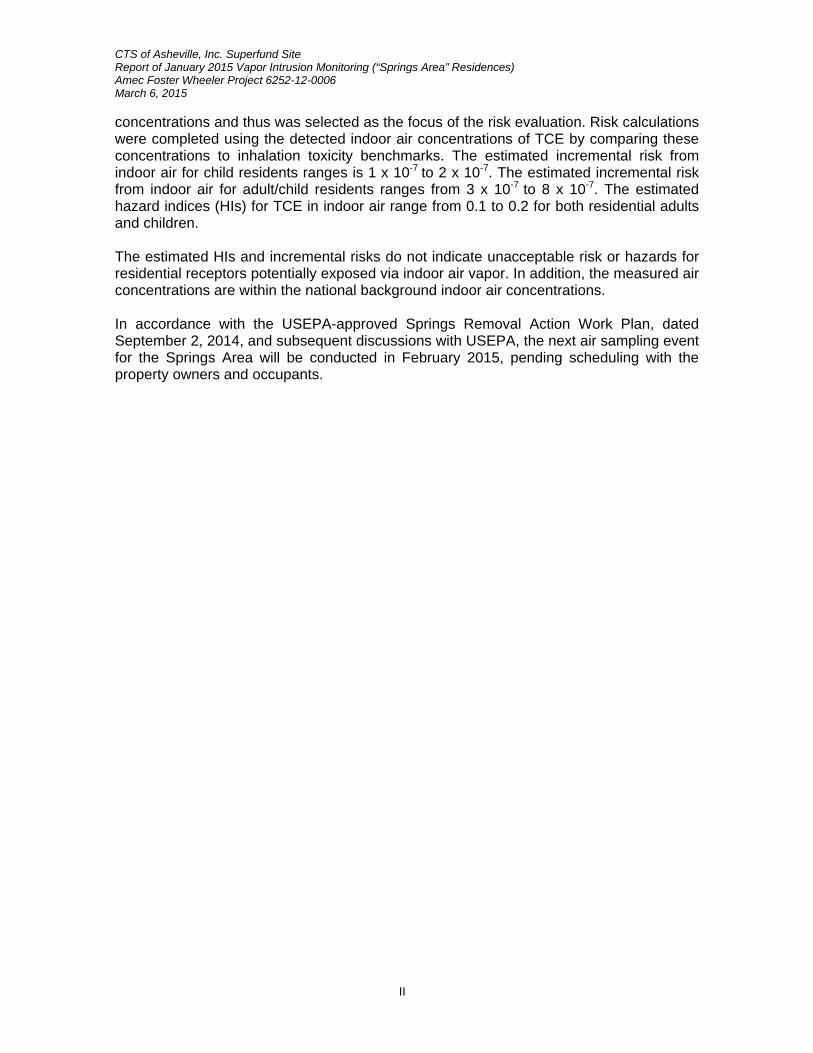
concentrations and thus was selected as the focus of the risk evaluation. Risk calculations were completed using the detected indoor air concentrations of TCE by comparing these concentrations to inhalation toxicity benchmarks. The estimated incremental risk from indoor air for child residents ranges is 1 x 10⁻⁷ to 2 x 10⁻⁷. The estimated incremental risk from indoor air for adult/child residents ranges from 3 x 10⁻⁷ to 8 x 10⁻⁷. The estimated hazard indices (HIs) for TCE in indoor air range from 0.1 to 0.2 for both residential adults and children. The estimated HIs and incremental risks do not indicate unacceptable risk or hazards for residential receptors potentially exposed via indoor air vapor. In addition, the measured air concentrations are within the national background indoor air concentrations. In accordance with the USEPA-approved Springs Removal Action Work Plan, dated September 2, 2014, and subsequent discussions with USEPA, the next air sampling event for the Springs Area will be conducted in February 2015, pending scheduling with the property owners and occupants.

CTS of Asheville, Inc. Superfund Site Report of January 2015 Vapor Intrusion Monitoring (“Springs Area” Residences) Amec Foster Wheeler Project 6252-12-0006 March 6, 2015
1
1.0 INTRODUCTION
Amec Foster Wheeler Environment & Infrastructure, Inc. (Amec Foster Wheeler), on
behalf of CTS Corporation, has prepared this Report of January 2015 Vapor Intrusion
Monitoring (“Springs Area” Residences; VI Report) for the CTS of Asheville, Inc.
Superfund Site (Site). This VI Report describes work conducted in accordance with the
Supplement to Vapor Intrusion Assessment Work Plan, Revision 4 (VI Work Plan), dated
June 11, 2014 (Amec Foster Wheeler, 2014), which was conditionally approved by the
United States Environmental Protection Agency (USEPA) in a letter dated June 13, 2014.
The schedule and sampling locations for this monitoring event were described in the
Springs Removal Action Work Plan, dated September 2, 2014, which was approved with
modifications by USEPA on September 9, 2014. The vapor intrusion monitoring was
conducted pursuant to Section 1.3.4 of the Scope of Work contained in Appendix A of the
Administrative Settlement Agreement and Order on Consent for Remedial
Investigation/Feasibility Study (Settlement Agreement) between the USEPA and CTS
Corporation (effective date January 26, 2012). This VI Report describes the activities that
were undertaken to monitor vapor intrusion at residences located east of the Site in the
“Springs Area”.
1.1 SITE DESCRIPTION
The Site is approximately nine acres on Mills Gap Road in Asheville, Buncombe County,
North Carolina and the areal extent of the contamination. The approximate center of the
Site is located at north latitude 35°29’36” and west longitude 82°30’25” (Figure 1). The
Site formerly contained an approximate 95,000-square foot, single-story brick and metal
structure in the southern portion of the Site (Figure 2). The building was demolished in
December 2011 and the concrete building pad remains intact. The northeastern portion of
the Site contains an asphalt-paved parking area and asphalt-paved driveways are located
parallel to the north (front) of the former building and southeast (rear) of the former
building. A six-foot high chain-link fence surrounds the Site and a locked gate at the north
end of the Site controls access to the Site from Mills Gap Road. The Site is unoccupied.
CTS of Asheville, Inc. Superfund Site Report of January 2015 Vapor Intrusion Monitoring (“Springs Area” Residences) Amec Foster Wheeler Project 6252-12-0006 March 6, 2015
2
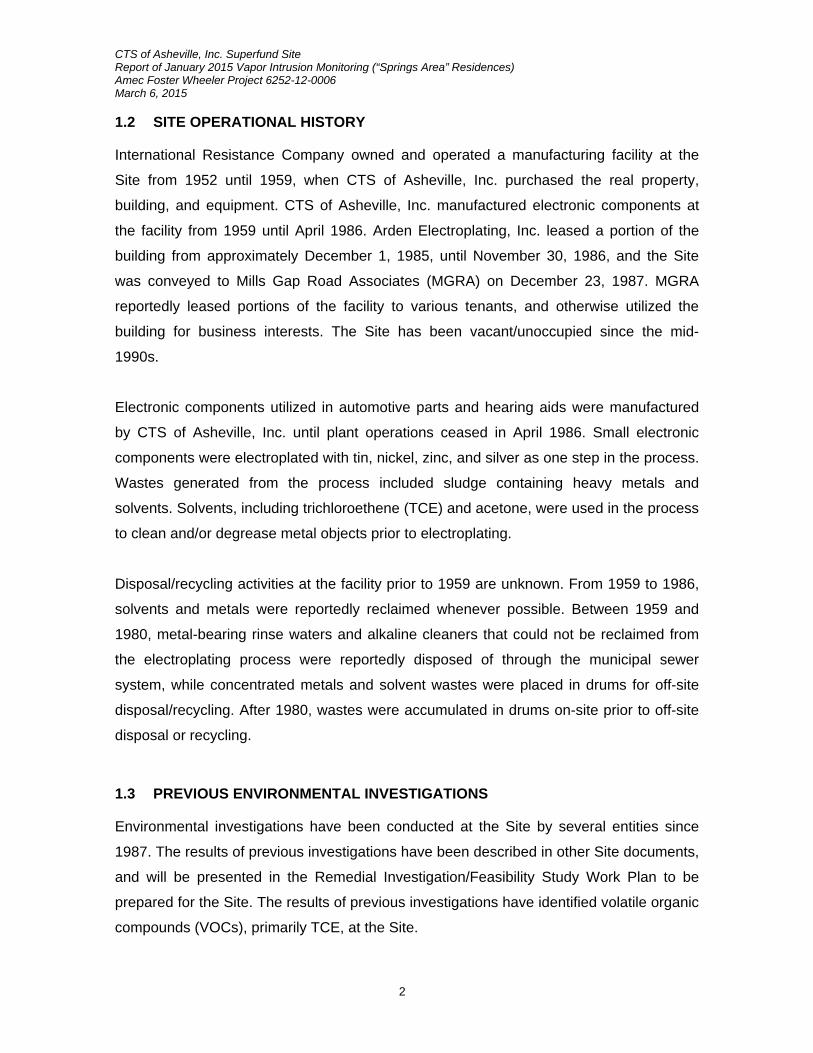
1.2 SITE OPERATIONAL HISTORY
International Resistance Company owned and operated a manufacturing facility at the
Site from 1952 until 1959, when CTS of Asheville, Inc. purchased the real property,
building, and equipment. CTS of Asheville, Inc. manufactured electronic components at
the facility from 1959 until April 1986. Arden Electroplating, Inc. leased a portion of the
building from approximately December 1, 1985, until November 30, 1986, and the Site
was conveyed to Mills Gap Road Associates (MGRA) on December 23, 1987. MGRA
reportedly leased portions of the facility to various tenants, and otherwise utilized the
building for business interests. The Site has been vacant/unoccupied since the mid-
1990s.
Electronic components utilized in automotive parts and hearing aids were manufactured
by CTS of Asheville, Inc. until plant operations ceased in April 1986. Small electronic
components were electroplated with tin, nickel, zinc, and silver as one step in the process.
Wastes generated from the process included sludge containing heavy metals and
solvents. Solvents, including trichloroethene (TCE) and acetone, were used in the process
to clean and/or degrease metal objects prior to electroplating.
Disposal/recycling activities at the facility prior to 1959 are unknown. From 1959 to 1986,
solvents and metals were reportedly reclaimed whenever possible. Between 1959 and
1980, metal-bearing rinse waters and alkaline cleaners that could not be reclaimed from
the electroplating process were reportedly disposed of through the municipal sewer
system, while concentrated metals and solvent wastes were placed in drums for off-site
disposal/recycling. After 1980, wastes were accumulated in drums on-site prior to off-site
disposal or recycling.
1.3 PREVIOUS ENVIRONMENTAL INVESTIGATIONS
Environmental investigations have been conducted at the Site by several entities since
1987. The results of previous investigations have been described in other Site documents,
and will be presented in the Remedial Investigation/Feasibility Study Work Plan to be
prepared for the Site. The results of previous investigations have identified volatile organic
compounds (VOCs), primarily TCE, at the Site.

CTS of Asheville, Inc. Superfund Site Report of January 2015 Vapor Intrusion Monitoring (“Springs Area” Residences) Amec Foster Wheeler Project 6252-12-0006 March 6, 2015
3
Although the shallow/overburden TCE groundwater plume has not been completely
delineated, the plume is expected to terminate near or slightly beyond the seep/spring
areas east and west of the Site. Volatilization of TCE and degradation products from the
groundwater plume represents a potential pathway for vapor intrusion into residential
structures located in the vicinity of the groundwater plume. The surface waters that
emanate from the springs east and west of the Site contain TCE; therefore the
volatilization of TCE from the surface waters is a potential pathway affecting ambient air in
the vicinity of the surface waters.
Soil contamination associated with the Site has not been identified on adjacent properties;
therefore, volatilization of constituents from soil contamination is not expected to
contribute to vapor intrusion into residences located adjacent to the Site property. As
summarized in Section 1.3.1 below, air sampling has been conducted in the vicinity of the
Site and has included sampling of soil gas, crawlspace air, indoor air and ambient/outside
air.
1.3.1 December 2007 and August 2008 Air Sampling
The USEPA and their subcontractors conducted air sampling in the vicinity of the Site in
December 2007. The sampling included 10 subslab and 12 crawlspace air samples
collected from 22 residences, as well as ambient air and ‘slam bar’ soil gas samples (T N
& Associates, 2008).
A Trace Atmospheric Gas Analyzer (TAGA) was also used to screen air quality in the
vicinity of the Site. TCE was detected in crawlspace air samples collected at residences
located on properties adjacent to the Site at concentrations ranging from an estimated
concentration of 0.243 micrograms per cubic meter (g/m3) at (west of
Site) to 20.3 g/m3 at (east of Site). Concentrations of detected
constituents in the subslab and crawlspace air samples were not above applicable
removal action levels.
In August 2008, USEPA and their subcontractors collected five crawlspace air samples,
two indoor air samples, and one soil gas sample (as well as ambient and duplicate air
samples) from six residences in the area of the Site (T N & Associates, 2009). TCE was
(b) (6)
(b) (6)
CTS of Asheville, Inc. Superfund Site Report of January 2015 Vapor Intrusion Monitoring (“Springs Area” Residences) Amec Foster Wheeler Project 6252-12-0006 March 6, 2015
4
detected in crawlspace air samples collected at residences located on properties adjacent
to the Site at concentrations ranging from an estimated concentration of 1.15 g/m3 at
(west of Site) to 7.41 g/m3 at (east of Site).
Concentrations of detected constituents in the air samples were not above USEPA’s
stated action levels.
Ambient air samples were collected during the aforementioned sampling events.
Concentrations of TCE detected in the ambient air samples were highest near the
seep/spring areas. The concentration of TCE in the vicinity of the springs east of the Site
during the August 2008 air sampling event was 1,490 g/m3 and the concentration of TCE
in the vicinity of the spring(s) west of the Site during the August 2008 air sampling event
was 5.24 g/m3 (T N & Associates, 2009). The concentrations of TCE detected in other
ambient air samples decreased with distance from the seep/spring areas.
1.3.2 October 2012 Air Sampling
Section 1.3.4 of the Settlement Agreement Scope of Work requires an evaluation of vapor
intrusion at residences immediately contiguous to the Site and/or proximate to the
currently known groundwater plume. Air samples were collected at properties west of the
Site in October 2012. Access to properties east of the Site had not been obtained at the
time of the October 2012 sampling event.
Concentrations of TCE, cis-1,2-dichloroethene, and/or vinyl chloride were detected in the
collected air samples. Concentrations of detected constituents were generally similar to or
slightly less than constituent concentrations detected during previous sampling events
conducted by USEPA and its contractors. A screening-level risk assessment was
conducted using the detected TCE concentrations. The calculated Hazard Indices and
incremental risks did not indicate unacceptable risks or hazards for potential residential
receptors.
1.3.3 April 2014 Air Sampling
Air samples were collected at properties east of the Site in April 2014. Concentrations of
TCE and cis-1,2-DCE were detected in the collected air samples. Concentrations of trans-
1,2-dichloroethene (trans-1,2-DCE) and vinyl chloride were estimated (i.e., above the
(b) (6)
(b) (6) (b) (6)

CTS of Asheville, Inc. Superfund Site Report of January 2015 Vapor Intrusion Monitoring (“Springs Area” Residences) Amec Foster Wheeler Project 6252-12-0006 March 6, 2015
5
method detection limit, but below the laboratory reporting limit) in several air samples.
Concentrations of detected constituents during the April 2014 VI assessment are
generally similar to (i.e., within the same order of magnitude) those constituent
concentrations detected during previous sampling events conducted by USEPA and its
contractors.
Concentrations of TCE detected in the crawlspace and indoor air at
were similar to the associated ambient air samples. The indoor and crawlspace
concentrations of TCE detected at were elevated with respect to TCE
detected in the associated adjacent ambient air samples. The cis-1,2-DCE to TCE ratio for
the air samples collected at indicated a different biodegradation
pattern than other air samples collected during the investigation, indicating a separate
distinct source of TCE inside the residence. The source of the TCE
concentrations in crawlspace and indoor air at is not known; however,
the source is not considered to be ambient air in the vicinity of the residence and is not a
result of vapor intrusion from the ground.
A screening-level risk assessment was conducted using the detected TCE concentrations.
The calculated Hazard Indices and incremental risks indicated unacceptable risks or
hazards for potential residential receptors.
1.3.4 June 2014 Air Sampling
In an email dated June 6, 2014, USEPA required additional air sampling at residences
located further east of the Site based on the results of the April 2014 air sampling event.
Air samples were collected from in and/or near eight residences east of the Site.
Concentrations of TCE and cis-1,2-DCE were detected in the collected air samples.
Estimated concentrations of trans-1,2-DCE and vinyl chloride were detected in several air
samples. Concentrations of detected constituents were generally similar to those
constituent concentrations detected during previous sampling events conducted by
USEPA and its contractors. A screening-level risk assessment was conducted using the
detected TCE concentrations. The calculated Hazard Indices and incremental risks did not
indicate unacceptable risks or hazards for potential residential receptors.
(b) (6)(b) (6)
(b) (6)
(b) (6)
(b) (6)(b) (6)
CTS of Asheville, Inc. Superfund Site Report of January 2015 Vapor Intrusion Monitoring (“Springs Area” Residences) Amec Foster Wheeler Project 6252-12-0006 March 6, 2015
6
1.3.5 October and November 2014 Air Sampling
Air samples were collected from in and/or near the eleven residences east of the Site
where samples were collected in April and June 2014. A springs area removal action,
consisting of installation of a Springs Vapor Removal and Capture System, was
completed in October 2014. Concentrations of TCE and cis-1,2-DCE were detected in the
air samples collected in October and November 2014. Concentrations above the method
detection limit and estimated concentrations (i.e., above the method detection limit, but
below the laboratory reporting limit) of trans-1,2-DCE and vinyl chloride were detected in
some of the air samples. Concentrations of detected constituents were less than those
constituent concentrations detected during previous sampling events conducted by
USEPA contractors and Amec Foster Wheeler. Screening-level risk assessments were
conducted using the detected TCE concentrations. The calculated Hazard Indices and
incremental risks did not indicate unacceptable risks or hazards for potential residential
receptors.
1.4 OBJECTIVE OF THE VAPOR INTRUSION MONITORING
The objective of this January 2015 air sampling, as proposed in the Supplemental VI Work
Plan and as directed by USEPA, was to monitor site-related VOCs at residences located
east of the Site in the springs area. In its letter of September 19, 2014, USEPA approved
with modifications the Springs Removal Action Work Plan, which indicated monthly air
sampling at the residences adjacent to the springs for a period of three months and
quarterly thereafter upon completion of the Springs Vapor Removal and Capture System.
This monitoring event, the second conducted after completion of the springs removal
action, was performed to determine if concentrations of Site-related VOCs were present in
indoor air and crawlspaces at the residences. The detected concentrations, if any, were
compared to risk-based screening values to indicate the potential for the occurrence of
vapor intrusion to pose a potential risk to the residential receptors.

CTS of Asheville, Inc. Superfund Site Report of January 2015 Vapor Intrusion Monitoring (“Springs Area” Residences) Amec Foster Wheeler Project 6252-12-0006 March 6, 2015
7
2.0 VAPOR INTRUSION MONITORING ACTIVITIES
The VI monitoring was conducted in accordance with the USEPA-approved Supplement
to VI Work Plan. The collected air samples were analyzed for TCE, which is the primary
volatile constituent known to be present in groundwater associated with the Site, as well
as for compounds that are degradation products of TCE.
2.1 SAMPLING ACTIVITIES
Sampling activities were conducted on January 13 and 14, 2015. A USEPA representative
accompanied Amec Foster Wheeler personnel during the sampling activities.
2.1.1 Access to Sample Off-Site Properties
Prior to the April 2014 sampling event, the USEPA sent access agreements to property
owners where air samples were proposed to be collected prior to initiating the air sampling
activities. The access agreements requested access for Amec Foster Wheeler and
USEPA personnel to enter the subject property for collection of air samples. Access
agreements were obtained from the owners of the following properties:
(Buncombe County PIN 9655-62-9768)
(Buncombe County PIN 9655-62-9768)
(Buncombe County PIN 9655-62-7448)
Property owners were notified by the USEPA of the date of the January 2015 sampling
activities and USEPA coordinated a time for the sample deployment/retrieval date and
time with each resident.
2.1.2 Crawlspace and Indoor Sample Locations
Prior to collecting interior air samples in April 2014, the interior of each residence to be
sampled was surveyed to collect information about the structure (e.g., configuration,
heating/cooling systems, etc.) and to assess factors that could influence the air sampling
results (e.g., products or chemicals containing VOCs). An Occupied Dwelling
Questionnaire was completed in coordination with the occupant of the residence. The
Questionnaires were included in the Vapor Intrusion Assessment:
, dated June 30, 2014.
(b) (6)
(b) (6)
(b) (6)
(b) (6)(b) (6)

CTS of Asheville, Inc. Superfund Site Report of January 2015 Vapor Intrusion Monitoring (“Springs Area” Residences) Amec Foster Wheeler Project 6252-12-0006 March 6, 2015
8
For this January 2015 VI monitoring event, indoor and crawlspace air samples were
collected from the following three residences, which are located east of the Site (Figure 3):
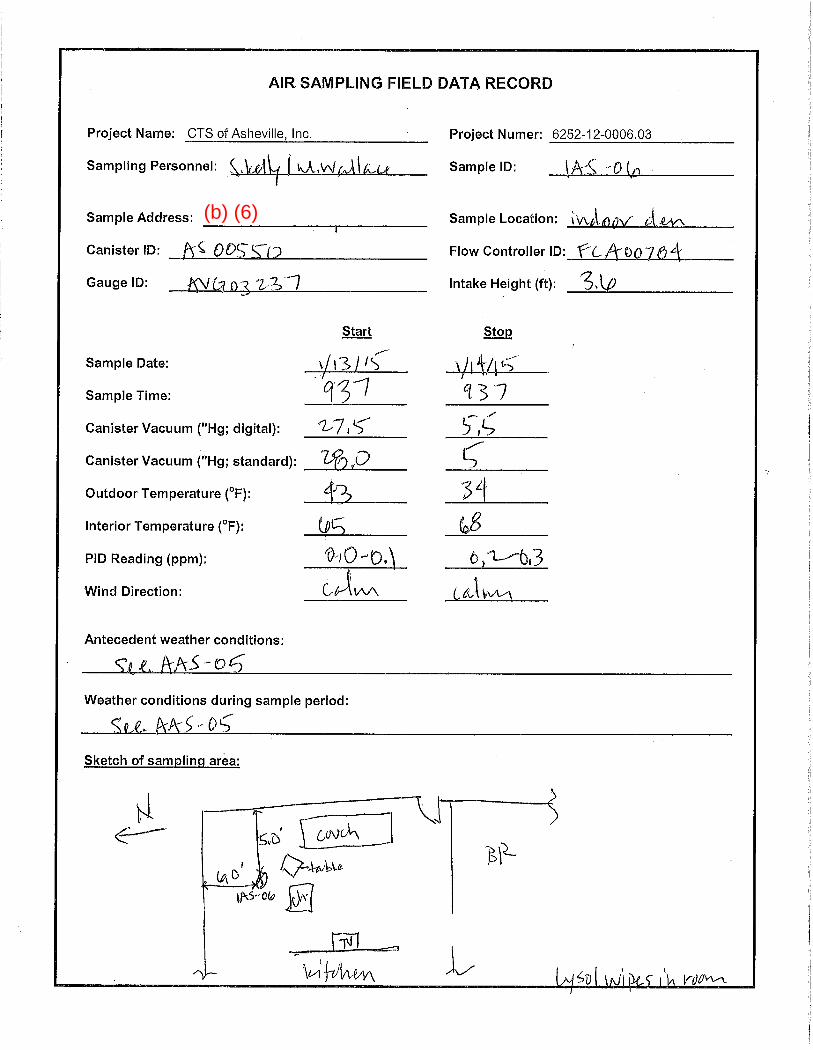
(sample IDs: IAS-06 and CAS-06)
(sample IDs: IAS-04 and CAS-04)
(sample IDs: IAS-05 and CAS-05)
The residence at is a one-story mobile home with a crawlspace. The
ground surface of the crawlspace is soil and is partially covered with a polyethylene
moisture barrier. Items or materials were not being stored in the crawlspace during the
sampling activities. The indoor air sample (IAS-06) was collected in the living room of the
residence and the crawlspace air sample (CAS-06) was collected in the northwest portion
of the crawlspace. A field duplicate sample (FD-15) was collected in series with IAS-06.
The residence at is a one-story mobile home with a crawlspace. The
ground surface of the crawlspace is soil and is partially covered with a polyethylene
moisture barrier. Building materials (e.g., siding material) were being stored in the
crawlspace during the sampling activities. The indoor air sample (IAS-04) was collected in
the living room of the residence and the crawlspace air sample (CAS-04) was collected in
the south-central portion of the crawlspace.
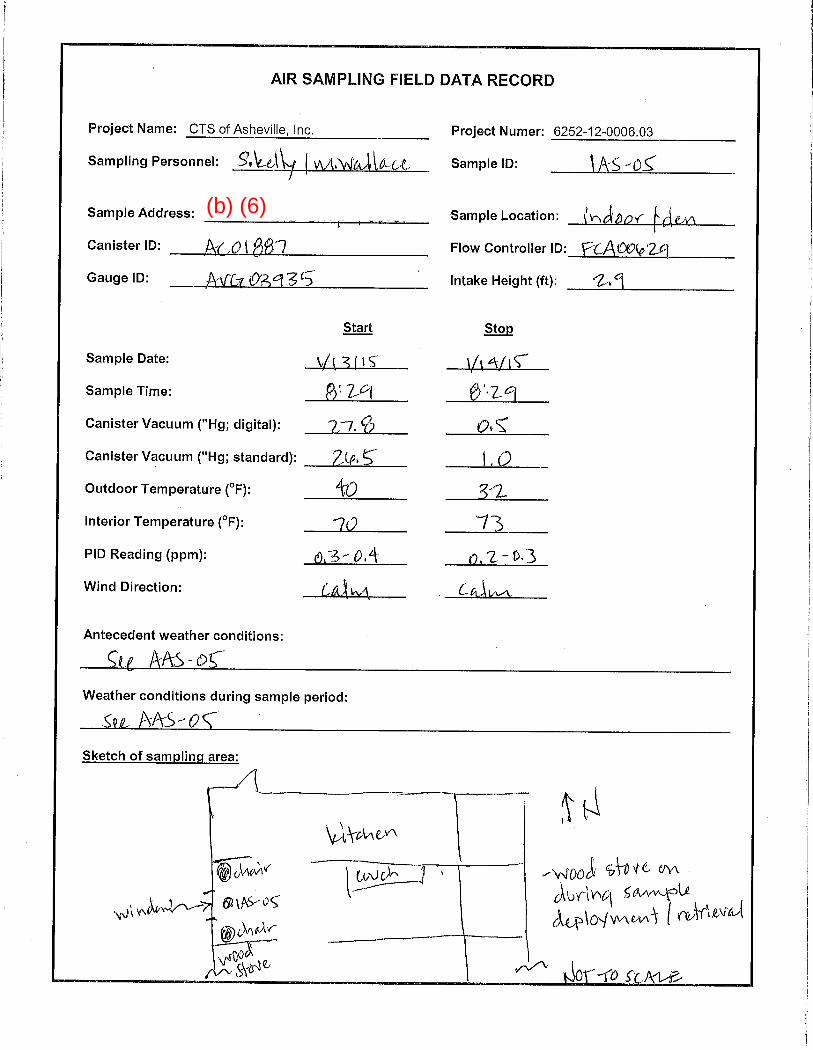
The residence at is a 1.5-story home with a crawlspace. The ground
surface of the crawlspace is soil and is partially covered with a polyethylene moisture
barrier. There were no items being stored in the crawlspace during the sampling activities.
A motorcycle was being stored in the living room area of the residence. A box with
containers of automotive and household cleaning products was located adjacent to the
motorcycle. The indoor air sample (IAS-05) was collected in the living room of the
residence and the crawlspace air sample (CAS-05) was collected in the south-central
portion of the crawlspace.
Photographs of the sampling areas are provided in Appendix A.
(b) (6)
(b) (6)
(b) (6)
(b) (6)
(b) (6)
(b) (6)
CTS of Asheville, Inc. Superfund Site Report of January 2015 Vapor Intrusion Monitoring (“Springs Area” Residences) Amec Foster Wheeler Project 6252-12-0006 March 6, 2015
9
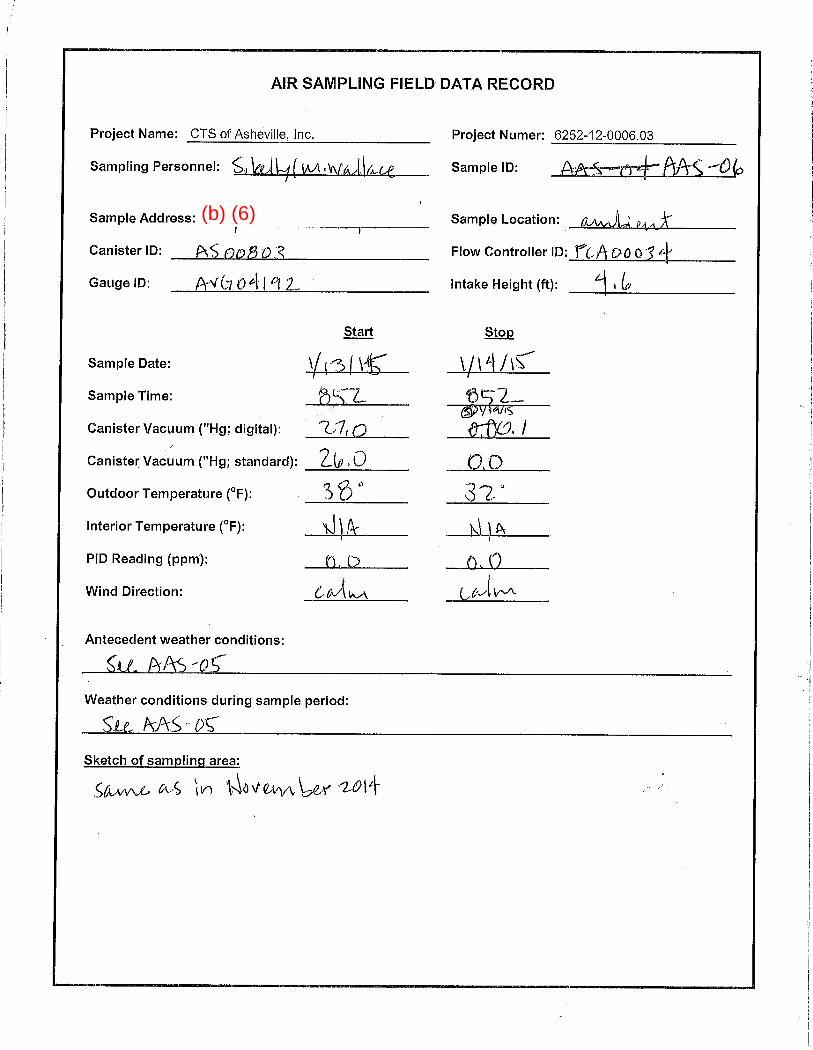
2.1.3 Ambient Air Sample Locations
Ambient air sample AAS-05 was collected at a location between the residence at
and the former spring/seep area to the northwest. Ambient air sample AAS-06
was collected at a location between the residences at and
the former spring/seep area to the south. A field duplicate sample (FD-14) was collected
in series with AAS-06.
Photographs of the sampling areas are provided in Appendix A.
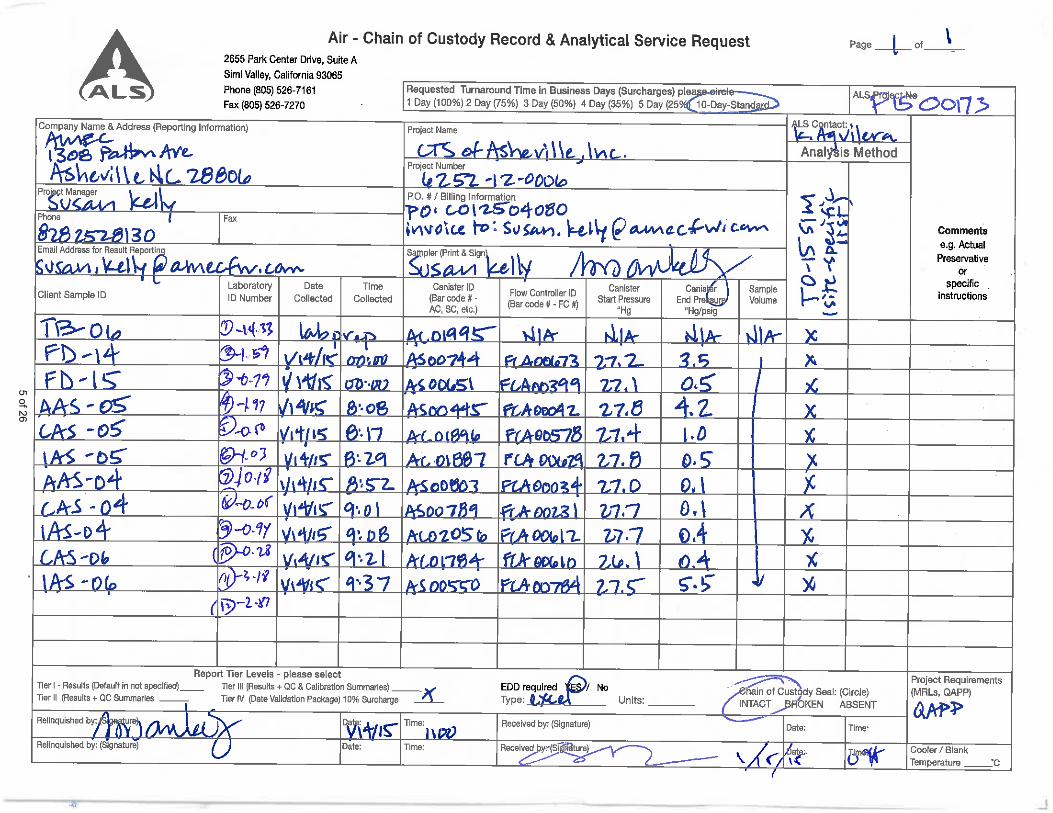
2.1.4 Sample Collection
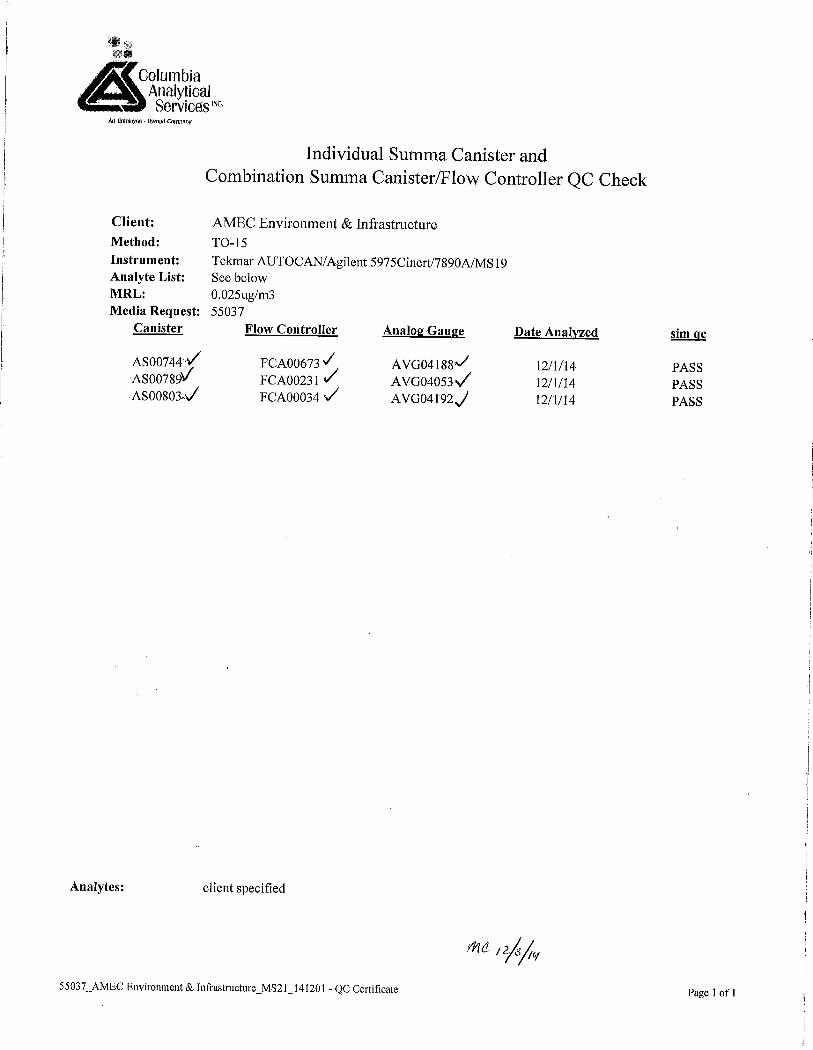
Air samples were collected using individually-certified, 6-Liter, electropolished, stainless
steel (SUMMA®) canisters. The canisters were equipped with individually-certified flow
controllers that were set to collect an air sample over a 24-hour period.
The indoor air sample canisters were placed on a plastic bucket on the floor surface for
sample collection. The sample inlet height was approximately three to four feet above the
floor surface.
The crawlspace air sample canisters were placed on the ground surface. The sample inlet
height at CAS-04 and CAS-06 was approximately two feet above ground surface. Sample
canister CAS-05 was placed in the approximate location as historic air samples collected
by USEPA, and the sample inlet height for sample CAS-05 was approximately five feet
above ground surface (i.e., the canister was placed on a ‘knee wall’ built in the
crawlspace).
The ambient air samples were secured to a metal fence post driven into the ground at the
sample locations. The sample inlet height ranged from approximately four to five feet
above ground surface.
Individually-certified vacuum gauges were attached to each canister and sample
personnel recorded vacuum gauge readings at the beginning and end of sample
collection. The air temperature also was recorded at the beginning and end of sample
collection (for indoor and crawlspace air samples, the indoor/crawlspace temperature and
(b) (6)(b) (6)
(b) (6)

CTS of Asheville, Inc. Superfund Site Report of January 2015 Vapor Intrusion Monitoring (“Springs Area” Residences) Amec Foster Wheeler Project 6252-12-0006 March 6, 2015
10
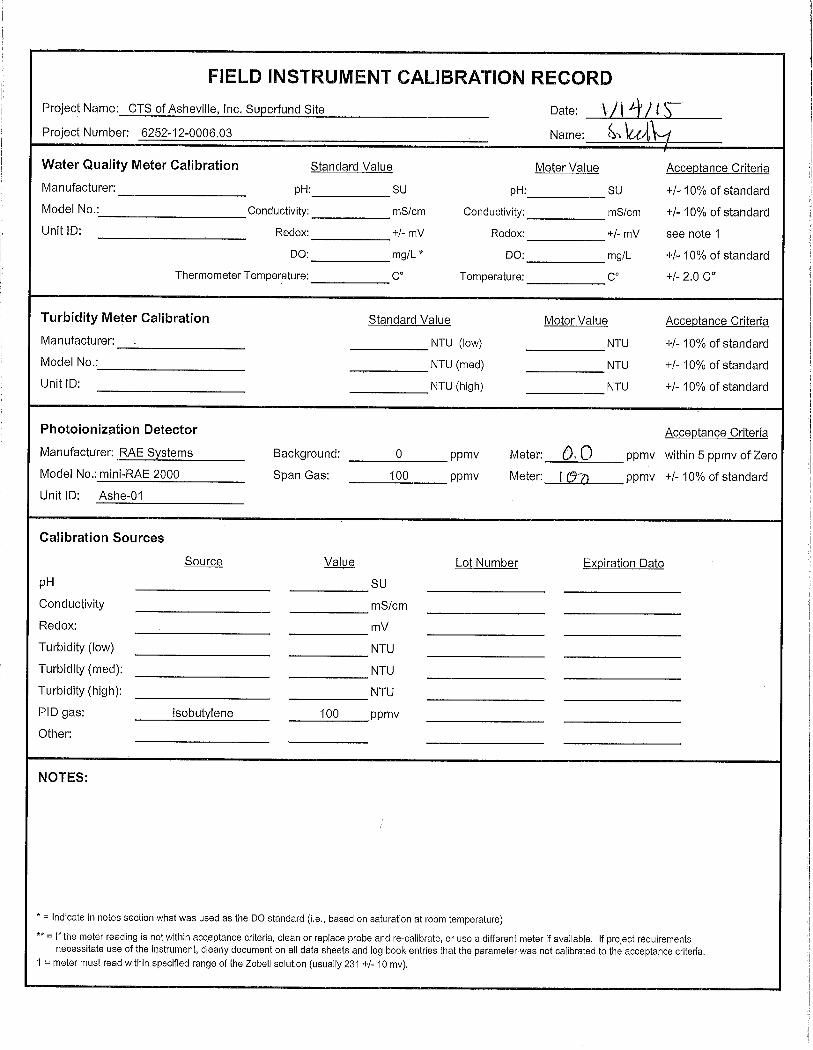
ambient/outdoor temperature were both recorded). A calibrated photoionization detector
(PID) was used to measure potential volatile vapors in the vicinity of the sample canister
during sample deployment and retrieval. Each canister was deployed for 24 hours and a
sample tag was affixed to the canisters during deployment and shipment to the laboratory.
Copies of the field data records and logbook for the sampling activities are included in
Appendix B. Table 1 contains a summary of the air samples collected and quality
assurance/quality control samples submitted to the laboratory. Copies of the laboratory
certifications for the canisters, flow controllers, and vacuum gauges are included in
Appendix C.
The air samples were shipped under chain-of-custody protocol via overnight delivery to
ALS Environmental in Simi Valley, California.
2.2 ANALYSIS OF AIR SAMPLES
The air samples were submitted for analysis of the following Site-related VOCs according
to USEPA Method TO-15 SIM (selective ion monitoring):
trichloroethene
cis-1,2-dichloroethene (cis-1,2-DCE)
trans-1,2-dichloroethene (trans-1,2-DCE)
vinyl chloride
CTS of Asheville, Inc. Superfund Site Report of January 2015 Vapor Intrusion Monitoring (“Springs Area” Residences) Amec Foster Wheeler Project 6252-12-0006 March 6, 2015
11
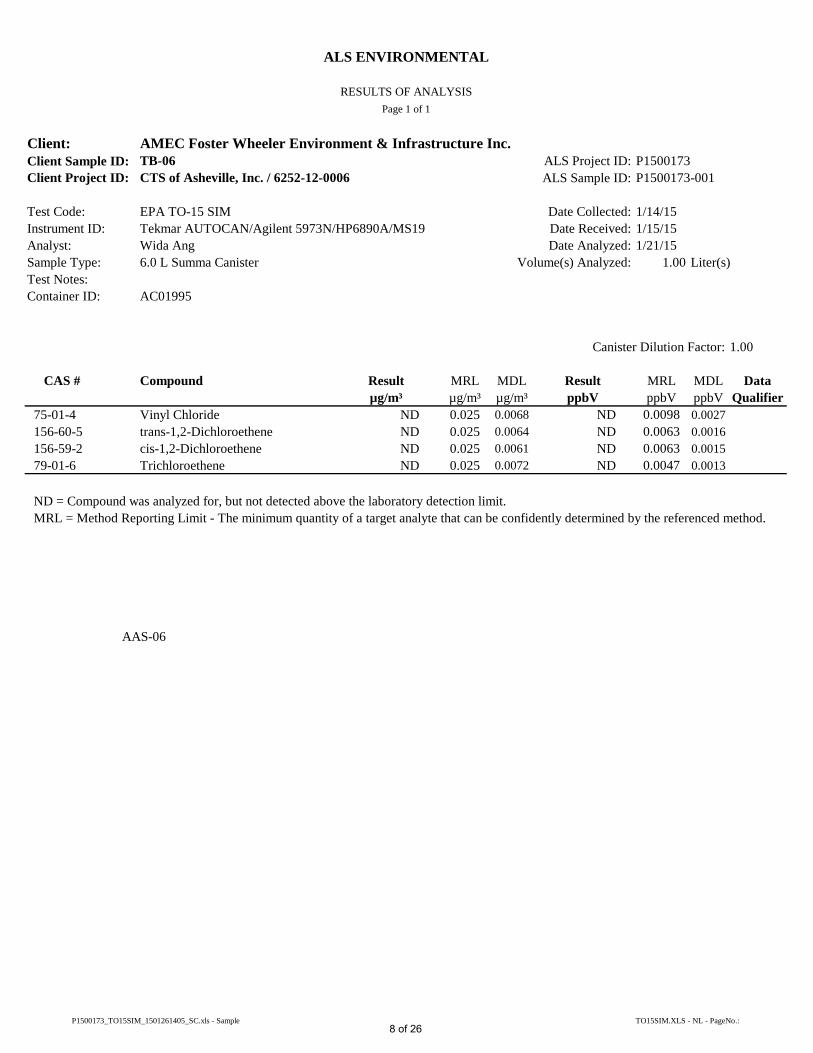
3.0 ANALYTICAL RESULTS AND DATA USABILITY
The following sections describe the laboratory analytical results of the submitted air
samples, as well as the results of data validation and data usability. The laboratory
analytical report is included as Appendix D.
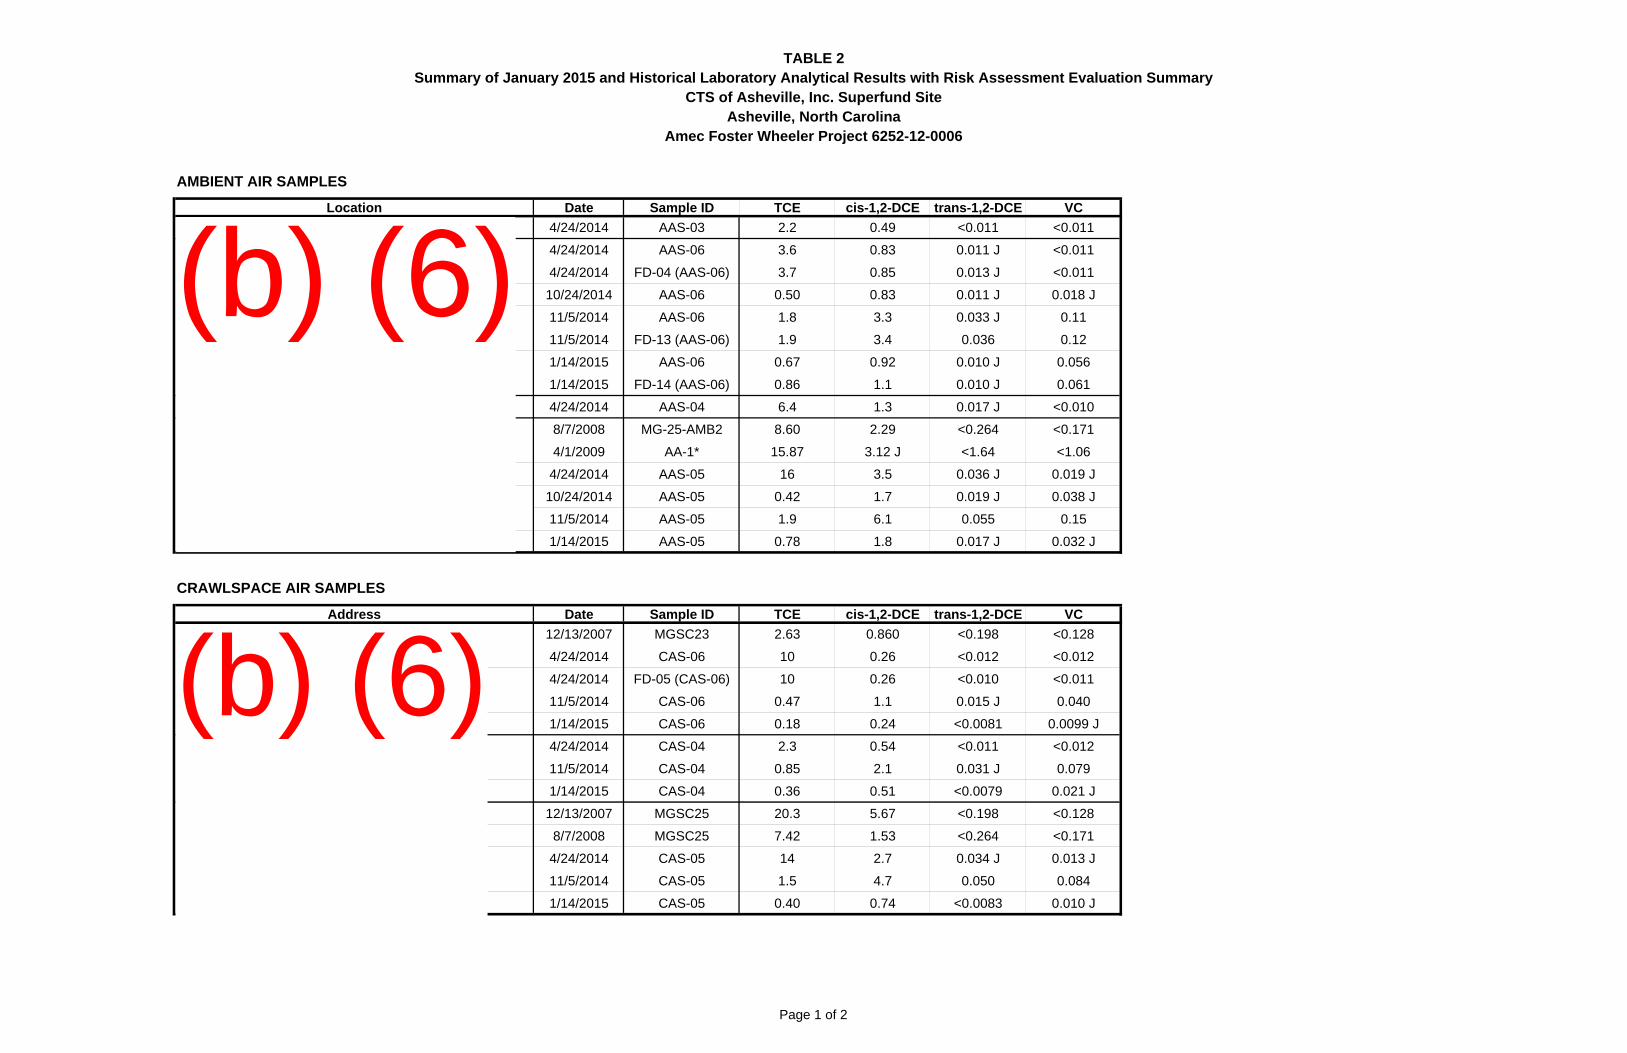
A summary of the analytical results is presented in Table 2. TCE was detected at
concentrations ranging from 0.18 to 0.40 g/m3 in the crawlspace air samples; 0.16 to
0.36 g/m3 in the indoor air samples; and 0.67 to 0.86 g/m3 in the ambient air samples.
Concentrations of cis-1,2-DCE were detected in the indoor air, crawlspace air, and
ambient air samples at concentrations ranging from 0.19 to 1.8 g/m3. Concentrations
above the method detection limit, and estimated concentrations (i.e. above the method
detection limit but less than the laboratory reporting limits), of trans-1,2-DCE and vinyl
chloride were detected in the air samples.
3.1 DATA VALIDATION
Data validation was conducted based on procedures in the USEPA Region 4 Data
Validation Standard Operating Procedures for Organic Analysis (USEPA, 2008), in
conjunction with Method TO-15 SIM and the laboratory’s Method TO-15 standard
operating procedure. Full validation, including raw data verification and calculation checks,
was completed on the laboratory data.
The data validation narrative is included in Appendix E. The results of the data validation
did not indicate the presence of quality control issues.
3.2 DATA USABILITY SUMMARY
Data quality issues were not identified during the data validation process. Data gaps from
the investigation included the following:
A crawlspace air sample duplicate was not collected, as one of the canisters received from the laboratory did not have sufficient initial vacuum to allow for sample collection over a 24-hour period. Indoor air and ambient air sample duplicates were collected, and the relative percent difference of the reported concentrations were within the acceptable criteria presented in the Supplemental

CTS of Asheville, Inc. Superfund Site Report of January 2015 Vapor Intrusion Monitoring (“Springs Area” Residences) Amec Foster Wheeler Project 6252-12-0006 March 6, 2015
12
VI Work Plan. The lack of a third duplicate sample is not considered to affect the quality of the data collected.
The data set is considered to be 100 percent complete with respect to the collected data.
Therefore, the data are usable for the completing the objectives set forth in the
Supplemental VI Work Plan.

CTS of Asheville, Inc. Superfund Site Report of January 2015 Vapor Intrusion Monitoring (“Springs Area” Residences) Amec Foster Wheeler Project 6252-12-0006 March 6, 2015
13
4.0 INDOOR AIR SCREENING-LEVEL RISK EVALUATION
Amec Foster Wheeler evaluated air quality for residences located contiguous to the east
of the Site. Indoor air and crawlspace air samples were collected on January 14, 2015, at
three residences and ambient air samples were collected from two locations (Figure 3).
Two VOCs, TCE and cis-1,2-DCE, were detected above the laboratory reporting limit in
each of the air samples. The analytical data for the January 2015 air samples are
summarized in Table 2. Risk assessment tables are included in Appendix F.
4.1 EXPOSURE ASSESSMENT
In order to identify constituents of potential concern (COPCs) for the air pathway, the
detected air constituents were compared to target indoor air concentrations from the
USEPA’s Vapor Intrusion Screening Level (VISL) Calculator, Version 3.3.1 (USEPA,
2014a) and the USEPA Regional Screening Levels (RSLs) for residential air (USEPA,
2015). These screening levels are presented in Table F.1 and are based on a residential
exposure scenario with target carcinogenic risk of 1 x 10⁻⁶ and target hazard index of 0.1.
As a result of this screening step, TCE was identified as an indoor air COPC and carried
through the screening-level risk evaluation. The detected concentrations of vinyl chloride
were below the Target Residential Indoor VISLs/RSLs and were not carried through the
screening-level risk evaluation. There are no air screening criteria for 1,2-cis-DCE and
1,2-trans-DCE.
Incremental risks and hazards were calculated using default adult and child resident
exposure assumptions (Tables F.2 through F.7). The risk assessment assumes future
residents will be present 350 days a year with exposure durations of 26 years for a
residential adult (6 years as a child and 20 years as an adult for age-adjusted exposures)
and 6 years for residential children (USEPA, 1991; USEPA, 2014b).
4.2 TOXICITY ASSESSMENT
TCE is a man-made, colorless liquid used mainly as a solvent to remove grease from
metal parts. It has also been an ingredient in some consumer products such as typewriter
correction fluid, adhesives, spot removers, carpet cleaners, paint strippers/removers
(USEPA, 2014c), and spray fixatives (USEPA, 2014d). The possible health effects from

CTS of Asheville, Inc. Superfund Site Report of January 2015 Vapor Intrusion Monitoring (“Springs Area” Residences) Amec Foster Wheeler Project 6252-12-0006 March 6, 2015
14
breathing TCE depend on the levels in indoor air, the length of exposure, and whether and
when a pregnant woman is exposed. According to the USEPA, women who are in the first
eight weeks of pregnancy are most sensitive to TCE exposures with exposures during this
time potentially increasing the risk of heart malformations in a developing fetus (USEPA,
2012). Chronic exposure to TCE may affect the immune system and increase
susceptibility to infections. Exposure to TCE is associated with an increased risk of
cancers of the kidney, liver, and non-Hodgkin lymphoma (USEPA, 2011a).
Toxicity values [Inhalation Reference Concentrations (RfCs) and Inhalation Unit Risks
(IURs)] used in this evaluation were obtained from the USEPA Integrated Risk Information
System (IRIS) (USEPA, 2011a). IRIS has released a Toxicity Assessment for TCE that
recommends TCE be addressed as a potential mutagen with risk for kidney-related
impacts being assessed using age-specific adjustment factors, and with liver and non-
Hodgkin lymphoma (NHL) risk addressed using the standard carcinogenic risk equations.
Separate TCE IURs have been derived for the kidney and liver-NHL endpoints. These
IURs, the age-specific adjustment factors used to adjust the exposure intakes, and the
TCE RfC used in this assessment, are listed in Appendix F, Tables F.2 through F.5.
The RfC is used to estimate non-carcinogenic inhalation hazards. The RfC is an estimate
of the daily exposure to the human population (including sensitive subgroups such as
children and the elderly) that is likely to be without an appreciable risk of deleterious
effects. The estimated hazard is compared to a target hazard index (HI) of 1. Cumulative
hazards less than 1 are not likely to be associated with systemic or non-carcinogenic
health risks. Non-carcinogenic hazards associated with inhalation exposures to TCE are
associated with potential damage to the thymus and heart.
Using the endpoint-specific IURs for TCE, the cumulative carcinogenic risk for the indoor
vapor intrusion pathway was calculated and compared to a target risk of 1 x 10⁻⁶. If the
cumulative carcinogenic risk for residents is less than 1 x 10⁻⁶, risk is considered to be in
the acceptable range. The IUR is characterized as an upper-bound estimate designed to
be protective of the majority of the human population.

CTS of Asheville, Inc. Superfund Site Report of January 2015 Vapor Intrusion Monitoring (“Springs Area” Residences) Amec Foster Wheeler Project 6252-12-0006 March 6, 2015
15
4.3 RISK CHARACTERIZATION
The TCE indoor air concentration from (0.23 g/m3) was used to
assess potential indoor air exposures and calculate incremental risks and hazards for both
adult/child and child residents (Tables F.2 and F.3, respectively). The estimated
incremental risk from indoor air is 5 x 10⁻⁷ for residential adults/children and 2 x 10⁻⁷ for
residential children. The estimated hazard indices (HIs) for TCE in indoor air are 0.1 for
both residential adults and children. The estimated HIs are less than 1 and the estimated
incremental risks are less than 1 x 10⁻⁶. Based on these results, the air pathway would not
pose an unacceptable hazard or risk to current or future residential receptors living at
The TCE indoor air concentration from (0.36 g/m3) was used to
assess potential indoor air exposures and calculate incremental risks and hazards for both
adult/child and child residents (Tables F.4 and F.5, respectively). The estimated
incremental risk from indoor air is 8 x 10⁻⁷ for residential adults/children and 2 x 10⁻⁷ for
residential children. The estimated HIs for TCE in indoor air are 0.2 for both residential
adults and children. The estimated HIs are less than 1 and the estimated incremental risks
are equal to or less than 1 x 10⁻⁶. Based on these results, the air pathway would not pose
an unacceptable hazard or risk to current or future residential receptors living at
.
The TCE indoor air concentration from (0.30 g/m3) was used to
assess potential indoor air exposures and calculate incremental risks and hazards for both
adult/child and child residents (Tables F.6 and F.7, respectively). The estimated
incremental risk from indoor air is 6 x 10⁻⁷ for residential adults/children and 2 x 10⁻⁷ for
residential children. The estimated HIs for TCE in indoor air are 0.1 for both residential
adults and children. The estimated HIs are less than 1 and the estimated incremental risks
are equal to or less than 1 x 10⁻⁶. Based on these results, the air pathway would not pose
an unacceptable hazard or risk to current or future residential receptors living at
.
(b) (6)
(b) (6)
(b) (6)
(b) (6)
(b) (6)(b) (6)
(b) (6)
(b) (6)(b) (6)

CTS of Asheville, Inc. Superfund Site Report of January 2015 Vapor Intrusion Monitoring (“Springs Area” Residences) Amec Foster Wheeler Project 6252-12-0006 March 6, 2015
16
4.4 UNCERTAINTY ANALYSIS
The intent of the monitoring was to evaluate current Site-specific VOC concentrations in
air inside and in the vicinity of residences and to compare current concentrations to
previously measured concentrations of Site-specific VOCs. Conservative risk-based
screening criteria were used to complete a preliminary evaluation of risks and hazards for
the residents. Key uncertainties associated with an inhalation risk evaluation include the
estimation of representative exposure concentrations and exposure intakes, the choice of
toxicity values, and the approach to estimating risks (USEPA, 2009).
This assessment assumes that the air concentrations at the residences will remain
consistent over time, although the detected constituents are potentially biodegradable and
air concentrations typically vary due to weather/seasonal fluctuations that influence
volatilization, air mixing, pressure differentials, etc. The assessment also assumes that the
air concentrations at the sampled locations will be spatially uniform, although air
concentrations may vary within structures due to locations of underground utilities,
subsurface fill and/or moisture barriers, foundation cracks, air flow, and dilution and mixing
within the indoor air space. These spatial and temporal variations could affect the risk
estimates calculated.
The assessment assumes that the source of TCE is the groundwater plume. However,
other man-made sources of TCE may be contributing to the concentrations observed in
indoor air. As noted in Section 4.2, USEPA has determined that a variety of household
products can contribute to observed indoor air TCE concentrations.
The assessment assumes that future residents will be present 350 days a year with
exposure durations of 26 years for a residential adult (6 years as a child and 20 years as
an adult for age-adjusted exposures) and 6 years for residential children. While consistent
with current USEPA risk assessment guidance, these assumptions would tend to
overestimate risks because national residential tenure in one location averages
approximately 9 years (USEPA, 2011b).
The non-carcinogenic reference concentration for TCE is based on cardio-malformations
for pre-birth exposures that might occur during the first eight weeks of pregnancy.

CTS of Asheville, Inc. Superfund Site Report of January 2015 Vapor Intrusion Monitoring (“Springs Area” Residences) Amec Foster Wheeler Project 6252-12-0006 March 6, 2015
17
Otherwise, exposure limits could be 10-fold higher and still remain protective for the
majority of the general public (USEPA, 2012). The possible health effects from breathing
TCE depends on the levels in indoor air, the length of exposure, and whether and when a
pregnant woman is exposed.
There is some degree of uncertainty associated with the characterization of risks of local
residents because residential adults and children are assumed to be present in the
residence for 24 hours per day for 350 days per year. Working adults and children
attending day care or school would not be present continuously every day.
4.5 COMPARISON TO PREVIOUS AIR INVESTIGATIONS
Ambient, crawlspace and/or indoor air samples were previously collected by USEPA
contractors and Amec Foster Wheeler at the residences sampled during this VI
monitoring. A summary of the analytical results from the previous sampling events, as well
as this VI monitoring, are included in Table 2. Concentrations of TCE during this VI
monitoring are generally less than constituent concentrations detected during previous
sampling events.
CTS of Asheville, Inc. Superfund Site Report of January 2015 Vapor Intrusion Monitoring (“Springs Area” Residences) Amec Foster Wheeler Project 6252-12-0006 March 6, 2015
18
5.0 DISCUSSION AND CONCLUSIONS
The VI monitoring was conducted in accordance with the USEPA-approved Supplemental
VI Work Plan. A crawlspace duplicate sample was not collected due to a low vacuum in
one of the canisters received from the laboratory. However, the lack of a third duplicate
sample is not considered to affect the quality of the data collected. The data collected for
the assessment are considered 100 percent complete and usable for meeting the
objectives presented in the VI Work Plan.
Concentrations of TCE and cis-1,2-DCE were detected in the collected air samples.
Concentrations above the method detection limit and estimated concentrations of trans-
1,2-DCE and vinyl chloride were detected in the air samples. Concentrations of detected
constituents during this January 2015 VI monitoring are less than previous sampling
events conducted by USEPA and Amec Foster Wheeler. Between September and
October 2014, a removal action, consisting of installation of a Springs Vapor Removal and
Capture System, was performed in the area of the springs. This removal action effectively
reduced TCE and other constituent concentrations in air in the area east of the Site prior
to this VI monitoring event.
The concentrations of TCE detected in the indoor air samples were greater than the
Target Residential Indoor VISL/RSL. As a result of this screening step, TCE was identified
as an indoor air COPC and carried through the screening-level risk evaluation. The
estimated concentrations of vinyl chloride were below the Target Residential Indoor
VISLs/RSLs and were not carried through the screening-level risk evaluation. There are
no inhalation VISL/RSL values issued for cis-1,2-DCE and trans-1,2-DCE. Risk
calculations were completed using the detected air concentrations of TCE in indoor air
samples and comparing these concentrations to inhalation toxicity benchmarks. Table 2
contains a summary of the risk and hazard estimates for the indoor air samples.
The TCE air concentrations measured in the ambient air and residential air samples (from
0.16 to 0.36 µg/m3) are within the 1990 to 2005 national background indoor air
concentrations range of 50th percentiles for TCE, which range from less than the reporting
limit to 1.1 µg/m3 (USEPA, 2011c). The USEPA national background indoor air
concentration data were collected from homes not known or expected to be located over

CTS of Asheville, Inc. Superfund Site Report of January 2015 Vapor Intrusion Monitoring (“Springs Area” Residences) Amec Foster Wheeler Project 6252-12-0006 March 6, 2015
19
soil or groundwater contamination or those having effective vapor intrusion mitigation
systems in place; therefore, the national background indoor air concentrations represent
typical background indoor air concentrations. However, the national background indoor
concentration data might not be directly applicable for the southeastern states due to the
absence of USEPA Region 4 sampling locations in the study.
The estimated hazards and risks do not indicate unacceptable risk or hazards for
residential receptors potentially exposed via indoor air. In accordance with the USEPA-
approved Springs Removal Action Work Plan, dated September 2, 2014, and subsequent
discussions with USEPA, the next sampling event will be conducted in February 2015,
pending scheduling with the property owners and occupants.
CTS of Asheville, Inc. Superfund Site Report of January 2015 Vapor Intrusion Monitoring (“Springs Area” Residences) Amec Foster Wheeler Project 6252-12-0006 March 6, 2015
20
6.0 REFERENCES
Amec Foster Wheeler, 2014. Supplement to Vapor Intrusion Assessment Work Plan (Revision 4), CTS of Asheville, Inc. Superfund Site, EPA ID: NCD003149556, June 11, 2014.
T N & Associates, Inc., USEPA Region 4 START, 2008. Subsurface Soil and
Groundwater Sampling Report, Revision 1, Mills Gap, April 23, 2008. T N & Associates, Inc., USEPA Region 4 START, 2009. Vapor Sampling Letter Report,
Revision 2, Mills Gap, June 16, 2009. USEPA, 1991. Human Health Evaluation Manual, Supplemental Guidance, OSWER
Directive 9285.6-03, March 1991. USEPA, 2008. Data Validation Standard Operating Procedures for Organic Analyses;
USEPA Region 4, Science and Ecosystem Support Division Quality Assurance Section, MTSB; Athens, Georgia; August 2008.
USEPA, 2009. Risk Assessment Guidance for Superfund, Volume I: Human Health
Evaluation Manual (Part F, Supplemental Guidance for Inhalation Risk Assessment), Final, EPA-540-R-070-002, January 2009.
USEPA, 2011a. Toxicological Review of Trichloroethylene (CAS No. 79-01-6) In Support
of Summary Information on the Integrated Risk Information System (IRIS), EPA/635/R-09/011F, September 2011.
USEPA, 2011b. Exposure Factors Handbook, 2011 Edition. EPA/600/R-090/052F,
September 2011. USEPA, 2011c. Background Indoor Air Concentrations of Volatile Organic Compounds in
North America Residences (1990 – 2005): A Compilation of Statistics for Assessing Vapor Intrusion, EPA 530-R-10-001, June 2011.
USEPA, 2012. OEA Recommendations Regarding Trichloroethylene Toxicity in Human
Health Risk Assessments, December 13, 2012. USEPA, 2014a. Vapor Intrusion Screening Level Calculator, Version 3.3.1. USEPA, 2014b. Human Health Evaluation Manual, Supplemental Guidance: Update of
Standard Default Exposure Values, OSWER Directive 9200.1-120, February 6, 2014.
USEPA, 2014c. Trichloroethylene (Technology Transfer Network-Air Toxics Website).
http://www.epa.gov/ttn/atw/hlthef/tri-ethy.html, accessed June 12, 2014. USEPA, 2014d. TSCA Work Plan Chemical Risk Assessment, Trichloroethylene:
Degreasing, Spot Cleaning and Arts & Crafts Uses. USEPA Document 740‐R1‐4002, June 2014.

CTS of Asheville, Inc. Superfund Site Report of January 2015 Vapor Intrusion Monitoring (“Springs Area” Residences) Amec Foster Wheeler Project 6252-12-0006 March 6, 2015
21
USEPA, 2015. Regional Screening Levels (RSL) for Chemical Contaminants at Superfund Sites (January 2015).

CTS of Asheville, Inc. Superfund Site Report of January 2015 Vapor Intrusion Monitoring (“Springs Area” Residences) Amec Foster Wheeler Project 6252-12-0006 March 6, 2015
TABLES

Time
PID Reading
(ppm)
PID Reading
(ppm)
Start/Stop Start Stop Start Stop Start Stop Start Stop
AAS-05 1/13/2015 8:08 NA NA 40 31 0.0 0.0 -27.8 -4.2
CAS-05 1/13/2015 8:17 43 52 40 32 0.1 0.2 -27.4 -1.0
IAS-05 1/13/2015 8:29 70 73 40 32 0.4 0.3 -27.8 -0.5
AAS-06 1/13/2015 8:52 NA NA 38 32 0.0 0.0 -27.0 -0.1
CAS-04 1/13/2015 9:01 45 38 41 35 0.0 0.1 -27.7 -0.1
IAS-04 1/13/2015 9:08 65 70 41 35 0.5 0.7 -27.7 -0.4
CAS-06 1/13/2015 9:21 49 40 43 34 0.1 0.0 -26.1 -0.4
IAS-06 1/13/2015 9:37 65 68 43 34 0.1 0.3 -27.5 -5.5
FD-14 (AAS-06) 1/13/2015 8:52 NA NA 38 32 0.0 0.0 -27.2 -3.5
FD-15 (IAS-06) 1/13/2015 9:37 65 68 43 34 0.1 0.3 -27.1 -0.7
TB-05 lab prep NA NA NA NA NA NA NA NA NA
Notes: Prepared By: SEK 1/30/151. oF: degrees Fahrenheit Checked By: RMC 2/10/152. PID: photoionization detector3. ppm: parts per million4. Hg: mercury5. NA: not applicable
TABLE 1Summary of Air Samples and Sampling Conditions - January 2015
CTS of Asheville, Inc. Superfund SiteAsheville, North Carolina
Amec Foster Wheeler Project 6252-12-0006
Interior Air Temperature
(oF)
Ambient Air Temperature
(oF)Vacuum
(inches Hg)
Sample ID Sample Location/Address Date Start
(b) (6)
Location Date Sample ID TCE cis-1,2-DCE trans-1,2-DCE VC
4/24/2014 AAS-03 2.2 0.49 <0.011 <0.011
4/24/2014 AAS-06 3.6 0.83 0.011 J <0.011
4/24/2014 FD-04 (AAS-06) 3.7 0.85 0.013 J <0.011
10/24/2014 AAS-06 0.50 0.83 0.011 J 0.018 J
11/5/2014 AAS-06 1.8 3.3 0.033 J 0.11
11/5/2014 FD-13 (AAS-06) 1.9 3.4 0.036 0.12
1/14/2015 AAS-06 0.67 0.92 0.010 J 0.056
1/14/2015 FD-14 (AAS-06) 0.86 1.1 0.010 J 0.061
4/24/2014 AAS-04 6.4 1.3 0.017 J <0.010
8/7/2008 MG-25-AMB2 8.60 2.29 <0.264 <0.171
4/1/2009 AA-1* 15.87 3.12 J <1.64 <1.06
4/24/2014 AAS-05 16 3.5 0.036 J 0.019 J
10/24/2014 AAS-05 0.42 1.7 0.019 J 0.038 J
11/5/2014 AAS-05 1.9 6.1 0.055 0.15
1/14/2015 AAS-05 0.78 1.8 0.017 J 0.032 J
Address Date Sample ID TCE cis-1,2-DCE trans-1,2-DCE VC
12/13/2007 MGSC23 2.63 0.860 <0.198 <0.128
4/24/2014 CAS-06 10 0.26 <0.012 <0.012
4/24/2014 FD-05 (CAS-06) 10 0.26 <0.010 <0.011
11/5/2014 CAS-06 0.47 1.1 0.015 J 0.040
1/14/2015 CAS-06 0.18 0.24 <0.0081 0.0099 J
4/24/2014 CAS-04 2.3 0.54 <0.011 <0.012
11/5/2014 CAS-04 0.85 2.1 0.031 J 0.079
1/14/2015 CAS-04 0.36 0.51 <0.0079 0.021 J
12/13/2007 MGSC25 20.3 5.67 <0.198 <0.128
8/7/2008 MGSC25 7.42 1.53 <0.264 <0.171
4/24/2014 CAS-05 14 2.7 0.034 J 0.013 J
11/5/2014 CAS-05 1.5 4.7 0.050 0.084
1/14/2015 CAS-05 0.40 0.74 <0.0083 0.010 J
TABLE 2
CRAWLSPACE AIR SAMPLES
AMBIENT AIR SAMPLES
Summary of January 2015 and Historical Laboratory Analytical Results with Risk Assessment Evaluation SummaryCTS of Asheville, Inc. Superfund Site
Asheville, North CarolinaAmec Foster Wheeler Project 6252-12-0006
Page 1 of 2
(b) (6)
(b) (6)
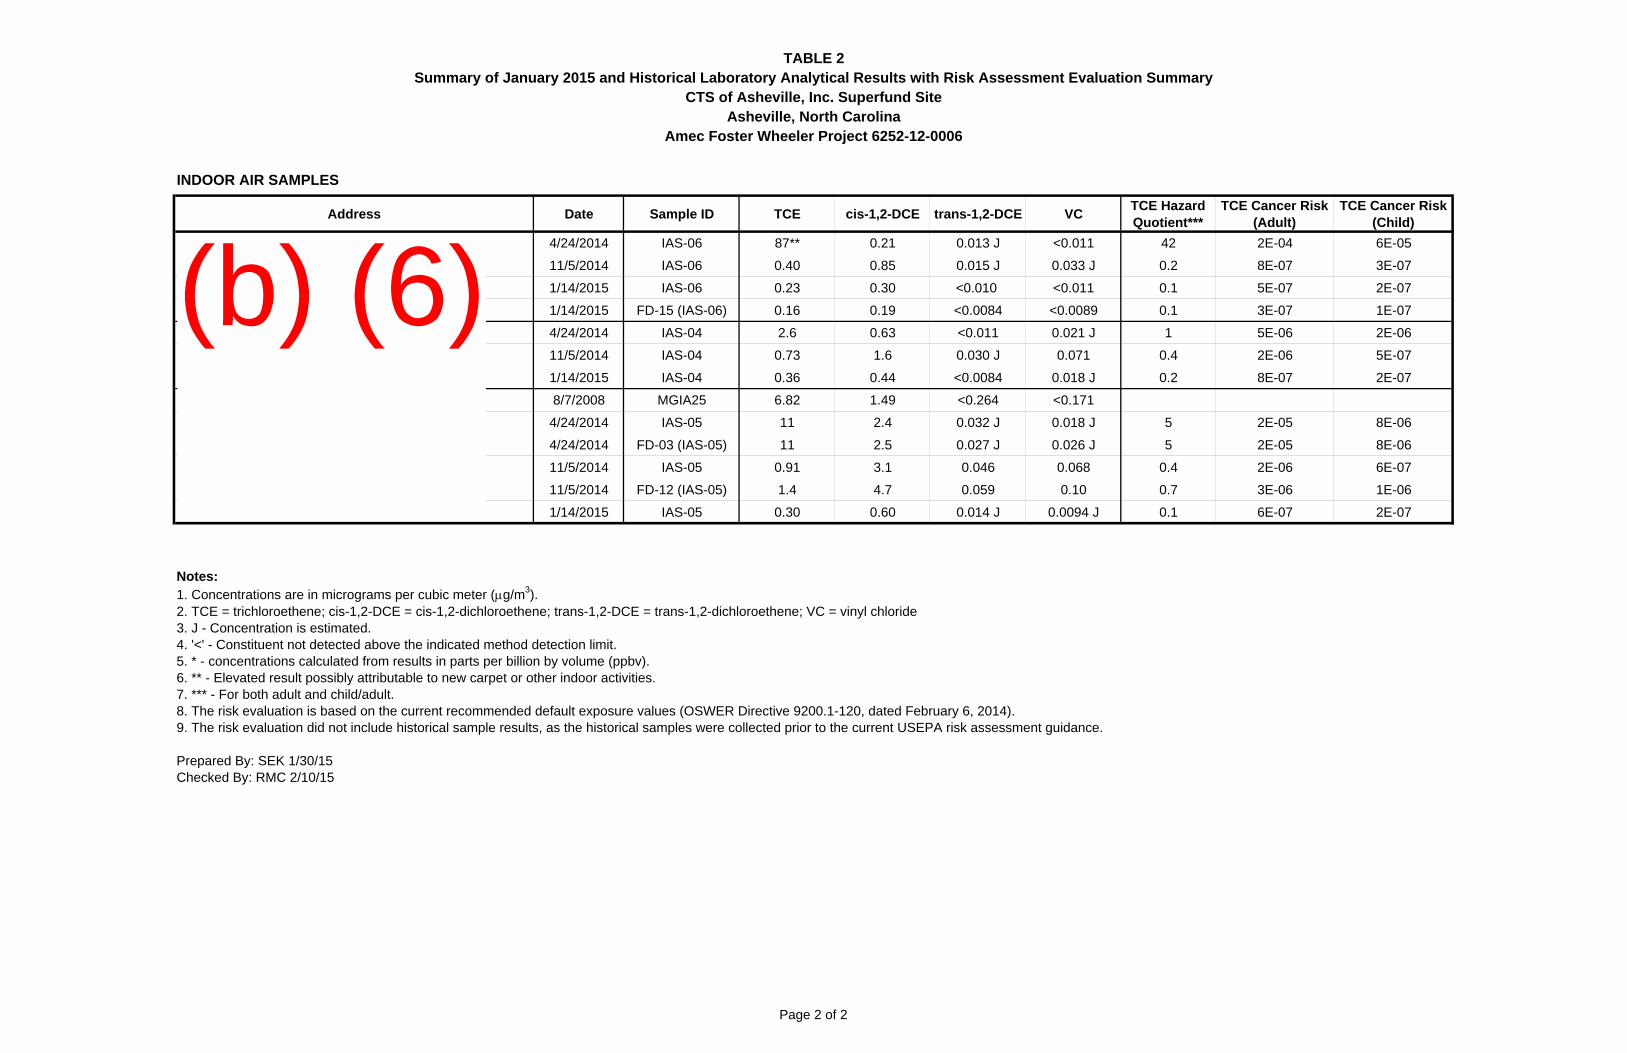
TABLE 2Summary of January 2015 and Historical Laboratory Analytical Results with Risk Assessment Evaluation Summary
CTS of Asheville, Inc. Superfund SiteAsheville, North Carolina
Amec Foster Wheeler Project 6252-12-0006
Address Date Sample ID TCE cis-1,2-DCE trans-1,2-DCE VCTCE Hazard Quotient***
TCE Cancer Risk(Adult)
TCE Cancer Risk(Child)
4/24/2014 IAS-06 87** 0.21 0.013 J <0.011 42 2E-04 6E-05
11/5/2014 IAS-06 0.40 0.85 0.015 J 0.033 J 0.2 8E-07 3E-07
1/14/2015 IAS-06 0.23 0.30 <0.010 <0.011 0.1 5E-07 2E-07
1/14/2015 FD-15 (IAS-06) 0.16 0.19 <0.0084 <0.0089 0.1 3E-07 1E-07
4/24/2014 IAS-04 2.6 0.63 <0.011 0.021 J 1 5E-06 2E-06
11/5/2014 IAS-04 0.73 1.6 0.030 J 0.071 0.4 2E-06 5E-07
1/14/2015 IAS-04 0.36 0.44 <0.0084 0.018 J 0.2 8E-07 2E-07
8/7/2008 MGIA25 6.82 1.49 <0.264 <0.171
4/24/2014 IAS-05 11 2.4 0.032 J 0.018 J 5 2E-05 8E-06
4/24/2014 FD-03 (IAS-05) 11 2.5 0.027 J 0.026 J 5 2E-05 8E-06
11/5/2014 IAS-05 0.91 3.1 0.046 0.068 0.4 2E-06 6E-07
11/5/2014 FD-12 (IAS-05) 1.4 4.7 0.059 0.10 0.7 3E-06 1E-06
1/14/2015 IAS-05 0.30 0.60 0.014 J 0.0094 J 0.1 6E-07 2E-07
Notes:1. Concentrations are in micrograms per cubic meter (g/m3).2. TCE = trichloroethene; cis-1,2-DCE = cis-1,2-dichloroethene; trans-1,2-DCE = trans-1,2-dichloroethene; VC = vinyl chloride3. J - Concentration is estimated.4. '<' - Constituent not detected above the indicated method detection limit.5. * - concentrations calculated from results in parts per billion by volume (ppbv).6. ** - Elevated result possibly attributable to new carpet or other indoor activities.7. *** - For both adult and child/adult. 8. The risk evaluation is based on the current recommended default exposure values (OSWER Directive 9200.1-120, dated February 6, 2014).9. The risk evaluation did not include historical sample results, as the historical samples were collected prior to the current USEPA risk assessment guidance.
Prepared By: SEK 1/30/15Checked By: RMC 2/10/15
INDOOR AIR SAMPLES
Page 2 of 2
(b) (6)
CTS of Asheville, Inc. Superfund Site Report of January 2015 Vapor Intrusion Monitoring (“Springs Area” Residences) Amec Foster Wheeler Project 6252-12-0006 March 6, 2015
FIGURES

Document: P:\Projects\CTS Corporation\4.0 Project Deliverables\4.5 Databases\GIS\MapDocuments\CTS_AIR_2015_11x17LS.mxd PDF: P:\Projects\CTS Corporation\4.0 Project Deliverables\4.5 Databases\GIS\Figures\VI 2015\Figure 3 - Jan 2015 Air.pdf 03/06/2015 9:03 AM brian.peters
CTS of Asheville, Inc. Superfund SiteAsheville, North Carolina
January 2015Air Sampling Locations
Project 6252120006 Figure 3
%K
%K
XY$D
XY$D
XY$D
SILK TREE LANE
JASMINE LANE
NODDING LANE
SITE
FORMERBUILDINGFORMERBUILDING
MILLS GAP ROAD
PINNERS COVE ROAD
CAS-06 IAS-06
CAS-05IAS-05
CAS-04IAS-04
AAS-06
AAS-05
0 10050Feet¯
LegendProperty Line $D CAS-04: Crawlspace Air Sample
XY IAS-04: Indoor Air Sample%K AAS-04: Ambient Air Sample
Checked/Date: SEK 03/05/15Prepared/Date: BRP 03/05/15
CTS of Asheville, Inc. Superfund Site Report of January 2015 Vapor Intrusion Monitoring (“Springs Area” Residences) Amec Foster Wheeler Project 6252-12-0006 March 6, 2015
APPENDIX A
PHOTOGRAPHS OF SAMPLING ACTIVITIES
CTS of Asheville, Inc. Superfund Site Report of January 2015 Vapor Intrusion Monitoring (“Springs Area” Residences): Appendix A Amec Foster Wheeler Project 6252-12-0006 March 6, 2015
A-1
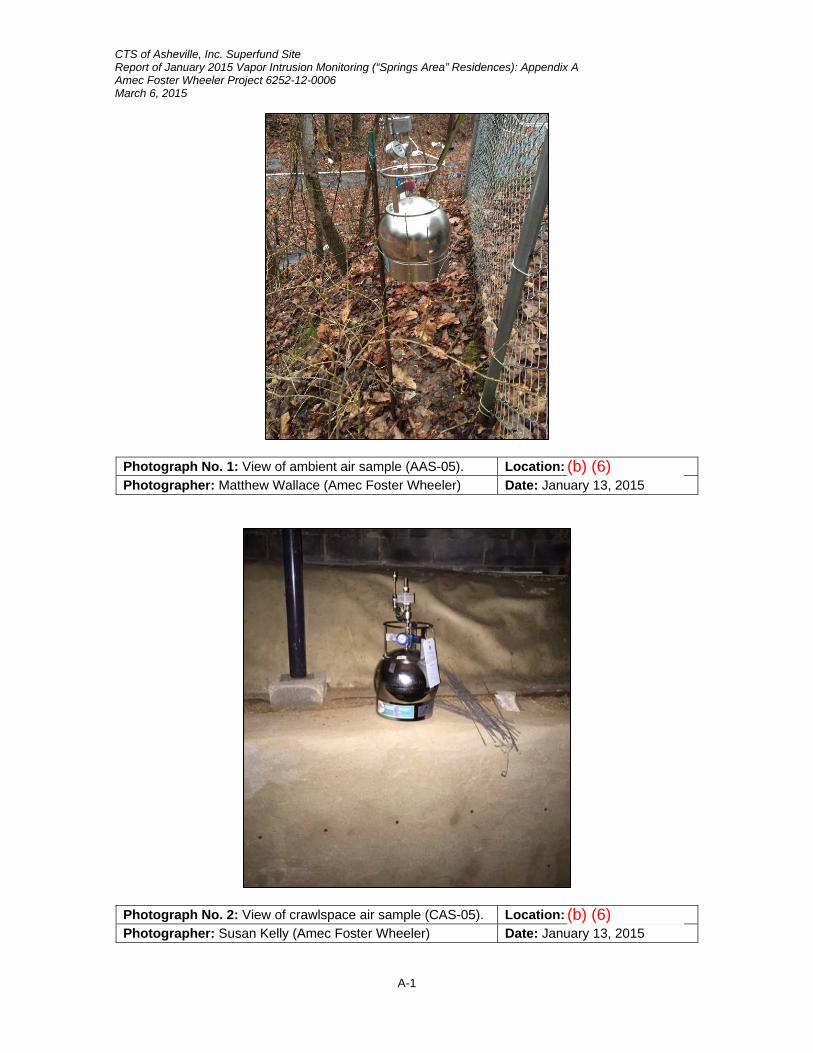
Photograph No. 1: View of ambient air sample (AAS-05). Location:
Photographer: Matthew Wallace (Amec Foster Wheeler) Date: January 13, 2015
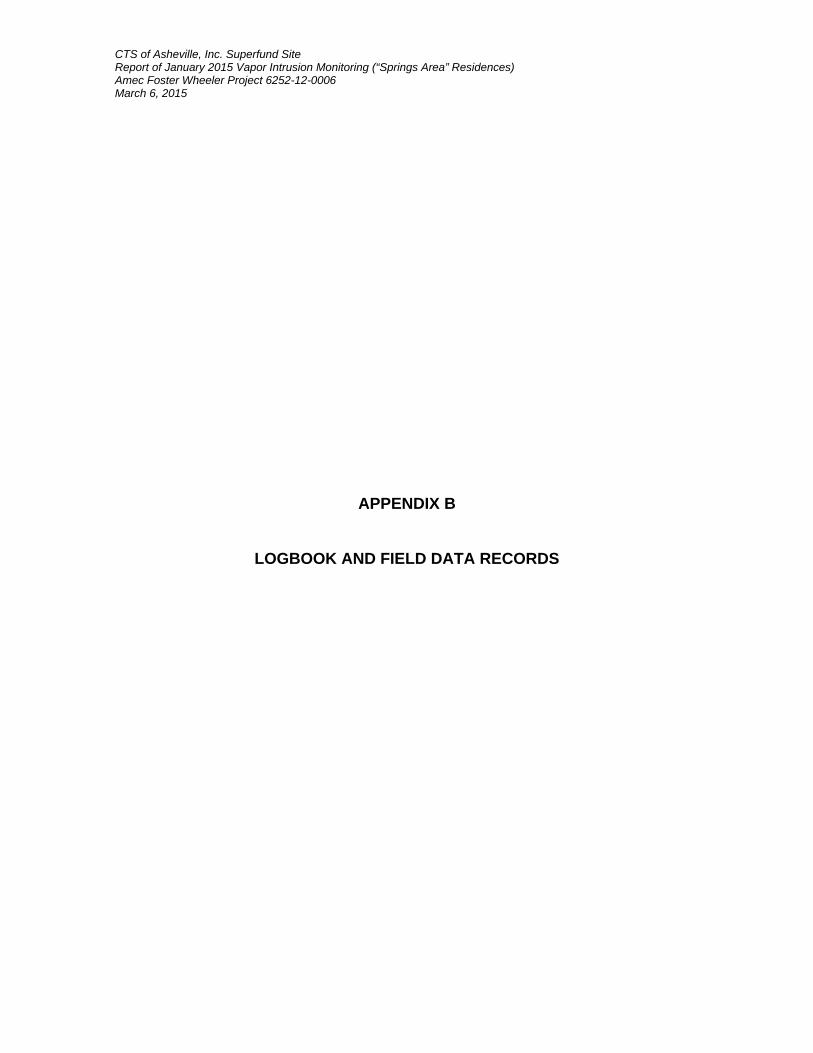
Photograph No. 2: View of crawlspace air sample (CAS-05). Location:
Photographer: Susan Kelly (Amec Foster Wheeler) Date: January 13, 2015
(b) (6)
(b) (6)

CTS of Asheville, Inc. Superfund Site Report of January 2015 Vapor Intrusion Monitoring (“Springs Area” Residences): Appendix A Amec Foster Wheeler Project 6252-12-0006 March 6, 2015
A-2
Photograph No. 3: View of indoor air sample (IAS-05). Location:
Photographer: Susan Kelly (Amec Foster Wheeler) Date: January 13, 2015
Photograph No. 4: View of ambient air sample (AAS-06) with duplicate (FD-14).
Location:
Photographer: Susan Kelly (Amec Foster Wheeler) Date: January 13, 2015
(b) (6)
(b) (6)

CTS of Asheville, Inc. Superfund Site Report of January 2015 Vapor Intrusion Monitoring (“Springs Area” Residences): Appendix A Amec Foster Wheeler Project 6252-12-0006 March 6, 2015
A-3
Photograph No. 5: View of indoor air sample (IAS-04). Location:
Photographer: Susan Kelly (Amec Foster Wheeler) Date: January 13, 2015
Photograph No. 6: View of crawlspace air sample (CAS-06). Location:
Photographer: Matthew Wallace (Amec Foster Wheeler) Date: January 13, 2015
(b) (6)
(b) (6)

CTS of Asheville, Inc. Superfund Site Report of January 2015 Vapor Intrusion Monitoring (“Springs Area” Residences): Appendix A Amec Foster Wheeler Project 6252-12-0006 March 6, 2015
A-4
Photograph No. 7: View of indoor air sample (IAS-06) and duplicate (FD-15).
Location:
Photographer: Susan Kelly (Amec Foster Wheeler) Date: January 13, 2015
(b) (6)
CTS of Asheville, Inc. Superfund Site Report of January 2015 Vapor Intrusion Monitoring (“Springs Area” Residences) Amec Foster Wheeler Project 6252-12-0006 March 6, 2015
APPENDIX B
LOGBOOK AND FIELD DATA RECORDS

(b) (6)
(b) (6)
(b) (6)
(b) (6)

(b) (6)
(b) (6)
(b) (6)

(b) (6)

(b) (6)
(b) (6)
(b) (6)

(b) (6)

(b) (6)

(b) (6)

(b) (6)
(b) (6)

(b) (6)


CTS of Asheville, Inc. Superfund Site Report of January 2015 Vapor Intrusion Monitoring (“Springs Area” Residences) Amec Foster Wheeler Project 6252-12-0006 March 6, 2015
APPENDIX C
LABORATORY INDIVIDUAL CERTIFICATION DOCUMENTS

CTS of Asheville, Inc. Superfund Site Report of January 2015 Vapor Intrusion Monitoring (“Springs Area” Residences) Amec Foster Wheeler Project 6252-12-0006 March 6, 2015
APPENDIX D
LABORATORY ANALYTICAL REPORT

2655 Park Center Dr., Suite A Simi Valley, CA 93065 T: +1 805 526 7161 F: +1 805 526 7270 www.alsglobal.com
LABORATORY REPORT January 30, 2015 Susan Kelly AMEC Environment & Infrastructure, Inc. 1308 Patton Ave Asheville, NC 28806-2604 RE: CTS of Asheville, Inc. / 6252-12-0006 Dear Susan: Enclosed are the results of the samples submitted to our laboratory on January 15, 2015. For your reference, these analyses have been assigned our service request number P1500173. All analyses were performed according to our laboratory’s NELAP and DoD-ELAP-approved quality assurance program. The test results meet requirements of the current NELAP and DoD-ELAP standards, where applicable, and except as noted in the laboratory case narrative provided. For a specific list of NELAP and DoD-ELAP-accredited analytes, refer to the certifications section at www.alsglobal.com. Results are intended to be considered in their entirety and apply only to the samples analyzed and reported herein. If you have any questions, please call me at (805) 526-7161. Respectfully submitted, ALS | Environmental Kate Aguilera Project Manager
R I G H T S O L U T I O N S | R I G H T P A R T N E R
1 of 26
kate.aguilera
Kate Aguilera
2655 Park Center Dr., Suite A Simi Valley, CA 93065 T: +1 805 526 7161 F: +1 805 526 7270 www.alsglobal.com
Client: AMEC Environment & Infrastructure, Inc. Service Request No: P1500173 Project: CTS of Asheville, Inc. / 6252-12-0006 _______________________________________________________________________________
CASE NARRATIVE
The samples were received intact under chain of custody on January 15, 2015 and were stored in accordance with the analytical method requirements. Please refer to the sample acceptance check form for additional information. The results reported herein are applicable only to the condition of the samples at the time of sample receipt. Volatile Organic Compound Analysis The samples were analyzed in SIM mode for selected volatile organic compounds in accordance with EPA Method TO-15 from the Compendium of Methods for the Determination of Toxic Organic Compounds in Ambient Air, Second Edition (EPA/625/R-96/010b), January, 1999. This procedure is described in laboratory SOP VOA-TO15. The analytical system was comprised of a gas chromatograph / mass spectrometer (GC/MS) interfaced to a whole-air preconcentrator. This method is not included on the laboratory’s AIHA-LAP scope of accreditation. The Summa canisters were cleaned, prior to sampling, down to the method reporting limit (MRL) reported for this project. Please note, projects which require reporting below the MRL could have results between the MRL and method detection limit (MDL) that are biased high. ______________________________________________________________________________________ The results of analyses are given in the attached laboratory report. All results are intended to be considered in their entirety, and ALS Environmental (ALS) is not responsible for utilization of less than the complete report. Use of ALS Environmental (ALS)’s Name. Client shall not use ALS’s name or trademark in any marketing or reporting materials, press releases or in any other manner (“Materials”) whatsoever and shall not attribute to ALS any test result, tolerance or specification derived from ALS’s data (“Attribution”) without ALS’s prior written consent, which may be withheld by ALS for any reason in its sole discretion. To request ALS’s consent, Client shall provide copies of the proposed Materials or Attribution and describe in writing Client’s proposed use of such Materials or Attribution. If ALS has not provided written approval of the Materials or Attribution within ten (10) days of receipt from Client, Client’s request to use ALS’s name or trademark in any Materials or Attribution shall be deemed denied. ALS may, in its discretion, reasonably charge Client for its time in reviewing Materials or Attribution requests. Client acknowledges and agrees that the unauthorized use of ALS’s name or trademark may cause ALS to incur irreparable harm for which the recovery of money damages will be inadequate. Accordingly, Client acknowledges and agrees that a violation shall justify preliminary injunctive relief. For questions contact the laboratory.
R I G H T S O L U T I O N S | R I G H T P A R T N E R
2 of 26

2655 Park Center Dr., Suite A Simi Valley, CA 93065 T: +1 805 526 7161 F: +1 805 526 7270 www.alsglobal.com
ALS Environmental – Simi Valley
CERTIFICATIONS, ACCREDITATIONS, AND REGISTRATIONS
Agency Web Site Number
AIHA http://www.aihaaccreditedlabs.org 101661
Arizona DHS http://www.azdhs.gov/lab/license/env.htm AZ0694
DoD ELAP http://www.pjlabs.com/search-accredited-labs L14-2
Florida DOH (NELAP)
http://www.doh.state.fl.us/lab/EnvLabCert/WaterCert.htm E871020
Maine DHHS http://www.maine.gov/dhhs/mecdc/environmental-health/water/dwp-services/labcert/labcert.htm
2014025
Minnesota DOH (NELAP)
http://www.health.state.mn.us/accreditation 838341
New Jersey DEP (NELAP)
http://www.nj.gov/dep/oqa/ CA009
New York DOH (NELAP)
http://www.wadsworth.org/labcert/elap/elap.html 11221
Oregon PHD (NELAP)
http://public.health.oregon.gov/LaboratoryServices/EnvironmentalLaboratoryAccreditation/Pages/index.aspx
CA200007
Pennsylvania DEP http://www.depweb.state.pa.us/labs 68-03307
(Registration) Texas CEQ (NELAP)
http://www.tceq.texas.gov/field/qa/env_lab_accreditation.html T104704413-
14-5 Utah DOH (NELAP)
http://www.health.utah.gov/lab/labimp/certification/index.html CA01627201
4-4
Washington DOE http://www.ecy.wa.gov/programs/eap/labs/lab-accreditation.html C946
Analyses were performed according to our laboratory’s NELAP and DoD-ELAP approved quality assurance program. A complete listing of specific NELAP and DoD-ELAP certified analytes can be found in the certifications section at www.alsglobal.com, or at the accreditation body’s website. Each of the certifications listed above have an explicit Scope of Accreditation that applies to specific matrices/methods/analytes; therefore, please contact the laboratory for information corresponding to a particular certification.
R I G H T S O L U T I O N S | R I G H T P A R T N E R
3 of 26

P1500173_Detail Summary_1501261646_RB.xls - DETAIL SUMMARY
Client: AMEC Foster Wheeler Environment & Infrastructure Inc. Service Request: P1500173Project ID: CTS of Asheville, Inc. / 6252-12-0006
Date Received: 1/15/2015Time Received: 09:45
Client Sample ID Lab Code MatrixDate
CollectedTime
CollectedContainer
IDPi1
(psig)Pf1
(psig)
TB-06 P1500173-001 Air 1/14/2015 00:00 AC01995 -14.25 3.61 XFD-14 P1500173-002 Air 1/14/2015 00:00 AS00744 -1.57 3.63 XFD-15 P1500173-003 Air 1/14/2015 00:00 AS00651 -0.75 3.58 XAAS-05 P1500173-004 Air 1/14/2015 08:08 AS00445 -1.92 3.51 XCAS-05 P1500173-005 Air 1/14/2015 08:17 AC01896 -0.47 3.65 XIAS-05 P1500173-006 Air 1/14/2015 08:29 AC01887 -1.02 3.58 XAAS-06 P1500173-007 Air 1/14/2015 08:52 AS00803 0.22 3.56 XCAS-04 P1500173-008 Air 1/14/2015 09:01 AS00789 0.05 3.53 XIAS-04 P1500173-009 Air 1/14/2015 09:08 AC02056 -0.83 3.66 XCAS-06 P1500173-010 Air 1/14/2015 09:21 AC01784 -0.26 3.59 XIAS-06 P1500173-011 Air 1/14/2015 09:37 AS00550 -3.15 3.57 X
ALS ENVIRONMENTAL
DETAIL SUMMARY REPORT
TO-1
5 - V
OC
SIM
4 of 26
5 of 26
1/30/15 9:57 AMP1500173_AMEC Environment Infrastructure, Inc._CTS of Asheville, Inc _ 6252-12-0006.xls - Page 1 of 2
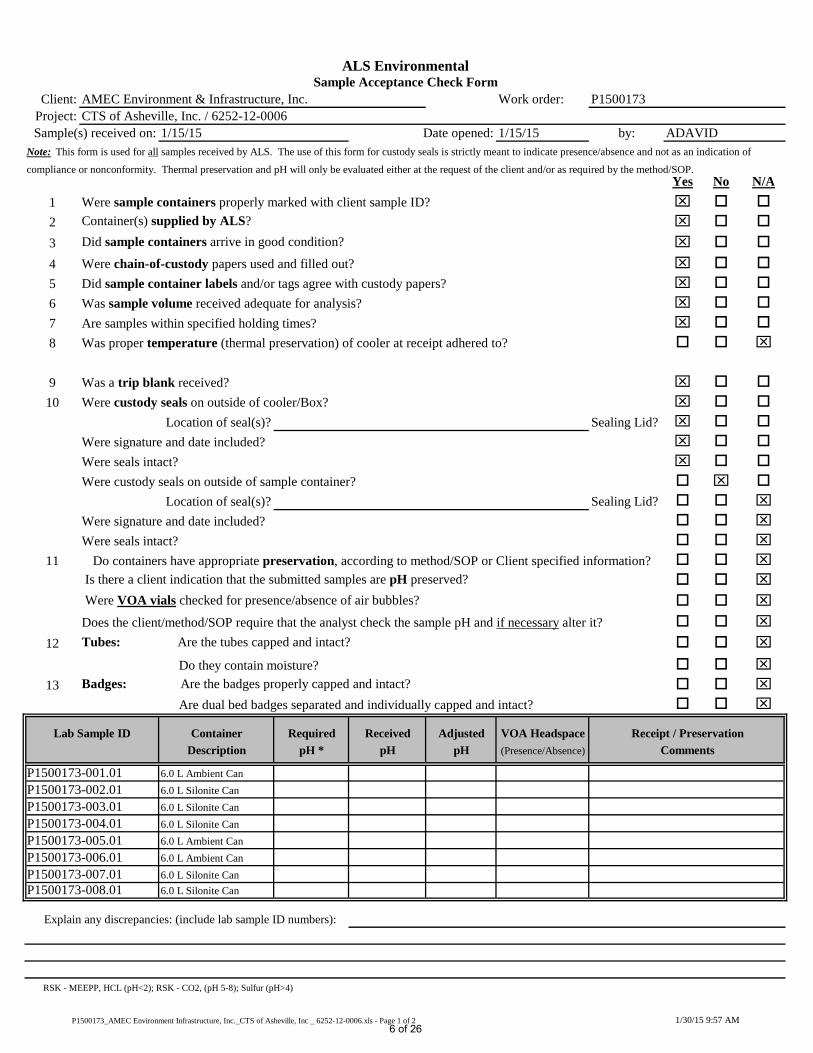
ALS EnvironmentalSample Acceptance Check Form
Client: AMEC Environment & Infrastructure, Inc. Work order: P1500173Project: CTS of Asheville, Inc. / 6252-12-0006Sample(s) received on: 1/15/15 Date opened: 1/15/15 by: ADAVID
Note: This form is used for all samples received by ALS. The use of this form for custody seals is strictly meant to indicate presence/absence and not as an indication of
compliance or nonconformity. Thermal preservation and pH will only be evaluated either at the request of the client and/or as required by the method/SOP.Yes No N/A
1 Were sample containers properly marked with client sample ID? 2 Container(s) supplied by ALS? 3 Did sample containers arrive in good condition? 4 Were chain-of-custody papers used and filled out? 5 Did sample container labels and/or tags agree with custody papers? 6 Was sample volume received adequate for analysis? 7 Are samples within specified holding times? 8 Was proper temperature (thermal preservation) of cooler at receipt adhered to?
9 Was a trip blank received?
10 Were custody seals on outside of cooler/Box? Location of seal(s)? Sealing Lid?
Were signature and date included? Were seals intact? Were custody seals on outside of sample container?
Location of seal(s)? Sealing Lid? Were signature and date included? Were seals intact?
11 Is there a client indication that the submitted samples are pH preserved? Were VOA vials checked for presence/absence of air bubbles?
12 Tubes: Are the tubes capped and intact?
Do they contain moisture? 13 Badges: Are the badges properly capped and intact?
Are dual bed badges separated and individually capped and intact?
Lab Sample ID Container Required Received Adjusted VOA HeadspaceDescription pH * pH pH (Presence/Absence) Comments
6.0 L Ambient Can 6.0 L Silonite Can6.0 L Silonite Can6.0 L Silonite Can6.0 L Ambient Can 6.0 L Ambient Can 6.0 L Silonite Can6.0 L Silonite Can
RSK - MEEPP, HCL (pH<2); RSK - CO2, (pH 5-8); Sulfur (pH>4)
Do containers have appropriate preservation, according to method/SOP or Client specified information?
Does the client/method/SOP require that the analyst check the sample pH and if necessary alter it?
Receipt / Preservation
P1500173-001.01P1500173-002.01P1500173-003.01P1500173-004.01P1500173-005.01P1500173-006.01P1500173-007.01P1500173-008.01
Explain any discrepancies: (include lab sample ID numbers):
6 of 26

1/30/15 9:57 AMP1500173_AMEC Environment Infrastructure, Inc._CTS of Asheville, Inc _ 6252-12-0006.xls - Page 2 of 2
ALS EnvironmentalSample Acceptance Check Form
Client: AMEC Environment & Infrastructure, Inc. Work order: P1500173Project: CTS of Asheville, Inc. / 6252-12-0006Sample(s) received on: 1/15/15 Date opened: 1/15/15 by: ADAVID
Lab Sample ID Container Required Received Adjusted VOA Headspace Receipt / PreservationDescription pH * pH pH (Presence/Absence) Comments
6.0 L Ambient Can 6.0 L Ambient Can 6.0 L Silonite Can
RSK - MEEPP, HCL (pH<2); RSK - CO2, (pH 5-8); Sulfur (pH>4)
P1500173-009.01P1500173-010.01P1500173-011.01
Explain any discrepancies: (include lab sample ID numbers):
7 of 26
TO15SIM.XLS - NL - PageNo.:P1500173_TO15SIM_1501261405_SC.xls - Sample
ALS ENVIRONMENTAL
RESULTS OF ANALYSISPage 1 of 1
Client: AMEC Foster Wheeler Environment & Infrastructure Inc.Client Sample ID: TB-06 ALS Project ID: P1500173Client Project ID: CTS of Asheville, Inc. / 6252-12-0006 ALS Sample ID: P1500173-001 Test Code: EPA TO-15 SIM Date Collected: 1/14/15Instrument ID: Tekmar AUTOCAN/Agilent 5973N/HP6890A/MS19 Date Received: 1/15/15Analyst: Wida Ang Date Analyzed: 1/21/15Sample Type: 6.0 L Summa Canister Volume(s) Analyzed: 1.00 Liter(s)Test Notes: Container ID: AC01995
1.00
CAS # Compound Result MRL MDL Result MRL MDL Dataµg/m³ µg/m³ µg/m³ ppbV ppbV ppbV Qualifier
75-01-4 Vinyl Chloride ND 0.025 0.0068 ND 0.0098 0.0027 156-60-5 trans-1,2-Dichloroethene ND 0.025 0.0064 ND 0.0063 0.0016 156-59-2 cis-1,2-Dichloroethene ND 0.025 0.0061 ND 0.0063 0.0015 79-01-6 Trichloroethene ND 0.025 0.0072 ND 0.0047 0.0013
ND = Compound was analyzed for, but not detected above the laboratory detection limit.MRL = Method Reporting Limit - The minimum quantity of a target analyte that can be confidently determined by the referenced method.
AAS-06
Canister Dilution Factor:
8 of 26

TO15SIM.XLS - NL - PageNo.:P1500173_TO15SIM_1501261405_SC.xls - Sample (2)
ALS ENVIRONMENTAL
RESULTS OF ANALYSISPage 1 of 1
Client: AMEC Foster Wheeler Environment & Infrastructure Inc.Client Sample ID: FD-14 ALS Project ID: P1500173Client Project ID: CTS of Asheville, Inc. / 6252-12-0006 ALS Sample ID: P1500173-002 Test Code: EPA TO-15 SIM Date Collected: 1/14/15Instrument ID: Tekmar AUTOCAN/Agilent 5973N/HP6890A/MS19 Date Received: 1/15/15Analyst: Wida Ang Date Analyzed: 1/21/15Sample Type: 6.0 L Silonite Canister Volume(s) Analyzed: 1.00 Liter(s)Test Notes: Container ID: AS00744
Initial Pressure (psig): -1.57 3.63
1.40
CAS # Compound Result MRL MDL Result MRL MDL Dataµg/m³ µg/m³ µg/m³ ppbV ppbV ppbV Qualifier
75-01-4 Vinyl Chloride 0.061 0.035 0.0095 0.024 0.014 0.0037156-60-5 trans-1,2-Dichloroethene 0.010 0.035 0.0090 0.0026 0.0088 0.0023 J156-59-2 cis-1,2-Dichloroethene 1.1 0.035 0.0085 0.27 0.0088 0.002279-01-6 Trichloroethene 0.86 0.035 0.010 0.16 0.0065 0.0019
ND = Compound was analyzed for, but not detected above the laboratory detection limit.MRL = Method Reporting Limit - The minimum quantity of a target analyte that can be confidently determined by the referenced method.J = The result is an estimated concentration that is less than the MRL but greater than or equal to the MDL.
AAS-06
Final Pressure (psig):
Canister Dilution Factor:
9 of 26

TO15SIM.XLS - NL - PageNo.:P1500173_TO15SIM_1501261405_SC.xls - Sample (3)
ALS ENVIRONMENTAL
RESULTS OF ANALYSISPage 1 of 1
Client: AMEC Foster Wheeler Environment & Infrastructure Inc.Client Sample ID: FD-15 ALS Project ID: P1500173Client Project ID: CTS of Asheville, Inc. / 6252-12-0006 ALS Sample ID: P1500173-003 Test Code: EPA TO-15 SIM Date Collected: 1/14/15Instrument ID: Tekmar AUTOCAN/Agilent 5973N/HP6890A/MS19 Date Received: 1/15/15Analyst: Wida Ang Date Analyzed: 1/21/15Sample Type: 6.0 L Silonite Canister Volume(s) Analyzed: 1.00 Liter(s)Test Notes: Container ID: AS00651
Initial Pressure (psig): -0.75 3.58
1.31
CAS # Compound Result MRL MDL Result MRL MDL Dataµg/m³ µg/m³ µg/m³ ppbV ppbV ppbV Qualifier
75-01-4 Vinyl Chloride ND 0.033 0.0089 ND 0.013 0.0035 156-60-5 trans-1,2-Dichloroethene ND 0.033 0.0084 ND 0.0083 0.0021 156-59-2 cis-1,2-Dichloroethene 0.19 0.033 0.0080 0.049 0.0083 0.002079-01-6 Trichloroethene 0.16 0.033 0.0094 0.030 0.0061 0.0018
ND = Compound was analyzed for, but not detected above the laboratory detection limit.MRL = Method Reporting Limit - The minimum quantity of a target analyte that can be confidently determined by the referenced method.
AAS-06
Final Pressure (psig):
Canister Dilution Factor:
10 of 26

TO15SIM.XLS - NL - PageNo.:P1500173_TO15SIM_1501261405_SC.xls - Sample (4)
ALS ENVIRONMENTAL
RESULTS OF ANALYSISPage 1 of 1
Client: AMEC Foster Wheeler Environment & Infrastructure Inc.Client Sample ID: AAS-05 ALS Project ID: P1500173Client Project ID: CTS of Asheville, Inc. / 6252-12-0006 ALS Sample ID: P1500173-004 Test Code: EPA TO-15 SIM Date Collected: 1/14/15Instrument ID: Tekmar AUTOCAN/Agilent 5973N/HP6890A/MS19 Date Received: 1/15/15Analyst: Wida Ang Date Analyzed: 1/21/15Sample Type: 6.0 L Silonite Canister Volume(s) Analyzed: 1.00 Liter(s)Test Notes: Container ID: AS00445
Initial Pressure (psig): -1.92 3.51
1.42
CAS # Compound Result MRL MDL Result MRL MDL Dataµg/m³ µg/m³ µg/m³ ppbV ppbV ppbV Qualifier
75-01-4 Vinyl Chloride 0.032 0.036 0.0097 0.013 0.014 0.0038 J156-60-5 trans-1,2-Dichloroethene 0.017 0.036 0.0091 0.0044 0.0090 0.0023 J156-59-2 cis-1,2-Dichloroethene 1.8 0.036 0.0087 0.46 0.0090 0.002279-01-6 Trichloroethene 0.78 0.036 0.010 0.15 0.0066 0.0019
ND = Compound was analyzed for, but not detected above the laboratory detection limit.MRL = Method Reporting Limit - The minimum quantity of a target analyte that can be confidently determined by the referenced method.J = The result is an estimated concentration that is less than the MRL but greater than or equal to the MDL.
AAS-06
Final Pressure (psig):
Canister Dilution Factor:
11 of 26

TO15SIM.XLS - NL - PageNo.:P1500173_TO15SIM_1501261405_SC.xls - Sample (5)
ALS ENVIRONMENTAL
RESULTS OF ANALYSISPage 1 of 1
Client: AMEC Foster Wheeler Environment & Infrastructure Inc.Client Sample ID: CAS-05 ALS Project ID: P1500173Client Project ID: CTS of Asheville, Inc. / 6252-12-0006 ALS Sample ID: P1500173-005 Test Code: EPA TO-15 SIM Date Collected: 1/14/15Instrument ID: Tekmar AUTOCAN/Agilent 5973N/HP6890A/MS19 Date Received: 1/15/15Analyst: Wida Ang Date Analyzed: 1/21/15Sample Type: 6.0 L Summa Canister Volume(s) Analyzed: 1.00 Liter(s)Test Notes: Container ID: AC01896
Initial Pressure (psig): -0.47 3.65
1.29
CAS # Compound Result MRL MDL Result MRL MDL Dataµg/m³ µg/m³ µg/m³ ppbV ppbV ppbV Qualifier
75-01-4 Vinyl Chloride 0.010 0.032 0.0088 0.0040 0.013 0.0034 J156-60-5 trans-1,2-Dichloroethene ND 0.032 0.0083 ND 0.0081 0.0021 156-59-2 cis-1,2-Dichloroethene 0.74 0.032 0.0079 0.19 0.0081 0.002079-01-6 Trichloroethene 0.40 0.032 0.0093 0.074 0.0060 0.0017
ND = Compound was analyzed for, but not detected above the laboratory detection limit.MRL = Method Reporting Limit - The minimum quantity of a target analyte that can be confidently determined by the referenced method.J = The result is an estimated concentration that is less than the MRL but greater than or equal to the MDL.
AAS-06
Final Pressure (psig):
Canister Dilution Factor:
12 of 26

TO15SIM.XLS - NL - PageNo.:P1500173_TO15SIM_1501261405_SC.xls - Sample (6)
ALS ENVIRONMENTAL
RESULTS OF ANALYSISPage 1 of 1
Client: AMEC Foster Wheeler Environment & Infrastructure Inc.Client Sample ID: IAS-05 ALS Project ID: P1500173Client Project ID: CTS of Asheville, Inc. / 6252-12-0006 ALS Sample ID: P1500173-006 Test Code: EPA TO-15 SIM Date Collected: 1/14/15Instrument ID: Tekmar AUTOCAN/Agilent 5973N/HP6890A/MS19 Date Received: 1/15/15Analyst: Wida Ang Date Analyzed: 1/21/15Sample Type: 6.0 L Summa Canister Volume(s) Analyzed: 1.00 Liter(s)Test Notes: Container ID: AC01887
Initial Pressure (psig): -1.02 3.58
1.34
CAS # Compound Result MRL MDL Result MRL MDL Dataµg/m³ µg/m³ µg/m³ ppbV ppbV ppbV Qualifier
75-01-4 Vinyl Chloride 0.0094 0.034 0.0091 0.0037 0.013 0.0036 J156-60-5 trans-1,2-Dichloroethene 0.014 0.034 0.0086 0.0035 0.0085 0.0022 J156-59-2 cis-1,2-Dichloroethene 0.60 0.034 0.0082 0.15 0.0085 0.002179-01-6 Trichloroethene 0.30 0.034 0.0096 0.055 0.0062 0.0018
ND = Compound was analyzed for, but not detected above the laboratory detection limit.MRL = Method Reporting Limit - The minimum quantity of a target analyte that can be confidently determined by the referenced method.J = The result is an estimated concentration that is less than the MRL but greater than or equal to the MDL.
AAS-06
Final Pressure (psig):
Canister Dilution Factor:
13 of 26
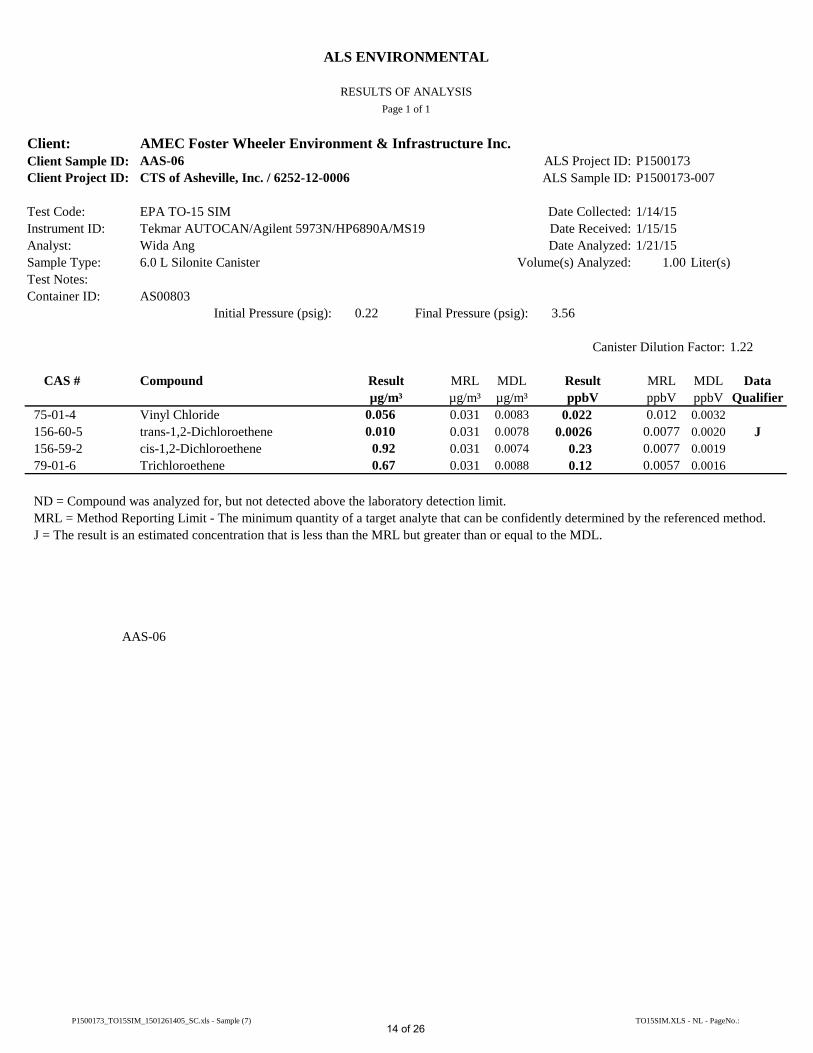
TO15SIM.XLS - NL - PageNo.:P1500173_TO15SIM_1501261405_SC.xls - Sample (7)
ALS ENVIRONMENTAL
RESULTS OF ANALYSISPage 1 of 1
Client: AMEC Foster Wheeler Environment & Infrastructure Inc.Client Sample ID: AAS-06 ALS Project ID: P1500173Client Project ID: CTS of Asheville, Inc. / 6252-12-0006 ALS Sample ID: P1500173-007 Test Code: EPA TO-15 SIM Date Collected: 1/14/15Instrument ID: Tekmar AUTOCAN/Agilent 5973N/HP6890A/MS19 Date Received: 1/15/15Analyst: Wida Ang Date Analyzed: 1/21/15Sample Type: 6.0 L Silonite Canister Volume(s) Analyzed: 1.00 Liter(s)Test Notes: Container ID: AS00803
Initial Pressure (psig): 0.22 3.56
1.22
CAS # Compound Result MRL MDL Result MRL MDL Dataµg/m³ µg/m³ µg/m³ ppbV ppbV ppbV Qualifier
75-01-4 Vinyl Chloride 0.056 0.031 0.0083 0.022 0.012 0.0032156-60-5 trans-1,2-Dichloroethene 0.010 0.031 0.0078 0.0026 0.0077 0.0020 J156-59-2 cis-1,2-Dichloroethene 0.92 0.031 0.0074 0.23 0.0077 0.001979-01-6 Trichloroethene 0.67 0.031 0.0088 0.12 0.0057 0.0016
ND = Compound was analyzed for, but not detected above the laboratory detection limit.MRL = Method Reporting Limit - The minimum quantity of a target analyte that can be confidently determined by the referenced method.J = The result is an estimated concentration that is less than the MRL but greater than or equal to the MDL.
AAS-06
Final Pressure (psig):
Canister Dilution Factor:
14 of 26

TO15SIM.XLS - NL - PageNo.:P1500173_TO15SIM_1501261405_SC.xls - Sample (8)
ALS ENVIRONMENTAL
RESULTS OF ANALYSISPage 1 of 1
Client: AMEC Foster Wheeler Environment & Infrastructure Inc.Client Sample ID: CAS-04 ALS Project ID: P1500173Client Project ID: CTS of Asheville, Inc. / 6252-12-0006 ALS Sample ID: P1500173-008 Test Code: EPA TO-15 SIM Date Collected: 1/14/15Instrument ID: Tekmar AUTOCAN/Agilent 5973N/HP6890A/MS19 Date Received: 1/15/15Analyst: Wida Ang Date Analyzed: 1/21/15Sample Type: 6.0 L Silonite Canister Volume(s) Analyzed: 1.00 Liter(s)Test Notes: Container ID: AS00789
Initial Pressure (psig): 0.05 3.53
1.24
CAS # Compound Result MRL MDL Result MRL MDL Dataµg/m³ µg/m³ µg/m³ ppbV ppbV ppbV Qualifier
75-01-4 Vinyl Chloride 0.021 0.031 0.0084 0.0082 0.012 0.0033 J156-60-5 trans-1,2-Dichloroethene ND 0.031 0.0079 ND 0.0078 0.0020 156-59-2 cis-1,2-Dichloroethene 0.51 0.031 0.0076 0.13 0.0078 0.001979-01-6 Trichloroethene 0.36 0.031 0.0089 0.066 0.0058 0.0017
ND = Compound was analyzed for, but not detected above the laboratory detection limit.MRL = Method Reporting Limit - The minimum quantity of a target analyte that can be confidently determined by the referenced method.J = The result is an estimated concentration that is less than the MRL but greater than or equal to the MDL.
AAS-06
Final Pressure (psig):
Canister Dilution Factor:
15 of 26

TO15SIM.XLS - NL - PageNo.:P1500173_TO15SIM_1501261405_SC.xls - Sample (9)
ALS ENVIRONMENTAL
RESULTS OF ANALYSISPage 1 of 1
Client: AMEC Foster Wheeler Environment & Infrastructure Inc.Client Sample ID: IAS-04 ALS Project ID: P1500173Client Project ID: CTS of Asheville, Inc. / 6252-12-0006 ALS Sample ID: P1500173-009 Test Code: EPA TO-15 SIM Date Collected: 1/14/15Instrument ID: Tekmar AUTOCAN/Agilent 5973N/HP6890A/MS19 Date Received: 1/15/15Analyst: Wida Ang Date Analyzed: 1/21/15Sample Type: 6.0 L Summa Canister Volume(s) Analyzed: 1.00 Liter(s)Test Notes: Container ID: AC02056
Initial Pressure (psig): -0.83 3.66
1.32
CAS # Compound Result MRL MDL Result MRL MDL Dataµg/m³ µg/m³ µg/m³ ppbV ppbV ppbV Qualifier
75-01-4 Vinyl Chloride 0.018 0.033 0.0090 0.0069 0.013 0.0035 J156-60-5 trans-1,2-Dichloroethene ND 0.033 0.0084 ND 0.0083 0.0021 156-59-2 cis-1,2-Dichloroethene 0.44 0.033 0.0081 0.11 0.0083 0.002079-01-6 Trichloroethene 0.36 0.033 0.0095 0.067 0.0061 0.0018
ND = Compound was analyzed for, but not detected above the laboratory detection limit.MRL = Method Reporting Limit - The minimum quantity of a target analyte that can be confidently determined by the referenced method.J = The result is an estimated concentration that is less than the MRL but greater than or equal to the MDL.
AAS-06
Final Pressure (psig):
Canister Dilution Factor:
16 of 26

TO15SIM.XLS - NL - PageNo.:P1500173_TO15SIM_1501261405_SC.xls - Sample (10)
ALS ENVIRONMENTAL
RESULTS OF ANALYSISPage 1 of 1
Client: AMEC Foster Wheeler Environment & Infrastructure Inc.Client Sample ID: CAS-06 ALS Project ID: P1500173Client Project ID: CTS of Asheville, Inc. / 6252-12-0006 ALS Sample ID: P1500173-010 Test Code: EPA TO-15 SIM Date Collected: 1/14/15Instrument ID: Tekmar AUTOCAN/Agilent 5973N/HP6890A/MS19 Date Received: 1/15/15Analyst: Wida Ang Date Analyzed: 1/21/15Sample Type: 6.0 L Summa Canister Volume(s) Analyzed: 1.00 Liter(s)Test Notes: Container ID: AC01784
Initial Pressure (psig): -0.26 3.59
1.27
CAS # Compound Result MRL MDL Result MRL MDL Dataµg/m³ µg/m³ µg/m³ ppbV ppbV ppbV Qualifier
75-01-4 Vinyl Chloride 0.0099 0.032 0.0086 0.0039 0.012 0.0034 J156-60-5 trans-1,2-Dichloroethene ND 0.032 0.0081 ND 0.0080 0.0021 156-59-2 cis-1,2-Dichloroethene 0.24 0.032 0.0077 0.061 0.0080 0.002079-01-6 Trichloroethene 0.18 0.032 0.0091 0.034 0.0059 0.0017
ND = Compound was analyzed for, but not detected above the laboratory detection limit.MRL = Method Reporting Limit - The minimum quantity of a target analyte that can be confidently determined by the referenced method.J = The result is an estimated concentration that is less than the MRL but greater than or equal to the MDL.
AAS-06
Final Pressure (psig):
Canister Dilution Factor:
17 of 26

TO15SIM.XLS - NL - PageNo.:P1500173_TO15SIM_1501261405_SC.xls - Sample (11)
ALS ENVIRONMENTAL
RESULTS OF ANALYSISPage 1 of 1
Client: AMEC Foster Wheeler Environment & Infrastructure Inc.Client Sample ID: IAS-06 ALS Project ID: P1500173Client Project ID: CTS of Asheville, Inc. / 6252-12-0006 ALS Sample ID: P1500173-011 Test Code: EPA TO-15 SIM Date Collected: 1/14/15Instrument ID: Tekmar AUTOCAN/Agilent 5973N/HP6890A/MS19 Date Received: 1/15/15Analyst: Wida Ang Date Analyzed: 1/21/15Sample Type: 6.0 L Silonite Canister Volume(s) Analyzed: 1.00 Liter(s)Test Notes: Container ID: AS00550
Initial Pressure (psig): -3.15 3.57
1.58
CAS # Compound Result MRL MDL Result MRL MDL Dataµg/m³ µg/m³ µg/m³ ppbV ppbV ppbV Qualifier
75-01-4 Vinyl Chloride ND 0.040 0.011 ND 0.015 0.0042 156-60-5 trans-1,2-Dichloroethene ND 0.040 0.010 ND 0.010 0.0026 156-59-2 cis-1,2-Dichloroethene 0.30 0.040 0.0096 0.077 0.010 0.002479-01-6 Trichloroethene 0.23 0.040 0.011 0.044 0.0074 0.0021
ND = Compound was analyzed for, but not detected above the laboratory detection limit.MRL = Method Reporting Limit - The minimum quantity of a target analyte that can be confidently determined by the referenced method.
AAS-06
Final Pressure (psig):
Canister Dilution Factor:
18 of 26

TO15SIM.XLS - NL - PageNo.:P1500173_TO15SIM_1501261405_SC.xls - MBlank
ALS ENVIRONMENTAL
RESULTS OF ANALYSISPage 1 of 1
Client: AMEC Foster Wheeler Environment & Infrastructure Inc.Client Sample ID: Method Blank ALS Project ID: P1500173Client Project ID: CTS of Asheville, Inc. / 6252-12-0006 ALS Sample ID: P150121-MB Test Code: EPA TO-15 SIM Date Collected: NAInstrument ID: Tekmar AUTOCAN/Agilent 5973N/HP6890A/MS19 Date Received: NAAnalyst: Wida Ang Date Analyzed: 1/21/15Sample Type: 6.0 L Summa Canister Volume(s) Analyzed: 1.00 Liter(s)Test Notes:
Canister Dilution Factor: 1.00
CAS # Compound Result MRL MDL Result MRL MDL Dataµg/m³ µg/m³ µg/m³ ppbV ppbV ppbV Qualifier
75-01-4 Vinyl Chloride ND 0.025 0.0068 ND 0.0098 0.0027 156-60-5 trans-1,2-Dichloroethene ND 0.025 0.0064 ND 0.0063 0.0016 156-59-2 cis-1,2-Dichloroethene ND 0.025 0.0061 ND 0.0063 0.0015 79-01-6 Trichloroethene ND 0.025 0.0072 ND 0.0047 0.0013
ND = Compound was analyzed for, but not detected above the laboratory detection limit.MRL = Method Reporting Limit - The minimum quantity of a target analyte that can be confidently determined by the referenced method.
AAS-06
19 of 26

TO15SIM.XLS - NL - PageNo.:P1500173_TO15SIM_1501261405_SC.xls - Surrogates
ALS ENVIRONMENTAL
SURROGATE SPIKE RECOVERY RESULTSPage 1 of 1
Client: AMEC Foster Wheeler Environment & Infrastructure Inc.Client Project ID: CTS of Asheville, Inc. / 6252-12-0006 ALS Project ID: P1500173
Test Code: EPA TO-15 SIMInstrument ID: Tekmar AUTOCAN/Agilent 5973N/HP6890A/MS19 Date(s) Collected: 1/14/15Analyst: Wida Ang Date(s) Received: 1/15/15Sample Type: 6.0 L Summa Canister(s) Date(s) Analyzed: 1/21/15Test Notes:
Client Sample ID ALS Sample ID Acceptance DataLimits Qualifier
P150121-MB 70-130 P150121-LCS 70-130 P1500173-001 70-130 P1500173-002 70-130 P1500173-003 70-130 P1500173-004 70-130 P1500173-005 70-130 P1500173-006 70-130 P1500173-007 70-130 P1500173-008 70-130 P1500173-009 70-130 P1500173-010 70-130 P1500173-011 70-130
Surrogate percent rec AAS-06Reported results are shown in concentration units and as a result of the calculation, may vary slightly from the on-column percent recovery.
CAS-04IAS-04CAS-06IAS-06
FD-14FD-15AAS-05CAS-05IAS-05AAS-06
TB-06Lab Control SampleMethod Blank
Bromofluorobenzene%
Recovered83
1,2-Dichloroethane-d4%
Recovered105
Toluene-d8
Recovered%
98104 92 90102 83 90100 91 86101 98 8897 96 8899 94 85
100 97 8997 94 10596 93 89
96 91 97
97 97 8896 96 93
20 of 26

TO15SIM.XLS - NL - PageNo.:P1500173_TO15SIM_1501261405_SC.xls - LCS
ALS ENVIRONMENTAL
LABORATORY CONTROL SAMPLE SUMMARYPage 1 of 1
Client: AMEC Foster Wheeler Environment & Infrastructure Inc.Client Sample ID: Lab Control Sample ALS Project ID: P1500173Client Project ID: CTS of Asheville, Inc. / 6252-12-0006 ALS Sample ID: P150121-LCS
Test Code: EPA TO-15 SIM Date Collected: NAInstrument ID: Tekmar AUTOCAN/Agilent 5973N/HP6890A/MS19 Date Received: NAAnalyst: Wida Ang Date Analyzed: 1/21/15Sample Type: 6.0 L Summa Canister Volume(s) Analyzed: 0.125 Liter(s)Test Notes:
ALS
CAS # Compound % Recovery Acceptance Data Limits Qualifier
75-01-4 Vinyl Chloride 156-60-5 trans-1,2-Dichloroethene 156-59-2 cis-1,2-Dichloroethene 79-01-6 Trichloroethene
Laboratory Control Sample percent recovery is verified and accepted based on the on-column result.Reported results are shown in concentration units and as a result of the calculation, may vary slightly.
AAS-06
4.044.24
4.16
2.65
Resultµg/m³
3.16
3.934.28 3.94
Spike Amountµg/m³
94 66-116
63-12075 66-11566
92 66-116
21 of 26
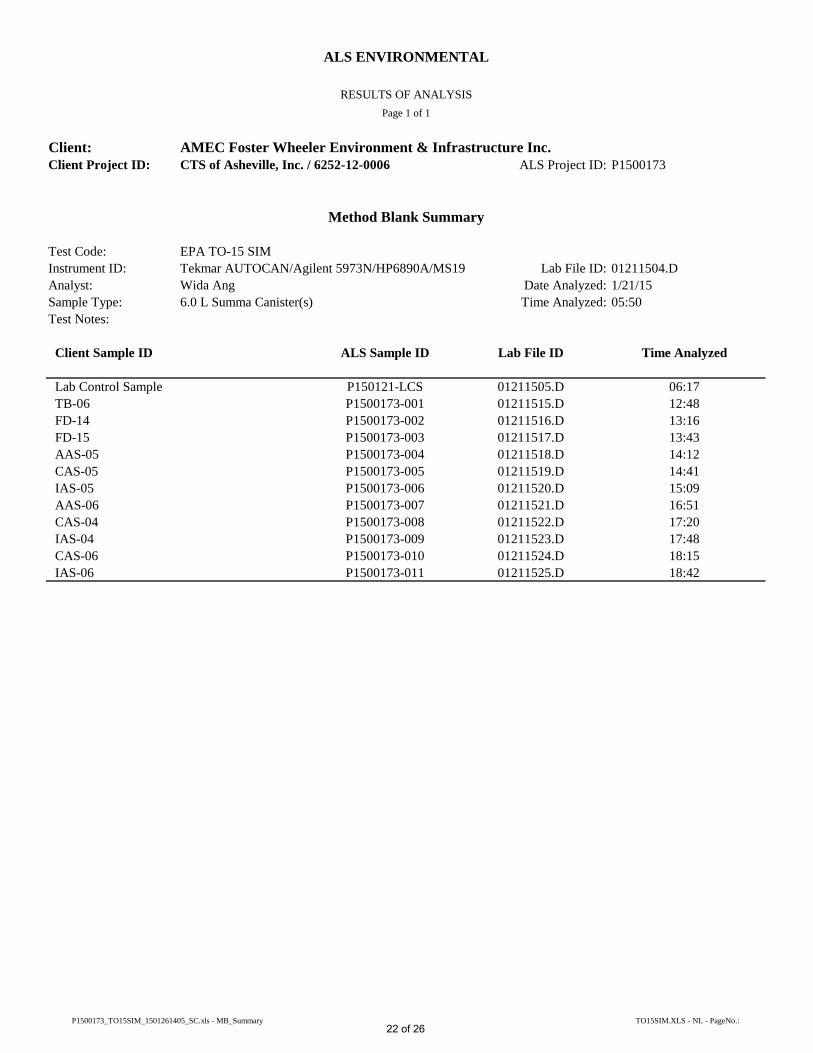
TO15SIM.XLS - NL - PageNo.:P1500173_TO15SIM_1501261405_SC.xls - MB_Summary
ALS ENVIRONMENTAL
RESULTS OF ANALYSISPage 1 of 1
Client: AMEC Foster Wheeler Environment & Infrastructure Inc.CTS of Asheville, Inc. / 6252-12-0006 ALS Project ID: P1500173
Method Blank Summary
Test Code: EPA TO-15 SIMInstrument ID: Tekmar AUTOCAN/Agilent 5973N/HP6890A/MS19 Lab File ID: 01211504.DAnalyst: Wida Ang Date Analyzed: 1/21/15Sample Type: 6.0 L Summa Canister(s) Time Analyzed: 05:50Test Notes:
Client Sample ID
CAS-06 P1500173-010 01211524.D 18:15IAS-06 P1500173-011 01211525.D 18:42
CAS-04 P1500173-008 01211522.D 17:20IAS-04 P1500173-009 01211523.D 17:48
IAS-05 P1500173-006 01211520.D 15:09AAS-06 P1500173-007 01211521.D 16:51
AAS-05 P1500173-004 01211518.D 14:12CAS-05 P1500173-005 01211519.D 14:41
FD-14 P1500173-002 01211516.D 13:16FD-15 P1500173-003 01211517.D 13:43
TB-06 P1500173-001 01211515.D 12:4801211505.D 06:17
ALS Sample ID Lab File ID Time Analyzed
Client Project ID:
Lab Control Sample P150121-LCS
22 of 26

TO15SIM.XLS - NL - PageNo.:P1500173_TO15SIM_1501261405_SC.xls - ISS
ALS ENVIRONMENTAL
RESULTS OF ANALYSISPage 1 of 1
Client: AMEC Foster Wheeler Environment & Infrastructure Inc.CTS of Asheville, Inc. / 6252-12-0006 ALS Project ID: P1500173
Internal Standard Area and RT Summary
Test Code: EPA TO-15 SIMInstrument ID: Tekmar AUTOCAN/Agilent 5973N/HP6890A/MS19 Lab File ID: 01211502.DAnalyst: Wida Ang Date Analyzed: 1/21/15Sample Type: 6.0 L Summa Canister(s) Time Analyzed: 04:55
Test Notes:
IS1 (BCM) IS2 (DFB) IS3 (CBZ)AREA # RT # AREA # RT # AREA # RT #
24 Hour Standard 36798 6.11 212376 8.71 23871 13.13 Upper Limit 51517 6.44 297326 9.04 33419 13.46 Lower Limit 22079 5.78 127426 8.38 14323 12.80
Client Sample ID01 Method Blank 39452 6.12 189046 8.72 22367 13.1302 Lab Control Sample 41084 6.11 205109 8.72 23203 13.1303 TB-06 41197 6.12 184647 8.72 18625 13.1304 FD-14 42119 6.11 211946 8.72 24202 13.1305 FD-15 43908 6.13 214453 8.73 26929 13.1306 AAS-05 45883 6.11 231990 8.72 27003 13.1307 CAS-05 44337 6.11 229666 8.72 27045 13.1308 IAS-05 48317 6.12 245833 8.72 28646 13.1309 AAS-06 48289 6.11 251238 8.72 23029 13.1310 CAS-04 47240 6.11 244507 8.71 26997 13.1311 IAS-04 49012 6.12 249178 8.72 29329 13.1312 CAS-06 49373 6.12 253998 8.72 25624 13.1313 IAS-06 50638 6.12 261711 8.72 25249 13.1314151617181920
IS1 (BCM) = BromochloromethaneIS2 (DFB) = 1,4-DifluorobenzeneIS3 (CBZ) = Chlorobenzene-d5
AREA UPPER LIMIT = 140% of internal standard areaAREA LOWER LIMIT = 60% of internal standard areaRT UPPER LIMIT = 0.33 minutes of internal standard RTRT LOWER LIMIT = 0.33 minutes of internal standard RT
# Column used to flag values outside QC limits with an I.I = Internal standard not within the specified limits. See case narrative.
Client Project ID:
23 of 26

Method Path : I :\MS1 9\METHODS\ Method File : Xl912 0514.M
Response Factor Report MS 1 9
Title : EPA T0-15 pe r SOP VOA-T01 5 (CASS T0-15/GC-MS ) Last Update : Sat Dec 0 6 09 :27:43 2014 Response Via : Initial Calibrat~on
Cal ibration Files 10 =12051405 . D 20 = 12051406.D 50 =12051407 . D 100 =12051408.D 500 =12051409 . D 1000=12051 410 - D 2500=12051411.D 20K =1 2051412.D SOK =12051413 . D
Compound 10 20 50 100 500 1000 2500 20K SOK Avg %RSD
1) I Bromochloromethane ... ----------------ISTD---------------------2) T Dichlorodifluo ... 2 . 212 1.963 2 .18 2 2.039 1. 988 2.216 1.981 2.136 2 . 299 2.113 5 . 82 3) T Chloromethane 0.753 0.560 0.560 0.498 0.4 68 0.512 0 .4 63 0.502 0 . 547 0 . 540 16.20 4) T Vi nyl Chloride 1.738 1.520 1.687 1 . 577 1.515 l. 693 1.522 1.618 l. 699 l. 619 5 . 47 5) T Bromomethane 1.210 1.063 0.934 0 .833 0 . 918 0.833 0 . 921 l. 005 0 . 965 13.07 6) T Chloroethane 0.769 0.690 0.748 0.693 0 .667 0. 743 0.667 0 . 715 0 . 775 0 .719 5.82 7) T Acetone 1.028 0 . 581 0 . 610 0.557 0.619 0 . 561 0 . 659 27.62 8) T Trichlorofluor ... 1.503 1.367 1.551 1.436 1.401 1 . 570 1.410 1 . 510 1.625 1.486 5 . 88 9) T 1,1-Dichloroet ... 1.098 0.980 1.089 1.017 0 . 995 1 .112 1. ODO 1. 072 1.183 l. 061 6 . 34
10) T Methylene Chl o ... 1.341 1. 223 1. 091 0.989 1. 100 0 . 982 1.048 1 .153 1. 116 10 . 89 11) T Trichlorotrifl ... 1. 1 04 1.D59 1.152 1.070 1.018 1 .1 30 1.013 1 .0 84 1. 185 1. 091 5.34 12 ) T trans-1,2-Dich .. . 1. 305 1. 088 1.192 1.109 1. 074 1.205 1.088 1 .183 1. 305 1 .172 7.66 13) T 1, 1-Dichl oroet ... 1. 809 1.637 1.803 1.679 1 . 643 1.829 1.649 l. 769 1. 937 1 .751 5 . 97 14) T Methyl tert-Bu ... 3 . 091 2.888 3. 1 26 2.977 2 . 884 3.236 2.932 3.168 3.435 3 . 082 5 . 93 15) T c is-1,2-Dichl o ... 1 .216 1.080 1.198 1. 129 l. 108 1 . 241 1.123 1. 212 1. 323 1.181 6 . 54 16) T Chloroform 3.211 2.287 1 . 935 1 . 667 1 . 824 1.631 1 .717 1.825 2.012 26.16 17) s 1,2-Dichloroet ... 1 .371 1.375 1.367 1. 344 1 . 367 1 . 357 1 .360 1 . 318 1. 265 l. 347 2 . 62 18) T 1,2-Dichloroet ... 1.234 1 .093 1 . 225 1.156 1. 131 l. 265 1. 138 1 .206 1 . 296 1.194 5 . 69 19) T 1,1,1-Trichlor ... 1.687 1 .528 1 . 695 1.580 1.542 1. 723 l. 551 1 .667 1 . 813 1 . 643 5.95 20) T Benzene 6.553 5.598 3.894 4 . 347 3 . 833 4.057 4.316 4 .657 22 . 02 21) T Carbon Tetrach ... 1.474 l.221 1. 293 1.223 1.242 1.408 1.285 1.397 1 . 505 1.339 8 . 17
22) I 1, 4-Difluorobenzen ... ----------------ISTD----- ----------------23) T 1, 2 - Dichloropr ... 0.208 0.185 0.207 0.193 0 . 190 0 . 212 0 . 193 0.209 0 . 230 0 . 203 6 . 98 24) T Bromodichlorom ... 0 . 272 0 . 241 0.271 0.252 0.252 0.283 0 . 259 0.288 0 . 319 0 . 271 8.80 25) T Trichloroethene 0 . 280 0 .243 0 . 268 0 . 247 0.232 0. 262 0.238 0.264 0 .2 92 0 . 258 7.77 26) T 1,4-Dioxane 0.193 0 . 164 0.178 0 . 164 0.158 0 . 179 0 . 178 0.193 0.213 0 . 180 9 . 65 27) T cis-1,3- Dichlo ... 0.318 0 .279 0 . 312 0 . 291 0 . 291 0.331 0 . 307 0 . 348 0.384 0.318 1 0.32 28) T trans-1,3-Dich ... 0.274 0.236 0 . 267 0.248 0 . 251 0.289 0.273 0.315 0 . 349 0 . 278 1 2.81 29) T 1,1,2-Trichlor ... 0.174 0. 1 57 0.174 0 . 163 0 . 164 0.183 0 . 168 0 . 184 0.203 0.174 8 . 04 30) s Toluene-dB (SS2) 0.902 0. 907 0.903 0.896 0.898 0.898 0 . 903 0.910 0 . 904 0.902 0.49 31) T Toluene 1.388 1.041 1.040 0.937 0 . 823 0.92 1 0.838 0 . 899 0 . 947 0.981 1 7 .33 32) T 1 , 2-Dibromoethane 0.226 0 . 203 0.226 0 . 212 0 . 215 0 .243 0.226 0 . 250 0.275 0.231 9 . 57 33) T Tetrachloroethene 0.294 0.262 0.295 0.275 0 . 277 0.310 0 . 282 0.309 0.337 0.293 7 . 69
34) I Chlorobenzene-d5 ( ... ----------------!STD---------------------35) T Chlorobenzene 5 .1 88 4.620 5 . 082 4 . 834 4.833 5.358 4 . 772 4.645 4 . 157 4. 832 7 . 33 36) T Ethylbenzene 9.036 7.647 8.180 7 . 725 7.828 8.751 7 . 870 7.617 8.082 6 . 63 37) T m,p-Xylene 7.755 6 .11 9 6.474 6.113 6.354 7.155 6 . 448 6 . 084 6.563 9. 04
X19120514.M Mon Dec 15 0 8 :37:42 2014 Page: 1
1~6/t'f ""-- Ji11 /.;l.//~ /If
24 of 26

Re sponse Factor Repbrt MS19
Metho d Pat h : l : \MS19\METHODS\ Met hod File : Xl 9 1 2 051 4 . M Ti t le : EPA T0-15 p er SOP VOA-T01 5 (CASS T0 -15/GC-MS)
3 8) T a -Xylene 3 .600 3. 036 3.2 49 3. 117 3.224 3. 63 2 3 . 26 7 3.1 3 5 2 . 663 3.214 9 . 0 6 39) T 1,1, 2 , 2 - Tetrac ... 3. 18 8 2 . 7 5 6 3 . 056 2.946 3.086 3.488 3 . 138 3 .000 2 . 557 3 . 024 8.72 40) s Bro mo fluo r oben ... 3.133 3 . 121 3 .132 3 . 08 1 3.171 3.157 3.208 2 . 899 2 . 398 3.033 8.37 4 1) T 1, 3 - Di c hlorobe ... 4 .34 4 3 . 860 4 . 2 7 3 4 . 08 6 4 . 2 1 4 4 .760 4 .322 4.120 3 . 455 4 . 159 8 . 62 42 ) T 1,4-Di chl orobe ... 4 .74 7 4 .128 4 . 5 50 4 . 35 0 4 .4 0 5 5 .0 02 4 . 63 1 4. 362 3. 786 4.4 40 7 . 96 43) T 1 ,2-Dichlorobe ... 4 .13 7 3 .705 4. 1 2 9 3.962 4. 125 4 .647 4 . 209 3. 948 3.436 4.033 8 . 38 44) T 1 , 2 , 4-Trichlor . .. 3.095 2.770 3. 1 02 2.963 2 . 93 6 3.396 3.242 3.039 2.729 3 . 030 7 . 00 45) T Na phth a l ene 1 .091 0 . 880 0 . 938 0 .884 0 . 902 1. 054 1 .033 0.900 0 . 960 El 8.90 46) T Hexachlo r obuta ... 2 .26 6 2 . 0 44 2.25 7 2 .1 6 6 1. 997 2 . 267 2.019 1. 943 1. 806 2 . 085 7 . 8 4 ----------------------------------------------------------------------------(#) = Out of Range
JiJ11 1.,)./ IS- /I </
X19120514 . M Mon Dec 15 08:37:42 2014 Page : 2
,ul51' v v-
25 of 26
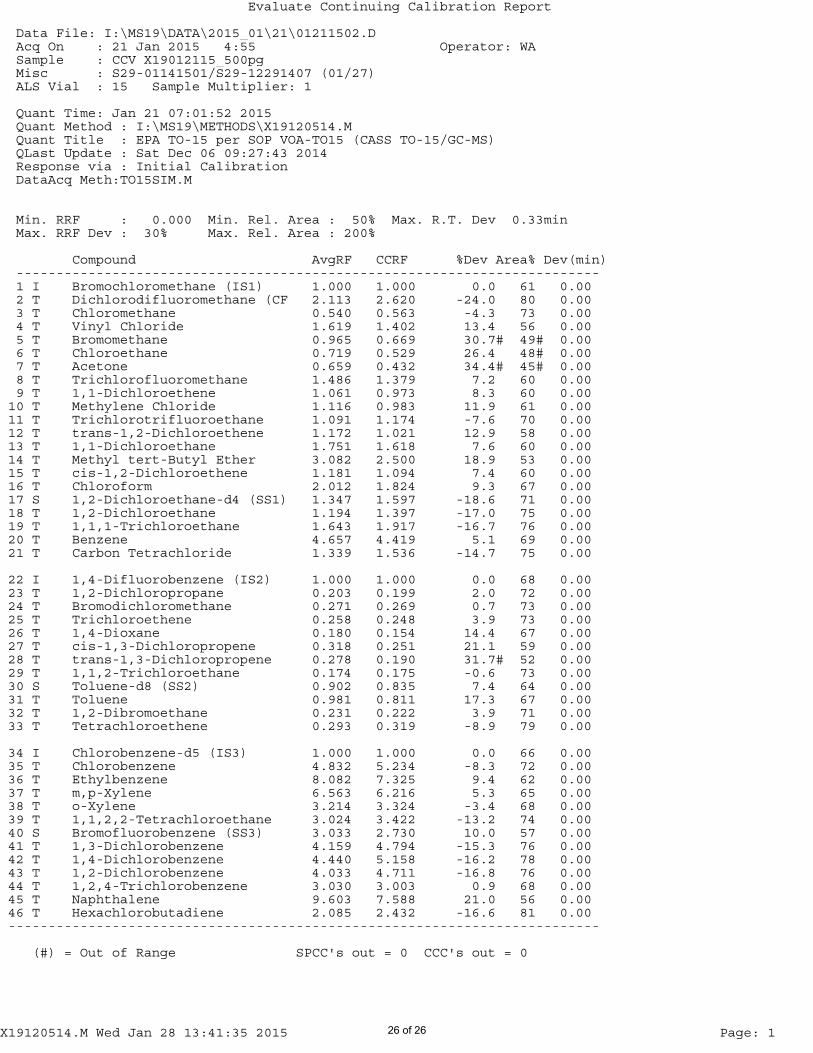
Evaluate Continuing Calibration Report Data File: I:\MS19\DATA\2015_01\21\01211502.D Acq On : 21 Jan 2015 4:55 Operator: WA Sample : CCV X19012115_500pg Misc : S29-01141501/S29-12291407 (01/27) ALS Vial : 15 Sample Multiplier: 1 Quant Time: Jan 21 07:01:52 2015 Quant Method : I:\MS19\METHODS\X19120514.M Quant Title : EPA TO-15 per SOP VOA-TO15 (CASS TO-15/GC-MS) QLast Update : Sat Dec 06 09:27:43 2014 Response via : Initial Calibration DataAcq Meth:TO15SIM.M Min. RRF : 0.000 Min. Rel. Area : 50% Max. R.T. Dev 0.33min Max. RRF Dev : 30% Max. Rel. Area : 200% Compound AvgRF CCRF %Dev Area% Dev(min) ------------------------------------------------------------------------- 1 I Bromochloromethane (IS1) 1.000 1.000 0.0 61 0.00 2 T Dichlorodifluoromethane (CF 2.113 2.620 -24.0 80 0.00 3 T Chloromethane 0.540 0.563 -4.3 73 0.00 4 T Vinyl Chloride 1.619 1.402 13.4 56 0.00 5 T Bromomethane 0.965 0.669 30.7# 49# 0.00 6 T Chloroethane 0.719 0.529 26.4 48# 0.00 7 T Acetone 0.659 0.432 34.4# 45# 0.00 8 T Trichlorofluoromethane 1.486 1.379 7.2 60 0.00 9 T 1,1-Dichloroethene 1.061 0.973 8.3 60 0.00 10 T Methylene Chloride 1.116 0.983 11.9 61 0.00 11 T Trichlorotrifluoroethane 1.091 1.174 -7.6 70 0.00 12 T trans-1,2-Dichloroethene 1.172 1.021 12.9 58 0.00 13 T 1,1-Dichloroethane 1.751 1.618 7.6 60 0.00 14 T Methyl tert-Butyl Ether 3.082 2.500 18.9 53 0.00 15 T cis-1,2-Dichloroethene 1.181 1.094 7.4 60 0.00 16 T Chloroform 2.012 1.824 9.3 67 0.00 17 S 1,2-Dichloroethane-d4 (SS1) 1.347 1.597 -18.6 71 0.00 18 T 1,2-Dichloroethane 1.194 1.397 -17.0 75 0.00 19 T 1,1,1-Trichloroethane 1.643 1.917 -16.7 76 0.00 20 T Benzene 4.657 4.419 5.1 69 0.00 21 T Carbon Tetrachloride 1.339 1.536 -14.7 75 0.00 22 I 1,4-Difluorobenzene (IS2) 1.000 1.000 0.0 68 0.00 23 T 1,2-Dichloropropane 0.203 0.199 2.0 72 0.00 24 T Bromodichloromethane 0.271 0.269 0.7 73 0.00 25 T Trichloroethene 0.258 0.248 3.9 73 0.00 26 T 1,4-Dioxane 0.180 0.154 14.4 67 0.00 27 T cis-1,3-Dichloropropene 0.318 0.251 21.1 59 0.00 28 T trans-1,3-Dichloropropene 0.278 0.190 31.7# 52 0.00 29 T 1,1,2-Trichloroethane 0.174 0.175 -0.6 73 0.00 30 S Toluene-d8 (SS2) 0.902 0.835 7.4 64 0.00 31 T Toluene 0.981 0.811 17.3 67 0.00 32 T 1,2-Dibromoethane 0.231 0.222 3.9 71 0.00 33 T Tetrachloroethene 0.293 0.319 -8.9 79 0.00 34 I Chlorobenzene-d5 (IS3) 1.000 1.000 0.0 66 0.00 35 T Chlorobenzene 4.832 5.234 -8.3 72 0.00 36 T Ethylbenzene 8.082 7.325 9.4 62 0.00 37 T m,p-Xylene 6.563 6.216 5.3 65 0.00 38 T o-Xylene 3.214 3.324 -3.4 68 0.00 39 T 1,1,2,2-Tetrachloroethane 3.024 3.422 -13.2 74 0.00 40 S Bromofluorobenzene (SS3) 3.033 2.730 10.0 57 0.00 41 T 1,3-Dichlorobenzene 4.159 4.794 -15.3 76 0.00 42 T 1,4-Dichlorobenzene 4.440 5.158 -16.2 78 0.00 43 T 1,2-Dichlorobenzene 4.033 4.711 -16.8 76 0.00 44 T 1,2,4-Trichlorobenzene 3.030 3.003 0.9 68 0.00 45 T Naphthalene 9.603 7.588 21.0 56 0.00 46 T Hexachlorobutadiene 2.085 2.432 -16.6 81 0.00 -------------------------------------------------------------------------- (#) = Out of Range SPCC's out = 0 CCC's out = 0
X19120514.M Wed Jan 28 13:41:35 2015 Page: 126 of 26
widayati.ang
Wida Ang

CTS of Asheville, Inc. Superfund Site Report of January 2015 Vapor Intrusion Monitoring (“Springs Area” Residences) Amec Foster Wheeler Project 6252-12-0006 March 6, 2015
APPENDIX E
DATA VALIDATION

CTS of Asheville, Inc. Superfund Site Report of January 201 Vapor Intrusion Monitoring (“Springs Area” Residences): Appendix E Amec Foster Wheeler Project 6252-12-0006 March 6, 2015
E-1
DATA VALIDATION REPORT CTS of Asheville, Inc. Superfund Site
Asheville, North Carolina Introduction
Air samples were collected at the CTS of Asheville, Inc. Superfund Site (Site) in Asheville, North Carolina in January 2015 and submitted for off-site laboratory analysis. Samples were analyzed by ALS Environmental in Simi Valley, California. Results were reported in Sample Delivery Group (SDG): P1500173. A listing of samples included in this Data Validation Report is presented in Table E.1 and a summary of the analytical results is presented in Table E.2. Samples were analyzed by the following method:
Volatile organic compounds (VOCs) by USEPA Method TO-15 (project list only)
Deliverables for the off-site laboratory analyses included a Level IV data package. Data validation was completed based on procedures in the USEPA Region 4 Data Validation Standard Operating Procedures (Region 4 SOP) for Organic Analysis (USEPA, 2008), in conjunction with the laboratory’s Method TO-15 Selective Ion Monitoring (SIM) SOP (ALS, 2014) and the CTS of Asheville, Inc. Superfund Site Quality Assurance Project Plan (QAPP), Revision 4 (Amec Foster Wheeler, 2014). Quality control limits listed in the Region 4 SOP and QAPP were used during the data evaluation. The validation included the following evaluations:
Lab report narrative Sample collection and chain of custody Data package completeness Holding times Quality control data (blanks, instrument tune and calibrations, lab control
samples, duplicates, and surrogate recovery) Internal standard response and retention time Data transcription Calculations Electronic data reporting Data qualification
The following laboratory or data validation qualifiers are used in the final data presentation. U = target analyte is not detected at the reported detection limit J = concentration is estimated Results are interpreted to be usable as reported by the laboratory unless discussed in the following sections.

CTS of Asheville, Inc. Superfund Site Report of January 201 Vapor Intrusion Monitoring (“Springs Area” Residences): Appendix E Amec Foster Wheeler Project 6252-12-0006 March 6, 2015
E-2
Data Validation Results
Quality control issues were not identified during the data validation. Several data validation observations are discussed below. Field Duplicates A summary of field duplicate results is presented on Table E.3. Good agreement was observed for target analytes in both field duplicate pairs. Relative percent differences (RPDs) between results were less than the QAPP-specified control limit of 50. Sample Reporting A subset of project-specific TO-15 compounds (trichloroethene, cis-1,2-dichloroethene, trans-1,2-dichloroethene, and vinyl chloride) was reported in the data set. References:
ALS Environmental, 2014. Standard Operating Procedure for Determination of Volatile Organic Compounds in Air Samples Collected in Specially Prepared Canisters and Gas Collection Bags by Gas Chromatography/Mass Spectrometry (GC/MS), Revision 21.0, February 15, 2014.
Amec Foster Wheeler, 2014. Vapor Intrusion Assessment Work Plan: Quality Assurance
Project Plan (Revision 4), March 14, 2014. USEPA Region 4, 2008. “Data Validation Standard Operating Procedures for Organic
Analysis” Science and Ecosystem Support Division, Quality Assurance Section, MTSB, Revision 3.1.
Data Validator: Julie Ricardi Date: 2/25/2015 Reviewed by Chris Ricardi, NRCC-EAC
Date: 2/28/2015

Location Field Sample ID SDG Sample Date Lab ID
AAS-05 AAS-05 P1500173 01/14/15 P1500173-004
AAS-06 AAS-06 P1500173 01/14/15 P1500173-007
AAS-06 FD-14 P1500173 01/14/15 P1500173-002
CAS-04 CAS-04 P1500173 01/14/15 P1500173-008
CAS-05 CAS-05 P1500173 01/14/15 P1500173-005
CAS-06 CAS-06 P1500173 01/14/15 P1500173-010
IAS-04 IAS-04 P1500173 01/14/15 P1500173-009
IAS-05 IAS-05 P1500173 01/14/15 P1500173-006
IAS-06 FD-15 P1500173 01/14/15 P1500173-003
IAS-06 IAS-06 P1500173 01/14/15 P1500173-011
QC TB-05 P1500173 01/14/15 P1500173-001
Prepared By: WCG 2/23/15Checked By: JAR 2/24/15
TABLE E.1Data Validation Report: Sample Summary
CTS of Asheville, Inc. Superfund SiteAsheville, North Carolina
Amec Foster Wheeler Project 6252-12-0006

TABLE E.2 Data Validation Report: Sample Result Summary
CTS of Asheville, Inc. Superfund SiteAsheville, North Carolina
Amec Foster Wheeler Project 6252-12-0006
Location
Sample Date
Field Sample ID
Method Parameter Result Qual Result Qual Result Qual Result Qual Result Qual Result Qual
TO-15 SIM cis-1,2-Dichloroethene 1.8 0.92 1.1 0.51 0.74 0.24TO-15 SIM trans-1,2-Dichloroethene 0.017 J 0.01 J 0.01 J 0.031 U 0.032 U 0.032 UTO-15 SIM Trichloroethene 0.78 0.67 0.86 0.36 0.40 0.18TO-15 SIM Vinyl chloride 0.032 J 0.056 0.061 0.021 J 0.01 J 0.0099 J
Location
Sample Date
Field Sample ID
Method Parameter Result Qual Result Qual Result Qual Result Qual Result Qual
TO-15 SIM cis-1,2-Dichloroethene 0.44 0.60 0.19 0.30 0.025 UTO-15 SIM trans-1,2-Dichloroethene 0.033 U 0.014 J 0.033 U 0.04 U 0.025 UTO-15 SIM Trichloroethene 0.36 0.30 0.16 0.23 0.025 UTO-15 SIM Vinyl chloride 0.018 J 0.0094 J 0.033 U 0.04 U 0.025 U
Notes:1. Concentrations are in micrograms per cubic meter (g/m3).2. U - constituent not detected at the reporting limit.3. J - concentration is estimated.
Prepared By: WCG 2/25/15Checked By: JAR 2/26/15
FD-15 IAS-06 TB-0501/14/15 01/14/15 01/14/15
AAS-06 FD-14 CAS-04 CAS-05 CAS-06
IAS-04 IAS-05
IAS-06 IAS-06 QC
01/14/15 01/14/15 01/14/15 01/14/15 01/14/15
01/14/15 01/14/15
AAS-06 AAS-06 CAS-04 CAS-05 CAS-06
IAS-04 IAS-05
AAS-0501/14/15AAS-05
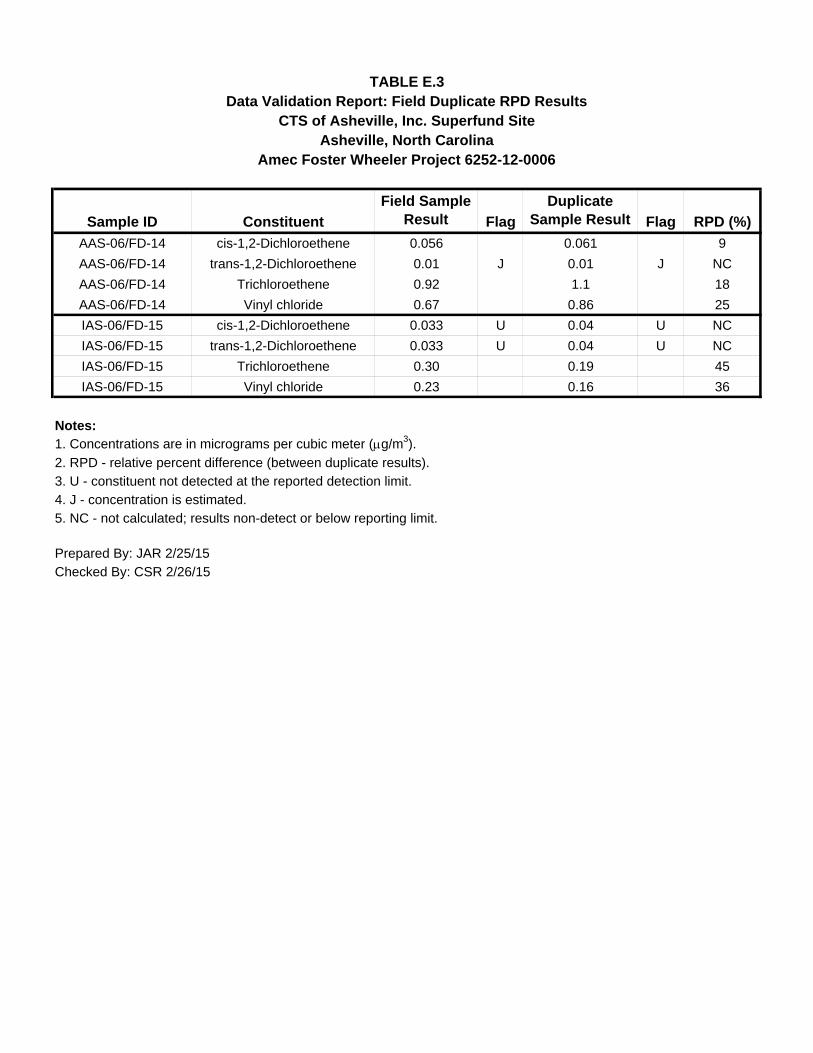
Sample ID Constituent
Field Sample Result Flag
Duplicate Sample Result Flag RPD (%)
AAS-06/FD-14 cis-1,2-Dichloroethene 0.056 0.061 9
AAS-06/FD-14 trans-1,2-Dichloroethene 0.01 J 0.01 J NC
AAS-06/FD-14 Trichloroethene 0.92 1.1 18
AAS-06/FD-14 Vinyl chloride 0.67 0.86 25
IAS-06/FD-15 cis-1,2-Dichloroethene 0.033 U 0.04 U NC
IAS-06/FD-15 trans-1,2-Dichloroethene 0.033 U 0.04 U NC
IAS-06/FD-15 Trichloroethene 0.30 0.19 45
IAS-06/FD-15 Vinyl chloride 0.23 0.16 36
Notes:1. Concentrations are in micrograms per cubic meter (g/m3).
2. RPD - relative percent difference (between duplicate results).3. U - constituent not detected at the reported detection limit.4. J - concentration is estimated.5. NC - not calculated; results non-detect or below reporting limit.
Prepared By: JAR 2/25/15Checked By: CSR 2/26/15
TABLE E.3Data Validation Report: Field Duplicate RPD Results
Asheville, North CarolinaAmec Foster Wheeler Project 6252-12-0006
CTS of Asheville, Inc. Superfund Site

CTS of Asheville, Inc. Superfund Site Report of January 2015 Vapor Intrusion Monitoring (“Springs Area” Residences) Amec Foster Wheeler Project 6252-12-0006 March 6, 2015
APPENDIX F
RISK ASSESSMENT CALCULATION TABLES
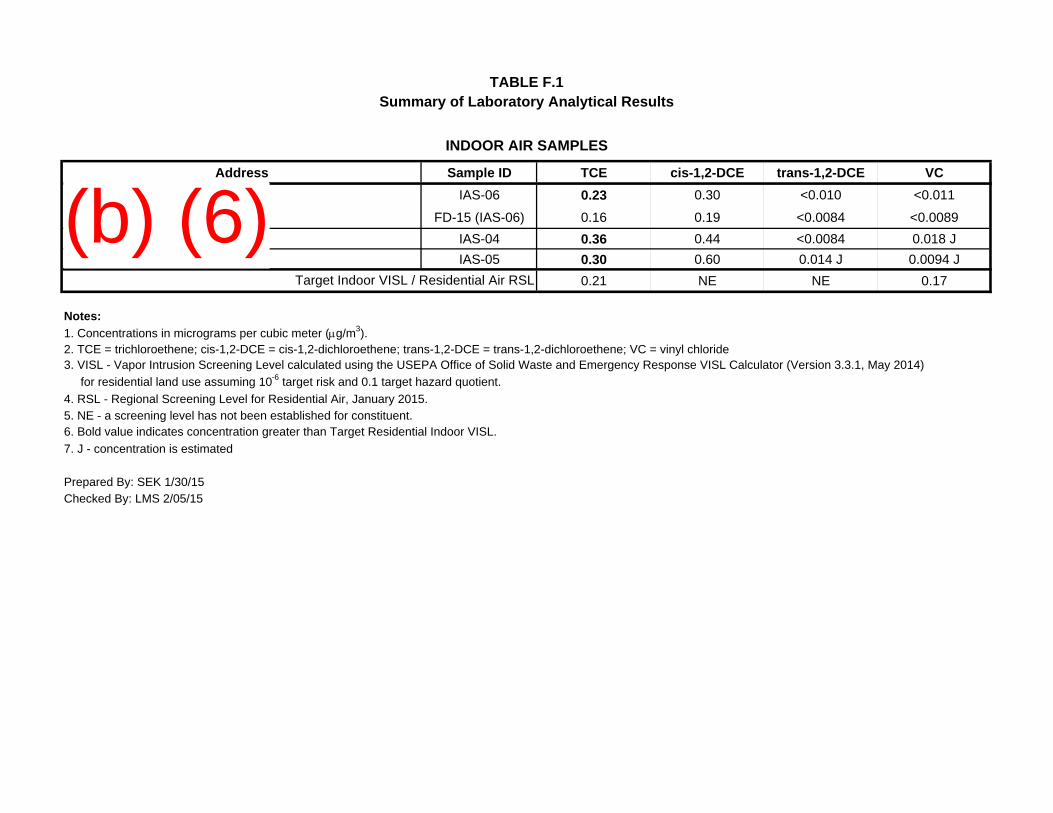
Address Sample ID TCE cis-1,2-DCE trans-1,2-DCE VC
IAS-06 0.23 0.30 <0.010 <0.011
FD-15 (IAS-06) 0.16 0.19 <0.0084 <0.0089
IAS-04 0.36 0.44 <0.0084 0.018 J
IAS-05 0.30 0.60 0.014 J 0.0094 J
0.21 NE NE 0.17
Notes:
1. Concentrations in micrograms per cubic meter (g/m3).2. TCE = trichloroethene; cis-1,2-DCE = cis-1,2-dichloroethene; trans-1,2-DCE = trans-1,2-dichloroethene; VC = vinyl chloride3. VISL - Vapor Intrusion Screening Level calculated using the USEPA Office of Solid Waste and Emergency Response VISL Calculator (Version 3.3.1, May 2014)
for residential land use assuming 10-6 target risk and 0.1 target hazard quotient.
4. RSL - Regional Screening Level for Residential Air, January 2015.5. NE - a screening level has not been established for constituent.6. Bold value indicates concentration greater than Target Residential Indoor VISL.
7. J - concentration is estimated
Prepared By: SEK 1/30/15Checked By: LMS 2/05/15
INDOOR AIR SAMPLES
TABLE F.1Summary of Laboratory Analytical Results
Target Indoor VISL / Residential Air RSL
(b) (6)

Parameter
Concentration in Air
(ug/m3)
Noncarcinogen
(ug/m3)
Mutagenic (3)
(ug/m3)
Carcinogen
(ug/m3)
InhalationRfC
(mg/m3)
Inhalation Kidney Mutagenic Unit Risk
(ug/m3)-1
Inhalation Liver Unit Risk
(ug/m3)-1
Trichloroethylene 0.23 2.2E-01 2.3E-01 8.2E-02 2.0E-03 1.0E-06 3.1E-06 IRIS 0.1 2.3E-07 2.5E-07 5E-07
Notes:
m3 = cubic meters
mg = milligramRfC = Reference Concentrationug = microgramsIRIS = Integrated Risk Information System (TCE data most recently revised September 28, 2011)(1) Concentration detected in indoor air (IAS-06).(2) Exposure Concentration = See Equations below(3) Mutagenic risk for TCE includes age-adjusted risk for ages 0 to 26 years.(4) Hazard Quotient (Noncarcinogens) = Noncarcinogen Exposure Concentration/RfC x 1000 ug/mg(5) Kidney Excess Cancer Risk = Mutagenic Exposure Concentration x Inhalation Kidney Mutagenic Unit Risk(6) Liver Excess Cancer Risk = Carcinogenic Exposure Concentration x Inhalation Liver Unit Risk(7) Total Excess Cancer Risk = Kidney Excess Cancer Risk + Liver Excess Cancer Risk
Carcinogen Exposure Concentration = CA x ET x EF x ED/ ATc where:
Mutagenic Exposure Concentration = CA x ET x EF x ((ED2 x AF2)+(ED4 x AF4)+(ED10 x AF10)+(ED14 x AF14)) / ATc where:Noncarcinogen Exposure Concentration = CA x ET x EF x ED/ATnc where:
CA = Constituent Concentration in Air (estimated) See above (ug/m3)ET = Exposure Time (hours per day) 24 (hours/day)EF = Exposure Frequency (days per year) 350 (days/year)ED = Exposure Duration (years) 26 (years)ED2 = Exposure Duration 2 (mutagen) 2 (years)ED4 = Exposure Duration 4 (mutagen) 4 (years)ED10 = Exposure Duration 10 (mutagen) 10 (years)ED16 = Exposure Duration ≥16 (mutagen) 10 (years)AF2 = Age-Dependent Adjustment Factor 10AF4 = Age-Dependent Adjustment Factor 3AF10 = Age-Dependent Adjustment Factor 3AF16 = Age-Dependent Adjustment Factor 1ATnc = Averaging Time (Noncarcinogen, hours) 227,760ATc = Averaging Time (Carcinogenic, hours) 613,200
Prepared By: SEK 1/30/15Checked By: LMS 2/05/15
Sampled
Toxicity Values
Source
Hazard
Quotient (4)
(Unitless)
Exposure Value
Type (1)
Liver Excess
Cancer Risk (6)
(Unitless)
Total Excess
Cancer Risk (7)
(Unitless)
TABLE F.2Calculations of Risk to Indoor Air Concentrations –
Adult Resident (Current and Future)Inhalation of Indoor Air
Exposure Concentration (2)
Kidney Excess
Cancer Risk (5)
(Unitless)
(b) (6)

Parameter
Concentration in Air
(ug/m3)
Noncarcinogen
(ug/m3)
Mutagenic
(ug/m3)
Carcinogen
(ug/m3)
InhalationRfC
(mg/m3)
Inhalation Kidney Mutagenic Unit Risk
(ug/m3)-1
Inhalation Liver Unit Risk
(ug/m3)-1Source
Hazard
Quotient (3)
(Unitless)
Kidney Excess
Cancer Risk (4)
(Unitless)
Liver Excess
Cancer Risk (5)
(Unitless)
Total Excess
Cancer Risk (6)
(Unitless)
Trichloroethylene 0.23 2.2E-01 1.0E-01 1.9E-02 2.0E-03 1.0E-06 3.1E-06 IRIS 0.1 1.0E-07 5.9E-08 2E-07
Notes:
m3 = cubic meters
mg = milligram
RfC = Reference Concentration
ug = micrograms
IRIS = Integrated Risk Information System (TCE data most recently revised September 28, 2011)
(2) Exposure Concentration = See Equations below(3) Hazard Quotient (Noncarcinogens) = Noncarcinogen Exposure Concentration/RfC x 1000 ug/mg(4) Kidney Excess Cancer Risk = Mutagenic Exposure Concentration x Inhalation Kidney Mutagenic Unit Risk(5) Liver Excess Cancer Risk = Carcinogenic Exposure Concentration x Inhalation Liver Unit Risk(6) Total Excess Cancer Risk = Kidney Excess Cancer Risk + Liver Excess Cancer Risk
Carcinogen Exposure Concentration = CA x ET x EF x ED/ ATc where:
Mutagenic Exposure Concentration = CA x ET x EF x ((ED2 x AF2)+(ED4 x AF4)) / ATc where:
Noncarcinogen Exposure Concentration = CA x ET x EF x ED/ATnc where:
CA = Constituent Concentration in Air (estimated) See above (ug/m3)
ET = Exposure Time (hours per day) 24 (hours/day)
EF = Exposure Frequency (days per year) 350 (days/year)
ED = Exposure Duration (years) 6 (years)
ED2 = Exposure Duration 2 (mutagen) 2 (years)
ED4 = Exposure Duration 4 (mutagen) 4 (years)
AF2 = Age-Dependent Adjustment Factor 10
AF4 = Age-Dependent Adjustment Factor 3
ATnc = Averaging Time (Noncarcinogen, hours) 52,560
ATc = Averaging Time (Carcinogenic, hours) 613,200
Prepared By: SEK 1/30/15
Checked By: LMS 2/05/15
Child Resident (Current and Future)
TABLE F.3Calculations of Risk to Indoor Air Concentrations –
(1) Concentration detected in the indoor air (IAS-06).
Inhalation of Indoor Air
Exposure Concentration (2)
Sampled
Exposure Value
Type (1)
Toxicity Values
(b) (6)
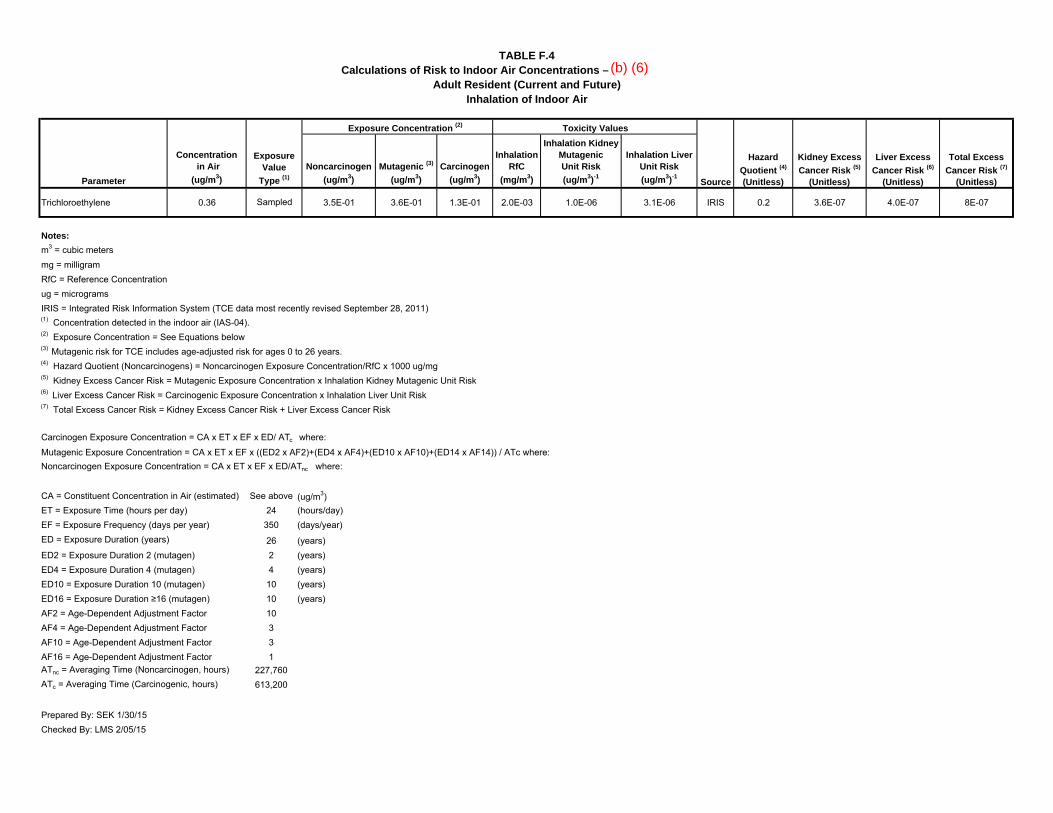
Parameter
Concentration in Air
(ug/m3)
Noncarcinogen
(ug/m3)
Mutagenic (3)
(ug/m3)
Carcinogen
(ug/m3)
InhalationRfC
(mg/m3)
Inhalation Kidney Mutagenic Unit Risk
(ug/m3)-1
Inhalation Liver Unit Risk
(ug/m3)-1
Trichloroethylene 0.36 3.5E-01 3.6E-01 1.3E-01 2.0E-03 1.0E-06 3.1E-06 IRIS 0.2 3.6E-07 4.0E-07 8E-07
Notes:
m3 = cubic metersmg = milligramRfC = Reference Concentrationug = microgramsIRIS = Integrated Risk Information System (TCE data most recently revised September 28, 2011)(1) Concentration detected in the indoor air (IAS-04).(2) Exposure Concentration = See Equations below(3) Mutagenic risk for TCE includes age-adjusted risk for ages 0 to 26 years.(4) Hazard Quotient (Noncarcinogens) = Noncarcinogen Exposure Concentration/RfC x 1000 ug/mg(5) Kidney Excess Cancer Risk = Mutagenic Exposure Concentration x Inhalation Kidney Mutagenic Unit Risk(6) Liver Excess Cancer Risk = Carcinogenic Exposure Concentration x Inhalation Liver Unit Risk(7) Total Excess Cancer Risk = Kidney Excess Cancer Risk + Liver Excess Cancer Risk
Carcinogen Exposure Concentration = CA x ET x EF x ED/ ATc where:
Mutagenic Exposure Concentration = CA x ET x EF x ((ED2 x AF2)+(ED4 x AF4)+(ED10 x AF10)+(ED14 x AF14)) / ATc where:Noncarcinogen Exposure Concentration = CA x ET x EF x ED/ATnc where:
CA = Constituent Concentration in Air (estimated) See above (ug/m3)ET = Exposure Time (hours per day) 24 (hours/day)EF = Exposure Frequency (days per year) 350 (days/year)ED = Exposure Duration (years) 26 (years)ED2 = Exposure Duration 2 (mutagen) 2 (years)ED4 = Exposure Duration 4 (mutagen) 4 (years)ED10 = Exposure Duration 10 (mutagen) 10 (years)ED16 = Exposure Duration ≥16 (mutagen) 10 (years)AF2 = Age-Dependent Adjustment Factor 10AF4 = Age-Dependent Adjustment Factor 3AF10 = Age-Dependent Adjustment Factor 3AF16 = Age-Dependent Adjustment Factor 1ATnc = Averaging Time (Noncarcinogen, hours) 227,760ATc = Averaging Time (Carcinogenic, hours) 613,200
Prepared By: SEK 1/30/15Checked By: LMS 2/05/15
Total Excess
Cancer Risk (7)
(Unitless)
Exposure Value
Type (1)
Sampled
TABLE F.4Calculations of Risk to Indoor Air Concentrations –
Adult Resident (Current and Future)Inhalation of Indoor Air
Exposure Concentration (2) Toxicity Values
Source
Hazard
Quotient (4)
(Unitless)
Kidney Excess
Cancer Risk (5)
(Unitless)
Liver Excess
Cancer Risk (6)
(Unitless)
(b) (6)

Parameter
Concentration in Air
(ug/m3)
Noncarcinogen
(ug/m3)
Mutagenic
(ug/m3)
Carcinogen
(ug/m3)
InhalationRfC
(mg/m3)
Inhalation Kidney Mutagenic Unit Risk
(ug/m3)-1
Inhalation Liver Unit Risk
(ug/m3)-1Source
Hazard
Quotient (3)
(Unitless)
Kidney Excess
Cancer Risk (4)
(Unitless)
Liver Excess
Cancer Risk (5)
(Unitless)
Total Excess
Cancer Risk (6)
(Unitless)
Trichloroethylene 0.36 3.5E-01 1.6E-01 3.0E-02 2.0E-03 1.0E-06 3.1E-06 IRIS 0.2 1.6E-07 9.2E-08 2E-07
Notes:
m3 = cubic meters
mg = milligram
RfC = Reference Concentration
ug = micrograms
IRIS = Integrated Risk Information System (TCE data most recently revised September 28, 2011)
(2) Exposure Concentration = See Equations below(3) Hazard Quotient (Noncarcinogens) = Noncarcinogen Exposure Concentration/RfC x 1000 ug/mg(4) Kidney Excess Cancer Risk = Mutagenic Exposure Concentration x Inhalation Kidney Mutagenic Unit Risk(5) Liver Excess Cancer Risk = Carcinogenic Exposure Concentration x Inhalation Liver Unit Risk(6) Total Excess Cancer Risk = Kidney Excess Cancer Risk + Liver Excess Cancer Risk
Carcinogen Exposure Concentration = CA x ET x EF x ED/ ATc where:
Mutagenic Exposure Concentration = CA x ET x EF x ((ED2 x AF2)+(ED4 x AF4)) / ATc where:
Noncarcinogen Exposure Concentration = CA x ET x EF x ED/ATnc where:
CA = Constituent Concentration in Air (estimated) See above (ug/m3)
ET = Exposure Time (hours per day) 24 (hours/day)
EF = Exposure Frequency (days per year) 350 (days/year)
ED = Exposure Duration (years) 6 (years)
ED2 = Exposure Duration 2 (mutagen) 2 (years)
ED4 = Exposure Duration 4 (mutagen) 4 (years)
AF2 = Age-Dependent Adjustment Factor 10
AF4 = Age-Dependent Adjustment Factor 3
ATnc = Averaging Time (Noncarcinogen, hours) 52,560
ATc = Averaging Time (Carcinogenic, hours) 613,200
Prepared By: SEK 1/30/15
Checked By: LMS 2/05/15
Exposure Value
Type (1)
Sampled
(1) Concentration detected in the indoor air (IAS-04).
TABLE F.5Calculations of Risk to Indoor Air Concentrations –
Child Resident (Current and Future)Inhalation of Indoor Air
Exposure Concentration (2) Toxicity Values
(b) (6)
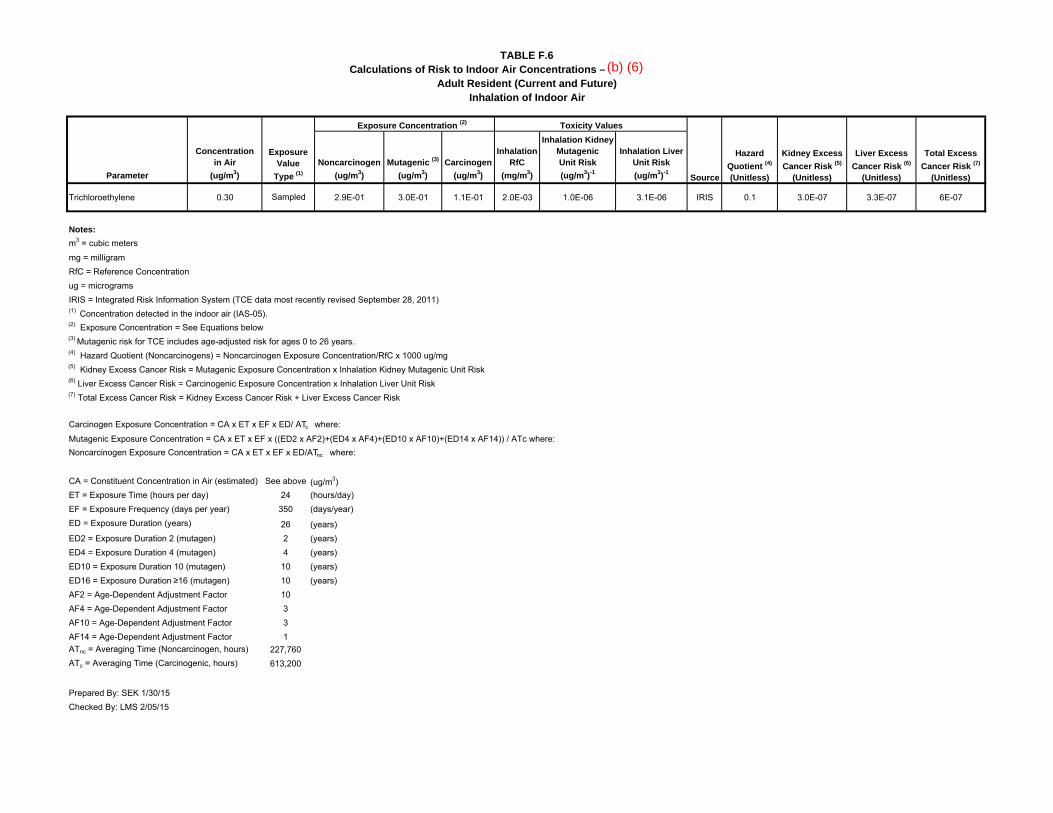
Parameter
Concentration in Air
(ug/m3)
Noncarcinogen
(ug/m3)
Mutagenic (3)
(ug/m3)
Carcinogen
(ug/m3)
InhalationRfC
(mg/m3)
Inhalation Kidney Mutagenic Unit Risk
(ug/m3)-1
Inhalation Liver Unit Risk
(ug/m3)-1
Trichloroethylene 0.30 2.9E-01 3.0E-01 1.1E-01 2.0E-03 1.0E-06 3.1E-06 IRIS 0.1 3.0E-07 3.3E-07 6E-07
Notes:
m3 = cubic meters
mg = milligramRfC = Reference Concentrationug = microgramsIRIS = Integrated Risk Information System (TCE data most recently revised September 28, 2011)
(2) Exposure Concentration = See Equations below(3) Mutagenic risk for TCE includes age-adjusted risk for ages 0 to 26 years.(4) Hazard Quotient (Noncarcinogens) = Noncarcinogen Exposure Concentration/RfC x 1000 ug/mg(5) Kidney Excess Cancer Risk = Mutagenic Exposure Concentration x Inhalation Kidney Mutagenic Unit Risk(6) Liver Excess Cancer Risk = Carcinogenic Exposure Concentration x Inhalation Liver Unit Risk(7) Total Excess Cancer Risk = Kidney Excess Cancer Risk + Liver Excess Cancer Risk
Carcinogen Exposure Concentration = CA x ET x EF x ED/ ATc where:
Mutagenic Exposure Concentration = CA x ET x EF x ((ED2 x AF2)+(ED4 x AF4)+(ED10 x AF10)+(ED14 x AF14)) / ATc where:Noncarcinogen Exposure Concentration = CA x ET x EF x ED/ATnc where:
CA = Constituent Concentration in Air (estimated) See above (ug/m3)ET = Exposure Time (hours per day) 24 (hours/day)EF = Exposure Frequency (days per year) 350 (days/year)ED = Exposure Duration (years) 26 (years)ED2 = Exposure Duration 2 (mutagen) 2 (years)ED4 = Exposure Duration 4 (mutagen) 4 (years)ED10 = Exposure Duration 10 (mutagen) 10 (years)ED16 = Exposure Duration ≥16 (mutagen) 10 (years)AF2 = Age-Dependent Adjustment Factor 10AF4 = Age-Dependent Adjustment Factor 3AF10 = Age-Dependent Adjustment Factor 3AF14 = Age-Dependent Adjustment Factor 1ATnc = Averaging Time (Noncarcinogen, hours) 227,760ATc = Averaging Time (Carcinogenic, hours) 613,200
Prepared By: SEK 1/30/15Checked By: LMS 2/05/15
Adult Resident (Current and Future)
TABLE F.6Calculations of Risk to Indoor Air Concentrations –
(1) Concentration detected in the indoor air (IAS-05).
Inhalation of Indoor Air
Exposure Concentration (2)
Exposure Value
Type (1)
Sampled
Toxicity Values
Source
Hazard
Quotient (4)
(Unitless)
Kidney Excess
Cancer Risk (5)
(Unitless)
Liver Excess
Cancer Risk (6)
(Unitless)
Total Excess
Cancer Risk (7)
(Unitless)
(b) (6)
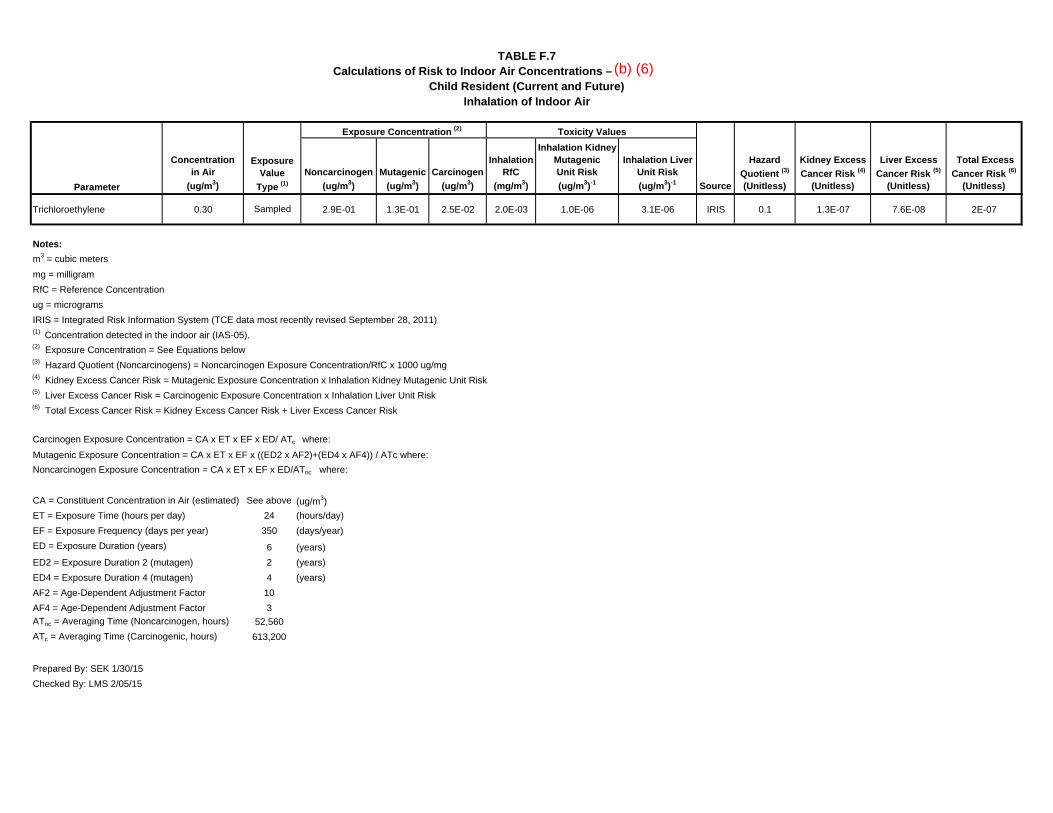
Parameter
Concentrationin Air
(ug/m3)
Noncarcinogen
(ug/m3)
Mutagenic
(ug/m3)
Carcinogen
(ug/m3)
InhalationRfC
(mg/m3)
Inhalation Kidney Mutagenic Unit Risk
(ug/m3)-1
Inhalation Liver Unit Risk
(ug/m3)-1 Source
Hazard
Quotient (3)
(Unitless)
Kidney Excess
Cancer Risk (4)
(Unitless)
Liver Excess
Cancer Risk (5)
(Unitless)
Total Excess
Cancer Risk (6)
(Unitless)
Trichloroethylene 0.30 2.9E-01 1.3E-01 2.5E-02 2.0E-03 1.0E-06 3.1E-06 IRIS 0.1 1.3E-07 7.6E-08 2E-07
Notes:
m3 = cubic meters
mg = milligram
RfC = Reference Concentration
ug = micrograms
IRIS = Integrated Risk Information System (TCE data most recently revised September 28, 2011)
(2) Exposure Concentration = See Equations below(3) Hazard Quotient (Noncarcinogens) = Noncarcinogen Exposure Concentration/RfC x 1000 ug/mg(4) Kidney Excess Cancer Risk = Mutagenic Exposure Concentration x Inhalation Kidney Mutagenic Unit Risk(5) Liver Excess Cancer Risk = Carcinogenic Exposure Concentration x Inhalation Liver Unit Risk(6) Total Excess Cancer Risk = Kidney Excess Cancer Risk + Liver Excess Cancer Risk
Carcinogen Exposure Concentration = CA x ET x EF x ED/ ATc where:
Mutagenic Exposure Concentration = CA x ET x EF x ((ED2 x AF2)+(ED4 x AF4)) / ATc where:
Noncarcinogen Exposure Concentration = CA x ET x EF x ED/ATnc where:
CA = Constituent Concentration in Air (estimated) See above (ug/m3)
ET = Exposure Time (hours per day) 24 (hours/day)
EF = Exposure Frequency (days per year) 350 (days/year)
ED = Exposure Duration (years) 6 (years)
ED2 = Exposure Duration 2 (mutagen) 2 (years)
ED4 = Exposure Duration 4 (mutagen) 4 (years)
AF2 = Age-Dependent Adjustment Factor 10
AF4 = Age-Dependent Adjustment Factor 3
ATnc = Averaging Time (Noncarcinogen, hours) 52,560
ATc = Averaging Time (Carcinogenic, hours) 613,200
Prepared By: SEK 1/30/15
Checked By: LMS 2/05/15
Child Resident (Current and Future)
TABLE F.7Calculations of Risk to Indoor Air Concentrations –
(1) Concentration detected in the indoor air (IAS-05).
Inhalation of Indoor Air
Exposure Concentration (2)
Exposure Value
Type (1)
Sampled
Toxicity Values
(b) (6)

Location Hazard Quotient Excess Cancer Risk Hazard Quotient Excess Cancer Risk
0.1 5E-07 0.1 2E-07
0.2 8E-07 0.2 2E-07
0.1 6E-07 0.1 2E-07
Note:
(a) Adult excess cancer risk includes mutagenic exposures for multiple ages (TCE).
Prepared By: SEK 1/30/15Checked By: LMS 2/05/15
Inhalation of Indoor Air
Adult (a) Child
TABLE F.8Summary of Risk to Indoor Air Concentrations Adult and Child Residents (Current and Future)
(b) (6)