Report of independent auditorS - Metropolitan Museum of Art
25
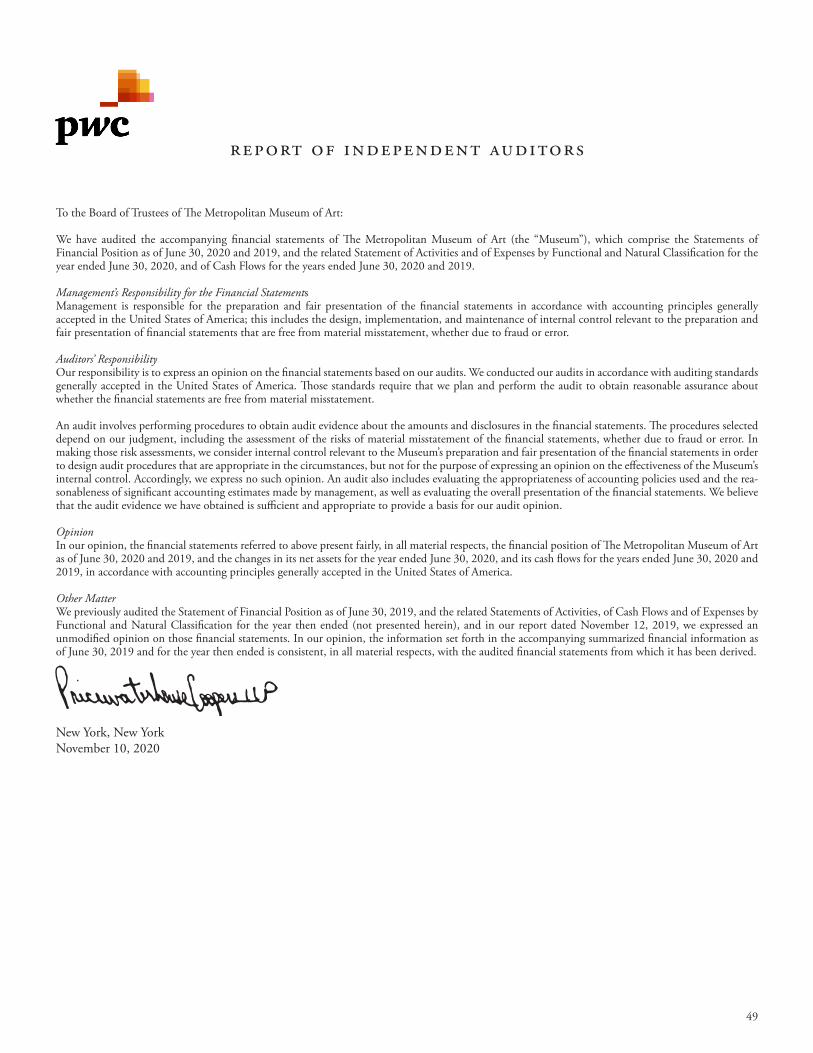
49 Report of independent auditorS To the Board of Trustees of e Metropolitan Museum of Art: We have audited the accompanying financial statements of e Metropolitan Museum of Art (the “Museum”), which comprise the Statements of Financial Position as of June 30, 2020 and 2019, and the related Statement of Activities and of Expenses by Functional and Natural Classification for the year ended June 30, 2020, and of Cash Flows for the years ended June 30, 2020 and 2019. Management’s Responsibility for the Financial Statements Management is responsible for the preparation and fair presentation of the financial statements in accordance with accounting principles generally accepted in the United States of America; this includes the design, implementation, and maintenance of internal control relevant to the preparation and fair presentation of financial statements that are free from material misstatement, whether due to fraud or error. Auditors’ Responsibility Our responsibility is to express an opinion on the financial statements based on our audits. We conducted our audits in accordance with auditing standards generally accepted in the United States of America. ose standards require that we plan and perform the audit to obtain reasonable assurance about whether the financial statements are free from material misstatement. An audit involves performing procedures to obtain audit evidence about the amounts and disclosures in the financial statements. e procedures selected depend on our judgment, including the assessment of the risks of material misstatement of the financial statements, whether due to fraud or error. In making those risk assessments, we consider internal control relevant to the Museum’s preparation and fair presentation of the financial statements in order to design audit procedures that are appropriate in the circumstances, but not for the purpose of expressing an opinion on the effectiveness of the Museum’s internal control. Accordingly, we express no such opinion. An audit also includes evaluating the appropriateness of accounting policies used and the rea- sonableness of significant accounting estimates made by management, as well as evaluating the overall presentation of the financial statements. We believe that the audit evidence we have obtained is sufficient and appropriate to provide a basis for our audit opinion. Opinion In our opinion, the financial statements referred to above present fairly, in all material respects, the financial position of e Metropolitan Museum of Art as of June 30, 2020 and 2019, and the changes in its net assets for the year ended June 30, 2020, and its cash flows for the years ended June 30, 2020 and 2019, in accordance with accounting principles generally accepted in the United States of America. Other Matter We previously audited the Statement of Financial Position as of June 30, 2019, and the related Statements of Activities, of Cash Flows and of Expenses by Functional and Natural Classification for the year then ended (not presented herein), and in our report dated November 12, 2019, we expressed an unmodified opinion on those financial statements. In our opinion, the information set forth in the accompanying summarized financial information as of June 30, 2019 and for the year then ended is consistent, in all material respects, with the audited financial statements from which it has been derived. New York, New York November 10, 2020
Transcript of Report of independent auditorS - Metropolitan Museum of Art
49
Report of independent auditorS
To the Board of Trustees of The Metropolitan Museum of Art:
We have audited the accompanying financial statements of The Metropolitan Museum of Art (the “Museum”), which comprise the Statements of Financial Position as of June 30, 2020 and 2019, and the related Statement of Activities and of Expenses by Functional and Natural Classification for the year ended June 30, 2020, and of Cash Flows for the years ended June 30, 2020 and 2019.
Management’s Responsibility for the Financial StatementsManagement is responsible for the preparation and fair presentation of the financial statements in accordance with accounting principles generally accepted in the United States of America; this includes the design, implementation, and maintenance of internal control relevant to the preparation and fair presentation of financial statements that are free from material misstatement, whether due to fraud or error.
Auditors’ ResponsibilityOur responsibility is to express an opinion on the financial statements based on our audits. We conducted our audits in accordance with auditing standards generally accepted in the United States of America. Those standards require that we plan and perform the audit to obtain reasonable assurance about whether the financial statements are free from material misstatement.
An audit involves performing procedures to obtain audit evidence about the amounts and disclosures in the financial statements. The procedures selected depend on our judgment, including the assessment of the risks of material misstatement of the financial statements, whether due to fraud or error. In making those risk assessments, we consider internal control relevant to the Museum’s preparation and fair presentation of the financial statements in order to design audit procedures that are appropriate in the circumstances, but not for the purpose of expressing an opinion on the effectiveness of the Museum’s internal control. Accordingly, we express no such opinion. An audit also includes evaluating the appropriateness of accounting policies used and the rea-sonableness of significant accounting estimates made by management, as well as evaluating the overall presentation of the financial statements. We believe that the audit evidence we have obtained is sufficient and appropriate to provide a basis for our audit opinion.
OpinionIn our opinion, the financial statements referred to above present fairly, in all material respects, the financial position of The Metropolitan Museum of Art as of June 30, 2020 and 2019, and the changes in its net assets for the year ended June 30, 2020, and its cash flows for the years ended June 30, 2020 and 2019, in accordance with accounting principles generally accepted in the United States of America.
Other MatterWe previously audited the Statement of Financial Position as of June 30, 2019, and the related Statements of Activities, of Cash Flows and of Expenses by Functional and Natural Classification for the year then ended (not presented herein), and in our report dated November 12, 2019, we expressed an unmodified opinion on those financial statements. In our opinion, the information set forth in the accompanying summarized financial information as of June 30, 2019 and for the year then ended is consistent, in all material respects, with the audited financial statements from which it has been derived.
New York, New YorkNovember 10, 2020
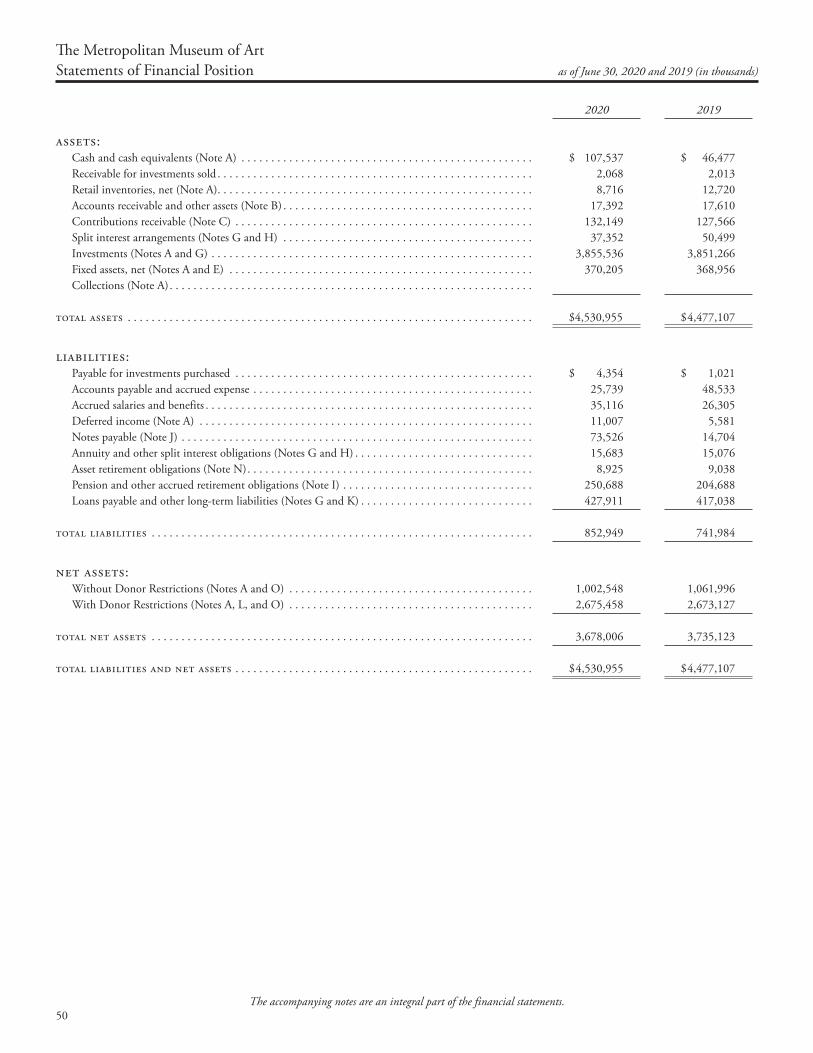
50The accompanying notes are an integral part of the financial statements.
2020 2019
Assets: Cash and cash equivalents (Note A) . . . . . . . . . . . . . . . . . . . . . . . . . . . . . . . . . . . . . . . . . . . . . . . . . $ 107,537 $ 46,477 Receivable for investments sold . . . . . . . . . . . . . . . . . . . . . . . . . . . . . . . . . . . . . . . . . . . . . . . . . . . . . 2,068 2,013 Retail inventories, net (Note A) . . . . . . . . . . . . . . . . . . . . . . . . . . . . . . . . . . . . . . . . . . . . . . . . . . . . . 8,716 12,720 Accounts receivable and other assets (Note B) . . . . . . . . . . . . . . . . . . . . . . . . . . . . . . . . . . . . . . . . . . 17,392 17,610 Contributions receivable (Note C) . . . . . . . . . . . . . . . . . . . . . . . . . . . . . . . . . . . . . . . . . . . . . . . . . . 132,149 127,566 Split interest arrangements (Notes G and H) . . . . . . . . . . . . . . . . . . . . . . . . . . . . . . . . . . . . . . . . . . 37,352 50,499 Investments (Notes A and G) . . . . . . . . . . . . . . . . . . . . . . . . . . . . . . . . . . . . . . . . . . . . . . . . . . . . . . 3,855,536 3,851,266 Fixed assets, net (Notes A and E) . . . . . . . . . . . . . . . . . . . . . . . . . . . . . . . . . . . . . . . . . . . . . . . . . . . 370,205 368,956 Collections (Note A) . . . . . . . . . . . . . . . . . . . . . . . . . . . . . . . . . . . . . . . . . . . . . . . . . . . . . . . . . . . . .
total assets . . . . . . . . . . . . . . . . . . . . . . . . . . . . . . . . . . . . . . . . . . . . . . . . . . . . . . . . . . . . . . . . . . . . $4,530,955 $ 4,477,107
Liabilities: Payable for investments purchased . . . . . . . . . . . . . . . . . . . . . . . . . . . . . . . . . . . . . . . . . . . . . . . . . . $ 4,354 $ 1,021 Accounts payable and accrued expense . . . . . . . . . . . . . . . . . . . . . . . . . . . . . . . . . . . . . . . . . . . . . . . 25,739 48,533 Accrued salaries and benefits . . . . . . . . . . . . . . . . . . . . . . . . . . . . . . . . . . . . . . . . . . . . . . . . . . . . . . . 35,116 26,305 Deferred income (Note A) . . . . . . . . . . . . . . . . . . . . . . . . . . . . . . . . . . . . . . . . . . . . . . . . . . . . . . . . 11,007 5,581 Notes payable (Note J) . . . . . . . . . . . . . . . . . . . . . . . . . . . . . . . . . . . . . . . . . . . . . . . . . . . . . . . . . . . 73,526 14,704 Annuity and other split interest obligations (Notes G and H) . . . . . . . . . . . . . . . . . . . . . . . . . . . . . . 15,683 15,076 Asset retirement obligations (Note N) . . . . . . . . . . . . . . . . . . . . . . . . . . . . . . . . . . . . . . . . . . . . . . . . 8,925 9,038 Pension and other accrued retirement obligations (Note I) . . . . . . . . . . . . . . . . . . . . . . . . . . . . . . . . 250,688 204,688 Loans payable and other long-term liabilities (Notes G and K) . . . . . . . . . . . . . . . . . . . . . . . . . . . . . 427,911 417,038
total liabilities . . . . . . . . . . . . . . . . . . . . . . . . . . . . . . . . . . . . . . . . . . . . . . . . . . . . . . . . . . . . . . . . 852,949 741,984
Net assets: Without Donor Restrictions (Notes A and O) . . . . . . . . . . . . . . . . . . . . . . . . . . . . . . . . . . . . . . . . . 1,002,548 1,061,996 With Donor Restrictions (Notes A, L, and O) . . . . . . . . . . . . . . . . . . . . . . . . . . . . . . . . . . . . . . . . . 2,675,458 2,673,127
total net assets . . . . . . . . . . . . . . . . . . . . . . . . . . . . . . . . . . . . . . . . . . . . . . . . . . . . . . . . . . . . . . . . 3,678,006 3,735,123
total liabilities and net assets . . . . . . . . . . . . . . . . . . . . . . . . . . . . . . . . . . . . . . . . . . . . . . . . . . $ 4,530,955 $ 4,477,107
Statements of Financial Position as of June 30, 2020 and 2019 (in thousands)
The Metropolitan Museum of Art
51The accompanying notes are an integral part of the financial statements.
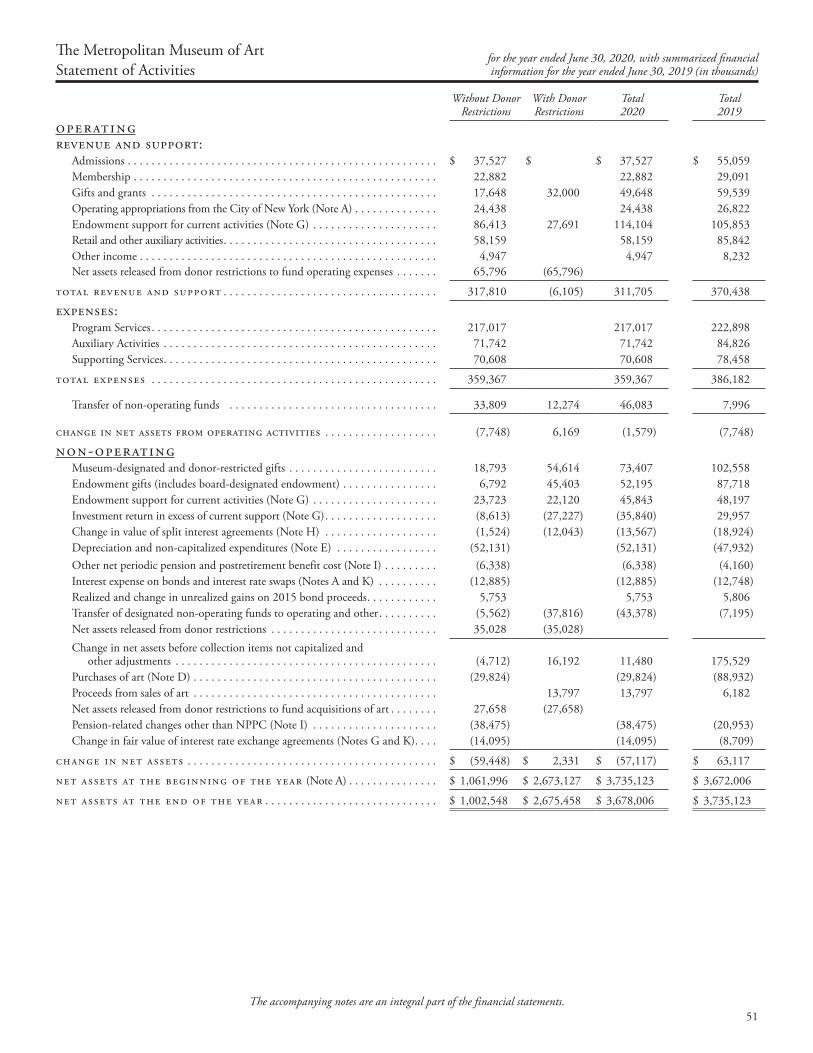
Without Donor Restrictions
With Donor Restrictions
Total 2020
Total 2019
operatingrevenue and support: Admissions . . . . . . . . . . . . . . . . . . . . . . . . . . . . . . . . . . . . . . . . . . . . . . . . . . . . $ 37,527 $ $ 37,527 $ 55,059 Membership . . . . . . . . . . . . . . . . . . . . . . . . . . . . . . . . . . . . . . . . . . . . . . . . . . . 22,882 22,882 29,091 Gifts and grants . . . . . . . . . . . . . . . . . . . . . . . . . . . . . . . . . . . . . . . . . . . . . . . . 17,648 32,000 49,648 59,539 Operating appropriations from the City of New York (Note A) . . . . . . . . . . . . . . 24,438 24,438 26,822 Endowment support for current activities (Note G) . . . . . . . . . . . . . . . . . . . . . 86,413 27,691 114,104 105,853 Retail and other auxiliary activities . . . . . . . . . . . . . . . . . . . . . . . . . . . . . . . . . . . . 58,159 58,159 85,842 Other income . . . . . . . . . . . . . . . . . . . . . . . . . . . . . . . . . . . . . . . . . . . . . . . . . . 4,947 4,947 8,232 Net assets released from donor restrictions to fund operating expenses . . . . . . . 65,796 (65,796)
total revenue and support . . . . . . . . . . . . . . . . . . . . . . . . . . . . . . . . . . . . 317,810 (6,105) 311,705 370,438
expenses: Program Services . . . . . . . . . . . . . . . . . . . . . . . . . . . . . . . . . . . . . . . . . . . . . . . . 217,017 217,017 222,898 Auxiliary Activities . . . . . . . . . . . . . . . . . . . . . . . . . . . . . . . . . . . . . . . . . . . . . . 71,742 71,742 84,826 Supporting Services . . . . . . . . . . . . . . . . . . . . . . . . . . . . . . . . . . . . . . . . . . . . . . 70,608 70,608 78,458
total expenses . . . . . . . . . . . . . . . . . . . . . . . . . . . . . . . . . . . . . . . . . . . . . . . . 359,367 359,367 386,182
Transfer of non-operating funds . . . . . . . . . . . . . . . . . . . . . . . . . . . . . . . . . . . 33,809 12,274 46,083 7,996
change in net assets from operating activities . . . . . . . . . . . . . . . . . . . (7,748) 6,169 (1,579) (7,748)
non-operating Museum-designated and donor-restricted gifts . . . . . . . . . . . . . . . . . . . . . . . . . 18,793 54,614 73,407 102,558 Endowment gifts (includes board-designated endowment) . . . . . . . . . . . . . . . . 6,792 45,403 52,195 87,718 Endowment support for current activities (Note G) . . . . . . . . . . . . . . . . . . . . . 23,723 22,120 45,843 48,197 Investment return in excess of current support (Note G) . . . . . . . . . . . . . . . . . . . (8,613) (27,227) (35,840) 29,957 Change in value of split interest agreements (Note H) . . . . . . . . . . . . . . . . . . . (1,524) (12,043) (13,567) (18,924) Depreciation and non-capitalized expenditures (Note E) . . . . . . . . . . . . . . . . . (52,131) (52,131) (47,932) Other net periodic pension and postretirement benefit cost (Note I) . . . . . . . . . (6,338) (6,338) (4,160) Interest expense on bonds and interest rate swaps (Notes A and K) . . . . . . . . . . (12,885) (12,885) (12,748) Realized and change in unrealized gains on 2015 bond proceeds . . . . . . . . . . . . 5,753 5,753 5,806 Transfer of designated non-operating funds to operating and other . . . . . . . . . . (5,562) (37,816) (43,378) (7,195) Net assets released from donor restrictions . . . . . . . . . . . . . . . . . . . . . . . . . . . . 35,028 (35,028) Change in net assets before collection items not capitalized and other adjustments . . . . . . . . . . . . . . . . . . . . . . . . . . . . . . . . . . . . . . . . . . . . (4,712) 16,192 11,480 175,529 Purchases of art (Note D) . . . . . . . . . . . . . . . . . . . . . . . . . . . . . . . . . . . . . . . . . (29,824) (29,824) (88,932) Proceeds from sales of art . . . . . . . . . . . . . . . . . . . . . . . . . . . . . . . . . . . . . . . . . 13,797 13,797 6,182 Net assets released from donor restrictions to fund acquisitions of art . . . . . . . . 27,658 (27,658) Pension-related changes other than NPPC (Note I) . . . . . . . . . . . . . . . . . . . . . (38,475) (38,475) (20,953) Change in fair value of interest rate exchange agreements (Notes G and K) . . . . (14,095) (14,095) (8,709)
change in net assets . . . . . . . . . . . . . . . . . . . . . . . . . . . . . . . . . . . . . . . . . . $ (59,448) $ 2,331 $ (57,117) $ 63,117
net assets at the beginning of the year (Note A) . . . . . . . . . . . . . . . $ 1,061,996 $ 2,673,127 $ 3,735,123 $ 3,672,006
net assets at the end of the year . . . . . . . . . . . . . . . . . . . . . . . . . . . . . $ 1,002,548 $ 2,675,458 $ 3,678,006 $ 3,735,123
The Metropolitan Museum of Art for the year ended June 30, 2020, with summarized financialStatement of Activities information for the year ended June 30, 2019 (in thousands)
52
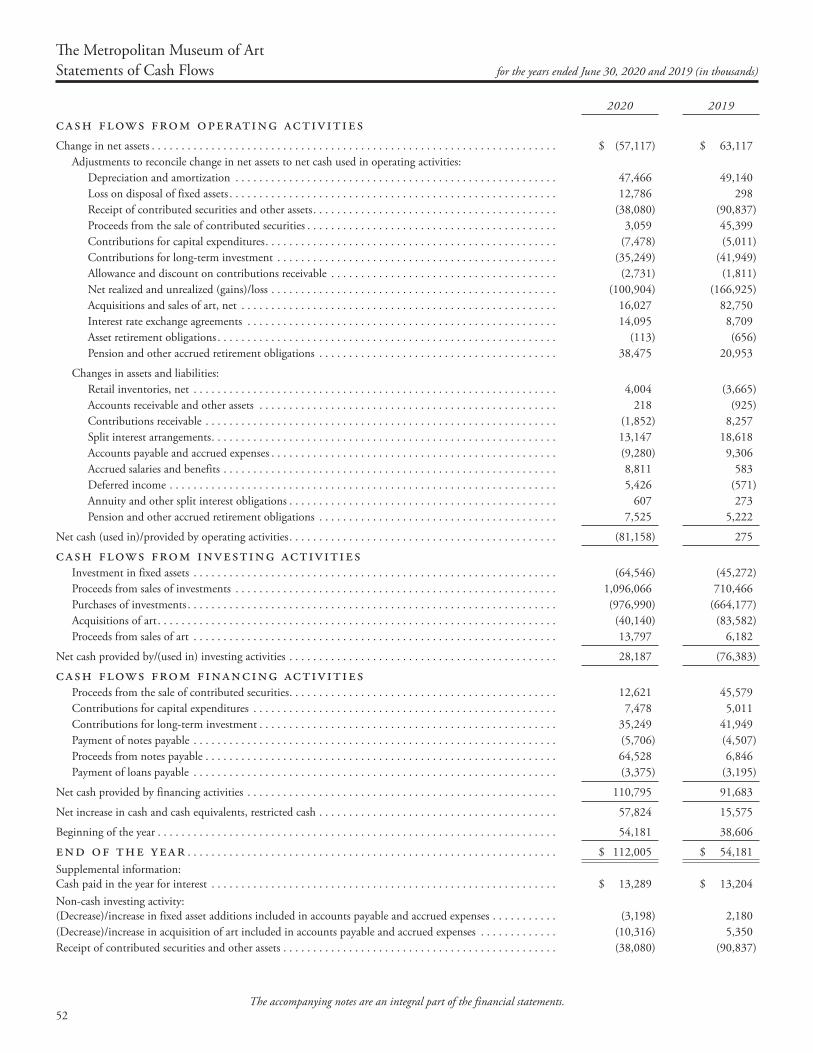
Statements of Cash Flows for the years ended June 30, 2020 and 2019 (in thousands)
2020 2019
cash flows from operating activitiesChange in net assets . . . . . . . . . . . . . . . . . . . . . . . . . . . . . . . . . . . . . . . . . . . . . . . . . . . . . . . . . . . . . . . . . . . . $ (57,117) $ 63,117 Adjustments to reconcile change in net assets to net cash used in operating activities: Depreciation and amortization . . . . . . . . . . . . . . . . . . . . . . . . . . . . . . . . . . . . . . . . . . . . . . . . . . . . . . 47,466 49,140 Loss on disposal of fixed assets . . . . . . . . . . . . . . . . . . . . . . . . . . . . . . . . . . . . . . . . . . . . . . . . . . . . . . . 12,786 298 Receipt of contributed securities and other assets . . . . . . . . . . . . . . . . . . . . . . . . . . . . . . . . . . . . . . . . . (38,080) (90,837) Proceeds from the sale of contributed securities . . . . . . . . . . . . . . . . . . . . . . . . . . . . . . . . . . . . . . . . . . 3,059 45,399 Contributions for capital expenditures . . . . . . . . . . . . . . . . . . . . . . . . . . . . . . . . . . . . . . . . . . . . . . . . . (7,478) (5,011) Contributions for long-term investment . . . . . . . . . . . . . . . . . . . . . . . . . . . . . . . . . . . . . . . . . . . . . . . (35,249) (41,949) Allowance and discount on contributions receivable . . . . . . . . . . . . . . . . . . . . . . . . . . . . . . . . . . . . . . (2,731) (1,811) Net realized and unrealized (gains)/loss . . . . . . . . . . . . . . . . . . . . . . . . . . . . . . . . . . . . . . . . . . . . . . . . (100,904) (166,925) Acquisitions and sales of art, net . . . . . . . . . . . . . . . . . . . . . . . . . . . . . . . . . . . . . . . . . . . . . . . . . . . . . 16,027 82,750 Interest rate exchange agreements . . . . . . . . . . . . . . . . . . . . . . . . . . . . . . . . . . . . . . . . . . . . . . . . . . . . 14,095 8,709 Asset retirement obligations . . . . . . . . . . . . . . . . . . . . . . . . . . . . . . . . . . . . . . . . . . . . . . . . . . . . . . . . . (113) (656) Pension and other accrued retirement obligations . . . . . . . . . . . . . . . . . . . . . . . . . . . . . . . . . . . . . . . . 38,475 20,953
Changes in assets and liabilities: Retail inventories, net . . . . . . . . . . . . . . . . . . . . . . . . . . . . . . . . . . . . . . . . . . . . . . . . . . . . . . . . . . . . . 4,004 (3,665) Accounts receivable and other assets . . . . . . . . . . . . . . . . . . . . . . . . . . . . . . . . . . . . . . . . . . . . . . . . . . 218 (925) Contributions receivable . . . . . . . . . . . . . . . . . . . . . . . . . . . . . . . . . . . . . . . . . . . . . . . . . . . . . . . . . . . (1,852) 8,257 Split interest arrangements . . . . . . . . . . . . . . . . . . . . . . . . . . . . . . . . . . . . . . . . . . . . . . . . . . . . . . . . . . 13,147 18,618 Accounts payable and accrued expenses . . . . . . . . . . . . . . . . . . . . . . . . . . . . . . . . . . . . . . . . . . . . . . . . (9,280) 9,306 Accrued salaries and benefits . . . . . . . . . . . . . . . . . . . . . . . . . . . . . . . . . . . . . . . . . . . . . . . . . . . . . . . . 8,811 583 Deferred income . . . . . . . . . . . . . . . . . . . . . . . . . . . . . . . . . . . . . . . . . . . . . . . . . . . . . . . . . . . . . . . . . 5,426 (571) Annuity and other split interest obligations . . . . . . . . . . . . . . . . . . . . . . . . . . . . . . . . . . . . . . . . . . . . . 607 273 Pension and other accrued retirement obligations . . . . . . . . . . . . . . . . . . . . . . . . . . . . . . . . . . . . . . . . 7,525 5,222
Net cash (used in)/provided by operating activities . . . . . . . . . . . . . . . . . . . . . . . . . . . . . . . . . . . . . . . . . . . . . (81,158) 275
cash flows from investing activities Investment in fixed assets . . . . . . . . . . . . . . . . . . . . . . . . . . . . . . . . . . . . . . . . . . . . . . . . . . . . . . . . . . . . . (64,546) (45,272) Proceeds from sales of investments . . . . . . . . . . . . . . . . . . . . . . . . . . . . . . . . . . . . . . . . . . . . . . . . . . . . . . 1,096,066 710,466 Purchases of investments . . . . . . . . . . . . . . . . . . . . . . . . . . . . . . . . . . . . . . . . . . . . . . . . . . . . . . . . . . . . . . (976,990) (664,177) Acquisitions of art . . . . . . . . . . . . . . . . . . . . . . . . . . . . . . . . . . . . . . . . . . . . . . . . . . . . . . . . . . . . . . . . . . . (40,140) (83,582) Proceeds from sales of art . . . . . . . . . . . . . . . . . . . . . . . . . . . . . . . . . . . . . . . . . . . . . . . . . . . . . . . . . . . . . 13,797 6,182
Net cash provided by/(used in) investing activities . . . . . . . . . . . . . . . . . . . . . . . . . . . . . . . . . . . . . . . . . . . . . 28,187 (76,383)
cash flows from financing activities Proceeds from the sale of contributed securities . . . . . . . . . . . . . . . . . . . . . . . . . . . . . . . . . . . . . . . . . . . . . 12,621 45,579 Contributions for capital expenditures . . . . . . . . . . . . . . . . . . . . . . . . . . . . . . . . . . . . . . . . . . . . . . . . . . . 7,478 5,011 Contributions for long-term investment . . . . . . . . . . . . . . . . . . . . . . . . . . . . . . . . . . . . . . . . . . . . . . . . . . 35,249 41,949 Payment of notes payable . . . . . . . . . . . . . . . . . . . . . . . . . . . . . . . . . . . . . . . . . . . . . . . . . . . . . . . . . . . . . (5,706) (4,507) Proceeds from notes payable . . . . . . . . . . . . . . . . . . . . . . . . . . . . . . . . . . . . . . . . . . . . . . . . . . . . . . . . . . . 64,528 6,846 Payment of loans payable . . . . . . . . . . . . . . . . . . . . . . . . . . . . . . . . . . . . . . . . . . . . . . . . . . . . . . . . . . . . . (3,375) (3,195)
Net cash provided by financing activities . . . . . . . . . . . . . . . . . . . . . . . . . . . . . . . . . . . . . . . . . . . . . . . . . . . . 110,795 91,683
Net increase in cash and cash equivalents, restricted cash . . . . . . . . . . . . . . . . . . . . . . . . . . . . . . . . . . . . . . . . 57,824 15,575
Beginning of the year . . . . . . . . . . . . . . . . . . . . . . . . . . . . . . . . . . . . . . . . . . . . . . . . . . . . . . . . . . . . . . . . . . . 54,181 38,606
end of the year . . . . . . . . . . . . . . . . . . . . . . . . . . . . . . . . . . . . . . . . . . . . . . . . . . . . . . . . . . . . . . $ 112,005 $ 54,181Supplemental information: Cash paid in the year for interest . . . . . . . . . . . . . . . . . . . . . . . . . . . . . . . . . . . . . . . . . . . . . . . . . . . . . . . . . . $ 13,289 $ 13,204Non-cash investing activity: (Decrease)/increase in fixed asset additions included in accounts payable and accrued expenses . . . . . . . . . . . (3,198) 2,180(Decrease)/increase in acquisition of art included in accounts payable and accrued expenses . . . . . . . . . . . . . (10,316) 5,350Receipt of contributed securities and other assets . . . . . . . . . . . . . . . . . . . . . . . . . . . . . . . . . . . . . . . . . . . . . . (38,080) (90,837)
The accompanying notes are an integral part of the financial statements.
The Metropolitan Museum of Art
53
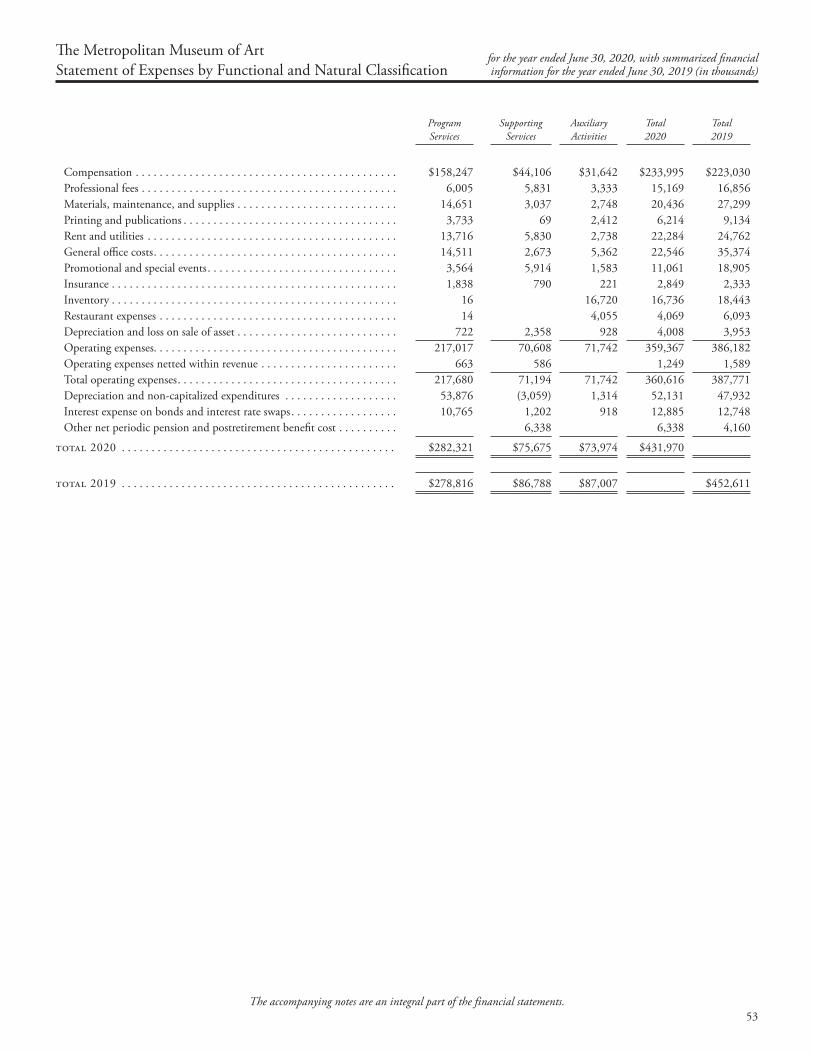
Program Services
Supporting Services
Auxiliary Activities
Total 2020
Total 2019
Compensation . . . . . . . . . . . . . . . . . . . . . . . . . . . . . . . . . . . . . . . . . . . . $158,247 $44,106 $31,642 $233,995 $223,030Professional fees . . . . . . . . . . . . . . . . . . . . . . . . . . . . . . . . . . . . . . . . . . . 6,005 5,831 3,333 15,169 16,856Materials, maintenance, and supplies . . . . . . . . . . . . . . . . . . . . . . . . . . . 14,651 3,037 2,748 20,436 27,299Printing and publications . . . . . . . . . . . . . . . . . . . . . . . . . . . . . . . . . . . . 3,733 69 2,412 6,214 9,134Rent and utilities . . . . . . . . . . . . . . . . . . . . . . . . . . . . . . . . . . . . . . . . . . 13,716 5,830 2,738 22,284 24,762General office costs . . . . . . . . . . . . . . . . . . . . . . . . . . . . . . . . . . . . . . . . . 14,511 2,673 5,362 22,546 35,374Promotional and special events . . . . . . . . . . . . . . . . . . . . . . . . . . . . . . . . 3,564 5,914 1,583 11,061 18,905Insurance . . . . . . . . . . . . . . . . . . . . . . . . . . . . . . . . . . . . . . . . . . . . . . . . 1,838 790 221 2,849 2,333Inventory . . . . . . . . . . . . . . . . . . . . . . . . . . . . . . . . . . . . . . . . . . . . . . . . 16 16,720 16,736 18,443Restaurant expenses . . . . . . . . . . . . . . . . . . . . . . . . . . . . . . . . . . . . . . . . 14 4,055 4,069 6,093Depreciation and loss on sale of asset . . . . . . . . . . . . . . . . . . . . . . . . . . . 722 2,358 928 4,008 3,953Operating expenses. . . . . . . . . . . . . . . . . . . . . . . . . . . . . . . . . . . . . . . . . 217,017 70,608 71,742 359,367 386,182Operating expenses netted within revenue . . . . . . . . . . . . . . . . . . . . . . . 663 586 1,249 1,589Total operating expenses . . . . . . . . . . . . . . . . . . . . . . . . . . . . . . . . . . . . . 217,680 71,194 71,742 360,616 387,771Depreciation and non-capitalized expenditures . . . . . . . . . . . . . . . . . . . 53,876 (3,059) 1,314 52,131 47,932Interest expense on bonds and interest rate swaps . . . . . . . . . . . . . . . . . . 10,765 1,202 918 12,885 12,748Other net periodic pension and postretirement benefit cost . . . . . . . . . . 6,338 6,338 4,160
Total 2020 . . . . . . . . . . . . . . . . . . . . . . . . . . . . . . . . . . . . . . . . . . . . . . $282,321 $75,675 $73,974 $431,970
Total 2019 . . . . . . . . . . . . . . . . . . . . . . . . . . . . . . . . . . . . . . . . . . . . . . $278,816 $86,788 $87,007 $452,611
The accompanying notes are an integral part of the financial statements.
The Metropolitan Museum of Art for the year ended June 30, 2020, with summarized financialStatement of Expenses by Functional and Natural Classification information for the year ended June 30, 2019 (in thousands)
54
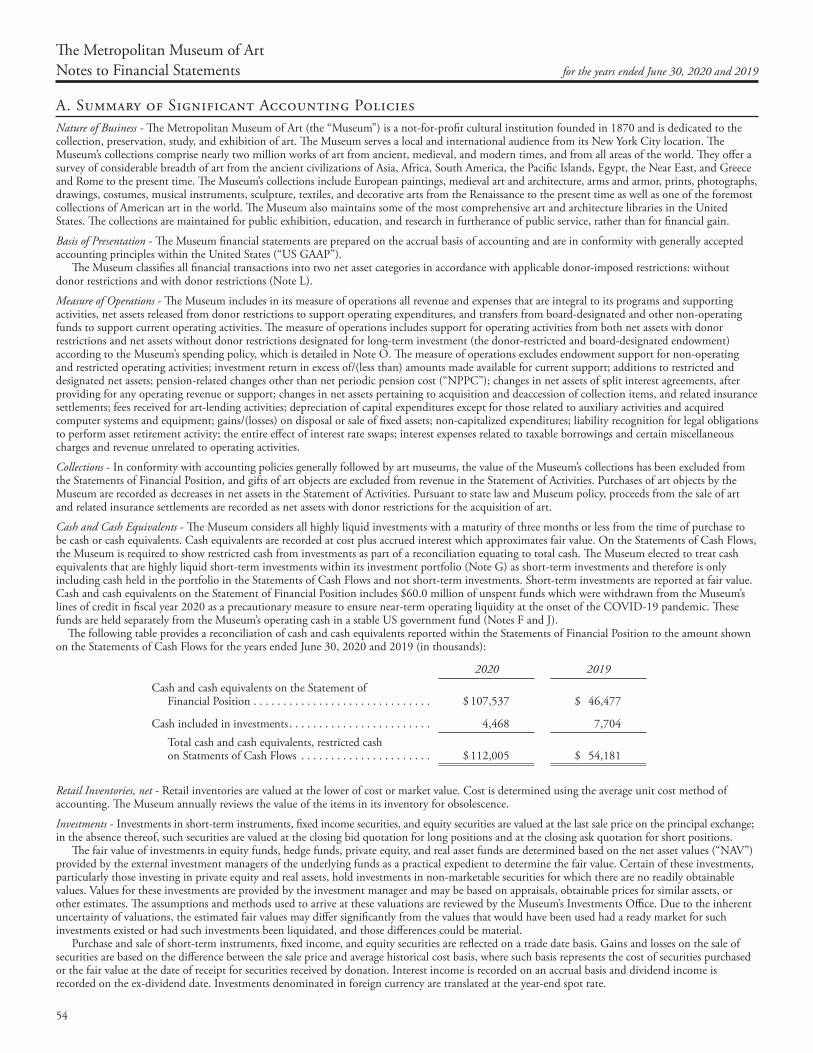
A. Summary of Significant Accounting PoliciesNature of Business - The Metropolitan Museum of Art (the “Museum”) is a not-for-profit cultural institution founded in 1870 and is dedicated to the collection, preservation, study, and exhibition of art. The Museum serves a local and international audience from its New York City location. The Museum’s collections comprise nearly two million works of art from ancient, medieval, and modern times, and from all areas of the world. They offer a survey of considerable breadth of art from the ancient civilizations of Asia, Africa, South America, the Pacific Islands, Egypt, the Near East, and Greece and Rome to the present time. The Museum’s collections include European paintings, medieval art and architecture, arms and armor, prints, photographs, drawings, costumes, musical instruments, sculpture, textiles, and decorative arts from the Renaissance to the present time as well as one of the foremost collections of American art in the world. The Museum also maintains some of the most comprehensive art and architecture libraries in the United States. The collections are maintained for public exhibition, education, and research in furtherance of public service, rather than for financial gain.
Basis of Presentation - The Museum financial statements are prepared on the accrual basis of accounting and are in conformity with generally accepted accounting principles within the United States (“US GAAP”). The Museum classifies all financial transactions into two net asset categories in accordance with applicable donor-imposed restrictions: without donor restrictions and with donor restrictions (Note L).
Measure of Operations - The Museum includes in its measure of operations all revenue and expenses that are integral to its programs and supporting activities, net assets released from donor restrictions to support operating expenditures, and transfers from board-designated and other non-operating funds to support current operating activities. The measure of operations includes support for operating activities from both net assets with donor restrictions and net assets without donor restrictions designated for long-term investment (the donor-restricted and board-designated endowment) according to the Museum’s spending policy, which is detailed in Note O. The measure of operations excludes endowment support for non-operating and restricted operating activities; investment return in excess of/(less than) amounts made available for current support; additions to restricted and designated net assets; pension-related changes other than net periodic pension cost (“NPPC”); changes in net assets of split interest agreements, after providing for any operating revenue or support; changes in net assets pertaining to acquisition and deaccession of collection items, and related insurance settlements; fees received for art-lending activities; depreciation of capital expenditures except for those related to auxiliary activities and acquired computer systems and equipment; gains/(losses) on disposal or sale of fixed assets; non-capitalized expenditures; liability recognition for legal obligations to perform asset retirement activity; the entire effect of interest rate swaps; interest expenses related to taxable borrowings and certain miscellaneous charges and revenue unrelated to operating activities.
Collections - In conformity with accounting policies generally followed by art museums, the value of the Museum’s collections has been excluded from the Statements of Financial Position, and gifts of art objects are excluded from revenue in the Statement of Activities. Purchases of art objects by the Museum are recorded as decreases in net assets in the Statement of Activities. Pursuant to state law and Museum policy, proceeds from the sale of art and related insurance settlements are recorded as net assets with donor restrictions for the acquisition of art.
Cash and Cash Equivalents - The Museum considers all highly liquid investments with a maturity of three months or less from the time of purchase to be cash or cash equivalents. Cash equivalents are recorded at cost plus accrued interest which approximates fair value. On the Statements of Cash Flows, the Museum is required to show restricted cash from investments as part of a reconciliation equating to total cash. The Museum elected to treat cash equivalents that are highly liquid short-term investments within its investment portfolio (Note G) as short-term investments and therefore is only including cash held in the portfolio in the Statements of Cash Flows and not short-term investments. Short-term investments are reported at fair value. Cash and cash equivalents on the Statement of Financial Position includes $60.0 million of unspent funds which were withdrawn from the Museum’s lines of credit in fiscal year 2020 as a precautionary measure to ensure near-term operating liquidity at the onset of the COVID-19 pandemic. These funds are held separately from the Museum’s operating cash in a stable US government fund (Notes F and J).
The following table provides a reconciliation of cash and cash equivalents reported within the Statements of Financial Position to the amount shown on the Statements of Cash Flows for the years ended June 30, 2020 and 2019 (in thousands):
2020 2019Cash and cash equivalents on the Statement of Financial Position . . . . . . . . . . . . . . . . . . . . . . . . . . . . . . $ 107,537 $ 46,477
Cash included in investments . . . . . . . . . . . . . . . . . . . . . . . . 4,468 7,704 Total cash and cash equivalents, restricted cash on Statments of Cash Flows . . . . . . . . . . . . . . . . . . . . . . $ 112,005 $ 54,181
Retail Inventories, net - Retail inventories are valued at the lower of cost or market value. Cost is determined using the average unit cost method of accounting. The Museum annually reviews the value of the items in its inventory for obsolescence.
Investments - Investments in short-term instruments, fixed income securities, and equity securities are valued at the last sale price on the principal exchange; in the absence thereof, such securities are valued at the closing bid quotation for long positions and at the closing ask quotation for short positions.
The fair value of investments in equity funds, hedge funds, private equity, and real asset funds are determined based on the net asset values (“NAV”) provided by the external investment managers of the underlying funds as a practical expedient to determine the fair value. Certain of these investments, particularly those investing in private equity and real assets, hold investments in non-marketable securities for which there are no readily obtainable values. Values for these investments are provided by the investment manager and may be based on appraisals, obtainable prices for similar assets, or other estimates. The assumptions and methods used to arrive at these valuations are reviewed by the Museum’s Investments Office. Due to the inherent uncertainty of valuations, the estimated fair values may differ significantly from the values that would have been used had a ready market for such investments existed or had such investments been liquidated, and those differences could be material.
Purchase and sale of short-term instruments, fixed income, and equity securities are reflected on a trade date basis. Gains and losses on the sale of securities are based on the difference between the sale price and average historical cost basis, where such basis represents the cost of securities purchased or the fair value at the date of receipt for securities received by donation. Interest income is recorded on an accrual basis and dividend income is recorded on the ex-dividend date. Investments denominated in foreign currency are translated at the year-end spot rate.
Notes to Financial Statements for the years ended June 30, 2020 and 2019
The Metropolitan Museum of Art
55
Derivative Instruments - The Museum records derivative instruments (e.g., interest rate swap agreements and foreign currency forward exchange contracts) at fair value in accordance with Derivatives and Hedges Accounting and Fair Value Accounting guidance. The change in fair value during the reporting period, together with the net effect of the interest rate swap and foreign currency forward exchange contracts, is recognized below the operating measure.
Fixed Assets - The building occupied by the Museum on Fifth Avenue is owned by the City of New York (the “City”) and is leased free of charge to the Museum pursuant to a capital lease. The value of the original building is not included on the Statements of Financial Position since it is fully depreciated. Certain building and gallery improvements are paid for by the City and are included in fixed assets. Contributions from the City for assets that are not yet placed into service are reflected in net assets with donor restrictions.
Building and leasehold improvements are capitalized and reported as fixed assets. The Met Cloisters in Fort Tryon Park and other buildings that are the property of the Museum are included as fixed assets and are stated at cost. Amortization of leasehold improvements of the Fifth Avenue building and depreciation of buildings, improvements, and equipment are computed on a straight-line basis over the estimated useful lives of the assets. Amortization of leasehold improvements related to auxiliary activities is computed on a straight-line basis over the shorter of the remaining term of the lease or estimated useful lives of the assets.
Long-lived assets such as fixed assets are reviewed for impairment when events or circumstances indicate that their carrying value may not be recoverable.
Deferred Income - Membership dues received from individuals and corporations pertaining to all membership categories are recognized as revenue upon receipt for the portion of the dues that are considered a contribution to the Museum, while the portion of the dues that relates to the service the Museum will provide the Member is recognized as revenue ratably over the term of the membership period, up to 24 months. Amounts not yet earned by the end of the fiscal year are reported as deferred income. The Museum has reviewed membership revenue as part of the adoption of Topic 606 and has determined the Museum provides service to Members equally over the membership term and thus requires no change to the accounting of this revenue.
Admissions Income - Admissions revenue is associated with tickets sold for entry to the Museum. Admissions revenue ticket price is based upon established levels for individuals and groups. The Museum primarily recognizes revenue for admissions at point of sale.
Retail and Auxiliary Revenues - Auxiliary activities consist primarily of revenue from retail, restaurant operations, and the parking garage. Revenue related to retail and auxiliary activities is primarily recognized at point of sale as the service has been provided in full by the Museum.
Contributions, Contributed Utilities, and Support - Contributions, including cash, in-kind contributions, and unconditional promises to give (pledges), are recorded as revenue in the period in which they are received. Conditional contributions are recognized as revenue when the conditions on which they depend have been substantially met. Contributions are recorded at fair value, and in the case of pledges, net of estimated uncollectible amounts, and discounted if due in over one year.
Several utility costs of the Museum are paid for by the City. The value of such costs is reported as revenue and a corresponding amount is included as an expense in the Statement of Activities, totaling $14.1 million and $15.8 million in fiscal years 2020 and 2019, respectively. The City also provides funds for guardianship and maintenance, including reimbursement for salaries, Social Security, and pension contributions.
The Museum has volunteers who provide assistance in various areas of the Museum. Such contributed services do not meet the criteria for recognition of contributed services contained in US GAAP and, accordingly, are not reflected in the accompanying financial statements.
Bond Issuance Costs - Bond issuance costs, which represent costs to obtain financing for infrastructure projects for the Museum, are currently included in loans payable and other long-term liabilities on the Statements of Financial Position; amortization of these costs extends over the life of the applicable loan.
Allocation of Expenses - The costs of providing Museum programs and supporting services are shown on the Statement of Expenses by Functional and Natural Classification. Program services include curatorial, conservation, exhibition, education, and library activities and public services. Supporting services include fundraising and management and general administrative costs. Fundraising costs include expenses associated with individual and corporate memberships, annual appeals, benefit events, the capital campaign, and other fundraising efforts. Management and general administrative costs include expenses for executive management, financial administration, information systems, human resources, and legal services. Auxiliary activities include retail, restaurant, and parking garage expenses.
Natural expenses attributable to numerous functional expense categories are allocated using reasonable cost allocation methodologies. Security costs are allocated by a square-footage and guard-post basis. Buildings management, facilities, depreciation, and interest are allocated on a square-footage basis. Information technology costs are allocated on a number of machines basis.
The Statement of Expenses by Functional and Natural Classification includes expenses that are netted within revenues on the Statement of Activities due to the nature of the operations of the Museum.
Advertising - Advertising expenses pertaining to retail activities, mostly attributable to the production and distribution of catalogues, amounted to $3.8 million and $4.8 million in fiscal years 2020 and 2019, respectively. Other advertising expenses incurred primarily in support of special exhibi-tions, the permanent collection, and live arts totaled $3.1 million and $4.8 million in fiscal years 2020 and 2019, respectively. All advertising is expensed as incurred.
Interest Expense - Interest on tax-exempt debt, including commitment fees, is charged to operating expenses. Interest expense related to interest rate swap agreements and the Series 2015 Bonds interest is charged to non-operating activities, as the proceeds are used solely to fund infrastructure projects.
Income Tax Status - The Museum is a not-for-profit organization exempt from income tax under Section 501(c)(3) of the Internal Revenue Code.
Use of Estimates - The preparation of financial statements in conformity with US GAAP requires management to make estimates and assumptions that affect the reported amounts of assets and liabilities and the disclosure of contingent assets and liabilities at the date of the financial statements and the reported amounts of revenue and expenses during the reporting period. Actual results could differ from those estimates.
Summarized Comparative Information - The financial statements include certain prior year summarized comparative information in total but not by net asset class. Such information does not include sufficient detail to constitute a presentation in conformity with US GAAP. Accordingly, such information should be read in conjunction with the Museum financial statements for the year ended June 30, 2019, from which the summarized information was derived.
Adopted Accounting Pronouncements - In November 2016, the FASB issued ASU 2016-18, Statement of Cash Flows (Topic 230). The new guidance requires that the reconciliation of the beginning-of-period and end-of period amounts shown in the Statements of Cash Flows include restricted cash and restricted cash equivalents. Companies will also need to disclose information about the nature of the restrictions. The new standard was effective January 1, 2019, and was adopted by the Museum using a retrospective application. The Museum has implemented the new guidance as included in
56
the Cash and Cash Equivalents section of Note A above. The adoption of ASU 2016-18 did not have an impact on the Museum’s results of operations; however, the adoption increased the 2019 beginning-of-the-year cash balance by $4.3 million and decreased net cash used in investing activities for the year ended June 30, 2019, from $79.8 million as previously reported to $76.4 million in the Statements of Cash Flows.
In March 2017, the FASB issued ASU 2017-07, Improving the Presentation of Net Periodic Pension Cost and Net Periodic Postretirement Benefit Cost, which requires that an employer report the service cost component in the same line item or items as other compensation costs arising from services rendered by the pertinent employees during the period. The other components of net benefit cost are required to be presented in the income statement separately from the service cost component and outside a subtotal of income from operations, if one is presented. The amendments in this update also allow only the service cost component to be eligible for capitalization when applicable. The amendments in this update are effective for fiscal years beginning after December 15, 2018 (fiscal year 2020 for the Museum), with early adoption permitted. The Museum adopted this standard in 2020 on a retrospective basis and as a result, recorded the non-service cost components of the net periodic costs for its pension and postretirement benefit plans of $6.3 million and $4.2 million within the non-operating section of the Statements of Activities for the years ended June 30, 2020 and 2019, respectively. The Museum utilized a permitted practical expedient whereby an employer may use the amounts disclosed in the note for Pension and Other Postretirement Benefit Plans (Note I) for the prior comparative period as the estimation basis for applying the retrospective presentation requirements.
New Accounting Pronouncements - In February 2016, the FASB issued ASU No. 2016-02, Leases (Topic 842). Under this guidance, lessees will need to recognize the following for all leases (with the exception of leases with a term of twelve months or less) at the commencement date: (a) a lease liability, which is a lessee’s obligation to make lease payments arising from a lease, measured on a discounted basis; and (b) a right-of-use asset, which is an asset that represents the lessee’s right to use, or control the use of, a specified asset for the lease term. Under the new guidance, lessor accounting is largely unchanged. The guidance requires a modified retrospective transition approach for leases existing at, or entered into after, the beginning of the earliest comparative period presented in the financial statements. The modified retrospective approach would not require any transition accounting for leases that expire before the earliest comparative period presented. A full retrospective transition approach is not permitted. The standard, as amended by ASU 2020-05, is effective for fiscal years beginning after December 15, 2019 (fiscal year 2021 for the Museum), with early application permitted. The Museum is evaluating the impact of this standard on the financial statements and will adopt in fiscal year 2021.
In March 2019, the FASB issued ASU 2019-03, Updating the Definition of Collections. The new ASU aligns the US GAAP definition of collections with the American Alliance of Museum’s current policy regarding the management of collections. Under the amendments, the definition of collections will be expanded to allow the proceeds from sales of collection items to be used in the direct care of existing collection items. Entities can allow proceeds to be used for both direct care and acquisitions, or they can retain the narrower definition and continue to restrict the use of proceeds to the acquisition of new collection items consistent with the current US GAAP definition. The amendments in this update are effective for fiscal years beginning after December 15, 2019 (fiscal year 2021 for the Museum), with early adoption permitted. The Museum is evaluating the impact of this standard on the financial statements.
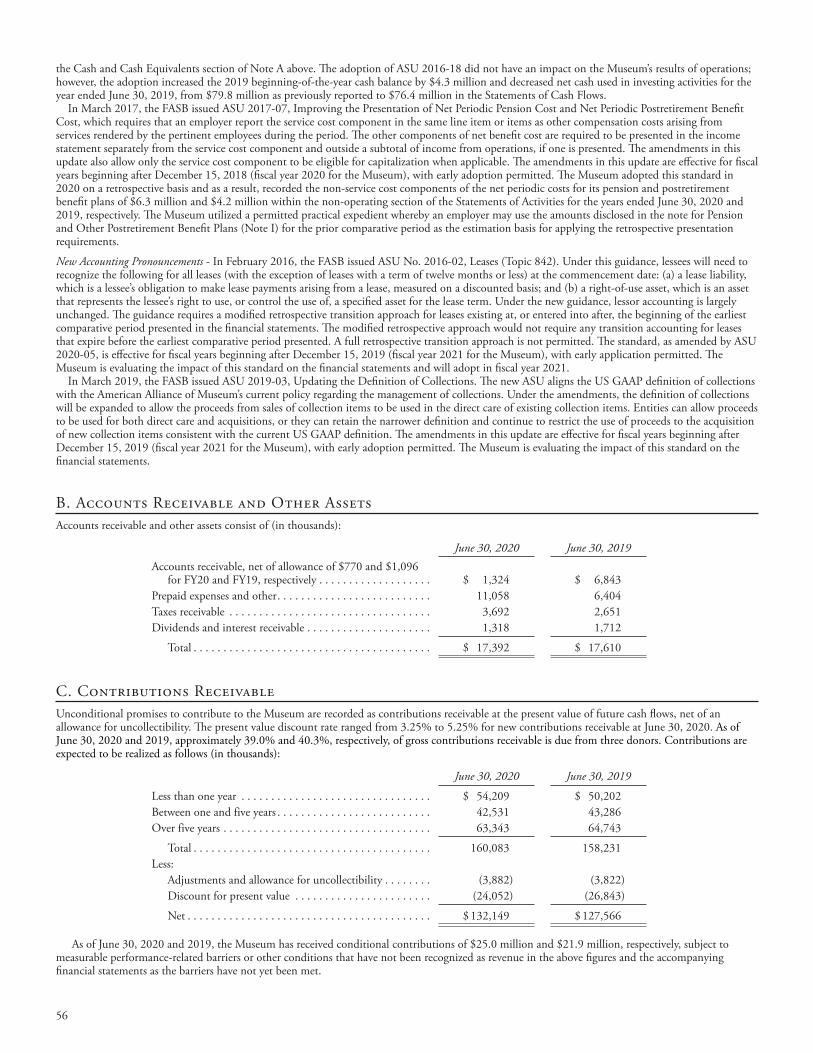
B. Accounts Receivable and Other AssetsAccounts receivable and other assets consist of (in thousands):
June 30, 2020 June 30, 2019Accounts receivable, net of allowance of $770 and $1,096 for FY20 and FY19, respectively . . . . . . . . . . . . . . . . . . . $ 1,324 $ 6,843Prepaid expenses and other . . . . . . . . . . . . . . . . . . . . . . . . . . 11,058 6,404Taxes receivable . . . . . . . . . . . . . . . . . . . . . . . . . . . . . . . . . . 3,692 2,651Dividends and interest receivable . . . . . . . . . . . . . . . . . . . . . 1,318 1,712
Total . . . . . . . . . . . . . . . . . . . . . . . . . . . . . . . . . . . . . . . . $ 17,392 $ 17,610
C. Contributions ReceivableUnconditional promises to contribute to the Museum are recorded as contributions receivable at the present value of future cash flows, net of an allowance for uncollectibility. The present value discount rate ranged from 3.25% to 5.25% for new contributions receivable at June 30, 2020. As of June 30, 2020 and 2019, approximately 39.0% and 40.3%, respectively, of gross contributions receivable is due from three donors. Contributions are expected to be realized as follows (in thousands):
June 30, 2020 June 30, 2019
Less than one year . . . . . . . . . . . . . . . . . . . . . . . . . . . . . . . . $ 54,209 $ 50,202Between one and five years . . . . . . . . . . . . . . . . . . . . . . . . . . 42,531 43,286Over five years . . . . . . . . . . . . . . . . . . . . . . . . . . . . . . . . . . . 63,343 64,743
Total . . . . . . . . . . . . . . . . . . . . . . . . . . . . . . . . . . . . . . . . 160,083 158,231Less: Adjustments and allowance for uncollectibility . . . . . . . . (3,882) (3,822) Discount for present value . . . . . . . . . . . . . . . . . . . . . . . (24,052) (26,843)
Net . . . . . . . . . . . . . . . . . . . . . . . . . . . . . . . . . . . . . . . . . $ 132,149 $ 127,566
As of June 30, 2020 and 2019, the Museum has received conditional contributions of $25.0 million and $21.9 million, respectively, subject to measurable performance-related barriers or other conditions that have not been recognized as revenue in the above figures and the accompanying financial statements as the barriers have not yet been met.
57
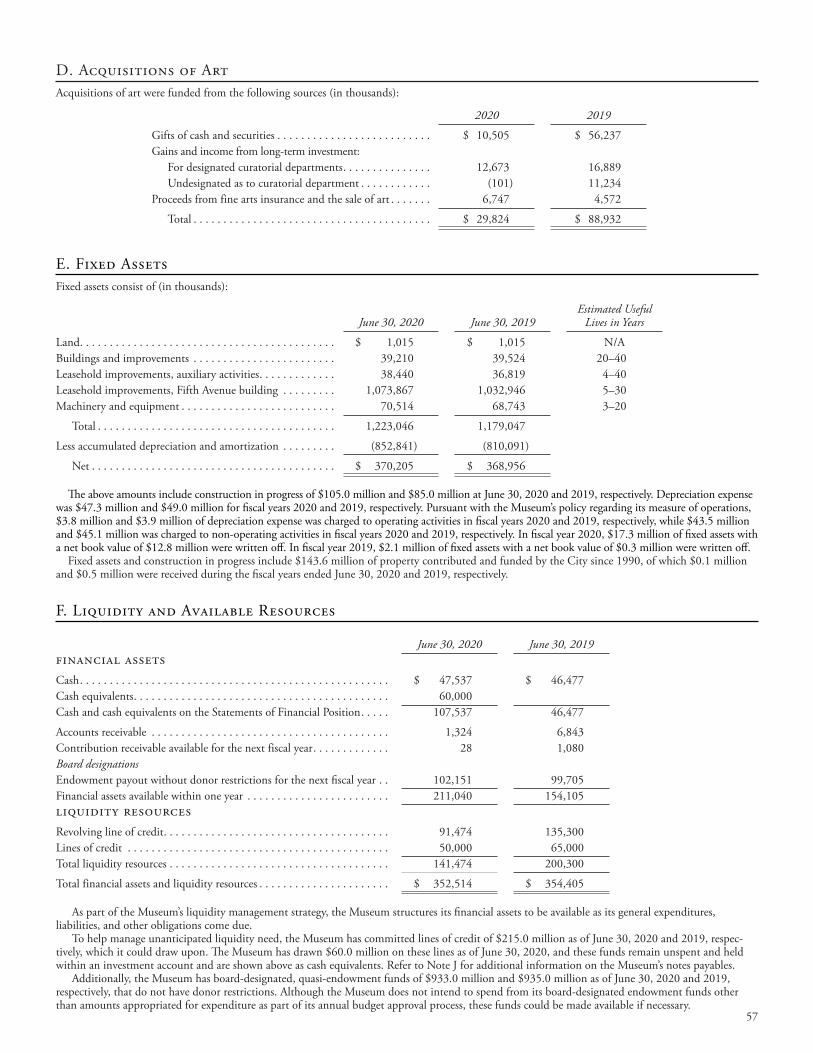
D. Acquisitions of ArtAcquisitions of art were funded from the following sources (in thousands):
2020 2019
Gifts of cash and securities . . . . . . . . . . . . . . . . . . . . . . . . . . $ 10,505 $ 56,237Gains and income from long-term investment: For designated curatorial departments . . . . . . . . . . . . . . . 12,673 16,889 Undesignated as to curatorial department . . . . . . . . . . . . (101) 11,234Proceeds from fine arts insurance and the sale of art . . . . . . . 6,747 4,572
Total . . . . . . . . . . . . . . . . . . . . . . . . . . . . . . . . . . . . . . . . $ 29,824 $ 88,932
E. Fixed AssetsFixed assets consist of (in thousands):
June 30, 2020 June 30, 2019Estimated Useful
Lives in Years
Land . . . . . . . . . . . . . . . . . . . . . . . . . . . . . . . . . . . . . . . . . . . $ 1,015 $ 1,015 N/ABuildings and improvements . . . . . . . . . . . . . . . . . . . . . . . . 39,210 39,524 20–40Leasehold improvements, auxiliary activities . . . . . . . . . . . . . 38,440 36,819 4–40Leasehold improvements, Fifth Avenue building . . . . . . . . . 1,073,867 1,032,946 5–30Machinery and equipment . . . . . . . . . . . . . . . . . . . . . . . . . . 70,514 68,743 3–20
Total . . . . . . . . . . . . . . . . . . . . . . . . . . . . . . . . . . . . . . . . 1,223,046 1,179,047
Less accumulated depreciation and amortization . . . . . . . . . (852,841) (810,091)
Net . . . . . . . . . . . . . . . . . . . . . . . . . . . . . . . . . . . . . . . . . $ 370,205 $ 368,956
The above amounts include construction in progress of $105.0 million and $85.0 million at June 30, 2020 and 2019, respectively. Depreciation expense was $47.3 million and $49.0 million for fiscal years 2020 and 2019, respectively. Pursuant with the Museum’s policy regarding its measure of operations, $3.8 million and $3.9 million of depreciation expense was charged to operating activities in fiscal years 2020 and 2019, respectively, while $43.5 million and $45.1 million was charged to non-operating activities in fiscal years 2020 and 2019, respectively. In fiscal year 2020, $17.3 million of fixed assets with a net book value of $12.8 million were written off. In fiscal year 2019, $2.1 million of fixed assets with a net book value of $0.3 million were written off.
Fixed assets and construction in progress include $143.6 million of property contributed and funded by the City since 1990, of which $0.1 million and $0.5 million were received during the fiscal years ended June 30, 2020 and 2019, respectively.
F. LiQUIDITY AND AVAILABLE RESOURCES
June 30, 2020 June 30, 2019financial assetsCash . . . . . . . . . . . . . . . . . . . . . . . . . . . . . . . . . . . . . . . . . . . . . . . . . . . . $ 47,537 $ 46,477Cash equivalents . . . . . . . . . . . . . . . . . . . . . . . . . . . . . . . . . . . . . . . . . . . 60,000 Cash and cash equivalents on the Statements of Financial Position . . . . . 107,537 46,477
Accounts receivable . . . . . . . . . . . . . . . . . . . . . . . . . . . . . . . . . . . . . . . . 1,324 6,843Contribution receivable available for the next fiscal year . . . . . . . . . . . . . 28 1,080Board designations Endowment payout without donor restrictions for the next fiscal year . . 102,151 99,705Financial assets available within one year . . . . . . . . . . . . . . . . . . . . . . . . 211,040 154,105liquidity resources Revolving line of credit . . . . . . . . . . . . . . . . . . . . . . . . . . . . . . . . . . . . . . 91,474 135,300Lines of credit . . . . . . . . . . . . . . . . . . . . . . . . . . . . . . . . . . . . . . . . . . . . 50,000 65,000Total liquidity resources . . . . . . . . . . . . . . . . . . . . . . . . . . . . . . . . . . . . . 141,474 200,300
Total financial assets and liquidity resources . . . . . . . . . . . . . . . . . . . . . . $ 352,514 $ 354,405 As part of the Museum’s liquidity management strategy, the Museum structures its financial assets to be available as its general expenditures, liabilities, and other obligations come due. To help manage unanticipated liquidity need, the Museum has committed lines of credit of $215.0 million as of June 30, 2020 and 2019, respec-tively, which it could draw upon. The Museum has drawn $60.0 million on these lines as of June 30, 2020, and these funds remain unspent and held within an investment account and are shown above as cash equivalents. Refer to Note J for additional information on the Museum’s notes payables. Additionally, the Museum has board-designated, quasi-endowment funds of $933.0 million and $935.0 million as of June 30, 2020 and 2019, respectively, that do not have donor restrictions. Although the Museum does not intend to spend from its board-designated endowment funds other than amounts appropriated for expenditure as part of its annual budget approval process, these funds could be made available if necessary.
58
However, these endowment funds contain investments with lock-up provisions that reduce the total investments that could be made available (see Note G for disclosures regarding the investment portfolio).
In January 2020, the World Health Organization recognized the novel strain of coronavirus, COVID-19, as a pandemic. In response to this outbreak, many local and national governments have imposed restrictions on business operations, travel, and time spent outside the home. In accor-dance with guidelines issued by the New York State government, the Museum closed on March 13, 2020, and remained closed through the end of the fiscal year.
The Museum reopened to the public with limited hours and occupancy, in accordance with New York State directives, on August 29, 2020. There is considerable uncertainty regarding the impact on future operations, including reopening restrictions, low visitorship due to travel restrictions and the comfort of visitors to return to museums, and the impact on other sources of revenue such as fundraising events, retail operations, food services, educational programs and events, and donations. Therefore, the Museum expects this matter to continue to negatively impact its operating results into fiscal year 2021.
The Museum believes it will maintain compliance with its debt covenants and meet its obligations as they become due as a result of initiatives implemented and agreements in place at this time. However, given the uncertainty regarding the development of this pandemic and steps taken to contain it or treat its effects, there is difficulty in predicting the ultimate duration and severity of the impact of COVID-19 on the Museum. The ultimate impact of these uncertainties may be material to the Museum’s results and financial position in the future.
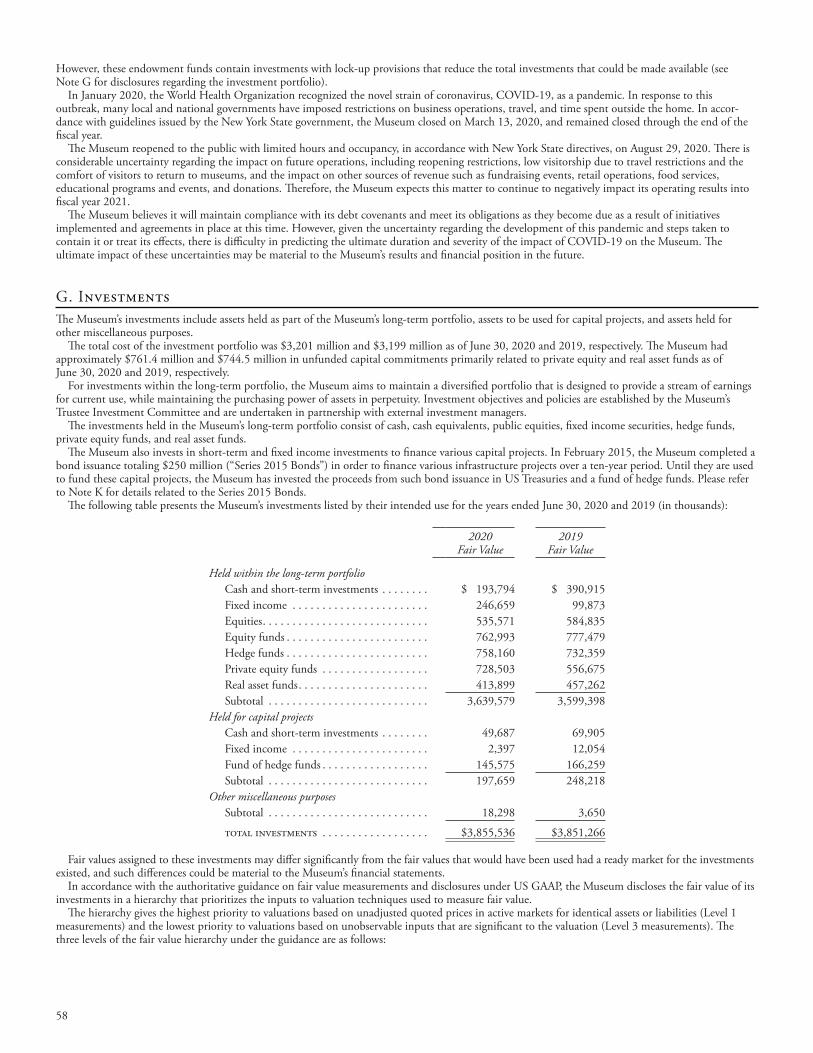
G. InvestmentsThe Museum’s investments include assets held as part of the Museum’s long-term portfolio, assets to be used for capital projects, and assets held for other miscellaneous purposes.
The total cost of the investment portfolio was $3,201 million and $3,199 million as of June 30, 2020 and 2019, respectively. The Museum had approximately $761.4 million and $744.5 million in unfunded capital commitments primarily related to private equity and real asset funds as of June 30, 2020 and 2019, respectively.
For investments within the long-term portfolio, the Museum aims to maintain a diversified portfolio that is designed to provide a stream of earnings for current use, while maintaining the purchasing power of assets in perpetuity. Investment objectives and policies are established by the Museum’s Trustee Investment Committee and are undertaken in partnership with external investment managers.
The investments held in the Museum’s long-term portfolio consist of cash, cash equivalents, public equities, fixed income securities, hedge funds, private equity funds, and real asset funds.
The Museum also invests in short-term and fixed income investments to finance various capital projects. In February 2015, the Museum completed a bond issuance totaling $250 million (“Series 2015 Bonds”) in order to finance various infrastructure projects over a ten-year period. Until they are used to fund these capital projects, the Museum has invested the proceeds from such bond issuance in US Treasuries and a fund of hedge funds. Please refer to Note K for details related to the Series 2015 Bonds.
The following table presents the Museum’s investments listed by their intended use for the years ended June 30, 2020 and 2019 (in thousands):
2020Fair Value
2019Fair Value
Held within the long-term portfolio Cash and short-term investments . . . . . . . . $ 193,794 $ 390,915 Fixed income . . . . . . . . . . . . . . . . . . . . . . . 246,659 99,873 Equities . . . . . . . . . . . . . . . . . . . . . . . . . . . . 535,571 584,835 Equity funds . . . . . . . . . . . . . . . . . . . . . . . . 762,993 777,479 Hedge funds . . . . . . . . . . . . . . . . . . . . . . . . 758,160 732,359 Private equity funds . . . . . . . . . . . . . . . . . . 728,503 556,675 Real asset funds . . . . . . . . . . . . . . . . . . . . . . 413,899 457,262 Subtotal . . . . . . . . . . . . . . . . . . . . . . . . . . . 3,639,579 3,599,398Held for capital projects Cash and short-term investments . . . . . . . . 49,687 69,905 Fixed income . . . . . . . . . . . . . . . . . . . . . . . 2,397 12,054 Fund of hedge funds . . . . . . . . . . . . . . . . . . 145,575 166,259 Subtotal . . . . . . . . . . . . . . . . . . . . . . . . . . . 197,659 248,218Other miscellaneous purposes Subtotal . . . . . . . . . . . . . . . . . . . . . . . . . . . 18,298 3,650
total investments . . . . . . . . . . . . . . . . . . $3,855,536 $3,851,266
Fair values assigned to these investments may differ significantly from the fair values that would have been used had a ready market for the investments existed, and such differences could be material to the Museum’s financial statements.
In accordance with the authoritative guidance on fair value measurements and disclosures under US GAAP, the Museum discloses the fair value of its investments in a hierarchy that prioritizes the inputs to valuation techniques used to measure fair value.
The hierarchy gives the highest priority to valuations based on unadjusted quoted prices in active markets for identical assets or liabilities (Level 1 measurements) and the lowest priority to valuations based on unobservable inputs that are significant to the valuation (Level 3 measurements). The three levels of the fair value hierarchy under the guidance are as follows:

59
Level 1 - Quoted market prices for identical instruments in active markets. Level 1 assets include cash, cash equivalents, bonds, and equity securities actively traded on recognized exchanges both domestic and foreign. These investments are freely tradable and are valued based on quoted prices from active markets.
Level 2 - Quoted prices for similar assets or liabilities in active markets, quoted prices for identical or similar assets in markets that are not active, observable inputs other than quoted prices, inputs derived principally from or corroborated by observable market data by correlation or other means. Level 2 assets primarily consist of funds that invest in exchange-traded equity, fixed income securities, and derivatives. The receipt of information regarding underlying holdings generally is less frequent than assets classified as Level 1. Valuations are based on quoted prices or other significant observable inputs. The Investments Office performs a number of procedures to support the reasonableness of the valuation of these investments.
Level 3 - Valuation models in which significant inputs are unobservable or where there is little, if any, market activity.
An investment’s level within the fair value hierarchy is based on the lowest level of any input that is significant to the fair value measurement. However, the determination of what constitutes “observable” requires significant judgment by the Museum. The Museum considers observable data to be that market data which is readily available, regularly distributed or updated, reliable and verifiable, not proprietary, and provided by multiple, independent sources that are actively involved in the relevant market. The categorization of an investment within the hierarchy is based upon the pricing transparency of the investment and does not necessarily correspond to the Museum’s perceived risk of that investment.
The Museum uses the NAV, provided by external investment managers, as a practical expedient to determine the fair value of the underlying investments that (a) do not have a readily determinable fair value and (b) either have the attributes of an investment company or prepare their financial statements consistent with the measurement principles of an investment company. The Museum reviews these valuations in a number of ways, including, but not limited to, assessing the valuation methodologies employed by each manager, reviewing the footnotes related to valuation in audited financial statements, and evaluating the performance of each investment relative to market and investment-specific data.
For such investments, the Museum applies the guidance outlined in Disclosure for Investments in Certain Entities That Calculated Net Asset Value per Share (or Its Equivalent), which does not require these investments to be categorized within the fair value hierarchy. For investments in funds that are not valued based on the practical expedient, the Museum considers several factors in appropriately classifying these investment funds in the fair value hierarchy. An investment is generally classified as Level 2 if the Museum has the ability to withdraw its investment from the investment fund at the measurement date. An investment is generally classified as Level 3 if the Museum does not have the ability to withdraw its investment from the investment fund, such as investments in private investment funds, side pockets, or funds with suspended withdrawals imposed.
Fair Value MeasurementsThe following tables present the financial instruments as stated on the Statements of Financial Position, by caption and by level within the valuation
hierarchy as of June 30, 2020 and 2019 (in thousands):
Assets and Liabilities at Fair Value as of June 30, 2020
Level 1 Level 2 Level 3Investments valued using the practical expedient Total
Split interest arrangements . . . . . . . . . . . . . . . . . . $ 8,351 $ 15,018 $ 13,983 $ $ 37,352investments: Equities . . . . . . . . . . . . . . . . . . . . . . . . . . . . . . . . 517,317 18,254 535,571Fixed income Government bonds . . . . . . . . . . . . . . . . . . . . . 33,871 33,871 Corporate debt . . . . . . . . . . . . . . . . . . . . . . . . 166,672 4 166,676 Mortgage-backed . . . . . . . . . . . . . . . . . . . . . . 37,377 37,377 Other . . . . . . . . . . . . . . . . . . . . . . . . . . . . . . . 11,132 11,132Cash and short-term investments . . . . . . . . . . . . . 230,027 13,689 243,716Equity funds . . . . . . . . . . . . . . . . . . . . . . . . . . . . . 762,993 762,993Hedge funds . . . . . . . . . . . . . . . . . . . . . . . . . . . . . 758,160 758,160Private equity funds . . . . . . . . . . . . . . . . . . . . . . . 728,503 728,503Real asset funds . . . . . . . . . . . . . . . . . . . . . . . . . . 413,899 413,899Fund of hedge funds held for capital projects . . . . 145,575 145,575Other investments . . . . . . . . . . . . . . . . . . . . . . . . 371 17,692 18,063Total investments . . . . . . . . . . . . . . . . . . . . . . . . . 747,715 280,995 17,696 2,809,130 3,855,536
total assets . . . . . . . . . . . . . . . . . . . . . . . . . . . . $ 756,066 $ 296,013 $ 31,679 $ 2,809,130 $ 3,892,888liabilities:
Annuity and other split interest obligations . . . . . $ $ 15,683 $ 15,683
Interest rate exchange agreements . . . . . . . . . . . . . 50,162 50,162
total liabilities . . . . . . . . . . . . . . . . . . . . . . . . . $ 50,162 $ 15,683 $ 65,845
During the year ended June 30, 2020, Level 3 assets increased following the receipt of the gifted trust with an original value of $21.9 million. This asset is included in Other Investments within Level 3 and valued based on an independent appraisal using a discounted cash flows approach.
60
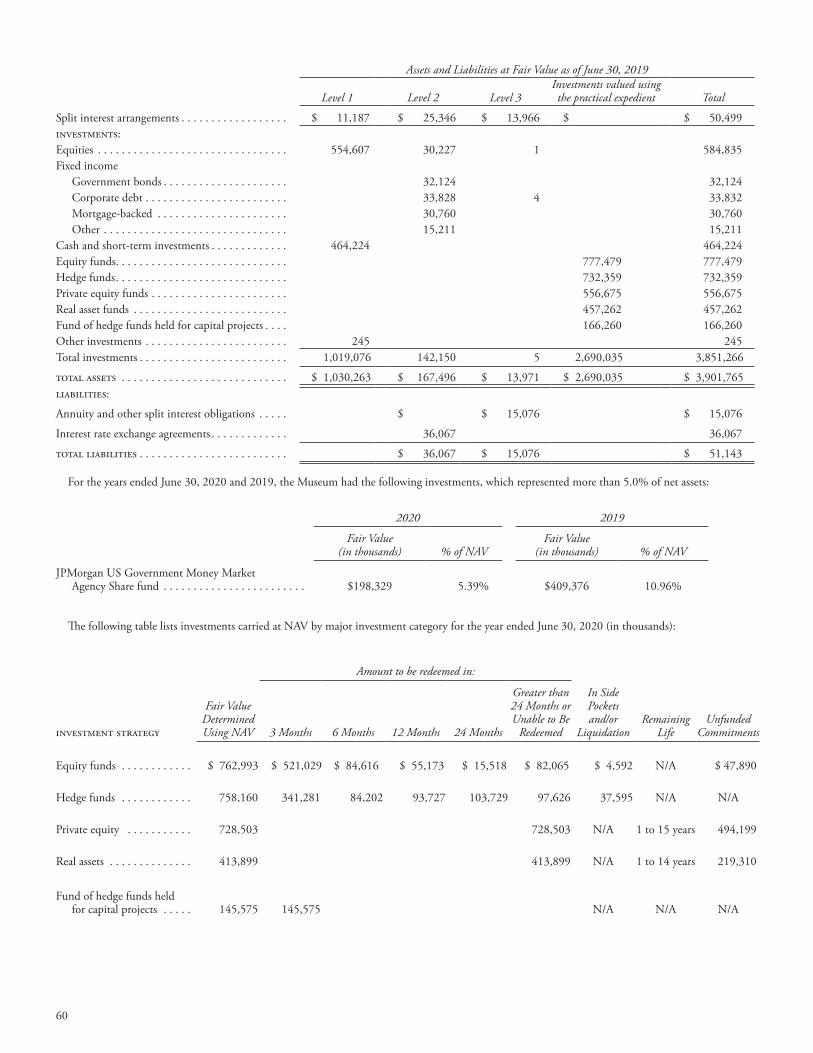
Assets and Liabilities at Fair Value as of June 30, 2019
Level 1 Level 2 Level 3Investments valued using the practical expedient Total
Split interest arrangements . . . . . . . . . . . . . . . . . . $ 11,187 $ 25,346 $ 13,966 $ $ 50,499investments: Equities . . . . . . . . . . . . . . . . . . . . . . . . . . . . . . . . 554,607 30,227 1 584,835Fixed income Government bonds . . . . . . . . . . . . . . . . . . . . . 32,124 32,124 Corporate debt . . . . . . . . . . . . . . . . . . . . . . . . 33,828 4 33,832 Mortgage-backed . . . . . . . . . . . . . . . . . . . . . . 30,760 30,760 Other . . . . . . . . . . . . . . . . . . . . . . . . . . . . . . . 15,211 15,211Cash and short-term investments . . . . . . . . . . . . . 464,224 464,224Equity funds . . . . . . . . . . . . . . . . . . . . . . . . . . . . . 777,479 777,479Hedge funds . . . . . . . . . . . . . . . . . . . . . . . . . . . . . 732,359 732,359Private equity funds . . . . . . . . . . . . . . . . . . . . . . . 556,675 556,675Real asset funds . . . . . . . . . . . . . . . . . . . . . . . . . . 457,262 457,262Fund of hedge funds held for capital projects . . . . 166,260 166,260Other investments . . . . . . . . . . . . . . . . . . . . . . . . 245 245Total investments . . . . . . . . . . . . . . . . . . . . . . . . . 1,019,076 142,150 5 2,690,035 3,851,266
total assets . . . . . . . . . . . . . . . . . . . . . . . . . . . . $ 1,030,263 $ 167,496 $ 13,971 $ 2,690,035 $ 3,901,765liabilities:
Annuity and other split interest obligations . . . . . $ $ 15,076 $ 15,076
Interest rate exchange agreements . . . . . . . . . . . . . 36,067 36,067
total liabilities . . . . . . . . . . . . . . . . . . . . . . . . . $ 36,067 $ 15,076 $ 51,143
For the years ended June 30, 2020 and 2019, the Museum had the following investments, which represented more than 5.0% of net assets:
2020 2019
Fair Value(in thousands) % of NAV
Fair Value(in thousands) % of NAV
JPMorgan US Government Money Market Agency Share fund . . . . . . . . . . . . . . . . . . . . . . . . $198,329 5.39% $409,376 10.96%
The following table lists investments carried at NAV by major investment category for the year ended June 30, 2020 (in thousands):
Amount to be redeemed in:
investment strategy
Fair Value Determined Using NAV 3 Months 6 Months 12 Months 24 Months
Greater than 24 Months or Unable to Be
Redeemed
In Side Pockets and/or
Liquidation Remaining
LifeUnfunded
Commitments
Equity funds . . . . . . . . . . . . $ 762,993 $ 521,029 $ 84,616 $ 55,173 $ 15,518 $ 82,065 $ 4,592 N/A $ 47,890
Hedge funds . . . . . . . . . . . . 758,160 341,281 84,202 93,727 103,729 97,626 37,595 N/A N/A
Private equity . . . . . . . . . . . 728,503 728,503 N/A 1 to 15 years 494,199
Real assets . . . . . . . . . . . . . . 413,899 413,899 N/A 1 to 14 years 219,310
Fund of hedge funds held for capital projects . . . . . 145,575 145,575 N/A N/A N/A
61
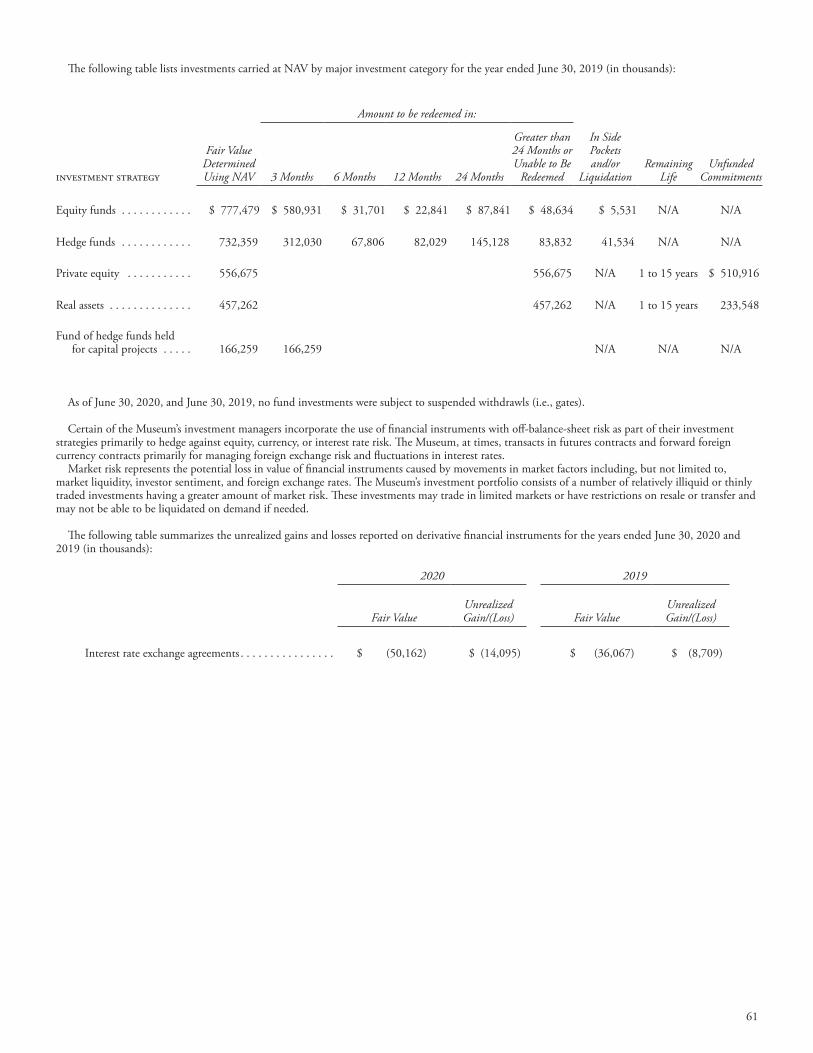
The following table lists investments carried at NAV by major investment category for the year ended June 30, 2019 (in thousands):
Amount to be redeemed in:
investment strategy
Fair Value Determined Using NAV 3 Months 6 Months 12 Months 24 Months
Greater than 24 Months or Unable to Be
Redeemed
In Side Pockets and/or
Liquidation Remaining
LifeUnfunded
Commitments
Equity funds . . . . . . . . . . . . $ 777,479 $ 580,931 $ 31,701 $ 22,841 $ 87,841 $ 48,634 $ 5,531 N/A N/A
Hedge funds . . . . . . . . . . . . 732,359 312,030 67,806 82,029 145,128 83,832 41,534 N/A N/A
Private equity . . . . . . . . . . . 556,675 556,675 N/A 1 to 15 years $ 510,916
Real assets . . . . . . . . . . . . . . 457,262 457,262 N/A 1 to 15 years 233,548
Fund of hedge funds held for capital projects . . . . . 166,259 166,259 N/A N/A N/A
As of June 30, 2020, and June 30, 2019, no fund investments were subject to suspended withdrawls (i.e., gates).
Certain of the Museum’s investment managers incorporate the use of financial instruments with off-balance-sheet risk as part of their investment strategies primarily to hedge against equity, currency, or interest rate risk. The Museum, at times, transacts in futures contracts and forward foreign currency contracts primarily for managing foreign exchange risk and fluctuations in interest rates.
Market risk represents the potential loss in value of financial instruments caused by movements in market factors including, but not limited to, market liquidity, investor sentiment, and foreign exchange rates. The Museum’s investment portfolio consists of a number of relatively illiquid or thinly traded investments having a greater amount of market risk. These investments may trade in limited markets or have restrictions on resale or transfer and may not be able to be liquidated on demand if needed.
The following table summarizes the unrealized gains and losses reported on derivative financial instruments for the years ended June 30, 2020 and 2019 (in thousands):
2020 2019
Fair ValueUnrealized Gain/(Loss) Fair Value
Unrealized Gain/(Loss)
Interest rate exchange agreements . . . . . . . . . . . . . . . . $ (50,162) $ (14,095) $ (36,067) $ (8,709)
62
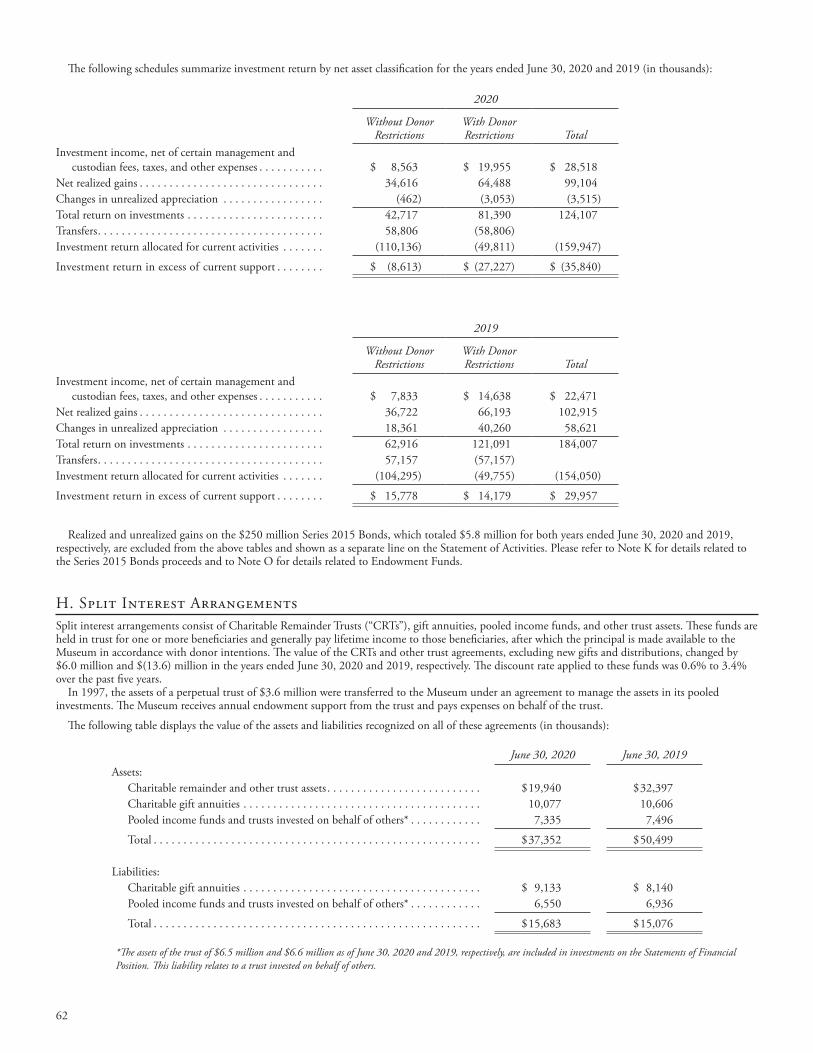
The following schedules summarize investment return by net asset classification for the years ended June 30, 2020 and 2019 (in thousands):
2020
Without Donor Restrictions
With Donor Restrictions Total
Investment income, net of certain management and custodian fees, taxes, and other expenses . . . . . . . . . . . $ 8,563 $ 19,955 $ 28,518Net realized gains . . . . . . . . . . . . . . . . . . . . . . . . . . . . . . . 34,616 64,488 99,104Changes in unrealized appreciation . . . . . . . . . . . . . . . . . (462) (3,053) (3,515)Total return on investments . . . . . . . . . . . . . . . . . . . . . . . 42,717 81,390 124,107Transfers . . . . . . . . . . . . . . . . . . . . . . . . . . . . . . . . . . . . . . 58,806 (58,806) Investment return allocated for current activities . . . . . . . (110,136) (49,811) (159,947)
Investment return in excess of current support . . . . . . . . $ (8,613) $ (27,227) $ (35,840)
2019
Without Donor Restrictions
With Donor Restrictions Total
Investment income, net of certain management and custodian fees, taxes, and other expenses . . . . . . . . . . . $ 7,833 $ 14,638 $ 22,471Net realized gains . . . . . . . . . . . . . . . . . . . . . . . . . . . . . . . 36,722 66,193 102,915Changes in unrealized appreciation . . . . . . . . . . . . . . . . . 18,361 40,260 58,621Total return on investments . . . . . . . . . . . . . . . . . . . . . . . 62,916 121,091 184,007Transfers . . . . . . . . . . . . . . . . . . . . . . . . . . . . . . . . . . . . . . 57,157 (57,157) Investment return allocated for current activities . . . . . . . (104,295) (49,755) (154,050)
Investment return in excess of current support . . . . . . . . $ 15,778 $ 14,179 $ 29,957
Realized and unrealized gains on the $250 million Series 2015 Bonds, which totaled $5.8 million for both years ended June 30, 2020 and 2019, respectively, are excluded from the above tables and shown as a separate line on the Statement of Activities. Please refer to Note K for details related to the Series 2015 Bonds proceeds and to Note O for details related to Endowment Funds.
H. Split Interest ArrangementsSplit interest arrangements consist of Charitable Remainder Trusts (“CRTs”), gift annuities, pooled income funds, and other trust assets. These funds are held in trust for one or more beneficiaries and generally pay lifetime income to those beneficiaries, after which the principal is made available to the Museum in accordance with donor intentions. The value of the CRTs and other trust agreements, excluding new gifts and distributions, changed by $6.0 million and $(13.6) million in the years ended June 30, 2020 and 2019, respectively. The discount rate applied to these funds was 0.6% to 3.4% over the past five years.
In 1997, the assets of a perpetual trust of $3.6 million were transferred to the Museum under an agreement to manage the assets in its pooled investments. The Museum receives annual endowment support from the trust and pays expenses on behalf of the trust.
The following table displays the value of the assets and liabilities recognized on all of these agreements (in thousands):
June 30, 2020 June 30, 2019Assets: Charitable remainder and other trust assets . . . . . . . . . . . . . . . . . . . . . . . . . . $ 19,940 $ 32,397 Charitable gift annuities . . . . . . . . . . . . . . . . . . . . . . . . . . . . . . . . . . . . . . . . 10,077 10,606 Pooled income funds and trusts invested on behalf of others* . . . . . . . . . . . . 7,335 7,496
Total . . . . . . . . . . . . . . . . . . . . . . . . . . . . . . . . . . . . . . . . . . . . . . . . . . . . . . . $ 37,352 $ 50,499
Liabilities: Charitable gift annuities . . . . . . . . . . . . . . . . . . . . . . . . . . . . . . . . . . . . . . . . $ 9,133 $ 8,140 Pooled income funds and trusts invested on behalf of others* . . . . . . . . . . . . 6,550 6,936
Total . . . . . . . . . . . . . . . . . . . . . . . . . . . . . . . . . . . . . . . . . . . . . . . . . . . . . . . $ 15,683 $ 15,076
*The assets of the trust of $6.5 million and $6.6 million as of June 30, 2020 and 2019, respectively, are included in investments on the Statements of Financial Position. This liability relates to a trust invested on behalf of others.
63
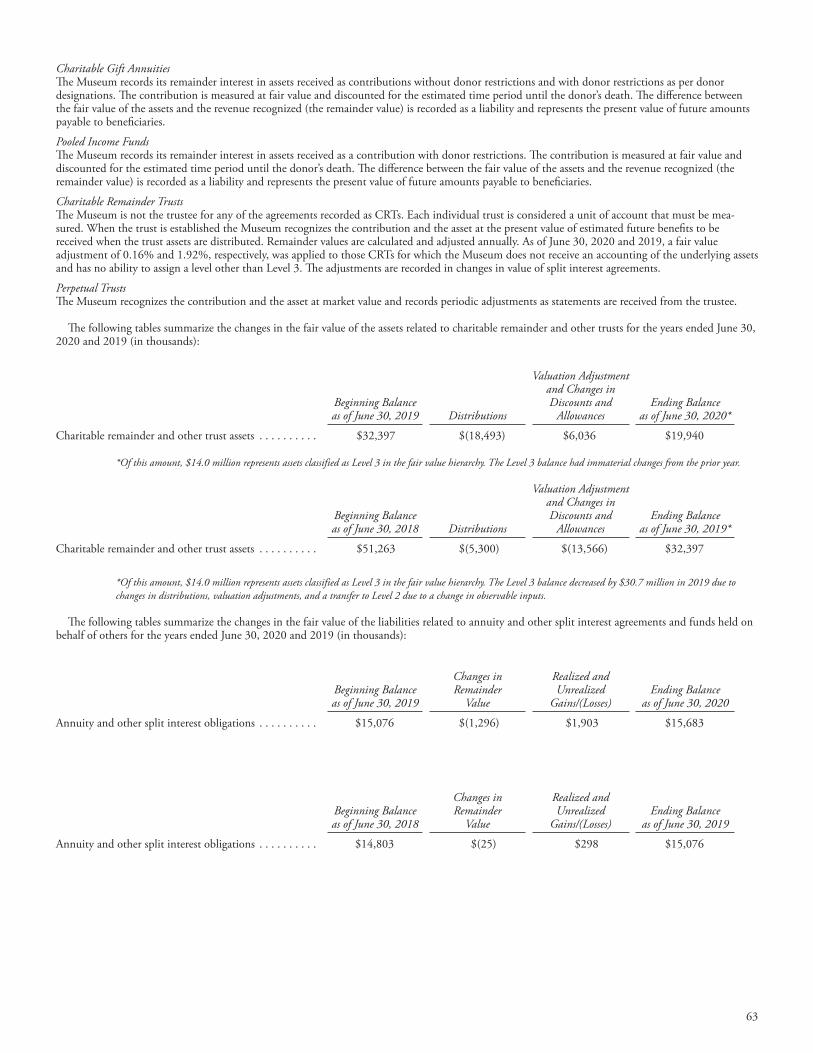
Charitable Gift AnnuitiesThe Museum records its remainder interest in assets received as contributions without donor restrictions and with donor restrictions as per donor designations. The contribution is measured at fair value and discounted for the estimated time period until the donor’s death. The difference between the fair value of the assets and the revenue recognized (the remainder value) is recorded as a liability and represents the present value of future amounts payable to beneficiaries.
Pooled Income FundsThe Museum records its remainder interest in assets received as a contribution with donor restrictions. The contribution is measured at fair value and discounted for the estimated time period until the donor’s death. The difference between the fair value of the assets and the revenue recognized (the remainder value) is recorded as a liability and represents the present value of future amounts payable to beneficiaries.
Charitable Remainder TrustsThe Museum is not the trustee for any of the agreements recorded as CRTs. Each individual trust is considered a unit of account that must be mea-sured. When the trust is established the Museum recognizes the contribution and the asset at the present value of estimated future benefits to be received when the trust assets are distributed. Remainder values are calculated and adjusted annually. As of June 30, 2020 and 2019, a fair value adjustment of 0.16% and 1.92%, respectively, was applied to those CRTs for which the Museum does not receive an accounting of the underlying assets and has no ability to assign a level other than Level 3. The adjustments are recorded in changes in value of split interest agreements.
Perpetual TrustsThe Museum recognizes the contribution and the asset at market value and records periodic adjustments as statements are received from the trustee.
The following tables summarize the changes in the fair value of the assets related to charitable remainder and other trusts for the years ended June 30, 2020 and 2019 (in thousands):
Beginning Balance as of June 30, 2019 Distributions
Valuation Adjustment and Changes in Discounts and
AllowancesEnding Balance
as of June 30, 2020*
Charitable remainder and other trust assets . . . . . . . . . . $ 32,397 $ (18,493) $6,036 $19,940
*Of this amount, $14.0 million represents assets classified as Level 3 in the fair value hierarchy. The Level 3 balance had immaterial changes from the prior year.
Beginning Balance as of June 30, 2018 Distributions
Valuation Adjustment and Changes in Discounts and
AllowancesEnding Balance
as of June 30, 2019*
Charitable remainder and other trust assets . . . . . . . . . . $ 51,263 $ (5,300) $(13,566) $ 32,397
*Of this amount, $14.0 million represents assets classified as Level 3 in the fair value hierarchy. The Level 3 balance decreased by $30.7 million in 2019 due to changes in distributions, valuation adjustments, and a transfer to Level 2 due to a change in observable inputs.
The following tables summarize the changes in the fair value of the liabilities related to annuity and other split interest agreements and funds held on behalf of others for the years ended June 30, 2020 and 2019 (in thousands):
Beginning Balance as of June 30, 2019
Changes in Remainder
Value
Realized and Unrealized
Gains/(Losses)Ending Balance
as of June 30, 2020
Annuity and other split interest obligations . . . . . . . . . . $ 15,076 $(1,296) $1,903 $15,683
Beginning Balance as of June 30, 2018
Changes in Remainder
Value
Realized and Unrealized
Gains/(Losses)Ending Balance
as of June 30, 2019
Annuity and other split interest obligations . . . . . . . . . . $ 14,803 $(25) $298 $15,076
64
I. Pension Plans and Postretirement Benefits and Payments
The following section describes the Museum’s various pension and postretirement plans, with supporting data in the schedules below.
Defined benefit pension plan for union staff - The Museum has a qualified defined benefit pension plan for all union employees covered by a collective bargaining agreement. Benefits under this plan are based on employees’ years of service and final four years of compensation. Employees contribute 3% of their base earnings to this plan, which amounted to $1.0 million for both fiscal years 2020 and 2019.
Defined contribution plan for nonunion staff (Basic Plan) - The Museum has a mandatory defined contribution pension plan for all nonunion employees other than temporary employees. Under this plan, participants are required to contribute 3% of their annual compensation as a condition of employ-ment and the Museum contributes 8% of a participant’s base pay during the year. The Museum also contributes 5.7% of base pay earnings that exceed the Social Security wage base during a calendar year. The cost of the defined contribution plan recognized in fiscal years 2020 and 2019 was $8.8 mil-lion and $8.6 million, respectively.
Defined contribution matching plan for nonunion staff (Matching Plan) - The Museum has a voluntary defined contribution matching pension plan for all nonunion employees other than temporary employees. Under this plan, nonunion employees may voluntarily defer a portion of their annual compensa-tion on a pre-tax basis. Effective January 1, 2018, the Museum began matching contributions in an amount not to exceed 3% of compensation for eligible employees. There is no minimum contribution under this plan. The cost of the defined contribution matching plan recognized in fiscal years 2020 and 2019 was $3.0 million and $2.9 million, respectively.
Defined contribution plan for union staff (Union Matching Plan) - The Museum has a voluntary defined contribution plan for all union employees covered by a collective bargaining agreement. The Museum contributes up to 3% of the participant’s salary based on a schedule. The cost of this plan in fiscal years 2020 and 2019 was $0.4 million and $0.3 million, respectively.
Postretirement benefits - The Museum provides postretirement medical care benefit coverage to retired employees as outlined below.
• Nonunion staff: Substantially all of the Museum’s nonunion employees become eligible for certain benefits (prescription drugs and health insurance subject to annual limits) when they reach age 55 and have 15 years of service to the Museum. The Museum made contributions to the nonunion postretirement medical care benefit plan of $1.7 million and $1.6 million in fiscal years 2020 and 2019, respectively.
• Union staff: The Museum’s union employees are eligible to participate in a New York City–sponsored postretirement benefit plan (EIN 13-1624086) pursuant to a collective bargaining agreement between the Museum and Local 1503 of District Council 37 (member of AFSCME and AFL-CIO)through June 30, 2020. The benefits provided to these employees include medical and surgical coverage as well as certain supplemental benefits (dental, prescription drug, vision, and health insurance). The postretirement benefit obligation related to supplemental benefits is part of a multi-employer plan and, as such, the Museum is not required to record a liability for these benefits. The postretirement benefit obligation for medical and surgical coverage is not considered a part of a multiemployer plan and is, therefore, included as an obligation of the Museum. The Museum’s union employees become eligible for postretirement benefits when they reach age 52 and have 10 years of service or age 62 with 5 years of service to the Museum. The Museum made contributions to the postretirement medical care benefit plan of $3.1 million and $2.6 million in fiscal years 2020 and 2019, respectively, which represent more than 5% of the plan expenses. The plan is not subject to a funding improvement plan.
• Pay for unused sick leave benefit: The Museum reimburses eligible employees for a portion of unused sick days if they meet certain age and service requirements at termination. The Museum made payments in fiscal years 2020 and 2019 of $0.3 million and $0.5 million, respectively.
Funding policy - The Museum’s funding policy is to contribute annually an amount that meets or exceeds the minimum requirements of the Employee Retirement Income Security Act of 1974 (ERISA), using assumptions different from those used for financial reporting.
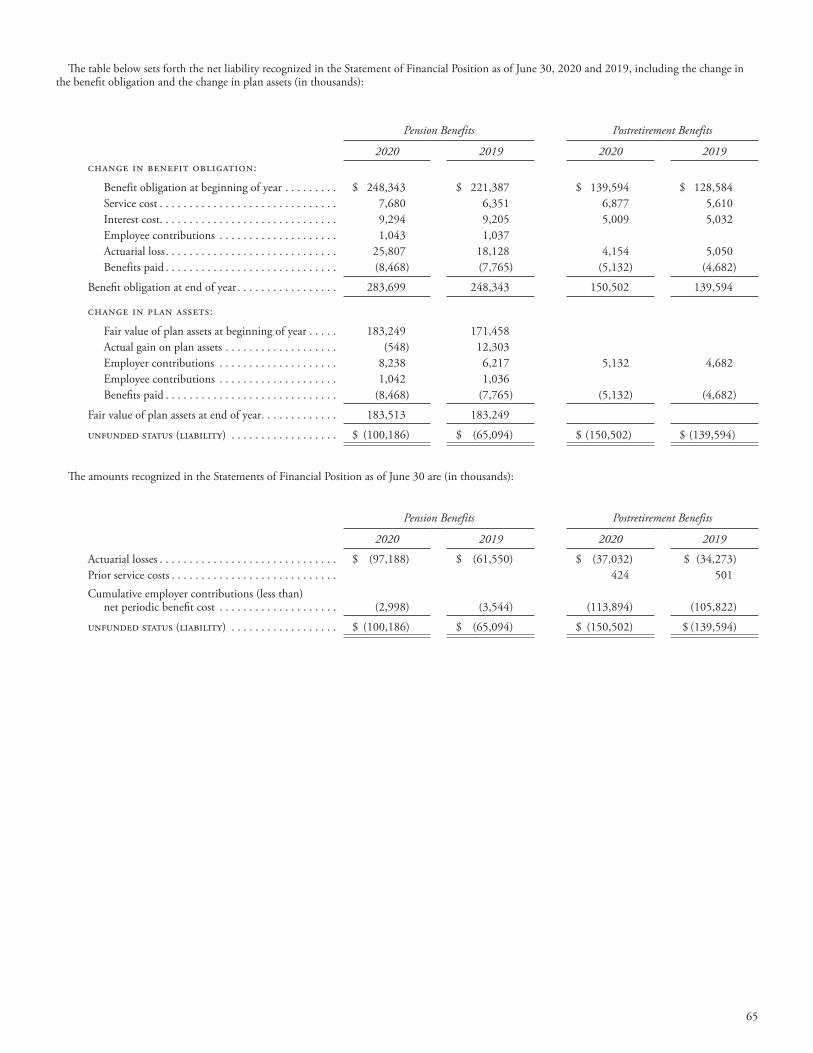
65
The table below sets forth the net liability recognized in the Statement of Financial Position as of June 30, 2020 and 2019, including the change in the benefit obligation and the change in plan assets (in thousands):
Pension Benefits Postretirement Benefits
2020 2019 2020 2019change in benefit obligation:
Benefit obligation at beginning of year . . . . . . . . . $ 248,343 $ 221,387 $ 139,594 $ 128,584 Service cost . . . . . . . . . . . . . . . . . . . . . . . . . . . . . . 7,680 6,351 6,877 5,610 Interest cost. . . . . . . . . . . . . . . . . . . . . . . . . . . . . . 9,294 9,205 5,009 5,032 Employee contributions . . . . . . . . . . . . . . . . . . . . 1,043 1,037 Actuarial loss . . . . . . . . . . . . . . . . . . . . . . . . . . . . . 25,807 18,128 4,154 5,050 Benefits paid . . . . . . . . . . . . . . . . . . . . . . . . . . . . . (8,468) (7,765) (5,132) (4,682)
Benefit obligation at end of year . . . . . . . . . . . . . . . . . 283,699 248,343 150,502 139,594
change in plan assets:
Fair value of plan assets at beginning of year . . . . . 183,249 171,458 Actual gain on plan assets . . . . . . . . . . . . . . . . . . . (548) 12,303 Employer contributions . . . . . . . . . . . . . . . . . . . . 8,238 6,217 5,132 4,682 Employee contributions . . . . . . . . . . . . . . . . . . . . 1,042 1,036 Benefits paid . . . . . . . . . . . . . . . . . . . . . . . . . . . . . (8,468) (7,765) (5,132) (4,682)
Fair value of plan assets at end of year . . . . . . . . . . . . . 183,513 183,249
unfunded status (liability) . . . . . . . . . . . . . . . . . . $ (100,186) $ (65,094) $ (150,502) $ (139,594)
The amounts recognized in the Statements of Financial Position as of June 30 are (in thousands):
Pension Benefits Postretirement Benefits
2020 2019 2020 2019
Actuarial losses . . . . . . . . . . . . . . . . . . . . . . . . . . . . . . $ (97,188) $ (61,550) $ (37,032) $ (34,273)Prior service costs . . . . . . . . . . . . . . . . . . . . . . . . . . . . 424 501Cumulative employer contributions (less than) net periodic benefit cost . . . . . . . . . . . . . . . . . . . . (2,998) (3,544) (113,894) (105,822)
unfunded status (liability) . . . . . . . . . . . . . . . . . . $ (100,186) $ (65,094) $ (150,502) $ (139,594)
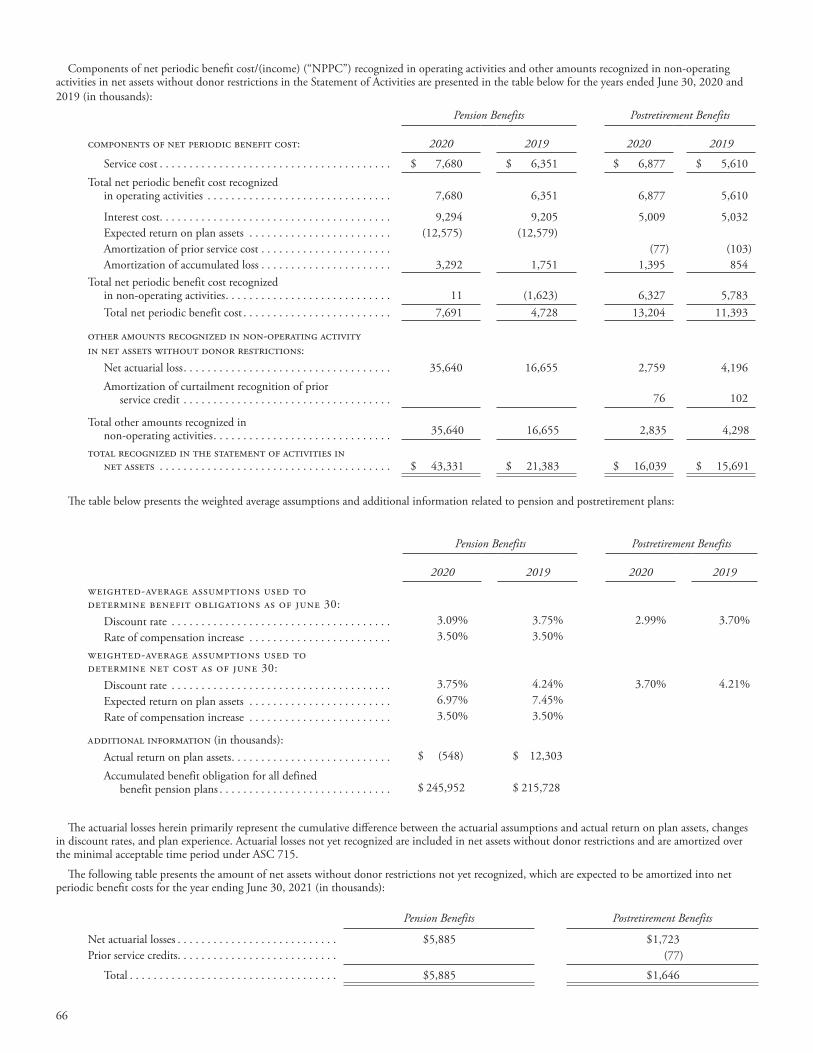
66
Components of net periodic benefit cost/(income) (“NPPC”) recognized in operating activities and other amounts recognized in non-operating activities in net assets without donor restrictions in the Statement of Activities are presented in the table below for the years ended June 30, 2020 and 2019 (in thousands):
Pension Benefits Postretirement Benefits
components of net periodic benefit cost: 2020 2019 2020 2019
Service cost . . . . . . . . . . . . . . . . . . . . . . . . . . . . . . . . . . . . . . . $ 7,680 $ 6,351 $ 6,877 $ 5,610Total net periodic benefit cost recognized in operating activities . . . . . . . . . . . . . . . . . . . . . . . . . . . . . . . 7,680 6,351 6,877 5,610
Interest cost. . . . . . . . . . . . . . . . . . . . . . . . . . . . . . . . . . . . . . . 9,294 9,205 5,009 5,032 Expected return on plan assets . . . . . . . . . . . . . . . . . . . . . . . . (12,575) (12,579) Amortization of prior service cost . . . . . . . . . . . . . . . . . . . . . . (77) (103) Amortization of accumulated loss . . . . . . . . . . . . . . . . . . . . . . 3,292 1,751 1,395 854Total net periodic benefit cost recognized in non-operating activities . . . . . . . . . . . . . . . . . . . . . . . . . . . . 11 (1,623) 6,327 5,783 Total net periodic benefit cost . . . . . . . . . . . . . . . . . . . . . . . . . 7,691 4,728 13,204 11,393
other amounts recognized in non-operating activity in net assets without donor restrictions: Net actuarial loss . . . . . . . . . . . . . . . . . . . . . . . . . . . . . . . . . . . 35,640 16,655 2,759 4,196 Amortization of curtailment recognition of prior service credit . . . . . . . . . . . . . . . . . . . . . . . . . . . . . . . . . . . 76 102
Total other amounts recognized in non-operating activities . . . . . . . . . . . . . . . . . . . . . . . . . . . . . . 35,640 16,655 2,835 4,298
total recognized in the statement of activities in net assets . . . . . . . . . . . . . . . . . . . . . . . . . . . . . . . . . . . . . . . $ 43,331 $ 21,383 $ 16,039 $ 15,691
The table below presents the weighted average assumptions and additional information related to pension and postretirement plans:
Pension Benefits Postretirement Benefits
2020 2019 2020 2019Weighted-average assumptions used to determine benefit obligations as of June 30: Discount rate . . . . . . . . . . . . . . . . . . . . . . . . . . . . . . . . . . . . . 3.09% 3.75% 2.99% 3.70% Rate of compensation increase . . . . . . . . . . . . . . . . . . . . . . . . 3.50% 3.50% Weighted-average assumptions used to determine net cost as of June 30: Discount rate . . . . . . . . . . . . . . . . . . . . . . . . . . . . . . . . . . . . . 3.75% 4.24% 3.70% 4.21% Expected return on plan assets . . . . . . . . . . . . . . . . . . . . . . . . 6.97% 7.45% Rate of compensation increase . . . . . . . . . . . . . . . . . . . . . . . . 3.50% 3.50%
additional information (in thousands): Actual return on plan assets . . . . . . . . . . . . . . . . . . . . . . . . . . . $ (548) $ 12,303
Accumulated benefit obligation for all defined benefit pension plans . . . . . . . . . . . . . . . . . . . . . . . . . . . . . $ 245,952 $ 215,728
The actuarial losses herein primarily represent the cumulative difference between the actuarial assumptions and actual return on plan assets, changes in discount rates, and plan experience. Actuarial losses not yet recognized are included in net assets without donor restrictions and are amortized over the minimal acceptable time period under ASC 715.
The following table presents the amount of net assets without donor restrictions not yet recognized, which are expected to be amortized into net periodic benefit costs for the year ending June 30, 2021 (in thousands):
Pension Benefits Postretirement Benefits
Net actuarial losses . . . . . . . . . . . . . . . . . . . . . . . . . . . $5,885 $ 1,723Prior service credits . . . . . . . . . . . . . . . . . . . . . . . . . . . (77)
Total . . . . . . . . . . . . . . . . . . . . . . . . . . . . . . . . . . . $5,885 $ 1,646
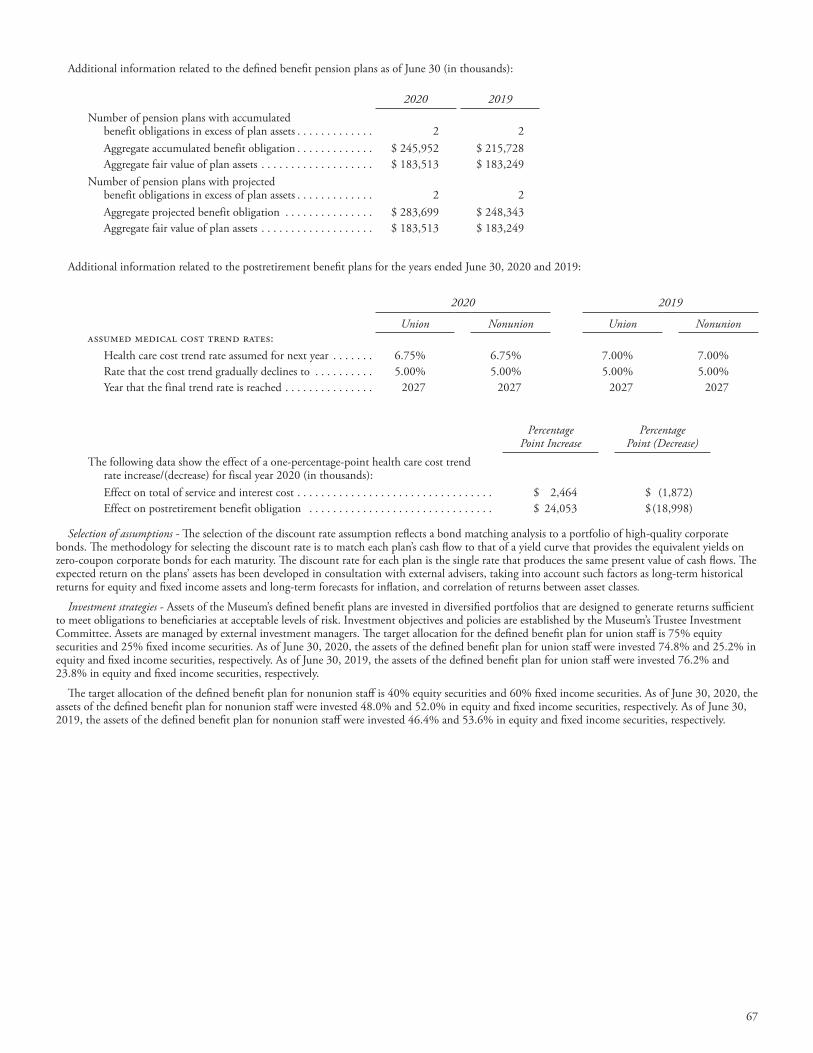
67
Additional information related to the defined benefit pension plans as of June 30 (in thousands):
2020 2019Number of pension plans with accumulated benefit obligations in excess of plan assets . . . . . . . . . . . . . 2 2 Aggregate accumulated benefit obligation . . . . . . . . . . . . . $ 245,952 $ 215,728 Aggregate fair value of plan assets . . . . . . . . . . . . . . . . . . . $ 183,513 $ 183,249Number of pension plans with projected benefit obligations in excess of plan assets . . . . . . . . . . . . . 2 2 Aggregate projected benefit obligation . . . . . . . . . . . . . . . $ 283,699 $ 248,343 Aggregate fair value of plan assets . . . . . . . . . . . . . . . . . . . $ 183,513 $ 183,249
Additional information related to the postretirement benefit plans for the years ended June 30, 2020 and 2019:
2020 2019
Union Nonunion Union Nonunionassumed medical cost trend rates: Health care cost trend rate assumed for next year . . . . . . . 6.75% 6.75% 7.00% 7.00% Rate that the cost trend gradually declines to . . . . . . . . . . 5.00% 5.00% 5.00% 5.00% Year that the final trend rate is reached . . . . . . . . . . . . . . . 2027 2027 2027 2027
Percentage Point Increase
Percentage Point (Decrease)
The following data show the effect of a one-percentage-point health care cost trend rate increase/(decrease) for fiscal year 2020 (in thousands): Effect on total of service and interest cost . . . . . . . . . . . . . . . . . . . . . . . . . . . . . . . . . $ 2,464 $ (1,872) Effect on postretirement benefit obligation . . . . . . . . . . . . . . . . . . . . . . . . . . . . . . . $ 24,053 $ (18,998)
Selection of assumptions - The selection of the discount rate assumption reflects a bond matching analysis to a portfolio of high-quality corporate bonds. The methodology for selecting the discount rate is to match each plan’s cash flow to that of a yield curve that provides the equivalent yields on zero-coupon corporate bonds for each maturity. The discount rate for each plan is the single rate that produces the same present value of cash flows. The expected return on the plans’ assets has been developed in consultation with external advisers, taking into account such factors as long-term historical returns for equity and fixed income assets and long-term forecasts for inflation, and correlation of returns between asset classes.
Investment strategies - Assets of the Museum’s defined benefit plans are invested in diversified portfolios that are designed to generate returns sufficient to meet obligations to beneficiaries at acceptable levels of risk. Investment objectives and policies are established by the Museum’s Trustee Investment Committee. Assets are managed by external investment managers. The target allocation for the defined benefit plan for union staff is 75% equity securities and 25% fixed income securities. As of June 30, 2020, the assets of the defined benefit plan for union staff were invested 74.8% and 25.2% in equity and fixed income securities, respectively. As of June 30, 2019, the assets of the defined benefit plan for union staff were invested 76.2% and 23.8% in equity and fixed income securities, respectively.
The target allocation of the defined benefit plan for nonunion staff is 40% equity securities and 60% fixed income securities. As of June 30, 2020, the assets of the defined benefit plan for nonunion staff were invested 48.0% and 52.0% in equity and fixed income securities, respectively. As of June 30, 2019, the assets of the defined benefit plan for nonunion staff were invested 46.4% and 53.6% in equity and fixed income securities, respectively.
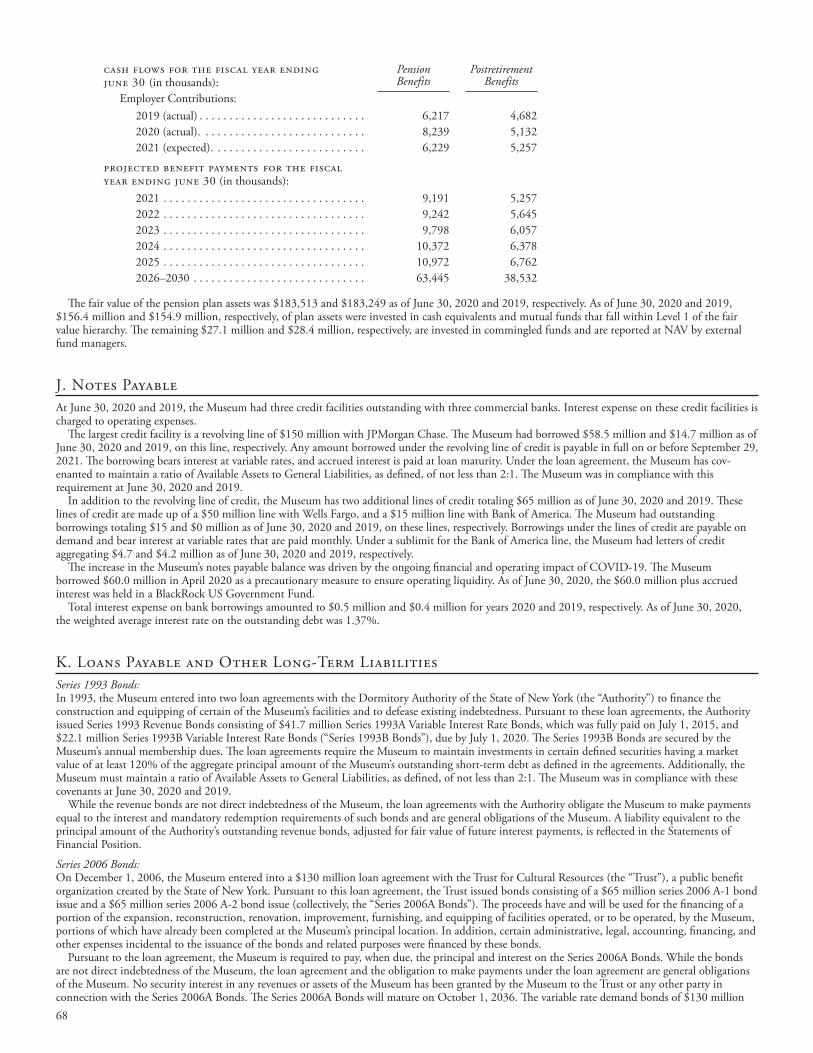
68
Cash flows for the fiscal year ending June 30 (in thousands):
Pension Benefits
Postretirement Benefits
Employer Contributions: 2019 (actual) . . . . . . . . . . . . . . . . . . . . . . . . . . . . 6,217 4,682 2020 (actual). . . . . . . . . . . . . . . . . . . . . . . . . . . . 8,239 5,132 2021 (expected). . . . . . . . . . . . . . . . . . . . . . . . . . 6,229 5,257
Projected benefit payments for the fiscal year ending June 30 (in thousands): 2021 . . . . . . . . . . . . . . . . . . . . . . . . . . . . . . . . . . 9,191 5,257 2022 . . . . . . . . . . . . . . . . . . . . . . . . . . . . . . . . . . 9,242 5,645 2023 . . . . . . . . . . . . . . . . . . . . . . . . . . . . . . . . . . 9,798 6,057 2024 . . . . . . . . . . . . . . . . . . . . . . . . . . . . . . . . . . 10,372 6,378 2025 . . . . . . . . . . . . . . . . . . . . . . . . . . . . . . . . . . 10,972 6,762 2026–2030 . . . . . . . . . . . . . . . . . . . . . . . . . . . . . 63,445 38,532
The fair value of the pension plan assets was $183,513 and $183,249 as of June 30, 2020 and 2019, respectively. As of June 30, 2020 and 2019, $156.4 million and $154.9 million, respectively, of plan assets were invested in cash equivalents and mutual funds that fall within Level 1 of the fair value hierarchy. The remaining $27.1 million and $28.4 million, respectively, are invested in commingled funds and are reported at NAV by external fund managers.
J. Notes Payable At June 30, 2020 and 2019, the Museum had three credit facilities outstanding with three commercial banks. Interest expense on these credit facilities is charged to operating expenses.
The largest credit facility is a revolving line of $150 million with JPMorgan Chase. The Museum had borrowed $58.5 million and $14.7 million as of June 30, 2020 and 2019, on this line, respectively. Any amount borrowed under the revolving line of credit is payable in full on or before September 29, 2021. The borrowing bears interest at variable rates, and accrued interest is paid at loan maturity. Under the loan agreement, the Museum has cov-enanted to maintain a ratio of Available Assets to General Liabilities, as defined, of not less than 2:1. The Museum was in compliance with this requirement at June 30, 2020 and 2019.
In addition to the revolving line of credit, the Museum has two additional lines of credit totaling $65 million as of June 30, 2020 and 2019. These lines of credit are made up of a $50 million line with Wells Fargo, and a $15 million line with Bank of America. The Museum had outstanding borrowings totaling $15 and $0 million as of June 30, 2020 and 2019, on these lines, respectively. Borrowings under the lines of credit are payable on demand and bear interest at variable rates that are paid monthly. Under a sublimit for the Bank of America line, the Museum had letters of credit aggregating $4.7 and $4.2 million as of June 30, 2020 and 2019, respectively.
The increase in the Museum’s notes payable balance was driven by the ongoing financial and operating impact of COVID-19. The Museum borrowed $60.0 million in April 2020 as a precautionary measure to ensure operating liquidity. As of June 30, 2020, the $60.0 million plus accrued interest was held in a BlackRock US Government Fund.
Total interest expense on bank borrowings amounted to $0.5 million and $0.4 million for years 2020 and 2019, respectively. As of June 30, 2020, the weighted average interest rate on the outstanding debt was 1.37%.
K. Loans Payable and Other Long-Term LiabilitiesSeries 1993 Bonds:In 1993, the Museum entered into two loan agreements with the Dormitory Authority of the State of New York (the “Authority”) to finance the construction and equipping of certain of the Museum’s facilities and to defease existing indebtedness. Pursuant to these loan agreements, the Authority issued Series 1993 Revenue Bonds consisting of $41.7 million Series 1993A Variable Interest Rate Bonds, which was fully paid on July 1, 2015, and $22.1 million Series 1993B Variable Interest Rate Bonds (“Series 1993B Bonds”), due by July 1, 2020. The Series 1993B Bonds are secured by the Museum’s annual membership dues. The loan agreements require the Museum to maintain investments in certain defined securities having a market value of at least 120% of the aggregate principal amount of the Museum’s outstanding short-term debt as defined in the agreements. Additionally, the Museum must maintain a ratio of Available Assets to General Liabilities, as defined, of not less than 2:1. The Museum was in compliance with these covenants at June 30, 2020 and 2019.
While the revenue bonds are not direct indebtedness of the Museum, the loan agreements with the Authority obligate the Museum to make payments equal to the interest and mandatory redemption requirements of such bonds and are general obligations of the Museum. A liability equivalent to the principal amount of the Authority’s outstanding revenue bonds, adjusted for fair value of future interest payments, is reflected in the Statements of Financial Position.
Series 2006 Bonds: On December 1, 2006, the Museum entered into a $130 million loan agreement with the Trust for Cultural Resources (the “Trust”), a public benefit organization created by the State of New York. Pursuant to this loan agreement, the Trust issued bonds consisting of a $65 million series 2006 A-1 bond issue and a $65 million series 2006 A-2 bond issue (collectively, the “Series 2006A Bonds”). The proceeds have and will be used for the financing of a portion of the expansion, reconstruction, renovation, improvement, furnishing, and equipping of facilities operated, or to be operated, by the Museum, portions of which have already been completed at the Museum’s principal location. In addition, certain administrative, legal, accounting, financing, and other expenses incidental to the issuance of the bonds and related purposes were financed by these bonds.
Pursuant to the loan agreement, the Museum is required to pay, when due, the principal and interest on the Series 2006A Bonds. While the bonds are not direct indebtedness of the Museum, the loan agreement and the obligation to make payments under the loan agreement are general obligations of the Museum. No security interest in any revenues or assets of the Museum has been granted by the Museum to the Trust or any other party in connection with the Series 2006A Bonds. The Series 2006A Bonds will mature on October 1, 2036. The variable rate demand bonds of $130 million
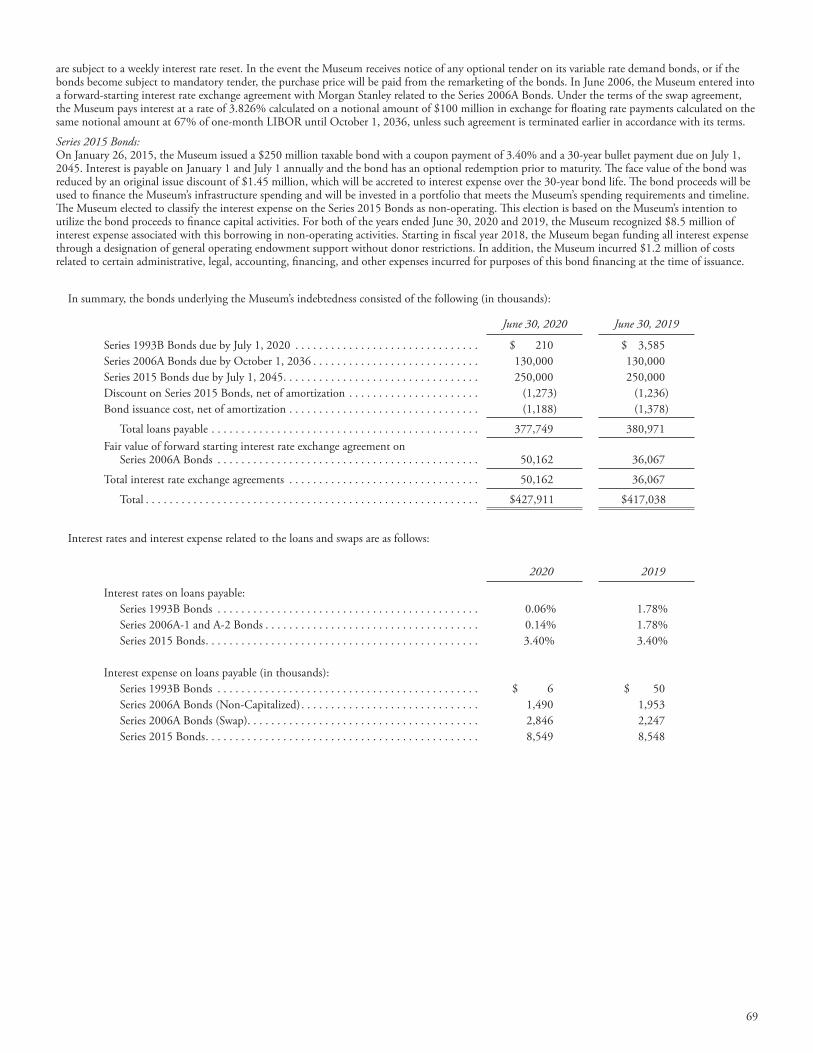
69
are subject to a weekly interest rate reset. In the event the Museum receives notice of any optional tender on its variable rate demand bonds, or if the bonds become subject to mandatory tender, the purchase price will be paid from the remarketing of the bonds. In June 2006, the Museum entered into a forward-starting interest rate exchange agreement with Morgan Stanley related to the Series 2006A Bonds. Under the terms of the swap agreement, the Museum pays interest at a rate of 3.826% calculated on a notional amount of $100 million in exchange for floating rate payments calculated on the same notional amount at 67% of one-month LIBOR until October 1, 2036, unless such agreement is terminated earlier in accordance with its terms.
Series 2015 Bonds: On January 26, 2015, the Museum issued a $250 million taxable bond with a coupon payment of 3.40% and a 30-year bullet payment due on July 1, 2045. Interest is payable on January 1 and July 1 annually and the bond has an optional redemption prior to maturity. The face value of the bond was reduced by an original issue discount of $1.45 million, which will be accreted to interest expense over the 30-year bond life. The bond proceeds will be used to finance the Museum’s infrastructure spending and will be invested in a portfolio that meets the Museum’s spending requirements and timeline. The Museum elected to classify the interest expense on the Series 2015 Bonds as non-operating. This election is based on the Museum’s intention to utilize the bond proceeds to finance capital activities. For both of the years ended June 30, 2020 and 2019, the Museum recognized $8.5 million of interest expense associated with this borrowing in non-operating activities. Starting in fiscal year 2018, the Museum began funding all interest expense through a designation of general operating endowment support without donor restrictions. In addition, the Museum incurred $1.2 million of costs related to certain administrative, legal, accounting, financing, and other expenses incurred for purposes of this bond financing at the time of issuance.
In summary, the bonds underlying the Museum’s indebtedness consisted of the following (in thousands):
June 30, 2020 June 30, 2019
Series 1993B Bonds due by July 1, 2020 . . . . . . . . . . . . . . . . . . . . . . . . . . . . . . . $ 210 $ 3,585Series 2006A Bonds due by October 1, 2036 . . . . . . . . . . . . . . . . . . . . . . . . . . . . 130,000 130,000Series 2015 Bonds due by July 1, 2045 . . . . . . . . . . . . . . . . . . . . . . . . . . . . . . . . . 250,000 250,000Discount on Series 2015 Bonds, net of amortization . . . . . . . . . . . . . . . . . . . . . . (1,273) (1,236)Bond issuance cost, net of amortization . . . . . . . . . . . . . . . . . . . . . . . . . . . . . . . . (1,188) (1,378)
Total loans payable . . . . . . . . . . . . . . . . . . . . . . . . . . . . . . . . . . . . . . . . . . . . . 377,749 380,971Fair value of forward starting interest rate exchange agreement on Series 2006A Bonds . . . . . . . . . . . . . . . . . . . . . . . . . . . . . . . . . . . . . . . . . . . . 50,162 36,067
Total interest rate exchange agreements . . . . . . . . . . . . . . . . . . . . . . . . . . . . . . . . 50,162 36,067
Total . . . . . . . . . . . . . . . . . . . . . . . . . . . . . . . . . . . . . . . . . . . . . . . . . . . . . . . . $427,911 $417,038
Interest rates and interest expense related to the loans and swaps are as follows:
2020 2019
Interest rates on loans payable: Series 1993B Bonds . . . . . . . . . . . . . . . . . . . . . . . . . . . . . . . . . . . . . . . . . . . . 0.06% 1.78% Series 2006A-1 and A-2 Bonds . . . . . . . . . . . . . . . . . . . . . . . . . . . . . . . . . . . . 0.14% 1.78% Series 2015 Bonds . . . . . . . . . . . . . . . . . . . . . . . . . . . . . . . . . . . . . . . . . . . . . . 3.40% 3.40%
Interest expense on loans payable (in thousands): Series 1993B Bonds . . . . . . . . . . . . . . . . . . . . . . . . . . . . . . . . . . . . . . . . . . . . $ 6 $ 50 Series 2006A Bonds (Non-Capitalized) . . . . . . . . . . . . . . . . . . . . . . . . . . . . . . 1,490 1,953 Series 2006A Bonds (Swap). . . . . . . . . . . . . . . . . . . . . . . . . . . . . . . . . . . . . . . 2,846 2,247 Series 2015 Bonds . . . . . . . . . . . . . . . . . . . . . . . . . . . . . . . . . . . . . . . . . . . . . . 8,549 8,548
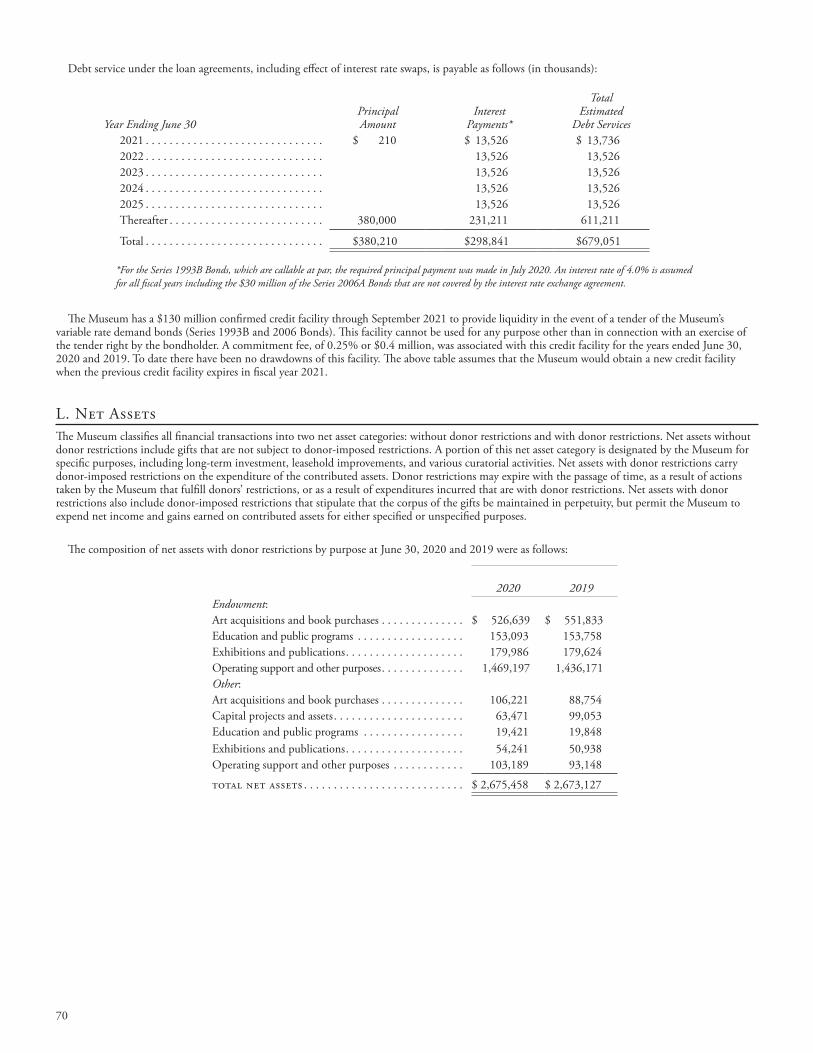
70
Debt service under the loan agreements, including effect of interest rate swaps, is payable as follows (in thousands):
Year Ending June 30Principal Amount
Interest Payments*
Total Estimated
Debt Services 2021 . . . . . . . . . . . . . . . . . . . . . . . . . . . . . . $ 210 $ 13,526 $ 13,736 2022 . . . . . . . . . . . . . . . . . . . . . . . . . . . . . . 13,526 13,526 2023 . . . . . . . . . . . . . . . . . . . . . . . . . . . . . . 13,526 13,526 2024 . . . . . . . . . . . . . . . . . . . . . . . . . . . . . . 13,526 13,526 2025 . . . . . . . . . . . . . . . . . . . . . . . . . . . . . . 13,526 13,526 Thereafter . . . . . . . . . . . . . . . . . . . . . . . . . . 380,000 231,211 611,211
Total . . . . . . . . . . . . . . . . . . . . . . . . . . . . . . $ 380,210 $ 298,841 $ 679,051
*For the Series 1993B Bonds, which are callable at par, the required principal payment was made in July 2020. An interest rate of 4.0% is assumed for all fiscal years including the $30 million of the Series 2006A Bonds that are not covered by the interest rate exchange agreement.
The Museum has a $130 million confirmed credit facility through September 2021 to provide liquidity in the event of a tender of the Museum’s variable rate demand bonds (Series 1993B and 2006 Bonds). This facility cannot be used for any purpose other than in connection with an exercise of the tender right by the bondholder. A commitment fee, of 0.25% or $0.4 million, was associated with this credit facility for the years ended June 30, 2020 and 2019. To date there have been no drawdowns of this facility. The above table assumes that the Museum would obtain a new credit facility when the previous credit facility expires in fiscal year 2021.
L. Net AssetsThe Museum classifies all financial transactions into two net asset categories: without donor restrictions and with donor restrictions. Net assets without donor restrictions include gifts that are not subject to donor-imposed restrictions. A portion of this net asset category is designated by the Museum for specific purposes, including long-term investment, leasehold improvements, and various curatorial activities. Net assets with donor restrictions carry donor-imposed restrictions on the expenditure of the contributed assets. Donor restrictions may expire with the passage of time, as a result of actions taken by the Museum that fulfill donors’ restrictions, or as a result of expenditures incurred that are with donor restrictions. Net assets with donor restrictions also include donor-imposed restrictions that stipulate that the corpus of the gifts be maintained in perpetuity, but permit the Museum to expend net income and gains earned on contributed assets for either specified or unspecified purposes.
The composition of net assets with donor restrictions by purpose at June 30, 2020 and 2019 were as follows:
2020 2019 Endowment: Art acquisitions and book purchases . . . . . . . . . . . . . . $ 526,639 $ 551,833 Education and public programs . . . . . . . . . . . . . . . . . . 153,093 153,758 Exhibitions and publications . . . . . . . . . . . . . . . . . . . . 179,986 179,624 Operating support and other purposes . . . . . . . . . . . . . . 1,469,197 1,436,171 Other: Art acquisitions and book purchases . . . . . . . . . . . . . . 106,221 88,754 Capital projects and assets . . . . . . . . . . . . . . . . . . . . . . 63,471 99,053 Education and public programs . . . . . . . . . . . . . . . . . 19,421 19,848 Exhibitions and publications . . . . . . . . . . . . . . . . . . . . 54,241 50,938 Operating support and other purposes . . . . . . . . . . . . 103,189 93,148
total net assets . . . . . . . . . . . . . . . . . . . . . . . . . . . $ 2,675,458 $ 2,673,127
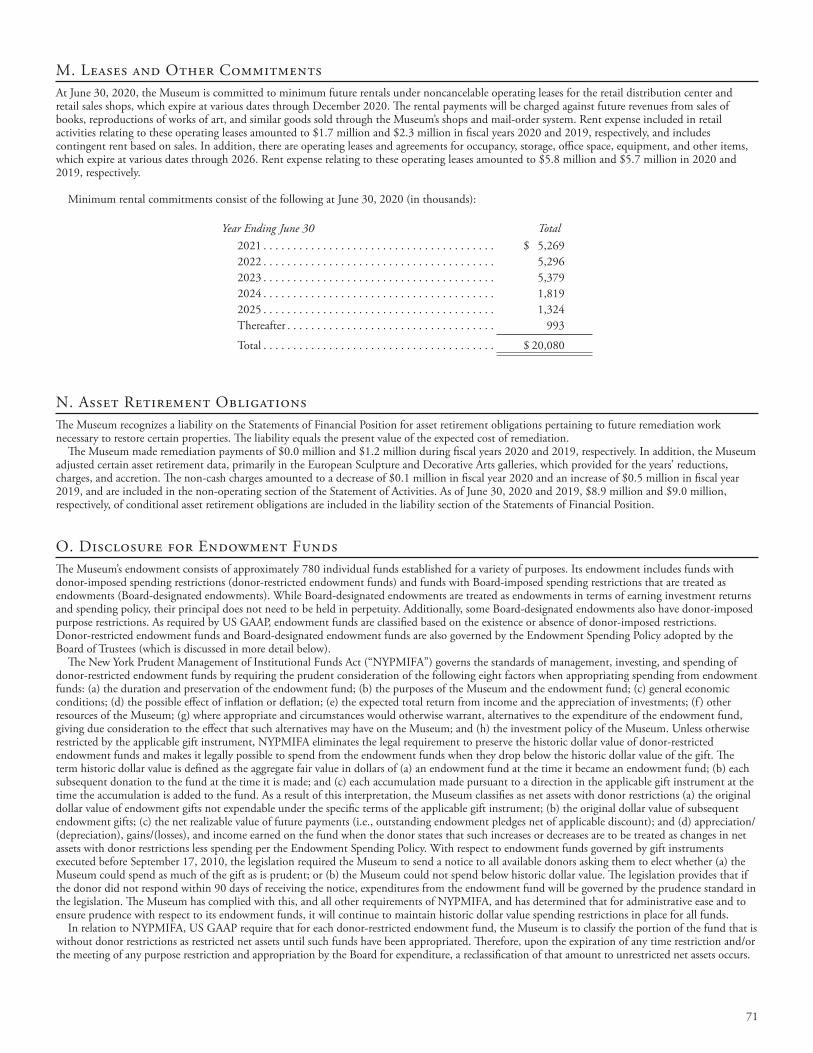
71
M. Leases and Other CommitmentsAt June 30, 2020, the Museum is committed to minimum future rentals under noncancelable operating leases for the retail distribution center and retail sales shops, which expire at various dates through December 2020. The rental payments will be charged against future revenues from sales of books, reproductions of works of art, and similar goods sold through the Museum’s shops and mail-order system. Rent expense included in retail activities relating to these operating leases amounted to $1.7 million and $2.3 million in fiscal years 2020 and 2019, respectively, and includes contingent rent based on sales. In addition, there are operating leases and agreements for occupancy, storage, office space, equipment, and other items, which expire at various dates through 2026. Rent expense relating to these operating leases amounted to $5.8 million and $5.7 million in 2020 and 2019, respectively.
Minimum rental commitments consist of the following at June 30, 2020 (in thousands):
Year Ending June 30 Total 2021 . . . . . . . . . . . . . . . . . . . . . . . . . . . . . . . . . . . . . . . $ 5,269 2022 . . . . . . . . . . . . . . . . . . . . . . . . . . . . . . . . . . . . . . . 5,296 2023 . . . . . . . . . . . . . . . . . . . . . . . . . . . . . . . . . . . . . . . 5,379 2024 . . . . . . . . . . . . . . . . . . . . . . . . . . . . . . . . . . . . . . . 1,819 2025 . . . . . . . . . . . . . . . . . . . . . . . . . . . . . . . . . . . . . . . 1,324 Thereafter . . . . . . . . . . . . . . . . . . . . . . . . . . . . . . . . . . . 993
Total . . . . . . . . . . . . . . . . . . . . . . . . . . . . . . . . . . . . . . . $ 20,080
N. Asset Retirement ObligationsThe Museum recognizes a liability on the Statements of Financial Position for asset retirement obligations pertaining to future remediation work necessary to restore certain properties. The liability equals the present value of the expected cost of remediation.
The Museum made remediation payments of $0.0 million and $1.2 million during fiscal years 2020 and 2019, respectively. In addition, the Museum adjusted certain asset retirement data, primarily in the European Sculpture and Decorative Arts galleries, which provided for the years’ reductions, charges, and accretion. The non-cash charges amounted to a decrease of $0.1 million in fiscal year 2020 and an increase of $0.5 million in fiscal year 2019, and are included in the non-operating section of the Statement of Activities. As of June 30, 2020 and 2019, $8.9 million and $9.0 million, respectively, of conditional asset retirement obligations are included in the liability section of the Statements of Financial Position.
O. Disclosure for Endowment Funds The Museum’s endowment consists of approximately 780 individual funds established for a variety of purposes. Its endowment includes funds with donor-imposed spending restrictions (donor-restricted endowment funds) and funds with Board-imposed spending restrictions that are treated as endowments (Board-designated endowments). While Board-designated endowments are treated as endowments in terms of earning investment returns and spending policy, their principal does not need to be held in perpetuity. Additionally, some Board-designated endowments also have donor-imposed purpose restrictions. As required by US GAAP, endowment funds are classified based on the existence or absence of donor-imposed restrictions. Donor-restricted endowment funds and Board-designated endowment funds are also governed by the Endowment Spending Policy adopted by the Board of Trustees (which is discussed in more detail below).
The New York Prudent Management of Institutional Funds Act (“NYPMIFA”) governs the standards of management, investing, and spending of donor-restricted endowment funds by requiring the prudent consideration of the following eight factors when appropriating spending from endowment funds: (a) the duration and preservation of the endowment fund; (b) the purposes of the Museum and the endowment fund; (c) general economic conditions; (d) the possible effect of inflation or deflation; (e) the expected total return from income and the appreciation of investments; (f ) other resources of the Museum; (g) where appropriate and circumstances would otherwise warrant, alternatives to the expenditure of the endowment fund, giving due consideration to the effect that such alternatives may have on the Museum; and (h) the investment policy of the Museum. Unless otherwise restricted by the applicable gift instrument, NYPMIFA eliminates the legal requirement to preserve the historic dollar value of donor-restricted endowment funds and makes it legally possible to spend from the endowment funds when they drop below the historic dollar value of the gift. The term historic dollar value is defined as the aggregate fair value in dollars of (a) an endowment fund at the time it became an endowment fund; (b) each subsequent donation to the fund at the time it is made; and (c) each accumulation made pursuant to a direction in the applicable gift instrument at the time the accumulation is added to the fund. As a result of this interpretation, the Museum classifies as net assets with donor restrictions (a) the original dollar value of endowment gifts not expendable under the specific terms of the applicable gift instrument; (b) the original dollar value of subsequent endowment gifts; (c) the net realizable value of future payments (i.e., outstanding endowment pledges net of applicable discount); and (d) appreciation/(depreciation), gains/(losses), and income earned on the fund when the donor states that such increases or decreases are to be treated as changes in net assets with donor restrictions less spending per the Endowment Spending Policy. With respect to endowment funds governed by gift instruments executed before September 17, 2010, the legislation required the Museum to send a notice to all available donors asking them to elect whether (a) the Museum could spend as much of the gift as is prudent; or (b) the Museum could not spend below historic dollar value. The legislation provides that if the donor did not respond within 90 days of receiving the notice, expenditures from the endowment fund will be governed by the prudence standard in the legislation. The Museum has complied with this, and all other requirements of NYPMIFA, and has determined that for administrative ease and to ensure prudence with respect to its endowment funds, it will continue to maintain historic dollar value spending restrictions in place for all funds.
In relation to NYPMIFA, US GAAP require that for each donor-restricted endowment fund, the Museum is to classify the portion of the fund that is without donor restrictions as restricted net assets until such funds have been appropriated. Therefore, upon the expiration of any time restriction and/or the meeting of any purpose restriction and appropriation by the Board for expenditure, a reclassification of that amount to unrestricted net assets occurs.
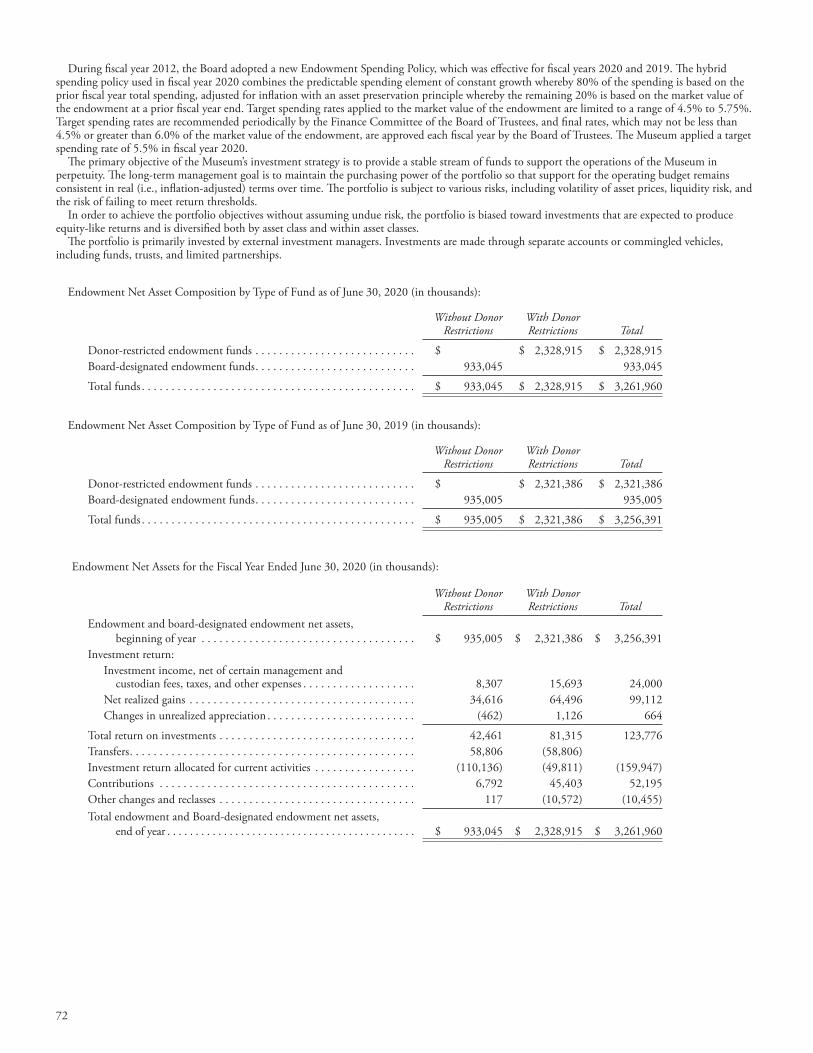
72
During fiscal year 2012, the Board adopted a new Endowment Spending Policy, which was effective for fiscal years 2020 and 2019. The hybrid spending policy used in fiscal year 2020 combines the predictable spending element of constant growth whereby 80% of the spending is based on the prior fiscal year total spending, adjusted for inflation with an asset preservation principle whereby the remaining 20% is based on the market value of the endowment at a prior fiscal year end. Target spending rates applied to the market value of the endowment are limited to a range of 4.5% to 5.75%. Target spending rates are recommended periodically by the Finance Committee of the Board of Trustees, and final rates, which may not be less than 4.5% or greater than 6.0% of the market value of the endowment, are approved each fiscal year by the Board of Trustees. The Museum applied a target spending rate of 5.5% in fiscal year 2020.
The primary objective of the Museum’s investment strategy is to provide a stable stream of funds to support the operations of the Museum in perpetuity. The long-term management goal is to maintain the purchasing power of the portfolio so that support for the operating budget remains consistent in real (i.e., inflation-adjusted) terms over time. The portfolio is subject to various risks, including volatility of asset prices, liquidity risk, and the risk of failing to meet return thresholds.
In order to achieve the portfolio objectives without assuming undue risk, the portfolio is biased toward investments that are expected to produce equity-like returns and is diversified both by asset class and within asset classes.
The portfolio is primarily invested by external investment managers. Investments are made through separate accounts or commingled vehicles, including funds, trusts, and limited partnerships.
Endowment Net Asset Composition by Type of Fund as of June 30, 2020 (in thousands):
Without Donor Restrictions
With Donor Restrictions Total
Donor-restricted endowment funds . . . . . . . . . . . . . . . . . . . . . . . . . . . $ $ 2,328,915 $ 2,328,915Board-designated endowment funds . . . . . . . . . . . . . . . . . . . . . . . . . . . 933,045 933,045
Total funds . . . . . . . . . . . . . . . . . . . . . . . . . . . . . . . . . . . . . . . . . . . . . . $ 933,045 $ 2,328,915 $ 3,261,960
Endowment Net Asset Composition by Type of Fund as of June 30, 2019 (in thousands):
Without Donor Restrictions
With Donor Restrictions Total
Donor-restricted endowment funds . . . . . . . . . . . . . . . . . . . . . . . . . . . $ $ 2,321,386 $ 2,321,386Board-designated endowment funds . . . . . . . . . . . . . . . . . . . . . . . . . . . 935,005 935,005
Total funds . . . . . . . . . . . . . . . . . . . . . . . . . . . . . . . . . . . . . . . . . . . . . . $ 935,005 $ 2,321,386 $ 3,256,391
Endowment Net Assets for the Fiscal Year Ended June 30, 2020 (in thousands):
Without Donor Restrictions
With Donor Restrictions Total
Endowment and board-designated endowment net assets, beginning of year . . . . . . . . . . . . . . . . . . . . . . . . . . . . . . . . . . . . $ 935,005 $ 2,321,386 $ 3,256,391Investment return: Investment income, net of certain management and custodian fees, taxes, and other expenses . . . . . . . . . . . . . . . . . . . 8,307 15,693 24,000 Net realized gains . . . . . . . . . . . . . . . . . . . . . . . . . . . . . . . . . . . . . . 34,616 64,496 99,112 Changes in unrealized appreciation . . . . . . . . . . . . . . . . . . . . . . . . . (462) 1,126 664
Total return on investments . . . . . . . . . . . . . . . . . . . . . . . . . . . . . . . . . 42,461 81,315 123,776Transfers . . . . . . . . . . . . . . . . . . . . . . . . . . . . . . . . . . . . . . . . . . . . . . . . 58,806 (58,806) Investment return allocated for current activities . . . . . . . . . . . . . . . . . (110,136) (49,811) (159,947)Contributions . . . . . . . . . . . . . . . . . . . . . . . . . . . . . . . . . . . . . . . . . . . 6,792 45,403 52,195Other changes and reclasses . . . . . . . . . . . . . . . . . . . . . . . . . . . . . . . . . 117 (10,572) (10,455)Total endowment and Board-designated endowment net assets, end of year . . . . . . . . . . . . . . . . . . . . . . . . . . . . . . . . . . . . . . . . . . . . $ 933,045 $ 2,328,915 $ 3,261,960
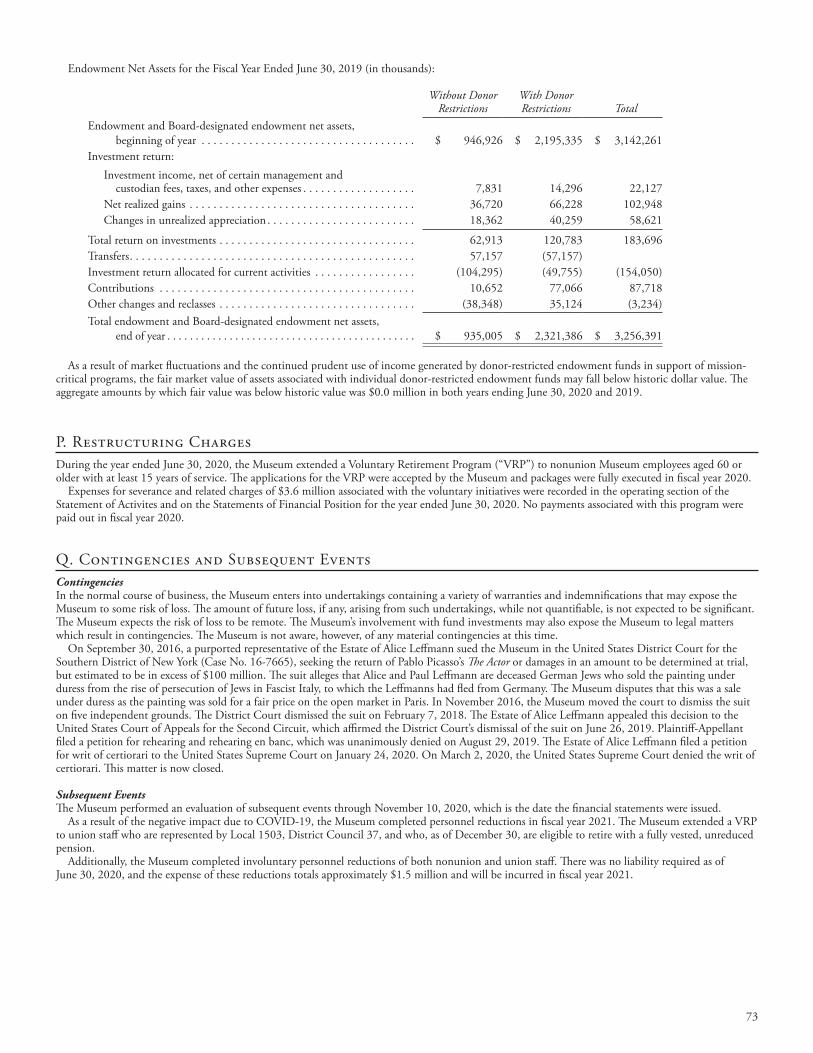
73
Endowment Net Assets for the Fiscal Year Ended June 30, 2019 (in thousands):
Without Donor Restrictions
With Donor Restrictions Total
Endowment and Board-designated endowment net assets, beginning of year . . . . . . . . . . . . . . . . . . . . . . . . . . . . . . . . . . . . $ 946,926 $ 2,195,335 $ 3,142,261Investment return: Investment income, net of certain management and custodian fees, taxes, and other expenses . . . . . . . . . . . . . . . . . . . 7,831 14,296 22,127 Net realized gains . . . . . . . . . . . . . . . . . . . . . . . . . . . . . . . . . . . . . . 36,720 66,228 102,948 Changes in unrealized appreciation . . . . . . . . . . . . . . . . . . . . . . . . . 18,362 40,259 58,621
Total return on investments . . . . . . . . . . . . . . . . . . . . . . . . . . . . . . . . . 62,913 120,783 183,696Transfers . . . . . . . . . . . . . . . . . . . . . . . . . . . . . . . . . . . . . . . . . . . . . . . . 57,157 (57,157) Investment return allocated for current activities . . . . . . . . . . . . . . . . . (104,295) (49,755) (154,050)Contributions . . . . . . . . . . . . . . . . . . . . . . . . . . . . . . . . . . . . . . . . . . . 10,652 77,066 87,718Other changes and reclasses . . . . . . . . . . . . . . . . . . . . . . . . . . . . . . . . . (38,348) 35,124 (3,234)Total endowment and Board-designated endowment net assets, end of year . . . . . . . . . . . . . . . . . . . . . . . . . . . . . . . . . . . . . . . . . . . . $ 935,005 $ 2,321,386 $ 3,256,391
As a result of market fluctuations and the continued prudent use of income generated by donor-restricted endowment funds in support of mission-critical programs, the fair market value of assets associated with individual donor-restricted endowment funds may fall below historic dollar value. The aggregate amounts by which fair value was below historic value was $0.0 million in both years ending June 30, 2020 and 2019.
P. Restructuring ChargesDuring the year ended June 30, 2020, the Museum extended a Voluntary Retirement Program (“VRP”) to nonunion Museum employees aged 60 or older with at least 15 years of service. The applications for the VRP were accepted by the Museum and packages were fully executed in fiscal year 2020.
Expenses for severance and related charges of $3.6 million associated with the voluntary initiatives were recorded in the operating section of the Statement of Activites and on the Statements of Financial Position for the year ended June 30, 2020. No payments associated with this program were paid out in fiscal year 2020.
Q. Contingencies and Subsequent EventsContingenciesIn the normal course of business, the Museum enters into undertakings containing a variety of warranties and indemnifications that may expose the Museum to some risk of loss. The amount of future loss, if any, arising from such undertakings, while not quantifiable, is not expected to be significant. The Museum expects the risk of loss to be remote. The Museum’s involvement with fund investments may also expose the Museum to legal matters which result in contingencies. The Museum is not aware, however, of any material contingencies at this time.
On September 30, 2016, a purported representative of the Estate of Alice Leffmann sued the Museum in the United States District Court for the Southern District of New York (Case No. 16-7665), seeking the return of Pablo Picasso’s The Actor or damages in an amount to be determined at trial, but estimated to be in excess of $100 million. The suit alleges that Alice and Paul Leffmann are deceased German Jews who sold the painting under duress from the rise of persecution of Jews in Fascist Italy, to which the Leffmanns had fled from Germany. The Museum disputes that this was a sale under duress as the painting was sold for a fair price on the open market in Paris. In November 2016, the Museum moved the court to dismiss the suit on five independent grounds. The District Court dismissed the suit on February 7, 2018. The Estate of Alice Leffmann appealed this decision to the United States Court of Appeals for the Second Circuit, which affirmed the District Court’s dismissal of the suit on June 26, 2019. Plaintiff-Appellant filed a petition for rehearing and rehearing en banc, which was unanimously denied on August 29, 2019. The Estate of Alice Leffmann filed a petition for writ of certiorari to the United States Supreme Court on January 24, 2020. On March 2, 2020, the United States Supreme Court denied the writ of certiorari. This matter is now closed.
Subsequent EventsThe Museum performed an evaluation of subsequent events through November 10, 2020, which is the date the financial statements were issued.
As a result of the negative impact due to COVID-19, the Museum completed personnel reductions in fiscal year 2021. The Museum extended a VRP to union staff who are represented by Local 1503, District Council 37, and who, as of December 30, are eligible to retire with a fully vested, unreduced pension.
Additionally, the Museum completed involuntary personnel reductions of both nonunion and union staff. There was no liability required as of June 30, 2020, and the expense of these reductions totals approximately $1.5 million and will be incurred in fiscal year 2021.