Disaster Relief Emergency Fund (DREF) Uganda: Cholera Outbreak

Report of Cholera Outbreak Investigation, Greater Accra
Region, June-August 2014
Investigators: Dr Emmanuel Dzotsi Mr. Alexander Asamoah; Mr. Charles Noor; Dr.
Anthony Gershon; Mr. Eric Yirenchi; Mr. Robert Nuoh; Mr. Geoffrey Atelu
July 1, 2014

1
Executive Summary
Introduction: On 4th
July, 2014 the Disease Surveillance Department (DSD) of the Public
Health Division, Ghana Health Service received a report from the Greater Accra Regional
Health Directorate indicating cholera outbreak in the Accra Metropolis; 16 suspected cases
reported between 9th
June and 3rd
July 2014 with two (2) confirmed by culture at the National
Public Health Reference Laboratory, Korle-Bu. Following these reports, a national team
comprising of residents from the Ghana Field Epidemiology and Laboratory Training
Programme (GFELTP) and the Disease surveillance Department (DSD) was dispatched to
investigate the outbreak with the objectives of establishing the magnitude, cause and source
of the outbreak.
Methods: A descriptive and an un-matched community-based 1:2 case control study was
conducted between 24th
July and 3rd August 2014. Cases were defined as any person
reporting to a facility in the Greater Accra Region from June to August 2014 with diarrhoea
with or without vomiting and diagnosed as cholera by clinician. Controls were persons
without cholera and living in the same neighbourhood as the case. Data were collected on
age, sex, place of residence, hygienic practices, and on food and water consumption. Data
was analyzed with Epi-info version 7 with odds ratio used as measure of association and
confidence level set at 95%.
Results: A total of 1,733 cholera cases with 20 deaths (CFR=1.2%) were reported between
9th
June and 3rd
August 2014 (attack rate = 25 per 100,000 population) in the Greater Accra
Region. A propagating multiple source outbreak was observed with increasing peaks. The
majority of cases clustering in the Ablekuma Sub-Metropolis (20.7%). The affected ages
ranged from 3 months to 90 years with a mean of 31 years. Most affected age group was 20 -
29 years: 426 (37.3%). Compared to the controls, the cholera cases were six (6) times more
likely to have drunk street-vended sachet water (odds ratio (OR) = 6; 95% confidence interval
(CI): 1.4-20.9; p-value: 0.00). Similarly, eating food prepared outside home especially street
vended food was significantly associated with getting cholera infection [OR=5.6; CI 2.5-
13.5; p-value 0.00]. However, home prepared food was protective against acquiring cholera
[OR=0.1; 95% CI: 0.06-0.29), p value: 0.00]. The Odds of acquiring cholera was reduced by
70%, comparing hand washing after defecating in controls to cases (OR = 0.3; 95% CI: 0.1-
0.8). Knowledge of the mode of cholera transmission significantly reduces the risk of
2
acquiring cholera by almost 60% (OR = 0.4; 95% CI: 0.2-0.8: p-value: 0.01).
Conclusion: A protracted multiple source propagating cholera outbreak was established in
the Greater Accra Region and there is significant association between consuming vended
sachet water and foods with the outbreak. Therefore, most likely vehicles of the cholera
transmission in the region was contaminated street vended sachet water and food from poor
environmental sanitation. Inadequate multi-sectorial intervention and weak diarrhoea diseases
surveillance and inadequate case management are the major contributory factors to the
protracted nature of the outbreak.
Recommendations:
1. The Region, Metropolitan, Municipal and Districts to step-up Multi-sectorial Public
Health Emergency Management and response systems
2. The Regional/Metropolitan/District Health Directorates to provide isolation facilities,
cholera beds and Paste Cholera Case management protocols at all the health facilities.
3. National to supply region with cholera logistics (infusions (5:4:1); Doxycycline /
Tetracycline, ORS)
4. Mass Community Education and social mobilization with announcements on cholera
prevention in the affected areas with the following key messages:
Drinking of safe water-pipe water/treated water and avoid drinking of street vended
sachet water
preparation and consumption of food under hygienic conditions
Avoid eating street vended foods
Avoid defeacating in open, use toilet facilities
Wash hands with soap and water after using toilet and before meals.
5. The Metropolitan/Municipal/District Assemblies and Food and Drugs Authority to
ensure that food and water vendors provide hygienic food and water eg preparation,
storage and serving.
6. Ghana water company to provide adequate water supply eg tanker supply to
communities without water
7. The Ministry of Local Government and Food and Drugs Authority to enforce by-laws
on environmental sanitation, water and food safety: target food and water vendors

3
List of Abbreviations
RDHS Regional Director of Health Services
CFR Case Fatality Rate
CR Central Region
DCO Disease Control Officer
FELTP Field Epidemiology and Laboratory Training Programme
GHS Ghana Health Services
MDHS Metropolitan Director of Health Services
MHD Metropolitan Health Directorate
GHS Ghana Health Services
IPD In-patient Department
OPD Out Patient Department
ORS Oral Rehydration Salt
PHRL Public Health Reference Laboratory
PHD Public Health Division
RHD Regional Health Directorate
SPH School of Public Health
WC Water Closet
Acknowledgements
We thank the following individuals and groups for their contribution to the investigation: the
Acting Director PHD, Head DSD and his team, Head National Public Health Reference
Laboratory and team, Transport Unit, GHS, the Authorities of FELTP, SPH, Legon; the
Greater Accra Regional Director of Health Services and his team, Head of Public Health Unit
of Korle-Bu Teaching Hospital, all the Metropolitan/Sub-Metropolitan/Municipal Directors
of Health Services of Osu-Clotey Sub-Metropolitan, La Dadekotopon, Lodzokuku Kurowor,
Ga West Municipalities. Special thanks also to the Medical Superintendents and teams,
Doctors, nurses of La General, Ga West Municipal hospitals, Korle-Bu Polyclinic for their
joined forces to deal with the outbreak.

4
1.0 Introduction
On 4th
July, 2014 the Disease Surveillance Department (DSD) of the Public Health Division,
Ghana Health Service received a report from the Greater Accra Regional Health Directorate
indicating cholera outbreak in the Accra Metropolis; 16 suspected cases reported between 9th
June and 3rd
July 2014 with two (2) confirmed by culture at the National Public Health
Reference Laboratory (NPHRL), Korle-Bu. Following these reports, a national team
comprising of residents from the Ghana Field Epidemiology and Laboratory Training
Programme (GFELTP) and the Disease surveillance Department (DSD) was dispatched to
investigate the outbreak.
1.1 Objectives
1. Establish existence and magnitude of the outbreak
2. Identify the source and mode of transmission of the outbreak
3. Describe the epidemic by time, place and person
4. Establish possible causes/risk factors/vehicles of transmission of the outbreak
5. Make recommendations and provide support to implement preventive and control
measures
1.2 Investigation Team Members
1. Dr Emmanuel Dzotsi - Physician Epidemiologist (GHS/DSD)—Leader
2. Mr Ato -Regional DCO, GAR
3. Mr. Alexander Asamoah - Resident (GFELTP)
4. Mr. Charles Noor - Resident (GFELTP)
5. Mr. Alexander Asamoah - Resident (GFELTP)
6. Mr. Eric Yirenchi - Resident (GFELTP)
7. Mr. Robert Nuoh - Resident (GFELTP)
8. Mr. Geoffrey Atelu - Resident (GFELTP)
5
2.0 Methods
2.1 Outbreak Setting
The outbreak occurred in the Accra metropolitan area, La Dadekotopon, Lodzokuku kurowor,
Ga South, Ga West and Tema Metropolis in the Greater Accra Region.
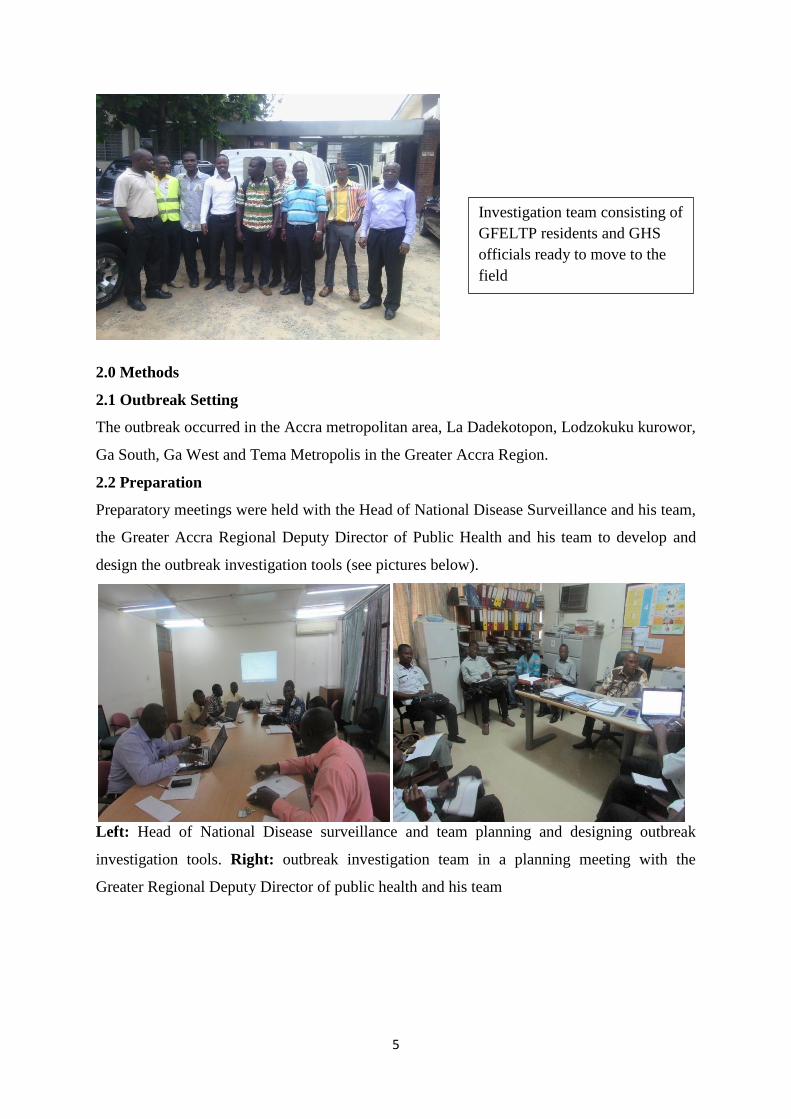
2.2 Preparation
Preparatory meetings were held with the Head of National Disease Surveillance and his team,
the Greater Accra Regional Deputy Director of Public Health and his team to develop and
design the outbreak investigation tools (see pictures below).
Left: Head of National Disease surveillance and team planning and designing outbreak
investigation tools. Right: outbreak investigation team in a planning meeting with the
Greater Regional Deputy Director of public health and his team
Investigation team consisting of
GFELTP residents and GHS
officials ready to move to the
field

6
2.2 Study Design
The study was both descriptive and an un-matched community-based 1: 2 case control study.
Cases were all persons with cholera and controls were persons without cholera and living in
the same neighbourhood as the case.
2.2 Investigation Period
The investigations were done between 24th
July and 3rd August 2014 by a team from
National Surveillance Department, GFELTP and Greater Accra Regional Health Directorate.
2.3 Study Population and Sampling
2.3.1 Inclusion criteria
The participants of the study included all persons living in Greater Accra Region confirmed
with cholera or had epidemiological linkage with confirmed cholera cases detected during the
outbreak and randomly selected community controls from the same neigbourhood where the
cases live.
2.3.2 Exclusion criteria
Persons not resident in Greater Accra
2.3.3 Sample size calculation
A sample size of 138 (46 cases and 92 controls) was calculated using the method by Kelsey
et al. in Epi-Info 7. This was calculated based on an alpha of 0.05, at two sided confidence
level of 95%, power of 80% and assuming 40% prevalence of exposure among controls to
detect a least odds ratio of 3.
2.4 Investigation Sites visited:
The investigation sites visited included the Greater Accra Regional Health Directorate, Osu-
Clotey Sub-Metropolitan health Directorate, La Dadekotopon Health Directorate, Lodzokuku
Kurowor Health Directorate, Ga West Health Directorate, Cholera Treatment Centres at
Ridge Hospital, La General Hospital, Korle Bu Polyclinic, Ga West Municipal Hospital and
Communities of all cases
2.5 Selection of cases and controls
2.5.1 Case definition
7
A case was defined as any person reporting to a facility in the Greater Accra Region from
June to August 2014 with diarrhoea with or without vomiting and diagnosed as cholera by
clinician.
Cases were randomly selected from cholera treatment centres in the health facilities visited.
These health facilities were conveniently sampled.
2.5.2 Selection of Controls
Controls were defined as any person living in Greater Accra Region from June to August
2014 without diarrhea or vomiting and coming from same community and neighbourhood of
a case.
For each case, two controls were selected and interviewed on the same day as the case
interviewed.
Controls were selected from the same neighbourhood communities as the cases by visiting
the houses of cases, spun a bottle in the approximate centre of the house, selected the
immediate household to the direction of the bottle and randomly selected the first control.
The second control was also randomly selected from the immediate household following the
first control in the same direction. Random selection of controls was done by numbering all
persons met in a household on pieces of paper, mixed them and selected one.
We visited as many households as needed to find appropriate controls for all the 46 cases.
2.6 Data collection method
The Team engaged and interviewed, Regional, Metropolitan and Sub-Metropolitan Health
Management Teams, Hospital management Teams, clinicians, nurses and Laboratory staff at
all places visited. We reviewed records of cases (line list, OPD and admission folders) and
conducted risk factor assessment of the cases. We followed-up cases into their residence and
conducted environmental assessment of the communities.
Standardized questionnaire was used to collect demographic, clinical and exposure history
from the cases and controls. Questionnaires were administered to the cases as they were
detected in the cholera treatment centres by trained data collection officers. Communities and
neighbourhoods of the cases were visited to randomly select and interview the controls. If a
case or control was a child the questionnaires was administered to their parents or care givers.

8
Questions were asked about age, sources of drinking water, main source of food (whether
home prepared or vended foods), hand washing practices, type of toilet use and household
waste disposal practices between June and August 2014.
2.7 Data management and Analysis
Data was cleaned manually and necessary correction(s) made during collection. Data was
cleaned, checked for consistency and analyzed using Epi-info version 7 and Excel statistical
software packages.
2.8 Ethical considerations
Consent Process: participants of the study were informed about the study verbally to solicit
their consent to participate in the study. Children were recruited in the study after obtaining
informed consent from their parents or care-givers.
3.0 Results
3.1 Descriptive Epidemiology
3.1.1 Evolution of the outbreak
The Cholera outbreak in Greater Accra Region started during epidemiological week 24 of
2014 (9th
– 15th
June 2014) when six (6) suspected cholera cases reported to the Ussher
polyclinic in the Asiedu Keteke Sub-Metropolis of the Accra Metropolis. One (1) out of the
five (5) samples investigated at the National Public Health Reference Laboratory (NPHRL) at
Korle-Bu confirmed positive for vibrio cholera.
The index case (the first confirmed cholera case in the region) was a 10 year old girl from
Agboba community in Ashiedu Keteke Sub-Metropolis. The date of onset of diarrhoea was
09th
June 2014 and was admitted on 10th
June 2014 at Ussher Polyclinic. She survived the
infection after being managed with Intravenous infusions, ORS, and tetracycline antibiotics.
Stool specimen taken from her on the date of reporting tested positive for Vibrio cholerae 01
of the Ogawa sub type but the laboratory confirmation came after patient was discharged.
The evening prior to the onset of diarrhoea she ate rice and fried turkey tail (locally called
Tsofi) from a street food vendor at Agbado, a suburb of Accra Metropolis.
As of 20th
June 2014 no case was reported to the Ussher polyclinic. However, on the 26th
June 2014 ten (10) cases with profuse watery diarrhoea reported at Ridge hospital OPD and
five tested positive by Cholera Rapid Diagnostic test (RDT) but three (3) of the stool samples
sent to NPHRL tested negative by Culture. All the cases reported from Odorna area in the

9
Osu-Klotey Sub-Metro of Accra Metropolis. As of 4th
July 2014 no case have reported to the
Ridge hospital cholera bay.
The second positive vibrio cholera case in the Greater Accra region was a 53 years old male,
residence of Maamobi in Ayawaso Sub-Metropolis of the Accra Metropolis. He was admitted
to the Maamobi Polyclinic on 30th
June 2014 with diarrhoea which started 28th
June 2014.
After the report of the second positive case in week 26, there was sudden upsurge of the
cholera cases during week 29 in the Accra Metropolis and further spread of the outbreak to
other districts in the region. This is as shown in the epicurve below (Figure 1).
-
Figure 1: Epidemic Curve: Cholera Outbreak, Greater Accra Region, 2014
The epidemic curve (Figure 1) shows a protracted propagating multiple source outbreak with
increasing peaks starting in week 24 of 2014 (9th
– 15th
June 2014) reaching the highest peak
in week 31 with the number of cases slightly declining in week 32 of the outbreak.
0
100
200
300
400
500
600
700
800
900
1000
Wee
k 1
Wee
k 2
Wee
k 3
Wee
k 4
Wee
k 5
Wee
k 6
Wee
k 7
Wee
k 8
Wee
k 9
Wee
k 1
0
Wee
k 1
1
Wee
k 1
2
Wee
k 1
3
Wee
k 1
4
Wee
k 1
5
Wee
k 1
6
Wee
k 1
7
Wee
k 1
8
Wee
k 1
9
Wee
k 2
0
Wee
k 2
1
Wee
k 2
2
Wee
k 2
3
Wee
k 2
4
Wee
k 2
5
Wee
k 2
6
Wee
k 2
7
Wee
k 2
8
Wee
k 2
9
Wee
k 3
0
Wee
k 3
1
Wee
k 3
2
Cas
es
Epid. Weeks
Suspected Cases Confirmed Cases

10
3.1.2 Magnitude of Outbreak
The outbreak is wide spread within the Greater Accra Region and not contained. A total of
1,733 suspected cholera cases, 47 confirmed with 20 deaths (CFR=1.2%) were reported
between 9th
June and 3rd
August 2014. The overall attack rate was approximately 25 per
100,000 population with sex specific attack rates of 31.2% and 19.6% for males and females
respectively.
The most affected districts were Osu Klottey Sub-Metropolis of the Accra Metropolis with an
attack rate of 111 per 100,000 and La Dadekotopon with an attack rate of 76 per 100,000
(Fig.2).
Figure 2: Attack Rate of Cholera By districts during outbreak, Greater Accra, June-July 2014.
3.1.3 Distribution of cholera cases by place
The majority of cases were clustering in the Ablekuma Sub-Metropolis (20.7%). Of the
1,141 cholera cases analysed in the region, 1.3% (15/1141) were from both Awutu Senya
(1.22%) and Kwahu North (0.08%) districts of the Central and Eastern regions respectively.
Of the 98.7% (1126/1141) of cases from Greater Accra Region, 20.7% (233/1126) were from
Ablekuma Sub-Metropolis, 13.9% (157/1126) from Osu Klottey Sub-Metropolis and 12.3%
(138/1126) from Okaikoi Sub-Metropolis of Accra metropolis whilst 15.5% from La
Dadekotopon Municipal. Cases from Accra metropolis formed 59.4% (669/1126) of the cases
from Greater Accra Region and 0.2% (2/1126) were from Shai Osu Doku district. There was
no case recorded from Ada East, Ada West and Ningo Prampram districts (Fig. 3).
0
20
40
60
80
100
120
Ab
leku
ma
Ash
ied
u K
ete
ke
Aya
was
o
Oka
i ko
i
Osu
Klo
ttey
Ad
a Ea
st
Ad
a W
est
Ad
enta
n
Ash
aim
an
Ga
Cen
tral
Ga
East
Ga
Sou
th
Ga
We
st
Kp
on
e K
atam
anso
La D
adek
oto
po
n
La N
kwan
tan
ang
Led
zoku
ku
Nin
go P
ram
pra
m
Shai
Osu
Do
ku
Tem
a
Att
ack
Rat
e(
pe
r 1
00
00
0)
Districts

11
Figure 3: Distribution of Cholera cases by districts, Greater Accra Region, June-July 2014
3.1.4 Age Sex Distribution of Cases
The affected ages ranged from 3 months to 90 years with a median of 28 years, mean
31.1years and standard deviation of 14.5 years. The age group 20 - 29 years was the most
affected; 426 (37.3%). The least (0.1%) affected age group was ninety years and above.
3.1.5 Laboratory Results
Out of the 184 suspected cases investigated by Culture at the National Public Health
Reference Laboratory, Korle-Bu, 90 were confirmed positive for vibrio cholera, ogawa
subtype .Of the 90 cases that were confirmed , 64 were from Accra Metropolis, nine (9) from
Ladadekotopon, and 2 each from Ga South and Ga East.
0.0
5.0
10.0
15.0
20.0
25.0
Ab
leku
ma
Ash
ied
u K
ete
ke
Aya
was
o
Oka
i ko
i
Osu
Klo
ttey
Ad
a Ea
st
Ad
a W
est
Ad
enta
n
Ash
aim
an
Ga
Cen
tral
Ga
East
Ga
Sou
th
Ga
We
st
Kp
on
e K
atam
anso
La D
adek
oto
po
n
La N
kwan
tan
ang
Led
zoku
ku
Nin
go P
ram
pra
m
Shai
Osu
Do
ku
Tem
a
Re
lati
ve F
req
ue
ncy
(%
)
Districts
0
50
100
150
200
250
300
Num
ber o
f cas
es
Age Groups (Years)
Distribution of cholera cases by Age and sex, Greater Accra Region, July 2014.
male
female

12
Sensitivity Test
The isolates have shown the following antibiotic sensitivity patterns:
Table 1: Vibrio Cholerae sensitivity Pattern, Greater Accra Region, June- July 2014
Antibiotics Tested Proportion sensitive
Ciprofloxacillin 100% ,
Tetracycline 100%,
Chloramphenicol 80%,
Erythromycin 20%
Ampicillin 0%
Cotrimoxazole 0%.
3.1.6 Case Management and containment
Most of the cases were admitted and treated at Cholera Treatment Centres at Ridge hospital,
La General Hospital, Korle Bu Polyclinic and Ga West Municipal hospital. Several cases
were still on admission at the time of visit. All the cases admitted were managed with Ringers
Lactate, ORS and Tetracycline capsules. Contacts were given prophylaxis with Tetracycline
capsules. We observed overcrowded wards and some patients lying on benches (pictures)
13
3.1.7 Epidemic Preparedness and Response Measures
The Greater Accra Region had functioning epidemic management committee and have
preparedness plan. The Epidemic Management committee had met and put in measures to
control the outbreak, which included;
1. Rapid response teams visited the facilities and communities to start some
investigation
2. Community case follow-up on going in some Sub-Metropolis and Districts and
contacts given tetracycline prophylaxis
3. Public education on going
4. Metropolitan Assembly started fumigation of public toilet facilities and mass clearing
of garbage in the region
3.1.8 Surveillance System
Case detection and reporting
The Ashiedu keteke Sub-Metropolitan Health Directorate was notified of the index cholera
outbreak on the 19th
June 2014, whilst the outbreak started in week 24 (9 – 15 June 2014)
about week after the outbreak occurred in the Ussher polyclinic. The Region was notified on
20 June 2014, whilst national notified on 4th
July 2014 (four weeks after the outbreak
occurred).
Standard case definition for cholera and diarrhoea diseases were observed only at the
DHMTs but not at all the hospitals and clinics visited. Although there is weekly reporting to
the region and metropolis, weekly trend analysis of diarrhoea cases was not done at all the
facilities to detect outbreaks early. Records review and clinician sensitization were not done
regularly. Line list of the cases were observed and spot maps seen at some facilities.
3.1.9 Key Challenges Identified
Inadequate supplies of I.V Fluids 5:4:1, doxycycline/tetracycline and ORS at the
facilities and the regional medical stores. For this reason some facilities rather bought
them from the markets and then sold it to the patients to be paid after management.

14
Difficulty in tracing cases to their respective homes to identify immediate contacts
because of poor traceable address systems.
Lack of case management protocol pasted at the cholera treatment centres
Inadequate cholera beds at the treatment centres compelling management of cases on
benches
Some facilities did not have a cholera treatment centres. The improvised sites were
OPD, medical wards and unroofed uncompleted buildings with patients also managed
on benches.
Some facilities had cholera beds without mattress fitted to the wooden structure.
Patients lay on wooden beds with card boards covering the opening for egestion.
Bleach carpets (foot bathes) were absent in some cholera treatment centres and those
who had laid it on the bare ground were dirty and not frequently soaked.
3.1.10 Environmental Assessment
There was generally poor environmental sanitation at all the communities where the cases
reside. We observed crude dumping of refuse in most places and refuse containers full and
overflowing, drains were shocked with people openly defeacating in them, and some water
pipe lines laid directly through some of the drains. We observed broken sewage pipes with
sewage leaking into the environment at some places. There were inadequate water supply
from the Ghana Water Company; taps were closed and people normally fetch with buckets
and gallons and further stored in rubber bowls, gallons and polytanks for use. We observed
inadequate hand washing facilities.
There were some WC in some homes but majority of them use Public Pit laterines (KVIP) the
premises of these were general dirty and liquid waste dislodged by cesspit emptier. Many
food vendors were observed selling food along the open gutters. (See pictures below)
Figure 1 broken sewage pipe with sewage leaking into the environment at La Ananse krom new mantiase.
Figure 2; an open drain chocked with garbage in La Wireless, close to the la Community garbage damping site.

15
Description of Pictures above:
Upper Left Upper right ; Lower left: Shows interview of a sanitation worker at the la
damping site. According to him the garbage has not been lifted for four months because the
vehicles have all broken down. Lower right: observed open defecation at La New Mantiase.
Poor Sanitation
Pictures: Upper right: Garbage disposed into open drain, with a broken water pipeline.
Figure 3: Garbage overflow in La community dumping site

16
Upper left: Broken sewage line. Lower Right: Toilet discharging untreated sewage into
open drain at La Ageman. Lower left: Observed disposal of untreated sewage into open drain
at Osu Casttle junction
3.1.11 Hypothesis for why the outbreak occurred
Due to the findings that, a high proportion of the cases ate food and drank water from street
vendors which was most likely to have been contaminated and accompanied inadequate water
and sanitation facilities, the following hypothesis was formulated:
The outbreak in the Greater Accra Region could be associated with;
Drinking water from street water vendors
Eating food from street food vendors outside home
Closure of pipe borne water supply
Poor personal hygiene practices
Attending social gatherings eg funerals
Poor sanitation
This hypothesis was tested with analytic study (case-control study) to establish the actual risk
factors associated with the Outbreak.
3.2 Analytical Study-Hypothesis Testing
A community-based unmatched 1:2 case control study was conducted between 24th
July and
3rd
August 2014 in the Greater Accra region to identify risk factors and associated vehicles of
transmission. We selected 46 cases from cholera treatment centres and 92 neighbourhood
community controls.
3.2.1 Epidemiological and Clinical Characteristics of cases and controls
The median age for both cases and controls was 32 years. Among cholera cases, age ranged
from 12 to 70 years, with the most affected age group 21-30 years;17 (37%) and the least
affected age group being below 10 and above 60 years; (Table 2). The age range among
controls was from 10 to 89 years.
Table 2: Age Distribution of Cases and Controls at Ola Training College October, 2013
Age Group No. of Cases (%) N=46 No. of Controls (%) N=92
0-10 0 1

17
Age Group No. of Cases (%) N=46 No. of Controls (%) N=92
11-20 8 8
21-30 17 30
31-40 7 20
41-50 6 17
51-60 4 11
61-70 4 3
71-80 0 1
81-90 0 1
Total 46 92
The most common symptoms among Cholera cases were diarrhoea 46 (100%), vomiting
34(73%)), abdominal cramps 30 (65%). (Table 3). Of the 46 cases 42 (91%) were
hospitalized.
Table 3: Signs and Symptoms of Cholera Cases, Greater Region June-August 2014
Signs and Symptoms Number (%) N=46
Diarrhoea 46 (100%)
Vomiting 34 (73%)
Abdominal Cramps 30 (65%)
Headache 17 (37%)
Chills 16 (35%)
Nausea 15 (33%)
Fever 13 (28%)
Blood in stool 0 (0%)
3.2.2 Risk Factors
In a bivariate analysis, the study found that compared to the controls, the cholera cases were
six times more likely to have drunk vended sachet water [odds ratio = 6; 95% confidence
interval (CI): 1.7-20.9, p-value: 0.00] (Table 4), suggesting sachet water as a possible vehicle
of transmission. Drinking pipe and borehole water were protective although not significantly
associated with the illness. (Appendix 1).

18
Eating food prepared outside home was significantly associated with cholera i.e cholera cases
were six (6) times more likely to have eaten food prepared outside as compared to the
controls [OR=5.6; CI 2.5-13.5; p-value 0.00] (Table 4). Similarly, it was found that, cases
were three (3) times more likely to have eaten street vended food compared to controls (OR=
2.7; 95% CI: 1.3-5.7: p-value 0.01). Eating home prepared food was found to be protective
against acquiring cholera [OR=0.1; 95% CI: 0.06-0.29), p value: 0.00].
The Odds of acquiring cholera was reduced by 70%, comparing hand washing after
defecating in controls to cases (OR = 0.3; 95% CI: 0.1-0.8).
Knowledge of the mode of cholera transmission significantly reduces the risk of acquiring
cholera by almost 60% (OR = 0.4; 95% CI: 0.2-0.8: p-value: 0.01).
Other variables tested included places food eaten, attending ceremonies (funerals, parties,
outdooring, and festivals), water storage were not associated with the risk of cholera in the
Region (Annex 1)
Table 4: Statistically Significant Exposures among Cholera Cases and Controls,
Greater Accra Region, 2014
Potential Exposures Cases Control OR 95% CI P-value
Street Vended Sachet
water
43/46 (93.5%) 65/92 (70.7%)
6.0
1.7-20.85
0.00
Food prepared Home 19/46 (41.3%) 78/92 (84.8%) 0.1 0.06-0.29 0.00
Food outside home 37/46 (80.4%)
38/92 (41.3%) 5.8
2.53-13.51
0.00
Street Food Vendor 25/46 (54.4%) 28/92 (30.4%) 2.7 1.31-5.65 0.01
Hand washing After
defecating
35/46 (29.4%) 84/92 (91.3%) 0.3 0.11-0.82 0.03
Knowledge of cholera
transmission
20/46 (43.5%)
62/96 (67.4%) 0.4 0.18-0.78 0.01

19
5.0 Discussions
The upsurge of reported cases of severe watery diarrhoea in the Greater Accra Region
predominantly affecting adults and the isolation of pathogenic strain of cholera organisms in
72% (100/137) of the collected rectal swabs and stool samples from various health facilities
in the region confirm that the outbreak was caused by Vibrio cholerae. Past surveillance
suggest that very few or no cases are reported between weeks 19 and 35. Therefore the
abnormal number of cases observed during this period is a clear indication of an outbreak.
The delay in controlling the outbreak could be attributed to the fact that most health facilities
were not prepared with logistics to manage the overwhelming numbers of cases and also the
risk factors are multiple. Furthermore, weak diarrhoea disease surveillance system, the late
notification of the outbreak to higher levels and inadequate multi-sectorial (Ghana water
company, Local Government etc) preparedness and response mechanisms in the region are
some of the major contributory factors for the protracted nature of the cholera outbreak
The sudden outbreak of severe diarrhea especially among residents living La Dadekotopon,
Osu Klotey, Okai Koi, and Ablekuma sub metros in the Greater Accra Region agrees with the
poor sanitary conditions observed in these areas and the eating habits of these residents. The
water supply system in these areas also had visible leakages in the pipes suggesting possible
water contamination, since there was evidence of visible disposal of untreated sewage into
open drains.
The study revealed that, the cholera outbreak affected all age groups in the region and more
especially among young adult males, however people in age 20-29 in both sexes are most
affected. Male cases out number their female counterparts which is largely a function of male
behavior since males are more likely to eat outside home foods. Finding more male case than
female agrees with the finding of Opare et al., 2012, and Sur et al., 2005.
The significant association observed between eating vended foods and also between
consuming vended sachet water suggest that sachet water and street food vending are
possible vehicles of the cholera transmission in the region which is similar to findings of
Hutin et al., 2003. The vended items are most likely contaminated from the environment and
poor handling.

20
5.0 Study Limitations
1. Sampling of cases was done by convenience method
2. Tracing cases to respective homes were at times not possible due to poor addressing
system
3. We were also unable to get food/environmental samples from the communities for
laboratory investigation.
4. Possibility of recall bias cannot be ruled-out
6.0 Conclusion
A protracted multiple source propagating cholera outbreak was established in the Greater
Accra Region and there is significant association between consuming street vended sachet
water and foods with the outbreak. Therefore, the most likely vehicles of the cholera
transmission in the region was contaminated street vended sachet water and food from poor
environmental sanitation. Inadequate multi-sectorial intervention, weak diarrhoea diseases
surveillance and inadequate case management are the major contributory factors to the
protracted nature of the outbreak.
5.0 Recommendations
1. The Region and Metropolis/Municipal/Districts to step-up the Multi-sectorial Public
Health Emergency Management and response system
2. The Regional/Metropolitan/District Health Directorates to provide isolation facilities,
cholera beds and Paste Cholera Case management protocols at all the health facilities.
3. National to supply region with cholera logistics (infusions (5:4:1); Doxycycline /
Tetracycline, ORS)
4. Mass Community Education and social mobilization with announcements on cholera
prevention with the following key messages:
Drinking of safe water: pipe water/treated water
Avoid drinking of street vended sachet water
preparation and consumption of food under hygienic conditions
Avoid eating street vended food
Avoid defeacating in open, use toilet facilities
Wash hands with soap and water after using toilet and before meals.

21
5. The Metropolitan/Municipal/District Assemblies, Food and Drugs Authourity to
ensure that food and water vendors provide hygienic food and water eg preparation,
storage and serving.
6. Ghana water company to provide adequate water supply
7. The Ministry of Local Government- Metropolitan/Municipal/District Assemblies to
ensure adequate environmental sanitation in the region
6.0: References
1. Opare, J., Der, J., Afakye, K., Bonsu, G., Ohuabunwo, C., Afari, E., … Sackey, S.
(2011). SP5-12 Outbreak of cholera, East-Akim Municipality, Ghana, November
2010. Journal of Epidemiology and Community Health, 65(Suppl 1), A448–A448.
2. Opare, J. K. L., Ohuabunwo, C., Afari, E., Wurapa, F., Sackey, S. O., Der, J., …
Odei, E. (2012). Outbreak of Cholera in the East Akim Municipality of Ghana
Following Unhygienic Practices by Small-Scale Gold Miners, November 2010.
Ghana Medical Journal, 46(3), 116.
3. Sur, D., Deen, J. L., Manna, B., Niyogi, S. K., Deb, A. K., Kanungo, S., … others.
(2005). The burden of cholera in the slums of Kolkata, India: data from a prospective,
community based study. Archives of Disease in Childhood, 90(11), 1175–1181.
4. Seas C, Gotuzzo E. Vibrio cholerae. In: Mandell GL, Bennett JE, Dolin R, editors. Principles
and Practice of Infectious Diseases. USA: Churchill Livingston; 2000. pp. 2266–2272.
5. Shears P. Recent developments in cholera. Curr Opin Infect Dis. 2001;14:553–558.
6. WHO fact sheet on cholera. Last up-dated February 2014. Available from:
http://www.who.int/mediacentre/factsheets/fs107/en/
7. Yvan Hutin, Stephen Luby and Christophe PaqueRisk factors for cholera during an
outbreak in Nigeria, Journal of water and health, 2003. 01.3
22
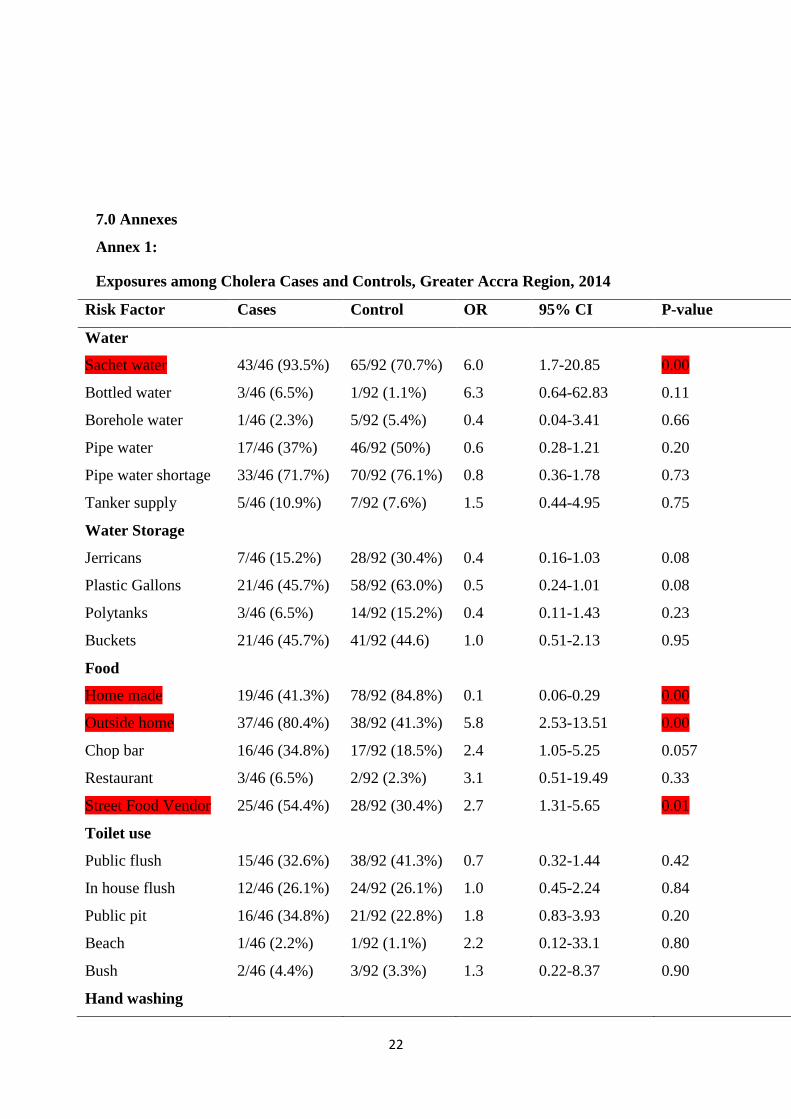
7.0 Annexes
Annex 1:
Exposures among Cholera Cases and Controls, Greater Accra Region, 2014
Risk Factor Cases Control OR 95% CI P-value
Water
Sachet water
Bottled water
43/46 (93.5%)
3/46 (6.5%)
65/92 (70.7%)
1/92 (1.1%)
6.0
6.3
1.7-20.85
0.64-62.83
0.00
0.11
Borehole water 1/46 (2.3%) 5/92 (5.4%) 0.4 0.04-3.41 0.66
Pipe water
Pipe water shortage
Tanker supply
Water Storage
Jerricans
Plastic Gallons
Polytanks
Buckets
17/46 (37%)
33/46 (71.7%)
5/46 (10.9%)
7/46 (15.2%)
21/46 (45.7%)
3/46 (6.5%)
21/46 (45.7%)
46/92 (50%)
70/92 (76.1%)
7/92 (7.6%)
28/92 (30.4%)
58/92 (63.0%)
14/92 (15.2%)
41/92 (44.6)
0.6
0.8
1.5
0.4
0.5
0.4
1.0
0.28-1.21
0.36-1.78
0.44-4.95
0.16-1.03
0.24-1.01
0.11-1.43
0.51-2.13
0.20
0.73
0.75
0.08
0.08
0.23
0.95
Food
Home made 19/46 (41.3%) 78/92 (84.8%) 0.1 0.06-0.29 0.00
Outside home
Chop bar
Restaurant
Street Food Vendor
37/46 (80.4%)
16/46 (34.8%)
3/46 (6.5%)
25/46 (54.4%)
38/92 (41.3%)
17/92 (18.5%)
2/92 (2.3%)
28/92 (30.4%)
5.8
2.4
3.1
2.7
2.53-13.51
1.05-5.25
0.51-19.49
1.31-5.65
0.00
0.057
0.33
0.01
Toilet use
Public flush 15/46 (32.6%) 38/92 (41.3%) 0.7 0.32-1.44 0.42
In house flush 12/46 (26.1%) 24/92 (26.1%) 1.0 0.45-2.24 0.84
Public pit 16/46 (34.8%) 21/92 (22.8%) 1.8 0.83-3.93 0.20
Beach
Bush
1/46 (2.2%)
2/46 (4.4%)
1/92 (1.1%)
3/92 (3.3%)
2.2
1.3
0.12-33.1
0.22-8.37
0.80
0.90
Hand washing

23
Risk Factor Cases Control OR 95% CI P-value
Before eating 42/46 (91.3%) 90/92 (97.8%) 0.2 0.04-1.32 0.18
After eating 40/46 (87%) 87/92 (94.6%) 0.38 0.01-1.3 0.22
After defecating 35/46 (29.4%) 84/92 (91.3%) 0.3 0.11-0.82 0.03
After changing baby
diaper
2/46 (4.4%) 13/92 (14.1%) 0.3 0.01-1.28 0.15
With soap BE
After Hand shake
Social Gatherings
Funerals
Party
Waste Disposal
Crude dumping
Burring
Refuse Container
Contacts
Household with
Cholera Case
Knowledge of
Transmission
30/46 (65.2%)
5/46 (10.9%)
9/46 (19.6%)
4/46 (8.7%)
2/46 (4.4%)
3/46 (6.5%)
23/46 (50%)
17/46 (37%)
20/46 (43.5%)
69/92 (75%)
10/92 (10.9)
17/92 (18.5%)
5/96 (5.4%)
3/92 (3.3%)
2/92 (2.3%)
61/92 (66.3%)
25/92 (27.1%)
62/96 (67.4%)
0.6
1.0
1.1
1.7
1.3
3.1
0.5
1.6
0.4
0.29-1.35
0.32-3.12
0.43-2.64
0.42-6.49
0.22-8.37
0.51-19.49
0.25-1.05
0.74-3.34
0.18-0.78
0.32
0.78
0.93
0.71
0.87
0.42
0.095
0.33
0.01
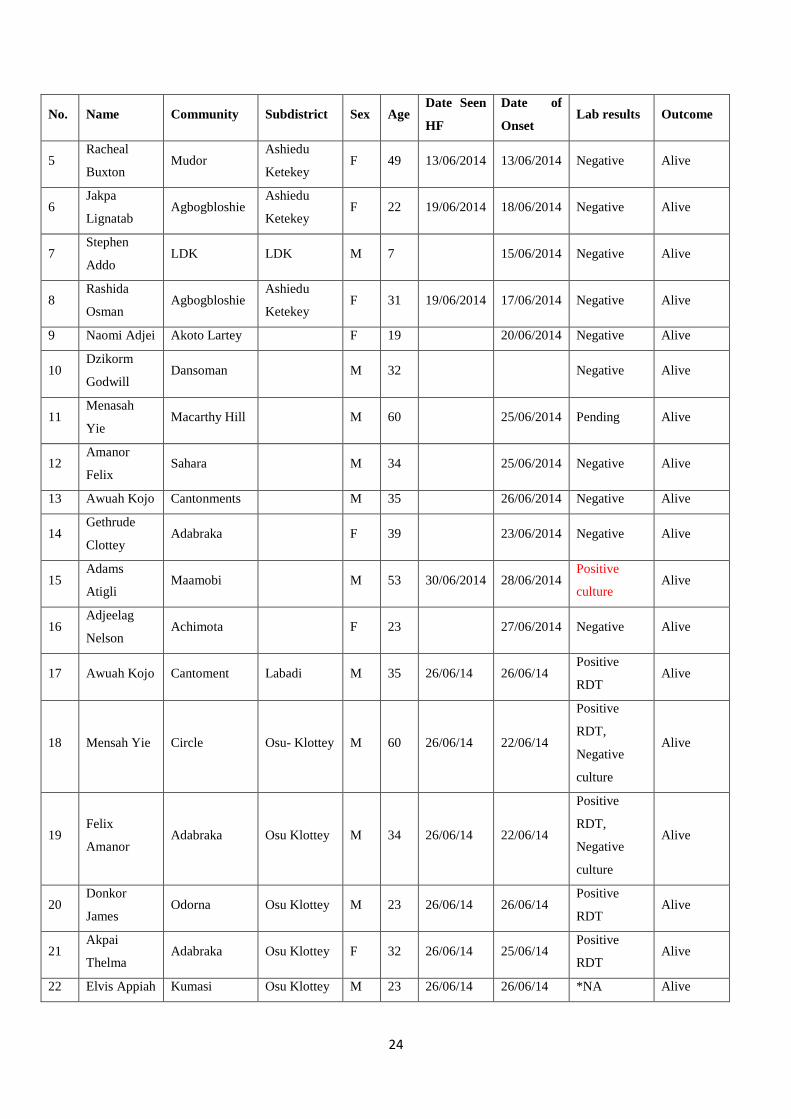
Annex 2:
Line List of Cholera Cases, Greater Accra Region, 10 June-31 July 2014
No. Name Community Subdistrict Sex Age Date Seen
HF
Date of
Onset Lab results Outcome
1 Benita
Aryee Agbado
Ashiedu
Ketekey F 10 10/06/2014 09/06/2014
Positive
culture Alive
2 Mohamed
Fati Agbogbloshie
Ashiedu
Ketekey F 20 10/06/2014 10/06/2014 Negative Alive
3 Jaboa Isaac Agbogbloshie Ashiedu
Ketekey M 25 11/06/2014 11/06/2014 Negative Alive
4 Deborah A.
Armah Korle-Gonor Ablekuma F 19 11/06/2014 11/06/2014 Negative Alive
24
No. Name Community Subdistrict Sex Age Date Seen
HF
Date of
Onset Lab results Outcome
5 Racheal
Buxton Mudor
Ashiedu
Ketekey F 49 13/06/2014 13/06/2014 Negative Alive
6 Jakpa
Lignatab Agbogbloshie
Ashiedu
Ketekey F 22 19/06/2014 18/06/2014 Negative Alive
7 Stephen
Addo LDK LDK M 7 15/06/2014 Negative Alive
8 Rashida
Osman Agbogbloshie
Ashiedu
Ketekey F 31 19/06/2014 17/06/2014 Negative Alive
9 Naomi Adjei Akoto Lartey F 19 20/06/2014 Negative Alive
10 Dzikorm
Godwill Dansoman M 32 Negative Alive
11 Menasah
Yie Macarthy Hill M 60 25/06/2014 Pending Alive
12 Amanor
Felix Sahara M 34 25/06/2014 Negative Alive
13 Awuah Kojo Cantonments M 35 26/06/2014 Negative Alive
14 Gethrude
Clottey Adabraka F 39 23/06/2014 Negative Alive
15 Adams
Atigli Maamobi M 53 30/06/2014 28/06/2014
Positive
culture Alive
16 Adjeelag
Nelson Achimota F 23 27/06/2014 Negative Alive
17 Awuah Kojo Cantoment Labadi M 35 26/06/14 26/06/14 Positive
RDT Alive
18 Mensah Yie Circle Osu- Klottey M 60 26/06/14 22/06/14
Positive
RDT,
Negative
culture
Alive
19 Felix
Amanor Adabraka Osu Klottey M 34 26/06/14 22/06/14
Positive
RDT,
Negative
culture
Alive
20 Donkor
James Odorna Osu Klottey M 23 26/06/14 26/06/14
Positive
RDT Alive
21 Akpai
Thelma Adabraka Osu Klottey F 32 26/06/14 25/06/14
Positive
RDT Alive
22 Elvis Appiah Kumasi Osu Klottey M 23 26/06/14 26/06/14 *NA Alive

25
No. Name Community Subdistrict Sex Age Date Seen
HF
Date of
Onset Lab results Outcome
23 Kwesi
Marfo Adabraka Osu Klottey M 25 26/06/14 26/06/14 *NA Alive
24 Klottey
Albert Adabraka Osu Klottey M 31 28/06/14 28/06/14 *NA Alive
25 James
Ahenkora Adabraka Osu Klottey M 32 27/06/14 27/06/14 *NA Alive
26 Baba Ali Adabraka Osu Klottey M 59 29/06/14 29/06/14 *NA Alive
27 Yaw Adusei Odorna Osu klottey M 44 30/6/14 29/6/14 *NA Alive
28 Hanson
Sackey Adabraka Osu klottey M 69 1/7/14 30/6/14 *NA Alive
29 Emma tetteh Nima Ayawaso F 29 1/7/14 30/6/14 *NA Alive
30 Nyarko
Kwesi Tabora Okaikoi M 40 1/7/14 30/6/14 *NA Alive
31 Constance
Oppong Kwabenya Ga East F 30 2/7/14 30/6/14 *NA Alive
32 Yaw
Anokye Adabraka Osu klottey M 25 2/7/14 30/6/14 *NA Alive
*NA- specimen not taken
Annex 3: Attack Rates Cholera Outbreak, Greater Accra Region, June –July 2014

26
Districts Population Cases Deaths RF % AR / 100000 CFR %
Ablekuma 756666 233 4 20.7 31 1.7
Ashiedu Keteke 129566 69 0 6.1 53 0.0
Ayawaso 489820 72 0 6.4 15 0.0
Okai koi 340379 138 1 12.3 41 0.7
Osu Klottey 141127 157 2 13.9 111 1.3
Ada East 83516 0 0 0.0 0 0.0
Ada West 64267 0 0 0.0 0 0.0
Adentan 88374 3 0 0.3 3 0.0
Ashaiman 215777 9 0 0.8 4 0.0
Ga Central 116926 18 1 1.6 15 5.6
Ga East 165274 59 2 5.2 36 3.4
Ga South 431795 29 1 2.6 7 3.4
Ga West 296868 54 0 4.8 18 0.0
Kpone Katamanso 109184 5 0 0.4 5 0.0
La Dadekotopon 231166 175 2 15.5 76 1.1
La Nkwantanang 128120 12 0 1.1 9 0.0
Ledzokuku 257538 66 2 5.9 26 3.0
Ningo Prampram 78006 0 0 0.0 0 0.0
Shai Osu Doku 60785 2 0 0.2 3 0.0
Tema 345750 17 0 1.5 5 0.0
GAR 4530904 1126 15 100.0 25 1.3
Accra Metro 1857558 669 7 59.4 36 1.0
Blanks 0 8 0 0.7 0 0.0
Awutu Senya 220674 14 0 1.2 6 0.0
Kwahu North 237152 1 0 0.1 0 0.0