Report No. 769 Waters Proficiency Testing Round 143...
37
SD 9.17.05 Report No. 769 Waters Proficiency Testing Round 143 - Biochemical Oxygen Demand (BOD) Chemical Oxygen Demand (COD) Total Organic Carbon (TOC) - August 2012 Acknowledgments PTA wishes to gratefully acknowledge the technical assistance provided for this program by Ms S Semczuk of the Australian Water Quality Centre. Also our thanks go to the Environmental Resource Associates (ERA) for the supply of samples and to Global Proficiency Pty Ltd (Melbourne, Australia) for distributing the samples. © Copyright Proficiency Testing Australia, 2012 PO Box 7507 SILVERWATER NSW 2128, Australia
Transcript of Report No. 769 Waters Proficiency Testing Round 143...

SD 9.17.05
Report No. 769
Waters Proficiency Testing
Round 143 - Biochemical Oxygen Demand (BOD)
Chemical Oxygen Demand (COD) Total Organic Carbon (TOC) -
August 2012
Acknowledgments
PTA wishes to gratefully acknowledge the technical assistance provided for this program by Ms S Semczuk of the Australian Water Quality Centre. Also our thanks go to the Environmental Resource Associates (ERA) for the supply of samples and to Global Proficiency Pty Ltd (Melbourne, Australia) for distributing the samples.
© Copyright Proficiency Testing Australia, 2012
PO Box 7507 SILVERWATER NSW 2128, Australia

SD 9.17.05
CONTENTS
1. Foreword............................................................................................................................1
2. Program Features and Design...........................................................................................1
3. Statistical Format ...............................................................................................................2
4. PTA and Technical Advisor’s Comments ..........................................................................4
5. Outlier Results .................................................................................................................15
6. Reference ........................................................................................................................15
APPENDIX A – Results and Data Analysis
Biochemical Oxygen Demand (BOD).................................................................................... A1
Chemical Oxygen Demand (COD) ........................................................................................ A4
Total Organic Carbon (TOC) ................................................................................................. A7
APPENDIX B – Sample Homogeneity and Stability
Homogeneity and Stability Testing........................................................................................ B1
APPENDIX C – Documentation
Instructions to Participants ................................................................................................... C1
Method Codes ...................................................................................................................... C3
Results Sheet ....................................................................................................................... C4

1
SD 9.17.05
1. Foreword
This report summarises the results of a proficiency testing program on the determination of Biochemical Oxygen Demand (BOD), Chemical Oxygen Demand (COD) and Total Organic Carbon (TOC) in waters. This is round 143 in a planned series of programs involving the analysis of chemical and physical parameters of waters. The exercise was conducted in May 2012 by Proficiency Testing Australia (PTA). The main aim of the program was to assess laboratories’ abilities to competently perform the prescribed analyses. The Program Coordinator was Ms D Mihaila and the Technical Advisor was Ms S Semczuk of the Australian Water Quality Centre. This report was authorised by Mrs F Watton, PTA Quality – Business Development Manager.
2. Program Features and Design 2.1 Each laboratory was randomly allocated a unique code number for the program to
ensure confidentiality of results. Reference to each laboratory in this report is by code number only.
2.2 Laboratories were provided with the "Instructions to Participants" and "Results Sheet"
(see Appendix C). Laboratories were requested to perform the tests according to their routine methods.
2.3 Participants were provided with one sealed vial (labelled R143) for analysis of
biochemical oxygen demand, chemical oxygen demand and total organic carbon. 2.4 A total of 57 laboratories received samples, comprising:
- 38 Australian participants; and
- 19 overseas participants, including:
- Brunei Darussalam (1), China (1), Indonesia (2), Kenya (1), Malaysia (2), New Zealand (2), Papua New Guinea (4), Singapore (3), Thailand (3).
Of these 57 laboratories, 7 were unable to submit results by the due date. 2.5 Results (as reported by participants) with corresponding summary statistics (i.e.
number of results, median, uncertainty of the median, normalised interquartile range, robust coefficient of variation, minimum, maximum and range) are presented in Appendix A (for each sample and for each of the analyses performed).
2.6 A robust statistical approach, using z-scores, was utilised to assess laboratories’
testing performance (see Section 3). Robust z-scores and z-score charts relevant to each test are presented in Appendix A.
The document entitled Guide to Proficiency Testing Australia, 2012 (reference [1]) defines the statistical terms and details the statistical procedures referred to in this report.

2
SD 9.17.05
2.7 A tabulated listing of laboratories (by code number) identified as having outlier results can be found on page 15.
2.8 Prior to sample distribution, a number of randomly selected samples were analysed
for homogeneity. Based on the results of this testing (see Appendix B) it was considered that the samples utilised for this program were homogeneous. As such, any results later identified as outliers could not be attributed to any notable sample variability.
3. Statistical Format
For each test, where appropriate, the following information is given:
- a table of results and calculated z-scores;
- a list of summary statistics; and
- ordered z-score charts. 3.1 Outlier Results and Z-scores In order to assess laboratories’ testing performance, a robust statistical approach,
using z-scores, was utilised. Z-scores give a measure of how far a result is from the consensus value (i.e. the median), and gives a "score" to each result relative to the other results in the group.
A z-score close to zero indicates that the result agrees well with those from other
laboratories. Whereas, a z-score with an absolute value greater than or equal to 3.0 is considered to be an outlier and is marked by the symbol “§”.
Each determination was examined for outliers with all methods pooled. The table on
page 15 summarises the outlier results detected. 3.2 Results Tables and Summary Statistics Each of these tables contains the results returned by each laboratory, including the
code number for the method used, and the robust z-score calculated for each result. Results have been entered exactly as reported by participants. That is, laboratories
which did not report results to the precision (i.e. number of significant figures) requested on the Results Sheet have not been rounded to the requested precision before being included in the statistical analysis.
A list of summary statistics appears at the bottom of each of the tables of results and consists of:
- the number of results for that test/sample (No. of Results);
- the median of these results, i.e. the middle value (Median);
- the uncertainty of the median;
- the normalised interquartile range of the results (Normalised IQR);
- the robust coefficient of variation, expressed as a percentage (Robust CV) - i.e. 100 x Normalised IQR / Median;

3
SD 9.17.05
- the minimum and maximum laboratory results; and
- the range (Maximum - Minimum).
The median is a measure of the centre of the data. The normalised IQR is a measure of the spread of the results. It is calculated by multiplying the interquartile range (IQR) by 0.7413, a factor which converts the IQR to an estimate of the standard deviation. The IQR is the difference between the upper and lower quartiles (i.e. the values above and below which a quarter of the results lie, respectively). For normally distributed data, the uncertainty of the median is approximated by:
n
normIQR×2
π
Please see reference [1] for further details on these robust summary statistics.
3.3 Ordered Z-Score Charts On these charts each laboratory's robust z-score is shown, in order of magnitude, and
is marked with its code number. From these charts, each laboratory can readily compare its performance relative to the other laboratories.
These charts contain solid lines at +3.0 and -3.0, so that outliers are clearly
identifiable as those laboratories whose "bar" extends beyond these "cut-off" lines. The y-axis of these charts has been limited, so very large z-scores appear to extend beyond the chart boundary.

4
SD 9.17.05
4. PTA and Technical Advisor’s Comments 4.1. Metrological Traceability and Measurement Uncertainty of Assigned Values Consensus values (median) derived from participants’ results are used in this program. These values are not metrologically traceable to an external reference. Sample preparation was undertaken according to Environmental Resource Associates’ Standard Operating Procedures to ensure samples were fit-for-purpose, homogenous and stable. The sample R143 was expected to contain the following levels:
Analysis Biochemical Oxygen Demand
Chemical Oxygen Demand
Total Organic Carbon
Certified Value (mg/L) 111 179 70.8
The assigned value for this program is the median of the results submitted by the participants. The table below presents the median values and their calculated uncertainty, for the analyses performed. Analysis
Median (mg/L)
Uncertainty of the median (mg/L)
Biochemical Oxygen Demand 112.0 3.0
Chemical Oxygen Demand 173.0 2.8
Total Organic Carbon 71.20 0.88
The median values for all analyses are in good agreement with the expected values. Overall, the performance of participants in this round was good, with robust CVs comparable with those from previous programs and lower than 10% for Chemical Oxygen Demand and for Total Organic Carbon.

5
SD 9.17.05
4.2. Analysis of Round 143 Results 4.2.1. Biochemical Oxygen Demand (BOD) The following table compares the BOD median and robust CV from this round to those obtained in previous PTA rounds.
Round Sample Median (mg/L) Robust CV (%) Participan ts
This study R143 112.0 13.9 43
Report 722 R132 55.00 9.6 44
Report 654 1 68.40 19.7 56
The BOD testing was successfully carried out with satisfactory results (|z-score|≤2.0) ranging between 81 – 143 mg/L. Out of 43 participants, four questionable results (2.0<|z-score|<3.0) were reported (laboratories 263, 297, 442 and 529). Three outliers results (|z-score|≥3.0) were obtained, requiring follow-up action on behalf of participant laboratories 135, 239 and 460. Figure 1 exhibits the spread of results and the methods used for BOD testing in this round. The data set formed an approximately normal distribution and the vast majority of participants in this round used the APHA Part 5210 B method.
Biochemical Oxygen Demand (BOD) (mg/L) -R143
0
2
4
6
8
10
12
14
16
18
20
0 15 30 45 60 75 90 105 120 135 150 165 180 195
Results (mg/L)
Freq
uenc
y
APHA Part 5210 B
Other
Figure 1. Spread of results for BOD proficiency testing of sample R143, with a median of 112.0 mg/L. Participants’ investigations of BOD outlier results from previous programs revealed errors due to:
� Incorrect dilutions; � Failure to calibrate dissolved oxygen meters; � Transcription errors;

6
SD 9.17.05
� Contamination of dilution water; � Evaporation of water seals during incubation; � Seeding not used or seeds not properly activated when required; and � High dissolved oxygen in blank due to algae growth in plastic tubing.
Measurement Uncertainty Out of 43 participants, 33 (77%) submitted MU information. There is a large variety of MU values stated by participants, ranging from 0.387 to 30 mg/L. Several of the stated MUs did not accurately reflect the difference between the participant’s result and the median obtained for this proficiency sample. A t-test of results (outliers removed, 95% confidence interval) indicated the reproducibility for BOD in this round was 112.0 ± 35.1 mg/L. The MU stated by participants can be seen in Figure 2 below and gives an indication of the expected MU for these samples, based on the 95% confidence interval for overall reproducibility in this round.
Biochemical Oxygen Demand (BOD) MU (mg/L) - R14 3
0
1
2
3
4
5
6
7
8
9
0 3 6 9 12 15 18 21 24 27 30 33 36 39
MU (mg/L)
Fre
quen
cy APHA Part 5210 B
Figure 2. MU for BOD, as stated by participants, compared with 95% confidence interval for overall reproducibility (----) ( ±35.1 mg/L) in this round. Figure 3 below displays the BOD results and MU compared to the median. Also included are the reproducibility limits. Laboratories 124, 239, 297, 442, 444, 460, 529 and 549 may need to re-examine their MU calculations, as their result was further from the median than their stated uncertainty.

7
SD
9.17.05
Figure 3. Biochemical Oxygen Demand (BOD) - Results of Sample R143, including MU, compared to the median
Results of S
ample R
143, including MU
, compared to t
he median
Biochem
ical Oxygen D
emand (B
OD
) - Sam
ple R143
Biochemical Oxygen Demand (BOD) - Sample R143
10
30
50
70
90
110
130
150
170
190
210
230
112
126
129
131
141
157
181
214
227
231
239
297
301
315
316
319
356
400
407
416
419
421
426
442
444
460
488
499
509
517
529
542
549
Laboratory Code
Res
ult (
mg/
L)
Result ± MU Median Reproducibility Limits
8
SD 9.17.05
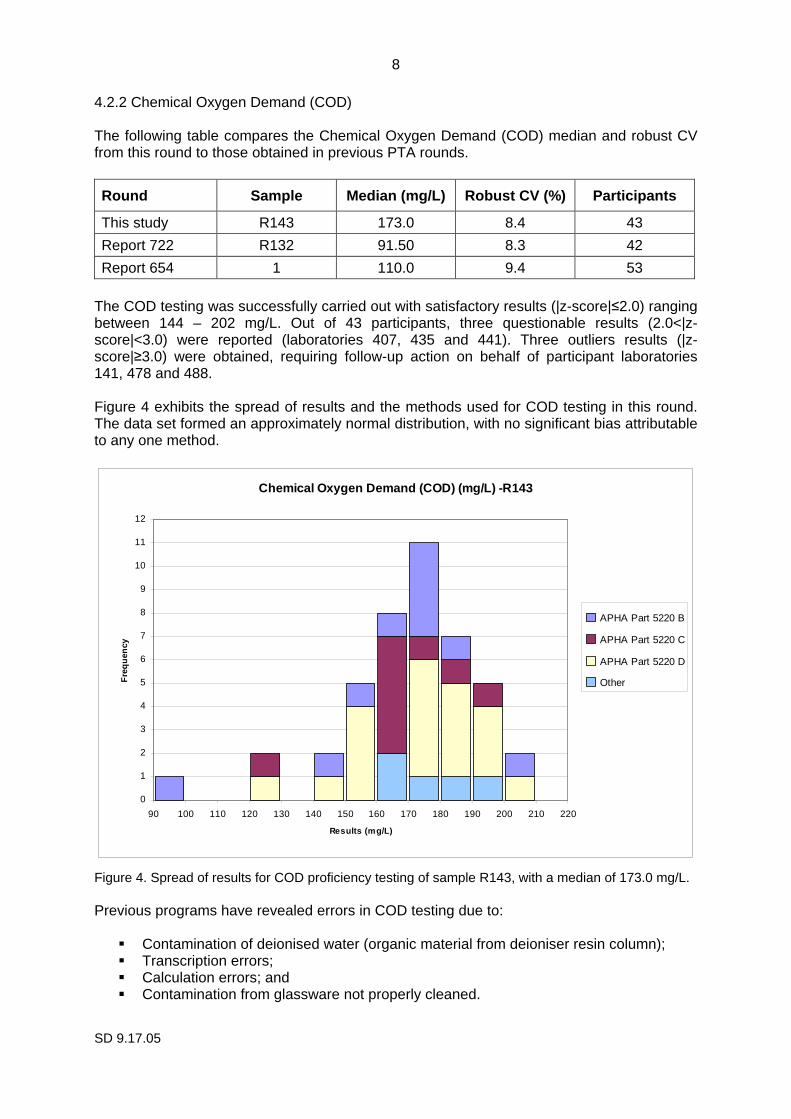
4.2.2 Chemical Oxygen Demand (COD) The following table compares the Chemical Oxygen Demand (COD) median and robust CV from this round to those obtained in previous PTA rounds.
Round Sample Median (mg/L) Robust CV (%) Participan ts
This study R143 173.0 8.4 43
Report 722 R132 91.50 8.3 42
Report 654 1 110.0 9.4 53
The COD testing was successfully carried out with satisfactory results (|z-score|≤2.0) ranging between 144 – 202 mg/L. Out of 43 participants, three questionable results (2.0<|z-score|<3.0) were reported (laboratories 407, 435 and 441). Three outliers results (|z-score|≥3.0) were obtained, requiring follow-up action on behalf of participant laboratories 141, 478 and 488. Figure 4 exhibits the spread of results and the methods used for COD testing in this round. The data set formed an approximately normal distribution, with no significant bias attributable to any one method.
Chemical Oxygen Demand (COD) (mg/L) -R143
0
1
2
3
4
5
6
7
8
9
10
11
12
90 100 110 120 130 140 150 160 170 180 190 200 210 220
Results (mg/L)
Fre
quen
cy
APHA Part 5220 B
APHA Part 5220 C
APHA Part 5220 D
Other
Figure 4. Spread of results for COD proficiency testing of sample R143, with a median of 173.0 mg/L. Previous programs have revealed errors in COD testing due to:
� Contamination of deionised water (organic material from deioniser resin column); � Transcription errors; � Calculation errors; and � Contamination from glassware not properly cleaned.

9
SD 9.17.05
Measurement Uncertainty Out of 43 participants, 32 (74%) submitted MU information. There is a large variety of MU values stated by participants, ranging from 1 to 46 mg/L. Several of the stated MUs did not accurately reflect the difference between the participant’s result and the median obtained for this proficiency sample. A t-test of results (outliers removed, 95% confidence interval) indicated the reproducibility for COD in this round was 173.0 ± 29.8 mg/L. The MU stated by participants can be seen in Figure 5 below, broken down by the methods used, and gives an indication of the expected MU for these samples, based on the 95% confidence interval for overall reproducibility in this round.
Chemical Oxygen Demand (COD) MU (mg/L) - R143
0
1
2
3
4
5
6
7
8
9
10
11
0 4 8 12 16 20 24 28 32 36 40 44 48 52
MU (mg/L)
Fre
quen
cy
APHA Part 5220 B
APHA Part 5220 C
APHA Part 5220 D
Other
Figure 5. MU for COD, as stated by participants, compared with 95% confidence interval for overall reproducibility (----) ( ±29.8 mg/L) in this round. Figure 6 below displays the COD results and MU compared to the median. Also included are the reproducibility limits. Laboratories 141, 181, 227, 231, 239, 315, 316, 334, 356, 488, 499 and 549 may need to re-examine their MU calculations, as their result was further from the median than their stated uncertainty.

10
SD
9.17.05
Figure 6. Chemical Oxygen Demand (COD) - Results of Sample R143, including MU, compared to the median
Results of S
ample R
143, including MU
, compared to t
he median
Chem
ical Oxygen D
emand (C
OD
) - Sam
ple R143
Chemical Oxygen Demand (COD) - Sample R143
90
110
130
150
170
190
210
230
250
270
112
126
129
131
141
157
181
214
227
231
239
297
301
315
316
319
334
356
400
407
419
421
426
442
444
459
460
488
499
509
517
549
Laboratory Code
Res
ult (
mg/
L)
Result ± MU Median Reproducibility Limits

11
SD 9.17.05
4.2.3 Total Organic Carbon (TOC) The following table compares the Total Organic Carbon (TOC) median and robust CV from this round to those obtained in previous PTA rounds.
Round Sample Median (mg/L) Robust CV (%) Participan ts
This study R143 71.20 5.2 28
Report 722 R132 36.45 4.3 24
Report 654 1 43.85 5.2 28
The TOC testing was successfully carried out with satisfactory results (|z-score|≤2.0) ranging between 63.8 – 78.6 mg/L. Out of 28 participants, three questionable results (2.0<|z-score|<3.0) were reported (laboratories 231, 419 and 460). Three outliers results (|z-score|≥3.0) were obtained, requiring follow-up action on behalf of participant laboratories 239, 421 and 486. Figure 7 exhibits the spread of results and the methods used for TOC testing in this round. The data set formed an approximately normal distribution, with no significant bias attributable to any one method. The majority of participants in this round used the APHA Part 5310 B method.
Total Organic Carbon (TOC) (mg/L) -R143
0
1
2
3
4
5
6
7
8
9
10
11
55 58 61 64 67 70 73 76 79 82 85 88 91 94
Results (mg/L)
Fre
quen
cy
APHA Part 5310 B
APHA Part 5310 C
APHA Part 5310 D
Other
>88
Figure 7. Spread of results for TOC proficiency testing of sample R143, with a median of 71.20 mg/L. Previous programs on TOC have revealed errors due to:
� Calibration standards; � Incorrect dilutions; � Transcription errors; and � Instrument malfunctions.

12
SD 9.17.05
Measurement Uncertainty Out of 28 participants, 19 (68%) submitted MU information. There is a large variety of MU values stated by participants, ranging from 1 to 17.8 mg/L. Several of the stated MUs did not accurately reflect the difference between the participant’s result and the median obtained for this proficiency sample. A t-test of results (outliers removed, 95% confidence interval) indicated the reproducibility for TOC in this round was 71.20 ± 8.95 mg/L. The MU stated by participants can be seen in Figure 8 below, broken down by the methods used and gives an indication of the expected MU for these samples, based on the 95% confidence interval for overall reproducibility in this round.
Total Organic Carbon (TOC) MU (mg/L) - R143
0
1
2
3
4
5
6
0 1.5 3 4.5 6 7.5 9 10.5 12 13.5 15 16.5 18 19.5
MU (mg/L)
Freq
uenc
y
APHA Part 5310 B
APHA Part 5310 C
APHA Part 5310 D
Other
Figure 8. MU for TOC, as stated by participants, compared with 95% confidence interval for overall reproducibility (----) ( ±8.95 mg/L) in this round. Figure 9 below displays the TOC results and MU compared to the median. Also included are the reproducibility limits. Laboratories 239, 315, 419, 421, 460 and 529 may need to re-examine their MU calculations, as their result was further from the median than their stated uncertainty.

13
SD
9.17.05
Figure 9. Total Organic Carbon (TOC) - Results of Sample R143, including MU, compared to the median
Results of S
ample R
143, including MU
, compared to t
he median
Total O
rganic Carbon (T
OC
) - Sam
ple R143
Total Organic Carbon (TOC) - Sample R143
40
50
60
70
80
90
100
129
131
239
263
301
315
316
319
385
400
419
421
442
444
460
499
509
517
529
Laboratory Code
Res
ult (
mg/
L)
Result ± MU Median Reproducibility Limits

14
SD 9.17.05
4.3. Analysis of Results by Method Groups Further analysis of results by method groups is undertaken to provide specific information on individual method performance. In order for methods to be grouped for analysis, PTA requires more than ten sets of results from the same method group. For methods other than those presented below, there were less than ten results submitted, therefore reliable conclusions cannot be drawn from analysing them separately and these results have not been analysed by grouped methods. 4.3.1. Biochemical Oxygen Demand (BOD) The method APHA Part 5210B - method code 1 was most frequently employed for BOD analysis, with 41 laboratories indicating the use of this method and only two laboratories indicating other methods. The table below presents the median and normalised IQR of BOD results obtained by method 1.
Sample Method code Participants Median (mg/L) Robus t CV (%)
Potable 1 1 41 112.0 13.2
4.3.2. Chemical Oxygen Demand (COD) For COD analysis, the majority of participants (38 out of 43) used various APHA protocols. The method APHA Part 5220D - method code 6 was most frequently employed, with 19 laboratories indicating the use of this method. The table below presents the median and normalised IQR of COD results obtained by method 6.
Sample Method code Participants Median (mg/L) Robus t CV (%)
Potable 1 6 19 178.0 11.0
4.3.3. Total Organic Carbon (TOC) For TOC analysis, the majority of participants (24 out of 28) used various APHA protocols. The method APHA Part 5310B - method code 12 was most frequently employed, with 18 laboratories indicating the use of this method. The table below presents the median and normalised IQR of TOC results obtained by method 12.
Sample Method code Participants Median (mg/L) Robus t CV (%)
Potable 1 12 18 70.80 4.4

15
SD 9.17.05
5. Outlier Results
Laboratories reporting outlier results are listed in the following table:
Analysis Lab
Code Biochemical Oxygen Demand
Chemical Oxygen Demand
Total Organic Carbon
135 §
141 §
239 § §
421 §
460 §
478 §
486 §
488 §
1 A “§” indicates the occurrence of a z-score outlier result (i.e. those results for which
|z-score|≥3.0). 6. Reference
[1] Guide to Proficiency Testing Australia, 2012 (This document can be found on the PTA website, www.pta.asn.au)

SD 9.17.05
APPENDIX A
Results and Data Analysis Biochemical Oxygen Demand (BOD).................................................................................... A1
Chemical Oxygen Demand (COD) ........................................................................................ A4
Total Organic Carbon (TOC) ................................................................................................. A7

SD 9.17.05
Biochemical Oxygen Demand (BOD) Results
Sample R143

A1
SD 9.17.05
Biochemical Oxygen Demand (BOD)
Results by Laboratory Code
Sample R143
Lab Code
Result ± MU1 (mg/L)
Robust z-score2
Method Code3
112 118 ± 20 0.39 1
126 124 ± 11.4328 0.77 1
129 112 ± 18 0.00 1
131 112 ± 22 0.00 1
135 20.0 # -5.92 § 1
141 122 ± 11 0.64 1
147 84 # -1.80 3
157 114 ± 15 0.13 1
181 120 ± 15 0.52 1
203 102 # -0.64 1
214 97.1 ± 18.1 -0.96 1
227 99.0 ± 25 -0.84 1
231 108.8 ± 9.5 -0.21 1
239 39 ± 1 -4.70 § 1
242 121 # 0.58 3
263 67.4 # -2.87 1
297 68 ± 11 -2.83 1
301 117 ± 15 0.32 1
315 116 ± 11.7 0.26 1
316 125 ± 18 0.84 1
319 100 ± 17.4 -0.77 1
356 114 ± 6 0.13 1
398 90 # -1.42 1
400 125 ± 25 0.84 1
407 122 ± 29.8 0.64 1
416 102 ± 14.7 -0.64 1
417 114 # 0.13 1
419 117 ± 12 0.32 1
421 111 ± 17 -0.06 1 1 Where reported, results are shown with their corresponding
measurement uncertainty (MU). 2 "§"s denote outliers (i.e. those results for which |z-score| ≥ 3.0). Robust
z-scores are calculated as: z = (A - median) ÷ normalised IQR, where A is the participant laboratory's result.
3 Please refer to Appendix C (page C3) for method code descriptions.

A2
SD 9.17.05
Biochemical Oxygen Demand (BOD)-cont.
Results by Laboratory Code
Sample R143
Lab Code
Result ± MU1 (mg/L)
Robust z-score2
Method Code3
426 134 ± 25 1.42 1
435 81 # -2.00 1
441 106 # -0.39 1
442 150 ± 22 2.45 1
444 81.0 ± 14.6 -2.00 1
447 119 # 0.45 1
460 182 ± 30 4.51 § 1
488 119 ± 23.8 0.45 1
499 111.720 ± 0.387 -0.02 1
509 109 ± 28 -0.19 1
517 105 ± 18.0 -0.45 1
529 78.5 ± 9.7 -2.16 1
542 116 ± 23 0.26 1
549 96 ± 12 -1.03 1
No of Results: 43
Median: 112.0
Uncertainty of the Median:
3.0
Normalised IQR:
15.5
Robust CV: 13.9%
Minimum: 20.0
Maximum: 182
Range: 162.0
1 Where reported, results are shown with their corresponding
measurement uncertainty (MU). 2 "§"s denote outliers (i.e. those results for which |z-score| ≥ 3.0).
Robust z-scores are calculated as: z = (A - median) ÷ normalised IQR, where A is the participant laboratory's result.
3 Please refer to Appendix C (page C3) for method code descriptions.

SD 9.17.05
Biochemical Oxygen Demand (BOD) - Sample R143 - Rob ust Z-Scores
Robust Z-Scores
Ordered R
obust Z-S
core Charts
A3
Biochem
ical Oxygen D
emand (B
OD
) - Sam
ple R143
297 52
9
435
444
147 39
8 227
319
416
517
441
231
509
421
214
549 20
3
263
239
135
129
499
-5
-4
-3
-2
-1
0
1
2
3
4
5
lab code
z-sc
ore
417
315
542
301
419
112
181
242
407
126
316
400 42
6
442
460
131
157
356 14
1
447
488
-5
-4
-3
-2
-1
0
1
2
3
4
5
lab code
z-sc
ore

SD 9.17.05
Chemical Oxygen Demand (COD) Results
Sample R143

A4
SD 9.17.05
Chemical Oxygen Demand (COD)
Results by Laboratory Code
Sample R143
Lab Code
Result ± MU1 (mg/L)
Robust z-score2
Method Code3
112 177 ± 5 0.27 6
126 170 ± 15.572 -0.21 4
129 191 ± 23 1.23 6
131 163 ± 16 -0.68 5
141 122 ± 5 -3.49 § 6
147 166 # -0.48 11
157 187 ± 15 0.96 4
181 200 ± 10 1.85 11
203 171 # -0.14 4
214 176 ± 15.1 0.21 5
227 193 ± 16 1.37 6
231 150 ± 16 -1.57 6
239 192 ± 1 1.30 6
242 177 # 0.27 11
258 166 # -0.48 11
263 181 # 0.55 6
297 170 ± 28 -0.21 5
301 178 ± 22 0.34 6
315 159 ± 11.5 -0.96 6
316 152 ± 19 -1.44 6
319 171 ± 25.7 -0.14 4
334 158 ± 3 -1.03 6
356 155 ± 3 -1.23 6
398 175 # 0.14 4
400 192 ± 29 1.30 5
407 209 ± 38.8 2.46 6
417 162 # -0.75 5
419 170 ± 25.5 -0.21 5
421 173 ± 1.7 0.00 6 1 Where reported, results are shown with their corresponding
measurement uncertainty (MU). 2 "§"s denote outliers (i.e. those results for which |z-score| ≥ 3.0). Robust
z-scores are calculated as: z = (A - median) ÷ normalised IQR, where A is the participant laboratory's result.
3 Please refer to Appendix C (page C3) for method code descriptions.

A5
SD 9.17.05
Chemical Oxygen Demand (COD)-cont.
Results by Laboratory Code
Sample R143
Lab Code
Result ± MU1 (mg/L)
Robust z-score2
Method Code3
426 182 ± 15 0.62 11
435 143 # -2.05 4
441 205 # 2.19 4
442 182 ± 22 0.62 6
444 158 ± 15.8 -1.03 4
447 180 # 0.48 6
459 170 ± 17.6 -0.21 5
460 173 ± 10 0.00 6
478 90.3 # -5.66 § 4
488 129 ± 25.8 -3.01 § 5
499 182.412 ± 2.295 0.64 5
509 184 ± 46 0.75 6
517 180 ± 14.0 0.48 4
549 186 ± 12.9 0.89 6
No of Results: 43
Median: 173.0
Uncertainty of the Median:
2.8
Normalised IQR:
14.6
Robust CV: 8.4%
Minimum: 90.3
Maximum: 209
Range: 118.7
1 Where reported, results are shown with their corresponding
measurement uncertainty (MU). 2 "§"s denote outliers (i.e. those results for which |z-score| ≥ 3.0).
Robust z-scores are calculated as: z = (A - median) ÷ normalised IQR, where A is the participant laboratory's result.
3 Please refer to Appendix C (page C3) for method code descriptions.

SD 9.17.05
Chemical Oxygen Demand (COD) - Sample R143 - Robust Z-Scores
Robust Z-Scores
Ordered R
obust Z-S
core Charts
A6
Chem
ical Oxygen D
emand (C
OD
) - Sam
ple R143
435 23
1
316
356
334
444 13
1
147
126
297
419
459
203
319
417
315 25
8
488
141
478
460
421
-5
-4
-3
-2
-1
0
1
2
3
4
5
lab code
z-sc
ore
242
301
447
517
263
426
509
549 12
9
239
400
227 18
1 441
407
398
214
112 15
7
442
499
-5
-4
-3
-2
-1
0
1
2
3
4
5
lab code
z-sc
ore

SD 9.17.05
Total Organic Carbon (TOC) Results
Sample R143

A7
SD 9.17.05
Total Organic Carbon (TOC)
Results by Laboratory Code
Sample R143
Lab Code
Result ± MU1 (mg/L)
Robust z-score2
Method Code3
126 70.8 # -0.11 12 129 68.9 ± 6.9 -0.62 12 131 73.1 ± 7.3 0.51 14 154 65.3 # -1.58 12 203 69.5 # -0.46 17 231 79.2 # 2.15 17 239 91 ± 1 5.32 § 13 263 72.6 ± 3.898 0.38 12 301 71.9 ± 9.0 0.19 13 315 67.9 ± 1.30 -0.89 12 316 71.8 ± 4.8 0.16 12 319 66.1 ± 7.21 -1.37 12 385 67.1 ± 12 -1.10 12 400 71.2 ± 10.7 0.00 12 417 71.5 # 0.08 12 419 80.6 ± 7 2.52 12 421 58.3 ± 9.9 -3.46 § 12 435 65.0 # -1.66 13 442 68 ± 10 -0.86 12 444 74.7 ± 5.98 0.94 13 447 74 # 0.75 12 460 61 ± 5 -2.74 13 478 71.2 # 0.00 12 486 490.30 # 112.51 § 17 499 72.410 ± 1.422 0.32 17 509 71.4 ± 17.8 0.05 12 517 70.8 ± 1.2 -0.11 12 529 65.3 ± 1 -1.58 12
No of Results: 28
Median: 71.20
Uncertainty of the Median:
0.88
Normalised IQR:
3.73
Robust CV: 5.2%
Minimum: 58.3
Maximum: 490.30
Range: 432.00 1 Where reported, results are shown with their corresponding
measurement uncertainty (MU). 2 "§"s denote outliers (i.e. those results for which |z-score| ≥ 3.0).
Robust z-scores are calculated as: z = (A - median) ÷ normalised IQR, where A is the participant laboratory's result.
3 Please refer to Appendix C (page C3) for method code descriptions.

SD 9.17.05
Total Organic Carbon (TOC) - Sample R143 - Robust Z -Scores
Ordered R
obust Z-S
core Charts
A8
Total O
rganic Carbon (T
OC
) - Sam
ple R143
154
529
319
385
315
442 12
6
517
478
509
417
316
301
499 44
7
444
231 41
9
239
486
203
129
400
435
460
421
131
263
-5
-4
-3
-2
-1
0
1
2
3
4
5
lab code
z-sc
ore

SD 9.17.05
APPENDIX B
Sample Homogeneity and Stability

B1
SD 9.17.05
Homogeneity and Stability Testing Samples for this program were obtained from the Environmental Resource Associates (ERA). As such, all samples are subjected to rigorous stability and homogeneity testing. On the basis of this testing, the ampoules utilised for this program were considered to be homogeneous and stable.

SD 9.17.05
APPENDIX C
Documentation
Instructions to Participants ................................................................................................... C1
Method Codes ...................................................................................................................... C3
Results Sheet ....................................................................................................................... C4

C1
SD 9.17.05
PROFICIENCY TESTING AUSTRALIA
WATERS PROFICIENCY TESTING PROGRAM
CHEMICAL ANALYSIS ROUND 143 May, 2012 Biochemical Oxygen Demand (BOD) Chemical Oxygen Demand (COD) Total Organic Carbon (TOC)
INSTRUCTIONS TO PARTICIPANTS
**Please record (on the Results Sheet) the approximate temperat ure of the samples upon receipt**
Please note the following before commencing the analysis of the samples. 1. Samples
i) One sealed vial supplied by Environmental Resource Associates (ERA). The vial contains BOD, COD, TOC concentrates.
ii) The sample must be thoroughly mixed prior to analysis.
iii) The vial will require 200-fold dilution in reagent grade water.
Please Note: Where possible, proficiency testing samples should be treated as a routine
laboratory sample. 2. Sample Preparation Caution: Analysis must begin immediately after vial is opened.
i) Adjust vial temperature to 20º C. ii) Add approximately 100 - 200 millilitres (mL) deionised water to a one-litre volumetric
flask. iii) Shake the vial prior to opening. iv) Using a volumetric pipette, volumetrically transfer 5.0 mL of the concentrate into the
1000 mL volumetric flask. v) Dilute the flask to final volume with deionised water. vi) Cap the flask and mix contents well. vii) Immediately analyse the diluted sample by your normal procedures. viii) Report your result as mg/L for the diluted sample .
C2
SD 9.17.05
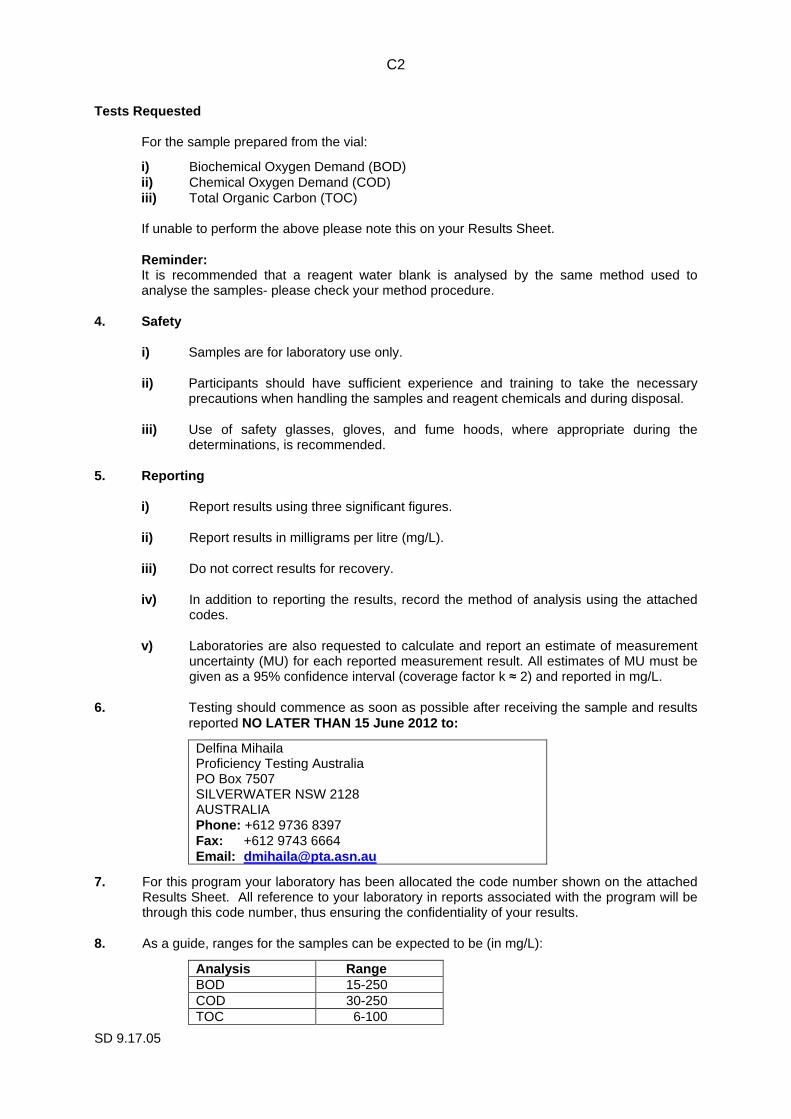
Tests Requested For the sample prepared from the vial:
i) Biochemical Oxygen Demand (BOD) ii) Chemical Oxygen Demand (COD) iii) Total Organic Carbon (TOC) If unable to perform the above please note this on your Results Sheet. Reminder: It is recommended that a reagent water blank is analysed by the same method used to analyse the samples- please check your method procedure.
4. Safety i) Samples are for laboratory use only. ii) Participants should have sufficient experience and training to take the necessary
precautions when handling the samples and reagent chemicals and during disposal. iii) Use of safety glasses, gloves, and fume hoods, where appropriate during the
determinations, is recommended. 5. Reporting
i) Report results using three significant figures.
ii) Report results in milligrams per litre (mg/L). iii) Do not correct results for recovery. iv) In addition to reporting the results, record the method of analysis using the attached
codes.
v) Laboratories are also requested to calculate and report an estimate of measurement uncertainty (MU) for each reported measurement result. All estimates of MU must be given as a 95% confidence interval (coverage factor k ≈ 2) and reported in mg/L.
6. Testing should commence as soon as possible after receiving the sample and results
reported NO LATER THAN 15 June 2012 to:
Delfina Mihaila Proficiency Testing Australia PO Box 7507 SILVERWATER NSW 2128 AUSTRALIA Phone: +612 9736 8397 Fax: +612 9743 6664 Email: [email protected]
7. For this program your laboratory has been allocated the code number shown on the attached Results Sheet. All reference to your laboratory in reports associated with the program will be through this code number, thus ensuring the confidentiality of your results.
8. As a guide, ranges for the samples can be expected to be (in mg/L):
Analysis Range BOD 15-250 COD 30-250 TOC 6-100

C3
SD 9.17.05
Method Codes to be used for the Results Sheet
ANALYSIS METHOD DESCRIPTION
METHOD REFERENCE CODE
APHA APHA Part 5210 B 1
US EPA US EPA 0405.1 2
Biochemical Oxygen Demand (BOD)
Other Other (please specify) 3
APHA Part 5220 B 4
APHA Part 5220 C 5
APHA
APHA Part 5220 D 6
US EPA 0410.1 7
US EPA 0410.2 8
US EPA 0410.3 9
US EPA
US EPA 0410.4 10
Chemical Oxygen Demand (COD)
Other
Other (please specify)
11
APHA Part 5310 B 12
APHA Part 5310 C 13
APHA
APHA Part 5310 D 14
US EPA 0415.1 15 US EPA
US EPA 0415.2 16
Total Organic Carbon (TOC)
Other Other (please specify) 17
Method Reference Key
i) APHA APHA “Standard Methods for the Examination of Water and Wastewater” 19th Edition (1995), 20th Edition (1998), 21st Edition (2005).
ii) USEPA USEPA 600/4 – 79 – 020.
C4
SD 9.17.05
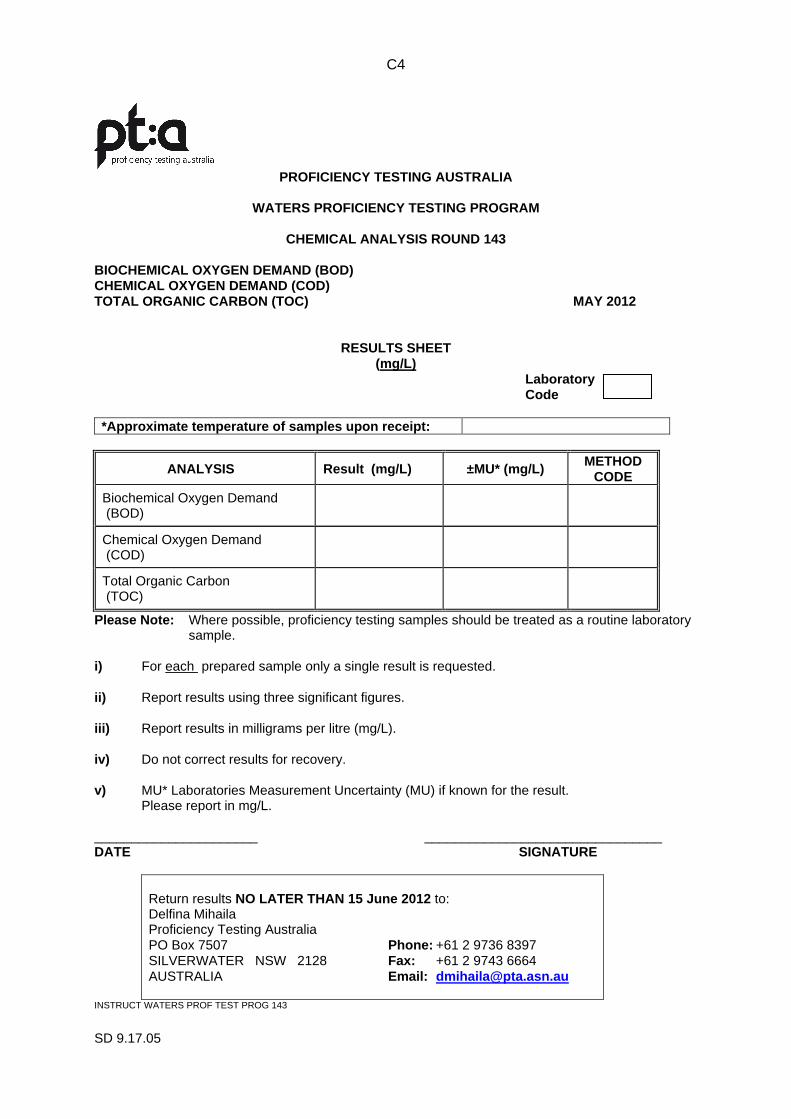
PROFICIENCY TESTING AUSTRALIA
WATERS PROFICIENCY TESTING PROGRAM
CHEMICAL ANALYSIS ROUND 143
BIOCHEMICAL OXYGEN DEMAND (BOD) CHEMICAL OXYGEN DEMAND (COD) TOTAL ORGANIC CARBON (TOC) MAY 2012
RESULTS SHEET (mg/L)
Laboratory Code *Approximate temperature of samples upon receipt:
ANALYSIS Result (mg/L) ±MU* (mg/L) METHOD CODE
Biochemical Oxygen Demand (BOD)
Chemical Oxygen Demand (COD)
Total Organic Carbon (TOC)
Please Note: Where possible, proficiency testing samples should be treated as a routine laboratory sample.
i) For each prepared sample only a single result is requested.
ii) Report results using three significant figures.
iii) Report results in milligrams per litre (mg/L).
iv) Do not correct results for recovery.
v) MU* Laboratories Measurement Uncertainty (MU) if known for the result. Please report in mg/L. ______________________ ________________________________ DATE SIGNATURE
Return results NO LATER THAN 15 June 2012 to: Delfina Mihaila Proficiency Testing Australia PO Box 7507 Phone: +61 2 9736 8397 SILVERWATER NSW 2128 Fax: +61 2 9743 6664 AUSTRALIA Email: [email protected]
INSTRUCT WATERS PROF TEST PROG 143

SD 9.17.05
- End of Report -