
REPORT Industrial Land Study - surrey.ca Campbell Heights Industrial Land... · REPORT Industrial...
57
REPORT Industrial Land Study South Campbell Heights & South of Fraser Region Prepared By: Colliers International Consulting Prepared For: The City of Surrey
Transcript of REPORT Industrial Land Study - surrey.ca Campbell Heights Industrial Land... · REPORT Industrial...

REPORT
Industrial Land Study South Campbell Heights & South of
Fraser Region
Prepared By:
Colliers International Consulting
Prepared For:
The City of Surrey

South Campbell Heights Industrial Land Study | 2
Mr. Don Luymes Manager, Community Planning City of Surrey 13450 104 Avenue Surrey, BC V3T 1V8
April 27, 2016 Dear Don, Re: Report – South Campbell Heights Industrial Land Study Please find enclosed Colliers International Consulting’s South Campbell Heights Industrial Land Study which examines industrial demand and supply in the region as well as opportunities unique to South Campbell Heights. If you have any questions, please contact us at the phone number or email address below. Sincerely, COLLIERS INTERNATIONAL CONSULTING
James Smerdon Vice President, Director | Retail Consulting +1 (604) 685 4808 [email protected]
Sabrina SpeianuConsultant +1 (604) 661 0864 [email protected]
Colliers International200 Granville Street, 19th Floor
Vancouver, BC V6C 2R6
South Campbell Heights Industrial Land Study | 3
Notice The information contained in this document has been obtained from sources deemed reliable. While every effort has been made to ensure its accuracy, Colliers International cannot guarantee it. Colliers International assumes no responsibility for any inaccuracies in this information.
This document is only intended for the City of Surrey.
No part of this document may be reproduced or transmitted in any form or by any means, electronic or mechanical, for any purpose, without the expressed written permission of Colliers International.
Copyright 2016 Colliers International.
South Campbell Heights Industrial Land Study | 4
Table of Contents 1 | Executive Summary ............................................................................................................................................................................................................................ 10
2 | Supply Analysis .................................................................................................................................................................................................................................. 15
2.1 | South of Fraser Industrial Lands ................................................................................................................................................................................................ 15
2.2 | Vacant Inventory by Municipality & Treaty Lands ..................................................................................................................................................................... 16
3 | Demand Forecast ............................................................................................................................................................................................................................... 34
3.1 | Historical Construction Activity and Land Absorption ............................................................................................................................................................... 38
3.2 | Historical Land Sales Activity ..................................................................................................................................................................................................... 43
3.3 | Employment-Driven Demand ..................................................................................................................................................................................................... 45
3.4 | Land Demand Conclusions ......................................................................................................................................................................................................... 47
4 | Agro-Industrial Opportunities in South Campbell Heights ............................................................................................................................................................... 49
5 | Conclusions ......................................................................................................................................................................................................................................... 53
Appendix 1 – Industrial Land Use Classifications ................................................................................................................................................................................... 55
Appendix 2 – Industry Feedback Highlights ........................................................................................................................................................................................... 56

South Campbell Heights Industrial Land Study | 5
Figures Figure 1 Vacant Industrial Inventory by Municipality ............................................................................................................................................................................. 16
Figure 2 South of Fraser vs Other Lower Mainland Industrial Building Inventory Constructed ....................................................................................................... 40
Figure 3 South of Fraser vs Other Lower Mainland Industrial Land Absorbed ................................................................................................................................... 41
Figure 4 Campbell Heights vs Other Surrey Industrial Building Inventory Constructed ..................................................................................................................... 42
Figure 5 Campbell Heights vs Other Surrey Industrial Land Absorbed ............................................................................................................................................... 42
Figure 6 South of Fraser vs Other Lower Mainland Industrial Land Sales ......................................................................................................................................... 43
Figure 7 South of Fraser vs Other Lower Mainland Proportion of Industrial Land Sales .................................................................................................................. 44
Figure 8 Langley and Delta Industrial Land Sales ................................................................................................................................................................................. 44
Figure 9 Surrey and Campbell Heights Industrial Land Sales .............................................................................................................................................................. 45
Figure 10 Kerr Avenue Business Park Brochure Site Plan ................................................................................................................................................................... 49

South Campbell Heights Industrial Land Study | 6
Maps Map 1 Study Area ...................................................................................................................................................................................................................................... 11
Map 2 Regional Distribution of Vacant Industrial Lots by Size ............................................................................................................................................................ 20
Map 3 TFN Lands Inventory Map ............................................................................................................................................................................................................ 21
Map 4 Boundary Bay & Surrounding Area Inventory Map ...................................................................................................................................................................22
Map 5 Tilbury Area Inventory Map ......................................................................................................................................................................................................... 23
Map 6 Annacis Island Inventory Map ...................................................................................................................................................................................................... 24
Map 7 Bridgeview Inventory Map ........................................................................................................................................................................................................... 25
Map 8 Newton Inventory Map ................................................................................................................................................................................................................. 26
Map 9 East Newton/Panorama Inventory Map ...................................................................................................................................................................................... 27
Map 10 Highway 99 Corridor Inventory Map ......................................................................................................................................................................................... 28
Map 11 Campbell Heights Inventory Map ................................................................................................................................................................................................ 29
Map 12 Cloverdale & Mufford/Bypass Inventory Map ........................................................................................................................................................................... 30
Map 13 Port Kells/Anniedale/Carvolth Inventory Map ........................................................................................................................................................................... 31
Map 14 Aldergrove Inventory Map .......................................................................................................................................................................................................... 32
Map 15 Gloucester Inventory Map ........................................................................................................................................................................................................... 33

South Campbell Heights Industrial Land Study | 7
Map 16 Land Parcels Absorbed Through Construction ......................................................................................................................................................................... 39

South Campbell Heights Industrial Land Study | 8
Tables Table 1 South of Fraser Land Use Summary ......................................................................................................................................................................................... 16
Table 2 South of Fraser Industrial ‘Vacant’ Land Inventory by Location and Constraints .................................................................................................................. 17
Table 3 South of Fraser Industrial Lands ‘Uses Likely to Develop’ and ‘Vacant Port Lands’ Inventory by Location and Constraints ............................................ 17
Table 4 South of Fraser Industrial Lands ‘Agriculture’ and ‘Residential Uses’ Inventory by Location and Constraints ................................................................... 17
Table 5 South of Fraser Vacant and Unconstrained Industrial Land Inventory by Lot Size ............................................................................................................... 18
Table 6 South of Fraser Vacant, Agricultural and Residential-Use Unconstrained Industrial Land Inventory .................................................................................. 18
Table 7 Surrey Vacant and Unconstrained Industrial Land Inventory by Lot Size .............................................................................................................................. 19
Table 8 Surrey Vacant, Agricultural and Residential-Use Unconstrained Industrial Land Inventory ................................................................................................. 19
Table 9 Large Scale Logistics Facility Land Demand ............................................................................................................................................................................ 35
Table 10 RealNet Industrial Land Sales 2008-2012 .............................................................................................................................................................................. 36
Table 11 Net Change in Developed Industrial Land 2005-2010 ............................................................................................................................................................ 36
Table 12 Employment Land Demand, City of Surrey ............................................................................................................................................................................. 37
Table 13 Employment Land Demand, City of Surrey ............................................................................................................................................................................. 37
Table 14 Industrial Land (acres) Absorbed through Construction Activity 2010 - 2015 .................................................................................................................... 38
Table 15a South of Fraser Industrial Land Demand by Employment Growth ...................................................................................................................................... 46

South Campbell Heights Industrial Land Study | 9
Table 16 Cumulative South of Fraser Land Demand and Absorption Timeline Summary .................................................................................................................. 47
Table 17 Cumulative Surrey Land Demand and Absorption Timeline Summary ................................................................................................................................. 47

South Campbell Heights Industrial Land Study | 10
1 | Executive Summary
Introduction
In late 2015 the City of Surrey was investigating the possibility of re-designating lands south of Campbell Heights to industrial. These lands, while currently zoned and used for agricultural purposes, are not in the Agricultural Land Reserve (ALR) and lie just directly south of Surrey’s rapidly developing Campbell Heights industrial park. Given that demand for industrial lands have been increasing regionally as Port Metro Vancouver and the Lower Mainland have become a key distribution hub, and given that the supply of land has steadily dwindled and remains limited, the City of Surrey would like to explore the opportunity to cater to regional industrial land demand through the re-designation of the South Campbell Heights Lands.
The City of Surrey engaged Colliers International Consulting (CIC) to provide a summary of regional industrial land supply and demand forces which could either give credence to or refute this opportunity. This report makes use of a large array of land supply and demand information including Metro Vancouver’s updated 2015 industrial land inventory, various regional municipality business license and employment data, detailed land sales data, and detailed construction and land absorption data compiled by Colliers International.
This report investigates the following:
The existing supply of industrial lands within the South of Fraser Region (see Map 1) and the market suitability and timing of this supply; The demand for industrial lands in the South Fraser Region, estimated from historical construction activity and sales and projected employment
growth; and Opportunities unique to the South Campbell Heights area, such as agro-industrial opportunities.

South Campbell Heights Industrial Land Study | 11
Map 1 Study Area (shown in red)

South Campbell Heights Industrial Land Study | 12
Supply Analysis
In total, the South of Fraser Region contains approximately 12,660 acres of industrial land. Surrey contains 6,391 acres which represents 50 percent of total inventory in the study area. Of the total study area inventory, 2,086 acres, approximately 16 percent, is vacant, and an additional 976 acres is currently used for low-density residential or agricultural purposes, which are very likely to be redeveloped in the future. Within Surrey specifically, 1,228 acres are vacant, which represents 59 percent of vacant land in the study area. Surrey also contains an additional 770 acres of lands being used for low-density residential and agricultural purposes.
After accounting for constraints such as environmental sensitivity, unsuitable topography and poor configuration, the South of Fraser region contains approximately 1,864 acres of unconstrained vacant industrial lands. Surrey specifically contains 1,069 acres of unconstrained vacant industrial lands.
Approximately 31 percent of the region’s vacant and unconstrained land base (measured by acres) is suitable for small owner/occupiers desiring less than five acres of land. However, these small lots represent 80 percent of total lot count in the region. Only 40 lots remain which are suitable for small to medium sized manufacturers (5 to 10 acres), only 10 lots remain which are suitable for regional contractors, cold storage facilities, and smaller developers (10 to 15 acres), only 20 lots remain suitable for large manufacturers, transportation companies, and larger developers (15 to 30 acres), and only 8 lots remain for national and international logistics, e-commerce, manufacturing corporations, and large developers (more than 30 acres).
When adding in land currently used for residential and agricultural purposes, these numbers increase only modestly, and only two more lots greater than 30 acres are available. The City of Surrey itself contains approximately half of the lots in each category, and is also in short supply of larger lots. Barring significant efforts to consolidate the region’s fragmented industrial land parcels, very few options remain for larger industrial users/developers, which poses a significant competitive weakness for the region as a whole.
Demand Forecast
Since the region’s industrial land supply is so constrained, projecting actual demand proves to be a challenge as absorption is almost entirely supply-driven. However, Colliers used three methods to gauge future absorption of industrial land. The first measure assumes that absorption roughly mirrors the pace of industrial building construction and will continue at levels seen in recent history. The second measure assumes that absorption will closely mirror the recent pace of industrial land sales and will continue at levels seen in recent history. The third measure assumes that absorption will mirror planned industrial employment growth as cities put policies into action that will trigger industrial development based on their targeted employment goals. Each measure is not without weaknesses in its respective set of assumptions, however each also provides some insight as to the pacing of land demand in the region.
Based off of historical construction activity, the region has seen a pace of absorption of 73 to 122 acres per year, and Surrey itself has seen approximately 29 to 39 acres per year. This will result in a regional requirement of 1,825 to 3,050 acres of land by 2041, and a Surrey-specific requirement of 725 to 975 acres of land by 2041.

South Campbell Heights Industrial Land Study | 13
Based off of historical sales activity, the region has seen (arms-length only) sales of approximately 258 acres per year, and the City of Surrey has seen sales of 173 acres per year since 2000. This will result in a regional requirement of 6,450 acres by 2041 and a Surrey-specific requirement of 4,325 acres by 2041,
Based off of future expected employment growth, the region will require an additional 70 acres per year, and the City of Surrey will require approximately 44 acres per year. This will result in a regional requirement of 1,691 acres by 2041 and a Surrey-specific requirement of 1,100 acres by 2041.
In all measures except for sales activity (because this measure overestimates absorption due to resales), it appears as if the region and the City of Surrey has sufficient industrial lands to meet requirements until 2041. However, it should be noted that much of the region’s vacant land inventory consists of small fragmented parcels, whereas demand for land generally comes from larger users and developers (who act as intermediaries for smaller users who want a turn-key space solution). This is the most constrained segment of the market, and is the reason why numerous industry stakeholders are concerned about the region’s future land supply. Based on the above-mentioned absorption measures, the City of Surrey should ensure that approximately 30 to 50 acres of industrial land is available in any given year, and that this predominantly consists of larger lot sizes. Given tight supply in the region, Colliers foresees that lands in South Campbell Heights could be quickly absorbed soon after the Surrey City Development Corporation’s (SCDC’s) remaining lands in Campbell Heights North and subsequent project in Campbell Heights East are accounted for.
There remains an additional question of whether future demand for industrial land will be from business park or light industrial uses. Although data doesn’t currently exist to perfectly segregate users, anecdotal evidence suggests that light industrial uses are more supportable than business park uses within South Campbell Heights. Business park uses, which contain a greater component of office space, tend to have higher employment densities. South Campbell Heights will not be as competitive in attracting business park tenants due to its poor public transit connectivity. Municipalities such as Burnaby and Richmond are better poised to capture demand from this user category. However, initial plans for SCDC’s East Campbell Heights lands are supporting business park uses over light industrial uses due to the area’s environmental sensitivities and resulting irregular lot configurations. Should demand materialize for these lands, it is possible that South Campbell Heights could also see support for business park uses.
Agro-Industrial Opportunities in South Campbell Heights
Given South Campbell Heights’ opportune location- close to the U.S. border, active agricultural lands, an industrial park, and good connectivity to regional transportation corridors- it could be an opportunity to attract agro-industrial business. Agro-industrial users can be broken down into two cateogries: larger processors who generate greater revenue and require the full servicing available within traditional industrial parks; and smaller users who generally operate on-farm within the Agricultural Land Reserve (ALR) but some of which may be growing out of the ALR’s 50 percent rule in which 50 percent of processed materials must come from goods produced on the farm.

South Campbell Heights Industrial Land Study | 14
An opportunity exists to make land outside of the ALR and its associated constraints more affordable for the small and mid-sized processors in a way that supports this industry and preserves ALR land for primary agricultural production. However, fairness must also be considered as these processors will face lower land costs and less of a tax burden compared to similar operators existing in industrial parks. Additionally, it should be noted that a similar park in Chilliwack, which was specifically designated for food processing has seen very slow absorption since its launch in 2005. This could be attributed to its very narrow focus on a small market niche, which represents a threat that a similar park in South Campbell Heights could also face.
In summary, it is evident that the region’s industrial land supply is constrained, especially in land size categories desired by larger users. Should South Campbell Heights be designated as industrial, there is evidence to support steady absorption. An additional opportunity exists to designate the area for agro-industrial uses. However, this designation may result in a much slower pace of absorption.
Recommendations
As industrial demand in the region is largely supply-driven due to a shortage of suitable lands for mid-sized and large industrial users and developers, Colliers suggests integrating land supply considerations into the City’s industrial attraction and retention strategy. It should be noted that large industrial users have been known to leave land-constrained areas for areas with more availability as they need to expand, and some industrial users have bypassed the Lower Mainland entirely for other areas such as Kamloops and Calgary which have a greater availability of land. In this environment, ensuring developable land is available is key to attracting and retaining industrial businesses.
Additionally, industry feedback has pointed to a shortage of industrial lands available which allow for outdoor storage or truck parking. This is resulting in users which require these entitlements being willing to outbid industrial developers in areas such as Bridgeview and it is stunting the gradual redevelopment of the area. Colliers suggests reconsidering policies which heavily restrict or disallow outdoor storage or parking in industrial-only areas such as Campbell Heights, where interference with other land uses is minimal.
Finally, much of the region’s vacant industrial is fragmented into small parcels which are unsuitable for large-scale development and thus are locked-in to their current low-intensity uses. The undertaking of a large-scale assembly program by an entity such as SCDC, which can operate on a longer time horizon than a private developer, could be beneficial for the intensification of industrial lands in the long-term.

South Campbell Heights Industrial Land Study | 15
2 | Supply Analysis Colliers obtained access to Metro Vancouver’s draft 2015 Industrial Lands Inventory GIS data in order to compile the South of Fraser Industrial Lands inventory in this section. Included in the scope of the Metro Vancouver inventory are lands that have one or more of the following attributes:
Industrial or Mixed Employment designation in the Metro Vancouver Regional Growth Strategy Industrial designation in the relevant municipality’s Official Community Plan Industrial zoning (within all designations) Industrial use (within all designations)
Metro Vancouver has categorized their land inventory based on 23 types of land uses. The uses are listed in Appendix 1 for reference. For the purposes of this report, Colliers has focused its attention on parcels that are either vacant, or have uses likely to be redeveloped given industrial designation (for example, residential, agricultural, and outdoor storage uses within industrially designated lands). Colliers has also updated the data to reflect market conditions up to the end of March, 2016.
The following section first details the South of Fraser industrial lands by type of use and municipality, and then further investigates vacant lands by parcel size. The inventory in each submarket is then further quantified with qualitative commentary on the market readiness of particularly significant parcels.
2.1 | South of Fraser Industrial Lands
In total, the South of Fraser region contains approximately 12,660 acres of industrial land. The City of Surrey contains approximately half of this inventory (6,391 acres), followed by Delta (3,619 acres), the Township of Langley (2,115 acres), the Tsawwassen First Nations Treaty Lands (322 acres), and the City of Langley (214 acres). Of all the industrial lands in the region, approximately 2,086 acres (16 percent) are vacant. A further 1,829 acres (14 percent) contain uses that are the most likely to redevelop over time (outdoor storage & parking, resource extraction, agriculture, and residential).
Although providing development timing estimates is a tricky speculative endeavor, it is possible to categorize currently vacant lands as short- (within one year) to mid-term (within 10 years) prospects for development, and lands containing other uses which are likely to redevelop as being more mid- to long-term prospects. These uses have additional constraints that affect the timing of development such as zoning, existing productive uses, remediation needs, fragmentation of parcels, and owners with high price expectations. In particular, due to municipal bylaws, outdoor storage and truck parking sites are in such short supply in the region that, although favourably zoned and easy to redevelop, they are in high demand by users who are willing to bid prices past the point developers can justify. Table 1 summarizes these land uses by municipality across the region.

South Campbell Heights Industrial Land Study | 16
Table 1 South of Fraser Land Use Summary
Land Use Surrey Township of
Langley City of Langley
Delta Tsawwassen First Nations
Total
Vacant Uses Vacant Port Lands 0 0 0 34 0 34Vacant Land 1,228 275 0 291 291 2,086
Uses Likely to Redevelop Outdoor Storage & Parking 339 31 5 215 0 590Resource Extraction 57 0 0 206 0 263Agriculture 324 13 0 0 0 336Residential 446 184 6 4 0 640
Other Developed - Industrial and Non-Industrial Uses 3,998 1,612 203 2,868 31 8,711Total 6,391 2,115 214 3,619 322 12,660
2.2 | Vacant Inventory by Municipality & Treaty Lands
In total, the South of Fraser region contains 2,086 acres of vacant industrial lands (excluding vacant port lands and existing uses likely to redevelop). The City of Surrey currently holds approximately 59 percent of vacant industrial land inventory. The Tsawwassen First Nations Lands, The Corporation of Delta, and the Township of Langley each have a similar amount of vacant lands remaining, with 14 percent, 14 percent and 13 percent, respectively.
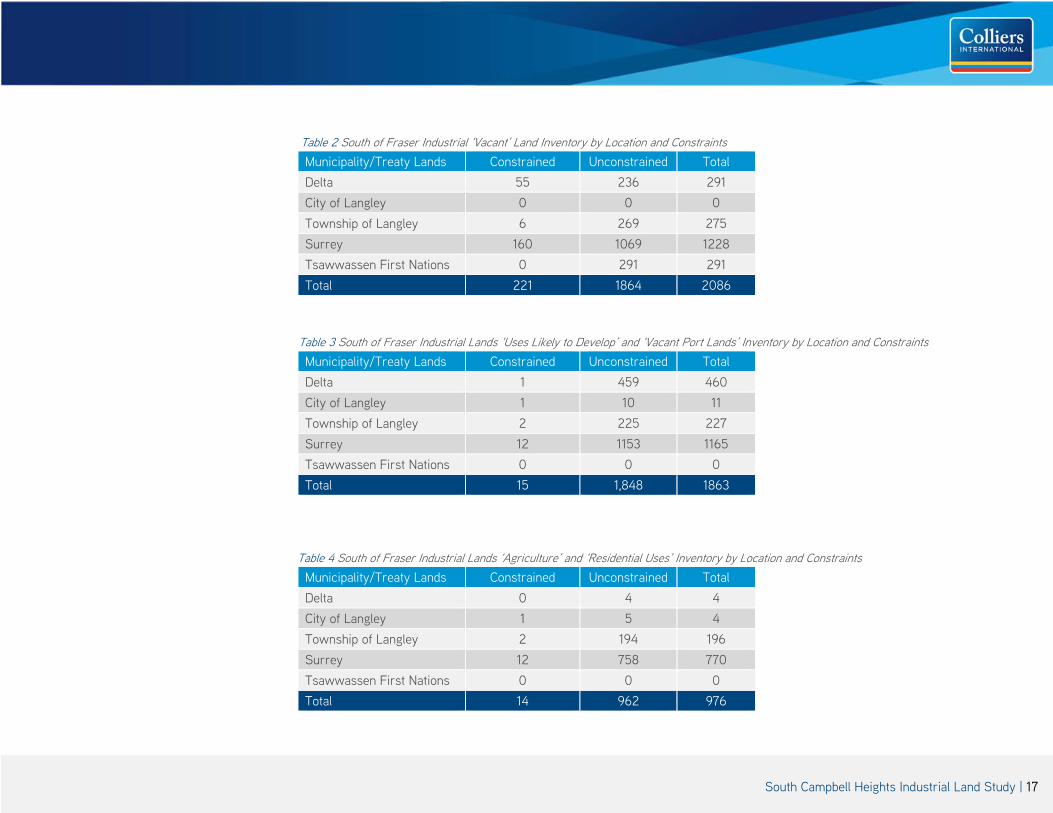
Colliers has identified several obvious development constraints such as unsuitable topography, undesirable configuration and environmental sensitivity which affect a further 221 acres of this inventory (see Table 2). In this modification, Colliers has assumed that constraints such as servicing and government-ownership can be mitigated in the mid- to long-term. Table 2 breaks down the remaining 1,864 acres of vacant and unconstrained industrial lands by municipality. Tables 3 and 4 further drill down into all uses likely to redevelop and then agricultural and residential uses specifically.
Delta291 acres
14%
City of Langley0 acres0%
Township of Langley275 acres
13%
Surrey1228 acres
59%
Tsawwassen First Nations291 acres
14%
Figure 1 Vacant Industrial Inventory by Municipality
South Campbell Heights Industrial Land Study | 17
Table 2 South of Fraser Industrial ‘Vacant’ Land Inventory by Location and Constraints Municipality/Treaty Lands Constrained Unconstrained Total Delta 55 236 291 City of Langley 0 0 0 Township of Langley 6 269 275 Surrey 160 1069 1228 Tsawwassen First Nations 0 291 291 Total 221 1864 2086
Table 3 South of Fraser Industrial Lands ‘Uses Likely to Develop’ and ‘Vacant Port Lands’ Inventory by Location and Constraints Municipality/Treaty Lands Constrained Unconstrained Total Delta 1 459 460 City of Langley 1 10 11 Township of Langley 2 225 227 Surrey 12 1153 1165 Tsawwassen First Nations 0 0 0 Total 15 1,848 1863
Table 4 South of Fraser Industrial Lands ‘Agriculture’ and ‘Residential Uses’ Inventory by Location and Constraints Municipality/Treaty Lands Constrained Unconstrained Total Delta 0 4 4 City of Langley 1 5 4 Township of Langley 2 194 196 Surrey 12 758 770 Tsawwassen First Nations 0 0 0 Total 14 962 976
South Campbell Heights Industrial Land Study | 18
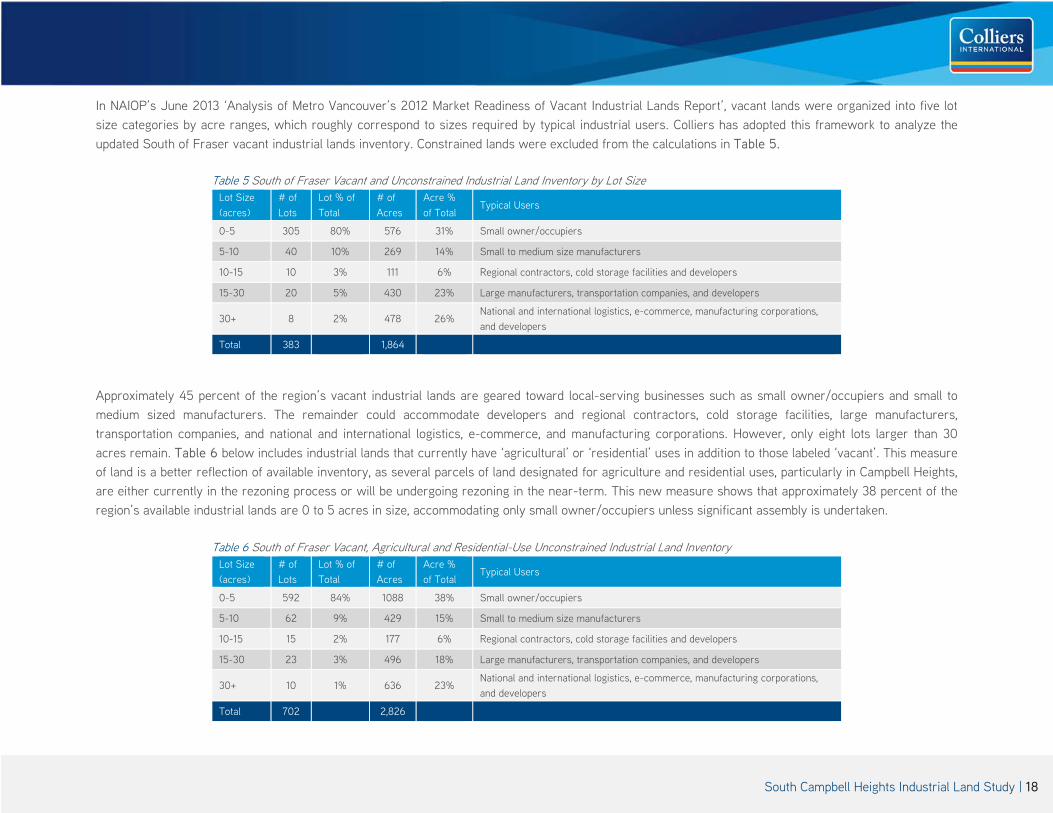
In NAIOP’s June 2013 ‘Analysis of Metro Vancouver’s 2012 Market Readiness of Vacant Industrial Lands Report’, vacant lands were organized into five lot size categories by acre ranges, which roughly correspond to sizes required by typical industrial users. Colliers has adopted this framework to analyze the updated South of Fraser vacant industrial lands inventory. Constrained lands were excluded from the calculations in Table 5.
Table 5 South of Fraser Vacant and Unconstrained Industrial Land Inventory by Lot Size Lot Size (acres)
# of Lots
Lot % of Total
# of Acres
Acre % of Total
Typical Users
0-5 305 80% 576 31% Small owner/occupiers
5-10 40 10% 269 14% Small to medium size manufacturers
10-15 10 3% 111 6% Regional contractors, cold storage facilities and developers
15-30 20 5% 430 23% Large manufacturers, transportation companies, and developers
30+ 8 2% 478 26% National and international logistics, e-commerce, manufacturing corporations, and developers
Total 383 1,864
Approximately 45 percent of the region’s vacant industrial lands are geared toward local-serving businesses such as small owner/occupiers and small to medium sized manufacturers. The remainder could accommodate developers and regional contractors, cold storage facilities, large manufacturers, transportation companies, and national and international logistics, e-commerce, and manufacturing corporations. However, only eight lots larger than 30 acres remain. Table 6 below includes industrial lands that currently have ‘agricultural’ or ‘residential’ uses in addition to those labeled ‘vacant’. This measure of land is a better reflection of available inventory, as several parcels of land designated for agriculture and residential uses, particularly in Campbell Heights, are either currently in the rezoning process or will be undergoing rezoning in the near-term. This new measure shows that approximately 38 percent of the region’s available industrial lands are 0 to 5 acres in size, accommodating only small owner/occupiers unless significant assembly is undertaken.
Table 6 South of Fraser Vacant, Agricultural and Residential-Use Unconstrained Industrial Land Inventory Lot Size (acres)
# of Lots
Lot % of Total
# of Acres
Acre % of Total
Typical Users
0-5 592 84% 1088 38% Small owner/occupiers
5-10 62 9% 429 15% Small to medium size manufacturers
10-15 15 2% 177 6% Regional contractors, cold storage facilities and developers
15-30 23 3% 496 18% Large manufacturers, transportation companies, and developers
30+ 10 1% 636 23% National and international logistics, e-commerce, manufacturing corporations, and developers
Total 702 2,826

South Campbell Heights Industrial Land Study | 19
The same breakdown into lot size groups for the City of Surrey alone is also provided in Tables 7 and 8. Approximately 39 percent of vacant, industrial and residential-use industrial lands within Surrey are smaller lots typically used by small owners and occupiers. Seven out of 10 of the region’s largest parcels (30 acres and above) are located within Surrey.
Table 7 Surrey Vacant and Unconstrained Industrial Land Inventory by Lot Size Lot Size (acres)
# of Lots
Lot % of Total
# of Acres
Acre % of Total
Typical Users
0-5 222 83% 378 35% Small owner/occupiers
5-10 21 8% 139 13% Small to medium size manufacturers
10-15 8 3% 87 8% Regional contractors, cold storage facilities and developers
15-30 13 5% 275 26% Large manufacturers, transportation companies, and developers
30+ 5 2% 189 18% National and international logistics, e-commerce, manufacturing corporations, and developers
Total 269 1,069
Table 8 Surrey Vacant, Agricultural and Residential-Use Unconstrained Industrial Land Inventory Lot Size (acres)
# of Lots
Lot % of Total
# of Acres
Acre % of Total
Typical Users
0-5 428 85% 716 39% Small owner/occupiers
5-10 40 8% 283 15% Small to medium size manufacturers
10-15 12 2% 141 8% Regional contractors, cold storage facilities and developers
15-30 16 3% 340 19% Large manufacturers, transportation companies, and developers
30+ 7 1% 347 19% National and international logistics, e-commerce, manufacturing corporations, and developers
Total 503 1,827

South Campbell Heights Industrial Land Study | 20
As shown in Map 2, few lots larger than 30 acres remain in the region, with the majority located in Campbell Heights North and East, a couple in the Tsawwassen First Nations lands, one in Chatterton (soon to be subdivided) and another along the Fraser River in Surrey which has undesirable configuration. The industrial land base in each submarket within the South of Fraser region is highlighted on the map and further explored in the following pages.
Map 2 Regional Distribution of Vacant Industrial Lots by Size
T F N L A N D S
T I L B U R Y
B O U N D A R Y B A Y
A N N A C I S I S L A N D
B R I D G E V I E W
N E W T O N
E A S T N E W T O N & P A N O R A M A
P O R T K E L L S , A N N I E D A L E &
C A R V O L T H
C L O V E R D A L E , M U F F O R D &
B Y P A S S
C A M P B E L L H E I G H T S
A L D E R G R O V E
G L O U C E S T E R
H I G H W A Y 9 9 C O R R I D O R

South Campbell Heights Industrial Land Study | 21
TFN Lands
Map 3 TFN Lands Inventory Map
Tsawwassen Container Examination Facility (Completion Expected Late 2017)
Chevron Canada
Development on TFN lands has been inhibited due to a lack of servicing, lack of road access, and costly fill to increase the site elevation. These constraints have since been removed for 100 acres. TFN have entered into a land lease with Port Metro Vancouver for a container examination facility (11.4 acres), Chevron Canada (1.5 acres), and Great West Life (57 acres).TFN expects to lease the remaining lands over 10 to 12 years (approximately 20 to 25 acres per year).
Legend
Vacant
Vacant Port Lands 0 acres
Vacant Land 291 acres
Uses Likely to Convert
Outdoor Storage & Parking 0 acres
Resource Extraction 0 acres
Agriculture 0 acres
Residential 0 acres
Other Developed Uses
Developed 31 acres
According to the listing brokers, GWL’s lands will build‐out with 3 large industrial buildings (approx. 400,000 sq. ft. each). The first is expected to commence construction in summer 2016. The remaining land will be built‐out within 2 years.

South Campbell Heights Industrial Land Study | 22
Delta – Boundary Bay & Surrounding Area
Map 4 Boundary Bay & Surrounding Area Inventory Map
Not designated for general industrial development
Legend
Vacant
Vacant Port Lands 0 acres
Vacant Land 43 acres
Uses Likely to Convert
Outdoor Storage & Parking 5 acres
Resource Extraction 163 acres
Agriculture 0 acres
Residential 0 acres
Other Developed Uses
Developed 86 acres
The recent completion of Boundary Bay Industrial Park absorbed approximately 44 acres of previously vacant industrial land. Although another 43 acres remains vacant, Colliers has identified that approximately 33 acres are designated for airport‐related uses and are not available for general industrial development. Only 10 acres of vacant industrial land remains.
Not designated for general industrial development
A development application to develop this 163 acre site for light industrial uses, manufacturing, and warehousing was submitted in 2010. No progress has been made since.

South Campbell Heights Industrial Land Study | 23
Delta – Tilbury Area
Map 5 Tilbury Area Inventory Map
Legend
Vacant
Vacant Port Lands 34 acres
Vacant Land 232 acres
Uses Likely to Convert
Outdoor Storage & Parking 328 acres
Resource Extraction 43 acres
Agriculture 0 acres
Residential 3 acres
Other Developed Uses
Developed 947 acres
Environmental Issues
Approximately 232 acres of vacant land and 34 acres of vacant port land remains within the Tilbury area. Of this, approximately 110 acres at Delta Link is expected to be sold by the end of 2016. Additionally, three parcels totaling approximately 11 acres have a poor configuration which is not marketable, and 58 acres have serious environmental issues that will require intensive remediation.
Configuration Issues
Configuration Issues
Delta Link is approximately 110 acres in total and is expected to sell out by end of 2016

South Campbell Heights Industrial Land Study | 24
Delta – Annacis Island
Map 6 Annacis Island Inventory Map
Legend
Vacant
Vacant Port Lands 0 acres
Vacant Land 6 acres
Uses Likely to Convert
Outdoor Storage & Parking 3 acres
Resource Extraction 0 acres
Agriculture 0 acres
Residential 0 acres
Other Developed Uses
Developed 1104 acres
Almost no vacant land remains on Annacis Island and one of the two remaining parcels is a waterfront lot with unfavorable configuration.

South Campbell Heights Industrial Land Study | 25
Surrey – Bridgeview
Map 7 Bridgeview Inventory Map
Legend
Vacant
Vacant Port Lands 0 acres
Vacant Land 136 acres
Uses Likely to Convert
Outdoor Storage & Parking 427 acres
Resource Extraction 27 acres
Agriculture 0 acres
Residential 13 acres
Other Developed Uses
Developed 1,398 acres
Despite containing approximately 136 acres of vacant land, Surrey’s Bridgeview Area is unlikely to be redeveloped over the long‐term. Bridgeview is one of the last remaining areas in the Lower Mainland which allows for outdoor storage and parking uses. Soils in the area are also unstable and many sites have odd configurations and a lack of servicing. Users such as auto‐wrecking companies, unable to find space anywhere else, are willing to pay $1.5 to $1.6 million per acre here, outbidding developers who are unable to turn a profit at those prices after the costs of remediation, fill, and servicing are factored in.
Overland West under construction
Strata development marketed since 2014
Pacific Link –approximately 14 acres remain

South Campbell Heights Industrial Land Study | 26
Surrey – Newton
Map 8 Newton Inventory Map
Surrey’s Newton area is also almost entirely built‐out. Few vacant lots remain, totaling approximately 12 acres. Of these, 3 acres are lots smaller than 1 acre in size. There are currently no opportunities to accommodate larger industrial users in this area as only 2 lots are greater than 5 acres in size. This area will likely be a target for future assembly and redevelopment after the economic life of current uses has been spent (over 20 years).
Legend
Vacant
Vacant Port Lands 0 acres
Vacant Land 12 acres
Uses Likely to Convert
Outdoor Storage & Parking 71 acres
Resource Extraction 0 acres
Agriculture 0 acres
Residential 8 acres
Other Developed Uses
Developed 1,028 acres

South Campbell Heights Industrial Land Study | 27
Surrey – East Newton/Panorama
Map 9 East Newton/Panorama Inventory Map
Legend
Vacant
Vacant Port Lands 0 acres
Vacant Land 86 acres
Uses Likely to Convert
Outdoor Storage & Parking 25 acres
Resource Extraction 0 acres
Agriculture 0 acres
Residential 40 acres
Other Developed Uses
Developed 216 acres
Some vacant lands remain in Surrey’s East Newton/Panorama area as East Newton Business Park has yet to fully build‐out. However, many lots are burdened with topographical issues or environmental sensitivities. An application to remove 6480 152 Street (19 acres) from the ALR in exchange for 28.7 acres in South Campbell Heights is currently underway.
Restricted by green infrastructure
network corridor
Topographical issues & environmentally
sensitive
Topographical issues & environmentally
sensitive
Moderate to very high habitat suitability
Application for ALR exclusion

South Campbell Heights Industrial Land Study | 28
Surrey – Highway 99 Corridor
Map 10 Highway 99 Corridor Inventory Map
Legend
Vacant
Vacant Port Lands 0 acres
Vacant Land 71 acres
Uses Likely to Convert
Outdoor Storage & Parking 3 acres
Resource Extraction 0 acres
Agriculture 6 acres
Residential 37 acres
Other Developed Uses
Developed 28 acres
Rezoning application for two industrial buildings conditionally approved
Rezoning application for industrial building in initial review
Rezoning/OCP application for 3‐storey office
Conditionally approved for retail/office
Initial review for construction of a commercial building.
There is strong pressure for non‐industrial uses along the Highway 99 Corridor. Current applications for uses such as hotel, office, and retail are either conditionally approved or in the initial review phase.

South Campbell Heights Industrial Land Study | 29
Surrey – Campbell Heights
Map 11 Campbell Heights Inventory Map
Sold Out
Subdivided & Serviced in 12 mo.
Starline – 34 acres Offers on 13 acres
Environmental limitations such as Little Campbell River and green infrastructure
networks limit development of Campbell Heights East to
approx., 80 acres net
Green infrastructure network hubs severely constrain the site
Onni’s Campbell Heights West – 2 buildings conditionally approved
Hopewell’s South Surrey Business Park – 1st
building conditionally approved
Legend
Vacant
Vacant Port Lands 0 acres
Vacant Land 520 acres
Uses Likely to Convert
Outdoor Storage & Parking 5 acres
Resource Extraction 29 acres
Agriculture 312 acres
Residential 232 acres
Other Developed Uses
Developed 407 acres
SCDC’s Campbell Heights North phases 1‐4 are sold out, and phase 5 can be subdivided and serviced within 12 months. Major future supply includes SCDC’s Campbell Heights East, Onni’s Campbell Heights West, and Hopewell’s South Surrey Business Park. Of 520 acres of vacant land, approximately 77 are undevelopable due to green infrastructure network hubs. However, the 312 acres of agricultural land and 232 acres of residential land in the area are a legitimate mid‐ to long‐term source of land supply.

South Campbell Heights Industrial Land Study | 30
Surrey/Langley – Cloverdale & Mufford/Bypass
Map 12 Cloverdale & Mufford/Bypass Inventory Map
Legend
Vacant
Vacant Port Lands 0 acres
Vacant Land 164 acres
Uses Likely to Convert
Outdoor Storage & Parking 38 acres
Resource Extraction 0 acres
Agriculture 5 acres
Residential 13 acres
Other Developed Uses
Developed 732 acres
LUC discharge application to allow industrial
development is underway
Kwantlen is exploring selling off parcels for industrial development
Approximately five smaller lots in this area have planned industrial developments in various stages of the approvals process. However, the largest supply could come from Kwantlen lands, as the university is exploring selling off parcels for industrial development.
Development permit application for tilt‐up industrial building
Green infrastructure network corridor constrains site
South Campbell Heights Industrial Land Study | 31
Surrey/Langley – Port Kells/Anniedale/Carvolth
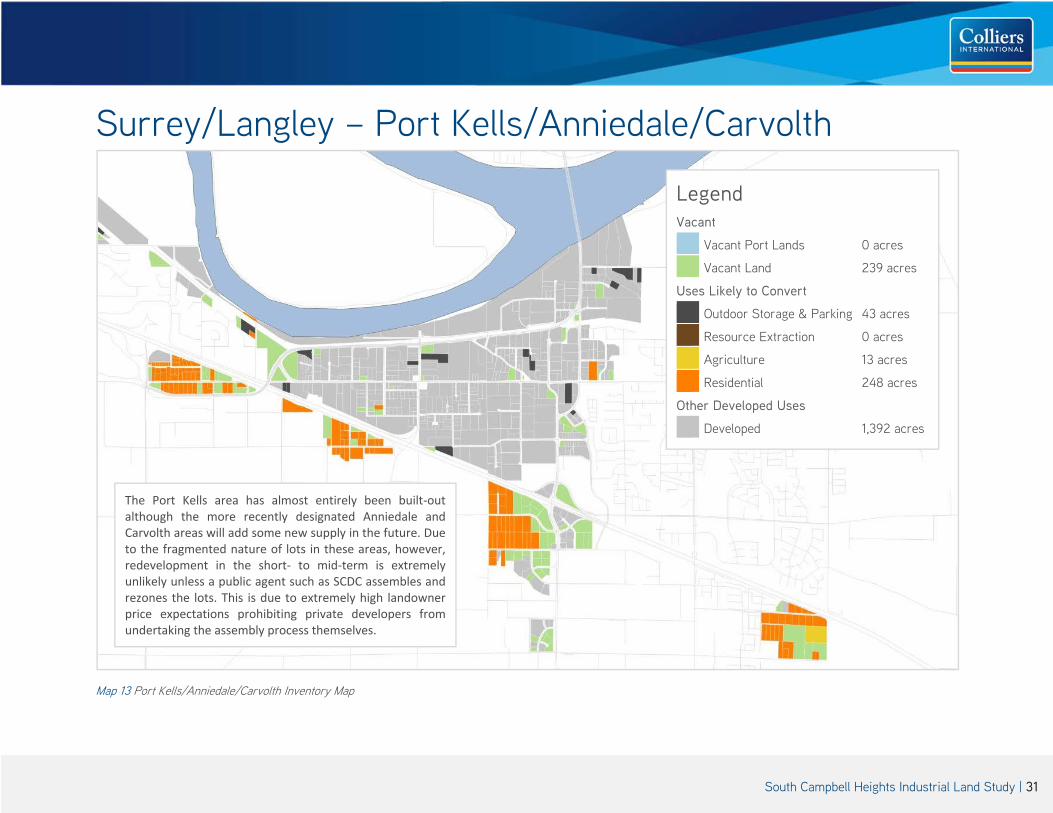
Map 13 Port Kells/Anniedale/Carvolth Inventory Map
The Port Kells area has almost entirely been built‐out although the more recently designated Anniedale and Carvolth areas will add some new supply in the future. Due to the fragmented nature of lots in these areas, however, redevelopment in the short‐ to mid‐term is extremely unlikely unless a public agent such as SCDC assembles and rezones the lots. This is due to extremely high landowner price expectations prohibiting private developers from undertaking the assembly process themselves.
Legend
Vacant
Vacant Port Lands 0 acres
Vacant Land 239 acres
Uses Likely to Convert
Outdoor Storage & Parking 43 acres
Resource Extraction 0 acres
Agriculture 13 acres
Residential 248 acres
Other Developed Uses
Developed 1,392 acres
South Campbell Heights Industrial Land Study | 32
Langley Township - Aldergrove
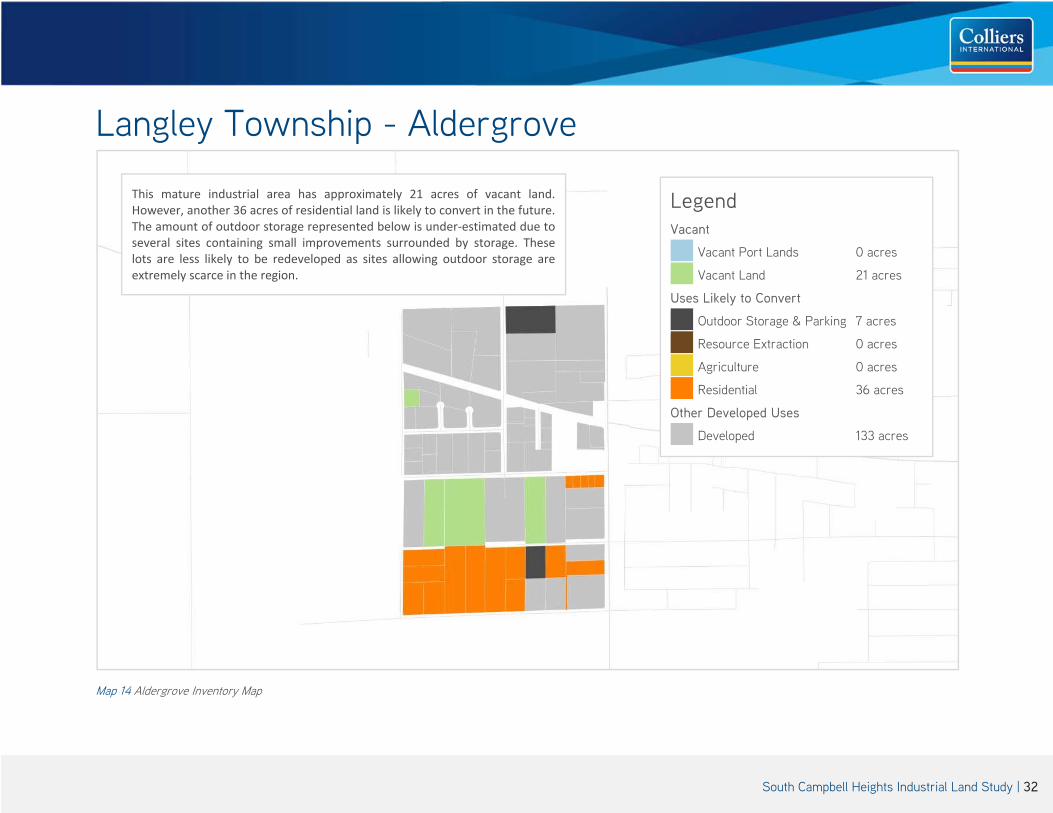
Map 14 Aldergrove Inventory Map
Legend
Vacant
Vacant Port Lands 0 acres
Vacant Land 21 acres
Uses Likely to Convert
Outdoor Storage & Parking 7 acres
Resource Extraction 0 acres
Agriculture 0 acres
Residential 36 acres
Other Developed Uses
Developed 133 acres
This mature industrial area has approximately 21 acres of vacant land. However, another 36 acres of residential land is likely to convert in the future. The amount of outdoor storage represented below is under‐estimated due to several sites containing small improvements surrounded by storage. These lots are less likely to be redeveloped as sites allowing outdoor storage are extremely scarce in the region.

South Campbell Heights Industrial Land Study | 33
Langley Township - Gloucester
Map 15 Gloucester Inventory Map
Legend
Vacant
Vacant Port Lands 0 acres
Vacant Land 88 acres
Uses Likely to Convert
Outdoor Storage & Parking 0 acres
Resource Extraction 0 acres
Agriculture 0 acres
Residential 9 acres
Other Developed Uses
Developed 483 acres
Some lands remain in Beedie’s Gloucester Industrial Estates Northeast Quadrant and Lots 1, 3, and 4, however absorption has been slower than expected as these lands have remained available for several years. This could partially be explained by potential purchasers desiring greater flexibility in development forms, which they can achieve with developers of their choice in Campbell Heights. Beedie has plans in place to re‐designate some of the lands previously set aside for a golf course back to industrial uses. In total, this could add approximately 33 acres to land supply in this area.
Proposed industrial sites

South Campbell Heights Industrial Land Study | 34
3 | Demand Forecast In this section, Colliers uses three approaches to estimate future industrial land demand in the South of Fraser region:
A trend of historical construction activity A trend of sales activity Future employment linked to land
Each method captures a different perspective of potential future industrial land demand and each has its own respective benefits and weaknesses which are outlined in their respective sections to follow.
Other recent reports which have estimated municipal and regional industrial land demand include:
Site Economics’ October 2015 ‘Industrial Land Market and Trade Growth in Metro Vancouver’ Report for Port Metro Vancouver NAIOP’s ‘Long-Term Forecast and Analysis of Metro Vancouver’s Industrial Lands’ October 2014 Report Metro Vancouver’s 2010 Industrial Lands Inventory The City of Surrey’s November 2008 Employment Lands Strategy

South Campbell Heights Industrial Land Study | 35
The Site Economics report, focused on the regional demand for logistics space arising from expected increases in port activity, used actual operating efficiency ratios of building space inventory to twenty foot equivalent units (TEUs). These ratios were applied to three port volume forecast scenarios undertaken for Port Metro Vancouver by Ocean Shipping Consultants in 2013. The report projected a cumulative total new logistics-oriented land demand of 1,614 acres in the case of existing Port Metro Vancouver capacity, 2,439 acres in the case of the addition of the Deltaport Intermodal Yard, and 3,440 acres in the case of the addition of both the Deltaport Intermodal Yard and a second Robert Banks Terminal. The results of the analysis are shown in Table 9.
Table 9 Large Scale Logistics Facility Land Demand Source: Industrial Land Market and Trade Growth in Metro Vancouver Report

South Campbell Heights Industrial Land Study | 36
NAIOP’s absorption estimates were derived from RealNet-provided industrial land sales between 2008 and 2012. Based on total acres sold, a five-year average of 409 acres per year was calculated for the Metro Vancouver and Fraser Valley Regional District regions. However, it should be noted that although industrial land sales provide a good indicator of the volatility of demand in the region, they are not the best indicator for actual absorption. Industrial land sales are not a suitable proxy for absorption because some purchasers either buy and hold, or buy and intend to service and parcel off the lands for resale. The absorption data provided in the NAIOP report is shown in Table 10.
Metro Vancouver’s 2010 Industrial Lands Inventory compared developed industrial land between 2005 and 2010 to measure the pace of industrial land absorption. Developed industrial lands grew by 1,242 acres over this period, representing an average annual land absorption rate of approximately 250 acres. It also noted that while developed industrial land increased over the period, the net change in vacant land inventory was negligible due to additions such as Tsawwassen First Nations land and areas of Delta and Maple Ridge. The data provided in the 2010 inventory report is shown in Table 11 below.
Table 11 Net Change in Developed Industrial Land 2005-2010 Source: 2010 Industrial Lands Inventory
Table 10 RealNet Industrial Land Sales 2008-2012 Source: Long-Term Forecast and Analysis of Metro Vancouver’s Industrial Lands Report
South Campbell Heights Industrial Land Study | 37
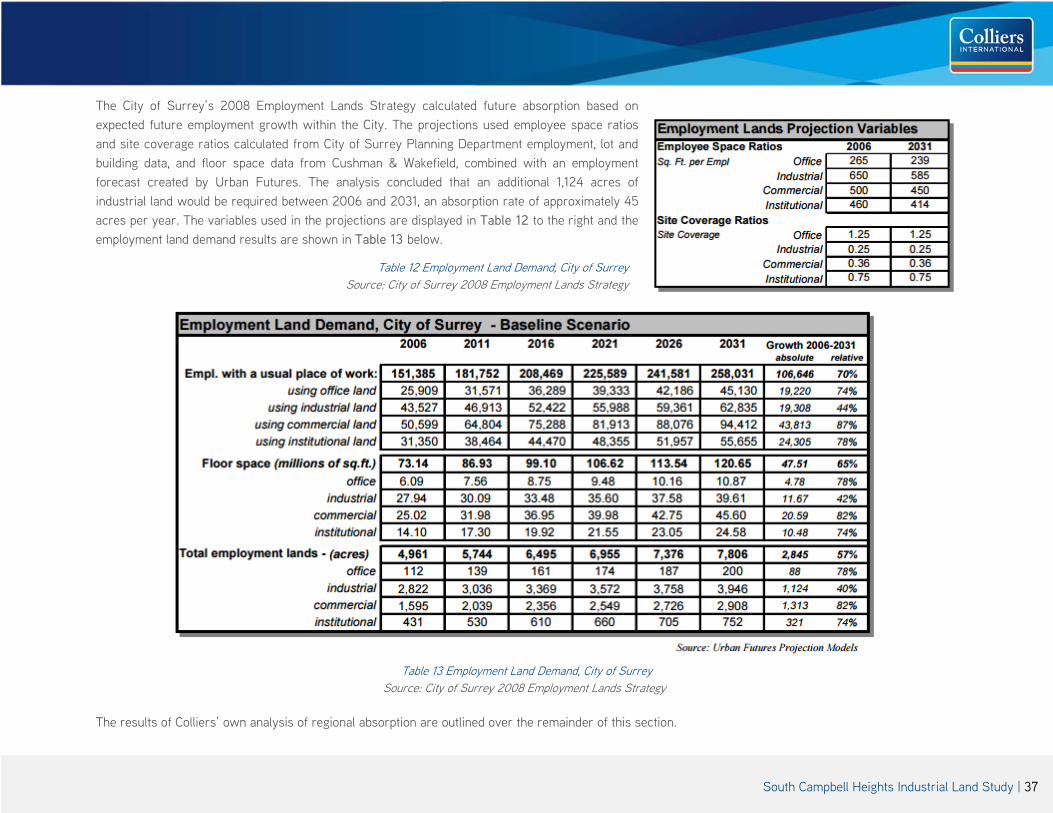
The City of Surrey’s 2008 Employment Lands Strategy calculated future absorption based on expected future employment growth within the City. The projections used employee space ratios and site coverage ratios calculated from City of Surrey Planning Department employment, lot and building data, and floor space data from Cushman & Wakefield, combined with an employment forecast created by Urban Futures. The analysis concluded that an additional 1,124 acres of industrial land would be required between 2006 and 2031, an absorption rate of approximately 45 acres per year. The variables used in the projections are displayed in Table 12 to the right and the employment land demand results are shown in Table 13 below.
Table 13 Employment Land Demand, City of Surrey
Source: City of Surrey 2008 Employment Lands Strategy
The results of Colliers’ own analysis of regional absorption are outlined over the remainder of this section.
Table 12 Employment Land Demand, City of Surrey Source: City of Surrey 2008 Employment Lands Strategy

South Campbell Heights Industrial Land Study | 38
3.1 | Historical Construction Activity and Land Absorption
This approach to measuring absorption captures lands which are absorbed for more improved uses such as single and multi-tenant warehouses, manufacturing facilities and distribution centres. It does not track previously vacant lands which have been taken up by less building-intensive uses such as outdoor storage and truck parking, which still provide an economic benefit to the region. However, this approach does not significantly undercount absorption, as municipalities generally do not allow more permanent outdoor storage and truck parking unless the uses were previously grandfathered in. They do, however, sometimes grant temporary permits.
This approach to calculating historical absorption used Colliers-tracked industrial building construction activity data across Metro Vancouver, Abbotsford and Chilliwack from 2010 to 2015. The land parcel absorbed by each new industrial building was counted in the inventory. In the case of phased projects being constructed over a single lot, the share of land absorbed by the building was assumed to be the same as the building’s share of total planned square footage. A summary table of each municipality’s land usage using this method is provided in Table 14 below, and a map showing the distribution of this absorption throughout the South of Fraser region is provided in Map 16.
Table 14 Industrial Land (acres) Absorbed through Construction Activity 2010 - 2015 Municipality 2010 2011 2012 2013 2014 2015 Total Abbotsford 8 1 2 6 7 24 Burnaby 39 22 27 18 9 5 120 Chilliwack 34 5 15 1 7 62 Coquitlam 1 1 Delta 11 14 32 73 50 181 Langley 20 10 7 5 43 86 Maple Ridge 1 1 New Westminster 23 4 3 10 40 North Vancouver 3 6 6 15 Pitt Meadows 4 17 37 59 Port Coquitlam 22 4 12 5 43 Richmond 15 52 16 41 43 4 172 Surrey 18 24 38 15 28 50 173 Vancouver 9 15 8 1 2 35 Total 168 130 164 153 215 183 1012

South Campbell Heights Industrial Land Study | 39
Map 16 Land Parcels Absorbed Through Construction Source: Colliers International
South Campbell Heights Industrial Land Study | 40
South of Fraser vs Other Lower Mainland Industrial Land Demand – Inventory Built Approach
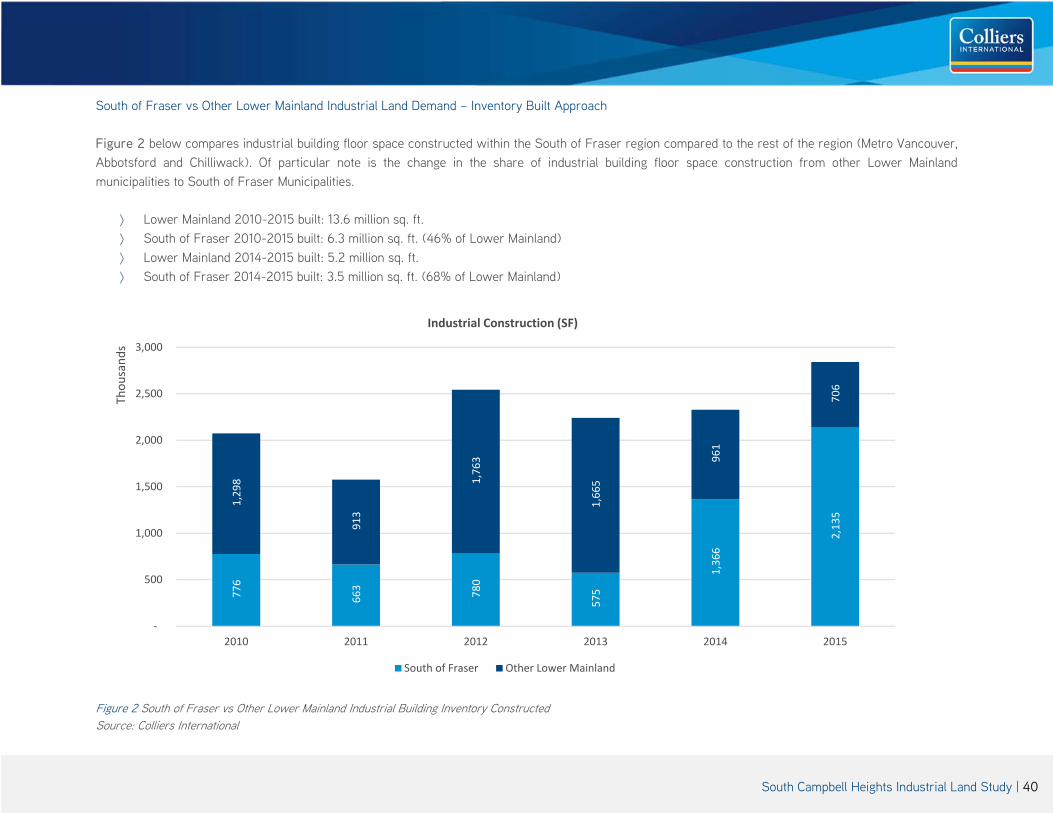
Figure 2 below compares industrial building floor space constructed within the South of Fraser region compared to the rest of the region (Metro Vancouver, Abbotsford and Chilliwack). Of particular note is the change in the share of industrial building floor space construction from other Lower Mainland municipalities to South of Fraser Municipalities.
Lower Mainland 2010-2015 built: 13.6 million sq. ft. South of Fraser 2010-2015 built: 6.3 million sq. ft. (46% of Lower Mainland) Lower Mainland 2014-2015 built: 5.2 million sq. ft. South of Fraser 2014-2015 built: 3.5 million sq. ft. (68% of Lower Mainland)
Figure 2 South of Fraser vs Other Lower Mainland Industrial Building Inventory Constructed Source: Colliers International
776
663 780
575
1,366
2,135
1,298
913
1,763
1,665
961
706
‐
500
1,000
1,500
2,000
2,500
3,000
2010 2011 2012 2013 2014 2015
Thou
sand
s
Industrial Construction (SF)
South of Fraser Other Lower Mainland

South Campbell Heights Industrial Land Study | 41
Figure 3 South of Fraser vs Other Lower Mainland Industrial Land Absorbed Source: Colliers International
A corresponding change of land absorption share from other Lower Mainland municipalities to South of Fraser municipalities is also visible. This is likely due to a lack of well-configured vacant lands north of the Fraser in general.
Lower Mainland 2010-2015 absorbed: 1,012 acres South of Fraser 2010-2015 absorbed: 440 acres (43% of Lower Mainland) Lower Mainland 2014-2015 absorbed: 398 acres South of Fraser 2014-2015 absorbed: 244 acres (61% of Lower Mainland) Average of 73 acres per year for South of Fraser over past 6 years but 122 acres per year for past 2 years At pace of 73 acres per year an additional 1,825 acres could be expected by 2041. At brisk pace of 122 acres per year, an additional 3,050 acres can
be expected by 2041
4934
60 53
101
143
118
96
104 100
114 40
0
50
100
150
200
250
2010 2011 2012 2013 2014 2015
Acres
Land Absorbed Through Construction (Acres)
South of Fraser Other Lower Mainland

South Campbell Heights Industrial Land Study | 42
Campbell Heights vs Other Surrey Industrial Land Demand – Inventory Built Approach
Figure 4 Campbell Heights vs Other Surrey Industrial Building Inventory Constructed Source: Colliers International
The pace of construction completion within Campbell Heights significantly picked up in 2015, when approximately 692,000 square feet of industrial space was constructed in this industrial park. This rate of construction is expected to remain elevated for several years to come as new users who purchased lands in the area, particularly in Campbell Heights North, complete their buildings.
Figure 5 Campbell Heights vs Other Surrey Industrial Land Absorbed Source: Colliers International
163 73 106 26151 212
148 399 319
164
263
692
0
200
400
600
800
1000
2010 2011 2012 2013 2014 2015
Thou
sand
s Industrial Construction (SF)
Campbell Heights
Other Surrey
8 4
22
113 13
9 20
16
13
15
37
0
10
20
30
40
50
60
2010 2011 2012 2013 2014 2015
Acres Land Absorbed Through Construction (Acres)
Campbell Heights
Other Surrey
South Campbell Heights Industrial Land Study | 43
3.2 | Historical Land Sales Activity
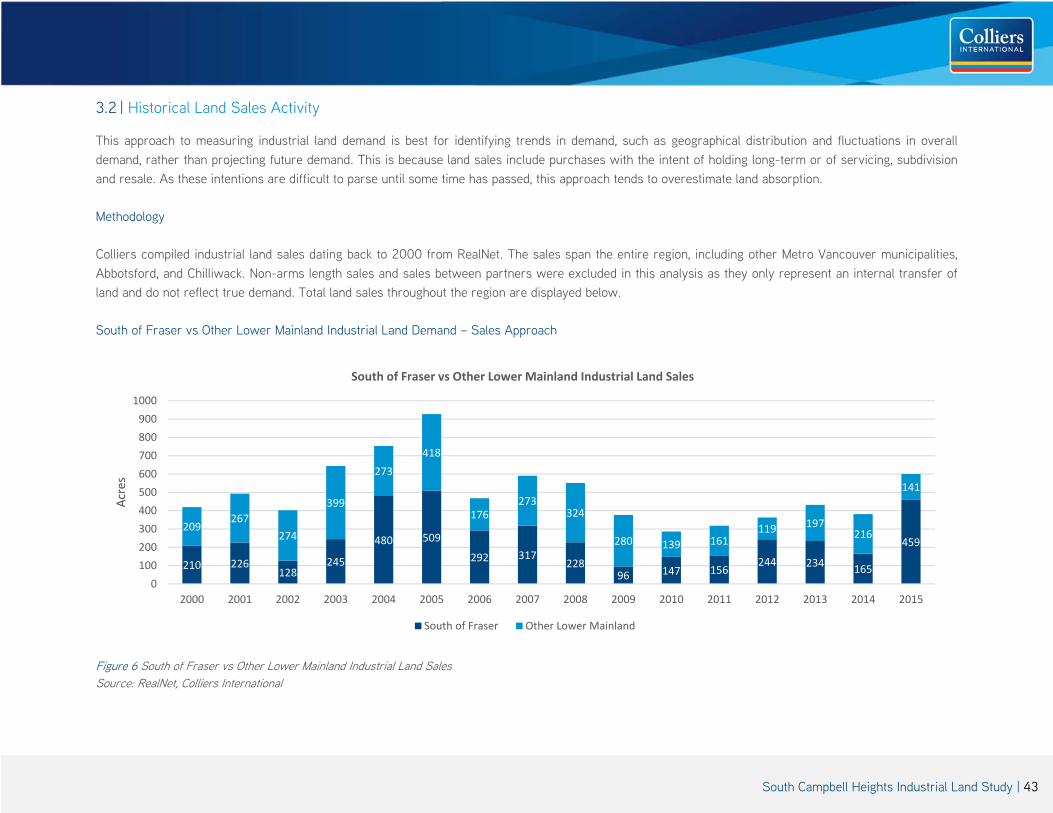
This approach to measuring industrial land demand is best for identifying trends in demand, such as geographical distribution and fluctuations in overall demand, rather than projecting future demand. This is because land sales include purchases with the intent of holding long-term or of servicing, subdivision and resale. As these intentions are difficult to parse until some time has passed, this approach tends to overestimate land absorption.
Methodology
Colliers compiled industrial land sales dating back to 2000 from RealNet. The sales span the entire region, including other Metro Vancouver municipalities, Abbotsford, and Chilliwack. Non-arms length sales and sales between partners were excluded in this analysis as they only represent an internal transfer of land and do not reflect true demand. Total land sales throughout the region are displayed below.
South of Fraser vs Other Lower Mainland Industrial Land Demand – Sales Approach
Figure 6 South of Fraser vs Other Lower Mainland Industrial Land Sales Source: RealNet, Colliers International
210 226128
245
480 509
292 317228
96 147 156244 234 165
459209
267274
399
273418
176273
324
280 139 161119 197
216
141
01002003004005006007008009001000
2000 2001 2002 2003 2004 2005 2006 2007 2008 2009 2010 2011 2012 2013 2014 2015
Acres
South of Fraser vs Other Lower Mainland Industrial Land Sales
South of Fraser Other Lower Mainland

South Campbell Heights Industrial Land Study | 44
Figure 7 South of Fraser vs Other Lower Mainland Proportion of Industrial Land Sales Source: RealNet, Colliers International
Of note is the peak of 927 acres sold in 2005, a volume which will likely never be seen again due to a lack of supply of land. The South of Fraser’s share of land sales has fluctuated over the past decade and a half. Its share of regional demand has been low since 2009 and has since recovered and soared in 2015 due to lack of availability elsewhere in the region. The annual average land sale total from 2000 to 2015 was 258 acres per year. Industrial land sales in Langley (City and Township combined) have steadily declined since peak highs in 2003, as industrial parks in this area built-out and vacant land inventory dwindled. Delta, however, has shown a more consistent trend of industrial land sales, aside from a 2015 spike from the sale of Delta Link.
Figure 8 Langley and Delta Industrial Land Sales Source: RealNet, Colliers International
50%
46%
32%
38% 64
%
55%
62%
54%
41%
26% 51
%
49% 67%
54%
43% 76
%
50%
54%
68%
62% 36
%
45%
38%
46%
59%
74% 49
%
51% 33%
46%
57% 24
%
0%
20%
40%
60%
80%
100%
2000 2001 2002 2003 2004 2005 2006 2007 2008 2009 2010 2011 2012 2013 2014 2015
% of A
cres
South of Fraser vs Other Lower Mainland Proportion of Industrial Land Sales
South of Fraser Other Lower Mainland
57 64
31
114
105
76
67
44
29
21 20
28 36
8 7
26
0
20
40
60
80
100
120
Acres
Langley (City and Township) Industrial Land Sales
50
14 7 7
74
16
32
69
36
20 25 17
47 53
14
145
0
50
100
150
200
2000
2001
2002
2003
2004
2005
2006
2007
2008
2009
2010
2011
2012
2013
2014
2015
Acres
Delta Industrial Land Sales

South Campbell Heights Industrial Land Study | 45
Campbell Heights vs Other Surrey Industrial Land Demand – Sales Approach
Campbell Heights has grown to be the main contributor to Surrey industrial land sales. Surrey’s average acres sold per year from 2000 to 2015 was 173 acres per year. From 2010 to 2015, it dropped slightly to 163 acres per year.
Figure 9 Surrey and Campbell Heights Industrial Land Sales Source: RealNet, Colliers International
3.3 | Employment-Driven Demand
This approach uses Metro Vancouver Regional Growth Strategy employment projections to forecast employment-driven industrial land demand. However, in general, and especially in the Lower Mainland, industrial floor space demand is increasingly being driven by logistics/distribution space. These industrial users require more floor space but have fewer employees working on-site. Another caveat to this approach is that it is driven by local employment objectives, whereas the opportunities for industrial growth within the South of Fraser region are driven more by regional demand and a lack of supply north of the Fraser. Despite its tendency to under-estimate industrial land demand, it is a useful tool for exploring, as a base case, how much industrial land would be required to achieve local employment objectives.
126
324
81
26
132
40
88 58
138
134
112 19
6
102 143
90 124
175
94
112
178 30
15
15 53
23 39
32
91
0
50
100
150
200
250
300
350
400
450
2000 2001 2002 2003 2004 2005 2006 2007 2008 2009 2010 2011 2012 2013 2014 2015
Acres
Surrey and Campbell Heights Industrial Land Sales
Campbell Heights Other Surrey

South Campbell Heights Industrial Land Study | 46
Methodology
The number of employees within industrial lands were estimated from Metro Vancouver Regional Growth Strategy total employment projections and the proportion of employees within industrial lands in Surrey in 2006, sourced from Surrey’s 2008 Employment Lands Strategy. A square foot per employee ratio was applied to derive additional required industrial floor area. The square foot per employee ratio was calculated based on regional employment in 2011 and Colliers-tracked industrial floor space inventory from that same year. Lastly, a regional-average industrial land floor space ratio was applied to required space to determine additional land required. The following assumptions were used and held constant over the projection period:
Proportion of employment within industrial lands: 29% Square feet of industrial space per employee: 616 sq. ft. Industrial floor space ratio: 0.4
Projections
The following projections show declining annual demand for industrial space based on a declining employment growth rate built into Metro Vancouver’s projections. In total, approximately 2,096 acres would be required between 2011 and 2041 (approximately an additional 1,691 acres between 2016 and 2041). The City of Surrey’s employment-driven industrial land requirement from 2011 to 2041 is 1,321 acres (approximately an additional 1,086 acres from 2016 to 2041).
South of Fraser Region
Year Employment
within Industrial Lands
Add'l Sq. Ft. Floor Area
Req’d
Add'l Land Req’d
(Acres)
Add'l Land Req’d per
Year (Acres)
2011 83,694 2021 106,720 14,184,016 814 812031 126,150 11,968,880 687 692041 142,970 10,361,120 595 59Total 2011-2041 2,096 70
Surrey
Year Employment
within Industrial Lands
Add'l Sq. Ft. Floor Area
Req’d
Add'l Land Req’d
(Acres)
Add'l Land Req’d per
Year (Acres)
2011 48,778 2021 62,060 8,181,712 470 472031 74,820 7,860,160 451 452041 86,130 6,966,960 400 40Total 2011-2041 1,321 44
Table 15a South of Fraser Industrial Land Demand by Employment Growth Table 15b South of Fraser Industrial Land Demand by Employment Growth

South Campbell Heights Industrial Land Study | 47
3.4 | Land Demand Conclusions
The three forecast methods and the resulting time to absorb current inventory were compiled for both the South of Fraser Region and the City of Surrey in Tables 16 and 17 below.
Table 16 Cumulative South of Fraser Land Demand and Absorption Timeline Summary
South of Fraser Region Cumulative Additional Industrial Land Demand Required 2016-2041
Historical Construction Historical Sales Employment
Time Period 2010-2015 Rate
73 acres/yr 2014-2015 Rate
122 acres/yr 258 acres/yr
70/yr avg. over the period
2016-2041 (25 years) 1,825 acres 3,050 acres 6,450 acres 1,691 acres
Years to Absorb
‘Vacant’ Unconstrained Land Inventory (1,864 acres) 26 years 15 years 7 years 27 years
‘Vacant’ + ‘Agricultural Use’ + ‘Residential Use’ Unconstrained Land Inventory (2,826 acres)
39 years 23 years 11 years 40 years
Table 17 Cumulative Surrey Land Demand and Absorption Timeline Summary
Surrey Cumulative Additional Industrial Land Demand Required 2016-2041
Historical Construction Historical Sales Employment
Time Period 2010-2015 Rate
29 acres/yr 2014-2015 Rate
39 acres/yr 173 acres/yr
44/yr avg. over the period
2016-2041 (25 years) 725 acres 975 acres 4,325 acres 1,100 acres
Years to Absorb
‘Vacant’ Unconstrained Land Inventory (1,069 acres) 37 years 27 years 6 years 24 years
‘Vacant’ + ‘Agricultural Use’ + ‘Residential Use’ Unconstrained Land Inventory (1,827 acres)
63 years 47 years 11 years 42 years
Based off of historical construction activity, the region has seen a pace of absorption of 73 to 122 acres per year, and Surrey itself has seen approximately 29 to 39 acres per year. This will result in a regional requirement of 1,825 to 3,050 acres of land by 2041, and a Surrey-specific requirement of 725 to 975 acres of land by 2041.
Based off of historical sales activity, the region has seen (arms length only) sales of approximately 258 acres per year, and the City of Surrey has seen sales of 173 acres per year. This will result in a regional requirement of 6,450 acres by 2041 and a Surrey-specific requirement of 4,325 acres by 2041.
South Campbell Heights Industrial Land Study | 48
Based off of future expected employment growth, the region will require an additional 70 acres per year, and the City of Surrey will require approximately 44 acres per year. This will result in a regional requirement of 1,691 acres by 2041 and a Surrey-specific requirement of 1,100 acres by 2041.

South Campbell Heights Industrial Land Study | 49
4 | Agro-Industrial Opportunities in South Campbell Heights South Campbell Heights is located closer to larger population centres such as Vancouver and Burnaby and is also closer to the U.S. border crossing than other potential agro-industrial areas in the Fraser Valley such as Abbotsford’s Clearbrook and Chilliwack’s Kerr Business Park. Given its proximity to population centres and adjacency to ALR lands, South Campbell Heights is geographically well-positioned to attract agro-industrial opportunities.
A 2013 “Food Processing Investment Attraction Study” conducted for the City of Chilliwack by Toma & Bouma interviewed several food processing industry organizations including Vantage Foods, Rogers Foods, Sandel Foods, Johnston Packers, and BC Food Processors. The report noted that the costing of land, utility, power, water, waste, labour, taxes, incentives and transport items were large factors in siting decisions for food producers. In addition, operational plants are not likely to move unless they are at the end of their economic life or face pressure to move (as is the case in Vancouver, where some food processing facilities are under threat due to residential development pressures).
The report also discussed competitiveness being a major issue for regional food companies, and identified that companies such as Pillsbury and some dairy processors moved out of the province due to competitiveness factors. Also of note is the lack of specialized support such as the food development centres present in other provinces (the Leduc Food Development Centre, the Saskatoon Food Development Centre, and the Guelph Food Technology Centre were listed as examples).
Chilliwack’s Kerr Avenue Business Park serves as an important case study for agro-industrial-targeted industrial developments in the Fraser Valley. After its initial marketing launch in 2005, it gained only two tenants: a 65,000 square foot Vantage Foods facility and a 67,737 square foot Sandel Foods facility. The remaining 16 acres have remained undeveloped since 2005. Only in 2015, a decade later, did further interest in the park accrue. Berry Hill Foods, based in Abbotsford, has decided to open a new plant in the Kerr Figure 10 Kerr Avenue Business Park Brochure Site Plan

South Campbell Heights Industrial Land Study | 50
Avenue Food Processing Park which is set to open in summer 2016. A proposal by Fraser Valley Meats to open a 22,000 square-foot slaughterhouse was also forwarded in 2015 but subsequently withdrawn in September of that year before its scheduled public hearing. In a letter of support, the British Columbia Cattlemen’s Associated said that the province is in “desperate need of federally inspected slaughter plants” 1. The Toma & Bouma report cites the 2008 recession as the likely reason for the slow uptake of agro-industrial land and predicted that it may take an additional five years after 2013 to see demand pick up again. However, a 2011 North Lougheed Land Use Study for conducted for the City of Pitt Meadows by AECOM, which considered agro-industrial uses in the area, suggested that Kerr Avenue Business Park’s failings were due to its focus on “a small slice of the overall market” and that “buyers in [the agri-industrial] market pool are typically not interested in high exposure property and the higher land costs that accompany such parcels”2.
The 2012 Zbeetnoff Agro-Environmental Consulting “Rural Agri-Industrial Study: Resolution of Uses Along the Fraser Highway Corridor” report for the City of Abbotsford also interviewed stakeholders such as the Agricultural Land Commission, the British Columbia Ministry of Agriculture, the British Columbia Agricultural Council, Agro-industrial operators in urban areas, agro-industrial operators in the ALR, and agro industrial supply and equipment dealers. The report provided key insights into the disparate goals and opinions of each stakeholder group as they pertain to creating a specific agro-industrial cluster within the City of Abbotsford.
It should be noted that agro-industrial operators, depending on their scale of operation, have different locational requirements. Agro-industry that requires substantial power, water, sewer and waste management tend to locate in fully-serviced industrial areas. However, smaller processors achieving less revenue cannot afford to locate in these areas.
The study notes several ALR infractions within Abbotsford in which processors are not meeting ALC’s 50 percent rule: “the requirement that agri-industrial activities on ALR property are ancillary to primary production in that they derive at least 50 percent of source products from the farm on which they occur”3. It discovered that some agro-industrial development is targeting ALR lands because of lower land and development costs, and fewer compliance barriers. This creates an unlevel playing field for facilities in industrial areas that pay higher taxes and compliance costs. The study’s consulted agro-industrial
1 Henerson, P. J. (2015, September 14). Chilliwack abattoir application pulled at last minute. Chilliwack Times. Retrieved from http://www.chilliwacktimes.com/news/327578611.html
2 AECOM. (2011, June 23). North Lougheed Land Use Study (Rep.). Retrieved http://www.pittmeadows.bc.ca/assets/Land~and~Building~Photos/Pitt_Meadows_-_N_Lougheed_Land_Use_Study_June23_FINAL_2_.pdf
3 Zbeetnoff Agro‐Environmental Consulting. (2012, December 4). Rural Agri‐Industrial Study: Resolution of Uses along the Fraser Highway Corridor (Rep.). Retrieved https://abbotsford.civicweb.net/filepro/document/31833/EDP 058-2013 Agri-Industrial Study.pdf

South Campbell Heights Industrial Land Study | 51
operators noted that there is demand for lower-cost agro-industrial locations in Abbotsford and that there is a need to provide these cost effective options for on-farm primary processors that do not satisfy the 50 percent rule.
This discussion of fairness applies to South Campbell Heights, as the potential to designate an area for agro-industrial uses only reduces land costs and creates the same unlevel playing field for existing food processors in industrial areas. The Zbeetnoff report suggests that lower land costs and taxation could be perceived as fair if the area also receives fewer services such as lower road standards and utilities.
The strengths, weaknesses, opportunities and threats associated with the South Campbell Heights area attracting agro-industrial businesses and acting as an agro-industrial activity hub can be summarized as follows:

South Campbell Heights Industrial Land Study | 52
Strengths
Surrounding land use context (both ALR and industrial) is complementary
Proximity to raw agricultural production
Proximity to key regional population centres (supplying consumer base and labour force) compared to competitive clusters in Abbotsford and Chilliwack
Lower land costs relative to other Metro industrial lands
Good connectivity via regional road network
Weaknesses
Higher land and building costs than other Fraser Valley industrial areas
Poor public transit connectivity
Opportunities
Displacement of food processors in urban areas of Metro Vancouver due to development pressures creates demand for Fraser Valley areas
Protection of existing ALR farmland from 50 percent rule infractions
Providing a lower-cost option for on-farm agro-industrial operators which have outgrown the on-farm pairing
Threats
Perception of an unfair playing field by existing agro-industrial operators located in industrial areas
Potential for extremely slow absorption due to targeting of a very small niche of operators
South Campbell Heights Industrial Land Study | 53
5 | Conclusions Approximately 31 percent of the region’s vacant and unconstrained land base (measured by acres) is suitable for small owner/occupiers desiring less than five acres of land. However, these small lots represent 80 percent of total lot count in the region. Only 40 lots remain which are suitable for small to medium sized manufacturers (5 to 10 acres), only 10 lots remain which are suitable for regional contractors, cold storage facilities, and smaller developers (10 to 15 acres), only 20 lots remain suitable for large manufacturers, transportation companies, and larger developers (15 to 30 acres), and only 8 lots remain for national and international logistics, e-commerce, manufacturing corporations, and large developers (more than 30 acres).
When adding in land currently used for residential and agricultural purposes, these numbers increase only modestly, and only two more lots greater than 30 acres are available. The City of Surrey itself contains approximately half of the lots in each category, and is also in short supply of larger lots. Barring significant efforts to consolidate the region’s fragmented industrial land parcels, very few options remain for larger industrial users/developers, which poses a significant competitive weakness for the region as a whole.
In all measures except for sales activity (because this measure overestimates absorption due to resales), it appears as if the region and the City of Surrey has sufficient industrial lands to meet requirements until 2041. However, it should be noted that much of the region’s vacant land inventory consists of small fragmented parcels, whereas demand for land generally comes from larger users and developers developers (who act as intermediaries for smaller users who want a turn-key space solution). This is the most constrained segment of the market, and is the reason why numerous industry stakeholders are concerned about the region’s future land supply. Based on the above-mentioned absorption measures, the City of Surrey should ensure that approximately 30 to 50 acres of industrial land is available in any given year, and that this predominantly consists of larger lot sizes. Given tight supply in the region, Colliers foresees that lands in South Campbell Heights could be quickly absorbed soon after the Surrey City Development Corporation’s (SCDC’s) remaining lands in Campbell Heights North and subsequent project in Campbell Heights East are accounted for.
An opportunity exists to make land outside of the ALR and its associated constraints more affordable for these small and mid-sized processors in a way that supports this industry and preserves ALR land for primary agricultural production. However, fairness must also be considered as these processors will face lower land costs and less of a tax burden compared to similar operators existing in industrial parks. Additionally, it should be noted that a similar park in Chilliwack, which was specifically designated for food processing has seen excessively slow absorption since its launch in 2005. This could be attributed to its very narrow focus on a small market niche, which represents a threat that a similar park in South Campbell Heights could also face.
There remains an additional question of whether future demand for industrial land will be from business park or light industrial uses. Although data doesn’t currently exist to perfectly segregate users, anecdotal evidence suggests that light industrial uses are more supportable than business park uses within South Campbell Heights. Business park uses, which contain a greater component of office space, tend to have higher employment densities. South Campbell

South Campbell Heights Industrial Land Study | 54
Heights will not be as competitive in attracting business park tenants due to its poor public transit connectivity. Municipalities such as Burnaby and Richmond are better poised to capture demand from this user category. However, initial plans for SCDC’s East Campbell Heights lands are supporting business park uses over light industrial uses due to the area’s environmental sensitivities and resulting irregular lot configurations. Should demand materialize for these lands, it is possible that South Campbell Heights could also see support for business park uses.
In summary, it is evident that the region’s industrial land supply is constrained, especially in land size categories desired by larger users. Should South Campbell Heights be designated as industrial, there is evidence to support steady absorption. An additional opportunity exists to designate the area for agro-industrial uses. However, this designation may result in a much slower pace of absorption.
Recommendations
As industrial demand in the region is largely supply-driven due to a shortage of suitable lands for mid-sized and large industrial users and developers, Colliers suggests integrating land supply considerations into the City’s industrial attraction and retention strategy. It should be noted that large industrial users have been known to leave land-constrained areas for areas with larger availability as they need to expand, and some industrial users have bypassed the Lower Mainland entirely for other areas such as Calgary which have a greater availability of land. In this environment, ensuring that developable land is available is key to attracting and retaining industrial businesses.
Additionally, industry feedback has pointed to a shortage of industrial lands available which allow for outdoor storage or truck parking. This is resulting in users which require these entitlements being willing to outbid industrial developers in areas such as Bridgeview and it is stunting the gradual redevelopment of the area. Colliers suggests reconsidering policies which heavily restrict or disallow outdoor storage or parking in industrial-only areas such as Campbell Heights, where interference with other land uses is minimal.
Finally, much of the region’s vacant industrial is fragmented into small parcels which unsuitable for large-scale development and thus are locked-in to their current low-intensity uses. The undertaking of a large-scale assembly program by an entity such as SCDC, which can operate on a longer time horizon than a private developer, could be beneficial for the intensification of industrial lands in the long-term.
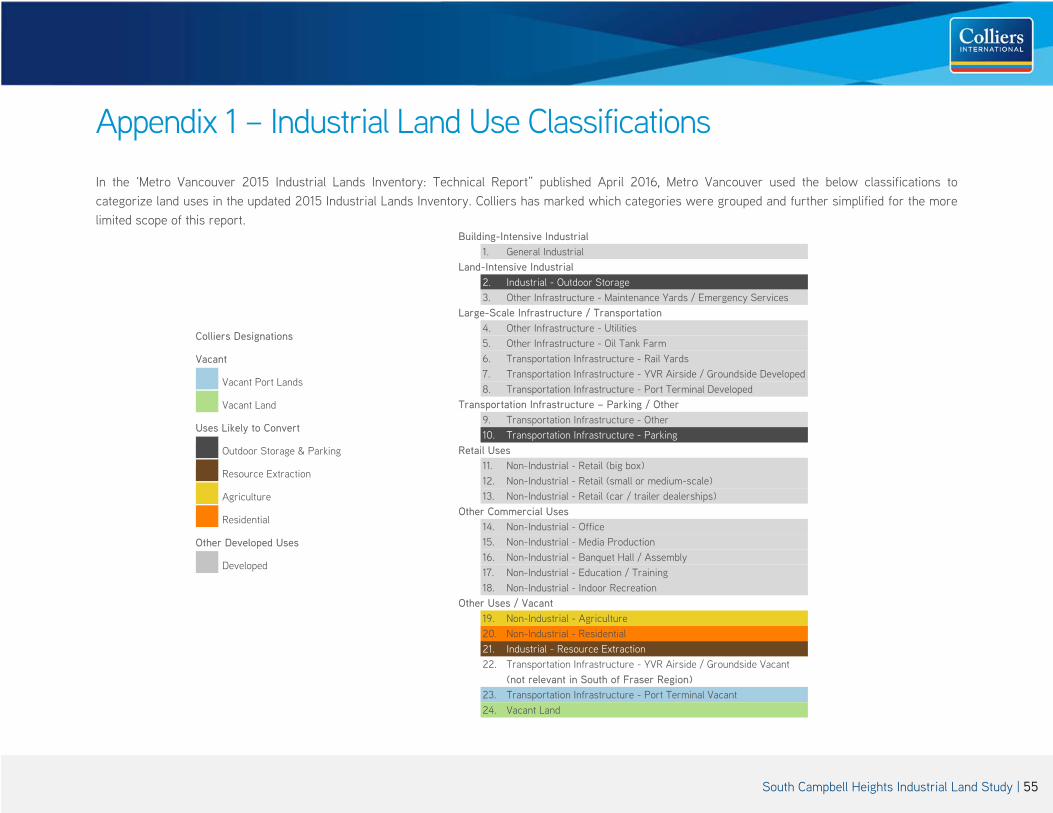
South Campbell Heights Industrial Land Study | 55
Appendix 1 – Industrial Land Use Classifications In the ‘Metro Vancouver 2015 Industrial Lands Inventory: Technical Report” published April 2016, Metro Vancouver used the below classifications to categorize land uses in the updated 2015 Industrial Lands Inventory. Colliers has marked which categories were grouped and further simplified for the more limited scope of this report.
Colliers Designations
Vacant
Vacant Port Lands
Vacant Land
Uses Likely to Convert
Outdoor Storage & Parking
Resource Extraction
Agriculture
Residential
Other Developed Uses
Developed
Building-Intensive Industrial 1. General Industrial
Land-Intensive Industrial 2. Industrial - Outdoor Storage 3. Other Infrastructure - Maintenance Yards / Emergency Services
Large-Scale Infrastructure / Transportation 4. Other Infrastructure - Utilities 5. Other Infrastructure - Oil Tank Farm 6. Transportation Infrastructure - Rail Yards 7. Transportation Infrastructure - YVR Airside / Groundside Developed 8. Transportation Infrastructure - Port Terminal Developed
Transportation Infrastructure – Parking / Other 9. Transportation Infrastructure - Other 10. Transportation Infrastructure - Parking
Retail Uses 11. Non-Industrial - Retail (big box) 12. Non-Industrial - Retail (small or medium-scale) 13. Non-Industrial - Retail (car / trailer dealerships)
Other Commercial Uses 14. Non-Industrial - Office 15. Non-Industrial - Media Production 16. Non-Industrial - Banquet Hall / Assembly 17. Non-Industrial - Education / Training 18. Non-Industrial - Indoor Recreation
Other Uses / Vacant 19. Non-Industrial - Agriculture 20. Non-Industrial - Residential 21. Industrial - Resource Extraction 22. Transportation Infrastructure - YVR Airside / Groundside Vacant
(not relevant in South of Fraser Region) 23. Transportation Infrastructure - Port Terminal Vacant 24. Vacant Land

South Campbell Heights Industrial Land Study | 56
Appendix 2 – Industry Feedback Highlights
Discussion #1 – Beedie Group
Participants:
Todd Tuen – President, Industrial Beth Berry - Director, Industrial Development Jason Tonin – Director, Land Development Ryan Jenkins – Pre-Construction Manager
Discussion #2 – Surrey City Development Corporation (SCDC)
Participants:
Jaret Lang – Director, Development and Planning Jennider Jangula – Development Assistant Tina Peng – Real Estate Analyst
Summary
Campbell Heights Industrial
Participants noted that land demand in Campbell Heights is fundamentally driven by its affordability and availability, although it is also well-positioned for logistics due to its proximity to the U.S. border. South of Fraser tenants needing to expand their business have very few options. For example, Starline Windows has recently purchased 34 acres of land in Campbell Heights North in order to efficiently group their smaller pre-existing Port Kells properties into one location. Industrial land prices are rising across the region and are even pushing past $900,000 per acre in Abbotsford. Comparatively, Campbell Heights is seen as an affordable option.
Although Campbell Heights North land has been selling at a brisk pace, it is worth noting that SCDC has been focusing on targeting larger employers due to a mandate to increase employment in the area. If instead sales had focused on developers, land could have been sold even more quickly. Demand for industrial space within Campbell Heights is also coming from local South Surrey family businesses which are actively purchasing strata units in the park.

South Campbell Heights Industrial Land Study | 57
Industrial Market Challenges
In addition to a shortage of industrial land, industrial users and developers face several other regional challenges. Due to low interest rates and high owner-user demand to purchase buildings, lease rates have remained stagnant over the past decade. This makes retrofitting or redeveloping old industrial buildings a challenge and places further pressure on demand for vacant land. In addition, municipalities, all of which are desiring cleaner, higher-order forms of industrial development such as business/technology parks, are creating onerous design requirements and zoning regulations which make it difficult for some businesses to relocate or expand. Examples include cross-dock users which are challenged to find areas allowing trailer storage.
Future Opportunities
Participants noted that few opportunities remain for industrial development throughout the region. Industrial parks are generally built-out and industrially designated-land in the region has been mostly accounted for. In addition to Campbell Heights, some limited availabilities exist, such as Delta Link, which is expected to sell out by the end of 2016, and lands in Cloverdale south of Highway 10. Other opportunities include brownfield development and assembly but these processes take time and a considerable effort to bring to the market. Barnston Island is seeing as a speculative play in the market, although there is no indication as of yet that it will be released from the Agricultural Land Reserve for industrial development. Some suggest investigating intensification opportunities for agricultural lands in addition to industrial lands in order to ensure the region is making efficient use of its resources.


