
report from the FDIC - FDIC Economic Inclusion · 2015 FDIC National Survey of Unbanked and...
88
ECONOMICINCLUSION.GOV FEDERAL DEPOSIT INSURANCE CORPORATION 2015 FDIC National Survey of Unbanked and Underbanked Households
Transcript of report from the FDIC - FDIC Economic Inclusion · 2015 FDIC National Survey of Unbanked and...
ECONOMICINCLUSION.GOV
F E D E R A L D E P O S I T I N S U R A N C E C O R P O R AT I O N
2015FDIC National Survey of Unbanked and Underbanked Households

2015FDIC National Survey of Unbanked and Underbanked Households
FEDERAL DEPOSIT INSURANCE CORPORATIONDivision of Depositor and Consumer Protection
ECONOMICINCLUSION.GOV
OCTOBER 20, 2016
Members of the FDIC Unbanked/Underbanked Survey Study Group
Susan Burhouse
Karyen Chu
Keith Ernst
Ryan Goodstein
Alicia Lloro
Gregory Lyons
Joyce Northwood
Yazmin Osaki
Sherrie Rhine
Dhruv Sharma
Jeffrey Weinstein

V
2015 FDIC National Survey of Unbanked and Underbanked Households
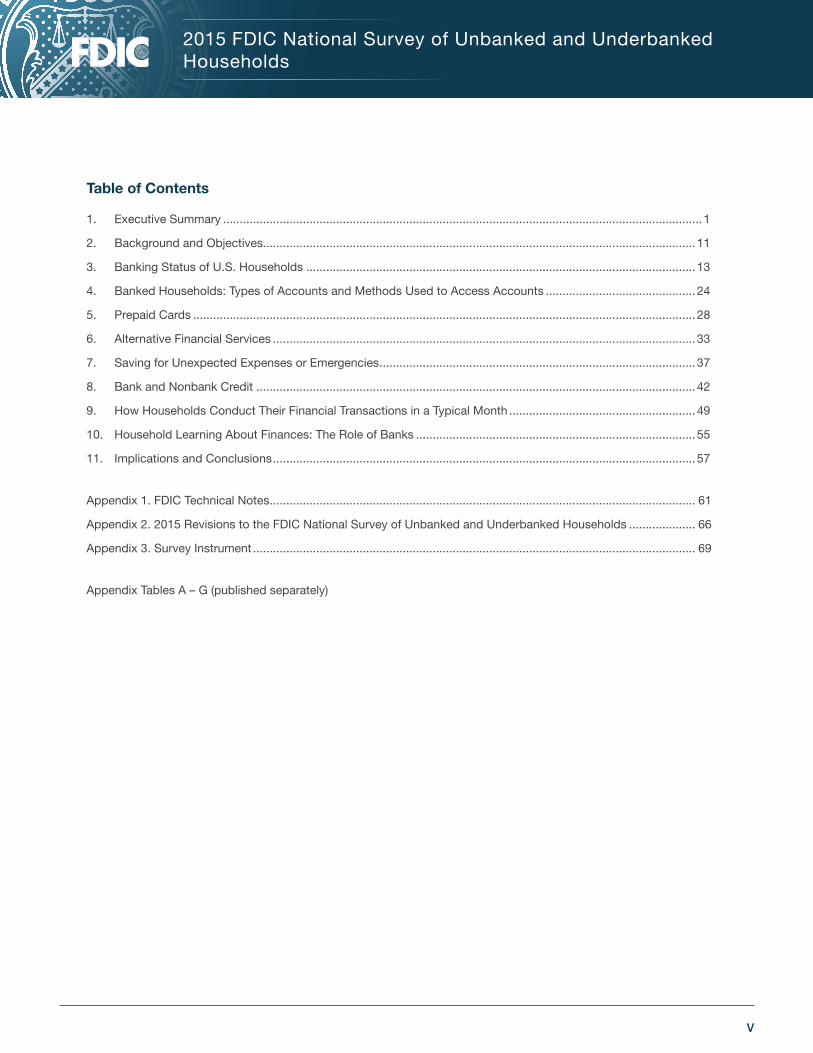
Table of Contents
1. Executive Summary ................................................................................................................................................1
2. Background and Objectives..................................................................................................................................11
3. Banking Status of U.S. Households .....................................................................................................................13
4. Banked Households: Types of Accounts and Methods Used to Access Accounts .............................................24
5. Prepaid Cards ....................................................................................................................................................... 28
6. Alternative Financial Services ...............................................................................................................................33
7. Saving for Unexpected Expenses or Emergencies ...............................................................................................37
8. Bank and Nonbank Credit ....................................................................................................................................42
9. How Households Conduct Their Financial Transactions in a Typical Month ........................................................49
10. Household Learning About Finances: The Role of Banks .................................................................................... 55
11. Implications and Conclusions ...............................................................................................................................57
Appendix 1. FDIC Technical Notes ................................................................................................................................ 61
Appendix 2. 2015 Revisions to the FDIC National Survey of Unbanked and Underbanked Households .................... 66
Appendix 3. Survey Instrument ..................................................................................................................................... 69
Appendix Tables A – G (published separately)

1
2015 FDIC National Survey of Unbanked and Underbanked Households
1. Executive Summary
Public confidence in the banking system stems in part from
how effectively banks serve the needs of the nation’s diverse
population. Accordingly, the FDIC is committed to expanding
Americans’ access to safe, secure, and affordable banking
services. The FDIC National Survey of Unbanked and Under-
banked Households is one contribution to this end.
To assess the inclusiveness of the banking system, and in
partial response to a statutory mandate, the FDIC has con-
ducted the survey biennially since 2009.1 The most recent
survey was administered in June 2015 in partnership with the
U.S. Census Bureau, collecting responses from more than
36,000 households. The survey provides estimates of the pro-
portion of U.S. households that do not have an account at an
insured institution, and the proportion that have an account
but obtained (nonbank) alternative financial services in the
past 12 months. The survey also provides insights that may
inform efforts to better meet the needs of these consumers
within the banking system.
This executive summary presents key results from the 2015
survey and summarizes the implications of these results for
policymakers, financial institutions, and other stakeholders
who are working to improve access to mainstream financial
services.
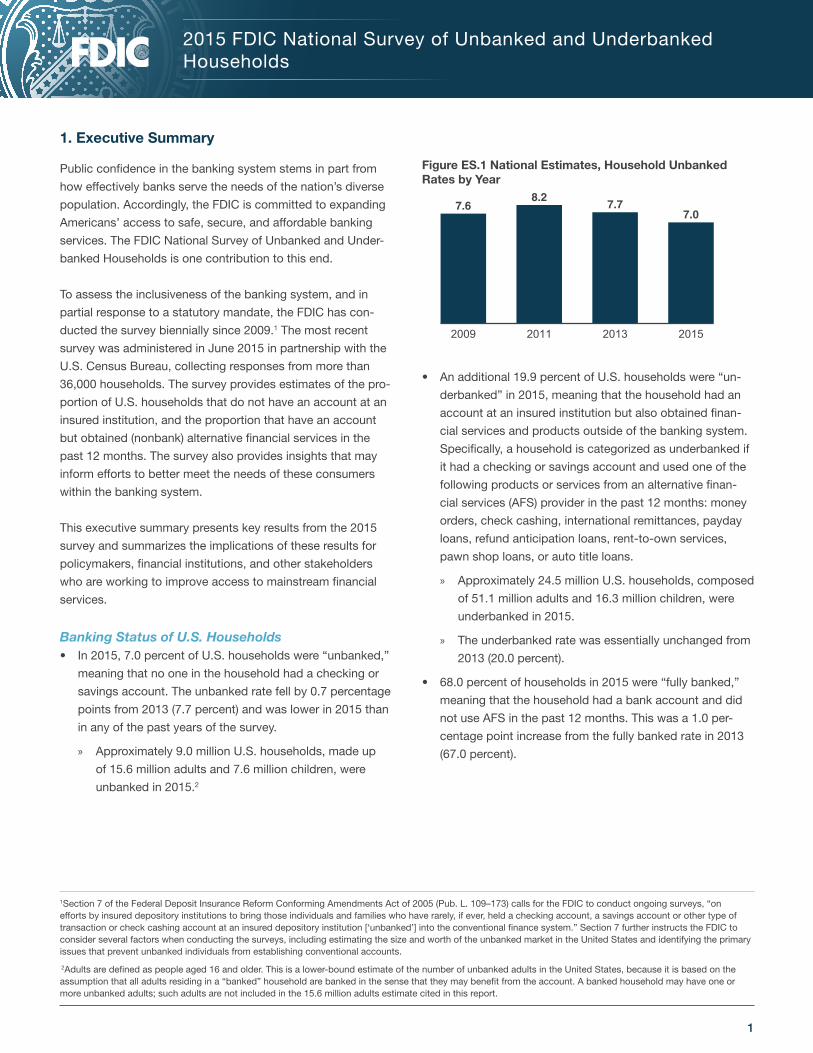
Banking Status of U.S. Households• In 2015, 7.0 percent of U.S. households were “unbanked,”
meaning that no one in the household had a checking or
savings account. The unbanked rate fell by 0.7 percentage
points from 2013 (7.7 percent) and was lower in 2015 than
in any of the past years of the survey.
» Approximately 9.0 million U.S. households, made up
of 15.6 million adults and 7.6 million children, were
unbanked in 2015.2
Figure ES.1 National Estimates, Household Unbanked Rates by Year
7.6
8.27.7
7.0
2009 2011 2013 2015
• An additional 19.9 percent of U.S. households were “un-
derbanked” in 2015, meaning that the household had an
account at an insured institution but also obtained finan-
cial services and products outside of the banking system.
Specifically, a household is categorized as underbanked if
it had a checking or savings account and used one of the
following products or services from an alternative finan-
cial services (AFS) provider in the past 12 months: money
orders, check cashing, international remittances, payday
loans, refund anticipation loans, rent-to-own services,
pawn shop loans, or auto title loans.
» Approximately 24.5 million U.S. households, composed
of 51.1 million adults and 16.3 million children, were
underbanked in 2015.
» The underbanked rate was essentially unchanged from
2013 (20.0 percent).
• 68.0 percent of households in 2015 were “fully banked,”
meaning that the household had a bank account and did
not use AFS in the past 12 months. This was a 1.0 per-
centage point increase from the fully banked rate in 2013
(67.0 percent).
1Section 7 of the Federal Deposit Insurance Reform Conforming Amendments Act of 2005 (Pub. L. 109–173) calls for the FDIC to conduct ongoing surveys, “on efforts by insured depository institutions to bring those individuals and families who have rarely, if ever, held a checking account, a savings account or other type of transaction or check cashing account at an insured depository institution [‘unbanked’] into the conventional finance system.” Section 7 further instructs the FDIC to consider several factors when conducting the surveys, including estimating the size and worth of the unbanked market in the United States and identifying the primary issues that prevent unbanked individuals from establishing conventional accounts.
2Adults are defined as people aged 16 and older. This is a lower-bound estimate of the number of unbanked adults in the United States, because it is based on the assumption that all adults residing in a “banked” household are banked in the sense that they may benefit from the account. A banked household may have one or more unbanked adults; such adults are not included in the 15.6 million adults estimate cited in this report.
2 | 2015 FDIC National Survey of Unbanked and Underbanked Households
Changes in Banking Status• Approximately half of the decline in the unbanked rate
from 2013 to 2015 can be attributed to improvements in
the socioeconomic circumstances of U.S. households.
However, even after accounting for these changes, the
remaining decline in the unbanked rate across years was
statistically significant.3
• Consistent with previous results, banking status varied
considerably across the U.S. population in 2015. For
example, unbanked and underbanked rates were higher
among the following groups: lower-income households,
less-educated households, younger households, black
and Hispanic households, and working-age disabled
households.4
• Reflecting the decline in the unbanked rate at the nation-
al level, unbanked rates fell between 2013 and 2015 for
many segments of the population.
» In particular, unbanked rates declined substantial-
ly among groups that had high unbanked rates in
2013, including households with incomes of less than
$15,000, younger households, and black and Hispanic
households. Despite these improvements, unbanked
rates within these groups remained substantially higher
than the overall unbanked rate in 2015.
» Some segments of the population that experienced
declines in unbanked rates also experienced declines
in underbanked rates. This was true for black house-
holds, for whom the unbanked rate decreased from
20.6 percent in 2013 to 18.2 percent in 2015. The
underbanked rate also decreased among black house-
holds, resulting in a large increase in the fully banked
rate from 40.0 percent in 2013 to 45.5 percent in 2015.5
• Unbanked rates increased between 2013 and 2015 for
some groups. In particular, among Asian households the
unbanked rate increased from 2.2 to 4.0 percent. Under-
banked rates also increased among Asian households,
leading to a substantial decline in the fully banked rate
(from 73.4 to 67.2 percent).
Income Volatility and Banking Status The 2015 survey added a new question to examine the po-
tential influence of income volatility on the ways households
manage their finances.
• More than one in five U.S. households had income that
“varied somewhat from month to month” or “varied a lot
from month to month” (over the past 12 months). Un-
banked and underbanked rates were higher among these
households.
• Unbanked rates among households with income that
varied somewhat or a lot from month to month were 8.7
and 12.9 percent, respectively, compared to 5.7 percent
among households with income that “was about the same
each month.”
• An additional 26.6 and 30.9 percent of households with
income that varied somewhat or a lot, respectively, were
underbanked, compared to 19.1 percent among those
with steady monthly income.
• Even among households with higher levels of income,
unbanked and underbanked rates were higher when that
income was volatile. For example, among households with
annual income between $50,000 and $75,000, unbanked
rates among those with income that varied somewhat or
a lot were 2.9 and 4.1 percent, respectively, compared to
less than 1 percent for those with steady monthly income.
3A linear probability model was estimated to account for changes from 2013 to 2015 in the distribution of households across the household-level characteristics shown in Appendix Table A.2. Changes in the socioeconomic characteristics of households (income, employment status, homeownership status, and educational attainment) between 2013 and 2015 accounted for about half of the difference in unbanked rates between 2013 and 2015. Adding additional controls for the remaining demographic characteristics listed in Appendix Table A.2 had little effect on the remaining difference.
4For characteristics that vary at the person-level, such as race, age, education, and employment, the characteristics of the owner or renter of the home (i.e., “householder”) are used to represent the household. For convenience, abbreviated language is used when referring to certain household characteristics. For example, the term “white household” refers to a household in which the householder has been identified as white, non-black, non-Hispanic, and non-Asian. The phrase “working-age disabled” refers to a household in which the householder has a disability and is aged 25 to 64. See Appendix 1 for additional details.
5As noted in Table 3.3, the decline in the underbanked rate among black households is not statistically significant at the 10 percent level, although the increase in the fully banked rate is statistically significant.
YearNumber of Households
(1000s)Unbanked(Percent)
Underbanked(Percent)
Fully banked(Percent)
Banked, underbanked status unknown
(Percent)
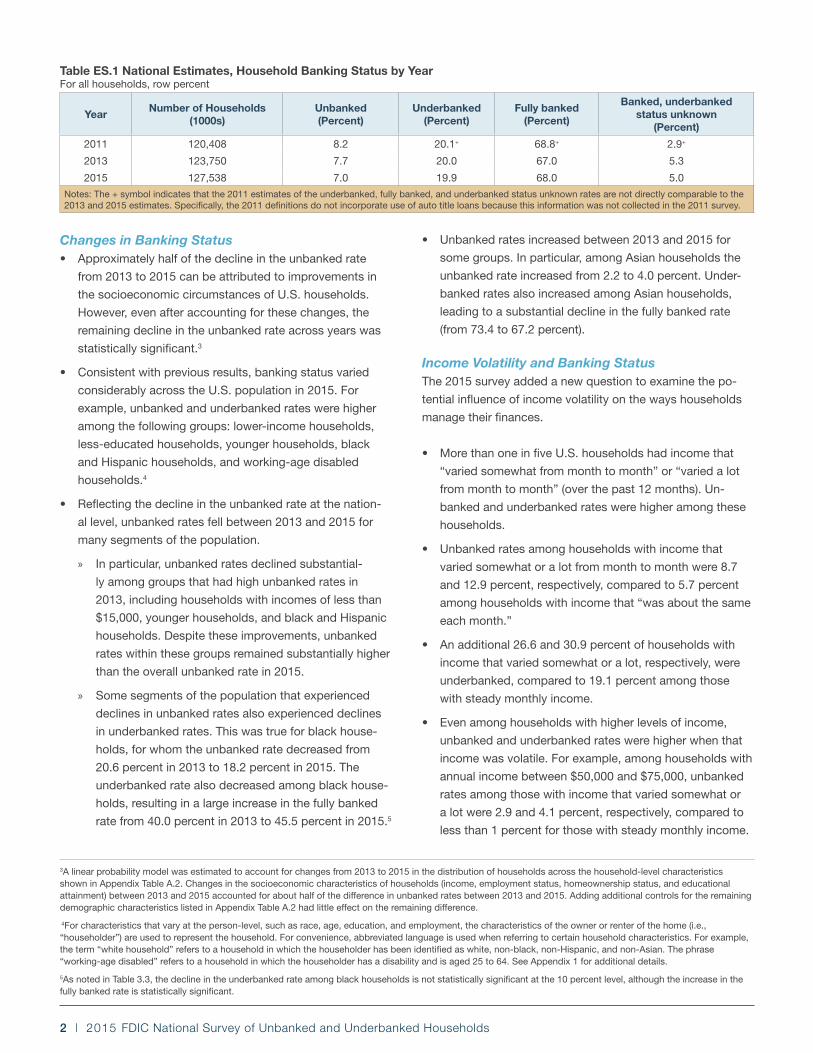
2011 120,408 8.2 20.1+ 68.8+ 2.9+
2013 123,750 7.7 20.0 67.0 5.3
2015 127,538 7.0 19.9 68.0 5.0
Notes: The + symbol indicates that the 2011 estimates of the underbanked, fully banked, and underbanked status unknown rates are not directly comparable to the 2013 and 2015 estimates. Specifically, the 2011 definitions do not incorporate use of auto title loans because this information was not collected in the 2011 survey.
Table ES.1 National Estimates, Household Banking Status by YearFor all households, row percent
3
Reasons Households Were UnbankedAs in previous years, the 2015 survey asked unbanked house-
holds about the reasons why they did not have an account.
The 2015 estimates were qualitatively quite similar to those
from the 2013 survey.
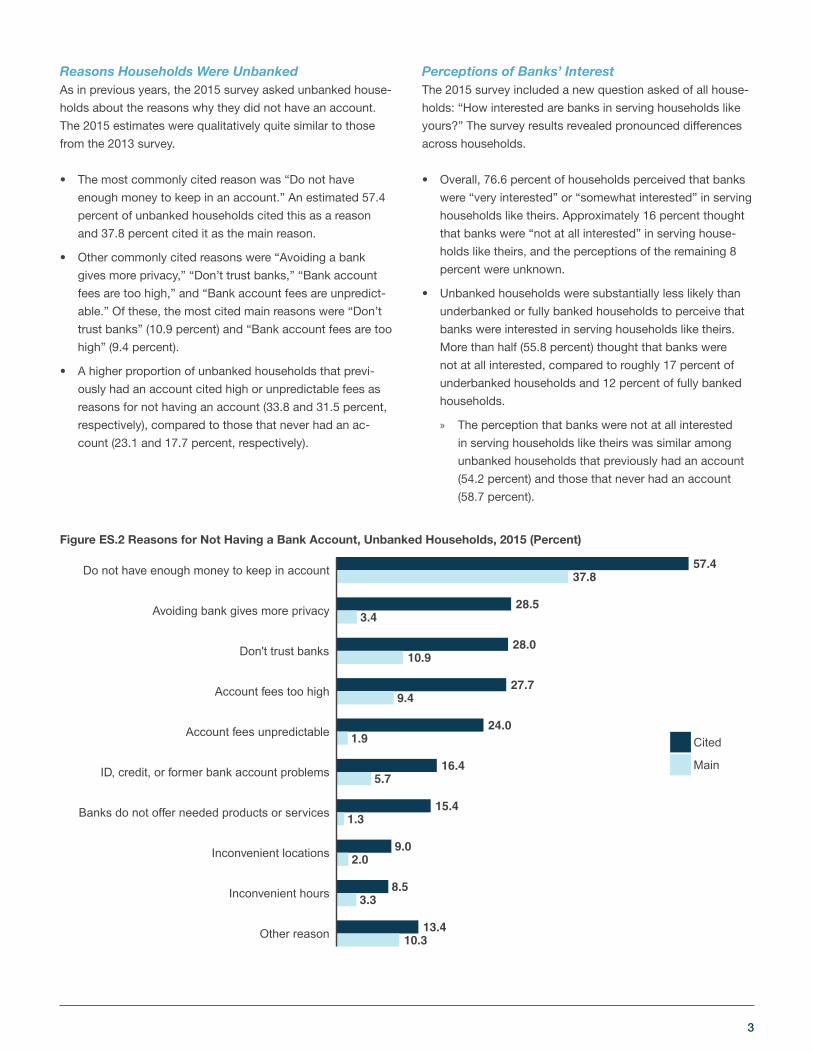
• The most commonly cited reason was “Do not have
enough money to keep in an account.” An estimated 57.4
percent of unbanked households cited this as a reason
and 37.8 percent cited it as the main reason.
• Other commonly cited reasons were “Avoiding a bank
gives more privacy,” “Don’t trust banks,” “Bank account
fees are too high,” and “Bank account fees are unpredict-
able.” Of these, the most cited main reasons were “Don’t
trust banks” (10.9 percent) and “Bank account fees are too
high” (9.4 percent).
• A higher proportion of unbanked households that previ-
ously had an account cited high or unpredictable fees as
reasons for not having an account (33.8 and 31.5 percent,
respectively), compared to those that never had an ac-
count (23.1 and 17.7 percent, respectively).
Perceptions of Banks’ Interest The 2015 survey included a new question asked of all house-
holds: “How interested are banks in serving households like
yours?” The survey results revealed pronounced differences
across households.
• Overall, 76.6 percent of households perceived that banks
were “very interested” or “somewhat interested” in serving
households like theirs. Approximately 16 percent thought
that banks were “not at all interested” in serving house-
holds like theirs, and the perceptions of the remaining 8
percent were unknown.
• Unbanked households were substantially less likely than
underbanked or fully banked households to perceive that
banks were interested in serving households like theirs.
More than half (55.8 percent) thought that banks were
not at all interested, compared to roughly 17 percent of
underbanked households and 12 percent of fully banked
households.
» The perception that banks were not at all interested
in serving households like theirs was similar among
unbanked households that previously had an account
(54.2 percent) and those that never had an account
(58.7 percent).
13.410.3
8.53.3
9.02.0
15.41.3
16.45.7
24.01.9
27.79.4
28.010.9
28.53.4
57.437.8
Other reason
Inconvenient hours
Inconvenient locations
Banks do not offer needed products or services
ID, credit, or former bank account problems
Account fees unpredictable
Account fees too high
Don't trust banks
Avoiding bank gives more privacy
Do not have enough money to keep in account
Cited
Main
Figure ES.2 Reasons for Not Having a Bank Account, Unbanked Households, 2015 (Percent)

4 | 2015 FDIC National Survey of Unbanked and Underbanked Households
» Among unbanked households that thought banks were
not at all interested in serving households like theirs,
only 17.3 percent were very or somewhat likely to open
an account in the next 12 months compared to 50.4
percent among unbanked households that perceived
banks to be very or somewhat interested in serving
households like theirs.
Banked Households: Types of Accounts • Among banked households in 2015, patterns of savings
and checking account ownership were generally similar to
previous years.
» Almost all banked households had a checking account
(98.0 percent), while roughly three in four (77.8 percent)
had a savings account.
» Savings account ownership was substantially lower
among certain segments of the population, including
households with lower income and lower education,
black and Hispanic households, and working-age
disabled households.
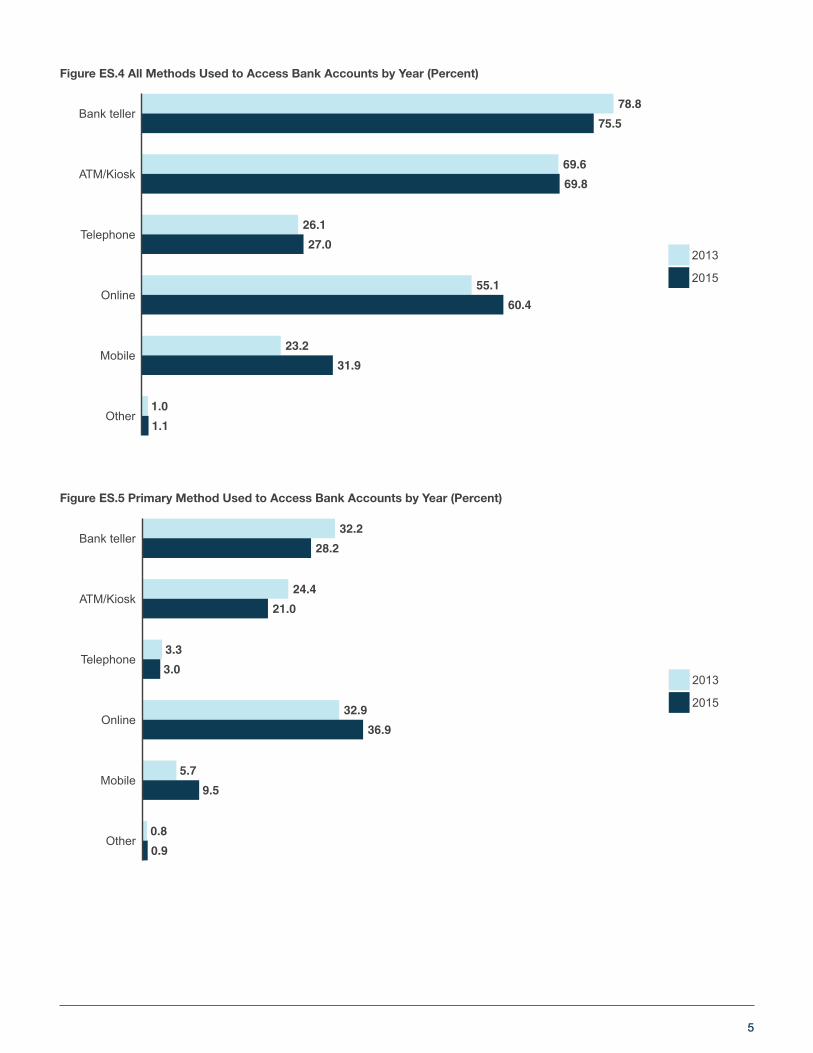
Banked Households: Methods Used to Access Accounts• Use of online and mobile banking to access accounts in-
creased substantially from 2013 to 2015, while use of bank
tellers decreased. However, use of bank tellers remained
quite prevalent, particularly among segments of the popu-
lation that had higher unbanked and underbanked rates.
» The proportion of banked households that used online
banking to access their accounts in the past 12 months
increased from 55.1 percent in 2013 to 60.4 percent in
2015. Further, 31.9 percent of banked households in
2015 used mobile banking, compared to 23.2 percent
in 2013.
» The proportion of households that used a bank teller to
access their accounts in the past 12 months fell from
78.8 percent in 2013 to 75.5 percent in 2015.
» Use of bank tellers was especially prevalent among
lower-income households, less-educated households,
older households, and households located in rural
areas.
» Slightly less than half (49.2 percent) of banked house-
holds used a physical channel (bank branch or ATM/
kiosk) as the primary method for accessing a bank
account.
76.6 15.8 5.5 2.1
30.9 55.8 9.1 4.2
79.4 16.6 4.0
83.9 12.0 4.0Fully banked
Underbanked
Unbanked
All
Very or somewhat Not at all Unknown: Don't know/Refused Unknown: Dropped out
Figure ES.3 “How Interested Are Banks in Serving Households Like Yours?” by Banking Status, 2015 (Percent)
Notes: The category “Unknown: Don’t know/Refused” includes households that were asked the survey question but did not select a response (“very interested,” “somewhat interested,” or “not at all interested”). The category “Unknown: Dropped out” includes households that dropped out of the survey before this question.
5
1.0
1.1
23.2
31.9
55.1
60.4
26.1
27.0
69.6
69.8
78.8
75.5
Other
Mobile
Online
Telephone
ATM/Kiosk
Bank teller
2013
2015
0.8
0.9
5.7
9.5
32.9
36.9
3.3
3.0
24.4
21.0
32.2
28.2
Other
Mobile
Online
Telephone
ATM/Kiosk
Bank teller
2013
2015
Figure ES.4 All Methods Used to Access Bank Accounts by Year (Percent)
Figure ES.5 Primary Method Used to Access Bank Accounts by Year (Percent)
6 | 2015 FDIC National Survey of Unbanked and Underbanked Households
Prepaid Cards Some consumers use general purpose reloadable prepaid
cards to address their financial transaction needs. Similar to a
checking account, these cards can be used to pay bills, with-
draw cash at ATMs, make purchases, deposit checks, and
receive direct deposits. These cards may have been obtained
from sources such as a bank location or bank website, a non-
bank store or website, a government agency, or an employer.
Many, although not all, such cards store funds in accounts
eligible for deposit insurance.6
• Between 2013 and 2015, the proportion of households
that used a prepaid card in the past 12 months increased
from 7.9 percent to 9.8 percent. This growth occurred
broadly across socioeconomic and demographic groups.
• Consistent with results from the 2013 survey, prepaid card
use in 2015 was higher among lower-income households,
less-educated households, younger households, black
households, and working-age disabled households.
• Households with income that varied somewhat or a lot
from month to month were more likely to use prepaid
cards in 2015 (13.5 percent and 15.5 percent, respectively)
than households with income that was about the same
each month (9.2 percent). This pattern held for households
of all income levels.
• Use of prepaid cards was most prevalent among un-
banked households. An estimated 27.1 percent of un-
banked households used a prepaid card in 2015, com-
pared to 15.4 percent of underbanked households and 6.9
percent of fully banked households.
» Unbanked households that used prepaid cards were
more likely to have had a bank account at some point
in the past: 64.1 percent of unbanked households that
used prepaid cards had a bank account in the past
versus 42.3 percent of unbanked households that did
not use prepaid cards.
• Households that used prepaid cards obtained the cards
from a variety of sources. The most common source was a
store or website that is not a bank (42.6 percent of house-
holds that used prepaid cards obtained cards from this
source), followed by a bank location or a bank’s website
(17.3 percent).
Alternative Financial Services• In 2015, almost one in four households (24.0 percent) used
AFS in the past 12 months.7
» Use of transaction AFS continued to be substantially
more common than use of credit AFS: 20.2 percent of
households used transaction AFS, and 7.7 percent of
households used credit AFS.8
• Consistent with previous reports, use of AFS was much
higher among unbanked households than banked house-
holds.
» The proportion of unbanked households that used
AFS, however, fell by about 10 percent between 2013
and 2015. This decline was attributable to decreased
use of transaction AFS among the unbanked.
• Households with volatile income were more likely to use
AFS.
» Use of transaction AFS among households with
income that varied somewhat or a lot from month to
month was 27.7 and 34.3 percent, respectively, com-
pared to 18.9 percent among households with income
that was about the same each month. Similarly, use of
credit AFS was substantially higher among households
with more volatile income.
» These patterns held even among households with
higher levels of income.
Saving for Unexpected Expenses or EmergenciesSavings can help households better manage unexpected
expenses or emergencies, such as health issues or major au-
tomobile repairs. The absence of savings can sometimes be a
barrier to financial stability and resilience, particularly for con-
sumers with uneven or low incomes. To gain insight into these
issues, the 2015 survey included new questions on whether
households saved for unexpected expenses or emergencies
and the methods they used.
• Overall, 56.3 percent of households saved; that is, they set
aside money in the past 12 months that could be used for
unexpected expenses or emergencies, even if the funds
were later spent.
» Rates of saving for unexpected expenses or emergen-
cies were lower among certain segments of the popu-
6Unless noted otherwise, estimates of prepaid card use are based on the 12 months before the survey. Households were instructed that the survey questions about prepaid cards were “not asking about gift cards or debit cards linked to a checking account.”
7Unless noted otherwise, all estimates of AFS use are based on the 12 months before the survey.
8For the purposes of this report, transaction AFS include the following nonbank products and services: money orders, check cashing, and international remittances. Credit AFS include the following nonbank products and services that may be used in lieu of bank credit: payday loans, refund anticipation loans, rent-to-own services, pawn shop loans, and auto title loans.

7
lation, including lower-income households, less-edu-
cated households, black and Hispanic households, and
working-age disabled households.
» Unbanked households saved for unexpected expenses
or emergencies at a much lower rate than underbanked
and fully banked households: 20.2 percent of un-
banked households saved for this purpose, compared
to 55.2 percent of underbanked households and 60.0
percent of fully banked households.
• Among all households that saved for unexpected expens-
es or emergencies, savings accounts were the most used
savings method followed by checking accounts: more
than four in five (84.9 percent) kept savings in one of these
accounts. About one in ten (10.5 percent) households that
saved maintained savings in the home, or with family or
friends.
» The use of formal (e.g., savings or checking accounts)
and informal (e.g., in the home, or with family or
friends) savings methods varied by household charac-
teristics. For example, among households that saved
for unexpected expenses or emergencies, lower-in-
come households, less-educated households, and
working-age disabled households were less likely to
keep savings in a savings account and more likely to
maintain savings in the home, or with family or friends.
» Unbanked households generally saved using informal
methods, while underbanked and fully banked house-
holds generally saved using formal methods. Un-
banked households that saved primarily kept savings
in the home, or with family or friends, and on prepaid
cards. In contrast, underbanked and fully banked
households that saved primarily used savings and
checking accounts.
70.1
24.5
10.5
0.53.0
0.7
67.8
12.6
65.7
24.7
16.7
0.7
73.4
25.2
7.0
0.1
All Unbanked Underbanked Fully banked
Savings account Checking account In home, or with family or friends Prepaid card
Figure ES.6 Selected Savings Methods for Households That Saved by Banking Status, 2015 (Percent)

8 | 2015 FDIC National Survey of Unbanked and Underbanked Households
Bank and Nonbank CreditTo gain a more complete picture of household credit behavior,
the 2015 survey included a new series of questions on bank
credit, in addition to questions about nonbank credit asked in
previous surveys. Specifically, households were asked wheth-
er, in the past 12 months, they had a credit card or a personal
loan or line of credit from a bank (i.e., “bank credit”), applied
for bank credit, were denied bank credit or not given as much
credit as they applied for (i.e., “denied”), or thought about
applying for bank credit but did not because they thought
they might be turned down (i.e., “felt discouraged about ap-
plying”). Households were also asked whether they fell behind
on bills in the past 12 months.
• Most households had bank credit, though a significant
share of households used nonbank credit.
» 67.9 percent of households had bank credit, and 63.8
percent of households had bank credit only.
» 8.2 percent of households used nonbank credit.
About half of these households had a mix of bank and
nonbank credit (4.0 percent), and the other half (4.1
percent) had nonbank credit only.
» The remaining 28.0 percent of households did not use
any of the credit products asked about in the survey.
Figure ES.7 Bank and Nonbank Credit, 2015 (Percent)
No credit28.0
Nonbankcredit only4.1
Bank andnonbank credit4.0
Bankcredit only
63.8
Note: Households may have used credit products that were not asked about in the survey (e.g., mortgages, auto loans, certain nonbank installment loans, and informal loans from family or friends).
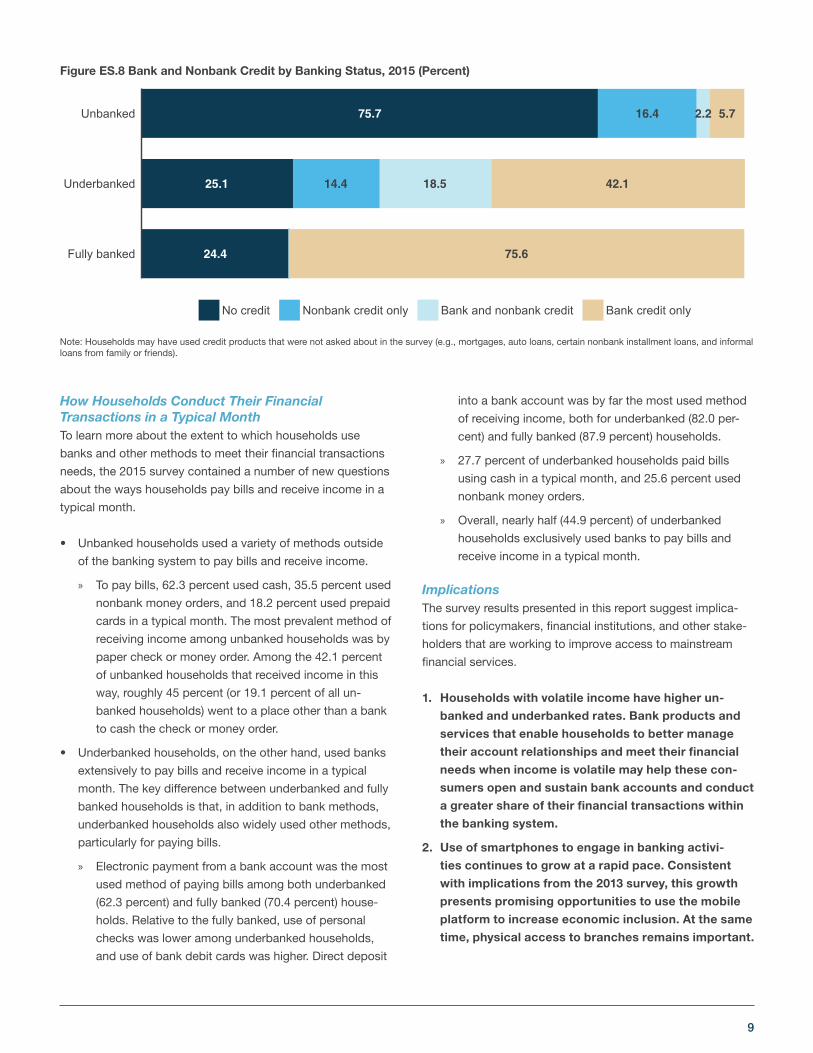
• Similar shares of underbanked and fully banked house-
holds had credit: 74.9 percent of underbanked and 75.6
percent of fully banked households had at least one of the
credit products asked about in the survey.
• Many underbanked households had credit from nonbank
sources. While 42.1 percent of underbanked households
had bank credit only, nearly one in five (18.5 percent) had
both bank and nonbank credit and 14.4 percent had only
nonbank credit.
• Lower-income, less-educated, black, Hispanic, and work-
ing-age disabled households were more likely to use non-
bank credit only or not to use any of the credit products
asked about in the survey.
• Households with volatile income were more likely to use
nonbank credit, either on its own or in addition to bank
credit.
» 7.9 percent of households with income that varied a
lot from month to month used only nonbank credit,
and 7.6 percent used both bank and nonbank credit.
In comparison, 3.4 percent of households with income
that was about the same each month used nonbank
credit only and 3.5 percent had credit from both banks
and nonbanks.
» Income volatility was associated with greater nonbank
credit use even for higher-income households.
• Use of nonbank credit was strongly associated with
whether the household was denied bank credit, felt
discouraged about applying for bank credit, or reported
falling behind on bills.
» Among households that applied for bank credit and
were denied, 24.7 percent used nonbank credit (15.2
percent had both bank and nonbank credit, while 9.5
percent used nonbank credit only). In comparison, only
7.7 percent of households that were not denied (or did
not apply) used nonbank credit.
» Similarly, 28.7 percent of households that were dis-
couraged about applying for bank credit used nonbank
credit, compared to 6.8 percent among those that were
not discouraged about applying. Also, 24.7 percent
of households that fell behind on bills used nonbank
credit, compared to 4.8 percent among those that did
not fall behind on bills.
• For the purposes of this report, we classify a household as
having credit needs that were not fully met by banks if the
household was denied bank credit, felt discouraged about
applying for bank credit, or used any nonbank credit prod-
uct. Applying this convention, 13.7 percent of households
had credit needs that were not fully met by banks. About
half (52.5 percent) of these households reported that they
stayed current on bills.
9
How Households Conduct Their Financial Transactions in a Typical Month To learn more about the extent to which households use
banks and other methods to meet their financial transactions
needs, the 2015 survey contained a number of new questions
about the ways households pay bills and receive income in a
typical month.
• Unbanked households used a variety of methods outside
of the banking system to pay bills and receive income.
» To pay bills, 62.3 percent used cash, 35.5 percent used
nonbank money orders, and 18.2 percent used prepaid
cards in a typical month. The most prevalent method of
receiving income among unbanked households was by
paper check or money order. Among the 42.1 percent
of unbanked households that received income in this
way, roughly 45 percent (or 19.1 percent of all un-
banked households) went to a place other than a bank
to cash the check or money order.
• Underbanked households, on the other hand, used banks
extensively to pay bills and receive income in a typical
month. The key difference between underbanked and fully
banked households is that, in addition to bank methods,
underbanked households also widely used other methods,
particularly for paying bills.
» Electronic payment from a bank account was the most
used method of paying bills among both underbanked
(62.3 percent) and fully banked (70.4 percent) house-
holds. Relative to the fully banked, use of personal
checks was lower among underbanked households,
and use of bank debit cards was higher. Direct deposit
into a bank account was by far the most used method
of receiving income, both for underbanked (82.0 per-
cent) and fully banked (87.9 percent) households.
» 27.7 percent of underbanked households paid bills
using cash in a typical month, and 25.6 percent used
nonbank money orders.
» Overall, nearly half (44.9 percent) of underbanked
households exclusively used banks to pay bills and
receive income in a typical month.
ImplicationsThe survey results presented in this report suggest implica-
tions for policymakers, financial institutions, and other stake-
holders that are working to improve access to mainstream
financial services.
1. Households with volatile income have higher un-
banked and underbanked rates. Bank products and
services that enable households to better manage
their account relationships and meet their financial
needs when income is volatile may help these con-
sumers open and sustain bank accounts and conduct
a greater share of their financial transactions within
the banking system.
2. Use of smartphones to engage in banking activi-
ties continues to grow at a rapid pace. Consistent
with implications from the 2013 survey, this growth
presents promising opportunities to use the mobile
platform to increase economic inclusion. At the same
time, physical access to branches remains important.
75.7
25.1
24.4
16.4
14.4
2.2
18.5
5.7
42.1
75.6Fully banked
Underbanked
Unbanked
No credit Nonbank credit only Bank and nonbank credit Bank credit only
Figure ES.8 Bank and Nonbank Credit by Banking Status, 2015 (Percent)
Note: Households may have used credit products that were not asked about in the survey (e.g., mortgages, auto loans, certain nonbank installment loans, and informal loans from family or friends).
10 | 2015 FDIC National Survey of Unbanked and Underbanked Households
3. One in five unbanked households save for unex-
pected expenses, although for the most part not in
insured depositories. Bringing these savings into
the banking system could allow these households to
build banking relationships that help them safeguard
funds, enhance access to credit, and increase finan-
cial security.
4. Banks may have the opportunity to help meet the
credit needs of some households that have an unmet
demand for bank credit. The vast majority of these
households are banked, yet few applied for bank
credit in the past 12 months. Many are also young.
Banks could help meet the credit needs of these
households by promoting the importance of building
a credit history, incorporating nontraditional data
into underwriting, and increasing households’ aware-
ness of personal credit products.
5. The great majority of underbanked households use
banks to pay bills, although many also use cash and
nonbank money orders. Efforts to encourage and
make it easier for a range of payees to accept elec-
tronic payments, and outreach to raise awareness of
bill pay and other electronic payments among low-
er-income households, may facilitate the movement
of these transactions into the banking system.
6. The majority of unbanked households think that
banks have no interest in serving households like
theirs, and a significant share of unbanked house-
holds do not trust banks. These findings suggest
that understanding and addressing the sources of
these attitudes and building trust and familiarity are
important to attract and develop relationships with
unbanked consumers.
11
2015 FDIC National Survey of Unbanked and Underbanked Households
2. Background and Objectives
BackgroundWhen households open an account at a federally insured
depository institution, they establish a mainstream banking re-
lationship that provides them the opportunity to deposit funds
securely, conduct basic financial transactions, accumulate
savings, and access credit on fair and affordable terms.
Despite these benefits, many households—referred to in
this report as “unbanked”—do not have an account at an
insured institution. Other households have an account, but
also obtained financial services and products from alterna-
tive financial services (AFS) providers in the past 12 months.
These households are referred to as “underbanked” in this
report. Unbanked and underbanked households present an
opportunity for banks to expand access to and utilization of
their products and services.
The FDIC recognizes that public confidence in the banking
system is strengthened when banks effectively serve the
broadest possible set of consumers. As a result, the agency
is committed to expanding economic inclusion in the finan-
cial mainstream by ensuring that all Americans have access
to safe, secure, and affordable banking services. The FDIC
National Survey of Unbanked and Underbanked Households
represents one contribution to this end.
Conducted to assess the inclusiveness of the banking sys-
tem, and in partial response to a statutory mandate, this bien-
nial survey provides estimates of unbanked and underbanked
populations. It also seeks to offer insights that will inform
efforts to better meet the needs of these groups.
The FDIC conducts the household survey in partnership
with the U.S. Census Bureau. Specifically, the FDIC spon-
sors a special supplement on unbanked and underbanked
households that is administered in conjunction with Census
Bureau’s Current Population Survey (CPS).
The first FDIC National Survey of Unbanked and Under-
banked Households was conducted in January 2009, and
subsequent surveys were conducted in June 2011, June
2013, and June 2015. Results from these surveys are avail-
able at http://www.economicinclusion.gov.
This report presents the results of the 2015 FDIC National
Survey of Unbanked and Underbanked Households. This sur-
vey was conducted in June 2015, collecting responses from
36,189 households. See Appendix 1 (FDIC Technical Notes)
for additional details.
Where appropriate, this report discusses trends in survey
results over time. In certain cases, results are not comparable
across years, because of changes in the survey instrument.
For example, underbanked rates in 2015 and 2013 are not
comparable to the 2011 or 2009 estimates, because of dif-
ferences in the types of AFS included in the survey that were
used to categorize households as underbanked.
The results of this survey complement other FDIC efforts
to increase sustainable and safe access to the financial
mainstream. For more information on those efforts and for
additional resources from this survey, including the ability
to query the underlying data, readers should visit
http://www.economicinclusion.gov.
The FDIC encourages researchers, policymakers, consumer
and community groups, and financial institutions to use the
publicly available data to improve understanding of the issues
and challenges underserved households perceive when de-
ciding how and where to conduct financial transactions. The
information provided in this report, as well as future analyses
produced with the publicly available data, will contribute to
efforts to create sustainable banking opportunities for a broad
set of consumers.
What’s NewA number of changes were made to the 2015 survey
instrument to provide additional information about the
characteristics of unbanked and underbanked households.
The details of these changes, summarized below, are
provided in Appendix 2.
The notable additions to the 2015 survey instrument fall into
five main areas.

12 | 2015 FDIC National Survey of Unbanked and Underbanked Households
First, questions were added to obtain additional information
about household economic circumstances and perceptions.
A new question asked households to indicate the extent to
which their income varied from month to month over the past
12 months, and another asked households whether they fell
behind on bill payments over the same period. Households
were also asked, “How interested are banks in serving house-
holds like yours?”
Second, questions about certain mainstream credit products
were added. Specifically, a new question asked households
whether they had a credit card in the past 12 months, and
another asked about personal loans or lines of credit from a
bank. These “bank credit” products are potential substitutes
for the small-dollar, short-term credit available from AFS
providers. Households were also asked about new applica-
tions and denials for such bank credit, and whether they felt
discouraged about applying for such credit because they
thought they might be turned down.
Third, the survey included new questions about household
saving for unexpected expenses or emergencies. Households
were asked whether they saved for this purpose in the past
12 months (even if they later spent the funds). Households
that saved were also asked where they kept the funds.
Fourth, to explore the ways that households use banks and
other providers to meet their financial transactions needs, the
survey included new questions about the ways households
pay bills (for things like a mortgage, rent, utilities, or child
care) and receive income (from work, government benefits, or
other regular sources) in a typical month.
Finally, the survey included new questions about the role that
banks play in helping consumers learn about managing their
finances and financial products. Specifically, a question was
added on whether households asked a bank teller or cus-
tomer service agent about financial products or services, or
about managing money. Another question asked households
whether they attended a financial education or counseling
session, and if so, whether they learned about the session
from a bank.
13
2015 FDIC National Survey of Unbanked and Underbanked Households
3. Banking Status of U.S. Households
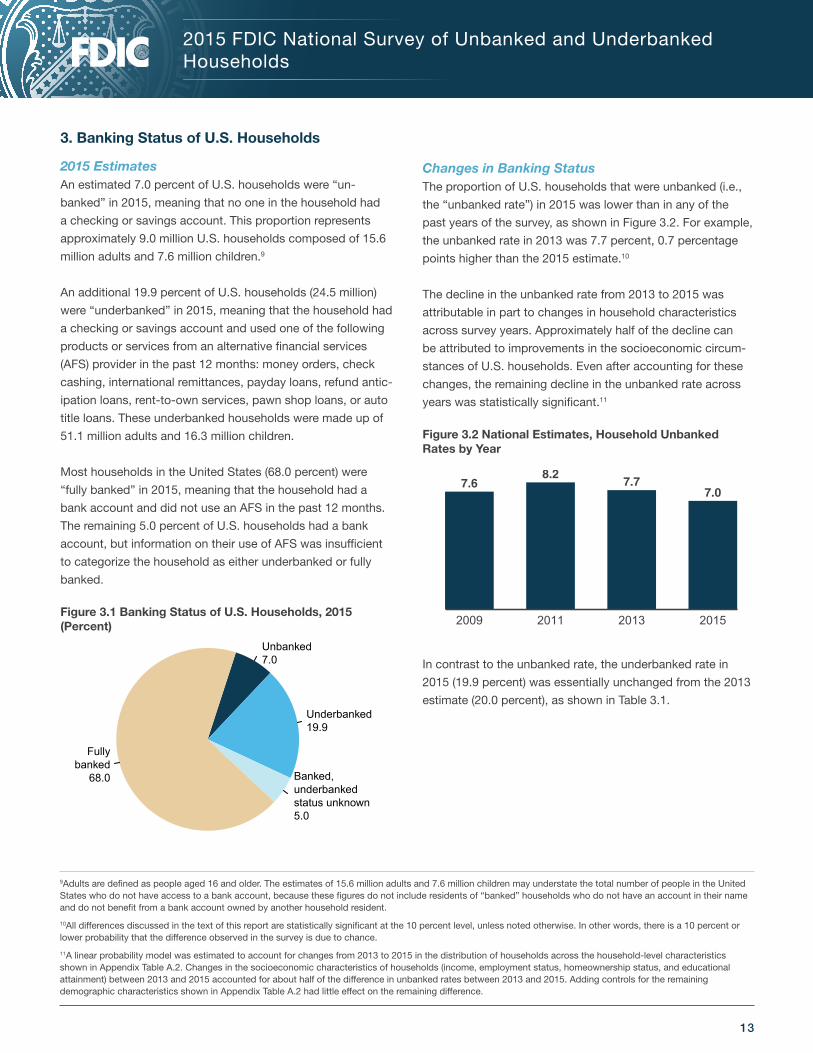
2015 EstimatesAn estimated 7.0 percent of U.S. households were “un-
banked” in 2015, meaning that no one in the household had
a checking or savings account. This proportion represents
approximately 9.0 million U.S. households composed of 15.6
million adults and 7.6 million children.9
An additional 19.9 percent of U.S. households (24.5 million)
were “underbanked” in 2015, meaning that the household had
a checking or savings account and used one of the following
products or services from an alternative financial services
(AFS) provider in the past 12 months: money orders, check
cashing, international remittances, payday loans, refund antic-
ipation loans, rent-to-own services, pawn shop loans, or auto
title loans. These underbanked households were made up of
51.1 million adults and 16.3 million children.
Most households in the United States (68.0 percent) were
“fully banked” in 2015, meaning that the household had a
bank account and did not use an AFS in the past 12 months.
The remaining 5.0 percent of U.S. households had a bank
account, but information on their use of AFS was insufficient
to categorize the household as either underbanked or fully
banked.
Figure 3.1 Banking Status of U.S. Households, 2015 (Percent)
Unbanked 7.0
Underbanked19.9
Banked, underbanked status unknown 5.0
Fullybanked
68.0
Changes in Banking StatusThe proportion of U.S. households that were unbanked (i.e.,
the “unbanked rate”) in 2015 was lower than in any of the
past years of the survey, as shown in Figure 3.2. For example,
the unbanked rate in 2013 was 7.7 percent, 0.7 percentage
points higher than the 2015 estimate.10
The decline in the unbanked rate from 2013 to 2015 was
attributable in part to changes in household characteristics
across survey years. Approximately half of the decline can
be attributed to improvements in the socioeconomic circum-
stances of U.S. households. Even after accounting for these
changes, the remaining decline in the unbanked rate across
years was statistically significant.11
Figure 3.2 National Estimates, Household Unbanked Rates by Year
7.68.2
7.77.0
2009 2011 2013 2015
In contrast to the unbanked rate, the underbanked rate in
2015 (19.9 percent) was essentially unchanged from the 2013
estimate (20.0 percent), as shown in Table 3.1.
9Adults are defined as people aged 16 and older. The estimates of 15.6 million adults and 7.6 million children may understate the total number of people in the United States who do not have access to a bank account, because these figures do not include residents of “banked” households who do not have an account in their name and do not benefit from a bank account owned by another household resident.
10All differences discussed in the text of this report are statistically significant at the 10 percent level, unless noted otherwise. In other words, there is a 10 percent or lower probability that the difference observed in the survey is due to chance.
11A linear probability model was estimated to account for changes from 2013 to 2015 in the distribution of households across the household-level characteristics shown in Appendix Table A.2. Changes in the socioeconomic characteristics of households (income, employment status, homeownership status, and educational attainment) between 2013 and 2015 accounted for about half of the difference in unbanked rates between 2013 and 2015. Adding controls for the remaining demographic characteristics shown in Appendix Table A.2 had little effect on the remaining difference.
14 | 2015 FDIC National Survey of Unbanked and Underbanked Households
12The 2011 estimates of the underbanked and fully banked rates are not directly comparable to the 2013 and 2015 estimates because of changes in the definitions of these categories. Specifically, beginning with the 2013 survey, use of auto title loans was considered when determining whether a household was underbanked or fully banked. Further, as discussed in the 2013 report, the proportion of unknown responses for most of the AFS questions generally doubled from 2011 to 2013, resulting in an increase in the proportion of households that were categorized as underbanked status unknown. Excluding households with unknown underbanked status and using the 2011 definitions of underbanked and fully banked (that exclude use of auto title loans), the underbanked rate in 2015 was similar to the 2013 and 2011 estimates, and the fully banked rate in 2015 was higher than the 2013 and 2011 estimates.
13For characteristics that vary at the person-level, such as race, age, education, and employment, the characteristics of the owner or renter of the home (i.e., the “householder”) are used to represent the household. For convenience, abbreviated language is used when referring to certain household characteristics. For example, the term “white household” refers to a household for which the householder has been identified as white, non-black, non-Hispanic, and non-Asian. The phrase “working-age disabled” refers to a household in which the householder has a disability and is aged 25 to 64. See Appendix 1 for additional details.
14As noted in Table 3.3, the decline in the underbanked rate among black households is not statistically significant at the 10 percent level, although the increase in the fully banked rate is statistically significant.
15For example, the Federal Reserve Board’s “Report on the Economic Well-Being of U.S. Households in 2015” examined monthly income and expense volatility among U.S. consumers, showing that this volatility was associated with difficulty in paying bills (see http://www.federalreserve.gov/2015-report-economic-well-being-us-households-201605.pdf). The 2013 FDIC National Survey of Unbanked and Underbanked Households showed that household transitions into and out of the banking system were related to economic shocks, such as changes in employment or income (see https://www.economicinclusion.gov/surveys/2013household/documents/2013_FDIC_Unbanked_HH_Survey_Report.pdf).
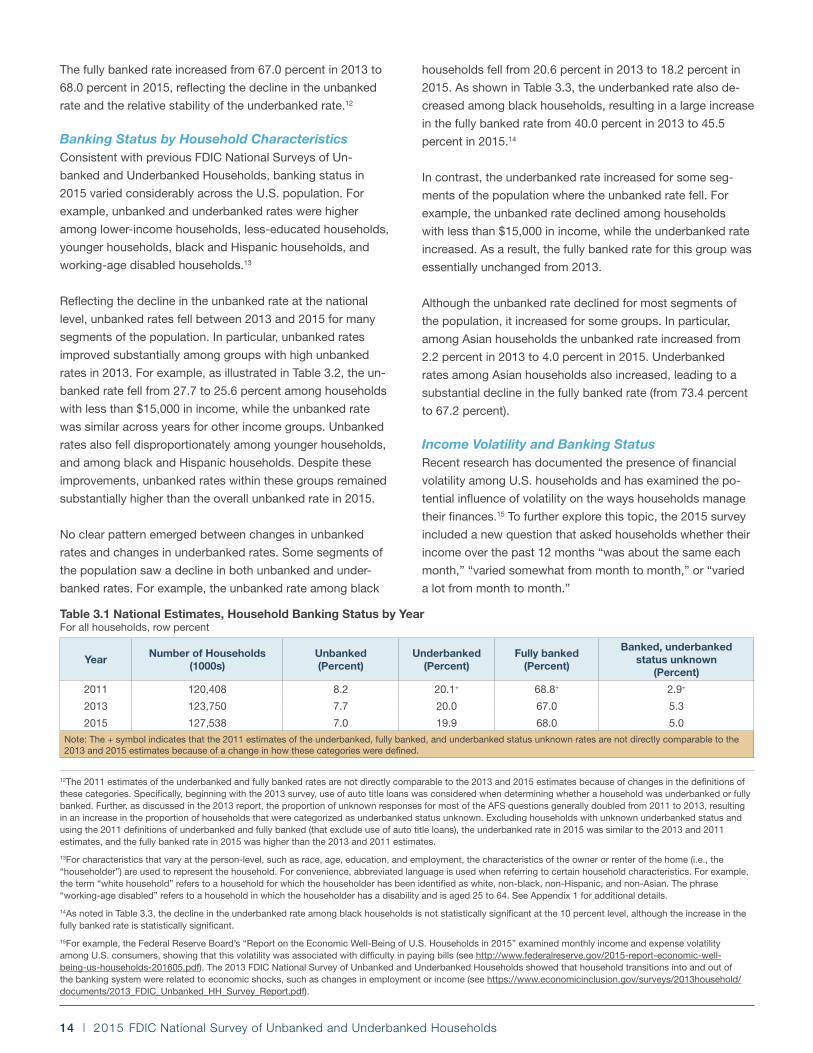
Table 3.1 National Estimates, Household Banking Status by Year For all households, row percent
YearNumber of Households
(1000s)Unbanked (Percent)
Underbanked (Percent)
Fully banked (Percent)
Banked, underbanked status unknown
(Percent)
2011 120,408 8.2 20.1+ 68.8+ 2.9+
2013 123,750 7.7 20.0 67.0 5.3
2015 127,538 7.0 19.9 68.0 5.0
Note: The + symbol indicates that the 2011 estimates of the underbanked, fully banked, and underbanked status unknown rates are not directly comparable to the 2013 and 2015 estimates because of a change in how these categories were defined.
The fully banked rate increased from 67.0 percent in 2013 to
68.0 percent in 2015, reflecting the decline in the unbanked
rate and the relative stability of the underbanked rate.12
Banking Status by Household CharacteristicsConsistent with previous FDIC National Surveys of Un-
banked and Underbanked Households, banking status in
2015 varied considerably across the U.S. population. For
example, unbanked and underbanked rates were higher
among lower-income households, less-educated households,
younger households, black and Hispanic households, and
working-age disabled households.13
Reflecting the decline in the unbanked rate at the national
level, unbanked rates fell between 2013 and 2015 for many
segments of the population. In particular, unbanked rates
improved substantially among groups with high unbanked
rates in 2013. For example, as illustrated in Table 3.2, the un-
banked rate fell from 27.7 to 25.6 percent among households
with less than $15,000 in income, while the unbanked rate
was similar across years for other income groups. Unbanked
rates also fell disproportionately among younger households,
and among black and Hispanic households. Despite these
improvements, unbanked rates within these groups remained
substantially higher than the overall unbanked rate in 2015.
No clear pattern emerged between changes in unbanked
rates and changes in underbanked rates. Some segments of
the population saw a decline in both unbanked and under-
banked rates. For example, the unbanked rate among black
households fell from 20.6 percent in 2013 to 18.2 percent in
2015. As shown in Table 3.3, the underbanked rate also de-
creased among black households, resulting in a large increase
in the fully banked rate from 40.0 percent in 2013 to 45.5
percent in 2015.14
In contrast, the underbanked rate increased for some seg-
ments of the population where the unbanked rate fell. For
example, the unbanked rate declined among households
with less than $15,000 in income, while the underbanked rate
increased. As a result, the fully banked rate for this group was
essentially unchanged from 2013.
Although the unbanked rate declined for most segments of
the population, it increased for some groups. In particular,
among Asian households the unbanked rate increased from
2.2 percent in 2013 to 4.0 percent in 2015. Underbanked
rates among Asian households also increased, leading to a
substantial decline in the fully banked rate (from 73.4 percent
to 67.2 percent).
Income Volatility and Banking StatusRecent research has documented the presence of financial
volatility among U.S. households and has examined the po-
tential influence of volatility on the ways households manage
their finances.15 To further explore this topic, the 2015 survey
included a new question that asked households whether their
income over the past 12 months “was about the same each
month,” “varied somewhat from month to month,” or “varied
a lot from month to month.”
15
Characteristics2011
(Percent)2013
(Percent)2015
(Percent)Difference (2015-2013)
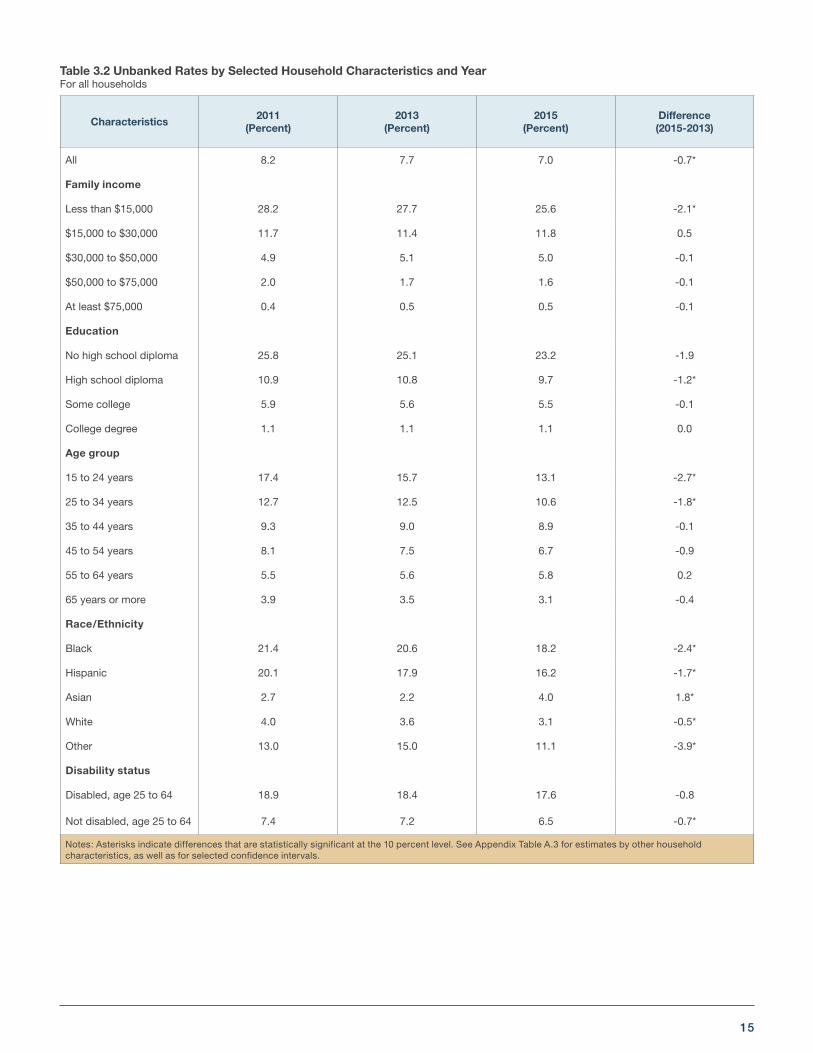
All 8.2 7.7 7.0 -0.7*
Family income
Less than $15,000 28.2 27.7 25.6 -2.1*
$15,000 to $30,000 11.7 11.4 11.8 0.5
$30,000 to $50,000 4.9 5.1 5.0 -0.1
$50,000 to $75,000 2.0 1.7 1.6 -0.1
At least $75,000 0.4 0.5 0.5 -0.1
Education
No high school diploma 25.8 25.1 23.2 -1.9
High school diploma 10.9 10.8 9.7 -1.2*
Some college 5.9 5.6 5.5 -0.1
College degree 1.1 1.1 1.1 0.0
Age group
15 to 24 years 17.4 15.7 13.1 -2.7*
25 to 34 years 12.7 12.5 10.6 -1.8*
35 to 44 years 9.3 9.0 8.9 -0.1
45 to 54 years 8.1 7.5 6.7 -0.9
55 to 64 years 5.5 5.6 5.8 0.2
65 years or more 3.9 3.5 3.1 -0.4
Race/Ethnicity
Black 21.4 20.6 18.2 -2.4*
Hispanic 20.1 17.9 16.2 -1.7*
Asian 2.7 2.2 4.0 1.8*
White 4.0 3.6 3.1 -0.5*
Other 13.0 15.0 11.1 -3.9*
Disability status
Disabled, age 25 to 64 18.9 18.4 17.6 -0.8
Not disabled, age 25 to 64 7.4 7.2 6.5 -0.7*
Notes: Asterisks indicate differences that are statistically significant at the 10 percent level. See Appendix Table A.3 for estimates by other household characteristics, as well as for selected confidence intervals.
Table 3.2 Unbanked Rates by Selected Household Characteristics and YearFor all households

16 | 2015 FDIC National Survey of Unbanked and Underbanked Households
Characteristics
Underbanked Fully bankedBanked,
underbanked status unknown
2013 (Percent)
2015 (Percent)
Difference (2015-2013)
2013 (Percent)
2015 (Percent)
Difference (2015-2013)
2013 (Percent)
2015 (Percent)
Difference (2015-2013)
All 20.0 19.9 -0.1 67.0 68.0 1.0* 5.3 5.0 -0.2
Family income
Less than $15,000 22.4 24.3 2.0* 45.2 45.1 -0.1 4.7 4.9 0.2
$15,000 to $30,000 25.0 23.6 -1.4* 57.9 59.5 1.5 5.7 5.1 -0.6
$30,000 to $50,000 23.3 23.7 0.5 65.7 66.2 0.4 5.9 5.1 -0.8*
$50,000 to $75,000 19.8 20.2 0.5 73.2 73.0 -0.2 5.2 5.1 -0.1
At least $75,000 13.6 13.4 -0.2 81.0 81.3 0.3 4.9 4.9 0.0
Education
No high school diploma
24.1 25.9 1.8* 46.3 46.4 0.1 4.6 4.5 -0.1
High school diploma 21.9 22.2 0.3 61.7 62.9 1.2 5.6 5.3 -0.3
Some college 23.0 22.0 -1.1 66.2 67.7 1.5* 5.2 4.8 -0.4
College degree 14.3 14.5 0.2 79.3 79.1 -0.1 5.3 5.2 -0.1
Age group
15 to 24 years 30.8 29.4 -1.4 48.8 52.1 3.2 4.6 5.5 0.9
25 to 34 years 24.7 24.5 -0.2 58.3 60.8 2.5* 4.6 4.0 -0.5
35 to 44 years 23.8 22.7 -1.2 62.5 63.1 0.6 4.6 5.3 0.6
45 to 54 years 21.9 21.1 -0.8 65.4 67.5 2.1* 5.2 4.8 -0.4
55 to 64 years 17.7 18.5 0.8 71.7 70.9 -0.9 5.0 4.8 -0.2
65 years or more 11.6 13.0 1.4* 78.2 78.1 -0.1 6.7 5.8 -0.9*
Race/Ethnicity
Black 33.2 31.1 -2.0 40.0 45.5 5.5* 6.3 5.2 -1.1*
Hispanic 28.6 29.3 0.7 48.4 48.9 0.5 5.1 5.6 0.5
Asian 17.7 21.0 3.3* 73.4 67.2 -6.3* 6.7 7.8 1.1
White 15.9 15.6 -0.3 75.4 76.6 1.2* 5.0 4.7 -0.3
Other 25.3 27.5 2.2 55.2 56.7 1.6 4.5 4.6 0.1
Disability status
Disabled, age 25 to 64 28.1 28.4 0.3 49.0 49.7 0.7 4.5 4.3 -0.3
Not disabled, age 25 to 64
21.1 20.6 -0.5 66.8 68.1 1.3* 4.9 4.8 -0.1
Notes: Asterisks indicate differences that are statistically significant at the 10 percent level. See Appendix Tables A.4 and A.5 for underbanked and fully banked rates by other household characteristics, as well as for selected confidence intervals.
Table 3.3 Underbanked and Fully Banked Rates by Selected Household Characteristics and YearFor all households

17
As illustrated in Figure 3.3, 71.8 percent of households in
2015 had income that was about the same each month,
16.3 percent had income that varied somewhat from month
to month, and 4.5 percent had income that varied a lot from
month to month. Income volatility affected households at all
income levels. For example, 21.6 percent of households with
less than $15,000 in annual income had income that varied
somewhat or a lot from month to month, as did 19.6 percent
of households with annual income of $75,000 or more.16
Figure 3.3 Monthly Income Volatility, 2015 (Percent)
Varieda lot4.5
Variedsomewhat16.3
Aboutthe same
71.8
Unknown7.3
Higher income volatility was associated with higher
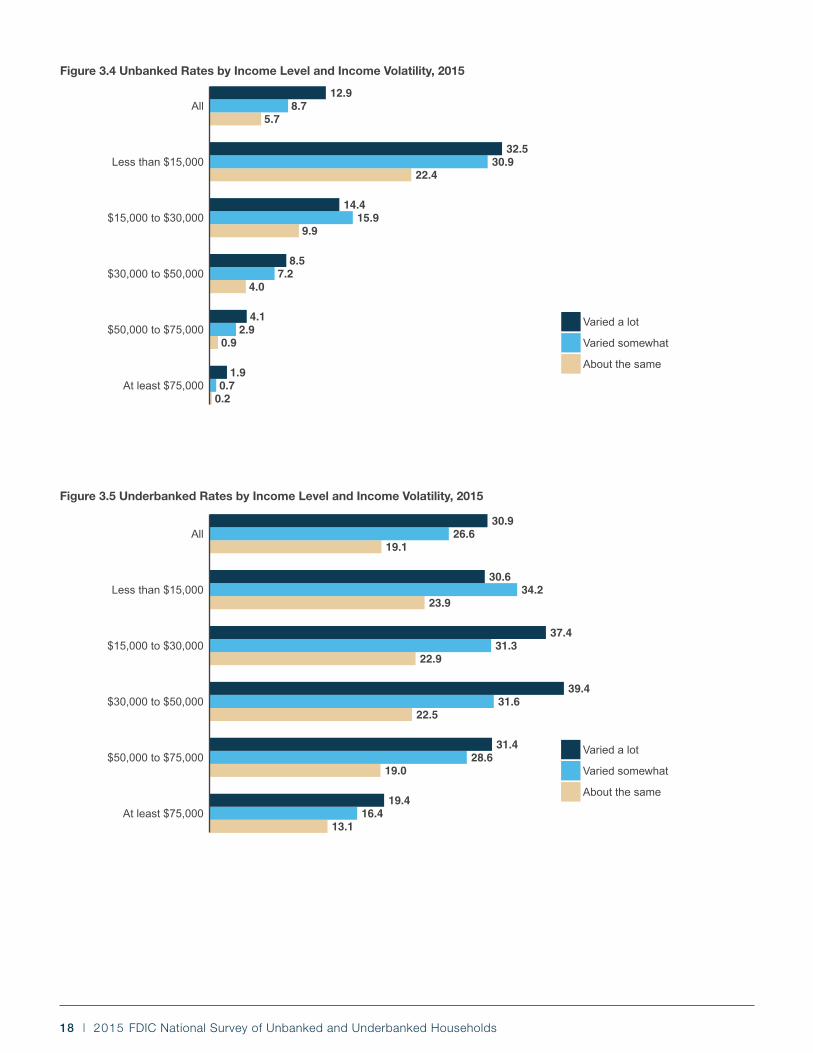
unbanked rates. As shown in Figure 3.4, the unbanked rate
for households with income that varied a lot from month to
month (12.9 percent) was more than twice as high as the
unbanked rate for households with steady monthly income
(5.7 percent).
The influence of income volatility on bank account ownership
was most pronounced among the lowest-income house-
holds. Indeed, among households with less than $15,000 in
annual income, the unbanked rate was more than 30 percent
for households with income that varied somewhat or a lot,
compared to about 22 percent for households with steady in-
come. Volatility appeared to play a role even at higher income
levels. For example, among households with annual income
between $50,000 and $75,000, the unbanked rate was 2.9 for
households with income that varied somewhat and 4.1 per-
cent for households with income that varied a lot, compared
to 0.9 percent for households with steady monthly income.
Income volatility was also associated with substantial dif-
ferences in underbanked rates, as shown in Figure 3.5. The
underbanked rate was 26.6 percent among households with
income that varied somewhat and 30.9 percent among those
with income that varied a lot, compared to 19.1 percent
among those with steady income. These patterns held across
household income levels. For example, the underbanked rate
was about 30 percent for households with annual income
between $50,000 and $75,000 that varied somewhat or a lot
from month to month. In contrast, the underbanked rate was
substantially lower among households at the same income
level with steady monthly income (19.0 percent).
Banking Status by GeographyRegional variation in unbanked and underbanked rates in
2015 was similar to previous years: unbanked and under-
banked rates were highest among households in the Southern
region. However, underbanked rates declined among South-
ern households from 23.5 percent in 2013 to 21.6 percent in
2015, contributing to an increase in the fully banked rate from
62.1 to 65.0 percent. Unbanked rates in the Western region
declined from 7.4 to 5.9 percent, but this was offset by an
increase in the underbanked rate from 17.6 to 19.9 percent.
As a result, the fully banked rate was essentially unchanged
from 2013.
Unbanked and underbanked rates varied considerably across
states, as illustrated in Figures 3.6 and 3.7. Reflecting the
regional variation described above, and similar to estimates
from previous years, unbanked and underbanked rates
were generally higher among states in the Southern region.
Unbanked rates ranged from 1.5 percent (Vermont) to 14.0
percent (Louisiana), and underbanked rates ranged from 12.8
percent (Vermont) to 27.3 percent (Nevada). Some states saw
large swings in unbanked rates between 2013 and 2015. For
example, the unbanked rate in Alabama increased from 9.2
to 12.5 percent while the unbanked rate in Arizona declined
from 12.8 to 8.5 percent. (See Appendix Tables A.7 – A.14 for
detailed state- and MSA-level estimates, along with selected
confidence intervals.)
16See Appendix Table A.6 for the distribution of households by income level and income volatility.
18 | 2015 FDIC National Survey of Unbanked and Underbanked Households
0.20.7
1.9
0.92.9
4.1
4.07.2
8.5
9.915.9
14.4
22.430.9
32.5
5.78.7
12.9
At least $75,000
$50,000 to $75,000
$30,000 to $50,000
$15,000 to $30,000
Less than $15,000
All
Varied a lot
Varied somewhat
About the same
Figure 3.4 Unbanked Rates by Income Level and Income Volatility, 2015
13.116.4
19.4
19.028.6
31.4
22.531.6
39.4
22.931.3
37.4
23.934.2
30.6
19.126.6
30.9
At least $75,000
$50,000 to $75,000
$30,000 to $50,000
$15,000 to $30,000
Less than $15,000
All
Varied a lot
Varied somewhat
About the same
Figure 3.5 Underbanked Rates by Income Level and Income Volatility, 2015

19
Figure 3.6 Unbanked Rates by State, 2015
CA
CO
CT
DE
FL
ID
IL IN
IA
ME
MD
MAMI
MNMT
NE
NH
ND
OH
OR
PA
SD
UT
VT
VA
WA
WI
WY
DC
AK
NJ
HI
RI
NMOK
AR
LA
MS ALGA
WV
NY
AZ
MO
NC
SC
NV KS
TN
TX
KY
Less than 4.0
4.0 to 5.0
5.0 to 7.4
7.4 to 9.4
At least 9.4
AZ
CA
CO
CT
DE
FL
IL IN
IA
KS
KY
ME
MD
MAMI
MNMT
NH
NC
OH
OR
PA
SD
TN
VT
VAWV
WI
WY
DC
AK
NJ
HI
RI
ID
NMOK
AR
LA
MS ALGA
NY
WA
UT
ND
MO
SC
NV
NE
TXLess than 17.4
17.4 to 18.8
18.8 to 20.7
20.7 to 23.8
At least 23.8
Figure 3.7 Underbanked Rates by State, 2015
20 | 2015 FDIC National Survey of Unbanked and Underbanked Households
17The 2013 survey included a number of questions examining household transitions into and out of the banking system and the events that may have contributed to these transitions. As discussed in Appendix 2, those questions were not repeated in the 2015 survey.
18Although the proportion of unbanked households that previously had an account was slightly higher in 2015 (46.5 percent) than in 2013 (45.9 percent) and 2011 (44.7 percent), the differences between these estimates are not statistically significant.
19The proportion of unbanked households that were not at all likely to open an account in the next 12 months was substantially higher in 2015 than in 2013, even after accounting for differences in observable household characteristics (listed in Appendix Table A.2) and in the use of prepaid cards between 2013 and 2015.
20For a detailed description of changes to the survey instrument, see Appendix 2.
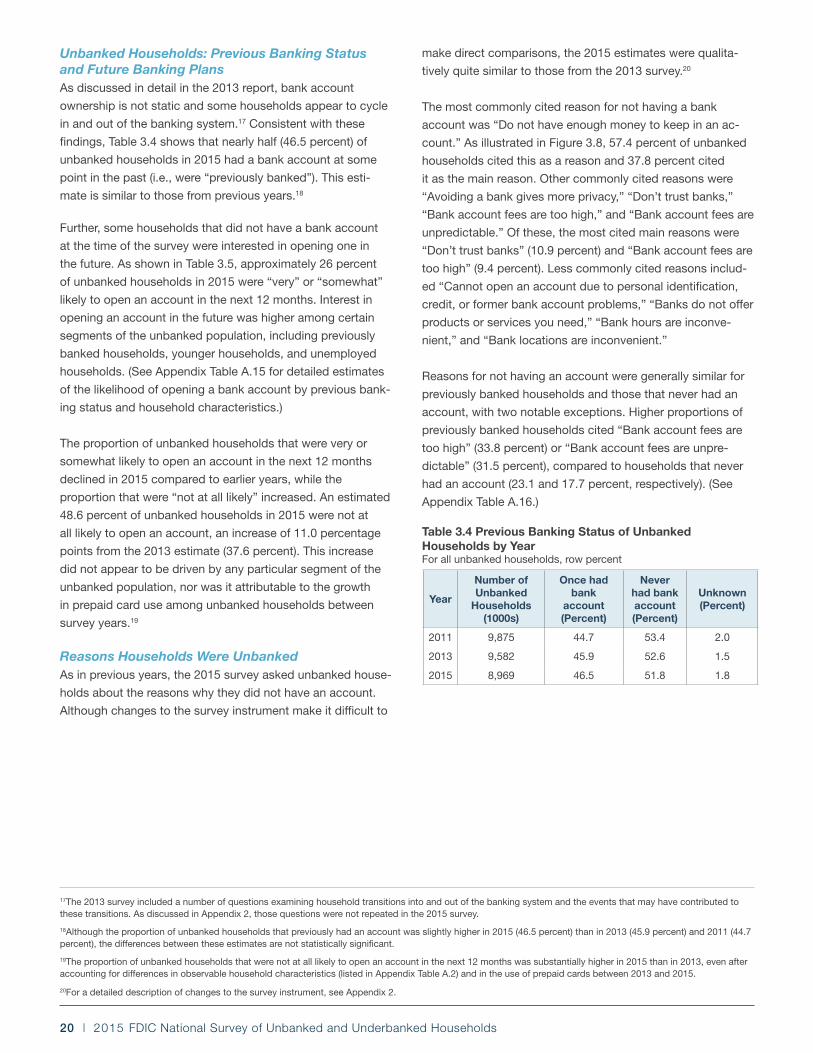
Unbanked Households: Previous Banking Status and Future Banking PlansAs discussed in detail in the 2013 report, bank account
ownership is not static and some households appear to cycle
in and out of the banking system.17 Consistent with these
findings, Table 3.4 shows that nearly half (46.5 percent) of
unbanked households in 2015 had a bank account at some
point in the past (i.e., were “previously banked”). This esti-
mate is similar to those from previous years.18
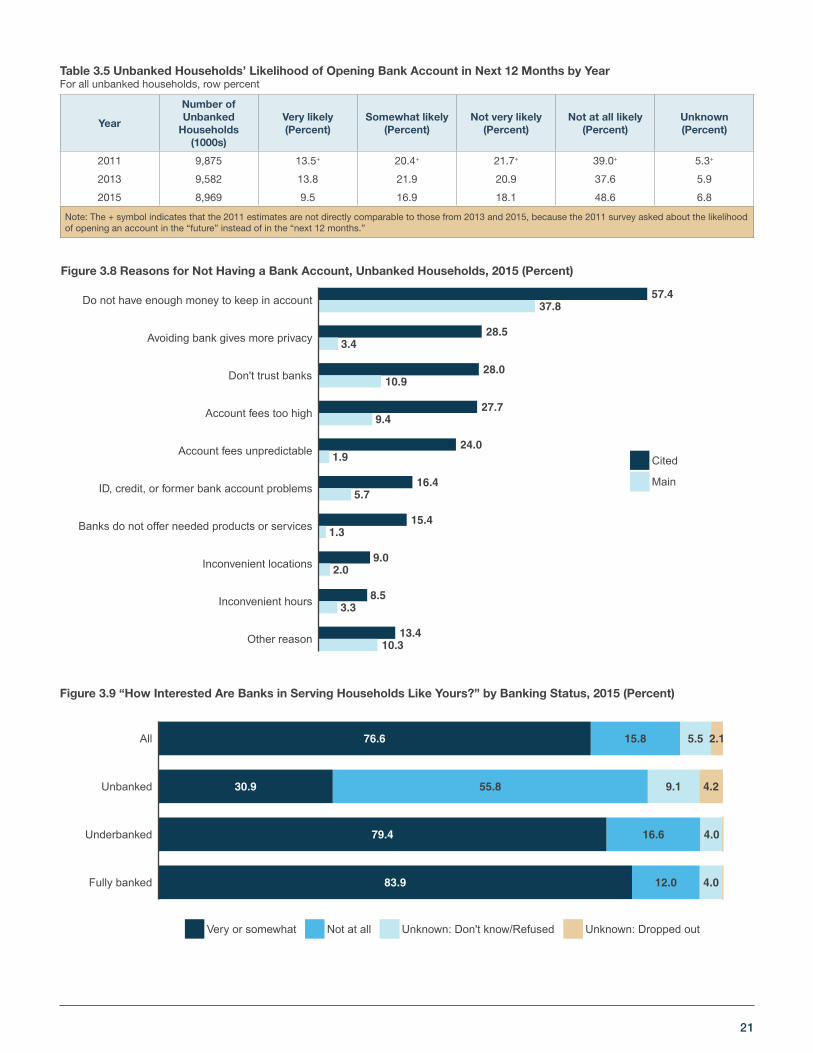
Further, some households that did not have a bank account
at the time of the survey were interested in opening one in
the future. As shown in Table 3.5, approximately 26 percent
of unbanked households in 2015 were “very” or “somewhat”
likely to open an account in the next 12 months. Interest in
opening an account in the future was higher among certain
segments of the unbanked population, including previously
banked households, younger households, and unemployed
households. (See Appendix Table A.15 for detailed estimates
of the likelihood of opening a bank account by previous bank-
ing status and household characteristics.)
The proportion of unbanked households that were very or
somewhat likely to open an account in the next 12 months
declined in 2015 compared to earlier years, while the
proportion that were “not at all likely” increased. An estimated
48.6 percent of unbanked households in 2015 were not at
all likely to open an account, an increase of 11.0 percentage
points from the 2013 estimate (37.6 percent). This increase
did not appear to be driven by any particular segment of the
unbanked population, nor was it attributable to the growth
in prepaid card use among unbanked households between
survey years.19
Reasons Households Were UnbankedAs in previous years, the 2015 survey asked unbanked house-
holds about the reasons why they did not have an account.
Although changes to the survey instrument make it difficult to
make direct comparisons, the 2015 estimates were qualita-
tively quite similar to those from the 2013 survey.20
The most commonly cited reason for not having a bank
account was “Do not have enough money to keep in an ac-
count.” As illustrated in Figure 3.8, 57.4 percent of unbanked
households cited this as a reason and 37.8 percent cited
it as the main reason. Other commonly cited reasons were
“Avoiding a bank gives more privacy,” “Don’t trust banks,”
“Bank account fees are too high,” and “Bank account fees are
unpredictable.” Of these, the most cited main reasons were
“Don’t trust banks” (10.9 percent) and “Bank account fees are
too high” (9.4 percent). Less commonly cited reasons includ-
ed “Cannot open an account due to personal identification,
credit, or former bank account problems,” “Banks do not offer
products or services you need,” “Bank hours are inconve-
nient,” and “Bank locations are inconvenient.”
Reasons for not having an account were generally similar for
previously banked households and those that never had an
account, with two notable exceptions. Higher proportions of
previously banked households cited “Bank account fees are
too high” (33.8 percent) or “Bank account fees are unpre-
dictable” (31.5 percent), compared to households that never
had an account (23.1 and 17.7 percent, respectively). (See
Appendix Table A.16.)
Table 3.4 Previous Banking Status of Unbanked Households by YearFor all unbanked households, row percent
Year
Number of Unbanked
Households (1000s)
Once had bank
account (Percent)
Never had bank account (Percent)
Unknown (Percent)
2011 9,875 44.7 53.4 2.0
2013 9,582 45.9 52.6 1.5
2015 8,969 46.5 51.8 1.8
21
Table 3.5 Unbanked Households’ Likelihood of Opening Bank Account in Next 12 Months by YearFor all unbanked households, row percent
Year
Number of Unbanked
Households (1000s)
Very likely (Percent)
Somewhat likely (Percent)
Not very likely (Percent)
Not at all likely (Percent)
Unknown (Percent)
2011 9,875 13.5+ 20.4+ 21.7+ 39.0+ 5.3+
2013 9,582 13.8 21.9 20.9 37.6 5.9
2015 8,969 9.5 16.9 18.1 48.6 6.8
Note: The + symbol indicates that the 2011 estimates are not directly comparable to those from 2013 and 2015, because the 2011 survey asked about the likelihood of opening an account in the “future” instead of in the “next 12 months.”
Figure 3.8 Reasons for Not Having a Bank Account, Unbanked Households, 2015 (Percent)
13.410.3
8.53.3
9.02.0
15.41.3
16.45.7
24.01.9
27.79.4
28.010.9
28.53.4
57.437.8
Other reason
Inconvenient hours
Inconvenient locations
Banks do not offer needed products or services
ID, credit, or former bank account problems
Account fees unpredictable
Account fees too high
Don't trust banks
Avoiding bank gives more privacy
Do not have enough money to keep in account
Cited
Main
Figure 3.9 “How Interested Are Banks in Serving Households Like Yours?” by Banking Status, 2015 (Percent)
76.6 15.8 5.5 2.1
30.9 55.8 9.1 4.2
79.4 16.6 4.0
83.9 12.0 4.0Fully banked
Underbanked
Unbanked
All
Very or somewhat Not at all Unknown: Don't know/Refused Unknown: Dropped out

22 | 2015 FDIC National Survey of Unbanked and Underbanked Households
Perceptions of Banks’ Interest The 2015 survey included a new question asked of all house-
holds: “How interested are banks in serving households like
yours?” The survey results revealed pronounced differences
across households.
As illustrated in Figure 3.9, more than three-quarters of U.S.
households thought that banks were “very interested” or
“somewhat interested” in serving households like theirs.
Approximately 16 percent thought that banks were “not at all
interested,” and the perceptions of the remaining 8 percent
were unknown.
Unbanked households were substantially less likely than
underbanked or fully banked households to perceive that
banks were interested in serving households like theirs. More
than half (55.8 percent) of unbanked households thought that
banks were not at all interested, compared to 16.6 percent
of underbanked households and 12.0 percent of fully banked
households. In contrast, the perceptions of underbanked
households were quite similar to those of fully banked house-
holds. Indeed, nearly 80 percent of underbanked households
thought that banks were very or somewhat interested in serv-
ing households like theirs, compared to 83.9 percent of fully
banked households who felt this way.
Figure 3.9 also shows that a higher proportion of unbanked
households had “don’t know” or “refused” recorded for
this question, compared to underbanked and fully banked
households. Unbanked households that had not had a bank
account in the past were especially likely to have don’t know
or refused recorded for this question. These results suggest
that some unbanked households might not have been familiar
with banks.21
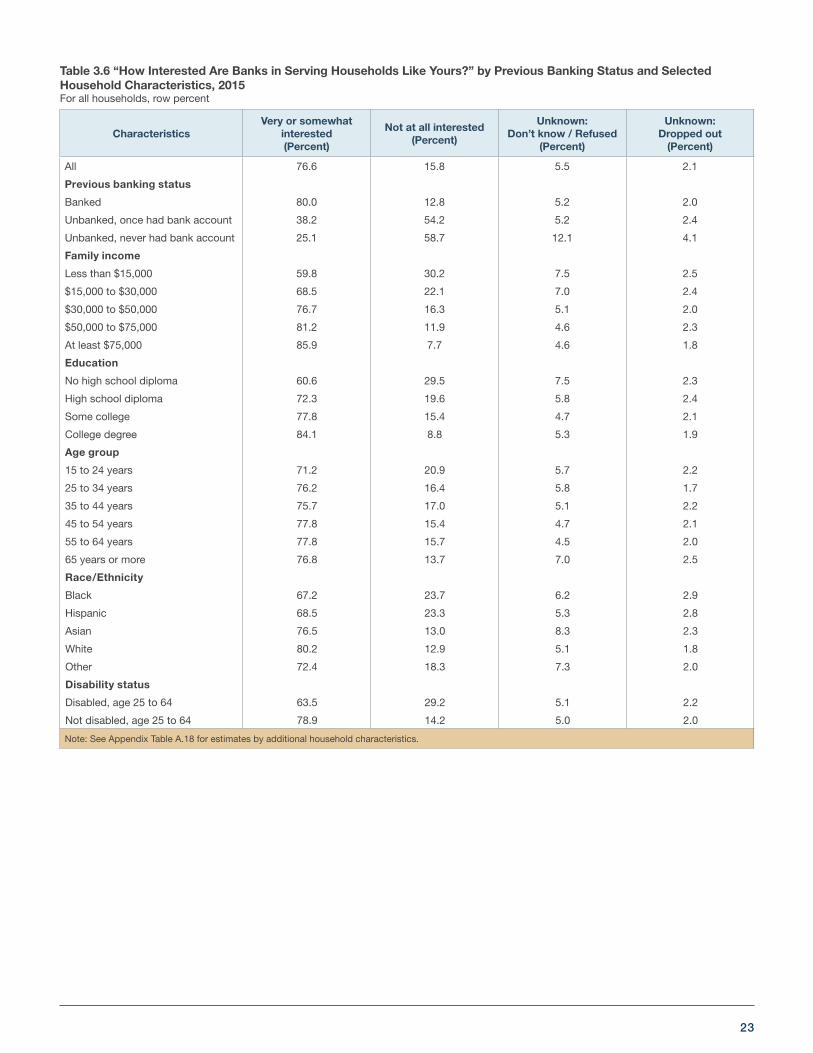
Perceptions among unbanked households varied based on
whether the household was previously banked. As shown in
Table 3.6, similar shares of previously banked (54.2 percent)
and never banked households (58.7 percent) perceived that
banks were not at all interested in serving households like
theirs. However, a higher share of previously banked house-
holds (38.2 percent) perceived that banks were very or some-
what interested in serving households like theirs, compared
with 25.1 percent of households that were never banked.
Perceptions of bank interest also varied by household charac-
teristics. For example, the proportion that thought banks were
very or somewhat interested in serving households like theirs
ranged from 59.8 percent among the lowest income group
(less than $15,000) to 85.9 percent among the highest income
group ($75,000 or more). Perceptions also varied by race and
ethnicity: the proportions of black and Hispanic households
that thought banks were interested in serving households like
theirs were lower than for white households. Working-age
disabled households were less likely than nondisabled
households to think that banks were interested in serving
households like theirs. The differences in perceptions of bank
interest across household characteristics were generally
smaller in magnitude than the differences between banked
and unbanked households discussed above.
Finally, the likelihood of unbanked households opening an
account in the future was associated with differences in their
perceptions of banks’ interest in serving households like
theirs. Among unbanked households that thought banks were
not at all interested in serving households like theirs, only 17.3
percent were very or somewhat likely to open an account in
the next 12 months. In contrast, among unbanked house-
holds that perceived banks to be very or somewhat interested
in serving households like theirs, 50.4 percent were very or
somewhat likely to open an account in the next 12 months.
21Households recorded as “Unknown: Don’t know/Refused” were asked the survey question but did not select a response (“very interested,” “somewhat interested,” or “not at all interested”). Households recorded as “Unknown: Dropped out” dropped out of the survey before being asked this question.
23
CharacteristicsVery or somewhat
interested (Percent)
Not at all interested (Percent)
Unknown: Don’t know / Refused
(Percent)
Unknown: Dropped out
(Percent)
All 76.6 15.8 5.5 2.1
Previous banking status
Banked 80.0 12.8 5.2 2.0
Unbanked, once had bank account 38.2 54.2 5.2 2.4
Unbanked, never had bank account 25.1 58.7 12.1 4.1
Family income
Less than $15,000 59.8 30.2 7.5 2.5
$15,000 to $30,000 68.5 22.1 7.0 2.4
$30,000 to $50,000 76.7 16.3 5.1 2.0
$50,000 to $75,000 81.2 11.9 4.6 2.3
At least $75,000 85.9 7.7 4.6 1.8
Education
No high school diploma 60.6 29.5 7.5 2.3
High school diploma 72.3 19.6 5.8 2.4
Some college 77.8 15.4 4.7 2.1
College degree 84.1 8.8 5.3 1.9
Age group
15 to 24 years 71.2 20.9 5.7 2.2
25 to 34 years 76.2 16.4 5.8 1.7
35 to 44 years 75.7 17.0 5.1 2.2
45 to 54 years 77.8 15.4 4.7 2.1
55 to 64 years 77.8 15.7 4.5 2.0
65 years or more 76.8 13.7 7.0 2.5
Race/Ethnicity
Black 67.2 23.7 6.2 2.9
Hispanic 68.5 23.3 5.3 2.8
Asian 76.5 13.0 8.3 2.3
White 80.2 12.9 5.1 1.8
Other 72.4 18.3 7.3 2.0
Disability status
Disabled, age 25 to 64 63.5 29.2 5.1 2.2
Not disabled, age 25 to 64 78.9 14.2 5.0 2.0
Note: See Appendix Table A.18 for estimates by additional household characteristics.
Table 3.6 “How Interested Are Banks in Serving Households Like Yours?” by Previous Banking Status and Selected Household Characteristics, 2015For all households, row percent
24 | 2015 FDIC National Survey of Unbanked and Underbanked Households
2015 FDIC National Survey of Unbanked and Underbanked Households
4. Banked Households: Types of Accounts and Methods Used to Access Accounts
Types of Accounts Owned by Banked HouseholdsPatterns of savings and checking account ownership among
banked households in 2015 were generally similar to previous
years, as shown in Table 4.1.22 Almost all banked households
had a checking account (98.0 percent), while roughly three in
four (77.8 percent) had a savings account.
Savings account ownership rates in 2015 varied widely across
the population. For example, savings account ownership
rates were lower among black and Hispanic households,
working-age disabled households, and households in rural
areas. Differences by income and education were especially
pronounced. For example, among banked households with
less than $15,000 in income, only 52.6 percent had a savings
account in 2015, compared to 91.6 percent among those with
over $75,000 in income. (See Appendix Table B.1 for details.)
Methods Banked Households Used to Access Their AccountsKnowing how households access their bank accounts can
help inform discussions about how best to serve different
groups of consumers. As in the 2013 survey, banked house-
holds were asked about the methods they used to access
their accounts in the past 12 months and about the most
common (i.e., “primary”) method used.23 The results show
that use of online and mobile banking increased from 2013
to 2015, while use of bank tellers fell. Use of bank tellers
remained quite prevalent, however, particularly among
segments of the population that have higher unbanked and
underbanked rates.
As illustrated in Figure 4.1, 75.5 percent of banked house-
holds in 2015 used bank tellers to access their accounts in
the past 12 months, a higher proportion than any other meth-
od asked about in the survey.24 However, use of bank tellers
to access accounts fell slightly in 2015 compared to 2013
(78.8 percent). During the same period, use of online banking
and mobile banking grew substantially. The growth in mobile
banking was particularly striking, as 31.9 percent of banked
households in 2015 accessed an account using a mobile
phone compared to 23.2 percent in 2013.
These patterns were also present when looking at the primary
methods banked households used to access their accounts
(Figure 4.2). Use of bank tellers and ATMs/kiosks fell from
2013 to 2015, while use of online and mobile banking in-
creased. Notably, 36.9 percent of banked households used
online banking as the primary method of account access in
2015, more than any other method asked about in the survey.
Slightly less than half (49.2 percent) used a physical channel
(bank teller or ATM/kiosk) as their primary method of bank
account access.
Table 4.3 shows changes in the proportion of banked house-
holds that primarily used bank tellers, online banking, and
mobile banking between 2013 and 2015, by banking status
and selected household characteristics. Patterns were similar
within each of the groups listed in the table: use of bank tell-
ers fell, while use of online and mobile banking increased.
The estimates by banking status show that use of mobile
banking grew substantially among both underbanked and
fully banked households. The proportion of underbanked
households that used mobile banking as their primary means
of account access in 2015 (12.6 percent) was higher than the
share of fully banked households (8.7 percent) that primarily
used mobile banking, although this gap closed somewhat
between 2013 and 2015.
Changes in the use of bank tellers and online banking were
less pronounced for underbanked households than for fully
banked households. The proportion of underbanked house-
holds that primarily used bank tellers in 2015 was 27.8
percent, and the proportion that primarily used online bank-
22As in previous years, the 2015 survey asked about savings and checking account ownership for each person within the household. The analysis of checking and savings account ownership presented in this section excludes 647 observations (representing roughly 2.4 million banked households) where at least one person in the household had missing information on bank account type, and there was not enough information from the remaining persons in the household to categorize the household by the types of bank accounts owned. Estimates of checking and savings account ownership among banked households presented in this section may differ slightly from the 2011 and 2013 reports, because observations with missing information on bank account type were not dropped in prior years.
23Specifically, banked households were asked about bank tellers, ATMs/kiosks, telephone banking, online banking, mobile banking, and other methods of account access used in the past 12 months. Households were then asked which method they most commonly used. The estimates presented in this section do not necessarily reflect intensity of use.
24The analysis of bank account access methods presented in this section excludes 1,423 observations (representing roughly 5.3 million banked households) that did not access their accounts in the past 12 months or that did not report whether they accessed their accounts.

25
Table 4.1 Types of Accounts Owned by Banked Households by YearFor all banked households, row percent
YearNumber of
Households(1000s)
Checking and savings
(Percent)
Savings only(Percent)
Checking only(Percent)
Memo:Has savings
(Percent)
Memo:Has checking
(Percent)
2011 108,682 74.5 2.2 23.4 76.6 97.8
2013 111,926 73.8 2.2 24.0 76.0 97.8
2015 116,137 75.8 2.0 22.2 77.8 98.0
ing was 27.6 percent. These are fairly similar to the propor-
tions from the 2013 survey. In contrast, among fully banked
households the proportion that primarily used bank tellers
decreased from 33.0 to 28.2 percent, and the proportion that
primarily used online banking increased from 35.1 to 39.9
percent.
Use of bank tellers as the primary means of account
access remained quite prevalent among certain segments
of the population, including lower-income households,
less-educated households, older households, and
households located in rural areas. These groups also were
disproportionately more likely to access their accounts using
only bank tellers. For example, approximately one-quarter
of banked households with income of $30,000 or less and
one-third of banked households with no high school degree
exclusively used bank tellers to access their accounts (see
Appendix Table B.10).
Mobile Phone, Smartphone, and Home Internet AccessFinancial institutions, nonbank prepaid card issuers, and AFS providers are increasingly seeking to interact with customers
through the Internet and mobile phones, especially smartphones.
As shown in Table 4.2, smartphone access grew markedly, from 55.7 percent in 2013 to 67.1 percent in 2015. As in 2013,
the vast majority of U.S. households had access to a mobile phone in 2015.
Mobile phone and smartphone access continued to be lower among unbanked households than underbanked and fully
banked households. Notably, unbanked households in 2015 were more likely to own or have regular access to a smartphone
(42.9 percent) than to have Internet access at home using a desktop, laptop, or tablet computer (27.7 percent).
Table 4.2 Mobile Phone, Smartphone, and Home Internet Access by Banking Status and YearFor all households
Mobile phone Smartphone Internet at home
2013(Percent)
2015(Percent)
Difference(2015-2013)
2013(Percent)
2015(Percent)
Difference(2015-2013)
2015(Percent)
All 82.7 84.2 1.5* 55.7 67.1 11.4* 72.0
Banking status
Unbanked 68.1 69.0 0.9 33.1 42.9 9.8* 27.7
Underbanked 90.5 91.4 0.9 64.5 75.5 11.0* 72.8
Fully banked 86.8 88.6 1.8* 59.0 71.1 12.1* 80.6
Notes: Asterisks indicate differences that are statistically significant at the 10 percent level. Estimates of Internet access at home are not available for 2013. See Appendix Tables B.11 – B.15 for estimates by household characteristics, and for selected confidence intervals.
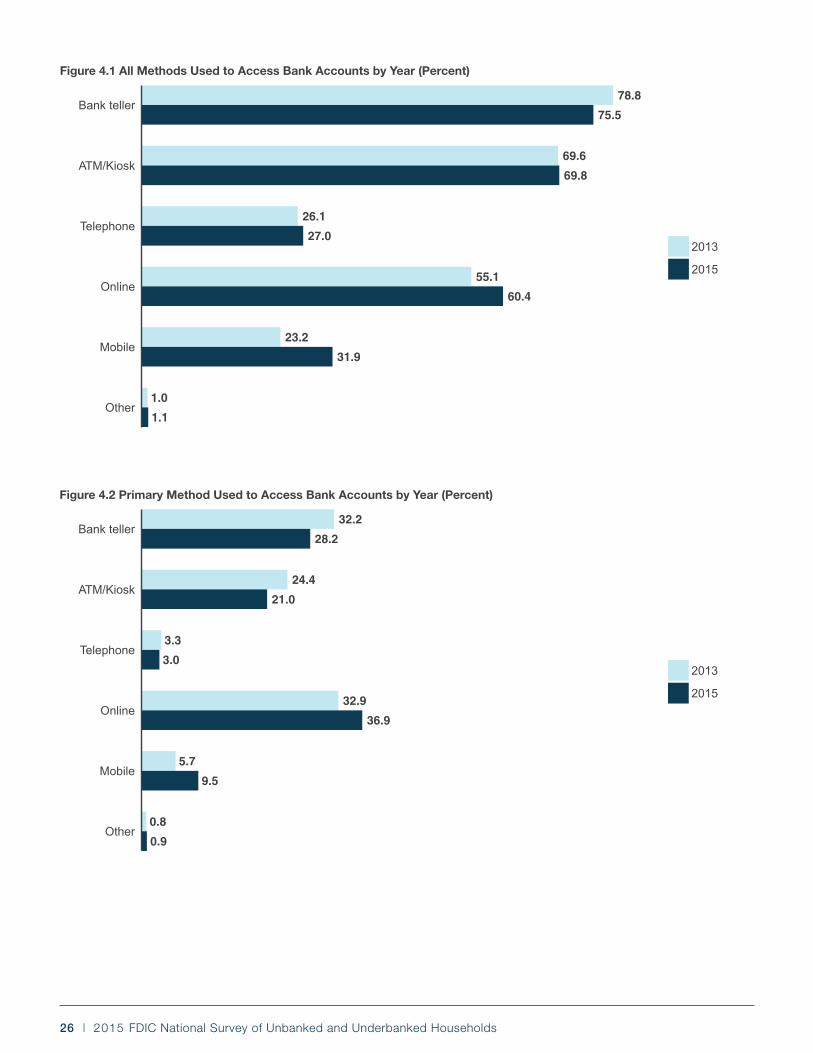
26 | 2015 FDIC National Survey of Unbanked and Underbanked Households
0.8
0.9
5.7
9.5
32.9
36.9
3.3
3.0
24.4
21.0
32.2
28.2
Other
Mobile
Online
Telephone
ATM/Kiosk
Bank teller
2013
2015
Figure 4.2 Primary Method Used to Access Bank Accounts by Year (Percent)
1.0
1.1
23.2
31.9
55.1
60.4
26.1
27.0
69.6
69.8
78.8
75.5
Other
Mobile
Online
Telephone
ATM/Kiosk
Bank teller
2013
2015
Figure 4.1 All Methods Used to Access Bank Accounts by Year (Percent)

27
Table 4.3 Use of Bank Tellers, Online Banking, or Mobile Banking as Primary Method of Account Access by Selected Household Characteristics and YearFor all banked households that accessed their account in the past 12 months
Characteristics
Bank teller Online banking Mobile banking
2013(Percent)
2015(Percent)
Difference(2015-2013)
2013(Percent)
2015(Percent)
Difference(2015-2013)
2013(Percent)
2015(Percent)
Difference(2015-2013)
All 32.2 28.2 -4.1* 32.9 36.9 4.0* 5.7 9.5 3.8*
Banking status
Underbanked 29.0 27.8 -1.3 26.6 27.6 1.0 9.5 12.6 3.1*
Fully banked 33.0 28.2 -4.8* 35.1 39.9 4.8* 4.7 8.7 4.0*
Family income
Less than $15,000 47.5 41.7 -5.8* 14.5 18.0 3.5* 4.0 7.1 3.0*
$15,000 to $30,000 44.9 40.5 -4.4* 17.3 20.8 3.5* 5.3 8.1 2.7*
$30,000 to $50,000 35.7 32.5 -3.3* 26.7 29.1 2.4* 6.3 9.7 3.4*
$50,000 to $75,000 28.3 25.8 -2.5* 36.8 39.7 2.8* 6.4 11.3 4.9*
At least $75,000 20.1 16.7 -3.4* 49.4 53.6 4.2* 5.7 9.7 4.0*
Education
No high school diploma 55.6 50.8 -4.8* 8.8 11.8 3.0* 2.4 4.0 1.6*
High school diploma 41.8 38.2 -3.6* 21.0 24.5 3.5* 4.3 7.5 3.2*
Some college 30.2 25.6 -4.6* 32.5 36.8 4.2* 7.4 11.6 4.2*
College degree 21.0 17.9 -3.1* 48.0 51.5 3.5* 6.2 10.4 4.2*
Age group
15 to 24 years 21.1 15.9 -5.2* 27.8 31.4 3.6* 20.3 25.0 4.7*
25 to 34 years 17.0 14.3 -2.8* 42.5 42.6 0.1 13.2 21.9 8.7*
35 to 44 years 21.1 16.9 -4.2* 41.5 45.8 4.3* 8.9 14.3 5.4*
45 to 54 years 26.7 22.9 -3.8* 37.7 42.0 4.3* 3.7 7.6 3.8*
55 to 64 years 36.1 31.7 -4.4* 31.6 37.3 5.7* 1.4 3.4 2.0*
65 years or more 54.6 48.7 -5.9* 17.8 23.8 5.9* 0.6 1.2 0.6*
Race/Ethnicity
Black 33.1 30.1 -3.0* 21.3 25.1 3.7* 7.8 11.3 3.5*
Hispanic 34.0 29.3 -4.7* 23.0 27.2 4.2* 8.3 12.6 4.3*
Asian 29.7 25.5 -4.2* 40.2 44.4 4.1* 5.7 9.0 3.3*
White 32.0 27.9 -4.1* 35.8 40.0 4.2* 5.0 8.6 3.6*
Other 32.0 25.4 -6.7* 29.4 33.8 4.4 3.7 12.5 8.8*
Disability status
Disabled, age 25 to 64 35.6 32.4 -3.2* 24.8 25.9 1.1 2.7 6.6 3.9*
Not disabled, age 25 to 64 24.5 20.6 -3.9* 39.7 43.8 4.1* 6.9 11.9 5.0*
Metropolitan status
Metro area - principal city 28.9 24.6 -4.3* 32.9 36.9 4.1* 6.8 11.1 4.3*
Metro area - balance 29.1 24.9 -4.2* 37.0 40.8 3.8* 6.0 9.5 3.5*
Not in metro area 44.9 41.5 -3.3* 23.2 27.4 4.2* 3.2 6.7 3.5*
Not identified 34.0 31.9 -2.2* 31.1 34.0 2.8* 5.5 8.9 3.4*
Notes: Asterisks indicate differences that are statistically significant at the 10 percent level. See Appendix Tables B.5 – B.9 for estimates by other household characteristics, and for selected confidence intervals.

28 | 2015 FDIC National Survey of Unbanked and Underbanked Households
2015 FDIC National Survey of Unbanked and Underbanked Households
5. Prepaid Cards
Some consumers use general purpose reloadable prepaid
cards to address their financial transaction needs. Similar to
a checking account, these cards can be used to pay bills,
withdraw cash at ATMs, make purchases, deposit checks,
and receive direct deposits. These cards may have been
obtained from sources such as a bank location or bank web-
site, a nonbank store or website, a government agency, or an
employer.25 Many, although not all, such cards store funds in
accounts eligible for deposit insurance.
As with the 2013 survey, the 2015 survey asked households
whether they used a prepaid card in the past 12 months,
which we refer to as prepaid card use.26 Between 2013 and
2015, the proportion of households that used a prepaid card
increased from 7.9 percent to 9.8 percent, as shown in Table
5.1.27
Table 5.1 Prepaid Card Use in Past 12 Months by YearFor all households, row percent
YearNumber of
Households (1000s)
Used(Percent)
Did not use (Percent)
Unknown(Percent)
2013 123,750 7.9 86.4 5.7
2015 127,538 9.8 85.8 4.4
Prepaid Card Use by Household CharacteristicsDifferences in prepaid card use across households were
similar in 2015 to earlier survey years. As shown in Table 5.2,
prepaid card use was higher among lower-income house-
holds, less-educated households, younger households, black
households, and working-age disabled households. Growth in
prepaid card use from 2013 to 2015 occurred broadly among
socioeconomic and demographic groups.
Table 5.2 Prepaid Card Use in Past 12 Months by Selected Household Characteristics and YearFor all households
Characteristics2013
(Percent)2015
(Percent)Difference(2015-2013)
All 7.9 9.8 1.8*
Family income
Less than $15,000 11.4 14.3 3.0*
$15,000 to $30,000 8.3 10.8 2.5*
$30,000 to $50,000 8.3 8.8 0.6
$50,000 to $75,000 6.4 9.2 2.8*
At least $75,000 6.5 8.1 1.5*
Education
No high school diploma 8.9 11.0 2.1*
High school diploma 8.1 10.3 2.2*
Some college 8.8 10.8 2.0*
College degree 6.7 8.0 1.4*
Age group
15 to 24 years 12.7 12.4 -0.3
25 to 34 years 10.9 12.6 1.6*
35 to 44 years 10.3 11.4 1.1
45 to 54 years 9.1 11.0 1.8*
55 to 64 years 6.4 9.3 2.9*
65 years or more 3.0 5.5 2.6*
Race/Ethnicity
Black 11.5 13.9 2.4*
Hispanic 7.8 9.6 1.9*
Asian 4.4 5.7 1.3
White 7.3 9.1 1.7*
Other 13.8 17.0 3.2
Disability status
Disabled, age 25 to 64 12.4 15.2 2.8*
Not disabled, age 25 to 64
8.7 10.4 1.7*
Notes: Asterisks indicate differences that are statistically significant at the 10 percent level. See Appendix Table C.2 for estimates by other household characteristics, as well as for selected confidence intervals.
25Households were instructed that the survey questions about prepaid cards were “not asking about gift cards or debit cards linked to a checking account.”
26Several questions on prepaid cards were added to the 2015 survey, and some questions from the 2013 survey were either revised or dropped. The introductory description of prepaid cards was made more concise in the 2015 survey, and the list of prepaid card sources was revised. The 2013 survey included questions about whether households used a prepaid card in the past 30 days or had ever used a prepaid card, reasons for prepaid card use, and reloading prepaid cards; these questions were not repeated in the 2015 survey. The 2015 survey included new questions about the use of prepaid cards to save for unexpected expenses or emergencies, receive income in a typical month, and pay bills in a typical month (these questions are discussed in sections 7 and 9). See Appendix 2 for additional details.
27Between 2011 and 2013, prepaid card use also increased, as measured by the proportion of households that had ever used a prepaid card. Estimates of prepaid card use in 2011 are not comparable to 2015 because in 2011, households were only asked if they had ever used a prepaid card, while in 2015 households were only asked if they used a prepaid card in the past 12 months.
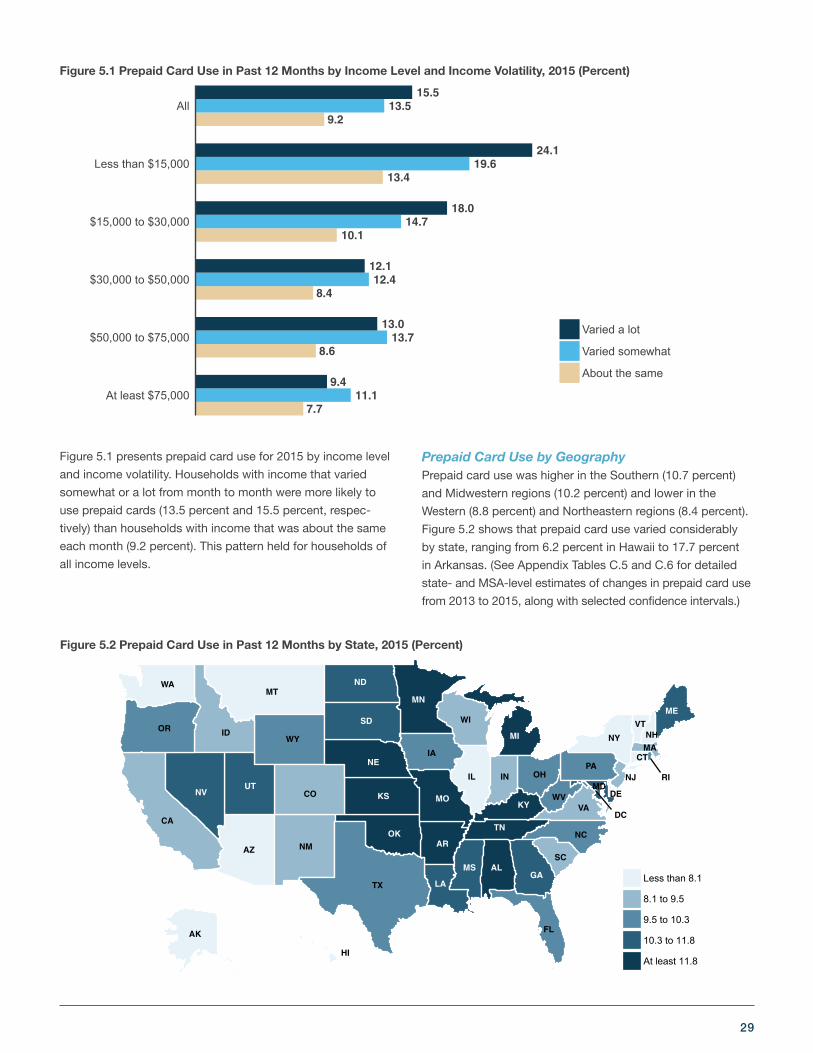
29
Figure 5.1 presents prepaid card use for 2015 by income level
and income volatility. Households with income that varied
somewhat or a lot from month to month were more likely to
use prepaid cards (13.5 percent and 15.5 percent, respec-
tively) than households with income that was about the same
each month (9.2 percent). This pattern held for households of
all income levels.
Prepaid Card Use by GeographyPrepaid card use was higher in the Southern (10.7 percent)
and Midwestern regions (10.2 percent) and lower in the
Western (8.8 percent) and Northeastern regions (8.4 percent).
Figure 5.2 shows that prepaid card use varied considerably
by state, ranging from 6.2 percent in Hawaii to 17.7 percent
in Arkansas. (See Appendix Tables C.5 and C.6 for detailed
state- and MSA-level estimates of changes in prepaid card use
from 2013 to 2015, along with selected confidence intervals.)
7.711.1
9.4
8.613.7
13.0
8.412.4
12.1
10.114.7
18.0
13.419.6
24.1
9.213.5
15.5
At least $75,000
$50,000 to $75,000
$30,000 to $50,000
$15,000 to $30,000
Less than $15,000
All
Varied a lot
Varied somewhat
About the same
Figure 5.1 Prepaid Card Use in Past 12 Months by Income Level and Income Volatility, 2015 (Percent)
AZ
CA
CO
CT
DE
FL
ID
IL IN
IA
MD
MA
MT
NH
NM
NY
NC
OH
OR
PA
SC
TX
VT
VA
WA
WV
WI
WY
DC
AK
NJ
HI
RI
OKAR
LA
MS ALGA
UT
ND
SD
MN
MO
ME
NV KS
NE
TN
KY
MI
Less than 8.1
8.1 to 9.5
9.5 to 10.3
10.3 to 11.8
At least 11.8
Figure 5.2 Prepaid Card Use in Past 12 Months by State, 2015 (Percent)
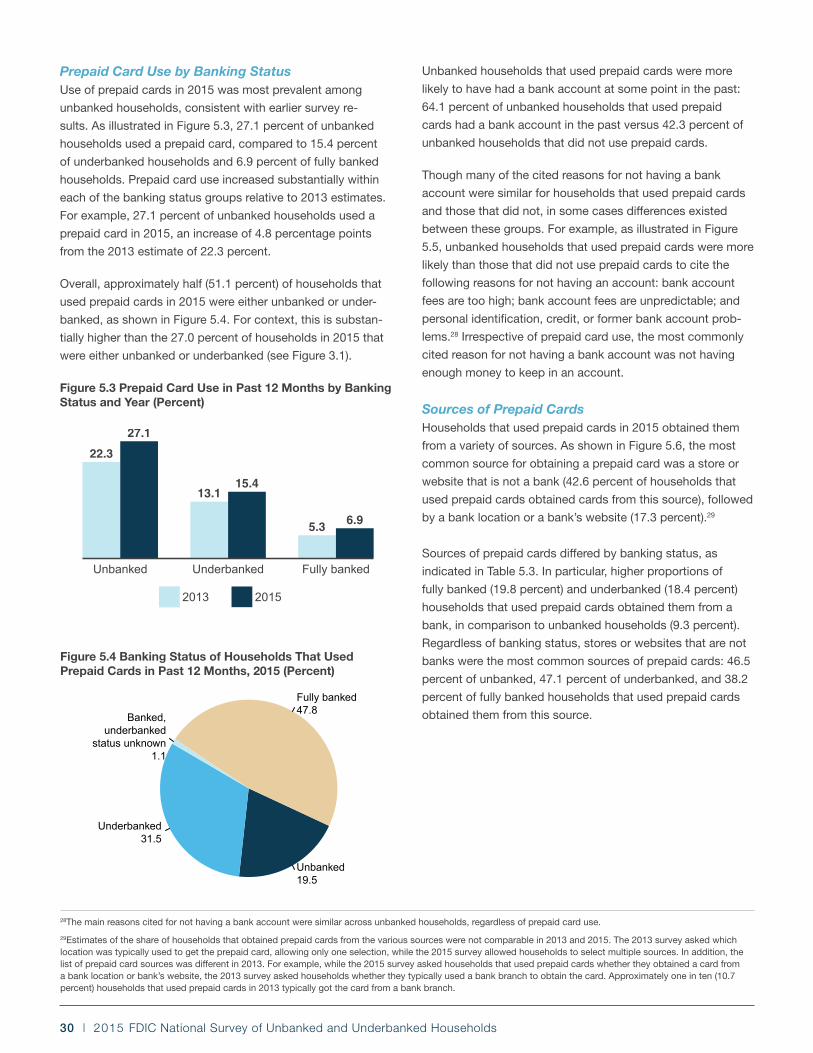
30 | 2015 FDIC National Survey of Unbanked and Underbanked Households
Prepaid Card Use by Banking StatusUse of prepaid cards in 2015 was most prevalent among
unbanked households, consistent with earlier survey re-
sults. As illustrated in Figure 5.3, 27.1 percent of unbanked
households used a prepaid card, compared to 15.4 percent
of underbanked households and 6.9 percent of fully banked
households. Prepaid card use increased substantially within
each of the banking status groups relative to 2013 estimates.
For example, 27.1 percent of unbanked households used a
prepaid card in 2015, an increase of 4.8 percentage points
from the 2013 estimate of 22.3 percent.
Overall, approximately half (51.1 percent) of households that
used prepaid cards in 2015 were either unbanked or under-
banked, as shown in Figure 5.4. For context, this is substan-
tially higher than the 27.0 percent of households in 2015 that
were either unbanked or underbanked (see Figure 3.1).
Unbanked households that used prepaid cards were more
likely to have had a bank account at some point in the past:
64.1 percent of unbanked households that used prepaid
cards had a bank account in the past versus 42.3 percent of
unbanked households that did not use prepaid cards.
Though many of the cited reasons for not having a bank
account were similar for households that used prepaid cards
and those that did not, in some cases differences existed
between these groups. For example, as illustrated in Figure
5.5, unbanked households that used prepaid cards were more
likely than those that did not use prepaid cards to cite the
following reasons for not having an account: bank account
fees are too high; bank account fees are unpredictable; and
personal identification, credit, or former bank account prob-
lems.28 Irrespective of prepaid card use, the most commonly
cited reason for not having a bank account was not having
enough money to keep in an account.
Sources of Prepaid CardsHouseholds that used prepaid cards in 2015 obtained them
from a variety of sources. As shown in Figure 5.6, the most
common source for obtaining a prepaid card was a store or
website that is not a bank (42.6 percent of households that
used prepaid cards obtained cards from this source), followed
by a bank location or a bank’s website (17.3 percent).29
Sources of prepaid cards differed by banking status, as
indicated in Table 5.3. In particular, higher proportions of
fully banked (19.8 percent) and underbanked (18.4 percent)
households that used prepaid cards obtained them from a
bank, in comparison to unbanked households (9.3 percent).
Regardless of banking status, stores or websites that are not
banks were the most common sources of prepaid cards: 46.5
percent of unbanked, 47.1 percent of underbanked, and 38.2
percent of fully banked households that used prepaid cards
obtained them from this source.
28The main reasons cited for not having a bank account were similar across unbanked households, regardless of prepaid card use.
29Estimates of the share of households that obtained prepaid cards from the various sources were not comparable in 2013 and 2015. The 2013 survey asked which location was typically used to get the prepaid card, allowing only one selection, while the 2015 survey allowed households to select multiple sources. In addition, the list of prepaid card sources was different in 2013. For example, while the 2015 survey asked households that used prepaid cards whether they obtained a card from a bank location or bank’s website, the 2013 survey asked households whether they typically used a bank branch to obtain the card. Approximately one in ten (10.7 percent) households that used prepaid cards in 2013 typically got the card from a bank branch.
Figure 5.3 Prepaid Card Use in Past 12 Months by Banking Status and Year (Percent)
22.3
27.1
13.115.4
5.3 6.9
Unbanked Underbanked Fully banked
2013 2015
Figure 5.4 Banking Status of Households That Used Prepaid Cards in Past 12 Months, 2015 (Percent)
Unbanked19.5
Underbanked31.5
Banked, underbanked
status unknown1.1
Fully banked47.8

31
14.313.9
11.18.0
9.19.6
18.314.9
22.015.4
33.821.7
35.426.6
31.828.4
31.729.7
60.860.7
Other reason
Inconvenient hours
Inconvenient locations
Banks do not offer needed products or services
ID, credit, or former bank account problems
Account fees unpredictable
Account fees too high
Don't trust banks
Avoiding bank gives more privacy
Do not have enough money to keep in account
Used prepaid card
Did not use prepaid card
Figure 5.5 Cited Reasons for Not Having a Bank Account by Prepaid Card Use, 2015 (Percent)
1.3
6.8
9.2
14.2
14.8
17.3
42.6
Unknown
Other
Employer payroll card
Family or friends
Government agency
Bank location or bank's website
Store or website that is not a bank
Figure 5.6 Sources of Prepaid Cards for Households That Used Prepaid Cards in Past 12 Months, 2015 (Percent)
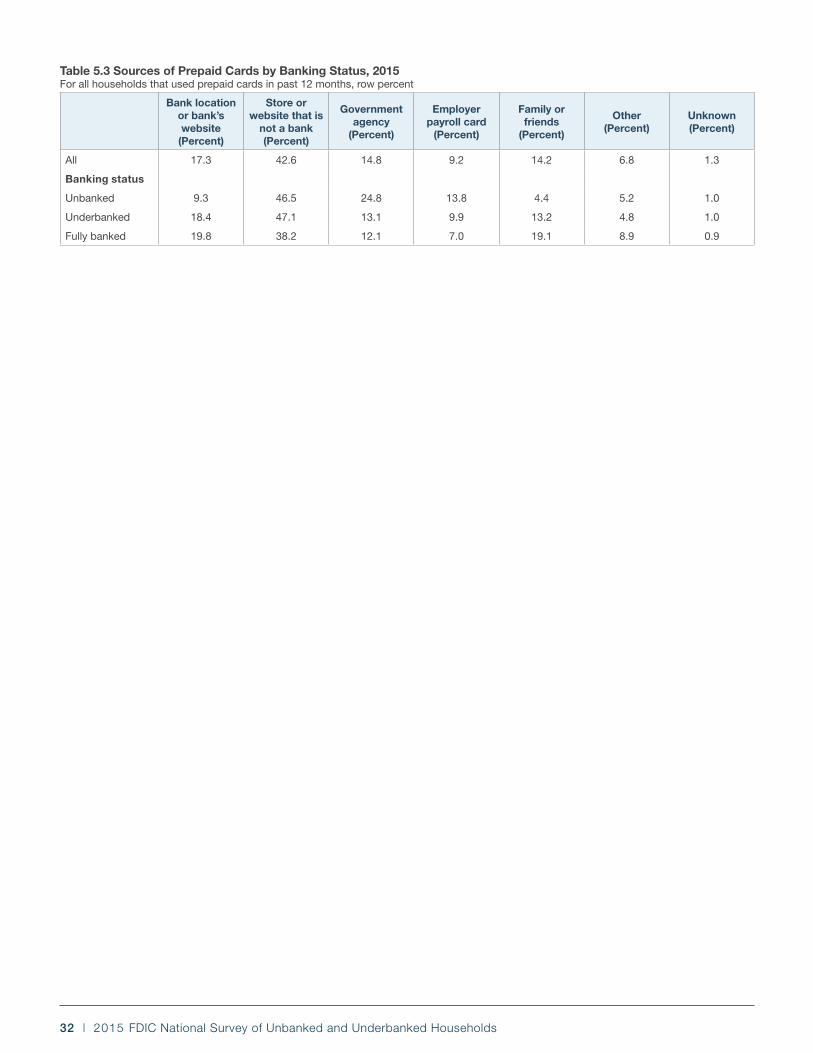
32 | 2015 FDIC National Survey of Unbanked and Underbanked Households
Bank location or bank’s website
(Percent)
Store or website that is
not a bank (Percent)
Government agency
(Percent)
Employer payroll card
(Percent)
Family or friends
(Percent)
Other (Percent)
Unknown (Percent)
All 17.3 42.6 14.8 9.2 14.2 6.8 1.3
Banking status
Unbanked 9.3 46.5 24.8 13.8 4.4 5.2 1.0
Underbanked 18.4 47.1 13.1 9.9 13.2 4.8 1.0
Fully banked 19.8 38.2 12.1 7.0 19.1 8.9 0.9
Table 5.3 Sources of Prepaid Cards by Banking Status, 2015For all households that used prepaid cards in past 12 months, row percent
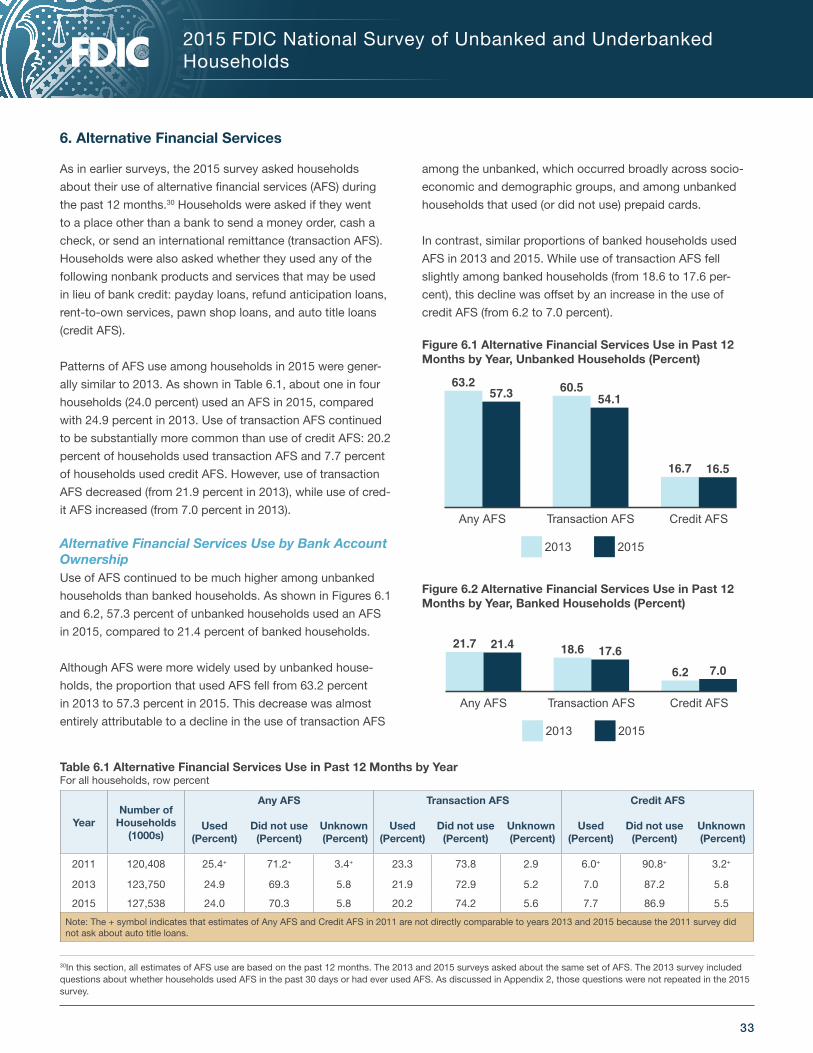
33
2015 FDIC National Survey of Unbanked and Underbanked Households
6. Alternative Financial Services
As in earlier surveys, the 2015 survey asked households
about their use of alternative financial services (AFS) during
the past 12 months.30 Households were asked if they went
to a place other than a bank to send a money order, cash a
check, or send an international remittance (transaction AFS).
Households were also asked whether they used any of the
following nonbank products and services that may be used
in lieu of bank credit: payday loans, refund anticipation loans,
rent-to-own services, pawn shop loans, and auto title loans
(credit AFS).
Patterns of AFS use among households in 2015 were gener-
ally similar to 2013. As shown in Table 6.1, about one in four
households (24.0 percent) used an AFS in 2015, compared
with 24.9 percent in 2013. Use of transaction AFS continued
to be substantially more common than use of credit AFS: 20.2
percent of households used transaction AFS and 7.7 percent
of households used credit AFS. However, use of transaction
AFS decreased (from 21.9 percent in 2013), while use of cred-
it AFS increased (from 7.0 percent in 2013).
Alternative Financial Services Use by Bank Account Ownership Use of AFS continued to be much higher among unbanked
households than banked households. As shown in Figures 6.1
and 6.2, 57.3 percent of unbanked households used an AFS
in 2015, compared to 21.4 percent of banked households.
Although AFS were more widely used by unbanked house-
holds, the proportion that used AFS fell from 63.2 percent
in 2013 to 57.3 percent in 2015. This decrease was almost
entirely attributable to a decline in the use of transaction AFS
among the unbanked, which occurred broadly across socio-
economic and demographic groups, and among unbanked
households that used (or did not use) prepaid cards.
In contrast, similar proportions of banked households used
AFS in 2013 and 2015. While use of transaction AFS fell
slightly among banked households (from 18.6 to 17.6 per-
cent), this decline was offset by an increase in the use of
credit AFS (from 6.2 to 7.0 percent).
Figure 6.1 Alternative Financial Services Use in Past 12 Months by Year, Unbanked Households (Percent)
63.257.3 60.5
54.1
16.7 16.5
Any AFS Transaction AFS Credit AFS
2013 2015
Figure 6.2 Alternative Financial Services Use in Past 12 Months by Year, Banked Households (Percent)
21.7 21.4 18.6 17.6
6.2 7.0
Any AFS Transaction AFS Credit AFS
2013 2015
30In this section, all estimates of AFS use are based on the past 12 months. The 2013 and 2015 surveys asked about the same set of AFS. The 2013 survey included questions about whether households used AFS in the past 30 days or had ever used AFS. As discussed in Appendix 2, those questions were not repeated in the 2015 survey.
YearNumber of
Households (1000s)
Any AFS Transaction AFS Credit AFS
Used (Percent)
Did not use (Percent)
Unknown (Percent)
Used (Percent)
Did not use (Percent)
Unknown (Percent)
Used (Percent)
Did not use (Percent)
Unknown (Percent)
2011 120,408 25.4+ 71.2+ 3.4+ 23.3 73.8 2.9 6.0+ 90.8+ 3.2+
2013 123,750 24.9 69.3 5.8 21.9 72.9 5.2 7.0 87.2 5.8
2015 127,538 24.0 70.3 5.8 20.2 74.2 5.6 7.7 86.9 5.5
Note: The + symbol indicates that estimates of Any AFS and Credit AFS in 2011 are not directly comparable to years 2013 and 2015 because the 2011 survey did not ask about auto title loans.
Table 6.1 Alternative Financial Services Use in Past 12 Months by YearFor all households, row percent

34 | 2015 FDIC National Survey of Unbanked and Underbanked Households
Table 6.2 shows use of specific AFS by bank account
ownership and year. Overall, as shown in panel A, money
orders were the most commonly used AFS in 2015, followed
by check cashing. Use of nonbank money orders declined
substantially in recent years, however, particularly among
unbanked households. Use of nonbank check cashing also
declined sharply among unbanked households, from 35.9
percent in 2013 to 30.3 percent in 2015.
Alternative Financial Services Use by Household CharacteristicsConsistent with past survey results, AFS use differed widely
across households. As shown in Appendix Table D.1, use of
AFS was higher among lower-income households, less-edu-
cated households, younger households, black and Hispanic
households, and working-age disabled households. As in-
dicated in Appendix Table D.4, declines in the use of trans-
action AFS between 2013 and 2015 were fairly widespread
across segments of the population.
Income volatility was also related to AFS use, as illustrated
in Figures 6.3 and 6.4. For example, 34.3 percent of house-
holds with income that varied a lot from month to month used
transaction AFS, compared to 18.9 percent of households
with steady monthly income. Similarly, use of credit AFS was
substantially higher among households with more volatile
income.
Even at higher levels of income, AFS use was higher among
households with volatile income. For example, among house-
holds with annual income of at least $75,000 that varied a
lot from month to month, 17.5 percent used transaction AFS
and 8.6 percent used credit AFS. In contrast, for households
with annual income of at least $75,000 and steady monthly
income, 10.8 percent used transaction AFS and 3.4 percent
used credit AFS.
Specific AFS2011
(Percent)2013
(Percent)2015
(Percent)Difference (2015-2013)
A. All households
Money orders 18.3 17.3 15.0 -2.3*
Check cashing 7.7 6.5 6.5 -0.1
Remittances 3.7 3.7 3.7 0.0
Pawn shop loans
2.9 2.9 1.8 -1.1*
Payday loans 1.7 2.0 2.0 0.0
Refund anticipation loans
1.2 1.8 2.6 0.8*
Rent-to-own 1.5 1.5 1.8 0.3*
Auto title loans 0.9 1.3 0.5*
B. Unbanked households
Money orders 49.1 47.3 43.2 -4.2*
Check cashing 38.0 35.9 30.3 -5.6*
Remittances 9.2 9.2 7.9 -1.3
Pawn shop loans
10.5 9.9 6.6 -3.3*
Payday loans 1.6 2.7 3.6 0.9*
Refund anticipation loans
3.4 3.8 4.5 0.7
Rent-to-own 5.1 4.5 5.0 0.6
Auto title loans 1.7 2.3 0.7
C. Banked households
Money orders 15.6 14.7 12.8 -1.9*
Check cashing 5.0 4.1 4.7 0.6*
Remittances 3.2 3.2 3.4 0.2
Pawn shop loans
2.2 2.3 1.5 -0.8*
Payday loans 1.7 1.9 1.8 -0.1
Refund anticipation loans
1.0 1.6 2.5 0.8*
Rent-to-own 1.2 1.2 1.5 0.3*
Auto title loans 0.8 1.3 0.5*
Notes: Asterisks indicate differences that are statistically significant at the 10 percent level. Estimates of auto title loan use are not available for the year 2011.
Table 6.2 Use of Specific Alternative Financial Services by Bank Account Ownership and YearFor all households
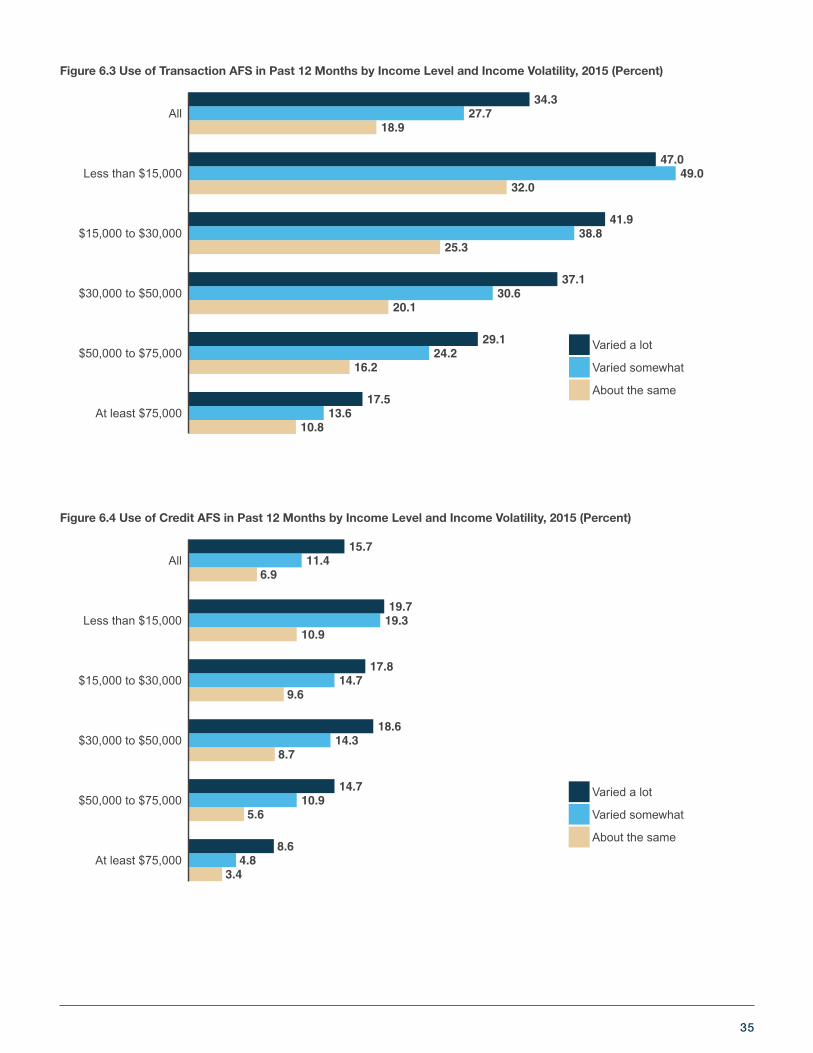
35
10.813.6
17.5
16.224.2
29.1
20.130.6
37.1
25.338.8
41.9
32.049.0
47.0
18.927.7
34.3
At least $75,000
$50,000 to $75,000
$30,000 to $50,000
$15,000 to $30,000
Less than $15,000
All
Varied a lot
Varied somewhat
About the same
3.44.8
8.6
5.610.9
14.7
8.714.3
18.6
9.614.7
17.8
10.919.319.7
6.911.4
15.7
At least $75,000
$50,000 to $75,000
$30,000 to $50,000
$15,000 to $30,000
Less than $15,000
All
Varied a lot
Varied somewhat
About the same
Figure 6.4 Use of Credit AFS in Past 12 Months by Income Level and Income Volatility, 2015 (Percent)
Figure 6.3 Use of Transaction AFS in Past 12 Months by Income Level and Income Volatility, 2015 (Percent)
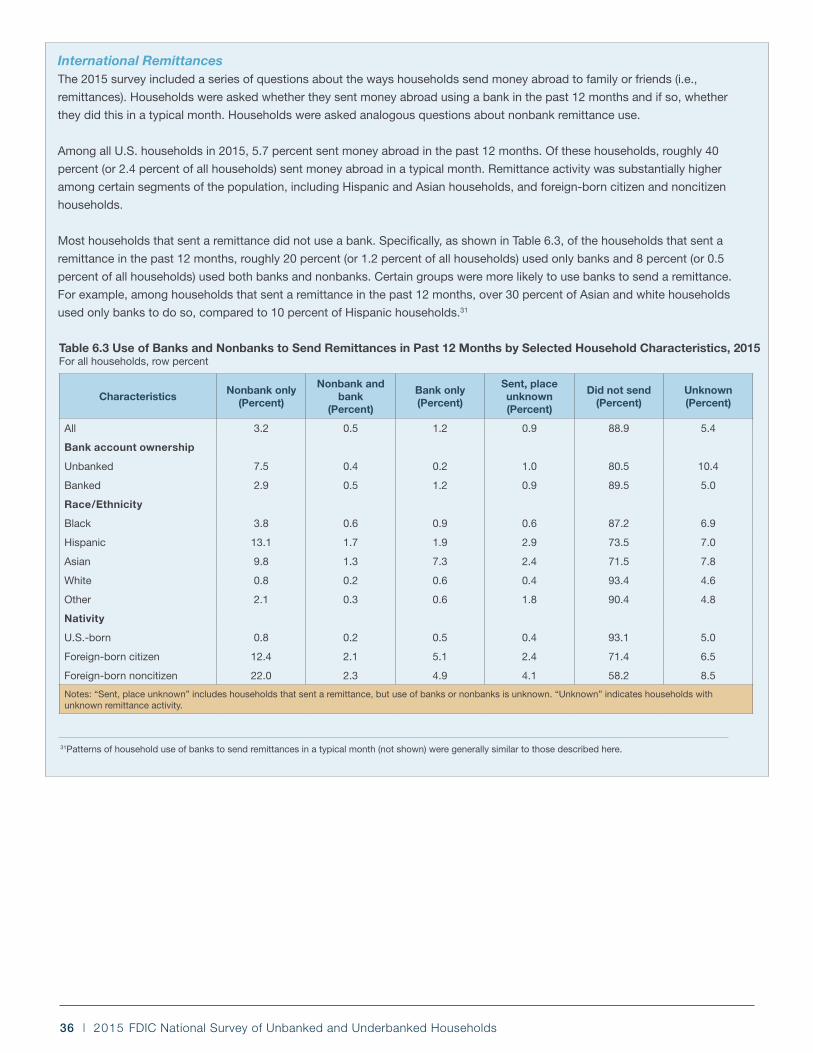
36 | 2015 FDIC National Survey of Unbanked and Underbanked Households
International RemittancesThe 2015 survey included a series of questions about the ways households send money abroad to family or friends (i.e.,
remittances). Households were asked whether they sent money abroad using a bank in the past 12 months and if so, whether
they did this in a typical month. Households were asked analogous questions about nonbank remittance use.
Among all U.S. households in 2015, 5.7 percent sent money abroad in the past 12 months. Of these households, roughly 40
percent (or 2.4 percent of all households) sent money abroad in a typical month. Remittance activity was substantially higher
among certain segments of the population, including Hispanic and Asian households, and foreign-born citizen and noncitizen
households.
Most households that sent a remittance did not use a bank. Specifically, as shown in Table 6.3, of the households that sent a
remittance in the past 12 months, roughly 20 percent (or 1.2 percent of all households) used only banks and 8 percent (or 0.5
percent of all households) used both banks and nonbanks. Certain groups were more likely to use banks to send a remittance.
For example, among households that sent a remittance in the past 12 months, over 30 percent of Asian and white households
used only banks to do so, compared to 10 percent of Hispanic households.31
31Patterns of household use of banks to send remittances in a typical month (not shown) were generally similar to those described here.
CharacteristicsNonbank only
(Percent)
Nonbank and bank
(Percent)
Bank only (Percent)
Sent, place unknown (Percent)
Did not send (Percent)
Unknown (Percent)
All 3.2 0.5 1.2 0.9 88.9 5.4
Bank account ownership
Unbanked 7.5 0.4 0.2 1.0 80.5 10.4
Banked 2.9 0.5 1.2 0.9 89.5 5.0
Race/Ethnicity
Black 3.8 0.6 0.9 0.6 87.2 6.9
Hispanic 13.1 1.7 1.9 2.9 73.5 7.0
Asian 9.8 1.3 7.3 2.4 71.5 7.8
White 0.8 0.2 0.6 0.4 93.4 4.6
Other 2.1 0.3 0.6 1.8 90.4 4.8
Nativity
U.S.-born 0.8 0.2 0.5 0.4 93.1 5.0
Foreign-born citizen 12.4 2.1 5.1 2.4 71.4 6.5
Foreign-born noncitizen 22.0 2.3 4.9 4.1 58.2 8.5
Notes: “Sent, place unknown” includes households that sent a remittance, but use of banks or nonbanks is unknown. “Unknown” indicates households with unknown remittance activity.
Table 6.3 Use of Banks and Nonbanks to Send Remittances in Past 12 Months by Selected Household Characteristics, 2015For all households, row percent

37
2015 FDIC National Survey of Unbanked and Underbanked Households
7. Saving for Unexpected Expenses or Emergencies
Savings can help households better manage unexpected
expenses or emergencies, such as health issues or major au-
tomobile repairs. The absence of savings can sometimes be a
barrier to financial stability and resilience, particularly for con-
sumers with uneven or low incomes. To gain insight into these
issues, the 2015 survey included new questions on whether
households saved for unexpected expenses or emergencies
and the methods they used.
Specifically, households were asked whether they set aside
any money in the past 12 months that could be used for
unexpected expenses or emergencies, even if the funds were
later spent.32 Households were prompted to consider only
funds that could have been easily spent, if necessary, and
not retirement or other long-term savings. Households that
set aside money for this purpose were then asked where
they kept the money, choosing one or more of the following
methods: savings accounts; checking accounts; prepaid
cards; other accounts such as certificates of deposit, broker-
age accounts, or savings bonds; in the home, or with family
or friends; buying something with the intent to pawn it or sell
it later, if necessary; or other methods.
Overall, 56.3 percent of households saved for unexpected
expenses or emergencies in the past 12 months.33
Savings Rates by Household CharacteristicsRates of saving for unexpected expenses or emergencies var-
ied by household characteristics (see Table 7.1). For example,
savings rates were lower among lower-income households,
less-educated households, black and Hispanic households,
and working-age disabled households. Differences by income
and education were especially pronounced. For instance, only
30.8 percent of households with income of less than $15,000
saved for unexpected expenses or emergencies, compared to
72.9 percent of households with income of at least $75,000.
Savings rates varied little by income volatility: 56.3 percent of
households with income that was about the same each month
saved, compared to 58.3 percent of households with income
that varied somewhat from month to month and 51.3 percent
of households with income that varied a lot.34
Savings Rates by GeographyRates of saving for unexpected expenses or emergencies
were higher in the Midwestern (61.1 percent) and Western re-
gions (59.1 percent) and lower in the Northeastern (56.2 per-
cent) and Southern regions (52.1 percent). Figure 7.1 shows
that savings rates varied widely across states, ranging from
42.7 percent in Florida to 71.3 percent in Utah. (See Appendix
Tables E.2 and E.3 for detailed estimates of savings rates by
state and MSA.)
Savings MethodsFigure 7.2 shows that among all households that saved for
unexpected expenses or emergencies, savings accounts
were the most used savings method followed by checking
accounts: more than four in five (84.9 percent) kept savings
in one of these accounts. About one in ten (10.5 percent)
households that saved maintained savings in the home, or
with family or friends.
32The question allows for funds to be later spent because a household might have experienced an unexpected expense or emergency that required the household to draw on the money that had been saved.
33The analysis presented in this section excludes 2,658 observations (representing roughly 10.1 million households) with missing information on whether the household saved for unexpected expenses or emergencies.
34The absence of a strong association between income volatility and savings rates may be due to the fact that the survey focused on saving for unexpected expenses or emergencies, and month-to-month volatility in income could be expected or unexpected. For example, households that expected their income to vary from month to month might have saved in higher-income months to pay for regular expenses in lower-income months, but they might not have viewed this activity as having saved for unexpected expenses or emergencies.
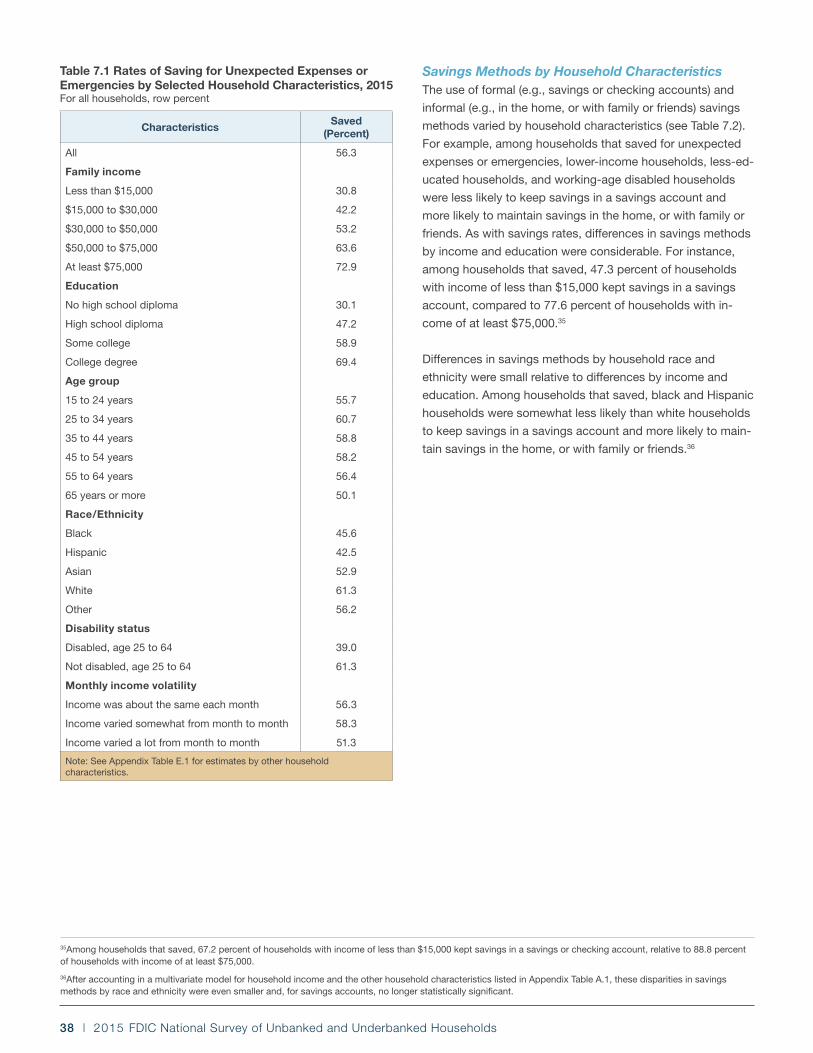
38 | 2015 FDIC National Survey of Unbanked and Underbanked Households
Savings Methods by Household CharacteristicsThe use of formal (e.g., savings or checking accounts) and
informal (e.g., in the home, or with family or friends) savings
methods varied by household characteristics (see Table 7.2).
For example, among households that saved for unexpected
expenses or emergencies, lower-income households, less-ed-
ucated households, and working-age disabled households
were less likely to keep savings in a savings account and
more likely to maintain savings in the home, or with family or
friends. As with savings rates, differences in savings methods
by income and education were considerable. For instance,
among households that saved, 47.3 percent of households
with income of less than $15,000 kept savings in a savings
account, compared to 77.6 percent of households with in-
come of at least $75,000.35
Differences in savings methods by household race and
ethnicity were small relative to differences by income and
education. Among households that saved, black and Hispanic
households were somewhat less likely than white households
to keep savings in a savings account and more likely to main-
tain savings in the home, or with family or friends.36
CharacteristicsSaved
(Percent)
All 56.3
Family income
Less than $15,000 30.8
$15,000 to $30,000 42.2
$30,000 to $50,000 53.2
$50,000 to $75,000 63.6
At least $75,000 72.9
Education
No high school diploma 30.1
High school diploma 47.2
Some college 58.9
College degree 69.4
Age group
15 to 24 years 55.7
25 to 34 years 60.7
35 to 44 years 58.8
45 to 54 years 58.2
55 to 64 years 56.4
65 years or more 50.1
Race/Ethnicity
Black 45.6
Hispanic 42.5
Asian 52.9
White 61.3
Other 56.2
Disability status
Disabled, age 25 to 64 39.0
Not disabled, age 25 to 64 61.3
Monthly income volatility
Income was about the same each month 56.3
Income varied somewhat from month to month 58.3
Income varied a lot from month to month 51.3
Note: See Appendix Table E.1 for estimates by other household characteristics.
Table 7.1 Rates of Saving for Unexpected Expenses or Emergencies by Selected Household Characteristics, 2015For all households, row percent
35Among households that saved, 67.2 percent of households with income of less than $15,000 kept savings in a savings or checking account, relative to 88.8 percent of households with income of at least $75,000.
36After accounting in a multivariate model for household income and the other household characteristics listed in Appendix Table A.1, these disparities in savings methods by race and ethnicity were even smaller and, for savings accounts, no longer statistically significant.
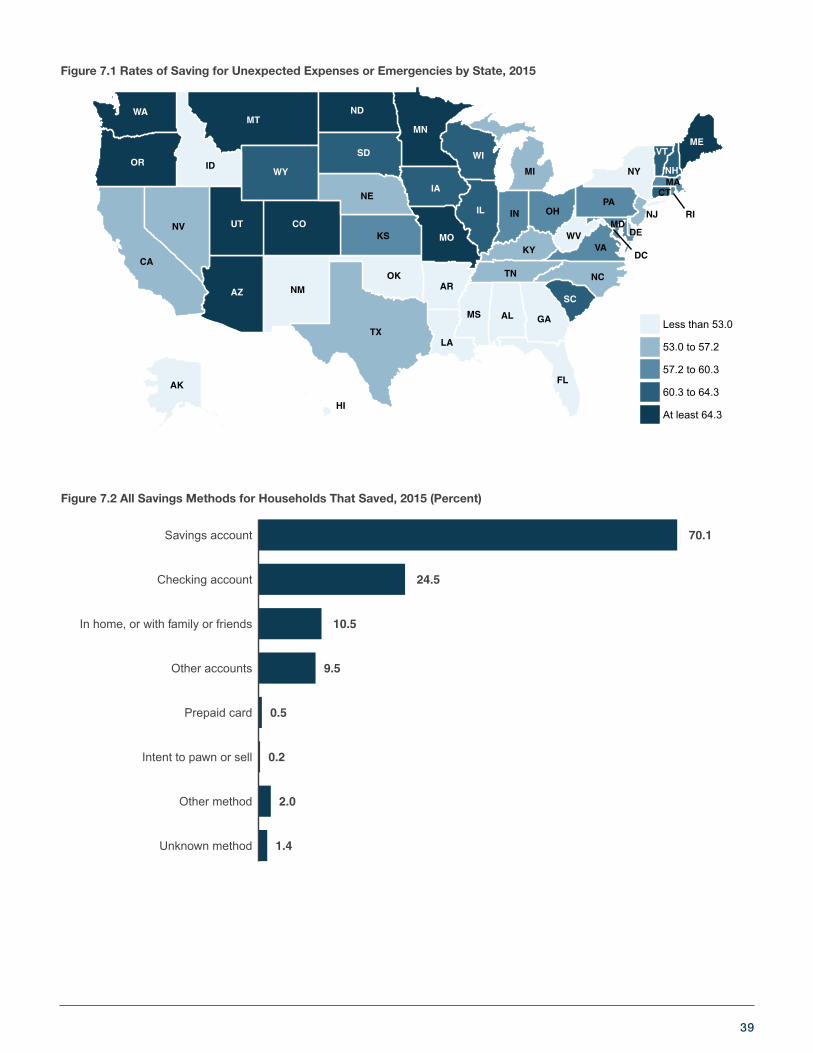
39
AL
AR
CA
CT
DE
FL
GA
ID
IN
KS
KY
LA
MD
MAMI
MS
NE
NV
NM
NY
NC
OH
OK
PA
TN
TX
VAWV
DC
AK
NJ
HI
RI
WA
OR
MT
WY
UT CO
AZ
ND
SD WI
MN
IA
MO
ME
IL
NH
VT
SC
Less than 53.0
53.0 to 57.2
57.2 to 60.3
60.3 to 64.3
At least 64.3
Figure 7.1 Rates of Saving for Unexpected Expenses or Emergencies by State, 2015
1.4
2.0
0.2
0.5
9.5
10.5
24.5
70.1
Unknown method
Other method
Intent to pawn or sell
Prepaid card
Other accounts
In home, or with family or friends
Checking account
Savings account
Figure 7.2 All Savings Methods for Households That Saved, 2015 (Percent)
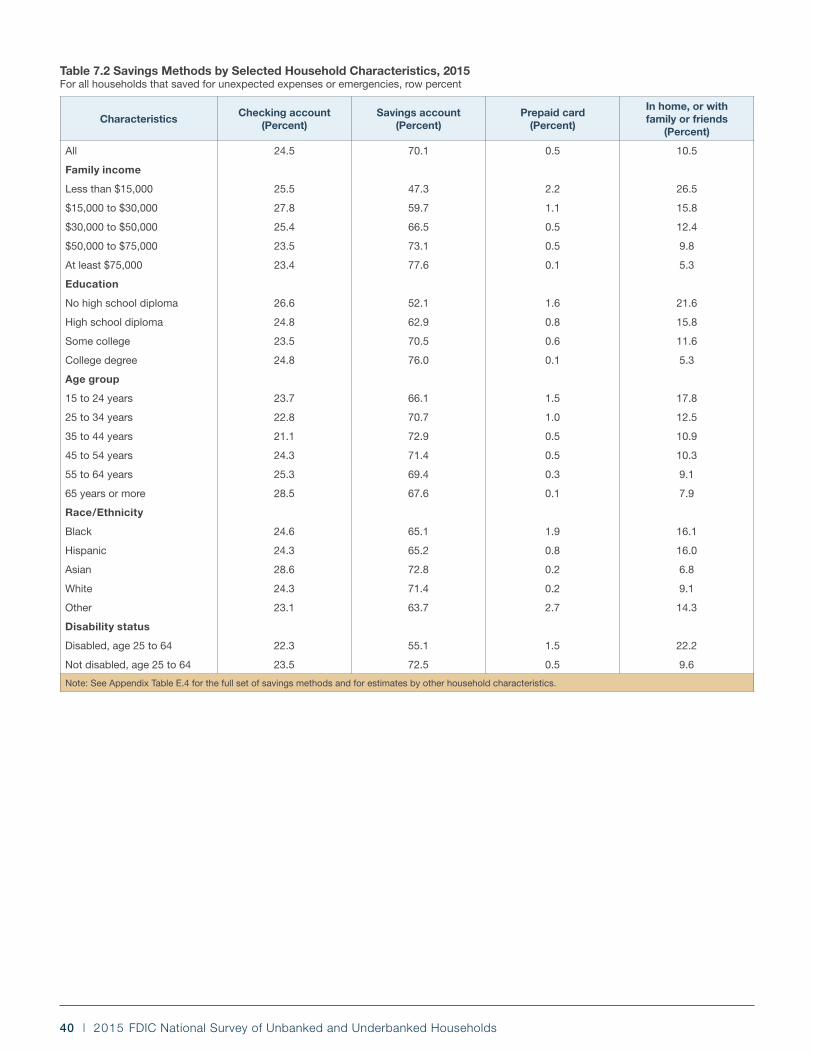
40 | 2015 FDIC National Survey of Unbanked and Underbanked Households
CharacteristicsChecking account
(Percent)Savings account
(Percent)Prepaid card
(Percent)
In home, or with family or friends
(Percent)
All 24.5 70.1 0.5 10.5
Family income
Less than $15,000 25.5 47.3 2.2 26.5
$15,000 to $30,000 27.8 59.7 1.1 15.8
$30,000 to $50,000 25.4 66.5 0.5 12.4
$50,000 to $75,000 23.5 73.1 0.5 9.8
At least $75,000 23.4 77.6 0.1 5.3
Education
No high school diploma 26.6 52.1 1.6 21.6
High school diploma 24.8 62.9 0.8 15.8
Some college 23.5 70.5 0.6 11.6
College degree 24.8 76.0 0.1 5.3
Age group
15 to 24 years 23.7 66.1 1.5 17.8
25 to 34 years 22.8 70.7 1.0 12.5
35 to 44 years 21.1 72.9 0.5 10.9
45 to 54 years 24.3 71.4 0.5 10.3
55 to 64 years 25.3 69.4 0.3 9.1
65 years or more 28.5 67.6 0.1 7.9
Race/Ethnicity
Black 24.6 65.1 1.9 16.1
Hispanic 24.3 65.2 0.8 16.0
Asian 28.6 72.8 0.2 6.8
White 24.3 71.4 0.2 9.1
Other 23.1 63.7 2.7 14.3
Disability status
Disabled, age 25 to 64 22.3 55.1 1.5 22.2
Not disabled, age 25 to 64 23.5 72.5 0.5 9.6
Note: See Appendix Table E.4 for the full set of savings methods and for estimates by other household characteristics.
Table 7.2 Savings Methods by Selected Household Characteristics, 2015For all households that saved for unexpected expenses or emergencies, row percent

41
Savings Rates and Methods by Banking StatusFigure 7.3 shows that unbanked households saved for unex-
pected expenses or emergencies at a much lower rate than
underbanked and fully banked households: 20.2 percent of
unbanked households saved for this purpose, compared to
55.2 percent of underbanked households and 60.0 percent of
fully banked households.
Figure 7.3 Rates of Saving for Unexpected Expenses or Emergencies by Banking Status, 2015
20.2
55.260.0
Unbanked Underbanked Fully banked
Figure 7.4 shows that unbanked households generally saved
using informal methods, while underbanked and fully banked
households generally saved using formal methods. Unbanked
households that saved primarily kept savings in the home,
or with family or friends (67.8 percent), and on prepaid cards
(12.6 percent).37 In contrast, underbanked and fully banked
households that saved primarily used savings and checking
accounts. The vast majority of underbanked (82.0 percent)
and fully banked (88.2 percent) households that saved kept
savings in one of these accounts.
Although prepaid cards are generally thought of as transac-
tional, some households, particularly the unbanked, used
them as savings vehicles. Among households that saved and
used a prepaid card in the past 12 months, 27.0 percent of
unbanked households kept savings on a prepaid card, com-
pared to only 4.1 percent of underbanked households and 1.2
percent of fully banked households.
37In addition, 12.3 percent of unbanked households selected other method, which is substantially higher than the percentage of underbanked (2.2 percent) and fully banked (1.6 percent) households that selected other method. (See Appendix Table E.4.)
3.00.7
67.8
12.6
65.7
24.7
16.7
0.7
73.4
25.2
7.0
0.1Unbanked Underbanked Fully banked
Savings account Checking account In home, or with family or friends Prepaid card
Figure 7.4 Selected Savings Methods for Households That Saved by Banking Status, 2015 (Percent)
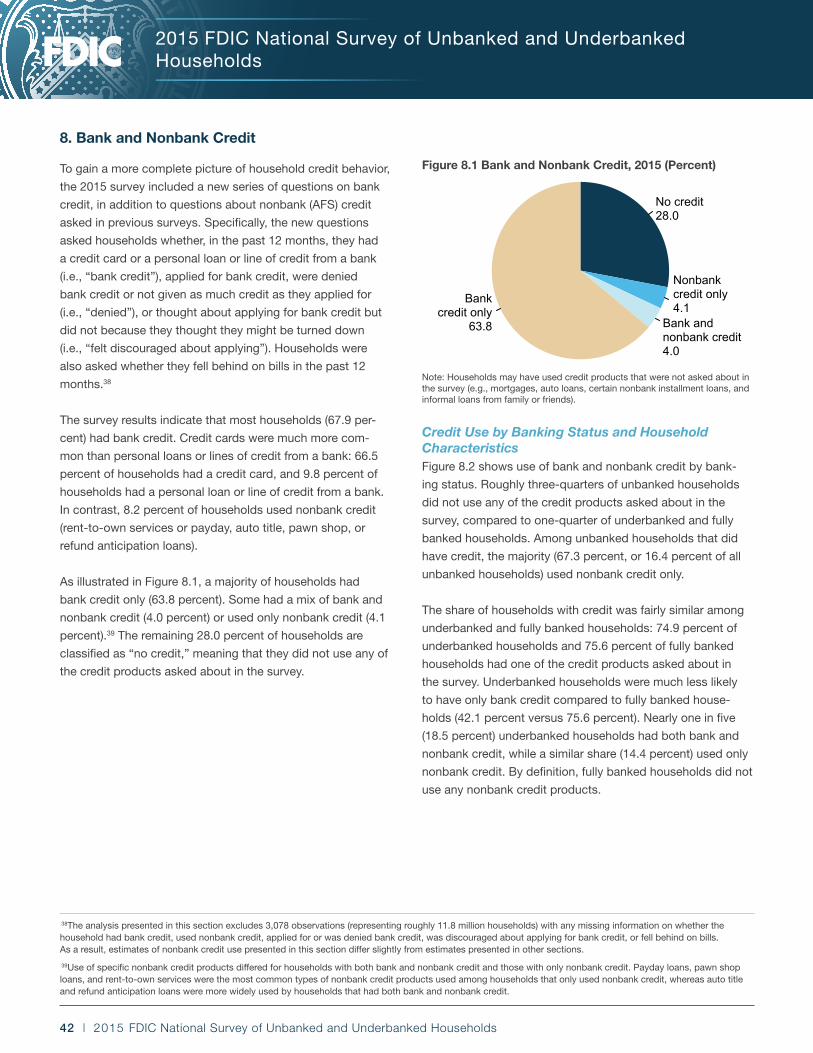
42 | 2015 FDIC National Survey of Unbanked and Underbanked Households
2015 FDIC National Survey of Unbanked and Underbanked Households
8. Bank and Nonbank Credit
To gain a more complete picture of household credit behavior,
the 2015 survey included a new series of questions on bank
credit, in addition to questions about nonbank (AFS) credit
asked in previous surveys. Specifically, the new questions
asked households whether, in the past 12 months, they had
a credit card or a personal loan or line of credit from a bank
(i.e., “bank credit”), applied for bank credit, were denied
bank credit or not given as much credit as they applied for
(i.e., “denied”), or thought about applying for bank credit but
did not because they thought they might be turned down
(i.e., “felt discouraged about applying”). Households were
also asked whether they fell behind on bills in the past 12
months.38
The survey results indicate that most households (67.9 per-
cent) had bank credit. Credit cards were much more com-
mon than personal loans or lines of credit from a bank: 66.5
percent of households had a credit card, and 9.8 percent of
households had a personal loan or line of credit from a bank.
In contrast, 8.2 percent of households used nonbank credit
(rent-to-own services or payday, auto title, pawn shop, or
refund anticipation loans).
As illustrated in Figure 8.1, a majority of households had
bank credit only (63.8 percent). Some had a mix of bank and
nonbank credit (4.0 percent) or used only nonbank credit (4.1
percent).39 The remaining 28.0 percent of households are
classified as “no credit,” meaning that they did not use any of
the credit products asked about in the survey.
Figure 8.1 Bank and Nonbank Credit, 2015 (Percent)
No credit28.0
Nonbankcredit only4.1
Bank andnonbank credit4.0
Bankcredit only
63.8
Note: Households may have used credit products that were not asked about in the survey (e.g., mortgages, auto loans, certain nonbank installment loans, and informal loans from family or friends).
Credit Use by Banking Status and Household CharacteristicsFigure 8.2 shows use of bank and nonbank credit by bank-
ing status. Roughly three-quarters of unbanked households
did not use any of the credit products asked about in the
survey, compared to one-quarter of underbanked and fully
banked households. Among unbanked households that did
have credit, the majority (67.3 percent, or 16.4 percent of all
unbanked households) used nonbank credit only.
The share of households with credit was fairly similar among
underbanked and fully banked households: 74.9 percent of
underbanked households and 75.6 percent of fully banked
households had one of the credit products asked about in
the survey. Underbanked households were much less likely
to have only bank credit compared to fully banked house-
holds (42.1 percent versus 75.6 percent). Nearly one in five
(18.5 percent) underbanked households had both bank and
nonbank credit, while a similar share (14.4 percent) used only
nonbank credit. By definition, fully banked households did not
use any nonbank credit products.
38The analysis presented in this section excludes 3,078 observations (representing roughly 11.8 million households) with any missing information on whether the household had bank credit, used nonbank credit, applied for or was denied bank credit, was discouraged about applying for bank credit, or fell behind on bills. As a result, estimates of nonbank credit use presented in this section differ slightly from estimates presented in other sections.
39Use of specific nonbank credit products differed for households with both bank and nonbank credit and those with only nonbank credit. Payday loans, pawn shop loans, and rent-to-own services were the most common types of nonbank credit products used among households that only used nonbank credit, whereas auto title and refund anticipation loans were more widely used by households that had both bank and nonbank credit.
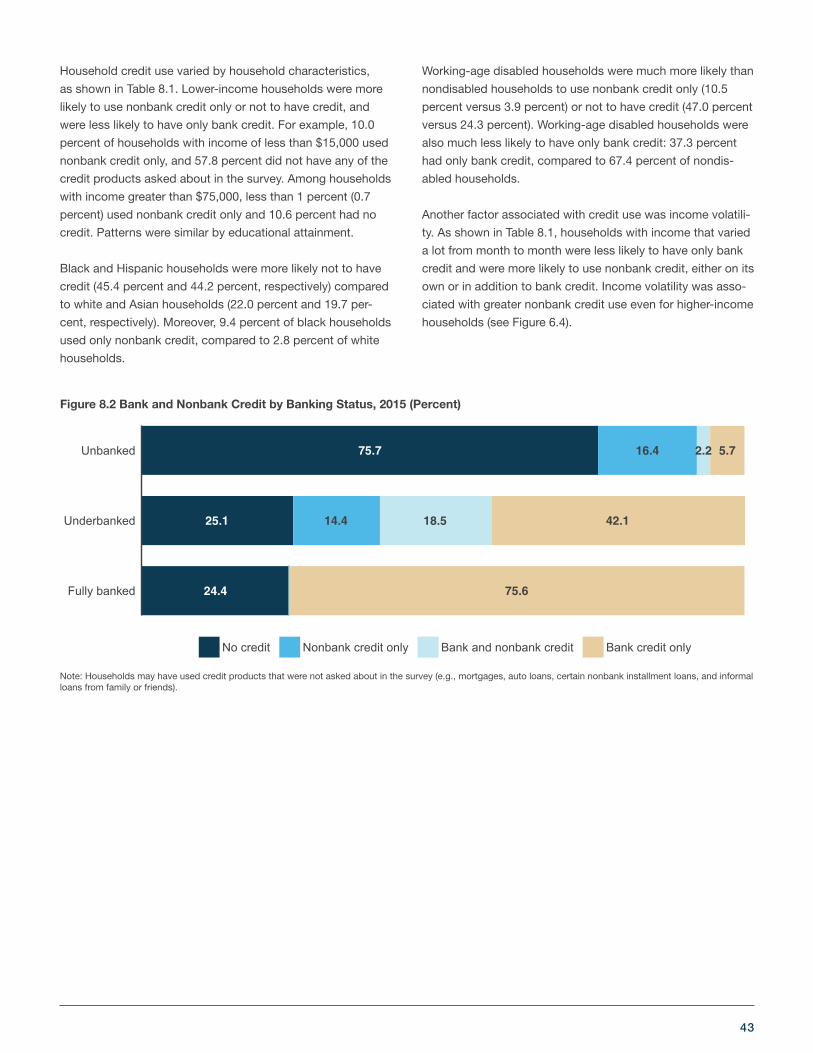
43
Household credit use varied by household characteristics,
as shown in Table 8.1. Lower-income households were more
likely to use nonbank credit only or not to have credit, and
were less likely to have only bank credit. For example, 10.0
percent of households with income of less than $15,000 used
nonbank credit only, and 57.8 percent did not have any of the
credit products asked about in the survey. Among households
with income greater than $75,000, less than 1 percent (0.7
percent) used nonbank credit only and 10.6 percent had no
credit. Patterns were similar by educational attainment.
Black and Hispanic households were more likely not to have
credit (45.4 percent and 44.2 percent, respectively) compared
to white and Asian households (22.0 percent and 19.7 per-
cent, respectively). Moreover, 9.4 percent of black households
used only nonbank credit, compared to 2.8 percent of white
households.
Working-age disabled households were much more likely than
nondisabled households to use nonbank credit only (10.5
percent versus 3.9 percent) or not to have credit (47.0 percent
versus 24.3 percent). Working-age disabled households were
also much less likely to have only bank credit: 37.3 percent
had only bank credit, compared to 67.4 percent of nondis-
abled households.
Another factor associated with credit use was income volatili-
ty. As shown in Table 8.1, households with income that varied
a lot from month to month were less likely to have only bank
credit and were more likely to use nonbank credit, either on its
own or in addition to bank credit. Income volatility was asso-
ciated with greater nonbank credit use even for higher-income
households (see Figure 6.4).
75.7
25.1
24.4
16.4
14.4
2.2
18.5
5.7
42.1
75.6Fully banked
Underbanked
Unbanked
No credit Nonbank credit only Bank and nonbank credit Bank credit only
Figure 8.2 Bank and Nonbank Credit by Banking Status, 2015 (Percent)
Note: Households may have used credit products that were not asked about in the survey (e.g., mortgages, auto loans, certain nonbank installment loans, and informal loans from family or friends).
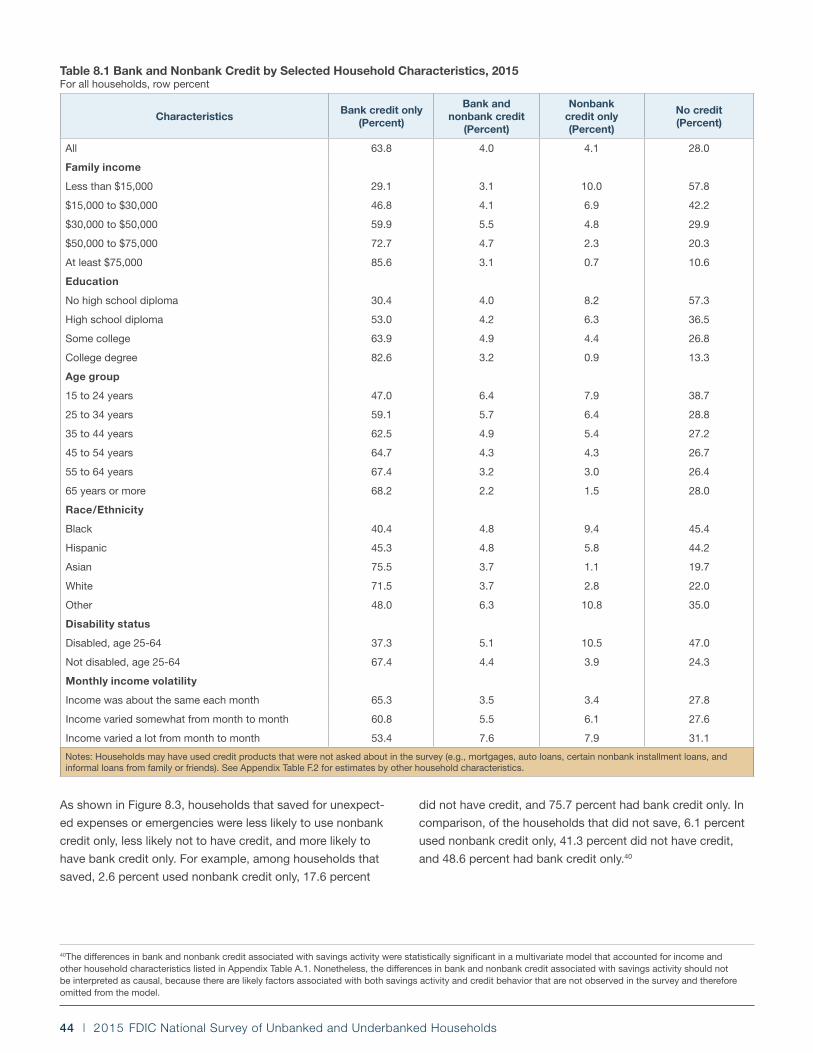
44 | 2015 FDIC National Survey of Unbanked and Underbanked Households
CharacteristicsBank credit only
(Percent)
Bank and nonbank credit
(Percent)
Nonbank credit only (Percent)
No credit (Percent)
All 63.8 4.0 4.1 28.0
Family income
Less than $15,000 29.1 3.1 10.0 57.8
$15,000 to $30,000 46.8 4.1 6.9 42.2
$30,000 to $50,000 59.9 5.5 4.8 29.9
$50,000 to $75,000 72.7 4.7 2.3 20.3
At least $75,000 85.6 3.1 0.7 10.6
Education
No high school diploma 30.4 4.0 8.2 57.3
High school diploma 53.0 4.2 6.3 36.5
Some college 63.9 4.9 4.4 26.8
College degree 82.6 3.2 0.9 13.3
Age group
15 to 24 years 47.0 6.4 7.9 38.7
25 to 34 years 59.1 5.7 6.4 28.8
35 to 44 years 62.5 4.9 5.4 27.2
45 to 54 years 64.7 4.3 4.3 26.7
55 to 64 years 67.4 3.2 3.0 26.4
65 years or more 68.2 2.2 1.5 28.0
Race/Ethnicity
Black 40.4 4.8 9.4 45.4
Hispanic 45.3 4.8 5.8 44.2
Asian 75.5 3.7 1.1 19.7
White 71.5 3.7 2.8 22.0
Other 48.0 6.3 10.8 35.0
Disability status
Disabled, age 25-64 37.3 5.1 10.5 47.0
Not disabled, age 25-64 67.4 4.4 3.9 24.3
Monthly income volatility
Income was about the same each month 65.3 3.5 3.4 27.8
Income varied somewhat from month to month 60.8 5.5 6.1 27.6
Income varied a lot from month to month 53.4 7.6 7.9 31.1
Notes: Households may have used credit products that were not asked about in the survey (e.g., mortgages, auto loans, certain nonbank installment loans, and informal loans from family or friends). See Appendix Table F.2 for estimates by other household characteristics.
Table 8.1 Bank and Nonbank Credit by Selected Household Characteristics, 2015For all households, row percent
As shown in Figure 8.3, households that saved for unexpect-
ed expenses or emergencies were less likely to use nonbank
credit only, less likely not to have credit, and more likely to
have bank credit only. For example, among households that
saved, 2.6 percent used nonbank credit only, 17.6 percent
did not have credit, and 75.7 percent had bank credit only. In
comparison, of the households that did not save, 6.1 percent
used nonbank credit only, 41.3 percent did not have credit,
and 48.6 percent had bank credit only.40
40The differences in bank and nonbank credit associated with savings activity were statistically significant in a multivariate model that accounted for income and other household characteristics listed in Appendix Table A.1. Nonetheless, the differences in bank and nonbank credit associated with savings activity should not be interpreted as causal, because there are likely factors associated with both savings activity and credit behavior that are not observed in the survey and therefore omitted from the model.
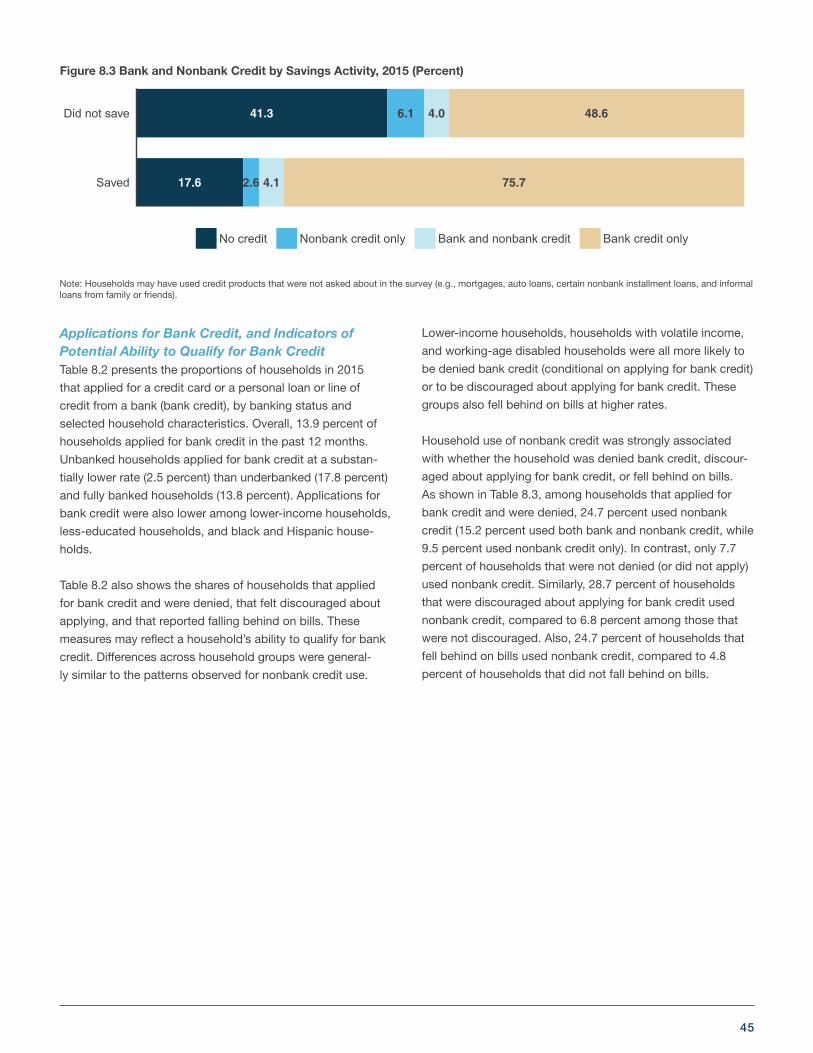
45
Applications for Bank Credit, and Indicators of Potential Ability to Qualify for Bank CreditTable 8.2 presents the proportions of households in 2015
that applied for a credit card or a personal loan or line of
credit from a bank (bank credit), by banking status and
selected household characteristics. Overall, 13.9 percent of
households applied for bank credit in the past 12 months.
Unbanked households applied for bank credit at a substan-
tially lower rate (2.5 percent) than underbanked (17.8 percent)
and fully banked households (13.8 percent). Applications for
bank credit were also lower among lower-income households,
less-educated households, and black and Hispanic house-
holds.
Table 8.2 also shows the shares of households that applied
for bank credit and were denied, that felt discouraged about
applying, and that reported falling behind on bills. These
measures may reflect a household’s ability to qualify for bank
credit. Differences across household groups were general-
ly similar to the patterns observed for nonbank credit use.
Lower-income households, households with volatile income,
and working-age disabled households were all more likely to
be denied bank credit (conditional on applying for bank credit)
or to be discouraged about applying for bank credit. These
groups also fell behind on bills at higher rates.
Household use of nonbank credit was strongly associated
with whether the household was denied bank credit, discour-
aged about applying for bank credit, or fell behind on bills.
As shown in Table 8.3, among households that applied for
bank credit and were denied, 24.7 percent used nonbank
credit (15.2 percent used both bank and nonbank credit, while
9.5 percent used nonbank credit only). In contrast, only 7.7
percent of households that were not denied (or did not apply)
used nonbank credit. Similarly, 28.7 percent of households
that were discouraged about applying for bank credit used
nonbank credit, compared to 6.8 percent among those that
were not discouraged. Also, 24.7 percent of households that
fell behind on bills used nonbank credit, compared to 4.8
percent of households that did not fall behind on bills.
41.3
17.6
6.1
2.6
4.0
4.1
48.6
75.7Saved
Did not save
No credit Nonbank credit only Bank and nonbank credit Bank credit only
Figure 8.3 Bank and Nonbank Credit by Savings Activity, 2015 (Percent)
Note: Households may have used credit products that were not asked about in the survey (e.g., mortgages, auto loans, certain nonbank installment loans, and informal loans from family or friends).
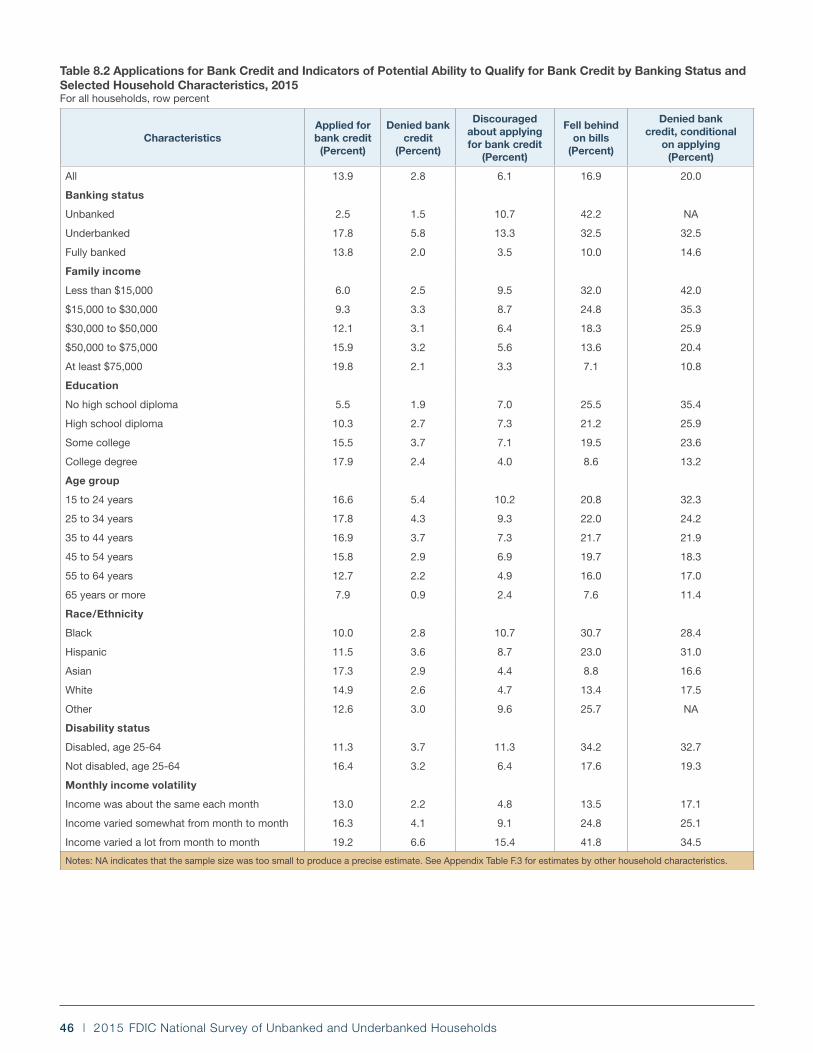
46 | 2015 FDIC National Survey of Unbanked and Underbanked Households
CharacteristicsApplied for bank credit (Percent)
Denied bank credit
(Percent)
Discouraged about applying for bank credit
(Percent)
Fell behind on bills
(Percent)
Denied bank credit, conditional
on applying (Percent)
All 13.9 2.8 6.1 16.9 20.0
Banking status
Unbanked 2.5 1.5 10.7 42.2 NA
Underbanked 17.8 5.8 13.3 32.5 32.5
Fully banked 13.8 2.0 3.5 10.0 14.6
Family income
Less than $15,000 6.0 2.5 9.5 32.0 42.0
$15,000 to $30,000 9.3 3.3 8.7 24.8 35.3
$30,000 to $50,000 12.1 3.1 6.4 18.3 25.9
$50,000 to $75,000 15.9 3.2 5.6 13.6 20.4
At least $75,000 19.8 2.1 3.3 7.1 10.8
Education
No high school diploma 5.5 1.9 7.0 25.5 35.4
High school diploma 10.3 2.7 7.3 21.2 25.9
Some college 15.5 3.7 7.1 19.5 23.6
College degree 17.9 2.4 4.0 8.6 13.2
Age group
15 to 24 years 16.6 5.4 10.2 20.8 32.3
25 to 34 years 17.8 4.3 9.3 22.0 24.2
35 to 44 years 16.9 3.7 7.3 21.7 21.9
45 to 54 years 15.8 2.9 6.9 19.7 18.3
55 to 64 years 12.7 2.2 4.9 16.0 17.0
65 years or more 7.9 0.9 2.4 7.6 11.4
Race/Ethnicity
Black 10.0 2.8 10.7 30.7 28.4
Hispanic 11.5 3.6 8.7 23.0 31.0
Asian 17.3 2.9 4.4 8.8 16.6
White 14.9 2.6 4.7 13.4 17.5
Other 12.6 3.0 9.6 25.7 NA
Disability status
Disabled, age 25-64 11.3 3.7 11.3 34.2 32.7
Not disabled, age 25-64 16.4 3.2 6.4 17.6 19.3
Monthly income volatility
Income was about the same each month 13.0 2.2 4.8 13.5 17.1
Income varied somewhat from month to month 16.3 4.1 9.1 24.8 25.1
Income varied a lot from month to month 19.2 6.6 15.4 41.8 34.5
Notes: NA indicates that the sample size was too small to produce a precise estimate. See Appendix Table F.3 for estimates by other household characteristics.
Table 8.2 Applications for Bank Credit and Indicators of Potential Ability to Qualify for Bank Credit by Banking Status and Selected Household Characteristics, 2015For all households, row percent

47
Bank credit only (Percent)
Bank and nonbank credit
(Percent)
Nonbank credit only
(Percent)
No credit (Percent)
All 63.8 4.0 4.1 28.0
Applied for bank credit and denied
Yes 60.3 15.2 9.5 15.0
No 63.9 3.7 4.0 28.4
Discouraged about applying for bank credit
Yes 41.2 11.9 16.8 30.1
No 65.3 3.5 3.3 27.8
Fell behind on bills
Yes 35.5 9.3 15.3 39.8
No 69.6 3.0 1.8 25.6
Denied, discouraged, or fell behind on bills
Yes 40.4 9.1 13.5 37.1
No 69.9 2.7 1.7 25.6
Note: Households may have used credit products that were not asked about in the survey (e.g., mortgages, auto loans, certain nonbank installment loans, and informal loans from family or friends).
Table 8.3 Bank and Nonbank Credit by Indicators of Potential Ability to Qualify for Bank Credit, 2015For all households, row percent
Unmet Demand for Bank CreditThe new survey questions on whether households were
discouraged about applying for bank credit and whether they
were denied bank credit, along with existing questions on
nonbank credit use, allow us to estimate the share of house-
holds that may have credit needs which are not fully met by
mainstream financial institutions. Moreover, the new survey
question about whether households fell behind on bills allows
us to explore if some households with unmet demand for
bank credit could potentially be served by banks.
For the purposes of this report, we classify a household as
having “unmet demand for bank credit” if the household was
denied bank credit, felt discouraged about applying for bank
credit, or used any nonbank credit product. Applying this
convention, 13.7 percent of households had unmet demand
for bank credit. These households can be categorized into
four types: those that had bank credit only, yet were also dis-
couraged about applying for or were denied bank credit (3.5
percent of all households); those that had both bank and non-
bank credit (4.0 percent of all households); those that used
nonbank credit only (4.1 percent of all households); and those
that did not have credit and were discouraged about applying
for or were denied bank credit (2.0 percent of all households).
Among households with unmet demand for bank credit,
some of those that reported staying current on bills may
potentially be served by banks. While staying current on bills
is an imperfect measure of creditworthiness, it nevertheless
provides some insight into these households’ financial
situation.41 Figure 8.4 presents the share of households with
unmet demand for bank credit that stayed current on bills,
overall and for each of the four types of households with
unmet demand for bank credit. Among all households with
unmet demand for bank credit, about half (52.5 percent)
stayed current on bills. Of the households that had only bank
credit but were denied or felt discouraged about applying
for new bank credit, 65.1 percent stayed current on bills. In
contrast, 37.1 percent of households that used only nonbank
credit stayed current on bills.
41In some cases, the credit needs of households that did not fall behind on bills may not be serviceable by banks because of previous negative credit events or high debt-to-income ratios.
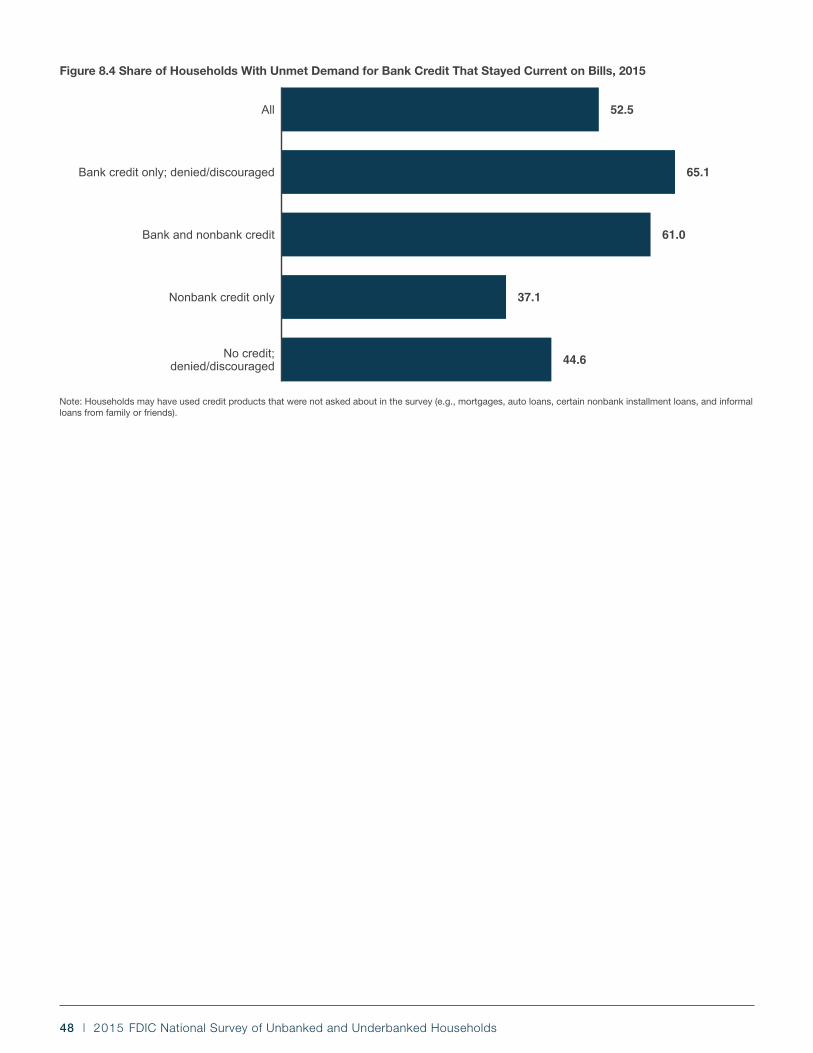
48 | 2015 FDIC National Survey of Unbanked and Underbanked Households
44.6
37.1
61.0
65.1
52.5
No credit;denied/discouraged
Nonbank credit only
Bank and nonbank credit
Bank credit only; denied/discouraged
All
Figure 8.4 Share of Households With Unmet Demand for Bank Credit That Stayed Current on Bills, 2015
Note: Households may have used credit products that were not asked about in the survey (e.g., mortgages, auto loans, certain nonbank installment loans, and informal loans from family or friends).

49
2015 FDIC National Survey of Unbanked and Underbanked Households
9. How Households Conduct Their Financial Transactions in a Typical Month
The 2015 survey included a number of new questions about
the ways households pay bills (for things like mortgage,
rent, utilities, or child care) and receive income (from work,
government benefits, or other regular sources). The goal of
these questions was to learn more about the extent to which
households use banks and other methods to meet their
financial transactions needs in a typical month over the past
12 months.
For the purposes of this report, the following methods of pay-
ing bills are classified as “bank” methods: electronic payment
from a bank account, personal check drawn on a bank, debit
card linked to a bank account, credit card, or cashier’s check
or money order purchased at a bank. “Other” methods of
paying bills include nonbank money orders, prepaid cards,
and cash.
Similarly, “bank” methods of receiving income include the
following: direct deposit into a bank account, or paper check
or money order if the household had a bank account and did
not go to a nonbank check casher in a typical month. “Other”
methods of receiving income include cash, direct deposit
onto a prepaid card, and check (for households that were
unbanked or that used a nonbank check casher to get the
funds).42
2015 National Estimates The great majority of U.S. households used banks to pay bills
in a typical month, consistent with the fact that most U.S.
households have a bank account.43 As illustrated in Figure
9.1, the most widely used method was electronic payment
from a bank account (64.3 percent). Use of bank personal
checks was nearly as common (61.2 percent), despite the
emergence of widely available and increasingly diverse means
of making electronic payments. Use of other bill payment
methods, such as cash, nonbank money orders, and prepaid
cards, was substantially lower. Overall, more than 90 percent
of households paid bills using a bank-related method in a
typical month, and three out of four used only banks (i.e., they
used banks and did not use cash, nonbank money orders,
prepaid cards, or other).
The most prevalent method of receiving income was, by far,
direct deposit into a bank account. More than four out of
five households (81.3 percent) used this method in a typi-
cal month, as shown in Figure 9.2. The next most prevalent
method of receiving income was by paper check or money
order (29.1 percent). Of the households that used this meth-
od, approximately 7 percent (or 2.1 percent of all households)
used a nonbank check casher to get the funds in a typical
month.44 Less commonly used ways of receiving income were
cash (8.2 percent) and direct deposit onto a prepaid card (3.9
percent).45 Overall, most households (88.5 percent) received
income using a bank-related method in a typical month, and
79.2 percent used only banks.
42The distinction between bank and other methods is not always straightforward. The approach used in this report is to classify a method as bank-related if a bank is likely to be directly involved in the transaction, at least from the household’s perspective. Use of prepaid cards to pay bills or receive income is treated as other because, in most cases, consumers do not obtain the card directly from a bank. Similarly, use of cash to pay bills or receive income is considered to be other, although, in some cases, the cash may have been obtained directly from a bank account (particularly among banked households). Unbanked households that received income via check or money order and did not use a nonbank check casher in a typical month are also classified as other, although it is possible that in at least some of these cases, the households may have gone to a bank to receive the funds.
43The analysis presented in this section excludes 3,012 observations (representing roughly 11.4 million households) with any missing information on use of prepaid cards or nonbank money orders or check cashers in the past 12 months, on methods used to pay bills or receive income, or where the household volunteered that it did not pay bills or receive income in a typical month.
44This does not necessarily mean that only 2.1 percent of households used a nonbank check casher in a typical month. Households may use check cashers to handle paper checks or money orders that they do not think of as “income.” For reference, results from the 2013 survey indicate that 3.4 percent of all households cashed a check in a place other than a bank in the past 30 days.
45Because of an issue with the administration of the survey instrument, information on use of prepaid cards to receive income is missing for many unbanked households. The estimates of income received through direct deposit onto a prepaid card or using other methods incorporate imputed values for these households. See Appendix 1 for details.
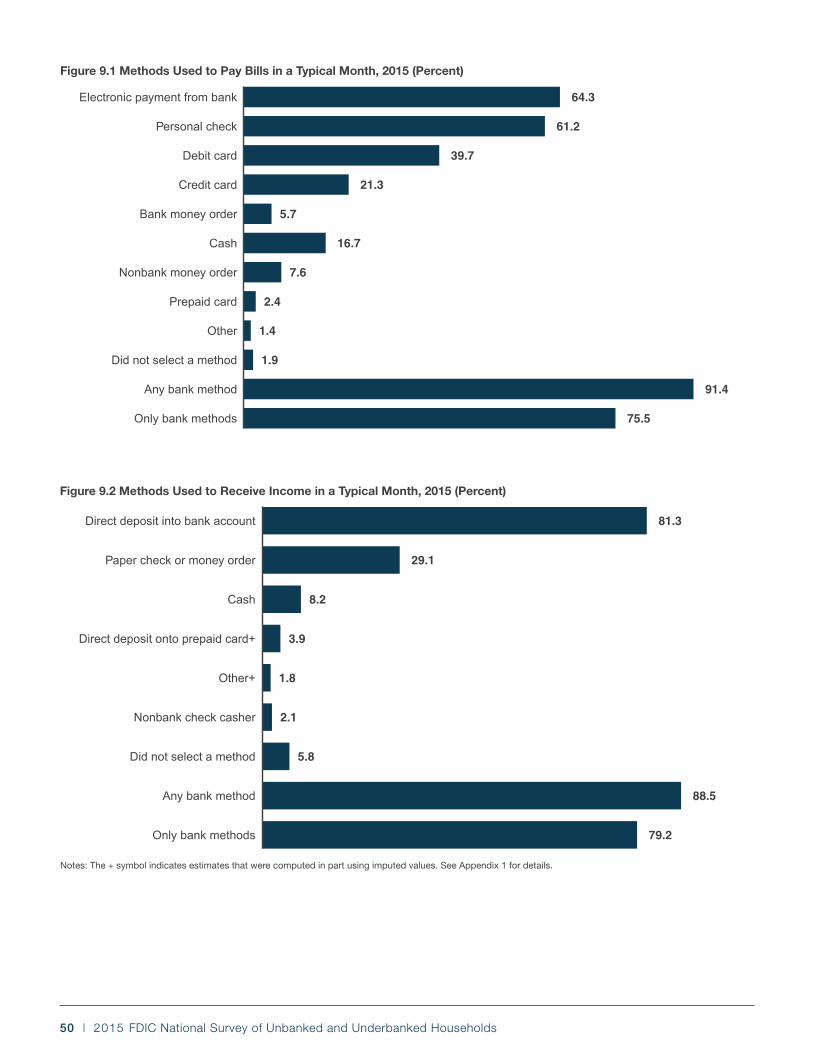
50 | 2015 FDIC National Survey of Unbanked and Underbanked Households
75.5
91.4
1.9
1.4
2.4
7.6
16.7
5.7
21.3
39.7
61.2
64.3
Only bank methods
Any bank method
Did not select a method
Other
Prepaid card
Nonbank money order
Cash
Bank money order
Credit card
Debit card
Personal check
Electronic payment from bank
Figure 9.1 Methods Used to Pay Bills in a Typical Month, 2015 (Percent)
79.2
88.5
5.8
2.1
1.8
3.9
8.2
29.1
81.3
Only bank methods
Any bank method
Did not select a method
Nonbank check casher
Other+
Direct deposit onto prepaid card+
Cash
Paper check or money order
Direct deposit into bank account
Figure 9.2 Methods Used to Receive Income in a Typical Month, 2015 (Percent)
Notes: The + symbol indicates estimates that were computed in part using imputed values. See Appendix 1 for details.

51
Bill Payment and Income Receipt Methods by Household Characteristics Most U.S. households used banks to handle their financial
transactions in a typical month, although certain segments of
the population were less likely to do so.46 For example, panel
A of Table 9.1 illustrates differences by income in the meth-
ods households used to pay bills. Lower-income households
were substantially less likely to use banks and more likely to
use other methods such as cash and nonbank money orders.
Most notably, the use of electronic payments from a bank ac-
count varied sharply by income, ranging from 33.1 percent of
households with less than $15,000 in income to 84.2 percent
of households with income of $75,000 or more.
Lower-income households were also substantially less
likely to receive income using a bank. As shown in panel B
of Table 9.1, 61.8 percent of households with income less
than $15,000 received income through direct deposit into a
bank account, compared to 92.0 percent of households with
income of $75,000 or more. The proportion of households
that received income through paper check or money order
in a typical month was fairly similar across income groups.
However, lower-income households were more likely to use a
nonbank check casher to get these funds.
Examining differences across other household characteristics
revealed that use of banks to pay bills and receive income
in a typical month was less prevalent among less-educated
households, younger households, and black and Hispanic
households. Even within these groups, the proportion of
households that used bank-related methods was still high
relative to the proportions that used other methods.47
46Differences across households in the methods used to pay bills and receive income may be attributable to a number of factors, some of which may be outside of the household’s control such as the ways employers disburse earnings (e.g., availability of direct deposit or use of payroll cards) or in the types of payment instruments required by payees.
47See Appendix Tables G.1 – G.15 for estimated use of all bill payment and income receipt methods in a typical month, and for the most common (i.e., “primary”) method of bill payment in a typical month, by selected household characteristics. Differences across households in the primary method of bill payment generally followed the same patterns as the differences in all bill payment methods described in this report.
AllLess than $15,000
$15,000 to $30,000
$30,000 to $50,000
$50,000 to $75,000
At least $75,000
A. Paying bills (Percent)
Electronic payment from bank 64.3 33.1 45.7 60.5 73.4 84.2
Personal check 61.2 43.7 56.9 63.0 66.4 66.7
Debit card 39.7 29.9 37.3 44.0 44.2 39.9
Credit card 21.3 11.3 14.1 18.8 23.4 29.7
Bank money order 5.7 9.8 8.3 6.8 4.3 2.5
Cash 16.7 33.8 25.4 17.8 11.8 7.0
Nonbank money order 7.6 17.7 13.2 8.4 4.8 1.7
Prepaid card 2.4 6.3 3.7 2.2 1.9 0.6
Other 1.4 4.0 2.0 1.2 0.8 0.6
Did not select a method 1.9 4.7 2.6 1.8 1.2 0.8
Any bank method 91.4 71.8 86.0 92.7 96.8 98.6
Only bank methods 75.5 48.4 63.0 74.0 82.8 90.4
B. Receiving income (Percent)
Direct deposit into bank account 81.3 61.8 71.7 79.7 87.3 92.0
Paper check or money order 29.1 26.1 29.1 30.8 29.9 28.8
Cash 8.2 11.6 10.4 8.5 7.8 5.7
Direct deposit onto prepaid card+ 3.9 8.3 5.0 3.4 3.2 2.2
Other+ 1.8 4.4 2.2 1.6 1.0 1.1
Nonbank check casher 2.1 5.4 3.9 2.1 0.9 0.4
Did not select a method 5.8 13.3 7.7 5.1 4.2 2.9
Any bank method 88.5 69.0 81.7 89.6 93.9 96.5
Only bank methods 79.2 59.6 72.0 79.8 83.8 88.3
Notes: The + symbol indicates rows with estimates that were computed in part using imputed values. See Appendix 1 for details.
Table 9.1 Methods Used to Pay Bills and Receive Income in a Typical Month by Income, 2015For all households that paid bills and received income in a typical month, column percent
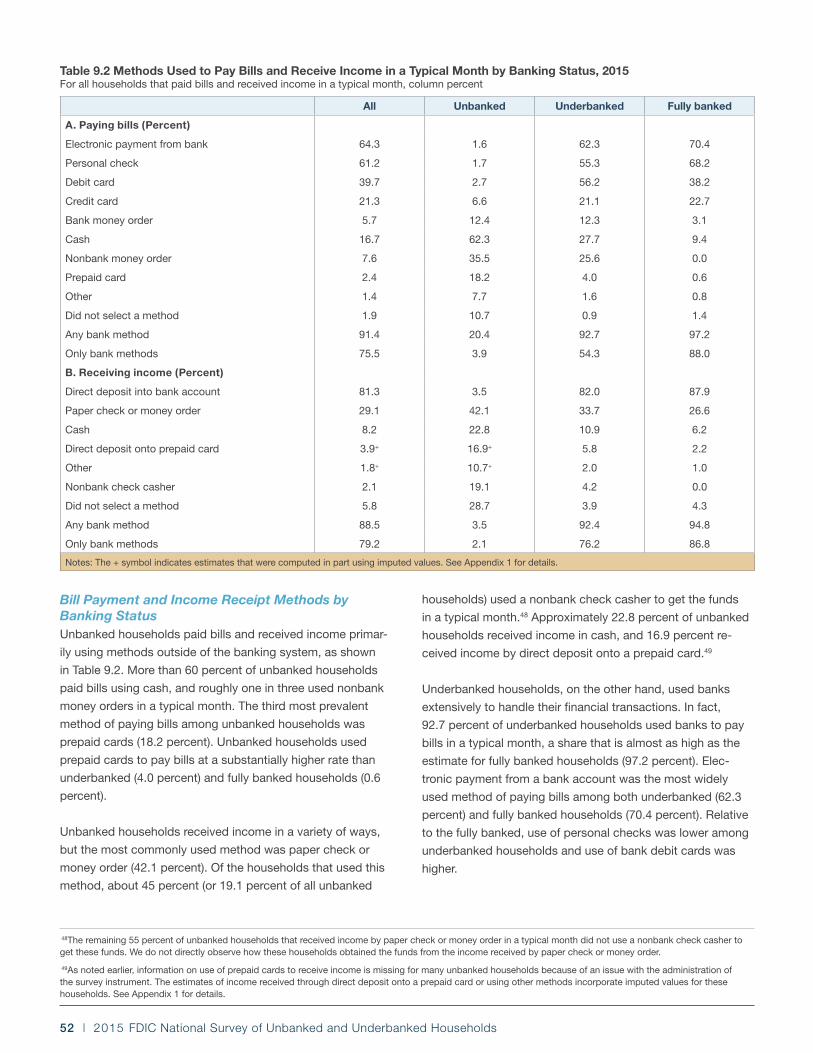
52 | 2015 FDIC National Survey of Unbanked and Underbanked Households
Bill Payment and Income Receipt Methods by Banking StatusUnbanked households paid bills and received income primar-
ily using methods outside of the banking system, as shown
in Table 9.2. More than 60 percent of unbanked households
paid bills using cash, and roughly one in three used nonbank
money orders in a typical month. The third most prevalent
method of paying bills among unbanked households was
prepaid cards (18.2 percent). Unbanked households used
prepaid cards to pay bills at a substantially higher rate than
underbanked (4.0 percent) and fully banked households (0.6
percent).
Unbanked households received income in a variety of ways,
but the most commonly used method was paper check or
money order (42.1 percent). Of the households that used this
method, about 45 percent (or 19.1 percent of all unbanked
households) used a nonbank check casher to get the funds
in a typical month.48 Approximately 22.8 percent of unbanked
households received income in cash, and 16.9 percent re-
ceived income by direct deposit onto a prepaid card.49
Underbanked households, on the other hand, used banks
extensively to handle their financial transactions. In fact,
92.7 percent of underbanked households used banks to pay
bills in a typical month, a share that is almost as high as the
estimate for fully banked households (97.2 percent). Elec-
tronic payment from a bank account was the most widely
used method of paying bills among both underbanked (62.3
percent) and fully banked households (70.4 percent). Relative
to the fully banked, use of personal checks was lower among
underbanked households and use of bank debit cards was
higher.
All Unbanked Underbanked Fully banked
A. Paying bills (Percent)
Electronic payment from bank 64.3 1.6 62.3 70.4
Personal check 61.2 1.7 55.3 68.2
Debit card 39.7 2.7 56.2 38.2
Credit card 21.3 6.6 21.1 22.7
Bank money order 5.7 12.4 12.3 3.1
Cash 16.7 62.3 27.7 9.4
Nonbank money order 7.6 35.5 25.6 0.0
Prepaid card 2.4 18.2 4.0 0.6
Other 1.4 7.7 1.6 0.8
Did not select a method 1.9 10.7 0.9 1.4
Any bank method 91.4 20.4 92.7 97.2
Only bank methods 75.5 3.9 54.3 88.0
B. Receiving income (Percent)
Direct deposit into bank account 81.3 3.5 82.0 87.9
Paper check or money order 29.1 42.1 33.7 26.6
Cash 8.2 22.8 10.9 6.2
Direct deposit onto prepaid card 3.9+ 16.9+ 5.8 2.2
Other 1.8+ 10.7+ 2.0 1.0
Nonbank check casher 2.1 19.1 4.2 0.0
Did not select a method 5.8 28.7 3.9 4.3
Any bank method 88.5 3.5 92.4 94.8
Only bank methods 79.2 2.1 76.2 86.8
Notes: The + symbol indicates estimates that were computed in part using imputed values. See Appendix 1 for details.
Table 9.2 Methods Used to Pay Bills and Receive Income in a Typical Month by Banking Status, 2015For all households that paid bills and received income in a typical month, column percent
48The remaining 55 percent of unbanked households that received income by paper check or money order in a typical month did not use a nonbank check casher to get these funds. We do not directly observe how these households obtained the funds from the income received by paper check or money order.
49As noted earlier, information on use of prepaid cards to receive income is missing for many unbanked households because of an issue with the administration of the survey instrument. The estimates of income received through direct deposit onto a prepaid card or using other methods incorporate imputed values for these households. See Appendix 1 for details.
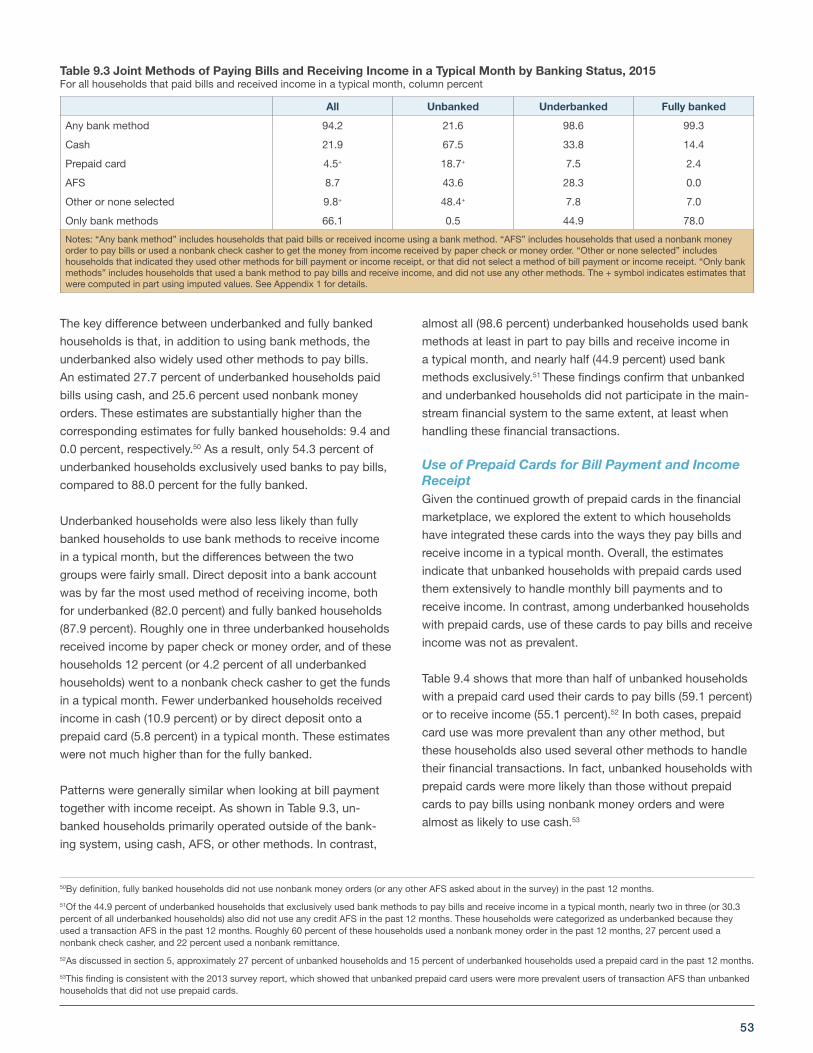
53
All Unbanked Underbanked Fully banked
Any bank method 94.2 21.6 98.6 99.3
Cash 21.9 67.5 33.8 14.4
Prepaid card 4.5+ 18.7+ 7.5 2.4
AFS 8.7 43.6 28.3 0.0
Other or none selected 9.8+ 48.4+ 7.8 7.0
Only bank methods 66.1 0.5 44.9 78.0
Notes: “Any bank method” includes households that paid bills or received income using a bank method. “AFS” includes households that used a nonbank money order to pay bills or used a nonbank check casher to get the money from income received by paper check or money order. “Other or none selected” includes households that indicated they used other methods for bill payment or income receipt, or that did not select a method of bill payment or income receipt. “Only bank methods” includes households that used a bank method to pay bills and receive income, and did not use any other methods. The + symbol indicates estimates that were computed in part using imputed values. See Appendix 1 for details.
Table 9.3 Joint Methods of Paying Bills and Receiving Income in a Typical Month by Banking Status, 2015For all households that paid bills and received income in a typical month, column percent
50By definition, fully banked households did not use nonbank money orders (or any other AFS asked about in the survey) in the past 12 months.
51Of the 44.9 percent of underbanked households that exclusively used bank methods to pay bills and receive income in a typical month, nearly two in three (or 30.3 percent of all underbanked households) also did not use any credit AFS in the past 12 months. These households were categorized as underbanked because they used a transaction AFS in the past 12 months. Roughly 60 percent of these households used a nonbank money order in the past 12 months, 27 percent used a nonbank check casher, and 22 percent used a nonbank remittance.
52As discussed in section 5, approximately 27 percent of unbanked households and 15 percent of underbanked households used a prepaid card in the past 12 months.
53This finding is consistent with the 2013 survey report, which showed that unbanked prepaid card users were more prevalent users of transaction AFS than unbanked households that did not use prepaid cards.
The key difference between underbanked and fully banked
households is that, in addition to using bank methods, the
underbanked also widely used other methods to pay bills.
An estimated 27.7 percent of underbanked households paid
bills using cash, and 25.6 percent used nonbank money
orders. These estimates are substantially higher than the
corresponding estimates for fully banked households: 9.4 and
0.0 percent, respectively.50 As a result, only 54.3 percent of
underbanked households exclusively used banks to pay bills,
compared to 88.0 percent for the fully banked.
Underbanked households were also less likely than fully
banked households to use bank methods to receive income
in a typical month, but the differences between the two
groups were fairly small. Direct deposit into a bank account
was by far the most used method of receiving income, both
for underbanked (82.0 percent) and fully banked households
(87.9 percent). Roughly one in three underbanked households
received income by paper check or money order, and of these
households 12 percent (or 4.2 percent of all underbanked
households) went to a nonbank check casher to get the funds
in a typical month. Fewer underbanked households received
income in cash (10.9 percent) or by direct deposit onto a
prepaid card (5.8 percent) in a typical month. These estimates
were not much higher than for the fully banked.
Patterns were generally similar when looking at bill payment
together with income receipt. As shown in Table 9.3, un-
banked households primarily operated outside of the bank-
ing system, using cash, AFS, or other methods. In contrast,
almost all (98.6 percent) underbanked households used bank
methods at least in part to pay bills and receive income in
a typical month, and nearly half (44.9 percent) used bank
methods exclusively.51 These findings confirm that unbanked
and underbanked households did not participate in the main-
stream financial system to the same extent, at least when
handling these financial transactions.
Use of Prepaid Cards for Bill Payment and Income ReceiptGiven the continued growth of prepaid cards in the financial
marketplace, we explored the extent to which households
have integrated these cards into the ways they pay bills and
receive income in a typical month. Overall, the estimates
indicate that unbanked households with prepaid cards used
them extensively to handle monthly bill payments and to
receive income. In contrast, among underbanked households
with prepaid cards, use of these cards to pay bills and receive
income was not as prevalent.
Table 9.4 shows that more than half of unbanked households
with a prepaid card used their cards to pay bills (59.1 percent)
or to receive income (55.1 percent).52 In both cases, prepaid
card use was more prevalent than any other method, but
these households also used several other methods to handle
their financial transactions. In fact, unbanked households with
prepaid cards were more likely than those without prepaid
cards to pay bills using nonbank money orders and were
almost as likely to use cash.53
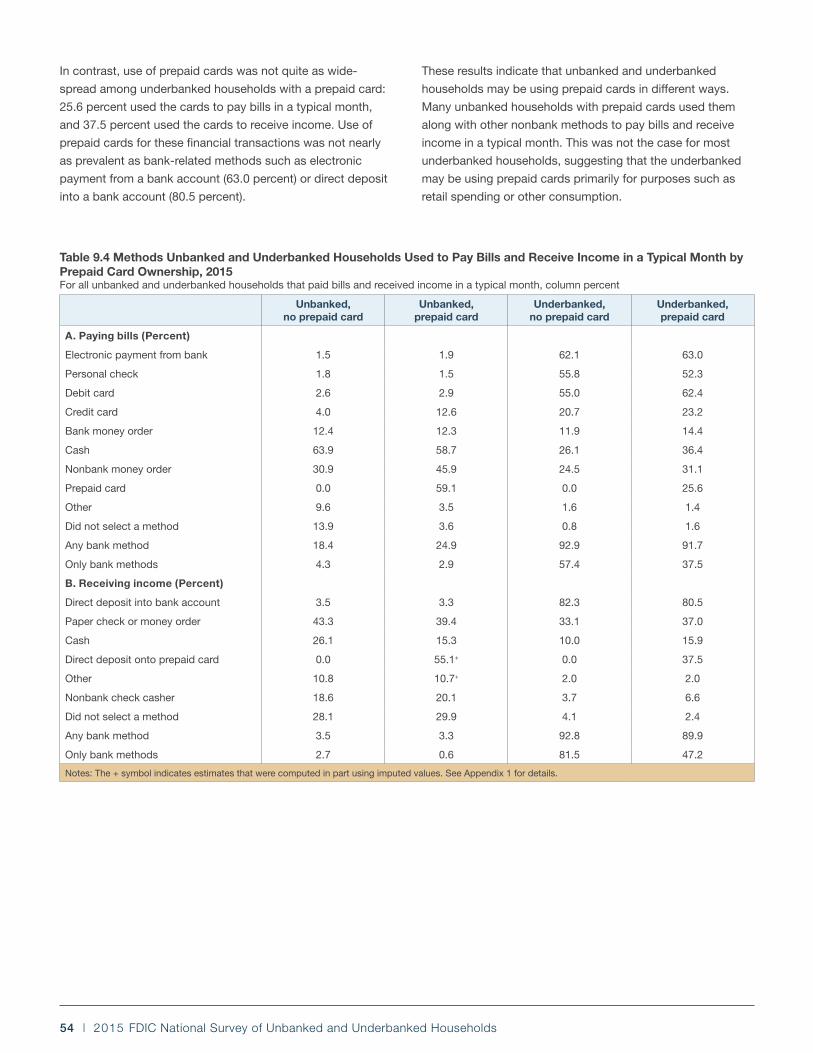
54 | 2015 FDIC National Survey of Unbanked and Underbanked Households
In contrast, use of prepaid cards was not quite as wide-
spread among underbanked households with a prepaid card:
25.6 percent used the cards to pay bills in a typical month,
and 37.5 percent used the cards to receive income. Use of
prepaid cards for these financial transactions was not nearly
as prevalent as bank-related methods such as electronic
payment from a bank account (63.0 percent) or direct deposit
into a bank account (80.5 percent).
These results indicate that unbanked and underbanked
households may be using prepaid cards in different ways.
Many unbanked households with prepaid cards used them
along with other nonbank methods to pay bills and receive
income in a typical month. This was not the case for most
underbanked households, suggesting that the underbanked
may be using prepaid cards primarily for purposes such as
retail spending or other consumption.
Unbanked, no prepaid card
Unbanked, prepaid card
Underbanked, no prepaid card
Underbanked, prepaid card
A. Paying bills (Percent)
Electronic payment from bank 1.5 1.9 62.1 63.0
Personal check 1.8 1.5 55.8 52.3
Debit card 2.6 2.9 55.0 62.4
Credit card 4.0 12.6 20.7 23.2
Bank money order 12.4 12.3 11.9 14.4
Cash 63.9 58.7 26.1 36.4
Nonbank money order 30.9 45.9 24.5 31.1
Prepaid card 0.0 59.1 0.0 25.6
Other 9.6 3.5 1.6 1.4
Did not select a method 13.9 3.6 0.8 1.6
Any bank method 18.4 24.9 92.9 91.7
Only bank methods 4.3 2.9 57.4 37.5
B. Receiving income (Percent)
Direct deposit into bank account 3.5 3.3 82.3 80.5
Paper check or money order 43.3 39.4 33.1 37.0
Cash 26.1 15.3 10.0 15.9
Direct deposit onto prepaid card 0.0 55.1+ 0.0 37.5
Other 10.8 10.7+ 2.0 2.0
Nonbank check casher 18.6 20.1 3.7 6.6
Did not select a method 28.1 29.9 4.1 2.4
Any bank method 3.5 3.3 92.8 89.9
Only bank methods 2.7 0.6 81.5 47.2
Notes: The + symbol indicates estimates that were computed in part using imputed values. See Appendix 1 for details.
Table 9.4 Methods Unbanked and Underbanked Households Used to Pay Bills and Receive Income in a Typical Month by Prepaid Card Ownership, 2015For all unbanked and underbanked households that paid bills and received income in a typical month, column percent
55
2015 FDIC National Survey of Unbanked and Underbanked Households
10. Household Learning About Finances: The Role of Banks
Banks are one source consumers can use to learn about
managing their finances. The 2015 survey included new ques-
tions about whether households sought financial information
from banks, and about attending financial education or coun-
seling sessions.54
As shown in Table 10.1, 4.2 percent of households “asked
a bank teller or bank customer service agent about financial
products and services or managing your money” in the past
12 months. An estimated 4.4 percent of households attend-
ed “any financial education classes or financial counseling
sessions, either in-person, by phone, or online” in the past 12
months. Of those, 20.7 percent (or 0.9 percent of all house-
holds) learned “about any of those financial education classes
or counseling sessions through a bank.”
Unbanked households were less likely than banked house-
holds to learn about finances from a bank. An estimated 1.3
percent of unbanked households asked a bank teller or cus-
tomer service agent about finances, compared to 5.3 percent
of underbanked households and 4.1 percent of fully banked
households. Unbanked households were also not as likely as
banked households to attend a financial education or coun-
seling session.
The estimates in Table 10.1 also suggest that certain popula-
tions—for example, lower-income households, less-educated
households, and black and Hispanic households—were less
likely to ask a bank teller or customer service agent about
financial products or services or managing money.55 Patterns
were generally similar when looking at the percentage that
attended any financial education or counseling session in the
past 12 months.
Among households that attended a financial education or
counseling session, black and Hispanic households were
more likely than white households to have learned about it
from a bank. There are also differences by age: households
aged 65 or older that attended a financial education or coun-
seling session were less likely to have learned about it from a
bank, relative to younger households.
54The analysis presented in this section excludes 2,534 observations (representing roughly 9.6 million households) with missing responses to any of the three questions related to financial education and learning.
55These differences are attributable in part to differences in unbanked rates across populations. Among households with a bank account, differences by household characteristics in the likelihood of going to a bank to learn about financial products or services or managing money were generally smaller in magnitude, and in some cases became statistically insignificant.
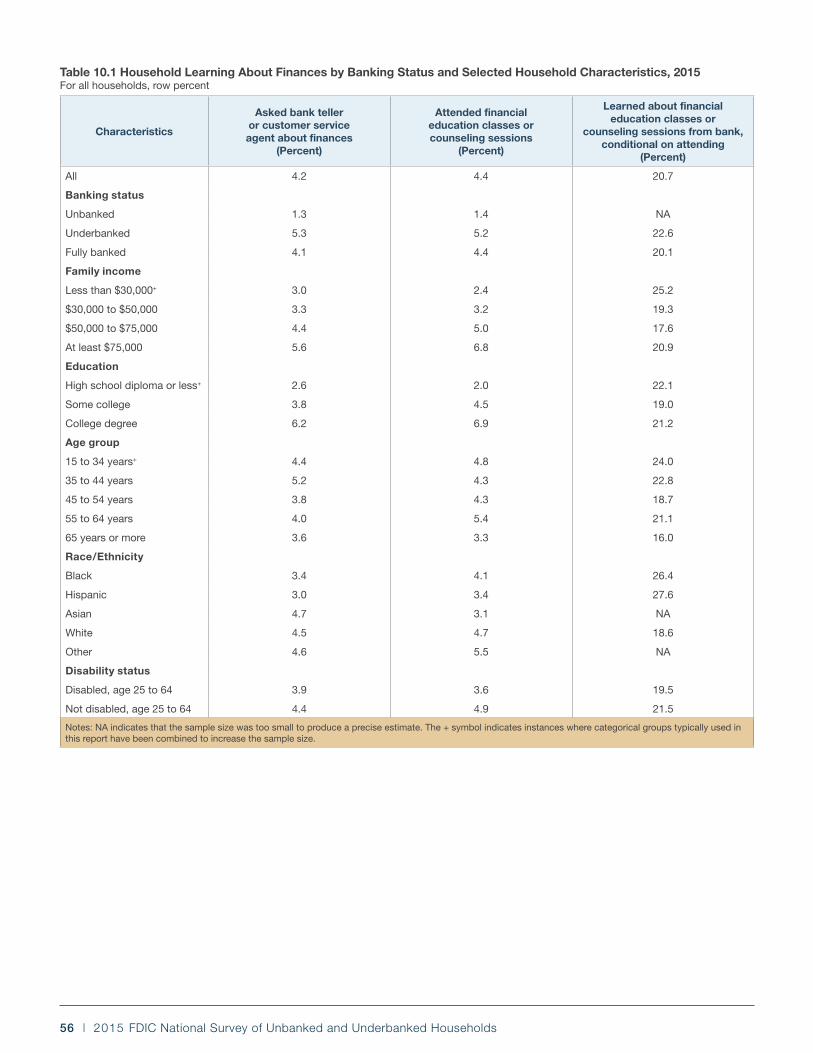
56 | 2015 FDIC National Survey of Unbanked and Underbanked Households
Characteristics
Asked bank teller or customer service agent about finances
(Percent)
Attended financial education classes or counseling sessions
(Percent)
Learned about financial education classes or
counseling sessions from bank, conditional on attending
(Percent)
All 4.2 4.4 20.7
Banking status
Unbanked 1.3 1.4 NA
Underbanked 5.3 5.2 22.6
Fully banked 4.1 4.4 20.1
Family income
Less than $30,000+ 3.0 2.4 25.2
$30,000 to $50,000 3.3 3.2 19.3
$50,000 to $75,000 4.4 5.0 17.6
At least $75,000 5.6 6.8 20.9
Education
High school diploma or less+ 2.6 2.0 22.1
Some college 3.8 4.5 19.0
College degree 6.2 6.9 21.2
Age group
15 to 34 years+ 4.4 4.8 24.0
35 to 44 years 5.2 4.3 22.8
45 to 54 years 3.8 4.3 18.7
55 to 64 years 4.0 5.4 21.1
65 years or more 3.6 3.3 16.0
Race/Ethnicity
Black 3.4 4.1 26.4
Hispanic 3.0 3.4 27.6
Asian 4.7 3.1 NA
White 4.5 4.7 18.6
Other 4.6 5.5 NA
Disability status
Disabled, age 25 to 64 3.9 3.6 19.5
Not disabled, age 25 to 64 4.4 4.9 21.5
Notes: NA indicates that the sample size was too small to produce a precise estimate. The + symbol indicates instances where categorical groups typically used in this report have been combined to increase the sample size.
Table 10.1 Household Learning About Finances by Banking Status and Selected Household Characteristics, 2015For all households, row percent
57
2015 FDIC National Survey of Unbanked and Underbanked Households
11. Implications and Conclusions
The survey results presented in this report show a 0.7
percentage point reduction in the unbanked rate between
June 2013 and June 2015, with roughly half of the decline
attributable to improvements in the economic circumstances
of U.S. households. The unbanked rate fell for many groups
that had high unbanked rates in 2013. However, unbanked
rates for these groups remain substantially higher than the
overall unbanked rate in 2015. Below, the report concludes
with a discussion of opportunities to increase the use of
mainstream banking services by unbanked and underbanked
households.
1. Households with volatile income have higher un-
banked and underbanked rates. Bank products and
services that enable households to better manage
their account relationships and meet their financial
needs when income is volatile may help these con-
sumers open and sustain bank accounts and conduct
a greater share of their financial transactions within
the banking system.
More than one in five U.S. households have income that
varies “somewhat” or “a lot” from month to month, and these
households are more likely to be unbanked or underbanked.
Income volatility has notable effects even among households
with moderate levels of income.
For example, among households with annual income be-
tween $30,000 and $50,000, those with volatile income have
an unbanked rate (7.4 percent) almost twice that of house-
holds with steady income (4.0 percent). This difference of 3.5
percentage points is similar in magnitude to the difference
in unbanked rates between households with annual income
of $30,000 to $50,000 and households with annual income
of $50,000 to $75,000. Households with volatile income also
use alternative financial services at higher rates, even among
banked and moderate- and higher-income households.
Banks may have opportunities to build and strengthen
relationships with unbanked and underbanked households
that have volatile monthly income by offering products and
services that enable them to better manage their account
relationships and meet their financial needs within the banking
system. Later in this section, we discuss implications relat-
ed to savings and bank credit that may be helpful to these
households. The following are three additional examples of
opportunities for banks to serve these households:
• Consumers with volatile income might find it difficult to
consistently meet minimum balance requirements even
in cases where, over time, their balances and deposits
are substantial. Accounts with low or no minimum bal-
ance requirements and low fees that are consistent with
the FDIC Model Safe Accounts Template may help these
households enter and stay in the banking system.56 In
addition, in the 2013 survey, we found that households
that recently became unbanked were more likely to have
experienced either a significant income loss or job loss
that they said contributed to the household becoming
unbanked. Targeted solutions that assist customers who
experience unexpected events such as job loss may also
help these households retain their bank accounts during
these periods of transition.
• Consumers with volatile income may have a need to mon-
itor account balances closely. Almost all households with
volatile income have access to a mobile phone, and more
than eight in ten have access to a smartphone. Mobile
banking technology may help these households manage
their financial inflows and outflows. Encouraging the use
of mobile banking, including features such as balance
monitoring and timely alerts and notification, may help
these households better cope with their fluctuating income
streams.57
• In addition, during periods when income is low, house-
holds with volatile income may feel more pressed to use
incoming funds as soon as they are received. Banking ser-
vices that offer expedited access to funds for a reasonable
56See https://www.fdic.gov/consumers/template/template.pdf for the FDIC Model Safe Accounts Template.
57In focus groups conducted by the FDIC in 2015, some consumers who used mobile financial services reported that mobile alerts and monitoring tools helped them reduce fees, better track their finances, and improved on-the-spot decision making. See “Opportunities for Mobile Financial Services to Engage Underserved Consumers Qualitative Research Findings,” May 25, 2016 (available at https://www.fdic.gov/consumers/community/mobile/MFS_Qualitative_Research_Report.pdf), and “Bank Efforts to Serve Unbanked and Underbanked Consumers Qualitative Research,” May 25, 2016 (available at https://www.fdic.gov/consumers/community/research/QualitativeResearch_May2016.pdf).
58 | 2015 FDIC National Survey of Unbanked and Underbanked Households
fee, while following sound risk-management practices,
may be particularly attractive to these households. Sim-
ilarly, current efforts to offer quicker availability of funds
through improvements in the payment system may also
benefit households with volatile income.
2. Use of smartphones to engage in banking activi-
ties continues to grow at a rapid pace. Consistent
with implications from the 2013 survey, this growth
presents promising opportunities to use the mobile
platform to increase economic inclusion. At the same
time, physical access to branches remains important.
Access to, and use of, smartphones to engage in banking
activities continues to grow at a rapid pace. Between 2013
and 2015, smartphone access increased by 30 percent for
unbanked households and by 17 percent for underbanked
households. As of 2015, roughly four in ten unbanked
households and three in four underbanked households have
access to a smartphone. From 2013 to 2015, overall use of
mobile banking grew by 37 percent, and mobile banking as
the primary method of account access grew by 66 percent.
By 2015, slightly less than half (49.2 percent) of all banked
households use a physical channel (bank branch or ATM/
kiosk) as their primary method of account access. Under-
banked households continue to be more likely than fully
banked households to use the mobile channel as their primary
means of account access (12.6 percent versus 8.7 percent).
These findings suggest, consistent with other FDIC research,
that banks could use the mobile banking platform to increase
economic inclusion.58
At the same time, the results suggest that modification of
branch services may have economic inclusion implications.
Although the proportion of households that primarily use
bank tellers to access their accounts has fallen, lower-income
households, less-educated households, older households,
and households located in rural areas continue to rely on
bank tellers as their primary method for accessing their bank
accounts. In addition, use of bank tellers remains prevalent,
even among households that primarily use other methods for
accessing their accounts. Finally, research from the Federal
Reserve Board of Governors indicates that 44 percent of
households responding to a 2013 survey chose their bank
based on the location of its offices, by far the leading factor in
their selection.59
3. One in five unbanked households save for unex-
pected expenses, although for the most part not in
insured depositories. Bringing these savings into
the banking system could allow these households to
build banking relationships that help them safeguard
funds, enhance access to credit, and increase finan-
cial security.
While unbanked households are less likely than underbanked
and fully banked households to set aside money for un-
expected expenses or emergencies, one in five unbanked
households save for this purpose. However, roughly two-
thirds of these households keep the savings in the home, or
with family or friends. When not kept in a bank account, these
savings are not insured and could be lost or stolen. An addi-
tional one in eight of these households keep these savings on
a prepaid card, most of which are not obtained from a bank.
Access to mainstream financial services at an insured depos-
itory institution provides consumers with a safe place to save,
conduct basic financial transactions, and build a credit history
and access credit on favorable terms. Banks that provide
households with safe, affordable savings options can address
a present need and create opportunities for these additional
benefits. Low-cost savings accounts with low minimum bal-
ance requirements are one option that unbanked households
could use as a gateway to enter the banking system and
build relationships with banks.60 With an established banking
relationship, these households could eventually access low-
er-cost bank credit and increase their financial security. For
example, households with thin or no credit histories that save
in banks may use those deposits as collateral to access credit
or to obtain credit on more favorable terms.
4. Banks may have the opportunity to help meet the
credit needs of some households that have an unmet
demand for bank credit. The vast majority of these
households are banked, yet few applied for bank
credit in the past 12 months. Many are also young.
Banks could help meet the credit needs of these
households by promoting the importance of building
a credit history, incorporating nontraditional data
into underwriting, and increasing households’ aware-
ness of personal credit products.
58See “Opportunities for Mobile Financial Services to Engage Underserved Consumers Qualitative Research Findings,” May 25, 2016.
59Estimates are from the 2013 Survey of Consumer Finances, available at: www.federalreserve.gov/econresdata/scf/scfindex.htm.
60In interviews conducted by the FDIC in 2015, some banks discussed using low-fee savings accounts as gateway products into the banking system for unbanked consumers. See “Bank Efforts to Serve Unbanked and Underbanked Consumers Qualitative Research,” May 25, 2016.
59
Almost 14 percent of households have unmet demand for
bank credit, meaning that in the past 12 months they used a
nonbank credit product or were denied or felt discouraged
about applying for bank credit (specifically credit cards and
personal loans or lines of credit).
The vast majority (88 percent) of these households are
banked. They conduct their monthly financial transactions
(i.e., paying bills and receiving income) using their bank
account. Despite an active banking relationship, fewer than
one in three banked households with unmet demand for bank
credit applied for a credit card or personal loan or line of cred-
it from a bank in the past 12 months.
Some of these households may present opportunities for
banks to extend credit in the form of credit cards or small-dol-
lar personal loans. For example, about one-half of households
with unmet demand for bank credit indicate that they were
current on their bills over the past 12 months. While keeping
up with bills is an incomplete measure of creditworthiness, it
nevertheless provides some insight into the financial situation
of these households.61
Many households with unmet demand for bank credit are
young, suggesting they may have little to no credit history.
Efforts to promote credit building or to incorporate nontradi-
tional credit data into bank underwriting could expand access
to bank credit for such households, while also building or
strengthening these consumers’ relationships with banks.
For banked households, banks could potentially use
households’ account transaction and other banking
relationship information to help underwrite and offer credit. In
addition, banks could undertake communications strategies
to increase households’ awareness of short-term personal
credit products.62
5. The great majority of underbanked households use
banks to pay bills, although many also use cash and
nonbank money orders. Efforts to encourage and
make it easier for a range of payees to accept elec-
tronic payments, and outreach to raise awareness of
bill pay and other electronic payments among low-
er-income households, may facilitate the movement
of these transactions into the banking system.
Roughly 20 percent of households are classified as under-
banked in this report, meaning that they have a bank account
but used at least one alternative financial service in the past
12 months. However, substantial differences exist among
underbanked households in the ways they conduct their
financial transactions. Understanding these differences has
implications for policymakers, financial institutions, and other
stakeholders interested in strengthening these households’
engagement with the mainstream financial system.
The vast majority of underbanked households use banks to
pay monthly bills. About one in six, however, use cash or
nonbank money orders as their primary method for paying
bills. Another roughly one in four use bank methods as their
primary method for paying bills, including bank debit card,
electronic payment from a bank account, and personal check
drawn on a bank account, but they also use cash and non-
bank money orders to pay some bills in a typical month.
For the one in four underbanked households that primarily
use bank methods to pay bills but also use cash or nonbank
money orders to pay some bills in a typical month, the use
of cash or money orders may be the result of payee require-
ments. Efforts to encourage and make it easier for a range of
payees (for example, landlords) to accept electronic payments
may help these households reduce their use of cash and
nonbank money orders.
Some of the underbanked households that use cash and
nonbank money orders as their primary method of paying bills
may not be aware of the range of bank products that they can
use to pay bills. In focus groups conducted by the FDIC in
2015, some consumers and consumer counselors noted that
low-income and underbanked consumers may be unfamiliar
with the range of bank products and services that they can
use to meet their financial transaction needs.63 Banks may
have an opportunity to encourage consumers to conduct
these transactions within the banking system, for example,
by raising awareness of alternatives such as bank bill pay or
person-to-person payments through bank accounts, including
emerging options for faster payments.
61In some cases, banks may not be able to meet the credit needs of households that did not fall behind on bills, because of credit risk associated with previous negative credit events or high debt-to-income ratios.
62In interviews and focus groups conducted by the FDIC in 2015, many consumers said that they were unaware of bank products and services that provide alternatives to nonbank providers. Similarly, many banks said it was essential to have a marketing and communication strategy to make consumers aware of these offerings. See “Bank Efforts to Serve Unbanked and Underbanked Consumers Qualitative Research,” May 25, 2016.
63See “Bank Efforts to Serve Unbanked and Underbanked Consumers Qualitative Research,” May 25, 2016.
60 | 2015 FDIC National Survey of Unbanked and Underbanked Households
6. The majority of unbanked households think that
banks have no interest in serving households like
theirs, and a significant share of unbanked house-
holds do not trust banks. These findings suggest
that understanding and addressing the sources of
these attitudes and building trust and familiarity are
important to attract and develop relationships with
unbanked consumers.
More than half (55.8 percent) of unbanked households think
that banks are “not at all interested” in serving households
like theirs. This is more than three times higher than the
roughly 17 percent of underbanked households, and more
than four times higher than the 12 percent of fully banked
households, that hold the same view. Even among unbanked
households with income of at least $50,000, 47 percent
perceive that banks are not at all interested in serving house-
holds like theirs. Similar shares of previously banked house-
holds and households that have never had a bank account
also have this perception.
Unbanked households that hold this view are significantly
less likely to be interested in opening an account in the future
compared with unbanked households that perceive banks
to be “very interested” or “somewhat interested” in serving
households like theirs. Only a small proportion (17 percent)
of unbanked households that perceive banks to be not at all
interested in serving households like their own is “very” or
“somewhat” likely to open an account in the next 12 months,
compared with 50 percent of unbanked households that per-
ceive banks to be very or somewhat interested.
Among unbanked households that think banks are not at all
interested in serving households like theirs, only a minority are
unbanked because banks do not offer needed products or
services. Less than one in five (18 percent) of these house-
holds cited this as one reason they are unbanked, and only 1
percent cited this as the main reason.
In addition, more than one in four unbanked households say
they are unbanked because they do not trust banks, and
roughly one in ten unbanked households are unbanked mainly
because they do not trust banks. Lack of trust in banks was
the second most frequently cited main reason for being un-
banked.
These statistics are consistent with key findings from qual-
itative research that the FDIC conducted with unbanked,
underbanked, and low-and-moderate income consumers, in
which trust and familiarity emerged as important themes.64
Taken together, the survey and qualitative research findings
suggest that attracting and developing longer-term sustain-
able relationships with unbanked consumers requires going
beyond developing new products and services to establish
trust and familiarity with unbanked consumers.65
64Ibid.
65In interviews conducted by the FDIC in 2015, some banks discussed working with established, trusted partners in their local communities to build trust and educate unbanked and low-and-moderate income consumers about banking services. For examples of this and other strategies, see “Bank Efforts to Serve Unbanked and Underbanked Consumers Qualitative Research,” May 25, 2016.

61
2015 FDIC National Survey of Unbanked and Underbanked Households
Appendix 1. FDIC Technical Notes
The data for this report were collected through a Federal
Deposit Insurance Corporation (FDIC)-sponsored Unbanked/
Underbanked Supplement to the Current Population Sur-
vey (CPS) for June 2015. The CPS is a monthly survey of
about 53,000 interviewed households conducted by the U.S.
Census Bureau for the Bureau of Labor Statistics (BLS). The
survey is based on a scientific sample that is representative
of the U.S. civilian, noninstitutionalized population, aged 15 or
older.
The CPS is the primary source of information on the labor
force characteristics of the U.S. population, including em-
ployment, unemployment, and earnings statistics. The CPS
includes a variety of demographic characteristics, such as
age, sex, race, marital status, and educational attainment. Ad-
ditional information about the CPS is provided on the Census
website.1
The CPS sample consists of independent samples in each
state and the District of Columbia. The sample sizes for each
state are set so that specific precision requirements for esti-
mating unemployment rates will be met.2 The sample design
ensures that most of the households in a given state have the
same probability of being selected, though, in general, house-
hold selection probabilities will vary across states. Because
the CPS design is state-based, most of the estimates for the
Unbanked/Underbanked Supplement should be precise at the
state level and for some metropolitan statistical areas (MSAs).
Unbanked/Underbanked SupplementThe fourth Unbanked/Underbanked Supplement was con-
ducted in June 2015. The first, second, and third supplements
were conducted in January 2009, June 2011, and June 2013,
respectively. The primary purpose of the supplement is to
estimate the percentage of U.S. households that are “un-
banked” and “underbanked” and to identify the reasons why.
The supplement survey instrument used in 2015, attached as
Appendix 3, included approximately 50 questions designed to
provide this information.
The 2015 survey instrument is similar to the 2013, 2011, and
2009 survey instruments. The 2009 instrument was developed
with the expertise of a national consulting firm, which spe-
cializes in public opinion research, as well as input from the
Census Bureau’s Demographic Surveys Division and the BLS.
The 2009 survey instrument underwent four rounds of cogni-
tive field pre-testing and was revised to address the feedback
gathered from each round.3 The questionnaire was revised in
2011, 2013, and 2015. For a detailed description of the most
recent revisions, which underwent two rounds of cognitive
testing, see Appendix 2. Because of changes in the ques-
tionnaire, direct comparisons between 2015 and prior-year
estimates are not possible in some cases.
Eligibility and ExclusionsAll households that participated in the June 2015 CPS were
eligible to participate in the Unbanked/Underbanked Sup-
plement. However, only households whose respondents
specified that they had some level of participation in their
household finances and responded “Yes” or “No” to wheth-
er someone in their household had a bank account (survey
supplement Question 2, or Q2) were considered survey re-
spondents.4 CPS household respondents who did not answer
or answered “Don’t know” to Q2, or who did not participate
in their household financial decisions (or refused to answer),
were asked no further questions and were classified as nonre-
spondents for the supplement.
Coverage and Response Rates For the June 2015 CPS, a statistical sample of 60,841
survey-eligible households was selected from the sampling
frame.5 Of these households, 52,801 participated in the CPS,
1See, for example, Technical Paper 66, “Design and Methodology, Current Population Survey,” available at http://www.census.gov/prod/2006pubs/tp-66.pdf.
2The precision targets that are the basis for the sample design of the CPS are provided in Chapter 3 of the U.S. Census Bureau’s Technical Paper 66, available at http://www.census.gov/prod/2006pubs/tp-66.pdf.
3The goal of each round was to determine respondents’ comprehension of each question, test the flow of the questions, find major recall difficulties, ascertain the sensitivity or inappropriateness of any questions, and gauge the operational feasibility of the supplement. No changes to the survey were recommended following the fourth round of testing.
4Respondents involved in their household finances include respondents in households where adults have separate finances or in households where the respondent was the only adult in the household. For households where adults share finances or have a mix of shared and separate finances, respondents were asked to specify how much they participated in their household financial decisions. Only those who reported having at least some level of participation were considered to be involved in their household finances.
5For details on the sampling frame, refer to the technical documentation for the June 2015 supplement, available at http://thedataweb.rm.census.gov/ftp/cps_ftp.html.
62 | 2015 FDIC National Survey of Unbanked and Underbanked Households
resulting in an 87 percent response rate. There were 8,040
nonrespondent eligible households. Most of these nonrespon-
dents either refused to participate (66 percent) or were not
home at the time of the interview visit or call (20 percent). The
remaining 14 percent consisted of households where (a) the
household respondent was temporarily absent, (b) the house-
hold could not be located, (c) language barriers prevented the
interview, or (d) other reasons. Because of the availability of
translators for many languages, only 0.5 percent of the non-
respondents (37 households) did not participate as a result of
language barriers.
Coverage ratios for the CPS are derived as a measure of the
percentage of persons in the target universe (the U.S. civilian,
noninstitutionalized population, aged 15 or older) that are
included in the sampling frame.6 The overall coverage ratio for
the June 2015 CPS was 89 percent. The missing 11 percent
consists of three groups: (a) persons residing in households
that are not in the CPS sampling frame, (b) noninstitutional-
ized persons not residing in households at the time the CPS
was conducted, and (c) household residents that were not
listed as household members for the CPS for various reasons.
The coverage ratios varied across demographic groups. For
example, among women aged 15 and older, the coverage
ratio was 92 percent for whites, 81 percent for blacks, and 84
percent for Hispanics.
Of the 52,801 households that participated in the CPS, 36,189
(69 percent) also participated in the Unbanked/Underbanked
Supplement.7 Supplement survey response rates vary by
household characteristics, ranging from 63 to 74 percent for
the segments of the population listed in Appendix Table A.1.
The weights calculated by the Census Bureau for the CPS
and the Unbanked/Underbanked Supplement respondents
were adjusted to account for both nonresponse and under-
coverage. These weight adjustments help correct any biases
in estimates because of nonresponse and undercoverage, so
that results from the CPS are representative of the U.S. civil-
ian, noninstitutionalized population, aged 15 or older.8
Analysis of Supplement Survey ResultsUsing supplement survey results, households were classified
as “unbanked” if they answered “No” to the question, “Do
you or anyone else in your household have a checking or
savings account now?” Households that answered “Yes”
to this question were classified as “underbanked” if they
indicated that they used one of the following products or
services from an alternative financial services provider in the
past 12 months: money orders, check cashing, international
remittances, payday loans, refund anticipation loans, rent-to-
own services, pawn shop loans, or auto title loans.
The estimated proportion of U.S. households that is un-
banked was derived by dividing the sum of the weights of
the household respondents that were identified as being
unbanked by the sum of the weights of all household respon-
dents. The same formula was used to estimate the propor-
tion of U.S. households that is underbanked. For estimated
proportions of unbanked or underbanked households for de-
mographic subgroups, the same computational approach was
used and applied to respondent households in the subgroup.
In addition to presenting estimated proportions, many of the
tables in this report include estimated numbers of households
(e.g., total households, unbanked households, or under-
banked households). An estimated number of households
for a given category such as unbanked is derived as the sum
of the weights of the sample households in that category.
For example, for the entire supplement sample of 36,189
respondent households, the sum of the household weights is
roughly 127.5 million, which would be an estimate of all U.S.
households as of June 2015. The Housing Vacancy Sur-
vey, another survey related to the CPS that uses household
controls to produce household weights, provided an estimate
of 117.3 million as the number of households in June 2015.
This difference (127.5 million versus 117.3 million) is because
household weights prepared by Census for the CPS and for
this supplement survey are generally taken to be the reference
person weights and are not adjusted to align with household
count controls. Household count controls were not used to
adjust household weights because the CPS is a person-lev-
el survey rather than a household-level survey; therefore,
universe controls were used only in the preparation of person
weights. As a result, the sum of household weights shown in
our tables for a category tends to be somewhat higher than
the actual household count for the category.
This report also contains a number of tables for which
unbanked percentages and other household statistics are
computed for subgroups defined by a particular economic or
demographic characteristic. The household classification of
an economic or demographic variable that is defined at the
6The coverage ratio is the weighted number of persons in a demographic group (after weights are adjusted to account for household nonresponse) divided by an independent count of persons in that demographic group (obtained from the 2010 Census with updates based on the American Community Survey).
7Taking into account the nonresponse to the base CPS, the overall response rate for the Unbanked/Underbanked Supplement was 59 percent.
8This adjustment is done by introducing three stages of ratio estimation that adjust weights to align with population control totals (independent population estimates for various demographic and geographic groups). The household weight is generally taken to be the weight of the householder/reference person; however, if the householder/reference person is a married male, the spouse’s weight is used.

63
person level rather than the household level (e.g., race/ethnic-
ity, education, or employment status) is based on the eco-
nomic or demographic classification of the householder/refer-
ence person (i.e., the person who owns or rents the home).9
The Census Bureau classifies households into different
household types. For instance, a family household is a
household that includes two or more people related by birth,
marriage, or adoption and residing together, along with any
unrelated people who may be residing there. Detailed defini-
tions regarding household types can be found in the technical
documentation on the CPS website.10
Households are categorized into racial/ethnic classifica-
tions as follows: if the householder is identified as black,
the household is classified as “black” regardless of whether
the householder is identified as Hispanic or any other race.
If the householder is not identified as black and is identified
as Hispanic, the household is classified as “Hispanic.” If the
householder is identified as Asian and not black or Hispanic,
then the household is classified as “Asian.” If the householder
is identified as white and not any other race and not Hispan-
ic, then the household is classified as “white.” All remaining
households are classified as “other.”
This report provides unbanked and other estimates for
the population of households with disabilities. As in the
2013 report (the first time these estimates were presented),
households are categorized as follows: if the householder is
between age 25 and 64 and either (a) indicates “Yes” to any of
the six-question disability sequence in the base CPS or (b) is
classified as “Not in labor force – disabled,” the household is
classified as “Disabled, age 25 to 64.”11 If the householder is
between age 25 and 64 and neither condition (a) nor (b) above
is met, the household is classified as “Not disabled, age 25 to
64.” If the householder is not between the ages of 25 and 64,
the household is classified as “Not applicable (not age 25 to
64).”12
This report presents estimates of unbanked and underbanked
rates (and other outcomes of interest) for larger metropolitan
statistical areas (MSAs). MSA delineations are established by
the Office of Management and Budget (OMB). OMB published
a revised set of MSA delineations in February 2013, based
on data from the 2010 Census and the 2006-2010 American
Community Surveys. The 2013 delineations superseded the
earlier delineations based on Census 2000 data, first estab-
lished by OMB in June 2003.13
As discussed in the technical documentation to the June
2015 supplement, the Census Bureau phased the 2013 MSA
delineations into the CPS (and phased out the 2003 delinea-
tions) over the period May 2014 to July 2015.14 Housing units
first included in the CPS before May 2014 were assigned
metropolitan area codes based on the 2003 delineations.
These metropolitan area codes consisted of metropolitan New
England city and town area (NECTA) codes for New England
states (Connecticut, Maine, Massachusetts, New Hamp-
shire, Rhode Island, and Vermont) and MSA codes for other
states.15 Housing units first included in the CPS in May 2014
or later were assigned metropolitan area codes based on the
2013 delineations. These metropolitan area codes consisted
only of MSA codes, as housing units in New England were
given MSA codes as part of the phase-in of the 2013 delinea-
tions.
To facilitate MSA-level estimates using the 2015 survey data,
an observation with an obsolete 2003 MSA code was as-
signed the corresponding 2013 MSA code.16 An observation
with a NECTA code was assigned the 2013 MSA code that
9In a few cases, the householder/reference person is classified as an ineligible respondent for the CPS, but another eligible household resident participated in the CPS and in the Unbanked/Underbanked Supplement. In these cases we use the attributes of the eligible respondent to characterize the household.
10See https://www.census.gov/programs-surveys/cps/technical-documentation/subject-definitions.html.
11Specifically, we use the variable PEMLR (“Monthly labor force recode”) to determine if the respondent is not in the labor force because of a disability. Refer to the CPS Data Dictionary for detail on the six-question disability sequence, available at the following link: http://thedataweb.rm.census.gov/ftp/cps_ftp.html.
12A universally accepted method to identify the population with disabilities does not exist. Key estimates from the FDIC Unbanked/Underbanked Supplement, such as the proportion of disabled households that are unbanked, are qualitatively similar using alternative disability measures. See Appendix I of the 2013 report for details, available at https://www.economicinclusion.gov/surveys/2013household/documents/2013_FDIC_Unbanked_HH_Survey_Appendix.pdf.
13For February 2013 delineations, see OMB Bulletin Number 13-01 (February 28, 2013), available at https://www.whitehouse.gov/sites/default/files/omb/bulletins/2013/b13-01.pdf. For June 2003 delineations, see OMB Bulletin Number 03-04 (June 6, 2003), available at https://www.whitehouse.gov/omb/bulletins_b03-04. In each year between 2003 and 2009, OMB published minor revisions to the MSA delineations, based on the Census Bureau’s annual population estimates.
14The technical documentation for the June 2015 supplement is available at http://thedataweb.rm.census.gov/ftp/cps_ftp.html.
15Unlike MSAs, which are made up of one of more full counties or county equivalents, NECTAs are composed of cities and towns and often do not follow county boundaries.
16In the 2015 survey data, some housing units were located in counties populous enough to be identified, but no MSA code was assigned because these counties were not in an MSA based on the 2003 delineations (all of these housing units were first included in the CPS before May 2014). Because some of these counties were in an MSA based on the 2013 delineations, a 2013 MSA code was assigned to housing units located in such counties.
64 | 2015 FDIC National Survey of Unbanked and Underbanked Households
comprised that majority of the NECTA population.17 Overall,
less than 3 percent of observations in the 2015 data were
affected by these adjustments.
For the 2013 and earlier survey years, metropolitan area
estimates provided in this report are based on the 2003
delineations (MSA or NECTA). Consequently, some metropol-
itan area estimates that use 2015 survey data are not directly
comparable to the corresponding metropolitan area estimates
that use 2013 and earlier survey data, because of changes in
geographic boundaries (e.g., the addition or subtraction of a
county). In the report tables, a tilde (~) next to an MSA name
indicates that the MSA was affected by a geographic bound-
ary change. All MSA names in the tables, however, reflect the
2013 delineations.
Imputed Values for Income Received Through Prepaid Card or Other Methods in a Typical Month Because of an issue with the administration of the survey
instrument, Q140c – about whether the household received
income or benefits through direct deposit or electronic trans-
fer onto a prepaid card in a typical month – was not asked of
households that used a prepaid card in the past 12 months,
received income in a typical month, and were longer-term
unbanked (i.e., unbanked and did not have a bank account at
any point in the 12 months before the survey). This issue also
appeared to influence responses to Q140e – about whether
the household received income in any other form in a typical
month. The proportion that indicated “Yes” to this question
was substantially higher among the affected households.18
For the 540 households affected by this issue, predicted
probabilities of receiving income through a prepaid card were
generated using estimates from a logit model. The logit model
was estimated on the sample of 2,915 households that used a
prepaid card in the past 12 months and that received income
in a typical month. Of these 2,915 households, 2,844 had a
bank account, and the remaining 71 were recently unbanked
(i.e., unbanked but had a bank account at some point in the
12 months before the survey).
The logit model specification included an indicator for bank
account ownership; an indicator for whether the household
obtained a prepaid card from a government agency or an
employer; an indicator for whether the household fell behind
on bills in the past 12 months; and categorical variables that
characterized the household’s monthly income volatility,
income level, employment status, education, age, race/eth-
nicity, nativity, metropolitan status, and geographic region.
Predicted probabilities of receiving income by other methods
were generated for these households using a similar logit
model.19
Estimates of the proportions of households that received
income through a prepaid card (and through other methods)
presented in this report incorporate these predicted values.
For example, Appendix Table G.3 shows that among un-
banked households, 16.9 percent received income through
direct deposit or electronic transfer onto a prepaid card. This
estimate is the weighted average of the proportion among
unbanked households that did not use a prepaid card (0
percent, by construction), the proportion among recently
unbanked households that used a prepaid card (54 percent),
and the average predicted probability among longer-term
unbanked households that used a prepaid card (55 percent).20
Statistical Precision of EstimatesTo indicate the precision of certain estimates, standard errors
were calculated based on the variation of the estimates
across a set of 160 sample replicates provided by the Census
Bureau. Details of the calculation of standard errors based on
sample replicates (and on the CPS methodology in general)
are available from the Census Bureau.21
Estimated differences discussed in this report are significant
at the 10 percent level unless noted otherwise. That is, if
the population difference were zero, then the probability of
obtaining estimates having the observed difference or a larger
difference would be no more than 10 percent, and could be
considerably less. For example, the estimated difference
17For example, households with a NECTA code for Boston-Cambridge-Quincy, MA-NH, were assigned the MSA code for Boston-Cambridge-Newton, MA-NH. For each NECTA code in the 2015 survey data, at least 80 percent of the Census 2010 NECTA population (and the estimated July 1, 2015, NECTA population) resided within the corresponding MSA, and for the majority of the NECTAs this number was at least 90 percent.
18Specifically, 24 percent of the 540 households affected by this issue answered “Yes” to the question about receiving income from other sources, compared to roughly 10 percent among other (unaffected) unbanked households and 2 percent among banked households. Further, households that indicated they received income in any other form were asked to specify the method. Among the households that were affected by this issue and gave a verbatim response, a substantially higher proportion of the verbatim responses directly referred to a prepaid card (compared to households that were not affected and gave a verbatim response).
19The logit model of income receipt by some other method was estimated on the 35,443 households in the sample that received income in a typical month and that were not affected by the issue with the administration of the survey instrument. The model specification was identical to the model of income receipt through a prepaid card described in the text.
20The estimated proportion of households that received income through a prepaid card in a typical month (and through other methods) was quite robust to using alternative logit model specifications and to alternative predictive approaches such as random forest.
21For a detailed description of the methodology used to calculate standard errors based on sample replicates, see Chapter 14 of the U.S. Census Bureau’s Technical Paper 66, available at http://www.census.gov/prod/2006pubs/tp-66.pdf.

65
between the proportion of unbanked households in the U.S.
between 2015 (7.0 percent) and 2013 (7.7 percent) is -0.7
percentage points. The estimated standard error of this differ-
ence (computed using the 160 replicates as described above)
is 0.2 percentage points. Under the assumption that the true
difference in the unbanked rate between 2015 and 2013 is
zero, the probability of observing the -0.7 percentage point
difference in our sample data is 0.4 percent (i.e., the p-value
is 0.004).
Certain 2015 report appendix tables include 90 percent confi-
dence intervals in addition to point estimates. The confidence
interval is one way to describe the uncertainty surrounding the
estimate. For example, as shown in Appendix Table A.3, the
estimated proportion of U.S. households that were unbanked
in 2015 is 7.0 percent, and the 90 percent confidence interval
around this estimate ranges from 6.8 to 7.3 percent.
66 | 2015 FDIC National Survey of Unbanked and Underbanked Households
2015 FDIC National Survey of Unbanked and Underbanked Households
Appendix 2. 2015 Revisions to the FDIC National Survey of Unbanked and Underbanked Households
The FDIC revised the survey instrument based on past survey
experience, feedback received in response to the 2013 sur-
vey, and recent research on economic inclusion topics. The
revisions retained successful elements of the 2013 survey,
reorganized and revised existing questions, and added ques-
tions to gain new insights. The new and revised questions
provide a detailed view of household financial transactions,
credit, and savings behavior. The questions also increase
our understanding of the extent to which use of alternative
financial services (AFS) is typical rather than incidental, and
provide information on household characteristics that could
influence financial services use, such as monthly income
volatility and perceptions about banks.
To accommodate the new questions in the 2015 survey in-
strument, several questions from the 2013 survey instrument
were dropped because responses were not expected to differ
from the 2013 responses. For example, the 2015 survey did
not contain questions about recent events that might explain
transitions into and out of the banking system (e.g., changes
in income, marital status, or residence) or questions on where
households obtained AFS.
Specific revisions to the 2015 survey are described below.
Introduction, Transitions, Reasons for Being Unbanked, and Household Perceptions About BanksOne question dropped from the 2013 survey asked house-
holds that opened an account less than 12 months ago the
main reason for opening an account (2013 survey Q2f).
A new question asked all households, “How interested are
banks in serving households like yours? Would you say
very interested, somewhat interested, not at all interested?”
(Q101).
Minor revisions were made to questions that asked unbanked
households the reasons why they did not have a bank ac-
count (Q5 and Q6). The response, “Banks do not have con-
venient hours or locations” (2013 survey Q5a) was split into
separate reasons: “Bank hours are inconvenient” (Q5a1) and
“Bank locations are inconvenient” (Q5a2). “Bank account
fees are too high or unpredictable” (2013 survey Q5b) was
also split into separate reasons: “Bank account fees are too
high” (Q5b1) and “Bank account fees are unpredictable”
(Q5b2). Wording for other reasons was modified as follows:
“Don’t like dealing with or don’t trust banks” was shortened
to “Don’t trust banks” (Q5d), “Do not have enough money to
keep in an account or meet a minimum balance” was short-
ened to “Do not have enough money to keep in an account”
(Q5e), “Not using a bank provides more privacy for my
personal finances” was changed to “Avoiding a bank gives
more privacy” (Q5f), and “Can’t open an account due to ID,
credit, or banking history problems” became “Cannot open an
account due to personal identification, credit, or former bank
account problems” (Q5g). Responses for the main reason a
household was unbanked (Q6) were updated to be consistent
with Q5.
Finally, questions on recent events that might explain transi-
tions into and out of the banking system (2013 survey Q49,
Q50, and Q51) were dropped.
Direct Deposit and Account Access MethodsQuestions that asked about automatic transfers or deposits
(2013 survey Q2c and Q2d) were dropped. Instead, the 2015
survey asked households whether they received income
through direct deposit or electronic transfer into a bank ac-
count in a typical month (Q140b).
A question on types of mobile banking activities that house-
holds engaged in (2013 survey Q2i), such as downloading a
bank’s mobile app, reading text message alerts, or sending
money to others using a bank’s website or mobile app, was
dropped.
Prepaid CardsThe introductory description of prepaid cards was shortened
in the 2015 survey instrument.
The language and responses for the question on prepaid card
sources were changed. The 2013 survey asked which location
the household typically used to get the prepaid card, allowing
67
only one selection (2013 survey Q43), while the 2015 survey
allowed households to select multiple sources (Q111). The
location choices also differed. The 2015 survey included as
sources a bank location or bank’s website (as opposed to a
bank branch in the 2013 survey), a government agency, an
employer payroll card, and family or friends.
A new follow-up question asked households that used a pre-
paid card from a government agency whether they received
the card for social security or disability benefits, unemploy-
ment benefits, or food or child care benefits like SNAP or WIC
(Q112).
The following questions about prepaid cards were dropped:
whether households had ever used a prepaid card (2013
survey Q39), whether households used a prepaid card in the
past 30 days (2013 survey Q41), reasons for using a prepaid
card (2013 survey Q42 and Q42b), reloading of prepaid cards
(Q44), methods to access or load a prepaid card account
(2013 survey Q45), and prepaid card access and use through
a mobile phone (2013 survey Q45b).
Although many prepaid card questions were dropped, prepaid
card use was incorporated into new questions on income
receipt and bill payment in a typical month and on saving for
unexpected expenses or emergencies (described below).
Alternative Financial ServicesAll AFS questions that asked households whether they had
ever used a particular AFS or whether they used a particular
AFS in the past 30 days (2013 survey Q9, Q11, Q14, Q16,
Q20, Q22, Q25, Q27, Q29, Q31, Q33, Q35, Q37, Q38, and
Q38c) were dropped.
Questions that asked which nonbank locations were typically
used to cash checks (2013 survey Q13b), purchase mon-
ey orders (2013 survey Q19b), or send money to friends or
relatives living outside the U.S. (2013 survey Q24b) were also
dropped.
A question on online payday loan use in the past 12 months
(2013 survey Q28b) was dropped.
Minor wording changes were made to questions on pawn
shop loans (2013 survey Q30 and 2015 survey Q123), rent-to-
own services (2013 survey Q36 and 2015 survey Q125), and
auto title loans (2013 survey Q38b and 2015 survey Q126).1
The 2015 survey included new questions about international
remittances. All households were asked whether they sent
money abroad to family or friends in the past 12 months
(Q130). For households that sent money abroad in the past 12
months, follow-up questions asked whether the money was
sent using a bank (Q131) or a nonbank (Q133) in the past 12
months. Households that sent money abroad using a bank
in the past 12 months were asked whether they did so in a
typical month (Q132). Similarly, households that sent money
abroad using a nonbank in the past 12 months were asked
whether they did so in a typical month (Q134). The question
about nonbank remittance use in the past 12 months in the
2015 survey (Q133) was similar to a question from the 2013
survey (2013 survey Q21).
Bank Credit, Saving, and Income VolatilityThe 2015 survey included new questions about bank credit,
saving for unexpected expenses or emergencies, and income
volatility. All of these questions refer to the past 12 months.
Q160 asked households whether they had a credit card from
Visa, MasterCard, American Express, or Discover. Q161
asked whether they had a personal loan or line of credit from
a bank, excluding student loans or loans for major purchas-
es like a house or car. These new credit questions focused
on bank credit products most likely to be substitutes for
small-dollar, short-term credit available from AFS providers.
New questions asked households whether they applied for
a new credit card, or a personal loan or line of credit at a
bank (Q162), and, if so, whether they were turned down or
not given as much credit as requested (Q163). Q164 asked
households whether they thought about applying for a new
credit card, or a personal loan or line of credit at a bank, but
changed their mind because they thought they might be
turned down.
A new question asked households whether they set aside
any money that could be used for unexpected expenses
or emergencies, even if the funds were later spent (Q170).
Households were prompted to consider only funds that could
have been easily spent, if necessary, and not retirement or
other long-term savings. Q171 asked households that saved
for unexpected expenses or emergencies where they kept
the funds, with responses that included savings accounts;
checking accounts; prepaid cards; other accounts such as
certificates of deposit, brokerage accounts, or savings bonds;
in the home, or with family or friends; buying something with
1In the 2013 survey, Q36 asked about use of rent-to-own services in the past 12 months, but Q35, which asked households whether they had ever used rent-to-own services, contained language describing rent-to-own services. Similarly, in the 2013 survey, Q38b asked about use of auto title loans in the past 12 months, but Q38 contained language describing auto title loans.

68 | 2015 FDIC National Survey of Unbanked and Underbanked Households
the intent to pawn it or sell it later, if necessary; and other
methods. Only households that saved and were either banked
or recently unbanked (i.e., unbanked but had a bank account
at some point in the 12 months before the survey) were asked
whether they kept savings in a savings account or a checking
account, and only households that saved and used a prepaid
card in the past 12 months were asked whether they kept
savings on a prepaid card.
A new question asked households whether their income over
the past 12 months was about the same each month, varied
somewhat from month to month, or varied a lot from month to
month (Q180).
A new question asked households whether they fell behind on
bill payments (Q181).
Income Receipt and Bill Payment in a Typical MonthA new series of questions asked households about the
methods they used to receive income (from work, government
benefits, or other regular sources) and pay bills (for things
like mortgage, rent, utilities, or child care) in a typical month.
Households were prompted to consider the past 12 months
before answering those questions.
All households were asked whether they received income in
a typical month by paper check or money order (Q140a) or in
cash (Q140d).2 Banked households and recently unbanked
households were asked whether they received income in a
typical month through direct deposit or electronic transfer into
a bank account (Q140b). Banked households and recently
unbanked households that used a prepaid card in the past 12
months were asked whether they received income through
direct deposit or electronic transfer onto a prepaid card
(Q140c).3 All households were asked whether they received
income in any other form (Q140e). For households that re-
ceived income by paper check or money order and that used
a nonbank check casher in the past 12 months, a follow-up
question asked whether they typically cashed the check or
money order at a place other than a bank (Q141).
All households were asked whether they paid bills in a typical
month with cash (Q150a), with a credit card (Q150d), or with a
cashier’s check or money order from a bank (Q150h).4 Banked
and recently unbanked households were asked whether they
paid bills with a personal check drawn on a bank account
(Q150b), using a debit card linked to a bank account (Q150c),
or electronically from a bank account through online bill pay
or direct withdrawal (Q150f). Households that used a prepaid
card in the past 12 months were asked whether they used
a prepaid card to pay bills (Q150e). Households that used
a nonbank money order in the past 12 months were asked
whether they paid bills with a money order from a place other
than a bank (Q150g). All households were asked whether they
paid bills in any other way (Q150i). Q151 asked households to
choose their most common method of paying bills from the
methods they selected in Q150.
Household Learning About FinancesA question was added on whether households asked a bank
teller or bank customer service agent about financial prod-
ucts and services or managing money in the past 12 months
(Q182).
Another question asked households whether, in the past 12
months, they attended any financial classes or financial coun-
seling sessions, either in-person, by phone, or online (Q183).
For households that attended such classes or counseling ses-
sions, a follow-up question asked whether they learned about
the classes or counseling sessions through a bank (Q184).
Internet AccessThe question on Internet access (2013 survey Q46 and 2015
survey Q187) was modified to ask whether the household
currently had Internet access at home, rather than at home or
outside the home (e.g., school, work, public library, etc.) as in
2013.
2If at any point during the questions on receiving income respondents volunteered that they did not receive income, they were not asked further questions about receiving income.
3The universe for Q140c was intended to include all households that used a prepaid card in the past 12 months. Because of an issue with the administration of the survey instrument, only banked and recently unbanked households that used a prepaid card were asked this question. See Appendix 1 for details.
4If at any point during the questions on paying bills respondents volunteered that they did not pay bills, they were not asked further questions about paying bills.

69
2015 FDIC National Survey of Unbanked and Underbanked Households
Appendix 3. Survey Instrument
Next, I’d like to ask you some questions about household finances.
1. Which of the following best describes your household finances? Do the adults…
¨Share all finances [CONTINUE]
¨Share some finances [CONTINUE]
¨Share no finances at all [SKIP TO Q2]
¨ I AM THE ONLY ADULT IN THE HOUSEHOLD (VOLUNTEERED) [SKIP TO Q2]
¨DK/REFUSE [CONTINUE]
1a. How much do you participate in making financial decisions for your household?
¨A lot [CONTINUE]
¨Some [CONTINUE]
¨Not at all [TERMINATE]
¨DK/REFUSE [TERMINATE]
2. Do you (if OTHERS AGE≥15 FILL: or anyone else in your household) have a checking or savings account now?
¨YES [CONTINUE]
¨NO [SKIP TO Q3]
¨DK/REFUSE [TERMINATE]
[Questions 2a-2h are asked only of households that have a bank account.]
2a. Who is that? (Enter Line Number)
¨1-16 [CONTINUE]
¨DK/REFUSE [SKIP TO Q2e]
2b. What type or types of accounts do you and each of your household members have? (Ask this question for each adult
(15 years of age and older) individual of the household.)
¨Only checking accounts [CONTINUE]
¨Only savings accounts [CONTINUE]
¨Or both checking and savings accounts [CONTINUE]
¨OTHER (VOLUNTEERED) [CONTINUE]
¨DK/REFUSE [CONTINUE]
2e. In the past 12 months, that is since June 2014, was there any time when no one in your household had an account?
¨YES [CONTINUE]
¨NO [CONTINUE]
¨DK/REFUSE [CONTINUE]
70 | 2015 FDIC National Survey of Unbanked and Underbanked Households
2g. In the past 12 months, have you (if OTHERS AGE≥15 FILL: or anyone else in your household) accessed an account in any of
the following ways? (Mark all that apply.)
¨Bank teller [CONTINUE]
¨ATM or bank kiosk [CONTINUE]
¨Telephone banking through phone call or automated voice/touch tone [CONTINUE]
¨Online banking with a laptop, desktop computer, or tablet such as an iPad [CONTINUE]
¨Mobile banking with text messaging, mobile app, or Internet browser or email on a
mobile phone [CONTINUE]
¨Other (Specify) [CONTINUE]
¨Did not access an account in the past 12 months [CONTINUE]
¨DK/REFUSE [CONTINUE]
2h. What was the most common way that you (if OTHERS AGE≥15 FILL: or anyone else in your household) accessed an account?
(Read only answers marked in Q2g. Mark only one.)
¨Bank teller [SKIP TO Q101]
¨ATM or bank kiosk [SKIP TO Q101]
¨Telephone banking through phone call or automated voice/touch tone [SKIP TO Q101]
¨Online banking with a laptop, desktop computer, or tablet such as an iPad [SKIP TO Q101]
¨Mobile banking with text messaging, mobile app, or Internet browser or email on a
mobile phone [SKIP TO Q101]
¨Other (Specify) [SKIP TO Q101]
¨DK/REFUSE [SKIP TO Q101]
[Questions 3-7 are asked only of households that do not have a bank account.]
3. Have you (if OTHERS AGE≥15 FILL: or anyone else in your household) ever had a checking or savings account?
¨YES [CONTINUE]
¨NO [SKIP TO Q5]
¨DK/REFUSE [SKIP TO Q5]
4. Have you (if OTHERS AGE≥15 FILL: or anyone else in your household) had a checking or savings account in the past 12
months, that is since June 2014?
¨YES [CONTINUE]
¨NO [CONTINUE]
¨DK/REFUSE [CONTINUE]
5. There are different reasons people might not have a checking or savings account. Do any of the following reasons apply to you
(IF OTHERS AGE≥15 FILL: or others in your household)? Do you not have an account…
a1. Because bank hours are inconvenient?
¨YES [CONTINUE]
¨NO [CONTINUE]
¨DK/REFUSE [CONTINUE]
a2. Because bank locations are inconvenient?
¨YES [CONTINUE]
¨NO [CONTINUE]
¨DK/REFUSE [CONTINUE]
71
b1. Because bank account fees are too high?
¨YES [CONTINUE]
¨NO [CONTINUE]
¨DK/REFUSE [CONTINUE]
b2. Because bank account fees are unpredictable?
¨YES [CONTINUE]
¨NO [CONTINUE]
¨DK/REFUSE [CONTINUE]
c. Because banks do not offer products or services you need?
¨YES [CONTINUE]
¨NO [CONTINUE]
¨DK/REFUSE [CONTINUE]
d. Because you don’t trust banks?
¨YES [CONTINUE]
¨NO [CONTINUE]
¨DK/REFUSE [CONTINUE]
e. Because you do not have enough money to keep in an account?
¨YES [CONTINUE]
¨NO [CONTINUE]
¨DK/REFUSE [CONTINUE]
f. Because avoiding a bank gives more privacy?
¨YES [CONTINUE]
¨NO [CONTINUE]
¨DK/REFUSE [CONTINUE]
g. Because you cannot open an account due to personal identification, credit, or former bank account problems?
¨YES [CONTINUE]
¨NO [CONTINUE]
¨DK/REFUSE [CONTINUE]
h. Was there some other reason (Specify)?
¨YES (Specify) [CONTINUE]
¨NO [CONTINUE]
¨DK/REFUSE [CONTINUE]
72 | 2015 FDIC National Survey of Unbanked and Underbanked Households
[If YES to more than one reason in Q5a1-Q5h, continue. Otherwise, skip to Q7.]
6. What is the main reason why no one in your household has an account? (Read only answers marked in Q5a1-Q5h.
Mark only one.)
¨Bank hours are inconvenient [CONTINUE]
¨Bank locations are inconvenient [CONTINUE]
¨Bank account fees are too high [CONTINUE]
¨Bank account fees are unpredictable [CONTINUE]
¨Banks do not offer products or services you need [CONTINUE]
¨Don’t trust banks [CONTINUE]
¨Do not have enough money to keep in an account [CONTINUE]
¨Avoiding a bank gives more privacy [CONTINUE]
¨Cannot open an account due to personal identification, credit, or former bank
account problems [CONTINUE]
¨Some other reason (Specify) [CONTINUE]
¨DK/REFUSE [CONTINUE]
7. How likely is it that you (IF OTHERS AGE≥15 FILL: or someone else in your household) will open a checking or savings account
within the next 12 months?
¨Very likely [CONTINUE]
¨Somewhat likely [CONTINUE]
¨Not very likely [CONTINUE]
¨Not at all likely [CONTINUE]
¨DK/REFUSE [CONTINUE]
[Question 101 is asked of all households.]
101. The next question is about your household. How interested are banks in serving households like yours? Would you say very
interested, somewhat interested, not at all interested?
¨VERY INTERESTED [CONTINUE]
¨SOMEWHAT INTERESTED [CONTINUE]
¨NOT AT ALL INTERESTED [CONTINUE]
¨DK/REFUSE [CONTINUE]
Now I have a question about prepaid cards. I am not asking about gift cards or debit cards linked to a checking ac-
count. Prepaid cards allow you or others, like relatives or a government agency, to load funds that can later be spent.
Prepaid cards also allow you to withdraw cash from ATMs.
110. In the past 12 months, that is since June 2014, did you (if OTHERS AGE≥15 FILL: or anyone else in your household) use any
prepaid cards like these?
¨YES [CONTINUE]
¨NO [SKIP to Q120]
¨DK/REFUSE [SKIP to Q120]

73
[Question 111 is asked only of households that used a prepaid card in the last 12 months.]
111. Where did the prepaid cards that you used in the past 12 months come from? (Mark all that apply.)
¨A bank location or bank’s website [CONTINUE]
¨A store or website that is not a bank [CONTINUE]
¨A government agency [CONTINUE]
¨Employer payroll card [CONTINUE]
¨Family or friends [CONTINUE]
¨Other (Specify) [CONTINUE]
¨DK/REFUSE [CONTINUE]
[Question 112 is asked only of households that used a prepaid card from a government agency.]
112. Thinking about the card(s) received from a government agency, why did you (if OTHERS AGE≥15 FILL: or others in your
household) have these card(s)? (Mark all that apply.)
¨To receive social security or disability benefits [CONTINUE]
¨To receive unemployment benefits [CONTINUE]
¨To receive food or child care benefits like SNAP or WIC [CONTINUE]
¨Other (Specify) [CONTINUE]
¨DK/REFUSE [CONTINUE]
Earlier, we asked about banks, including any bank, savings and loans institution, credit union, or brokerage firm. The
next questions ask about going to places other than a bank for your financial services.
120. In the past 12 months, that is since June 2014, did you (if OTHERS AGE≥15 FILL: or anyone else in your household) go to
some place other than a bank to cash a check?
¨YES [CONTINUE]
¨NO [CONTINUE]
¨DK/REFUSE [CONTINUE]
121. In the past 12 months, did you (if OTHERS AGE≥15 FILL: or anyone else in your household) go to some place other than a
bank to purchase a money order?
¨YES [CONTINUE]
¨NO [CONTINUE]
¨DK/REFUSE [CONTINUE]
122. Did you (if OTHERS AGE≥15 FILL: or anyone else in your household) take out a payday loan or payday advance from some
place other than a bank in the past 12 months?
¨YES [CONTINUE]
¨NO [CONTINUE]
¨DK/REFUSE [CONTINUE]
123. Did you (if OTHERS AGE≥15 FILL: or anyone else in your household) pawn an item at a pawn shop in the past 12 months?
Do not include selling an unwanted item to a pawn shop.
¨YES [CONTINUE]
¨NO [CONTINUE]
¨DK/REFUSE [CONTINUE]
74 | 2015 FDIC National Survey of Unbanked and Underbanked Households
124. In the past 12 months, that is since June 2014, did you (if OTHERS AGE≥15 FILL: or anyone else in your household) take out
a tax refund anticipation loan, or use a tax preparation service in order to receive your tax refund faster than the IRS would
provide it?
¨YES [CONTINUE]
¨NO [CONTINUE]
¨DK/REFUSE [CONTINUE]
125. Some stores allow people to rent to own items such as furniture or appliances. We do not mean stores that offer installment
plans or layaway plans. In the past 12 months, did you (if OTHERS AGE≥15 FILL: or anyone else in your household) rent
anything from a rent-to-own store because it couldn’t be financed any other way?
¨YES [CONTINUE]
¨NO [CONTINUE]
¨DK/REFUSE [CONTINUE]
126. Auto title loans use a car title to borrow money for a short period of time. They are NOT loans used to purchase a car. In the
past 12 months, did you (if OTHERS AGE≥15 FILL: or someone else in your household) take out an auto title loan?
¨YES [CONTINUE]
¨NO [CONTINUE]
¨DK/REFUSE [CONTINUE]
The next few questions are about sending money abroad.
130. In the last 12 months, that is since June 2014, did you (if OTHERS AGE≥15 FILL: or someone else in your household) send
money to family or friends living outside of the US?
¨YES [CONTINUE]
¨NO [SKIP TO Q140a]
¨DK/REFUSE [SKIP TO Q140a]
[Question 131 is asked only of households that sent money abroad.]
131. In the last 12 months, did you (if OTHERS AGE≥15 FILL: or someone else in your household) send money abroad
using a bank?
¨YES [CONTINUE]
¨NO [SKIP TO Q133]
¨DK/REFUSE [SKIP TO Q133]
[Question 132 is asked only of households that used a bank to send money abroad.]
132. Did you (if OTHERS AGE≥15 FILL: or someone else in your household) send money abroad using a bank in a typical
month?
¨YES [CONTINUE]
¨NO [CONTINUE]
¨DK/REFUSE [CONTINUE]
[Question 133 is asked only of households that sent money abroad.]
133. In the last 12 months, did you (if OTHERS AGE≥15 FILL: or someone else in your household) send money abroad using a
place other than a bank?
¨YES [CONTINUE]
¨NO [SKIP TO Q140a]
¨DK/REFUSE [SKIP TO Q140a]
75
[Question 134 is asked only of households that used a place other than a bank to send money abroad.]
134. Did you (if OTHERS AGE≥15 FILL: or someone else in your household) send money abroad using a place other than a bank
in a typical month?
¨YES [CONTINUE]
¨NO [CONTINUE]
¨DK/REFUSE [CONTINUE]
The next few questions are about the different ways people receive income. People may receive income from work,
government benefits, or other regular sources in a number of ways. Think about the ways income has come into your
household in the past 12 months, that is since June 2014.
[Question 140a is asked of all households.]
140a. In a typical month, have you (if OTHERS AGE≥15 FILL: or others in your household) received income by paper check or
money order?
¨YES [CONTINUE]
¨NO [CONTINUE]
¨DID NOT RECEIVE INCOME (VOLUNTEERED) [SKIP TO Q150a]
¨DK/REFUSE [CONTINUE]
[Question 140b is asked only of households that are banked or recently unbanked.]
140b. In a typical month, have you (if OTHERS AGE≥15 FILL: or others in your household) received income or benefits through
direct deposit or electronic transfer into a bank account?
¨YES [CONTINUE]
¨NO [CONTINUE]
¨DK/REFUSE [CONTINUE]
[Question 140c is asked only of households that have used a prepaid card and that have received income.]1
140c. In a typical month, have you (if OTHERS AGE≥15 FILL: or others in your household) received income or benefits through
direct deposit or electronic transfer onto a prepaid card?
¨YES [CONTINUE]
¨NO [CONTINUE]
¨DK/REFUSE [CONTINUE]
[Questions 140d-140e are asked of all households that have received income.]
140d. In a typical month, have you (if OTHERS AGE≥15 FILL: or others in your household) received income in cash?
¨YES [CONTINUE]
¨NO [CONTINUE]
¨DK/REFUSE [CONTINUE]
140e. In a typical month, have you (if OTHERS AGE≥15 FILL: or others in your household) received income in any other form?
¨YES (Specify) [CONTINUE]
¨NO [CONTINUE]
¨DK/REFUSE [CONTINUE]
1Due to an issue with the administration of the survey instrument, some households that used a prepaid card and that received income were not asked question 140c. See Appendix 1 (FDIC Technical Notes) for details.
76 | 2015 FDIC National Survey of Unbanked and Underbanked Households
[Question 141 is asked only of households that received income by paper check or money order, and used a non-bank check
casher in the last 12 months.]
141. Think about the income you (if OTHERS AGE≥15 FILL: or others in your household) received by paper check or money order
in the past 12 months. Did you typically use some place other than a bank to cash the check or money order?
¨YES [CONTINUE]
¨NO [CONTINUE]
¨DK/REFUSE [CONTINUE]
The next few questions are about the different ways people pay their monthly bills for things like mortgage, rent, utili-
ties, or child care. Think about the ways your household has paid bills in the past 12 months, that is since June 2014.
[Question 150a is asked of all households.]
150a. In a typical month, did you (if OTHERS AGE≥15 FILL: or someone else in your household) use cash to pay these types of
bills?
¨YES [CONTINUE]
¨NO [CONTINUE]
¨DID NOT PAY BILLS IN PAST 12 MONTHS (VOLUNTEERED) [SKIP TO Q160]
¨DK/REFUSE [CONTINUE]
[Questions 150b-150c are asked only of households that have a bank account or had a bank account in the last 12 months.]
150b. In a typical month, did you (if OTHERS AGE≥15 FILL: or someone else in your household) pay bills with a personal check
drawn on a bank account?
¨YES [CONTINUE]
¨NO [CONTINUE]
¨DK/REFUSE [CONTINUE]
150c. In a typical month, did you (if OTHERS AGE≥15 FILL: or someone else in your household) pay bills using a debit card linked
to a bank account?
¨YES [CONTINUE]
¨NO [CONTINUE]
¨DK/REFUSE [CONTINUE]
[Question 150d is asked of all households that pay bills.]
150d. In a typical month, did you (if OTHERS AGE≥15 FILL: or someone else in your household) use a credit card to pay bills?
¨YES [CONTINUE]
¨NO [CONTINUE]
¨DK/REFUSE [CONTINUE]
[Question 150e is asked only of households that used a prepaid card in the last 12 months and that pay bills.]
150e. In a typical month, did you (if OTHERS AGE≥15 FILL: or someone else in your household) use a prepaid card to pay bills?
¨YES [CONTINUE]
¨NO [CONTINUE]
¨DK/REFUSE [CONTINUE]
77
[Question 150f is asked only of households that have a bank account or had a bank account in the last 12 months and that pay
bills.]
150f. In a typical month, did you (if OTHERS AGE≥15 FILL: or someone else in your household) pay bills electronically from a bank
account, either through online bill pay or direct withdrawal?
¨YES [CONTINUE]
¨NO [CONTINUE]
¨DK/REFUSE [CONTINUE]
[Question 150g is asked only of households that used a money order from a place other than a bank in the last 12 months and that
pay bills.]
150g. In a typical month, did you (if OTHERS AGE≥15 FILL: or someone else in your household) use a money order from a place
other than a bank to pay bills?
¨YES [CONTINUE]
¨NO [CONTINUE]
¨DK/REFUSE [CONTINUE]
[Questions 150h-150i are asked of all households that pay bills.]
150h. Over the past 12 months, in a typical month, did you (if OTHERS AGE≥15 FILL: or someone else in your household) use a
cashier’s check or money order from a bank to pay bills?
¨YES [CONTINUE]
¨NO [CONTINUE]
¨DK/REFUSE [CONTINUE]
150i. In a typical month, did you (if OTHERS AGE≥15 FILL: or someone else in your household) pay bills in any other way?
¨YES (Specify) [CONTINUE]
¨NO [CONTINUE]
¨DK/REFUSE [CONTINUE]
[If YES to multiple questions in Q150a-Q150i, continue. Otherwise, skip to Q160.]
151. Which was the most common method you (or if OTHERS AGE≥15 FILL: or others in your household) used to pay bills over
the last 12 months? (Read only answers marked in Q150a-Q150i. Mark only one.)
¨Cash [CONTINUE]
¨Personal check [CONTINUE]
¨Debit card [CONTINUE]
¨Credit card [CONTINUE]
¨Prepaid card [CONTINUE]
¨Electronic payments from a bank account (e.g. online bill pay) [CONTINUE]
¨Money order from a place other than a bank [CONTINUE]
¨Cashier’s check or money order from a bank [CONTINUE]
¨Other (Specify) [CONTINUE]
¨DK/REFUSE [CONTINUE]
78 | 2015 FDIC National Survey of Unbanked and Underbanked Households
The next few questions are about how people borrow money or purchase items on credit.
160. In the past 12 months, that is since June 2014, did you (if OTHERS AGE≥15 FILL: or someone else in your household) have a
credit card from Visa, MasterCard, American Express, or Discover? Please do not include debit cards.
¨YES [CONTINUE]
¨NO [CONTINUE]
¨DK/REFUSE [CONTINUE]
161. Have you (if OTHERS AGE≥15 FILL: or anyone in your household) had a personal loan or line of credit from a bank any time
in the last 12 months? I am not asking about student loans, or loans taken out to make major purchases like a house or car.
¨YES [CONTINUE]
¨NO [CONTINUE]
¨DK/REFUSE [CONTINUE]
162. In the past 12 months, that is since June 2014, did you (if OTHERS AGE≥15 FILL: or someone else in your household) apply
for a new credit card, or a personal loan or line of credit at a bank?
¨YES [CONTINUE]
¨NO [SKIP TO Q164]
¨DK/REFUSE [SKIP TO Q164]
[Question 163 is asked only of households that applied for credit in the last 12 months.]
163. In the past 12 months, did any lender or creditor turn down your (if OTHERS AGE≥15 FILL: or someone else in your house-
hold’s) request for new credit or not give you as much credit as you applied for?
¨YES [CONTINUE]
¨NO [CONTINUE]
¨DK/REFUSE [CONTINUE]
[Question 164 is asked of all households.]
164. Was there any time in the past 12 months that you (if OTHERS AGE≥15 FILL: or someone else in your household) thought
about applying for a new credit card, or a personal loan or line of credit at a bank, but changed your mind because you
thought you might be turned down?
¨YES [CONTINUE]
¨NO [CONTINUE]
¨DK/REFUSE [CONTINUE]
The next few questions are about the different ways that people save their money.
170. Even if you later spent it, did you (if OTHERS AGE≥15 FILL: or anyone else in your household) set aside any money in the
past 12 months that could be used for unexpected expenses or emergencies? I’m only asking about funds that could be
easily spent if necessary, and am not asking about retirement or other long-term savings.
¨YES [CONTINUE]
¨NO [SKIP TO Q180]
¨DK/REFUSE [SKIP TO Q180]
79
[Question 171 is asked only of households that set aside some savings in the past 12 months.]
171. Where did you (if OTHERS AGE≥15 FILL: or anyone else in your household) keep this money? (Mark all that apply.)
(Read only for banked or recently unbanked) In a checking account? [CONTINUE]
(Read only for banked or recently unbanked) In a savings account? [CONTINUE]
(Read only for those with a prepaid card) On a prepaid card? [CONTINUE]
¨ In other accounts such as certificates of deposit, brokerage accounts, or savings bonds? [CONTINUE]
¨Did you keep the savings in the home, or with family or friends? [CONTINUE]
¨Did you buy something with the intent to pawn or sell later if necessary? [CONTINUE]
¨Other (Specify) [CONTINUE]
¨DK/REFUSE [CONTINUE]
[Questions 180-183 are asked of all households.]
180. Which best describes your household’s income over the past 12 months? (Mark only one.)
¨ Income is about the same each month [CONTINUE]
¨ Income varies somewhat from month to month [CONTINUE]
¨ Income varies a lot from month to month [CONTINUE]
¨DK/REFUSE [CONTINUE]
181. Often times, households find that they are not able to keep up with their bills. Over the last 12 months, was there a time
when you (if OTHERS AGE≥15 FILL: or someone else in your household) fell behind on bill payments?
¨YES [CONTINUE]
¨NO [CONTINUE]
¨DK/REFUSE [CONTINUE]
182. In the past 12 months, have you (if OTHERS AGE≥15 FILL: or anyone else in your household) asked a bank teller or bank
customer service agent about financial products and services or managing your money?
¨YES [CONTINUE]
¨NO [CONTINUE]
¨DK/REFUSE [CONTINUE]
183. In the past 12 months, did you (if OTHERS AGE≥15 FILL: or others in your household) attend any financial education classes
or financial counseling sessions, either in-person, by phone, or online?
¨YES [CONTINUE]
¨NO [SKIP TO Q185]
¨DK/REFUSE [SKIP TO Q185]
[Question 184 is asked only of households that attended a financial education class or counseling.]
184. Did you (if OTHERS AGE≥15 FILL: or someone else in your household) learn about any of those financial education classes
or counseling sessions through a bank?
¨YES [CONTINUE]
¨NO [CONTINUE]
¨DK/REFUSE [CONTINUE]
[Question 185 is asked of all households.]
185. Do you (if OTHERS AGE≥15 FILL: or someone else in your household) currently own or have regular access to a mobile
phone?
¨YES [CONTINUE]
¨NO [SKIP TO Q187]
¨DK/REFUSE [SKIP TO Q187]

80 | 2015 FDIC National Survey of Unbanked and Underbanked Households
[Question 186 is asked only of households that have a mobile phone.]
186. Are any of these mobile phones a smartphone with features to access the Internet, send emails, and download apps?
¨YES [CONTINUE]
¨NO [CONTINUE]
¨DK/REFUSE [CONTINUE]
[Question 187 is asked of all households.]
187. Do you (if OTHERS AGE≥15 FILL: or someone else in your household) currently have regular access to the Internet at home,
using a desktop, laptop, or tablet computer?
¨YES [CONTINUE]
¨NO [CONTINUE]
¨DK/REFUSE [CONTINUE]
<END>


FDIC-037-2016
Federal Deposit Insurance Corporation


