REPORT FOR INVESTORS · Report for Investors Q3 of 2017 1 Financing and Investor Relationship...
21
REPORT FOR INVESTORS III QUARTER OF 2017 Bogotá D.C., November 16, 2017
Transcript of REPORT FOR INVESTORS · Report for Investors Q3 of 2017 1 Financing and Investor Relationship...

REPORT FOR
INVESTORS
III QUARTER OF 2017
Bogotá D.C., November 16, 2017

Report for Investors Q3 of 2017
1 Financing and Investor Relationship Management,
E mail:[email protected] www.grupoenergiabogota.com/inversionistas
Bogotá D.C., November 16, 2017
TABLE OF CONTENTS
1. Executive summary and relevant facts ...................................................................................... 2
1.1. The natural gas market in Colombia .............................................................................. 2
1.2. Summary of TGI’s financial results for Q3 2017 ......................................................... 2
1.3. Relevant facts during Q3 2017 ........................................................................................ 3
2. Commercial performance ............................................................................................................. 4
2.1. Sales by sector .................................................................................................................... 4
2.2. Contractual Structure ........................................................................................................ 5
3. Financial performance .................................................................................................................. 6
3.1. Financial results .................................................................................................................. 6
3.2. Debt indicators .................................................................................................................... 9
4. Operating performance ................................................................................................................ 9
5. Capital investments ..................................................................................................................... 11
6. Annexes ........................................................................................................................................ 13
Annex 1: Legal notice and clarifications ................................................................................ 13
Clarifications to the report .......................................................................................................... 13
Annex 2: Link to Consolidated Financial Statements Q3 2017: ....................................... 13
Annex 3: Outlook of the Holding Company – EEB ............................................................... 14
Annex 4: TGI's Overview ............................................................................................................. 14
Annex 5: Terms and definitions ................................................................................................ 15
Annex 6: Footnotes to the tables .............................................................................................. 16

Report for Investors Q3 of 2017
2 Financing and Investor Relationship Management,
E mail:[email protected] www.grupoenergiabogota.com/inversionistas
1. Executive summary and relevant facts
1.1. The natural gas market in Colombia
Table N° 1 - Demand of natural gas in Colombia
Demand (GBTUD) Q3 17 Q3 16 Var. %
Thermoelectric 162.74 221.79 -26.6
Residential – commercial 181.29 108.41 67.2
Industrial – refinery 409.30 435.39 -6.0
Vehicular – GNV 61.45 72.73 -15.5
Petrochemical 22.52 12.27 83.5
Other Consumptions 34.24 36.34 -5.8
Internal demand 871.5 886.9 -1.7
Exports
Total
- - -
871.5 886.9 -1.7
During the third quarter of 2017, the natural gas market in Colombia presented a decrease in its total demand by 1.7% in
comparison with the same period in 2016. During this year, the main sector affected by the decrease in the demand was
the thermoelectric sector, the consumption of which fell by 26.0%, given that in 2016, because of the impact of the
meteorological phenomena known as "El Niño", thermal generation increased. This is in stark contrast to what happened
in 2017 when the rainy season lasted longer than usual and thermal generators decreased their output and, therefore,
natural gas consumption decreased. On the other hand, petrochemical and residential gas consumption follows its
growing trend in the reported periods.
1.2. Summary of TGI’s financial results for Q3 2017
This report presents the compared financial statements for the months of September, 2017 with respect to September,
2016 under IFRS – International Financial Reporting Standards.
Table Nº 2 - TGI Selected Indicators - Numbers as of September 2017
Q3 2017 Q3 2016 Var %
Operating Revenue - USD Mm 308.6 332.3 -7.1
Operating Profit - USD Mm 187.8 213.6 -12.1
EBITDA YTD - USD Mm 251.2 281.2 -10.7
Net profit - USD Mm 97.1 62.7 54.9
Transportes volume – Mmpcd 432.1 457.8 -5.6
Firm Contracted Capacity – Mmpcd 692.0 671.3 3.09
Firm Contracted Capacity – Mm3d 19.6 19.0 3.1
International Credit Ratings:
S&P - Oct. 31:
Fitch - Oct.12:
Moody’s – Jun. 01:
BBB-, stable
BBB, stable
Baa3, stable

Report for Investors Q3 of 2017
3 Financing and Investor Relationship Management,
E mail:[email protected] www.grupoenergiabogota.com/inversionistas
The operating income at the close of September, 2017 presented a decrease in comparison with the same period of
2016, mainly due to lower volumes of transported gas (-5.6%). This resulted from the decrease in dispatch from
thermoelectric plants in the interior part of the country during the year 2017, with respect to the consumption during
the first half of 2016, due to "El Niño" phenomena.
The operational profit decreased (-12.1%) in comparison with the same period in 2016, mainly due to the decrease of
the company's operational income in 7.1%, mainly due to the decrease of variable charges associated with the
transported volume.
The company's net profit reached USD 97.1 Million, which represents an increase of USD 34.4 Million, 54.9% in
comparison with the close as of September, 2016.
The firm accumulated hired total capacity for the third quarter of 2017 is approximately 692 MPCD. As of the end of
September 2017, 92.3% of the available capacity was hired.
1.3. Relevant facts during Q3 2017
To this date, the regulator, CREG, continues to review Resolution 090 of 2016, which determined a methodology for
the current calculation of the WACC rate for tariff purposes in the natural gas transportation activity. According to the
regulator's work plan, the final methodology is expected to be issued during the last quarter of 2017.
Also under consideration is Resolution 026 of 2017, published in April, which addresses issues related to the
remuneration and competitive processes for projects included in the Natural Gas Supply Plan, prepared by the
Mining and Energy Planning Unit of Colombia (UPME in Spanish) and adopted by the Ministry of Mines and Energy
through Resolution 40006 of January 4, 2017, which includes the following projects that are complementary to TGI’s
system:
i. Yumbo - Mariquita Two-Way
ii. Construction of Loop 10”, Mariquita - Gualanday
iii. Barrancabermeja – Ballena Two-Way
iv. El Cerrito – Popayán Compressors
In addition, the aforementioned resolution defines projects that are complementary to the TGI system due to their
location and that will have a competitive selection process, as follows:
i. Construction of the Pacific Regasification Plant
ii. Construction of the Buenaventura – Yumbo Gas Pipeline
On the other hand and in compliance with the requirements of the Creg, the company submitted to such entity the
information about the characterization for the new Gas Pipeline Galán Casabe Yondo, within the process being
carried out for the definition by mutual agreement of the regulated charges for said gas pipeline.
On August 25, Grupo Energía de Bogotá informs that as of that date and after exercising the transfer option,
Transportadora de Gas Internacional TGI will start operations and will maintain the Mariquita-Cali gas pipeline built by
Transgas de Occidente.
On October 3, Grupo Energía de Bogotá informs that the arbitration tribunal of the Chamber of Commerce of Bogotá
issued an arbitration award in the proceeding driven by EPM ESP., and ISAGEN S.A. ESP, against TGI S.A. ESP;
given that neither party filed an action for annulment, the award became effective in accordance with the certification
issued on October 4, 2017 by the Tribunal's secretary.

Report for Investors Q3 of 2017
4 Financing and Investor Relationship Management,
E mail:[email protected] www.grupoenergiabogota.com/inversionistas
2. Commercial performance
2.1. Sales by sector
During the third trimester of 2017, the distribution sector, which includes residential and commercial consumption as well
as small industries and some vehicular consumption, continues to be the main income generator for the company, with a
64.8% participation. In comparison with the same period of the previous year, this sector slightly maintained its
participation with respect to the total.
Graph Nº 1 - Income Sectorial Composition
TGI’s direct sales to NGV distributors grew from 7.2% to 7.7% in comparison with the close of September 2016. This
growth in NGV consumption was due to the fact that the sector’s companies have encouraged the conversion from
petrol-fueled vehicles to natural gas-fueled vehicles, as evidenced by TGI’s granting of a subsidy per converted vehicle in
areas of influence such as Bogota, Medellin and Western Colombia. As previously explained, the thermal sector presents
a lower consumption due to the effects of El Niño phenomena, which went from 13.4% to 10.5% with respect to its
participation in the company's revenues.
Graph Nº 2 - Revenue per customer
64.8%
13.1% 10.5%
2.5% 7.7%
1.4%
63.5%
12.2% 13.4%
2.9% 7.2%
0.7%
Distributor Refinery Thermal Commercial Vehicular Others*
3Q 2017
3Q 2016
13.5%
31.5%
19.5%
9.4%
5.6%
20.4%
12.9%
28.0%
19.5%
10.4%
5.9%
23.2%
Ecopetrol Gas Natural Gases deOccidente
EPM Isagen Others*
3Q 2017
3Q 2016

Report for Investors Q3 of 2017
5 Financing and Investor Relationship Management,
E mail:[email protected] www.grupoenergiabogota.com/inversionistas
As of 2017, first-level main clients represented 80% of TGI's operating income. The main sectors serviced by the
company, which represent 90% of the total income, have stable consumption patterns.
Graph Nº 3 - Delinquency Ratio
The support management in the collection of the past due portafolio carried out during the third quarter of 2017 allowed
the company to achieve a default index of 0.003% as of September 30, which represents a financial stability for TGI.
2.2. Contractual Structure
The main sectors serviced by TGI have stable consumption rates without seasonality. This is why 100% of its contracts
are valid and agreed under a distribution of approximately 90% fixed charges and 10% variable charges.
93.4% of TGI’s income related to the natural gas transportation service is derived from fixed charges established in Firm
transportation contracts during the first 9 months of 2017. Therefore, only 6.6% of TGI's remaining income of the gas
transportation contracts is affected by the fluctuations in the demand of natural gas.
Table N° 3 - Contractual structure
Q3 2017 Q3 2016
Type of
contract No
Contracted
Capacity
(Mmpcd)
Residual life
(years average) No
Hired Capacity
(Mmpcd)
Residual life
(years average)
Firm (1) 1,669 692 8.14 1,169 671.3 9.58
See footnotes in Annex 6
Graph Nº 4 - TGI Residual Contractual Lifespan
0.023%
0.016% 0.015%
0.040%
0.003%
3Q-16 4Q-16 1Q-17 2Q-17 3Q-17
See footnotes in Annex 6

Report for Investors Q3 of 2017
6 Financing and Investor Relationship Management,
E mail:[email protected] www.grupoenergiabogota.com/inversionistas
As of this date, there are 1,669 enforceable natural gas transportation contracts, of which 388 correspond to
transportation contracts for the expansion projects proposed by the company (Cusiana - Aíay Ocoa: Project) 108,
Cusiana Phase III: 171 and Cusiana Phase IV: 109).
3. Financial performance
3.1. Financial results
As of September 2017, the total sales of the last twelve months was USD 409.2 million, which represents a decrease of
7.9% with respect to the same period in 2016. The quarter's sales reached USD 103.9 Million of which 64.9% came from
tariffs in US dollars (USD) and the remaining 35.07% from tariffs in Colombian pesos (COP). From TGI's revenues from
the natural gas transportation service, 93.4% came from fixed charges established in the firm contracts (capacity
charges), 5.60% from variable charges and 1.01% from income which corresponds to non-regulated revenue.
Table N° 4 - LTM Revenue Structure
USD Mm Variation Share
Q3 2017 Q3 2016 USD % Q3 2017 Q3 2016
Total Sales 409.2 444.3 (35.1) -7.9
Breakdown by currency
Revenue in USD (1) 267.4 301.7 (34.2) -11.4 65.3% 67.9%
Revenue in COP (1) 141.8 142.6 (0.8) -0.6 34.7% 32.1%
Breakdown by type of charge
Fixed charges revenue AO&M (2) 377.0 376.1 0.9 0.2 92.1% 84.7%
Variable charges revenue (3) 26.3 53.2 (26.9) -50.5 6.4% 12.0%
Complimentary serv. revenue (4) 5.8 15.0 (9.1) -61.0 1.4% 3.4%
See footnotes in Annex 6
Sales expressed in US dollars presented as of the third quarter 2017 (UDM) a decrease of 11.4% in comparison with the
same period of 2016 and represent as of this date 65.3% of TGI's total sales. Meanwhile, the part of sales expressed in
0
100,000
200,000
300,000
400,000
500,000
600,000
700,000
800,000
abr-
17
dic
-17
ago-1
8
abr-
19
dic
-19
ago-2
0
abr-
21
dic
-21
ago-2
2
abr-
23
dic
-23
ago-2
4
abr-
25
dic
-25
ago-2
6
abr-
27
dic
-27
ago-2
8
abr-
29
dic
-29
ago-3
0
abr-
31
dic
-31
ago-3
2
abr-
33
dic
-33
ago-3
4
abr-
35
dic
-35
ago-3
6
abr-
37
dic
-37
GAS NATURAL ECOPETROL EPM GASES DE OCCIDENTE ISAGEN OTHERS

Report for Investors Q3 of 2017
7 Financing and Investor Relationship Management,
E mail:[email protected] www.grupoenergiabogota.com/inversionistas
Colombian pesos, COP, presented a decrease of only 0.6%, in comparison with the same period of the previous year,
slightly due to a variation of the averages of the foreign exchange rates for the compared periods.
Graph Nº 5 - Revenue per currency
With respect to the variable charges that remunerate the investment, these presented a decrease of 50.5% in the last
twelve months, remaining at USD 26.4 million for Q3 2017 UDM, because the transported volume decreased
simultaneously with respect to the transported volume in the first nine months of the previous year. This was as a result
of the decrease of the demand in the thermoelectric sector, due to the end of the "El Niño" phenomena, which represents
a share of 6.4% over the total sales.
Graph Nº 6 - Revenue by type of UDM charges
65.3%
34.7%
67.9%
32.1%
Revenues linked USD Revenues linked COP
3Q 2017
3Q 2016
92.1%
6.4% 1.4%
84.7%
12.0%
3.4%
Capacity charges & AOM Variable Charges Complementary services
3Q 2017
3Q 2016

Report for Investors Q3 of 2017
8 Financing and Investor Relationship Management,
E mail:[email protected] www.grupoenergiabogota.com/inversionistas
Table N° 5 – Income statement Q3 2017 1
USD Million Var COP Million Var
Q3 2017 Q3 2016 USD %
Q3 2017 Q3 2016 COP %
Operating Income 308.6 332.3 (23.7) -7.1% 907,331 1,009,763 -102,433 -10.1%
CostCostss| Operating Expenses (121.4) (118.8) (2.5) 2.1% (347,744) (356,081) 8,337 -2.3%
Other Income/(Expenses) 0.6 0.1 0.4 312.0% 1,500 417 1,083 259.7%
Operating Profit 187.8 213.6 (25.8) -12.1% 561,087 654,099 -93,012 -14.2%
Operating Margin % 60.9% 64.3% 62% 65%
Cumulative EBITDA 251.2 281.2 (30.0) -10.7% 739,041 856,715 -117,674 -13.7%
EBITDA Margin % 81.4% 84.6% 81.5% 84.8%
Profit/(Loss)NoOper.Net (51.3) (54.9) 3.6 -6.6% (146,680) (147,953) 1,273 -0.9%
Net variation difference (19.7) 12.7 (32.3) -255.4% (57,836) 38,766 (96,602) -249.2%
Tax on profit (82.4) (108.1) 25.7 -23.8% (244,745) (311,212) 66,467 -21.4%
Deferred Tax (NIIF) 62.7 (0.6) 63.3 -10750% 184,255 (1,803) 186,058 -10321%
Utilidad neta 97.1 62.7 34.4 54.9% 296,081 231,898 64,183 27.7%
See footnotes in Annex 6
For their part, as of the close of Q3 2017 operating costs and expenses increased jointly in 2.1%, maintaining a similar
level in comparison with the same period in 2016. As of the close of Q3 2017, the operating profit closed at USD 187.8
million, representing a decrease of 12.1% in comparison with the same period of the previous year, mainly due to the
increase in revenue, as previously explained.
Non-operating results present a lower expense as of the end of September 2017, mainly due to the better performance
of the financial income, which grew in 31.4%. On the other hand, even though in the last twelve month the local currency
devaluated, an expense was recorded in the net exchange difference, due to the change in the company's functional
currency.
Regarding income tax, as of September 2017 the provision presented a decrease due to a lower net profit in comparison
with the prior year. On the other hand, an adjustment in the income tax for the year 2016 was made for USD 22.5 million,
due to a change in the asset's lifespan as a strategy to increase the company's liquid assets and to achieve the
deduction of the interest related to the company's debts in 2017.
On the other hand, the change in the above-mentioned lifespans and the TRM's fluctuation generated a reduction of
liabilities for deferred taxes and therefore, the income statement shows a release of the provision (income) in USD 62.7
million, which represents a significant variation with respect to the amount recorded in the same period of the previous
year.
As a result of all of the above, the net profit at the close of Q3 2017 increased in USD 34.4 million, in comparison with Q3
2016's net profit, with a close of USD 97.1 for September 20172.
1 TGI's functional currency is United States Dollars. The information is also presented in the Presentation Currency (Colombian Pesos-COP) For
information purposes, the numbers in the income statement in USD are converted to COP at the official exchange rate (TRM) of the date in which the
different items are accounted for. 2 For more detailed information about the income statement, see annex 7

Report for Investors Q3 of 2017
9 Financing and Investor Relationship Management,
E mail:[email protected] www.grupoenergiabogota.com/inversionistas
As a reference, below is table No. 5, the numbers of the results in Colombian pesos3.
3.2. Debt indicators
Table Nº 6- Debt indicators
Q3 2017 Q3 2016 Unit
Senior net debt / EBITDA UDM OM: < 4,8 2.5 2.4 Times
EBITDA LTM / LTM OM Interests: > 1,7 4.61 5.63 Times
Debt structure Amount Currency Coupon (%) Maturity
Senior - International bonds (4) 750 USD Mm 5.700% 20-mar-2022
Inter-company - Subordinated (5) 370 USD Mm 6.125% 21-Dec-2022
Syndicated Loan (6) 184 USD Mm Libor 6M + 2.25% 11-Sep-2019
See footnotes in Annex 6 |
Table Nº 7 – Indicator Breakdown
Thousands USD
Q3 2017 Q3 2016
EBITDA LTM 325,055 367,781
Gross Senior Debt 863,320 1,047,436
Cash and invest. Provisional 56,333 163,751
Net Senior Debt 806,987 883,685
Net Financial Expenses UDM (1) 70,543 65,283
See footnotes in Annex 6 |
The company continues to comply with what is set-forth in the 2022 Bonds Indenture with respect to the net debt
indicator to EBITDA. For the avoidance of doubt, this covenant is currently suspended given that there is a rating in the
investment grade from at least 2 of the 3 most important rating agencies.
4. Operating performance
TGI maintains its leadership in the natural gas transportation market of Colombia with 54.5% of the infrastructure in Km
and 47.2% of the transported volume. The total transported volume decreases in 2017, as the previous year’s volume
was increased due to the thermal electrical energy demand caused by “El Niño” phenomena.
3 The historic rate is the actual currency exchange at the time of executing the transactions

Report for Investors Q3 of 2017
10 Financing and Investor Relationship Management,
E mail:[email protected] www.grupoenergiabogota.com/inversionistas
Table Nº 9 - Selected operational indicators
Q3 2017 Q3 2016 Var %
Total capacity - Mmpcd (1) 753.8 733.8 2.7
Transported volume – Mmpcd (2) 432.05 457.77 -5.6
Firm Contracted Capacity – Mmpcd (3) 692.0 671.3 3.0
Load factor - % (4) 51.5 56.7 -9.1
Availability - % (5) 99.8 100.0 -0.2
Losses - % (6) - 0.1 -100
Gas pipeline length - Km 753.8 733.8 2.7
See footnotes in Annex 6
As of September 2017, the firm contracted capacity maintains similar levels to those presented in the previous period,
with a variation of 3.1% due to the company's commercial activities in the search for new contracts. Similarly, the
expansions of the system during the last years and its operating improvement have contributed to the increase in the
transportation capacity. Lastly, the system's losses remain below the 1% maximum level accepted by the regulation.
Table Nº 10 – Total transportation capacity of TGI's system – Q3 2017
By Section - Mmpcd Transportation
Capacity
Transported volume
Q3 17
Ballena – Barrancabermeja 260.0 81.7
Mariquita – Gualanday 15.0 13.7
Gualanday – Neiva 11.0 8.2
Cusiana – Porvenir 412.0 303.7
Cusiana – Apiay 33.0 31.6
Apiay – Usme 17.8 2.0
Morichal – Yopal 5.0 5.1
Sur de Bolívar 0.0 0.3
TOTAL 753.8 446.2
Additionally, TGI has a share participation of 32.24% in the Peruvian natural gas distribution company, Contugas, (EEB
is the owner of the remaining 67.76%). This company was awarded the concession with the Peruvian state to operate
and maintain a 291 Km transportation network of gas pipelines with a 350 Mmpcd capacity plus 1,023 Km of distribution
Table Nº 8 - Volume by transporter – Mmpcd
Q3 2017 Part. % Q3 2016 Part. %
TGI 432.1 47.2% 457.8 48.5%
Promigas 326.0 35.6% 340.5 36.1%
Other* 156.8 17.1% 144.8 15.4%
Total 914.8 100.0% 943.1 100.0%
Source: Concentra. Inteligencia en Energía
*Industries directly connected to the transport

Report for Investors Q3 of 2017
11 Financing and Investor Relationship Management,
E mail:[email protected] www.grupoenergiabogota.com/inversionistas
networks in southern Peru (Department of Ica). TGI is responsible for the operational technical supervision of this
company.
5. Capital investments
Table Nº 11 - Capex
USD Million
Q3 2017
Q3
2016
Investment (1) 51.9 6.7
See footnotes in Annex 6
Table Nº 12 - Status of expansion projects in Colombia Q3 17
Description
Capex
(USD
mm)
Execution
(%)
Start of
Operations
Cusiana Phase III
Increase of the Cusiana - Vasconia Capacity in 20 MPCD to service
the center of the Country.
Basic Engineering, Details, Environmental Studies, request of
environmental permits before the CAR, procurements of compression
units, equipment and pipes, environmental and social compensation,
Supervision and Construction for the expansion of the Miraflores,
Puente Guillermo, Vasconia stations and Vasconia Hub Adaptations.
31 95 Ongoing
Cusiana – Apiay –
Ocoa
"Cusiana Apiay Termo Ocoa Expansion. Construction of two new gas
compression stations, the PARATEBUENO station on the Cusiana –
Apiay Gas Pipeline and the VILLAVICENCIO Station on the Apiay-
Villavicencio-Ocoa Gas Pipeline.
The project will increase the transportation capacity to meet the
natural gas demand of shippers who requested transportation
capacity from Cusiana, Apiay and Villavicencio for 32 MMSCFD;
7MMSCFD will deviate for the Apiay-Villavicencio-Ocoa gas
pipeline."
48 74 Q4 17
Loop Armenia
Construction of Loop Armenia of 37 km in 8" between PK 219 of the
trunk line of 20 inches and the derivation from the branch to the
municipality of La Tebaida and Loop Dos Quebradas of 8 Km in 3"
between PK4 and PK 11 of el Ramal to Dos Quebradas that seeks to
supply the increasing demand in the area, so that the Loop in el
Ramal to Armenia will increase the capacity by 8,288 MPCD and the
Loop in el Ramal to Two Quebradas in 0.438 MPCD.
19 84 Q4 17
Cusiana Phase IV Expansion of the transportation capacity of Cusiana - Vasconia gas
pipeline:
I. 43 Mmpcd for the section Cusiana - Vasconia through the
construction of a 49.6 Km loop in 24”
II. 17 Mmpcd for the section Puente Guillermo - Vasconia, through
the expansion of the Puente Guillermo Compression Section.
70 11
I. Cusiana -
Vasconia 4T
2018
II. Puente
Guillermo –
Vasconia Q1
Report for Investors Q3 of 2017
12 Financing and Investor Relationship Management,
E mail:[email protected] www.grupoenergiabogota.com/inversionistas
2018
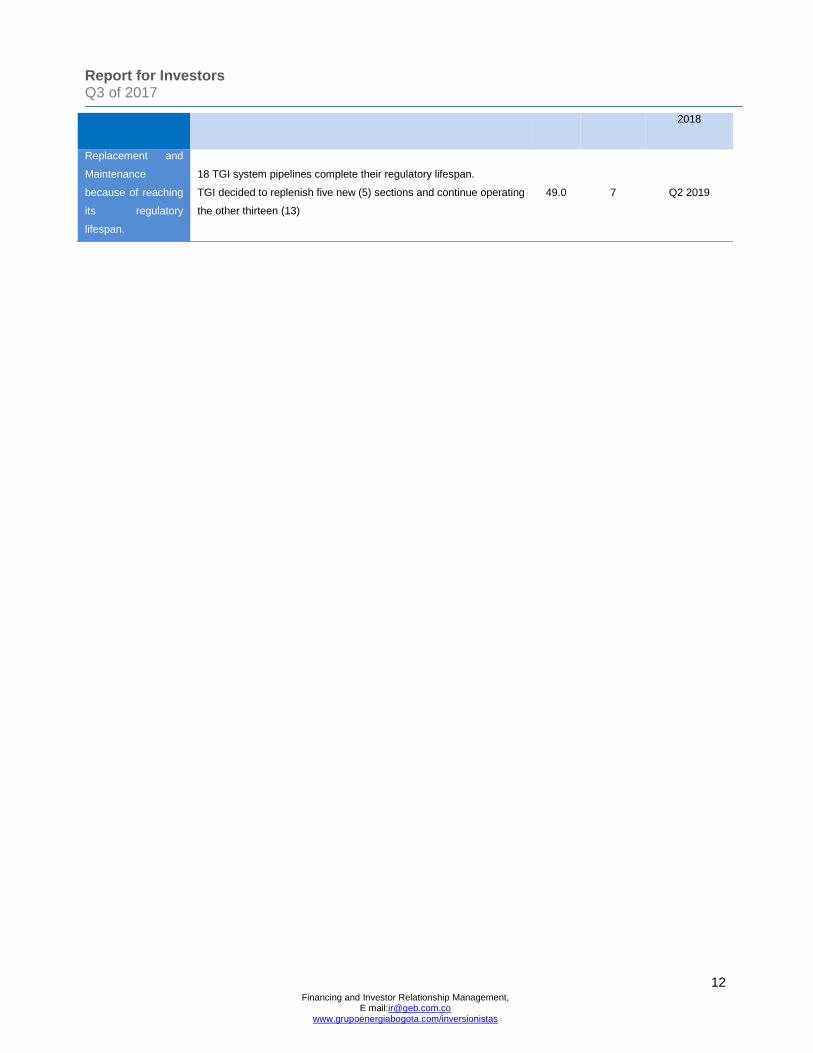
Replacement and
Maintenance
because of reaching
its regulatory
lifespan.
18 TGI system pipelines complete their regulatory lifespan.
TGI decided to replenish five new (5) sections and continue operating
the other thirteen (13)
49.0 7 Q2 2019

Report for Investors Q3 of 2017
13 Financing and Investor Relationship Management,
E mail:[email protected] www.grupoenergiabogota.com/inversionistas
6. Annexes
Annex 1: Legal notice and clarifications
This document contains words such as “anticipate”, “believe”, “expect”, “estimate” and others with similar meaning. Any
information that is different to the historic information, including, but without limiting to that refers to the Company’s
financial situation, its business strategy, its plans and management objectives, relates to forecasts.
Forecasts in this report were made under assumptions related to the economic, competitive, regulatory and operational
environment of the business and took into account risks beyond the Company’s control. Forecasts are uncertain and
they may not materialize. One may also expect that unexpected events or circumstances occur. As a result of the
foregoing, actual results may differ significantly from forecasts herein contained. Therefore, forecasts in this report must
not be considered as true facts. Potential investors must not take into account the forecasts or assumptions herein
contained, neither should they base their investment decisions upon them.
The Company expressly waives any obligation or commitment to distribute updates or revisions of any of the forecasts
herein contained.
The company’s past performance may not be considered as a pattern of its future performance.
Clarifications to the report
As of 2015, TGI’s functional currency is the United States Dollars. All numbers in the 2016 and 2017 income state in
USD are converted to COP at the Market Representative Rate (TRM, for its accronym in Spanish) as of the date in
which the different line items are accounted for.
Only for information purposes, we have converted Capex figures in this report to its USD equivalent using the TRM of
the end of period as published by the Superintendency of Finance of Colombia. The foreign exchange rates used in
the conversion are the following:
TRM as of September 30, 2016: 2,879.95.
TRM as of September 30, 2017: 2,936.67.
The comma (,) is used in the numbers presented to separate thousands and the period (.) is used to separate
decimals.
EBITDA is not an indicator recognized by the accounting laws of Colombia or the United States and may present
difficulties as an analytical tool. Therefore, EBITDA should not be taken into account in an isolated manner as a
company cash flow indicator.
EBITDA for a certain period was calculated taking the operating Profit (or loss), plus amortization of intangibles and
depreciation of fixed assets for said period.
Annex 2: Link to Consolidated Financial Statements Q3 2017:
http://www.grupoenergiadebogota.com/inversionistas/estados-financieros

Report for Investors Q3 of 2017
14 Financing and Investor Relationship Management,
E mail:[email protected] www.grupoenergiabogota.com/inversionistas
Annex 3: Outlook of the Holding Company – EEB
EEB is an integrated company in the energy sector with operations in Colombia, Perú and Guatemala;
The company was founded in 1896 and is controlled by the District of Bogotá, with a share ownership of 76.2%.
Given that EEB's share is listed in the Colombian public securities market, it is governed by the corporate governance
international standards.
EEB has an expansion strategy focused in the transportation and distribution of energy in Colombia and other
countries of the region.
EEB participated in the entire electricity value chain and almost the entire natural gas value chain - it does not
participate in the exploration and production activity of this hydrocarbon.
Grupo EB is among the mos important Colombian issuers of corporate debt in international capital markets. In
October 2007, EEB and TGI conducted an issuance of corporate bonds in the 144A market for USD 1,360 million. In
2012, TGI conducted a debt management operation to reduce the coupon rate in 380 pbs and extend its debt term by
five more years.
Since 2009, EEB's share is traded in the Colombian public securities market.
Annex 4: TGI's Overview
(1) EEB through direct and indirect participation. (2) EEB participated through SPV GEBBRAS, which was acquired on August 21, 2015 for ~ USD158 mm, 51% of share
participation in 4 transmission concessions.
TGI is a key player in EEB’s growth strategy; it is the largest natural gas transport company in Colombia and operates
a natural monopoly in an area with high growth potential and which development is of special interest to the
Colombian government.
TGI is the only natural gas transporter in Colombia connecting main supply sources - Guajira and Cusiana – with
main consumption centers.
TGI is subject to the regulation of the Ministry of Mines and Energy and the CREG. CREG defines the maximum
tariffs that TGI can charge to its users based on principles of financial viability and economic efficiency. The tariff
scheme is designed so that the investor obtains an adequate return on the invested capital and recovers the
operation and maintenance costs. The part of the tariffs that provides the return on the investment is indexed at the
COP / USD exchange rate, which gives the company a natural coverage with respect to its obligations in foreign
currency.

Report for Investors Q3 of 2017
15 Financing and Investor Relationship Management,
E mail:[email protected] www.grupoenergiabogota.com/inversionistas
Almost the totality of the company's sales are backed-up by firm and long-term contracts subscribed with sound
companies that operate in Colombia.
In 2013, TGI completed the most ambitious expansion project for the natural gas transportation infrastructure in
Colombia: the expansion of the Guajira and Cusiana gas pipelines, which cost amounted to USD 650 mm.
TGI has a share ownership of 32.24% in the Peruvian natural gas distribution company, Contugas, (EEB is the owner
of the remaining 67.76%). This company was awarded a concession for the construction of a natural gas
transportaiton and distribution network in Southern Peru (Department of Ica), for an estimated amount of USD 345 m.
ConTUgas fully started the project's commercial operation on April 30, 2014.
Annex 5: Terms and definitions
ANH: Agencia Nacional de Hidrocarburos (National Hydrocarbons Agency) Colombian entity responsible for the
definition of the hydrocarbon policy.
BR: Banco de la República (Central Bank). Colombia's Central Bank responsible for the monetary and exchange rate
policies of the country.
Bln or bln: Billion of US$. Factor 109
BOMT : Build, Operate, Maintain and Transfer Contract. It is a contract pursuant to which a third-party commits to
build, operate, maintain and transfer an asset.
COP / COP: Colombian Pesos.
CREG: Comisión de Regulación de Energía y Gas de Colombia (Energy and Gas Regulatory Commission of
Colombia). Colombian government agency responsible for the regulation of electric energy and natural gas
household utilities.
Cuota de Fomento (Development Quota): Relates to resources that Ecogas collected from users to carry out new
natural gas infrastructure projects.
DANE: Departamento Administrativo Nacional de Estadística (National Administrative Department for Statistics). Is
the entity responsible for the planning, surveying, processing, analyzing and disclosing of Colombia's official
statistics.
DNP: Departamento Nacional de Planeación (National Planning Department). Is the entity responsible for Colombia's
Economic Planning.
EEB: Empresa de Energía de Bogotá. Holding shareholder of TGI.
GNV: Gas natural vehicular (Vehicular natural gas).
GPC: Giga cubic feet. Factor 109
IED (DFI): Direct foreign investment.
IPC (CPI): Consumer price index of Colombia.
Km: Kilometers
MEM: Ministry of Energy and Mining of Peru.
Mi: United States Miles.
Mm/mm: million.
Mlm / Mlm: billions
M3: cubic meters
PBS: Basic Points, equal to 0.01%

Report for Investors Q3 of 2017
16 Financing and Investor Relationship Management,
E mail:[email protected] www.grupoenergiabogota.com/inversionistas
Pcd or pcd: cubic feet per day
SF: Superintendency of Finance. Government agency responsible for regulating, supervising and controlling the
Colombian financial sector.
TGI: Transportadora de Gas Internacional.
Tpc / tpc: Tera cubic feet. Factor 109
TRM: Market representative exchange rate; is an average of prices of the COP-USD transactions that is calculated
on a daily basis by the SF.
R/P: Reserves/Production ratio. Estimates the duration of the reserves given the level of production at a certain time.
UDM: Last twelve months.
UPME: Government agency responsible for the planning of the mining and energy sectors in Colombia.
USD: United States of America Dollars.
Annex 6: Footnotes to the tables
Footnotes delinquent portfolio index graph
(1) Delinquent index is calculated by measuring in arrears the portfolio – exceeding thirty days of delinquency – on
amounts invoiced in the last twelve months.
Return to chapter
Footnotes Table Nº 3: Contractual Structure
(1) Contractual modality ensuring the maximum volume of transported gas during a specific period of time.
Remuneration of this type of contract may be per capacity and/or variable.
Return to chapter
Footnotes Table Nº 4: Revenue structure
(1) Regulation for gas transport in Colombia divides the tariff to users; one part acknowledges investments and the other
administration, operation and maintenance costs and expenses - AOM. The portion acknowledging investments is
expressed in US$ it’s adjusted annually with IPP “Capital Equipment” from the USA and payable in COP at the TRM
of the end of each month. The portion acknowledged by AOM is defined in COP and expressed annually with
Colombian CPI.
(2) Capacity charges or fixed charges mandates the carrier to maintain an available transport capacity in the event the
client so requires. On the other hand, the client commits to paying such capacity irrespective of the volume
transported.
(3) Variable charges mandate the carrier to maintain an available capacity in the event the client so requires. However,
and contrary to the above-described scheme, the client only pays what was effectively transported, but at a higher
tariff. In general, TGI's clients maintain contracting schemes that combine fixed charges with variable charges.
(4) Additional services provided by the company, such as new connections or odorization.
Return to chapter
Footnotes Table Nº 6: Debt indicators
(1) According to the international bonds contract, the company’s net debt only takes into account TGI's senior debt less
cash value and temporary investments.
(2) The sum of the operational profit, amortizations, depreciations and provisions and tax on equity.
(3) These are the interests accrued from TGI's financial debt.
(4) Corresponds to the value of the bonds issued by TGI Internacional and guaranteed by TGI.
(5) Corresponds to the inter-company debt acquired by TGI with EEB.

Report for Investors Q3 of 2017
17 Financing and Investor Relationship Management,
E mail:[email protected] www.grupoenergiabogota.com/inversionistas
(6) Corresponds to the debt from the IELAH vehicle.
Return to chapter
Footnotes Table Nº 7: Indicator Breakdown
(1) Financial expenses are net from treasury revenue and the coupons received from contracted Opposite Swaps.
Return to chapter
Footnotes Table Nº 9: Operational indicators in Colombia
(1) Nominal system transport capacity.
(2) Average of actual volume transported.
(3) A contracting modality binding TGI to maintain a certain volume available in its transport capacity when the client so
requires.
(4) It is the usage percentage of the gas pipeline and it is obtained as the ratio between nomination and transport
capacity.
(5) Is the actual gas transport capacity in a specific period vis-à-vis nominal capacity.
(6) It is the difference between gas volumes received less gas delivered taking into account changes in inventories. It is
measured in percentiles with respect to the volume received by the clients. CREG recognized a maximum loss of 1%
through the tariffs.
Return to chapter
Footnotes Table Nº 11: Capex
(1) Corresponds to those investments aimed at increasing the company’s transport capacity.
(2) Correspond to those investments aimed at maintaining the adequate status of the company's assets to allow normal
working thereof and maintain the transport capacity at its current levels.
Return to chapter

Report for Investors Q3 of 2017
18 Financing and Investor Relationship Management,
E mail:[email protected] www.grupoenergiabogota.com/inversionistas
Annex 7: Income Statement and EBITDA
Table N° 13 – Detailed income statement
USD Var
Q3 2017 Q3 2016 USD Var %
Operating Income 308,576,760 332,308,365 (23,731,605) -7.1%
Sales Costs (103,255,865) (99,796,222) (3,459,643) 3.5%
Operation and maintenance (43,215,746) (38,378,102) (4,837,644) 12.6%
Depreciations, amortizations and
provisions (60,040,119) (61,418,120) 1,378,001 -2.2%
Gross profit 205,320,895 232,512,143 (27,191,248) -11.7%
Admin. and Operational Expenses (18,107,200) (19,031,966) 924,766 -4.9%
Personnel and general services (14,140,024) (12,700,776) (1,439,248) 11.3%
Depreciations, amortizations and provisions (2,096,241) (1,965,068) (131,173) 6.7%
Wealth tax (1,870,935) (4,366,123) 2,495,188 -57.1%
Other Income/(Egress) 565,761 137,336 428,425 312.0%
Operating Profit 187,779,456 213,617,513 (25,838,057) -12.1%
Non-operating income 12,127,996 9,228,117 2,899,879 31.4%
Financial (1)
8,363,835 7,755,639 608,196 7.8%
Coverage assessment (2)
3,764,161 1,472,478 2,291,683 155.6%
Non-operating expenses (63,438,629) (64,135,861) 697,232 -1.1%
Financial (3)
(57,232,683) (58,900,872) 1,668,189 -2.8%
Inv. Assessment Permanent (1,518,052) (2,312,706) 794,654 -
Coverage assessment (2)
(4,687,894) (2,922,283) (1,765,611) 60.4%
Net Change Difference (4)
(19,674,628) 12,656,716 (32,331,344) -255.4%
Profit before income tax 116,794,195 171,366,486 (54,572,291) -31.8%
Income tax (82,382,322) (108,099,547) 25,717,225 -23.8%
Deferred tax 62,679,761 (588,528) 63,268,289 -10750.3%
Utilidad neta 97,091,634 62,678,411 34,413,223 54.9%
(1) Includes financial yields for temporary investments.
(2) Reflects the valuation of hedging contracted by the company to reduce risk of paying the capital of debt in foreign currency.
(3) Financial expenses related to company’s debt.
(4) Reflects the impact of the devaluation/revaluation on the conversion to USD of assets and liabilities of the company in Colombian pesos
Table N° 14 – Breakdown Quarter EBIDTA
USD Q3 - 2017 Q3 - 2016
Income 308,576,760 332,308,365
(-)Operating and maintenance costs. 43,215,745 38,378,102
(-)Personnel and general services exp. 4 14,140,024 12,700,776
Quarter EBITDA 251,220,991 281,229,488
Margin Quarter EBITDA 81% 85%
4 These expenses do not include wealth tax.

Report for Investors Q3 of 2017
19 Financing and Investor Relationship Management,
E mail:[email protected] www.grupoenergiabogota.com/inversionistas
Annex 8: Financial information of main clients of TGI
Company Overview Main clients served
▪ Largest gas producer in Colombia
▪ Integrated company in the hydrocarbon sector.
▪ Company that is listed in the stock market and is
controlled by the Colombian government.
▪ Is a part of the group of the 40 largest oil companies
of the world.
▪ Shares listed in the Colombian, New York and Toronto
public stock market.
▪ Firm contract for 11 years.
▪ Ratings: Foreign debt: Baa2 (Moody’s) / BBB (Fitch) /
BBB (S&P); Local debt: AAA.
▪ Refineries.
▪ Thermal generators.
▪ Trading.
▪ Colombia's largest natural gas distributor and
marketer.
▪ Controlled by Gas Natural Fenosa de España; EEB
has a share ownership of 25%.
▪ Firm contract for 10 years.
▪ Rating: BBB (Fitch) / Local AAA.
▪ Residential.(1)
▪ SME.
▪ Industries.
▪ Natural gas for vehicles.
▪ 2.7 million clients.
▪ Natural gas distributor and marketer with presence in
Southeastern Colombia.
▪ Private company controlled by Promigas.
▪ Provides its services to more than 900.000 users.
▪ Firm contract for 15 years.
▪ Rating: Local AAA (Fitch).
▪ Residential.
▪ Industries.
▪ Natural gas for vehicles.
▪ 1.0 million clients.
▪ Main electricity generator in Colombia and important
distributor of natural gas in Northwestern Colombia.
▪ Integrated company with participation in electric
energy and natural gas.
▪ Firm contract for 9 years.
▪ Ratings: Foreign: Baa3 (Moody’s) / BBB+ (Fitch) ;
AAA Local (Fitch).
▪ Residential.
▪ Thermal generators.
▪ 877 thousand clients.

Report for Investors Q3 of 2017
20 Financing and Investor Relationship Management,
E mail:[email protected] www.grupoenergiabogota.com/inversionistas
▪ The second largest company of electric energy
generation.
▪ 57% controlled by the Colombian State.
▪ Firm contract for 5 years.
▪ Ratings: Foreign: Baa3 (Moody’s) / BBB- (Fitch)/ BBB-
(S&P); AAA Local.
▪ Thermal generators.
▪ Trading.
Source: Company Information. (1) Usuarios residenciales se refiere al número de residencies servidas, no a la población, la cual podría ser aproximadamente cinco
veces mayor.