Report for Fair Trade Original - Erasmus University … · Report for Fair Trade Original ......
27
1 Report for Fair Trade Original (Project Id.: 1271) Prof. Peter Knorringa as advisor What does Fair Trade contribute to its partner organisations in the South? Dr. Georgina M. Gómez International Institute of Social Studies Erasmus University Rotterdam
Transcript of Report for Fair Trade Original - Erasmus University … · Report for Fair Trade Original ......

1
Report for Fair Trade Original
(Project Id.: 1271)
Prof. Peter Knorringa as advisor
WhatdoesFairTradecontributetoitspartnerorganisationsintheSouth?
Dr.GeorginaM.Gómez
InternationalInstituteofSocialStudies
ErasmusUniversityRotterdam

2
1. Introduction
Fair Trade Original has been concentrating its efforts on strengthening its partner organisations to reach levels of competitiveness that will allow them to prosper in both fair trade and mainstream markets. In the first meeting with the Fair Trade Original business consultants, some explained that Dutch consumers used to choose fair trade products based on their own ideological values and personal decisions (the willingness to help others improve their welfare) but this decision is no longer taken at the expense of buying lower quality products. According to the business consultants, Dutch consumers demand attractive, well-designed and well-manufactured products, in which case they are willing to pay a somewhat higher price to help others. In this line, Fair Trade Original has been building upon the capacity of its partners in terms of product development, quality, marketing and logistics. It combines a series of business development and capacity building services for its partner organisations, on the one hand, with a niche market channel in which they sell their own products, on the other. The “graduation” of the partners is seen as reaching the capacity to sell in mainstream markets besides the relatively small fair trade niche market.
The main question that triggered the present study is how efficient and effective Fair Trade Original has been in delivering improvements to its partners by using these two instruments (capacity building and trade). This question cannot be answered at face value because the goals of Fair Trade Original are several and not necessarily going together. For instance, the partners are expected to improve as businesses (i.e. become better structured, more efficient, more flexible enterprises) while at the same time further the social and environmental principles that constitute the philosophy of fair trade (offer better working and buying conditions, higher salaries, environmentally friendly production practices, responsible farming). These do not necessarily converge; an organisation may be very “effective and efficient” in business terms but not in social and environmental terms, and viceversa. There is a second important reason why the question as such cannot be answered easily. A business may be able to sell more and improve its profits for reasons that have nothing to do with their own organisational strength, while a very strong business can also lose sales and profits for reasons beyond its control. These may happen due to changing fashions, for example. Moreover, there is no direct causal relationship between the interventions of Fair Trade Original and the end results of the organisations it supports. To make things even more complicated, Fair Trade Original can only support and suggest from a distance, but it cannot really force changes in the behaviour of its partners. As a matter of fact, Fair Trade Original has built a reputation for respecting its partners. So from the support it gives to what organisations actually do and the results they effectively get in their business operations there are many variables at stake. Furthermore, Fair Trade Original cannot guarantee its partners that their own sales will not fall or that their consumers will not change their tastes. So, also the use of trade as a tool for development has its limits. Nevertheless, this report explores the extent to which it is possible to identify the benefits that Fair Trade Original brings to its partners.
In the way of improving the capacities of the partner organisations, Fair Trade Original has designed a series of assessment tools on which it can develop business development plans and capture the progress of its partners. It has prepared a large number of different reports and evaluations. The present report is an effort to systematise the information available from these various documents (evaluation documents, business plans, fair trade assessments, etc.). It also seeks to identify what interventions have worked best and select a short list of partners to further study why those interventions have been successful.
3
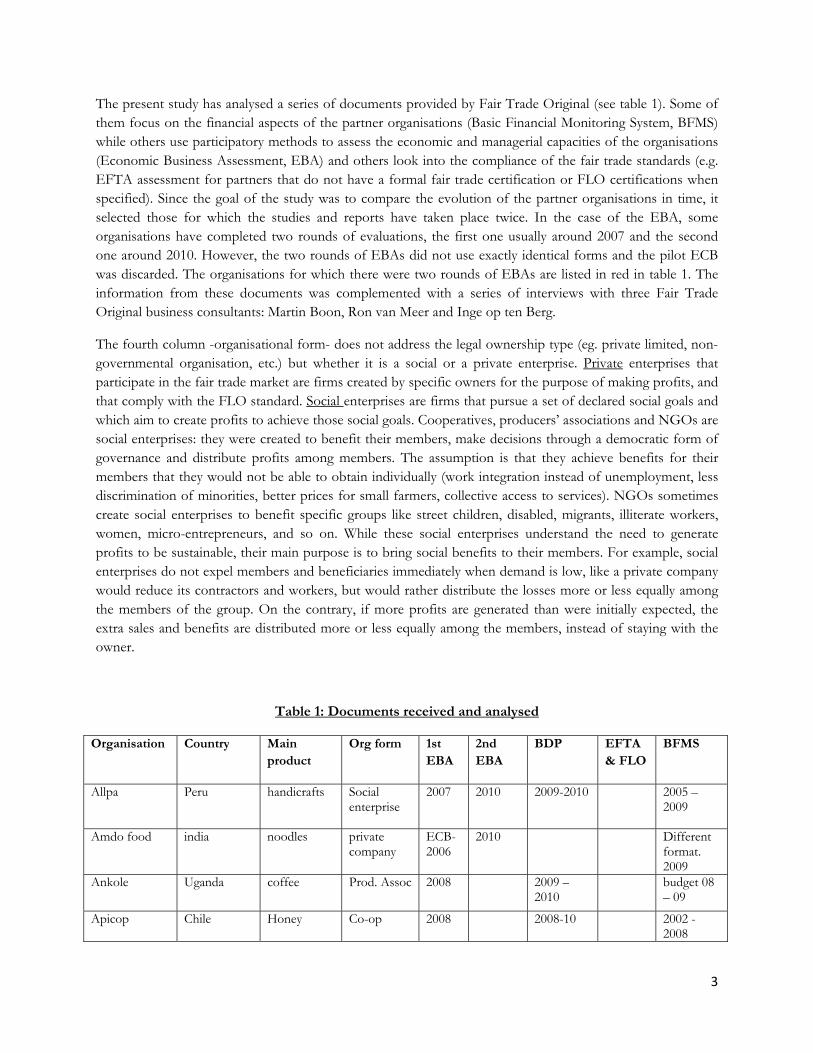
The present study has analysed a series of documents provided by Fair Trade Original (see table 1). Some of them focus on the financial aspects of the partner organisations (Basic Financial Monitoring System, BFMS) while others use participatory methods to assess the economic and managerial capacities of the organisations (Economic Business Assessment, EBA) and others look into the compliance of the fair trade standards (e.g. EFTA assessment for partners that do not have a formal fair trade certification or FLO certifications when specified). Since the goal of the study was to compare the evolution of the partner organisations in time, it selected those for which the studies and reports have taken place twice. In the case of the EBA, some organisations have completed two rounds of evaluations, the first one usually around 2007 and the second one around 2010. However, the two rounds of EBAs did not use exactly identical forms and the pilot ECB was discarded. The organisations for which there were two rounds of EBAs are listed in red in table 1. The information from these documents was complemented with a series of interviews with three Fair Trade Original business consultants: Martin Boon, Ron van Meer and Inge op ten Berg.
The fourth column -organisational form- does not address the legal ownership type (eg. private limited, non-governmental organisation, etc.) but whether it is a social or a private enterprise. Private enterprises that participate in the fair trade market are firms created by specific owners for the purpose of making profits, and that comply with the FLO standard. Social enterprises are firms that pursue a set of declared social goals and which aim to create profits to achieve those social goals. Cooperatives, producers’ associations and NGOs are social enterprises: they were created to benefit their members, make decisions through a democratic form of governance and distribute profits among members. The assumption is that they achieve benefits for their members that they would not be able to obtain individually (work integration instead of unemployment, less discrimination of minorities, better prices for small farmers, collective access to services). NGOs sometimes create social enterprises to benefit specific groups like street children, disabled, migrants, illiterate workers, women, micro-entrepreneurs, and so on. While these social enterprises understand the need to generate profits to be sustainable, their main purpose is to bring social benefits to their members. For example, social enterprises do not expel members and beneficiaries immediately when demand is low, like a private company would reduce its contractors and workers, but would rather distribute the losses more or less equally among the members of the group. On the contrary, if more profits are generated than were initially expected, the extra sales and benefits are distributed more or less equally among the members, instead of staying with the owner.
Table 1: Documents received and analysed
Organisation Country Main product
Org form 1st EBA
2nd EBA
BDP EFTA & FLO
BFMS
Allpa Peru handicrafts Social enterprise
2007 2010 2009-2010 2005 –2009
Amdo food india noodles private company
ECB-2006
2010 Different format. 2009
Ankole Uganda coffee Prod. Assoc 2008 2009 –2010
budget 08 – 09
Apicop Chile Honey Co-op 2008 2008-10 2002 -2008

4
Aarong Bangla handicrafts Assoc 2008 2010 up to 2007CAI Campesino
Bolivia walnuts Co-op 2008-10 2001 a 2007
Carmien South Africa Rooibos tea Trader 2008 2009-10 Conserve india private 2011 Copiasuro Guatemala honey coop 2007 2010 2008-10 2005-9Craft aid Mauritius sugar pack 2007 2009 2008-10 CRC India crafts private 2009 2010 Crearte Guatemala handicrafts Social
enterp. 2007 2010 2008-10 2005-09
Crisil Bolivia glas Private entreprise
2007 2010 2008-10 2005 to 2008
Dhaka Hand Bangla handicrafts Private enterprise
2010
FTCI Tibet handicrafts federation 2007 2010 various up to 2006Goue Valley S Africa grape, wines Private
famers 2007 2010 2008-10
Kasama Thailand ceramics Private enterprise
Kasinthula Malawi sugar Farmers assoc
TMF 2006
2009 2007-09 2009-10
FLO 2006
2001-2009
KCU Tanzania coffee Coop 2008 2009-11 FLO 05-07
2008-2009
KNCU Tanzania coffee Coop 2008 2009-11 FLO 2008
1996-2008
MAI Vietnam handicrafts Social enterp
2007 2009 2007-10 2007-2009
Manos campesinas
Guatemala coffee Social enterprise
2009 2009-2010
MAs tropical Sri Lanka coco milk, spices
Farmers assoc
2007 2010 2009-10 Social audit
Mitra Bali Indonesia jewelry, silk, ceramic
private ltd 2009 2010 Up to 2009
PFB Thailand rice Prod. assoc 2006 2010 2008-2010 Pradan india Silk private ltd Info
form Samroiyod thailand fruits Coop 2007 2010 Sang Arun thailand ceramic private ltd 2007 2010 Social
Auds. 2004-2010
Sasha india handicraft, food
Private enterprise
2007 2010 2007 2004-2010
Sidama Ethiopia coffee Coop 2007 2008-10 2008-2010Tara India handicrafts Trust 2007 2008-10 Turqle South Africa spices,
sauces trader 2007 2010 2009-10 2009 2004-2008
UNTE India Tea trader 2007 2010 2008-10 2003-2006Vinos Lautaro Chile wines Coop 2007 2009 2008-10 2004-2008Yak & Yeti Nepal handicrafts private ltd 2007 2009 2007 2004-2009Y-development
Thailand handicrafts Social enterprise
2007 2010 2004-08 Eval form
2004-2008
5
2. Steps taken and organisation of the study
The list of thirty-six organisations and the documents received for each one clearly indicated that it would not be possible to systematize the information on each one of them. There were a series of inconsistencies that explain this fact:
1. few organisations have compatible documents, in terms of the type of report or the years in which these were processed. For thirteen of them there was both financial (BFMS) and managerial (EBA) information available (Allpa, Copiasuro, Crearte, Crisil, FTCI, MAI, Sang Arun, Sasha, Turqle, UNTE, Vinos Lautaro, Yak&Yeti, Y-Development), a sample that is too small to show meaningful results but these were closely analysed anyway in search of possible patterns. The whole range of documents for managerial, financial and social – environmental information was received for two organisations only (Yak&Yetu and Y-Development). Furthermore, the years of the EBA and BFMS do not always coincide. This analysis is presented in section 3.
2. the forms of the EBAs are not the same in the first and second round. There was a small number of organisations for which there was a “pilot” EBA methodology carried out in 2006; these were too different to allow for significant comparison. The rounds of 2007 and 2010 were about 80% the same. The question of whether the organisations has access to Internet or whether it carries out job reviews, for example, have disappeared in the 2010 questionnaire, while the English language skills was added (not present in 2007).
3. The codification of the scoring is not consistent. For example, question 1 gave one point in 2007 for not having a business plan, while the 2010 questionnaire gave zero points for the same question and answer.
4. Probably having noticed these differences, some organisations and local consultants seem to have chosen to use the 2007 form in 2010, so not all the EBAs of the year 2009-2010 use the same questionnaire.
5. the EBAs are facilitated by local consultants where the partner organisations are situated, by the Fair Trade Original business consultants and sometimes by the trading partners themselves. A closer look at the EBAs across continents shows that different consultants interpret the questions differently and answer them differently. Moreover, while some use only integrate numbers (1, 2, 3 and so on), others use numbers with decimals (1.5; 2.5 and so on). Some local consultants add comments to their answers or explain their answers, while others do not.
6. For the same reason of having different consultants in different countries and for the various organisations, many answers are missing. Some consultants comment in the EBA questionnaire itself that they do not feel comfortable or they do not understand the question. This is consistent with a previous evaluation of the EBA that was received together with the documents listed above.
7. the total base of calculation is different in the EBAs of the first and second rounds. While the questionnaire of 2007 adds up to a total of a hundred points, the EBA of 2010 adds up to 115. In order to make them comparable, some consultants expressed the 2010 EBA in percentages, so the basis of calculation would be reduced in both cases to 100. While this solves the problem of

6
comparability, it also flattens the scores, so one point in 2010 is “worth” 15% less than one point in 2007.
In view of the points mentioned above, the decision was made to take the following steps. First, to focus most of the analysis on the 19 organisations for which there were two rounds of EBAs in 2007 and 2010. The analysis of the EBAs of these first 19 organisations started by making the scorings as consistent as possible, which meant re-expressing the scores using always 1-3 to answer the same questions in the two EBA rounds. The questions that were not present in both questionnaires were eliminated. There were two areas in which these eliminations had to be compensated. In the area of management, the question on job audits of the 2007 round and the question on 3Cs competencies of the 2010 round were taken as equivalent (either one of them scored 0 to 3 points in the EBAs). In the ICT area, the same was done with the question of Internet access and English language capacities: either one scored 0 to 2 points in their respective EBA rounds. These changes were enough to get both rounds of EBAs to add to a total of 132 points. Having a consistent base of 132 points allowed for the comparison between organizations and across the two periods of time. The information is presented in section 3.
The second step was to compare the seven organisations for which financial and economic / managerial information was available. The information is reported in section 4.
The third step was to analyse the documents that contained information on social and environmental progress, which came mostly from EFTA assessments and a few FLO certifications received. As this was insufficient, it was complemented with first hand information gathered at a meeting of local and business consultant held in The Netherlands on 2nd October, 2010. The information is reported in section 5.
The fourth step was to compare the facts and figures of the documents and the perceptions of the local consultants with the analysis of the business consultants at Fair Trade Original. Their reading of the situation is inevitably subjective too, but they are in a position to compare information across different organisations in a sector and region, across longer periods of time and in relation to the mission and goals of Fair Trade Original. In addition, they can compare notes regularly with each other, so their appraisal of the partner was considered an all-encompassing vision of the situation of the partners.
3. Analysis of Economic & Business Assessment reports (EBAs)
The scores of the re-expressed EBAs are presented in the file Analysis main.xls in both numeric and graphic forms. The analysis of the EBAs of these 19 organisations shows is presented in Table 2, sorted by EBA total score in the second round. As noticed, the patterns by continent can be biased by the consultants that made the assessments rather than strictly by the organisations involved.
1. There is some diversity in terms of the competencies of the organizations Fair Trade Original works with. While some organizations score at the top of the managerial and economic aspects listed in the EBA, others just reach 65% of these.
2. There are significant changes between the two rounds of evaluation, seen by the total EBA scores. Some organizations show improvements of more than 15% in their economic strength, measured by

7
the EBA, while others show small decrements of up to 6%. On average the organizations that Fair Trade Original works with have improved 8.22%, going from 77% to 84%.
Table 2. EBA analysis, two rounds for 19 partners
Partner Region Sector EBAs % change Remarks 2007 2009
1 Allpa Latam GL 82.6 96.2 16.51% wow
2 Sasha Asia GL 88.6 92.4 4.29%
3 Unte Asia food 89.4 90.2 0.85% oops
4 Yak &Yeti Asia GL 81.4 89.4 9.77% wow
5 Turqle Africa food 84.5 89.0 5.38%
6 Samroiyod Asia food 65.9 89.0 35.05% new org
7 Y-dev Asia GL 72.3 87.5 20.94% wow
8 Craft Aid Sugar Africa food 87.1 87.1 0.00% oops
9 Goue Valley Africa food 83.7 85.6 2.26%
10 MAI Asia GL 69.7 85.6 22.82% Wow
11 PFB Asia food 81.1 84.1 3.74%
12 Sang Arun Asia GL 76.5 82.6 7.95%
13 Crearte Latam GL 69.3 81.1 17.03% Wow
14 MAS Tropical Asia food 84.5 80.7 -4.48% Oops
15 Tara Asia GL 84.8 79.5 -6.30% Oops
16 Crisil Latam GL 63.6 76.5 20.24% Wow
17 Amdo India Asia food 65.9 73.1 10.93%
18 Copiasuro Latam food 65.9 72.7 10.34% Wow
19 vinos Lautaro Latam food 74.2 69.7 -6.12% Oops
AVG 77.4 83.8 8.22%
“Oops” for any decrease “Wow” for 15% growth or higher
3. The highest improvement corresponds to Samroiyod, which is relatively new and started from a very low level, which is the reason why this case is not considered significant to study further. The second

8
highest score corresponds to MAI (Vietnam, G&L), a positive assessment that is shared by the business consultant of G&L. It is followed by Y-Development (Asia, G&L), Crisil (LatAm, G&L), Crearte (LatAm, G&L) and Allpa (LatAm, G&L). These assessments are not fully shared by the business consultants in these areas, especially in the case of Y-Development and Crisil.
4. At the other extreme, the organizations that have decreased their economic and managerial capacities are Vinos Lautaro (LatAm, food), Tara (Asia, G&L) and MAs Tropical (Asia, food). Although this assessment is partially shared by the business consultants, they emphasise that the decreases are small and linked to contextual problems. MAs was affected by financial constraints and poor export marketing performance.
5. Some of organisations are basically very stable, like Unte and Craft Aid, so they show minimal changes in their managerial capacities. The business consultants pointed out that the major changes happened before the EBA (2007).
6. The sample is certainly too small and unbalanced to show a clear pattern by continent, but some interesting tendency comes out. Of a total of 19 organisations, 8 of them are below the average and 11 are above the average of the EBA of 2010. If the entry point is the continent, the EBAs show that out of the 5 Latin American partners in the sample 4 of them are below the average and only one is above but this one is ranked at the top of the EBA of 2010. Out of the 11 Asian partners in the sample, 4 are below average and 7 are above the general average. All the African partners are above average. This could suggest that in the EBA round of 2009/2010 the Asian partners were on average stronger in economic and managerial terms than the rest, while the African partners were more or less average and the Latin American ones were relatively weaker with the exception of Allpa.
7. The conclusion is somewhat different in dynamic terms, comparing the two rounds of EBAs. Of the 5 Latin American partners in the sample, 3 of them are high growers (that is, more than 15% improvement in the EBA scores), one of them is around the average and one of them is decreasing. Of the 11 Asian partners in the sample, only 3 are high-growers and the other 8 show a below-average improvement in their EBAs or even a decrease (3 cases). African partners are also growing below the average of the sample.
8. Points 4, 5 and 6 could suggest a weak pattern by continent. While Asian partners are relatively stronger in economic and managerial terms than their Latin American counterparts, at least reflected by their EBAs, they also tend to improve less. Latin American organizations are weaker but seem to improve their EBA scores faster. African partners seem to be somewhere in-between. This could be explained by a real trend in their capacity building or simply by a statistical bias (the higher an organisation starts, the less ground there is for improvement). The data is simply too little to tell.
9. A similar analysis was done per sector. In this case, there were 9 organisations in G&L and 10 in Food. Both sectors show a very similar diversity between strong and weak organizations in terms of economic and managerial capacities. Among the G&L partners, 5 have an above-average EBA in the second round (2009-2010) and 4 have a below-average EBA in the second round. Among the Food partners, 6 have an above-average EBA in the second round and 4 have a below-average EBA in the second round.

9
10. In dynamic terms, the pattern is slightly favourable to the G&L organizations, at least in terms of their managerial capacities, with no direct implication on how much they sell. Five of the G&L partners have improved rapidly and four did not. Of the 10 Food partners, only 1 shows a significant improvement in the EBA and it is a new organization that has grown exceptionally fast. Looking at it from another angle, all but one of the six rapidly improving organisations in the sample are in the G&L sector, while only one is in the Food sector. At the same time, most of the organizations whose EBA scores are decreasing or hardly improving at all are in the Food sector.
11. The business consultants highlighted that this does not correspond with their position in the market. Indeed, the sales and profits of G&L have been falling in the last year, according to the BMFS. The turnover in G&L has fallen an average of 9.57% in 2009 in comparison to 2008, while Food has grown 31.76% in the same period. It is not really a contradiction. Indeed, the improvement in managerial capacities measured by the EBA does not imply that sales will grow at the same pace in the market. There are many variables that contribute to growth in turnover and profits, like external factors, climate, and changes in tastes. An organisation can become stronger and yet not necessarily sell more every year. Moreover, what comes out from the analysis of the sales is a strong instability, a point taken up in section 4 below.
The second level of analysis using the two rounds of EBAs focused on the economic and managerial areas in which these organisations made progress. The information is summarized in Table 3, in which the partners are sorted by the total score in the second round EBA.
Table 3. EBA analysis in various economic and managerial areas
Partner Region Sector Was strongest Was weakest Main improvement
Main decline
1 Allpa Lat Am GL Mkg Q all areas none
2 Sasha Asia GL ICT, Fm, Mkg Q Most areas Fm
3 Unte Asia food Mkg, Mng Q, Fm, ICT Q, Fm, ICT None
4 Yak &Yeti Asia GL Q Mng, Mkg Mkg, Mng Q
5 Turqle Africa GL ICT Fm Fm None
6 Samroiyod Asia food Mng Mkg, Fm, Mkg, Fm None
7 Y-dev Asia GL None Mkg, Mng Mkg, Mng, Q None
8 Craft Aid Sugar Africa food Mng, Q, Fm Mkg Mkg Mng
9 Goue Valley Africa food ICT Fm Fm Mkg
10 MAI Asia GL Q Fm, Mkg, Mng Mkg, Mng, Fm None
11 PFB Asia food ICT, Mng, Mkg Fm, Q Mkg, Fm None
12 Sang Arun Asia GL Q ICT, Mng Mng, Fm, Mkg None

10
13 Crearte Lat Am GL ICT, Q, Mng Fm, Mkg Mng, Mkg, Fm None
14 MAS Tropical Asia food ICT, Mng, Mkg Fm Mkg Q, ICT
15 Tara Asia GL Fm, Q Mng, Mkg None ICT, Fm
16 Crisil Lat Am GL ICT All others Fm, Mkg, Q ICT
17 Amdo India Asia food Q All others All areas None
18 Copiasuro Lat Am food Mng All others Q, Fm, Mng None
19 Vinos Lautaro Lat Am food Mng, Mkg, ICT Fm Mkg, Fm Mng, ICT
Mng: Management. Mkg: Marketing. Q: Quality. ICT: Information Technologies. Fm: Financial management.
1. The information in the two rounds of EBA by area of action shows that Fair Trade Original works with heterogeneous partners. There does not seem to be clear criteria on what makes an organization eligible to become a partner in terms of their economic or managerial strengths and weaknesses. At the same time, there does not seem to be a significant difference by region or by sector in terms of the managerial areas in which organisations are weak/strong or in terms of how they evolve. As explained by one of the business consultants, the potential of the product and the compliance of the fair trade principles are taken into consideration. After that, the intensity of support given depends on a need analysis, on a case by case basis.
2. The area in which most weaknesses are detected is in the Financial Management (only three partners have it as their main strength, while eleven show it as their main weakness). It is followed by Marketing (only six organisations identify it as their main strength, while ten find it a main weakness). In the areas of General Management and Quality, the number of organisations that have these as their main strength and weakness, respectively, is balanced. The area of ICT comes out relatively strong (eight partners consider it their main strength and only four highlight it as their main weakness). This suggest the most “typical” partner of Fair Trade Original in the first round of EBAs was weak in its financial aspects and its marketing, had products of reasonable quality and an acceptable general management, and was rather strong in information and communication technologies.
3. The evolution in time is almost always positive and by the second round of EBAs most partners have improved. What is also remarkable is that the areas where there is the most improvement are also those where most weaknesses were detected in line with the needs’ assessment of each partner. In Marketing, for instance, fourteen organisations have experienced an improvement, while only one has deteriorated. In Finance, thirteen partners have made progress and only two have not. In the areas of general Management and Quality, the number of organisations that have improved is smaller but equally significant: eight partners have better management and six have better quality, while only two have worsened respectively. The progress is less in ICT, which was identified as the area in which improvement was less needed. The second round of EBAs hence shows that the typical Fair Trade Original partner has improved precisely in the areas where the major weaknesses were detected (marketing and finance) but there has been significant progress in management and quality too.

11
4. The improvement in the economic and managerial areas of these organisations could mean that Fair Trade Original and its partners can make a precise diagnose of what kind of support is most needed and concentrate their work there. However, it could also mean that the partner organisations work harder to make progress where they interpret that Fair Trade Original is demanding it the most. One of the business consultants pointed out that partnering with Fair Trade Original explains this bias.
4. Analysis of financial and economic performance indicators
The data from the Economic and Business Assessment was then crossed with some financial and business indicators, which were obtained from the BFMS series of documents. These indicators were available for only some of the 19 organisations analysed so far. The data corresponds to the last three years of operations, which was highlighted as a weakness of the approach. Two of the business consultants interviewed for this study pointed out that the last two years were affected by an economic crisis that hit some of their partners quite hard in terms of sales and profits. This was especially strong in the G&L sector in 2009. With this limitation in mind, the economic performance of these organisations was considered in terms of five indicators: the turnover, profits, the number of clients, the number of farmers or workers and the weight of Fair Trade Original in the total sales of the partners. The last indicator was chosen on the assumption that as organisations become stronger they reduce their dependence on sales to Fair Trade Original.
1. The data shows that the revenues have increased in seven of the nine organisations for which there is information available. The extreme case of increase is Copiasuro, which doubled its revenues in just two years. There are two organisations for which revenues have not increased or have gone up & down, leaving them more or less at the same level as three years ago.
2. The number of clients –both in the fair trade as in the mainstream market- has also experienced a positive trend. In all but two cases there has been an increase in the amount of customers. There are two cases in which this has remained stable and for which an increase in the amount of clients was seen as unlikely because of supply restrictions. One of the partners (Amdo) is increasing its sales in the local mainstream market, which was considered as a sign of business strength.
Table 4a. Business and Financial Indicators, 2006 -2009
Partner Region Sector % change turnover
% change profits
Change # clients
Change # workers/ farmers
FTO in total sales
Allpa Lat Am GL -2.6 -93.1 Down 9 clients
Up 8 Small
Sasha Asia GL -17.5 -16.3 Up 7 clients
Up 5
Unte Asia food Small
Yak &Yeti Asia GL -28.7 -7.0 Up 3 clients
Up 35

12
Turqle Africa Food 8.8 69.5 Up 2 clients
Up 50 Very big
Samroiyod Asia food Up ?
Y-dev Asia GL -28.3 -70.5 same
Craft Aid Sugar Africa food 46.7 45.0 Up 6 clients
Up 2 small
Goue Valley Africa food Up ? Small
MAI Asia GL 16.1 22.4 Up 4 clients
Down 5
PFB Asia food 62.3 350.2 Up 4 clients
Up 193
Sang Arun Asia GL
Crearte Lat Am GL 58.8 -456.6 Up 4 clients
Up 50
MAS Tropical Asia food Same Up 16 Small
Tara Asia GL Up 2 clients
Up 14
Crisil Lat Am GL 8.03 141.15 Up 160 clients
Down 7
Amdo India Asia food 108.5 Up 1 client Up 1 Small but growing
Copiasuro Lat Am food 66.8 -67.7 Up 1 client Up 2 Small
Vinos Lautaro Lat Am food
Fair Trade Original as % of their sales: “small” = <30%, med = >31% to <70%, large = >71%
(1) Grew substantially un 2010
3. The dependency of the partners on Fair Trade Original for their sales is generally low (less than 30% of the sales), except for two cases. Those are considered rather special partners and there are already some efforts to diversify their client base to other (mainstream) customers. However, most of these organisations do work with other fair trade customers. Therefore, the low reliance on Fair Trade Original can be coupled with a high dependence on other fair trade customers. Although it represents some degree of client diversity, it is still restricted to the specialised fair trade market and away from mainstream markets.
As pointed out already, the comparison of progress in managerial terms, captured by the EBAs, and the progress in turnover, profits, number of clients and number of farmers or workers seem to show different pictures. Organisations that have made significant progress in managerial terms, like Allpa or Y-development, have not been doing well in their sales and turnover. For example, Allpa has improved its organisational and business indicators by 16% (EBA 2007 to EBA 2009), while at the same time its turnover has decreased 2.6% between 2008 and 2006, the profits have diminished 93%, the number of clients has fallen from 35 to 26 and the number of workers has increased from 63 to 71. In general, the sales of several organisations in G&L have fallen. What is equally remarkable is the magnitude of the losses and gains in terms of percentages. An organisation like Allpa, for instance, has lost almost half of its profits between 2006 and 2008. In the same

13
period, Crearte, also in G&L and in Latin America, has seen its turnover rise 60% while its profits fell 456%. Crisil, a third organisation in G&L and in Latin America has seen its turnover increase 8% while the profits more than doubled. The figures for the organisations with two rounds of EBAs are shown in Table 4b.
At first sight the financial information seems to elude any pattern: some grow, some shrink, and there is no evident relationship with the strengthening of the managerial capacities. As a matter of fact, such instability is quite normal in the Third World. Businesses (social as well as private enterprises) tend to show very large rates of growth, unseen in the industrialised countries, followed by years in which turnover and profits plummet. The pattern of these organisations in the South, in fact, is their instability. Dealing with instability is one of their main survival skills, quite necessary to ensure they stay in business, although this is a skill that somehow contradicts, or at least differs from, most of the conceptual consensus on how organisations should be managed.
Once instability is accepted as the strongest pattern in the financial figures shown below, it is not difficult to see why turnover and profits do not necessarily go along the progress in business capacities. Most suppliers and buyers of these unstable organisations are equally unstable and face similar problems: unexpected changes in institutions and rules, abrupt and unexpected changes in government policies and macroeconomic policies, slumps in commodity markets, natural disasters, interruption of various inputs, and changes in consumers’ preferences.
Table 4b. Basic financial and economic information
Revenues, euros Profits, euros Nr. Clients Nr. farmers or
workers
2006 2008 change 2006 2008 change 2006 2008 2006 2008
Allpa 1.230.468 1.198.637 -2,6% 57.747 3.973 -93,1% 35 26 63 71Sasha 1.216.072 1.003.708 -17,5% 109.446 91.654 -16,3% 26/11* 33/35* 106 111Unte Yak &Yeti 651.597 464.300 -28,7% 19.548 18.173 -7,0% 26 29 20 55Turqle 1.132.034 1.232.007 8,8% 68.325 115.809 69,5% 6 8 360 410Samroiyod Y-dev 658.444 471.978 -28,3% 67.781 19.988 -70,5% 15 15 30/66*Craft Aid Sugar 1.065.495 1.562.994 46,4% 138.259 200.415 45,0% 36 42 29Goue Valley MAI 1.068.814 1.241.330 16,1% 213.763 261.690 22,4% 22 26/5* 30 25/21* PFB 799.769 1.298.340 62,3% 15.785 71.071 350,2% 2 6 376 569Sang Arun 1.173.465 26.557 5 Crearte 110.391 176.448 59,8% -4.142 14.771 -456,6% 6 10 350 400MAS Tropical 971.840 3.948 3 3 120 136Tara 2.957.487 88.725 33/17* 35/25* 42 54Crisil 494.444 534.125 8,0% 25.067 60.450 141,1% 3 (300) 4 (460) 120 113Amdo India 38.586 80.435 108,5% 375- 71 2 3 16 17Copiasuro 167.816 279.978 66,8% 12.600 4.072 -67,7% 4 5 94 96vinos Lautaro
** Nr. Clients mainstream and FT

14
An additional point is the role of fair trade markets in hampering this instability. Fair trade markets are also irregular, subject to changes in consumers’ tastes and priorities, the macroeconomic crisis, etc. It is to be expected that in an economic downturn Dutch consumers would demand less from Fair Trade Original, for instance, than when the economy is booming. Buying more expensive ceramics or jewels in the fair trade market may become a luxury choice. This same instability is transferred to Fair Trade Original, that sees its own turnover decrease, and this translates in lower orders from their organisations. In terms of the two instruments used by Fair Trade Original that were mentioned in the first paragraph of this study (trade and capacity building) it becomes clear that trade can help but it is not enough to stabilise the sales of the partner organisations.
5. Social, environmental and business improvements
The documents that have been studied so far have focused on the economic and business aspects alone. However, as a development organisation, Fair Trade Original also seeks to improve the social condition of producers and their workers and the environmental practices of production. Both dimensions of progress do not necessarily go together. Some organisations make progress in social terms, while they are unable to improve their business and economic indicators, while others may earn larger profits without necessarily offering their workers better conditions or adopting better environmental practices. In the first extreme are the “traditional partner organisations”, mostly NGOs that have ventured in competitive markets at a later stage. In the second extreme are the private firms that got acquainted with the principles of fair trade rather recently. Possible trade-offs between these two dimensions were discussed with the local consultants and the Fair Trade Original business consultants during a meeting on October 1st.
During the meeting, the consultants were given an assignment. The objective was two-fold: a) to compare the information of the consultants with the documents listed above, for each one of the organisations Fair Trade Original works with, and b) to gather information towards the selection of cases for further study. In view of the second objective, the choice was made to include all organisations and not only the ones for which there were comparable rounds of EBAs, BFMS and other evaluations available. Consequently, the organisations reviewed in this exercise were considerably more than those discussed above, for which there were two rounds of EBAs available.
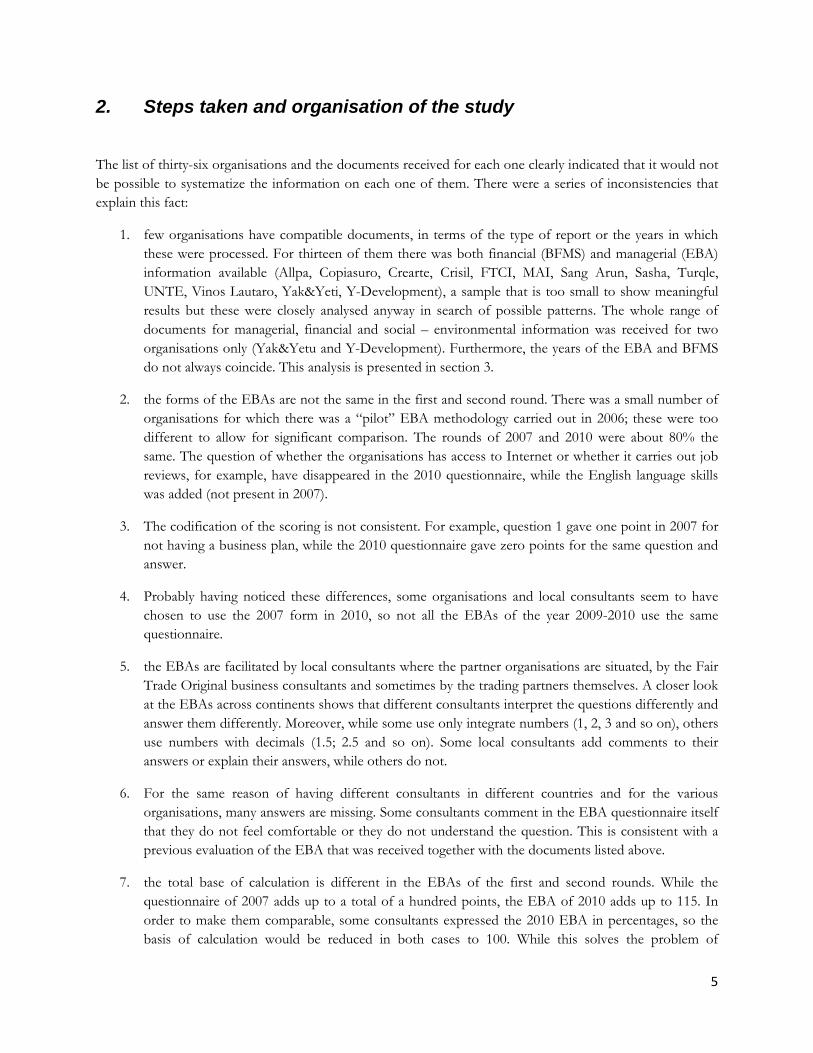
The exercise was the following. Each one of them was given a card with the names of the organisations they knew and worked with. They were asked to decide whether there had been significant change in those organisations. If there was no significant change, they would place the card with the organisation’s name in the one flip chart, which was divided in two zones: “was weak and stayed weak” and “was strong and stayed strong”. The resulting first flip-chart is reproduced in Table 5 (discussed organisations in red). If the organisations had experienced significant change, the consultants were asked to place the cards in a second flip-chart, which was divided in four zones: “worsened in both social and economic terms”, “better in social terms but no change in economic terms”, “better in economic terms but no change in social terms” and “better in both dimensions”. The resulting flip-chart is reproduced in table 6 (discussed organisations in red), which is a fully subjective assessment, as described.
15
Table 5. Organisations with no change
Started strong, stayed strong
Apicoop Chile Carmien Tea
Average, no change
CAI Campesino,KCU Tanzania Manos Vinos Lautaro (Chile)
Started weak, stayed weak
Crearte FTCI
Phased out KNCU Eswatini
The exercise confirmed what the evaluations commented above already suggested, that most organisations experience significant changes in their capacities once they start working with Fair Trade Original. The ones that experience no changes at all are a relative minority.
The second flip-chart turned out the results reproduced in table 6. This assignment to explore the consultants’ perceptions of the partners’ evolution shows various points.
1. There are a few organisations that have worsened since they started working with Fair Trade Original. According to the consultants that participated in the exercise, the main reasons for this were a) contextual factors like hurricanes and other natural disasters, b) internal problems and conflicts within the organisations that Fair Trade Original could not overcome and c) a longer term economic deterioration that the support of Fair Trade Original was unable to revert.
2. The number of organisations that have improved in social terms alone is the same as those that show progress in economic terms alone. Quadrants 1 and 4 show a mix of regions and sectors (Food and G&L). Most of the organisations that have improved in social and environmental terms alone (quadrant 1) are traders or private enterprises that were already relatively strong in business terms (there are some exceptions to this). The intervention of Fair Trade Original with them did not make such a significant impact in their economic performance, but has increased the inclination of these organisations to include social and environmental goals in their mission. This is, after all, what the fair trade principles aim at.
3. A similar trend but in opposite direction is observed among the organisations in quadrant 4. The majority of these organisations are social enterprises (cooperatives, farmers associations, and other firms that include social goals in their mission), although there are also some exceptions to this. For these organisations the partnership with Fair Trade Original translates into a better economic and business performance, rather than better social conditions or environmental practices.

16
Table 6. Partners’ social and economic progress1
1
Orgs got stronger in social/environmental terms
Goue Vallei/Citrusdal (private) Yak & Yeti (private)
Granor Passi PFB (social enterprise)
Kasinthula (private) Visahakit (min. change)
Tara (min change) (private) Turqle (min change) (private)
2
Orgs got stronger overall
Allpa (social ent.) MAI (social ent.)
Craft Aid (social ent.) SangArun (private ent.) Samroiyod (social ent.)
Amdo (private ent.) MAs Tropical (min progress) (social ent.)
Y-development (min progress) (social ent.)
3
Orgs. got weaker overall
Eswatini Aarong
Mitra Bali
4
Orgs got stronger in business
Crisil (private ent.) Copiasuro (social ent.)
Sidamo Ankole
Mauritius Sugar Syndicate (social ent.) Sasha Dhaka
Ankole (min. progress) Sidama (min progress)
4. Finally, quadrant 2 shows a number of organisations that have improved both in social and economic terms. This group includes both private and social enterprises, and very different scales of operations. None of these cases is dependent on Fair Trade Original for their sales, some get about half of their revenues from various fair trade buyers and about half of their sales centre on the mainstream market. In all cases there have been strong improvements in marketing and quality, mostly with the support of Fair Trade Original. Two words are used consistently among both local and Dutch consultants to describe this group: “entrepreneurial” attitude and “open mind” to changes and suggestions that come from the fair trade partners. It should be noted that all of these have had two rounds of EBA and a significant number has also collected financial and business indicators. It raises a question on causality: have these figures helped these organisations to improve their overall performance? One of the business consultants pointed out that at least they have raised the awareness on the importance of business performance.
To wrap up, it seems Fair Trade Original is particularly good in “balancing acts”, that is the compensation of social and economic goals. On the one hand, those organisations that are stronger in economic and managerial terms (mainly private enterprises) seem to improve their social aspects when they start trading
1 Business consultants and local consultants disagreed on placing organizations in one or other quadrant.
So
cial
per
form
ance
Economic performance (EBA, Financial indicators)

17
with Fair Trade Original and in compliance with its conditions. The ones that do achieve these results appear in quadrant 1. There are some cases in which those private enterprises embrace corporate social responsibility policies and become benchmark cases in their regions, creating a “demonstration effect” that results from the intervention of Fair Trade Original but probably cannot be measured adequately. The exceptions are those firms which were weak in managerial and economic terms to start with and which, according to the reports of the consultants, are less open to make changes in terms of the working conditions like workers’ participation, etc. Those organisations appear in quadrant 4. On the other hand, there are organisations which are already quite good in social terms (mainly cooperatives and farmers’ associations) and which improve their economic and business performance. Fair Trade Original seems to play a relevant role in their capacity building and institutional strengthening in various areas across the whole organisation. Finally, quadrant 2 presents a list of organisations that have made progress in all dimensions. There does not seem to be any common component across them, except for their attitude of “entrepreneurship” and “open mindedness” of the management.
6. Beyond facts and figures
Three business consultants were finally interviewed to find out more about the interventions of Fair Trade Original with these organisations. Their perceptions of some of the organisations under analysis are described below, sorted by the subjective evaluations of the business consultants on the support given by Fair Trade Original and the progress the partners have made. Clearly, the order is necessarily arbitrary. Further details have been obtained from the organisations’ websites.
1. Allpa (quadrant 2 in table 6: overall progress) was described as a success story. It is a social enterprise with a strongly entrepreneurial management, a well-diversified but reasonable scope of products, and a decisive presence in mainstream markets. It operates as an NGO managed by a group of social workers who buy from a number of medium to private producers. Although Allpa would have survived without Fair Trade Original, the main advantage of the partnership is the capacity building it got. Allpa seems to have implemented the changes suggested by first EBA and scores the highest EBA available in 2010. Allpa would not have been able to afford it on its own and its product development department survives mainly thanks to international cooperation funds. Fair Trade Original has given Allpa enough time to learn and take risks until it could gain a place in the mainstream market. The second advantage for Allpa of the partnership with Fair Trade Original is that it stabilizes the sales when there is an economic crisis and demand in the mainstream markets declines, as it happens at present. The BDP 2007-2011 that came out of the first EBA were translated by Allpa into several action plans. The management has improved by incorporating routines of planning, monitoring and evaluation, etc, by following the guidelines of the ISO 9000:2008 to standardize processes. It has formalized its HR management, allocated experts in ICT, and is in the process of borrowing work capital from low-cost providersAllpa has recently reduced the number of products substantially, so the average production costs has gone down. The case of Allpa shows that the EBA has effectively identified a series of areas on which improvement was necessary. The EBA 2007 showed that Allpa was already a strong organization in business terms but it was unable to maintain a regular level of turnover and profits; this was taken up as a goal to achieve by 2010 (objectives M1 to M3) of the BDP 2007-2011. The financial figures of the period 2007-2010 show that this specific goal has not been met. It also shows that part of this was due to the low

18
capacity of producers, which was taken up as an action plan to work on capacity building among the suppliers. In terms of FT principles, Allpa positioned itself strongly in terms of working conditions, corporate social responsibility, as a member of WFTO, and accepting other codes of conduct requested by buyers. The document that shows the effective implementation of the BDP is the EBA 2010 and the items are not always clearly linked. No further documents were received on their compliance with FT principles. The turnover of Allpa has slightly dropped, while the profits have collapsed 93% between 2006 and 2008. The amount of clients has dropped too, although it has increased its number of workers.
2. Samroiyod (quadrant 2 in table 6: overall progress) is considered a success story in terms of job creation, economic growth and innovativeness to implement changes. The EBA 2007 explains that the Visahakit group of producers was only launched in 2007 to supply fresh pineapple to the Samroiyod factory, in turn established in 2005. Since it was new, the mission, business plan, marketing plan and other planning documents did not exist. It is relatively new to the principles of fair trade but as a company that springs from a solid farmers’ co-operative (Visahakit), it is fully aligned with its principles. Samroiyod is the factory that processes the pineapples grown by the 600 members of Visahakit, out of which only a few were FLO certified but the goal was to have them certified at the earliest occasion. In 2009 there were 45 certified farmers and the number was expected to double by 2011. No documents on their compliance with social and environmental FT principles were received but the 2007 EBA points out that Samroiyod has a strong reputation in co-management and as a one of the “best co-operatives in Thailand”, according to the local consultant, with the participation of community members, environmental protection and low employee rotation. No BDP was received for this organization, but the second EBA shows progress in several areas. For instance, by 2010 the organization had clarified its target market in the high quality (high price) and fair trade niche markets and prepared informal marketing plans accordingly. There is also a number of areas in which there has been no progress, like no written business plan, marketing plan or mission, and no procedures to make more thorough use of the information it generates. It has received support from Fair Trade Original to train its members on hygiene, food safety and environmental practices, which has resulted in HACCP and SGC certifications. It has a good balance between mainstream and other fair trade customers but its main weakness lies in its high indebtedness. No further documents were received on their compliance with FT principles.
3. MAI (quadrant 2 in table 6: overall progress) was also described as a success story. The organisation was launched by a group of social workers with a set of social goals for youth and has quickly developed its entrepreneurial capacities. The TMF document (2006) and the first EBA (2007) indicated that MAI did business mostly on an informal basis. The information reviewing products and clients was generated but hardly ever used. Various ideas to improve marketing, for example, were generated within the organization but these were hardly ever written. It did not see product promotion as an activity worth investing in, while it did work on product development. Although no evaluations of their compliance with FT principles have been received, the EBA 2007 and TMF 2006 point out that MAI had from the start various FT features like 1) empowerment of women, starting by income and a general stimulus for women to do business on their own, family planning and the management of the household finances; 2) reducing child labour, using the government support for children schooling; 3) reducing rural – urban migration incentives, by creating employment and income generating opportunities in the villages; 4) supporting better working conditions at the level of the producers. At that time the TMF document also pointed out that a vision was developing in

19
terms of marketing, management, and organizational development that became clear in the many discussions. Its entrepreneurial strength was substantiated by some investment in looking forward (innovate before the boom of Vietnamese products was over) and their willingness to accept advice from outside the organisation. The BDP 2007-2010 generated for this organization reflects this evaluation and stresses the need to formalize and structure it clearer, create transparent procedures, use written information for marketing purposes, and incorporate the routines to innovate, plan, monitor and evaluate. The EBA in May 2009 shows significant improvements in these areas. It has formalized various procedures, prepared a written mission statement, defined job descriptions on paper, and clarified the legal structure and the contractual relationships with producers. In contrast, other management tools such as a written operational plan were not prepared and there were no mechanisms to monitor the plans regularly. It is still dependent on the fair trade market, with 90% of their total sales, but it is working on finding new customers in the mainstream market. Fair Trade Original provided support in a wide variety of areas, from product design to general management, financing to participate in fairs, and introducing ICT to improve the information flows. The partnership has a wide coverage of support over almost two decades, which has made MAI quite dependent on Fair Trade Original in terms of capacity building as well. Both turnover and profits had increased substantially between 2006 and 2008, around 16% and 22% respectively, while the number of clients and workers expanded as well.
4. SangArun (quadrant 2 in table 6: overall progress) was described as a success story in terms of the changes that took place since it started its partnership with Fair Trade Original and job creation. It is a private family-run company with 220 workers and was one of the producers of Y-Development in Thailand with which Fair Trade Original started working directly. At the beginning of the partnership Fair Trade Original co-financed a consultant that generated important business and social changes within the organization. It has also adopted CSR practices that have become a benchmark in the region. Fair Trade Original has supported it in terms of quality, marketing, fair visits, product design, and training in financial management. SangArun was relatively strong in short-term management and marketing already at the time when Fair Trade Original started working with them. For instance, although it is a small family-run enterprise, it visited two fairs a year with its own resources (Tendence and Ambiente each year) and prepared a separate marketing plan for each one of them. The owners meet on a daily basis to discuss production matters and once a month with workers. They kept an open minded attitude towards the demands of the clients for new designs, but they did not do pro-active product innovation. In turn, the first evaluations stress that SangArun was weak in strategic issues, long-term planning and anticipating market changes. For instance, it had no mission statement, no business plan, insufficient capacities in terms of reading balance sheets and hardly any formalized arrangements. No BDP was received for this organisation but the EBA 2010 shows considerable progress. The organization still has no written mission statement but was working on a written strategic plan, marketing plan and some incipient operating plans. Some degree of longer-term monitoring was also being practised, the organizational structure had become clearer and it was drafting plans to increase training to workers. Although it seems strong in keeping loyal long-term customers, it shows less ability in finding new ones. The financial information of the BFMS shows that fair trade channels went down from 35% of the sales in 2007 to 13% in 2009. The gross profit trend was also favourable and went from 30.6% in 2007 to 34.9% in 2009. The EFTA social audit evaluation showed that their social and environmental standards were acceptable, with a majority of green lights, among which there were several examples of social improvements for the workers, no

20
employment of children, association of the workers in a “welfare committee” and provisions of special services for the workers’ community. There were very few yellow lights to be improved in term of the FT principles, like a number of health and safety standards that had to be improved, keeping records of accidents, and a stronger promotion of FT principles among workers. The result of this evaluation was that SangArun hired a HR consultant to foster the training of workers and improve health and safety standards.
5. Copiasuro (quadrant 4 in table 6: better in economic terms) was described as a success case both in economic and social terms. In 2007 Copiasuro was selling honey for prices below its break-even point. It was losing money even if it had long-term committed customers in the FT niche and a strong demand for its product. The 2007 EBA pointed out that Copiasuro did not have a strong tradition of planning, monitoring, and evaluation. There were hardly any long-term strategic plans and the information from the yearly balance statements, for instance, was not used. This weakness was translated into an action plan BDP 2007-2010 and the EBA 2010 showed that a reporting system to keep updated records, inform the members, and further use the information in the longer term was starting to be developed into a detailed operational plan and written business plan. Another weak area was in human resources management, wages and training; as a matter of fact the EBA 2007 highlights that there were no HR policies at all, mainly justified by the financial situation of the cooperative. In spite of that, the commitment of the employees with the organization was considerably high. By the 2010 EBA, little progress had been made in this area. In relation to marketing, the EBA identified the need to diversify the scope of products offered and increase their value added, in spite of the relatively limited degree that this can be done with honey products. It also transpired into an action plan and by 2010 Copiasuro developed the capacity to offer single-flower, organic and mountain honey, although the quality is still described as “not outstanding” by the local consultant. In short, the planning, monitoring and evaluation processes had been improved, but not to the extent that Fair Trade Original would have expected (for instance, updating written plans regularly). No information on FT compliance was received, but the business consultant considers that it is a cooperative that has achieved both economic and social roles and is hence fully aligned with the principles of fair trade. It has doubled its revenues in just three years, although mainly due to the high prices of honey and not because of increases in volume. It sells all its production to fair trade buyers. The partnership with Fair Trade Original has a series of advantages. For example, the only training it gets and can offer its members is the one funded by Fair Trade Original. The management was described as highly entrepreneurial but Copiasuro is facing problems of scale, innovation and is exposed to adverse climate changes. Even so, it managed to become ISO9001:2008 certified. Between 2006 and 2008 the turnover increased 67% but the profits dropped 67%. The number of clients and farmers has expanded slightly.
6. Craft Aid (sugar) is a rather stable case that appears to have achieved a considerable impact on its target population of poor and handicapped persons. Craft Aid is mainly a social enterprise with a strongly entrepreneurial management, with sugar, textiles, and handicrafts divisions. Fair Trade Original only buys sugar from Craft Aid, so only the sugar division is analysed here. Most of the intervention by Fair Trade Original took place before 2007, so the improvements achieved are not fully caught by the EBAs because these took place later. Both the business consultants at Fair Trade Organisation as well as the local consultants emphasise, however, that Craft Aid has changed substantially since the partnership with them has started. The first EBA (2007) found that Craft Aid still needed to progress on the formalisation of its processes and procedures, like writing a marketing

21
plan or longer term planning. In turn, it was a strong organisation that complied with HACCP standards, trained its workers and kept loyal long-term buyers and for which the mainstream markets represented two thirds of the sales volume in 2007 (however concentrated in one large customer). The actions then recommended in the BDP 2007-2010 included the implementation of a developmental plan for farmers and the collection of updated information. It was active in searching for customers and willing to invest its own resources in further improvements. The EBA 2009 was poorly filled in and showed no changes in the scores. Both turnover and profits had improved substantially between 2006 and 2008 (around 50% respectively), mainly due to strong market demand and increasing prices. The number of clients and workers expanded slightly. No further information on FLO compliance has been received.
7. Turqle (quadrant 1 in table 6: better in social & environmental terms) was described as a stable case, but in the sense that it was already strong and entrepreneurial when it started cooperating with Fair Trade Original. It is an umbrella organisation of SME producers that employ a total of 600 workers (5 to 120 workers per enterprise). It is managed by a group of entrepreneurs and it started operating as a trading company, buying inputs and selling final products. Turqle trading described itself as the “compassionate interface between the markets in the North and the producers in the South” and it supports the producers to develop products and identify new markets and buyers, facilitates certification processes, supports capacity development for both social and business objectives and handles all sorts of logistics. It was basically bred as a social enterprise by a small group of committed owners - managers. The 2007 EBA identified the dependence of Turqle on Fair Trade Original for strategic planning inputs, for instance seen in awaiting the launch of new products by Fair Trade Original. A more pro-active marketing attitude was considered necessary, as well as diversifying to mainstream clients (only 20% of their sales). The BDP that came out of this diagnose was consistent: improve marketing efforts, maintain quality (seen as high), retain HACCP and FT standards, and pay closer attention to the HR policy. The social audit evaluation shows the need to improve and prepare a written policy in H&S. It would have survived without the support of Fair Trade Original, although the partnership has allowed Turqle to further its social goals, like sending the workers’ children to school, doing advocacy work, training workers on planning, safety and hygiene (HACCP processes). The organization relies heavily on a number of fair trade buyers and is considered a “typical fair trade organization” in terms of its social commitment. Between 2006 and 2008 the turnover increased 8.8% while profits went up 70%. The number of clients and workers has expanded significantly. No information on compliance with FT standards was received.
8. Y-development (quadrant 2 in table 6 but with little progress) is considered a rather average case in both social and business terms. It is the local counter-part of a large international development organization from which it gets financial support, so it has a lower incentive to look for new clients and outlets or train its producers. As such, it is also perceived as rather bureaucratic and inflexible. The 2007 EBA described Y-Development as a strong self-help organization that sought to help producers and villagers in Northern Thailand. It sold most of its production to FT clients, while a marketing strategy to increase the sales to the mainstream market was basically inexistent and there was no dedicated marketing specialist within the organisation. In the EBA 2010 the number of mainstream clients had increased only slightly and no marketing expert had been hired. In turn, in 2007 the level of formalization and use of management tools was seen as in need of improvement, some of which had happened by the time of the 2010 EBA. No major issues were detected in relation to the logistics, although it could benefit from increasing the production capacity of its

22
suppliers. By the 2010 EBA this had partially improved, although some new problems had appeared as a result of the economic crisis. In social terms, the 2006 social audit showed a very small number of “orange light” areas that Y-Development needed to improve. In capacity building, for instance, there was no plan for training staff and workers, with minimum wages and no plan to improve producing conditions. There were no cost calculation procedures, so it was not possible to establish fair price programmes that could monitor fulfilment and progress. The 2009 EFTA found that Y-Development had developed the capacity building plan for the suppliers, providing training for small producers and it has started providing training on price breakdown for its suppliers. The list of non-compliance areas was rather minor: keeping records of H&S accidents, monitoring the wages paid to workers by the suppliers and larger efforts to reduce waste. The turnover had dropped 28%, while the profits fell by 70%. The number of clients and workers was rather unchanged.
9. Goue Valley (quadrant 1 in table 6: better in social & environmental terms) was described as an average case with stable sales and evolution. It was introduced to the fair trade principles by the local development agency in South Africa and within the black empowerment policies BEE. It was established as a cooperative in 1957 but 50% of it was bought by a private entrepreneur and supporter of FT. The change of ownership occurred in 2007 and basically meant changing from a cooperative to a private enterprise structure. It buys grapes from a small number of large suppliers to produce wine, three of which and the factory are FLO certified. The five major suppliers provided 65% of the grapes. It has reached an unstable balance between mainstream and fair trade customers, and it is only partially open to taking capacity building opportunities from Fair Trade Original. It has received its support in terms of training and the certification process of the farms and faces a strong market demand. It pursues the diversification of its product base, with the goal of promoting the local development of the region of Citrusval. The EBA 2007 reflected the doubts and uncertainties of the new ownership situation. Some weaknesses were observed on a more structural level, like the need to develop a business and marketing plan and get FLO certification of more suppliers of grapes. It was dependent on the fair trade niche market for 80% of its sales. FTO has also supported Goue Vallei through workshops on marketing and export. Time did not permit a full EBA to be carried out in 2010 but various issues could be re-evaluated in consultation with the financial manager. The EBA had hardly improved, with slight positive changes at the financial level, passing from a high level of expensive debt to a lower level of indebtedness. No evaluations on FLO compliance were received but the comments in the BDP 2008 highlight that the cellar workers did not identify the benefits of FT enough, as there were no additional benefits or services like health, day care and education. The workers were becoming more involved in the organisation’s decision as part of the BEE framework.
10. MA’s Tropical (quadrant 2 in table 6 but with little progress) was situated in the group of average to successful cases. It is organized as a producers’ association, fully aligned with the principles of fair trade. It has not grown significantly and it has done limited efforts to find mainstream new clients. Fair Trade Original has facilitated a study that showed there was a potentially interesting mainstream market for some of its additional products, but it took a long time to introduce changes. It has a large domestic market but depends on fair trade channels for export. A challenge has been ensuring a standard quality and best practices across its members. The main areas of support are food safety, HACCP, quality improvement and general training of workers. It is considered too big as an organisation, sometimes lacking focus and ambition.

23
11. Amdo India (quadrant 2 in table 6: overall progress) is still a struggling case, although with great sympathy from the Fair Trade Original and local consultants that praise the progress this company has made. It is a small private enterprise that is only making a small profit and its financial sustainability is not secured yet. Fair Trade Original has been supporting them since 2001 and hired an in-house consultant to do capacity building, train workers, improve quality and hygiene, and a wide variety of tasks that have kept the company afloat. It is in process of getting HACCP certified. While it is still struggling in economic terms, it has made some interesting progress in improving working conditions and other social aspects. It has also expanded significantly and constitutes a benchmark in the area in terms of its labour relations, in spite of its financial struggles and mixed economic results.
12. Crisil (quadrant 4 in table 6: better in economic terms) was described as an average case, rather resistant to change and with internal tensions among shareholders. It is a private medium enterprise which has improved significantly in business and economic terms since it started its partnership with Fair Trade Original. It sells mainly to mainstream markets (less than 15% of its sales go to fair trade customers like CTM and Traidcraft apart from Fair Trade Original). The fair trade partnerships have given Crisil a series of benefits that go beyond trade, which cannot be assured due to the high export costs of the enterprise. Fair Trade Original supported Crisil to invest in new productive infrastructure, partially formalize managerial procedures and better organize production processes. The procedures of planning, monitoring and evaluation have been insufficiently incorporated and most of them were described as “ad hoc” and short-term in the EBA 2007 and then again in the EBA 2010. It did not develop a specific marketing plan and most of the planning stayed informal or non-existent. The EBA 2007 found that training activities for the personnel were minimum, assessed as necessary and translated into the BDP 2008-2010, but do not seem to have been carried out sufficiently by the EBA 2010. This second evaluation did find, however, that the working conditions have been improved in terms of ventilation and heat. The BDP 2008-2010 adds that Crisil is interested in exporting more, but at the same time the international buyers have indicated irregularities in the quality, which clearly does not help, and that without a marketing plan there are no sustained efforts to improve the marketing of the product. In addition, it had made insufficient progress in social terms and it is quite resistant to social changes, like workers’ participation or in contributing to actions to promote FT principles at a social level. In response to the last social audit document (not received), the organisation is currently busy tackling non-conformities like upgrading its human resources with the assistance of a local consultant. The partnership with Fair Trade Original has also contributed towards easing the internal conflicts of the organization, which is an indirect but important contribution.
13. Yak & Yeti (quadrant 1 in table 6: better in social & environmental terms) was described as a struggling case, mainly because of the context factors in Nepal like the absence of reliable infrastructure and institutional instability that dampen its efforts to achieve more growth. It was described as a very entrepreneurial middle-size firm that has achieved growth in turnover, profits and number of clients, according to the BFMS 2009. The EBA 2007 gives very little information beyond the numerical scores, but according to the responsible business consultant, this enterprise would have survived without the support of Fair Trade Original because it channels its sales mainly to mainstream markets (according to the BFMS 2009 it sells just about 10% of its production to fair trade markets). No BDP was received for this organisation. The main impact of Fair Trade Original’s intervention is observed on the environmental and social aspects. The organization had no previous

24
contact with the principles of fair trade and yet it adapted to them rapidly. The EFTA 2007 evaluation shows only minor non-compliances (yellow lights) in only a few areas and no major non-compliances (orange or red lights). The document concluded that the enterprise creates opportunities for economically disadvantaged producers, but it was unclear what wages the workers received, how many craftsmen work for it permanently, and no written job-descriptions. Moreover, the working hours and wages do not always comply with national laws and ILO conventions and workers do not always receive contracts or wage statements. Finally, the management of resources and waste was not always environmentally responsible. The EFTA evaluation thus concluded was that there was little awareness of how the craftsmen and the workers benefited from fair trade. The business consultant explained, however, that by 2009 Yak & Yeti has been able to prepare a CSR policy that covers workers’ conditions and environmental practices, which constitutes a benchmark in the region. The motivation came mainly from Fair Trade Original, which has also given support to train personnel on quality issues, packing, design and product development that has allowed it to start diversifying its scope of products on offer.
14. Vinos Lautaro (group with no significant changes, in table 5) was described as a difficult case, mainly due to its resistance to change and the generational renovation that it needs to face in the near future. It is a private limited company owned by a cooperative, hence fully aligned with the principles of fair trade, but it operates in a bureaucratic, slow and rather inflexible way. It is fully dependent on the fair trade market (100% of its sales) although not only on Fair Trade Original. The turnover and profits have been increasing since 2004; the gross profit rate went from 27% to 35% between 2004 and 2008, according to the BFMS 2009. No FLO/EFTA evaluation was received, but the BDP for this organisation points out that they are fully committed to the fair trade principles. They use the price premium to feed a solidarity fund from which they give study grants to the children of the workers and farmers and pay training and health care for the workers. The BDP 2008-2010 committed Vinos Lautaro to prepare written business and marketing plans, improve traceability and productive infrastructure and the financial performance of the organisation, among other goals. It also set the ambitious goal of doubling its production capacity from one to 2.2 million litres of wine, 80% of them FLO certified. The second EBA was done at the end of 2008 points out that planning, monitoring and evaluation has not been incorporated as a routine of the organisation, there is no financial planning and Vinos Lautaro is rather unresponsive to the high quality and organic demands of the clients. It focuses on the challenges of generational change (all the members are 50 years and older) and the limitations of the farmers (on average, with 10 hectares of land) to increase the production of grapes; the solution proposed for this is the recruitment of new members and the training of the children in the grapes’ production. The financial situation had improved in relation to the previous years, given that the profits and turnover increased in 2008. However, it relies heavily on Fair Trade Original for capacity building, quality improvement, and farming techniques.
15. Unte was described as very entrepreneurial organisation but eventually a disappointment for Fair Trade Original. It is a producers’ association of tea producers that does not really need the sales to Fair Trade Original to survive. It has a high commitment to social development of the workers and the small scale farmers that work for it, with social programmes in education, health care, housing and pension funds. The labour conditions and payment are described as acceptable in the BDP 2008-2011. However, media reports later cast doubts on whether this was really the situation for all farmers. The EBA 2007 describes it as a very strong organisation in business and economic terms too, with multiple certifications including ISO 9000:2000 and FLO (document not received); in fact

25
EBA gives the maximum scores in most of the items. The BDP 2008-2010 that came out of that evaluation focuses on maintaining quality and certifications, and the only change that would mean an improvement is the strengthening of the farmers’ position. The EBA 2010 shows a similarly strong position. Although Fair Trade Original has invested little in this partner, it has given some advice on a number of issues and most of them were not taken on board, so eventually Fair Trade Original has decided not to invest further resources in it.
The interviews with the business consultants at Fair Trade Original highlight a series of conclusions, which are quite consistent with the documents analysed in the previous sections. Fair Trade Original partners rely heavily on its support, although in different ways. The weakest ones depend on it for sales, capacity building and business development services. The strongest partners do not depend on Fair Trade Original for their sales, but for the benefits in terms of consultancy, capacity building, training, and other business development services that apparently none of them would be able (or willing) to afford on their own. Even in the cases in which organisations obtain less than one third of their revenues from selling to Fair Trade Original, they still see it as an outlet channel when mainstream market demand is in decline. So Fair Trade Original firstly serves all partners for capacity building and business development services while it acts as main buyer for the weaker organisations and has an important support role for those that have other buyers (in either the fair trade or mainstream markets).
7. Conclusions
The analysis of the documents received, in combination with the meeting with the local partners and the interviews with the Dutch consultants indicates a number of findings to answer the questions that triggered this report. The first objective was to produce a systematisation of available information (evaluation documents, business plans, Fair Trade association assessments, etc.). This was quite a difficult task given the inconsistencies between the documents received: changing forms, different ways in which consultants interpret and answer the questions and the divergent scores for the same question. Once re-expressed to increase their consistency, the data shows that each document captures a small part of the story of each organisation. The “whole picture” can only be obtained by comparing them, but this would require filing all the information in one single document (see recommended actions in section 8).
The second overall question was how efficient/effective Fair Trade Original is in delivering improvements to its partners. On average, organisations improved their economic and business capacities between the two EBA rounds, which has been corroborated by the local and business consultants. However, the average progress hides the fact that some organisations experienced very significant improvements and others have had small regresses. By region, it would seem that the Asian partners start from a higher capacity level but show sluggish progress, while the Latin American partners start from lower levels of capacity and progress faster. The African partners are somewhere in-between. Possible reasons for this could be the more intensive use of the EBA in Latin America or that weaker organisations have more to gain from partnering with Fair Trade Original and these happen to be in Latin America.
By sector, the starting point is quite mixed but the partners in the Gifts & Living sector make progress consistently further and faster in terms of their business strength. This does not correspond with their sales

26
and profits, that have fallen in the last years. As said, an organisation can become stronger and yet not necessarily sell more every year.
In terms of strengths and weaknesses of the partners, there is no clear pattern that would explain how they were chosen. All in all, their major weakness is the financial management, followed by marketing. The most common strength is the ICT capacity, while general management and quality are in between. The partners have improved accordingly: they concentrate on improving their financial and marketing capacities, followed by general management and quality and paying relatively less attention to ICT. The EBA hence seems to represent well the areas in which the efforts of the work with Fair Trade Original have concentrated, or it may have biased the allocation of resources and efforts to those areas.
In all, the main contribution of Fair Trade Original is to strengthen partners in the area where they are relatively weaker: i.e., supporting the social and environmental improvement of private enterprises (working conditions, etc.) and the business or economic capacities of the social enterprises. While this is an interesting and important conclusion, the Fair trade Original intervention strategy does not systematically focus on developing these ‘compensating’ capabilities. Obviously, there are also exceptions to this trend. The common thread among those partners that have experienced the most progress are their “entrepreneurial” capacities and the “open mindedness” of the leadership. None of these two aspects is evaluated by objective criteria that guide the decision on what organisations can be suitable partners for Fair Trade Original (see recommendations). At the same time, the organisations that have experienced none or minimal progress have been characterised by conflict ridden among the leaders and/or producers and workers.
Another characteristic is that all the partners somehow rely heavily on Fair Trade Original for their survival, but this happens in very different ways. The weakest organisations have relatively few mainstream or fair trade clients, so they rely heavily on Fair Trade Original for both trade and capacity building. In contrast, the strongest organisations have diversified their customer base in such a way that they can manage their sales without Fair Trade Original but they are dependent for capacity building, training producers, improving working conditions or for generating general community development. Overall, the loss of Fair Trade Original as a partner would affect them significantly: the weaker partners would probably not survive at all, while the stronger ones would have to seek other sources of funding to provide training and pursue corporate social responsibility practices. It was not possible during this study to find out what kind of exit strategy or limits to its support are envisioned by Fair Trade Original. The obvious exit strategy, referred to regularly, was the decline in sales and changes in the product assortment demanded by consumers in Europe. At the moment, no indication was found that there are any reductions in the support given nor preparations to withdraw from either group of organisations (see recommendations).
8. Recommended actions
1. The first recommended action has been implemented already by the end of the writing of this report. It is to compile in one unique document or file all the information corresponding to a single organisation at the same time. The new file merges the new EBA (received in December), BFMS, action plan or intervention strategy in one single Excel document with different spreadsheets. This would enable the systematisation of the data and comparability across organisations. Even if the later
27
does not happen, at least the trajectory for a single organisation would be concentrated in one single file, serving as a unique assessment tool that tells the story of the organisation. In this sense, the new tool can be more systematically filled in by various consultants and the new system of levels of concern are less open to subjective interpretation. It preserves the most positive aspect of the old EBA idea, to serve as a general and all-encompassing list of areas that are important for any business to look into. In turn, Section 6 (Human Resources) of the new EBA represents an example of an extra improvement, as it asks whether the wages are “enough” to go by and whether workers are trained. However, Fair Trade Original may also want to know what kind of training has taken place, who is trained to do what, whether workers / associated producers are given a voice to participate in business decisions. There are other aspects, like educating the children of the producers, that do not show up in the new EBA tool and are relevant to show the social progress that Fair Trade Original wishes to achieve.
2. A second recommendation focuses on the selection criteria. What are the criteria by which an organisation is chosen and becomes a “good partner”? The main criteria seems to be the need of Fair Trade Original itself to expand and complete the diversity of its supply. The organisations in the G&L sector seem to be doing slightly better than the Food sector in terms of their managerial capacity building, although this is not reflected in the sales, as highlighted by several business consultants. the EBA seems to be assisting Fair Trade Original in assessing what business areas to concentrate its efforts on. Beyond that, it is the personal knowledge of the consultants that work with the organisations that gives a clearer indication. “Entrepreneurship” capacities, “open mindedness”, “motivation”, “attitude to change” were most often mentioned as the reasons why an organisation experiences progress in social, economic and environmental terms. Yet none of this is assessed in any way by objective criteria.
3. In the same way that it is unclear why an organisation is chosen as partner, it is also unclear what are the exit strategies or the limits to Fair Trade Original support. How far is Fair Trade Original willing or capable of supporting an organisation? Do partners improve because they accumulate capacities and can stand alone on their feet after a limited amount of years, or do they continue to exist because Fair Trade Original supports them indefinitely? Do partners get to cover the costs of their expansion and improvements? What are the criteria for withdrawing the capacity building support? For instance, once the partners have diversified their client base, should Fair Trade Original still support their marketing and quality improvement efforts? Should it pump resources in a sluggish company until it starts making a profit because its product is interesting in the assortment of Fair Trade Original? Although some organisations have been phased out of various reasons, a policy on when and how this should happen could provide clearer guidance.
4. The final question that launched the present study was to choose cases for further research, to better understand what has already been done with this desk study. This point has been submitted as a separate document.