REPORT - files.eric.ed.gov · report r e s u m e s. ed 013 518. ec 000 576. one in a thousand - -a...
86
REPORT R E S U M E S ED 013 518 EC 000 576 ONE IN A THOUSAND - -A COMPARATIVE STUDY OF MODERATELY AND HIGHLY GIFTED ELEMENTARY SCHOOL CHILDREN. BY- BARBE, WALTER B. OHIO STATE DEPT. OF EDUCATION, COLUMBUS PUB DATE 64 EDRS PRICE MF-$0.50 HC-$3.52 88P. DESCRIPTORS- *GIFTED, *STUDENT CHARACTERISTICS, CHILDREN, ELEMENTARY GRADES, FAMILY BACKGROUND, EDUCATICAL EXPERIENCE, PHYSICAL DEVELOPMENT, ADJUSTMENT (TO ENVIRONMENT) , ABILITY IDENTIFICATION, TALENT IDENTIFICATION, FERSCNALITY, ICWA TESTS CF BASIC SKILLS, STANFORD BINET INTELLIGENCE TEST, CHILDRENS PERSONALITY QUESTIONNAIRE, CFO, !FAT, COLUMBUS MODERATELY GIFTED AND HIGHLY GIFTED CHILDREN WERE STUDIED TO DETERMINE DIFFERENCES IN EDUCATIONAL DEVELOPMENT; ADJUSTMENT, PHYSICAL DEVELOPMENT, AND FAMILY BACKGROUND. SCHOOL PSYCHOLOGY INTERNS NOMINATED POTENTIALLY CAPABLE PUPILS FRCO GRADES THREE TO SIX. FROM THESE, 65 MATCHED FAIRS OF MODERATELY GIFTED (IQ SCORES CF 120 TO 130) AND HIGHLY GIFTED (I0 SCORES OF 148 AND ABOVE) WERE SELECTED. STANFORD-BINET INTELLIGENCE TEST SCORES, ICOA EVERY PUPIL TEST CF BASIC SKILLS SCORES INSTITUTE FOR PERSONALITY AND ABILITY TESTING CHILDREN'S PERSONALITY OUESTICNNAIRE SCORES, PARENT RATINGS CF CHILD, AUTOBIOGRAPHIES, WFiD IS IT SCORES, SCHOOL RECORDS, socicccoNomrc LEVELS, AND HOME INFORMATION WERE CCTAINED. STRUCTURED INTERVIEWS AND INSTRUMENTS MEASURING CREATIVITY AND SELF CONCEPT WERE USED WITH 40 CF THE SUBJECTS. FINDINGS INDICATED THAT THE HIGHLY GIFTED GROUP CAME FROM MORE AFFLUENT BACKGROUNDS, HAD h$DRE HIGHLY EDUCATED PARENTS, AND RATED HIGHER ON CREATIVITY MEASURES. BOTH GROUPS WERE FOUND TO BE WELL ADJUSTED, AND THERE WERE ND OUTSTANDING DIFFERENCES OF PHYSICAL DEVELOPMENT. TEACHERS DID NOT IDENTIFY 25 FERCENT C4 THE HIGHLY GIFTED. LARGE NUMBERS WOULD HAVE SEEN MISSED THROUGH RELIANCE ON GROUP TESTS. THE STUDY RECOMMENDS A STATE REGISTRY CAF' HIGHLY GIFTED CHILDREN, SUMMER WORKSHOPS FOR TEACHERS; AND EXCESS COST SUPPORT. (RIM)
Transcript of REPORT - files.eric.ed.gov · report r e s u m e s. ed 013 518. ec 000 576. one in a thousand - -a...
REPORT R E S U M E S
ED 013 518 EC 000 576ONE IN A THOUSAND - -A COMPARATIVE STUDY OF MODERATELY ANDHIGHLY GIFTED ELEMENTARY SCHOOL CHILDREN.BY- BARBE, WALTER B.OHIO STATE DEPT. OF EDUCATION, COLUMBUS
PUB DATE 64EDRS PRICE MF-$0.50 HC-$3.52 88P.
DESCRIPTORS- *GIFTED, *STUDENT CHARACTERISTICS, CHILDREN,ELEMENTARY GRADES, FAMILY BACKGROUND, EDUCATICAL EXPERIENCE,PHYSICAL DEVELOPMENT, ADJUSTMENT (TO ENVIRONMENT) , ABILITYIDENTIFICATION, TALENT IDENTIFICATION, FERSCNALITY, ICWATESTS CF BASIC SKILLS, STANFORD BINET INTELLIGENCE TEST,CHILDRENS PERSONALITY QUESTIONNAIRE, CFO, !FAT, COLUMBUS
MODERATELY GIFTED AND HIGHLY GIFTED CHILDREN WERESTUDIED TO DETERMINE DIFFERENCES IN EDUCATIONAL DEVELOPMENT;ADJUSTMENT, PHYSICAL DEVELOPMENT, AND FAMILY BACKGROUND.SCHOOL PSYCHOLOGY INTERNS NOMINATED POTENTIALLY CAPABLEPUPILS FRCO GRADES THREE TO SIX. FROM THESE, 65 MATCHED FAIRSOF MODERATELY GIFTED (IQ SCORES CF 120 TO 130) AND HIGHLYGIFTED (I0 SCORES OF 148 AND ABOVE) WERE SELECTED.STANFORD-BINET INTELLIGENCE TEST SCORES, ICOA EVERY PUPILTEST CF BASIC SKILLS SCORES INSTITUTE FOR PERSONALITY ANDABILITY TESTING CHILDREN'S PERSONALITY OUESTICNNAIRE SCORES,PARENT RATINGS CF CHILD, AUTOBIOGRAPHIES, WFiD IS IT SCORES,SCHOOL RECORDS, socicccoNomrc LEVELS, AND HOME INFORMATIONWERE CCTAINED. STRUCTURED INTERVIEWS AND INSTRUMENTSMEASURING CREATIVITY AND SELF CONCEPT WERE USED WITH 40 CFTHE SUBJECTS. FINDINGS INDICATED THAT THE HIGHLY GIFTED GROUPCAME FROM MORE AFFLUENT BACKGROUNDS, HAD h$DRE HIGHLY EDUCATEDPARENTS, AND RATED HIGHER ON CREATIVITY MEASURES. BOTH GROUPSWERE FOUND TO BE WELL ADJUSTED, AND THERE WERE ND OUTSTANDINGDIFFERENCES OF PHYSICAL DEVELOPMENT. TEACHERS DID NOTIDENTIFY 25 FERCENT C4 THE HIGHLY GIFTED. LARGE NUMBERS WOULDHAVE SEEN MISSED THROUGH RELIANCE ON GROUP TESTS. THE STUDYRECOMMENDS A STATE REGISTRY CAF' HIGHLY GIFTED CHILDREN, SUMMERWORKSHOPS FOR TEACHERS; AND EXCESS COST SUPPORT. (RIM)

212
f],
1964
Columbus
Ohio
ONE IN A
THOUSAND
A Comparative Study of
Moderately and Highly
Gifted Elementary
School Children
Issued by E. E. loll
Superintendent of Public Instruction
1191144111,11101101M,A7,-,-

ONE IN A THOUSAND:
A COMPARATIVE STUDY OF
HIGHLY AND MODERATELY GIFTED
ELEMENTARY SCHOOL CHILDREN
stSo oft:-
Y117.1.717
eVo . Afro'
'OHIO.
WALTER B. BAR13EProfessor of Special Education and Chairman
Department of Special EducationKent State University
Prepared under the direction of
R. A. HORNDirector, Division of Special Education
Columbus, Ohio1964
U.S. DEPARTMENT OF HEALTH, EDUCATION 8 WELFARE
OFFICE OF EDUCATION
THIS DOCUMENT HAS BEEN REPRODUCED EXACTLY AS RECEIVED FROM THE
PERSON OR ORGANIZATION ORIGINATING IT. POINTS OF VIEW OR OPINIONS
STATED DO NOT NECESSARILY REPRESENT OFFICIAL OFFICE OF EDUCATION
POSITION OR POLICY.
<S
FOREWORD
The State of Ohio has assumed a role of leadership in the education3f gifted children. Through its many publications of reports of researchand demonstration projects dealing with the gifted, nationwide attentionhas been directed to Ohio. Throughout the State, more attention isbeing directed toward the education of the gifted than ever before. The-esulting better educational program for gifted children results in bettereducational opportunities for all children, for the research and demon-stration projects concerned with the gifted have not been conductedwithout the full awareness of the needs of all children and the contri-butions which increased knowledge and experience with the giftedprovides for the improvement of he educational program for all children.
This publication, One In A Thousand: A Comparative Study ofHighly and Moderately Gifted Elementary School Children, provides uswith evidence that the job is not yet finished. Even within the ranks ofthe gifted are children with different needs. The highly gifted childrenidentified in this study represent a greater number than many mighthave supposed to exist, and only increases our responsibility to be certainthat their education is not being neglected.
The research here reported is unique in that the number of highlygifted children identified is so large, such a distinct difference is estab-lished between the groups referred to as "highly gifted" and "moderatelygifted," and the use of such carefully matched groups is employed. Theutilization of such a wide variety of newly developed standardized instru-ments as well as instruments developed and adapted particularly for thisstudy offers suggested uses for others. The extensive scale of this studyshould mark it as one of the major contributions to the research in thearea of giftedness.
E. E. HOLTSuperintendent of Public Instruction

0110.1010.M.
h
ACKNOWLEDGEMENTS
The Project Coordinator wishes to express his appreciation to themany individuals who participated in this study. The 35 school psychol-ogy interns who collected the data certainly deserve the greatest amountof appreciation, for their wholehearted cooperation made this Projectpossible. The psychologists under whom they worked, their Universitytrainers, Mr. Thomas Stephens and Mr. S. J. Bonham, Jr., all contributedto this study with their support.
The group at Kent State University who worked on the studydemonstrated clearly that through such a research project learning couldtake: place at the highest level. It was with their never tiring efforts thatthe data were finally collected, tabulated and reported. The assistantswho worked on the study were Herbert Neff, Donald Howard, and JimTurek. Students who assisted in various phases of the study were RichardOriole, Barbara Kish, Wanda Louie, Katherine Steiert, and James Evans.
Dr. Kaoru Yamamoto, a member of the faculty of Kent State Uni-versity, throughout the year, provided constant advice on the project and,in particular, assistance in scoring and interpreting the data on creativity.Mr. John Guidubaldi, research assistant, provided the project with farmore than the expected amount of time and diligent effort. To Mr.Guidubaidi and Mrs. Margaret Betzhold, administrative assistant, wentthe major responsibility for interpreting the Coordinator's efforts to makea final report. In addition to their endless efforts, they contributed to thegood feeling which makes a research project either dull routine orexciting. The present research project was indeed exciting due in nosmall way to their efforts.
Again, Miss Julia Waida, University Editor, Kent State University,provided the cover design, for which all of us express sincere apprecia-tion. The drawing on the cover was done by Fred Barbe; its choice beingdictated both by parental pride as well as the belief that giftedness is,indeed, many dimensional.
For the support of the research, greatest appreciation is expressed tothe Division of Special Education of the Ohio Department of Education.
Walter B. Barbe

TABLE OF CONTENTS
LIST OF TABLESPage
ix
Chapter
I. INTRODUCTIONReferences 2
II. PROBLEMS AND PROCEDURES 4Statement of the Problem 5Selection of Subjects 6Collection of Data 7Treatment of Data 8Limitations of Study 8References 9
III. COMPOSITION AND FAMILY BACKGROUNDOF THE GROUP 10
Group Division 10I.Q. Distribution 10Interview Sample 13Number of Children in Family
and Their Ordinal Position 14Marital Status of Parents 15Age of Parents 15Religious Affiliation 16Economic Status 16Educational Level of Parents 17Occupational Level of Father 24Summary . 27References 28
IV. EDUCATIONAL DEVELOPMENT AND ABILITIES 29Kindergarten Attendance 29Grade Skipping 29Age Learned to Read 30Rate of Progress in School 30Special Class Attendance 30
vii

4
rr
PageIowa Tests of Basic Skills 31Autobiographies
34Vocational Interests35Creative Thinking Abilities 36Special Talents or Skills and Limitations 39Group Intelligence Testing 41Mental Qualities42Summary42References44
V. PHYSICAL DEVELOPMENT 45Prenatal Development45Age of Walking and Talking 45
Parents' Ratings of Physical Traits 45School Absences
47Strengths and Weaknesses
47ocio-Economic Factor and Physical Development 48mmary
48
S
Su
VI. THE ADJUSTMENT OF MODERATELY ANDHIGHLY GIFTED CHILDREN 49
The IPAT Children's Personality Questionnaire 49Self- Concept52
Behavior Irregularities 55Children's Wishes .. 56Teacher Selection of "Who Is It?" 56Parents' Ratings of the Child's Adjustment 59Summary
66References
66
VII. SUMMARY, IMPLICATIRECOMMENDATIONS
SummaryImplicationsPortrait of The Highly GiftedRecommendations
ONS AND
viii
Child
6870737777
q.
t
Table
1.
2.
3.
4.
5.
LIST OF TABLESPage
Distribution of Subjects by Grade Level and Sex 11
Distribution of I.Q. of 130 Moderately and Highly GiftedSubjects . . 12
Percentage Distribution of Subjects in Interview Sampleby County Rating 14
Number of Children in Family and Ordinal Position ofSubject ....... . 18
School Rating of Status Characteristics of Gifted Subjectson Source of Parents' Income 19
6. School Rating of Status Characteristics of Gifted Subjectson House Type 20
7. School Rating of Status Characteristics of Gifted Subjectson Dwelling Area 21
8. Rating of Economic Status of Home by Parents of GiftedSubject 22
9. Rating of Community by Parent of Gifted Subject 2310. Rating of Occupations of Fathers of Gifted Subjects y
School Authorities 2511. Occupations of Father Reported by Parents on Home
Information Report . 2612A. Performance on Iowa Tests of Basic SkillsBoys 3212B. Performance on Iowa Tests of Basic SkillsGirls 33
13. Mean Scores on Mechanical Aspects of Writing . . ....... 3514. Product-Moment Correlation Coefficients Between I.Q.
and Measures of Creative Thinking 3715. Point-Biserial Correlation Coefficients for Two I.Q. Groups
on Six Creativity Scores . . ..... . 3816. Mean Creativil` 'cores for I.Q. and Sex Subgroups 3817. Analysis of V: of Creativity Scores 3918. Lowest Group I.Q Scores ... 4119. Parents' Ratings of Child on Mental Qualities 4320. Parents' Ratings of Child on Physical Traits 4621. Fisher's "t" Values for Comparisons of CPQ Performance 5222. Fisher's "t" Values for Self-Concept Differences Between
Groups on Both Parts of Self-Concept Instrument 5423. Categorizatilon of "Three Wishes" of 40 Gifted Children 5724. Teacher Selection of "Who Is It?" . 5825. Parents' Ratings of Child on Social Traits and Attitudes 6026. Parents' Ratings of Child on Emotional Adjustment 6327. R mts' Ratings of Child's Work Habits 65
ix
1
Chapter I
INTRODUCTION
The study of gifted children has expanded into a major area ofresearch only in the past decade. Previously, educational research wasdevoted only occasionally to the child with superior mental endowmentand even less frequently were administrative adjustments made in theschool curriculum for children who differed from the average in thepositive direction. Terman's monumental study and Witty's continuedresearch were the major exceptions to the general apathy with whichthe American public viewed the problems of the gifted.
The study of giftedness has developed through a number of distinctphases beginning with the "impressionalistic and anecdotal" methodsused by Nordeau and Lombroso, Lo the "deductive" methods used byGalion and Ellis, to the biographical method used by Cattell, and finallyto the present phase, the study of gifted children begun on such anextensive scale by Terman. The development of new instruments andthe refinement of older instruments, as well as the increased awarenessof giftedness and its importance have contributed to the current wide-spread interest.
Efforts of the past decade to broaden and expand the concept ofgiftedness have met with unexpected success. The very group whichwas the cause of the increased interest, the highly gifted group, is nowin danger of being overlooked. Highly gifted children have come to beconsidered the same as all those labeled "gifted", even though theirgiftedness may be at a level which makes them as different from themoderately gifted as the moderately gifted are from the average.
Little attention has been given to those children who score at thehighest levels on the Stanford-Binet Intelligence Scales. With the excep-tion of Hollingworth and Terman, investigators in the area of giftedness,
1,have tended to confine their studies to a lower level of giftedness, usually
9
sll
indicated by a lower I.Q. cut-off of betweel 120 and 130.
The current interest in the full development of the potentiality ofgifted children is based primarily upon a national conviction that fromthis group will come our future leaders in those areas requiring intel-lectual prowess. Defense, as well as survival, have become closely alliedwith the present desire to conserve human resources.
1
'11119m11011.1.111tallidill,

-77-7,7^7-77",r7 777, 7..", 7"."7"77.7777.".""",
Generalizations concerning the superiority of gifted children in areasother than intellectual ability are widespread. These generalizations aremade primarily as a result of the findings of Terman's follow-up studyof more than 1,000 intellectually gifted youngsters. Supportive studieshave occurred regularly, with only an occasional reference to those areasin which the gifted child does not excel.
An examination of the break-down of areas of superiority of giftedchildren in non-academic, and indeed even in specific parts of someacademic areas, raises a question concerning the characterization of theintellectually gifted child being above average in all other areas. Bydefinition the gifted child excels in tests of intelligence, but in academicareas such as arithmetic fundamentals, spelling and handwriting thereis some indication that the intellectually gifted child does not excel. Inmeasures of adjustment, the problem arises as to whether the intel-lectually gifted child is really better adjusted, or is merely bright enoughto know the type of response desired.
Historically, there was a definite need for the positive contention ofover-all superiority to be attributed to the intellectually gifted child.Previous misconceptions concerning the intellectually gifted child neededto be dispelled. The ov erwhelming acceptance today of the belief ofsuperiority, however, both on measures which purport to compare giftedchildren with the standards of their own intellectual peer group as wellas on measures which compare the gifted with the standards of theaverage, results in some problems which are as detrimental to the de-velopment of the gifted child as were earlier misconceptions concerninghim.
The need is apparent for a re-examination of the characteristics ofgifted children in view of the refinement of earlier measuring instrumentsas well as the development of new methods of assessment. With a viewtoward program development, which is the current emphasis, under-standing of the characteristics of intellectually gifted children is essential.If differences between moderately gifted and highly gifted do exist,questions need to be raised concerning whether current practices areproviding for these differences.
REFERENCESCox, Catharine M. The Early Mental Traits of Three Hundred Geniuses. Va. II:
Genetic Studies of Genius. Stanford, California: Stanford University Press, 1925.Calton, F. Hereditary Genius. London: Macmillan and Co., Ltd., 1869. Reprinted
1925.
Hollingworth, Leta S. Children Above 180 1.Q. New York: World Book Company,1942.
2
. Gifted Children. New York: The Macmillan Co., 1926.Terman, Lewis A. "The Discovery and Encouragement of Exceptional Talent,"American Psychologist, IX ( June, 1954), 221-30.Terman, Lewis M. et al. Mental and Physical Traits of a Thousand Gifted Children.Vol. I: Genetic Studies of Gehius. Stanford, California: Stanford University Press,1925.
. The Promise of Youth, Follow-up Studies of a Thousand Gifted Children.Vol. III: Genetic Studies of Genius. Stanford, California: Stanford UniversityPress, 1930.
Terman, Lewis M. and Oden, Melita H. The Gifted Child Grows Up; Twenty-fiveYears' Follow-up of a Superior Group. Vol. IV: Genetic Studies of Genius.Stanford, California: Stanford University Press, 1947.. The Gifted Group at Mid - Life: Thirty-five Years' Follow-up of the SuperiorChild. Vol. V: Genetic Studies of Genius. Stanford, California: Stanford Uni-versity Press, 1959.
3

Chapter II
PROBLEMS AND PROCEDURES
The current interest in the gifted has resulted from a general aware-ness of the need to make special provisions for the potentially capableindividual. The level of this potentiality, however, has not been clearlydistinguished. For the most part, the image of the gifted child as per-ceived by the general public has been those children at the highest levelsof intelligence. School personnel, however, prompted partly by practicalconsiderations, as well as by awareness of the lack of definitiveness ofmeasures of intelligence, have included children in the ranks of the giftedwho are at a much lower level of intelligence. School programs, therefore,have been provided for those who might be called moderately gifted,while the general public has assumed that programs for the gifted meanprograms for the highly gifted. Any examination of characteristics, there-fore, must be concerned with determining not only the characteristicsof the moderately gifted, but also determining the characteristics of thehighly gifted.
There can be no clear-cut distinction between moderately gifted andhighly gifted children which will not be objected to by at least somepeople. The use of I.Q. scores to make such a distinction, as has beendone in the present study, certainly allows for some disagreement. Thereis widespread agreement, either stated or implied, by a number of in-vestigators in the area of the gifted that there are differences betweenmoderately and highly gifted children other than the quantitative differ-ence of a higher I.Q. score, but whether or not an I.Q. point can beestablished which makes this distinction is the debatable point.
Examining extremes, there little question but that the 120 I.Q.lower cut-off point, so commonly used by schools in assignment ofchildren either to programs or classes for the gifted, includes a largonumber of moderately gifted children. Indeed, such programs appear tobe heavily loaded with children in this category. At the other extreme,were schools to use the 180 I.Q. cut-off as the lower limit of the highlygifted, as Hollingworth did in her book Children Above 180 I.Q., therewould be few if any programs existing merely for want of eligiblechildren.
Obviously, some reasonable as well as defensible compromise mustbe made. In the present study, an I.Q. score of 148 was used for the
4
Ago.IMIWINEWMPIIIIIMMUNIEWMPINIMPOW 0.1411101,
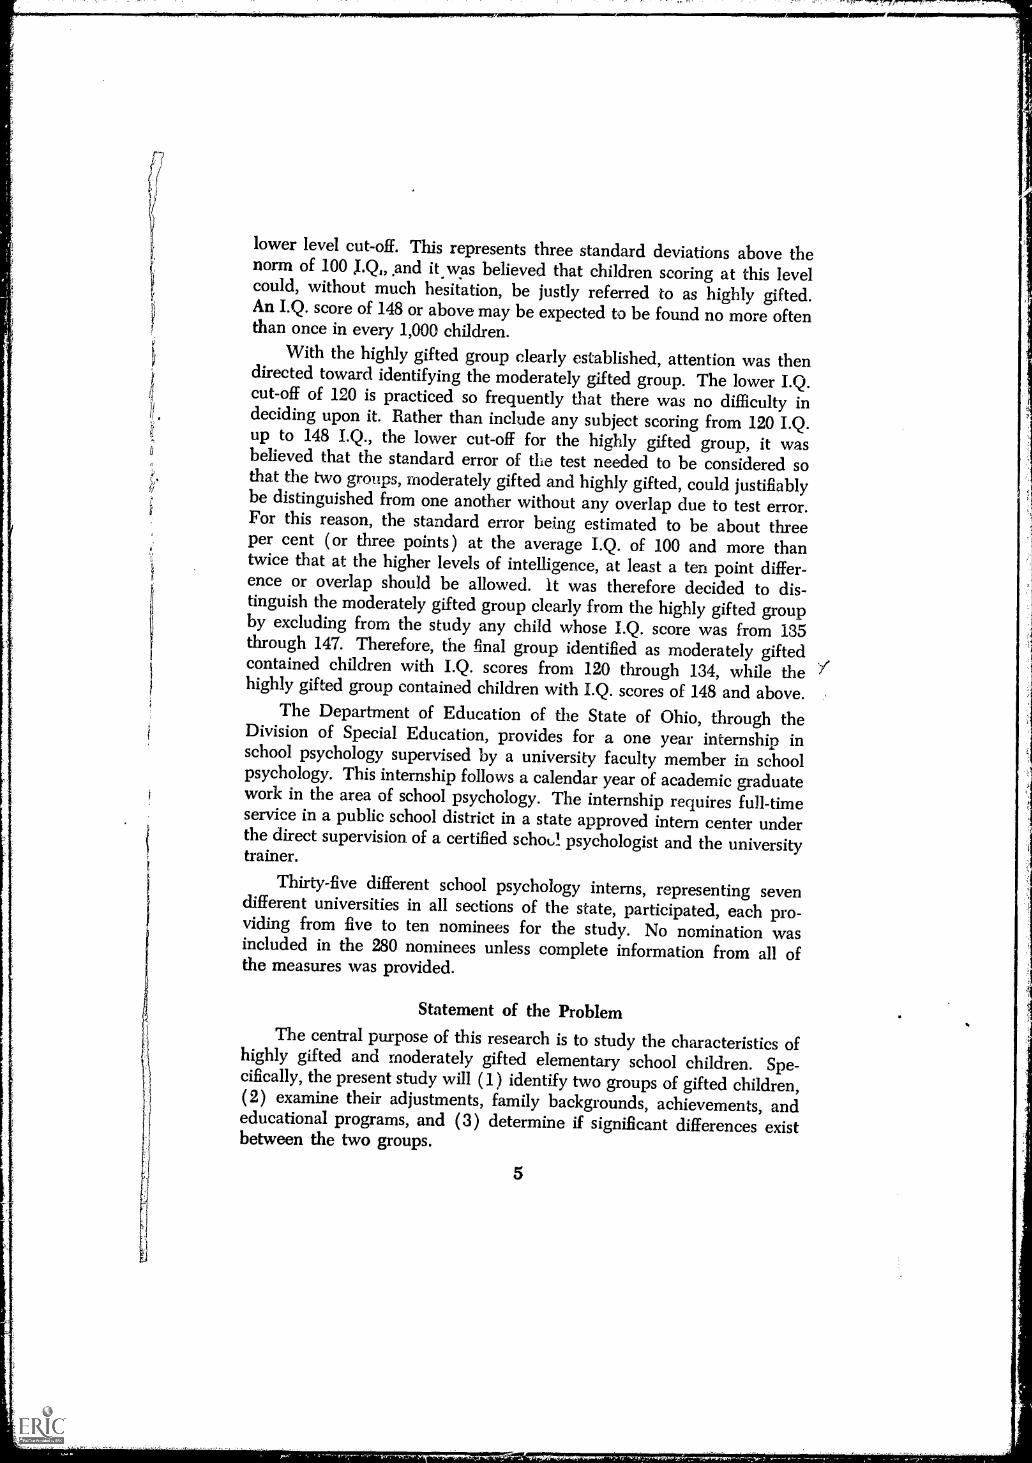
lower level cut-off. This represents three standard deviations above thenorm of 100 J.Q sand it.was believed that children scoring at this levelcould, without much hesitation, be justly referred to as highly gifted.An I.Q. score of 148 or above may be expected to be found no more oftenthan once in every 1,000 children.
With the highly gifted group clearly established, attention was thendirected toward identifying the moderately gifted group. The lower I.Q.cut-off of 120 is practiced so frequently that there was no difficulty indeciding upon it. Rather than include any subject scoring from 120 I.Q.up to 148 I.Q., the lower cut-off for the highly gifted group, it wasbelieved that the standard error of the test needed to be considered sothat the two groups, moderately gifted and highly gifted, could justifiablybe distinguished from one another without any overlap due to test error.For this reason, the standard error being estimated to be about threeper cent ( or three points) at the average I.Q. of 100 and more thantwice that at the higher levels of intelligence, at least a ten point differ-ence or overlap should be allowed. it was therefore decided to dis-tinguish the moderately gifted group clearly from the highly gifted groupby excluding from the study any child whose I.Q. score was from 135through 147. Therefore, the final group identified as moderately giftedcontained children with I.Q. scores from 120 through 134, while thehighly gifted group contained children with I.Q. scores of 148 and above.
The Department of Education of the State of Ohio, through theDivision of Special Education, provides for a one year internship inschool psychology supervised by a university faculty member in schoolpsychology. This internship follows a calendar year of academic graduatework in the area of school psychology. The internship requires full-timeservice in a public school district in a state approved intern center underthe direct supervision of a certified schou". psychologist and the universitytrainer.
Thirty-five different school psychology interns, representing sevendifferent universities in all sections of the state, participated, each pro-viding from five to ten nominees for the study. No nomination wasincluded in the 280 nominees unless complete information from all ofthe measures was provided.
Statement of the ProblemThe central purpose of this research is to study the characteristics of
highly gifted and moderately gifted elementary school children. Spe-cifically, the present study will (1) identify two groups of gifted children,(2) examine their adjustments, family backgrounds, achievements, andeducational programs, and (3) determine if significant differences existbetween the two groups.
5
The research reported in this study was planned to make data avail-,able pertinent to these problems:
1. In what areas of educational development do moderately andhighly gifted elementary school children differ, and to whatextent does this difference exist?
2. To what extent do the moderately gifted and highly gifted chil-dren in this particular study differ in personal, social, educationaland family adjustment?
3. Are there differences in the family backgrounds of moderatelyand highly gifted children?
Selection of Subjects
Primary reliance for nomination of subjects was placed upon 35school psychologist interns in the State of. Ohio. Each of them was askedto nominate the "eight most capable children (potentiv.11y) in your schoolsystem on any basis (individual or group I.Q. score; achievement,measured or demonstrated; imaginativeness; etc.) ." The children nomi-nated were to be from grades three through six, with none being excludedbecause of any atypical characteristics "other than high ability." ( A idi-tional nominations were provided by three research assistants work;ngon the project.) A parental permission letter was obtained for eachsubject included in the study.
The number of nominees, for whom complete information was sub-mitted and whose Stanford-Binet I.Q. score was 120 or above, was 280children. Information on 12 children whose I.Q. scores were below 120was submitted but not used in this study. From the group of 280 childrenranging in I.Q. score from 120 to 180 plus (unadjusted ), the final groupsto be studied were selected.
Since the purpose of the study was to compare moderately andhighly gifted, the subjects were selected from the nominees who met thecriteria for these two categories (i.e. moderately gifted, 120-134 I.Q.score; highly gifted, an I.Q. score of 148 and above). A sample of thetotal population was made to be approximately representative of thepercentage of population distribution in metropolitan, urban and ruralcounties in Ohio.
The final matched pair group contained 130 subjects. Sixty-fivehighly gifted children were matched with 65 moderately gifted children.The group contained 31 matched pairs of boys and 34 matched pairsof girls.
Personal interviews were conducted by the Project staff with 40subjects from the matched pair group. An effort was made to have the
6
interview sample representative of the total matched pair group on thebasis of grade and sex. In addition to a structured interview, creativityand self-concept instruments were administered.
Collection of DataThe data were collected from 38 school systems by a variety of
school personnel throughout Ohio. Parents, teachers and administratorsassisted 35 school psychology interns and three Project staff members inobtaining information about the subjects.
For each of thautobiographies,This information
e 280 nominees test data, parental and teacher ratings,chool records and home information were obtained.
was obtained from the following sources:
1. Stanford -Binet Intelligence Test, Form L-M (1960).2. Iowa Every Pupil Tests of Basic Skills, Forms I and II. 1956,
Grade Levels, 3-4, and 5-6.3. IPAT Children's Personality Questionnaire (The CPQ), Form A
(1960).4. Parents' Rating of the Child's Qualities, Diagnostic Child Study
Record.5.
6.
7
Who Is It? (Form A ).Autobiography.
. School Record.8. Index of Status Characteristics of Family (Adapted from W. L.
Warner).9. Home Information,
10. Parental Permission.
Information was obtained for every subject in all of these ten areas. Forthe interview group (N =40) additional information was secured fromthe following sources:
1. Personal Interview Questionnaire.2. Tell Us About Yourself.3. Minnesota Battery of Tests of Creative Thinking (Ask-and-Guess
Test and Test of Imagination). 1960.
The Stanford-Binet was administered and scored by the schoolpsychology intern. All but a few were administered between October,1962 and February, 1963, with the few exceptions being children whowere tested in the Spring of 1962 by the school psychologist. The sametime of testing applies to the Iowa Tests of Basic Skills although thescoring of these was done in the Project office.
7

-04..
The IPAT Children's Personality Questionnaires were administeredin the Fall of 1962 by the school psychology interns and were scored inthe Project office. The "Who Is It?" sociometric instrument asked theclassroom' teacher of each subject to list the names of the pupils in herclass who best fit each of ten descriptions (i.e. funniest, most popular,etc.). Parents were asked to rate their child on a four-point scale onphysical traits, social traits and attitudes, mental qualities, emotionaladjustment and work habits. This information was obtained from theWitty Diagnostic Child Study Record. Each child was asked to write anautobiography. These several instruments provided information con-cerning the child's adjustment from him, his parent, and his teacher.The school records provided much valuable information. Schoolgrades received by the child at each grade level were obtained. Thechild' 's attendance record, in addition to previous standardized test scores,provided additional information. Records of special class participationand other administrative adjustments were acquired.An adaptation of the W. L. Warner Index of Status Characteristicsof Family was completed by the school administrator for each child inthe study. The Witty Diagnostic Child Study Record, Home InformationReport, provided extensive information from the parent about the child'sfamily background.
For those children in the interview sample, a Personal InterviewQuestionnaire was prepared. This questionnaire provided validity checkson certain information obtained from other sources and added additionalinformation. A "Tell Us About Yourself" scale was prepared in anattempt to determine some facets of self-concept. The "Ask-and-GuessTest" and "Test of Imagination" from the Minnesota Battery of Tests ofCreative Thinking were administered to the interview group by membersof the Project staff.
Treatment of DataThe data, because of the great variety collected, were treated indifferent ways. Where it was appropriate, tests for significance wereperformed. Where this was not applicable, tabulations and percentageswere reported. Split -half reliability coefficients and point biserial corre-lation coefficients were applied to the creativity and self-concept meas-ures. Chi square techniques were applied on consistency checks offather's occupation and number of siblings.
Limitations of StudyThe wide scope of the study itself is perhaps its major limitation.Because there has been so little research in the area of the highly gifted,the Project staff felt justified in not investigating exhaustively a few
8

isolated characteristics, but instead comparing on a broad scale thecharacteristics of moderately and highly gifted elementary school chil-dren. Specifically, the limitations of the present study include:
(1) The representativeness of the groups characterized as "highlygifted" and "moderately gifted" is not assured. Generalization must notbe made concerning "highly gifted" and "moderately gifted" on thebasis of the results of this study, for little attempt was made to makethe groups representative even of such groups in Ohio. Efforts to dis-tribute the subjects throughout the state, and to be proportionallyrepresentative of the size of the county in which they lived, were madein an attempt to avoid the influence of any particular economic orcultural group, but did not make the group representative of highlyand moderately gifted children.
(2) The inadequacies of testing instruments to measure the abilities,attitudes, achievements and adjustments of individuals who possess in-telligence of such a high level must be recognized. Whether instrumentspurported to measure intangibles are as valid for gifted children as theyare for average children has never been clearly demonstrated. Exactlyhow much influence on the results may have been exerted because ofthe subject's awareness of expected responses cannot be determined.
(3) Reliance upon a large number of people for collection of data,regardless of how well trained and supervised they may beand therewere numerous indications of extreme care in administration and scoringintroduces the possibility of differing procedures which may haveinfluenced final results.
There are certainly other limitations of the study, although theseare, in the opinion of the Project Coordinator, the major ones. Theestablishment of control groups which did not over-lap in I.Q. score butwere separated by 14 I.Q. points, although it lowered the number ofsubjects in the study, greatly improved its findings. The interviewing ofapproximately 30 per cent of the total group, although not a randomsample of the group, provided valuable checks on information obtainedby other means as well as additional information not obtainable fromthe entire group. That certain limitations existed was recognized beforethe study was undertaken, but it is believed that the methods used bestfulfilled the purpose of the study.
REFERENCES
Freehill, Maurice F. Gifted ChildrenTheir Psychology and Education. New York:The Macmillan Company, 1961.
Hollingworth, Leta S. Children Above 180 T.Q. New York: World Book Company,1942.
Chapter III
COMPOSITION AND FAMILY BACKGROUNDOF THE GROUP
The family background of gifted students has received attention inthe research primarily in an attempt to add evidence to the nature-nurture controversy. There has been little attempt, however, to dis-tinguish between highly gifted and moderately gifted subjects on factorsof family background. This type of comparison is certainly as valid asis the comparison of gifted subjects with average subjects. It must beclear that neither type of comparison will provide evidence to supportan argument in favor of either environmental or hereditary factors ex-clusively.
Group Division
As was explained in the section on Procedures, the subjects weredivided into matched pairs. There were 31 matched pairs of boys and34 matched pairs of girls; the final total group therefore containing 65moderately gifted and 65 highly gifted elementary school children. Ofthe total groups, 40 were in the interview sample. This break-downindicating the number of subjects in the total group and in the samplegroup by grade level is indicated in Table I.
I.Q. Distribution
Selection of subjects for the present study was determined by I.Q.score, sex and grade level. Highly gifted was defined as an I.Q. scoreof 148 and above, while moderately gifted was defined as an I.Q. scorefrom 120 to 135. Table II presents the distribution of I.Q. scores withineach group.
The mean I.Q score of the moderately gifted group was 129, whilethe mean I.Q. score of the highly gifted group was 158. The mean I.Q.score of the moderately gifted male group was only slightly lower thanthe mean I.Q. score of the moderately gifted female group (128 and 129,respectively). The mean I.Q. score of the highly gifted male group wasagain lower than the mean I.Q. score of the highly gifted female group(154 and 162, respectively).
The range of I.Q. scores in the moderately gifted group was estab-lished by the study as being from 120 to 135, as also was the lower I.Q.
10
score limit of the highly gifted group (148). The range in the highlygifted group extended upward to an I.Q. score of 174. No adjustmentwas made in any I.Q. score for the low ceiling of the test, with thehighest I.Q. score in the table- being reported for those individuals whowent above the tables. Twenty-one of the 31 males in the high grouppassed at least one of the items at the Superior Adult III level, while28 of the 34 females passed at least one of the items at the SuperiorAdult III level. The ceiling operated to the greatest disadvantage of thechildren in the higher grades (5th and 6th), for every 6th grade childin the study passed at least one item at the Superior Adult III level, andall but two at the 5th grade level did the same. It could be supposed thathad there been a higher ceiling, over three-fourths of the children in thehigh group would have had a chance of obtaining a still higher I.Q.score. There can be no question but that the high group is truly highlygifted in intellectual prowess, and may indeed even be comparable withprevious studies of children reported at much higher I.Q. score levelswhere either adjusted scores were obtained or the 1916 or 1937 Binettests were used and the age of testing was younger and resulted in thepossibility of higher scores.
Table IDISTRIBUTION OF SUBJECTS BY GRADE LEVEL AND SEX
GRADE GROUPSNUMBER IN
MATCHED GROUPSNUMBER IN
INTERVIEW SAMPLE
MALE FEMALE MALE FEMALE
Highly Gifted 5 4 2 23
Moderately Gifted 5 4 2 2
Highly Gifted 8 5 1 1 24
Moderately Gifted 8 5 1 2
Highly Lifted 9 12 4 35
Moderately Gifted 9 12 4 3
Highly Gifted 9 13 3 36
Moderately Gifted . 9 13 3 3
Total Matched highly Gifted Males -31, Interview Sample-10Total Matched Moderately Gifted Males-31, Interview Sample-10Total Matched Ilighly Gifted Females-34, Interview Sample-10Total Matched Moderately Gifted Females-34, Interview Sample-10
11

Tab
le I
I
DIS
TR
IBU
TIO
N O
F I.
Q. S
CO
RE
S O
F 13
0 M
OD
ER
AT
EL
Y A
ND
HIG
HL
Y G
IFT
ED
SU
BJE
CT
S
MO
DE
RA
TE
LY
GIF
TE
DH
IGH
LY
GIF
TE
D
120-
124
1125
-129
130
-134
1T
OT
AL
145-
149
150-
154
155-
159
160-
164
I16
5-16
9 1
170-
174
TO
TA
L
Mal
es7
1113
3116
31
40
31
Fem
ales
117
1634
77
64
934
AHNeKKOKKI.0011000
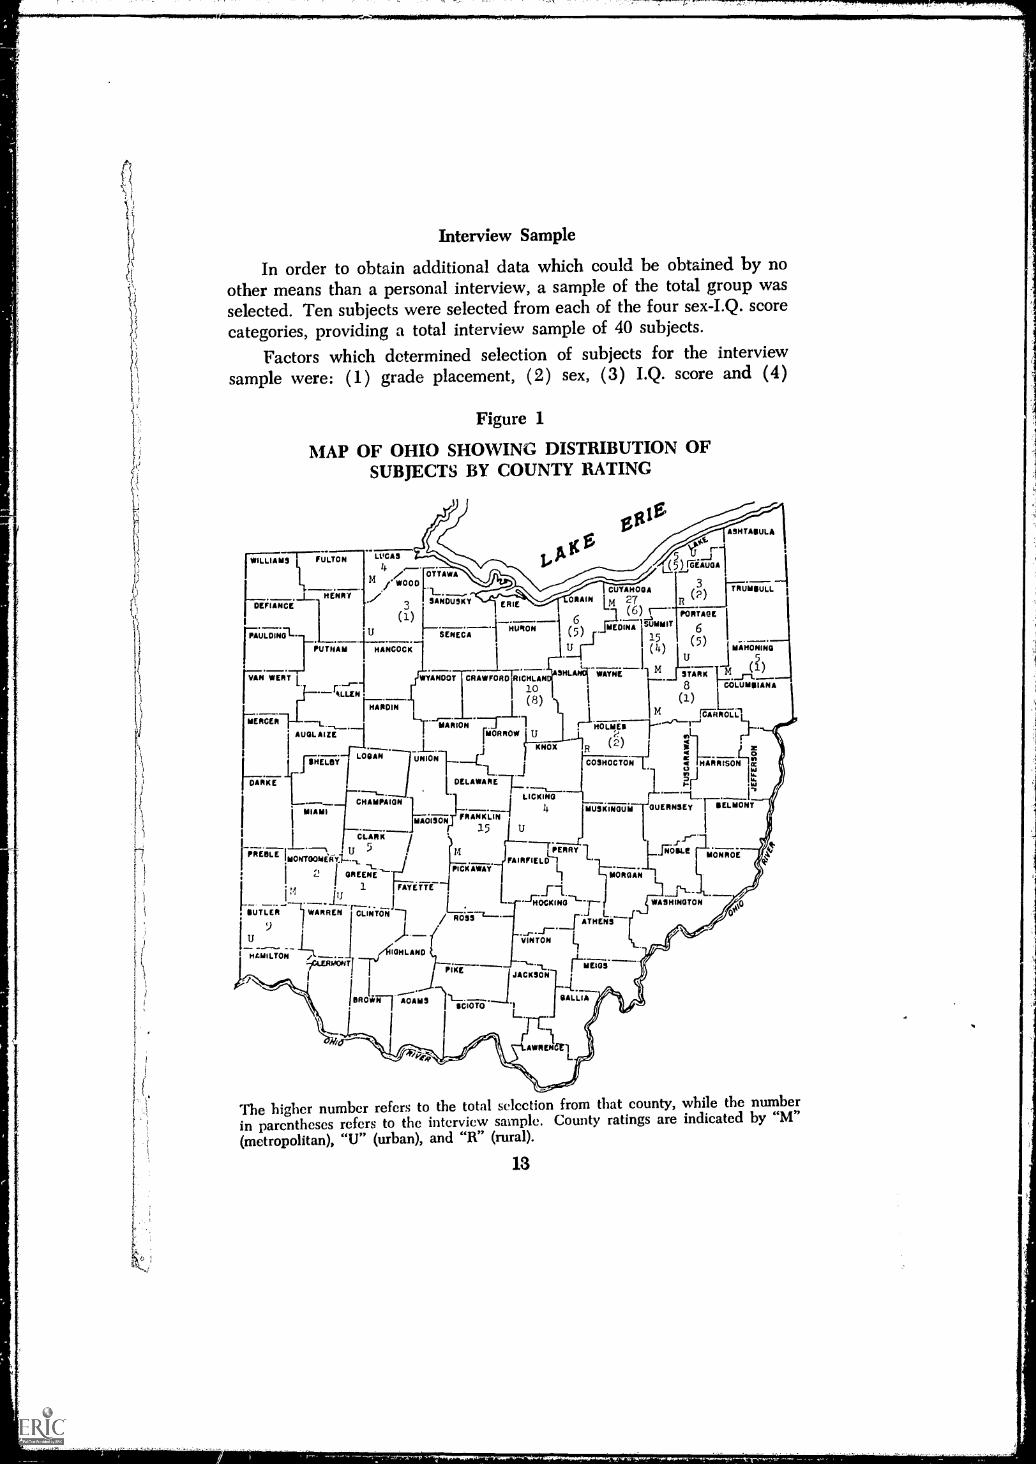
Interview Sample
In order to obtain additional data which could be obtained by noother means than a personal interview, a sample of the total group wasselected. Ten subjects were selected from each of the four sex-I.Q. scorecategories, providing a total interview sample of 40 subjects.
Factors which determined selection of subjects for the interviewsample were: (1) grade placement, (2) sex, (3) I.Q. score and (4)
Figure 1
MAP OF OHIO SHOWING DISTRIBUTION OFSUBJECTS BY COUNTY RATING
WILLIAMS FULTON
DEFIANCEJ_
rPAULDINGIt
PUTNAM HANCOCK
VAN. WER'T L.
FIITROIN
,...._MiRCER
AUGLAIZE
LOSAN
6 AP i K E
.--..... _J CHAMPAIGNMIAMI
1
CLARK
rPREDLE ",.;007,6tyi_U. 5
2 I GREENEI
'L.
1li_ _. --- U
SUTLER WARREN I CLINTON -19
HENRY
LUCAS
4 e--M
OTTAWA/ WOOD
, SANDUSKY
(1)
U
,1-- ALLEN
SENECA
ERIE
-iHURONj
CUYAHOGAOMAIN 14 27
(6)-..-1 (6)
WYANOOT I CRAWFOR-M0 RIDHLAN
10
.oun7-1-- ,..._ _.._.
(1)
Ii
ail! OL LlilMARION --.1
(8) -)-t-.
riORROW
KNOX
d 0 rri j1R
COSHOCTON
(2)
i HAiR1S01111
ItUNION1_____L
Z.[ DELAWAREI_ ri !Fi liti
FKANK-LIN 11
4 muskiNoui E
ou.Rms'El_y .__. r1 SELMONT
MAOISON.r11-1-,
.5 k,.-----EI 14
PICKFAIRFIELD PERRY 1
jriforIL-1-.; C-MON R 0E
MORGAN
FAY iTTH
/ R 0 ii-i---L. L -7-.1K1'Ajr-THELNS--
\....1- -,_.-
WASHINGTON
V I N L..[
--L
L.
L15),
iTtuusuu.1
I GEAUOA
I
ASHTANULA
11/01NA SUMMIT
12.5.Fr15( )
SHLAINTWAYNe 1 M
PORTAGE
(65) hiaKomi°5
STARK
8
HAMILTON 17-T
IS R 0 win AO A II SSCIOTO '1
GALLIA
eWRN
LrFq
The higher number refers to the total selection from that county, while the numberin parentheses refers to the interview sample. County ratings are indicated by "M"(metropolitan), "U" (urban), and "R" (rural).
13
-

rram,777,9111.71.r.17.7 rtr,Tr
IMPIIHWORM"
county rating. The distribution of the subjects by grade level approxi-mated that of the total matched population. There were 20 matchedpairs of male subjects and 20 matched pairs of female subjects in theinterview sample. In every case a highly gifted subject was matchedwith a moderately gifted subject. An attempt was made to have adistribution by county rating similar to that in the total upper-elementaryschool population in Ohio, as indicated in Figure 1 and Table III.
Number of Children in Family and Their Ordinal PositionThere has been much observation, but little research, about thenumber of children in families of gifted children and the order of birthof the gifted child within the family. Reports have varied indicating
Table IIIPERCENTAGE DISTRIBUTION OF SUBJECTS IN
INTERVIEW SAMPLE BY COUNTY RATING
RATINGS OF COUNTY
METRO-POLITAN URBAN RURAL
Number %age Number %age Number %age
Highly Gifted 6 15 12 30 2 5Moderately Gifted 6 15 12 30 2 5Total Interview Group 12 30 24 60 4 10Expected Percentages* 28.3 69.5 2.3
* Computed from state census (1960) and state Educational Directory, 1961-1962.
that the gifted child comes from a family in which there are few children,and consequently the order of birth is either first or second, to an occa-sional report of a gifted child coming from an unusually large family.In any case, the presentation of data concerning the number of childrenin a family and the ordinal position of the gifted child must be examinedcarefully. Far more attention must be given to the abilities of siblings ofgifted children, although Terman did provide some evidence concerningthis. Because of the relative youth of the parents themselves, the size offamilies containing gifted children can by no means be stated with anyfinality.
In one instance in the study, twin boys were included. One caseof a child being adopted was reported, although it is not unlikely thatthere may have been other adoptions which were not reported. Indeed,14
any reluctance to report adoption would have been due to an effort toidentify completely as the child's natural parent, for without exceptionthe children included in this study demonstrated those healthy traits sofrequently attributed to gifted youngsters.
The mean number of children in the families of the highly andmoderately gifted groups differed only slightly, the difference not beingsignificant. The families of the highly gifted boys averaged 2.4 childrenwhile the highly gifted girls averaged 2.4. The families of the moderatelygifted boys averaged 2.9 children, while those of the moderately giftedgirls averaged 2.3. The mean total number of children in the families ofthe highly gifted children was 2.5, while the mean total number ofchildren in the families of the moderately gifted was 2.6. This slightdifference is not significant.
It is apparent from these figures, however, that the gifted childrenin this study came from relatively small families. In each of the groupsthe size of the family averaged slightly less than three children.
The order of birth of gifted children has been the subject of somediscussion. By being the first born, is the child more likely to be giftedbecause his parents can devote more time to him or because he mustgrow up more quickly to assume responsibility as the older child, or isthe advantage given to younger children in a family who can learn fromthe older brothers and sisters? No definitive answer has ever been given,nor can one be expected from this study.
The majority of the children in the study were first born. Sixty percent of the highly gifted subjects were first born, while 54 per cent ofthe moderately gifted subjects were first born. Table IV presents thenumber of children in the family and the ordinal position of the subjects.
Marital Status of Parents
More than 90 per cent of both the highly gifted and the moderatelygifted group come from families in which the parents are married andliving together (93.8 and 90.7 per cent, respectively). There are onlyfive reported cases of divorce, with three of these occurring in thefamilies of the moderately gifted female group.
Age of Parents
The median age of the subjects was about 10, with the majority beingfirst born children. The median age range of both mothers and fathersof the subjects was in the 35 to 40 age range for the highly gifted boysand the moderately gifted boys and girls, but was in the 40 to 45 agerange for the highly gifted girls. The fathers' ages were from the 30 to
15

35 range to the 55 to 60 range, while the mother's ages were from the25 to 30 age range to the 55 to 60 range.
This would seem to indicate that the subjects in the present studyhad relatively young parents, with little difference in the ages of theirmothers and fathers. For some unknown reason, perhaps chance, thehighly gifted girls had parents slightly older than did the other groups.
Religious Affiliation
About 60 per cent of the subjects in the present study came fromProtestant families, in which they and both of their parents were of thesame religious belief. Since only public school children were includedin the study, the percentage of Catholic children (about 12 per cent) islower than the proportional share in the general population, but prob-ably approximates the Catholic enrollment in the public schools. Abouteight per cent reported being of the Jewish faith, and about six per cent(2 subjects in each group) of the subjects and their mothers wereProtestants while their fathers had no religious affiliation.
Economic Status
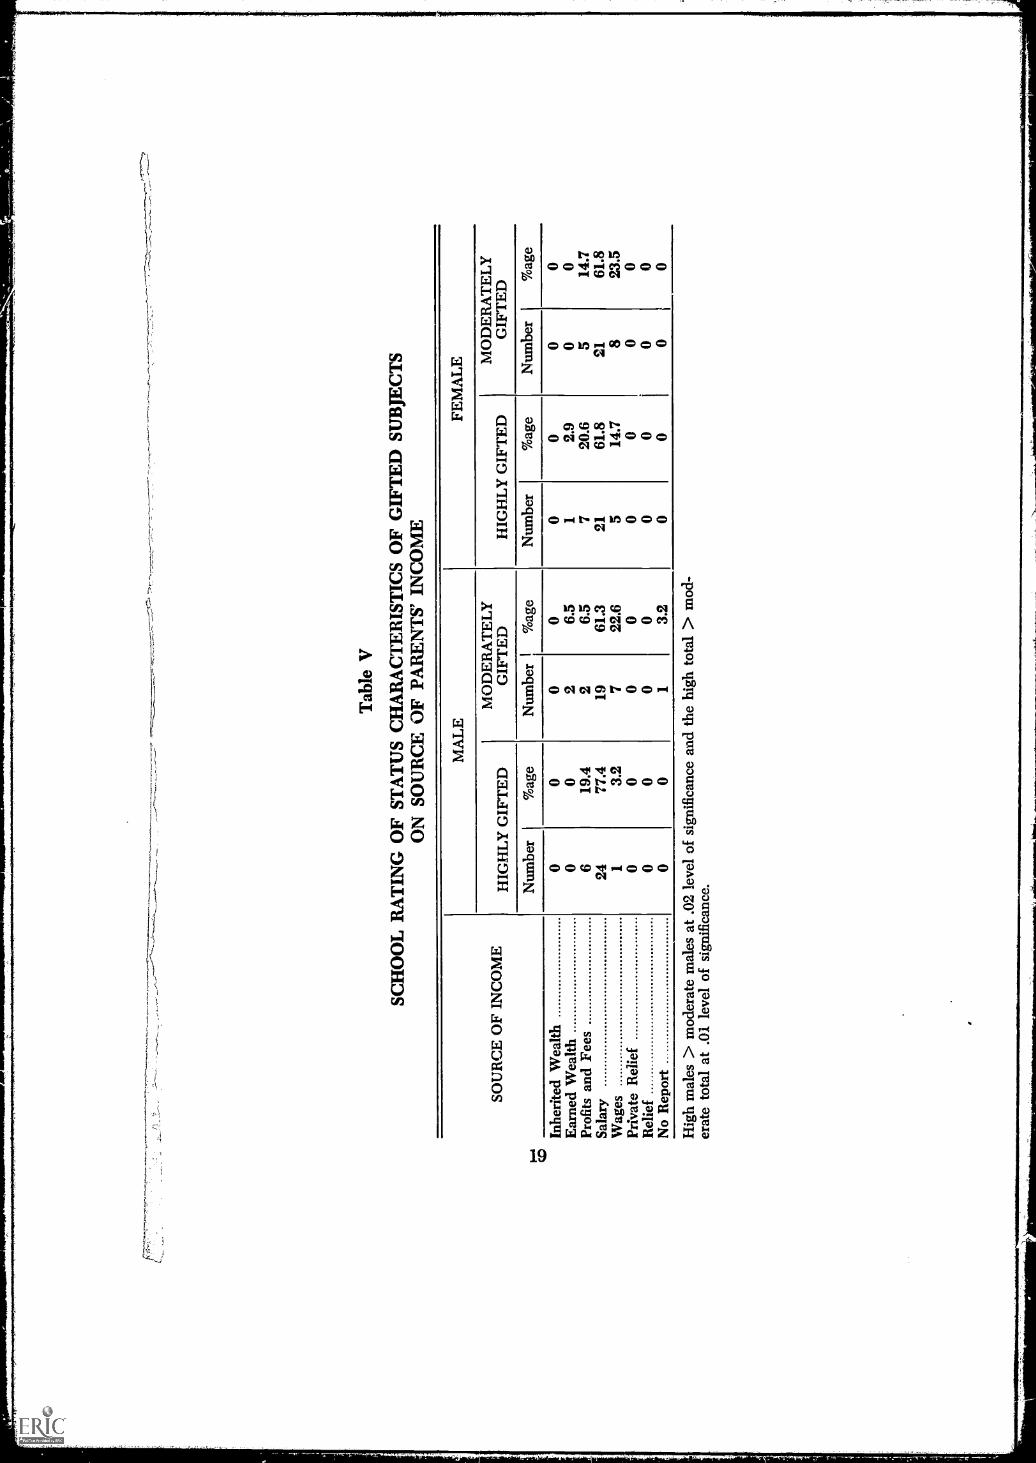
Indications of the economic status of the subjects in the presentstudy included such factors as occupational level of parents, source ofincome, ratings on house type, ratings on dwelling area, and the economicstatus of home and community in which the home is located. Occupa-tional level will be discussed under a separate heading. School authoritiesprovided ratings for each child on source of parent's income, house typeand dwelling area on an Index of Status Characteristics, adapted fromWarner's scale. Parents rated the economic status of the home and thecommunity in which the home is located, each on a four point scale, onthe Witty Home Information Report.
Ratings by school authorities of the source of parents' income indi-cate that the majority of the parent of the subjects in each of the groupsare salaried. There is a difference, significant at the .01 level, favoringthe highly gifted group. The higher ranking on the scale denotes higherincome, as the descriptions of each category clearly indicate. (Found inthe App,ndix and presented to the school authorities at the time therating was made.) The findings indicate that the highly gifted childrencome from wealthier family backgrounds than do the moderately gifted.
Ratings of house type by school authorities yield much the sameinformation. While most of the subjects in each of the groups come from"good" or "average" houses, there is a difference favoring the highlygifted group which is significant at the .05 level.
16
The dwelling area was also rated by school authorities for each ofthe subjects. It was believed by those making this study that this wouldbe the most reliable of the ratings, for the school authorities were in abetter position to rate dwelling areas, even if they did not specificallyknow the more detailed information regarding each subject such as typeof house and source of parent's income. The results, however, were con-sistent with those found in the other two areas. The difference, againfavoring the highly gifted group, was significant at the .01 level.
When parents were asked to rate the economic status of their home,however, the higher rating assigned by the school authorities to thehighly gifted group did not persist. All but one of the parents in bothgroups rated their home as either "comfortable" or "moderate," with oneparent of a highly gifted girl rating their home as "marginal." There waspractically no difference in the way in which the parents of highly giftedand the parents of moderately gifted rated their homes.
There was greater variability in the rating of their community byparents of gifted subjects, but the differences in the total group ratingswere only slight and were not significant. The parents of one moderatelygifted girl and one highly gifted girl rated their homes as "poor," andfour parents did not reply to this question.
Clearly the question must be raised whether school authorities, inrating economic background factors of highly gifted subjects, are notinfluenced by the "halo" effect and rate highly gifted children higher thajimay actually be true. Although the group to which a particular subjectwould be assigned was not definitely known by the administrator, thereis some likelihood that he could be influenced by his previous conceptionsof the subject's degree of giftedness.
Interestingly enough, parents of both groups tended to rate theirhomes and communities in the high average classification. This similarityof ratings is perhaps a function of an attitude of "false modesty" on thepart of the parents of the highly gifted.
Educational Level of Parents
As part of the Home Information Report, the parents were asked tostate the highest school grade attended by the father and the mother.It was readily apparent that both the mothers and the fathers of thehighly gifted group have more education than the mothers and fathersof the moderately gifted group. It was also apparent that in both thehighly gifted group and the moderately gifted group, the fathers hadmore education than the mothers, although the fathers of the moderatelygifted children did not have more education than the mothers of thehighly gifted group.
17

The fathers of the highly gifted boys were the best educated of theparents, about 49 per cent having five years or more of college. Onlyabout 30 per cent of the fathers of the highly gifted girls had five ormore years of college. Close to 30 per cent of the fathers of the moder-ately gifted boys and 21 per cent of the fathers of moderately gifted girlshad five or more years of college.
Sixty-eight per cent of the fathers of the highly gifted boys hadcompleted four years of college, while 53 per cent of the fathers of thehighly gifted girls had this much schooling. Fifty-two per cent of thefathers of moderately gifted boys had completed four years of college,while only 41 per cent of the fathers of moderately gifted girls had thismuch schooling.
Table IV
NUMBER OF CHILDREN IN FAMILY ANDORDINAL POSITION OF SUBJECT
ORDEROF NUMBER OF CHILDREN IN FAMILY (Including Subject)
BIRTH 1 2 3 4 5 6 7
First 1 9 6 2 1
Second 2 3 1
Third 4High Boys Fourth 1
Fifth 1
SixthSeventh
First 2 8 2 4Second 4 2 4 1
Moderate Third 2Boys Fourth 2
FifthSixthSeventh
First 5 12 1 1 1
Second 5 1 1
Third 3 1 1
High Girls Fourth 1
FifthSixthSeventh 1
First 1 8 3 6 1
Second 6 5 1 1
Moderate Third 1
G'-ls Fourth 1
FifthSixthSeventh
18
co
Tab
le V
SCH
OO
L R
AT
ING
OF
STA
TU
S C
HA
RA
CT
ER
IST
ICS
OF
GIF
TE
D S
UB
JEC
TS
ON
SO
UR
CE
OF
PAR
EN
TS'
IN
CO
ME
SOU
RC
E O
F IN
CO
ME
MA
LE
FEM
AL
E
HIG
HL
Y G
IFT
ED
MO
DE
RA
TE
LY
GIF
TE
DH
IGH
LY
GIF
TE
DM
OD
ER
AT
EL
YG
IFT
ED
Num
ber
%ag
eN
umbe
r%
age
Num
ber
%ag
eN
umbe
r%
age
Inhe
rite
d W
ealth
00
00
00
00
Ear
ned
Wea
lth0
02
6.5
12.
90
0Pr
ofits
and
Fee
s6
19.4
26.
57
20.6
514
.7Sa
lary
2477
.419
61.3
2161
.821
61.8
Wag
es1
3.2
722
.65
14.7
823
.5Pr
ivat
e R
elie
f0
00
00
00
0R
elie
f0
00
00
00
0N
o R
epor
t0
01
3.2
00
00
Hig
h m
ales
> m
oder
ate
mal
es a
t .02
leve
l of
sign
ific
ance
and
the
high
tota
l > m
od-
erat
e to
tal a
t .01
leve
l of
sign
ific
ance
.

O
Tab
le V
I
SCH
OO
L R
AT
ING
OF
STA
TU
SC
HA
RA
CT
ER
IST
ICS
OF
GIF
TE
D S
UB
JEC
TS
ON
HO
USE
TY
PE
HO
USE
TY
PE
MA
LE
FEM
AL
E
HIG
HL
Y G
IFT
ED
MO
DE
RA
TE
LY
GIF
TE
DH
IGH
LY
GIF
TE
DM
OD
ER
AT
EL
YG
IFT
ED
Num
ber
%ag
eN
umbe
r%
age
Num
ber
%ag
eN
umbe
r/G
age
Exc
elle
nt H
ouse
s0
02
6.5
12.
90
0V
ery
Goo
d H
ouse
s6
19.4
13.
22
5.9
617
.6G
ood
Hou
ses
1341
.913
41.9
1750
.08
23.5
Ave
rage
Hou
ses
1135
.512
38.7
1235
.317
50.0
Fair
Hou
ses
13.
22
6.5
25.
91
2.9
Poor
Hou
ses
00
00
00
00
Ver
y Po
or H
ouse
s0
00
00
00
0N
o R
epor
t0
01
3.2
00
25.
9H
igh
mal
es >
mod
erat
e m
ales
at .0
1 le
vel o
f si
gnif
ican
ce.
Hig
h gi
rls
> m
oder
ate
girl
sat
.05
leve
l of
sign
ific
ance
.
Tab
le V
II
SCH
OO
L R
AT
ING
OF
STA
TU
S C
HA
RA
CT
ER
IST
ICS
OF
GIF
TE
D S
UB
JEC
TS
ON
DW
EL
LIN
G A
RE
A
DW
EL
LIN
G A
RE
A
MA
LE
FEM
AL
E
HIG
HL
Y G
IFT
ED
MO
DE
RA
TE
LY
GIF
TE
DH
IGH
LY
GIF
TE
DM
OD
ER
AT
EL
YG
IFT
ED
Num
ber
%ag
eN
umbe
r%
age
Num
ber
%ag
eN
umbe
r%
age
Ver
y H
igh
00
26.
51
2.9
25.
9H
igh
722
.61
3.2
411
.83
8.8
Abo
ve A
vera
ge17
54.8
1548
.423
67.6
1544
.1A
vera
ge6
19.4
1238
.75
14.7
1029
.4B
elow
Ave
rage
00
00
12.
91
2.9
Low
00
00
00
00
Ver
y L
ow0
00
00
00
0N
o R
epor
t1
3.2
13.
20
03
8.8
Hig
h m
ales
> m
oder
ate
mal
es a
t .01
leve
l of
sign
ific
ance
.T
otal
hig
h gr
oup
> to
tal m
oder
ate
grou
p at
.01
leve
l of
sign
ific
ance
.
Tab
le V
III
RA
TIN
G O
F E
CO
NO
MIC
ST
AT
US
OF
HO
ME
BY
PA
RE
NT
S O
F G
IFT
ED
SU
BJE
CT
S
AFF
LU
EN
TC
OM
FOR
TA
BL
EM
OD
ER
AT
EM
AR
GIN
AL
1
DE
PEN
DE
NT
NO
RE
SPO
NSE
Num
ber
%ag
eN
umbe
r%
age
Num
ber
%ag
eN
umbe
r%
age
Num
ber
%ag
eN
umbe
r%
age
Mal
e
Hig
hly
Gif
ted
13.
223
74.2
722
.60
00
00
0
Mod
erat
ely
Gif
ted
00
2064
.511
35.5
00
00
00
Fem
ale
Hig
hly
Gif
ted
00
1544
.118
52.9
12.
90
00
0
Mod
erat
ely
Gif
ted
00
2264
.711
32.4
00
00
129
Tot
al
Hig
hly
Gif
ted
1.8
3829
.325
19.5
1.8
00
00
Mod
erat
ely
Gif
ted
00
4232
.322
16.9
00
00
1.8
,
Tab
le I
X
RA
TIN
G O
F C
OM
MU
NIT
Y B
Y P
AR
EN
TO
F G
IFT
ED
SU
BJE
CT
EX
CE
LL
EN
TG
OO
DFA
IRPO
OR
NO
RE
SPO
NSE
Nui
nber
%ag
eN
umbe
r%
age
Num
ber
%ag
eN
umbe
r%
age
Num
ber
I%
age
Mal
e
Hig
hly
Gif
ted
1445
.216
51.6
13.
20
00
0
Mod
erat
ely
Gif
ted
722
.618
58.1
412
.91
3.2
13.
2
Fem
ale
Hig
hly
Gif
ted
823
.521
61.8
411
.80
01
2.9
Mod
erat
ely
Gif
ted
1235
.319
55.9
12.
90
02
5.9
Tot
al
Hig
hly
Gif
ted
2233
.837
56.9
57.
70
01
1.5
Mod
erat
ely
Gif
ted
1929
.237
56.9
57.
71
1.5
34.
6

It is readily apparent that the parents of the subjects in the presentstudy are exceptionally well-educated. This makes the problem of thoseparents who did not have the advantage of advanced education evenmore serious. About 6.5 per cent of the fathers of highly gifted boys andalmost 12 per cent of the fathers of highly gifted girls had less than ahigh school education. Over 19 per cent of the fathers of moderatelygifted boys and 11 per cent of the fathers of moderately gifted girls haveless than a high school education.
The educational level of the mothers of the children in this study,while less than that of the fathers, is similar in the pattern it follows.The best educated group are the mothers of the highly gifted boys andgirls, about 16 per cent and 18 per cent respectively having five or moreyears college. In the case of the mothers, those of the highly gifted girlsare slightly better educated than are the mothers of the highly giftedboys. Only about one-third as many mothers have five or more years ofcollege than do the fathers. About 6.5 per cent and six per cent of themothers of moderately gifted boys and girls, respectively, have fiveor more years of college.
Almost 50 per cent of the mothers of highly gifted boys and highlygifted girls have four years of college, while about 23 per cent of themothers of the moderately gifted boys and girls have four years of col-lege. All of the mothers of highly gifted boys have at least a high schooleducation, but over 19 per cent of the mothers of moderately gifted boyshave less than a high school education. About nine per cent of themothers of highly gifted and moderately gifted girls have less than ahigh school education
The educational level of the mothers tends to follow, although at aslightly lower level, th;.,t of the fathers. The educational level of thegroups of parents is exceptionally high, with almost startling exceptionsat the less than high school graduation level.
Occupational Level of Father
The occupational level of the fathers of the children in this studyassumed particular significance in interpreting any differences whichmight be found between the moderately and highly gifted groups.Whether these differences were ones due to ability level, or some otherartifact such as occupational level of parents, could probably not beanswered with certainty. It was essential, however, to determine if differ-ences in occupational level existed so that it would be known if any suchpossible differences might have influenced other comparisons betweenthe two groups of children.
24
Tab
le X
RA
TIN
G O
F O
CC
UPA
TIO
NS
OF
FAT
HE
RS
OF
GIF
TE
DSU
BJE
CT
S B
YSC
HO
OL
AU
TH
OR
ITIE
S
(Fro
m I
ndex
of
Stat
usC
hara
cter
istic
s, W
. L. W
arne
r,ad
apte
d)
CA
TE
GO
RY
MA
LE
SFE
MA
LE
S
HIG
HL
Y G
IFT
ED
Num
ber
%ag
e
MO
DE
RA
TE
LY
GIF
TE
DN
umbe
r%
age
HIG
HL
Y G
IFT
ED
Num
ber
%ag
e
MO
DE
RA
TE
LY
GIF
TE
DN
umbe
r%
age
Hig
hly
Prof
essi
onal
722
.66
19.4
720
.64
11.8
Prof
essi
onal
1548
.411
35.5
1441
.211
32.4
Sem
i-pr
ofes
sion
al6
19.4
825
.86
17.6
1029
.4
Sale
s an
d C
leri
cal
13.
23
9.7
720
.66
17.6
Skill
ed1
3.2
26.
50
02
5.9
Uns
kille
d0
00
00
00
0
No
Res
pons
e1
3.2
13.
20
01
2.9

Tab
le X
I
OC
CU
PAT
ION
S O
F FA
TH
ER
RE
POR
TE
D B
Y P
AR
EN
TS
ON
HO
ME
INFO
RM
AT
ION
RE
POR
T
OC
CU
PAT
ION
S
MA
LE
SFE
MA
LE
S
HIG
HL
Y G
IFT
ED
Num
ber
%ag
eG
IFT
ED
Num
ber
%ag
eH
IGH
LY
GIF
TE
DN
umbe
r%
age
MO
DE
RA
TE
LY
GIF
TE
DN
umbe
r%
age
Prof
essi
onal
and
Man
ager
ial
2167
.716
51.6
2058
.817
50.0
Cle
rica
l3
9.7
26.
54
11.8
12.
9
Serv
ice
39.
71
3.2
25.
95
14.7
Agr
icul
ture
13.
21
3.2
12.
90
0
Skill
ed1
3.2
619
.47
20.6
823
.5
Sem
i-sk
illed
26.
53
9.7
00
12.
9
Uns
kille
d0
01
3.2
00
00
Une
mpl
oyed
00
13.
20
00
0

1011.11.1010110110100011.0.
The rating of occupations of fathers by school authorities was doneon the Index of Status Characteristics, Occupations, of Warner. Thedescriptions as used by Warner, with only minor modifications, werepresented to the school authorities. The results are reported in Table X.Over 70 per cent of the fathers were rated in the highly professionalor professional category for the fathers of the highly gifted male subjects,with only slightly over 60 per cent of the fathers of the highly giftedfemale subjects being so rated. Fifty-five per cent of the fathers of themoderately gifted male subjects were rated in the highly professionaland professional categories, while only about 44 per cent of the fathersof the moderately gifted female were so rated.
Using the Dictionary of Occupational Titles classification for theparents' rating of the father's occupation on the Ilome Information Reportprovided the information reported in Table XI. The reports are remark-ably similar for the fathers' occupations of the highly gifted male andhighly gifted female subjects. The differences for the moderately giftedgroups are greater, but are still close.
A check was made on the accuracy of the children's responses totheir father's occupation by comparing the reports of the children in apersonal interview with the occupation of the father as reported by theparent. The moderately gifted girls were accurate only approximately50 per cent of the time, while the highly gifted girls had 62 per centaccuracy. Maintaining their reputation for variability, the boys wereboth the most and least accurate with the moderately gifted boys beingaccurate only 45 per cent of the time and the highly gifted boys beingaccurate 73 per cent of the time. The highly gifted group was accurateapproximately 67 per cent of the time, while the moderately gifted groupwas accurate only 48 per cent of the time. The errors generally wereeither over-statement of the level of the father's occupation, or knowledgeof where he worked without specific knowledge of the type of workwhich he did.
Summary
Thirty-one highly gifted (148 I.Q. score and above) elementaryschool boys and 34 highly gifted elementary school girls were matchedwith equal numbers of moderately gifted boys and girls (I.Q. scoresbetween 120 and 135) in the same grade and in the same county classi-fication from throughout the State of Ohio. The mean I.Q. score of thehighly gifted group (N=65) was 158, while the mean I.Q. score of themoderately gifted group (N=65) was 129.
The children in this study were found to be from small families(mean size of family, 2.5 children) and the ,city were found to befirst born. Their parents (about 90 per cent) were married and living27

together, and were in the mean age range of 35 to 40, except for thehighly gifted female group whose parents were in the 40 to 45 age range.The children were mostly ( about 60 per cent) from Protestant homes.There is a variety of findings which suggest significant differences be-tween the economic level of the moderately gifted and the highly gifted
groups, without exception in favor of the highly gifted group.
The educational level of the fathers of the highly gifted was higherthan the educational level of the fathers of the moderately gifted. Thesame was true of the educational level of the mothers of the subjects in
this study.Occupational ratings of fathers of subjects, done both by the parents
themselves and by the school authorities showed remarkable similarity,with more of the fathers of highly gifted subjects being in the professionallevels. The children themselves were not good sources of informationabout the occupational level of their fathers.
Taken in its entirety, the highly gifted subjects came from a moreaffluent background than did the moderately gifted; the educational level
of their parents was higher; and in all other respects which were checked,
the highly gifted group appeared to be favored.
REFERENCES
Barbe, Walter B. "Characteristics of Gifted Children," Educational Administrationand Supervision, XLI ( April, 1955), 207-217.
Barbe, Walter B. "A Study of Family Background of the Gifted," The Journal ofEducational Psychology, XLVII ( May, 1956), 302-309.
Haggerty, M. E. and Nash, Harry B. "Mental Capacity of Children and PaternalOccupation," Journal of Educational Psychology, XV (December, 1924), 559-72.
State of Ohio, Department of Education. Educational Directory, 1961-1962. 1961.
State of Ohio, Department of Industrial and Economic Development. Ohio Popula-
tion: Growth and Distribution. 1960.
Terman, Lewis M. and Oden, Melita H. The Gifted Child Grows Up; Twenty-fiveYears' Follow-up of a Superior Group. Vol. IV: Genetic Studies of Genius.Stanford, California: Stanford University Press. 1947.
U.S. Department of Labor. Dictionary of Occupational Titles. Vol. I, 1949.
Warner, William Lloyd. Social Class in America. Chicago: Science Research As-sociates, 1949.
Witty, Paul A., Kopel, David, and Coomer, Ann. Diagnostic Child Study Record-Home Information Report. Evanston, Illinois: Northwestern University Psycho-Educational Clinic.
28
5

Chapter IV
EDUCATIONAL DEVELOPMENT AND ABILITIES
The subjects in the present study were all chosen on the basis oftheir intellectual ability, as measured by their ability to perform on astandardized, individual measure of intelligence. There can be no doubtbut that such tests measure academic potential, or the ability to achievein school, so that the outstanding results obtained and reported in thissection are what should be expected.
Because of the expected superior achievement rccord, it was not thepurpose of this section to report merely the results of achievement test-ing, although this will be done, but to present data collected from moder-ately and highly gifted groups of boys and girls in terms of their educa-tional experiences, achievements and abilities.
Kindergarten Attendance
Data concerning kindergarten attendance was collected only fromthe interview sample. Thirty-one of the interview sample attendedkindergarten. Of these, 19 were from the highly gifted group and 12were from the moderately gifted group. Nine of the interview group didnot attend kindergarten. All of the highly gifted girls (100 per cent) inthe interview sample attended kindergarten, while 90 per cent of thehighly gifted boys attended. Seventy per cent of the moderately giftedgirls and 50 per cent of the moderately gifted boys attended kindergarten.
Grade Skipping
Information concerning grades skipped was obtained from theparents' report as well as from the children themselves in the interviewsample. The children were completely reliable in reporting if they hadskipped a grade, for each instance reported by a child was verified by thereport of the parent.
Thirteen instances of grade skipping, or ten per cent of the total group,were reported by parents of the subjects in this study. Only an insig-nificant number of the highly gifted boys (N =2) and the moderatelygifted boys (N=1 ) and girls (N=1) were grade skipped and all of thesewere in the first grade. In the highly gifted group of girls, however, atotal of nine (26.5 per cent) were grade skipped. Three highly giftedgirls skipped the first grade, four skipped the second, one skipped the
29

third, and one skipped the fifth. There is a clear ithe grade skipping, as it occurred with this grouphighly gifted girls.
Age Learned to ReaThe ages at which the children in this
from one year old through seven years oldat age one and three at age seven. The mof the four groups, with mean ages of 5.35.1 for the highly gifted girls, 5.7 for5.6 for the moderately gifted girls. Igroup, both boys and girls, learnedmoderately gifted group, and thatgroups learned before the age ofgirls, more than half learned treported cases who learned tohighly gifted boys, and twoage seven were moderatelyately gifted girl.
Ra
d
dication that most ofof subjects, is done by
study learned to read was, with only one case reported
odal point was age six for eachyears for the highly gifted boys,
the moderately gifted boys andis apparent that the highly gifted
to read slightly earlier than did thea sizeable number of each of the foursix. In the case of the highly gifted
o read before the age of six. The tworead at age one and age two were both
f the three who did not learn to read untilgifted boys and the other one was a moder-
te of Progress in SchoolSince all of the subjects in this study were classified as gifted, either
highly or moderately, information concerning their rate of progress inschool, as their parents perceived it, was thought to be important. Aswas expected, the majority of the responses, ranging from 61 per cent forthe moderately gifted boys to 85 per cent for the highly gifted girls,stated that the child had a fast rate of progress. A higher percentage ofgirls, both highly and moderately gifted, were reported as having fastprogress than boys. About 61 per cent of the moderately gifted boysand 64.5 per cent of the highly gifted boys were reported as having madefast progress in school. Almost 71 per cent of the moderately gifted girlsand 85.3 per cent of the highly gifted girls were reported as making fastprogress
Obviously such a rating indicates faster progress for the highly giftedgirls, and faster progress for both highly and moderately gifted girls thanthat for boys. There was little difference in the reported rate of schoolprogress of moderately and highly gifted boys.
Special Class Attendance
With the increased attention being given to gifted children, and thestate wide effort to provide educational opportunities for gifted children,it was expected that many of the subjects would be participating in sometype of special program. Certainly for the highly gifted group, who scoreat such a high level above the average group, it was expected that provi-
30
'elf-P.M7FPF
sions would be made. Such was not the case, however. Only six of thechildren, or less than ten per cent, in the highly gifted group had partici-pated in any .type of special class during the regular school day. Onlyfour of the moderately gifted group, or about six per cent, had partici-pated in special classes.
Ten of the highly gifted group and two of the moderately giftedgroup had participated in some type of summer classes. Actually, thissmall number does not indicate any real effort on the part of the parentsor the schools to make any special educational provisions for these chil-dren other than what might be available in the regular classroom.
Iowa Tests of Basic SkillsThe Iowa Tests of Basic Skills were administered to every child in
the study. Excess grade equivalents were determined for each child oneach of the five sub-tests on the Iowa tests (Vocabulary, Reading, TotalLanguage, Total Work Study Skills, Total Arithmetic). Mean excessgrade equivalents were then computed for each of the four groups ofsubjects (moderately gifted boys, moderately gifted girls, highly giftedboys, highly gifted girls). Differences between the mean excess gradeequivalents were calculated and tests of significance were computed todetermine the level of significance. Obtained data concerning thesesignificant differences are reported in Table XII A and B.
In no instance did any child score below his grade placement onany area of the Iowa Test. This is probably an artifact of the procedureby which the children were selected for this study. The study mightindeed have been labeled "high achieving" children as well as giftedchildren. The mean achievement for each of the four groups was at leasttwo years above their actual grade placement.
There was a significant difference at the .01 level on total meanexcess grade equivalents favoring the highly gifted group over the moder-ately gifted group. The ceilings of many achievement tests are not suffi-ciently high to measure completely the achievement of gifted childien.In the present study the ceilings of the tests used were sufficiently high toindicate a significant difference between moderately and highly giftedchildren favoring the highly gifted group.
As the gifted children progressed through school, remembering thatthe subjects were distributed from grade three through grade six, thehighly gifted group demonstrated a greater increase in excess gradeequivalents than did the moderately gifted group. The gap between thehighly gifted and moderately gifted group increases each year as thechildren go from grade to grade in the elementary school. Educationincreases the differences in children's achievement in dircct proportionto their mental ability.
31

Tab
le X
II A
PER
FOR
MA
NC
E O
N I
OW
A T
EST
S O
F B
ASI
C S
KIL
LS
- B
OY
S
BO
YS
ME
AN
GR
AD
E E
QU
IVA
LE
NT
LE
VE
L
Voc
abul
ary
Rea
ding
Com
preh
ensi
onL
angu
age
Skill
sW
ork
`;tu
dyH
abits
Ari
thm
etic
Skill
s
GR
AD
E 3
Hig
hly
Gif
ted
4.9
5.5
5.3
5.4
4.6
Mod
erat
ely
Gif
ted
4.8
4.7
4.7
5.1
4.8
Exc
ess
Gra
deE
quiv
alen
t Dif
fere
nce
0.1
0.8
0.6
0.3
-0.2
GR
AD
E 4
Hig
hly
Gif
ted
7.3
8.3
7.1
6.5
5.9
Mod
erat
ely
Gif
ted
6.1
7.3
6.7
6.2
6.0
Exc
ess
Gra
deE
quiv
alen
t Dif
fere
nce
1.2*
1.0
0.4
0.3
--0.
1
GR
AD
E 5
Hig
hly
Gif
ted
8.8
9.0
9.3
7.9
6.9
Mod
erat
ely
Gif
ted
7.9
7.9
8.6
7.3
6.8
a
Exc
ess
Gra
deE
quiv
alen
t Dif
fere
nce
0.9
1.1
0.7
0,6
0.1
GR
AD
E 6
Hig
hly
Gif
ted
10.3
10.1
10.2
9.8
9.1
Mod
erat
ely
Gif
ted
9.0
9.1
9.6
8.9
8.0
Exc
ess
Gra
deE
quiv
alen
t Dif
fere
nce
1.3*
*1.
0**
0.6
0.9*
*1.
1**
**E
xces
s gr
ade
equi
vale
nt s
igni
fica
nt a
t the
.01
leve
l*E
xces
s gr
ade
equi
vale
nt s
igni
fica
nt a
t the
.05
leve
l
Tab
le X
II B
PER
FOR
MA
NC
E O
N I
OW
A T
EST
S O
F B
ASI
C S
KIL
LS
GIR
LS
GIR
LS
ME
AN
GR
AD
E E
QU
IVA
LE
NT
LE
VE
L
Voc
abul
ary
Rea
ding
Com
preh
ensi
onL
angu
age
Skill
sW
ork
Stud
yH
abits
Ari
thm
etic
Skill
s
GR
AD
E 3
Hig
hly
Gif
ted
6.5
6.9
5.5
5.6
5.4
Mod
erat
ely
Gif
ted
6.0
7.7
5.6
5.0
5.3
Exc
ess
Gra
deE
quiv
alen
t Dif
fere
nce
0.5
-0.8
-0.1
0.6
0.1
GR
AD
E 4
Hig
hly
Gif
ted
7.3
8.9
8.3
6.4
6.2
Mod
erat
ely
Gif
ted
6.5
6.7
5.8
5.4
Exc
ess
Gra
deE
quiv
alen
t Dif
fere
nce
1.2
2.4*
*1.
60.
60.
8
GR
AD
E 5
Hig
hly
Gif
ted
9.1
9.8
9.7
7.7
6.9
Mod
erat
ely
Gif
ted
8.8
8.1
9.0
7.4
6.9
Exc
ess
Gra
deE
quiv
alen
t Dif
fere
nce
0.3
1.7*
*0.
70.
30.
0
GR
AD
E 6
IIig
h ly
Gif
ted
10.6
10.0
10.4
9.6
9.0
Mod
erat
ely
Gif
ted
9.2
9.1
10.2
8.7
8.2
Exc
ess
Gra
deE
quiv
alen
t Dif
fere
nce
1.4*
*0.
9**
0.2
0.9*
*0.
8**
**E
xces
s gr
ade
equi
vale
nt s
igni
fica
nt a
t the
.01
leve
l*E
xces
s gr
ade
equi
vale
nt s
igni
fica
nt a
t the
.05
leve
l
The Total Language score on the Iowa Testswhich no significant differences were noted atother areas measured on the test showed sigat least one grade level, with all areas ewesignificant difference at the sixth grade level.
The differences between the achievemeappeared to decrease as the children progrades. The girls achieved better than diof school, but these differences became ntary grades.
Autobiog
Autobiographies were obtainestudy. The children were directe
I. When and where youII. About your parents,
III. Where you live nIV. What you like tV. What you wa
VI. Anything els
Attempts to treat thunsuccessful, but itof their writing. Tin Table XIII.
is the only area inany grade level. All
nificant differences int Language showing a
nt scores of boys and girlsress through the elementary
d the boys in the earlier yearsegligible in the higher elemen-
aphies
from each of the subjects in theto write about themselves including:
were born.
brothers, sisters, and friends.
OW.
o do. (hobbies, sports, and other interests)t to do in the future.
e about yourself.
e autobiographies on any qualitative factors werewas possible to measure certain mechanical aspects
he data obtained from the autobiographies are reported
The length of the opening or first sentence in which the child writesabout his hobbies was used in measuring sentence length. The numberof words in each sentence was counted and a mean sentence length foreach of the four groups in the study was obtained. There were onlyslight differences, which were insignificant, between the sentence lengthof the highly gifted and the moderately gifted subjects: however, thesedifferences did favor the higher group. The average sentence lengthwas between about ten and eleven words.
The number of adjectives, adverbs and prepositional phrases used inthe paragraph discussing hobbies were then counted for each subjectand the mean number obtained for each of the groups. Between two andthree adjectives were used, with the highly gifted bays using the mostand the moderately gifted girls using the fewest. The mean number ofadverbs used ranged from .97 for the moderately gifted boys to 1.7 forthe highly gifted boys. Approximately 1.5 prepositional phrases wereused by each of the four groups.
34

Table XIII
MEAN SCV"ES ON MECHANICAL ASPECTS OF WRITING
HIGHBOYS
MODERATEBOYS
HIGHGIRLS
MODERATEGIRLS
Sentence Length 11.00 10.20 10.32 9.97
Adjectives 3.12 2.30 2.35 2.08
Adverbs 1.74 .97 1.24 1.47
Prepositional Phrases 1.55 1.51 1.59 L76
Word Difficulty Level 5.79 4.90 5.09 5.31
The three hardest words in the paragraph on hobbies were obtainedand, using Thomdike and Lorge's Teacher's Word Book of 30,000 Words,the mean level of word difficulty was determined. The highly giftedboys used the highest level of words, while the moderately gifted boysused the least difficult level of words.
There were no significant differences between the sex-I.Q. groupsnor between the, total highly gifted group and total moderately giftedgroup.
Vocational Interests
Information concerning the occupational choices of the subjects wasobtained from the children on their autobiographies and from the parentsof the children on the home information record. It must be noted thatthese children are still very young, the oldest being only in the sixthgrade, but the evidence clearly indicates that even though they may nothave actually decided upon the vocation which they may be expected tofollow, they have done a considerable amount of vocational planning.
From the autobiographies it was determined that the boys, bothhighly gifted and moderately gifted, had chosen 17 different occupationsin which they thought they were interested. Both highly gifted andmoderately gifted girls chose 12 different occupations. Even though therewas little agreement as to vocational preference, diversity of interest wasvery apparent. Girls, both in the moderate and high groups, choseteaching first and medical related professions (nurse, doctor, etc.) next.Boys chose science in the greatest numbers and medical related positionsnext.
Classification of the vocational interests of the children as reportedby their parents indicated that about 30 per cent of the boys (bothmoderate and high groups ) had no specific vocational interest, but thatonly 20 per cent of the high group of girls and about 40 per cent of the
35
moderate group of girls had no specific vocational interest. Once againthere is a clear indication of the difference in the two groups of girls,with less or no difference in the two groups of boys. Virtually all of thechildren who had an interest, had one in the professional or managerialcategory.
Creative ThinkTwo tests from the Minnesota
(Torrance, 1962) were administethey were interviewed. The Asknation were then scored accordifive subscores, Fluency, Adeqt.tion, were derived. Additionas the unweighted sum ofand reliability of these testYamamoto (1962b).
As the first step ofcreativity scores wereresults are presented
It is seen fromsignificant, whilecorrelation betwing abilities arenegligible andand Hollandparently noKinnon, 1
ing Abilities
attcry of Tests of Creative Thinkinged to each of the 40 children when
and-Guess Test and the Test of Imagi-g to the manual (Yamamoto, 1962a) and
acy, Flexibility, Originality, and Elabora-ally, a Total Creativity score was obtained
hese subscores. For information on validitys, readers are referred to Torrance (1962) and
analysis, correlation coefficients between I.Q. andcalculated within each subject group and the
in Table XIV.
Table XIV that none of the coefficients is statisticallyheir size is in agreement with the generalization that
en measures of intelligence and those of creative think-low (.2 .4) among the general population and almost
even negative among selected, high-ability subjects (Taylor, 1962; Yamamoto, 1961). Such a low correlation is ap-an artifact of the restricted range of scores involved ( Mac-
962 ).
Although thcre seems to be a tendency for the moderately giftedgroup to reveal a slightly higher (negative) correlation than that shownby the highly gifted group, none of the group differences is statisticallysignificant.
Next, a point-biserial correlation coefficient was computed for theo groups, highly and moderately gifted, on each of the five creativity
subscores and on the total. The results are shown in Table XV.It is observed from Table XV that, on all but one of the creativity
scores derived, the point-biserial correlation was low but statisticallysignificant, indicating some association between the two variables, I.Q.and creativity.
In view of the suggested association, a further analysis of the resultswas made by application of 2 (I.Q. level) x 2 (sex) analysis of variancetechnique. Table XVI presents mean scores for various subgroups andTable XVII the results of analysis.
36.
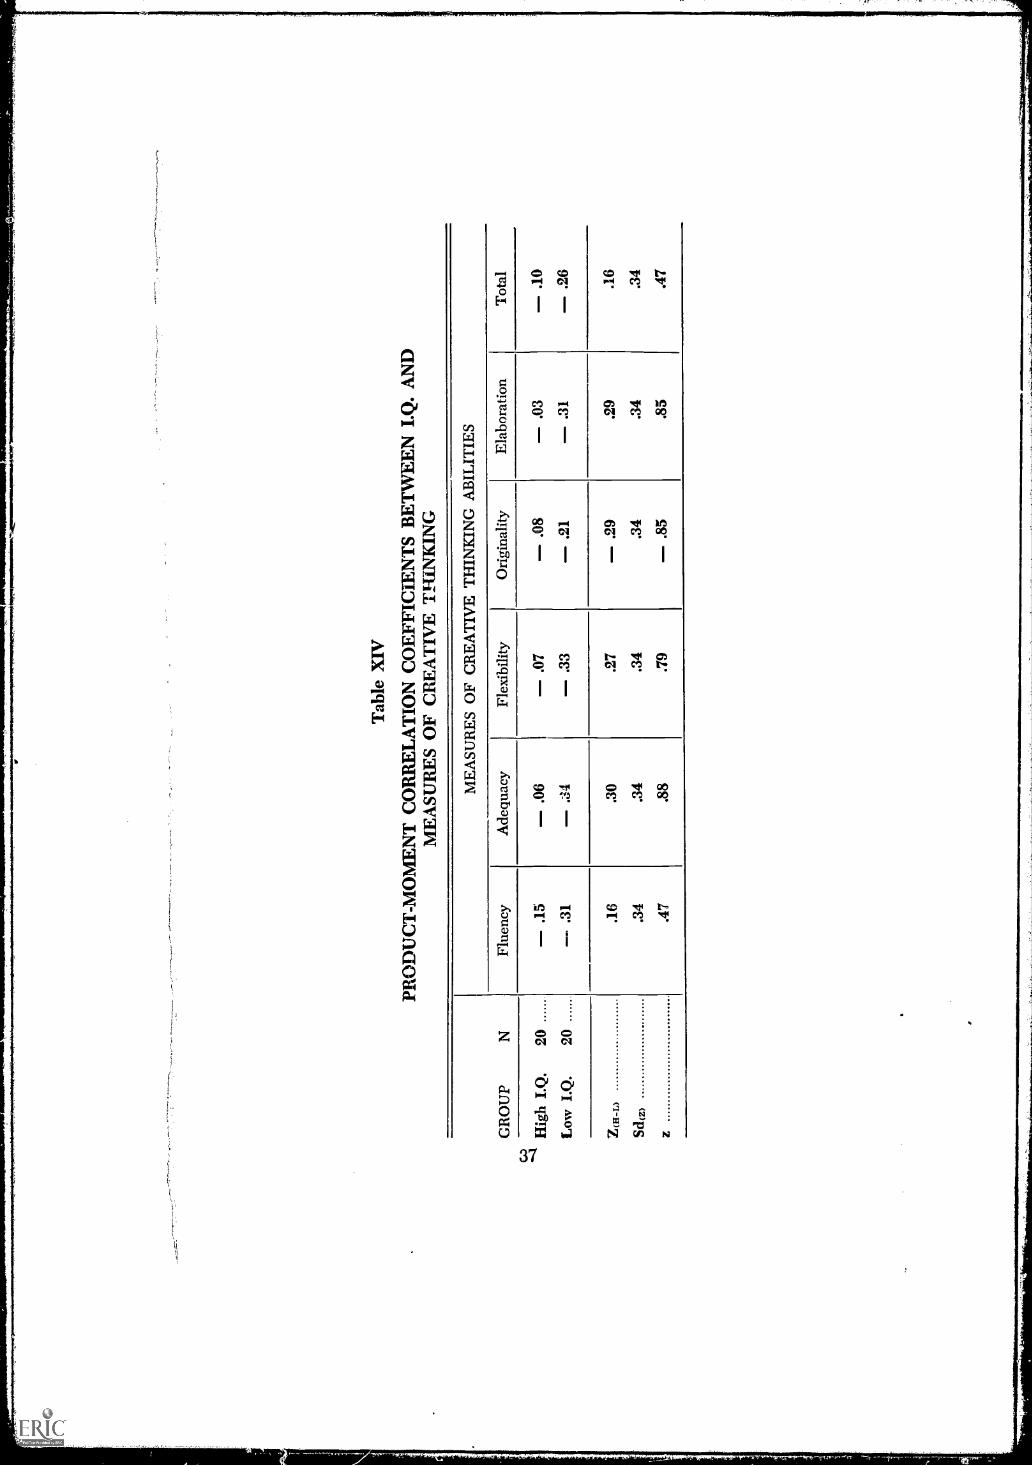
Tab
le X
IV
PRO
DU
CT
-MO
ME
NT
CO
RR
EL
AT
ION
CO
EFF
ICIE
NT
S B
ET
WE
EN
I.Q
. AN
DM
EA
SUR
ES
OF
CR
EA
TIV
E T
HIN
KIN
G
GR
OU
P0.
1
ME
ASU
RE
S O
F C
RE
AT
IVE
TH
INK
ING
AB
ILIT
IES
Flue
ncy
Ade
quac
yFl
exib
ility
Ori
gina
lity
Ela
bora
tion
Tot
al
Hig
h I.
Q.
20-
.15
- .0
6-
.07
- .0
8-
.03
- .1
0
Low
I.Q
.20
- .3
1-
.S4
- .3
3-
.21
- .3
1-
.26
Z(l
-L)
.16
.30
.27
- .2
9.2
9.1
6
Sd(z
).3
4.3
4.3
4.3
4.3
4.3
4
z.4
7.8
8.7
9-
.85
.85
.47
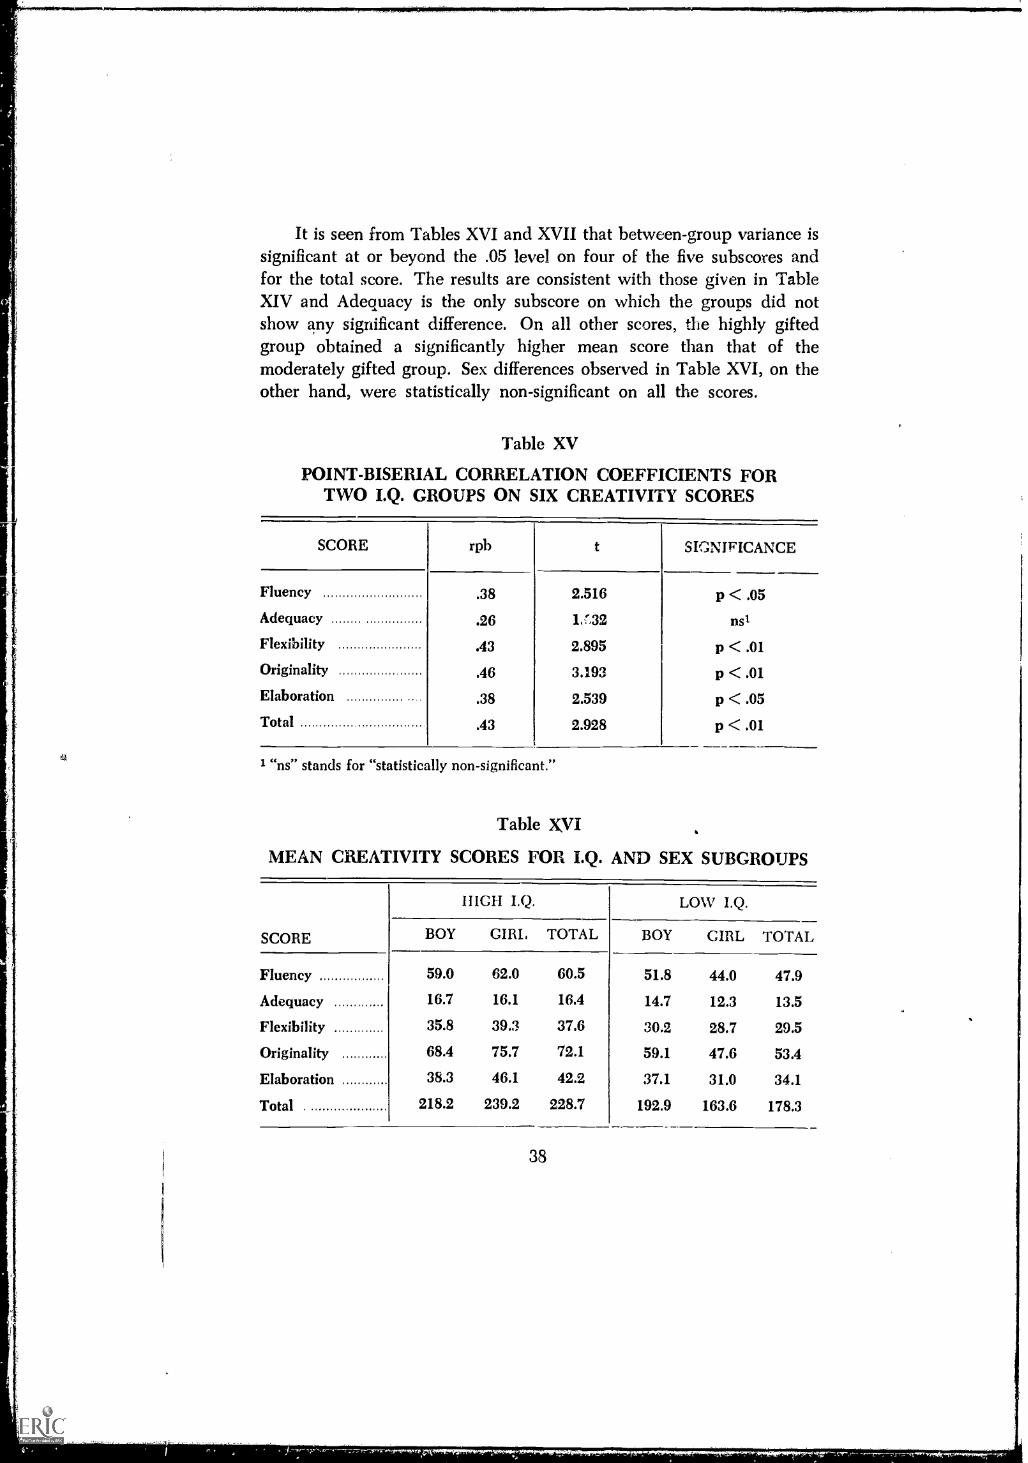
It is seen from Tables XVI and XVII that between-group variance issignificant at or beyond the .05 level on four of the five subscores andfor the total score. The results are consistent with those given in TableXIV and Adequacy is the only subscore on which the groups did notshow any significant difference. On all other scores, the highly giftedgroup obtained a significantly higher mean score than that of themoderately gifted group. Sex differences observed in Table XVI, on theother hand, were statistically non-significant on all the scores.
Table XV
POINT-BISERIAL CORRELATION COEFFICIENTS FORTWO I.Q. GROUPS ON SIX CREATIVITY SCORES
SCORE rpb t SIGNIFICANCE
Fluency .38 2.516 p < .05Adequacy .26 1. n32 ns1
Flexibility .43 2.895 p < .01Originality .46 3.193 p < .01Elaboration .38 2.539 p < .05Total .43 2.928 p < .01
1 "ns" stands for "statistically non-significant."
Table XVI
MEAN CREATIVITY SCORES FOR I.Q. AND SEX SUBGROUPS
SCORE
HIGH I.Q. LOW I.Q.
BOY CIRI, TOTAL BOY GIRL TOTAL
Fluency 59.0 62.0 60.5 51.8 44.0 47.9
Adequacy 16.7 16.1 16.4 14.7 12.3 13.5
Flexibility 35.8 39.3 37.6 30.2 28.7 29.5
Originality 68.4 75.7 72.1 59.1 47.6 53.4
Elaboration 38.3 46.1 42.2 37.1 31.0 34.1
Total 218.2 239.2 228.7 192.9 163.6 178.3
38

Table XVIIANALYSIS OF VARIANCE OF CREATIVITY SCORES
SCORESOURCE OFVARIATION d.f.
MEANSQUARE F
Fluency Group 1 1587.6 6.2*Sex 1 57.6 < 1Group x Sex j 1 291.6 1.2Error i 36 254.4
Adequacy Group 1 84.1 2.6Sex 1 22.5 < 1Group x Sex 1 8.1 < 1Error 36 32.5
Flexibility Group 1 656.1 8.2**Sex 1 10.0 < 1Group x Sex 1 62.5 < 1Error 36 80.5
Originality Group 1 3496.9 10.4**Sex 1 44.1 < 1Group x Sex 1 883.6 2.6Error 36 336.4
Elaboration Group 1 639.3 6.7*Sex 1 7.3 < 1Group x Sex 1 507.9 5A*Error 36 94.8
Total Group 1 25452.1 8.6**Sex 1 172.3 < 1Group x Sex 1 6325.1 2.1Error 36 2953.0
*1) < .05**I) < .01
There was significant group x sex interaction on Elaboration. Figure2 reveals that the interaction effects are mainly from among girls and notfrom among boys. high I.Q. girls scored much higher on Elaborationthan did lower I.Q. girls, thus causing the significant group effects.
Special Talents or Skills and Limitations
Information concerning talents or skills of the children in this studywas obtained from the home information report and from the students inthe interview group. Because the group consisted entirely of children
39

of high I.Q., it is not unusual to expect a wide variety of talents andskills. Noteworthy, from among a wide-spread list of abilities, however,is that all of the highly gifted girls (100 per cent) in the interview groupplay some musical instrument, while only half (50 per cent) of themoderately gifted girls play a musical instrument. Only 20 per cent of thegifted boys, in both the moderately and the highly gifted interviewgroups, play a musical instrument.
Information concerning special abilities in school revealed that 45.2per cent of the highly gifted boys had special ability in reading, whileonly 12.9 per cent of the moderately gifted boys had special ability in
Figure 2
GROUP x SEX INTERACTION ON ELABORATION SCORE
49
48
46
45
4443
42
4o
39
38
3736
3534
33
32
31
HighI.Q.
40
Girls
Low
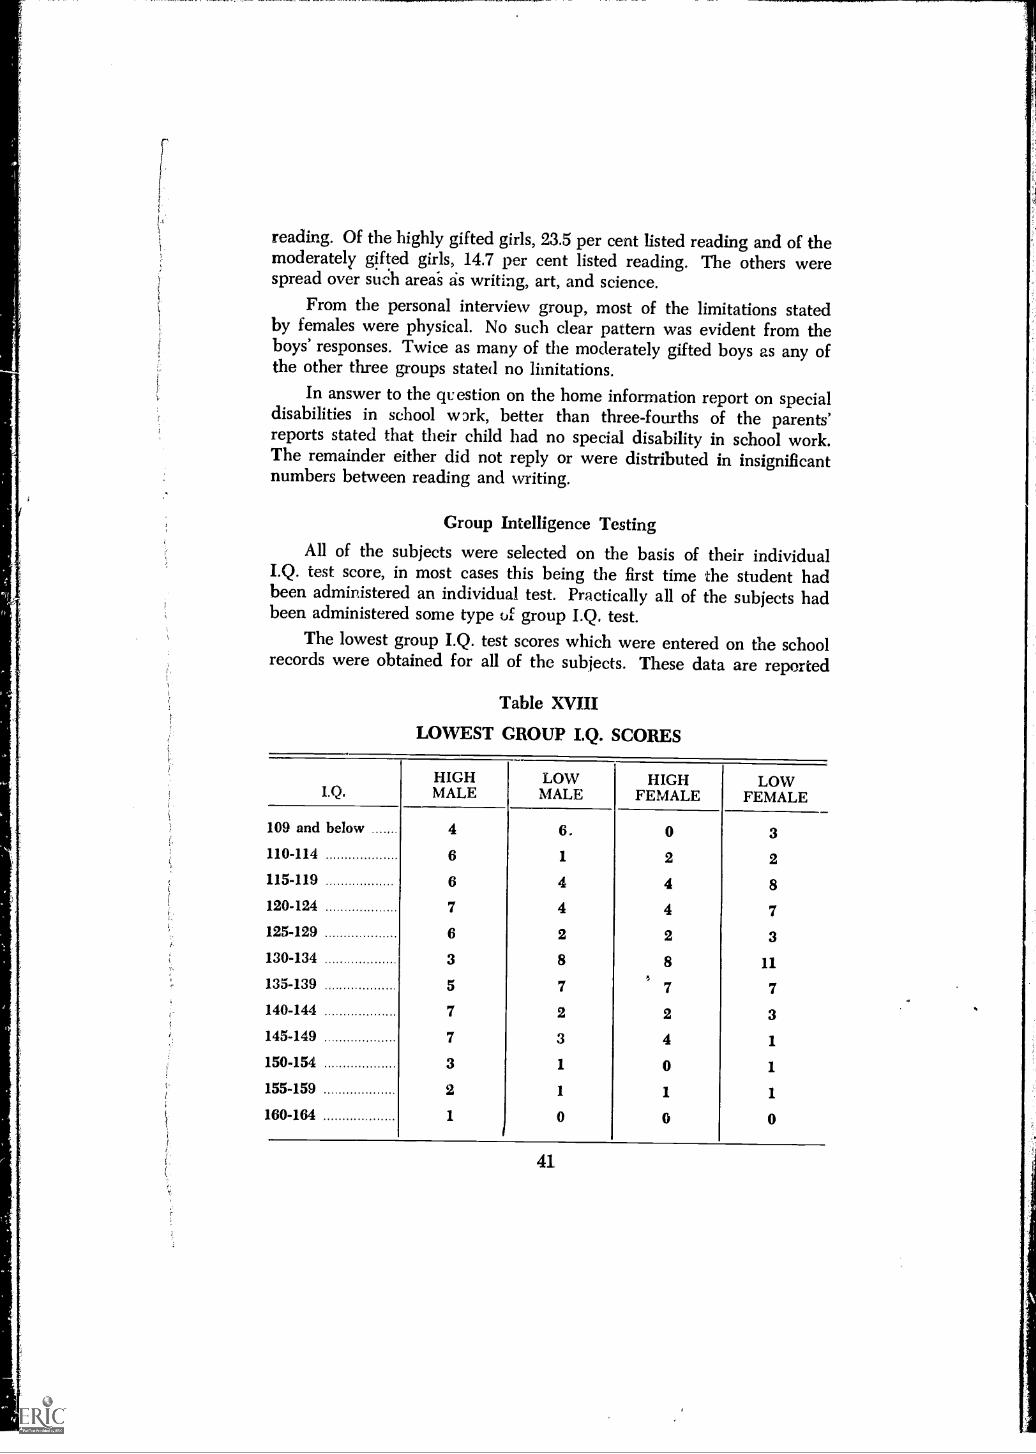
reading. Of the highly gifted girls, 23.5 per cent listed reading and of themoderately gifted girls, 14.7 per cent listed reading. The others werespread over such areas as writing, art, and science.
From the personal interview group, most of the limitations statedby females were physical. No such clear pattern was evident from theboys' responses. Twice as many of the moderately gifted boys as any ofthe other three groups stated no limitations.
In answer to the question on the home information report on specialdisabilities in school w Drk, better than three-fourths of the parents'reports stated that their child had no special disability in school work.The remainder either did not reply or were distributed in insignificantnumbers between reading and writing.
Group Intelligence TestingAll of the subjects were selected on the basis of their individual
I.Q. test score, in most cases this being the first time the student hadbeen administered an individual test. Practically all of the subjects hadbeen administered some type of group I.Q. test.
The lowest group I.Q. test scores which were entered on the schoolrecords were obtained for all of the subjects. These data are reported
Table XVIII
LOWEST GROUP I.Q. SCORES
I.Q.HIGHMALE
LOWMALE
HIGHFEMALE
LOWFEMALE
109 and below 4 6. 0 3110-114 6 1 2 2115-119 6 4 4 8120-124 7 4 4 7125-129 6 2 2 3130-134 3 8 8 11
,5
135-139 5 7 7 7140-144 7 2 2 3145-149 7 3 4 1
150-154 3 1 0 1
155-159 2 1 1 1
160-164 1 0 0 0
41,
in Table XVIII. The alarmingly large number of each of the four groupswho had scored on a group test below the lower cut-off point clearlyindicates the concern which must be expressed for the use of group teststo identify gifted children. Even the highly gifted group, who scored148 I.Q. or above had many instances in which the child had scored ona group test below 120 1.Q., or a minimum of 28 points lower than hisscore on the individual test.
Taking the most recent group I.Q. score provides evidence lessdramatic, but equally disturbing, concerning the use of group I.Q. teststo identify gifted children. About six per cent of the total matchedpopulation would not have been included in this study had group I.Q.tests been used because they failed to score above the 120 cut-off point.Had group I.Q. test results been depended upon, the highly gifted groupwould have contained only 27 per cent of the same population.
Mental Qualities
The ratings by parents of their children's mental qualities arereported in Table XIX. As would be expected, ratings were high on"general intelligence" and "success in school work" for all groups, butmore frequently reported to be high for the highly gifted group. In"initiative and self-direction" the data indicates more "high" ratings forthe highly gifted group, particularly for the girls. Ratings on creativitydo not agree with scores reported previously, for the highly gifted groupwas not reported "high" in creativity more often than the moderate group.Lack of agreement as to what is creativity probably accounts for thisdifference. As expected, fewer subjects were rated "high" in "mechanicalproficiency" than in any other area noted. There was clear indicationfrom the ratings of "oral expression" that the highly gifted group wasfavored over the moderately gifted group.
Summary
It is readily apparent that the subjects in the present study do notdiffer from the subjects in other studies of the gifted. Their academicachievement is commensurate with their ability, they learn to read earlyand they make rapid progress in school.. There is indication that forthe subjects in this study the highly gifted group scores higher on meas-ures of creativity than the moderately gifted group. Group I.Q. tests,while measuring partially the abilities of many of the gifted children,do exclude some of the children of very high ability.
42

Tab
le X
IX
PAR
EN
TS'
RA
TIN
GS
OF
CH
ILD
ON
ME
NT
AL
QU
AL
ITIE
S
TR
AIT
S
RA
TIN
GS
GE
NE
RA
LIN
TE
LL
IGE
NC
E
Num
ber
%ag
e
INIT
IAT
IVE
AN
D S
EL
F-D
IRE
CT
ION
Num
ber
%ag
e
CR
EA
TIV
EA
BIL
ITY
Num
ber
%ag
e
ME
CH
AN
ICA
LPR
OFI
CIE
NC
Y
Num
ber
%ag
e
OR
AL
EX
PRE
SSIO
N
Num
ber
%ag
e
SUC
CE
SS I
NSC
HO
OL
WO
RK
Num
ber
%ag
e
Hig
h27
87.1
1858
.17
22.6
1135
.522
71.0
2683
.9H
igh
Ave
rage
412
.912
38.7
1858
.115
48.4
929
.05
16.1
Boy
sB
elow
Ave
rage
00
00
516
.15
16.1
00
00
Unc
erta
in0
01
3.2
13.
20
00
00
0
Hig
h21
67.7
1651
.610
32.3
f)29
.016
51.6
2374
.2L
owA
vera
ge9
29.0
1445
.216
51.6
1754
.813
41.9
619
.4B
oys
Bel
ow A
vera
ge0
00
04
12.9
412
.91
3.2
13.
2U
ncer
tain
00
00
00
00
00
00
Hig
h30
88.2
2470
.614
41.2
823
.524
70.6
3191
.2H
igh
Ave
rage
25.
99
26,5
1852
.923
67.6
720
.61
2.9
Gir
lsB
elow
Ave
rage
12.
90
01
2.9
00
25.
91
2.9
Unc
erta
in0
00
01
2.9
12.
90
00
0
Hig
h25
73.5
1955
.916
47.1
720
.617
50.0
2573
.5L
owA
vera
ge9
26.5
1544
.118
52.9
2367
.617
50.0
926
.5G
irls
Bel
ow A
vera
ge0
00
0,
00
38.
80
00
0U
ncer
tain
00
00
00
12.
90
00
0

REFERENCES
Barron, Frank. "Creativity and What Research Says About It," N.E.A. Journal, L,No. 3 ( March, 1962), 17.
Brown, E. J. "Highly Intelligent But Not Necessarily Highly Creative," School andCommunity, XLIX ( November, 1962) 24:
Davis, Frederik B., Lesser, Gerald S., and French, Elizabeth G. "Identification andClassroom Behavior of Gifted Elementary School Children," The Gifted Student,Cooperative Monograph 2, U.S. Office of Education, 19-33.
Getzels, Jacob W. and Jackson, Philip W. Creativity and Intelligence. New York:John Wiley and Sons, Inc., 1962.
Kimball, Barbara. "The Sentence-Completion Technique in a Study of ScholasticUnderachievement," Journal of Consulting Psychology, XVI (October, 1952),353-58.
MacKinnon, D. W. "The Nature and Nurture of Creative Talent," AmericanPsychologist, XVII ( 1962), 484-495.
Mueller, W. and Rothney, J. "Comparisons of Selected Descriptive and PredictiveStatements of Superior Students, Their Parents and Their Teachers," Personneland Guidance Journal, XXXVIII (April, 1960), 621-5.
Orton, Kenneth D. "An Empirical Study of Annual Gains in the Iowa Tests of BasicSkills at Various Achievement Levels," Dissertation Abstracts, XIX (January-June, 1959), 165-7.
Piers, Ellen V., Daniels, Jacqueline M., and Quackenbush, John F. "The Identificationof Creativity in Adolescents," Journal of Educational Psychology, LI (December,1960), 346-51.
Shaw, Merville C. and McCuen, John T. "The Onset of Academic Underachievementin Bright Children," Journal of Educational Psychology, LI (1960), 103-8.
Sumpton, Merle R. and Luecking, Evelyn M. Education of the Gifted. New York:Thp Ronald Press Company, 1960.
Torrance, E. P. "Explorations in Creative Thinking," Education, LXXXI (December,1960), 216-20.
. Guiding Creative Talent. Englewood Cliffs, New Jersey: Prentice-Hall,1962.
. "Problems of Highly Creative Children," Education Digest, XXVII (No-vember, 1961), 40-2.
Wallen, N. E., and Stevenson, G. "Stability and Correlation of Judged Creativity inFifth Grade Writings," Journal of Educational Psychology, LI (October, 1960),273-6.
Yamamoto, K. "Creativity and Intellect: Review of Current Research and Projection."Paper read before the Minnesota Psychological Association Convention, Minne-apolis, Minnesota, April 28, 1961.
. Revised Scoring Manua for Tests of Creative Thinking. Minneapolis:Bureau of Educational Research, University of Minnesota, 1962.
. "A Study of the Relationships Between Creative Thinking Abilities ofFifth-grade Teachers and Academic Achievement and Personal-Social Adjust-ment of Their Pupils," Unpublished Ph. dissertation, University of Minnesota,1962.
44
Chapter V
PHYSICAL DEVELOPMENT
The importance of studying the physical development of children is
often minimized by the difficulties of collecting =reformation. In retrospect,
parents are inclined to forget ailments of their .1dren which seemed to
be minor and, particularly in larger families, to forget such factors as age
of walking and talking. Recognizing these limitations, the investigators
considered such information to be valuable enough to obtain as much as
possibl;.;. Parental reports provided the greatest part of the information.
School records provided additional information, but this was meager
other than the attendance record. Additional information was obtained
from the children in the interview sample.
Prenatal Development
The prenatal development and birth of the subjects was reported
as "normal" by about 80 per cent of parents of boys in both the highly
and moderately gifted groups. Better than 90 per cent of the parents of
girls reported "normal" prenatal development and birth.
Age of Walking and Talking
Reports on age of walking and talking are subject to great error
due to the inability to ,remember, as well as to the lack of any precise
measurement of exactly at which moment the child walks unaided or
talks intelligibly. The range of beginning walking was reported from
before eight months to after 16 months, with the mean age being 11
months for the moderately gifted boys and the highly gifted girls, and
12 months for the highly gifted boys }-..nd the moderately gifted girls. This
difference is clearly insignificant.
The age of talking was reported to be from before 12 months to over
20 months. The mean age of beginning talking for the highly andmoderately gifted boys was 17 months, while for the highly gifted girls
it was 16 months and for the moderately gifted girls it was 15 months.
The differences are not significant, although the expected tendency for
girls to begin talking before boys was supported.
Parents' Ratings of Physical Traits
The parents of each of the subjects were asked to rate their child on
a four point scale (High, Average, Below Average, Uncertain) on (1)
45
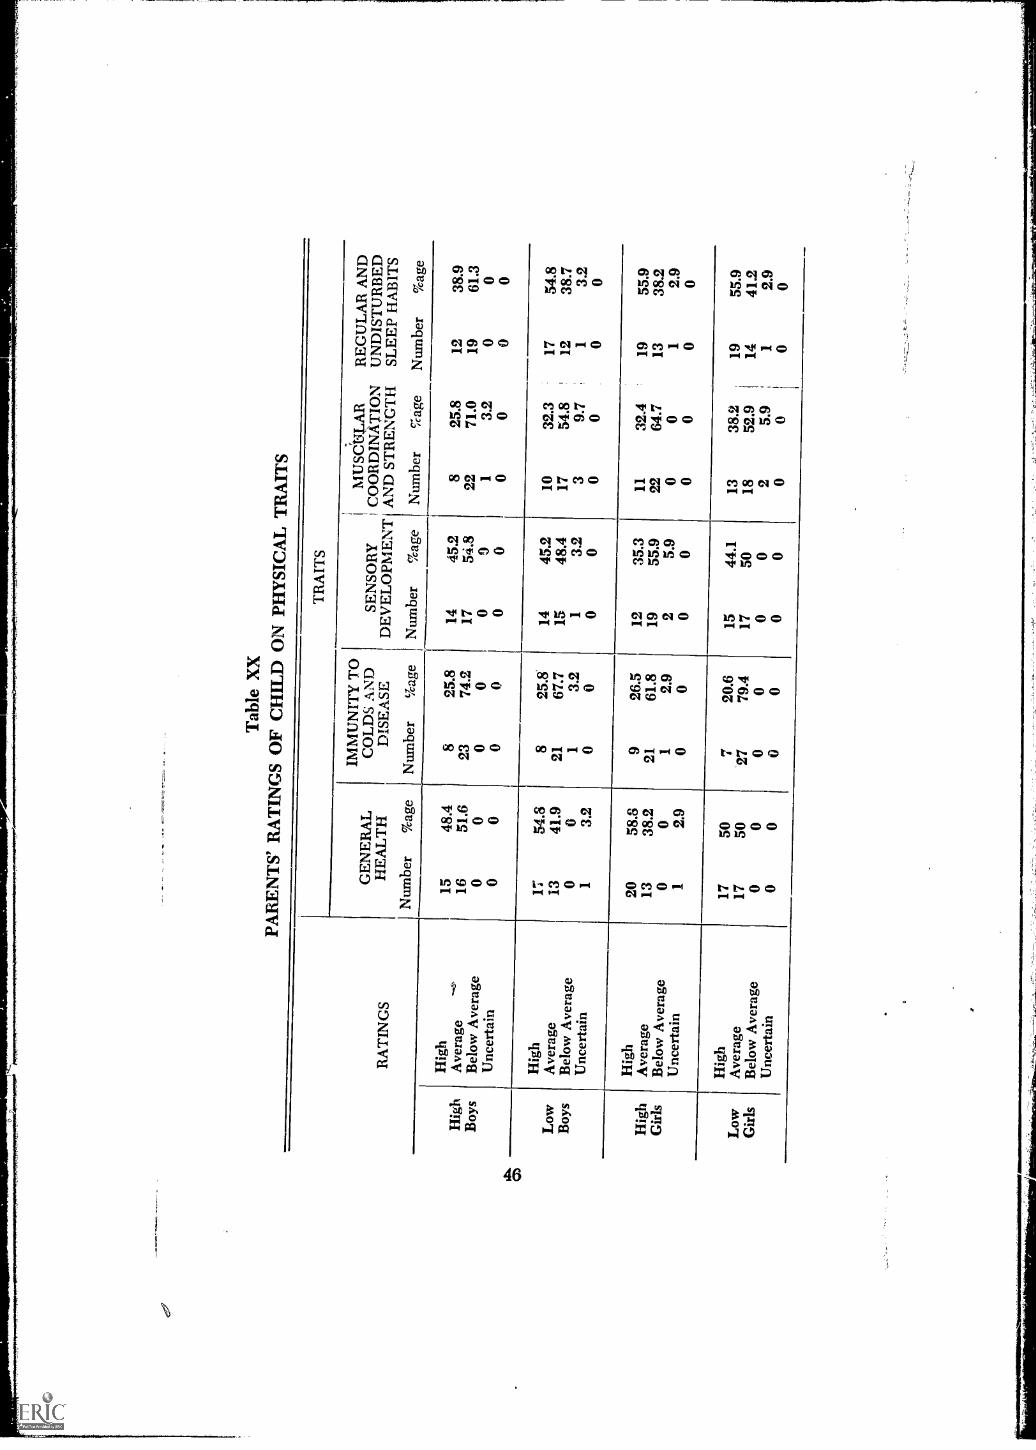
Tab
le X
XPA
RE
NT
S' R
AT
ING
S O
FC
HIL
D O
N P
HY
SIC
AL
TR
AIT
S
TR
AIT
S
RA
TIN
GS
GE
NE
RA
LH
EA
LT
H
Num
ber
%ag
e
IMM
UN
ITY
TO
CO
LD
S A
ND
DIS
EA
SE
Num
ber
%ag
e
SEN
SOR
YD
EV
EL
OPM
EN
T
Num
ber
%ag
e
MU
SCU
LA
RC
OO
RD
INA
TIO
NA
ND
ST
RE
NG
TH
Num
ber
%ag
e
RE
GU
LA
R A
ND
UN
DIS
TU
RB
ED
SLE
EP
HA
BIT
S
Num
ber
%ag
e
Hig
hB
oys
Hig
hA
vera
ge--
..,
Bel
ow A
vera
geU
ncer
tain
15 16 0 0
48.4
51.6 0 0
823 0 0
25.8
74.2 0 0
14 17 0 0
45.2
54.8 9 0
8 22 1 0
25.8
71.0 3.2
0
12 19 0 0
38.9
61.3 0 0
Low
Boy
s
Hig
hA
vera
geB
elow
Ave
rage
Unc
erta
in
17 130 1
54.8
41.9 0 3.2
821
1 0
25.8
67.7
3.2
0
14 15 1 0
45.2
48.4 3.2
0
10 17 3 0
32.3
54.8
'
9.7
0
17 12 1 0
54.8
38.7
3.2
0
Hig
hG
irls
Hig
hA
vera
geB
elow
Ave
rage
Unc
erta
in
20 13 0 1
58.8
38.2
0 2.9
9 21 1 0
26.5
61.8 2.9
0
12 19 2 0
35.3
55.9 5.9
0
11 22 0 0
32.4
64.7 0 0
19 131 0
55.9
38.2
2.9
0
Low
Gir
ls
Hig
hA
vera
geB
elow
Ave
rage
Unc
erta
in
17 17 0 0
50 50 0 0
7 I
27 0 0
20.6
79.4 0 0
15 17 0 0
44.1
50 0 0
13 18 2 0
38.2
,
52.9
i
5.9
: 1
01 I
19 14 1 0
55.9
4L2
2.9
0

general health, (2) immunity to colds and disease, (3) sensory develop-ment, (4) muscular coordination and strength, and (5) regular andundisturbed sleep habits. The results are reported in Table XX.
No significant differences were noted in the parents' reports on thegeneral health of the subjects in each of the four groups. About halfof the subjects in each of the groups were rated "high" in general health,and the remaining half were rated as "average." More of the highlygifted girls were rated high in general health than was any other group.
There appeared to be no particular resistance to colds on the partof the gifted subjects. About one-fourth of each group was rated as"high" in resistance to colds and disease, with the remaining rated about"average There appear to be no significant differences on ratings ofsensory development.
Muscular coordination and strength ratings showed fewer of thehigh ability boys to be rated "high" than the other three groups. Moreof the moderately gifted boys and the moderately gifted girls respec-tively were rated "high" in this area than were the highly gifted boysand girls. Since this is a topic on which there is frequent disagreementby the lay public with research reports on the superiority of giftedchildren in muscular coordination and strength, the data suggest thatthe more highly gifted are perhaps not so superior as the moderatelygifted group.
Ratings of sleep habits indicated no difference between any of thegroups, except the highly gifted boys, in which case a sizeable numberof parents reported only "average" sleep habits. This differed greatlyfrom the pattern reported by parents of highly gifted girls and moder-ately gifted boys and girls.
School Absences
The number of absences was taken from the school records as anindication of the health status of the child. Both the moderately andthe highly gifted boys averaged 9.5 days absence for each of the yearsthey had been in school. The girls averaged slightly fewer absences.The highly gifted girls averaged 7.6 days per year and the moderatelygifted girls averaged 8.7 days per year. For each of the groups, the firstgrade was the time when the largest number of absences occurred.
Strengths and Weaknesses
The 40 children in the interview sample were asked their strengthsand weaknesses. Fourteen of the 40 identified athletics as an area ofparticular weakness, while 12 identified athletics as an area of particularstrength. More of the girls, both moderately and highly gifted, (N=10)
r47
Mj
identified athletics as an ',rea of weakness than did boys (N=4). Thenumber identifying athletics as an area of strength differed little betweenthe highly and moderately. gifted groups.
Socio-Economic Factor and Physical Development
Those children in the interview sample whose parents were in pro-fessional and managerial occupations were grouped against those childrenwhose parents were in other categories. Using this classification, therewas no difference in the reported age of learning to talk and in thereported general health. The concern that perhaps the reported superi-ority of gifted children in physical areas might be an artifact of highsocio-economic background was not supported in this instance in whichoccupational classification was used as the distinguishing factor.
Summary
Reporting the physical development of children from statements ofparents, in retrospect, presents many problems. Memory of precise timesof beginning to walk and to talk are, at best, only approximations. Theresulting lack of differences found between the two groups, while thismight have been expected, is probably due to the method by which thedata were obtained. This is not meant to minimize the value of informa-tion on physical development, but, rather to point out the caution withwhich such data must be interpreted.
48

Chapter VI
THE ADJUSTMENT OF MODERATELY ANDHIGHLY GIFTED CHILDREN
The measurement of adjustment cannot be based upon any singlemeasure and, indeed, the problems of measuring the adjustment of giftedchildren are doubly increased. Standardized measures of personalitygenerally assume that the person responding does not know exactly whatfactor is being measured, and will therefore not see any reasons for falsestatements. This assumption is less true for gifted individuals than foraverage children. In addition to the gifted child's superiority in knowingwhat is expected, the child is also confronted with the dilemma of decid-ing if the adult wants the answer in the way the child really feels, or ifthe adult wants the answer in the way the child thinks he should feel.Then there is the additional problem of whether or not gifted childrenshould be expected to adjust in the same way as average children, orhave their adjustment measured against the same standard's as that ofaverage children. This dilemma is either unanswered or, if the mode ofoperation is correct, it has been answered in expecting all children toadjust in the same manner as the "average," under the false assumptionthat though children may differ in ability, there is no justification forbehavior differences.
A variety of means has been used to measure the adjustment of thechildren in the present study. A standardized personality test was admin-istered to each child, and teachers were asked to name the chilkLen intheir classes who were best described by each of ten statements Inaddition to this, reports from parents on all of the subject.; were col-lected. Forty children were interviewed and asked their three wishes.A non-standardized "Self-Concept Scale" was also administered to thechildren in the interview sample.
The IPAT Children's Personality QuestionnaireIn stating the great need for "trustworthy personality measures of
children," Porter and Cattell emphasize various reasons. Dominantamong these reasons is the obvious need for better understanding of achild, if his full potentiality is to be realized. Included is a reason fre-quently overlooked; the natural inclination of teachers to emphasizethose areas where results can be measured. Porter and Cattell state that
49

"it is commonplace of education that the teacher's attention is inclinedto concentrate on those mattors, notably academic achievement, whereresults can be measured." Perhaps even more important in programs forgifted children than in programs for any other particular group is theneed for means of measuring results of the program, other than academicachievement.
The Institute for Personality and Ability Testing, (IPAT), Children'sPersonality Questionnaire, (The CPQ), is distinctive in a number ofways. These particular qualities made it most suitable as a group meas-urement of personality for the children in this study. The test contains70 items, with five items for each of the 14 dimensions measured by thetest as listed below (popular title in parentheses):
1. Schizothymia-versus-Cyclothymia(Stiff, Aloof-versus-Warm, Sociable)
2. Mental Defect-versus-Genera= :-.1telligence(Less Intelligent-versus-More 1 ntelligent)
3. Ego Weakness-versus-Ego Strength(Emotionally Unstable-versus-Emotionally Mature)
4. Placidity of Temperament-versus-Excitability(Phlegmatic- versus- Excitable)
5. Submissiveness-versus-Dominance(Submissive-versus-Dominant)
6. Disurgency-versus-Surgency(Serious-versus-Happy-Go-Lucky)
7. Super Ego Weakness-versus-Super Ego Strength(Frivolous-versus-Persevering)
8. Threctia-versus-Parmia(Shy-versus-Venturesome)
9. Harria-versus-Premsia(Tough Minded-versus-Tender Minded)
10. Zeppia-versus-Coasthenia(Vigorous-versus-Internally Restrained)
11. Naivete-versus-Shrewdness(Simple-versus-Shrewd)
12. Unperturbed Adequacy-versus-Guilt Proneness(Complacent-versus-Self Reproaching)
1.3. Weak Self-Sentiment-versus-Strong Self-Sentiment(Lax-versus-Self Controlled)
14. Low Ergic Tension-versus-High Ergic Tension(Composed, Relaxed-versus-Driven, Tense)
Procedures:The IPAT Children's Personality Questionnaire was administered by
intern school psychologists to the 130 children in the study. In mostinstances the test was administered individually, although in some casesit was administered to a small group. Since all of the children were rela-tively good readers, it was not necessary to read the test to any of thesubjects. Although no time limits are directed in the Manual, it is esti-
50

.....MM.WIMMMalOMP.111.ISMOO.TOINIIN
mated that the test can be administered in a L0 minute period. Thechildren in this study, for the most part, took far less time than the 50minute period mentioned.
Treatment of Data:The data were treated using Fisher's "t test and the Cochran Cox
"t" test where the Fisher "t" test was not applicable in comparing thesub-groups on each of the 14 factors on the IPAT, CPQ. Using 65matched pairs of moderately ind highly gifted elementary children, 31matched pairs of boys and 34 matched pairs of girls, the following com-parisons were made on each of the 14 factors of the IPAT, CPQ:
1. Total moderately gifted group versus total highly gifted group.2. Moderately gifted girls versus highly gifted girls.3. Moderately gifted boys versus highly gifted boys.4. Boys (moderately and highly gifted) versus girls (moderately
and highly gifted).
Results:
The statistical comparisons of the data are presented in TableXXI. Comparing the total highly gifted group with the total moderatelygifted group on 14 factors of personality yielded only one difference,Disurgency-versus-Surgency, which was significant (at the .01 level).The highly gifted group was found to be significantly higher in the direc-tion of Surgency, which is defined as "happy-go-lucky, talkative, cheerful,serene, frank, expressive, mercurial, quick and alert." It must be Lotedthat both the moderately gifted and the highly gifted tended in theSurgency direction, with the highly gifted group doing so to a signifi-cantly greater extent.
Comparing highly gifted boys with moderately gifted boys on all14 factors yielded no significant differences. The comparison of highlygifted girls with moderately gifted girls gave similar results, with theexception r1-eit the highly gifted girls were significantly more surgentthan the moderate girls. The comparison between boys and girls yieldedsignificant differences at the .01 level on two factors, and on anotherfactor at the .05 level. On Submissiveness-versus-Dominance the boysappeared significantly more dominant, even with the adjusted scorespurported to allow for sex differences, and on Harria-versus-Premsia(Tough, Realistic-versus-Esthetically, Sensitive) the girls were sig-nificantly more Tender Minded. On SchNothymia-versus-Cyclothymia( Stiff, Aloof-versus-Warm, Sociable), a difference significant at the .05level was obtained, with the girls tending significantly more towardCyclothymia than the boys. The Anxiety-versus-Adjustment score, ob-tained by combining and weighting certain of the 14 sub-test scores,
51
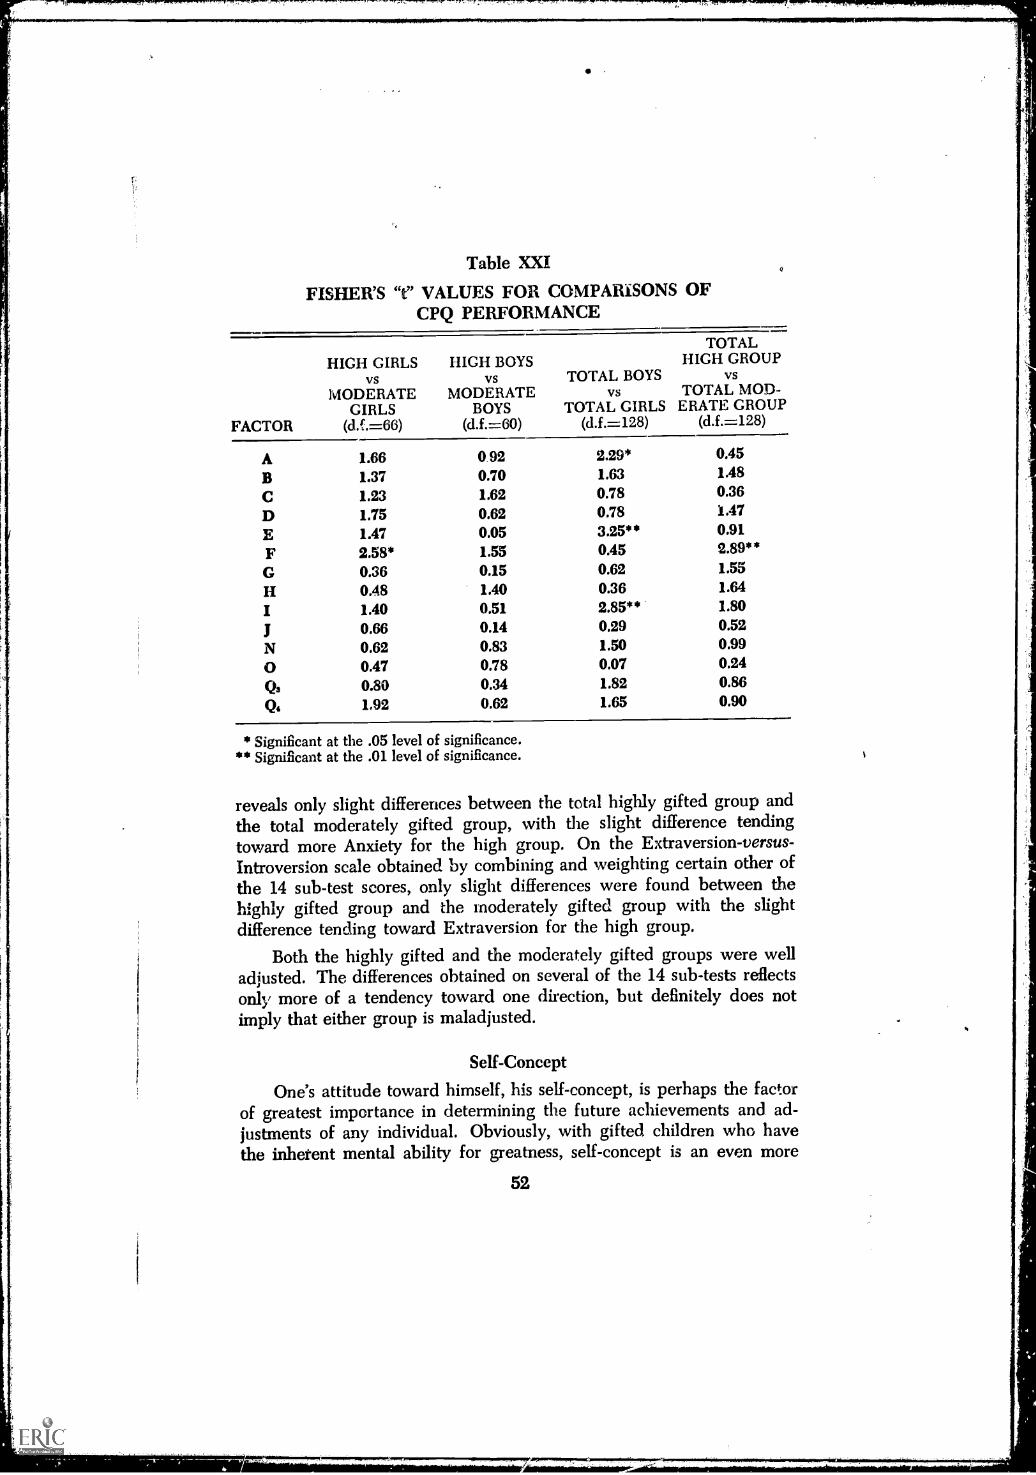
Table vaFISHER'S "t" VALUES FOR COMPARISONS OF
CPQ PERFORMANCE
HIGH GIRLSvs
MODERATEGIRLS
HIGH BOYSvs
MODERATEBOYS
TOTAL BOYSvs
TOTAL GIRLS
TOTALHIGH GROUP
vsTOTAL MOD -
ERATE GROUPFACTOR (d.f.=66) (d.f.=60) (d.f.=128) (d.f.=128)
A 1.66 0.92 2.29* 0.45
B 1.37 0.70 1.63 1.48
C 1.23 1.62 0.78 0.36
D 1.75 0.62 0.78 1.47
E 1.47 0.05 3.25** 0.91
F 2.58* 1.55 0.45 2.89**
G 0.36 0.15 0.62 1.55
H 0.48 1.40 0.36 1.64
I 1.40 0.51 2.85** 1.80
0.66 0.14 0.29 0.52
N 0.62 0.83 1.50 0.99
0 0.47 0.78 0.07 0.24
Q3 0.80 0.34 1.82 0.86
424 1.92 0.62 1.65 0.90
* Significan** Significan
t at the .05 level of significance.at the .01 level of significance.
reveals only slight differences between the total highly gifted group andthe total moderately gifted group, with the slight difference tendingtoward more Anxiety for the high group. On the Extraversion-versus-Introversion scale obtained by combining and weighting certain other ofthe 14 sub-test scores, only slight differences were found between thehighly gifted group and the moderately gifted group with the slightdifference tending toward Extraversion for the high group.
Both the highly gifted and the moderately gifted groups were welladjusted. The differences obtained on several of the 14 sub-tests reflectsonly more of a tendency toward one direction, but definitely does notimply that either group is maladjusted.
Self-Concept
One's attitude toward himself, his self-concept, is perhaps the factorof greatest importance in determining the future achievements and ad-justments of any individual. Obviously, with gifted children who havethe inherent mental ability for greatness, self-concept is an even more
52
li
important factor than it would be with average children. If it werepossible to measure the self-concept of gifted children, valuable informa-tion would be obtained. Even with the non-availability of any measuringinstrument, it was believed to be sufficiently important to at least makean effort to measure some factors of the self-concept of the subjects inthe study.
There is obviously no agreement either as to what self-conceptactually consists of or even the outcomes of good or poor self-concept.The abundance of literature on self-concept has been severely criticizedon the lack of agreement as to what constitutes self-concept and themethods used attempting to measure it. The present approach was anattempt to measure two factors thought to be part of one's total self-concept. Part I attempted to measure the subject's concept of his ownability to achieve. Part II attempted to measure the subject's conceptof his own characteristics and personality traits generally associated withsecurity
Statistical Treatment:Split-half reliability coefficients were computed for both parts of
the instrument using the Spearman Brown formula. The coefficient ob-tained for Part I of the test was a positive .88, and the coefficient forPart II was a positive .79.
Item correlations for Part I were computed and found to be insuffi-cient for proceeding further along these lines. Pearson Product MomentCorrelation Coefficients were computed for five areas. Items 1 and 6were measures of one's concept of his ability to achieve in academicareas (i.e. reading and arithmetic). A positive correlation of .20 wasobtained. Items 2 and 7 were measures of one's concept of his abilityto achieve in the future (i.e. when in high school and in college). Apositive correlation of .67 was obtained. The third area was a measureof one's concept of his basic intelligence. A positive correlation of .61was obtained. The fourth area was a measure of one's ability to achievewhen lie tried. Positive correlation of .86 was obtained. The fifth areameasured one's concept of his learning ability. A positive correlation of.56 was obtained. Item correlations were not computed for Part II ofthe instrument because the items were not constructed to be equivalent.
Point biserial correlation coefficients were computed for Parts I andII of the instrument. The highly gifted group had the better performanceon the first part of the instrument and the moderately giftec: group hadthe better performance on the second part. Neither of these wassignificant.
Using the Fisher "t" test of sign&cance on Part I of the instrument,differences at the .05 level of significance showed that highly gifted boys
53
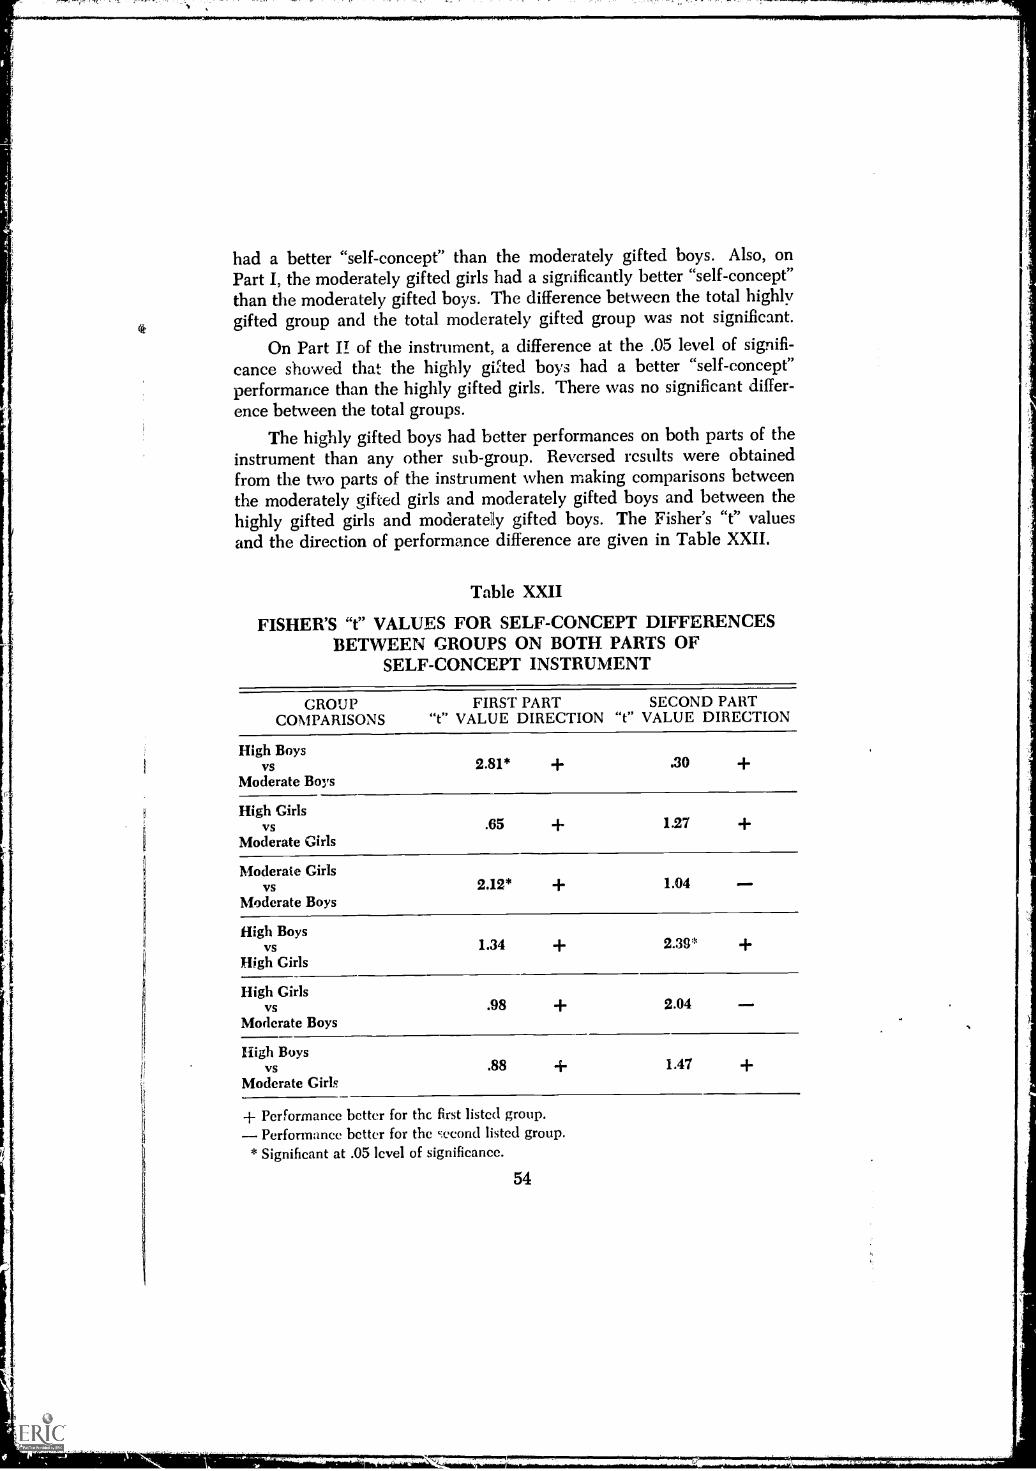
had a better "self-concept" than the moderately gifted boys. Also, onPart I, the moderately gifted girls had a significantly better "self-concept"than the moderately gifted boys. The difference between the total highlygifted group and the total moderately gifted group was not significant.
On Part II of the instrument, a difference at the .05 level of signifi-
cance showed that the highly gifted boys had a better "self-concept"performance than the highly gifted girls. There was no significant differ-
ence between the total groups.The highly gifted boys had better performances on both parts of the
instrument than any other sub-group. Reversed results were obtainedfrom the two parts of the instrument when making comparisons betweenthe moderately gifted girls and moderately gifted boys and between thehighly gifted girls and moderately gifted boys. The Fisher's "t" valuesand the direction of performance difference are given in Table XXII.
Table XXII
FISHER'S "t" VALUES FOR SELF-CONCEPT DIFFERENCESBETWEEN GROUPS ON BOTH PARTS OF
SELF-CONCEPT INSTRUMENT
GROUP FIRST PART SECOND PARTCOMPARISONS "t" VALUE DIRECTION "t" VALUE DIRECTION
High Boysvs
Moderate Boys2.81* + .30
High Girlsvs
Moderate Girls.65 1.27
Moderate Girlsvs
Moderate Boys2.12* 4 1.04
High Boysvs
High Girls1.34 2.39* +
High Girlsvs
Moderate Boys.98 4- 2.04
High Boysvs
Moderate Girls.88 + 1.47 +
+ Performance better for the first listed group.Performance better for the second listed group.
* Significant at .05 level of significance.
54
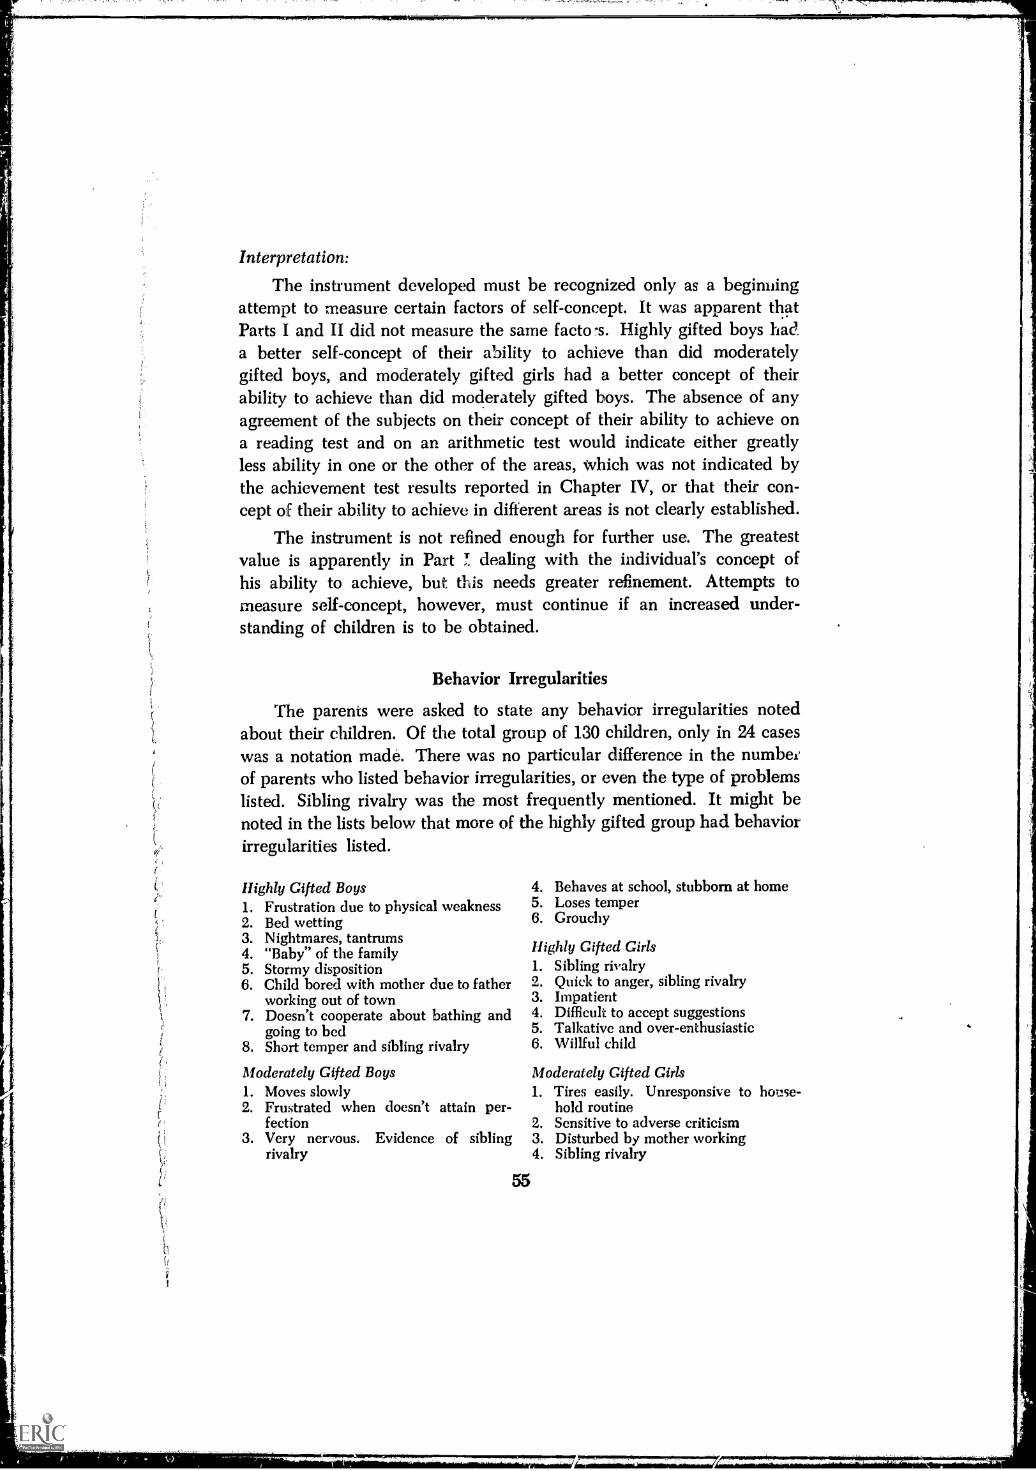
o-
....."!1111131111PAPHOPIIIIIMPRIPP.
Interpretation:
The instrument developed must be recognized only as a beginningattempt to measure certain factors of self-concept. It was apparent thatParts I and II did not measure the same facto Highly gifted boys had_a better self-concept of their ability to achieve than did moderatelygifted boys, and moderately gifted girls had a better concept of theirability to achieve than did moderately gifted boys. The absence of anyagreement of the subjects on their concept of their ability to achieve ona reading test and on an arithmetic test would indicate either greatlyless ability in one or the other of the areas, which was not indicated bythe achievement test results reported in Chapter IV, or that their con-cept of their ability to achieve in different areas is not clearly established.
The instrument is not refined enough for further use. The greatestvalue is apparently in Part !. dealing with the individual's concept ofhis ability to achieve, but this needs greater refinement. Attempts tomeasure self-concept, however, must continue if an increased under-standing of children is to be obtained.
Behavior Irregularities
The parents were asked to state any behavior irregularities notedabout their children. Of the total group of 130 children, only in 24 caseswas a notation made. There was no particular difference in the numbeiof parents who listed behavior irregularities, or even the type of problemslisted. Sibling rivalry was the most frequently mentioned. It might benoted in the lists below that more of the highly gifted group had behaviorirregularities listed.
Highly Gifted Boys 4. Behaves at school, stubborn at home1. Frustration due to physical weakness2. Bed wetting
5.6.
Loses temperGrouchy
3.4.
Nightmares, tantrums"Baby" of the family Highly Gifted Girls
5. Stormy disposition 1. Sibling rivalry6. Child bored with mother due to father 2. Quick to anger, sibling rivalry
working out of town 3. Impatient7. Doesn't cooperate about bathing and 4. Difficult to accept suggestions
going to bed 5. Talkative and over-enthusiastic8. Short temper and sibling rivalry 6. Willful child
Moderately Gifted Boys1. Moves slowly2. Frustrated when doesn't attain per-
fection3. Very nervous. Evidence of sibling
rivalry
55
Moderately Gifted Girls1. Tires easily. Unresponsive to house-
hold routine2. Sensitive to adverse criticism3. Disturbed by mother working4. Sibling rivalry

Children's Wishes
Asking children for their three wishes has long been used by teachersand school psychologists as a means to better understand children'sbehavior. The wishes are used only as an indication of the child'sdesires, and are not intended necessarily to divulge the inner-mostsecrets of the child's life. The beauty of the instrument is its simplicity,and the enthusiasm with which children frequently undertake to dis-cover their own three wishes is perhaps the best argument in favor of
the procedure itself.The 40 children in the interview sample were asked for their three
wishes. All of the children gave at least one wish, and most gave three.Several could think of only one wish, and several others felt that twowishes were absolutely all anyone could possibly hope for. No particularpressure was placed upon the children to give more wishes than theythemselves volunteered.
Categorizing children's wishes posed special problems, for the wishesoften were unique. An attempt was made, however, and is reported inTable XXIII.
The small number of subjects in the interview sample allowed forseemingly exaggerated differences in the two groups. The moderatelygifted group, with 12 of their wishes, as against only two in the highlygifted group, were "outer-directed." The two groups were quite similarin their materialistic wishes, but the highly gifted group stated more"self-ambition" wishes, and more "behavioristic" type wishes.
Teacher Selection of "Who Is It?"
A socio-metric instrument entitled, "Who Is It?" was given to theteacher of each classroom in which one of the 130 subjects in the finalsample was enrolled. The teacher was asked to identify the children whowere best described by each of ten statements. The teacher was given nodirection either to include or exclude the children in the study, or to listten different children or to repeat some of the names if the descriptionbest fits the child. The names of the subjects were then listed in each ofthe four categories (highly gifted boys, highly gifted girls, moderatelygifted boys, and moderately gifted girls) and the rating of each teacherin whose classroom a gifted subject was enrolled was checked to see ifthe child in the study was listed on any of the ten categories and, if so,on which items. The data obtained are presented in Table XXIV.
Noteworthy is the fact that 25 per cent of the highly gifted groupwas not listed on any one of the ten categories. Remembering that eachof these children had received I.Q. scores of 148 or above, it seems
56

t.
7""""T"`"r"'"'"'''''7777""e..,r.,FITrwafflwigT5r
Table XXIII
CATEGORIZATION OF "THREE WISHES" OF40 GIFTED CHILDREN
CATEGORY
HIGHLYGIFTED (N=20)Number %age
MODERATELYGIFTED (N=20)Number %age
INNER-DIRECTEDA. Materialistic
(96.8)(40.8)
(78.6)(44.6)
1. Money 7 11.9 6 10.72. Clothes 1 1.7 1 1.83. Animals 7 11.9 6 10.74. Toys, other
tangible objects 8 13.6 11 19.65. Sisters or brothers
in wishes 1 1.7 1 1.8B. Idealistic (33.9) (23.2)
1. Self-ambition 17 28.8 11 19.62. Education 3 5.1 2 3.6
C. Behavioristic (22.1) (10.4)1. Travel 1 1.7 3 5.42. Fantasy ("fly,"
"Smart pills") 2 3.4 1 1.83. More wishes 7 11.9 1 1.84. Negativistic 3 5.1 1.8
OUTER-DIRECTED (3.4) (2L4)A. Family welfare 1 1.7 4 7.1B. World welfare 1 1.7 8 14.3
difficult to believe that so many of them could be left off the rating asthe most intelligent, much less the nine other positive factors so oftenrelated with "brightness." An even greater percentage, about 37 percent, of the moderately gifted were not listed on any of the ten factors.This would be an astounding figure if the real impact of it had not beendepleted by the even more astounding absence of the highly gifted groupfrom the ratings.
The "Who Is It?" blank contained the following ten questions;1. Who is the most popular pupil in your class?2. Who has the wildest ideas?3. Who is the smartest?4. Which pupil do you like best?
57

CR
Tab
le X
XIV
TE
AC
HE
R S
EL
EC
TIO
N O
F "W
HO
IS
IT?"
HIG
HL
Y G
IFT
ED
*M
OD
ER
AT
EL
Y G
IFT
ED
*
BO
YS
Num
ber
%ag
eG
IRL
SN
umbe
r%
age
BO
YS
Num
ber
%ag
eG
IRL
SN
umbe
r%
age
Non
e L
iste
d7
22.6
926
.511
35.5
1338
.2
1.W
ho is
the
mos
t pop
ular
pup
il in
your
cla
ss?
39.
70
04
12.9
12.
92.
Who
has
the
wild
est i
deas
?3
9.7
25.
92
6.5
25.
93.
Who
is th
e sm
arte
st?
1341
.915
44.1
1032
.37
20.6
4.W
hich
pup
il do
you
like
bes
t?0
01
2.9
00
00
5.W
ho is
the
mos
t tal
ente
d?2
6.5
38.
85
16.1
12.
96.
Who
is th
e be
st le
ader
?5
16.1
411
.83
9.7
12.
97.
Who
is th
e m
ost i
mag
inat
ive?
39.
72
5.9
39.
71
2.9
8.W
ho h
as th
e m
ost a
cade
mic
pot
entia
l?15
48.4
1750
.07
22.6
1132
.49.
Who
is th
e m
ost i
ntel
ligen
t?15
48.4
17 a
50.0
619
.410
29.4
10.
Who
is th
e fu
nnie
st?
13.
20
02
6.5
00
* Pe
rcen
tage
sar
e ca
lcul
ated
for
eac
h ite
m d
iscr
etel
y be
caus
e of
the
poss
ibili
ty o
fan
y ch
ild b
eing
cho
sen
in m
ore
than
one
cat
egor
y.

MIIM01100111111011111111 Im.
5. Who is the most talented?6. Who is the best leader?7. Who is the most imaginative?8. Who has the most academic potential?9. Who is the most intelligent?
10. Who is the funniest?
7 ..71,11.rIRRAIRmM7"..FR7117174,mr
Parents' Ratings of the Child's AdjustmentParents are not necessarily in the best position to rate the adjust-
ment of their own children, but chey are in a position to contributevaluable information toward an understanding of the child's behavior.Parents in the present study were asked to indicate the type of personwith whom the child prefers to associate. No restriction was made onthe number of types which might be marked, so the total includes morethan the total number of children in the study. The number of categoriesmarked averaged slightly more than two for each subject.
Comparing the number of parents who marked each category revealsan almost identical number for the moderately and highly gifted groups.Fifty-four patents of highly gifted children and 48 of moderately giftedchildren indicated that their child preferred children of his own age.Thirteen of the parents of highly gifted and 16 of the parents of moder-ately gifted indicated their child preferred younger children. Thirty-fourand 35 of the parents of moderately and highly gifted children, respec-tively, indicated that their child preferred older children. About thesame number marked that their children preferred association with theirparents, and only in the number marking "other adults" was there anydifferences of any proportional size. Fifteen parents of highly giftedmarked this category, while only seven of the parents of moderatelygifted so indicated. The small number from both groups makes this notparticularly significant.
Parents were asked, "How well does your child get along with otherchildren and teachers?" Almost 97 per cent of the parents of highly giftedchildren marked "well," while about 91 per cent of the parents of moder-ately gifted children marked "well." This clearly indicates that bothgroups get along well with other children and teachers, with the highlygifted group perhaps getting along slightly better. When the childrenwhose fathers were in professional and managerial occupations, irrespec-tive of the I.Q. scores of the children, were compared with those childrenwhose fathers were not in professional and managerial occupations,almost identical results were obtained as when the grouping had beerdone on the basis of I.Q. This is another indication of the slightsuperiority of higher socio-economic groups in adjustment measures, not
59
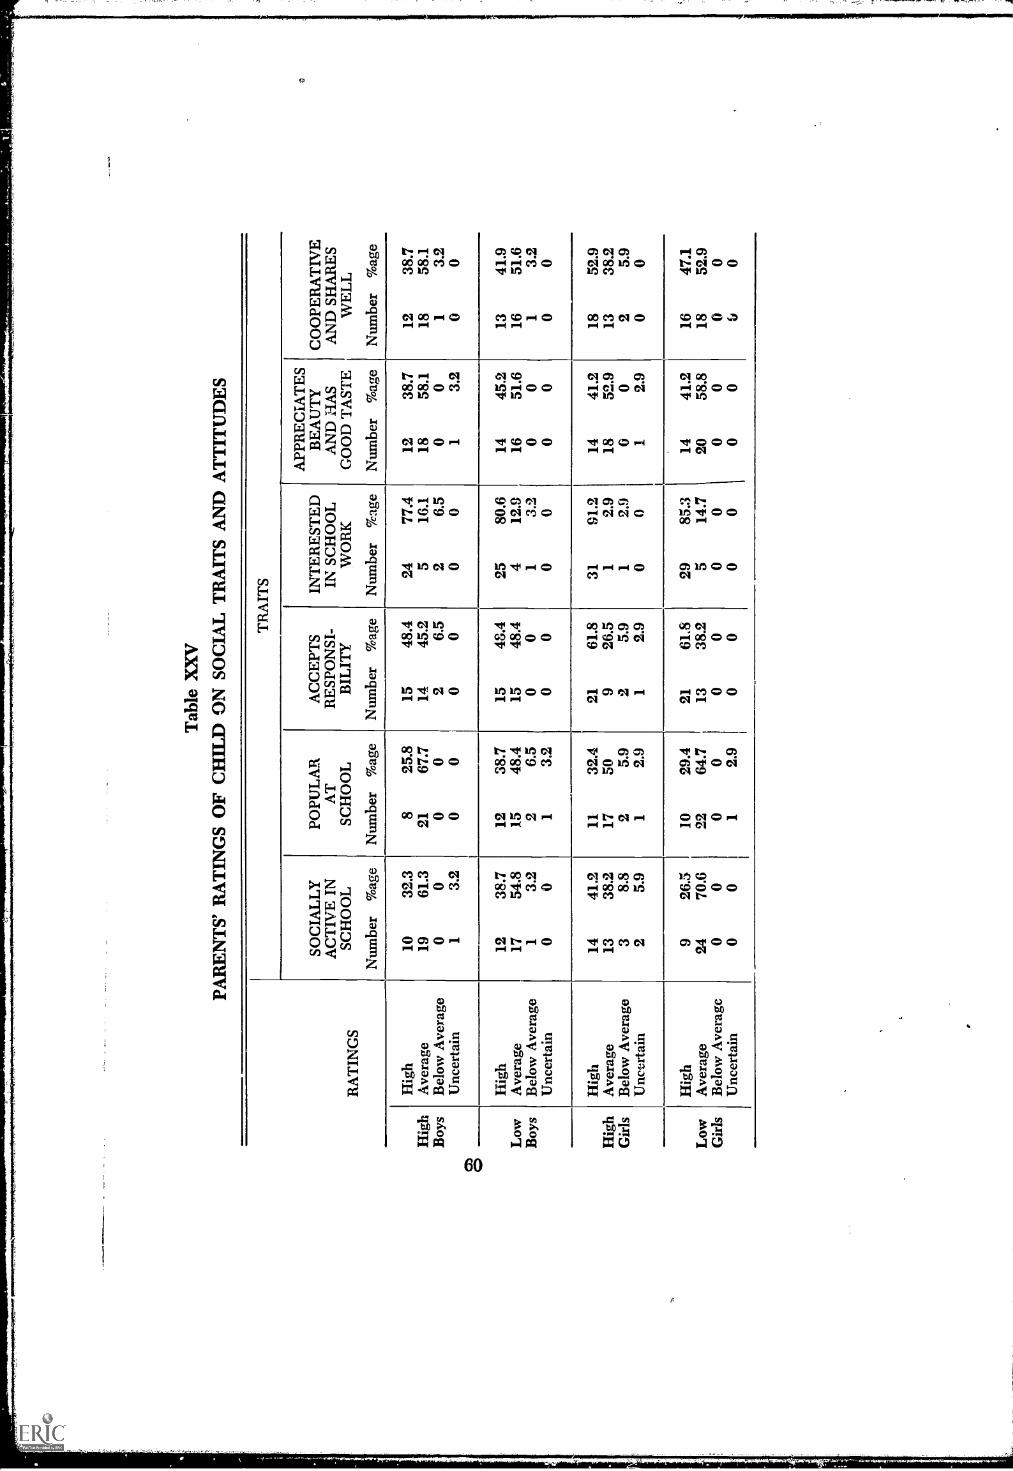
CT
)O
Tab
le X
XV
PAR
EN
TS'
RA
TIN
GS
OF
CH
ILD
ON
SO
CIA
L T
RA
ITS
AN
D A
TT
ITU
DE
S
TR
AIT
S
RA
TIN
GS
SOC
IAL
LY
AC
TIV
E I
NSC
HO
OL
Num
ber
%ag
e
POPU
LA
RA
TSC
HO
OL
Num
ber
%ag
e
AC
CE
PTS
RE
SPO
NSI
-B
ILIT
Y
Num
ber
%ag
e
INT
ER
EST
ED
IN S
CH
OO
LW
OR
K
Num
ber
%ag
e
APP
RE
CIA
TE
SB
EA
UT
YA
ND
HA
SG
OO
D T
AST
E
Num
ber
%ag
e
CO
OPE
RA
TIV
EA
ND
SH
AR
ES
WE
LL
Num
ber
%ag
e
Hig
h10
32.3
825
.815
48.4
2477
.412
38.7
1238
.7H
igh
Ave
rage
1961
.321
67.7
1445
.25
16.1
1858
.118
58.1
Boy
sB
elow
Ave
rage
00
00
26.
52
6.5
00
13.
2U
ncer
tain
13.
20
00
00
01
3.2
00
Hig
h12
38.7
1238
.715
48.4
2580
.614
45.2
1341
.9L
owA
vera
ge17
54.8
1548
.415
48.4
412
.916
51.6
1651
.6B
oys
Bel
ow A
vera
ge1
3.2
26.
50
01
3.2
00
13.
2U
ncer
tain
00
13.
20
00
00
00
0
Hig
h14
41.2
1132
.421
61.8
3191
.214
41.2
1852
.9H
igh
Ave
rage
1338
.217
509
26.5
12.
918
52.9
1338
.2G
irls
Bel
ow A
vera
ge3
8.8
25.
92
5.9
12.
90
02
5.9
Unc
erta
in2
5.9
12.
91
2.9
00
12.
90
0
Hig
h9
265
1029
.421
61,8
2985
.314
41.2
1647
.1L
owA
vera
ge24
70.6
2264
.713
38.2
514
.720
58.8
1852
.9G
irls
Bel
ow A
vera
ge0
00
00
00
00
00
0U
ncer
tain
00
12.
90
00
00
06
0
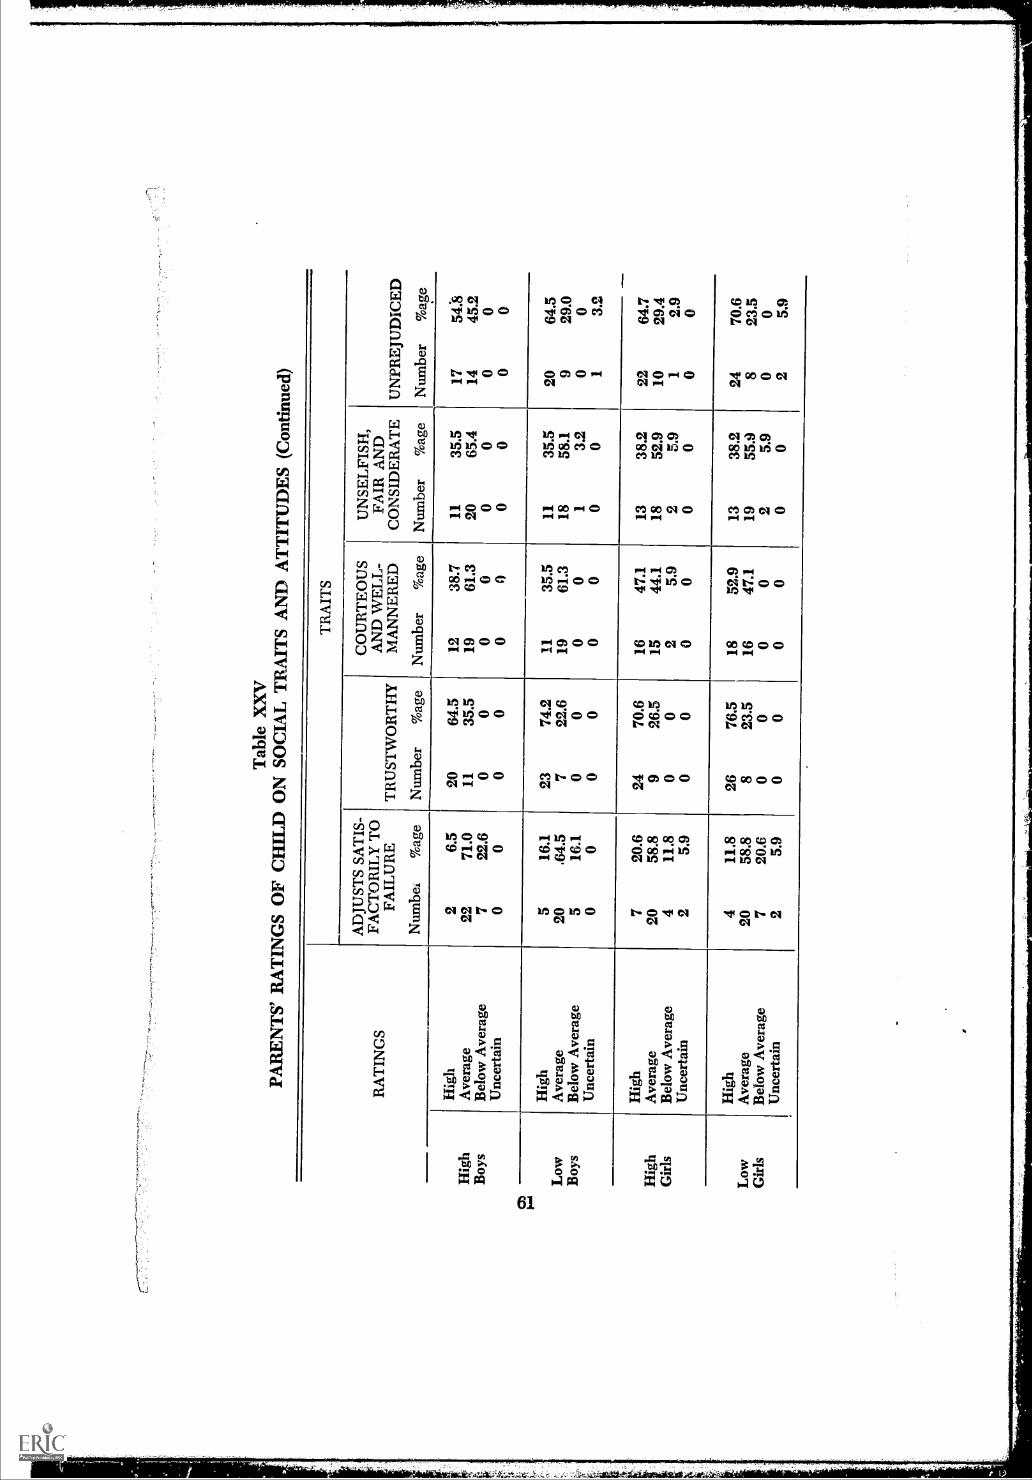
Tab
le X
XV
PAR
EN
TS'
RA
TIN
GS
OF
CH
ILD
ON
SO
CIA
LT
RA
ITS
AN
D A
TT
ITU
DE
S (C
ontin
ued)
TR
AIT
S
RA
TIN
GS
AD
JUST
S SA
TIS
-FA
CT
OR
ILY
TO
FAIL
UR
E
Num
ber
%ag
e
TR
UST
WO
RT
HY
Num
ber
%ag
e
CO
UR
TE
OU
SA
ND
WE
LL
-M
AN
NE
RE
D
Num
ber
%ag
e
UN
SEL
FISH
,FA
IR A
ND
CO
NSI
DE
RA
TE
Num
ber
%ag
e
UN
PRE
JUD
ICE
D
Num
ber
%ag
e
Hig
h2
6.5
2064
.512
38.7
1135
.517
54..8
Hig
hA
vera
ge22
71.0
1135
.519
61.3
2065
.414
45.2
Boy
sB
elow
Ave
rage
722
.60
00
00
00
0U
ncer
tain
00
00
00
00
00
Hig
h5
16.1
2374
.211
35.5
1135
.520
64.5
Low
Ave
rage
20.6
4.5
722
.619
61.3
1858
.19
29.0
Boy
sB
elow
Ave
rage
516
.10
00
01
3.2
00
Unc
erta
in0
00
00
00
01
3.2
Hig
h7
20.6
2470
.616
47.1
1338
.222
64.7
Hig
hA
vera
ge20
58.8
926
.515
44.1
1852
.910
29.4
Gir
lsB
elow
Ave
rage
411
.80
02
5.9
25.
91
2.9
Unc
erta
in2
5.9
00
00
00
00
Hig
h4
11.8
2676
.518
52.9
1338
.224
70.6
Low
Ave
rage
2058
.88
23.5
1647
.119
55.9
823
.5G
irls
Bel
ow A
vera
ge7
20.6
00
00
25.
90
0U
ncer
tain
25.
90
00
00
02
5.9
necessarily irrespective of I.Q. but irrespective of the moderately andhighly gifted categories as established in this study.
On a four point scale (high, average, below average and uncertain)parents were asked to rate their child on 11 traits: (1) socially active inschool, (2) popular at school, (3) accepts responsibility, (4) interestedin school work, (5) appreciates beauty and has good taste, (6) coopera-tive and shares well, (7) adjusts satisfactorily to fa. are, (8) trustworthy,(9) courteous and well-mannered, (10) unselfish, fair and considerate,and (11) unprejudiced. These data are reported in Table XXV.
In rating the child on social activities in school, a larger percentageof highly gifted girls were rated "high" than any of the other groups,with moderately gifted girls being rated "high" proportionally less thanany other group. The range of ratings for the highly gifted girls wasgreater than that of any other group. School popularity ratings indicatedmoderately gifted boys as being substantially more popular than anyof the other three groups.
The highly gifted girls appeared to be rated more often "high" ininterest in school work, cooperation, and their ability to adjust satis-factorily to failure than any of the other groups. The girls, both highlygifted and -moderately gifted, were more often rated "high". than theboys in accepting responsibility, interest in school work, cooperation, andcourtesy. Boys, however, in none of the areas, were more often rated"high" than girls. In appreciating beauty and having good taste, themoderately gifted boys were more often rated "high" than any of theother three groups.
Because of the superiority in intelligence of the subjects in thisstudy, their parents' ratings on their ability to adjust satisfactorily tofailure is of particular interest. Of the eleven areas rated, there werefar fewer "high" ratings in this one. The highly gifted boys appearedto have fewer who were rated as "high" in this area than the other threegroups, while the highly gifted girls had more rated as "high" than theother three groups. Indeed, the question can well be asked if this abilityto adjust to failure is not an important area of concern for those interestedin the education of the gifted.
While virtually all of the parents reported their children to be either"average" or "high" on the trait, "Unprejudiced," it is noteworthy thatthe moderately gifted boys were more often rated "high" than any othergroup to the extent of a difference of '23 percentage points between themand the nearest rating, that of the moderately gifted girls.
The results of these ratings must be interpreted remembering thatparents made the rating and the results therefore reflect how the parentbelieves his child behaves and believes. The clear-cut differences between
62

Tab
le X
XV
I
PAR
EN
TS'
RA
TIN
GS
OF
CH
ILD
ON
EM
OT
ION
AL
AD
JUST
ME
NT
TR
AIT
S
RA
TIN
GS
HA
PPY
, WH
OL
E-
SOM
E N
AT
UR
E
Num
ber
%ag
e
CA
LM
AN
DPO
ISE
D
Num
ber
%ag
e
WH
OL
ESO
ME
SE
XA
TT
ITU
DE
Num
ber
%ag
e
GE
NE
RA
LL
YSE
CU
RE
AN
DC
ON
FID
EN
T
Num
ber
%ag
e
Hig
h15
48.4
722
.F9
29.0
1341
.9H
igh
Ave
rage
1548
.422
71.0
1858
.118
58.i
Boy
sB
elow
Ave
rage
13.
21
3.2
00
00
Unc
erta
in0
01
3.2
39.
70
0
Hig
h15
48.4
722
.611
35.5
1341
.9L
owA
vera
ge13
41.9
1754
.812
38.7
1341
.9B
oys
Bel
ow A
vera
ge2
6.5
619
.40
03
9.7
Unc
erta
in0
00
05
16.1
13.
2
Hig
h18
52.9
1750
.015
44.1
2161
.8H
igh
Ave
rage
1235
.313
38.2
1647
.18
23.5
Gir
lsB
elow
Ave
rage
38.
83
8.8
00
25.
9U
ncer
tain
00
00
12.
91
2.9
Hig
h18
52.9
1235
.312
35.3
1852
.9L
owA
vera
ge16
47.1
1955
.919
55.9
1441
.2G
irls
Bel
ow A
vera
ge0
03
8.8
00
25.
9U
ncer
tain
00
00
12.
90
0

Tab
le X
XV
IPA
RE
NT
S' R
AT
ING
S O
F C
HIL
D O
N E
MO
TIO
NA
LA
DJU
STM
EN
T (
Con
tinue
d)
TR
AIT
S
RA
TIN
GS
FRE
E F
RO
ME
VA
SIO
N A
ND
RA
TIO
NA
LIZ
AT
ION
S
Num
ber
%ag
e
FRE
E F
RO
MN
ER
VO
US
HA
BIT
S
Num
ber
%ag
e
MO
DE
RA
TE
IN
DA
YD
RE
AM
ING
Num
ber
%ag
e
GO
OD
SE
NSE
OF
HU
MO
R
Num
ber
%ag
e
Hig
h8
25.8
516
.15
16.1
2064
.5H
igh
Ave
rage
1961
.321
67.7
2374
.211
35.5
Boy
sB
elow
Ave
rage
39.
75
16.1
13.
20
0U
ncer
tain
13.
20
02
6.5
00
Hig
h12
38.7
1341
.99
29.0
1961
.2L
owA
vera
ge15
48.4
1238
.720
64.5
929
.0B
oys
Bel
ow A
vera
ge2
6.5
412
.90
02
6.5
Unc
erta
in0
00
00
00
0
Hig
h14
41.2
111
29.4
1338
.219
55.9
Hig
hA
vera
ge17
50.0
1750
.016
47.1
1338
.2G
irls
Bel
ow A
vera
ge2
5.9
617
.63
8.8
12.
9U
ncer
tain
00
00
00
00
Hig
h12
35.3
1544
.17
20.6
1750
.0L
owA
vera
ge20
58.8
1441
.225
73.5
1750
.0G
irls
Bel
ow A
vera
ge2
5.9
514
.71
2.9
00
Unc
erta
in0
00
00
00
0
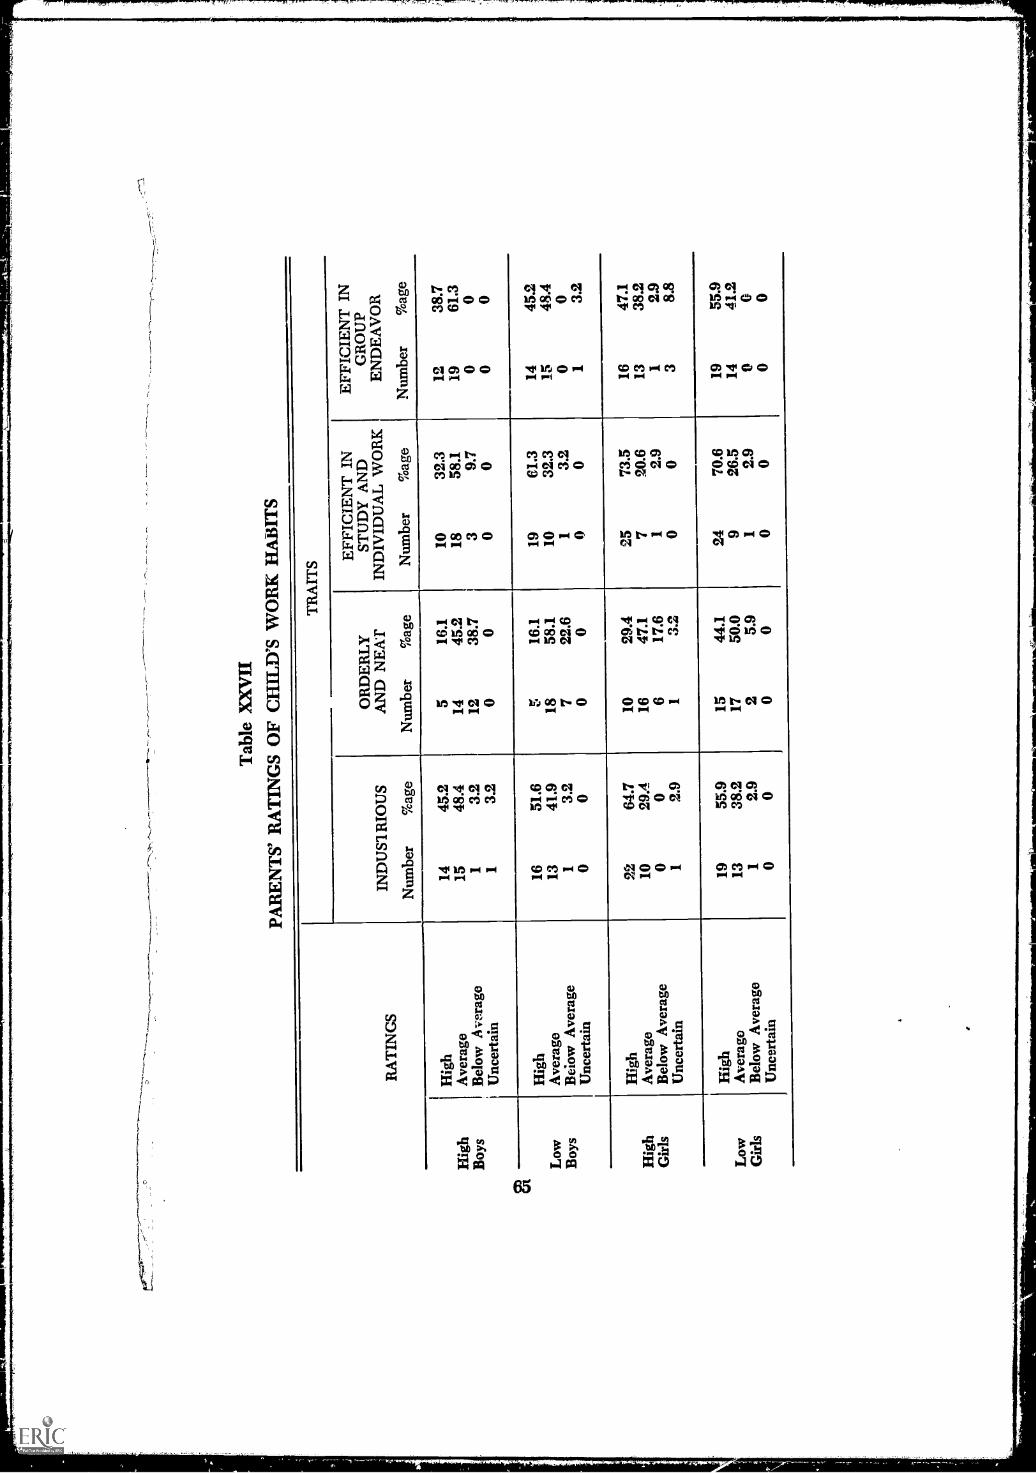
,4N
rqrg
iMN
RP
IMP
..q...
Ww
l.MIP
TM
wm
awm
wm
..am
wom
rwxr
wem
l.axw
crv,
.
a
Tab
le X
XV
II
PAR
EN
TS'
RA
TIN
GS
OF
CH
ILD
'S W
OR
K H
AB
ITS
RA
TIN
GS
TR
AIT
S
IND
US1
RIO
US
Num
ber
%ag
e
OR
DE
RL
YA
ND
NE
AT
Num
ber
%ag
e
EFF
ICIE
NT
IN
STU
DY
AN
DIN
DIV
IDU
AL
WO
RK
Num
ber
%ag
e
EFF
ICIE
NT
IN
GR
OU
PE
ND
EA
VO
R
Num
ber
%ag
e
Hig
hB
oys
Hig
hA
vera
geB
elow
Ave
rage
Unc
erta
in
14 15 1 1
45.2
48.4 3.2
3.2
5 14 12 0
16.1
45.2
38.7 0
10 18 3 0
32.3
58.1 9.7
0
12 19 0 0
38.7
61.3 0 0
Hig
h16
51.6
r16
.119
61.3
1445
.2
Low
Ave
rage
1341
.918
58.1
1032
.315
48.4
Boy
sB
eiow
Ave
rage
Unc
erta
in1 0
3.2
07 0
22.6 0
1 03.
20
0 10 3.
2
Hig
h22
64.7
1029
.425
73.5
1647
.1
Hig
hA
vera
ge10
29.4
1647
.17
20.6
1338
.2
Gir
lsB
elow
Ave
rage
00
617
.61
2.9
12.
9
Unc
erta
in1
2.9
I0
03
8.8
Hig
h19
55.9
1544
.124
70.6
1955
.9
Low
Ave
rage
1338
.217
50.0
926
.514
41.2
Gir
lsB
elow
Ave
rage
12.
92
5.9
12.
90
0
Unc
erta
in0
00
00
00

'wowPPlowle+wwwwworweir
the boys and the girls on acceptance of responsibility and courtesy, the
significant difference of the "Unprejudiced" rating of moderately gifted
boys, and the lower ratings on adjustment to failure all present areas in
need of further study.
Parents' tings of their child's emotional adjustment are reported
in Table XXVI. The eight traits on the Witty scale are: (1) happy,
wholesome nature, (2) calm and poised, (3) wholesome sex attitude,
(4) generally secure and confident, (5) free from evasions and rationali-
zations, (6) free from nervous habits, (7) moderate in daydreaming, and
(8) good sense of humor. Noteworthy is the great difference in reported
freedom from nervous habits between the high and moderate group,
favoring the moderately gifted group. On sense of humor, both moder-
ately and highly gifted boys were rated more highly than girls.
Parents' ratings of their child's work habits are reported in Table
XXVII. It is apparent that the highly gifted girls are most often rated
industrious, while the highly gifted boys are least often so rated (even
less often than either of the moderately gifted group), although the
differences are not great. Girls are reported more often than boys as
being orderly and neat, with moderately gifted girls more often so rated
than highly gifted girls. The highly gifted boys were least often reported
as high in "efficient in study and individual work" and "efficient in group
endeavor."Summary
The subjects in the study were found to be well adjusted. If major
differences exist in the adjustment of moderately and highly gifted
children, the instruments and procedures used in this study were not
sensitive enough to detect them. Parents' ratings indicated some differ-
ences both between the groups and between the sexes. Attempts to
measure self-concept met with limited success.
REFERENCES
Bonsai, Marcella and Stellfre, B. "The Temperament of Gifted Children," California
Journal of Educational Research, VI, 1955, 195-99.
Gallagher, James J. and Crowder, Thora H. "The Adjustment of Gifted Children in
the Regular Classroom," Exceptional Children, XXIII ( April, 1957), 306-12 and
( May, 1957), 353-63.
Hollingworth, Leta S. "The Child of Very Superior Intelligence as a Special Problem
in Social Adjustment," Mental Hygiene, XV (January, 1931), 3-16.
. "The Development of Personality in Highly Intelligent Children," National
Elementary Principal, XV (July, 1936), 272-81.
Lewis, W. Drayton. "Some Characteristics of Very Superior Children," The Journal
of Genetic Psychology, LXII, 1943, 301-309.
66
( 'r,
Liddle, Gordon. "Overlap Among Desirable and Undesirable Characteristics inGifted Children," Journal of Educational Psychology, IL ( August, 1958), 219-23.
Lucito, Leonard J. "A Comparison of the Independent Conformity Behavior ofIntellectually Bright and Dull Children," Unpublished Ph.D. Dissertation, Uni-versity of Illinois, 1959, 39-42.
Porter, Rutherford B., and Cattell, Raymond, B. Handbook for the IPAT Children'sPersonality Questionnaire "The CPQ" Forms A and B. Champaign, Illinois:Institute for Personality and Ability Testing, 1960.
Selig, Kalman. "Personality Structure as Revealed by the Rorschach Technique of aGroup Children Who Test at or above 170 I.Q. on the 1937 Revision of theStanford-Binet Scales," Dissertation Abstracts XIX ( January-June, 1959), 3373.
Shaw, M., et al. "Self Concept of Bright Underachieving High School Students asRevealed by an Adjective Check List," Personnel and Guidance Journal, XXXIX( November, 1960), 193-6.
Smith, Donald C. Personal and Social Adjustment of Gifted Adolescents. C.E.C.,Research Monograph, No. 4; editor, Lloyd M. Dunn, Washington, D.C.: TheCouncil for Exceptional Children, N.E.A., 54-56.
Wylie, Ruth C. The Self Concept. Lincoln, Nebraska: University of Nebraska Press,1961.
67

Chapter VII
SUMMARY, IMPLICATIONS ANDRECOMMENDATIONS
Learning more about gifted children has come to be recognizedincreasingly as more important. Early attention to identification pro-cedures and even characteristics of mentally precocious children arenow recognized as essential first steps, but not at all an answer to theproblems of educating such children. Controversy over identificationprocedures often resulted from the now apparent fact that even withinthe area of mental giftedness, there were differences in kinds of abilityand various degrees of these abilities. Lists of characteristics of giftedchildren encountered the same difficulties, for while even a majority ofmentally gifted children might seem to possess certain characteristics,there were those who could not be so characterized and, indeed, thereis even reason to suspect that many of the characteristics may be artifactsof superior environment rather than superior intelligence. The need forstudies of gifted children continues, with attention to ways in whichchildren categorized as gifted differ from one another. The present studywas intended to provide information about two groups of gifted children,one group clearly identified as highly gifted and another identified asmoderately gifted.The highly gifted children in the present study were defined asbeing those children nominated by intern psychologists from throughoutthe state of Ohio in grades three through six who received an I.Q. scoreof 148 or above on the Revised Stanford-Binet, Form L-M, Tests. Thesechildren were then matched with children of the same sex and grade whohad received a score of 120 through 134 on the Binet Tests. A fotql groupof 130 children was included in the study, 65 identified as highly giftedmatched with 65 identified as moderately gifted.
The highly gifted group included only children who were threestandard deviations above the norm, while the moderately gifted groupincluded children between roughly one standard deviation and twostandard deviations ( but none below 120 I.Q. score) above the norm.It was believed that by studying these two groups of children, andeliminating from the study any child whose Binet 1.Q. score was between135 and 148. there was less likelihood of contamination of any founddifferences in the groups as a result of standard error of measurementwhich might result in an overlap in the two groups. While there might68

be some objection to the labeling of the groups as highly and moderatelygifted, there can be little objection to the point that in terms of theirperformance on this particular test, the subjects in each of the two groupsperformed differently, with the highly gifted group performing signifi-cantly better than the moderately gifted group.
Information was collected from parents, teachers, school records,and the children themselves in a variety of areas. The Witty HomeInformation Record was used to obtain parents' reports. The Children'sPersonality Questionnaire ( IPAT) was used as a standardized measureof adjustment, while attempts were made to develop a self-concept scaleto determine what the children thought of their own ability to achieve.The Warner Scale to measure socio-economic status of the children wasused, as were reports from teachers, parents and the children themselves.The Iowa Tests of Basic Skills were administered to all of the childrento provide achievement data in addition to that obtained from othersources.
The data were treated in a variety of ways, each of which wasbelieved to be appropriate for that particular finding. It must be restatedthat the results of this study cannot be used to generalize about all highlyand moderately gifted children, but must be limited to those defined ashighly and moderately gifted children in this particular study. Thegroup is not necessarily representative even of such children in Ohio.Before generalizations can be made beyond the confines of this study,further research must be done with other groups of moderately andhighly gifted children. The summary is of this particular study whilethe implications are for those who are interested in pursuing the subjectbeyond this particular study.
The purpose of the study was to compare a group of highly giftedelementary school children with a group of moderately gifted children,in an attempt to determine any differences which might exist betweenthem. Data pertinent to the following questions were obtained.
1. In what areas of educational development do moderately andhighly gifted elementary school children differ, and to whatextent does this difference exist?
To what extent do the moderately gifted and highly giftedchildren in this particular study differ in personal, social, educa-tional, and family adjustment?
3. Are there differences in the family backgrounds of moderatelyand highly gifted children?
69
r.
SummaryThere has been very little research on characteristics of highly giftedchildren, and what research there has been has failed to distinguishclearly between the highly gifted group and that group of lesser intelli-gence immediately below them in the intellectual range. Because of theincrease in the standard error of measurement in intelligence testing asthe scores devi-I-e further above the norm, the likelihood of a group being
distinctively labeled, without contamination from the next lower group,is greatly decreased unless some gap is allowed between the two groupsfor the error in measurement. This has not been done previously so faras the present investigators know.
Inadequacy of Group TestingGroup I.Q. testing would have eliminated 11.5 per cent of thesubjects included in the present study because they did not score abovethe lower cut-off of 120 I.Q. on the group measure. Furthermore, 85.8per cent more subjects were obtained for the highly gifted group (l48I.Q. score and above) using the Binet results than if reliance had beenleft entirely to group I.Q. scores.The highest I.Q. scores were found among the younger children.
In virtually all instances the older subjects "hit the ceiling" of the test.This is important not in that it indicates any lowering of actual intelli-gence, but, for highly gifted children in particular, that the Binet testplaces a ceiling, which becomes increasingly more apparent from yearto year, on their scores.
Excess of Highly Gifted BoysThe nominating procedure resulted in an excess of highly giftedboys and moderately gifted girls. (The necessity to match the subjectsresulted in final groups slightly larger for the girls, but this was a resultof the limitations placed by having fewer moderately gifted boys andhighly gifted girls.) This difference in numbers of nominations mayhave been due to ( a) the manner in which they were selected, (b) thetest favoring boys at the upper extreme, (c) the existence of more highlygifted boys, (d) other unknown factors, or e) some combination of twoor more of these factors.
Family Background Favors Highly GiftedThere were no significant differences in the size of families from
which the moderately and highly gifted groups come. The majority ofeach group were first born children. The parents of the subjects werereiatively young, around mid-twenties, at the time of the child's birth.
70

il..,.*00001PMF0powiumgm*.*
Ii
t:'
r,
The highly gifted girls in this study had parents slightly older than theother groups, but the difference was not significant.
There was a difference (significant at the .01 level) in favor of thehighly gifted group on rating of parents' income and on rating of dwellingarea. Rating of house type indicated higher scores (significant at the.05 level) for the highly gifted group. Ratings by parents, however, asopposed to that of school administrators, revealed no significant differ-ences. It is possible that the more favorable ratings by school adminis-trators for the highly gifted group was a result of more objectivity, orthe similarity of ratings by parents of both the moderately and the highlygifted groups could reflect the tendency to rate such factors toward thenorm rather than give any indication of "bragging."
The parents of the subjects in each of the four groups wereexceptionally well educated, but the parents of the highly gifted grouphad more education than the parents of the moderately gifted group.The fathers of the highly gifted boys were the best educated. Themothers of the subjects in each of the four groups generally had lesseducation than did the fathers, but the same rank was maintained as forthe fathers (i.e. the mothers of the highly gifted boys were the besteducated.) About 15 per cent of the parents of the moderately giftedgroup had less than a high school education. There were more fathersof subjects in the highly gifted group in professional and managerialoccupations than there were in the moderately gifted group.
AccomplishmentsThere appeared to be a tendency for the highly gifted subjects to
score higher on measures of creativity than did the moderately giftedsubjects. Parents' rating of their child on creativity, however, indicatedno apparent differences.
All of the highly gifted girls play a musical instrument, while only50 per cent of the moderately gifted girls play an instrument. Only 20per cent of the boys, both highly gifted and moderately gifted, play amusical instrument.
Adjustment and Self-ConceptStandardized measures of personality (Children's Personality Ques-
tionnaire) indicated adjustment well wi hin the normal ranges for thesubjects in each of the groups. No significant differences in personalitywere detected between the two groups except in the "surgency" charac-teristics which indicated the highly gifted group was more "exuberant,talkative, happy-go-lucky, cheerful, quick and alert." Parents' reportsof adjustment of their children indicated few differences between thesubjects in each of the groups.
71
The group of highly gifted boys had a better self-concept of theirability to achieve than did the highly gifted' but there was nodifference between the self-concepts of the highly an ag oderately giftedgroups as a whole. The instrument appeared to Ile the subject'sattitude about his ability to achieve more than it rieas y ed other facetsof self-concept.
Listing of behavior irregularities was don y only about 2G per centof the parents, with slightly more parents of highly gifted subjects, bothboys and girls, indicating some irregularity than parents of moderatelygifted subjects. In both groups, parents of boys listed more than didparents of girls. No real significant difference between groups wasnoted. Sibling rivalry was the most frequently listed behavior irregularity.In stating their three wishes, children in the interview sample clearlyindicated that the moderately gifted group was more "outer-directed"
than the highly gifted group, while the highly gifted group exhibitedmore "self-aggrandizement." Twice as many of the parents of the highlygifted reported that their children preferred adult companions as didparents of the moderately gifted,Parents' ratings of their child's adjustment clearly indicate theirawareness of his average or above average adjustment. Ratings of free-dom from nervous habits indicate that the moderately gifted group isbetter adjusted in this respect.Highly gifted girls are most often rated "high" as "industrious," whilehighly gifted boys are rated least often as "industrious." Moderatelygifted girls were rated "high" more often than any of the other groupsin being "orderly and neat."
Teachers' Perception
Teachers did not perceive many of the children in the study as themost outstanding in the classroom in any of the ten categories from the"Who Is It?" questionnaire ( as listed previously in the chapter on adjust-ment). Whether teachers believed that these children were alreadybeing given enough additional attention, or whether the children werenot actually the outstanding ones in the classroom cannot be determined.Even in the area of intelligence, the children in the present study werenot chosen in any large number as the top child in the class.
School Achievement and ProgramThe girls in the highly gifted group had a somewhat better recordof attendance in school than any of the other groups, while the highlygifted boys had a somewhat poorer record of attendance. The differencesbetween the groups, however, are not large.
72

In achievement, the children scored on the Iowa Tests of BasicSkills at a level sufficiently above their actual grade placement to indicatethe virtual absence of so-called underachievement in both the highlygifted and the moderately gifted groups. The findings of earlier studiesindicating achievement at a level approximately two years above actualgrade placement is substantiated by this study.
None of the children in the present study scored below grade place-ment in achievement. The girls did better in achievement at the thirdgrade level, but by the sixth grade this difference had ceased to exist.As the children progressed through the elementary grades, the highlygifted group demonstrated a greater increase in excess grade placement.The total mean excess grade equivalent scores of the moderately andhighly gifted groups were significantly different (at the .01 level) infavor of the high group.
The total number of children reported to have been in a specialclass program is extremely low. Only six of the highly gifted and four ofthe moderately gifted had been in special classes, and all of these werein special classes which were a part of the state supported demonstration-research projects (under the auspices of the Division of Special Edu-cation of the Department of Education of Ohio) and not directly a resultof the initiative of the local school system.
An analysis of mechanical aspects of the writing ability of thesubjects produced no significant differences between groups on sentencelength, level of word difficulty, and use of adjectives, adverbs andprepositional phrases.
Physical DevelopmentGenerally, the superiority of gifted children in physical development
was demonstrated by the findings of this study, but the major purposeof distinguishing between highly gifted and moderately gifted did notresult in any outstanding differences. Coordination and strength wasthe only area on which the highly gifted group was not similar to themoderately gifted group. This difference might well be one resultingfrom less attention to Oysical skill and therefore less practice, ratherthan any inherent difference.
Implications
The implications from a study such as the one just reported areei..dless. Each reader will undoubtedly perceive many different ones from
those stated by the authors of this report. The important thing, of course,
is that research not be an end in itself, but that it provide additional
information, substantiate or refute previous findings, and above all
73
,

suggest future courses of action for both research and educational pro-cedure. Undoubtedly, we know far more about children than we arenow using. This is particularly true in the area of the gifted whereeducational provisions have been slow to develop in spite of the constantdemonstration of the need for special programming. The implicationsstated below are intended only to provide a beginning for additionalaction in order that the primary goal of education can be fulfilledthedevelopment of each child to the limit of his abilities.
Testing Program
There is an urgent need for a planned program of individual intelli-gence testing in the early elementary grades for all children who giveany indication of unusually high mental ability. Group intelligence testsare not a satisfar:tory measure of high intelligence, yet there is evidencethat individual testing is not being conducted due to either a lack oftrained personnel to administer the test or too much attention to testingof problem cases or cases of mental retardation.
If further study of the highly gifted continues to identify morehighly gifted boys than highly gifted girls, the methods of referral aswell as the testing instruments themselves must be examined more care-fully. The great danger is not that there may or may not be a preponder-ance of one sex over the other, but that in some manner whether certainintellectual factors are being overlooked, or our educational methods aresomehow supporting certain types of activities which tend to encouragean unbalanced development favoring one sex over the other.
in spite of the high achievement scores obtained by the highly giftedchildren, there is obviously a need for the development of an achieve-ment testing program which measttres more distinctly the upper levelsof the child's achievement, as well as the areas of weakness or gaps inlearning which can occur on present tests without being apparent becauseof the outstandingly high scores which tend to cover up deficiencies.
Achievement Level
The extremely high achievement level of the highly gifted subjectsclearly indicates that the existing program does not hinder their academicprogress to any great degree, and indeed apparently even encourages itup through the sixth grade. One can only speculate what happens aftercompletion of the sixth grade, however, when most children move intoa departmentalized program in which subject matter is taught primarilyout of a single text, with all-class assignments, a single grading system,and encouragement to strive for mastery of material which the highlygifted have mastered to a level at least two years and in a great manyinstances three and four years higher than their actual grade placement.
74
r

iq
r'
The high achievement level places a great responsibility upon thejunior and senior high schools to make those provisions, whether specialgrouping, acceleration or flexible curriculum, essential for childrenachieving at least two years above grade level. But merely makingadministrative provisions will not alter the basic need fur teaching pro-cedures, materials and content different from that presented to theregular classes.
Special ProvisionsAlthough there is much attention to the special needs of gifted
children, there is no evidence in the present study that attempts havebeen made to provide for the moderately gifted children, much less thehighly gifted, in a manner different from that of the average. In spiteof so much attention and effort on the part of the Department of Edu-cation in Ohio to disseminate information about the gifted and toencourage demonstration projects for the gifted, there is an alarmingabsence of effort on the local level to provide for the gifted in anyorganized manner.
The highly gifted more obviously need the benefits of special pro-gramming than do the moderately gifted, but because of the scarcity of
highly gifted children, it must be expected that programs of specialclasses will likely contain both moderately and highly gifted children.The teacher's responsibility in such a class should be to differentiateinstruction within such a group to meet the particular needs of thosechildren identified as highly gifted, as well as the needs, which mightindeed be different, of the moderately gifted.
It is not intended to imply that only in special groups can the needsof gifted children be adequately met. The present study itself clearlyindicates that in many ways, many of the children have been challengedand have achieved at a fantastically high level within the regular class-room. But one must ask how much better the child might have donehad he been in a situation in which the other children were challengingto him, the teacher could devote time to developing the special abilities
of this particular type of child, and he was not bound to the rigid
curriculum so necessary for children of less ability.
Socio-Economic Status
The socio - economic status of highly gifted children is higher thanthat of moderately gifted children which suggests the possibility thatin order to score at the highest levels of the individual intelligence test,the subject needs the full advantage of all the stimulating experiencesmore frequently found in families in which economic factors do notlimit the activities of the children. That average children also come from
75
the same situations in which stimulating experiences are provided indi-cates the existence of hereditary factors, but in discriminating betweenchildren at the highest levels of intelligence perhaps environmentalfactors are of greater importance than they are at the lower levels ofbrightness.
Creativity
The results of this study tend to indicate that there is a relationshipbetween high intelligence and high creativity. It seems logical to expectthat this would be true, particularly since the measurement of creativityso closely follows the same procedures used to measure intelligence.
Measurement of Adjustment
There is obviously a need for more refinement of instruments tomeasure the adjustment of gifted children. Quite likely, the very typesof adjustments measured for average children are different from those ofgifted and highly gifted children. Because the highly gifted are soperceptive, it is not unlikely that they respond to traditional measuresas much in terms of how they believe they should answer as in terms ofhow they actually feel. The question which must be raised is, "Shouldthe adjustment be measured in the same way and determined on thesame scale for gifted and highly gifted children as it is for average andbelow average children?" Obviously the question cannot be answeredwith what we now know about gifted children, but it is clear that existingmeasures of adjustment do not discriminate finely enough to provideinsight into the adjustment problems which gifted youngsters must face.
Teachers' Perception of Highly Gifted Children
There is obvious reason to be concerned when classroom teachersdo not perceive children with ability more than three standarddeviations above the norm as superlative in intelligence, much less inother areas. Perhaps the very differences which this study has tried sodiligently to identify between the highly and moderately gifted areoperating so that the teacher is confused as to whether or not the childshould be listed. To omit a child from a list of superlative ratings iscertainly not rejecting him, but it does indicate some lack of under-standing of the almost overwhelming possibilities open to this child infuture years.
The need is very great for further study of teacher's perceptions ofhighly gifted children. Perhaps not being identified as superlative hasbeen part of the child's stimulation to achieve at so much higher a levelthan would have been thought possible, so the finding is not necessarilybad. Probably the lack of information about highly gifted children,
76

a.
s.
L
because of the ,..arcity of research as well as the scarcity of highly giftedchildren, has resulted in the lack of understanding of hirr. and his uniqueproblems.
Portrait of The Highly Gifted Child
The highly gifted child is not in a special class, nor has he skippedany grade. His group I.Q. test does not indicate ability at the "highlygifted" level, but does indicate very superior intelligence. His I.Q. scoresappear to drop as he goes beyond the third grade because of the lowceiling of the test which he is already reaching, even at the age of nine.He is likely to be the first born child in a small family. He is achievingtwo years above his actual grade placement at the third grade level, andthis difference between achievement level and grade placement becomesgreater as he continues through the elementary grades. His parents areaware of his superior intelligence and success in school work. His parentsprobably earn more, are in professional and managerial occupationsmore frequently, live in a better neighborhood and home, and have abetter education than do the parents of moderately gifted children. Hisparents are college educated, but his father has more advanced educationthan his mother. He is more creative than moderately gifted children,but his parents do not perceive him to be more creative. Ile is welladjusted, differing only from moderately gifted children in that he ismore "out-going," but is not so free from nervous habits. His wishesare "inner-directed." He is not singled out by his teacher for superlativerating. He prefers adult companions to a greater extent than does themoderately gifted child.
The highly gifted boy differs from the highly gifted girl in someways. She plays a musical instrument, while he does not. Her schoolattendance is better than his, and his is poorer even than moderatelygifted children. Highly gifted boys were found more frequently thanhighly gifted girls. His father is better educated than hers, and wasfound in this study to be younger. He has a better self-concept of hisability to achieve than she does, but his parents report that he is lessindustrious and efficient in both individual and group endeavors. Hewas not achieving in language and reading as well as she was in thethird grade, but by the sixth grade his achievement was equal to hers.
Recommendations
It is apparent from this stud) of highly gifted youngsters that littleis known about them and, indeed, that it is difficult because of theinadequacy of existing tests and the extremely limited number of suchchildren to obtain information which will indicate the needs of thisparticular group. The highly gifted child frequently differs as much from
77
-
0111111111Nallimmen=0TV
the moderately gifted as the moderately gifted differs from the averageand yet there is no indication that anywhere in Ohio is much being doneto differentiate programs, materials or even instructional practices.
Recommendation Number 1: Establishment of a State Registry of HighlyGifted Children. It is strongly recommended that the Department ofEducation of Ohio establish in the Division of Special Education a state-wide registry of highly gifted children. Identification is obviously thefirst step toward understanding and adequately providing for any groupof exceptional children. Because of test limitations, particularly lowceilings, there is ample evidence that the abilities of highly gifted childrencannot be measured after the early elementary grades and may thereforenever be identified because of the absence of adequate measuringinstruments. Unidentified, it is not unlikely that the highly gifted childwill conform to the expected pattern of moderately gifted or even highaverage children. The establishment of a registry can provide theimpetus for early individual intelligence testing so that highly giftedchildren will not be lost as they move from grade to grade or from schoolto school. The Registry can provide a means for a follow-up of highlygifted children, as well as careful study of their needs and the kinds ofeducational programs which appear to benefit them in particular.
Recommendation Number 2: Promotion of summer workshops for teach-ers to acquaint them with the characteristics and needs of highly giftedchildren. In addition to the support which has previously been givento workshops for teachers of gifted children, it is recommended thatthe Department of Education of Ohio support workshops for teachersspecifically directed toward the education of highly gifted children. Theworkshops should include demonstration classes of such children, prob-ably collected from children listed in the Registry.
Recommendation Number 3: Financial excess cost support for identifi-cation and education of highly gifted children. The special needs ofhighly gifted children are probably exceeded only by society's need forthe results of the full development of the child's abilities. Education isnot a static process which can be financed in the same manner and tothe same extent for all. The excess cost of adequately educating highlygifted children will more than be repaid by the ultimate fulfillment ofthe child's potential.
78