Report Evaluating the Adequacy of the KXL DSEIS Market Analysis
64
Report evaluating the adequacy of the Keystone XL (KXL) Draft Supplemental Environmental Impact Statement (DSEIS) Market Analysis Ian Goodman Brigid Rowan www.thegoodman.com April 22, 2013
Transcript of Report Evaluating the Adequacy of the KXL DSEIS Market Analysis

Report evaluating the adequacy of the Keystone XL (KXL)
Draft Supplemental Environmental Impact Statement (DSEIS) Market Analysis
Ian Goodman Brigid Rowan
www.thegoodman.com
April 22, 2013

Report evaluating the adequacy of the KXL DSEIS Market Analysis 2
Table of Contents
1. Executive Summary ........................................................... 4
2. Introduction ........................................................................ 8
3. DSEIS Market Analysis: Key Elements ........................... 10
4. Crude Markets .................................................................. 14
4.1. Market Analysis in a Rapidly Shifting Context .............................. 14
4.2. US Crude Production ....................................................................... 16
4.3. Competition between Crudes .......................................................... 16
4.4. Operating Decisions to Shift Crude Slate ...................................... 18
4.5. Capital Investment to Shift Crude Slate ......................................... 21
4.6. Refinery Ownership by Non-Canadian Heavy Crude Producers 24
4.7. Conclusions ...................................................................................... 25
5. Availability and Cost of Crude Oil Transportation ......... 27
5.1. Introduction ....................................................................................... 27
5.2. Increases in Pipeline Capacity ........................................................ 28
5.2.1. Introduction ....................................................................................................... 28
5.2.2. Pipelines to the West: Northern Gateway and Trans Mountain Expansion . 29
5.2.3. Pipelines to the East: Line 9 and Energy East ................................................ 31
5.3. Increases in Rail Capacity ............................................................... 33
5.3.1. Introduction ....................................................................................................... 33
5.3.2. Critique of Market Analysis Figure 1.4.6-5 ...................................................... 35
5.3.3. Critique of Market Analysis Table 1.4-9 ........................................................... 37
5.3.4. Locational and Logistical Factors for Crude by Rail ...................................... 40
5.4. Pipelines and Rail as Transport Options for Tar Sands ............... 44
5.4.1. Risk Factors Related To Crude By Rail ........................................................... 48
5.5. Conclusion ........................................................................................ 50
6. Tar Sands Expansion and Breakeven Costs .................. 51

Report evaluating the adequacy of the KXL DSEIS Market Analysis 3
6.1. Introduction ....................................................................................... 51
6.2. Sensitivity to Logistics Costs and Crude Prices .......................... 51
6.3. Labor and other Alberta-Specific Constraints .............................. 52
6.3.1. Comparison of Canadian and US Regional Economic Factors Impacting
Energy Development ......................................................................................... 55
6.4. Crude Price and Other Broader Market Dynamics ....................... 56
6.5. Tar Sands Breakeven Costs ............................................................ 57
6.6. Conclusion ........................................................................................ 61
7. KXL Impact on Tar Sands Expansion ............................. 62

Report evaluating the adequacy of the KXL DSEIS Market Analysis 4
1. Executive Summary
In reviewing the adequacy of Keystone XL (KXL) Draft Supplemental Environmental Impact
Statement (DSEIS), the TGG Report has focused on the evaluation of the main conclusion of
the DSEIS Market Analysis. The Market Analysis has concluded that KXL will not have a
substantial impact on tar sand production and expansion. In response, this Report seeks to
answer the following question:
“Did the DSEIS Market Analysis substantially underestimate the impact that a rejection of KXL
would have on tar sands production and expansion through 2030 across a number of
scenarios?”
The TGG Report answers this question with an unequivocal yes.
Based on our evaluation of current market conditions (including emerging crude markets,
factors driving tar sands expansion, availability and cost of crude oil transportation, and tar
sands breakeven costs),the TGG Report concludes that the Market Analysis is deeply flawed
and not a sound basis for decision-making. We have determined that KXL, and specifically its
impact on tar sands logistics costs and crude prices, will have a significant impact on tar sands
expansion under a very broad range of conditions and assumptions.
The precise impact of KXL is difficult to quantify and would require a highly sophisticated
analysis that examines a range of scenarios and many interactive effects (to model the dynamic
market conditions that exist in the real world petroleum markets). However, for the purposes of
providing practical guidance to policymakers, a conservative and credible estimate would be
that KXL’s effect on tar sands expansion would be 100% or 1:1. In other words, every barrel of
tar sands crude transported by KXL would be the equivalent of a barrel of expanded crude
production in the tar sands. Therefore, if at full capacity, KXL can transport 830,000 bpd of tar
sands crudes, then its effect on tar sands expansion would be 830,000 bpd.
To undertake our evaluation of the DSEIS Market Analysis on which the TGG Report
conclusions (and impact estimate) are based, we first outlined the key elements of the Market
Analysis that drive the DSEIS conclusion (i.e. that KXL will not have a substantial impact on tar
sand production and expansion) in Section 3).
In the subsequent Sections (Sections 4, 5, and 6), we focused on the following areas relating to
tar sands market conditions: Crude Markets, Availability and Cost of Crude Oil Transportation,
and Tar Sands Expansion and Breakeven Costs. For each of these areas, we examined the
assumptions and methodology of key elements of the Market Analysis. In each of the focus
areas (which corresponds to a separate section), the TGG Report determined that the
assumptions and methodology of key elements of the Market Analysis were flawed and not a
sound basis for decision-making. Furthermore, each of these sections supports the TGG

Report evaluating the adequacy of the KXL DSEIS Market Analysis 5
Report’s key finding that KXL will have a significant impact on tar sands expansion under a very
broad range of conditions and assumptions.
The TGG Report’s Crude Markets analysis (Section 4) evaluates the DSEIS Market Analysis in
the context of the rapid and dramatic shifts currently underway in the North American oil system.
TGG compares the DSEIS analysis with information from a number of sources and determines
that the DSEIS analysis is not properly reflective of emerging market conditions. As part of our
analysis in this Section, TGG examined (i) US crude production; (ii) competition between
different crudes; (iii) capital investment and operating decisions that shift the crude slate; and
(iv) foreign refinery ownership issues affecting Canadian tar sands. TGG concludes that (a) the
emerging and dynamic conditions in the crude markets may become increasingly challenging
for tar sands producers; (b) the DSEIS Market report uses lagging data and does not
adequately take into account how changes in the crude markets are likely to result in more
challenging economic conditions for tar sands producers. Under challenging economic
conditions, it is even more essential for tar sands producers to have access to high volume, low
cost logistics. Therefore the approval of KXL will have a significant impact as an enabler of less
profitable marginal tar sands projects that could not be constructed without access to low cost
logistics.
TGG’s review of the Availability and Cost of Crude Oil Transportation (Section 5) demonstrates
serious impediments to both pipeline expansion and crude by rail. TGG therefore rejects the key
Market Analysis assumption that pipeline and other transport/takeaway capacity will not be a
significant constraint on tar sands. Our evaluation concludes definitively that pipelines are by
far the preferred transportation option because of low costs and high capacity. However, it is
clear that the tar sands are currently pipeline-constrained. Section 5.2 concludes that in light of
increasing public opposition, there are uncertain prospects for all of the major proposed pipeline
projects to transport tar sands crude. Section 5.3 then undertakes a detailed review of the
DSEIS assumption that crude by rail can be implemented at a sufficient scale and speed to
transport all incremental tar sands production to markets, even absent new pipeline capacity.
This Section demonstrates the deep flaws in the DSEIS assumption regarding crude to rail. In
fact, contrary to the assumptions of the Market Analysis, our evaluation concludes that crude by
rail is a not well matched for the transport of tar sands crude in terms of both cost effectiveness
and risk factors.
Section 5 evaluates and rejects the two flawed and related DSEIS assumptions discussed
above (i.e. that (a) pipeline and other transport/takeaway capacity will not be a significant
constraint on tar sands expansion; and (b) crude by rail can be implemented at a sufficient scale
and speed to transport all incremental tar sands production to markets, even absent new
pipeline capacity). These two assumptions are among the most significant drivers for the DSEIS
conclusion that KXL will not have a substantial impact on tar sand production and expansion.
And both assumptions are deeply flawed. As such TGG devoted significant effort in Section 5 to
demonstrate the uncertain prospects for all of the major proposed pipeline projects to transport
tar sands crude. It was then necessary to examine the validity of the Market Analysis’ second
significant assumption: that other logistics (notably crude by rail) can be implemented at a

Report evaluating the adequacy of the KXL DSEIS Market Analysis 6
sufficient scale and speed to transport all incremental tar sands production to markets, even
absent new pipeline capacity. Section 5.3 undertakes an extensive review of the current and
prospective use of crude by rail as a viable large-scale transportation option for tar sands crude.
TGG concludes that crude by rail is not well matched for the large-scale transport of tar sands
crude, both in terms of cost-effectiveness and risk factors. In demonstrating that there are
serious impediments to other tar sands crude transportation options (including other pipelines
and crude by rail), Section 5 makes a strong case that the approval of KXL matters - and it
matters a great deal - for tar sands expansion.
Section 6 provides an appropriate framework for analyzing tar sands expansion and breakeven
costs. The Market Analysis assumes that most tar sands projects will likely have breakeven
costs that are low relative to likely crude pricing, such that these projects will still be profitable
with higher logistics costs. In Section 6.2, the TGG report explores the important issue of how
changes in logistics costs and crude prices affect the amount of tar sands expansion. We
conclude that the following framework is a reasonable basis for analysis and decision-making:
1) Across a very broad range of conditions and assumptions, changes in logistics costs
and crude prices will impact the amount of tar sands expansion.
2) KXL, and specifically its impact on tar sands logistics costs and crude prices, will
thus impact the amount of tar sands expansion.
Sections 6.3 and 6.4 demonstrate how different market dynamics affect the relationship
between crude prices and tar sands expansion costs. In a context where logistics are
constrained (and potentially subject to major opposition and delays), a high rate of tar sands
expansion (likely accompanying high crude prices) could result in higher effective logistics
costs. In contrast, a lower rate of tar sands expansion (likely accompanying low crude prices)
could result in lower effective logistics costs. However, generally lower crude prices are not
favorable for tar sands profitability and expansion.
These dynamics matter in terms of how KXL could have an impact on tar sands expansion. At
high crude prices, access to a low-cost, high-capacity transportation option could facilitate
maximum tar sands expansion since part of the constraint of higher logistic costs would be
removed. At low crude prices, access to a low-cost, high-capacity transportation option could
enable some of the less profitable marginal tar sands projects. Therefore across a broad range
of conditions (high crude prices and high logistics costs to low crude prices and low logistics
costs), KXL can enable tar sands expansion (at low crude prices and low-cost logistics) or
maximize tar sands expansion (at high crude prices and high-cost logistics).
Tar sands breakeven costs are examined in Section 6.5 and the Market Analysis data is
compared to other more recent data sources. Our evaluation shows that the DSEIS is relying on
outdated information that substantially underestimates the breakeven costs for tar sands
projects under emerging market conditions. As indicated above, under challenging economic
conditions, it is even more essential for tar sands producers to have access to high volume, low

Report evaluating the adequacy of the KXL DSEIS Market Analysis 7
cost logistics. Approval of KXL will have a significant impact as an enabler of less profitable
marginal tar sands projects that could not be constructed without access to low-cost logistics.
Based the evaluation of current market conditions in the TGG Report, Section 7 concludes the
following:
3) The DSEIS Market Analysis is deeply flawed and not a sound basis for decision-
making.
4) KXL, and specifically its impact on tar sands logistics costs and crude prices will
have a significant impact on tar sands expansion under a very broad range of
conditions and assumptions.
5) The exact quantification of the impact of KXL requires a sophisticated analysis that is
beyond the scope of this report. However, for purposes of providing practical
guidance to policymakers, a conservative and credible estimate would be that KXL’s
effect on tar sands expansion would be 100% or 1:1. In other words, every barrel of
tar sands crude transported by KXL would be the equivalent of a barrel of expanded
crude production in the tar sands.
6) Should policymakers wish to base their decision on a more sophisticated and
detailed analysis, we suggest that the evaluation from the TGG Report be used as
input for such an analysis, which would also address and remedy the deep flaws
identified in the DSEIS Market Analysis.

Report evaluating the adequacy of the KXL DSEIS Market Analysis 8
2. Introduction
This Report evaluates the adequacy of the Keystone XL (KXL) Draft Supplemental
Environmental Impact Statement (DSEIS).1 Specifically, this Report reviews and responds to the
DSEIS Market Analysis (Section 1.4). The DSEIS Market Analysis relies, in part, on information
provided in other sections of the DSEIS. Thus, this Report also reviews and responds to
information provided elsewhere in the DSEIS, notably Market Analysis Supplemental
Information (Appendix C), and No Action Alternative (Section 2.2.3, and specifically information
relating to crude by rail).
This Report was prepared by The Goodman Group, Ltd. (TGG), a consulting firm specializing in
energy and regulatory economics.2 This project was partially supported with funding from
Natural Resources Defense Council (NRDC) and the Sierra Club.3 Any findings, conclusions or
opinions are those of TGG and the authors and do not necessarily reflect those of NRDC and/or
the Sierra Club.
In evaluating complex energy issues, TGG’s orientation is to undertake a deep and
comprehensive analysis of the relevant economic and other issues. But the KXL DSEIS Market
Analysis touches upon a very wide range of issues, such that a full independent analysis and
extensive consideration of relevant context is simply impractical for TGG to undertake given the
limited time, information, and other resources available. In light of these constraints, TGG has
provided a sound alternative analysis that offers useful guidance to policymakers. In particular,
the alternative analysis provided in this report provides more useful guidance than does the
flawed Market Analysis in regard to whether KXL will substantially impact tar sands expansion.
Based on guidance from our alternative analysis (and other input received as part of comment
process), the EIS preparers should now revise the Market Analysis in order to provide a sound
basis for decision-making.
In reviewing the adequacy of the Market Analysis, TGG was particularly focused on evaluating
its main conclusion: that KXL will not have a substantial impact on tar sands production and
expansion. To undertake this evaluation, we first outlined the key elements of the Market
Analysis that drive this main conclusion (Section 3). In the subsequent sections (Sections 4-6),
1 http://keystonepipeline-xl.state.gov/draftseis/index.htm 2 www.thegoodman.com This Report was co-authored by Ian Goodman and Brigid Rowan, co-authors (with the Cornell Global Labor Institute) of a previous report regarding KXL: Pipe Dreams? Jobs Gained, Jobs Lost by the Construction of Keystone XL. 3 The issues regarding KXL are of great importance and have been the subject of wide public concern in the US, Canada, and elsewhere. In preparation of this report, the authors undertook substantial work in addition to that supported with funding from NRDC and the Sierra Club. This additional work is provided as a public service to assist in consideration of the important issues regarding KXL.

Report evaluating the adequacy of the KXL DSEIS Market Analysis 9
we examined the assumptions and methodology of key elements of the Market Analysis relating
to Crude Markets (Section 4), Availability and Cost of Crude Oil Transportation (Section 5) and
Tar Sands Expansion and Breakeven Costs (Section 6).
Section 4 contrasts the Market Analysis consideration of emerging market conditions with data
from a number of sources and demonstrates that the DSEIS market outlook is not properly
reflective of emerging market conditions. TGG concludes that emerging and dynamic conditions
in the crude markets may become increasingly challenging for tar sands producers. Section 5
critiques the assumptions in the Market Analysis that tar sands transportation options will be
readily available and cost-effective, such that tar sands production can profitably access
markets even without KXL or any new pipeline. This section concludes that there are serious
impediments to both pipeline expansion and crude by rail. Section 5.3 undertakes a rigorous
review of the DSEIS assumption that crude by rail can be implemented at a sufficient scale and
speed to transport all incremental tar sands production to markets, even absent new pipeline
capacity. Section 5.3 demonstrates the deep flaws in this key DSEIS assumption. Section 5.4
compares pipelines and rail as transport options for tar sands. Section 6 provides an
appropriate framework for analyzing tar sands expansion and breakeven costs.
In light of our evaluation of the market conditions and the assumptions of the Market analysis,
Section 7 provides TGG’s conclusion that KXL will have a substantial impact on tar sands
expansion under a broad range of conditions and assumptions. The Section concludes with
TGG’s recommendations for policymakers based on our analysis.

Report evaluating the adequacy of the KXL DSEIS Market Analysis 10
3. DSEIS Market Analysis: Key Elements
Petroleum markets are large, complex, and highly interconnected. In turn, the DSEIS Market
Analysis is lengthy and complex, with significant interrelationships between its various elements.
Petroleum markets are also highly dynamic and interactive. The Market Analysis is much more
static, but does (to some degree) attempt to deal with market dynamics via consideration of
alternative scenarios and assumptions.
The Market Analysis is summarized in Section 1.4.1 (pp. 1.4.1 – 1.4.-2, emphasis added):
While the increase in U.S. production of crude oil and the reduced U.S.
demand for transportation fuels will likely reduce the demand for total U.S.
crude oil imports, it is unlikely to reduce demand for heavy sour crude at
Gulf Coast refineries. Additionally, as was projected in the 2011 Final EIS, the
midstream industry is showing it is capable of developing alternative capacity to
move Western Canadian Sedimentary Basin (WCSB) (and Bakken and
Midcontinent) crudes to markets in the event the proposed Project is not built.
Specifically, it is moving to develop alternative pipeline capacity that would
support Western Canadian, Bakken, and Midcontinent crude oil movements to
the Gulf Coast and is increasingly using rail to transport large volumes of crude
oil to East, West, and Gulf Coast markets as a viable alternative to pipelines. In
addition, projected crude oil prices are sufficient to support production of
essentially all Western Canadian (and U.S. tight oil [footnote in original omitted])
crude oil projects, even with potentially somewhat more expensive transport
options to market in the form of alternative pipelines and rail. Rail and supporting
non-pipeline modes should be capable, as was projected in 2011, of providing
the capacity needed to transport all incremental Western Canadian and Bakken
crude oil production to markets if there were no additional pipeline projects
approved.
Approval or denial of any one crude oil transport project, including the
proposed Project, remains unlikely to significantly impact the rate of
extraction in the oil sands, or the continued demand for heavy crude oil at
refineries in the U.S. Limitations on pipeline transport would force more crude
oil to be transported via other modes of transportation, such as rail, which would
probably (but not certainly) be more expensive. Longer term limitations also
depend upon whether pipeline projects that are located exclusively in Canada
proceed (such as the proposed Northern Gateway, the Trans Mountain
expansion, and the TransCanada proposal to ship crude oil east to Ontario on a
converted natural gas pipeline).
If all such pipeline capacity were restricted in the medium-to-long-term, the
incremental increase in cost of the non-pipeline transport options could result in a

Report evaluating the adequacy of the KXL DSEIS Market Analysis 11
decrease in production from the oil sands, perhaps 90,000 to 210,000 barrels per
day (bpd) (approximately 2 to 4 percent) by 2030. If the proposed Project were
denied but other proposed new and expanded pipelines go forward, the
incremental decrease in production could be approximately 20,000 to 30,000 bpd
(from 0.4 to 0.6 percent of total WCSB production) by 2030. (As examined in
section 4.15, such production decreases would be associated with a decrease in
greenhouse gas emissions in the range of 0.35 to 5.3 MMTCO2e annually if all
pipeline projects were denied, and in the range of 0.07 to 0.83 million metric tons
carbon dioxide equivalent (MMTCO2e) annually if the proposed Project were not
built.)
Fundamental changes to the world crude oil market, and/or far reaching actions
than are evaluated in this Supplemental EIS, would be required to significantly
impact the rate of production in the oil sands.
For evaluating the Market Analysis, it is useful to first outline its most important underlying
assumptions and relationships. The following key elements drive the DSEIS findings that KXL
will not have substantial impacts on tar sands production (and related GHG emissions and other
impacts):
1. Based to some extent on the assumptions/forecasts from US DOE EIA, and specifically the
AEO (Annual Energy Outlook).
2. Generally assumes high and rising crude prices.
3. With these high crude prices, assumes that tar sands crudes will be competitive to supply
existing and potential new markets (in North America and overseas).
4. Assumes significant near-term growth in North American (and specifically US) light crude
production (notably from shale/tight oil), followed by a leveling out and decline of US
production after 2020.
5. Assumes that competition from light crudes will not substantially impact the markets for
heavy tar sands crudes and that these markets will continue to grow (including refineries
undertaking new reconfiguration projects to process more heavy crudes).
6. Assumes that costs of new tar sands projects/production are moderate and increase at only
the rate of general inflation.
7. Based on the above, tar sands expansion is generally assumed to be profitable and large
scale expansion will proceed in all likely scenarios, even if KXL is not built.
8. Assumes that pipeline projects other than KXL are likely to be completed and will facilitate
transport of tar sands crudes (especially if those other projects repurpose existing

Report evaluating the adequacy of the KXL DSEIS Market Analysis 12
infrastructure and right-of-ways, and/or have less complex permitting (e.g., are solely within
the US or Canada and thus do not require a US Presidential Permit)).
9. To the extent that KXL and other pipelines are not completed to transport growing tar sands
production to profitable markets, assumes that other logistics (notably rail) can be put in
place and used to transport tar sands crudes to markets.
10. Specifically assumes that other logistics (notably rail) can be implemented at sufficient scale
and speed to transport all incremental tar sands production to markets, even absent any
additions of new pipeline capacity.
11. Assumes that transporting tar sands crudes by other logistics (notably rail) may have
somewhat higher costs than would transport by pipelines, but the likely incremental cost is
small (possibly zero in some cases, likely ranging from $2.00-$7.50/barrel, with the middle of
range being $5/barrel).
12. Assumes that if transporting crudes by other logistics (notably rail) has higher costs than
would pipelines, this cost penalty may impact only the tar sands production transported via
other logistics, rather than impacting pricing more broadly (notably for tar sands production
transported via lower cost logistics (notably pipelines)).
13. With this assumed relatively small incremental cost for transporting crudes by other logistics
(notably rail), assumes that constraints on pipelines (KXL not being built, or even no new
pipelines being built) will have only a small impact on tar sands logistics, costs, profitability,
and development of new projects.
14. Based on the above, assumes that pipeline and other transport/takeaway capacity will not
be a significant constraint on tar sands production and growth.
15. Based on all of the above assumptions and relationships, the Market Analysis concludes
that that KXL will not have substantial impact on tar sands production (and thus will not have
substantial impacts on GHGs and other impacts associated with tar sands production.
Finally, a significant key element that is driving the findings of the DSEIS Market Analysis is the
extensive reliance on information from industry sources. The DSEIS Market Analysis is based
on an assemblage of data and other information from multiple sources. While it is not
uncommon for analysis of complex energy and economic issues to rely upon disparate sources,
great care is needed to ensure that the overall analysis is objective, coherent, internally
consistent, and will provide useful and meaningful results. The need for great care is increased
when the data are (in many cases) derived from industry sources and analyses. Especially
when there can be very substantial financial and other self-interest involved, data and other
information should not be assumed to wholly objective; to the extent practical, inputs to the
analysis should be carefully reviewed and verified for consistency and accuracy.

Report evaluating the adequacy of the KXL DSEIS Market Analysis 13
Given the nature of petroleum market analysis, extensive reliance on information from industry
sources may be somewhat inevitable. Nonetheless, it should be recognized that in many cases,
these industry sources are seeking (implicitly and often explicitly) to advocate tar sands
expansion and more specifically construction of KXL and other projects relating to pipelines and
other logistics. In this context, it is especially important to undertake “sanity checks” to ensure
that the analysis is sound. TGG is very aware of the difficulties of energy analysis and
policymaking, in general and especially at this time when the energy system is in a period of
very rapid change. Decisions need to be made based on reasonably available information, and
the standard is not (and cannot be) perfection. But the standard also needs to be high enough
so the analysis is sound and provides a sound basis for decision-making.
Unfortunately, the DSEIS Market Analysis is substantially flawed and thus does not provide a
sound basis for decision-making in regard to KXL impacts. The purpose of an EIS to identify
impacts associated with a proposed Project. But in effect, the Market Analysis assumes away
virtually all of the impacts associated with KXL.
As elaborated upon in the sections below, the Market Analysis assumptions and methodology
are questionable. In fact, KXL could actually have a quite substantial impact on tar sands
production (and thus related GHG and other impacts).
In Sections 4 to 6, TGG examines the assumptions and methodology of key elements of the
Market Analysis relating to Crude Markets (Section 4), Availability and Cost of Crude Oil
Transportation (Section 5) and Tar Sands Expansion and Breakeven Costs (Section 6).

Report evaluating the adequacy of the KXL DSEIS Market Analysis 14
4. Crude Markets
4.1. Market Analysis in a Rapidly Shifting Context
As noted in the Market Analysis (pp. 1.4-7 – 1.4-23), in recent years, the North American oil
system has been undergoing dramatic shifts that are large, rapid, ongoing, and possibly
accelerating. Put very simply, US crude production is rapidly increasing, but US demand for
refining products is stagnant or falling, such the crude imports are rapidly falling and product
exports rapidly rising. The Market Analysis claims to be up to date with respect to current
information on market outlooks (p. 1.4-7):
The analysis presented in this Supplemental EIS uses the most current
information available. It examines several recent market outlooks, including the
2013 early release version of the AEO (the 2010 AEO had provided key input
assumptions for the EnSys 2010 and 2011 assessments). As in 2011, the
Department again consulted with experts from USDOE, and reviewed information
from industry associations such as CAPP and private consulting companies such
as Ensys, Hart Energy, and ICF International.
The Department also relied on a January 2013 memorandum from the
Administrator of the EIA that analyzed some of the key issues also presented in
this section (2013 EIA Memo [footnote 7 in original omitted]). Finally, the
Department also reviewed numerous comments received from the public during
the National Interest Determination comment period for the previously proposed
Project, and the scoping process for this Supplemental EIS.
While the AEO has begun to take into account the dramatic shifts these shifts into account,
there is typically a significant lag in the AEO forecasts. So it is fair to say that the AEO (and its
forecasts, specifically the AEO 2013 Early Release) is actually now a lagging indicator of
emerging shifts in petroleum markets. At some point in the future, conditions may begin to
stabilize, and AEO forecasts may catch up to more fully reflect emerging future realities. But for
now and quite possibly for at least the next few years, each new AEO forecast will reflect major
changes from the year before, but the next year’s forecast will reflect even more change.
The AEO forecasts will likely continue to be playing catch up until the boom in shale/tight oil
production levels off, or at least until it becomes better understood and its future evolution
becomes more predictable. And in fact, the STEO (Short-Term Energy Outlook) from US DOE
EIA has already reflected some changes from the AEO 2013 Early Release, notably to
Report evaluating the adequacy of the KXL DSEIS Market Analysis 15
substantially increase the forecast of US crude production (particularly from shale/tight oil) for
2013 and 2014. 4
TGG is very aware of the difficulties of energy forecasting and policymaking, in general and
especially in a period of very rapid change. TGG shares the view of some other energy market
analysts that the recent shifts in North American oil system (notably the rapid increase in
production from shale/tight oil, hydraulic fracturing (fracking), and horizontal drilling) are likely to
be ongoing and possibly accelerating, as they have been for natural gas. But there are very
large uncertainties associated with these shifts, and many (including many environmental
organizations) continue to be skeptical that these shifts are likely to be sustained and are
sustainable (in a variety of senses).
The lagging nature of the AEO forecasts (and the Market Analysis more generally) matters for
evaluating KXL, since the emerging market realities are considerably less favorable for tar
sands expansion. From the perspective of a few years ago (which continues to be reflected in
the lagging Market Analysis), large future expansion in tar sands production might appear to be
inevitable (or at least very likely). But, in reality, this large expansion is no longer so inevitable or
even likely. Thus, in the current evolving context, the Presidential Permit decision on KXL has
much more potential to affect tar sands development than it would otherwise. Building KXL will
help to shore up the deteriorating profitability and prospects for tar sands expansion, so that
more projects go ahead despite an otherwise increasingly challenging context. Not building KXL
will accelerate the shifts away from tar sands expansion by discouraging near-term project
development and giving more time to emerging market realities (and other factors) to constrain
future tar sands expansion.
There is a wide range of opinion regarding future crude prices (for both North American and
global markets). Given the shifts underway in North America and globally, some are predicting
that crude prices will soften or even decline substantially from current levels.5 In particular, the
decline in waterborne imports into North America is certainly affecting crude pricing in North
American markets, and there are increasing indications that this large decrease in imports will
also begin to put downward pressure on global crude prices.
4 http://www.eia.gov/pressroom/presentations/sieminski_02212013.pdf p. 21.
5 E.g., Verleger http://www.pkverlegerllc.com/assets/documents/TIE_W13_Verleger.pdf
and Citi, Energy 2020: Independence Day https://www.citivelocity.com/citigps/ReportSeries.action https://ir.citi.com/dY2GZTnBVKoXNrT1sVyHcQCSQNAUUsI%2F8pXCARkTtvUOa8zDR2EckBRtxCGyJoDVW58uAgJ35%2BU%3D
Report evaluating the adequacy of the KXL DSEIS Market Analysis 16
4.2. US Crude Production
Based on AEO 2013, the Market Analysis assumes significant near-term growth in North
American (and specifically US) light crude production (notably from shale/tight oil), but US
production will then level out and decline after 2020. Following the AEO 2013 Early Release in
December 2012, the February 2013 Short Term Energy Outlook (STEO) substantially increased
the forecast of US crude production (notably from shale/tight oil) for 2013 and 2014.6
There is wide uncertainty and controversy regarding growth in US crude production. But at least
in the short-term, the reality is that production is growing very fast and that this growth is (if
anything) accelerating, rather than moderating. For a variety of reasons, this growth may not be
sustained (or sustainable), but it is relevant to consider that there are notable parallels between
the recent evolution of oil and gas production and markets. Many were skeptical that shale gas
production had large potential, would continue to grow, and would result in substantially lower
natural gas prices over an extended period. And some still are skeptical. But at this point, it is
becoming increasingly clear that shale gas is in many ways a game changer for North American
(and possibly global) gas markets. There are some notable differences between gas and crude
markets, and the evolution of shale/tight oil is at an earlier stage of development than is shale
gas. Nonetheless, it is becoming increasingly credible that shale/tight oil will also be in many
ways a game changer for North American (and possibly global) crude markets.
4.3. Competition between Crudes
The Market Analysis assumes that competition from light crudes will not substantially impact the
markets for heavy tar sands crudes and that these markets will continue to grow (including
refineries undertaking new reconfiguration projects to process more heavy crudes). In particular,
the Market Analysis assumes that refineries now configured to process heavy crudes (notably
on the Texas Gulf Coast) are unlikely to shift away from heavy crudes to process more light
crudes (pp. 1.4-20 - 1.4-22, emphasis added):
The AEO outlooks, as well as the current trends in the market, suggest that
increased production of tight oil (light, sweet grade of crude oil), has not impacted
the demand for heavy, sour crude oil at the U.S. refineries optimized to process
heavy crude oil. The EIA notes, “AEO2013, AEO2012, and AEO2011 all project
continued strong demand for heavy sour crudes from Gulf Coast refiners that are
optimized to process such oil” (see the 2013 EIA memo in Appendix C, Market
Analysis Supplemental Information). A main driver for this is that although
6 http://www.eia.gov/pressroom/presentations/sieminski_02212013.pdf p. 21.

Report evaluating the adequacy of the KXL DSEIS Market Analysis 17
refiners’ can be expected to make adjustments in their operations to take
advantage of the increased supply of light crudes on the markets, shutting
down their heavy crude upgrading units would likely be the most inefficient
and expensive option.
The Market Analysis assumes that Canadian tar sands will provide an increasing share of US
heavy crude supply, and perhaps almost completely displace other suppliers by 2035 (pp. 1.4-
20 - 1.4-23), Finally, based on the AEO 2013 forecast, the Market Analysis assumes that US
light crude production from shale/tight oil will result in a bulge over the next few years, but then
plateau and begin to decline after 2020. The Market Analysis (pp. 1.4-20 - 1.4-26) thus makes
the further assumption that US refineries will undertake new reconfiguration projects to shift to
using more heavy tar sands crudes, even if they also undertake smaller projects to facilitate
processing light shale crudes. According to p. 1.4-26:
The difference in long-term growth projections between the light sweet tight oil
versus the WCSB heavy crudes could be expected to impact refiners’ decisions
regarding their investments. Refiners take long-term growth projections of
different types of oils into account when they decide whether to make whatever
improvements are necessary to process one grade of crude versus the other.
The 2013 AEO early release version projects a relatively rapid increase in U.S.
total crude oil production, spurred by shale developments, followed by a peak
and decline, such that by the late 2020’s the outlook is little changed from that in
the 2010 AEO. Thus, this latest EIA projection indicates a relatively short- to
medium-term “bulge” in U.S. crude production followed by a return to a
downward trend. In contrast, projections from CAPP and others of WCSB
production are for a steady, sustained growth over the medium- to long-term, in
large part because the bulk of the growth is projected to come from oil sands
which do not suffer the same decline profiles as do conventional and especially
“tight” crudes.
Since major refinery projects are evaluated based on a presumed 15+/- year life,
this distinction between projected supply growth in the United States (“bulge” of
light crudes) and in Western Canada (steady growth of heavy crudes) may
provide a basis for two types of capital investments: major, long-term expenditure
to process heavy WCSB crude supplies, and smaller “revamp” projects with
shorter payback periods to process light “tight” crude oils.
Refinery configurations and choice of crude slate are complex and highly technical issues. But,
at a minimum, the likely reality is much more nuanced than the Market Analysis findings that the
US refineries that can process heavy crudes will do so, and that the US market for heavy tar
sands crude will continue to grow as refineries reconfigure to process more heavy crude and tar
sands displaces other sources of heavy crudes. As somewhat acknowledged deep within the

Report evaluating the adequacy of the KXL DSEIS Market Analysis 18
Market Analysis, refinery decisions on crude sourcing and configuration are economically driven
and will shift in response to changing market conditions (Appendix C, p. 3):
refiners will shift their crude slate if they determine that they could achieve a
higher profit level by making changes to their crude runs or crude slate, including
making investments to shift to a lighter crude slate. Refiners determine the
optimal crudes to process like any other manufacturing company selecting the
right raw materials to manufacture products. Refining companies (including
refining divisions in large, integrated major oil companies) pay market prices for
the crude oil they run and measure their profitability based on selling their
product into the wholesale spot market with an added margin. They then use that
margin to cover their fixed and variable expenses. Refiners may select a more
expensive crude oil if that crude oil’s yield provides a greater margin than a
cheaper crude.
In fact, the US market for heavy crude and specifically tar sands heavy crude, may be
significantly smaller and less profitable than assumed by the Market Analysis. Competition from
light crudes will impact demand and pricing for heavy crudes. This competition will impact both
operating decisions and capital (investment).
4.4. Operating Decisions to Shift Crude Slate
Decisions to operate cokers and process heavy crudes are economically driven. Cokers are
energy intensive and have sizable operating costs. Cokers will only be operated if heavy crude
prices are substantially below light crude prices; at smaller price differentials, refiners will shift to
lighter crudes. According to CIBC 20127 (p. 104):
There will be significant competition from not only WCS vs. Maya for
access to the PADD 3 market, but also for light oil trying to get access
to higher complexity refineries. A complex refiner will take light oil…if
the price is right.
The Fight For Refinery Access In PADD 3, Lots Of Coking Capacity But
Refiners Have Flexibility: PADD 3 is the largest Coking market in the world with
approximately 3.2 MMBbls/d of heavy oil capacity. With this much installed
capacity, it seems quite a natural fit for lower-quality Canadian crudes such as
WCS or for continued intake of Maya. However, just because PADD 3 is home to
7 Canadian Imperial Bank of Commerce (CIBC). 2012. Too Much of A Good Thing: A Deep Dive Into The North American Energy Renaissance. Institutional Equity Research Industry Update. August 15, 2012; referred to in DSEIS Market Analysis and in this report as CIBC 2012. Website: http://www.scribd.com/doc/109921666/CIBC-NA-Energy-Economy-Too-much-of-a-good-Thing-Full-report. (Accessed April 14, 2013.)
Report evaluating the adequacy of the KXL DSEIS Market Analysis 19
significant coking capacity, doesn’t mean it will all be used. Any refinery that has
coking capacity can take a higher-quality crude oil slate (the opposite clearly
doesn’t hold true though). There are many tradeoffs involved in the equation but
it basically boils down to margin. A high complexity coking refinery may opt to run
at slightly lower rates by taking a higher slate of light oils. The decision will be
governed almost entirely by their margin analysis, which would incorporate the
higher yield typically obtained from a lighter barrel together with factors such as
lower wear and tear on the refinery and fewer catalyst costs, etc. In our
discussions with refiners, we have typically heard that heavier barrels like Maya
could not sustain a differential vs. light barrels of anything beyond US$5-
US$9/Bbl. Indeed this seems to correlate with historical Maya vs. LLS
differentials, which have averaged in the US$10/Bbl range. The overall point from
this discussion is that there will be significant competition from not only WCS vs.
Maya for access to the PADD 3 market, but also for light oil trying to get access
to higher complexity refineries. As discussed previously, this multifaceted
competition shifts the balance of power to the refiners – which they will use to
their advantage (as we have seen already in PADD 2).
The issue of competition between light and heavy crudes and possible idling of cokers has also
been addressed in other recent analysis: 8
As light-heavy spreads compress, the incentives for light-heavy switching
increase – $4-7 levels have been a “floor” level in the past – further pressure
could see idling of cokers and some push-out of medium and heavy crude
imports, weakening Mars/Maya even as LLS falls, to keep the spread from
narrowing too far for extended periods.
In practice, heavy crudes may not be displaced, but they will have to be sufficiently discounted
so that they will not be displaced. Thus, competition from light crudes puts downward pressure
on pricing (and possibly demand) for heavy crudes. And as discussed Section 4.6, competition
between heavy crudes (tar sands vs. waterborne imports) also puts downward pressure on
pricing (and perhaps demand for tar sands crudes). At a low enough price, there is likely to be a
market for tar sands heavy crudes, but this price discounting will make tar sands production and
expansion less profitable. And in turn, this will tend to constrain expansion relative to what is
likely in a higher price scenario. More generally, consideration of these complex dynamics
illustrates that there is more interaction and competition between markets than assumed by the
Market Analysis
8 Citi, Energy 2020: Independence Day, p. 41 Website: https://ir.citi.com/dY2GZTnBVKoXNrT1sVyHcQCSQNAUUsI%2F8pXCARkTtvUOa8zDR2EckBRtxCGyJoDVW58uAgJ35%2BU%3D

Report evaluating the adequacy of the KXL DSEIS Market Analysis 20
These downward pressures on crude pricing can be amplified when product is oversupplied into
a constrained market, giving refiners ability to secure large discounts from the multiple suppliers
competing for a limited market. According to CIBC 2012 (pp. 103-104):
The “Refinery X-Factor” & Balance Of Power: […] quantifying price discounts
is a complex matter. The logic is relatively straight forward when it is simply
transportation and quality related. However, the third component is the most
difficult to define, and that is what we term the “refinery X factor”. What we mean
by this is that when a situation arises in which a product is oversupplied into a
constrained market, the consumer (refineries in this case) have the balance of
power. With hundreds of market participants all fighting for limited refinery
capacity, discounting emerges and it is largely at the hands of the refiner as to
where the magnitude of those discounts.
The Gulf Coast refiners with heavy crude processing listed in Market Analysis Table 1.4-5
include Flint Hills Resource LP. As shown in Table 1.4-5, Flint Hills processed only a small
amount of heavy crude imports during the January-June 2012 period, equivalent to just 4% of
refinery capacity. Meanwhile, other refiners in Table 1.4-5 processed much larger amounts of
heavy crudes. For the other refiners, heavy crude imports averaged about 41% of refinery
capacity. 9 But heavy crude imports were more than half of refinery capacity at some refiners,
notably Houston Refining, Deer Park Refining, ConocoPhillips, and Total.
Various factors will influence refinery decisions on crude slate, but one key factor is coking
capacity. Within the subset of refineries that are equipped with coking capacity, some refineries
have large amounts of coking capacity (relative to overall refinery capacity and throughput), and
thus can process a crude slate weighted towards heavy crudes. Other refineries have smaller
amounts of coking capacity, and thus are limited in the amount of heavy crudes they can
process. Refineries with limited amounts of coking capacity may process some heavy crudes,
as well as a substantial amounts of lighter (light and medium) crudes.
Given the small amount of heavy crude imports at Flint Hills, it might be assumed that this
refiner has only a minimal amount of coking capacity. But in fact, the Flint Hills refinery in
Corpus Christi, Texas has 14,400 bpd of coking capacity, and thus might be able to process
substantially more heavy crudes than the amount indicated in Table 1.4-5.10 Within the
constraints of the DSEIS process, TGG has not been able to fully research this issue, but it
9 As discussed in Note c to Table 1.4-5, the Motiva Port Arthur refinery was offline for most of the January-June 2012 period. Thus, we have excluded it when calculating heavy crude imports as a share of refinery capacity. For all refiners in Table 1.4-5, except for Flint Hills and Motiva, refinery capacity totals 3,916,413 bpd, and heavy crude imports total 1,598,093 bpd. Thus, 10 US EIA Refinery Capacity Report June 2012 With Data as of January 1, 2012, p.20. Cokers process the heavy end of the barrel, the residuum from the refinery distillation processes. In effect, cokers process the heaviest portion of heavy crudes. Thus, for a given amount of coking capacity, a refinery can process a substantially larger amount of heavy crude throughput.
Report evaluating the adequacy of the KXL DSEIS Market Analysis 21
would appear that Flint Hills is choosing to process a lighter crude slate and not fully utilize its
coking capacity. If so, Flint Hills may provide some indication of how some refiners may respond
to the dramatic ongoing shifts in North American crude production. The Flint Hills Corpus Christi
refinery is very proximate to the large and rapidly growing light crude production from the Eagle
Ford shale.
In fact, as discussed in Section 4.5, Flint Hills is also planning to undertake capital investments
to shift crude slate in response to rapidly increasing light crude production.
4.5. Capital Investment to Shift Crude Slate
As discussed in Sections 4.3 and 4.4, the Market Analysis assumes that competition from light
crudes will not substantially impact the markets for heavy tar sands crudes and that refineries
now configured to process heavy crudes (notably on the Texas Gulf Coast) are unlikely to shift
away from heavy crudes to process more light crudes. In particular, the Market Analysis
assumes that refinery capital investments would include major projects to process more heavy
tar sands crudes, as well as more minor revamp projects to process light crudes from shale/tight
oil (p. 1.4-26):
Since major refinery projects are evaluated based on a presumed 15+/- year life,
this distinction between projected supply growth in the United States (“bulge” of
light crudes) and in Western Canada (steady growth of heavy crudes) may
provide a basis for two types of capital investments: major, long-term expenditure
to process heavy WCSB crude supplies, and smaller “revamp” projects with
shorter payback periods to process light “tight” crude oils.
In support of this assessment, the Market Analysis explains why it might not be cost-effective for
refineries now configured to process heavy crudes to undertake modifications to process more
light crudes (Appendix C, p. 3):
A refiner that processes heavy crudes has invested significant amounts of money
to install the equipment necessary to process them. A refiner that has made
these investments has economic incentive to continue to process heavy crudes
and may not be able to process significantly lighter crude slates as profitably. For
example, if a refinery configured to process a heavy slate of crude oil was
constrained to processing only a light crude oil slate, the volume of gasoline and
diesel fuels produced could decrease by 15 to 20 percent. This, in most cases
would be because the refiner’s crude oil distillation process is designed for
crudes with much less light components, such as naphtha, as heavier crudes.
Attempting to process high percentages of light crude oil in these units would
overload the distillation towers with light products and require a reduction in
crude processing. Not only would the refiner usually be paying relatively more for
that light slate of crude oil, it would be producing less gasoline and diesel from it.
Report evaluating the adequacy of the KXL DSEIS Market Analysis 22
This is the primary reason refiners would not typically replace a heavy crude oil
slate with 100 percent light crudes (IHS CERA 2011).
To go back to efficiently process more light crudes more economically, those
refiners would have to make additional expenditures in refinery equipment to
reconfigure the distillation towers to handle the lighter crude, and add capacity to
process the higher naphtha content into finished gasoline. Thus, even if an influx
of light domestic crudes makes them comparatively price advantaged to heavy
crude oils, the size of capital expenditure and downed production time for refiners
may offset potential benefits of trying to process more light crudes (Platts 2012).
TGG agrees that it is relevant to consider the issues described in the above quotation from the
Market Analysis. That said, it is also important to point out that shifting from heavy to light
crudes is a much less complex, expensive, and time consuming process, compared with shifting
than from light to heavy crudes. Reconfiguration projects to shift from light to heavy crudes
typically cost billions and take many years. Modifications to shift from heavy to light crudes
typically cost hundreds of millions and take a few years.
The reconfiguration projects that have been undertaken by some refineries may resulted in
stranded investment. Refineries that have invested in cokers and other capability to process
heavy crudes would typically prefer that these investments be utilized and profitable. But
especially over time, refineries will shift to process lighter crudes if that is more profitable on a
forward-looking basis. Moreover, shifts to process light crudes can also have the advantage of
reducing operating costs; cokers and other refinery units that process heavy crudes are energy-
intensive and have sizable operating costs.
Within the constraints of the DSEIS process, TGG has not been able to fully research this issue,
but it would appear that Flint Hills is choosing to undertake a major investment and
reconfiguration to process a lighter crude slate at its Corpus Christi refinery. 11 As discussed in
Section 4.4, Market Analysis Table 1.4-5 includes Flint Hills in its listing of Gulf Coast Area
refiners processing heavy crudes. Flint Hills is now seeking regulatory approval to undertake a
major upgrading of this refinery to increase the amount of Eagle Ford crude that it can
process:12
Flint Hills Resources, a subsidiary of Koch Industries, has proposed
upgrading its Corpus Christi West Refinery to increase the amount of Eagle
Ford crude it would be able to process. The $250 million dollar project would
11
This refinery is a combination of two connected plants, the West Refinery (230,000 bpd) and the East Refinery (70,000 bpd). The 14,400 bpd coker is part of the West Refinery. 12 Tunstall, Thomas, et al. Economic Impact of the Eagle Ford Shale, University of Texas San Antonio Institute for
Economic Development. March 2013, p. 65 (emphasis added). Website: http://bit.ly/11anGAU. Accessed April 21, 2013.

Report evaluating the adequacy of the KXL DSEIS Market Analysis 23
not necessarily add capacity, but rather enhance current operations to
optimize light sweet input by installing new equipment, modifying current
configurations and upgrading control technology. New processing towers,
heaters, piping, tanks, pumps and valves would be installed in the place
of older equipment built to refine heavy sour imports over the course of
two years pending approval from the Texas Commission for Environmental
Quality and the Environmental Protection Agency. As of October 2012, the
300,000 barrel per day refinery was processing up to 150,000 barrels per day
of Eagle Ford Crude.
The citation above indicates that the new equipment to process lighter crudes will replace older
equipment built to process heavy sour crudes.13
Aside from the issue of whether refiners will shift from heavy to light crudes, there is also the
issue of whether refiners will shift from light to heavy crudes. As discussed in Section 4.3, the
Market Analysis assumes that North American refineries will undertake new reconfiguration
projects, to add coking capacity and shift crude slate from light to heavy. But as noted above,
reconfiguration projects to shift from light to heavy crudes typically cost billions and take many
years. Refiners will only undertake these projects if they expect them to provide an adequate
return over an extended period.14
In contrast to short-term operating decisions, long-term investment decisions to add cokers are
dependent upon long-term expectations regarding crude pricing and supply. Specifically,
reconfiguration projects to shift from light to heavy crudes are evaluated based on expectations
regarding future price differentials between light and heavy crudes.
A few years ago, it appeared likely that future light crude supply would be limited and expensive,
and that tar sands expansion would be the only major source of growth in North American crude
production. In this context, many US refiners undertook reconfiguration projects to shift from
light to heavy crudes and specifically to enable processing of heavy tar sands crudes.
Crude markets have shifted dramatically over the last few years and these shifts are continuing
and possibly accelerating. In particular, the growth in North American light crude production has
been very large and rapid. Moreover, this growth has routinely exceeded expectations, such
that both output and forecasts/expectation of output are rising very quickly. In this context, North
13 Extensive information regarding the Flint Hills Corpus Christi West Refinery and the project to utilize more Eagle
Ford crude is provide on the Project Eagle Ford website http://www.fhrcorpuschristi.com/, including: Permit application to TCEQ (Texas Commission on Environmental Quality) http://www.fhrcorpuschristi.com/upload/FHRProjEagleFordAmendment%20ApplicationRecdbyTCEQDraft.pdf and Permit application to US EPA
http://www.fhrcorpuschristi.com/upload/FHRProjEagleFordWestGreenhouseGasApplicationDraft.pdf which in turn includes refinery PFD (Process Flow Diagram), Process Description, and Emissions Data. 14 As noted in the Market Analysis (p. 1.4-26), “major refinery projects are evaluated based on a presumed 15+/- year life”.

Report evaluating the adequacy of the KXL DSEIS Market Analysis 24
American refineries are unlikely to undertake new reconfiguration projects (to shift crude slate
from light to heavy), especially until and unless the boom in North American light crude
production levels out and possibly reverses.15 As noted in the Market Analysis (Appendix C, p.
4, emphasis added):
Valero has elected to cancel a major project at its Texas City refinery to construct
a coker [footnote 3 in original omitted] (referred to in the 2011 Final EIS market
analysis). Valero commented that due to the increased supply of domestic
light crude oil and delivery uncertainty of heavy crude oil supplies from the
WCSB (because of potential ongoing constraints on additional pipeline
capacity, particularly uncertainty about the proposed Project), light/heavy
crude price differentials would narrow and would make additional new
investments to process heavy crude uneconomic (Reuters 2012).
Based on the AEO 2013 forecast, the Market Analysis assumes that US light crude
production from shale/tight oil will result in a bulge over the next few years, but then
plateau and begin to decline after 2020. If that scenario actually occurs, it is possible that
North American refiners might then begin to consider new reconfiguration projects to
shift from light to heavy crudes. Many factors will influence future refinery decisions,
including tar sands development and logistics to transport tar sands crudes. As
commented by Valero in its recent decision to cancel a major coker project, ongoing
constraints on additional pipeline capacity will likely play a role in determining whether
refineries undertake reconfiguration that would expand markets for heavy tar sands
crudes.
4.6. Refinery Ownership by Non-Canadian Heavy Crude Producers
Some Gulf Coast heavy crude refineries are less likely to process tar sands crudes because
these refineries have ownership by non-Canadian heavy crude producers. The Gulf Coast
refineries with heavy crude processing listed in Market Analysis Table 1.4-5 include Citgo Lake
Charles and Corpus Christi (Venezuela PDVSA), Deer Park (Mexico PEMEX), and Motiva Port
Arthur (Saudi Aramco). As noted elsewhere in the Market Analysis (Appendix C, p. 5, but not in
relation to Table 1.4-5):
Since Motiva is a joint venture between Shell and Saudi Aramco, there may be
some equity obligations that may limit the option or the volume of WCSB crude
oil that could be processed.
15 Some reconfiguration projects are now underway (notably as at BP Whiting) to enable processing more heavy tar sands crudes) and will be completed and ramped up to full production over the next few years.

Report evaluating the adequacy of the KXL DSEIS Market Analysis 25
These foreign government-owned heavy crude producers bought equity shares in US refineries,
and often invested large amounts to install cokers and expand the refineries, in order to assure
a market for their own heavy crude production. 16 As noted elsewhere in the Market Analysis
(Appendix C, p. 3, but not in relation to Table 1.4-5):
PADD 3 has a particularly high heavy crude oil processing capacity in part
because of the proximity of large supplies of heavy crude oil in Mexico and
Venezuela. In addition, Mexico and Venezuela, through their state-controlled oil
companies, supported expansion of the heavy oil refining capacity through
several joint-venture investments in Gulf Coast refineries to create a more
profitable market for their heavy crude oil resources.
As a result of this ownership by non-Canadian state-controlled heavy crude producers, these
refineries are less likely to shift to processing tar sands crudes.
Moreover, crude pricing for these refineries is to some extent a matter of internal accounting,
rather than market pricing. These refineries are selling products into high priced domestic and
export markets, so their main rationale may be to process heavy crudes into products, rather
than maximize revenues from selling the crudes themselves. Thus in practice, these foreign
heavy crude producers may price their crudes to assure they are processed at these refineries.
If tar sands crudes are cheaper and might otherwise displace these other heavy crudes from
their market at these refineries, the heavy crude producers that own equity shares in these
refineries can simply drop their crude pricing.17 And such a strategy can still be profitable for the
crude producers, since it will increase the refinery margins and the crude producers share of the
profits from refining.
4.7. Conclusions
Section 4 evaluates the DSEIS analysis in a rapidly shifting context. TGG compares the DSEIS
analysis with information from a number of sources and determines that the DSEIS analysis is
not properly reflective of emerging market conditions. As part of our analysis in this Section,
TGG examined (i) US crude production; (ii) competition between different crudes; (iii) capital
16 http://www.nytimes.com/2013/04/05/business/texas-refinery-is-saudi-foothold-in-us-market.html?pagewanted=2&_r=0&pagewanted=all; http://www.beg.utexas.edu/energyecon/new-era/case_studies/Deer_Park_Refinery.pdf; Verleger, Philip. The Tar Sands Road to China (discussed in KXL FEIS Appendix V DOE Response to Verleger Report), pp. 10-12; Verleger, Philip. Keystone as Trojan Horse, pp. 19, 21-22. http://www.pkverlegerllc.com/assets/documents/Keystone_as_Trojan_Horse1.pdf 17 http://www.rbnenergy.com/sailing-stormy-waters-canadian-heavy-crude-after-the-pipelines; Verleger, Philip. The Tar Sands Road to China (discussed in KXL FEIS Appendix V), pp. 10-14; Verleger, Philip. Keystone as Trojan Horse, pp. 8, 19-22
http://www.pkverlegerllc.com/assets/documents/Keystone_as_Trojan_Horse1.pdf.

Report evaluating the adequacy of the KXL DSEIS Market Analysis 26
investment and operating decisions that shift the crude slate; and (iv) foreign refinery ownership
issues affecting Canadian tar sands. In light of this crude markets analysis, TGG concludes that
emerging and dynamic conditions in the crude markets may become increasingly challenging
for tar sands producers. Under challenging economic conditions, it is even more essential for tar
sands producers to have access to high volume, low cost logistics. Therefore the approval of
KXL will have a significant impact as an enabler of less profitable marginal tar sands projects
that could not be constructed without access to low cost logistics.

Report evaluating the adequacy of the KXL DSEIS Market Analysis 27
5. Availability and Cost of Crude Oil Transportation
5.1. Introduction
The Market Analysis asserts that crude oil transportation will be readily available and cost-
effective, such that tar sands production can profitably access markets, even without the
proposed Project, or any new pipelines. According to p. 1.4.1 (emphasis added):
[T]he midstream industry is showing it is capable of developing alternative
capacity to move Western Canadian Sedimentary Basin (WCSB) (and
Bakken and Midcontinent) crudes to markets in the event the proposed
Project is not built. Specifically, it is moving to develop alternative pipeline
capacity that would support Western Canadian, Bakken, and Midcontinent crude
oil movements to the Gulf Coast and is increasingly using rail to transport large
volumes of crude oil to East, West, and Gulf Coast markets as a viable
alternative to pipelines. […] Rail and supporting non-pipeline modes should
be capable, as was projected in 2011, of providing the capacity needed to
transport all incremental Western Canadian and Bakken crude oil
production to markets if there were no additional pipeline projects
approved.
Approval or denial of any one crude oil transport project, including the proposed
Project, remains unlikely to significantly impact the rate of extraction in the oil
sands, or the continued demand for heavy crude oil at refineries in the U.S.
Limitations on pipeline transport would force more crude oil to be
transported via other modes of transportation, such as rail, which would
probably (but not certainly) be more expensive. Longer term limitations also
depend upon whether pipeline projects that are located exclusively in Canada
proceed (such as the proposed Northern Gateway, the Trans Mountain
expansion, and the TransCanada proposal to ship crude oil east to Ontario on a
converted natural gas pipeline).
Assumptions regarding availability and cost of crude oil transportation are of central importance
for the Market Analysis. As previously summarized in Section 3, the Market Analysis is
premised upon following assumptions regarding availability and cost of crude oil transportation:
Assumes that pipeline projects other than KXL are likely to be completed and will facilitate
transport of tar sands crudes (especially if those other projects repurpose existing
infrastructure and right-of-ways, and/or has less complex permitting (e.g., are solely within
the US or Canada and thus do not require a US Presidential Permit)).

Report evaluating the adequacy of the KXL DSEIS Market Analysis 28
To the extent that KXL and other pipelines are not completed to transport growing tar sands
production to profitable markets, assumes that other logistics (notably rail) can be put in
place and used to move tar sands crudes to markets.
Specifically assumes that other logistics (notably rail) can be implemented at sufficient scale
and speed to transport all incremental tar sands production to markets, even absent any
additions of new pipeline capacity.
Based on the above, assumes that pipeline and other transport/takeaway capacity will not
be a significant constraint on tar sands production and growth.
Section 5 critiques these assumptions in the Market Analysis that drive the erroneous
assumption that pipeline and other transport/takeaway capacity will not be a significant
constraint on tar sands. In this Section, TGG conducts a review of the serious impediments to
both pipeline expansion and crude by rail. Section 5.2 evaluates the Market Analysis regarding
increases in pipeline capacity other than the proposed Project. Section 5.3 evaluates increases
in rail capacity. In particular, Section 5.3 undertakes a detailed review of the DSEIS assumption
that crude by rail can be implemented at a sufficient scale and speed to transport all incremental
tar sands production to markets, even absent new pipeline capacity. Section 5.3 demonstrates
the deep flaws in this key DSEIS assumption. Section 5.4 concludes that crude by rail is not well
matched for the transport of tar sands crude in terms of both cost effectiveness and risk factors.
5.2. Increases in Pipeline Capacity
5.2.1. Introduction
KXL is not unique in terms of encountering major opposition, delays, and uncertainty of
completion. Similar difficulties are also being encountered by other major pipeline projects that
would transport tar sands production. Pipeline projects to transport crude west through British
Columbia (Northern Gateway and Trans Mountain Expansion) are now seen as unlikely to be
completed. A smaller project to reverse and expand an existing crude pipeline east from Ontario
(Enbridge Line 9, and possibly the Portland-Montreal Pipeline) is likewise the subject of
significant public concern and opposition. Another major project to transport crude east across
Canada (TransCanada Energy East) is still in early stages of development, but will also
encounter intense opposition if it moves forward.

Report evaluating the adequacy of the KXL DSEIS Market Analysis 29
5.2.2. Pipelines to the West: Northern Gateway and Trans Mountain
Expansion
The Market Analysis has acknowledged the controversial nature of pipeline projects in British
Columbia (BC) and the significant public opposition and uncertainty associated with each of
them:18
There are several pipelines proposed for transporting WCSB crude oil to the Pacific,
including Trans Mountain to Vancouver and Northern Gateway and Northern Leg to
Kitimat. These pipelines have been controversial and are encountering significant
opposition. It is uncertain whether such projects ultimately will be approved. (p. 2.2-19)
[…]
Enbridge is proposing to construct the Northern Gateway pipeline, which would transport
up to 525,000 bpd of crude oil 1,177 km from Bruderheim, Alberta, to the Port of Kitimat,
British Columbia. The port would be improved with two dedicated ship berths and 14
storage tanks for crude oil and condensate. Enbridge intends for the pipeline to be
operational around 2017. A regulatory application was submitted in 2010, which is
undergoing an independent review process led by the Canadian National Energy Board
and the Canadian Environmental Assessment Agency. The pipeline would traverse First
Nation traditional lands and important salmon habitat. The project has been controversial
and has encountered opposition from some First Nation bands and other organizations.
Opposition to the project remains strong as evidenced by media reports of the January
2013 public hearings in Vancouver on the permit application. It remains uncertain at this
time if the project would receive permits and be constructed, and therefore the option of
moving additional crude to Kitimat was eliminated from detailed analysis. (p. 2.2-27)
Enbridge’s Northern Gateway Pipeline and Kinder Morgan’s Trans Mountain Expansion would
greatly increase tanker traffic on the BC coast, and are unlikely to be approved. Since 2011,
Northern Gateway has been the object of intense and ongoing public opposition on the part of
large First Nations and environmental coalitions, as well as thousands of diverse intervenors
from a broad cross-section of BC society, who have participated (and dramatically slowed
down) a Canadian federal hearing process to evaluate the project. If this project is cancelled,
opposition will shift its focus to the other proposed pipeline in BC, Kinder Morgan’s Trans
Mountain expansion.
As noted in CIBC 2012 (p. 8), the major BC pipeline projects (Northern Gateway and Trans
Mountain Expansion) are unlikely to proceed:
There are currently ~2.9 MMBbls/d of longhaul pipeline proposals on the table (out of
Western Canada). That sounds like a lot until one considers that two of the largest (the
18 DSEIS, pp. 1.4-26 -1.4-28; 1.4-64; 2.2-19, 2.2-27.

Report evaluating the adequacy of the KXL DSEIS Market Analysis 30
proposed 525,000 Bbls/d Gateway and 450,000 Bbls/d TMX expansion through B.C.)
face ever-increasing political risk and we assign no better than 50/50 odds that these
pipes are built before the end of the decade.
Dr. Jaccard agrees that the BC pipeline projects are unlikely to proceed and explains in detail
why they have a low probability of completion: 19
Both of these would involve a dramatic increase in oil tanker traffic on the BC
coast, in the latter case through the port of Vancouver.
The Northern Gateway pipeline proposal is opposed by aboriginal bands along
its route and on the coast, and their land rights in BC have a strong standing in
the courts (most have not signed treaties that extinguished their land claims).
Just as important, BC will have a provincial election in May. The main political
opposition has a significant lead in opinion polls (almost 20 points for the past
several months) and has promised to do everything it can to stop Northern
Gateway should it be elected, and should the project be approved by the
Canadian federal government. As a new government, it could launch its own
environmental assessment, and afterwards impose stringent conditions that
would effectively render the project infeasible.
The Trans Mountain pipeline expansion proposal is opposed by key municipal
governments in the Vancouver metropolitan region, including the city of
Vancouver. These municipal political leaders reflect the strong concerns of a
significant percentage of their voters about the risks of pipeline ruptures and oil
tanker accidents. Since governments at the provincial and federal level are
dependent on voter support in the region, political enthusiasm for the project is
unlikely. Again, aboriginal bands along the route and on the coast oppose the
project and vow to fight it in the courts. Thus far, most opposition to bitumen
transport through BC has focused on the Northern Gateway. If the project is
cancelled, this opposition would shift its focus to the Trans Mountain expansion
proposal.
Industry analysts have noted that these pipelines through BC have less than a
50% chance of being built. If they and Keystone are not built, industry watchers
agree that oil sands output will be reduced from what it otherwise would have
been.
19
http://docs.house.gov/meetings/IF/IF03/20130410/100616/HHRG-113-IF03-Wstate-JaccardM-20130410.pdf pp. 2-3. Dr. Jaccard is (among other things) an energy and environmental expert based in Vancouver, as well as former head of the British Columbia Utilities Commission. Thus, he has substantial experience and expertise regarding energy development in BC, and specifically whether projects are subject to intense opposition, and thus have a low probability of being completed.

Report evaluating the adequacy of the KXL DSEIS Market Analysis 31
Pipeline opponents in North America are a broad, diverse and dynamic transnational social
movement, made up not only of environmental groups, but of a broad cross-section of civil
society including indigenous groups, labor, students, citizens, scientists, artists, land-owners,
and communities and regions directly affected by the pipelines,. Pipeline opposition is dynamic
and can quickly shift from project to project (e.g., as Dr. Jaccard points out, if approval for
Northern Gateway is denied, activists will turn their attention to Trans Mountain). Pipeline
activists can also shift their opposition to pipeline alternatives such as crude by rail, as will be
discussed in Section 5.3.
5.2.3. Pipelines to the East: Line 9 and Energy East
Enbridge Line 9 and TransCanada Energy East are major pipeline projects that involve
repurposing of existing infrastructure to enable transport of tar sands (and other) crudes
eastward into Ontario and Quebec; the Market Analysis claims that development of these
projects supports the view that pipeline capacity will be added to enable transport of tar sands
(and other) crudes:
Enbridge has an array of projects under the heading “Eastern Access” to
increase capacity to take WCSB, and also potentially Bakken, crudes to
refineries in eastern PADD 2 but primarily in Sarnia, Ontario, and potentially
Quebec and Montreal. In association with these projects, which include the re-
reversal of Line 9 so it again runs east from Sarnia to Montreal, is the possible
reversal of the Portland, Maine, to Montreal pipeline to also run east.
[…]
The Final EIS and EnSys 2011 had noted that projects for interstate petroleum
pipelines that do not cross an international border face less regulatory review,
especially when they entail modifications to existing lines or rights of way, which
was one of the reasons a complete No Expansion shut-in of new capacity was
considered unlikely. The development of these projects supports that
assessment, and supports the view that, in general, absent larger regulatory
changes one can expect infrastructure developments to follow market patterns of
supply and demand, which EnSys had described as “business as usual”. These
firm projects add up to a major and on-going re-working of the U.S./Canadian
crude oil pipeline logistics system as the industry adapts to changing market
conditions precipitated by the growth in WCSB and Bakken and Midcontinent
production. In addition, other possible projects are constantly being considered.
The following are two important current examples that have been discussed as
possibilities (no action has been taken on either):

Report evaluating the adequacy of the KXL DSEIS Market Analysis 32
A possible TransCanada project to convert one or more existing natural gas
pipelines that run from Alberta to Ontario and on to Quebec to crude oil service.
Potential capacity has been reported as up to 600,000 bpd with capability to
carry both light and heavy/oil sands WCSB streams.
In fact, in addition to pipeline controversy in Western Canada, public opposition (among
environmental and First Nations groups, as well as landowners and citizens) is growing in
Ontario and Quebec around the Line 9 and Energy East projects.
Enbridge has now applied to the National Energy Board (NEB) for approval to reverse and
expand Line 9 capacity, to transport 300,000 bpd of heavy and lighter crudes eastward to
Montreal.20 Line 9 extends through the largest metropolitan areas in Canada (Toronto and
Montreal), and is highly proximate to both human activity and water.
TransCanada’s Energy East Project would transport crude (notably from tar sands production)
to refineries and marine loading terminals in Quebec and New Brunswick (Saint John); this 2700
mile project would repurpose a portion of TransCanada’s gas Mainline, with new pipe
constructed in Alberta, Saskatchewan, Eastern Ontario, Québec and New Brunswick to link up
with the pipe converted from gas service.21 Energy East is still in early stages of development,
with an open season now under way.22 Capacity could be between 500,000 and 850,000 bpd,
depending upon commercial interest. It is uncertain what the finalized design will be for this
project, whether it will move forward and how fast.
As noted by both CIBC 2012 and Dr. Jaccard, respectively, in the following citations, Energy
East will also be the subject of intense opposition, especially in Quebec.
The proposed TransCanada Mainline conversion (estimated ~600,000 Bbls/d) is
compelling but very early stage and could also provoke some political backlash in
Quebec. 23
TransCanada is exploring the option of transforming its west-to-east mainline from
natural gas to bitumen. This proposal would require the conversion of a half century old
natural gas pipeline right-of-way to move oil sands bitumen – a plan that will generate
more public scrutiny following the rupture of the repurposed Pegasus pipeline in
Arkansas. Moreover, TransCanada’s plan would require the construction of a pipeline
along new right-of-ways through Quebec and New Brunswick. This would not equate to
all of the oil sands development that would have been enabled by Keystone XL and
either of the BC pipelines, and it would again trigger a reaction as provincial
governments along the way were presented with public concerns similar to those in BC.
20
http://www.neb.gc.ca/clf-nsi/rthnb/pplctnsbfrthnb/nbrdgln9brvrsl/nbrdgln9brvrsl-eng.html http://www.enbridge.com/ECRAI/Line9BReversalProject.aspx 21 http://transcanada.com/6246.html 22 http://transcanada.com/6286.html 23 CIBC 2012, p. 8.

Report evaluating the adequacy of the KXL DSEIS Market Analysis 33
It must be remembered that opinion polls show that at least 40% of Canadians oppose
oil sands expansion. Opposition toward oil sands infrastructure in Quebec, where new
pipeline right of ways and construction would be required, is particularly strong.24
Particularly in Quebec, activists are already mobilizing against the Line 9 and Energy East
projects. Quebec has a long history of strong citizen activism and a vibrant protest culture, as
evidenced by widespread student protests and strikes of 2012. In particular, Quebec has a high
level of concern (and resistance) regarding fossil fuel development, as evidenced by major
citizen opposition to shale gas in Quebec, which led to a recent province-wide ban on hydraulic
fracturing (fracking). Indeed, the theme of this year’s Earth Day March in Montreal (on April 21,
2013) is to oppose the arrival of tar sands crude in Quebec via the Line 9 and Energy East
pipeline projects.25
5.3. Increases in Rail Capacity
5.3.1. Introduction
The Market Analysis asserts that rail can be implemented at sufficient scale and speed to
transport all incremental tar sands production to markets, even absent any additions of new
pipeline capacity (p. 1.4.1):
Rail and supporting non-pipeline modes should be capable, as was projected in
2011, of providing the capacity needed to transport all incremental Western
Canadian and Bakken crude oil production to markets if there were no additional
pipeline projects approved.
The Market Analysis claims that activities are presently underway to enable large-scale
utilization of rail to move tar sands crudes, and there has already been a sharp increase in
transport of crude oil (p. 1-4-33):
Increases in Rail Capacity
While no new pipeline capacity has been added since 2011 across the Canada-
United States border or to the Canadian West Coast, the development of rail as a
viable, large-scale transport option for crude oil does potentially add significant
transport capacity along these and other routes. [footnote 28 in original omitted]
As noted in the Final EIS, the linear infrastructure (railroad tracks) necessary to
transport crude oil in large volumes out of the WCSB is already in place. To
24 http://docs.house.gov/meetings/IF/IF03/20130410/100616/HHRG-113-IF03-Wstate-JaccardM-20130410.pdf pp. 3-4. 25 http://marchepourlaterre.org (French website).

Report evaluating the adequacy of the KXL DSEIS Market Analysis 34
utilize rail at large scale, producers and/or shippers would need to build
loading and unloading facilities and add tank car capacity. Both of those
activities are presently underway, and there already has been a sharp
increase in rail transport of crude oil. The developments to date, as well as
a review of industry information, indicate that, especially as long as
pipeline capacity is constrained, significant quantities of crude oil will be
transported by rail, including out of the WCSB. (emphasis added)
Meanwhile, a much more tentative assessment of tar sands crude by rail has been provided by
the Alberta ERCB (Energy Resources Conservation Board, the provincial energy regulatory
agency for tar sands and other energy resources). As part of its annual energy outlook, ERCB
found that:26
Rail shipments still represent a small portion of total volumes of crude bitumen
moved. Currently rail is being used to service projects with limited pipeline
capacity or to export volumes to areas not serviced by pipeline. This may change
in the future. Rail transportation is being promoted as an economic alternative to
pipelining oil and provides an option for producers to send oil to markets other
than Cushing, where oversupply is occurring.
[…]
In the short term, it is anticipated that rail will serve as a complementary niche
used by industry, depending on economic factors unique to each producer and
refiner. Rail could allow producers to bypass short-term pipeline bottlenecks to
take advantage of higher prices in PADD areas with refineries capable of
handling heavier crudes.
Longer term, however, growth in shipments of bitumen by rail will depend on
several factors, such as the availability and supply of diluent, the prices offered
by other commodity producers already using rail, and the development of crude
oil handling facilities to fill cars with bitumen.
The ERCB assessment is broadly consistent with the research that TGG was able to conduct
within the constraints of the DSEIS process. To date, there has been only limited
implementation of crude by rail in Western Canada. And much of that implementation is of
limited (if any) relevance for demonstrating that crude by rail is a realistic alternative to the
proposed Project (and other major pipelines).
26 ERCB ST98-2012: Alberta’s Energy Reserves 2011 and Supply/Demand Outlook 2012–2021 Energy Resources Conservation Board. June 2012, p. 3-37. Website: http://www.ercb.ca/sts/ST98/ST98-2012.pdf

Report evaluating the adequacy of the KXL DSEIS Market Analysis 35
The DSEIS Market Analysis of crude by rail is flawed and potentially misleading. And these
flaws are not merely of academic concern, but instead feed into other aspects of the DSEIS that
are also flawed and do not provide sound basis for analysis and decision-making.
5.3.2. Critique of Market Analysis Figure 1.4.6-5
Based on apparently very limited and flawed information and analysis, the DSEIS estimates that
there are 15+ unit train loading facilities in the WCSB (p. 1.4-42, emphasis added):
Figure 1.4.6-427 [sic] shows the estimated unit train loading, off-loading, and
transloading facilities throughout North America for crude oil and their estimated
capacities in 2013 and 2016. […] There is less publicly available information
about the facilities in the WCSB, including about their capacities.
[…] The number of facilities and capacities listed in the figure are primarily
for facilities reported to be capable of handling unit trains. [,,,] Section 1.8 of
Appendix C, Market Analysis Supplemental Information, provides additional
information related to these facilities and their estimated capacities and start-up
dates.
Figure 1.4.6-5 specifies 2013 capacity of 240,000 bpd for 15+ Canadian loading facilities, but
the DSEIS provides no basis for this capacity estimate. The DSEIS (quoted above) refers to
Section 1.8 of Appendix C as providing additional information. However, there is no Section 1.8
in Appendix C.28 Section 7 of Appendix C does provide information on crude by rail facilities in
the US and Canada. For Canada (Table 14), 14 loading facilities are identified by location, but
no information is shown for capacity and in-service date, and thus no basis is provided for the
capacity estimate in Figure 1.4.6-5 for Canadian loading facilities.
The information provided in the DSEIS is not sufficiently specific to facilitate meaningful review
in regard to Canadian train loading facilities.29 Operator/owner is specified for only 10 of the 14
facilities listed in Appendix C, Table 14; 4 of the facilities are identified only by location. 30 The
27 The reference here is actually to Figure 1.4.6-5 (which provides data for estimated capacities in 2013 (and 2016 for US facilities), not to Figure 1.4.6-4 (which provides data for 2010). 28 In Appendix C (p. 1), Section 1.0 is immediately followed by Section 2.0. 29
Source listed for Figure 1.4.6-5 is “Hart 2012; company and media reports.” Source listed for Appendix C, Table 14 is “Hart 2012a; Hart 2012b; company and media reports.” Hart 2012/2012a and 2012b are proprietary studies that are not publicly available; these were requested from Department of State, but they have not been provided (as of the time when this report was prepared). Source listed as “Company and media reports” is not sufficiently specific to facilitate meaningful review of the DSEIS Market Analysis in regard to Canadian train loading facilities, especially given that the DSEIS does not even specify ownership information for some of these facilities (see footnote 30). 30 4 Saskatchewan facilities are identified only by location: Dollard, Lloydminster, Esevan, and Bromhead. Meanwhile, there seems to have been some double counting. Table 14 includes “Torq Transloading, Tribune, SK” as a separate facility. Bromhead and Tribune are adjacent, and the Torq Transloading facility is in Bromhead. Torq (footnote continued on next page)

Report evaluating the adequacy of the KXL DSEIS Market Analysis 36
DSEIS (quoted above) states that Figure 1.4.6-531 shows information for capacities in both 2013
and 2016. But for Canadian facilities, estimated capacities are shown only for 2013. 32 Based on
the independent review that TGG has been able to undertake within the constraints of the
DSEIS process, publicly available information largely refutes, rather than confirms, the
information in Figure 1.4.6-5 regarding Canadian facilities.
As a simple consistency check, it is useful to consider the average capacity of train loading
facilities. According to Figure 1.4.6-5, there are 15+ Canadian Loading Facilities, with a 2013
capacity of 240,000 bpd, indicating that these facilities have an average capacity of less than
16,000 bpd.33 Meanwhile, also according to Figure 1.4.6-5, there are 15 US Bakken Loading
Facilities, with a 2013 capacity of 1,215,00 bpd, indicating that these facilities have an average
capacity of 81,000 bpd; average capacity could increase to almost 100,000 bpd as these
facilities continue to expand.34 Put simply, the US Bakken has many large facilities for loading
unit trains, but Canada does not. None of the Canadian loading facilities identified in the Market
Analysis (Figure 1.4.6-5 and Appendix C, Table 14) are now unit train capable.
In fact, the loading facilities now available in Western Canada are smaller scale manifest train
loading facilities, mostly proximate to non-tar sands production in Saskatchewan and adjacent
areas of Alberta.35
(footnote continued from previous page) Torq Transloading. 2012. Resource and Contract Requirements Necessary to Make Rail a Fully Integrated Part of Crude Takeaway Infrastructure. Presentation at the Crude Oil Markets, Rail & Pipeline Takeaway Summit. Calgary, AB. October 24 & 25, 2012, Adobe p. 5. 31 See footnote 27. 32 For US facilities, Figure 1.4.6-5 shows estimated capacities for both 2013 and 2016. The inadequacy of the DSEIS information and analysis in regard to Canadian crude by rail facilities is underlined by the contrast with the DSEIS in regard to US facilities. For each US facility (Appendix C, Tables 6-13), owner, location, estimated capacity and in-service date are specified, with estimated capacity then totaled for each type of facility, providing a reviewable basis for the summary data reported in Figure 1.4.6-5 for both 2013 and 2016. 33 Figure 1.4.6-5 reports there are 15+ Canadian facilities. Based on the low end of this range (15 facilities), average size is 16,000 bpd (= total capacity / number of facilities). Based on a higher number of facilities, average size would be less than 16,000 bpd. 34 Figure 1.4.6-5 indicates that capacity for the 15 Bakken Loading Facilities capacity could grow to 1,4865,000 in 2016, indicating an average capacity of almost 100,000 bpd. According to Appendix C, Table 7, 225,000 of this additional capacity is estimated to be added in 2014. 35 http://www.rbnenergy.com/crude-loves-rocknrail-bitumen-by-rail-part-2 http://www.rbnenergy.com/crude-loves-rock-n-rail-plethora-in-the-williston-basin These sources indicate that some development of unit train loading facilities may now be starting in the WCSB, but that is in Saskatchewan for light Bakken crude. For each loading facility, these above two sources specify type: transload (manifest train) or unit train. According to the second source, the Crescent Point loading facility in Stoughton, Saskatchewan has a capacity of 8.000 bpd. This facility, which came on-line in February 2012 to serve Bakken production, has now been expanded to 45,000 bpd, with actual throughput continuing to ramp up. Crescent Point Energy. Press Release: Crescent Point Energy Corp. Announces Year-End 2012 Results. March 14, 2013, Adobe pp. 2-4, 8 Website: http://crescentpointenergy.mwnewsroom.com/Files/c9/c9780fae-3b92-44a0-977b-6f4c79061fb0.pdf. (footnote continued on next page)

Report evaluating the adequacy of the KXL DSEIS Market Analysis 37
5.3.3. Critique of Market Analysis Table 1.4-9
Together with dramatically overstating the extent of unit train facilities (Figure 1.4.6-5), the
Market Analysis dramatically overstates the extent of crude by rail activity by tar sands
producers. The Market Analysis claims that there are 8 tar sands producers currently shipping
or planning to ship heavy crude in 2013:
at least eight publically reported WCSB producers are currently shipping or have
announced shipping heavy crude by rail in 2013 (Table 1.4-9).36
As noted in Section 1.4 there are at least 8 oil sands producers that are
currently transporting WCSB heavy crude by rail and have publically announced
plans to transport increasing amounts of it by rail in 2013 (see Table 1.4-9). This
indicates that shippers should have a choice in the form they ship crude oil and
that they are already making plans to utilize the rail option at scale. 37
As explained in more detail below, Table 1.4-9 does not actually present information for 8 tar
sands producers that are currently transporting WCSB heavy crude. Crescent Point Energy, the
largest single shipper identified in Table 1.4-9 (accounting for roughly one-third of the total
volume in the table) is not a tar sands producer and it is not transporting heavy crude by rail.
Crescent Point Energy produces lighter non-tar sands crudes (mainly in Saskatchewan from
tight oil in the Canadian Bakken and Shaunovon), and its crude by rail relates solely to these
lighter non-tar sands crudes. 38 Cenovus is a tar sands producer, but its crude by rail relates
solely to lighter non-tar sands crude production. Baytex and Devon are also tar sands
producers, but their crude by rail relates (in part) to other heavy non-tar sands crude production.
Suncor is a tar sands producer, but its crude by rail relates (in whole or part) to supplying its
Montreal refinery with lighter crudes (perhaps including non-tar sands production, as well as
Suncor tar sands SCO).
Given the incomplete and potentially misleading data presented in Table 1.4-9, it is impossible
to determine how much of the crude by rail is actually relating to tar sands heavy crudes, but it
appears to be quite small overall. To date, transport of tar sands heavy crudes via rail has
involved low volume operations, with niche players focusing on niche markets (small producers
supplying specialized markets). This is the reality, and it is consistent with the assessment
presented by ERCB.39
(footnote continued from previous page) Accessed April 18, 2013. 36 DSEIS, p. 1.4-43, emphasis added. 37
DSEIS, p. 2.2-8, emphasis added. 38 Incidental to its non-tar sands light crude production in Saskatchewan and Alberta, Crescent Point Energy produces a minor amount of heavy crude, about 1% of total crude output. 2012 Annual Information Form, p. 34. http://www.crescentpointenergy.com/files/10941.CPG-2012-AIF.pdf 39 See footnote 26.

Report evaluating the adequacy of the KXL DSEIS Market Analysis 38
Table 1.4-9 includes data for the entire WCSB (Western Canadian Sedimentary Basin) and is
thus much broader than just the Alberta tar sands in terms of geography, crude production,
crude types, and other factors affecting the economics and potential for crude by rail. Put
simply, the information in Table 1.4-9 is of quite limited value, and possibly misleading, in regard
to assessing the potential for crude by rail to be a viable alternative to the proposed Project
(KXL). Put simply, the actual crude by rail activity now underway in Western Canada bears little
resemblance to the large-scale transport of heavy crude by rail presented in the Market Analysis
as an alternative to the proposed Project.
In order to evaluate this important issue, TGG undertook a detailed analysis of Table 1.4-9. The
results of this analysis are presented below, organized by crude producer.
5.3.3.1. Crescent Point
In Table 1.4-9, the largest single shipper identified is Crescent Point, accounting for roughly
one-third of the total volume identified for all shippers in Table 1.4-9. Crescent Point is not a tar
sands producer. Crescent Point has growing light (non-tar sands) crude production mainly in
Saskatchewan (notably tight oil in the Canadian Bakken and Shaunovon). Crescent Point crude
by rail relates solely to these lighter non-tar sands crudes and mostly to the Canadian Bakken.40
The crude by rail in Table 1.4-9 for Crescent Point is similar to that in the adjacent US Bakken,
as opposed to the large scale tar sands heavy crude by rail that the DSEIS assumes to be a
viable alternative to the proposed Project.
5.3.3.2. Cenovous
While Cenovous is best known as a major tar sands producer and refiner, it also has growing
light (non-tar sands) crude production in Saskatchewan and Alberta (notably tight oil in the
Canadian Bakken). Cenovous crude by rail relates solely to these lighter non-tar sands crudes,
and (in part) is being used to access markets, which are not now served by the crude pipeline
network, notably to the East Coast. 41 The crude by rail in Table 1.4-9 for Cenovous is more
similar to that in the adjacent US Bakken, than to the large scale tar sands heavy crude by rail
that the DSEIS assumes to be a viable alternative to the proposed Project.
40
Crescent Point has 3 rail loading facilities: 45,000 bpd at Stoughton (eastern Saskatchewan), 5,000 bpd at Dollard (western Saskatchewan), and 3,000 bpd at Viking (eastern Alberta near Hardisty). Crescent Point Energy, Corporate Presentation, March 2013, pp. 5-6, 17 http://www.crescentpointenergy.com/files/10939.CPG-2013-03.pdf 41 Crude by rail is supplying the Irving refinery in Saint John, New Brunswick. Healing, Dan, Cenovus expands rail shipments of oil, Calgary Herald, January 8, 2013 Website: http://www.calgaryherald.com/business/Cenovus+expands+rail+shipments/7791390/story.html Accessed April 14, 2013. Cenovous, FirstEnergy Capital East Coast Energy Conference Presentation, March 14, 2013, p. 8 http://www.cenovus.com/invest/docs/2013/first-energy-2013-BCF-HSC-final-handout.pdf Cenovous 2012 Annual Report, pp. 6, 46-47 http://www.cenovus.com/invest/docs/2012-annual-report/cenovus-AR-2012.pdf

Report evaluating the adequacy of the KXL DSEIS Market Analysis 39
5.3.3.3. Baytex
Baytex is a tar sands producer, but also has significant other heavy (non-tar sands) crude
production in western Saskatchewan and eastern Alberta (Lloydminster and neighboring areas);
Baytex crude by rail relates (in large part) to this other heavy non-tar sands crude production.42
For various reasons discussed below, this other heavy non-tar sands crude production is in
some ways similar to that in the US Bakken and otherwise better suited for crude by rail vs. tar
sands heavy crude production.
Some Baytex Peace River tar sands production is being transported by rail, but this is a
relatively low volume operation that is not pipeline connected. Baytex relies on trucking to move
production from plantgate to either pipeline or rail loading terminal, which thus facilitates
transporting undiluted bitumen. Thus, the crude by rail in Table 1.4-9 for Baytex is of limited
relevance for evaluating the large scale tar sands heavy crude by rail that the DSEIS assumes
to be a viable alternative to the proposed Project.
5.3.3.4. Devon
Devon has some tar sands production, but also has significant other heavy (non-tar sands)
crude production in western Saskatchewan and eastern Alberta (Lloydminster area); Devon
crude by rail may relate to this other heavy non-tar sands crude production, rather than Devon’s
pipeline connected tar sands production.43
5.3.3.5. Suncor
Suncor is a major tar sands producer, which upgrades most of its bitumen production into light
crude (synthetic crude oil, SCO); in 2013, Suncor plans to transport Western Canada crudes via
rail to its Montreal, Quebec refinery.44 The Montreal refinery does not have coker capacity to
process heavy crudes, and is otherwise configured to process a light crude slate. Based on the
limited publicly available information, Suncor crude by rail relates (in whole or part) to light crude
production, which is in some ways similar to that in the US Bakken and otherwise better suited
for crude by rail vs. tar sands heavy crude production.45 Thus, the crude by rail in Table 1.4-9 for
42 Baytex Energy. 2012 Annual Information Form, pp. 47-52. Website: http://www.baytex.ab.ca/files/pdf/investor-relations/Annual%20Information%20Forms/2012%20AIF.pdf. Accessed April 17, 2013; Presentation, RBC Capital Markets' Crude and Refined Investor Day, April 4, 2013, pp. 3-5, Slides 6-10, “Rail Volume […] From Six different production areas […] At Six different loading locations” Website: http://www.baytex.ab.ca/files/pdf/corporate-presentations/Baytex%20-%20RBC%20Heavy%20Oil%20Conf%20-%20Website.pdf . Accessed April 18, 2013. 43
Devon Energy, 2012 Form 1-K, pp. 5, 7, 24 Website: http://services.corporate-ir.net/SEC/Document.Service?id=P3VybD1hSFIwY0RvdkwyRndhUzUwWlc1cmQybDZZWEprTG1OdmJTOWtiM2R1Ykc5aFpDNXdhSEEvWVdOMGFXOXVQVkJFUmlacGNHRm5aVDA0TnpReU9EVXdKbk4xWW5OcFpEMDFOdz09JnR5cGU9MiZmbj1EZXZvbkVuZXJneUNvcnBvcmF0aW9uXzEwS18yMDEzMDIyMS5wZGY= 44
Suncor, 2012 Annual Report, pp. 7, 22, 28-29, 32, 40. Website: http://www.suncor.com/en/investor/3342.aspx?id=1599667&linkid=hIR-Q3. Accessed April 18, 213. 45 Suncor is planning to transport Western crudes via crude by rail to an eastern refinery (Montreal); large amounts of crude by rail (notably from US Bakken) are being transported to East Coast refineries in US PADD 1 and New Brunswick (DSEIS pp. 1.4-37, 58, 61).
Report evaluating the adequacy of the KXL DSEIS Market Analysis 40
Suncor appears to be of limited relevance for evaluating the large scale tar sands heavy crude
by rail that the DSEIS assumes to be a viable alternative to the proposed Project.
Moreover, Suncor plans to use crude by rail as a complement to pipelines, not a substitute.
Suncor is a committed shipper on the Enbridge Line 9 project, to supply the full requirements of
the Montreal refinery. As is the case for other major tar sands producers, Suncor has a strong
preference for pipelines and is very active in promoting pipeline development.
5.3.3.1. Southern Pacific
Southern Pacific is a small tar sands producer and is transporting heavy tar sands crude by rail,
via relatively complex logistics which also include trucking from plantgate and barge:46
Southern Pacific’s bitumen volumes will be trucked approximately 60 km (38
miles) from the STP-McKay plant gate to Lynton, Alta., a CN rail terminal located
immediately south of Fort McMurray. From Lynton, volumes will be transferred
into rail cars and shipped approximately 4,500 km (2,800 miles) over CN’s
network and a short-line rail partner to a terminal in Natchez, Miss. The bitumen
will then be transferred to barges that will deliver the product as feedstock to
refineries on the Gulf Coast.
Southern Pacific is a relatively small tar sands producer, with new production ramping up over
at least the next year:
Initial production at the firm’s steam-assisted gravity drainage (SAGD) facility 45
km northwest of Fort McMurray was 1,200 barrels per day in December. It could
take at least another year before the design capacity of 12,000 bpd is achieved.
Costs for these logistic are reported to be $31/barrel vs. $8 for pipeline (if it was available),
although there could be some savings from backhauling diluent.47
To summarize, while Southern Pacific is a tar sands heavy crude producer, it is in some ways
also similar to the light crude producers in the Bakken (and elsewhere) that have been big users
of crude by rail. Compared with large tar sands producers, these other crude producers (notably
Southern Pacific and Bakken) place a high value on flexibility and optionality, and also would
prefer to avoid making large, inflexible commitments (such as for pipelines).
5.3.4. Locational and Logistical Factors for Crude by Rail
Location and logistics differ for Western Canadian crude production from non-tar sands and tar
sands, such that non-tar sands production is better suited for crude by rail. Non-tar sands crude
production in Saskatchewan and Alberta is located to the east and south of tar sands
production, and is thus more proximate to both the existing rail network and destination markets.
46 Press Release. http://www.shpacific.com/en/news/stp-2012-06rail7-june_27-final.pdf 47 http://www.edmontonjournal.com/business/Alberta+bitumen+makes+Mississippi+rail/7785676/story.html

Report evaluating the adequacy of the KXL DSEIS Market Analysis 41
And as is also the case for Bakken light crude production, Saskatchewan and Alberta non-tar
sands crude production is geographically dispersed over a wide area and often utilizes trucking
for local collection, with crude then transferred onto either rail or pipelines. This dispersed
pattern of production is proximate to the extensive rail network in the more southerly portions of
Saskatchewan and Alberta, and this incentivizes development of multiple dispersed train
loading facilities in order to reduce trucking requirements.48 Heavy crude production that utilizes
trucking for local collection also provides optionality for onward transport of crude that is
undiluted (raw bitumen) or under-diluted (railbit), which may be preferred by refiners and
especially those specializing in asphalt production.49
Crude production that utilizes trucking for local collection, and more generally small scale
movements of crude by rail, preferences use of manifest trains, and thus smaller scale manifest
train loading facilities.50 Large scale movements of crude by rail between high volume
production and destination markets enables the use of unit trains, and thus larger scale unit
train loading facilities.
The Market Analysis relies upon recent experience in the Bakken (and in other new US
production areas) as demonstration that crude by rail will be implemented rapidly and at very
large scale to enable increases in crude production absent sufficient pipeline capacity:
48 Torq Transloading. 2012. Resource and Contract Requirements Necessary to Make Rail a Fully Integrated Part of Crude Takeaway Infrastructure. Presentation at the Crude Oil Markets, Rail & Pipeline Takeaway Summit. Calgary, AB. October 24 & 25, 2012, pp. 6, 20. 49 Refineries specializing in asphalt production are a relatively small niche market, with significant seasonal variation (reflecting that asphalt is used in road and other projects that vary seasonally). Nonetheless, asphalt refineries may be an attractive niche market for heavy non-tar sands crudes, which may be well suited for asphalt production (as compared with heavy tar sands crudes, notably mined bitumen, whose asphalt quality may be poor). Baker Hughes. 2010. Planning Ahead for Effective Canadian Crude Processing, p. 4 , ”Asphalt from mined bitumen may be poor quality. SynBit asphalt quality uncertain.” Website: http://c14503045.r45.cf2.rackcdn.com/v1/8d19146939cbb609c9bcee0e9cf72dd2/28271-canadian_crudeoil_update_whitepaper_06-10.pdf. Accessed April 17, 2013 http://www.exxonmobil.com/crudeoil/download/KearlOilSands_withAssay.pdf p. 4, showing asphalt properties for Kearl and Cold Lake crudes. Torq Transloading. 2012. Resource and Contract Requirements Necessary to Make Rail a Fully Integrated Part of Crude Takeaway Infrastructure. Presentation at the Crude Oil Markets, Rail & Pipeline Takeaway Summit. Calgary, AB. October 24 & 25, 2012, pp. 6, 10-11; Vanderklippe, Nathan. Rail makes big inroads in oil transport. The Globe and Mail, May 21, 2012, updated June 21, 2012. Website: http://www.theglobeandmail.com/report-on-business/industry-news/energy-and-resources/rail-makes-big-inroads-in-oil-transport/article4198192/. Accessed April 16, 2013; http://www.rbnenergy.com/crude-loves-rock-n-rail-east-coast-delivery-terminals http://www.bloomberg.com/news/2012-05-03/nustar-may-triple-oil-rail-shipments-to-new-jersey-refinery.html http://www.lloydminsterheavyoil.com/transporthistory.htm; and http://www.heavycrudehauling.com/index.html 50 Crude by rail via manifest shipments typically involves a smaller number of cars in a mixed train with a variety of goods and commodities. By comparison, crude by rail via unit train typically involves a full train (100 tank cars) cycling between unit train loading and unloading facilities.

Report evaluating the adequacy of the KXL DSEIS Market Analysis 42
The leading production area that has developed rail, including the construction of
dedicated terminals for loading unit trains [footnote 29 in original omitted] to
transport crude oil, is in the Bakken in North Dakota and Montana. Pipeline
capacity out of the Bakken has not kept pace with the increases in production in
the region. Rather than allow the production there to be shut-in, companies
have responded with significant additional rail capacity and have been able
to do so very rapidly.51
[…]
The Bakken area has seen the greatest construction of unit-train rail facilities to
transport crude oil, but it is not the only area. Such facilities have been or are
being constructed in virtually every new production area of the United States to
transport crude oil where there is not sufficient pipeline capacity to accommodate
the new production, including the Eagle Ford shale in Texas, the Permian basin
in Texas, the Woodford/Anadarko area in Oklahoma, the Utica shale in Ohio, and
the Niobrara shale in Colorado and Wyoming. 52
The US Bakken is in some ways an ideal combination of characteristics for crude by rail.53
Production is dispersed over a wide area and benefits from the development of multiple loading
facilities. Producers place a high value on speed and optionality, At the same time, the overall
scale of production is very large and readily supports use of unit trains. So the Bakken is in
some ways very decentralized, but still big enough to achieve economy of scale.
Western Canadian non-tar sands production is typically smaller scale than US production. But
for the reasons discussed above, crude by rail may still be attractive for non-tar sands
producers, even if they are not large enough to utilize unit trains.
Tar sands production is typically larger scale, more clustered, and reliant on pipelines for local
collection, regional aggregation, and onward transport via the North American crude pipeline
system.54 Pipeline transport beyond tar sands production facilities (plant gate) typically requires
that bitumen be diluted to meet pipeline specifications.55 Tar sands heavy crude production
51 DSEIS, p. 1-4-33 (emphasis added). 52
DSEIS, p. 1-4-36. 53 Aside from locational and logistical factors discussed in this section, the US Bakken also has other characteristics that have preferenced crude by rail, including producing a very high quality light crude that can be processed at many refineries, including those on the East Coast which are not pipeline connected. 54 Tar sands projects are pipeline connected via the regional networks of Enbridge, Inter Pipeline Fund, Pembina, and Access. http://www.enbridge.com/MediaCentre/News/regionaloilsandsAAG.aspx http://www.interpipelinefund.com/operations/oil-sands-transportation.cfm http://www.pembina.com/pembina/webcms.nsf/AllDoc/023585C87690673D8725778800596E97?OpenDocument pp. 11-15 http://www.accesspipeline.com/. See also ERCB 2012, pp. 3-33 -3-34 http://www.ercb.ca/sts/ST98/st98-2011.pdf 55 The Enbridge MacKay River Pipeline is heated and insulated to enable transport of dry bitumen (with little or no dilution) from plant gate to an offsite terminal, where bitumen is diluted to pipeline specifications for onward (footnote continued on next page)

Report evaluating the adequacy of the KXL DSEIS Market Analysis 43
facilities are located in northern Alberta and are not highly proximate to the existing rail network.
Heavy tar sands crude production is typically diluted for pipeline transport upstream of locations
(such as Lloydminster), which are more proximate to the existing rail network. Thus, optionality
for onward high volume rail transport of undiluted or under-diluted bitumen would require
logistics that are substantially more complicated and possibly higher cost. Various
configurations might enable rail transport of crude that is undiluted (raw bitumen) or under
diluted (railbit), including the following: 56
a) undiluted or under diluted bitumen transported by truck from plant gate to rail loading
facility;
b) diluted bitumen transported by pipeline from plant gate to the rail loading facility, where it
would be heated to vaporize the diluent, which would then be cooled into a liquid and
transported via a separate pipeline back to plant gate for reuse;
c) undiluted/underdiluted bitumen transported by heated and insulated pipeline;57
d) development and rail loading terminals that are proximate to tar sands production.,
however, these locations are also less proximate to the existing rail network and
destination markets, requiring longer and more expensive rail shipments, and
(potentially) extending and upgrading the existing rail network.
It remains to be shown whether any of these configurations could provide a viable and cost-
effective alternative to high volume transport of dilbit via pipeline, or even how competitive these
configurations would be vs. transport of dilbit via rail.
To the extent that tar sands producers are moving crude by rail, it appears to have some or all
of the following characteristics: smaller producer, non-pipeline connected/reliant on trucking,
starting up new production, seeking to supply niche markets, strong preference and high value
for flexibility and optionality. Thus, the tar sands producers that are most active in crude by rail
have some characteristics that resemble other crude producers who have tended to find rail
attractive, notably Bakken and other shale, and also geographically dispersed non-tar sands
heavy crude production in Saskatchewan and Alberta. These types of crude producers may
prefer rail, even if it is significantly more costly than pipelines.
(footnote continued from previous page) transport on the Athabasca Pipeline; the MacKay River bitumen pipeline is 12-inch diameter and 22 miles long, and thus is a very small portion of the overall Alberta crude pipeline network (where bitumen must typically be diluted to pipeline specifications). The Echo Pipeline is also heated and insulated. http://turbolab.tamu.edu/proc/pumpproc/P21/02.pdf http://www.glowachpipecoatingconsultant.com/pdf/MacKay-River-Pipeline-High-Temperature-Pipeline.pdf 56
Within the constraints of the DSEIS process, TGG was able to undertake only a limited preliminary analysis. Based on this analysis, there are several configurations that might enable rail transport of crude that is undiluted (raw bitumen) or under diluted (railbit); however, each of these configurations could be problematic in terms of being more complicated and/or higher cost than logistics based on transport of dilbit via pipeline and rail. 57 See footnote 55.

Report evaluating the adequacy of the KXL DSEIS Market Analysis 44
5.4. Pipelines and Rail as Transport Options for Tar Sands
As noted in the Market Analysis (p. 1.4-27):
Pipelines have long been the preferred method of transportation for crude oil
producers and shippers for long-term, relatively stable commitments.
For a variety of reasons, pipelines are an especially preferred method for transport of tar sands
production to markets. As discussed in Section 6, Alberta (and especially tar sands production)
is very remote and landlocked. Western Canadian (and other nearby) crude markets are quite
small. So as tar sands production has expanded, pipelines have been essential to provide
dependable, low cost transport of increasingly large volumes of crude over increasingly long
distances.58
Pipelines are otherwise well matched to the needs of tar sands producers and shippers,
because “long-term relatively stable commitments” 59 are highly preferred. As discussed in
Section 6, tar sands production is capital intensive, and expansion projects typically entail large
up-front investments. Moreover, many tar sands projects are individually quite large, take a long
time to complete, and are vulnerable to major cost escalation and delays. Future revenues are
highly uncertain and volatile, notably due to their linkage with crude prices, Future operating
costs are also uncertain and potentially volatile, due in part to their linkage with energy prices.
Tar sands expansion is thus a risky business, and profitability is dependent upon a variety of
short- and long-term factors, which (individually and in combination) are highly uncertain and
volatile. Access to transportation capacity is vital for tar sands producers, since their revenues
are dependent upon market access. Put simply, if crude cannot be transported to market, it has
little (if any) value, and tar sands producers will have little (if any) revenue.
Potential transportation restrictions and consequent inability to generate revenue would be a
problem for any business, but it would be catastrophic for the business model of tar sands
producers. As discussed above, tar sands producers are in a capital intensive, high fixed cost
business with long-lived assets, seeking to recoup large up-front costs by selling crude at a
profit over many years. Thus, these producers want and need dependable access to
transportation and markets, both short- and long-term. Put simply, their business depends upon
it. In particular, adequate transportation and market access are a prerequisite for undertaking
expansion projects.
58 As tar sands production increases (and proximate markets remain small and saturated), crudes must be transported over longer distances to access less proximate markets. Moreover, as noted in the Market Analysis (p. 1.4-54), “[t]here has been a general trend in the outlook for oil sands production away from upgrading bitumen in recent years.” Tar sands production is increasingly in the form of heavy crudes (bitumen), as opposed to light crudes (SCO). Thus, tar sands production must be transported to refineries that can process these crudes, notably to refineries with coking capacity (and other configuration such as metallurgy) required to process heavy tar sands crudes. 59 DSEIS p. 1.4-27.

Report evaluating the adequacy of the KXL DSEIS Market Analysis 45
Tar sands producers recognize that crude transportation is a key consideration and pipelines
are thus very important. Cenovous, a major tar sands producer, identifies Transportation
Restrictions as a major operation risk and specifically states that approval of KXL (and the
Northern Gateway Project will benefit heavy tar sands producers: 60
Our ability to efficiently access end markets may be affected by insufficient
transportation capacity for our production. Transportation restrictions can
negatively impact financial performance by way of higher transportation costs,
wider price differentials, lower realized prices at specific locations or for specific
grades and, in extreme situations, production curtailment. […] this risk […] has
the greatest potential to impact our crude oil production, which could negatively
affect our financial position, results of operations and cash flows within our Oil
Sands and Conventional segments.
[…]
We anticipate transportation constraints will continue in the near term. The
Keystone XL project and the Northern Gateway Pipeline project, if
approved, will benefit heavy oil producers.
The Market Analysis acknowledges that pipelines are a preferred method of crude
transportation, but also asserts that crude by rail could provide a large-scale, viable alternative
means of transporting tar sands crudes. In particular, the Market Analysis assumes that crude
by rail could provide adequate transportation and market access, such that tar sands producers
would continue to expand production absent KXL or even absent any new pipelines (p. 1.4-33):
Rail and supporting non-pipeline modes should be capable, as was projected in
2011, of providing the capacity needed to transport all incremental Western
Canadian and Bakken crude oil production to markets if there were no additional
pipeline projects approved.
At best, the scenario of rail development suggested by Market Analysis is an untested
hypothetical. To date, there has been only a small amount of tar sands crude by rail. And this is
not surprising, given the needs and preferences of tar sands producers. When interviewed last
year, Cenovus CEO Brian Ferguson characterized crude by rail as a short-term solution for
small volumes, but made clear that large scale crude production and transport will require
pipeline connections.61
In rough terms, it costs twice as much to ship oil by train, some $5 to $10 more a
barrel.
60
Cenovous 2012 Annual Report, p. 63 (emphasis added) http://www.cenovus.com/invest/docs/2012-annual-report/cenovus-AR-2012.pdf 61 Vanderklippe, Nathan. Rail makes big inroads in oil transport. The Globe and Mail, May 21, 2012, updated June 21, 2012. Website: http://www.theglobeandmail.com/report-on-business/industry-news/energy-and-resources/rail-makes-big-inroads-in-oil-transport/article4198192/ (emphasis added). Accessed April 17, 2013.
Report evaluating the adequacy of the KXL DSEIS Market Analysis 46
The cost has made companies skeptical. Cenovus, which is boosting its daily
train movements from 2,000 to 5,000 barrels this year, has supported two new
pipeline proposals to move oil to the West Coast, for example.
Chief executive officer Brian Ferguson calls rail “really interesting” and a
“good short-term solution for relatively small volume.” But “anything of
size in terms of shipments will require pipeline connections.”
Dr. Mark Jaccard, a leading authority on Canadian energy issues, has provided a similar
assessment regarding the importance of KXL and other pipelines in regard to tar sands
expansion.62 He has reviewed the DSEIS Market Analysis and clearly concludes that KXL will
substantially affect tar sands development:
The Draft Supplemental Environmental Impact Statement of the US State Department
assumes that denying the Keystone XL pipeline will not appreciably slow development of
the Alberta oil sands and the carbon pollution it produces. There is considerable
evidence that contradicts this assumption, and its importance is noted by industry
analysts, Canadian politicians and even the oil sands producers themselves.
Quite simply, in the absence of Keystone XL, oil sands producers will find it more difficult
to profitably get their product to market. Over the next two decades, the oil sands
industry is considering plans to triple its production. To move forward, these projects
require a significant expansion of low cost transportation infrastructure. They have
potential alternatives to Keystone XL, but these are more costly and more difficult to
scale-up to the capacity of Keystone XL, and each faces significant impediments.
Because of their large capacity and low cost, pipelines are preferred. 63
[…]
Notably, the lowest cost and highest volume method of transporting oil sands product is
via pipelines, yet the other two major proposed pipelines from the oil sands – both of
62 Dr. Jaccard is (among other things) an international energy and environmental expert and author, an energy economist, a professor of environmental economics at Simon Fraser University in Vancouver, as well as former head of the British Columbia Utilities Commission. Internationally, he is recognized for his work since the 1990s on the Intergovernmental Panel on Climate Change, which received the Nobel Peace Prize in 2007. He was also lead author on the IPCC’s 2011 Special Report on Renewables. Thus, he has substantial experience and expertise regarding energy development, and specifically whether development of one type of project (notably pipelines) will affect development of another type of project (notably tar sands expansion). 63 Jaccard, Mark, “Asking the wrong question about Keystone XL.” Testimony to the US Congress Subcommittee on Energy and Power hearing entitled “H.R. 3, the Northern Route Approval Act.” April 10, 2013, p.2 Website: http://docs.house.gov/meetings/IF/IF03/20130410/100616/HHRG-113-IF03-Wstate-JaccardM-20130410.pdf. Accessed April 19, 2013.

Report evaluating the adequacy of the KXL DSEIS Market Analysis 47
them crossing British Columbia – are unlikely to be approved. Denial of Keystone XL
and both of these two pipelines will definitely slow development of the oil sands.64
[…]
This is not to say, however, that oil sands producers will stop pursuing new means of
getting their product to market. Facing significant discounts for their product, some oil
sands producers have turned to rail as a temporary solution. However, rail alternatives
are more complicated and costly, and extremely difficult to scale-up to the level of
throughput that would fully compensate for the absence of Keystone and either of the
BC pipelines. Also, efforts to expand the use of rail for transporting bitumen will create its
own counter pressure from concerned citizens along rail right-of-ways and trans-
shipment hubs. 65
As noted by Dr. Jaccard, tar sands expansion is affected by KXL as well as other major pipeline
projects.
This does mean that there will be no development of crude by rail for tar sands. As discussed
above, transportation restrictions are a major risk for tar sands producers. And these risks have
intensified in the current context when pipeline capacity is highly constrained and may remain
so. In this context, rail may play an important role as a contingency option.
Or put another way, rail may be attractive to tar sands producers as a form of transportation
insurance, Moreover, rail might be a cost-effective as insurance, since it might have some other
benefits, notably in terms of speed and flexibility to improve ongoing logistics. So to the extent
that some rail capability is now being put in place (such as buying tankcars), this does not mean
that a huge buildout of rail will be ongoing. Rail will only be useful as insurance if it is not relied
upon as the base case option.
Long historical experience confirms that tar sands producers can and will undertake expansion
premised on pipelines to provide high volume, low cost, highly dependable market access. The
Market Analysis is based on the untested hypothetical that tar sands expansion could proceed
based on just rail to transport expanding production to market.
Sole reliance on rail as a basis for tar sands expansion is a risky strategy for tar sands
producers. As discussed in CIBC 2011,66 tar sands expansion projects are large and subject to
very large risk and uncertainties. Reliance on rail would further increase the risk and
uncertainties for tar sands expansion. At a minimum, this added risk would have some impact
on tar sands expansion, since producers would need to have a bigger economic cushion to
justify proceeding with expansion projects.
64 Jaccard, op. cit., p. 1. 65 Jaccard, op. cit., p. 3. 66 P. 91.

Report evaluating the adequacy of the KXL DSEIS Market Analysis 48
5.4.1. Risk Factors Related To Crude By Rail
Beyond the flaws in the DSEIS analysis of rail discussed above, the DSEIS analysis also fails to
take into account various risk factors related to crude by rail. These risk factors relate to the
development of crude by rail (namely public opposition) and its operations (spills and increased
regulation). These factors could (a) increase the cost of crude by rail beyond the DSEIS
projections; and (b) represent significant impediments to this alternative to KXL. As such, the
DSEIS assumptions regarding the availability and cost of crude by rail are, at best, an untested
hypothetical and not a sound basis for decision-making.
According to Dr. Jaccard:
Facing significant discounts for their product, some oil sands producers have turned to
rail as a temporary solution. However, rail alternatives are more complicated and costly,
and extremely difficult to scale-up to the level of throughput that would fully compensate
for the absence of Keystone and either of the BC pipelines. Also, efforts to expand the
use of rail for transporting bitumen will create its own counter pressure from concerned
citizens along rail right-of-ways and trans-shipment hubs.
5.4.1.1. Risk factors Related to the Development of Crude by Rail
Tar sands developers have been frustrated by public opposition to pipelines and long regulatory
delays in obtaining permits and approvals. As such rail has been touted as a good workaround
to the protracted approval process and public controversy. Because permitting is not required to
move crude by rail, some have assumed that moving crude by rail is as simple as getting a
tanker car and loading it. Moreover tar sands developers have mistakenly assumed that there
will be no public opposition to rail.67
However public opposition to crude by rail is growing in Canada in both the West and the East.68
On Jan 29, 2013, 16 Canadian organizations, made up of environmental, First Nations, and
citizen groups (including Greenpeace Canada and Sierra Club BC, Living Oceans Society,
ForestEthics and the Council of Canadians) signed a letter to the CEO of Canadian National
(Canada’s largest railway) to express opposition any plans for the transport of tar sands crude
by rail. The letter concluded with the following warning:
“Should CN decide to try to move forward with its proposal, it would face major
opposition and risks to the company. We urge you to stop any forward movement with
shipping tar sands oil by rail through British Columbia.”69
67
http://www.theglobeandmail.com/report-on-business/industry-news/energy-and-resources/with-pipelines-under-attack-railways-lead-race-to-move-oil/article7264773/ 68 http://www2.macleans.ca/2013/01/31/pipeline-opponents-say-cns-crude-by-rail-car-pitch-poses-risk-to-company/ 69 http://www.forestethics.org//sites/forestethics.huang.radicaldesigns.org/files/CN-Rail-letter-2013.pdf

Report evaluating the adequacy of the KXL DSEIS Market Analysis 49
Quebec is also mobilizing against rail as well as pipelines. As mentioned above, the theme of
this year’s Earth Day March in Montreal (on April 21, 2013) is to oppose the arrival of tar sands
crude in Quebec. The French website mentions that opposition will be focused on arrival of tar
sands in Quebec by either pipeline or rail.70
As discussed, pipeline opposition is nimble and dynamic and can quickly shift from project to
project – or from pipelines to pipeline alternatives.
As such, US pipeline opponents can be expected to oppose crude-by-rail as an alternative to
pipelines. Among the recent highly publicized string of crude oil spills in North America in spring
2013, several were caused by train derailments, including a Canadian Pacific derailment in
Minnesota, which resulted in a spill of Canadian crude.71 Dr. Jaccard’s predicted “counter
pressure from concerned citizens along rail right-of-ways and trans-shipment hubs” will get
underway in the US should crude-by-rail start increasing.72
5.4.1.2. Risk factors Related to the Operations of Crude by Rail
As identified above, the risk factors related to operations of crude by rail include spills (resulting
in damage to wildlife, ecosystems, property), and increased regulation. Rail routings often have
particularly high proximity to water bodies and human and industrial activity, both absolutely and
relative to typical routings for crude pipelines.73 As such, rail spills can have significant impacts
on waterways and in populated areas. The letter addressed to the CEO of Canadian National,
cited above, points out the following:
“Unfortunately, as a recent study by the think-tank the Manhattan Institute indicates,
there are far greater fatality, injury and environmental risks when transporting crude oil
by rail than by pipeline. The industry itself acknowledges that trains have nearly three
times the number of spills as pipelines (which provides little comfort given Enbridge’s oil
spill record).”74
70 http://marchepourlaterre.org/ 71 http://www.reuters.com/article/2013/03/28/us-oil-train-derailment-idUSBRE92Q13U20130328 72 Indeed, communities and indigenous groups in the Pacific Northwest have recently mobilized against coal by rail projects that affect their communities and may endanger fisheries. http://www.scientificamerican.com/article.cfm?id=local-opposition-stands-athwart-us-coal-exports-to-asia&page=2 73 Especially for lines with heavy freight traffic, rail routings are designed to minimize elevation changes and were first established many years ago prior to most other infrastructure and development. Put simply, for rail routes, flatter is preferable, even if longer. As a result, rail routings are typically in low lying areas, often paralleling water bodies for long distances, in close proximity to shorelines and with many water crossings. Moreover, rail lines have historically had strong growth-inducing effects and often pass through populated areas and other concentrations of human and industrial activity. In comparison with the rail network, the crude pipeline network is less extensive and newer. Put simply, for pipeline routes, shorter is preferable, even if somewhat steeper. And especially for newer pipelines, routings may be designed to be somewhat less proximate to water and human activity. 74 See Footnote 69, pp. 1-2. The Manhattan Institute study can be found at http://www.manhattan-institute.org/pdf/ir_17.pdf. The study compares the record of oil and gas pipelines to that of transport via rail and road and concludes that pipelines are significantly safer than rail and road.

Report evaluating the adequacy of the KXL DSEIS Market Analysis 50
The letter goes on to discuss CN’s poor environmental and safety record, detailing major spills
of toxic products in Illinois and consequent pollution of lakes and rivers and extensive damage
to fish and wildlife.
The DSEIS does not appear to have taken into account the significant risk factors discussed
above in its assumption of the availability and cost of crude by rail. As Jaccard points out, “rail
alternatives are more complicated and costly, and extremely difficult to scale-up to the level of
throughput that would fully compensate for the absence of Keystone and either of the BC
pipelines.” Mobilization is already gearing up to oppose crude by rail in Canada, and US
activists are likely to also vigorously oppose this option should rail transport of crude increase.
Moreover, due to the safety and environmental risks associated with this option, crude by rail
could be subject to higher costs and potentially more regulation and public opposition in the
future.75
5.5. Conclusion
The review of increases in pipeline and rail capacity in Section 5, demonstrates serious
impediments to both pipeline expansion and crude by rail. TGG therefore rejects the key Market
Analysis assumption that pipeline and other transport/takeaway capacity will not be a significant
constraint on tar sands. Our evaluation concludes definitively that pipelines are by far the
preferred transportation option for tar sands because of low costs and high capacity. However,
the tar sands are now facing major constraints in terms of pipelines. Section 5.2 concludes that
in light of increasing public opposition, there are uncertain prospects for all of the major
proposed pipeline projects to transport tar sands crude. Section 5.3 then undertakes a detailed
review of the DSEIS assumption that crude by rail can be implemented at a sufficient scale and
speed to transport all incremental tar sands production to markets, even absent new pipeline
capacity. This Section demonstrates the deep flaws in the DSEIS assumption regarding crude
to rail. In fact, contrary to the assumptions of the Market Analysis, our evaluation in Section 5.4
concludes that crude by rail is not well-matched for the transport of tar sands crude in terms of
both cost effectiveness and risk factors.
In demonstrating that there are serious impediments to other tar sands crude transportation
options (including other pipelines and crude by rail), Section 5 makes a strong case that the
approval of KXL matters - and it matters a great deal - for tar sands expansion.
75 Aside from crude, the rail network moves large amounts of other energy products, chemicals, and other hazardous materials.

Report evaluating the adequacy of the KXL DSEIS Market Analysis 51
6. Tar Sands Expansion and Breakeven Costs
6.1. Introduction
This section provides an appropriate framework for analyzing tar sands expansion and
breakeven costs. Section 6.2 explores the important issue of how changes in logistics costs and
crude prices affect the amount of tar sands expansion. Sections 6.3 and 6.4 look at how
different market dynamics affect the relationship between crude prices and tar sands expansion
costs. Tar sands breakeven costs are examined in Section 6.5 and the Markets Analysis
assumptions are compared to other more recent data sources.
6.2. Sensitivity to Logistics Costs and Crude Prices
The Market Analysis (Vol I, pp. 1.4-51-1.4-55 and especially Figures 1.4.6-8 and 1.4.6-9)
assumes that most tar sands projects likely have breakeven costs that are low relative to likely
crude pricing, such that these projects will still be profitable with higher logistics costs76.
However, the Market Analysis does then acknowledge that tar sands expansion is likely
somewhat affected by changes in cost and crude prices (Vol I, pl. 1.4-55):
Although it appears that most oil sands projects in the CAPP forecast (and the
CIBC report) likely have breakeven costs low enough that the incremental
increase in transportation costs would not drive project costs above the
breakeven costs at expected oil prices, that does not mean that oil sands
production would be completely insensitive to changes in costs (or the outlook in
oil prices).
As a starting point, all else being equal, tar sands production and expansion will be more
profitable with lower costs (including logistics costs) and/or higher crude prices. So with lower
costs and/or higher crude prices, there will tend to be more tar sands expansion.
It is challenging to assess how much tar sands expansion will occur and how expansion could
vary depending upon factors such as logistics costs and crude prices. There are a variety of
interactions (such as construction costs), that in practice can vary substantially based on market
conditions and have substantial effects on factors such as tar sands costs. Thus, the very
simplified and static analysis shown in Figure 1.4.6-8 does not reflect the realities of tar sands
economic factors and especially the highly interactive nature of those factors.
76 In this report, logistics costs are defined as the costs associated with crude transportation.

Report evaluating the adequacy of the KXL DSEIS Market Analysis 52
In fact, across a very broad range of conditions and assumptions, changes in logistics costs and
crude prices will impact the amount of tar sands expansion. In particular, it is not likely the case
that in the future (at least any time soon) that tar sands expansion will be so profitable such that
shifts in logistics costs and crudes prices (up or down) will not be a significant factor affecting tar
sands expansion.
Thus, to the extent that KXL affects logistics costs (and/or crude prices), it will impact the
amount of tar sands expansion, under a very broad range of conditions and assumptions. And
this is the appropriate framework for assessing KXL impacts in this EIS process relating to a
Presidential Permit application. KXL will have a substantial impact on tar sands expansion, and
it should not be assumed away.
Notably, even if logistics costs are relatively low, and/or crude prices relatively high, there will
still be tar sands projects whose profitability is marginal. In other words, there will be some
projects that appear to be profitable (and producers will seek to build those), others with higher
costs that do not appear to be profitable (which will not be built), and some projects that are
right around breakeven. Thus, changes in crude prices and/or logistics costs can be assumed to
have some impact on the amount of tar sands expansion.
6.3. Labor and other Alberta-Specific Constraints
In particular, in a context of high crude prices, costs for expansion projects will likely be higher,
and possibly much higher, than in a lower crude price environment. As shown by past
experience, high crude prices can lead to a high rate of tar sands expansion, as well as
substantial cost escalation for tar sands projects. In part, this reflects Alberta-specific factors
and bottlenecks, including a very small population, labor force, and economy, in a very
landlocked location, with a cold climate that reduces productivity, in a country with a relatively
small population, labor force, and economy overall. Alberta is a high-cost location for energy
projects, and these costs can rapidly escalate when tar sands expansion ramps up to high
levels. The concept of a tar sands supply curve is more complicated because project
development (and operating) costs are affected by the amount of overall expansion. If many
projects are developed at once, development (and operating) costs will spike up.
As explained in a recent CERA report:77
Rising Capital Costs
Cost is a barrier for new upgrading or refining projects in Alberta; when projects
were first proposed (in the earlier 2000s), investors expected lower price tags.
From 2000 to 2008 (as measured by the IHS CERA Capital Costs Index) costs
for building upgraders or refineries in Alberta increased by 70%.[footnote * in
77 IHS CERA, Extracting Economic Value from the Canadian Oil Sands: Upgrading and refining in Alberta (or not)?, March 2013, pp. 4, 9, 11, 15-16 http://www.ihs.com/images/ihs-cera-upgrading-refining-mar-2013.pdf

Report evaluating the adequacy of the KXL DSEIS Market Analysis 53
original omitted] The rate of change was borne out on actual projects built this
decade, which had final price tags that were 50% to 100% higher than original
estimates. Although costs softened during the recession, they have since
recovered and are now higher than pre-recession levels. The situation is not
unique to Alberta. Project costs around the globe registered similar escalation
owing to increased demand for commodities, equipment, and specialized
personnel. However, with absolute costs in Alberta already higher than most
other regions, escalation had a more severe impact on project economics in
Alberta. [footnote ** in original: Capital costs for Alberta oil sands have
historically been higher than those for other regions, owing mostly to higher labor
costs, lower labor productivity (stemming from extreme weather conditions), and
challenges constructing in a remote landlocked location.]
[…]
• Construction techniques. Owing to differing construction methods, inland
locations are more expensive to build. With ocean access, larger components or
modules of the facility can be built off site. Once complete, the modules can be
transported to site and assembled like building blocks. This technique materially
reduces the labor requirements and—consequently—the cost. Access to the
ocean is critical, because modules can be the size of a football field and need to
be transported by ship. Although inland locations can use this method, since the
modules must be transported by truck, this materially reduces the module size
and corresponding cost savings.
• Labor costs. Construction labor is a large factor in why costs vary among
regions. In North America direct labor typically makes up 30% of a project’s total
cost, and labor costs in Alberta are higher than those of other regions. One
cause is the limited regional pool of construction workers (demand from oil sands
projects often exceeds local supply, requiring workers to be recruited from across
Canada and the globe). Another is Alberta’s landlocked location, keeping on-site
labor requirements relatively high (see construction techniques). Climate is also a
concern; cold weather decreases worker productivity.
[…]
The Alberta labor limit
Alberta has a relatively small skilled trade workforce for constructing industrial
projects—in our estimate about 17,000 workers are available for construction
projects (welders, pipefitters, electricians, and other skilled trades) in Alberta.
These workers support oil sands activity plus other industrial projects in the
province, such as electrical generation, pipeline construction, infrastructure, and
maintenance.

Report evaluating the adequacy of the KXL DSEIS Market Analysis 54
Often Alberta labor demand exceeds supply. Staffing industrial turnaround work
(large maintenance projects that are periodically executed over a one- to three-
month period in the spring and fall) is a perennial problem. To staff turnarounds,
multiple projects demand thousands of skilled trade workers at the same time.
During the turnaround seasons, workers from the rest of Canada are regularly
called on. There were longer-term labor shortages in 2007 and 2008 when the
demand for construction labor exhausted both Alberta and Canadian supply.
Foreign workers were recruited to fill the gap. Now, once again, the Alberta labor
market is constrained. Foreign workers are already at work on oil sands and
other projects in the province, and their numbers are projected to ramp up over
the next few years.
During the 2007 and 2008 labor shortage, projects faced expensive implications.
Wage rates were one factor, increasing by 5.9% annually. [footnote * in original
omitted] In addition total labor costs were boosted by overtime pay (over a 40-
hour week, wages are paid at time-and-a-half and double rates), signing
bonuses, employee recruitment costs, and living allowances. Worker productivity
also took a hit: as the labor shortage grew, the average skill level of the
workforce declined.
But perhaps the most costly implication of the shortage was the expensive start-
up and operational issues that numerous projects faced. […]
to avoid the need for foreign workers and the costly implications of a labor
shortage, the province should keep total construction labor demand at around
25,000 workers. At this level, workers from other parts of Canada are still
required to support projects, although no more than what has historically been
recruited. Since the demand from other Alberta industrial projects averages near
8,000 workers, this means that oil sands demand would need to stay near 17,000
workers.
Critical to our assumption that labor remains a long-term constraint to growth are
the expectations that oil sands growth remains strong and that government policy
for accessing foreign labor does not change significantly from today (i.e., existing
barriers for accessing and keeping foreign labor in the province continue).
[footnote * in original: In June 2012 the Canadian government changed the
process for accessing foreign labor by introducing an accelerated labor market
opinion process. The new process shortened the timeline, but it still takes a
company 6 to 12 months to bring a new foreign worker to Canada. Other barriers
include limits to the cumulative time that workers can stay in Canada and
difficulty in immigrating.]

Report evaluating the adequacy of the KXL DSEIS Market Analysis 55
6.3.1. Comparison of Canadian and US Regional Economic Factors
Impacting Energy Development
As explained above, tar sands projects are subject to a variety of factors that can result in
intensive cost escalation, especially during periods when producers seek to rapidly ramp up
production. Perhaps especially for those familiar with the US context, it is quite notable and
illuminating that there are only about 17,000 Alberta construction workers available to work on
tar sands construction projects. It is thus useful to compare Alberta and Texas, and more
generally the two countries, in terms of how these differences affect energy development.
The US (and especially Texas) has traditionally been a global center for oil and gas industry.
But with the growth of the tar sands and related activities, Canada (and especially Alberta) has
emerged as another global center for the oil and gas industry. More generally, there are some
substantial similarities and interactions between Canada (notably Alberta) and the US (notably
Texas).
But while similar in some ways, Alberta and Texas actually differ quite dramatically in terms of
scale, location, proximity, climate, and national setting. As a result, energy projects in Alberta
are typically more costly compared with similar projects in Texas, and a high rate of activity in
Alberta is much more likely to result in bottlenecks and substantial cost escalation. Put very
simply, size and location matter for energy projects; in terms of economy and logistics, Alberta
is very small and remote, and Texas is very large and proximate.78 Even when viewed on a
national scale in terms of economy and logistics, Canada is relatively small and in some ways
logistically challenged, and the US is enormous and in some ways logistically advantaged.79
And while current and evolving climate conditions affect energy projects in both Canada
(notably Alberta) and the US (notably Texas), winter and other seasonal conditions typically
result in higher costs for projects in more northerly locations.
78 The population in the entire province of Alberta is less than 4 million vs. more than 6 million in just the Houston metropolitan area and 26 million in the entire state of Texas. Alberta is very landlocked and remote from tidewater and other population and economic centers. Texas has a lengthy coastline, extensive port facilities, and is otherwise locationally and logistically advantaged in terms of proximate and relatively low cost access to large markets in both the US and internationally. 79
The population in all of Canada is less than 34 million vs. 315 million in the US. The Canadian population is less than the combined population of Texas and the two neighboring states that are also centers of the oil and gas industry (over 34 million in Texas, Louisiana, and Oklahoma). Canadian population and economic activity are mainly concentrated in the southerly areas within 100 miles to the US border, extending for almost 4000 miles between the East Coast (Atlantic) and West Coast (Pacific). But in part due to tar sands and other energy development, a significant portion of Alberta population and economic activity are located further north and less proximate to the US. In contrast with Canada, US population and economic activity are widely distributed across the lower 48 states, with concentrations proximate to tidewater (Atlantic and Pacific Oceans, Gulf of Mexico) and inland navigable waters (Great Lakes, as well inland rivers which in many cases are navigable for marine cargo vessels, albeit with some winter and other restrictions).

Report evaluating the adequacy of the KXL DSEIS Market Analysis 56
These differences between Canada and the US have important implications for energy
development, as can be seen in regard to both tar sands and tight oil. In recent years, the US
has achieved a ramp up in crude production that is substantially greater than the production
increase in Canada. In large part, this reflects that tight oil development in the US has been able
to achieve a ramp up in production that is much more rapid than that achieved by either tar
sands or tight oil in Canada.80
Much of the increase in US crude production has occurred in Texas, and has been advantaged
by proximity to labor, supply chain, and markets. But there have also been substantial crude
production increases in other parts of the US (notably in North Dakota Bakken) that are more
remote and logistically challenged. Nonetheless, even in those areas, energy development has
been advantaged by availability of labor, supply chain, and markets in other parts of the US
(including Texas).81
6.4. Crude Price and Other Broader Market Dynamics
The relationship between crude prices and tar sands expansion costs also reflects factors that
are less location-specific, and more related to national, continental, and global market
dynamics. Tar sands projects are materials and equipment-intensive. When crude prices are
high, this puts upward pressure on tar sands Input costs (for steel, cement, and other supply
chain), in part because higher energy prices will also tend to increase capital spending for
energy projects outside Alberta. Also, tar sands projects are energy-intensive, for both
construction (notably for energy as input for materials such as steel and cement) and operations
(especially for in-situ production), and higher crude prices tend to coincide with higher energy
prices overall.
Aside from the impact of crude prices upon construction (and operations) costs for tar sands
projects, high crude prices and a high rate of tar sands expansion may also lead to higher
logistics costs. As with tar sands projects, logistics such as pipelines and rail are materials-,
equipment-, and energy-intensive for both construction and operations. But more generally, high
crude prices and a high rate of tar sands expansion will typically coincide with a scenario with
large and rapidly increasing requirements for logistics to transport crudes. Moreover, as tar
sands production increases, it will tend to be accessing less proximate markets and thus crudes
will need to be transported over longer distances.
80 http://media.argusmedia.com/~/media/Files/PDFs/Presentations/IP13-ArgusCrude.pdf Adobe pp. 2-4; CIBC 2012, pp. 72-75. 81
As discussed in the IHS CERA report cited above (footnote 77), workers from other jurisdictions may be called in to mitigate local labor shortages. Labor markets are to some extent national, and to a lesser extent, international. Energy projects in the US typically have substantial access to sizable local and very large national labor supply, and a more restricted capability to use foreign workers. Energy projects in Canada have access to small local and relatively small national labor supply, and a more restricted capability to use foreign workers.
Report evaluating the adequacy of the KXL DSEIS Market Analysis 57
In a context of high crude prices, there may also be rapid growth and shifts in other crude
production and logistics, which can place further pressures on the crude logistics system. In
fact, this is now occurring in North America, with rapidly increasing light crude production from
shale/tight oil occurring simultaneously with sizable growth in tar sands production.
Especially in a context where logistics are constrained (and potentially subject to major
opposition and delays), a high rate of tar sands expansion (likely accompanying high crude
prices) could result in higher effective logistics costs vs. a context of a lower rate of tar sands
expansion (likely accompanying low crude prices).
The relationships discussed above are also relevant to more generally consider in terms of a
context with low crude prices. In general, lower crude prices are not favorable for tar sands
profitability and expansion. But the unfavorable impact of lower crude prices on tar sands
profitability will be somewhat offset by the favorable impact of reduced costs for project
construction, operations, and logistics. Put simply, with lower crude prices and a lower rate of
tar sand production growth, tar sands costs will generally be lower. Moreover, in this context,
producers will likely focus on the expansion project with the most favorable economics, which
are more likely to be profitable even in a low crude price environment.
That said, if crude prices are low enough and/or logistics costs high enough, then tar sands
expansion may largely or completely stop. Below a certain threshold, little if any expansion may
be profitable. But given the low cost estimated for some tar sands projects and other interactive
effects discussed above, some tar sands expansion might ongoing even with relatively low
crude prices (and/or logistics costs relatively high).82
6.5. Tar Sands Breakeven Costs
The Market Analysis assumes that costs of new tar sands projects are moderate and increase
at only the rate of general inflation. The Market Analysis relies on data from NEB 2011 (pp.1.4-
51 – 1.4-52):
The Canadian NEB in 2011 provided estimated breakeven costs for new tar sands
projects. Those prices expressed in terms of WTI price in 2011 dollars were: $51–61
82 In particular, in situ projects are typically estimated to have lower breakeven costs, relative to mining (non-upgraded) and upgraded mining. Likewise, it is sometimes estimated (notably in CIBC 2012) that there is a substantial range of costs for in-situ/SAGD projects, such that the lowest cost projects could be competitive at even relatively low crude prices. See: National Energy Board (NEB). 2011. Canada’s Energy Future: Energy Supply and Demand Projections to 2035, cited in DSEIS Table 1.4.10, p. 1.4-52; referred to in DSEIS Market Analysis and in this report as NEB 2011; CIBC 2012, p. 90; ERCB 2011 http://www.ercb.ca/sts/ST98/st98-2011.pdf ERCB 2012 http://www.ercb.ca/sts/ST98/st98-2011.pdf

Report evaluating the adequacy of the KXL DSEIS Market Analysis 58
per barrel for new in-situ crude; $66–76 per barrel for mining (without upgrader); and
$86–96 per barrel for mining (with upgrading) (NEB 2011).
The NEB 2011 estimates substantially understate likely breakeven costs, especially for
scenarios with a high rate of tar sands expansion. The table below compares the NEB 2011
estimates with the breakeven cost estimates issued in 2011 and 2012 by the Alberta ERCB
(Energy Resources Conservation Board), the provincial energy regulatory agency for tar sands
and other energy resources.
As shown in the above table, breakeven costs estimated by ERCB in 2012 are
substantially higher than those estimated in 2011 (by ERCB and NEB). In comparing its
2012 and 2011 estimates, the ERCB identified cost escalation as major risk factor for tar
sands projects:86
The significant cost inflation experienced by projects in the previous economic
boom resulted in some operators delaying and deferring new projects. […]
The results of the supply cost analysis show a marked increase over the results
from last year. This increase is largely attributable to the forecast light/heavy
differential and higher sustaining capital expenditures. […]
A major risk to the capital cost assumptions in this analysis would be the
re-emergence of cost escalation that occurred in the last decade. When too
many projects proceed, resources such as labour quickly become scarce,
which results in an escalation in capital and supply costs.
83 2011 $. 84 ERCB 2011 does not specify, but data are presumably in 2011 $ (year report was issued). 85 2012 $. Values in 2011 $ would be approximately 2% lower. 86 ERCB 2012, p. 3-30 (emphasis added).
Tar Sands Breakeven Costs (WTI Price $/barrel)
Project Type NEB 201183 ERCB 2011 84
ERCB 201285
New In Situ $51 - $61 $47 - $57 $50 - $78
New Mining (no upgrading)
$66 - $76 $63 - $81 $70 - $91
New Mining w/ Upgrading
$86 - $96 $88 - $102 NA

Report evaluating the adequacy of the KXL DSEIS Market Analysis 59
As discussed in Section 6.3, Alberta is highly constrained in terms of labor and other resources
required for tar sands projects. Alberta is a high-cost location for energy projects, and these
costs can rapidly escalate when tar sands expansion ramps up to high levels. The ERCB 2012
cost estimates are substantially higher than those estimated in 2011 (by ERCB and NEB), but
costs could actually be much higher. In a scenario of rapid tar sands expansion, costs escalate,
sometimes leading to projects being delayed or canceled.
In evaluating industry growth forecasts for tar sands expansion, CIBC 2012 (pp. 88-90)
considered labor availability:
The […] major question mark for oil sands development is labor availability.
The oil sands is a massively labor intensive project type. A typical 100,000
Bbls/d non-upgraded mine requires peak labor of approximately 5,000 workers.
A typical upgraded mine can require anywhere from 5,000-10,000 peak labor
force depending on pace of construction (historically peak was 10,000 but more
companies are planning to stretch construction to have better work force
control). SAGD is less labor intensive but, even still, a typical 35,000 Bbls/d
SAGD project still requires a peak labor force of approximately 700 workers over
a two- to three-year construction period (smaller projects at shorter end of
scale) and with so many projects in the queue, the labor needs are still massive.
The key takeaway is that to meet industry growth forecasts to the 2016/17 time
frame, the available labor force in the oil sands would need to expand
approximately 80% from 2012 levels. Clearly, at face value, these forecasts
entail a massive external labor need – and we note this does not include the
potential for the North West upgrader (potentially another 5,000 people) or
competing labor demands for LNG construction on the BC Coast
CIBC 2012 (pp. 88-90) considered how crude prices and major development constraints
(notably labor and pipeline capacity) will operate to balance supply and demand and limit tar
sands expansion to an achievable level:
Prices/Costs & Pipelines Will Rationalize Development…It Is Only A Matter
Of How Far
[…] there are a massive amount of projects on the planning board that
cannot simply be taken at face value given the major development
constraints such as pipeline capacity and labor. This implies a need for major
projection rationalization/ cannibalization that will be accomplished through some
combination of accelerating inflation, lower prices or more stringent/discerning
external capital.
[…]
In an efficient market, price or costs will rationalize the supply/demand balance
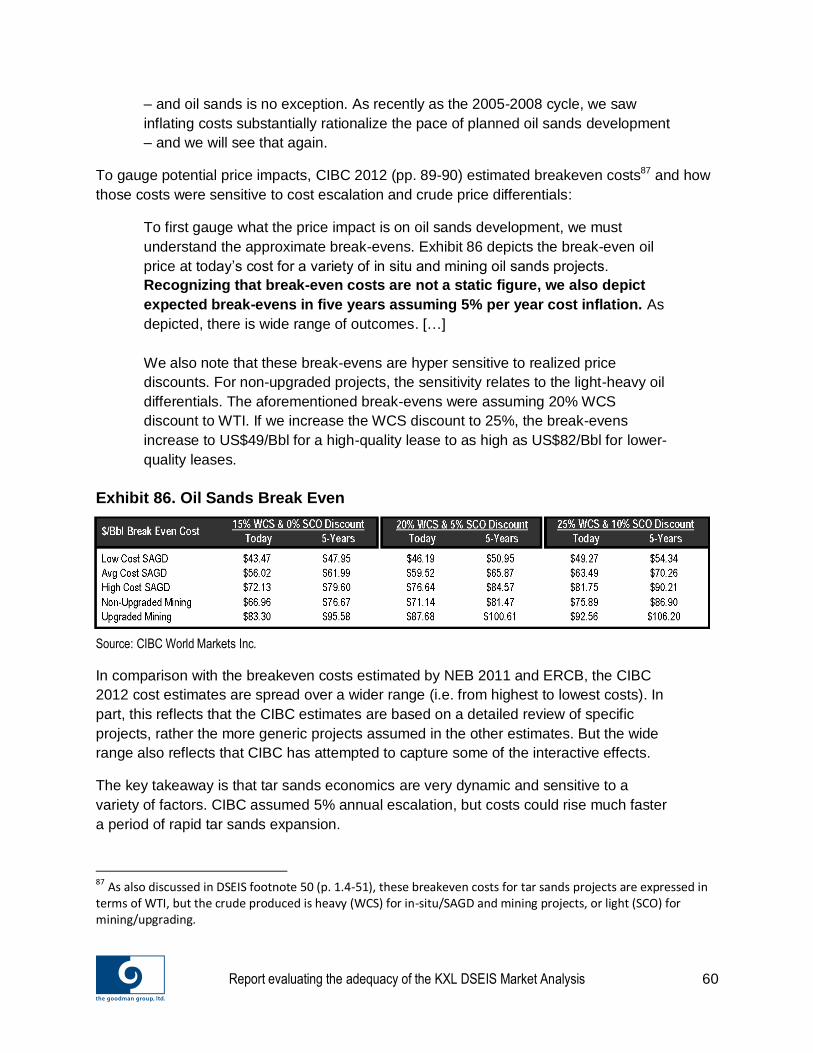
Report evaluating the adequacy of the KXL DSEIS Market Analysis 60
– and oil sands is no exception. As recently as the 2005-2008 cycle, we saw
inflating costs substantially rationalize the pace of planned oil sands development
– and we will see that again.
To gauge potential price impacts, CIBC 2012 (pp. 89-90) estimated breakeven costs87 and how
those costs were sensitive to cost escalation and crude price differentials:
To first gauge what the price impact is on oil sands development, we must
understand the approximate break-evens. Exhibit 86 depicts the break-even oil
price at today’s cost for a variety of in situ and mining oil sands projects.
Recognizing that break-even costs are not a static figure, we also depict
expected break-evens in five years assuming 5% per year cost inflation. As
depicted, there is wide range of outcomes. […]
We also note that these break-evens are hyper sensitive to realized price
discounts. For non-upgraded projects, the sensitivity relates to the light-heavy oil
differentials. The aforementioned break-evens were assuming 20% WCS
discount to WTI. If we increase the WCS discount to 25%, the break-evens
increase to US$49/Bbl for a high-quality lease to as high as US$82/Bbl for lower-
quality leases.
Exhibit 86. Oil Sands Break Even
Source: CIBC World Markets Inc.
In comparison with the breakeven costs estimated by NEB 2011 and ERCB, the CIBC
2012 cost estimates are spread over a wider range (i.e. from highest to lowest costs). In
part, this reflects that the CIBC estimates are based on a detailed review of specific
projects, rather the more generic projects assumed in the other estimates. But the wide
range also reflects that CIBC has attempted to capture some of the interactive effects.
The key takeaway is that tar sands economics are very dynamic and sensitive to a
variety of factors. CIBC assumed 5% annual escalation, but costs could rise much faster
a period of rapid tar sands expansion.
87 As also discussed in DSEIS footnote 50 (p. 1.4-51), these breakeven costs for tar sands projects are expressed in terms of WTI, but the crude produced is heavy (WCS) for in-situ/SAGD and mining projects, or light (SCO) for mining/upgrading.

Report evaluating the adequacy of the KXL DSEIS Market Analysis 61
6.6. Conclusion
Section 6.2 concludes that across a very broad range of assumptions and conditions, changes
in logistics costs and crude prices affect the amount of tar sands expansion. Thus, to the extent
that KXL affects logistics costs (and/or crude prices), it will impact the amount of tar sands
expansion under a very broad range of assumptions and conditions. Sections 6.3 and 6.4
demonstrate how different market dynamics affect the relationship between crude prices and tar
sands expansion costs. In a context where logistics are constrained (and potentially subject to
major opposition and delays), a high rate of tar sands expansion (likely accompanying high
crude prices) could result in higher effective logistics costs. In contrast, a lower rate of tar sands
expansion (likely accompanying low crude prices) could result in lower effective logistics costs.
However, generally lower crude prices are not favorable for tar sands profitability and
expansion.
These dynamics matter in terms of how KXL could have an impact on tar sands expansion. At
high crude prices, access to a low-cost, high-capacity transportation option could facilitate
maximum tar sands expansion since part of the constraint of higher logistic costs would be
removed. At low crude prices, access to a low-cost, high-capacity transportation option could
enable some of the less profitable marginal tar sands projects. Therefore across a broad range
of conditions (high crude prices and high logistics costs to low crude prices and low logistics
costs), KXL can enable tar sands expansion (at low crude prices and low-cost logistics) or
maximize tar sands expansion (at high crude prices and high-cost logistics).
Tar sands breakeven costs are examined in Section 6.5, and the Market Analysis data is
compared to other more recent data sources. Our evaluation shows that the DSEIS is relying on
outdated information that substantially underestimates the breakeven costs for tar sands
projects under emerging market conditions. As indicated above, under challenging economic
conditions, it is even more essential for tar sands producers to have access to high volume, low
cost logistics. Approval of KXL will have a significant impact as an enabler of less profitable
marginal tar sands projects that could not be constructed without access to low-cost logistics.

Report evaluating the adequacy of the KXL DSEIS Market Analysis 62
7. KXL Impact on Tar Sands Expansion
It is reasonable to conclude the following as a basis for analysis and decision-making:
1) Across a very broad range of conditions and assumptions, changes in logistics costs and
crude prices will impact the amount of tar sands expansion.
2) KXL, and specifically its impact on tar sands logistics costs and crude prices, will thus
impact the amount of tar sands expansion.
In this context, it is important to determine what impact KXL has on tar sands logistics costs and
crude prices. In practice, KXL is important for tar sands expansion, since it provides preferred
pipeline logistics (high capacity, low cost, traditionally high reliability) to supply the US Gulf
Coast (USGC) refinery market, and especially refineries configured to process heavy crudes.
Emerging market conditions may result in substantial downward pressure on netbacks88 from
selling heavy crude into the USGC market. In this context, tar sands crudes could be much
more competitive with KXL than with other higher cost logistics. Or put another way, at enough
of a price discount, tar sands crudes can be competitive to supply USGC markets, but this
could result in a low enough net back to substantially constrain tar sands profitability and
expansion.
The Market Analysis has assumed away the impact of KXL on tar sands expansion by
concluding that KXL will not have substantial impact on tar sands production (and thus will not
have substantial impacts on GHGs and other impacts associated with tar sands production).
Based on our evaluation of current market conditions (including emerging crude markets,
factors driving tar sands expansion, availability and cost of crude oil transportation and tar
sands breakeven costs), the TGG report concludes that the Market Analysis is deeply flawed
and not a sound basis for decision-making. We have determined that KXL, and specifically its
impact on tar sands logistics costs and crude prices, will have a significant impact on tar sands
expansion under a very broad range of conditions and assumptions.
Given the limitations of the available data, time and resources, TGG is unable to precisely
quantify the impact of KXL on the tar sands. This impact is difficult to quantify and would require
a highly sophisticated analysis that examines a range of scenarios and many interactive effects
(to model the dynamic market conditions that exist in the real world petroleum markets).
88 Netback is a summary of all the costs associated with bringing one unit of oil to the marketplace, and all of the revenues from the sale of all the products generated from that same unit. The netback is calculated by taking all of the revenues from the oil, less all costs associated with getting the oil to a market. These costs can include, but are not limited to, importing, transportation, production and refining costs, and royalty fees.

Report evaluating the adequacy of the KXL DSEIS Market Analysis 63
However, for the purposes of providing practical guidance to policymakers, a conservative and
credible estimate would be that KXL’s effect on tar sands expansion would be 100% or 1:1. In
other words, every barrel of tar sands crude transported by KXL would be the equivalent of a
barrel of expanded crude production in the tar sands. Therefore, if at full capacity, KXL can
transport 830,000 bpd of tar sands crudes, then its effect on tar sands expansion would be
830,000 bpd.
This estimate is based on our evaluation of current market conditions, and in particular on our
analysis in Section 5 of the availability and cost of crude oil transportation. TGG has concluded
that there are serious impediments to other crude transportation options (including other
pipelines and crude by rail). This opinion has been substantiated by the recent testimony of
energy expert Dr. Mark Jaccard89 on KXL and CIBC 2012, both cited earlier in this document. In
light of increasing public opposition, there are uncertain prospects for all of the major proposed
pipeline projects to transport tar sands crude. Moreover, contrary to the assumptions of the
Market Analysis, TGG has concluded in Section 5 that crude by rail is not well matched for the
transport of tar sands crude, in terms of cost-effectiveness and risk factors.
The 100% impact of KXL is further support by TGG’s conclusions in Section 4 regarding the
crude markets. In this section, we demonstrate that the emerging economic conditions will
become increasingly challenging for the tar sands. Under challenging economics conditions, it is
even more essential for tar sands producers to have access to high volume, low cost logistics,
so the impact of KXL on tar sands expansion tends to 100% under these conditions.
We are aware that under certain plausible scenarios, particularly those in which a modest
amount of crude by rail is cost-effective, KXL’s effect on tar sands expansion would somewhat
less than 100% (i.e. less than 830,000 bpd), but we believe that the impact of KXL would
continue to be quite substantial under most scenarios.
Furthermore TGG’s evaluation of market conditions leads us to conclude that the 100%
estimate is far more accurate than that of the Market Analysis, which assumes the following
vastly underestimated impacts for KXL:
If all such pipeline capacity90 were restricted in the medium-to-long-term, the
incremental increase in cost of the non-pipeline transport options could result in a
decrease in production from the oil sands, perhaps 90,000 to 210,000 barrels per
day (bpd) (approximately 2 to 4 percent) by 2030. If the proposed Project were
denied but other proposed new and expanded pipelines go forward, the
incremental decrease in production could be approximately 20,000 to 30,000 bpd
(from 0.4 to 0.6 percent of total WCSB production) by 2030. (As examined in
section 4.15, such production decreases would be associated with a decrease in
greenhouse gas emissions in the range of 0.35 to 5.3 MMTCO2e annually if all
89 See footnote XX. 90 Referring to pipeline projects located exclusively in Canada (particularly, Northern Gateway, Trans Mountain and Energy East).

Report evaluating the adequacy of the KXL DSEIS Market Analysis 64
pipeline projects were denied, and in the range of 0.07 to 0.83 million metric tons
carbon dioxide equivalent (MMTCO2e) annually if the proposed Project were not
built.)91
In light of our evaluation, TGG suggests that 100% impact estimate is a credible, conservative
and pragmatic estimate to guide policymakers in the absence of a much more sophisticated
analysis that examines a range of scenarios and many interactive market effects. However,
should policymakers wish to base their decision on a more sophisticated analysis, we suggest
that the TGG evaluation provided herein be used as input for such an analysis, which would
also address and remedy the deep flaws identified in the DSEIS Market Analysis.
91 Section 1.4.1 (pp. 1.4.1 – 1.4.-2). Emphasis added.