Report by the Secretariat - World Trade Organization · Web viewAccording to estimates for...
52
Australia WT/TPR/S/178 Page 73 IV. TRADE POLICIES BY SECTOR (1) OVERVIEW 1. In order to aid transparency and facilitate analysis of the potential impact of government assistance on the allocation of resources between sectors, the Productivity Commission publishes annual estimates of several key types of assistance, using, for example, effective rates of assistance (ERAs). 1 Among the main forms of assistance captured by ERAs are: tariff protection; budgetary assistance 2 ; and agricultural pricing and regulation. According to estimates for 2003/04, the latest year for which indicators are available, the ERA was virtually zero for mining, which accounts for around half of merchandise exports and is one of the major driving forces behind Australia's recent strong economic growth. The ERAs for primary production (including agriculture) and manufacturing were low, at only 4.1% and 4.5%, respectively. 3 However, these averages mask a significant variation in rates within sectors. At the high end are textiles, clothing and footwear (TCF) and motor vehicles and parts (MVP), with rates of 24.2% and 10.6%, respectively, although these may have fallen as a result of Australia's unilateral reduction in the tariffs for these sectors in 2005. At 12%, the ERA of the dairy industry is also relatively high, albeit significantly lower than prior to its deregulation in 2000. 4 For technical reasons, no estimates of ERAs were available for services. 2. The services sector dominates Australia's economy, accounting for nearly two thirds of GDP and roughly three quarters of employment in 2004/05. During the period under review, government assistance to services has been increasing, mainly owing to measures to encourage investment, R&D, and exports. The legislative and 1 ERAs are a measure of the net assistance to a sector divided by the sector's unassisted value added. Sectors with relatively high ERAs are, as a result of such assistance, more likely to be able to attract resources away from those with lower rates. 2 Budgetary assistance does not necessarily reflect subsidies provided within the meaning of the WTO agreements. 3 Needless to say, the ERAs for agriculture and its subsectors do not take into account Australia's stringent sanitary and phytosanitary measures. 4 Assistance to dairy farmers has been "decoupled" from dairy output and farm activity levels, thereby diluting its potential effects on production and thus trade.
Transcript of Report by the Secretariat - World Trade Organization · Web viewAccording to estimates for...
Australia WT/TPR/S/178Page 73
IV. TRADE POLICIES BY SECTOR
(1) OVERVIEW
1. In order to aid transparency and facilitate analysis of the potential impact of government assistance on the allocation of resources between sectors, the Productivity Commission publishes annual estimates of several key types of assistance, using, for example, effective rates of assistance (ERAs).1 Among the main forms of assistance captured by ERAs are: tariff protection; budgetary assistance2; and agricultural pricing and regulation. According to estimates for 2003/04, the latest year for which indicators are available, the ERA was virtually zero for mining, which accounts for around half of merchandise exports and is one of the major driving forces behind Australia's recent strong economic growth. The ERAs for primary production (including agriculture) and manufacturing were low, at only 4.1% and 4.5%, respectively.3 However, these averages mask a significant variation in rates within sectors. At the high end are textiles, clothing and footwear (TCF) and motor vehicles and parts (MVP), with rates of 24.2% and 10.6%, respectively, although these may have fallen as a result of Australia's unilateral reduction in the tariffs for these sectors in 2005. At 12%, the ERA of the dairy industry is also relatively high, albeit significantly lower than prior to its deregulation in 2000.4 For technical reasons, no estimates of ERAs were available for services.
2. The services sector dominates Australia's economy, accounting for nearly two thirds of GDP and roughly three quarters of employment in 2004/05. During the period under review, government assistance to services has been increasing, mainly owing to measures to encourage investment, R&D, and exports. The legislative and institutional frameworks for financial services have changed little since the previous Review, although stricter prudential regulations were announced in 2006 to bring them into line with international practices. The regulators of the telecommunications and broadcasting sectors, the Australian Communications Authority (ACA) and the Australian Broadcasting Authority (ABA), were merged to form the Australian Communications and Media Authority (ACMA) from 1 July 2005. It was also announced that foreign ownership restrictions on media would be removed from 2007.
3. Australia's merchant fleet has shrunk, reflecting its greater reliance on foreign-flagged vessels. However, the demand for transport is expected to almost double over the next 20 years. Moreover, it seems that despite the recent global boom in mining commodities and the associated increase in demand, exports have been constrained by the lack of transport facilities, particularly coal ports in some parts of Australia. In response, an Export and Infrastructure Taskforce was established to identify infrastructure bottlenecks. The taskforce found evidence of capacity constraints at most of Australia's bulk ports for coal and iron ore, but no infrastructure crisis. Instead, the regulatory framework was identified as the greatest impediment to the development of Australia’s infrastructure. Accordingly, the Council of Australian Governments (COAG) has since agreed to a range of initiatives to improve planning for ports and associated shipping channels and, through its new National Reform Agenda, measures to reform the regulatory system for infrastructure.
1 ERAs are a measure of the net assistance to a sector divided by the sector's unassisted value added. Sectors with relatively high ERAs are, as a result of such assistance, more likely to be able to attract resources away from those with lower rates.
2 Budgetary assistance does not necessarily reflect subsidies provided within the meaning of the WTO agreements.
3 Needless to say, the ERAs for agriculture and its subsectors do not take into account Australia's stringent sanitary and phytosanitary measures.
4 Assistance to dairy farmers has been "decoupled" from dairy output and farm activity levels, thereby diluting its potential effects on production and thus trade.
WT/TPR/S/178 Trade Policy ReviewPage 74
4. A few policy changes have been implemented in relation to civil aviation during the review period. In particular, since the signing of a bilateral agreement in 2003, international airlines from New Zealand have been accorded cabotage rights. Although price regulation of airport services remains, it has been relaxed since 2002, when the Government discontinued price notification and price cap arrangements for all airports, and introduced price monitoring for the seven most important.
5. Reforms aimed at simplifying the regulatory framework have continued in the electricity sector in order to create a fully competitive national market. As Australia has limited water resources, reform is being undertaken to establish a market framework for the management of water resources in both urban and rural areas.
(1) AGRICULTURE, LIVESTOCK, FORESTRY, AND FISHERIES
(i) Overview
6. The agriculture sector (including forestry and fisheries) accounts for a relatively small portion of the economy, but plays a much bigger role in exports. Between 2001/02 and 2005/06, the sector's share of GDP fell from 4.4% to 3.1%, and the share of total employment fell from 4.9% to 3.5% (Table I.2).5 The relative decline reflects, among other things, a fall in the relative price for food, as well as shifts in consumer demand towards services as income rises. Around two thirds of the sector's output was exported directly, making it the most export-oriented sector after mining.6 Agricultural exports increased in value from US$17.3 billion in 2002 to US$21.2 billion in 2005, accounting for 20.1% of total merchandise exports in 2005.7 The dependence of Australian farming on exports varies between industries8; the major agricultural exports are wheat, wine, bovine meat, meat of sheep or goats, and dairy products (Table AI.1). Imports of agricultural products increased from US$4.1 billion in 2002 to US$6.6 billion in 2005. The industries with the highest import shares include dairy and commercial fishing; the lowest are grains and poultry.
7. Domestic support for agriculture remains well below the OECD average. Tariffs on agricultural products remain low (averaging 1.4% in 2006), but ad valorem equivalents (AVEs) for a few non-ad valorem duties are much higher. Despite the privatization/corporatization of some state-trading enterprises, state-trading arrangements have been maintained for exports of some agricultural products. In addition, Australia's quarantine framework remains strict.
8. Since its previous Review, Australia has been active at the bilateral level in a wide range of agricultural related issues.9
(ii) Regulatory framework
9. The Department of Agriculture, Fisheries, and Forestry (DAFF) remains responsible for the development and implementation of policies and programmes, to promote competitiveness, increase profitability, and ensure the sustainability of the sector. Institutional reforms made during the period
5 Productivity Commission (2005e). According to the PC, the diminishing share of agriculture "largely reflects positive or success-related factors and is not a sign of systemic weakness" (p. 7).6 ? DAFF (2005c), p. 6.
7 The largest export market is Japan, followed by the United States, China, EC25, and the Republic of Korea.
8 The wool industry currently exports around 95% of its production. The beef, sugar, and wheat industries export around 65-75% of production, and the sheep meat, wine and dairy industries around 50-60%. (Productivity Commission, 2005e.)
9 Arrangements include MOUs on, inter alia, quarantine and SPS measures, trade facilitation, and technical cooperation issues, and the enhancement of agricultural cooperation.
Australia WT/TPR/S/178Page 75
under review include state trading arrangements for exports of agricultural products, which now cover fewer products: bulk wheat and in some states, bulk barley, lupines, canola, and rice (Chapter III(3)(iii)). In particular, the Australian Dairy Corporation was privatized and became Dairy Australia in July 2003.
10. In addition, Australia's SPS framework has been improved; Biosecurity Australia (BA) was established in December 2004 under the Financial Management and Accountability Act 1997 (the FMA Act), "to further boost the independence of operations and ensure appropriate financial autonomy".10 BA was initially an entity separated from the Australian Quarantine and Inspection Service (AQIS) in October 2000; it is now financially separated from DAFF. Since becoming an independent prescribed agency, its functions include providing science-based quarantine assessments and policy advice concerning imports of animals and plants. It also participates in international standard setting organizations11, and capacity-building activities for Australia's neighbouring countries. In October 2006, the Australian Government announced a reform package to make import risk analyses (IRAs) more transparent, efficient, timely, and predictable, to be implemented from early 2007 (Chapter III(2)(vii)(b)).
(iii) Assistance
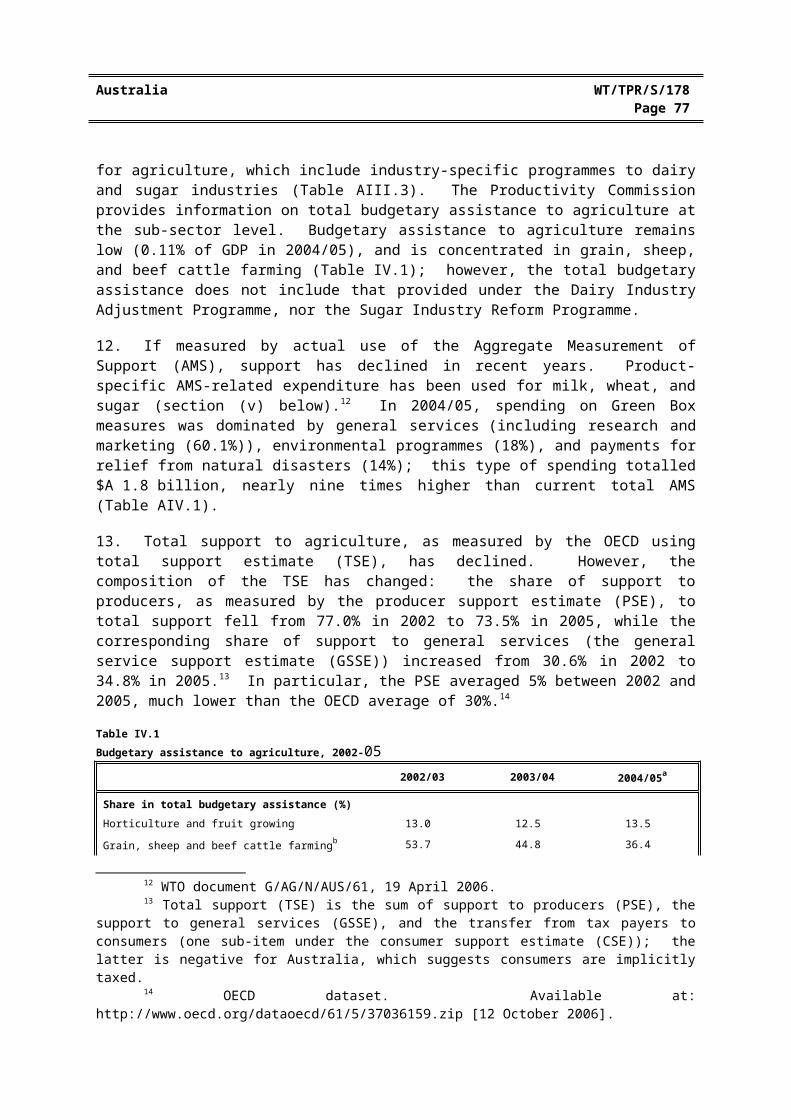
11. Various methods have been used to measure domestic support to agriculture. Australia notifies the WTO of its subsidy programmes for agriculture, which include industry-specific programmes to dairy and sugar industries (Table AIII.3). The Productivity Commission provides information on total budgetary assistance to agriculture at the sub-sector level. Budgetary assistance to agriculture remains low (0.11% of GDP in 2004/05), and is concentrated in grain, sheep, and beef cattle farming (Table IV.1); however, the total budgetary assistance does not include that provided under the Dairy Industry Adjustment Programme, nor the Sugar Industry Reform Programme.
12. If measured by actual use of the Aggregate Measurement of Support (AMS), support has declined in recent years. Product-specific AMS-related expenditure has been used for milk, wheat, and sugar (section (v) below).12 In 2004/05, spending on Green Box measures was dominated by general services (including research and marketing (60.1%)), environmental programmes (18%), and payments for relief from natural disasters (14%); this type of spending totalled $A 1.8 billion, nearly nine times higher than current total AMS (Table AIV.1).
13. Total support to agriculture, as measured by the OECD using total support estimate (TSE), has declined. However, the composition of the TSE has changed: the share of support to producers, as measured by the producer support estimate (PSE), to total support fell from 77.0% in 2002 to 73.5% in 2005, while the corresponding share of support to general services (the general service support estimate (GSSE)) increased from 30.6% in 2002 to 34.8% in 2005.13 In particular, the PSE averaged 5% between 2002 and 2005, much lower than the OECD average of 30%.14
Table IV.1Budgetary assistance to agriculture, 2002-05
10 DAFF (2005a), p. 436. 11 These organizations include the World Organisation for Animal Health (OIE), the Codex
Alimentarius Commission (Codex), and the bodies established under the International Plant Protection Convention (IPPC).
12 WTO document G/AG/N/AUS/61, 19 April 2006.13 Total support (TSE) is the sum of support to producers (PSE), the support to general services
(GSSE), and the transfer from tax payers to consumers (one sub-item under the consumer support estimate (CSE)); the latter is negative for Australia, which suggests consumers are implicitly taxed.
14 OECD dataset. Available at: http://www.oecd.org/dataoecd/61/5/37036159.zip [12 October 2006].

WT/TPR/S/178 Trade Policy ReviewPage 76
2002/03 2003/04 2004/05a
Share in total budgetary assistance (%)Horticulture and fruit growing 13.0 12.5 13.5
Grain, sheep and beef cattle farmingb 53.7 44.8 36.4
Dairy cattle farmingc 7.1 6.2 5.1
Poultry farming 0.4 0.9 1.4Other livestock farming 3.3 2.7 2.3
Other crop growingd 5.9 11.8 18.1
Services to agriculture (including hunting and trapping) 1.3 1.2 1.1Forestry and logging 2.6 3.7 4.1
Commercial fishinge 5.9 6.7 7.9
Unallocated primary production 6.8 9.6 10.1Total outlays ($A million) 502.1 626.3 704.5Total tax expenditure ($A million) 693.0 451.0 275.4Total budgetary assistance ($A million) 1,195.1 1,077.3 980.0Share of total budgetary assistance to GDP (%) 0.15 0.13 0.11
a Estimates are derived primarily from Australian Government budget papers, departmental annual reports and Treasury's 2005 TES.
b Excludes assistance derived from NSW statutory marketing arrangements for rice, which the PC categorizes as "agricultural pricing and regulatory assistance" rather than budgetary assistance. The PC estimates that assistance derived from the rice marketing arrangements totalled around $A 3 million in 2004/05.
c Does not include funding provided under the Australian Government's Dairy Industry Adjustment Package. The PC estimates that the package provided dairy farmers remaining in the industry with assistance totalling around $A 144 million in 2004/05.
d Does not include funding of $A 17.6 million and $A 9.1 million in 2002/03 and 2003/04, respectively, provided under the Australian Government's 2002 Sugar Industry Reform Program (SIRP).
e Commercial fishing combines the previously reported marine fishing and aquaculture industry groupings.
Source: Productivity Commission (2006e), Table A1.
14. An important part of assistance is drought relief. The drought in 2002/03 caused an estimated 70% reduction in the net value of farm production and reduced GDP growth by around 1%.15 The drought in 2006 caused a 20% fall in farm output, which is predicted to reduce GDP growth by half a percentage point.16 The ongoing severity and extent of the drought has resulted in the Government providing over $A 1.1 billion in direct assistance from July 2001 to June 2006, with a further $A 1.2 billion envisaged between 2006/07 and 2007/08. Drought relief has been provided mainly through an Exceptional Circumstances (EC) programme, under which farmers and small businesses receive income support and business assistance once an EC declaration is made by a state government and approved by the Minister for Agriculture, Fisheries and Forestry.17 However, a drought review panel established in October 2003 found that, although income support is highly valued by recipients and considered to be "necessary" during a drought, the wide range of available drought assistance measures and their associated eligibility requirements may be confusing for farmers.18 A comprehensive reform process is under way to improve the efficiency and effectiveness of the
15 Truss (Minister for Agriculture, Fisheries and Forestry) (2004).16 RBA online information. Viewed at: http://www.rba.gov.au/PublicationsAndResearch/
StatementsOnMonetaryPolicy/statement_on_monetary_1106.html [24 November 2006].17 Applications for EC declarations must demonstrate that the event (whether a drought or other
specified occurrence): is rare (a one in 20 to 25 year event); has resulted in a severe downturn in farm incomes over a prolonged period (greater than 12 month); affects a significant number of farmers in a region or industry; and was not predictable or part of a process of structural adjustment. Once an area has received an EC declaration, support provided under the EC programme is generally available for a period of up to two years.
18 Drought Review Panel (2004).
Australia WT/TPR/S/178Page 77
assistance provided during drought, and to shift the focus of drought policy to drought preparation and management.
(iv) Border measures
15. The simple average MFN tariff for agricultural products remains low, at 1.4% (1.5% for WTO agricultural products); most agricultural products are imported duty-free. However, the ad valorem equivalents (AVEs) for a few non-ad valorem duties are relatively high (the average AVE for specific rates (cheese and curd) are 23.8% in 2006) (Chapter III(2)(ii)).19 Tariff quotas apply to most types of cheese and curd imports (Chapter III(2)(ii)(a)).
16. Levies and charges have been maintained to fund activities such as: R&D; marketing; residue testing; plant and animal health programmes; and exports of wheat under the Wheat Export Authority (WEA).20 The Levies Revenue Service (LRS) based in the DAFF is responsible for collecting and paying out more than 60 different levies and charges imposed on a range of rural commodities and products, such as grains, horticultural products, livestock, farmed prawns, forest and wood products, and wine (Table AIV.2).
17. Some products, including meat, livestock, rice, wine and wine products, and sugar, are subject to export restrictions or licensing requirements (Chapter III(3)(ii)). The Australian Livestock Export (Merino) Orders prohibit the export of all merino genetic material out of Australia; this prohibition does not apply to exports to New Zealand.21
(v) Reforms in selected sectors
Dairy
18. In terms of farm-gate value, 50% of domestically produced milk in 2004/05 was exported, mainly in the form of manufactured products, such as butter, cheese, and milk powder. Australia accounts for around 2% of world milk production, and ranks third (behind New Zealand and the EC) in world dairy trade, with a 13% share.
19. Prior to 2000, the dairy industry received assistance through a combination of price and regulatory controls, valued at around $A 450 million in 1999/2000. In July 2000, these arrangements were terminated as part of the deregulation process, and a federal Dairy Industry Adjustment Package (DIAP) was introduced to help farmers to adjust.22 The DIAP, funded through a levy of 11 cents per litre on all milk products marketed as a beverage and sold to a retailer, covers a period of eight years from July 2000.
19 Specific duties are levied on some cheese and curd products, and alternate duties are levied on some fruit juices.
20 DAFF online information. Viewed at: http://www.affa.gov.au/content/levies/about_levies.cfm [13 June 2006].
21 According to the authorities, the Australian wool industry has made substantial investment in improving the quality of merino wool over the years and this is a crucial element in the competitiveness of the industry (WTO, 1998). According to Australia's APEC IAP, the livestock industry has indicated in recent consultations that it does not support any change to these restrictions (APEC, 2004).
22 Various funds have been provided under the package. Payments are administered to dairy farmers by the Dairy Adjustment Authority (DAA), which was established under the Dairy Industry Adjustment Act 2000. Eligibility for payment is based on market milk deliveries during 1998/99, and is paid quarterly over eight years from 2000/01.

WT/TPR/S/178 Trade Policy ReviewPage 78
20. The DIAP consists of: a dairy structural adjustment programme (DSAP), a supplementary dairy assistance (SDA) programme, and a dairy exit programme (DEP) (and the later farm help re-establishment grant (FHRG)).23 A diary regional assistance programme (DRAP), until terminated in August 2004, provided funds to projects that created employment opportunities in dairy-dependent communities adversely affected by deregulation.
21. Under the DSAP, direct assistance of $A 1.63 billion is available to eligible dairy farmers until 2008. Producers with an existing DSAP entitlement can apply for assistance under the SDA, under which $A 120 million is allocated to farmers who have been severely affected by deregulation. Up to June 2002, producers with a DSAP/SDA entitlement had the option of applying for assistance under the exit programme (DEP), which provided an optional tax-free exit payment of up to $A 45,000 for eligible dairy producers wishing to leave the industry. Subsequently, the DEP was extended to become a farm help re-establishment grant (FHRG), under which tax-free payments of up to $A 50,000, and access to farm help advice and training (worth up to $A 5,500), are provided by the Government. As dairy farmers have been exiting the industry, the amount of these grants has been falling, and the effective rate of assistance to dairy cattle farming declined, from 16.2% in 2002/03, to 12% in 2003/04.24
Sugar25
22. The sugar industry has been subject to a number of reforms and assistance packages since the mid-1990s. Following the Sugar Industry (Cane Growers) Assistance Package in 2000, the Government commenced the Sugar Industry Reform Programme (SIRP) in September 2002, with up to $A 120 million in assistance. The programme was funded partly by a levy of 3 cents per kg on domestic sugar sales. In April 2004, uncompleted elements of the SIRP 2002 (with total funding of $A 26.7 million) were incorporated into some new initiatives under the SIRP 2004, which provided funding of up to $A 444 million, over a period of four years. The programme includes mainly a $A 146 million one-off sustainability grant for cane growers and millers; in addition, up to $A 75 million is provided towards regional and community projects to assist the medium- and longer-term restructuring of the sugar industry, as well as up to $A 40 million in restructuring grants to help growers improve productivity.26 However, the world price indicator for raw sugar in 2004/05 increased by more than 30% from the previous year, and was expected to rise a further 16% in 2005/06. Partly due to the price increase, less than half of sugar farmers who received income support have taken the chance to develop an appropriate business or farm management plan.27 The authorities consider it too early to determine the full effect of the reform programme, as some of the key elements have not been completed, and others need time to take effect.
Wheat28
23. Assistance to the wheat industry is low, and mainly takes the form of the Tasmanian Wheat Freight Subsidy. Following the deregulation of Australia's wheat market, the Tasmanian Wheat Freight Subsidy was introduced in 1989 to alleviate sea freight costs of shipping bulk wheat to
23 Dairy Adjustment Authority online information. Viewed at: http://www.daa.gov.au/package.html [15 June 2006].
24 Productivity Commission (2004). 25 At the farm-gate level, 76% of domestic produced sugarcane in 1999/2000 was exported as raw and
refined sugar (DFAT, 2005c, p.63).26 Productivity Commission (2006e), p. 3.13.27 Productivity Commission (2006e), p. 3.13, "The limited evidence of reform (including a lower-than-
expected uptake of re-establishment grants which were available to assist farmers to exit the industry) may have been caused partly by changes in market conditions".
28 At the farm-gate level, 70% of wheat produced in Australia in 2004/05 was exported.

Australia WT/TPR/S/178Page 79
Tasmania from mainland Australia. Under the scheme, shippers of bulk wheat receive rebates proportional to the total tonnage shipped in a given financial year. Subject to an annual appropriation by Parliament, up to $A 1.05 million is available for 2006/07 for shippers claiming assistance. On 7 September 2006, the Government announced that the subsidy will be maintained; the Productivity Commission is currently conducting a public inquiry to examine the effectiveness of the scheme.
24. Although the domestic wheat market has been deregulated, exports of bulk wheat remain subject to state trading under single-desk arrangements. In July 1999, the statutory Australian Wheat Board ceased operation, with its marketing and financing functions transferred to the AWB Ltd, a grower-owned and controlled company.29 Since corporatization in 1999, AWB (International) Ltd, a subsidiary of AWB Ltd, has been granted the sole right under the Wheat Marketing Act 1989 to export bulk wheat without a permit from the Wheat Export Authority (WEA). The WEA, a statutory authority, is responsible for monitoring and reporting on AWB (International) Ltd, and for managing the export of wheat in containers and bags. The WEA is funded through a levy on wheat exports (Table AIV.2). The PC has recommended the single desk export arrangement be reviewed as one of the priority areas under the National Competition Policy (NCP).30
(vi) Forestry
25. Timber harvesting occur mainly in about 7% of Australia's forest area, and less than 1% of native production forest is harvested each year. The forestry industry contributed to around 1% of GDP and employed more than 83,600 people in 2004/05, accounting for 0.85% of total employment. In recent years, exports of forest products have been stable, and overall Australia remains a net importer of forestry products.31
26. Australia's forestry industry is guided by the National Forest Policy Statement (NFPS) 1992. A key element of the NFPS is the regional forest agreements (RFAs), which are 20-year plans for the conservation and sustainable management of Australia's native forests, by providing certainty for forest-based industries and forest-dependent communities. Currently, there are ten RFAs in four states: New South Wales, Tasmania, Victoria, and Western Australia.
27. Licences issued by DAFF are required for exports of over 2 tonnes of: woodchips and wood in the round with a cross-sectional area of 225 cm2 or greater, intended for further processing; and sandalwood sourced from Queensland and Western Australia. Exports of native hardwood woodchips are prohibited, unless they are sourced from a region covered by an RFA, or are exported under a restricted shipment licence (which allows the export of such woodchips in one shipment from a region not yet covered by an RFA). Exports of plantation-sourced material, including both native and exotic species, are not subject to any Commonwealth export controls, provided they meet environmental and heritage protection requirements set up under state codes of practice. Queensland is the only state that has not submitted its code of practice to the Commonwealth Government.
28. Measured by the effective rate of assistance (ERA), forestry receives a relatively high level of assistance compared with other agricultural industries, 5.3% in 2003/04 (4.1% on average for the primary industry).32 However, current forestry assistance programmes are concentrated in one state,
29 The AWB Ltd was allegedly involved in the United Nations Oil for Food scandal. Viewed at: http://www.unoilforfoodinquiry.gov.au [24 November 2006].
30 Productivity Commission (2005c).31 DAFF online information. Viewed at: http://www.daff.gov.au/forestry.32 Productivity Commission (2004). The PC report also stated that the around 5% effective rate of
assistance "plays a relatively minor role in the forestry industry compared with other government measures. The key government measures affecting forestry relate to resource management issues, such as the pricing of
WT/TPR/S/178 Trade Policy ReviewPage 80
Tasmania.33 All other programmes, such as the Eden Regional Adjustment Package, and the forest industry structural adjustment programme (NSW and Victoria), have been terminated.
(vii) Fisheries
29. There has been little change in the fisheries legislation or policy framework during the review period. Management of fisheries, both commercial and recreational, is shared between the Commonwealth and state governments. The Commonwealth is responsible for the management of fisheries outside the three nautical mile territorial waters, while the states are responsible for all other waters adjacent.34
30. At the Commonwealth level, management of the industry is undertaken by the Australian Fisheries Management Authority (AFMA), which is a statutory authority established under the Fisheries Administration Act 1991, and funded jointly by industry and the Commonwealth Government. The Minister of Agriculture, Fisheries and Forestry and the DAFF are responsible for the development of fisheries policy.
31. For certain types of fisheries, statutory fishing rights (SFRs) are required and granted by the AFMA.35 In particular, as defined in the Fisheries Management Act 1991, foreign-flagged vessels cannot obtain SFRs. SFRs for Australian vessels can be transferred or leased (but not to foreign-flagged vessels). Commonwealth fishing permits, which allow commercial fishing for Commonwealth managed species, and are transferable, cannot be granted to foreign-flagged vessels.
32. Currently, there are about 9,000 commercial fishing boats operating in Australia. The industry employs around 21,000 people in catching and harvesting, 4,000 in processing, and another 6,000 in the aquaculture sector. In recent years there has been growing concern about overfishing in Commonwealth-managed fisheries. Accordingly, in November 2005 the Government announced the "Securing Fishing Future" package, with a fund of $A 220 million; the package is aimed at reducing the high level of overcapacity in fisheries that are overfished, or at significant risk of overfishing in the future.36 Also, the AFMA announced substantial reductions in total allowable catch levels in a number of fisheries, applicable from 2006.
(2) MINING, ELECTRICITY, AND WATER
(i) Mining
33. Australia has an abundant supply of natural resources and is a major exporter of mining and quarrying products. The mining sector has been one of the major driving forces behind Australia's
forests, and the use of quotas to control the harvesting rates to protect the resource stock. The assistance implications of these measures, whether positive or negative, were not captured in the Productivity Commission's estimates."
33 The programmes are: Tasmanian forestry industry development programme, Tasmanian country sawmills assistance programme, and Tasmanian softwood industry development programme.
34 The Offshore Constitutional Settlement (OCS) allows the Commonwealth and state governments to change this management arrangement.
35 These fisheries include southern bluefin tuna, northern prawn, Bass Strait central zone scallop, Heard Island and McDonald Islands, and southern and eastern scalefish, and shark (DAFF online information. Viewed at: http://www.afma.gov.au/industry/licensing/permits/default.htm [6 October 2006]).
36 DAFF (2006). In addition to $A 150 million for a one-off fishing business buyout, the package includes $A 70 million to, inter alia, offset the impact of reduced fishing activity on onshore businesses directly linked to the fishing industry, establish a fishing communities programme to generate new employment opportunities, and cover the AFMA's management cost.

Australia WT/TPR/S/178Page 81
recent economic growth. In 2005/06, mining and quarrying accounted for 7.5% of GDP, up from 5.3% of GDP in 2001/02. In 2005, the sector accounted for 48.4% of total merchandise exports (up from 40% in 2002) (Chart I.1). Owing to the global boom in mining commodities, Australia's terms of trade have increased by around 30% over the past three years. Business investment, especially in mining and related infrastructure, has been growing at double-digit rates.
34. Mineral and petroleum resources are owned either by the Commonwealth or state and territory governments. The Commonwealth and state governments have separate roles and responsibilities. While the Commonwealth Government sets up national policy, state and territory governments manage and allocate mineral and petroleum property rights, have primary responsibility for land administration, regulate environmental or occupational-health and safety-related issues, and collect royalties on the minerals produced.37 Commercial exploration and development is undertaken by the private sector.
35. The mining sector operates in a competitive market.38 There are no sector-specific restrictions on foreign investment, although, as for all sectors, prior approval or notification is required for investment above certain thresholds (Table II.2). The sector receives very little government assistance; in 2004/05, mining received 5% of total budgetary assistance, while manufacturing and services received 42% and 30%, respectively. Although mineral imports can enter Australia under several tariff concession schemes, such as the Enhanced Project By-Law Scheme, the Tariff Concession scheme, and the Tradex scheme, tariffs are already low, indicating a low level of tariff assistance: the effective rate of assistance (ERA) for mining was virtually zero in 2003/04.39
36. However, despite the strong global demand for mining commodities, exports have been allegedly held back by infrastructure bottlenecks, particularly reflected in the queuing of ships at some coal ports. To respond, the Government established an Exports and Infrastructure Taskforce in March 2005, to identify any infrastructure bottlenecks (physical or regulatory) that may impede exports. The Taskforce issued its report in May 2005, and concluded that there were capacity constraints at certain bulk ports in some parts of the country, but no infrastructure crisis, and that the greatest impediment to the development of Australia's infrastructure was the regulatory framework. Responding to the Taskforce's conclusions, the COAG agreed, in principle, to a "simple and consistent national system of regulation for ports and export-related infrastructure" as a key part of its new National Reform Agenda (section (5)(vi)(a)).40
(ii) Electricity
37. The National Electricity Market (NEM) was established in 1998 to break down barriers to inter- and intra-state competition, including dismantling state-owned monopolies and implementing a third-party access regime for transmission and distribution. As a result, a wholesale market has been established for electricity supply to retailers and end-users in New South Wales, Queensland, South Australia, Tasmania, Victoria, and the Australian Capital Territory41; it is managed by the National Electricity Market Management Company Limited (NEMMCO). Electricity prices remain low by international standards at both retail and wholesale levels.
37 Onshore minerals royalties are collected by the states and the Northern Territory governments. There is no common royalty regime, and a mix of specific, ad valorem, and profit-based royalties applies, averaging at 3.5% of the gross value of mineral production.
38 Banks (2003).39 Productivity Commission (2006e). 40 COAG (2006). 41 Tasmania joined the NEM in May 2005. Service providers in the Northern Territory and Western
Australia are not subject to the requirements of the NEM.

WT/TPR/S/178 Trade Policy ReviewPage 82
38. Currently, all market participants must register with the NEMMCO. Service providers intending to operate in the NEM are subject to the Electricity Rules, as well as state and territory licensing requirements. Foreign and domestic service providers are subject to the same licensing requirements; foreign providers are required to have an Australian outlet.42
39. While the NEMMCO is responsible for managing the dispatch of electricity from generators, transmission and distribution used to be handled by a network of service providers, which, until recently, had been regulated by various federal and state regulatory bodies. The COAG conducted a review of the electricity market in 2002 and identified various deficiencies, including confused governance arrangements, insufficient competition in electricity generation, overlaps in regulatory responsibility, and inflexible electricity price signals for residential customers. 43 Consequently, continued reform is required to address these concerns and to meet increasing demand for electricity.44
40. To simplify the regulatory framework for the transmission and distribution of electricity, on 1 July 2005, the Australian Energy Regulator (AER) became responsible for market surveillance and regulation enforcement. During its first two years of operation, the AER will gradually replace 13 electricity regulators and 8 gas regulators. It is anticipated that by the end of 2010, the AER will be the sole regulator. A Memorandum of Understanding was signed between the AER and NEMMCO, to establish cooperation and liaison. The AER is required to monitor and enforce compliance by NEMMCO with its obligations under the National Electricity Law and Rules, and the NEMMCO functions as the operator and administrator of the wholesale electricity market. On 1 July 2005, an Australian Energy Market Commission (AEMC) also commenced operation.45 An MOU was signed between the AER, the AEMC, and the ACCC. Under the MOU, the ACCC retains responsibility as regulator of competition matters, including price surveillance of electricity. The AEMC develops the National Electricity Rules under the new National Electricity Law, which was amended in June 2005.
(iii) Water
41. Australia has limited water resources; management and the administration of water pricing is the responsibility of state and territory governments. Structural reforms have been conducted for more than a decade to establish a system where water users pay the full cost of the infrastructure and services provided.
42. In 1994, the COAG agreed on a strategic framework for water reform, to improve the efficiency and effectiveness of Australia's water supply and wastewater industries. 46 Progress thus far appears to have been concentrated in urban areas, where, for example, consumption-based pricing had been introduced to discourage wasteful water use, and full cost recovery by water service providers has been largely achieved; this could help to ensure appropriate investment in infrastructure. Institutions have also been established in urban areas to encourage efficiency in water provision.47
42 A foreign provider must be registered as a company with the Australian Securities and Investment Commission, and have acquired an Australian business number (ABN) through the Australian Taxation Office.
43 COAG (2002).44 It is estimated by the Australian Bureau of Agricultural and Resource Economics that by 2030,
electricity generation will need to grow by 73%, and gas demand will more than double.45 The AEMC is part of a reform package proposed by the Ministerial Council on Energy (MCE). The
package was endorsed by the COAG in 2004. As part of the package, both the Commonwealth and states governments signed an Australian Energy Market Agreement (AEMA) in June 2004 (see Appendix A of COAG (2006) for the MCE reform agenda).
46 National Water Commission (2006).47 OECD (2005b).

Australia WT/TPR/S/178Page 83
43. It seems water has not been managed efficiently, particularly in rural areas. 48 Three quarters of Australian water is used for irrigation, of which, between 20% and 40% is lost due to leakage and evaporation from open channels.49 Accordingly, in June 2004 a National Water Initiative (NWI) was agreed between the Commonwealth and New South Wales, Queensland, South Australia, Victoria, the Australian Capital Territory, and the Northern Territory; Tasmania signed up to the NWI in June 2005, and Western Australia in 2006. This inter-government agreement sets the national water reform agenda for the next ten years and beyond.
44. The NWI intends to put in place a market framework for the management of water resources in urban and rural areas. For example, state governments agreed to establish water market and trading arrangements to facilitate the operation of efficient water markets and intra- and inter-state water trading, and to minimize transaction costs on water trade.50 The NWI also intends to establish a price mechanism, which could address the scarcity of water and environmental externalities. 51 As water is the property of the states and territories, the NWI also includes a commitment to return all currently over-allocated and over-used river and ground water systems to environmentally sustainable levels of extraction. In addition, a National Water Commission was established to facilitate the reform process under the NWI. An Australian Water Fund was set up in 2005, with funding of $A 2 billion over five years to ensure that investment is consistent with the NWI.
(3) MANUFACTURING
45. During the period under review, the share of manufacturing in GDP and employment fell, from 12.1% and 11.8%, respectively in 2001/02, to 11.0% and 10.6%, respectively in 2005/06 (Table I.2). Manufacturing's share in total merchandise exports and imports also declined, from 23.9% and 82.9% in 2002, to 20.5% and 79.9%, respectively, in 2005 (Chart I.1). Within manufacturing, there is significant variation in performance between activities; in particular, activities related to natural resources and being R&D intensive have been growing more rapidly, while textiles, clothing, and footwear (TCF) production fell.
46. Despite its declining share in GDP and total employment, manufacturing remains an important sector, and continues to receive the largest portion of budgetary assistance (39.4% in 2004/05)52, of which, 37.4% was allocated to the motor vehicle industry, and 11% to the TCF industry (Table IV.2). Assistance provided to manufacturing is not necessarily reflective of a desire to protect local industry53; for example, assistance for R&D is intended to compensate for under-investment in private R&D activities owing to market failure.
47. Border protection for manufacturing was reduced in 2005, and the average applied tariff in manufacturing (based on two-digit ISIC industry) fell from 4.8% in 2002 to 4.1% in 2006 (Chart III.2).54 However, the low average tends to conceal some high tariff rates, such as the compound duty applied to used or second-hand vehicles.
Table IV.2
48 OECD (2006b).49 OECD (2006b).50 Productivity Commission (2006c).51 Currently, water is supplied to agriculture much more cheaply than to households.52 Productivity Commission (2006e), Table 2.1.53 Productivity Commission (2003d), p. 211.54 Productivity Commission (2003d), p. 150. According to the PC, it is difficult to tell the net effect of
reduced border protection on affected industries. On the one hand, tariff reductions may reduce profitability of a specific industry (at least in the short run). On the other hand, reduced tariff protection may lead firms to eliminate inefficient practices, or reduce costs if they use the imports as business inputs.
WT/TPR/S/178 Trade Policy ReviewPage 84
Budgetary assistance to manufacturing, 2002-05
2002/03 2003/04 2004/05
Share in total budgetary assistance (%)Food, beverages, and tobacco 4.2 5.6 6.1Textiles, clothing, footwear, and leather 11.2 10.6 11.1Wood and paper products 2.8 2.8 2.8Printing, publishing, and recorded media 1.4 1.8 1.2Petroleum, coal, chemicals, and associated products 11.3 9.1 7.6Non-metallic mineral products 0.6 0.6 0.7Metal product manufacturing 8.6 9.4 7.8Motor vehicles and parts 37.2 36.7 37.4Other transport equipment 2.3 2.0 1.4Other machinery and equipment 8.6 7.2 7.9Other manufacturing 3.1 6.8 6.8Unallocated manufacturing 8.8 7.7 9.2Total outlays ($A million) 781.9 852.9 769.5Total tax expenditures ($A million) 1,077.8 1,063.5 1,023.0Total budgetary assistance ($A million) 1,859.8 1,916.4 1,792.5Share of total budgetary assistance in GDP (%) 0.2 0.2 0.2
Note: Figures may not add to total due to rounding.
Source: Productivity Commission (2006e), Trade & Assistance Review 2004/05, Annual Report Series 2004/05, April, Canberra, Table A.3.
(i) Textiles, clothing, and footwear
48. The effective rate of assistance (ERA) for the textiles, clothing, and footwear (TCF) industry was 24.2% in 2003/04, when the overall ERA for the manufacturing sector was 4.5%.55 Assistance has been provided through, for example, tariff protection, as well as significant budgetary assistance. The authorities state that assistance to the TCF industry is transitional, aimed at facilitating the industry to adjust to the reduced tariffs.
49. In 1997, the TCF industry reached an agreement with the Government, so that tariffs on TCF products would be kept at the 2000 level until 2005. On 1 January 2005, Australia unilaterally reduced its tariffs on TCF products: the simple average applied MFN tariff (based on ISIC two-digit level) declined from 12.0% in 2002, to 8.7% in 2005. No further tariff reduction will occur until 2010 and 2015. Despite the reduction, the tariff is still much higher than the overall MFN average (4.1%).
50. The TCF industry has continued to decline56; accounting for around 0.3% of GDP, employment in the industry fell from 64,000 in 2002 to 54,000 in 2006. To enable the industry to adjust to tariff reduction and the subsequently increased import competition, as well as technological change and shifts in household expenditure, government assistance has been provided, mainly through a strategic investment programme (SIP) introduced in 2000, and a post-2005 assistance package (of which the SIP is now a part). Assistance is also provided through an expanded overseas assembly provisions scheme, specific TCF policy by-laws, and market access initiatives.
55 Productivity Commission (2004), Table 2.4.56 Over the decade to 1999/00, the sector's turnover contracted by 16% and employment by 37%.
During the same period, productivity as measured by turnover per employee increased by almost 48%. Productivity Commission (2003c).

Australia WT/TPR/S/178Page 85
51. The TCF SIP programme was applied between 2000/01 and 2004/05. Capped at $A 700 million, government grants under the SIP were provided to eligible firms, based on investment, R&D related expenditure, or value-added activities; each firm's total benefit under the scheme in any given year was limited to 5% of their sales of eligible products in the previous year.57
The grants were managed by AusIndustry. Grants may also be provided to purchase state-of-the-art second-hand plant and equipment for restructuring by firms in TCF dependent communities, or for ancillary activities relating to restructuring initiatives in TCF dependent communities.
52. The SIP programme, however, had several features that could undermine its capacity to encourage investment by firms to promote their international competitiveness.58 The complexity of the scheme also imposed compliance costs on firms. Partly reflecting these concerns and the tariff reduction in 2005, as well as recommendations by the Productivity Commission, the Government announced a TCF post-2005 assistance package in November 2003. The package mainly contains a TCF post-2005 (SIP) scheme, under which $A 575 million is provided over a ten-year period for new TCF plant/building expenditure, as well as for R&D and product development. It also enables firms to receive grants higher than the previous maximum of 5% of their total eligible revenue. The package also contains a TCF small business programme, a TCF structural adjustment programme, and a product diversification scheme, all covering a period of ten years from 1 July 2005.59 The product diversification scheme does not provide grants to eligible firms; instead, duty credits are allocated and may be used to offset the duty at the time of importation.60
53. The expanded overseas assembly provisions scheme (EOAP) allows importers of TCF products assembled from mainly Australian fabric and/or leather to pay tariffs on the cost of the overseas processing and content only. By encouraging the lower skilled, labour-intensive assembly activities to move abroad, the EOAP intends to promote the higher value-added production in Australia.61 The EOAP scheme was extended to 2010.
54. Most TCF products are not eligible for duty concessions under the tariff concession system (TCS) (Chapter III(2)(ii)(b)).62 However, around 20 policy by-laws enable specified TCF goods (mainly blended cotton and blended synthetic lightweight fabrics) to be imported duty free. Unlike the TCS system, under which imports may enter Australia duty free if no substitutable goods were
57 Of the total $A 700 million, $A 22 million had been used for the Regional Assistance Programme. Thus, the remaining $A 678 million was available for distribution.
58 For example, firms did not need to increase their expenditure levels to receive a SIP grant. Also, firms made their application for support after their spending had taken place; thus, uncertainties about the outcome of the application at the time of making spending decisions could discourage or delay some investment. In addition, there was a minimum spending threshold under the programme, which indicated that small businesses were excluded from this support.
59 WTO document G/SCM/N/123/AUS/Rev.1, 23 Sept 2005. Under the TCF small business programme (capped at $A 25 million, and $A 50,000 for individual projects), grants are provided to improve the business climate for small firms. The TCF structural adjustment programme is targeted at supporting industry consolidation and labour market adjustment. Under the programme, $A 50 million is available to: assist employees who have to look for alternative employment; improve competitiveness of firms; and assist communities to adjust to TCF industry consolidation.
60 AusIndustry Product Diversification Scheme, Terms and Conditions. Viewed at: http://www.industry.gov.au/assets/documents/itrinternet/PDSTermsConditionsvr2forwebNovember200520060104103911.pdf [26 September 2006].
61 To qualify for the scheme, an importer of the assembled goods must also be the exporter of the fabric and/or leather used in the assembly; there cannot be any transfer of ownership of the materials or the assembled goods between the time of export from, and import into, Australia; and the value of non-Australian fabric and/or leather must be no greater than 20% of the total material value used to assemble the product.
62 A few TCF products, such as specialist footwear, incontinence pants, and rubber gloves, may be imported duty free under the TCS.
WT/TPR/S/178 Trade Policy ReviewPage 86
being produced domestically when a tariff concession order was made, the policy by-laws grant duty-free entry to imports even if there was domestic production of these goods. TCF products may also enter Australia duty free, if they originate in LDCs, Forum Island countries, Papua New Guinea, New Zealand, or Singapore (Table III.2).
(i) Automotive
55. The automotive industry accounted for 5.7% of the total value added in manufacturing and about 0.6% of GDP in 2005.63 Employment, concentrated in South Australia and Victoria, was over 81,000 persons in November 2005, accounting for around 7% of employment in manufacturing and 0.8% of total employment. These figures suggest that the automotive industry's labour productivity is about 25% lower than in the remainder of the economy, which indicates that labour productivity in the economy as a whole could be increased by shifting resources from this industry to other sectors. 64
With over one third of domestically made vehicles exported, the industry is one of Australia's largest exporters. At the same time, around 75% of vehicles sold in Australia are imported. It is also highly open to foreign investment, with all four vehicle manufacturers in Australia subsidiaries of multinational corporations.65
56. Nonetheless, the automotive industry receives the largest portion of budgetary assistance in the manufacturing sector. The ERA for PMV reached 10.6% in 2003/04, compared with 4.5% for manufacturing as a whole. The simple average applied MFN tariff on motor vehicles, if based on ISIC four-digit industry, fell from 18.8% to 17.2% in 2005; like the TCF industry, the tariff is still much higher than the MFN average for the manufacturing sector, and is not expected to be reduced until 2010. The authorities indicate that Australia's effective vehicle tariff, based on actual trade data and incorporating bilateral tariff preferences and Tradex allowances, is 6.9%.
57. Used or second-hand vehicles (eight tariff lines) are subject to a compound rate of 10% (15% in 2002) plus $A 12,000 per unit, the average ad valorem equivalent (AVE) of which is 206.8% in 2006 (Chapter III(2)(ii)(a)). The $A 12,000 does not need to be paid for used "specialist and enthusiast" vehicles imported under a registered automotive workshop (RAW) scheme: with approval from the Department of Transport and Regional Services (DOTARS), a RAW may import up to 130 vehicles per category every year of used vehicles that meet safety and emission standards. 66 The authorities state that, since the commencement of the RAW scheme in April 2002, the tariff on second-hand vehicles has not been applied. This, nonetheless, suggests that the tariff is prohibitive on imports of used vehicles other than "specialist and enthusiast" ones.
58. All imported new vehicles, as well as domestically produced vehicles, must be approved by the DOTARS, under a full volume scheme, or a low volume scheme. Under the full volume scheme,
63 APEC online information, Automotive Dialogue, Automotive Profile – Australia. Viewed at: http://www.apec.org/apec/business_resources/industry_dialogues/automotive_dialogue.html#top.
64 The authorities disagree with the argument here on automotive industry labour productivity, and suggest that this requires more detailed analysis of, inter alia, definitional issues.
65 The automotive industry comprises four vehicle manufacturers: Ford, Holden, Mitsubishi, and Toyota. There are also more than 230 component, tool, design and engineering firms, many of which are also subsidiaries of MNCs (DITR online information).
66 The authorities state that a registered automotive workshop is entitled to plate and supply up to 100 vehicles per year in each vehicle category. An additional 30 vehicles (i.e. total 130) can be imported in a 12-month period to allow for handling and processing, as well as any vehicles that are not suitable for plating (such as vehicles damaged or cannot be shown to meet the relevant requirements). Other categories of used passenger motor vehicles that are not subject to the $12,000 duty are: used passenger motor vehicle imported by an Australian citizen or permanent resident who has owned and used the vehicle overseas; vehicles for evaluation and research, or type-test purposes; and vehicles for motor racing.
Australia WT/TPR/S/178Page 87
the vehicle manufacturer is allowed to conduct compliance tests on a representative vehicle or batch of vehicles, to examine the vehicles' compliance with the Australian Design Rules (ADRs). Vehicles meeting ADR type requirements can be imported in unlimited numbers, and both the imported and domestically produced vehicles can be sold on the domestic market. The low volume scheme, specified for new "specialist and enthusiast" vehicles, allows the import or sale of new vehicles without destructive or expensive tests. Instead, up to 25 or 100 vehicles (depending on the vehicle category) may be imported or sold, provided that evidence can be shown that they comply with related ADRs.
59. On 13 May 2005, the Government tightened policy requiring imports of vehicles built before 1989 to comply with safety and emission standards before importation.67
60. The Automotive Competitiveness and Investment Scheme (ACIS) was introduced in 2001. With a view to complementing tariff reductions by promoting firms' competitiveness, the ACIS is available for eligible participants in the form of quarterly duty credits, which can be used to discharge customs duty on subsequent eligible automotive imports, or sold or transferred.68 No participant may receive benefits exceeding 5% of their annual sales in the preceding year.69
61. Changes have been made to the ACIS scheme since its adoption in 2001. In December 2002, the Government announced the extension of ACIS to 2015. Thus, the scheme now has three stages: in the first stage (2001-05), assistance was capped at $A 2 billion; the cap is to be maintained for the second stage (2006-10), but reduced to $A 1 billion in the third stage (2011-15). The second stage also includes an $A 150 million motor vehicle producer R&D scheme. In addition to the capped assistance, motor vehicle producers are also able to claim uncapped assistance in the form of duty credits (to be terminated in 2015), equal to 15% of the production value for Australian and New Zealand markets multiplied by the relevant tariff rate.
62. Procurement of motor vehicles is exempted from Mandatory Procurement Procedures of the Commonwealth Procurement Guidelines (Chapter III(2)(viii)). The Commonwealth "vehicle fleet arrangements" provide that vehicles purchased by government agencies must be made in Australia by producers that satisfy the eligibility criteria under the ACIS. Imported vehicles with an engine capacity of less than 2,000cc may be purchased if marketed by automobile companies with a local presence.70 As government fleet purchases accounted for 21.7% of domestic demand for locally
67 Before May 2005, vehicles 15 or more years old could be imported without being subject to safety and emission requirements; this exemption was in place to allow imports of classic and historic cars (DOTARS media release, 13 May 2005).
68 Eligibility criteria are: for motor vehicle producers, an annual output of at least 30,000 motor vehicles or 30,000 engines; for component producers, production of at least $A 500,000 of one kind of automotive component annually for use as original equipment in at least 30,000 motor vehicles or 30,000 engines, or production of at least $A 500,000 of total original equipment components annually, where this represents at least 50% of the producer's total production value; for automotive machine tool producers, production of at least $A 500,000 of automotive tools annually, where at least 50% of that production is used to produce original equipment; for automotive service providers, at least $A 500,000 of automotive services annually, where at least 50% of total services relate to the production of motor vehicles or original equipment.
69 Qualifying motor vehicle producers may claim an import duty credit equal to 25% of the value of production of motor vehicles, engines, and engine components, multiplied by the relevant tariff rate, and 10% of the value of new investment in plant and equipment. Producers of automotive components and automotive machine tools, and providers of automotive services may claim an import duty credit equal to 25% of the value of new investment in plant and equipment, and 45% of the value of investment in R&D. Where motor vehicle producers also produce automotive components (other than engines and engine components), tools, or provide automotive services to a third party, a 25% investment incentive and a 45% R&D incentive may be provided.
70 Productivity Commission (2002a).

WT/TPR/S/178 Trade Policy ReviewPage 88
produced vehicles in 2005, they appear to be an important source of assistance to the domestic automotive industry.
63. Australia continues to provide assistance in the form of direct financial support to automotive producers. For example, a one-off grant of $A 50 million was provided to Ford Motors in March 2006. The luxury car tax (LCT), levied at 25% on the GST-exclusive value that exceeds a threshold, is also a source of assistance to local producers.71 Although the authorities state that the LCT applies to both imported and domestically produced motor vehicles, 97% of LCT revenue came from imported luxury vehicles in 2004, suggesting that the LCT tends to discriminate against imported luxury cars, which usually have higher prices than domestically produced luxury vehicles, partly as a result of relatively high tariffs (Chapter III(2)(iii)).72
(ii) Pharmaceuticals
64. The pharmaceutical industry is one of the most R&D intensive industries in Australia. It is also an integral part of the global industry, as a significant part of pharmaceutical activities in Australia is undertaken by subsidiaries of multinational corporations.
65. A purchasing agreement for drugs, the Pharmaceutical Benefits Scheme (PBS), covers around 75% of all pharmaceuticals prescribed in Australia (outside hospitals).73 Under the PBS, the Government negotiates prices of drugs with suppliers based on recommendations by the Pharmaceutical Benefits Pricing Authority (PBPA). Based on the agreed price, the PBPA negotiates a retail price with retailers. As the Government is the monopsony buyer, domestic prices for drugs are often low by international standards.74 According to claims by many pharmaceutical suppliers, this low price has affected the development of Australia's pharmaceutical industry.75
66. Responding to these concerns, the Government provided industry assistance through the Pharmaceutical Industry Investment Programme (PIIP), in order to partially compensate pharmaceutical firms by paying higher prices on certain products supplied under the PBS. The PIIP's funding was set at $A 300 million over five years (from July 1999 to June 2004).
67. However, an evaluation of the PIIP scheme by the Productivity Commission in 2003 concluded that, first, the rationale for providing assistance to the pharmaceutical industry based on price suppression was much less convincing than claimed by many pharmaceutical enterprises76; and second, the cost of the programme exceeded the benefits it generated, although the R&D component had a positive net effect.77 In addition, a foreign enterprise was not eligible for the R&D tax concession if the intellectual property (IP) was not Australian-owned, which contradicted the rationale for promoting R&D for its spillover effects in Australia.78
71 Productivity Commission (2002b). 72 The authorities maintain that the LCT does not discriminate against imported vehicles, as it applies at
the same rate to both Australian-made and imported vehicles, and the majority of vehicles are valued below the LCT threshold.
73 Productivity Commission (2001). The authorities state that the PBS covers 93% of all pharmaceuticals prescribed in Australia.
74 Productivity Commission (2001).75 Productivity Commission (2003a). 76 The reasons are: although low price tends to reduce profit, this could be partly offset by increased
sales, which reflect the subsidies provided to consumers when purchasing drugs listed on the PBS. In addition, empirical evidence suggests that low price does not seem to be related to low pharmaceutical activities.
77 Productivity Commission (2003a). 78 Productivity Commission (2003a).
Australia WT/TPR/S/178Page 89
68. Thus, when the PIIP scheme expired in 2004, the Government introduced a Pharmaceuticals Partnerships Programme (P3), aimed at increasing expenditures on high quality pharmaceutical R&D: $A 150 million is to be provided over five years (between July 2004 and June 2009). In addition, IP can now be owned offshore. Under the programme, once a grant is awarded, the company can obtain 30% or 50% of its annual increase in eligible R&D expenditure above its base level expenditure.79
However, the overall grant obtained under the P3 is capped at $A 10 million.
(4) SERVICES
(i) Overview
69. The services sector dominates the Australian economy. In 2005/06, it accounted for 68.9% of GDP and 75.0% of total employment (Table I.2). Real estate and business, wholesale and retail trade, ownership of dwellings, and transport, storage, and communications services have been the leading services activities, in terms of their shares in GDP; other important activities were finance and insurance, health, and community services.
70. In 2004, Australia's exports of services accounted for 1.1% of world services exports, and imports accounted for 1.2% of world services imports. Trade in services is an important component of Australia's total trade, with services exports accounting for 21.4% of total exports in 2005/06. Australia's services trade continued to grow in 2005/06: exports rose by 5.7%, mainly driven by travel; and imports rose by 4.6%, as strong domestic demand in connection with continued favourable exchange rates for Australians travelling abroad resulted in growth in imports of transportation and travel services. Services trade recorded a surplus of $A 828 million, up from a surplus of $A 380 million in 2004/05.
71. The estimated level of support provided to the services sector through direct financial assistance, tax expenditures, and funding to public-sector institutions has been increasing (Table AIV.3); budgetary outlays aimed at encouraging investment, R&D, and exports have been allocated mainly to property and business services, finance and insurance, cultural and recreational services, and communication services, accounting for 21%, 16%, 14.3%, and 10.7% of total budgetary assistance, respectively.
(ii) Commitments under the General Agreement on Trade in Services
72. Australia's Schedule of Specific Commitments under the General Agreement on Trade in Services has remained unchanged since 2002. Its existing GATS commitments cover most services sectors, with the exception of audiovisual, postal-courier and rail transport services. Australia submitted a revised services offer in May 2005, which proposes improvements to its existing schedule of commitments in areas such as mode 4, professional services, telecommunications, environmental
79 To obtain the grant, any pharmaceutical company that has undertaken R&D activities during the past three years, and proposes to increase its R&D expenditure for the following years, can apply to participate in the programme. When applying for the grant, companies need to provide details of all expenditure on eligible pharmaceuticals R&D activities in Australia or overseas, or both, for the three years prior to the application. The average of the three years' R&D expenditure is defined as the base level. The P3 programme has three rounds; round 3 (1 July 2007 to 30 June 2009) was launched in August 2006. In rounds 1 and 2, grants were provided as 30% of the additional R&D expenditure above the base level. In addition, in both round 1 and 2, grants were capped at $A 100,000 per year; this cap is to be increased to $A 200,000 per year in round 3, which also provides 50% of the additional R&D expenditure above the base level to eligible firms.
WT/TPR/S/178 Trade Policy ReviewPage 90
services, transportation and logistics services.80 Australia considers its active participation in the GATS negotiations important in delivering export opportunities for its service providers.81
73. During the period under review, Australia made two communications to the WTO Working Party on Domestic Regulation, covering professional regulations, as well as development of disciplines on domestic regulations for the legal and engineering sectors.82 Australia is also a very active participant in the negotiations, and has submitted various communications to the Special Session of the Council for Trade in Services.83
(iii) Regional agreements on services
74. Australia's regional trade agreements (RTAs) with New Zealand, Singapore, Thailand, and the United States all include provisions on services (Chapter II(6)(ii)(b)). Under the Australia–New Zealand Closer Economic Relations Trade Agreement (ANZCERTA), the negative "inscription list" of the Protocol on Trade in Services, aimed at ensuring national treatment, remains unchanged since the previous Review.84 Currently, Australia's "inscription list" includes air services, coastal shipping, broadcasting and television, third-party insurance, and certain postal services.85
75. The Singapore–Australia Free Trade Agreement (SAFTA) and the Australia–United States Free Trade Agreement (AUSFTA) both use a negative-list approach, whereby all services are in principle liberalized, with reservations for non-conforming measures contained in annexes to the agreements. In addition, Australia has undertaken, especially in its agreement with the United States, commitments that go beyond not only its GATS commitments, but also its revised services offer, in areas such as financial, legal, travel agencies/tour operator services.
76. By contrast, the Thailand–Australia Free Trade Agreement (TAFTA) takes a positive list approach to scheduling commitments on services. The commitments undertaken by Australia tend not to go beyond GATS, except for e-commerce, and mode 4 (movement of natural persons) where Australia provides, for example, for the temporary entry of Thai contractual service suppliers for up to three years without labour market testing. Nevertheless, TAFTA provides for further negotiations on market access in services and investment three years after its entry into force.
(iv) Financial services
77. The contribution of financial services to GDP was 7.8% in 2005/06, up from 7.5% in 2001/02 (Table I.2). Australia's financial services sector is based on three main institutional groups: authorized deposit-taking institutions (ADIs), which include banks, building societies, and credit unions; non-ADI financial intermediaries, including money market corporations, finance companies,
80 WTO document TN/S/O/AUS/Rev.1, 31 May 2005; and DFAT online information. Viewed at: http://www.dfat.gov.au/trade/wto_public_discussion_paper_0905.html [02/March 2006]. These offers are non-biding, and can be amended or withdrawn any time during the negotiations.
81 DFAT online information. Viewed at: http://www.dfat.gov.au/trade/negotiations/services/australias_ trade_in_services.html [20 June 2006].
82 WTO documents S/WPDR/W/28, 22 June 2004; and S/WPDR/W/34, 6 September 2005. 83 WTO documents TN/S/W/43, 8 June 2005, TN/S/W48, 30 June 2005, TN/S/W/50, 1 July 2005,
TN/S/W/53, 30 Sept 2005.84DAFT online information. Viewed at: http://www.dfat.gov.au/geo/new_zealand/anz_cer/
anz_cer.html [20 June 2006].85 DAFT online information. Viewed at: http://www.dfat.gov.au/geo/new_zealand/anz_cer/
annex_990309.html [20 June 2006].

Australia WT/TPR/S/178Page 91
and securitization vehicles; and funds managers and insurers, including life and general insurance companies, superannuation and approved deposit funds (ADFs) (Table IV.3).86
Table IV.3Structure of the financial system assets, 2002-05(Per cent and $A billion)
Main supervisor/ regulator
June 2002 June 2003 June 2004 June 2005
Total ($A trillion) 2.1 2.2 2.5 2.8(Per cent of total)
Banking sectorReserve Bank (RBA) 2.8 3.0 3.0 3.1Other banks APRA 46.2 47.8 49.4 48.4
Other authorized deposit-taking institutions (ADIs)
Permanent building societies APRA 0.6 0.6 0.6 0.6Credit unions APRA 1.2 1.3 1.2 1.2
Registered financial corporations (RFCs)Money market corporations ASIC 4.2 4.4 2.7 2.8Finance companies ASIC 4.3 3.6 3.0 3.1
Life offices and superannuation fundsLife insurance offices APRA 8.6 7.4 6.9 6.7Superannuation funds APRA 14.3 14.1 15.0 15.9
Other managed fundCash management trusts ASIC 1.6 1.3 1.3 1.3Common funds State authorities 0.4 0.4 0.4 0.3Friendly societies APRA 0.3 0.2 0.2 0.2Public unit trusts ASIC 6.4 6.1 6.2 6.4
Other financial institutionsGeneral insurance offices APRA 3.8 3.9 3.7 3.4Securitization vehicles ASIC 5.4 5.9 6.5 6.6
Source: Reserve Bank of Australia (undated), Bulletin Statistical Tables, Table B.1. Viewed at: http://www.rba.gov.au/Statistics/Bulletin/B01hist.xls [19 June 2006].
78. The banking sector remains Australia's largest holder of financial assets; with an increasing share in total financial assets, it accounts for almost half of the total assets of the financial system. In addition, the importance of credit unions, building societies, finance companies, and money market corporations has fallen during the review period; the authorities state that these institutions grew strongly in earlier decades partly as a result of strict regulation in the banking sector.
79. The institutions that supervise the financial system remain the same. The Reserve Bank of Australia (RBA), Australia's central bank, is responsible not only for monetary policy, but also for maintaining financial stability and promoting the safety and efficiency of the payment system. The Australian Prudential Regulation Authority (APRA) is the prudential regulator of the financial services industry. It oversees banks, credit unions, building societies, general insurance and reinsurance companies, life insurance companies, friendly societies, and most members of the superannuation industry.87 Established on 1 July 1998, APRA is funded largely by the industries that
86 RBA (2006).87 On 1 July 2002, the Financial Sector (Collection of Data) Act 2001 came into effect, and repealed the
Financial Corporations Act 1974. Corporations that were previously registered under the Financial Corporations Act are known collectively as "Registered Financial Corporations" (RFCs). Under the Financial Sector (Collection of Data) Act 2001, the registration and categorization of these RFCs became the responsibility of APRA. The change was made mainly to facilitate the collection of statistical data, not to

WT/TPR/S/178 Trade Policy ReviewPage 92
it supervises.88 The Australian Securities & Investments Commission (ASIC) assumes responsibility for market integrity and consumer protection across the financial system, and supervises non-ADI financial intermediaries, public unit trusts, and cash management trusts.
(a) Banking
80. Banks play a central role in the financial system, and their share in total financial assets increased from 40% in 1985 to 48.4% in 2005.89 The expansion of banks reflects several factors, including deregulation of the banking sector, the booming housing market, and the conversion of a number of building societies into banks.
81. Currently, there are 53 banks operating in Australia, 14 of which are predominantly Australian owned; there are no government-owned banks.90 The market is dominated by four major nation-wide banks, accounting for about two thirds of total banking assets.91 There are also 39 foreign-owned banks, accounting for 20% of domestic banking assets. Eleven of these operate as locally incorporated subsidiaries, and the remaining 28 are branches.
82. A foreign bank is not allowed to raise deposit funds or undertake business in Australia, unless authorized by the APRA; it may, however, raise funds in Australia through issuing debt securities, on the condition that those securities are offered or traded in parcels of not less than $A 500,000. Foreign banks may operate in Australia through locally incorporated subsidiaries and/or authorized branches; although branches are not subject to minimum capital requirements, they are not permitted to accept initial deposits of less than $A 250,000 from Australian residents and non-corporate institutions.92
83. Foreign investment in the banking sector needs to be consistent with the Banking Act 1959, the Financial Sector (Shareholdings) Act 1998 (FSSA), and other provisions, including prudential requirements. The FSSA specifies that financial sector companies are subject to a 15% shareholding limit, although the Treasurer may approve a higher percentage on "national interest" grounds. 93 Any proposed foreign takeover or acquisition of an Australian bank is considered on a case-by-case basis, and must be approved by the APRA. Under the AUSFTA, acquisition of interests by U.S. investors in financial sector companies, as defined by the FSSA, are exempt from the notification requirements of the Foreign Acquisition and Takeovers Act 1975 (FATA); however, the FSSA and prudential regulations continue to apply (Table II.2).
84. In May 2006, APRA released the revised prudential standards and guidance notes, reflecting the adoption of International Financial Reporting Standards (IFRS) by authorized deposit-taking institutions (ADIs). Under the revised standards, the definition of capital instruments eligible for Tier 1 capital from Australian accounting standards is in line with international practices. The
empower APRA to supervise the activities of the RFCs (APRA online information. Viewed at: http://www.apra.gov.au/rfc/ [21 June 2006]).
88 APRA online information. Viewed at: http://www.apra.gov.au/aboutapra/ [21 June 2006].89 RBA (2006), p.49.
90 ? In Australia, Commonwealth owned entities that may conduct financial operations are guaranteed by the Commonwealth Government. Although the Commonwealth sold its shareholdings in the Commonwealth Bank of Australia (CBA) in 1996, a transitional Commonwealth guarantee has been provided for all of the liabilities of the CBA. The length of the guarantee depends on the characteristic of the liability (WTO document TN/S/O/AUS/Rev.1, 31 May 2005).
91 The four largest banks are ANZ Banking Group, Commonwealth Bank of Australia, National Australia Bank, and Westpac Banking Corporation.
92 WTO document TN/S/O/AUS/Rev.1, 31 May 2005.93 Financial Sector (Shareholdings) Act 1998, Part 2, Article 8.

Australia WT/TPR/S/178Page 93
assessment of securitized assets for capital adequacy purposes was also revised. The revised prudential standards and guidance apply to all ADIs from 1 July 2006.94
85. The domestic interest spread among major banks has continued to fall during the period under review, from 2.7 percentage points in 2002 to 2.1 percentage points in 2005, possibly reflecting increased competition in the sector (Chart IV.1).
2.0
2.2
2.4
2.6
2.8
3.0
3.2
3.4
3.6
3.8
4.0
1996 1997 1998 1999 2000 2001 2002 2003 2004 2005
Per cent
Chart IV.1Major banks' domestic interest spreada, 1996-05
a
Source :
Average interest rate received less average interest rate paid.
Information provided by the Australian authorities.
(a) Insurance
86. On 30 June 2006 there were 35 life insurance companies operating in Australia, with assets worth $A 226.5 billion and receiving $A 40.1 billion in premium income for 2005/06. The life insurance sector is relatively concentrated; as at 31 December 2005, the top three groups accounted for 60% of total industry assets, and the top ten represented 92% of total assets. 95 Foreign-owned companies accounted for 29% of total life insurance assets.
87. Life insurance companies are supervised by APRA under the Life Insurance Act 1995. Australia has no public life insurers. Superannuation business has the largest share of life insurance companies' assets, accounting for 89% as at 30 June 2006, and around 90% of premiums in 2005/06. Around 22% of all superannuation assets are held in life insurance policies as at 30 June 2006.
94 APRA media release on 31 May 2006. Viewed at: http://www.apra.gov.au/media-releases/06_30.cfm [21 June 2006], and http://www.apra.gov.au/ADI/ADI-Prudential-Standards-for-1-July-2006.cfm [20 June 2006].
95 APRA online information. Viewed at: http://www.apra.gov.au/Statistics/Life-Insurance-Market-Statistics.cfm [21 June 2006].
WT/TPR/S/178 Trade Policy ReviewPage 94
88. As at December 2005, there were 133 private general insurers in Australia, of which 112 are direct insurers and 21 are reinsurers. They are prudentially supervised by APRA under the Insurance Act 1973. The general insurance sector is also highly concentrated, with the top three groups accounting for 45% of total industry assets, and the top ten representing 61% of total assets.96 There are also 14 public general insurers in Australia: not subject to the Insurance Act nor regulated by APRA, they are regulated by state level legislation.
89. Non-resident life insurers must be subsidiaries of foreign companies.97 Australia's GATS commitments also specify that sub-national guarantees may be provided by some state and territory insurance offices.98
90. APRA is strengthening its prudential requirements for general insurance companies, with a view to providing a clearer picture of reinsurance contracts. Under the new requirements, reinsurance arrangements must be disclosed to APRA annually, and prior approval must be sought for limited risk transfer arrangements (financial reinsurance). From 1 October 2006, general insurers supervised by the APRA must comply with the new requirements, to provide a business plan confirming their ability to meet future capital requirements, and an annual declaration of financial information by senior management.
(v) Communications
(a) Telecommunications
91. In 2004/05, total income for the telecommunications services industry was $A 35.8 billion; the largest income sources were the provision of basic telephony (32%), and mobile and paging (26%). Telecommunications enterprises employing more than 100 persons accounted for 90% of total employment and 94% of total income.99
92. In 2005, the Australian Communications Authority (ACA) was merged with the Australian Broadcasting Authority (ABA) to establish the Australian Communications and Media Authority (ACMA). The ACMA's functions include regulating telecommunications and radiocommunications, providing information on consumer issues, and issuing licences to telecommunications carriers. Carriers must be individually licensed. There are no restrictions on the number of carrier licences, and any corporation, partnership corporation, or public body may apply for a licence. Conditions of a licence obtained under the Telecommunications Act 1997 include contributing to subsidies paid to universal service providers in fulfilling the universal service obligation, and complying with the telecommunications access regime and related access obligations, as applicable. 100 On 23 September 2005, the requirement to provide an industry development plan was discontinued.101
93. In addition to carriers, service providers (carriage service providers, and content service providers) are regulated under the Telecommunications Act 1997.102 Carriage service providers must register with the Telecommunications Industry Ombudsman (TIO) scheme, which provides a free and
96 APRA online information. Viewed at: http://www.apra.gov.au/Statistics/loader.cfm?url=/commonspot/security/getfile.cfm&PageID=12009 [3 August 2006].
97 WTO document TN/S/O/AUS/Rev.1, 31 May 2005, and Life Insurance Act 1995, Section 16ZE.98 WTO document TN/S/O/AUS/Rev.1, 31 May 2005.99 ABS document 8126.0, "Information and Communication Technology Australia", September 2006.100 APEC (2004), p. 100. While the application requirements are relatively liberal, the Minister for
Communications, Information Technology and the Arts can impose further licence conditions. The charge for applying for a carrier licence was reduced from $A 10,000 to $A 2,200, and the fixed component of annual carrier licence charges reduced from $A 10,000 to $A 1,000, by the ACMA.
101 ACMA (2006), p. 10.
Australia WT/TPR/S/178Page 95
independent alternative dispute resolution scheme for small business and residential consumers of telecommunications services.
94. The universal service regime consists of the universal service obligation (USO) and the digital data service obligation (DDSO). Telstra Corporation Ltd (Telstra) is the universal service provider, although any other service provider can be so designated.103 Telstra receives a USO and DDSO subsidy, which is determined by the Communications Minister on the advice of ACMA. The subsidy is funded by a levy on all carriers, including Telstra, in proportion to their eligible telecommunications revenue.104
95. Foreign ownership in the industry, apart from Telstra, is subject to the general provisions of the Foreign Acquisitions and Takeover Act 1975. Foreign ownership of Telstra of up to 35% in aggregate, and up to 5% individually, is permitted. Following the Telstra 3 share offer in October and November 2006, Commonwealth Government ownership of Telstra was reduced from 51.8% to 17%.105
96. While Telstra's market share has continued to fall in the face of competition, it remains a major player in the sector. In 2004/05, Telstra’s overall market share by revenue was approximately 75%, down 3.4 percentage points from 2001/02.106 The authorities indicate that, as at 30 June 2006, Telstra accounted for 71% of the PSTN (public switched telephone network) market, 43% of the mobile phone market by subscribers, and 44% of the broadband market by subscribers. Since 1989, Telstra has been subject to price control arrangements aimed at stimulating competitive outcomes, by a requirement to pass on productivity gains to consumers through lower prices for services such as line rentals, local, long-distance, international, and fixed to mobile call services. In April 2004, the Minister for Communications, Information Technology and the Arts designated the ACCC to review the operation of Telstra's retail price controls, leading to new price control arrangements on Telstra commencing on 1 January 2006, and remaining in effect until 30 June 2009. In 2004/05, the overall price paid by consumers for telecommunications services fell by 6.6% from the previous year.107
97. Competition in the telecommunications market has been supported by the national access regime (Chapter III(4)(iii)(a)), contained in the Trade Practices Act 1974. The telecommunications competition framework was refined by the Telecommunications Competition Act passed in 2002, with a view to, inter alia: speeding up access to core telecommunication services; facilitating investment in new infrastructure; and building up a more transparent market. In September 2005, the Parliament passed another package of further regulatory adjustments to the telecommunications regime, leading up to the divestiture of the Government's remaining stake in Telstra (paragraph 95).
102 Carriers are companies that own telecommunications network units (basically transmission infrastructure). Among service providers, carriage service providers supply services using network units provided by carriers, and provide, for example, phone or internet access services. Content service providers provide, for example, pay TV services.
103 Telstra is required by the USO to provide standard telephone services, public payphones and prescribed carriage services to all residents of Australia on an equitable basis, wherever they reside or carry on business. The DDSO requires Telstra to provide "reasonable and equitable" access to a digital data service with a data speed broadly equivalent to 64 kbps upon request. The ACMA approves and regulates how Telstra fulfils its USO and DSSO obligations, and decides whether Telstra provides "reasonable and equitable" access to other service providers.
104 Productivity Commission (2006a). In 2004/05, USO costs were set at $A 211 million, although Telstra considered this to be less than its actual costs.
105 The Government held shares will be transferred to the Future Fund, an investment fund set up to strengthen the Commonwealth's long-term finance.
106 ACCC (2006b), p. 6.107 ACCC (2006a).
WT/TPR/S/178 Trade Policy ReviewPage 96
The package included the operational separation of Telstra's retail and wholesale and network business areas, with full effect from 1 December 2006; operational separation involves measures dealing with both price and non-price conduct, with a view to ensuring that Telstra does not use its dominant wholesale/network position to give advantage to its own retail business in an anti-competitive manner.
(b) Media
98. On 18 October 2006, the Australian Parliament passed the media reform package, under which the current media-specific and newspaper-specific foreign ownership restrictions would be removed from 2007. The media will remain a "sensitive sector": all direct (i.e. non-portfolio) proposals by foreign interests to invest in the media sector, irrespective of size, are subject to prior approval under the Government's foreign investment policy. Proposals involving portfolio share holdings of 5% or more must also be submitted for examination.108
(vi) Transport
99. Transport accounted for a significant share of Australia's economy (4.9% of GDP in 2005/06), and the demand for transport is expected to almost double over the next 20 years. 109
However, the recent global boom in mining commodities and the subsequent increase in export demand have been obstructed by lack of transport facilities in some parts of Australia, particularly in coal ports.
(a) Maritime services
100. The Australian merchant trading fleet has decreased in size; the number of ships fell from 82 in 1996 to 74 in 2003, the deadweight tonnage fell from 3.3 million tonnes to 2.1 million tonnes, and the gross tonnage fell from 2.3 million tonnes to 1.6 million tonnes over the same period. 110
According to the authorities, this reflects greater reliance on foreign-flagged vessels.
101. Australian shipping legislation generally requires both Australian and foreign-flagged vessels to comply with internationally agreed safety and operational standards established under the International Maritime Organization (IMO) treaties. For a ship to be registered in Australia, it must be majority Australian owned, unless it is designated as chartered by an Australian operator.
102. Cabotage by foreign-flagged vessels is permitted. Both domestic and foreign-flagged vessels are required to obtain a licence or a permit to operate in Australia's coastal shipping. To obtain a licence, operators are required to pay their crew Australian rates of pay while the vessel is engaged in coastal shipping in Australia, and must not be receiving subsidies from foreign governments. If the Minister for Transport is satisfied that there is no suitable licensed ship available for a shipping task, or the services provided by a licensed ship are considered inadequate, and an unlicensed ship meets the "public interest" requirement, a single voyage or continuing permit may be granted to the unlicensed ship. The "public interest" is assessed on a case-by-case basis.111 Nonetheless, permits are
108 DCITA media release. Viewed at: http://www.minister.dcita.gov.au/media/media_releases/new_media_framework_for_australia [15 September 2006].
109 COAG (2006).110 ABS (2006), p. 553.111 Satisfactory inspection reports are required for tankers and dry bulk vessels. Viewed at:
http://www.dotars.gov.au/maritime/freight/licences/index.aspx [11 August 2006].

Australia WT/TPR/S/178Page 97
almost always related to foreign-flagged vessels.112 Following a review of the permit/licence system, the Government has decided not to make any changes to the current policy.
103. In 2003, 47% of Australia's exports and 80% of imports carried by sea were shipped under liner carriage.113 International liner shipping is exempted from Australia's competition legislation: Part X of the Trade Practices Act 1974 (TPA) allows international liner shipping to form agreements for the joint supply and pricing of such shipping services. In addition, the TPA requires international liner cargo shipping operators to and from Australia to be represented by an Australian resident. Australia's regulatory framework for liner shipping was reviewed by the Productivity Commission in 2004/05.114 The PC recommended that introducing competition into liner shipping arrangements would promote efficiency and improve public interest. Australia maintains no restrictions on international bulk shipping, except for requiring all ships to meet international safety, marine environment protection, and security standards.
104. Port development and management is carried out mostly by state or territory governments, either through port authorities or by government departments.115 There are some privately operated ports. Auxiliary port services are subject to both Commonwealth and state legislation. Towage and cargo handling, are usually provided by the private sector, and there is no restriction for foreign suppliers to provide stevedoring services. Licences for the provision of towage, pilotage and other auxiliary services through private business are generally issued through public tender. Foreign vessels are able to access Australian sea ports and use port and harbour facilities under the same conditions as domestic vessels. The use of terminals is not mandatory.
105. Recently, increased attention has been drawn to competition and access issues in several ports around the country.116 For example, the Export and Infrastructure Taskforce found capacity constraints at most of Australia's bulk ports for the export of coal and iron ore. Accordingly, the COAG agreed, as part of its new National Reform Agenda that all state and territory governments should review the regulation of ports and port authorities, as well as handling and storage facility operations at significant ports within their jurisdiction, so as to promote competition and a consistent national approach.117
106. Several pieces of legislation have been revised during the period under review; in particular, the Maritime Legislation Amendment Act 2006 includes amendments to the Lighthouse Act 1911, the Navigation Act 1912, the Protection of the Sea (Prevention of Pollution from Ships) Act 1983, and the Shipping Registration Act 1981. Amendments related mainly to regulations on pilotage, prevention of pollution, and increased penalties for infringement. The authorities state that penalties were increased both in terms of fines and period of imprisonment, as the previous penalty level had not been high enough to deter infringement. In addition, Australian chemical tankers are now required to prepare and carry a Marine Pollution Emergency Plan for Noxious Liquid Substances.118
112 Vessels with permits carried 24% of coastal tonnage in 2003/04, and performed 32% of coastal tonne-kilometres.
113 Productivity Commission (2005d).114 Productivity Commission (2005d).115 Maritime safety for commercial shipping is the responsibility of the Australian Maritime Safety
Authority, an agency of the Australian Government.116 The authorities state that competition between ports is more limited in Australia than in many other
countries, due to the generally large distance between ports, and the specialization of ports in exporting particular resource commodities.
117 COAG (2006).118 Maritime Legislation Amendment Act 2006. Viewed at: http://www.comlaw.gov.au/ComLaw/
Legislation/Act1.nsf/0/30E1F5593CCDD6E6CA25714C008128FE/$file/024-2006.pdf [11 August 2006].
WT/TPR/S/178 Trade Policy ReviewPage 98
(a) Aviation services
107. Australia's international civil aviation grew by 3.9% in 2005/06 in terms of passengers carried to and from Australia, and by 3.3% in terms of freight traffic. A total of 52 airlines operated international passenger flights in June 2006, while the top three, Qantas, Singapore Airlines, and Air New Zealand, accounted for 48.1% of total passengers to and from Australia. Passenger numbers carried by domestic airlines reached 40.7 million in 2005, an increase of 7.6% over 2004. Currently, major domestic airlines include Qantas, Virgin Blue, and Jetstar, a subsidiary of Qantas.119
108. The aviation industry is regulated mainly by the Department of Transport and Regional Services (DOTARS), together with the Civil Aviation Safety Authority (CASA) and the International Air Services Commission (IASC). The IASC, established under the International Air Services Commission Act 1992, allocates the available capacity on international routes under bilateral air services arrangements to one or more carriers, based on its assessment of the applicant's ability to undertake scheduled services, and sets conditions where these are considered appropriate.120
109. The Government, through DOTARS, is responsible for administering and negotiating Australia's air services arrangements. DOTARS maintains a "register of available capacity", which contains details of the capacity available under each air services arrangement. For a carrier to operate scheduled international air services, a licence must be obtained from DOTARS. 121 Other aviation-related functions of DOTARS include approving airport development programmes, as well as airline and airports security programmes.
110. Australia permits the establishment of domestic airlines (other than Qantas) with up to 100% foreign ownership. An air services agreement with New Zealand, which entered into effect on 25 August 2003, allows consecutive cabotage (i.e. cabotage following an international journey) for airlines designated as single aviation market (SAM) carriers (for New Zealand airlines only).122
Opening cabotage service to foreign airlines may reduce the risk of tacit collusion in Australia's duopolistic market.123
111. Foreign investment in an Australian international carrier is permitted up to 49% (other than Qantas). For Qantas, up to 35% aggregate foreign ownership, and 25% individual foreign ownership is allowed. Other restrictions are: the word "Qantas" may not be removed from the company's name; the head office and principal operation centre must be based in Australia; two thirds of the board members, and the chair of the board, must be Australian citizens; and Qantas must not be incorporated outside Australia.
119 DOTARS (2006).120 Capacity and route rights available to Australian and foreign international airlines servicing
Australia are agreed bilaterally. The IASC may review an allocation at any time, either at the request of the carrier concerned, or if it believes it to be necessary. The IASC is also responsible for reviewing the allocations after a specified period, and providing advice to the Minister for Transport about any issue related to international air operations (IASC online information. Viewed at: http://www.iasc.gov.au/iascrole.aspx#Role [30 September 2006]).
121 Both scheduled and non-scheduled international air services need to meet the relevant requirements of the Air Navigation Act 1920, the Civil Aviation Act 1988 and related regulations. Market entry for non-scheduled services is determined in compliance with domestic legislation and regulatory requirements (APEC, 2004).
122 Further, the recent passing of the Civil Aviation Legislation Amendment (Mutual Recognition with New Zealand) Bill 2005 enables mutual recognition of Air Operator's Certificates (AOCs), which will remove the necessity for SAM carriers to hold dual certificates for operations in Australia and New Zealand.
123 OECD (2005b).

Australia WT/TPR/S/178Page 99
112. The Civil Aviation Safety Authority (CASA), an independent statutory authority, is responsible for aviation safety regulation under the Civil Aviation Act 1988 and relevant regulations. Airservices Australia, also a statutory authority, manages Australian administered airspace and provides services including air traffic control. Australia has been pursuing bilateral aviation safety agreements (BASAs) with key aviation partners. BASAs are believed by the authorities to be able to streamline the certification processes for mutual acceptance of aviation safety standards in a number of areas, including aircraft certification, maintenance, flight operation, and environmental certification. A BASA has been concluded with the United States.
113. The Government commenced the privatization of airports in 1997, and Sydney Airport was privatized in June 2002.124 As some major airports had significant market power, which could be used to set prices much higher than those in a more contestable market, the Government introduced price regulation together with the privatization process at major airports.125 Initially, prices had been regulated in various forms, including price notification, price monitoring, and price cap arrangements. However, in October 2001, with some airports facing financial pressures in the light of reduced global demand for aviation services following the 11 September attacks, and the collapse of Ansett, a major domestic carrier, the Government eased the regulatory arrangements. In May 2002, the Government announced a further easing of price regulation arrangements in line with recommendations made by Productivity Commission. Price notification and price cap arrangements for all airports (except regional airlines using Sydney Airport (see below)) were discontinued, and price monitoring for seven airports (Adelaide, Brisbane, Canberra, Darwin, Melbourne, Perth, and Sydney airports) was introduced on 1 July 2002 for five years.
114. The ACCC is in charge of monitoring the prices, costs, and profits regarding aeronautical and related services at these seven airports.126 When monitoring, the ACCC does not attempt to decide whether profits obtained by airports are evidence of "taking advantage of monopoly power"; however, its reports help the Government to evaluate and prevent any misuse of market power, as the Government reserves the right to return to stronger price controls if required. In addition, Sydney Airport must notify the ACCC if it intends to increase prices of aeronautical services to regional airlines. Non-compliance with ACCC decisions could trigger a public inquiry and the freezing of price changes. Currently, the Productivity Commission is conducting an inquiry to assess the price monitoring regime; the final report is expected to be submitted to the Government in January 2007.
115. In addition, the national access regime provides for third-party access to services at Australian airports. Established in 1995 and operating through Part IIIA of the Trade Practices Act (TPA) 1974, the regime promotes commercial negotiation between access seekers and infrastructure owners; if an agreement cannot be reached via commercial negotiations, compulsory arbitration is provided by the ACCC.
116. Currently, major shareholders of the seven airports are investment and fund management companies. Ownership arrangements for the seven price-monitored airports are contained in the Airports Act 1996: up to 49% foreign ownership is permitted, with a 5% limit on foreign airlines and cross-ownership limits between Sydney Airport (together with Sydney West) and Melbourne, Brisbane, and Perth airports (Table II.2).
124 By September 2001, all Commonwealth owned airports, apart from Sydney Airport, had been leased to commercially operated private sector companies (WTO, 2003).
125 Productivity Commission (2006b). 126 APEC (2004).
Australia WT/TPR/S/178Page 101
REFERENCES
ABS (2006), Year Book Australia 2006, January. Viewed at: http://www.ausstats.abs.gov.au/Ausstats/subscriber.nsf/0/67E47661AA446A24CA2570FC00119006/$File/13010_2006.pdf [20 February 2006].
ACCC (2006a), Telecommunications Report 2004-05 – Changes in prices paid for telecommunications services in Australia 2004-05, April, Canberra.
ACCC (2006b), Telecommunications Market Indicator Report 2004-05, July, Canberra.
ACMA (2006), Communications Report 2005-06, November, Canberra.
ANAO (2004), Intellectual Property Policies and Practices in Commonwealth Agencies, February, Canberra.
ANAO (2005), Managing for quarantine effectiveness follow-up, audit report No.19, Canberra.
APEC (2004), APEC Electronic Individual Action Plan – Australia, 2004. Viewed at: http://www.apec-iap.org/ [6 February 2006].
Ash K. (2006), Agricultural Policies in Selected OECD Countries: Prospects for Reform, March. Viewed at: http://abareonlineshop.com/product.asp?prodid=13389 [6 June 2006].
Austrade (2005), Review of the Export Market Development Grants Scheme, June. Viewed at: http://www.austrade.gov.au/publications/EMDGreview2005Full.pdf?1126761603699 [4 May 2006].
Banks, G. (2003), 'Minimum effective regulation' and the mining industry. An address to the Minerals Council of Australia's annual industry seminar, June, Canberra.
Banks, G. (2005), Structural reform Australian-style: Lessons for others? Presentation to the IMF, World Bank, and OECD, May, Canberra.
Banks G. (2006), Reducing the regulatory burden: the way forward. Inaugural public lecture given in Monash Centre for Regulatory Studies at the University Law Chambers, 17 May 2006, Melbourne. Viewed at: http://www.pc.gov.au/speeches/cs20060517/cs20060517.pdf [12 September 2006].
Budget (2006), Budget Strategy and Outlook 2006-07, Budget Paper No. 1, May. Viewed at: http://www.budget.gov.au/2006-07/bp1/download/bp1.pdf [31 July 2006].
CIE (2004), The Australia-Thailand Free Trade Agreement: economic effects, March. Viewed at: http://www.dfat.gov.au/trade/negotiations/aust-thai/tafta_eco_effects_cie.pdf [6 March 2006].
CIE (2005), Economic Analysis of the Export Market Development Grants Scheme, June. Viewed at: http://www.austrade.gov.au/publications/EMDG-CIE-economic-analysis.pdf?1131512264590 [4 May 2006].
COAG (2002), Toward a Truly National and Efficient Energy Market, December, Canberra.
COAG (2004), Principles and Guidelines for National Standard Setting and Regulatory Action by Ministerial Councils and Standard-Setting Bodies, June. Viewed at: http://www.industry.gov.au/assets/documents/itrinternet/coagprinciples20060328091242.pdf [30 March 2006].
COAG (2006), COAG Background Paper: COAG National Competition Policy Review, February, Canberra.
WT/TPR/S/178 Trade Policy ReviewPage 102
Customs (2000a), Australia's Anti-Dumping and Countervailing Administration, November. Viewed at: http://www.customs.gov.au/webdata/resources/files/Antidumping_050203.pdf [27 March 2006].
Customs (2000b), Customs Warehouses – Deferment of Duty, November. Viewed at: http://www.customs.gov.au/webdata/resources/files/commerc0.pdf [20 March 2006].
Customs (2000c), Tariff Concession System, November. Viewed at: http://www.customs.gov.au/webdata/resources/files/commer01.pdf [20 March 2006].
Customs (2002), Customs Guide to Importing and Exporting, March. Viewed at: http://www.customs.gov.au/webdata/resources/files/guideimport_export_040622.pdf [22 March 2006].
Customs (2004), Australian Customs Service Manual Volume 8A – Valuation, May, Canberra.
Customs (2005a), Annual Report 2004-05. Viewed at: http://www.customs.gov.au/webdata/resources/files/ACSannualReport0405.pdf [6 February 2006].
Customs (2005b), Documentary Import Declaration Comprehensive Guide, December. Viewed at: http://www.customs.gov.au/webdata/resources/files/DocImpDecGuide.pdf [6 February 2006].
Customs (2005c), Origin –Australia Thailand Free Trade Agreement, Vol 8d. Viewed at: http://www.customs.gov.au/webdata/resources/files/ACSManualVol8D.pdf [21 March 2006].
Customs (2005d), Origin –Australia United States Free Trade Agreement, Vol 8c. Viewed at: http://www.customs.gov.au/webdata/resources/files/manualVol8c_050407.pdf [21 March 2006].
Customs (2005e), Volume 22 Dumping and Subsidy, May, Canberra.
DAFF (2003), Import Risk Analysis Handbook. Viewed at: http://www.daff.gov.au/corporate_docs/publications/pdf/market_access/biosecurity/bde/ira_handbook_revised.pdf [6 April 2006].
DAFF (2005a), Annual Report 2004-05, Canberra.
DAFF (2005b), AQIS CMR (Imports) Information Booklet – Supplementary advice to Customs fact sheets and information booklets, version 2.0 (as at 12 August 2005). Viewed at: http://www.daff.gov.au/corporate_docs/publications/pdf/quarantine/border/2005/cmr_summary.pdf [17 March 2006].
DAFF (2005c), Australian Agriculture and Food Sector Stocktake, Canberra.
DAFF (2006), The FishBook II – A guide to Australian Government programmes, grants and services for the Australian seafood industry. Viewed at: http://www.daffa.gov.au/__data/assets/pdf_file/6049/fishbook_2.pdf [28 September 2006].
DFAT (2006a), Trade 2006. Viewed at: http://www.dfat.gov.au/trade/trade2006/trade2006.pdf[6 April 2006].
DFAT (2006b), Trade in Services Australia, 2004-05, March, Canberra.
DFAT (2006c), Trade Topics – A quarterly review of Australia’s international trade, spring edition. Viewed at: http://www.dfat.gov.au/publications/stats-pubs/trade_topics_spring06.pdf [28 November 2006].
DOTARS (2005), Annual Report 2004-05. Viewed at: http://www.dotars.gov.au/dept/annrpt/0405/pdf/DOTARS_AR05_Final.pdf [4 April 2006].
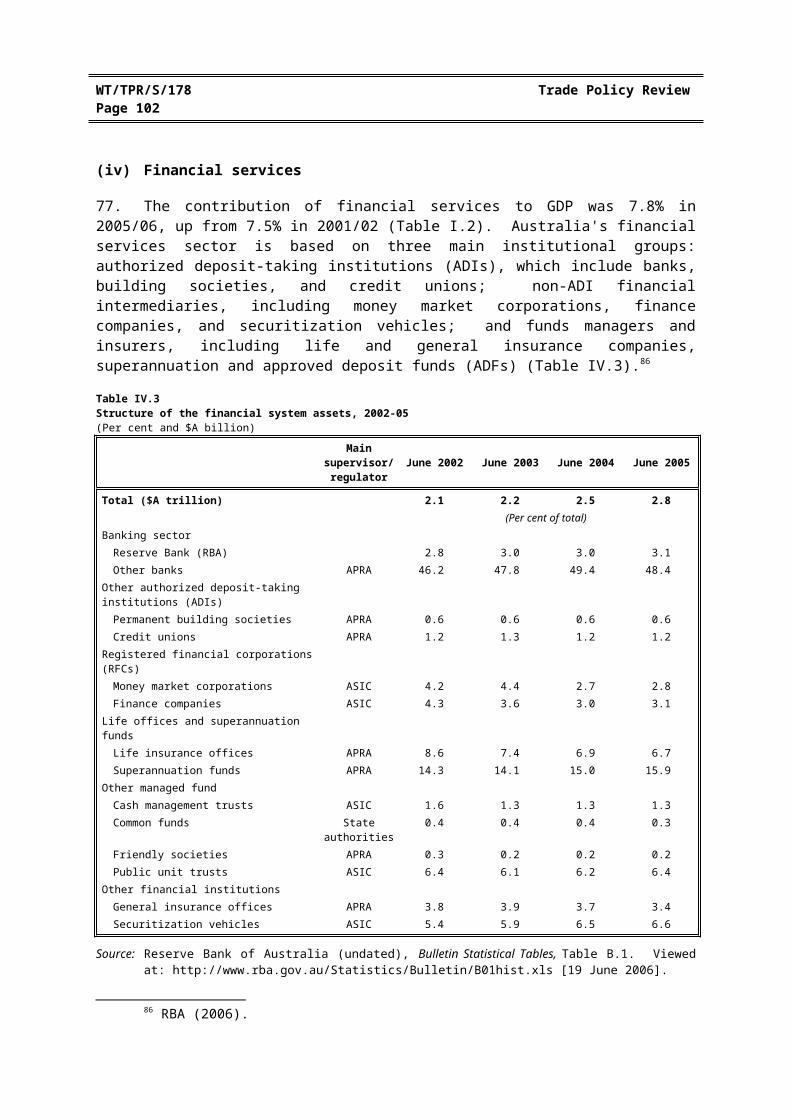
Australia WT/TPR/S/178Page 103
DOTARS (2006), AVLINE-Issue No. 8, Canberra, June, Canberra.
Drought Review Panel (2004), Consultations on national drought policy: preparing for the future, March. Viewed at: http://dpie.gov.au/corporate_docs/publications/pdf/innovation/drought/drought_report_complete.pdf [1 December 2006].
EFIC (2005), Australia's Export Credit Agency 2005 Annual Report, August. Viewed at: http://www.efic.gov.au/attachments/db/efi/106.pdf [09 May 2006].
FIRB (2005), Annual Report 2004-05,Canberra.
FIRB (2006), Summary of Australia's Foreign Investment Policy, January, Canberra.
FSANZ (2005), GM Foods – safety assessment of genetically modified foods. Viewed at: http://www.foodstandards.gov.au/_srcfiles/GM%20Foods_text_pp_final.pdf [3 October 2006].
IMF (2006), Staff Report for the 2006 Article IV Consultations – Australia, August.
JAS-ANZ (2005), Quality Manual, issue No. 5, August. Viewed at: http://www.jas-anz.com.au/web/DOCS/qualitymanual.pdf [4 April 2006].
National Water Commission (2006), 2005 National Competition Policy assessment of water reform progress. Viewed at: http://www.nwc.gov.au/reform/docs/Findings_WA.pdf [12 October 2006].
OECD (2005a), Annual Report on Competition Policy Development in Australia: 1 July 2004–30 June 2005, September, Paris.
OECD (2005b), Product Market Competition and Economic Performance in Australia, ECO/WKP(2005)38, 13 October 2005, Paris.
OECD (2006a), Australian Work on International Tax Comparisons, May, Paris.
OECD (2006b), Economic Surveys – Australia, Volume 2006/12, July, Paris.
Productivity Commission (1998), Annual Report 1997-98, September. Viewed at: http://www.pc.gov.au/research/annrpt/annualreport9798/annualreport9798.pdf [23 February 2006].
Productivity Commission (2001), International Pharmaceutical Price Differences, Research report, AusInfo, Canberra.
Productivity Commission (2002a), Review of Automotive Assistance, Report No.25, Canberra.
Productivity Commission (2002b), Trade and Assistance Review 2001-02, Annual Report Series 2001-02, AusInfo, December, Canberra.
Productivity Commission (2003a), Evaluation of the Pharmaceutical Industry Investment Programme, Research Report, AusInfo, Canberra.
Productivity Commission (2003b), From industry assistance to productivity: 30 years of the Commission, December, Canberra.
Productivity Commission (2003c), Review of TCF Assistance, Report No. 26, Canberra.
Productivity Commission (2003d), Trends in Australian Manufacturing, Commission Research Paper, AusInfo, August, Canberra.
WT/TPR/S/178 Trade Policy ReviewPage 104
Productivity Commission (2004), Trade and Assistance 2003/04, Annual Report Series 2003/04, Canberra.
Productivity Commission (2005a), Financial Performance of Government Trading Enterprises, 1999/00 to 2003/04, Commission Research Paper, July, Canberra.
Productivity Commission (2005b), Regulations and its Review 2004/05, Canberra.
Productivity Commission (2005c), Review of National Competition Policy Reforms, Report No. 33, February, Canberra.
Productivity Commission (2005d), Review of Part X of the Trade Practices Act 1974: International Liner Cargo Shipping, Report No.32, March, Canberra.
Productivity Commission (2005e), Trends in Australian Agriculture, Research Paper, Canberra.
Productivity Commission (2006a), Financial Performance of Government Trading Enterprises, 2000/01 to 2004/05, Commission Research Paper, July, Canberra.
Productivity Commission (2006b), Price Regulation of Airport Services, Productivity Commission Issue Paper, May, Canberra.
Productivity Commission (2006c), Rural water use and the environment: the role of market mechanisms, Research Report, August, Canberra.
Productivity Commission (2006d), Standard Setting and Laboratory Accreditation, November, Canberra.
Productivity Commission (2006e), Trade & Assistance Review 2004/05, Annual Report Series 2004-05, April, Canberra.
Reserve Bank of Australia (2006), Financial Stability Review, March. Viewed at: http://www.rba.gov.au/PublicationsAndResearch/FinancialStabilityReview/Mar2006/Pdf/financial_stability_review_0306.pdf [20 June 2006].
Regulation Taskforce (2006), Rethinking Regulation: Report of the Taskforce on Reducing Regulatory Burdens on Business. Report to the Prime Minister and the Treasurer, January. Viewed at: http://www.regulationtaskforce.gov.au/finalreport/regulationtaskforce.pdf [5 September 2006].
Treasury (2005), Tax Expenditure Statement 2005, December. Viewed at: http://www.treasury.gov.au/documents/1052/PDF/TES_2005.pdf [10 May 2005].
Treasury (2006a), Pocket Guide to the Australian Tax System. Viewed at: http://www.treasury.gov.au/documents/866/PDF/Pocket_tax_guide_MYEFO%202005-06.pdf [9 May 2006].
Treasury (2006b), Rethinking regulation: Report of the Taskforce on Reducing Regulatory Burdens on Business – Australian Government's Response, August. Viewed at: http://www.treasury.gov.au/documents/1141/PDF/Reducing_Regulatory_Burdens_on_Business_Final_Government_Response.pdf [11 September 2006].
Truss, W. (Minister for Agriculture, Fisheries and Forestry) (2004), Historic National Drought Roundtable, Media Release, AFFA04/92WT, 13 April.
UNCTAD (2005), World Investment Report 2005, Geneva.
Australia WT/TPR/S/178Page 105
UNCTAD (2006), World Investment Report 2006, New York and Geneva.
USTR (2004), Final Text of the U.S. – Australia Free Trade Agreement: Annex I – Services/Investment Non-Conforming Measures. Viewed at: http://www.ustr.gov/assets/Trade_Agreements/Bilateral/Australia_FTA/Final_Text/asset_upload_file350_3425.pdf [9 March 2006].
WTO (1998), Trade Policy Review – Australia, November, Geneva.
WTO (2003), Trade Policy Review – Australia, January, Geneva.