REPORT - Building Engineering Services Association
35
REPORT Testing issued by an Accredited Testing Laboratory Contact person RISE Date Reference Page Henrik Persson 2019-08-23 9P02219 1 (16) Energy and circular economy +46 10 516 55 21 [email protected] Rev. 2020-05-25 Warmafloor Ltd. Onyx, 12 Little Park Farm Rd, Segensworth West FAREHAM PO15 5TD Storbritannien Testing of an HIU according to the UK HIU Test Regime (3 appendices) Accred. No. 1002 Testing ISO/IEC 17025 RISE Research Institutes of Sweden AB Postal address Office location Phone / Fax / E- mail This report may not be reproduced other than in full, except with the prior written approval of the issuing laboratory. Box 857 SE-501 15 BORÅS Sweden Brinellgatan 4 SE-504 62 BORÅS +46 10 516 50 00 +46 33 13 55 02 [email protected] This is a revised version of the test report dated 2019-08-23. The revision concerns editorial changes for the low flow tests 3a and 3c. 1 Assignment RISE has tested a heat interface unit (HIU) (also known as a district heating substation) from Wavin on behalf of Warmafloor Ltd. 2 Test method The test method is described in the UK HIU Test Regime Technical Specification, Rev-009 (October 2018), issued by the Building Engineering Services Association (BESA). This will be referred to as the Test Regime throughout this document. The Test Regime specifies testing according to two different test packages: High temperature, with a primary supply temperature of 70 °C, and Low temperature, with a primary supply temperature of 60 °C. The current test object was tested according to both the High and Low temperature test package. 3 Test object Manufacturer: Warmafloor Ltd Model name: Calefa V Type/serial number: 1129 Year of manufacture: 2019 Domestic hot water priority: No 3.1 Design pressures Primary side: 16 bar Secondary side, space heating: 3 bar Secondary side, DHW: 10 bar Maximum differential pressure, primary side: 6 bar
Transcript of REPORT - Building Engineering Services Association

REPORT
Testing
issued by an Accredited Testing Laboratory
Contact person RISE Date Reference Page
Henrik Persson 2019-08-23 9P02219 1 (16) Energy and circular economy
+46 10 516 55 21
Rev. 2020-05-25
Warmafloor Ltd.
Onyx,
12 Little Park Farm Rd,
Segensworth West
FAREHAM PO15 5TD
Storbritannien
Testing of an HIU according to the UK HIU Test Regime (3 appendices)
Accred. No. 1002
Testing
ISO/IEC 17025
RISE Research Institutes of Sweden AB
Postal address Office location Phone / Fax / E-
This report may not be reproduced other than in full, except with the prior written approval of the issuing laboratory.
Box 857 SE-501 15 BORÅS Sweden
Brinellgatan 4 SE-504 62 BORÅS
+46 10 516 50 00 +46 33 13 55 02 [email protected]
This is a revised version of the test report dated 2019-08-23. The revision concerns editorial
changes for the low flow tests 3a and 3c.
1 Assignment
RISE has tested a heat interface unit (HIU) (also known as a district heating substation) from
Wavin on behalf of Warmafloor Ltd.
2 Test method
The test method is described in the UK HIU Test Regime Technical Specification, Rev-009
(October 2018), issued by the Building Engineering Services Association (BESA). This will be
referred to as the Test Regime throughout this document.
The Test Regime specifies testing according to two different test packages: High temperature,
with a primary supply temperature of 70 °C, and Low temperature, with a primary supply
temperature of 60 °C. The current test object was tested according to both the High and
Low temperature test package.
3 Test object
Manufacturer: Warmafloor Ltd
Model name: Calefa V
Type/serial number: 1129
Year of manufacture: 2019
Domestic hot water priority: No
3.1 Design pressures
Primary side: 16 bar
Secondary side, space heating: 3 bar
Secondary side, DHW: 10 bar
Maximum differential pressure, primary side: 6 bar

REPORT
Date Reference Page
2019-08-23 9P02219 2 (16) Rev. 2020-05-25
RISE Research Institutes of Sweden AB
3.2 Design temperatures
Primary side: max 120 °C
Secondary side, space heating: dimensioned for 30-95 °C
Secondary side, DHW: dimensioned for 45-65 °C
REPORT
Date Reference Page
2019-08-23 9P02219 3 (16) Rev. 2020-05-25
RISE Research Institutes of Sweden AB
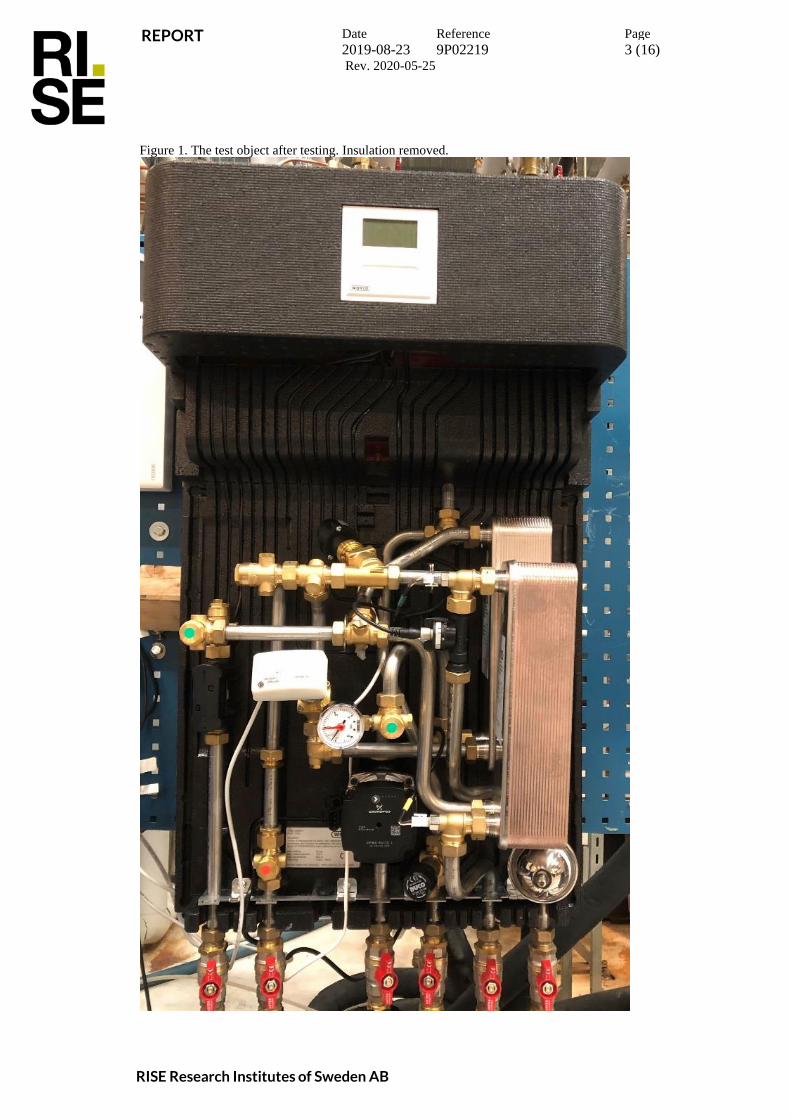
Figure 1. The test object after testing. Insulation removed.

REPORT
Date Reference Page
2019-08-23 9P02219 4 (16) Rev. 2020-05-25
RISE Research Institutes of Sweden AB
Figure 2. Test object nameplate.
3.3 Components and documentation
See Appendix 1.
4 Test location and time
The testing was performed at RISE in Borås, Sweden, department of Energy and circular
economy, in March-May 2019. The test object arrived to RISE on the 18th of March with no
visible damage.

REPORT
Date Reference Page
2019-08-23 9P02219 5 (16) Rev. 2020-05-25
RISE Research Institutes of Sweden AB
5 Abbreviations
6 Test equipment
The following equipment has been used during the tests:
District heating test rig FV3 ETu-QD CB:11
Differential pressure meter Inv. no. 202 111
Differential pressure meter Inv. no. 202 112
Differential pressure meter Inv. no. 202 680
Flow meter, inductive, DN 15 Inv. no. 202 082
Flow meter, inductive, DN 15 Inv. no. 202 687
Flow meter, inductive, DN 15 Inv. no. 202 686
Flow meter, inductive, DN 4 Inv. no. BX60131
Logger for measured data Inv. no. 202 879
Pressure meter for pressure test Inv. no. 201 378
Term Meaning (diagram legend entry)
DHW Domestic hot water -
HIU Heat Interface Unit -
SH Space heating -
P₁ Heat load, primary side [kW]
P₂ Heat load, space heating side [kW]
P₃ Heat load, domestic hot water [kW]
t₁₁ Temperature, primary supply connection (DH supply) [oC]
t₁₂ Temperature, primary return connection (DH return) [oC]
t₂₁ Temperature, space heating return connection (SH return) [oC]
t₂₂ Temperature, space heating supply connection (SH supply) [oC]
t₃₁ Temperature, cold water (CWS) [oC]
t₃₂ Temperature, domestic hot water supply connection (DHW supply) [oC]
q₁ Volume flow, primary side (DH) [l/s]
q₂ Volume flow, space heating side (SH) [l/s]
q₃ Volume flow, domestic hot water (DHW) [l/s]
∆p1 Pressure drop, primary side across HIU [bar]
∆p2 Pressure drop, space heating side across HIU [kPa]
∆p3 Pressure drop, domestic hot water across HIU [kPa]

REPORT
Date Reference Page
2019-08-23 9P02219 6 (16) Rev. 2020-05-25
RISE Research Institutes of Sweden AB
Figure 3. Simplified schematic diagram of the test rig used for the tests.

REPORT
Date Reference Page
2019-08-23 9P02219 7 (16) Rev. 2020-05-25
RISE Research Institutes of Sweden AB
6.1 Collection of measurement data, static measurements
When conditions were stable, measurement results were registered for at least 300 seconds.
Presented static measurement test values are averages of 300 data points. The sampling rate
was 1 Hz for the static tests. The pressure in the space heating circuit was 1.5 bar.
6.2 Collection of measurement data, dynamic measurements
The sampling rate was 1 Hz for the dynamic measurements.
The time constant for the temperature sensors in the measuring point t₃₂ is ≤ 1.5 s and
represents 63% of the final value of a momentary change of temperature from 10 to 90 °C.
The time constant for the flow meter to measure the DHW flow is ≤ 0.2 s.
The pressure for the incoming cold water was 1.5 bar for the production of DHW on demand
via a heat exchanger.
For the control of DHW flow, the test rig has two parallel coupled solenoid valves. Each
solenoid valve controls a set flow.
Results are presented in chart form and are verified with numerical values.
6.3 Control systems for DHW
The tested HIU is intended for direct exchange of DHW. This means that the incoming cold
water (10 ± 0.5 ºC), is heated directly in the heat exchanger to DHW temperature. The
temperature of DHW in the measuring point t₃₂ was measured in connection to the HIU DHW
tap.
6.4 Measurement uncertainty
Unless otherwise stated in conjunction with the reported values, the measurement uncertainty
has been estimated to be better than following values:
Differential pressure, primary ± 10 kPa
Differential pressure, space heating ± 1 kPa
Differential pressure, domestic hot water ± 1 kPa
Temperature 0-100 °C ± 0.1 °C
Flow, space heating (0.06 - 0.5 l/s) ± 1.5 %
Flow, space heating (< 0.06 l/s) Specified in conjunction with each reported
measurement
Flow, primary (0.1-0.5 l/s) ± 1.5 %
Flow, primary (< 0.1 l/s) Specified in conjunction with each reported
measurement
Flow, domestic hot water (0.02-0.4 l/s) ± 1.5 %
Pressure 0-7 MPa ± 10 kPa
The measurement uncertainty for calculated average values in test points 1a-f and 4a-b is
presented in conjunction with the reported value.
The measurement uncertainty has been calculated according to EA-4/16 with a coverage factor
k=2.

REPORT
Date Reference Page
2019-08-23 9P02219 8 (16) Rev. 2020-05-25
RISE Research Institutes of Sweden AB
7 Test results
The test results apply only to the tested unit.
The results of each test are presented as specified in the Test Regime. Refer to Table 1
regarding the test setup and Table 2 for details on the reporting.
Table 1. Test setup. Extract from the Test Regime.
No Test
static
pressure
on
primary
flow
dP
across
HIU
Primary
flow
temp
DHW
setpoint
DHW
flow
rate
DHW
heat
load
SH output
SH
flow
temp
SH
return
temp
[bar]
dP₁
[bar]
t₁₁ [°C]
t₃₂ [°C]
q₃ [l/s]
P₃
[kW]
P₂ [kW]
t₂₂
[°C]
t₂₁
[°C]
Static tests
0
Static pressure test
(same static pressure on both
flow and return connections)
1.43
times
rated
value
1.43
times
rated
value
n/a n/a n/a n/a n/a n/a n/a
1a Space Heating 1 kW
(DH 70°C flow) 3.0 0.5 70 55 0 0 1 60 40
1b Space Heating 2 kW
(DH 70°C flow) 3.0 0.5 70 55 0 0 2 60 40
1c Space Heating 4 kW
(DH 70°C flow) 3.0 0.5 70 55 0 0 4 60 40
1d Space heating 1 kW
(DH 60°C flow) 3.0 0.5 60 50 0 0 1 45 35
1e Space heating 2 kW
(DH 60°C flow) 3.0 0.5 60 50 0 0 2 45 35
1f Space heating 4 kW
(DH 60°C flow) 3.0 0.5 60 50 0 0 4 45 35
Dynamic tests
2a DHW only
(DH 70°C flow) 3.0 0.5 70 55
DHW
test
profile
DHW
test
profile
0 60 n/a
2b DHW only
(DH 60°C flow) 3.0 0.5 60 50
DHW
test
profile
DHW
test
profile
0 45 n/a
3a Low flow DHW
(DH 70°C flow) 3.0 0.5 70 55 0.02
Record
value 0 60 n/a
3b Low flow DHW
(DH 60°C flow) 3.0 0.5 60 50 0.02
Record
value 0 45 n/a
4a Keep-warm
(DH 70°C flow) 3.0 0.5 70 55 0 0 0 60 n/a
4b Keep-warm
(DH 60°C flow) 3.0 0.5 60 50 0 0 0 45 n/a
5a DHW response time
(DH 70°C flow) 3.0 0.5 70 55 0.13
Record
value 0 60 n/a
5b DHW response time
(DH 60°C flow) 3.0 0.5 60 50 0.13
Record
value 0 45 n/a
The cold water supply to the HIU on the test rig shall be 10 °C and at 1.5 bar for all tests.

REPORT
Date Reference Page
2019-08-23 9P02219 9 (16) Rev. 2020-05-25
RISE Research Institutes of Sweden AB
Table 2. Reporting of test results. Extract from the Test Regime.
Test Description Reporting
Static tests
0 Pressure test Pass/Fail as to whether HIU manages pressure test without leaks or damage.
1a Space Heating 1 kW,
60/40 °C secondary
t11- primary flow temperature.
t12- primary return temperature.
Plot of key metrics over duration of test.
Note: Outputs readings used as input data to ‘High Temperature’ Space Heating
Weighted Average Return Temperature calculation.
1b Space Heating 2 kW,
60/40 °C secondary
1c Space Heating 4 kW,
60/40 °C secondary
1d Space Heating 1 kW,
45/35 °C secondary
t11- primary flow temperature.
t12- primary return temperature.
Plot of key metrics over duration of test.
Note: Outputs readings used as input data to ‘Low Temperature’ Space Heating
Weighted Average Return Temperature calculation.
1e Space Heating 2 kW,
45/35 °C secondary
1f Space Heating 4 kW,
45/35 °C secondary
Dynamic tests
2a DHW only,
DH 70 °C flow,
55 °C DHW
Pass/Fail on DHW (at t32) exceeding 65.0°C (to 1 decimal point) for more than 10
consecutive seconds. State the maximum and minimum DHW temperatures over
the period of the test when there is a DHW flow.
Assessment of scaling risk as per criteria detailed in 2.26.
Plot of key metrics over duration of test.
Note: Outputs used as input data to ‘High Temperature’ Domestic Hot Water
Volume Weighted Average Return Temperature calculation.
Plot t32, t31, q3, t12, q1
2b DHW only,
DH 60 °C flow,
50 °C DHW
State the maximum and minimum DHW temperatures over the period of the test
when there is a DHW flow.
Plot q1, q3, dP1, dP3
Plot of key metrics over duration of test.
Note: Outputs used as input data to ‘Low Temperature’ Domestic Hot Water
Volume Weighted Average Return Temperature calculation.
3a Low flow DHW,
DH 70°C flow;
55 °C DHW
Pass/Fail on DHW (at t₃₂) exceeding 65.0 °C (1 decimal place) for more than 10
consecutive seconds.
Comment on ability to deliver DHW at low flow based on DHW temperature
reaching at least 45.0 °C at the end of the 180 second period of low flow DHW.
Comment on ability to deliver stable DHW flow temperature (at t32), defined as
ability to maintain 55.0 ± 3°C (1 decimal place) during the last 60 seconds of the
test. Maximum temperature achieved and +/- °C variance around 55.0 °C (1
decimal place) to be stated.
Assessment of scaling risk as per criteria detailed in 2.26.
Plot of key metrics for 60 seconds of 0.13 l/s flow and the subsequent 180
seconds of 0.02 l/s DHW flow.
3b Low flow DHW,
DH 60°C
flow;
50 °C DHW
Comment on ability to deliver DHW at low flow rate based on DHW temperature
reaching at least 45° C (one decimal place) at the end of the 180 second period of
low flow DHW.
Comment on ability to deliver stable DHW flow temperature (at t32), defined as
ability to maintain 50.0 +/-3°C (1 decimal place) during the last 60 seconds of the
test. Maximum temperature achieved and +/-°C variance around 55.0 °C (1
decimal place) to be stated.
Plot of key metrics for 60 seconds of 0.13 l/s flow and the subsequent 180
seconds of 0.02 l/s DHW flow.
Maximum temperature achieved and +/-° C variance around 50.0 °C (1 decimal
place) to be stated.
4a Keep-warm.
DH 70°C flow;
55 °C DHW
Assessment of whether valid keep-warm operation, based on
5a response time criteria: Pass / Fail
Plot temperature t10.
Assessment of scaling risk, based on duration of temperatures in excess of 55.0°C
REPORT
Date Reference Page
2019-08-23 9P02219 10 (16) Rev. 2020-05-25
RISE Research Institutes of Sweden AB
Test Description Reporting
(1 decimal place).
Comment on HIU keep-warm controls options.
Plot of key metrics over duration of test.
State average heat load for the duration of the test.
State average primary flow rate for the duration of the test.
Note: Outputs used as input data to ‘High Temperature’ Keep-warm
Volume Weighted Average Return Temperature
calculation.
4b Keep-warm, DH 60°C
flow;
50°C DHW
Assessment of whether valid keep-warm operation, based on 5b response time
criteria: Pass / Fail.
Observation on the operation of the HIU during keep-warm.
Assessment of scaling risk, based on duration of temperatures in excess of 55.0°C
(one decimal place).
Plot temperature t10.
Comment on HIU keep-warm controls options.
Plot of key metrics over duration of test.
State average heat load for the duration of the test.
State average primary flowrate for the duration of the test.
Note: Outputs used as input data to ‘Low Temperature’ Keep-warm
Volume Weighted Average Return Temperature calculation.
5a DHW response time,
DH
70°C flow; 55°C
DHW
Pass/Fail on DHW (at t32) exceeding 65.0°C (1 decimal place) for more than 10
consecutive seconds. State time to achieve a DHW temperature 45.0 °C (1
decimal place) and not subsequently drop below 42.0oC (1 decimal place).
Plot t32, t31, t12, q1 over duration of test.
5b DHW response time,
DH
60°C flow; 50°C
DHW
State time to achieve a DHW temperature 45.0 °C (1 decimal place) and not
subsequently drop below 42.0 °C (1 decimal place).
Plot t32, t31, q3, t12, q1 over duration of test.
7.1 Test 0: Pressure test
During the static pressure test 0, the tightness of the components on the primary side of the
HIU has been checked. This has been performed by closing the primary return and
pressurizing the primary flow to 23 bar (1.43 times the construction pressure) for 30 minutes.
No leakage or damage was detected during the static pressure test.
Test requirement: The HIU is to manage the pressure tests without leaks or damage.
Result: Pass.
7.2 Test 1a-1f: Space Heating 1-4 kW
For test points 1a-1f, a space heating load of 1-4 kW was simulated using a heat exchanger on
the test rig. The HIU pump was deactivated and the space heating flow was adjusted in the test
rig to deliver the required space heating load. The pressure in the space heating circuit was 1.5
bar for all tests.
While the HIU was delivering 4 kW of space heating, the space heating flow temperature t₂₂ was adjusted on the HIU until it reached 60 ± 0.5 °C (for test points 1a-1c) or 45 ± 0.5 °C (for
test points 1d-1f) as measured by the test rig. The space heating return temperature t₂₁ was
40 °C for test points 1a-1c and 35 °C for test points 1d-1f. The primary flow temperature t₁₁
was 70 °C for test points 1a-1c and 60 °C for test points 1d-1f. The pressure in the space
heating circuit was set to 1.5 bar.

REPORT
Date Reference Page
2019-08-23 9P02219 11 (16) Rev. 2020-05-25
RISE Research Institutes of Sweden AB
Prior to performing the test points 1a-f, the test rig differential pressure control valve (DPCV)
was adjusted to an average value of 0.5 ± 0.2 bar during 300 seconds while the HIU was
delivering 4 kW of space heating at a flow temperature t₂₂ of 45 ± 0.5 °C and a return
temperature of 35 ± 0.5 °C. This setting was kept for all tests carried out in the High temp and
Low temp test package.
For further details regarding the test setup, see Table 1.
During tests 1a-1c, the setpoint for space heating supply temperature t₂₂ on the HIU controller
was set to 58 °C P=0,6, I=60 and H= 0,5.
During tests 1d-1f, the setpoint for space heating supply temperature t₂₂ on the HIU controller
was set to 57 °C with a controller PID setting of P=0,6, I=20 and H= 1,0.
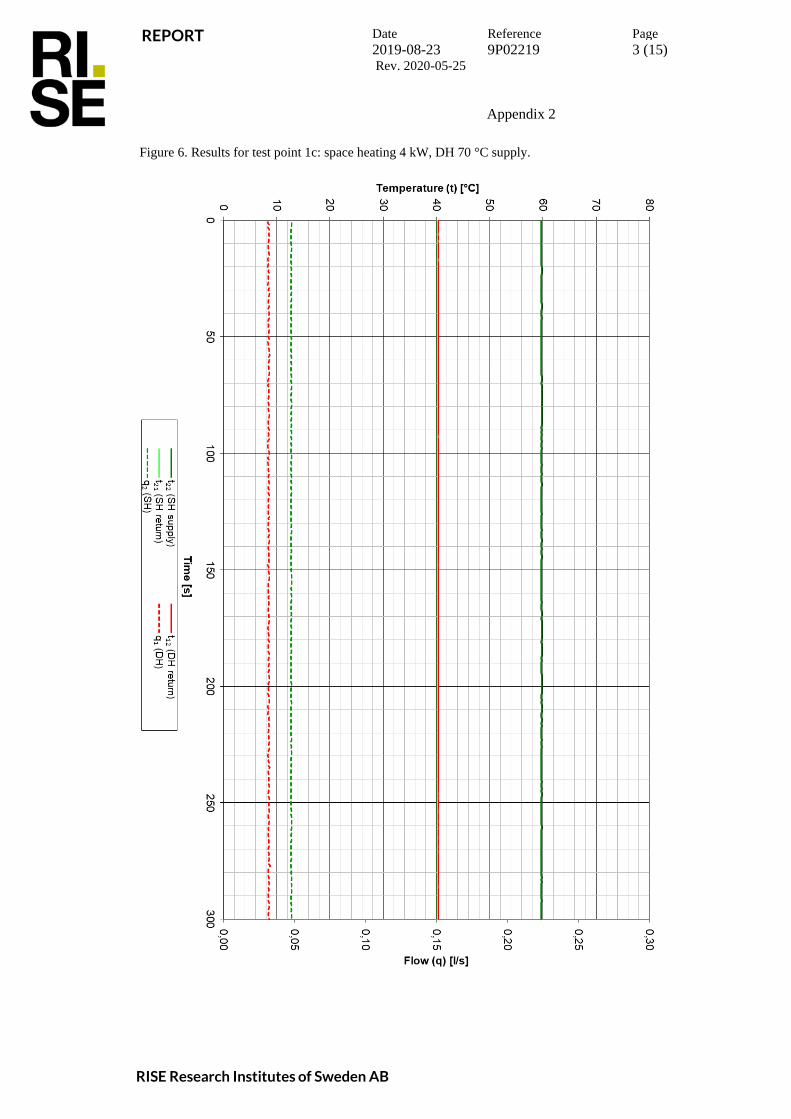
The results for test points 1a-1f are presented in Table 3 as averages of 300 data points. The
measurement uncertainty has been estimated to be better than the values in Table 4. The results
are also presented in Figure 4 to Figure 9, appendix 2.
Table 3. Test results for test points 1a-1f. Primary Secondary
Test
point
t₁₁ t₁₂ q₁ P₁ t₂₁ t₂₂ q₂ p₂ P₂
[C] [C] [l/s] [kW] [C] [C] [l/s] [kPa] [kW]
1a 70.0 39.8* 0.007 0.9 40.1 58.9 0.012 0.2 0.9
1b 70.1 40.1* 0.015 1.9 40.2 59.9 0.023 0.3 1.8
1c 70.1 40.4 0.032 3.9 40.2 59.7 0.048 0.9 3.8
1d 60.1 35.0* 0.011 1.2 35.1 46.0 0.024 0.3 1.1
1e 60.2 34.9* 0.021 2.2 35.0 46.8 0.042 0.7 2.1
1f 60.2 35.0 0.040 4.2 35.0 45.1 0.096 2.8 4.0
*) The primary return temperature t₁₂ was measured to be lower than the space heating return
temperature t₂₁, which is not practically possible if considering only the heat exchanger. The
measurement result was due to heat losses and thereby temperature drop in the piping from the
measuring point of t₂₁ at the HIU inlet to the heat exchanger on the secondary side and from the outlet
of the heat exchanger to the measuring point of t₁₂ at the HIU primary side outlet.
Table 4. Measurement uncertainty for test points 1a-1f. Primary Secondary
Test
point
t₁₁ t₁₂ q₁ P₁ t₂₁ t₂₂ q₂ p₂ P₂
[C] [C] [l/s] [kW] [C] [C] [l/s] [kPa] [kW]
1a ±0.1 ±0.1 ±0.0001 ±0.1 ±0.1 ±0.1 ±0.0012 ±1 ±0.1
1b ±0.1 ±0.1 ±0.0002 ±0.1 ±0.1 ±0.1 ±0.0021 ±1 ±0.2
1c ±0.1 ±0.1 ±0.0004 ±0.1 ±0.1 ±0.1 ±0.0004 ±1 ±0.1
1d ±0.1 ±0.1 ±0.0002 ±0.1 ±0.1 ±0.1 ±0.0022 ±1 ±0.1
1e ±0.1 ±0.1 ±0.0003 ±0.1 ±0.1 ±0.1 ±0.0003 ±1 ±0.1
1f ±0.1 ±0.1 ±0.0005 ±0.1 ±0.1 ±0.1 ±0.0007 ±1 ±0.1
7.3 Test 2a: DHW only, DH 70 °C flow
In test point 2a, a dynamic test of DHW was performed according to DHW flow rates specified
in the Test Regime. The primary flow temperature t₁₁ was 70 °C. The DHW setpoint was
adjusted while the HIU delivered 0.13 l/s of DHW until the DHW temperature t₃₂ reached

REPORT
Date Reference Page
2019-08-23 9P02219 12 (16) Rev. 2020-05-25
RISE Research Institutes of Sweden AB
55 ± 0.5 °C as measured by the test rig. The HIU DHW setpoint was 57 °C with controller PID
settings of: P=1.5, I=10 and H=0.2. For further details regarding the test setup, see Table 1.
- The DHW temperature (t₃₂) did not exceed 65.0 °C during the test for more than 10
consecutive seconds.
- The maximum measured temperature in point t₃₂ was 58.3 °C and the minimum
measured temperature in point t₃₂ was 42.2 °C.
Test requirement: The DHW flow temperature t₃₂ is not to exceed 65 °C for more than 10
consecutive seconds.
Result: Pass.
The test results for test point 2a are presented in Figure 10, appendix 2.
7.4 Test 2b: DHW only, DH 60 °C flow
In test point 2b, a dynamic test of DHW was performed according to DHW flow rates
specified in the Test Regime. The primary flow temperature t₁₁ was 60 °C. The DHW setpoint
was adjusted while the HIU delivered 0.13 l/s of DHW until the DHW temperature t₃₂ reached
50 ± 0.5 °C as measured by the test rig. The HIU DHW setpoint was 50 °C . For further details
regarding the test setup, see Table 1.
- The maximum measured temperature in point t₃₂ was 51,3 °C and the minimum
measured temperature in point t₃₂ was 42,2 °C.
The test results for test point 2b are presented in Figure 11, appendix 2.
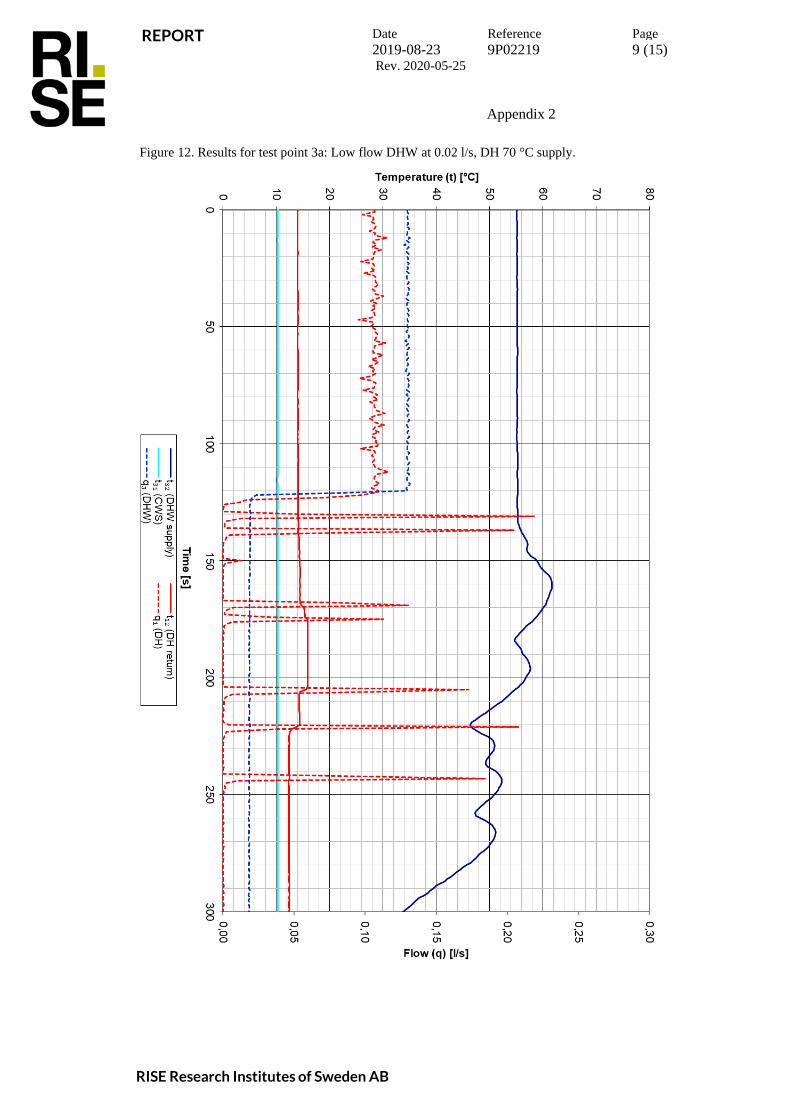
7.5 Test 3a: Low flow DHW, DH 70 °C flow
In test point 3a, a low DHW flow was tested. Domestic hot water was drawn at 0.13 l/s for
120 seconds, then immediately drawn at 0.02 l/s for 180 seconds. The primary flow
temperature t₁₁ was 70 °C and the domestic hot water setpoint was the same as in test point 2a.
For further details regarding the test setup, see Table 1.
- The HIU met the requirement of not exceeding 65 °C for more than 10 consecutive
seconds in accordance with the test method (maximum temperature reached was 61.7
°C). The HIU did not provide stable flow temperatures of 55 °C ± 3°C for ˃60 seconds
under the stated conditions.
Since the manufacturer stated minimum DHW flow was higher than 0.02 l/s, an additional
test was performed at the lowest DHW flow specified by the manufacturer. With the same
primary flow and DHW setpoint, DHW was drawn at 0.13 l/s for 120 seconds, then
immediately drawn at 0.03 l/s for 180 seconds.
Result: Pass

REPORT
Date Reference Page
2019-08-23 9P02219 13 (16) Rev. 2020-05-25
RISE Research Institutes of Sweden AB
Test 3c: Low flow DHW 70 C flow at manufacturers declared minimum flow rate
- At the minimum DHW flow rate claimed by the manufacturer (0.03 l/s) the unit did
provide stable flow temperatures of 55 °C ± 3°C for ˃60 seconds.
- At the minimum DHW flow rate claimed by the manufacturer, the HIU met the
requirement of not exceeding 65 °C for more than 10 consecutive seconds in
accordance with the test method (maximum temperature reached was 56.7 °C).
Test requirement: The DHW flow temperature t₃₂ is not to exceed 65 °C for more than 10
consecutive seconds.
Result: Pass
The results for test point 3a and 3c are presented in Figure 12 (DHW flow at 0.02 l/s) and
Figure 13 (DHW flow at 0.03 l/s), appendix 2.
7.6 Test 3b: Low flow DHW, DH 60 °C flow
In test point 3b, a low DHW flow of 0.02 l/s was tested. Domestic hot water was drawn at
0.13 l/s for 120 seconds, then immediately drawn at 0.02 l/s for 180 seconds. The primary flow
temperature t₁₁ was 60 °C and the domestic hot water setpoint was the same as in test point 2b.
For further details regarding the test setup, see Table 1.
- The unit delivered stable DHW temperature, maintaining the DHW output temperature
at 50 ± 3 °C during the last 60 seconds of the test.
- The maximum and minimum DHW outlet temperatures were 51.5 °C and 48.0 °C
respectively.
The results for test point 3b are presented in Figure 14, appendix 2.
7.7 Test 4a: Keep-warm, DH 70 °C flow
In test point 4a, the standby characteristics of the HIU were tested. A DHW flow of 0.13 l/s
was drawn until stable conditions were reached and was then turned off. Data was then
collected for 8 hours. For further details regarding the test setup, see Table 1.
The standby performance of the HIU is dependent on the standby control method used. The
HIU keep warm (bypass) temperature could on the test object be adjusted independently of the
DHW temperature. The keep warm temperature is measured and controlled by the district
heating supply temperature sensor in the unit. The keep warm function had 4 different modes:
Auto control, Schedule control, On and Off. In the Auto control mode, the controller analyses
the user pattern and activates the keep warm function when a DHW usage is expected. In the
Schedule control mode the user can program a full week schedule for activation of the keep
warm function. In the On mode, the keep warm function is set to continuously maintain the set
keep warm temperature. In the Off mode, the keep warm function is disabled.
During the tests the HIU keep-warm was set in the on mode.

REPORT
Date Reference Page
2019-08-23 9P02219 14 (16) Rev. 2020-05-25
RISE Research Institutes of Sweden AB
If the difference between the maximum and minimum primary flow temperature t₁₁ is higher
than 6 °C during the final 3 hours of the test, the HIU is considered to perform keep-warm
cycling.
- The temperature difference between the maximum and minimum primary flow
temperature t₁₁ was 1.5 °C during the final 3 hours of the test and as such the HIU was
not considered to perform keep-warm through cycling.
- The unit met the requirement of a keep warm function based on the response time
reaching 45 °C in test 5a.
- During the 8 hours after turning off the domestic hot water flow, the average primary
flow q₁ was 5.2 l/h with measurement uncertainty {+1.1−0.9
l/h
- The average heat load P₁ was 48 W with measurement uncertainty {+20−15
W.
The results for test point 4a are presented in Figure 15, appendix 2.
7.8 Test 4b: Keep-warm, DH 60 °C flow
In test point 4b, the standby characteristics of the HIU were tested. A DHW flow of 0.13 l/s
was drawn until stable conditions were reached and was then turned off. Data was then
collected for 8 hours. For further details regarding the test setup, see Table 1.
The standby performance of the HIU is dependent on the standby control method used. For a
description of the keep-warm settings, see Test 4a: Keep-warm, DH 70 °C flow.
If the difference between the maximum and minimum primary flow temperature t₁₁ is higher
than 6 °C during the final 3 hours of the test, the HIU is considered to perform keep-warm
cycling.
- The temperature difference between the maximum and minimum primary flow
temperature t₁₁ was 1.4 °C during the final 3 hours of the test and as such the HIU was
not considered to perform keep-warm through cycling.
- The unit met the requirement of a keep warm function based on the response time
reaching 45 °C in test 5b.
- During the 8 hours after turning off the domestic hot water flow, the average primary
flow q₁ was 11.9 l/h with measurement uncertainty {+1.1−1.1
l/h,
- The average heat load P₁ was 87 W with measurement uncertainty {+15−15
W.
The results for test point 4b are presented in Figure 16, appendix 2.

REPORT
Date Reference Page
2019-08-23 9P02219 15 (16) Rev. 2020-05-25
RISE Research Institutes of Sweden AB
7.9 Test 5a: DHW response time, DH 70 °C flow
Immediately after test point 4a, test point 5a was carried out. A DHW flow of 0.13 l/s was
drawn until conditions were stable. For further details regarding the test setup, see Table 1.
The DHW response time might be dependent on the HIU keep-warm settings. See Test 4a:
Keep-warm, DH 70 °C flow.
- The DHW temperature (t₃₂) did not exceed 65 °C during the test.
- The DHW temperature (t₃₂) reached 45 °C 11 seconds after the DHW flow was started
and did not drop below 42 °C thereafter.
Test requirement: the keep-warm facility is considered valid if the DHW temperature t₃₂
reaches 45 °C within 15 seconds.
Test requirement: The DHW flow temperature t₃₂ is not to exceed 65 °C for more than 10
consecutive seconds.
Result: Pass.
The results for test point 5a are presented in Figure 17, appendix 2.
7.10 Test 5b: DHW response time, DH 60 °C flow
Immediately after test point 4b, test point 5b was carried out. A DHW flow of 0.13 l/s was
drawn until conditions were stable. For further details regarding the test setup, see Table 1.
The DHW response time might be dependent on the HIU keep-warm settings. See Test 4b:
Keep-warm, DH 60 °C flow.
- The DHW temperature (t₃₂) reached 45 °C 11 seconds after the DHW flow was started
and did not drop below 42 °C thereafter.
Test requirement: the keep-warm facility is considered valid if the DHW temperature t₃₂
reaches 45 °C within 15 seconds.
The results for test point 5b are presented in Figure 18, appendix 2.

REPORT
Date Reference Page
2019-08-23 9P02219 16 (16) Rev. 2020-05-25
RISE Research Institutes of Sweden AB
7.11 Overall scaling risk assessment
The HIU has no thermostatic mixing valve or temperature regulating valve on the DHW outlet.
Table 5. Scaling assessment
Test
Test designation 2a 3a
Temperature t32 above 60 °C for more
than 5 seconds No No
Temperature t12 exceeds 55 °C at any
point of the test. No No
Test designation 4a 4b
Temperature t12 exceeds 50 °C at any
point No No
RISE Research Institutes of Sweden AB Energy and circular economy - Combustion and Aerosol Technology
Performed by Examined by
__Signature_1 __Signature_2
Henrik Persson Anders Hjörnhede
Appendices
1. Component data and documentation
2. Diagrams
3. VWART Calculations

REPORT
Date Reference Page
2019-08-23 9P02219 1 (2) Rev. 2020-05-25
Appendix 1
RISE Research Institutes of Sweden AB
Appendix 1. Component data and documentation
Component Documentation
submitted Manufacturer and type
Space heating heat
exchanger
Yes Wavin WH30-40M
Domestic hot water heat
exchanger
Yes Wavin WH30-40M
Controller for space
heating
Yes Wavin Sentio CCU-208
Control valve and
actuator for space
heating
Yes Frese OPTIMA Compact DN15 4 mm
High, Wavin 4064829
Space heating strainer Yes Streno, filter nr. 1.4301
Controller for domestic
hot water
Yes Wavin DHW-201-V
Control valve and
actuator for domestic hot
water
Yes Frese OPTIMA Compact with fast acting
actuator, pressure independent balancing &
control valve
Temperature sensors Yes Tasseron NTC
Domestic hot water
isolating valve/check
valve
Yes Neoperl, DBL-31422000000
Primary side strainer Yes Streno, filter nr. 1.4301
Drain valves No -
Vent valves Yes 27725 - Flexvent 3/8 without shut-off valve
Circulation pump Yes Grundfos UPM3 Auto L
Heat meter Yes Kamstrup Multical 302
Flow meter, domestic
hot water
Yes Huba Control type 210
Joints and connections Yes Wavin dobble O-ring joint
Gaskets Yes Wavin O-rings 4054707, flat gasket
4054698
Pipes Yes Wavin pipes
Differential pressure
control valve
Yes Frese OPTIMA
Expansion vessel Yes Winkelmann flat expansion vessels
Safety valves Yes Duco ½”K(M) 2,5 bar
Shock absorber
(incoming cold water)
Yes HydroGuard
Manometer and
thermometer
Yes Cewal SPA 45004007

REPORT
Date Reference Page
2019-08-23 9P02219 2 (2) Rev. 2020-05-25
Appendix 1
RISE Research Institutes of Sweden AB
Documentation Documentation
submitted Comment
Schematic diagram and drawing showing the
structure and arrangement of the HIU with
dimensions and weight
Yes
Calefa V
installation
manual
Technical specification for electronic components
including version of software
Yes Software v. 5.0
Details of calculation programs used for the heat
exchangers
Yes Cairo 1.1 for
Wavin
Installation guide
Yes Calefa V
installation
manual
Commissioning guide
Yes Calefa V
installation
manual
Operation guide with a function
description/description of operations and care
instructions as suited to the intended user category
Yes Calefa V
installation
manual
Declaration of Conformity for CE-marked HIU:s
Yes Calefa V
installation
manual
Full parameter list for electronically controlled
HIU:s
Yes Calefa V
installation
manual
HIU marking Information present
on HIU marking Comment
Model name and type number Yes Calefa V
Serial number Yes 1129

REPORT
Date Reference Page
2019-08-23 9P02219 1 (15) Rev. 2020-05-25
Appendix 2
RISE Research Institutes of Sweden AB
Appendix 2. Diagrams
Figure 4. Results for test point 1a: space heating 1 kW, DH 70 °C supply.

REPORT
Date Reference Page
2019-08-23 9P02219 2 (15) Rev. 2020-05-25
Appendix 2
RISE Research Institutes of Sweden AB
Figure 5. Results for test point 1b: space heating 2 kW, DH 70 °C supply.
REPORT
Date Reference Page
2019-08-23 9P02219 3 (15) Rev. 2020-05-25
Appendix 2
RISE Research Institutes of Sweden AB
Figure 6. Results for test point 1c: space heating 4 kW, DH 70 °C supply.

REPORT
Date Reference Page
2019-08-23 9P02219 4 (15) Rev. 2020-05-25
Appendix 2
RISE Research Institutes of Sweden AB
Figure 7. Results for test point 1d: space heating 1 kW, DH 60 °C supply.

REPORT
Date Reference Page
2019-08-23 9P02219 5 (15) Rev. 2020-05-25
Appendix 2
RISE Research Institutes of Sweden AB
Figure 8. Results for test point 1e: space heating 2 kW, DH 60 °C supply.

REPORT
Date Reference Page
2019-08-23 9P02219 6 (15) Rev. 2020-05-25
Appendix 2
RISE Research Institutes of Sweden AB
Figure 9. Results for test point 1f: space heating 4 kW, DH 60 °C supply.

REPORT
Date Reference Page
2019-08-23 9P02219 7 (15) Rev. 2020-05-25
Appendix 2
RISE Research Institutes of Sweden AB
Figure 10. Results for test point 2a: DHW only, DH 70 °C supply.

REPORT
Date Reference Page
2019-08-23 9P02219 8 (15) Rev. 2020-05-25
Appendix 2
RISE Research Institutes of Sweden AB
Figure 11. Results for test point 2b: DHW only, DH 60 °C supply.
REPORT
Date Reference Page
2019-08-23 9P02219 9 (15) Rev. 2020-05-25
Appendix 2
RISE Research Institutes of Sweden AB
Figure 12. Results for test point 3a: Low flow DHW at 0.02 l/s, DH 70 °C supply.

REPORT
Date Reference Page
2019-08-23 9P02219 10 (15) Rev. 2020-05-25
Appendix 2
RISE Research Institutes of Sweden AB
Figure 13. Results for test point 3c: Low flow DHW at manufacturer stated minimum DHW flow of
0.03 l/s, DH 70 °C supply.

REPORT
Date Reference Page
2019-08-23 9P02219 11 (15) Rev. 2020-05-25
Appendix 2
RISE Research Institutes of Sweden AB
Figure 14. Results for test point 3b: Low flow DHW, DH 60 °C supply.

REPORT
Date Reference Page
2019-08-23 9P02219 12 (15) Rev. 2020-05-25
Appendix 2
RISE Research Institutes of Sweden AB
Figure 15. Results for test point 4a: Keep-warm, DH 70 °C supply

REPORT
Date Reference Page
2019-08-23 9P02219 13 (15) Rev. 2020-05-25
Appendix 2
RISE Research Institutes of Sweden AB
Figure 16. Results for test point 4b: Keep-warm, DH 60 °C supply.

REPORT
Date Reference Page
2019-08-23 9P02219 14 (15) Rev. 2020-05-25
Appendix 2
RISE Research Institutes of Sweden AB
Figure 17. Results for test point 5a: DHW response time, DH 70 °C supply.

REPORT
Date Reference Page
2019-08-23 9P02219 15 (15) Rev. 2020-05-25
Appendix 2
RISE Research Institutes of Sweden AB
Figure 18. Results for test point 5b: DHW response time, DH 60 °C supply.

REPORT
Date Reference Page
2019-08-23 9P02219 1 (2) Rev. 2020-05-25
Appendix 3
RISE Research Institutes of Sweden AB
Appendix 3. VWART calculations
High temperature VWART calculations with keep warm function active
Test
carri
ed o
ut b
y RIS
E on
Mar
ch to
May
2019
Man
ufac
ture
r: W
arm
aflo
or Lt
d; M
odel
: Cal
efa V
; Ser
ial n
umbe
r: 11
29; Y
ear o
f man
ufac
ture
: 201
9
VWAR
T cal
cula
tion
prep
ared
by H
enrik
Per
sson
of R
ISE o
n 17
June
2019
VWAR
TVo
lum
e
DHW
14,6
24
,06
Stan
dby
40,6
39
,90
Spac
e He
atin
g40
,1
43,3
7
Perio
dVW
ART
% Ti
me
No H
eatin
g30
,8
92%
Heat
ing
39,2
8%
Over
all
31
DHW
Dra
w te
st re
sults
Post
DHW
Dra
w (6
0 sec
onds
)
Pow
er (W
)Pr
imar
y flo
w (m
3/hr
)Re
turn
Tem
p(°C
)Pr
imar
y flo
w (m
3/hr
)Av
g Ret
urn
Tem
p(°C
)kW
h Ho
urs
Volu
me
pa (m
3)Ev
ents
Av
erag
e du
ratio
n (s
ecs)
Volu
me
pa (m
3)
Low
1057
20,
170
14,6
0,00
3
12
,6
729
68,9
6
11
,722
10
000
30
0,25
0
Med
ium
1863
00,
303
14,4
0,00
1
13
,4
297
15,9
4
4,
830
660
75
0,01
4
High
2387
20,
388
14,8
0,00
2
14
,0
444
18,6
0
7,
216
300
145
0,
024
Stan
dy te
st re
sults
Stan
dby V
olum
es p
a
Prim
ary f
low
(m3/
hr)
Retu
rn Te
mp(
°C)
Hour
sVo
lum
e pa
(m3)
Stan
dby
0,00
5
40
,6
7 981
39,9
0
Spac
e He
atin
g tes
t res
ults
Pow
er (W
)Pr
imar
y flo
w (m
3/hr
)Re
turn
Tem
p(°C
)kW
h pa
Hour
sVo
lum
e pa
(m3)
1kW
p96
90,
029
39,8
9810
1,14
2,
933
2kW
p18
410,
055
40,0
787
427,
49
23,5
12
4kW
p38
380,
115
40,3
565
147,
21
16,9
29
DHW
Dra
w V
olum
es p
er an
num
Post
DW
H Dr
aw V
olum
es p
er an
num
Spac
e He
atin
g Vol
umes
pa

REPORT
Date Reference Page
2019-08-23 9P02219 2 (2) Rev. 2020-05-25
Appendix 3
RISE Research Institutes of Sweden AB
Low temperature VWART calculation with keep warm function active.
Low
tem
pera
ture
VW
ART C
alcu
latio
n fo
r War
maf
loor
Ltd
with
keep
war
m ac
tive
Test
carri
ed o
ut b
y RIS
E on
Mar
ch to
May
2019
Man
ufac
ture
r: W
arm
aflo
or Lt
d; M
odel
: Cal
efa V
; Ser
ial n
umbe
r: 11
29; Y
ear o
f man
ufac
ture
: 201
9
VWAR
T cal
cula
tion
prep
ared
by H
enrik
Per
sson
of R
ISE o
n 18
June
2019
VWAR
TVo
lum
e
DHW
14,6
29
,52
Stan
dby
40,5
96
,32
Spac
e He
atin
g34
,9
52,6
6
Perio
dVW
ART
% Ti
me
No H
eatin
g34
,4
93%
Heat
ing
34,9
7%
Over
all
34
DHW
Dra
w te
st re
sults
Post
DHW
Dra
w (6
0 sec
onds
)
Pow
er (W
)Pr
imar
y flo
w (m
3/hr
)Re
turn
Tem
p(°C
)Pr
imar
y flo
w (m
3/hr
)Av
g Ret
urn
Tem
p(°C
)kW
h Ho
urs
Volu
me
pa (m
3)Ev
ents
Av
erag
e du
ratio
n (s
ecs)
Volu
me
pa (m
3)
Low
9406
0,18
4
14
,5
0,
007
13,3
72
977
,50
14,2
61
1000
030
0,
583
Med
ium
1527
00,
300
14,6
0,00
5
13
,9
297
19,4
5
5,
835
660
75
0,06
9
High
2005
40,
393
15,0
0,00
6
14
,6
444
22,1
4
8,
701
300
145
0,
073
Stan
dy te
st re
sults
Stan
dby V
olum
es p
a
Prim
ary f
low
(m3/
hr)
Retu
rn Te
mp(
°C)
Hour
sVo
lum
e pa
(m3)
Stan
dby
0,01
2
40
,5
8 027
96,3
2
Spac
e He
atin
g tes
t res
ults
Pow
er (W
)Pr
imar
y flo
w (m
3/hr
)Re
turn
Tem
p(°C
)kW
h pa
Hour
sVo
lum
e pa
(m3)
1kW
p10
780,
040
35,0
9890
,91
3,63
6
2kW
p20
550,
075
34,9
787
382,
97
28,7
23
4kW
p40
350,
145
35,0
565
140,
02
20,3
04
DHW
Dra
w V
olum
es p
er an
num
Post
DW
H Dr
aw V
olum
es p
er an
num
Spac
e He
atin
g Vol
umes
pa