Report and Recommendations of the Task Force on · PDF fileReport and Recommendations of the...
35
Report and Recommendations of the Task Force on Gateway Mathematics Success April 2015
Transcript of Report and Recommendations of the Task Force on · PDF fileReport and Recommendations of the...

Report and Recommendations of the
Task Force on Gateway Mathematics Success
April 2015

Mr. Kevin J. Page, Chairman
Mr. Rick Trachok, Vice Chairman
p = i
NSHE Leadership
Dr. Andrea Anderson
Mr. Robert Davidson
Dr. Jason Geddes
Mr. James Dean Leavitt
Mr. Kevin C. Melcher
Mr. Cedric Crear
Dr. Mark W. Doubrava
Mr. Trevor Hayes
Mr. Sam Lieberman
Ms. Allison Stephens
Mr. Michael B. Wixom
Mr. Scott Young, Acting Chief Executive Officer
Board of Regents
Officers of the Nevada System of Higher Education
Mr. Daniel J. Klaich, Chancellor
Dr. Len Jessup, President University of Nevada, Las Vegas
Mr. Bart Patterson, President Nevada State College
Dr. Mark Curtis, President Great Basin College
Mr. Chester Burton, President Western Nevada College
Dr. Marc Johnson, President University of Nevada, Reno
Dr. Michael Richards, President College of Southern Nevada
Dr. Maria Sheehan, President Truckee Meadows Community College
Dr. Stephen Wells, President Desert Research Institute
Task Force on Gateway Mathematics Success
p = ii
NSHE Task Force on Gateway Mathematics Success 2014-2015
Task Force on Gateway Mathematics Success
Chris Herald, Chair Mathematics Professor
University of Nevada, Reno
Crystal Abba, Facilitator Vice Chancellor for Academic Affairs Nevada System of Higher Education
William Speer
Director, Math Learning Center University of Nevada, Las Vegas
Swatee Naik
Mathematics and Statistics Professor University of Nevada, Reno
Serge Ballif Assistant Professor of Mathematics
Nevada State College
Patrick Villa Math Department Chair
College of Southern Nevada
John Newman Math Department Chair
Great Basin College
William (Bill) Newhall Math Instructor
Truckee Meadows Community College
Linda Heiss Senior Director of Institutional Research
Nevada System of Higher Education
Eli Reilly Research Analyst
Nevada System of Higher Education
Staff
Carl Reiber Vice Provost for Academic Affairs University of Nevada, Las Vegas
Darren Divine Vice President for Academic Affairs
College of Southern Nevada
Ex Officio Members
Gary Schwartz Mathematics Professor
Western Nevada College
Members
Part I: Mathematics and Nevada’s Completion Agenda………………………………………. Part II: Data Analysis and Task Force Findings……………………………………………….. Part III: Task Force Recommendations………………………..……………………………….. Appendix A: Data Tables…………………………………………………………………………. Appendix B: Policy Proposal (Title 4, Chapter 16, Section1)………………………………....
p = iii
Table of Contents
Task Force on Gateway Mathematics Success
1 4 14 17 28

In 2010, under the leadership of Governor Brian Sandoval, Nevada joined the Complete College America (CCA) alliance, and the Board of Regents and Nevada System of Higher Education (NSHE) committed to an aggressive completion agenda to increase the number of students awarded degrees and credentials of value. As NSHE worked with CCA over the last five years to increase college attainment rates in Nevada, numerous policy changes and initiatives have been adopted by the Board of Regents, including limiting the number of credits required for degrees (120/60 credit policy); a low-yield program policy to reinforce degree productivity; an excess credit fee for students who have earned more than 150 percent of the credits required for a degree, but not yet earned a degree; examination of ways to address the challenges of access and affordability for Nevada students; a new funding formula and performance pool that focuses on student and institutional success; and a 15 to Finish campaign to encourage students to enroll full-time and graduate on-time. (For more information on these initiatives, see the NSHE website at www.nevada.edu.) In addition to the policy changes and initiatives embraced by the Board of Regents to date, modernizing undergraduate mathematics education is a key lever for improving college completion. Data at both the national and state levels indicate that not completing a gateway mathematics course within the first year of instruction correlates with a greatly reduced chance of student success and timely graduation. Complete College America regularly highlights – nationally and for Nevada – the important role that gateway mathematics courses can play in the persistence and success of students in higher education. The national dialogue on reducing barriers to student success includes (1) ensuring that the required mathematics courses are relevant to the programs in which students are enrolled, and (2) decreasing the length of remedial course sequences by offering pathways that accelerate remediation and/or co-requisite model courses, e.g., courses that provide college credit bearing coursework along with remediation in the same semester. Both of the latter models provide opportunities to complete the gateway mathematics course sooner, and earlier completion of the gateway mathematics course correlates strongly with higher rates of persistence and graduation. Background: NSHE Remedial Transformation Project In the past five years, the Chancellor’s Office, institutional academic officers, and mathematics faculty participated in extensive examinations of remedial/developmental coursework and reviewed data that steered discussions and changes in institutional approaches to gateway courses to promote student success. This work is a critical component to the State’s completion agenda adopted by the Board of Regents and the aggressive goals to graduate more students and eliminate unnecessary barriers along the way. Starting in 2010, the Chancellor created the Remedial Transformation Project with two steering committees, one for English and one for mathematics. The work and findings of the steering committees are detailed in the Project’s 2012 Report to the Board of Regents. In particular, the report notes:
From the beginning, institutions were encouraged to approach change through experimental pilot projects, the testing of new models and a continuous examination of data as they proceeded. Each institution shaped their current remedial program on the basis of the data on their own students’ success, and there is no mandate for standardized instructional methodology across all institutions. This commitment to evidence-based change and faculty-driven improvements has been key to the success of this project. In each institution’s update [report on pilot programs, etc.], there are many different models. However, there are a number of shared themes or approaches.
p = 1
Task Force on Gateway Mathematics Success
Part I: Mathematics and Nevada’s Completion Agenda

Course redesign to enable students to complete remedial instruction and an entry-level course within two semesters;
Curricular alignment between remedial courses and entry-level courses; Inclusion of reading instruction for students for whom reading is a barrier in
mathematics and English; More accurate student placement through multiple criteria; Different pathways defined for students based on their level of deficiency
and major or course of study; Conversion of remedial courses at the lowest levels to self-funded
skills-based laboratories; and Partnerships with school districts to offer early testing and to improve
college readiness of high school graduates. Building on the work of the Remedial Transformation Project, NSHE convened the Gateway Course Success Summit in April 2014 to continue the discussion of improving student success in mathematics. Mathematics faculty and academic officers representing all seven NSHE teaching institutions attended, along with national experts who participated in a panel on co-requisite remediation models. The Task Force on Gateway Mathematics Success is a continuation of that work and aims to build clear and structured pathways into and through entry-level mathematics courses. NSHE also convened a second summit in November 2014 to focus on English gateway course success, but that work, while related, is not the focus of this report. Creation of the NSHE Task Force on Gateway Mathematics Success The Charles Dana Center at the University of Texas-Austin (Dana Center) has for many years been leading the development of curricula for pathways through remediation and a gateway course in mathematics, statistics or quantitative reasoning. In 2014, CCA and the Dana Center began facilitating dialogs in selected states to identify needed mathematics curriculum changes and other related policy changes to improve success in gateway mathematics courses, and on implementing these changes on statewide scales. The momentum created by NSHE’s April 2014 summit on mathematics precipitated NSHE’s participation in the CCA/Dana Center’s Building Math Pathways into Programs of Study initiative. Nevada was selected to participate in the initiative, leading to the establishment of the Task Force on Gateway Mathematics Success by the Chancellor. The Task Force included mathematics faculty from NSHE’s four-year and two-year institutions who were charged broadly with making recommendations on changes that the System should make to increase success in gateway mathematics courses, and thereby increase degree completion. The efforts of the Task Force and its recommendations have been driven by data about student performance through the different traditional curricular mathematics pathways and more innovative pathways piloted recently at some institutions. The data described throughout the report are detailed in Tables 1 through 7 of Appendix A. As context for the work of the Task Force, there have been a number of System-wide conversations in recent years regarding the success and desire to scale up co-requisite models of remediation. Co-requisite models allow students who would otherwise be placed into a remedial course to be enrolled in a credit bearing, college level course with additional support in areas where remediation is needed.
p = 2
Task Force on Gateway Mathematics Success

p = 3
Changing Landscape Affecting Undergraduate Mathematics Education Several forces are driving the modernization of mathematics education at postsecondary institutions in Nevada and across the United States and affecting the form such reformative efforts take. 1. Focus on Completion
Across the United States, more and more states are replacing enrollment with completion as the basis of higher education funding. This shift to “performance funding” represents an entirely new approach by which states and legislatures view and measure success in postsecondary education. This change in performance benchmarks is focusing considerable attention on remediation programs and other curricular matters previously under the exclusive purview of campus officials. State executives, legislators, and private foundations are becoming increasingly active in efforts to reform specific aspects of public higher education, and these groups frequently cite mathematics requirements, in particular, lengthy remedial sequences, as a significant factor affecting student success and graduation.
2. Changes in College Readiness of K-12 Graduates The NSHE 2013-14 Remedial Placement and Enrollment Report shows that 55.6 percent of recent Nevada high school graduates placed into coursework that is below the college level in mathematics, English, or both. Efforts to reform the K-12 curriculum in Nevada and across the nation are well underway. Initiatives like the Common Core State Standards (and, in Nevada, the Nevada Academic Content Standards) seek to better equip Nevada students with skills necessary for success in college and for competing in the 21st century’s new economic landscape. These efforts necessitate updating the alignment between secondary and postsecondary curricula. In addition, implementation of a statewide 11th grade assessment tied to the new standards necessitates updating the way student college readiness is evaluated at the higher education institutions.
3. Economic Forces Many state and national reports highlight the fact that more jobs today require postsecondary education than ever before. For Nevada, by 2020, 58 percent of the jobs will require a career certificate or college degree. Currently, 30 percent of Nevada’s young adults have an associate degree or higher; thus, there is a 28 percent “skills gap.” This skills gap must be addressed as Nevada’s economy continues to diversify and advanced technology plays an ever more important role in the 21st century’s “knowledge economy.” Workers are far more likely to move between industries over the span of their career and hence will likely require retraining. Upward mobility of Nevada’s citizens, and by extension the economic competitiveness of the state, are therefore directly tied to the educational attainment levels and capability of workers to learn new skills.
In summary, the Nevada System of Higher Education’s focus on undergraduate mathematics completion is driven by both internal and external forces. The new performance funding mechanism, the ongoing need for remedial education, and the nature of future workforce demand all create a social and economic imperative for improving student success in postsecondary education. These cumulative forces represent the context in which the Task Force on Gateway Mathematics Success conducted its work.
Task Force on Gateway Mathematics Success
Co-requisite models provide remedial support during the same semester as the credit-bearing course. In November 2014, the Chancellor issued a memorandum on e-learning that included a directive to the institutions to establish co-requisite options for students by Fall 2015. The efficacy of co-requisite models has been demonstrated both nationally and, in Nevada, through the work of the University of Nevada, Reno (UNR), where such models were piloted for several years. Therefore, the work of the Task Force began with a review of system-wide data, including data from the co-requisite model pilots.

p = 4
Task Force on Gateway Mathematics Success
The Task Force on Gateway Mathematics Success collected and analyzed a variety of system-wide and institution-level data on student performance in NSHE gateway mathematics courses. The data and analyses of the Task Force are summarized here. A. Importance of Timely Gateway Mathematics Success Figure 1 indicates the percentage of Fall 2012 first-time, degree-seeking freshmen who completed a gateway mathematics course within the first two years of enrollment at each NSHE institution.
Figure 1. Fall 2012 Cohort - Percent Completed Gateway Math within First 2 Years
Part II: Data Analysis and Task Force Findings
Completed Gateway Math in 1st Year
Completed Gateway Math in 2nd Year
As Figure 1 shows, outside of the universities only 16.9 to 35.8 percent of first-time, degree-seeking freshman in the Fall 2012 cohort completed a gateway mathematics course within two years of enrollment. For comparison, Fall 2007 data depicted a similar pattern; between 2007 and 2012 there was no evidence of a significant increase in the percentage of students completing the gateway mathematics course within the first two years of enrollment. These data demonstrate that the current NSHE curricular pathways through remedial and gateway mathematics courses have troublingly low success rates. The much higher success rate at UNR, however, gives cause for optimism that scaling up recent successful innovations across the rest of the NSHE System, including co-requisite models and mandating continuous enrollment, will lead to significant improvements in statewide success rates. It is important to recognize that the data included in Figure 1 does not reflect the impact of many recent institutional initiatives to address concerns raised through the Remedial Transformation Project about the delivery of remediation and methods to ensure students complete the appropriate entry-level English and mathematic coursework within the first 30 college-level credits, as required by current Board policy. One exception is the work done at UNR. The percent of UNR first-time, degree-seeking students that completed the gateway mathematics course within one year increased from 71.2 percent for the Fall 2007 cohort to
Cohort Definition: First-time, degree-seeking freshmen
UNLV UNR NSC CSN GBC TMCC WNC

p = 5
Task Force on Gateway Mathematics Success
79.6 percent for the Fall 2012 cohort. That increase can be attributed in large part to the co-requisite model gateway courses that were piloted in 2010-11 academic year, and implemented at scale in Fall 2012. The Task Force recognizes the importance of completing gateway coursework early, and therefore is recommending revisions to Board policy that are discussed in Part III of this report. These recommendations are intended to ensure that co-requisite models and other accelerated pathways to gateway course completion are available and utilized at all NSHE institutions. The Task Force recognized that corrective models that prove to be effective at the universities may not necessarily be equally effective at the two-year colleges. The challenges facing NSHE’s two-year colleges differ from those of the universities due in part to the open access policies of the community colleges, and also to the older and non-residential student characteristics. For reasons that vary widely, many students enroll in two-year colleges because they do not meet the admission requirements of the universities. These students often have fewer general academic skills, including but not limited to time management, motivation, study skills, commitment, and critical thinking and reasoning skills. Thus, remediation at the two-year colleges is often more involved and complicated and frequently less successful. Even students placing into high level remedial courses or co-requisite model gateway courses often struggle due to these same deficiencies in general academic skills. Older and non-residential students often have work and family conflicts that limit the time, effort, and concentration they can devote to succeed in gateway courses, especially during their first semester as they adjust their lives to include academics. These factors complicate the challenge of increasing student success rates and reveal the need for more focused innovations. But, clearly, accelerated programs like the co-requisite models recommended in this report appear to result in a significant, overall increase in student success rates through gateway mathematics courses, even if this improvement may not be as great at open access institutions. In fact, many of these negative factors hindering student success among community college students appear to be accentuated by the traditional, extended remedial sequences causing students to drop out early.

p = 6
Task Force on Gateway Mathematics Success
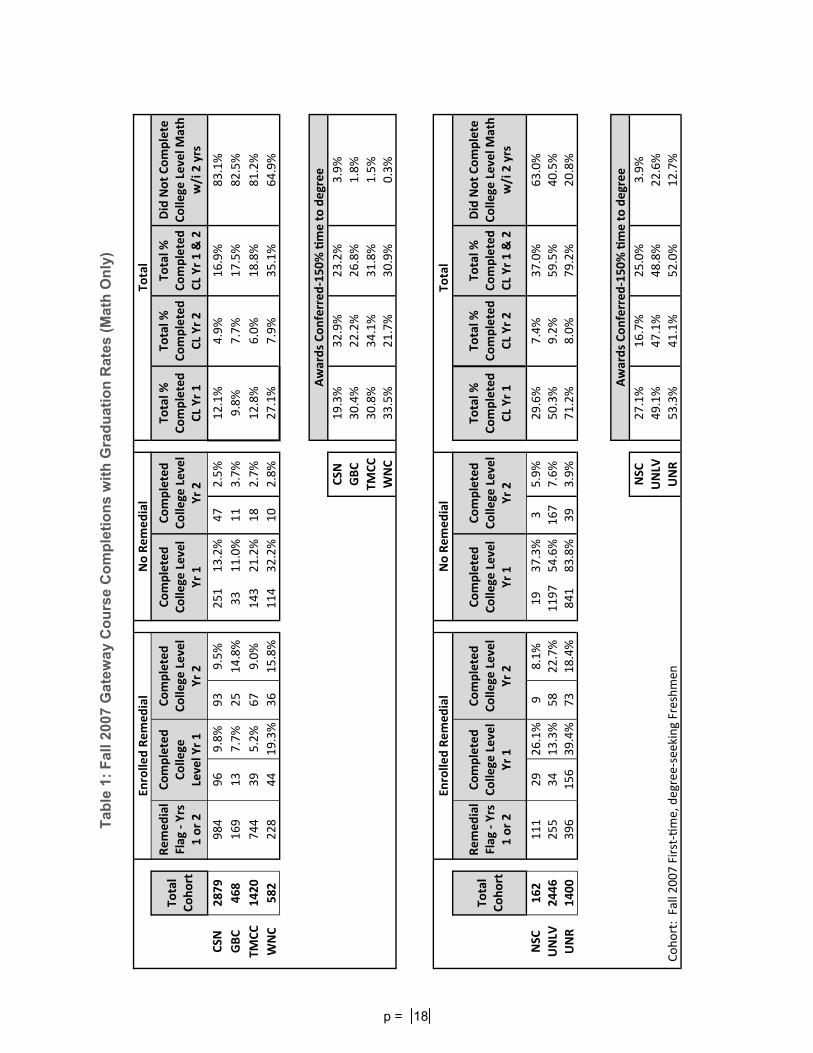
Table 1. Impacts on Graduating Students
Fall 2007 cohort
% Completed Gateway
Math in first 2 years
150% Graduation
Rate
UNLV 59.5% 48.8%
UNR 79.2% 52.0%
NSC 37.0% 25.0%
CSN 16.9% 23.2%
GBC 17.5% 26.8%
TMCC 18.8% 31.8%
WNC 35.1% 30.9%
% not Completed
Gateway Math in first 2 years
150% Graduation
Rate
40.5% 22.6%
20.8% 12.7%
63.0% 3.9%
83.1% 3.9%
82.5% 1.8%
81.2% 1.5%
64.9% 0.3%
NOTE: 150% graduation rates include students at the 4-year institutions who received a bachelor’s degree within six years and students at the 2-year institutions who received an associate’s degree within three years, certificate within 1.5 years, or bachelor’s degree within six years.
Task Force Finding: Timely completion of gateway mathematics courses correlates with students persistence and degree completion. The data included in Table 1 begs the question, why are students not completing the gateway mathematics courses in a timely manner? There are a number of factors that keep students from enrolling in and completing the appropriate gateway mathematics courses. Advising continues to be a factor, in addition to part-time enrollment. It appears that part-time students in particular may be delaying enrollment into the gateway mathematics course beyond the first year of enrollment. B. The “Right” Math Much of the national dialog concerning general education mathematics focuses on college algebra and its appropriateness as a “default mathematics requirement.” Within NSHE, there are two courses centered on college algebra: Math 124 and Math 126. (Common course numbering across the system requires that courses with comparable content be identified by the same number at all institutions, facilitating transfer/articulation across the state.) Through an examination of system-wide data, the Task Force determined that college algebra is not the default general education mathematics requirement at any NSHE institution.
Table 1 suggests that there is a strong positive correlation between timely completion of gateway mathematics courses and graduation. Even with the differences in student preparation and programmatic mission between community colleges and four-year institutions, students who successfully complete a gateway mathematics course within two years of initial enrollment are far more likely to graduate. For this reason, improving the success rates through remediation or co-requisite courses and gateway mathematics courses emerged as a top NSHE priority.
p = 7
Task Force on Gateway Mathematics Success
Each institution offers Math 120, Fundamentals of College Mathematics. This is a course designed to give students outside the quantitative disciplines the broad mathematical and statistical skills they need to be quantitatively literate citizens. Math 120 provides more applications of mathematics to real world settings, including an introduction to probability and statistics that will be valuable for anyone living in the modern information age. The Task Force spent time discussing what content is most important, timely, and relevant to include in a course like Math 120, whose overarching aim is general mathematics literacy. Mathematics is a dynamic field, and the content and delivery of mathematics instruction continues to evolve. Mathematics, science and statistics standards documents (National Council of Teachers of Mathematics, 2000; American Statistical Association, 2005; Common Core State Standards, 2010; Next Generation Science Standards, 2013) describe the teaching and learning of mathematics as an integrated collection of processes and content elements. Task Force members agreed that courses that fulfill this requirement should include college level mathematics that requires a foundational level of mathematical skill as a prerequisite. The Task Force plans to continue its discussions on the content of such a course. The remainder of this section focuses on system-wide data that the Task Force examined concerning enrollment patterns and success rates for students who enroll in college algebra courses (Math 124 or Math 126). Math 126, Pre-calculus I, covers the algebra portion—or, more specifically, the non-trigonometric portion—of pre-calculus. That is, it covers functions, domain and range, graphical representation of functions, graphical features such as local maxima, minima and asymptotes, inverse functions, and logarithms and exponentials. Algebraic techniques covered include factoring polynomials to find zeros or solve polynomial inequalities, or completing the square to interpret a quadratic function as a shifted, dilated and/or reflected version of y=x2. These lay the foundation for a thorough treatment of trigonometric functions in the subsequent course, Math 127, Pre-calculus II. Math 124, taught at some of NSHE institutions, is entitled College Algebra. Math 124 has considerable overlap with Math 126, but delves less deeply into some of these topics, and instead develops row reduction techniques for solving linear systems and introduces the binomial theorem. Math 124 is designed to better prepare students for Math 132, entitled Finite Mathematics, which covers logic, sets, probability, systems of linear equations, and linear programming, with applications to business and social sciences. College algebra courses are designed to prepare students for higher mathematics and science courses that require more advanced algebra skills and deeper knowledge of functions. For instance, business students may take Math 124 or Math 126 to prepare for Math 176, Introductory Calculus for Business and Social Sciences. On the other hand, students pursuing STEM programs use Math 126 (and the subsequent Math 127 covering the theory of trigonometric functions, identities and techniques) to prepare for Math 181, the gateway into calculus-based science courses. For specific curricular reasons, there are a few programs that require only Math 124 or Math 126 and nothing higher. Task Force Finding: A comprehensive examination of the mathematics requirements of NSHE programs found no programs requiring college algebra as a default, without any particular curricular reason for the requirement.

p = 8
Task Force on Gateway Mathematics Success
CSN
CSN
WNC
Figure 2. Subsequent Mathematics Enrollment within Two Years - By Institution Fall 2012 Cohort
UNLV
GBC
UNLV
NSC
TMCC
Math 126
UNR
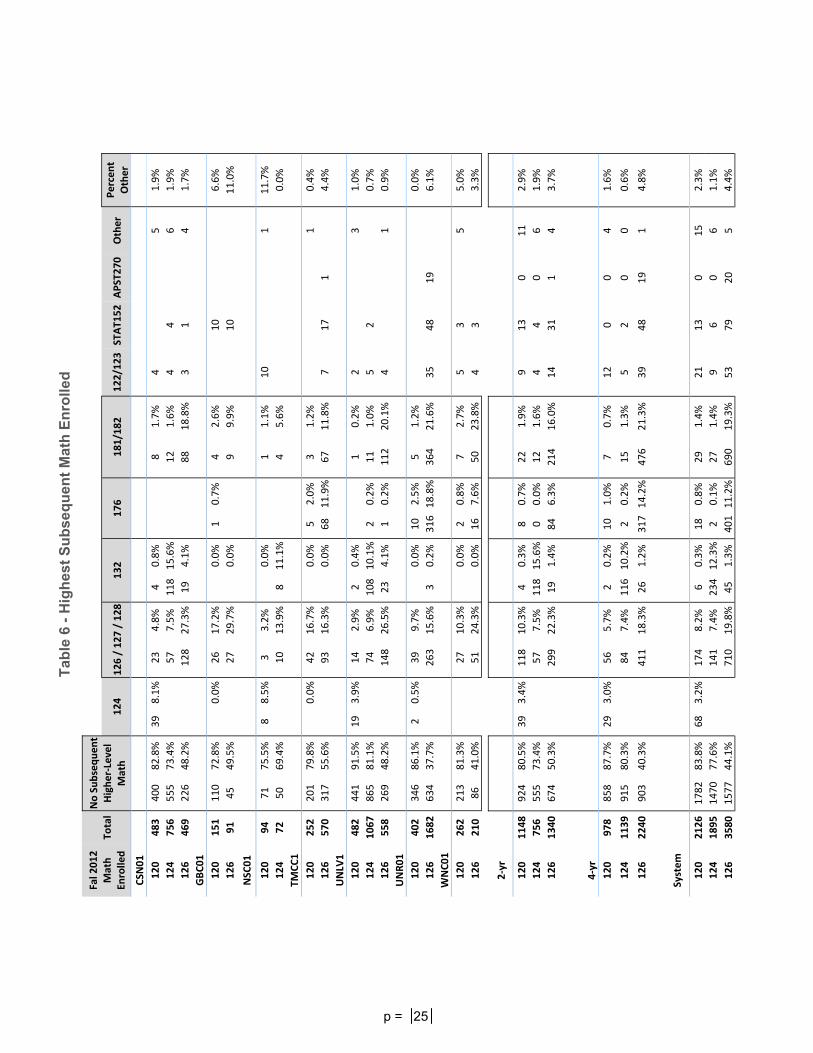
C. Subsequent Enrollment Patterns - Math 124 and Math 126 The following data examines the highest subsequent mathematics course students enrolled in within two years of enrolling in Math 124 or Math 126.
Math 124
126 / 127 / 128 132 / 176 181 / 182 Other math (not on calculus path)
No subsequent higher math
81.1% 69.4%
10.3%
11.1%
73.4%
15.6%
48.2% 37.7%
48.2%
49.5% 55.6%
41.0% 11.9%
7.6%
19.0%
21.6%
15.6%
6.1%
20.1%
26.5%
4.3%
0.9%
29.7%
9.9% 0.0%
11.0%
16.3%
11.8%
4.4%
24.3%
23.8%
3.3%
27.3%
1.7%
18.8%
4.1%
6.9%
1.0%
0.7%
13.9%
0.0%
5.6%
7.5%
1.6%
1.9%

Figure 2 shows that the majority of students across the System who enrolled in college algebra did not go on to complete a higher-level mathematics course. Possible explanations for a student not taking a higher mathematics course after Math 124 or Math 126 include:
The student’s program requires only Math 124 or Math 126, and so by earning credit in this class, the student completed the mathematics requirement for his or her program of study.
The student needs one or more higher mathematics courses for his or her chosen
program of study, but has failed to enroll in the next course. The student chose to take Math 124 or Math 126, even though Math 120 satisfies
the requirement for the student’s selected program of study. The first of these explains only a fraction of the students, due to the limited number of programs with Math 124 or Math 126 as the required mathematics course. The second scenario suggests a lack of needed advising, although one must determine to what extent the problem is repeated failure in the college algebra course, and to what extent the problem is a lack of continuously enrolling in mathematics courses. The third scenario raises the question why non-STEM students are taking Math 124 or Math 126 instead of Math 120. Do they understand their program requirements? Are they enrolling in this college algebra course while planning on a quantitative major, but then changing to a non-quantitative major after earning credit for it? Are they taking Math 124 or Math 126 because they are undecided and these courses satisfy the STEM and non-STEM program requirements?
p = 9
Task Force on Gateway Mathematics Success
p = 10
Task Force on Gateway Mathematics Success
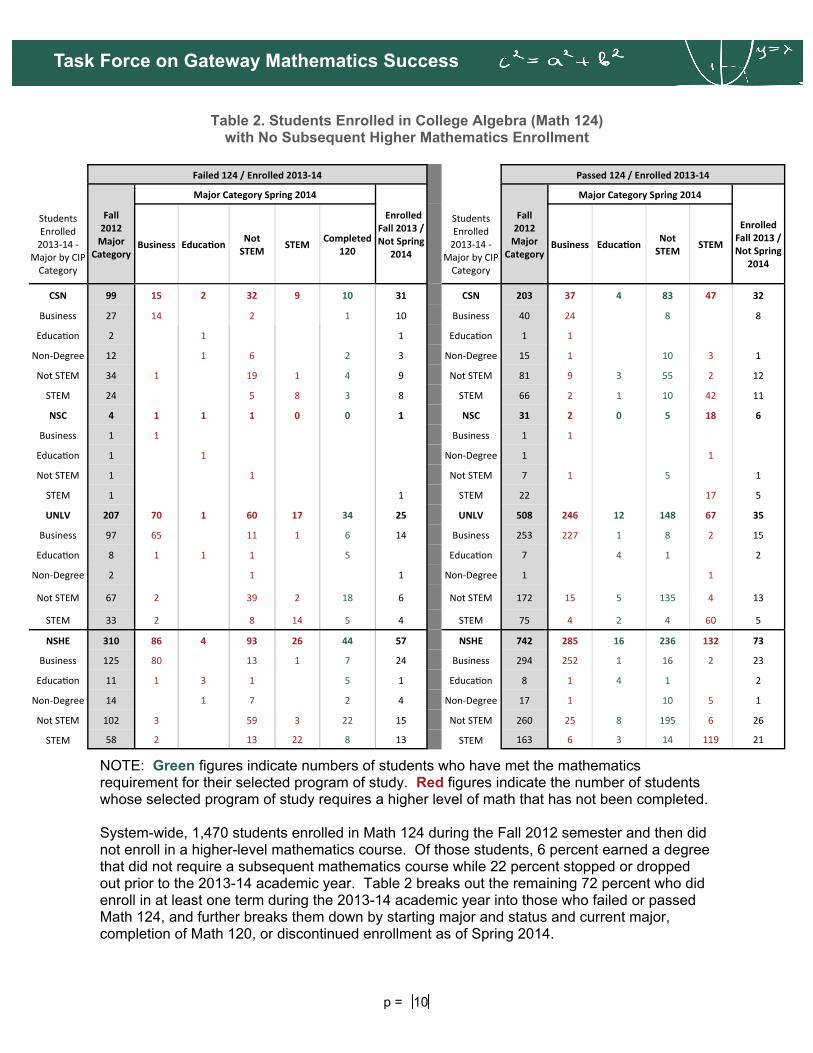
Table 2. Students Enrolled in College Algebra (Math 124) with No Subsequent Higher Mathematics Enrollment
Failed 124 / Enrolled 2013‐14 Passed 124 / Enrolled 2013‐14
Fall 2012 Major
Category
Major Category Spring 2014
Enrolled Fall 2013 / Not Spring
2014
Major Category Spring 2014
Students Enrolled 2013‐14 ‐
Major by CIP Category
Business Educa on Not STEM
STEM Completed
120
Students Enrolled 2013‐14 ‐
Major by CIP Category
Business Educa on Not STEM
STEM
Enrolled Fall 2013 / Not Spring
2014
CSN 99 15 2 32 9 10 31 CSN 203 37 4 83 47 32
Business 27 14 2 1 10 Business 40 24 8 8
Educa on 2 1 1 Educa on 1 1
Non‐Degree 12 1 6 2 3 Non‐Degree 15 1 10 3 1
Not STEM 34 1 19 1 4 9 Not STEM 81 9 3 55 2 12
STEM 24 5 8 3 8 STEM 66 2 1 10 42 11
NSC 4 1 1 1 0 0 1 NSC 31 2 0 5 18 6
Business 1 1 Business 1 1
Educa on 1 1 Non‐Degree 1 1
Not STEM 1 1 Not STEM 7 1 5 1
STEM 1 1 STEM 22 17 5
UNLV 207 70 1 60 17 34 25 UNLV 508 246 12 148 67 35
Business 97 65 11 1 6 14 Business 253 227 1 8 2 15
Educa on 8 1 1 1 5 Educa on 7 4 1 2
Non‐Degree 2 1 1 Non‐Degree 1 1
Not STEM 67 2 39 2 18 6 Not STEM 172 15 5 135 4 13
STEM 33 2 8 14 5 4 STEM 75 4 2 4 60 5
NSHE 310 86 4 93 26 44 57 NSHE 742 285 16 236 132 73
Business 125 80 13 1 7 24 Business 294 252 1 16 2 23
Educa on 11 1 3 1 5 1 Educa on 8 1 4 1 2
Non‐Degree 14 1 7 2 4 Non‐Degree 17 1 10 5 1
Not STEM 102 3 59 3 22 15 Not STEM 260 25 8 195 6 26
STEM 58 2 13 22 8 13 STEM 163 6 3 14 119 21
Fall 2012 Major
Category
NOTE: Green figures indicate numbers of students who have met the mathematics requirement for their selected program of study. Red figures indicate the number of students whose selected program of study requires a higher level of math that has not been completed. System-wide, 1,470 students enrolled in Math 124 during the Fall 2012 semester and then did not enroll in a higher-level mathematics course. Of those students, 6 percent earned a degree that did not require a subsequent mathematics course while 22 percent stopped or dropped out prior to the 2013-14 academic year. Table 2 breaks out the remaining 72 percent who did enroll in at least one term during the 2013-14 academic year into those who failed or passed Math 124, and further breaks them down by starting major and status and current major, completion of Math 120, or discontinued enrollment as of Spring 2014.

p = 11
Task Force on Gateway Mathematics Success
Table 3. Students Enrolled in College Algebra (Math 126) with No Subsequent Higher Mathematics Enrollment
Failed 126/ Enrolled 2013‐14 Passed 126 / Enrolled 2013‐14
Fall 2012 Major
Category
Major Category Spring 2014
Enrolled Fall 2013 / Not Spring
2014
Major Category Spring 2014
Enrolled Fall 2013 / Not Spring
2014
Students Enrolled 2013‐14 ‐
Major by CIP Category
Business Educa on Not STEM
STEM Completed
120
Students Enrolled 2013‐14 ‐
Major by CIP Category
Business Educa on Not STEM
STEM
CSN 69 7 2 15 25 5 15 CSN 64 7 0 23 27 7
Business 8 3 1 1 1 2 Business 4 3 1
Educa on 2 1 1 Educa on 0
Non‐Degree 7 2 2 1 2 Non‐Degree 4 2 2
Not STEM 19 1 8 3 3 4 Not STEM 27 2 17 4 4
STEM 33 1 1 3 20 1 7 STEM 29 2 4 21 2
GBC 12 0 0 0 4 4 4 GBC 9 1 1 3 3 1
Business 0 Business 1 1
Educa on 2 2 Non‐Degree 3 1 1 1
Not STEM 3 2 1 Not STEM 1 1
STEM 7 4 2 1 STEM 4 1 3
TMCC 128 13 5 28 44 17 21 TMCC 72 5 2 25 23 17
Business 22 12 5 1 4 Business 5 2 1 2
Educa on 7 4 1 2 Educa on 1 1
Non‐Degree 6 2 2 1 1 Non‐Degree 9 1 3 3 2
Not STEM 51 1 1 16 15 9 9 Not STEM 27 1 20 3 3
STEM 42 4 26 7 5 STEM 30 2 1 17 10
UNLV 152 16 1 39 61 13 22 UNLV 45 5 0 23 12 5
Business 12 9 1 2 Business 3 2 1
Educa on 2 1 1 Educa on 2 1 1
Not STEM 50 2 26 6 5 11 Not STEM 19 17 1 1
STEM 88 5 12 53 8 10 STEM 21 3 5 10 3
UNR 165 18 10 58 36 22 21 UNR 302 20 31 142 90 19
Business 28 15 8 1 4 Business 27 12 1 10 4
Educa on 20 9 5 3 2 1 Educa on 33 21 8 2 2
Not STEM 62 1 1 36 4 11 9 Not STEM 140 7 6 107 13 7
STEM 55 2 9 29 8 7 STEM 102 1 3 17 75 6
WNC 14 0 1 1 6 0 6 WNC 30 1 1 19 4 5
Business 2 2 Business 3 3
Educa on 1 1 Educa on 1 1
Not STEM 4 1 1 2 Not STEM 17 15 2
STEM 7 5 2 STEM 9 1 1 4 3
NSHE 540 54 19 141 176 60 89 NSHE 522 39 35 235 159 54
Business 72 39 15 4 2 12 Business 43 20 1 14 8
Educa on 32 16 7 3 2 4 Educa on 37 23 9 3 2
Non‐Degree 15 2 4 3 5 Non‐Degree 16 2 6 5 3
Not STEM 189 5 2 87 29 30 36 Not STEM 231 10 6 177 21 17
STEM 232 8 1 28 137 26 32 STEM 195 9 3 29 130 24
Fall 2012 Major
Category
NOTE: Green figures indicate numbers of students who have met the mathematics requirement for their selected program of study. Red figures indicate the number of students whose selected program of study requires a higher level of math that has not been completed.

p = 12
Task Force on Gateway Mathematics Success
System-wide, 1,577 students enrolled in Math 126 during the Fall 2012 semester and did not go on to enroll in a higher-level mathematics course. Of those students, 1.5 percent earned a degree or certificate that did not require a subsequent mathematics course while 31 percent stopped or dropped out prior to the 2013-14 academic year. Table 3 breaks out the remaining 67 percent who did enroll in at least one term during the 2013-14 academic year into those who failed or passed Math 126 by the starting major and status including current major, completion of Math 120, or discontinued enrollment as of Spring 2014. Similar to the findings in Table 2 for Math 124, 390 students out of the 540 students in Table 3 who failed Math 126 did not enroll in a higher-level mathematics course, despite remaining in majors which required more mathematics. Only 60 of the 540 students enrolled in and completed Math 120, suggesting a transition into a non-STEM program of study. For the students who passed Math 126, 198 students out of 522 students did not enroll in a higher mathematics course (during the next three semesters) although they remained enrolled in a major requiring one. This system-wide data suggests that a significant driver affecting the low completion numbers in gateway mathematics courses is the fact that students at many institutions are not compelled to remain continuously enrolled in mathematics until they complete their required courses. The Task Force identified this as a structural problem that will be addressed during the implementation phase of the Task Force’s work. Task Force Finding: Too many students are not completing the required mathematics course for their major in a timely fashion. D. Remedial to College-Level Challenges Remediation in mathematics remains a substantial challenge for students and reformative efforts have proven difficult. Figure 3 below reveals that for the Fall 2013 cohort of first-time, degree-seeking freshmen, 72.1 percent at two-year institutions and 41.5 percent at four-year institutions do not complete a college level mathematics course within one year after enrollment into remedial Math 096.
Figure 3. Completed college-level mathematics within one year after initial enrollment in Math 096 (Fall 2013 cohort)
2-year NSHE Institutions 4-year NSHE Institutions

p = 13
Task Force on Gateway Mathematics Success
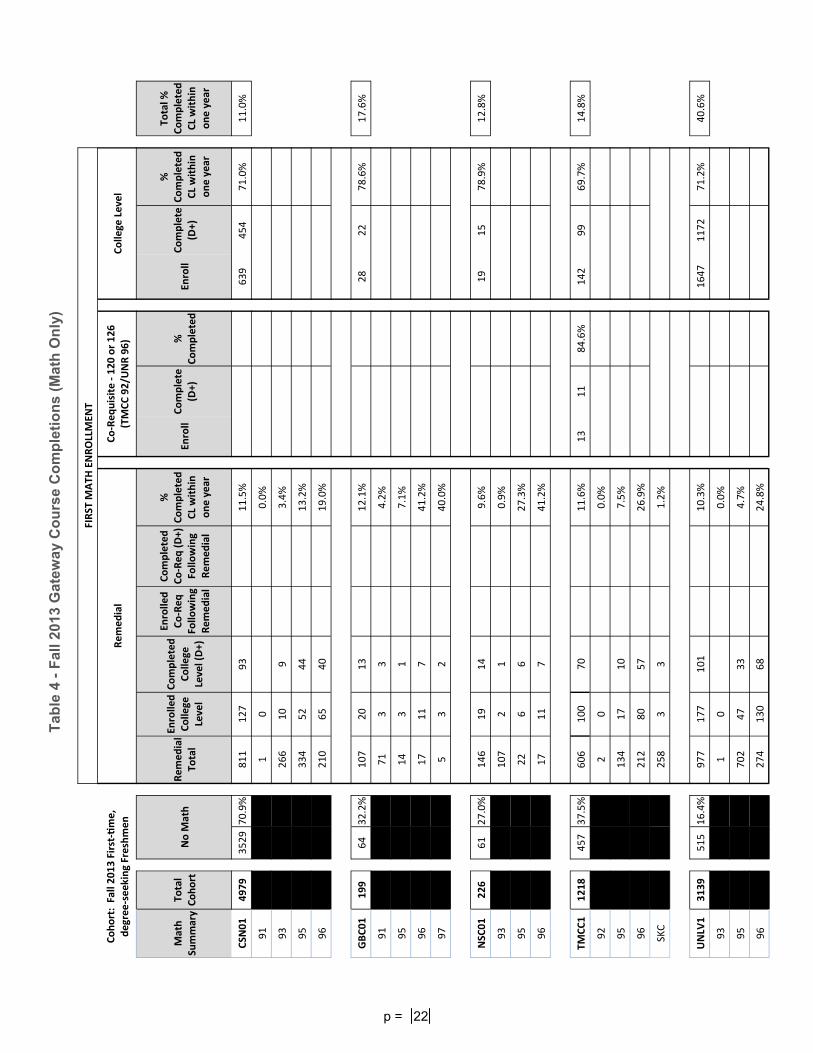
Table 4 contains institution-specific data on the number of Fall 2013 first-time, degree-seeking students who complete a college-level mathematics course within one year following enrollment in Math 095 or Math 096.
Table 4. Students enrolled in Math 095 or Math 096 in Fall 2013 Percent that complete a college-level course within one year
Math 095
Enrollment
% Completed College-Level
Course w/in one year
Math 096
Enrollment
% Completed College-Level
Course w/in one year
UNLV 702 4.7% 274 24.8% UNR 260 24.6% 435* 80.5% NSC 22 27.3% 17 41.2%
4-year Total 984 10.5% 726 58.5% CSN 334 13.2% 210 19.0% GBC 14 7.1% 17 41.2%
TMCC 134 7.5% 225* 30.2% WNC 169 13.6% 86 40.7%
2-year Total 651 12.0% 538 27.9%
The majority of the successes indicated in Table 4 for students at UNR who completed a college-level course within one year of remedial enrollment can be attributed to co-requisite model courses, which enable qualified students to complete their remediation and earn credit in Math 120 or Math 126 in the same semester. In order to compare success of the co-requisite model curriculum (offered at UNR and TMCC in Fall 2013) with that of the traditional curriculum, Table 4 includes the students at UNR and TMCC who are enrolled in either Math 120 or 126 with a remedial co-requisite. The 435 students at UNR consisted of 180 in Math 096 and 255 enrolled in co-requisite model courses. The rate at which those students enrolled in the co-requisite courses completed a credit bearing math class in the first year was 93 percent, compared with 63 percent for those enrolled in Math 096. The 80.5 percent figure is the completion rate for the combined cohort. These figures suggest that, for the students who meet the placement criterion for a co-requisite pathway, the co-requisite models provide students with considerably higher success rates.
NOTE: Cohort includes first-time, degree-seeking students only *co-requisite course enrollments included
p = 14
Task Force on Gateway Mathematics Success
For students starting in Math 095 at UNR, the rate of completion of a credit bearing math class is much lower, at 25 percent. A significant portion of the 75 percent not achieving college credit within one year are STEM majors on the 3-semester pathway to completion of Math 126. Over 50 percent of the students starting out in this class are, at least at the beginning, in STEM majors, business programs, or the education and health programs requiring pre-calculus. Another significant portion passed Math 095 in the fall, but enrolled in Math 096 in the spring, even though their program allowed them to take the co-requisite model non-STEM gateway math course in the spring. This latter portion would benefit from improved advising and/or an automated pop-up indicating “this math class is not required for your declared program” when they enroll in Math 096. Task Force Finding: Traditional remedial pathways do not result in timely completion of gateway mathematics courses. Co-requisite courses appear to result in much higher rates of successful completion of gateway mathematics courses in the first year of enrollment.
Part III: Task Force Recommendations
Suggested Revisions to Board Policy After analyzing the System-wide data previously described, the Task Force considered needed changes to the Board’s policy on placement (Title 4, Chapter 16, Section 1). The Task Force recommends sweeping changes to the policy, shifting the focus to student pathways and the completion of gateway courses, as opposed to cut scores for course placement, while at the same time honoring the ACT “guarantee” that was adopted by the Board of Regents at its December 2014 meeting. The proposed policy revisions are generally organized based on student preparedness (e.g. college ready; high school ready but not high school proficient; and not ready for high school mathematics). It is important to recognize that the work of the Task Force focused on those students who place below the college level, but at least at the high school level. While there remain students in the System who place below the high school level, Task Force members recognized that a discussion of interventions to assist students below the high school level must be considered separately. NSHE and its institutions are working collaboratively with local school districts to help these students while they are still in high school. Initiatives include, but are not limited to, programs to help with academic deficiencies identified through the 11th grade college and career readiness assessment (the ACT) to address those deficiencies during the senior year of high school, as well as efforts to expand dual credit options.
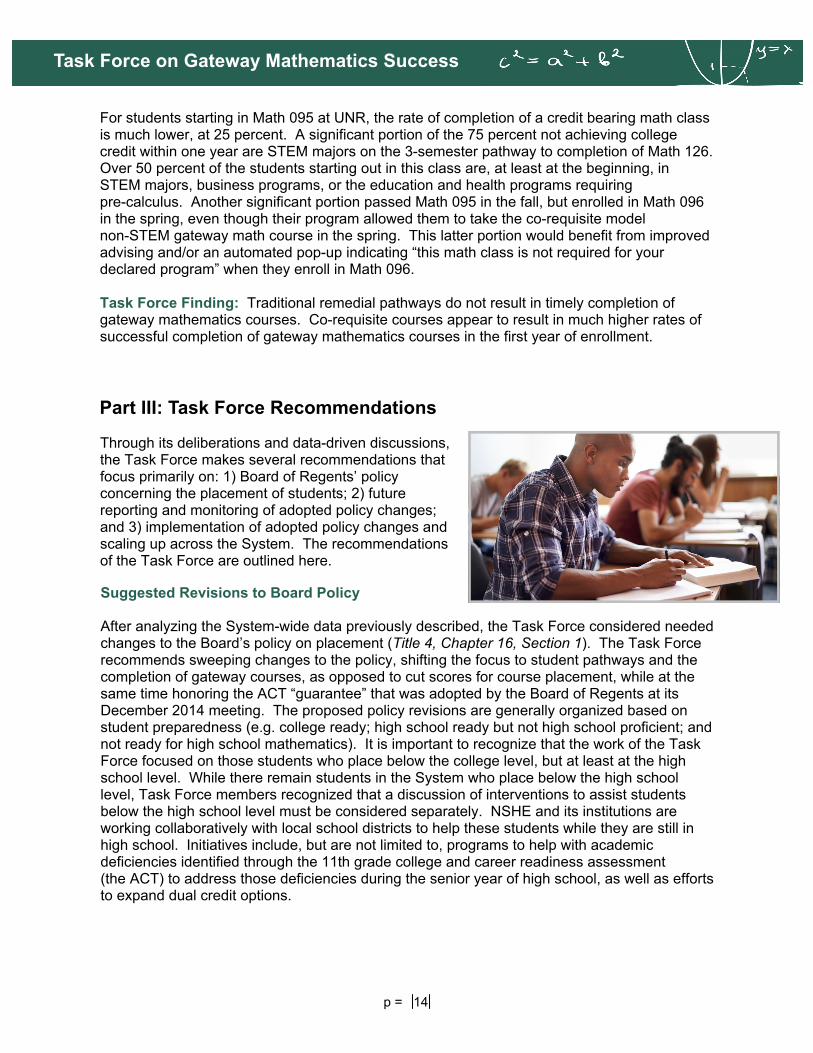
Through its deliberations and data-driven discussions, the Task Force makes several recommendations that focus primarily on: 1) Board of Regents’ policy concerning the placement of students; 2) future reporting and monitoring of adopted policy changes; and 3) implementation of adopted policy changes and scaling up across the System. The recommendations of the Task Force are outlined here.

p = 15
Task Force on Gateway Mathematics Success
The policy revisions recommended by the Task Force include requiring that students who meet specified benchmarks on college readiness assessments in mathematics and English be exempt from remediation and be placed into a college-level course (as previously adopted by the Board). For students who do not meet these benchmarks or have not taken one of the assessments, institutions must develop an assessment and placement policy that ensures students have an opportunity to enroll in and complete a gateway college course in mathematics and English within one academic year (for those students who place into Math 095 or higher). The proposed revisions provide an exception to the one-year gateway pathway for students seeking a STEM degree who place at the high school Algebra I level (e.g. Math 095) allowing placement into a three-semester sequence of remediation and a gateway course that may include co-requisite coursework. In the view of the Task Force, this three-semester exception for severely unprepared (Math 095 placement) STEM students is needed because a fully successful one-year accelerated pathway has not yet been demonstrated in any pilot form, but the experience with mini-sessions is promising. This exception should not greatly diminish the overall impact of the pathways, since students aspiring to STEM majors are often better prepared for mathematics. Finally, the proposed revisions mandate that the Chancellor work with the State Superintendent of Public Education to establish educational strategies to encourage high school standards, graduation requirements and assessments aligned with college and workforce readiness expectations. The specific language changes as proposed by the Task Force to Title 4, Chapter 16, Section 1 of the Board Handbook, are included in Appendix B. Data and Follow-Up Data Collection and Reporting System-wide data played a critical role in the deliberations of the Task Force, and these data were primary drivers for the Task Force’s recommendations. To that end, the Task Force recommends that the Chancellor’s Office continue the collection of data to measure ongoing institutional progress and the impacts of the suggested revisions to the Board’s placement policy, should it ultimately be adopted. At the April 2014 NSHE Math Summit, the Chancellor’s Office presented system-wide data on the percentage of students that complete a gateway mathematics course within one and two years of enrollment, and the corresponding percentage of students that ultimately graduate. That data set the stage for the work of the Task Force to make recommendations to increase student success in gateway mathematics. The Task Force strongly recommends the continued review of system-wide data to evaluate the efficacy of the curricular changes proposed in the policy revisions. In addition, Task Force members recognized the unique opportunity provided to the State and NSHE by the statewide administration of the ACT that will occur during the 2015-16 academic year. As a result of statewide administration of the ACT, the Chancellor’s Office will for the first time have ACT scores for all entering students who graduate from a public Nevada high school in 2016. The Task Force recommends that the Chancellor’s Office utilize the statewide ACT data in an effort to validate the current NSHE ACT college readiness benchmarks, which have been set based on national ACT data in the absence of statewide data. Similar efforts should also be made to validate the SAT, SBAC and PARCC scores, as soon as sufficient data is available for an appropriate validation study to be conducted. Finally, since the Task Force

p = 16
Task Force on Gateway Mathematics Success
recommendations require institutions to put in place placement mechanisms for students without ACT, SAT, SBAC or PARCC scores, such data should be gathered and examined to validate the institutional mechanisms, as well. Implementation and Scaling Up Finally, the work of the Task Force, as supported by Complete College America and the Charles Dana Center, will continue through the 2015-16 academic year. The Task Force will reconvene, following the Board’s consideration of the proposed policy changes in June 2015, to have System-wide discussions on the implementation of the policy revisions. If adopted, the policy will require that NSHE institutions essentially scale up all existing efforts to get students through gateway mathematics courses within one year (or three semesters for students on a STEM pathway who place at or below Math 095). It was clear from the deliberations of the Task Force that quality student advising and campus protocols to ensure that students do not delay completion of mathematics courses will be a critical part of campus implementation. Therefore, the Task Force recommends that, when it reconvenes in Fall 2015, additional institutional representatives from academic advising, admissions and institutional leadership be brought to the table for discussions that can support institutional implementation by Fall 2016. Through the implementation process, institutions will examine their capacity for full-scale implementation. It will not be possible for all institutions to scale-up 100 percent by Fall 2016 for a number of reasons including, but not limited to staffing limitations. However, reasonable benchmarks for each institution can be established against which institutional progress to full-scale implementation will be measured.
p = 17
Task Force on Gateway Mathematics Success
APPENDIX A
DATA TABLES
See tables on following pages.
Table 1: Fall 2007 Gateway Course Completion with Graduation Rates (Math Only)
Table 2: Fall 2012 Gateway Course Completions (Math Only)
Table 3: Fall 2012 Gateway Course Completions (Math Only)
Table 4: Fall 2013 Gateway Course Completions (Math Only)
Table 5: Math Course Number Legend
Table 6: Highest Subsequent Math Enrolled
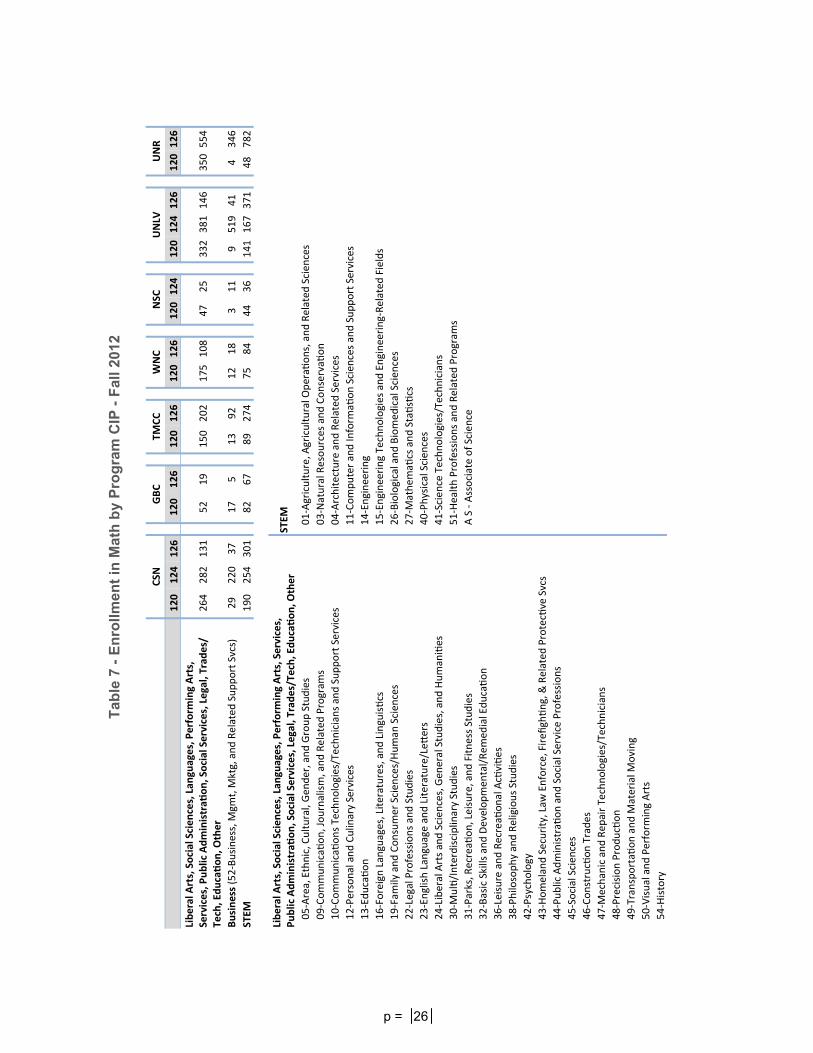
Table 7: Enrollment in Math by Program CIP - Fall 2012
p = 18
Tab
le 1
: F
all 2
007
Gat
eway
Co
urs
e C
om
ple
tio
ns
wit
h G
rad
uat
ion
Rat
es (
Mat
h O
nly
)
En
rolled Remed
ial
No Rem
edial
To
tal
To
tal
Cohort Remedial
Flag ‐ Yrs
1 or 2
Completed
College
Level Yr 1
Completed
College
Level
Yr 2
Completed
College
Level
Yr 1
Completed
College
Level
Yr 2
To
tal %
Completed
CL Yr 1
Total %
Completed
CL Yr 2
Total %
Completed
CL Yr 1 & 2
Did Not Complete
College
Level M
ath
w/i 2 yrs
CSN
2879
984
96
9.8%
93
9.5%
251
13.2%
47
2.5%
12.1%
4.9%
16.9%
83.1%
GBC
468
169
13
7.7%
25
14.8%
33
11.0%
11
3.7%
9.8%
7.7%
17.5%
82.5%
TMCC
1420
744
39
5.2%
67
9.0%
143
21.2%
18
2.7%
12.8%
6.0%
18.8%
81.2%
WNC
582
228
44
19.3%
36
15.8%
114
32.2%
10
2.8%
27.1%
7.9%
35.1%
64.9%
Awards Conferred‐150% me to degree
CSN
19.3%
32.9%
23.2%
3.9%
GBC
30.4%
22.2%
26.8%
1.8%
TMCC
30.8%
34.1%
31.8%
1.5%
WNC
33.5%
21.7%
30.9%
0.3%
En
rolled Remed
ial
No Rem
edial
To
tal
To
tal
Cohort Remedial
Flag ‐ Yrs
1 or 2
Completed
College
Level
Yr 1
Completed
College
Level
Yr 2
Completed
College
Level
Yr 1
Completed
College
Level
Yr 2
To
tal %
Completed
CL Yr 1
Total %
Completed
CL Yr 2
Total %
Completed
CL Yr 1 & 2
Did Not Complete
College
Level M
ath
w/i 2 yrs
NSC
162
111
29
26.1%
9
8.1%
19
37.3%
3
5.9%
29.6%
7.4%
37.0%
63.0%
UNLV
2446
255
34
13.3%
58
22.7%
1197 54.6%
167
7.6%
50.3%
9.2%
59.5%
40.5%
UNR
1400
396
156
39.4%
73
18.4%
841
83.8%
39
3.9%
71.2%
8.0%
79.2%
20.8%
Awards Conferred‐150% me to degree
NSC
27.1%
16.7%
25.0%
3.9%
UNLV
49.1%
47.1%
48.8%
22.6%
Cohort: Fall 2007 First‐me, degree‐seeking Freshmen
UNR
53.3%
41.1%
52.0%
12.7%

p = 19
Tab
le 2
: F
all 2
012
Gat
eway
Co
urs
e C
om
ple
tio
ns
(Mat
h O
nly
)
One Year
Remedial
Bridge ‐ 120 or 126
College
Level
Math
Summary
Total
Cohort
No M
ath
Remedial
Total
Enrolled
College
Level
Completed
College
Level
Enrolled
Bridge Completed
Bridge
%
Completed
CL within
one year
En
roll Complete
%
Completed
En
roll
Complete
%
Completed
CL within
one year
Total %
Completed
CL within
one year
CSN
01
4354
2947 67.7%
832
92
68
8.2%
575
371
64.5%
10.1%
GBC01
230
89
38.7%
110
17
14
12.7%
31
25
80.6%
17.0%
NSC01
132
43
32.6%
75
5
4
5.3%
14
11
78.6%
11.4%
TMCC1
1231
384 31.2%
711
142
92
12.9%
3
2
66.7%
133
103
77.4%
16.0%
UNLV
1
2688
508 18.9%
912
179
128
14.0%
1268
1004
79.2%
42.1%
UNR01
2425
111
4.6%
558
293
264
41
38
54.1%
91
87
95.6%
1665
1542
92.6%
79.6%
WNC01
598
180 30.1%
271
56
50
18.5%
147
129
87.8%
29.9%
Two Years
Remedial
Bridge ‐ 120 or 126
College
Level
Math
Summary
Total
Cohort
No M
ath
Remedial
Total
Enrolled
College
Level
Completed
College
Level
Enrolled
Bridge Completed
Bridge
%
Completed
CL within
two years
En
roll Complete
%
Completed
within two
years
En
roll
Complete
%
Completed
CL within
two years
Total %
Completed
CL within
two years
CSN
01
4354
2531 58.1%
1158
364
290
25.0%
665
448
67.4%
16.9%
GBC01
230
77
33.5%
120
34
25
20.8%
33
26
78.8%
22.2%
NSC01
132
39
29.5%
79
29
25
31.6%
14
11
78.6%
27.3%
TMCC1
1231
324 26.3%
771
267
210
27.2%
3
2
66.7%
133
113
85.0%
26.4%
UNLV
1
2688
357 13.3%
1007
423
333
33.1%
1324
1142
86.3%
54.9%
UNR01
2425
87
3.6%
574
354
323
74
72
68.8%
92
88
95.7%
1672
1580
94.5%
85.1%
WNC01
598
168 28.1%
285
101
87
30.5%
145
127
87.6%
35.8%
Cohort: Fall 2012 First‐me, degree‐seeking Freshmen

p = 20
Tab
le 3
- F
all 2
012
Gat
eway
Co
urs
e C
om
ple
tio
ns
(Mat
h O
nly
)
FIRST M
ATH
ENROLLMEN
T
Cohort: Fall 2012 First‐me,
degree‐seeking Freshmen
Remedial
Co‐Requisite ‐ 120 or 126 (96)
College Level
Math
Summary
Total
Cohort
No M
ath
Remedial
Total
Enrolled
College
Level
Completed
College
Level (D+)
Enrolled
Co‐Req
Follo
wing
Remedial
Completed
Co‐Req (D+)
Follo
wing
Remedial
%
Completed
CL within
one year
En
roll
Complete
(D+)
%
Completed
Enroll
Complete
(D+)
%
Completed
CL within
one year
Total %
Completed
CL within
one year
CSN
01
4354
2947
67.7%
832
92
68
8.2%
575
371
64.5%
10.1%
91
108
4
3
2.8%
93
45
1
1
2.2%
95
523
47
34
6.5%
96
156
40
30
19.2%
GBC01
230
89
38.7%
110
16
14
12.7%
31
25
80.6%
17.0%
91
60
2
2
3.3%
95
22
2
2
9.1%
96
18
8
7
38.9%
97
10
4
3
30.0%
NSC01
132
43
32.6%
75
5
4
5.3%
14
11
78.6%
11.4%
93
45
0
0
0.0%
95
18
1
1
5.6%
96
12
4
3
25.0%
TMCC1
1231
384
31.2%
711
142
92
12.9%
3
2
66.7%
133
103
77.4%
16.0%
92
2
2
2
100.0%
95
131
17
11
8.4%
96
279
121
77
27.6%
SKC
299
2
2
0.7%
UNLV1
2688
508
18.9%
912
179
128
14.0%
1268
1004
79.2%
42.1%
91/93
2
1
0
0.0%
95
637
53
36
5.7%
96
273
125
92
33.7%

FIRST M
ATH
ENROLLMEN
T
Cohort: Fall 2012 First‐me,
degree‐seeking Freshmen
Remedial
Co‐Requisite ‐ 120 or 126 (96)
College Level
Math
Summary
Total
Cohort
Remedial
Total
Enrolled
College
Level
Completed
College
Level (D+)
Enrolled
Co‐Req
Follo
wing
Remedial
Completed
Co‐Req (D+)
Follo
wing
Remedial
%
Completed
CL within
one year
En
roll
Complete
(D+)
%
Completed
Enroll
Complete
(D+)
%
Completed
CL within
one year
Total %
Completed
CL within
one year
UNR01
2425
111
4.6%
558
293
264
41
38
54.1%
91
87
95.6%
1665
1542
92.6%
79.6%
19
3
3
3
100.0%
95
10
1
0
2
2
20.0%
96
545
289
261
39
36
54.5%
WNC01
598
180
30.1%
271
56
50
18.5%
147
129
87.8%
29.9%
92
23
15
12
52.2%
95
168
13
12
7.1%
96
72
28
26
36.1%
98
8
0
0
0.0%
2‐yr
6413
3600
56.1%
1924
306
224
0
0
11.6%
3
2
66.7%
886
628
70.9%
13.3%
91/92/93
238
24
20
0
0
8.4%
95
844
79
59
0
0
7.0%
96
525
197
140
0
0
26.7%
97/98
18
4
3
0
0
16.7%
SKC
299
2
2
0
0
0.7%
4‐yr
5245
662
12.6%
1545
477
396
41
38
28.1%
91
87
2947
2557
86.8%
58.7%
92/93
50
4
3
0
0
6.0%
95
665
55
37
2
2
5.9%
96
830
418
356
39
36
47.2%
No M
ath
p = 21
Tab
le 3
co
nti
nu
ed -
Fal
l 201
2 G
atew
ay C
ou
rse
Co
mp
leti
on
s (M
ath
On
ly)
p = 22
Tab
le 4
- F
all 2
013
Gat
eway
Co
urs
e C
om
ple
tio
ns
(Mat
h O
nly
)
FIRST M
ATH
ENROLLMEN
T
Cohort: Fall 2013 First‐me,
degree‐seeking Freshmen
Remedial
Co‐Requisite ‐ 120 or 126
(TMCC 92/U
NR 96)
College Level
Math
Summary
Total
Cohort
No M
ath
Remedial
Total
Enrolled
College
Level
Completed
College
Level (D+)
Enrolled
Co‐Req
Follo
wing
Remedial
Completed
Co‐Req (D+)
Follo
wing
Remedial
%
Completed
CL within
one year
En
roll
Complete
(D+)
%
Completed
Enroll
Complete
(D+)
%
Completed
CL within
one year
Total %
Completed
CL within
one year
CSN
01
4979
3529
70.9%
811
127
93
11.5%
639
454
71.0%
11.0%
91
1
0
0.0%
93
266
10
9
3.4%
95
334
52
44
13.2%
96
210
65
40
19.0%
GBC01
199
64
32.2%
107
20
13
12.1%
28
22
78.6%
17.6%
91
71
3
3
4.2%
95
14
3
1
7.1%
96
17
11
7
41.2%
97
5
3
2
40.0%
NSC01
226
61
27.0%
146
19
14
9.6%
19
15
78.9%
12.8%
93
107
2
1
0.9%
95
22
6
6
27.3%
96
17
11
7
41.2%
TMCC1
1218
457
37.5%
606
100
70
11.6%
13
11
84.6%
142
99
69.7%
14.8%
92
2
0
0.0%
95
134
17
10
7.5%
96
212
80
57
26.9%
SKC
258
3
3
1.2%
UNLV1
3139
515
16.4%
977
177
101
10.3%
1647
1172
71.2%
40.6%
93
1
0
0.0%
95
702
47
33
4.7%
96
274
130
68
24.8%

FIRST M
ATH
ENROLLMEN
T
Cohort: Fall 2013 First‐me,
degree‐seeking Freshmen
Remedial
Co‐Requisite ‐ 120 or 126
(TMCC 92/U
NR 96)
College Level
Math
Summary
Total
Cohort
Remedial
Total
Enrolled
College
Level
Completed
College
Level (D+)
Enrolled
Co‐Req
Follo
wing
Remedial
Completed
Co‐Req (D+)
Follo
wing
Remedial
%
Completed
CL within
one year
En
roll
Complete
(D+)
%
Completed
En
roll
Complete
(D+)
%
Completed
CL within
one year
To
tal %
Completed
CL within
UNR01
2613
125
4.8%
441
137
123
60
54
40.1%
255
237
92.9%
1792
1644
91.7%
78.8%
92
1
0.0%
95
260
24
19
50
45
24.6%
96
180
113
104
10
9
62.8%
WNC01
633
201
31.8%
288
92
74
25.7%
144
120
83.3%
30.6%
92
29
21
16
55.2%
95
169
28
23
13.6%
96
86
43
35
40.7%
98
4
0
0.0%
2‐yr
7029
4251
60.5%
1812
339
250
0
0
13.8%
13
11
84.6%
953
695
72.9%
13.6%
91/92/93
369
34
28
0
0
7.6%
95
651
100
78
0
0
12.0%
96
525
199
139
0
0
26.5%
97/98
9
3
2
0
0
22.2%
SKC
258
3
3
0
0
1.2%
4‐yr
5978
701
11.7%
1564
333
238
60
54
18.7%
255
237
92.9%
3458
2831
81.9%
56.2%
92/93
109
2
1
0
0
0.9%
95
984
77
58
50
45
10.5%
96
471
254
179
10
9
39.9%
No M
ath
p = 23
Tab
le 4
co
nti
nu
ed -
Fal
l 201
3 G
atew
ay C
ou
rse
Co
mp
leti
on
s (M
ath
On
ly)

p = 24
Tab
le 5
- M
ath
Co
urs
e N
um
ber
Le
gen
d
CSN
01 GBC01 NSC01 TMCC1 U
NLV1 UNR01 W
NC01
Pre‐Req
uisite
120: Fund of College M
athem
acs
X
X
X
X
X
X
X
124: C
ollege Algeb
ra
X
X
X
126: Precalculus I
X
X
X
X
X
X
X
127: Precalculus II
X
X
X
X
X
X
X
128: Precalculus & Trig
X
X
X
X
X
X
X
132: Finite Mathem
acs
X
X
X
Math 124: C
ollege Algeb
ra
176: C
alculus for Business
X
X
X
Math 126: Precalculus I
181: C
alculus I
X
X
X
X
X
X
X
Math 126/127 or Math 128
100: M
ath for Allied
Health
X
X
X
104: Applied M
athema
cs
X
105R: M
ath for Radiologic Tech
X
106: G
eometry
X
107: R
eal Estate Math
X
108: M
ath for Technicians
X
110: Shop M
athem
acs
X
111: M
ath Electronics Applica
ons
X
116: Technical M
athem
acs
X
X
122: N
umb Concpt Elem Schl Tch
X
X
X
X
X
X
X
123: Stat Geo
mt Cncpt Elem Tch
X
X
X
X
X
X
X
p = 25
Tab
le 6
- H
igh
est
Su
bse
qu
ent
Mat
h E
nro
lled
Fal 2012
Math
Enrolled To
tal No Subsequent
Higher‐Level
Math
124
126 / 127 / 128
132
176
181/182
122/123
STAT152
APST270
Other
Percent
Other
CSN
01
120
483
400
82.8%
39
8.1%
23
4.8%
4
0.8%
8
1.7%
4
5
1.9%
124
756
555
73.4%
57
7.5%
118
15.6%
12
1.6%
4
4
6
1.9%
126
469
226
48.2%
128
27.3%
19
4.1%
88
18.8%
3
1
4
1.7%
GBC01
120
151
110
72.8%
0.0%
26
17.2%
0.0%
1
0.7%
4
2.6%
10
6.6%
126
91
45
49.5%
27
29.7%
0.0%
9
9.9%
10
11.0%
NSC01
120
94
71
75.5%
8
8.5%
3
3.2%
0.0%
1
1.1%
10
1
11.7%
124
72
50
69.4%
10
13.9%
8
11.1%
4
5.6%
0.0%
TMCC1
120
252
201
79.8%
0.0%
42
16.7%
0.0%
5
2.0%
3
1.2%
1
0.4%
126
570
317
55.6%
93
16.3%
0.0%
68 11.9%
67
11.8%
7
17
1
4.4%
UNLV1
120
482
441
91.5%
19
3.9%
14
2.9%
2
0.4%
1
0.2%
2
3
1.0%
124
1067
865
81.1%
74
6.9%
108
10.1%
2
0.2%
11
1.0%
5
2
0.7%
126
558
269
48.2%
148
26.5%
23
4.1%
1
0.2%
112
20.1%
4
1
0.9%
UNR01
120
402
346
86.1%
2
0.5%
39
9.7%
0.0%
10
2.5%
5
1.2%
0.0%
126
1682
634
37.7%
263
15.6%
3
0.2%
316
18.8%
364
21.6%
35
48
19
6.1%
WNC01
120
262
213
81.3%
27
10.3%
0.0%
2
0.8%
7
2.7%
5
3
5
5.0%
126
210
86
41.0%
51
24.3%
0.0%
16
7.6%
50
23.8%
4
3
3.3%
2‐yr
120
1148
924
80.5%
39
3.4%
118
10.3%
4
0.3%
8
0.7%
22
1.9%
9
13
0
11
2.9%
124
756
555
73.4%
57
7.5%
118
15.6%
0
0.0%
12
1.6%
4
4
0
6
1.9%
126
1340
674
50.3%
299
22.3%
19
1.4%
84
6.3%
214
16.0%
14
31
1
4
3.7%
4‐yr
120
978
858
87.7%
29
3.0%
56
5.7%
2
0.2%
10
1.0%
7
0.7%
12
0
0
4
1.6%
124
1139
915
80.3%
84
7.4%
116
10.2%
2
0.2%
15
1.3%
5
2
0
0
0.6%
126
2240
903
40.3%
411
18.3%
26
1.2%
317
14.2%
476
21.3%
39
48
19
1
4.8%
System
120
2126
1782
83.8%
68
3.2%
174
8.2%
6
0.3%
18
0.8%
29
1.4%
21
13
0
15
2.3%
124
1895
1470
77.6%
141
7.4%
234
12.3%
2
0.1%
27
1.4%
9
6
0
6
1.1%
126
3580
1577
44.1%
710
19.8%
45
1.3%
401
11.2%
690
19.3%
53
79
20
5
4.4%
p = 26
Tab
le 7
- E
nro
llmen
t in
Mat
h b
y P
rog
ram
CIP
- F
all 2
012
CSN
GBC
TM
CC
WNC
NSC
UNLV
UNR
120
124
126
120
126
120
126
120
126
120
124
120
124
126
120
126
Liberal A
rts, Social Sciences, Lan
guages, Perform
ing Arts,
Services, Public Administra
on, Social Services, Legal, Trades/
Tech, Educa
on, O
ther
264
282
131
52
19
150
202
175
108
47
25
332
381
146
350
554
Business (52‐Business, M
gmt, M
ktg, and Related Support Svcs)
29
220
37
17
5
13
92
12
18
3
11
9
519
41
4
346
STEM
190
254
301
82
67
89 274
75
84
44
36
141
167
371
48 782
STEM
05‐Area, Ethnic, Cultural, Gender, and Group Studies
01‐Agriculture, A
gricultural O
pera
ons, and Related
Scien
ces
09‐Communica
on, Journalism, and Related Program
s
03‐Natural Resources and Conserva
on
10‐Communica
ons Technologies/Technicians and Support Services
04‐Architecture and Related Services
12‐Personal and Culinary Services
11‐Computer and Inform
aon Scien
ces and Support Services
13‐Educa
on
14‐Engineering
16‐Foreign Languages, Literatures, and Linguis
cs
15‐Engineering Technologies and Engineering‐Related
Fields
19‐Fam
ily and Consumer Sciences/Human
Scien
ces
26‐Biological and Biomed
ical Scien
ces
22‐Legal Professions and Studies
27‐M
athema
cs and Sta
scs
23‐English Language and Literature/Le
ers
40‐Physical Scien
ces
24‐Liberal Arts and Scien
ces, Gen
eral Studies, and Humanies
41‐Scien
ce Technologies/Technicians
30‐M
ul/Interdisciplinary Studies
51‐Health Professions and Related Program
s
31‐Parks, R
ecrea
on, Leisure, and Fitness Studies
A S ‐ Associate of Science
32‐Basic Skills and Developmen
tal/Rem
edial Educa
on
36‐Leisure and Recrea
onal Acvi
es
38‐Philosophy and Religious Studies
42‐Psychology
43‐Homeland Security, Law
Enforce, Firefigh
ng, & Related
Protecve Svcs
44‐Public Administra
on and Social Service Professions
45‐Social Scien
ces
46‐Construcon Trades
47‐M
echanic and Repair Technologies/Technicians
48‐Precision Producon
49‐Transporta
on and M
aterial M
oving
50‐Visual and Perform
ing Arts
54‐History
Liberal A
rts, Social Sciences, Lan
guages, Perform
ing Arts, Services,
Public Administra
on, Social Services, Legal, Trades/Tech, Educa
on, O
ther

p = 27
Tab
le 7
co
nti
nu
ed -
En
rollm
ent
in M
ath
by
Pro
gra
m C
IP -
Fal
l 201
2
2‐yr
4‐yr
System
120
124
126
120
124
126
120
124
126
Liberal A
rts, Social Sciences, Lan
guages, Perform
ing
Arts, Services, Public Administra
on, Social
Services, Legal, Trades/Tech, O
ther
641
46.3%
282
20.4%
460
33.3%
729
39.7%
406
22.1%
700
38.1% 1370
42.6%
688
21.4% 1160
36.0%
Business (52‐Business, M
gmt, M
ktg, and Related
Support Svcs)
71
16.0%
220
49.7%
152
34.3%
16
1.7%
530
56.8%
387
41.5%
87
6.3%
750
54.5% 539
39.2%
STEM
436
30.8%
254
17.9%
726
51.3%
233
14.7%
203
12.8% 1153
72.6%
669
22.3%
457
15.2% 1879
62.5%
STEM
05‐Area, Ethnic, Cultural, Gender, and Group Studies
01‐Agriculture, A
gricultural O
pera
ons, and Related
Scien
ces
09‐Communica
on, Journalism, and Related Program
s
03‐Natural Resources and Conserva
on
10‐Communica
ons Technologies/Technicians and Support Services
04‐Architecture and Related Services
12‐Personal and Culinary Services
11‐Computer and Inform
aon Scien
ces and Support Services
13‐Educa
on
14‐Engineering
16‐Foreign Languages, Literatures, and Linguis
cs
15‐Engineering Technologies and Engineering‐Related
Fields
19‐Fam
ily and Consumer Sciences/Human
Scien
ces
26‐Biological and Biomed
ical Scien
ces
22‐Legal Professions and Studies
27‐M
athema
cs and Sta
scs
23‐English Language and Literature/Le
ers
40‐Physical Scien
ces
24‐Liberal Arts and Scien
ces, Gen
eral Studies, and Humanies
41‐Scien
ce Technologies/Technicians
30‐M
ul/Interdisciplinary Studies
51‐Health Professions and Related Program
s
31‐Parks, R
ecrea
on, Leisure, and Fitness Studies
A S ‐ Associate of Science
32‐Basic Skills and Developmen
tal/Rem
edial Educa
on
36‐Leisure and Recrea
onal Acvi
es
38‐Philosophy and Religious Studies
42‐Psychology
43‐Homeland Security, Law
Enforce, Firefigh
ng, & Related
Protecve Svcs
44‐Public Administra
on and Social Service Professions
45‐Social Scien
ces
46‐Construcon Trades
47‐M
echanic and Repair Technologies/Technicians
48‐Precision Producon
49‐Transporta
on and M
aterial M
oving
50‐Visual and Perform
ing Arts
54‐History
Liberal A
rts, Social Sciences, Lan
guages, Perform
ing Arts, Services, Public Administra
on,
Social Services, Legal, Trades/Tech, Educa
on, O
ther
p = 28
Task Force on Gateway Mathematics Success
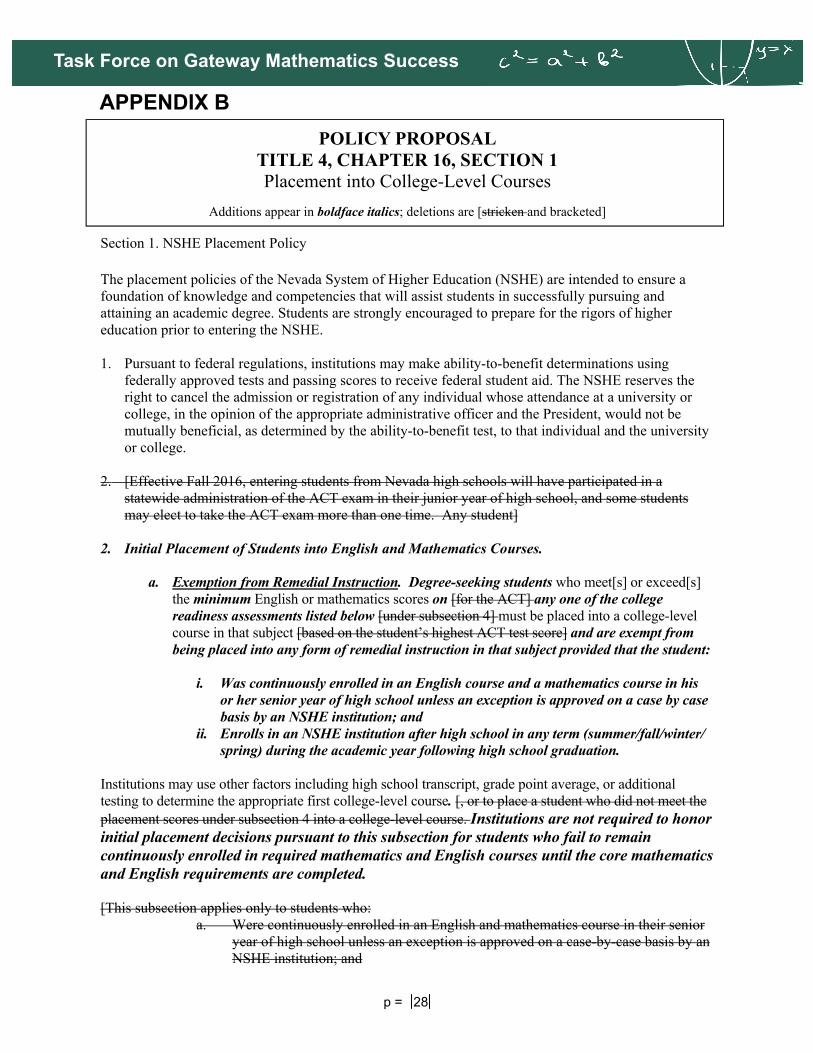
APPENDIX B
POLICY PROPOSAL TITLE 4, CHAPTER 16, SECTION 1 Placement into College-Level Courses
Additions appear in boldface italics; deletions are [stricken and bracketed]
Section 1. NSHE Placement Policy The placement policies of the Nevada System of Higher Education (NSHE) are intended to ensure a foundation of knowledge and competencies that will assist students in successfully pursuing and attaining an academic degree. Students are strongly encouraged to prepare for the rigors of higher education prior to entering the NSHE. 1. Pursuant to federal regulations, institutions may make ability-to-benefit determinations using
federally approved tests and passing scores to receive federal student aid. The NSHE reserves the right to cancel the admission or registration of any individual whose attendance at a university or college, in the opinion of the appropriate administrative officer and the President, would not be mutually beneficial, as determined by the ability-to-benefit test, to that individual and the university or college.
2. [Effective Fall 2016, entering students from Nevada high schools will have participated in a statewide administration of the ACT exam in their junior year of high school, and some students may elect to take the ACT exam more than one time. Any student]
2. Initial Placement of Students into English and Mathematics Courses.
a. Exemption from Remedial Instruction. Degree-seeking students who meet[s] or exceed[s] the minimum English or mathematics scores on [for the ACT] any one of the college readiness assessments listed below [under subsection 4] must be placed into a college-level course in that subject [based on the student’s highest ACT test score] and are exempt from being placed into any form of remedial instruction in that subject provided that the student:
i. Was continuously enrolled in an English course and a mathematics course in his
or her senior year of high school unless an exception is approved on a case by case basis by an NSHE institution; and
ii. Enrolls in an NSHE institution after high school in any term (summer/fall/winter/spring) during the academic year following high school graduation.
Institutions may use other factors including high school transcript, grade point average, or additional testing to determine the appropriate first college-level course. [, or to place a student who did not meet the placement scores under subsection 4 into a college-level course. Institutions are not required to honor initial placement decisions pursuant to this subsection for students who fail to remain continuously enrolled in required mathematics and English courses until the core mathematics and English requirements are completed. [This subsection applies only to students who:
a. Were continuously enrolled in an English and mathematics course in their senior year of high school unless an exception is approved on a case-by-case basis by an NSHE institution; and
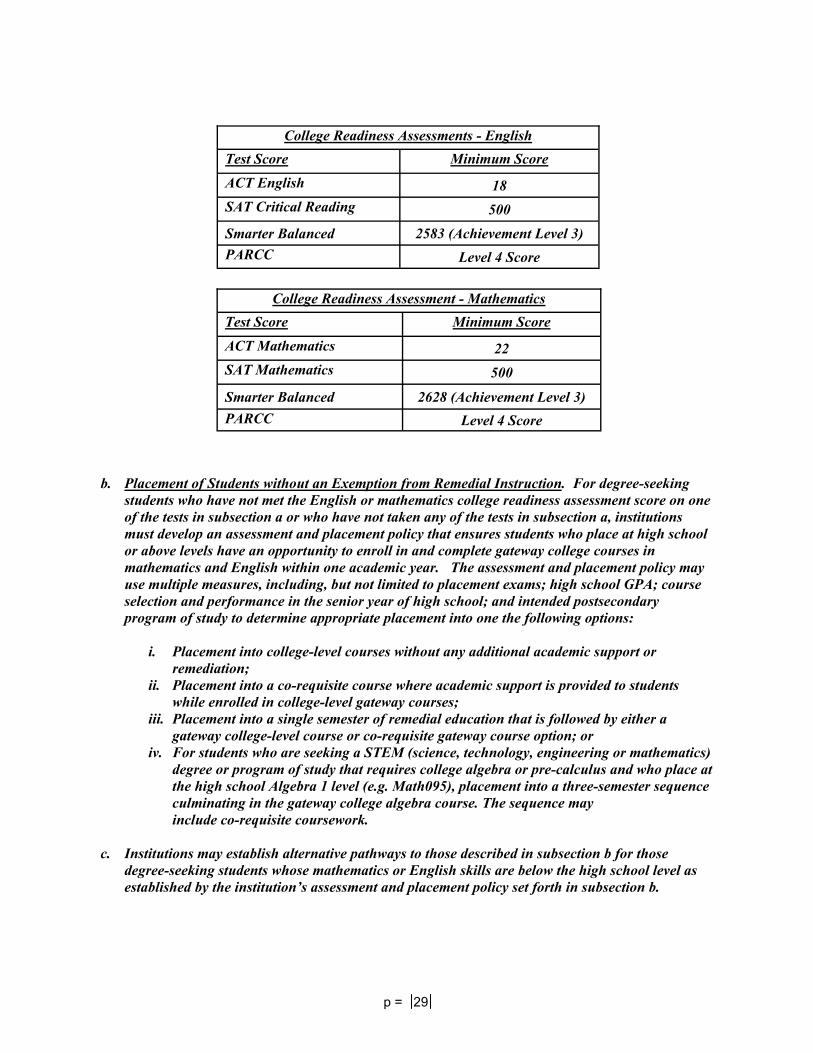
College Readiness Assessments - English
Test Score Minimum Score
ACT English 18 SAT Critical Reading 500
Smarter Balanced 2583 (Achievement Level 3) PARCC Level 4 Score
College Readiness Assessment - Mathematics
Test Score Minimum Score
ACT Mathematics 22 SAT Mathematics 500
Smarter Balanced 2628 (Achievement Level 3) PARCC Level 4 Score
b. Placement of Students without an Exemption from Remedial Instruction. For degree-seeking students who have not met the English or mathematics college readiness assessment score on one of the tests in subsection a or who have not taken any of the tests in subsection a, institutions must develop an assessment and placement policy that ensures students who place at high school or above levels have an opportunity to enroll in and complete gateway college courses in mathematics and English within one academic year. The assessment and placement policy may use multiple measures, including, but not limited to placement exams; high school GPA; course selection and performance in the senior year of high school; and intended postsecondary program of study to determine appropriate placement into one the following options:
i. Placement into college-level courses without any additional academic support or
remediation; ii. Placement into a co-requisite course where academic support is provided to students
while enrolled in college-level gateway courses; iii. Placement into a single semester of remedial education that is followed by either a
gateway college-level course or co-requisite gateway course option; or iv. For students who are seeking a STEM (science, technology, engineering or mathematics)
degree or program of study that requires college algebra or pre-calculus and who place at the high school Algebra 1 level (e.g. Math095), placement into a three-semester sequence culminating in the gateway college algebra course. The sequence may include co-requisite coursework.
c. Institutions may establish alternative pathways to those described in subsection b for those
degree-seeking students whose mathematics or English skills are below the high school level as established by the institution’s assessment and placement policy set forth in subsection b.
p = 29

3. [All degree-seeking students must complete the appropriate entry-level English and mathematics course work within the first 30 college-level credits year of enrollment unless otherwise authorized by the institution. Insti-tutions should support enrollment in the appropriate entry-level, credit bearing college course immediately upon completion of any required remedial work. In addition] Unless an institutional exception is made, all degree-seeking students [should] must be continuously enrolled in [the] appropriate mathematics and English courses until the institutional core curriculum mathematics and English requirements are completed.
4. [Except as otherwise provided in subsection 2, a student’s English and mathematics placement test scores will serve as the foundation for decisions about the appropriate first college-level course. However, in addition to these scores, institutions may rely on other factors such as high school courses and grade point average, demonstrable competencies, and work experience to determine a student’s college-content readiness and recommend placement.
a) English Placement. The following scores are minimum scores on tests a student may take or
an institution may administer for placement into an entry-level, credit bearing college Eng-lish course. Other appropriate placement tools may be used for English placement including reading tests, departmental diagnostic tests or other proprietary tests if supported by institu-tional research.
b) Mathematics Placement. The following scores are minimum scores on tests a student may take or an institution may administer for placement into an entry-level, credit bearing col-lege mathematics course. Other appropriate placement tools may be used for mathematics placement including reading tests, departmental diagnostic tests or other proprietary tests if supported by institutional research.
5. Remedial education at NSHE institutions shall utilize instructional methods, including but not lim-
ited to co-requisite models in mathematics and English, and course designs that are most effective in ensuring that students are ready for and successful in completing an entry-level college course in English and mathematics.]
p = 30
Test Score Minimum Score
ACT English 18 SAT Critical Reading 440 Compass Writing Skills 69 Accuplacer Sentence Skills 80-86
Test Score Minimum Score
ACT Math 22 SAT Math 500 Compass Mathematics 65 Accuplacer College Level Math 50-63]
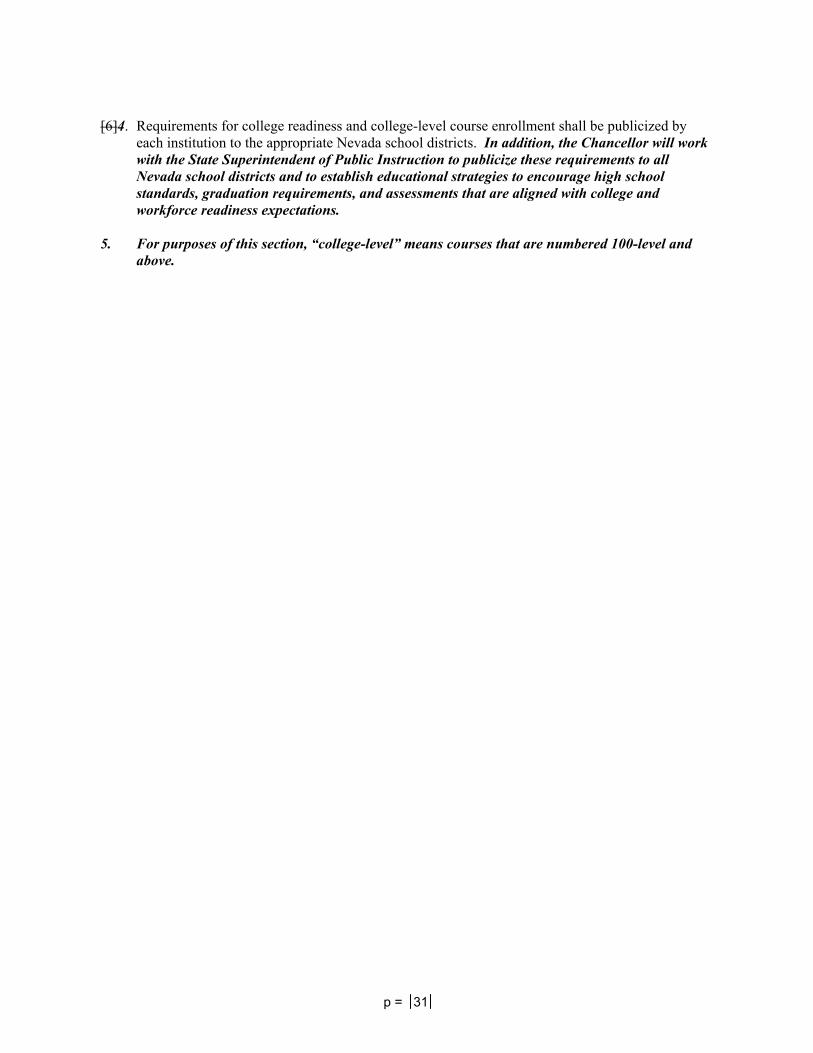
[6]4. Requirements for college readiness and college-level course enrollment shall be publicized by each institution to the appropriate Nevada school districts. In addition, the Chancellor will work with the State Superintendent of Public Instruction to publicize these requirements to all Nevada school districts and to establish educational strategies to encourage high school standards, graduation requirements, and assessments that are aligned with college and workforce readiness expectations.
5. For purposes of this section, “college-level” means courses that are numbered 100-level and
above.
p = 31