
Report - ago.gov.zm Management of Environm… · Management of Environmental Degradation Caused by...
88
1 Management of Environmental Degradation Caused by Mining Activities in Zambia. Republic of Zambia Report of the Auditor General on the Management of Environmental Degradation Caused by Mining Activities in Zambia. July 2014
Transcript of Report - ago.gov.zm Management of Environm… · Management of Environmental Degradation Caused by...

1Management of Environmental Degradation Caused by Mining Activities in Zambia.
Republic of Zambia
Report of the
Auditor Generalon the
Management of Environmental Degradation Caused by Mining Activities in Zambia.
July 2014

Management of Environmental Degradation Caused by Mining Activities in Zambia.2

iiiManagement of Environmental Degradation Caused by Mining Activities in Zambia.
FOREWORDI have the honour to submit my performance audit report on the Management of Environmental Degradation Caused by Mining Activities in Zambia. The audit was conducted in accordance with the mandate as provided for under Article 121(2) of the Constitution of Zambia, the Public Audit Act No. 8 of 1980, the Public Finance Act No. 15 of 2004 and the INTOSAI Guidance for Supreme Audit Institutions on Auditing Mining.
During the last decade, in addition to the old mines, several new mines have been opened which has raised considerable interest for their potential to contribute towards economic growth and poverty alleviation. The mining sector has contributed to national economic growth through tax-es, socio–economic infrastructural development, creation of employment and provision of educa-tion and health services among others.
However, the mining sector has faced challenges in achieving sustainable mining practices which cause minimum damage to the environment. Poor mining and mineral processing practices pol-lute the environment and their effects continue long after the mine has stopped operating. The environmental effects of mining and mineral resource activities affect all environmental media – land, air, water, and associated flora and fauna, and human health and safety.
It is therefore important that mining activities are managed in such a way that the negative im-pacts to the environment and humans are minimised.
The performance audit whose results are contained in this report was carried out to assess the effectiveness and efficiency of the regulatory bodies (Zambia Environmental Management Agency and Mine Safety Department) in carrying out their overall responsibilities of managing the environmental degradation caused by mining activities in Zambia.
I would like to thank the staff at the Ministry of Mines, Energy and Water Development, Ministry of Lands, Natural Resources and Environment Protection, ZEMA, MSD, ZCCM-IH and the fifteen large scale mining companies visited for their cooperation during the process of auditing.
Dr. Anna O Chifungula
AUDITOR GENERAL

Management of Environmental Degradation Caused by Mining Activities in Zambia.iv
ACRONYMS
CCS Chambishi Copper Smelter
CEP Copperbelt Environmental Project
CEMP Copper Environmental Management Programme
DA Developmental Agreement
ECZ Environmental Council of Zambia
EIA Environmental Impact Assessment
EMP Environmental Management Programme
KCM Konkola Copper Mine
MCM Mopani Copper Mine
MEWD Ministry of Mines, Energy and Water Development
MLNREP Ministry of Lands, Natural Resources and Environmental Protection
MSD Mine Safety Department
NFCA Non Ferrous Coppermine Africa
OAG Office of the Auditor General
TCo Total Cobalt
TCu Total Copper
TD Tailing Dams/Dump
TDS Total Dissolved Solids
TFe Total Iron
TMn Total Manganese
TSF Tailings Storage Facility
TSS Total Suspended Solid
ZCCM Zambia Consolidated Copper Mines
ZCCM-IH Zambia Consolidated Copper Mines Investment Holding
ZEMA Zambia Environmental Management Agency

vManagement of Environmental Degradation Caused by Mining Activities in Zambia.
Table of ContentsFOREWORD ................................................................................................................................................................................iii
ACRONYMS ................................................................................................................................................................................iv
Executive Summary ...............................................................................................................................................................vii
1. INTRODUCTION ..............................................................................................................................................................1
2. MOTIVATION FOR THE AUDIT ....................................................................................................................................2
2.1. Public Interest .............................................................................................................................................................2
2.2. Parliamentary Concerns ..........................................................................................................................................2
3. DESCRIPTION OF THE AUDIT AREA ..........................................................................................................................3
4. ROLES AND RESPONSIBILITIES OF KEY STAKEHOLDER ....................................................................................3
4.1. Zambia Consolidated Copper Mines – Investment Holding (ZCCM-IH) ................................................3
4.2. Functions and performance of the Group ........................................................................................................3
4.3. Copperbelt Environmental Project (CEP) ..........................................................................................................3
5. AUDIT DESIGN .................................................................................................................................................................5
5.1. Audit Objective ...........................................................................................................................................................5
5.2. Audit Scope ..................................................................................................................................................................5
5.3. Audit Questions ..........................................................................................................................................................4
5.4. Audit Criteria ...............................................................................................................................................................5
6. AUDIT METHODOLOGY ............................................................................................................................................ 10
6.1. Documentary Review ............................................................................................................................................ 10
6.2. Interviews and questionnaires ........................................................................................................................... 10
6.3. Physical Inspections ............................................................................................................................................... 10
6.4. Data Analysis ............................................................................................................................................................ 10
7. AUDIT FINDINGS.......................................................................................................................................................... 11
7.1. Inadequate Measures Put in Place by Government to Ensure that Environmental Degradation Caused by Mining Activities are Effectively and Efficiently Managed. ................................................ 11
7.2. Compliance with Environmental Regulations and Licencing Conditions by mining companies 14
8. CONCLUSION ................................................................................................................................................................ 32
8.1. Mining companies are polluting the environment in terms of air, surface and ground water, and land. ............................................................................................................................................................................. 32
8.2. Measures that Government has put in place to ensure that the environmental degradations caused by mining activities are adequately managed are not working effectively and efficiently. ........ 34
9. RECOMMENDATIONS ................................................................................................................................................ 37
9.1. Air, Ground and Surface Water Pollution ........................................................................................................ 37
9.2. Management of Dumps/Dams .......................................................................................................................... 37
9.3. Used Oil Storage Facilities.................................................................................................................................... 37
9.4. Policy formulation ................................................................................................................................................372
9.5. Development and enforcement of legislation ............................................................................................. 38
9.6. Environment Protection Fund ............................................................................................................................ 38
Appendix 1 Name of mines and facilities visited ............................................................................................ 39
Appendix 2 Environmental Protection Fund Performance Estimates (US$) .............................................. 40
Appendix 3 Bank balances as at April 2012 ........................................................................................................... 42

Management of Environmental Degradation Caused by Mining Activities in Zambia.vi
Appendix 4 Assets Procured under CEP in 2009 .................................................................................................. 43
Appendix 5 Air Pollution - Sulphur dioxide (SO4) ................................................................................................ 45
Appendix 6 Air Pollution – Dust ................................................................................................................................. 46
Appendix 7 Air Pollution – Arsenic (As) ................................................................................................................... 47
Appendix 8 Air Pollution – Copper (Cu) .................................................................................................................. 48
Appendix 9 Air Pollution – Lead (Pb) ........................................................................................................................ 49
Appendix 10 Mines that did not submit Bi annual reports for surface water monitoring. ................. 50
Appendix 11 Surface Water Particles – TSS mg/l ............................................................................................... 51
Appendix 12 Surface Water Pollution (Other Facilities) – Tcu ....................................................................... 52
Appendix 13 Surface Water Pollution (Other Facilities) – Tco ....................................................................... 53
Appendix 14 Surface Water Pollution ( Other Facilities) - TMn ..................................................................... 54
Appendix 15 Surface Water Pollution (Other Facilities) – TFe ....................................................................... 55
Appendix 16 Underground Water Pollution (Other Facilities) – pH ............................................................ 56
Appendix 17 Underground Water Pollution (Other Facilities) – TSS ........................................................... 57
Appendix 18 Underground Water Pollution (Other Facilities) – TDs .......................................................... 58
Appendix 19 Underground Water Pollution (Other Facilities) – SO4 .......................................................... 59
Appendix 20 Ground Water Pollution (Other Facilities) – Tcu ....................................................................... 60
Appendix 21 Ground Water Pollution (Dumps) – TCo ..................................................................................... 61
Appendix 22 Underground Water Pollution (Other facilities) – TMn ......................................................... 62
Appendix 23 Ground Water Pollution (Dumps) – TFe ...................................................................................... 63
Appendix 24 Assessment of Tailings Storage Facilities (Dumps/dams) .................................................... 64
Appendix 25 Assessment of Slag Dump ............................................................................................................... 67
Appendix 26 Assessment of Overburden Dumps ............................................................................................. 68
Appendix 27 Assessment of Waste Rock Dumps ............................................................................................... 70
Appendix 28 Assessment of used oil storage facilities .................................................................................... 73

viiManagement of Environmental Degradation Caused by Mining Activities in Zambia.
Executive Summary
1. Introduction
Zambia has predominantly been a mining country and is endowed with a wealth of natural resources including metals such as copper, industrial materials such as lime, construction materials and energy materials such as coal. During the last decade, several mines have been opened. The mining sector has, therefore, evoked considerable interest for its potential to contribute towards economic growth and poverty alleviation.
On the other hand, the supply of metals and minerals is not without environmental and social costs. The effects of mining continue long after the mine has stopped operating. Poor mining and mineral processing practices poison the air, land and water and leave the environment to suffer a slow death. Many rivers have been pronounced biologically dead due to release of mine tailings (waste from the mine containing rocks, metals and poisons) into waterways resulting in aquatic plant and animal life being choked with toxic sediment. There are also several reported cases of loss of human life. The environmental effects of mining and mineral resource activities affect all environmental media – land, air, water, and associated flora and fauna – as well as the human environment – individual health and safety, local community lifestyles, cultural survival, social order and economic well-being.
Mining activities are in this respect, supposed to be managed with a view of reducing the negative impacts to environment and humans.
2. Motivation for the audit
The audit was motivated by a number of factors and these were:
a) Public Interest
Several concerns have been raised by stakeholders who have cited issues such as lack of integrated mining policies, failure to disclose Developmental Agreements (DAs), failure by mines to mitigate effects of environmental degradation, air, land and water pollution, unfair resettlements, failure by government to pay back to the communities where the mining operations are taking place and lack of consultations with the communities/ stakeholders on mining projects, among other things.
b) Maiden Performance Audit
There has been no performance audit carried out at the Ministry of Lands, Natural Resources and Environmental Protection and thus the audit could be categorised as a high risk audit.
c) Parliamentary Concerns
Members of Parliament have also expressed their misgivings with regard to the adequacy of the Environmental Protection Fund. Further concerns were raised on Parliamentary order no 996 in which parliamentarians sought clarifications on whether environmental impact assessment studies are conducted in order to determine the effects of mining on the local communities.
d) Changes in the legislation governing the mining sector.
The Mines and Minerals Act 1995 was repealed and replaced by the Mines and Mineral Development Act No. 7 of 2008. The EPPCA No 12 of 1990 was repealed and replace by the Environmental Management Act No. 12 of 2011. Therefore, it is imperative to assess how the new laws are being administered by the relevant Ministries.
3. Audit Design for the Main-Study.
The objective of the audit was to assess the effectiveness and efficiency of the regulatory bodies in carrying out their overall responsibilities of managing the environmental degradation caused by mining activities in Zambia in order to reduce the negative environment impacts of mining activities on humans and the environment.
Management of Environmental Degradation Caused by Mining Activities in Zambia.viii
The audit involved collection of data at the ZEMA, CEP and MSD and a selected number of Mines. There are thirty one (31) mining companies in Zambia out of which fifteen (15) mines were visited. The mines selected were mining companies with large scale mining licences with a view of obtaining an understanding on how environmental degradation from mining activities is being managed. The list of mines visited is attached at Appendix 1.
The audit methodology involved examination of the records and activities of the ZEMA, CEP under ZCCM IH and selected mines.
In carrying out the audit answers to the following questions were sort;
i. To what extent are the mining companies complying with the environmental rules, laws, regulations and environmental licensing conditions issued by Government in their responsibility for managing the environmental degradation from their mining activities?
ii. What measures has the Government put in place to ensure that the environment degradations caused by mining activities are adequately managed?
iii. How are the relevant Government Institutions collaborating in their responsibility for management of environmental degradation caused by mining activities?
iv. What are the possible causes for failure to effectively and efficiently manage mining and environmental effects of mining companies?
The audit questions were answered by documentary review of board minutes, annual and quarterly reports, bi annual reports provided by mining companies to ZEMA showing air and water sampling test results conducted and averaged monthly, correspondence file between mining companies ZEMA and MSD, compliance monitoring reports, budgets and work plans, funding and releases, procurement records, environmental audit reports, environmental impact assessments reports, Staff establishment, staff returns, recruitment records, tools list, strategic plans, financial statements, bank statements, monitoring and evaluation reports among others with the view of obtaining documentary evidence on the management of environmental degradation caused by mining companies.
Structured interviews were held and in some instances questionnaires administered to key personnel in order to obtain detailed understanding of management of environmental degradation programmes in place. In addition, interviews were carried out to collect primary data used to assess the efficiency and effectiveness of managing environmental degradation. Interviews were also carried out to confirm information obtained from documentary review.
Physical inspections of the mines were carried out at all the selected mines in the company of ZEMA and Mine staff. Audit evidence was also collected through photographs. Data analysis of structured interviews and information collected from documents was carried out to answer the audit questions.
4. Major Audit Findings
a) The mining companies are not complying with the environmental rules, laws, regulations and environmental licensing conditions set by Government.
Examinations of bi-annual reports submitted by mines to ZEMA, correspondence files between ZEMA and the mines, the compliance monitoring reports, environmental audit reports from ZEMA and a physical inspection conducted on the facilities revealed the following mining companies are failing to produce monthly returns or biannual report on air emission to the environment. As a result, the contents of Sulphur Dioxide (SO2), dust from stack emissions, Arsenic (As), Copper (Cu) and Lead (Pb) in the air emitted to the environment was way above the minimum limits set by ZEMA.
In addition, the audit has also revealed that both surface and ground water are also being polluted. For instance the pH value was as low as 3 in some mines instead of the recommended 6 to 9. The means that the waster released to the environment was acidic. Total Suspended Solids (TSS) and Total Dissolved Solids (TDS) and in cases sulphates in the effluent was also high. Dissolved solids are an indicator that the chemical content of the waste water released to the environment is high. This was in fact the case for some mines in that Total Copper (TCu), Total Cobalt (TCo), Total Manganese (TMn) and Total Iron (TFe) were very high in some instances.

ixManagement of Environmental Degradation Caused by Mining Activities in Zambia.
The management of dumps and dams was also poor. Tailing Storage Facility(TSF), slag dumps, overburden dumps and waste rock dumps all had unrestricted access. In some dumps, there were no warning signs as required by law. Some mines did not carry out progressive re-vegetation of the embankments of the dumps while in the case of those that had started, the vegetation was sparse such that it did not provide adequate protection against erosion. The dumps were also polluting the surface water bodies and the underground water bodies or aquifers while some dumps’ proximity to residential areas was below the required 500m. The close proximity of residential areas has exacerbated the problem of illegal mining and exposure to hazardous waste materials which in some instances has led to death.
Used oil storage facilities were equally poorly managed by some mining companies. According to the licensing conditions for storage of used oil, all hazardous waste shall be stored in an area with limited access to unauthorized personnel, a bunded and impermeable floor and adequate ventilation to avoid build-up of hazardous fumes. The licensing conditions stipulated that the hazardous waste shall be handled safely to avoid emergencies such as poisoning, fire, explosion, spills etc. The licensing conditions issued by ZEMA also stated that the storage facility shall be inspected periodically and the inspection results shall be recorded in a record book that shall always be kept within the storage facility for inspection by ZEMA Inspectors.
A review of compliance monitoring reports and physical inspections carried out revealed that licensing conditions that required that adequate warning and safety signs are visibly displayed were not adhered to and access to storages facilities was not restricted. It was also observed that there were oil spillages in storage facilities which were finding their way in the drainages and subsequently polluting the environment. Further, some mines had no periodic inspection records on site contrary to the licensing conditions.
b) Measures Government has put in place to ensure that the environmental degradation caused by mining activities is adequately managed are not working effectively.
Although government has put in place a comprehensive National Policy on the Environment that has domesticated a number of international conventions or protocols on protection and control of the environment, the Ministry responsible for the environment and ZEMA have not carried out any review to assess how well the policy is being implemented by various stakeholders including mining companies. ZEMA also stated that some of the conventions require costly technology to be put in place which is in fact a challenge for Zambia.
Strengthening of the regulatory framework has not been effectively carried out. Despite government providing resources through CEP to review the laws, only the principal legislation had been reviewed and replaced. The subsidiary legislation such as the statutory instruments on Environmental Impact Assessment (EIA), Water and Air Pollution Control regulations, Statutory Instrument no. 29 of 1997, the Mines and Minerals Act (Act no. 31 of 1995), the Mines and Minerals (Environmental) Regulations 1997, Statutory Instrument No. 102 of 1998, The Mines and Minerals Regulations (Environmental Protection Fund) Regulations 1998 had not been reviewed. ZEMA stated that as a result of failure to review the sub-regulations, the current laws were inadequate to provide guidelines and hence difficult to enforce. Furthermore, legislation on all producer responsibility for all companies generating waste had not been developed. The audit also revealed that there was no law on noise pollution and that segregated management of the various pieces of legislation by various government organisations was in fact one of the causes for a fragmented approach to management of the environment.
ZEMA had no standards on how to manage Uranium. Instead ZEMA relied on the Ionizing and Radiation Protection Regulations which were administered under the Radiation Protection Board as such it could not effectively enforce the management of Uranium.
The Environmental Protection Fund (EPF) put in place by Government has not worked effectively. Mining Companies are not complying with the EPF’s regulations in that the majority are not paying the stipulated contributions. For those that have issued the bank guarantees and bonds, the bank guarantees or bonds were not validated by Bank of Zambia as per investment policy. The MSD has failed to enforce sanctions on defaulters to the Fund. The operation account was not functional and the hedging strategy put in place

Management of Environmental Degradation Caused by Mining Activities in Zambia.x
to ensure time value of money for the Fund is maintained was also poor. Only bank interests have been used as a hedging strategy thus not taking advantage of the full array of options the Fund’s the investment policy provides for. The MSD has also failed to appoint a competent External Fund Manager.
Monitoring and evaluation has also been ineffective as environmental monitoring activities were being carried out independently by various departments and there was no coordination in the collection of information and its storage.
Due to lack of capacity and resources, most institutions including ZEMA and MSD were unable to carry out monitoring regularly and consistently as they are mandated. Although equipment costing K880,847,632 was procured under CEP and delivered in 2009 for ZEMA to set up a laboratory, the laboratory was still not operational as of April 2013. Some of the reasons advanced for the laboratory not being operational were that the laboratory did not meet the criteria required to have certification, such as adequate and specialised equipment and lack of a laboratory technician primarily assigned to handle laboratory work. Some equipment such as the portable gas monitoring equipment and portable pH meter were not in working condition while other equipment needed calibration and standards for checking their performance and that the laboratory did not have its own procedures and methods for carrying out tests.
As a result of this ZEMA has had to rely on the test results provided by mining companies through bi annual reports a practice that renders the test results unreliable as ZEMA has no means of verifying them. ZEMA has on occasions used other organisations to carry out sampling and testing a practice that makes data collection very expensive and unsustainable. This was in fact one of the cause for mining companies to continue to release effluents and emissions that are higher than set limits.
Therefore the goal and overall objective of Government on environment and natural resources as set out in the National Policy on Environment of supporting Governments developmental priority of improving the quality of life of the people of Zambia through protection and management of the environment and natural resources in its entirety, balancing the needs for social and economic development and environmental integrity to the maximum extent possible, while keeping adverse activities to the minimum is not being achieved.
5. Recommendations
The audit has revealed that there are many weaknesses in the management of environmental degradation caused by mining activities in Zambia. The OAG believes that these recommendations need to be considered if the deliveries of rehabilitation and reintegration services are to be better managed ensuring that efficiency is achieved in the use of public resources. Based on the findings mentioned above the OAG recommends as follows:
a) Air, Ground and Surface Water Pollution
ZEMA should ensure that air released to the environment by mining companies does not exceed the standards prescribed and that companies that are polluting the air should be held accountable.
b) Management of Dumps/Dams
ZEMA and MSD should ensure that dumps and dams are managed properly by ensuring that:
• Restricted Access
Tailings, slag and overburden dumps should be secured and access restricted to authorised personnel only. This will not only preserve the integrity and stability of the dumps thus reduce erosion, but will also safeguard the public from exposure to contaminants. In addition, illegal mining will be curbed.
• Warning and Safety Signs
All tailings slag and overburden facilities should have warning and safety signs displayed at appropriate places.

xiManagement of Environmental Degradation Caused by Mining Activities in Zambia.
• Disposal of waste other than tailings material
Mines should be penalized for disposing waste other than tailings, slag and overburden material on dump sites to deter offenders / would be offenders except for those that seek prior authorization from ZEMA.
• Progressive Re-vegetation
Progressive rehabilitation, including vegetation management should be carried out regularly, in line with licensing conditions and other guidelines.
• Proximity of residential areas to the dams/dumps
In line with licensing conditions, there should be no residential areas within 500metres of tailings, slag and overburden dumps. In addition, the practice of communities cultivating vegetables on toe dumps should be halted forthwith.
• Submission of Bi annual reports
Mines should submit bi annual reports as stipulated in licensing conditions. ZEMA should ensure that bi annual reports are analysed promptly to ensure that polluting facilities are identified and correction take promptly.
c) Used Oil Storage Facilities
All used oil storage facilities should have bunded and impermeable floors, adequate ventilation, warning and safety signs and restricted access at all times. In addition, fire fighting equipment and fully stocked first aid kits should always be available at used oil storage facilities. Further, all storage facilities should be inspected periodically and inspection records readily available for inspection by regulatory authorities.
d) Policy Formulation
ZEMA and the ministry responsible for environmental protection should review the National Policy to assess its suitability for implementation in protecting the environment.
e) Development and Enforcement of Legislation
The statutory instruments on Environmental Impact Assessment (EIA), Water and Air Pollution Control regulations should be revised in line with changes in mining practices as a matter of urgency, given that the regulatory framework was supposed to have been revised in full by 31st December, 2008. Furthermore, legislation on all producer responsibility for all companies generating waste should be developed and implemented.
Sub-regulations of Statutory Instrument no. 29 of 1997, the Mines and Minerals Act (Act no. 31 of 1995), the Mines and Minerals (Environmental) Regulations, 1997 and Statutory Instrument No. 102 of 1998, The Mines and Minerals Regulations (Environmental Protection Fund) Regulations 1998 should be revised in order to address deficiencies identified in the current mining laws. The Government should also consider ZEMA administering this regulation to ensure that there is no duplication of work among government departments.
f) Environment Protection Fund
MSD should ensure that all mines that are required to contribute to the Fund are compelled to do so. Punitive action should be taken against erring companies. Particularly, the small scale mines should lodge bank guarantees. In addition, the committee should select new account signatories who must begin to work immediately.
All bank accounts held by EPF should be brought to the fore and reconciled by competent personnel. In addition, the Ministry of Mines should ensure that a qualified person is deployed to manage the funds on behalf of Mine Safety Department and the EPF committee as a matter of urgency.
The EPF funds should be invested in such a way as to ensure that the time value of money is maintained and the risk of the investments is diversified as per the investment policy.

Management of Environmental Degradation Caused by Mining Activities in Zambia.xii

1Management of Environmental Degradation Caused by Mining Activities in Zambia.
1. INTRODUCTIONZambia has predominantly been a mining country and is endowed with a wealth of natural resources such as copper, limestone and coal. During the last decade, several new mines have been opened which has raised considerable interest for their potential to contribute towards economic growth and poverty alleviation.
The mining sector has contributed to national economic growth through taxes, socio–economic infrastructural development, creation of employment and provision of education and health services among others.
However, the mining sector has faced challenges in achieving sustainable mining practices which cause minimum damage to the environment. Poor mining and mineral processing practices pollute the environment and their effects continue long after the mine has stopped operating.
The environmental effects of mining and mineral resource activities affect all environmental media – land, air, water, and associated flora and fauna, and human health and safety.
It is therefore important that mining activities are managed in such a way that the negative impacts to the environment and humans are minimised.

Management of Environmental Degradation Caused by Mining Activities in Zambia.2
2. MOTIVATION FOR THE AUDITThe audit was motivated by the following factors among others: 2.1. Public Interest
There have been concerns raised by the public who have cited issues such as lack of integrated mining policies, failure to disclose Developmental Agreements (DAs), failure by mines to mitigate effects of environmental degradation, air, land and water pollution, unfair resettlements and lack of consultations with the communities/stakeholders on mining projects, among other things
2.2. Parliamentary Concerns
During debates in the National Assembly, Members of Parliament have also expressed misgivings with regard to the adequacy of the Environmental Protection Fund as well as to whether environmental impact assessment studies are conducted in order to determine the effects of mining on the local communities and environment in general.
3. DESCRIPTION OF THE AUDIT AREA
The key players on issues relating to environmental management in the mining sector are the Ministry of Mines, Energy and Water Development, the Zambia Environmental Management Agency and the Zambia Consolidated Copper Mines-Investment Holdings (ZCCM-IH) through the Copperbelt Environmental Project (CEP).

3Management of Environmental Degradation Caused by Mining Activities in Zambia.
4. ROLES AND RESPONSIBILITIES OF KEY STAKEHOLDER
4.1. The Ministry of Mines, Energy and Water Development
The Ministry of Mines, Energy and Water Development is responsible for the management of the mineral resources in the country. It promotes and regulates the development of the mining sector in line with the Government policy and the formulation and enforcement of environmental regulations, among others. The Ministry discharges its environmental responsibility through the Mines Safety Department which is responsible for all aspects of safety, health and environment in the mineral exploration, mining and mineral processing operations.
4.2. Zambia Environmental Management Agency (ZEMA)
The ZEMA was established under the Environmental Management Act No. 12 of 2011. ZEMA plays advisory, regulatory, consultative, monitoring, coordination and information dissemination roles on all environmental issues in Zambia. The main objective is to provide for a clean and healthy environment for all by working with key players, from Government institutions to the individual. The functions of ZEMA are to:
a) Draw up and enforce regulations related to water, air and noise pollution, pesticides and toxic substances, waste management and natural resources management.
b) Advice the Government on the formulation of policies related to good management of natural resources and environment.
c) Advise on all matters relating to environmental conservation, protection and pollution control, including necessary policies, research investigations and training.
d) Identify projects, plans and policies that need environmental impact assessment.
e) Request information on the quality, quantity and management methods of natural resources and environmental conditions in Zambia
4.3. Zambia Consolidated Copper Mines – Investment Holding (ZCCM-IH)
ZCCM–IH (“the Company’’) is an investments holdings company which has a primary listing on the Lusaka Stock Exchange and secondary listings on London and Euronext Stock Exchanges. The Company has the majority of its investments held in the copper mining sector of Zambia. Its principal activities include managing the Zambian Government’s stake in the mining sector. Other activities include:
a) Undertaking investment analysis and aligning company operations towards maximizing returns to shareholders;
b) Ensuring effective representation on the boards of the investee companies; and
c) Promoting Zambian ownership and management in mining assets.
4.3.1. Functions of ZCCM-IH
In its transformed state as an investments holding company, the main functions of the Company are among others the following:
a) To monitor the performance of the investee companies with respect to production and metal prices in order to ensure that commitments agreed upon relating to disbursements are fulfilled on a timely basis;
b) To ensure that ZCCM-IH environmental obligations under the transaction documents are complied with;

Management of Environmental Degradation Caused by Mining Activities in Zambia.4
c) To ensure that environmental obligations continued to be attended to through different levels of participation; and
d) To liaise with prospective greenfield investors in the mining and minerals industry who will enter into agreements with the Government. The Group has continued to liaise with Greenfield investors.
4.3.2. Copperbelt Environmental Project (CEP)
CEP was established by the Government through the ZCCM-IH, the World Bank and the Nordic Development Fund. On 14th April and 30th June 2003, the Government signed the agreements with the International Development Association and Nordic Development Fund respectively. The agreements were for five years and the total project amount was K248,798,000,000 (US$52.6 million).
The principal activities of the project under the Development Financing Agreement was to assist the Government in addressing environmental liabilities and obligations associated with the mining sector following the privatisation of the mining assets of ZCCM and strengthening the capacity of its environmental regulatory institutions to improve future compliance of the mining sector with environmental and social regulations.
The project consisted of two (2) components, the Environmental Management Facility (EMF) and the Strengthening of the Environmental Regulatory Framework.
The first component, the EMF, was used as a primary mechanism for addressing environmental and social mitigation measures arising from the operations of ZCCM prior to privatisation. In addition, the facility was meant to finance the costs for implementation of priority mitigation measures to address public health issues or damage to ecological functions and supporting the preparation of a Consolidated Environmental Management Plan (CEMP).
The second component, the Strengthening of the Environmental Regulatory Framework, was aimed at strengthening the institutional capacity of the Environmental Council of Zambia (now ZEMA), MSD and delegated authorising agencies in reviewing environmental impact assessments, negotiating environmental management plans with private investors and ZCCM-IH, issuing licences, monitoring compliance with environmental standards in implementation of the EMPs, issuing pollution permits, collecting fees and other charges, etc.

5Management of Environmental Degradation Caused by Mining Activities in Zambia.
5. AUDIT DESIGN
5.1. Audit Objective
The objective of the audit was to assess the effectiveness and efficiency of the regulatory bodies in carrying out their overall responsibilities of managing the environmental degradation caused by mining activities in Zambia.
5.2. Audit Scope
The audit was focused on the management of environmental degradation caused by mining companies and the measures that the government has put in place to mitigate the impact of such activities on humans and the environment. The audit covered the MSD under the Ministry of Mines, Energy and Water Development, ZEMA under the Ministry of Lands, Natural Resources and Environment Protection, ZCCM-IH and fifteen large scale mining companies on the Copperbelt, Southern and North-Western provinces and was for the period 2009 to2012. Details of the mines visited are at Appendix 1.
5.3. Audit Questions
The audit questions were designed to seek answers to the following:
a) What measures has the Government put in place to ensure that the environmental degradation caused by mining activities is adequately managed?
b) How are the relevant Government institutions collaborating in their responsibilities for management of environmental degradation caused by mining activities?
c) To what extent are the mining companies complying with the environmental laws and rules and regulations in their responsibility for managing the environmental degradation from their mining activities?
d) What are the possible causes for failure to effectively and efficiently manage environmental effects caused by mining companies?
5.4. Audit Criteria
The sources of audit criteria were:
a) National Policy on Environment 2007
b) The Mines and Mineral Development Act No. 7 of 2008,
c) Statutory Instruments No. 29 of 1997 – The Mines and Minerals Act(Environmental Regulations),
d) Statutory Instruments No. 102 of 1998 – The Mines and Mineral Regulations, Vol. 13 Cap 213.
e) Statutory Instruments No. 125 of 2001-The Hazardous Waste Management Regulations,
f) The Environment Protection and Pollution Control Act No. 12 of 1990 repealed and replaced by the Environmental Management Act No. 12 of 2011,
g) EPPCA No. 12 of 1990, Air Pollution Control (Licensing and emission standards) Regulations 1996 (SI No. 141 of 1996)
h) EPPCA No. 12 of 1990, Water Pollution Control (Effluent and Waste Water) Regulations 1996 (SI No. 72 of 1993)

Management of Environmental Degradation Caused by Mining Activities in Zambia.6
i) Strategic Plan for the Ministry of Mines, Energy and Water Development, 2008-2012 (Formerly the Ministry of Mines, Mineral Development and Natural Resources),
j) Strategic and Business Plan 2007 – 2011 for ZEMA.
The specific audit criteria used in the audit was as follows:
a) Formulation of Policies and Regulations
i. National Environmental Policy provides that;
The goal and overall objective is to have a national policy on environment that will support government’s developmental priority to eradicate poverty and improve the quality of life of the people of Zambia. The specific objectives included;
To promote the sound protection and management of Zambia’s environment and natural resources in their entirety, balancing the need for social and economic development and environmental integrity to the maximum extent possible, while keeping adverse activities to the minimum;
To accelerate environmentally and economically sustainable growth in order to improve the health, sustainable lively hoods, income and living conditions of the poor majority with better equity and self-reliance;
To ensure broad based environmental awareness and commitment to enforce environmental laws and to the promotion of environmental accountability,
To build individual and institutional capacity to sustain the environment,
To regulate and enforce environmental laws, and
To promote the development of sustainable industrial and commercial process having full regard for environmental integrity.
ii. MEWD is responsible for among other things the following;
Analysing and initiating the formulation of policies on the management of the environment and natural resources in order to contribute to the sustainable socio-economic development of the country;
Reviewing existing and developing new legislation on the management of the environment and natural resources in order to ensure quality environmental management;
Promoting and coordinating bilateral and multi-lateral cooperation projections and treaties in inter alia environment and natural resources management in order to promote Zambia’s interest and meet international obligations;
iii. To have ECZ legal and regulatory framework revised by December 31, 2008.
EIA revised by 31st December 2007
Water and Air Pollution Control regulations which have pollution loads incorporated developed by December 31st 2008
Legislation on all producer responsibility for all companies generating waste developed and implemented by December 31st 2008
EPPCA amended by December 2008.
iv. According to the EMA Act, the functions of the Agency shall be among other things to;
Establish and review land use guidelines;

7Management of Environmental Degradation Caused by Mining Activities in Zambia.
Establish standard for the conservation and protection of natural resources in consultation with the relevant appropriate authorities,
Monitor dereliction or contamination of land and assess the nature of rehabilitation works required and;
Do all such acts and things as are necessary to carry out the purposes of this division
b) Monitoring by ZEMA
ZEMA is responsible, for among other things, to regulate all aspects of the environment through the enforcement of regulations and standards.
i. Monitoring trends in the use of natural resources and their impact on the environment.
ii. Monitoring and improving the management of surface and ground water pollutions.
iii. The Agency shall develop and enforce measures aimed at preventing and controlling pollution.
iv. Monitoring, through sampling and other techniques, the components of biological diversity, paying particular attention to those requiring urgent conservation measures and those which offer the greatest potential for sustainable use.
v. The Agency shall, in consultation with the relevant agencies or bodies , monitor:
All environmental phenomena with a view to making an assessment of any possible changes in the environment and their possible impacts ; or
The operation of any industry, project or activity with a view of determining its immediate and long term effects on the environment.
vi. The Agency shall order or carry out investigations of actual or suspected air pollution including collection of data
c) Air pollution
i. The Agency shall in accordance with the guidelines set out in the first schedule assess the quality of ambient air in order to safe guard the general health, safety or welfare of persons, animal life, plant life or property affected by workers, industrial or business activities undertaken by an operator.
ii. Any person who intends to erect or install a new industrial plant, undertaking or process which is likely to cause air pollution shall register with the inspectorate at planning stage, apply for a licence within six months prior to commencement of operations.
iii. The holder of the licence or permit shall;
Install, at holders cost, air measuring devices, collect such samples and conduct such analysis as the inspectorate may direct;
Submit monthly emissions returns submitted before or on the 9th day of the month.
d) Water pollution
i. The licence to discharge effluent into the aquatic environment shall conform to the conditions and standards for chemical and physical parameters contained in the table of standards for effluent and waste water

Management of Environmental Degradation Caused by Mining Activities in Zambia.8
ii. The holder of a licence shall –
keep a record of the licensed activities;
submit the record referred to in paragraph (a) above to the Inspectorate every six months from the commencement of the licensed activities;
iii. The Inspectorate may order the holder of a licence under these regulations to install at the expense of the holder of the licence, metering devices and to take samples and analyse them as the Inspectorate may direct.
e) Mine Dumps
i. A developer shall submit a report to the Director of Mines which shall be prepared by a competent person and shall state the safety precautions and the other measures to be taken to protect the environment surrounding the dumping area, before dumping any material on that site.
ii. A developer shall obtain a report from an independent competent person (every two years) on;
each active classified dump;
the condition of the ground between a dump and all surface intersections of vertical planes drawn from the boundaries of any mine workings less than one hundred metres from the nearest edge of the dump;
every matter which may affect the security or safety of the dump, ground or mine workings;
any significant impact on the environment not originally predicted; and
The progress made in implementing the environmental impact statement.
iii. A copy of the report shall be kept at the office of a mine for inspection by an inspector and another copy sent to the Director - MSD.
f) Environmental Protection Fund
i. There shall be paid from the Fund, monies required to carry out the objectives of the Fund which are to provide assurance to the Director (MSD) that the developer shall execute the Environmental Impact Statement in accordance with the mines and minerals (Environment Regulations 1997) and to provide protection to Government against the risk of having the obligation to undertake the rehabilitation of a mining area where the holder of the mining licence fails to do so.
ii. A developer shall contribute to the Fund established under the Act.
iii. The contributions to the Fund, shall be calculated depending on the performance of each developer, and shall be categorized as follows:
Category 1: action taken to rehabilitate
√ progressive rehabilitation carried out
√ whether the rehabilitation has been properly monitored; and
√ Whether the annual rehabilitation audits show progress to meet the target of the environmental impact statement to manage environmental pollution.

9Management of Environmental Degradation Caused by Mining Activities in Zambia.
Category 2: Environmental compliance capability
√ the financial capability to complete the rehabilitation of the mine area;√ the materials in place for total mine area rehabilitation;√ whether suitable expertise is provided for the organizational structure; and√ Whether the developer or the person who holds a mining licence or permit has
an approved environmental impact statement or project brief. Category 3:Basis operational and strategic environment protection requirements
√ An approved environmental impact statement or project brief;√ discharges of mining operations are permitted or licensed;√ post-mining land use and slop and profile design, allowing stable land
rehabilitation within the mining or permit area; and√ A water management system is in place or designed to contain, treat, discharge
or dispose of contaminated water. iv. The contribution shall be deposited with the Fund over a period of five years beginning
the year the prospecting, exploration or mining operations are commissioned in the case of new operations, or when the developer submits an approved environmental impact statement in the case of existing mines or project briefs for prospecting and exploration projects.
v. The administrative expenses of operating the Fund shall not exceed 1.0 per centum of the total income of the Fund.
vi. All monies forming part of the Fund shall, pending the investment or application, therefore, in accordance with these regulations be paid or transferred into a dedicated bank account with a registered bank.
vii. The monies of the Fund shall be held in a hard currency account.
viii. Any monies in the fund that are not immediately required for the objectives of the Fund may be invested by the committee in any manner as may be authorised by the minister.

Management of Environmental Degradation Caused by Mining Activities in Zambia.10
6. AUDIT METHODOLOGY
The audit involved examination of records, interviewing of officials at ZEMA, CEP, MSD and selected mines; and physical site inspections. Fifteen (15) out of thirty-one (31)mining companies operating in Zambia were visited(Appendix 1).The companies selected were mining companies with large scale mining licences with a view of obtaining an understanding on how environmental degradation from their activities was being managed.
The audit was conducted in accordance with the mandate as provided for under Article 121(2) of the Constitution of Zambia, the Public Audit Act No. 8 of 1980, the Public Finance Act No. 15 of 2004 and the INTOSAI Guidance for Supreme Audit Institutions on Auditing Mining.
The methods of data collection included:
6.1. Documentary Review
Documentary review of National Environmental Policy, Zambia’s Mining Policy 1995, minutes of board meetings, annual and quarterly reports, reports submitted to ZEMA by mining companies; showing air and water sampling test results conducted and averaged monthly was conducted.
Other documents reviewed were files of correspondence between mining companies ZEMA and MSD, compliance monitoring reports, budgets and work plans, funding and releases, procurement records, environmental audit reports, environmental impact assessment reports, staff establishments, staff returns, recruitment records, asset register, strategic plans, financial statements, bank statements, monitoring and evaluation reports, among others.
6.2. Interviews and questionnaires
Structured interviews were used and in some instances questionnaires administered to key personnel in order to obtain detailed understanding of management of environmental degradation programmes in place. In addition, the interviews were carried out to collect primary data used to assess the efficiency and effectiveness of managing environmental degradation and to confirm information obtained from documentary review.
6.3. Physical Inspections
Physical inspections of the mines were carried out at all the selected mines in the company of ZEMA and Mine staff. Audit evidence was also collected through photographs.
6.4. Data Analysis
Data analysis of structured interviews and information collected from documents was carried out to answer the audit questions. Some of the analysis included the analysing of contribution to the EFP and monthly emissions and effluents to the environment. In the analyses maximum, minimum, average and median values were calculated. The details of these analyses are provided in the report and the appendices.

11Management of Environmental Degradation Caused by Mining Activities in Zambia.
7. AUDIT FINDINGS7.1. Inadequate Measures Put in Place by Government to Ensure that Environmental
Degradation Caused by Mining Activities are Effectively and Efficiently Managed.
a) National Policy on Environment
Although ZEMA has no specific environmental policy on mining activities, there is a comprehensive national policy on environment which addresses environmental issues. The policy was launched in 2007 and has incorporated a number of international protocols and /or conventions that Zambia has signed and ratified on the management and protection of the environment.
However, ZEMA has not been able to fully implement this policy as some provisions and obligations under some of the international laws demanded costly technology and other technical resource requirements which were a major challenge. For instance, the destruction of certain types of hazardous waste and restoration to near natural conditions of craters and waste dumps left behind after many years of mining.
Further, despite the challenges that ZEMA has faced in implementing the policy, the Ministry has not reviewed the policy with the aim of assessing its suitability since its formulation in 2007.
b) Weak Regulatory Framework
i. ZEMA
The Strategic and Business Plan 2007-2011 identified four strategic imperatives namely; the revision of the EIA regulations by 31st December 2007, the development of Water and Air Pollution Control regulations which have pollution loads incorporated by 31st December 2008,the development of legislation for all producer responsibilities for companies generating waste by 31st December 2008 and the amendment of EPPCA by 31st December 2008.
However, as of May 2013, only the EPPCA had been repealed and replaced by the Environmental Management Act No. 12 of 2011. The other strategic imperatives had not been attained despite the availability of funding of K384million under the CEP. It was also observed that although ZEMA commenced working on reviewing and amending the EIA in 2009, the revised version was still awaiting consent from the Ministry of Justice and the inclusion of new concepts from the EMA of 2011. Furthermore, the water and air pollution regulations were still under review as of May 2013.
In addition, ZEMA had no standard on how to manage Uranium. Instead the Agency relied on the Ionizing and Radiation Protection Regulations which were administered under the Radiation Protection Board as such it could not effectively audit the waste rock dump under Barrick Lumwana Mine.
A review of the compliance monitoring report issued by ZEMA to Barrick Lumwana revealed that the waste containing uranium was not properly covered to avoid radiation leaks. It was observed that at Lumwana mine copper concentrates high in uranium were stockpiled in open grounds instead of a shed with impermeable floors. With regard to management of uranium, ZEMA stated they did not have the required financial and technical capacity to embark on the development of the standards at the moment.
ii. Failure to Review Regulations - Ministry of Mines Energy and Water Development
Although the principal legislation was reviewed, repealed and replaced in 2008, the Sub – regulations, Statutory Instrument No. 29 of 1997, the Mines and Minerals Regulation (Environmental Protection Fund) Regulations 1998 were not reviewed.

Management of Environmental Degradation Caused by Mining Activities in Zambia.12
c) Environmental Protection Fund put in place by Government has not worked effectively
The Fund put in place to secure Government against future environmental liabilities that may arise in case the mines fail to meet the environmental liabilities at closure of business was not working effectively. A review of minutes of the EPF committee meetings revealed that the management of EPF moved from CEP to MSD on 31st March, 2011 and the EPF secretariat under CEP was dissolved on 12th September, 2011.
The following were observed:
i. Failure to contribute to the Fund
During the period under review amounts totalling US$226,649,973 were due to the Fund from forty nine (49) mining companies (Appendix 2). However, as of 31st December 2012, only amounts totalling US$50,402,334had been contributed leaving a balance of US$176,247,639 outstanding as shown in the table below:
Table 1: Contributions to the Fund as 31st December 2012
Category Amount DueUS$
Amount PaidUS$
Amount Outsanding
US$Bonds/Guarantee 214,848,683 40,036,247 174,812,436 Cash 11,562,406 10,366,087 1,196,319 TOTAL 226,411,089 50,402,334 176,008,755
Source: Mines Safety Department
According to existing arrangements, part of the contributions were supposed to be made in the form of bank guarantees or bonds validated by the Bank of Zambia while the balance was supposed to be made in cash. In this regard, contributions totalling US$40,036,247were received in the form of bank guarantees or bonds from six (6) large-scale mining companies namely Kagem, Kansanshi, Lumwana, Bwana Mkubwa and Muliashi Mines and one (1) small-scale mining company, Gemfields.
However, contrary to the laid down procedures, the bank guarantees/bonds were not validated by the Bank of Zambia.
ii. Failure to apply penalties on defaulting companies
Although the Director had power to enforce compliance which includes applying penalties such as charging interest at ruling bank rate
to defaulters in line with Section 117(2) of the Mines and Minerals Development Act, no action had been taken against the defaulting mining companies as of 31st May 2013 (Appendix 2).
Failure by MSD to invoke the law on defaulting mining companies shows weaknesses in the operation of the MSD. This was not in the best interest of the country which may have to meet the cost of rehabilitation of the environment from the Government treasury should the defaulting mines fail to do so.
iii. Failure to Appoint an External Fund Manager
According to the resolution of the EPF committee, the EPF was supposed to contract an external fund manager or managers to advise on possible investment options in the market and monitor performance of the market.
Contrary to the resolution, MSD had not appointed an External Fund Manager and the Fund was being managed by an Engineer who had no formal training in

13Management of Environmental Degradation Caused by Mining Activities in Zambia.
investment portfolio management. Consequently, despite the EPF being permitted to invest in various asset classes such as equities, Government securities (Treasury bills and bonds), corporate bonds, real estate and collective investment schemes
, the EPF concentrated on cash and cash equivalents alone such as fixed deposit bank interest. Therefore, there is a risk that the time value of the funds was not adequately taken into consideration in the way the Fund was managed.
The EPF has both composite and investments bank accounts held with five (5) commercial banks. Composite bank accounts are used as collection points for EPF contributions while investments accounts are used as fixed deposits accounts.
A review of the account balances as of April 2012 revealed that the total balance of the investments and composite accounts stood at US$8,989,048.66 which had accumulated interest of US$140, 223.59.No proper reconciliation of the accounts was done. (Appendix 3)
iv. Operational Account was Non Functional.
After the management of the EPF Fund moved from CEP to MSD in March 2011, the operations account held at ZANACO was suspended. However, as of December 2012 the account was not operational and consequently, activities such as sensitisation of mines on the need to contribute to the EPF have not been carried out.
d) Lack of monitoring capacity by ZEMA and MSD
In order to build motoring and evaluation capacity in ZEMA and MSD, the Government through CEP procured various monitoring equipment at a total cost of ZMW3,483,601 (Appendix 4) which was aimed at helping the institutions establish certified laboratories and a monitoring network countrywide covering both effluent and ambient monitoring.
However, the following were observed:
i. Equipment costing ZMW27,611 delivered to ZEMA in 2009 had not been delivered to MSD as of 31st December 2012. See table below:
Table 2: Equipment not delivered to MSD
Equipment not delivered to MSD
Name of equipment/ acersoriesAmount
ZMWKayak sediment corer 2,858 laboratory screens 2,842 laboratory furnance 7,015 Oven for drying samples 5,058 Konimeters x2 2,605 Spare parts for PTEA- electrode set for Cd,Pb,Cu,Mn and mercury film glassy carbon working electrodes,platinum counter electrode sets and referenece electrode for mesuring chromium and mercury. 2,476 Spare parts for PTEA- electrode set for Fe,Ni and Co complete with chrome film glassy carbon working electrodes,platinum counter electrode sets and referenece electrode for mesuring iron, nickel and cobalt 2,476
Spare part chamber muffle furnance consisting of element and electrode 1,140
spare kit for high temperature oven comprising, fan motor and elements 1,140 TOTAL 27,611
Source: ZEMA

Management of Environmental Degradation Caused by Mining Activities in Zambia.14
ii. Despite the availability of the equipment, as of May 2013, the laboratory had not been certified as it did not meet the criteria such as:
Qualified laboratory personnel,Properly calibrated equipment,Operational standards, Testing procedures and methods,
iii. The portable gas monitoring equipment and portable pH meter at ZEMA were not in working condition. No air and water sampling, testing and analysis were carried out by ZEMA
In the absence of properly equipped laboratories the results of their monitoring activities may be rendered unreliable. Consequently, ZEMA and MSD relied on results produced by the mining companies through bi-annual reports but such results could not be verified.
7.2. Compliance with Environmental Regulations and Licencing Conditions by Mining Companies
a) Air Pollution
Contrary to the provisions of the EPPCA No 12 of 1990, Air Pollution Control (Licensing and Emissions Standards) Regulations 1996 (Statutory instrument No 141 of 1996) which stipulates, among others, that:
i. The holder of a licence shall submit monthly emission returns to ZEMA,
ii. The maximum amount of sulphur dioxide (SO2) a mine is allowed to emit from the smelter and convertors to the environment is1000mg/Nm3.
iii. The maximum amount of dust a mine was allowed to emit from the smelter and converters to the environment was 50mg/Nm3.
iv. The maximum amount of Arsenic (As) a mine was allowed to emit to the environment was 0.5mg/Nm3.
v. The maximum amount of copper content in the air a mine was allowed to emit to the environment was 1.0mg/Nm3.
vi. The maximum amount of lead (Pb) emission to the environment was set at 0.2 mg/Nm3;
The following were observed;
i. Failure to Produce Monthly Returns on Air Emissions to the Environment.
Two (2) out of the five (5) large scale mining companies selected, that had smelting facilities, did not comply with the requirement to submit monthly returns on air emitted into the environment for periods ranging from one (1) year to three (3) years as shown in Table 4 below:

15Management of Environmental Degradation Caused by Mining Activities in Zambia.
Table 3: Mining facilities that emitting air to the environment without producing returns.
Mines Facilities Monthly Returns not Submitted
1. Chimney 1 January 2010 to December 2011.January to June 2010
July to December 2011January to June 2010
July to December 20119. Horizontal Kiln January 2009 to December 201110. Vertical Kiln January 2009 to December 201111. Hydrator January 2009 to December 2011
1. Chambishi CopperSmelter.
2. Anode Furnace
3. Slag Cleaning Furnace
2. Ndola Lime
Source: Bi annual reports submitted by Mining companies to ZEMA
ii. Sulphur Dioxide(SO2) Emissions
The audit revealed that the average value for Sulphur Dioxide released to the environment by four (4) out of the five (5) mining companies ranged from 358.6mg/Nm3 to 86,155mg/Nm3. Further analysis showed that the mining companies’ emissions were above the ZEMA statutory limits. Eight (8) mine facilities emitted between one (1) and thirty (30) times above the statutory limit out of the 36 months assessed. Mopani Copper Mine emitted up to 155,769mg/Nm3 which was 155% higher than the set limit.(Appendix 5)
iii. Dust from Stack Emissions
The average amount of dust that was emitted by the five (5) mines at eleven (11) facilities assessed was higher than the set limit ranging from 157.1mg/Nm3to 2,679.5mg/Nm3. The highest was recorded by Ndola Lime at 5,550mg/Nm3which was 111 times higher than the statutory limit of 50mg/Nm3. Further analysis conducted revealed that out of the 36 months assessed, all the mines emitted dust which was higher than the set limit for periods ranging from 4 to 28 months. The audit also revealed that Chambishi Copper Smelter did not assess the dust parameter for chimney 1 contrary to the air pollution regulations and licencing conditions set by ZEMA. (Appendix 6)
iv. Arsenic(As)
The audit revealed that the average content of arsenic released to the environment ranged from 0.4mg/Nm3 to 4.7mg/Nm3. Generally, out of 36 months assessed, four(4) out of five (5) mines released air high in arsenic for periods ranging from one (1) month to twenty-eight (28) months at seven of the facilities. The highest was recorded by Mopani Copper Mine at the converter slag-blow-stack with emissions up to 38.8mg/Nm3 which was 77.6 times higher than statutory limit of 0.5mg/Nm3. Ndola Lime and Chambishi Copper smelter did not provide test result throughout the period under review at three(3) and one (1) of their facilities respectively. (Appendix 7)
v. Copper (Cu)
While the requirement for copper content in the air emitted to the environment was set at 1.0mg/Nm3, the average copper content in the mine emissions were high ranging from 2.7 to 151.3mg/Nm3
.The highest was recorded by Mopani Copper Mine at 854.2mg/Nm3which was 854times higher than the set limit. Furthermore, the audit revealed that out of 36 months assessed, the mine emissions were higher than set limit for periods ranging from 9 months to 31 months. Ndola Lime and Chambishi Copper Smelters did not completely provide returns for copper while the other mines did not provide returns for some months from one (1) to three (3) years contrary to the air pollution regulation.(Appendix 8)

Management of Environmental Degradation Caused by Mining Activities in Zambia.16
vi. Lead(Pb)
Analysis of data obtained from the bi annual reports revealed that the average value of lead content in the emissions ranged from 0.3 to 23.4mg/Nm3
. Three(3) mines did not comply with the set parameters, at six (6) of their facilities, for periods ranging from 5 to 31 months out of the 36 months assessed. Mopani Copper Mine emitted up to 75.9mg/Nm3which was 379 times higher than the set limit of 0.2mg/Nm3.Chambishi Copper Smelter did not assess the lead parameter at Chimney 1, while Ndola Lime did not assess all the three stacks, contrary to the regulations.(Appendix 9)
vii. Weaknesses in the Developmental Agreements
On 31st March 2000, Government signed a developmental agreement with Mopani Copper Mine Plc under which the company took control of the Mopani Mine in Mufulira. The agreement provided for the following, among others:
Text box1: Extracts of the Developmental Agreement
The MCM:
1) Will negotiate in good faith with GRZ with a view of agreeing within six months of finalisation of the baseline environmental study (or such longer periods as the parties may agree) the detailed terms and condition of the Environmental plan.
2) Shall comply with and implement the environmental plan in accordance with the time tables contained therein and good mining practices and, without prejudice to the time table, the company shall achieve the objectives specified in the Environmental Plan no later than the last date specified therein for achievement.
3) Save as provided in clause 12.4 , GRZ hereby confirms that for the stability period it will not take any action and will procure no action is taken by any of its ministries, departments or agencies over which it has operational control acting on its behalf ) under or in enforcing any applicable laws with the intent of :
• Securing the company’s earlier compliance with environmental laws other than that envisaged by the timetable and conditions set in the environmental plan.
• Requiring the company to clean up and/or remove any stock of pollutants and/or remedy any other condition which was pre-existing as at the date of this agreement(other than in respect of areas of land or of water bodies identified by the company pursuant to clause 12.19(b)(ii)
• Imposing fines or penalties upon the company payable under the environmental laws (or enacting new fines and penalties there under) which are the payable respect of the company’s non-compliance with the such environmental laws and where the environmental plan provides for the remedy of the same in accordance with a specified timetable and the company is in material compliance with that timetable.
• Imposing fines or penalties upon the company’s breach of environmental laws in the case of penalties charged in respect of the emission of sulphur dioxide arising from the ongoing operation of the Mufulira smelter provided that the company remains in compliance with the measures and in material compliance with the timetables for implementing those measures set out in the environmental plan to reduce such omissions and as appropriate, for the construction of a new acid plant as set out in the environmental plan or,
4) Effecting any changes thereto or enacting new legislation and regulation or repealing existing laws or regulations which would prevent the company complying with environmental plan and time tables for contained therein without making provisions for the company to be exempted there from or material alter or affect the scope, enforcement or application of environmental laws regarding the establishment, maintenance or operation of the environmental protection fund.
Source: Developmental Agreement
In pursuance of the terms of the agreement above, MCM developed a plan as detailed below, in order to bring the smelter into compliance with the existing environmental legislations.

17Management of Environmental Degradation Caused by Mining Activities in Zambia.
Text box 2: Extracts of the Environmental Management Plan
Phase OneInstallation of the ISA Furnace to replace the existing electric furnace used for primary smeltingInstallation of the acid plant for treatment of the ISA smelt furnace off gasses, and Refurbishment and upgrade of the materials handling facilitiesPhase TwoInstallation of the two new anode furnaces andInstallation of twin new copper anode casting wheelsPhase Three
i. Installation of two new bigger 15 X 35 converters, refurbishing one existing converter and installations of water cooled hoods and off gas handling facilities, and
ii. Installation of a second new acid plant with gas cleaning and cooling plant and associated equipment for the treatment of the converter off gas
Source: Smelter Upgrade Environmental Project Brief – MCM
In this respect, in their decision letter dated 7th December 2004, ZEMA approved the plan and MCM was required to implement the following:
Text box 3: Extracts of ZEMA Decision Letter Issued to MCM
i. To implement all the proposed mitigation measures provided in the project brief
ii. To obtain a licence to emit air pollutants from the acid plant.
iii. To meet the long term emission limit as stipulated in the third schedule (Regulation 4) of SI 141 of 1996 by June 2015 emissions from either the electric furnace stacks and/ or acid plant.
iv. To conduct emission monitoring on a monthly basis for every point.
v. Dilution of flue gases to achieve long term emission limits shall not be allowed and is punishable.
vi. Mopani Copper Mine shall capture 55- 59% of the total sulphur dioxide generated at the 64% matte grader by December 2006.
vii. MCM shall by December 2008 implement measures to capture the sulphur dioxide emissions from the converters. Detailed studies shall be conducted and approved by Mine Safety Department and Environmental Council of Zambia before the project is implement.
viii. Compliance with environmental standards and/or specific limits of particular pollutants is the responsibility of the developer. Thus, compliance with ECZ recommended measures does not absolve the developer from responsibility if such measures do not achieve compliance with environmental control standards.
ix. This approval does not exempt the developer from obtaining any other relevant authorisation.
x. This decision letter does not exempt Mopani Copper Mine Plc from obtaining any other relevant authorisations and that permission can be withdrawn without notice should the developer fail to comply with laid down conditions.
Source: Decision Letter dated 7th December 2004
However, the following were observed:
Total sulphur capture of 55- 59% has not been met:
Contrary to the agreement, MCM did not meet the 55 – 59% benchmark of the total sulphur dioxide emitted to the environment.
In this respect, in thirty (30) out of thirty-six (36) months assessed, the sulphur dioxide captured was below 55% as shown in the table below:

Management of Environmental Degradation Caused by Mining Activities in Zambia.18
Year Month Total Sulphur dioxide Capture (% )
Remark
2009 January 49.62 Below rangeFebruary 51.98 Below range
March 54 Below rangeApril 50.58 Below rangeMay 50.99 Below rangeJune 48.62 Below rangeJuly 50 Below range
August 47 Below rangeSeptember 48 Below range October 48 Below rangeNovember 45 Below rangeDecember 47 Below range
2010 January 50 Below rangeFebruary 46 Below range
March 52 Below rangeApril 46 Below rangeMay - No resultsJune 57 Within rangeJuly 52 Below range
August 49 Below rangeSeptember 50 Below range
October 54 Below rangeNovember 54 Below rangeDecember 50 Below range
2011 January 51 Below rangeFebruary 54 Below range
March 49 Below rangeApril 50 Below rangeMay 59 Within rangeJune 66 Above rangeJuly 51 Below range
August 52 Below rangeSeptember 58 Within range
October 57 Within rangeNovember 51 Below rangeDecember 53 Below range
Source: Bi Annual Reports from Mopani.
Measures to capture the sulphur dioxide from the converter not implemented
Although the agreement required MCM to put in place measures to capture the sulphur dioxide from the converters by December 2008, the company did not implement the decision. As of May 2013, MCM had embarked on installing new converters. However, the converters were emitting sulphur dioxide, in the range, of 15,243 and 621,879 mg/Nm3 per month compared to the statutory limit of 1,000 mg/Nm3. (Appendix 5).
Failure by MCM to implement the measures in the agreement has impacted negatively on the communities in close proximity to the mine. In particular, the community most affected is Kankoyo residential area which stretches, in a circular manner, from the eastern through to southern and western side of the plant. Some houses are less than 500m from the plant site fence.
In addition, a study carried out by Copperbelt Environmental Project (CEMP II) in 2005 revealed that the children in Mufulira (Kankoyo township) had higher respiratory infections, high lead and cadmium concentration in blood than those in Kitwe. Since the economic condition of Mufulira and Kitwe were similar, the study attributed the results to air pollution in Mufulira.
TABLE 4: Sulphur Dioxide Capture

19Management of Environmental Degradation Caused by Mining Activities in Zambia.
Failure by ZEMA to Enforce the Agreement
Although MCM failed to meet its obligations under the agreement, in particular, to capture 55 – 59% of sulphur dioxide emissions by December 2006 and to put in place measures to capture the sulphur dioxide emissions from the converters by December 2008, ZEMA was unable to take any action against the company as clause 12.4 of the Developmental Agreement virtually gave the company immunity against any punitive measures by Government and any of its agencies during the stability period which ends in June 2015.
b) Surface Water Pollution
In order to assess the quality of water that the mines released to the environment after mining operations, twenty-eight (28) facilities in fifteen (15) large scale mining companies were selected based on the risk of pollution to the environment. (Appendix 1)
According to the licensing conditions issued by ZEMA and Section (7) of the Water Pollution Control (Waste Water and Effluent) Regulation 1993:
i. The holder of a licence shall submit a record of all its licensed activities,
ii. The waste water or effluent released to the environmental should have a pH value of 6 to 9,
iii. Waste water or effluent released to the aquatic environmental should not have total suspended solids exceeding 100mg/litre
iv. Total Dissolved Solids must not exceed 3000mg/litre and must not adversely affect surface water.
v. The sulphate burden in the waste water or effluent released to the aquatic environmental must be reduced to 1500mg/l.
vi. Copper compounds (TCu) should not exceed 1.5mg/L.
vii. Total cobalt compounds in effluents discharged not to exceed 1.0mg/litre
viii. Maximum limit of 1.0mg/Litre of total manganese (TMn)
ix. Maximum contents of iron shall be 2.0mg/L
Examinations of bi-annual reports and other records submitted by mining companies to ZEMA, correspondence files between ZEMA and the mines, compliance monitoring reports and physical inspections conducted at the facilities revealed that mining companies released waste water and effluent to the environment with physical and chemical parameters above and/or outside the minimum limits set by ZEMA as follows:
i. Submission of Waste Water Discharge Returns To ZEMA
There were ten (10) mines out of sixteen (16), representing 62.5% which did not submit bi annual reports to ZEMA on twenty-two (22) facilities under their control that discharged waste water and effluents into the environment. (Appendix10)
ii. pH Value.
Bwana Mkubwa Mine and Maamba Collieries released water to the environment which was acidic with pH Values ranging from 3 to 4.
iii. Total Suspended Solids (TSS).
There were four(4) mines namely Non Ferrous Copper Mine, Mopani Copper Mine- Mufulira, Konkola Copper Mine Nchanga and Konkola IBU that continued after the privatisation of the mines to release water to the environment which was up to 48,069mg/l or 480% higher than the ZEMA authorised limit of 100mg/l. (Appendix 11)

Management of Environmental Degradation Caused by Mining Activities in Zambia.20
iv. Total Dissolved Solids (TDS).
There were two (2) mines that discharged waste water from three facilities to the aquatic environment that had total dissolved solids in excess of the authorised limit of 3,000mg/l. KCM Nchanga division, released waste water from Muntimpa Tailing Dump spillway that had a TDS content of up to 5,411mg/l. (Chart 1).
It was also observed that there were no test results for water released to the environment for the period from August to October 2009 and January 2011 to December 2011 for Non Ferrous Copper Africa Mining Plc (NFCA) while KCM had no test results for the period July 2009 to December 2009 contrary to the licences conditions issued by ZEMA that required that average monthly test results be sent to ZEMA in a bi-annual report.
Sediments released in Nchanga and eventually Mushishima stream at Pollution Control Dam (PCD) by KCM Nchanga Division
Solids reporting into Mushishima stream
Sediments from Muntimpa TSF reporting into Muntimpa stream
Sendiments on the embarkments of the stream formerly known as Hippo pool

21Management of Environmental Degradation Caused by Mining Activities in Zambia.
v. Sulphates.
KCM Nchanga division discharged effluents with sulphates (SO4) contents of up to 3,270mg/l which was above the statutory limits of 1,500mg/l. There were no test results for PCD and Muntimpa spillways for the period from July 2009 to December 2010.
It was also observed that Chambishi Copper Mine discharged effluents with high sulphates in 2011 of up to 2,189mg/l while there were no test results for the months of June to November 2010 and June, August and September 2011 (Chart 2)
Chart 2.
Source: Bi Annual Reports* Other Mines not appearing were all below the statutory limits
0
1000
2000
3000
4000
5000
6000
Jan
Feb
Mar
Ap
r May
Ju
n Jul
Aug
Sep
Oct
Nov
De
c Jan
Feb
Mar
Ap
r May
Ju
n Jul
Aug
Sep
Oct
Nov
De
c Jan
Feb
Mar
Ap
r May
Ju
n Jul
Aug
Sep
Oct
Nov
De
c
2009 2010 2011
Average Monthly releases of TDS in mg/L
Time in months
Mines that discharged e:luents high in Total Disolved Solids (TDS)
ZEMA statutory limits
NFCA -‐TD6 overHlow efHluent quality KCM NchangaPCD Spillway KCM Nchanga-‐Muntimpa spillway
Chart 1.
Source: Bi Annual Reports* Other Mines not appearing were all below the statutory limits.** Between January and June 2009,Chambishi Copper Mine was still under Development.
0
500
1000
1500
2000
2500
3000
3500
Jan
Feb
Mar
Ap
r May
Ju
n Jul
Aug
Sep
Oct
Nov
De
c Jan
Feb
Mar
Ap
r May
Ju
n Jul
Aug
Sep
Oct
Nov
De
c Jan
Feb
Mar
Ap
r May
Ju
n Jul
Aug
Sep
Oct
Nov
De
c
2009 2010 2011
Average monthly sulphates released to
the environm
ent in mg/l
Time in Months
Mines that discharged ef:luents high in sulphates(so4)
ZEMA statutory limits
Chambeshi Copper Smelter-‐Acid plant drain 1500

Management of Environmental Degradation Caused by Mining Activities in Zambia.22
v. Total Copper (TCu).
Seven(7) mines discharged waste water to the environment which had TCu content above the statutory limit of 1.5mg/l at fourteen (14)discharge facilities for periods ranging from three (3) to twenty-four (24) months out of the thirty-six (36)months assessed. The discharge of waste water above the statutory limits ranged from 1.6mg/L to 787mg/L of Total Copper(TCu) compounds with KCM – Pollution Control Dam (PCD) recording the highest pollutants in their discharged water; while four (4) mines did not submit test results for nine (9) licensed discharge facilities.(Appendix 12)
vi. Total Cobalt (TCo).
Five (5) mines namely Chambishi Metals, Non Ferrous Copper Mine, KCM Konkola, KCM Nchanga and MCM Mufulira mines released effluents to the aquatic environment at ten(10) licenced discharge points that had higher TCo content than the set limits by up to twenty-three (23) times. The highest recorded numbers above limit was 311mg/litre by KCM Nchanga open pit which decants into the Nchanga stream. (Appendix 13)
vii. Total Manganese (TMn)
Four (4) mines namely Non Ferrous Copper Mine, KCM Nchanga and MCM Mufulira and MCM Nkana released effluents above the set limit of 1.0mg/l at ten (10) licensed discharge points with maximum TMn contents ranging from 4.0mg/litre to 201.1mg/litre. (Appendix 14)
viii. Total Iron (TFe)
Four (4) mines namely KCM Nchanga, KCM Konkola, MCM Mufulira and MCM Nkana SBU released effluent with TFe content above the authorised limit 2.0mg/l to the aquatic environment at seven (7) discharge points with maximum values ranging from 6.3mg/l to 6,752mg/l .(Appendix15)
c) Ground Water Pollution
In order to assess the quality of ground water, bi annual reports submitted by mines to ZEMA were scrutinised. A sample of four (4) mines with seven(7) facilities were analysed as showninTable.5 below:
Table 5:Facilities Assessed for Ground Water Pollution
Name of Mine Name of Facility
1. Chambishi Copper Smelter 1. Sulphuric Acid Storage Facility.
2. Konkola Copper Mine - Nkana 2. Acid Loading Bay.
3. Mopani Copper Mine Mufulira- 3. Concentrate smelter shed borehole no. 9
4. Acid Loading Bay.
5. Borehole No. 18 between take house 5 and refinery change house.
4. Mopani Copper Mine Nkana - 6. Old CVW.
7. Cobalt Plant – Deep.
8. Cobalt Plant –Shallow.
Source: ZEMA

23Management of Environmental Degradation Caused by Mining Activities in Zambia.
i. Failure to provide Test Results
Chambishi Copper Smelter did not submit bi-annual reports, Konkola Copper Mine - Nkana and Mopani Mufulira provided annual and quarterly test results respectively instead of monthly averages while some test results for other months were not provided as shown in the table below.
Table 6: Mines that did not provide Monthly Test Results
Name of mine Name of facility Period
1. Chambishi Copper Smelter
Sulphuric Acid Storage Facility July 2009 to December 2011.
2. Konkola Copper Mine-Nkana
Acid Loading Bay Annual averages provided instead of the monthly averages.
3. Mopani Copper Mine Mufulira-
Concentrate Smelter Shed borehole no. 9 both deep and shallow
Quarterly averages provided instead of the monthly averages.
Source: Bi annual reports
ii. pH Value
Water from Mopani Copper Mine sipping into ground water at two (2) of its facilities namely Old CVW, Cobalt plant both shallow and deep aquifer was highly acidic with an average pH Value of 3.4 to 5.0. There were no test results for Chambishi Copper Smelter while the quarterly averages as opposed to monthly averages were provided for MCM Mufulira concentrate shed. (Appendix 16)
iii. Total Suspended Solids (TSS).
Suspended solids at borehole No.18 of the Mopani Copper Mine-Mufulira were up to 10,563mg/l which was higher than the authorised level of 100mg/l. Mopani Copper Mine-Nkana did not provide test results for all the three facilities for suspended solids. In addition, there were no test results for Chambishi Copper Smelter while the quarterly averages as opposed to monthly averages were provided for MCM Mufulira concentrate shed. (Appendix17)
iv. Total Dissolved Solids (TDS).
MCM Mufulira was compliant at both facilities while MCM Nkana was not compliant for some months with total dissolved solids recorded of up to 11,063mg/l high while some months had no test results. Furthermore, there were no test results for Chambishi Copper Smelter while the quarterly averages as opposed to monthly averages were provided for MCM Mufulira concentrate shed. (Appendix 18)
v. Sulphates.
The borehole test results for MCM Mufulira were compliant to the statutory limit while there was no evidence of testing at MCM Nkana and Chambishi Copper smelter as no test results were availed for audit. (Appendix 19)

Management of Environmental Degradation Caused by Mining Activities in Zambia.24
vi. Total Copper (TCu).
Borehole test results at five (5) discharge facilities at both MCM Mufulira and Nkana sites were higher that the set limit of 1.5mg/l. The highest was 118mg/l which was 118 times higher than the limit. There were no test results for Chambishi Copper Smelter while the quarterly averages as opposed to monthly averages were provided for MCM Mufulira concentrate shed. (Appendix 20)
vii. Total Cobalt (TCo).
MCM Nkana mines boreholes test results for the cobalt plant were up to 4,200mg/l for the deep aquifer and 2,781mg/l of the shallow aquifer as compared to the authorised limit of 1.0mg/l. There were no test results for Chambishi Copper Smelter while the quarterly averages as opposed to monthly averages were provided for MCM Mufulira concentrate shed.(Appendix 21)
viii. Total Manganese (TMn)
MCM Mufulira and MCM Nkana borehole test results were above the set limit at all the five (5) facilities with a record high of up to 235mg/l contrary to the set regulations. There were no test results for Chambishi Copper Smelter while the quarterly averages as opposed to monthly averages were provided for MCM Mufulira concentrate shed.(Appendix 22)
ix. Total Iron (TFe)
MCM Mufulira and MCM Nkana borehole test results were above the set limit at four (4) of its facilities with the maximum values ranging from 28.9 to 214 mg/l compared to the authorised limit of 2.0mg/l. There were no test results for Chambishi Copper Smelter while the quarterly averages as opposed to monthly averages were provided for MCM Mufulira concentrate shed.(Appendix23)
There was no baseline data for the boreholes submitted by ZEMA for audit scrutiny.
d) Management of Dump Sites
Licensing conditions and Statutory Instrument No. 29 of 1997 – The Mines and Minerals (Environmental Regulations) of 1997 stipulate that:
i. All tailings dams and dumps should be secured and access restricted to authorised personnel only.
ii. TSF should have warning and safety signs displayed at appropriate places.
iii. Disposal of waste other than tailings material at TSF is prohibited except with the written consent of the Zambia Environmental Management Agency (ZEMA)
iv. The licensing conditions require that the dams/dumps are managed in such a way as to; ensure its stability and minimise accidents and other risks to other adjacent land uses; avoid polluting surrounding areas including surface and ground water bodies; and prevent soil erosion and encourage re-vegetation. In addition, the conditions state that the developers of the mines should ensure that they conduct progressive rehabilitation activities throughout the license period
v. Licensing conditions state that no residential areas should be within 500 metres from the dam/dump.
vi. All information relating to the operation and management of the tailings dam/dump including results of monitoring activities, quantities and characteristics of waste disposed of and the general operation of the site should be documented, maintained and submitted in two bi-annual six monthly reports.

25Management of Environmental Degradation Caused by Mining Activities in Zambia.
vii. Hazardous waste should be handled safely to avoid emergencies such as poisoning, fire, explosion, spills etc
viii. Mines should maintain periodic inspection records
Contrary to the above, the following were observed:
i. Tailings Storage Facility(TSF) (Appendix 24)
Unrestricted Access
Out of a total of nineteen (19) tailings facilities inspected, ten (10) facilities namely Musi, Lubengele, Muntimpa, Chibuluma South, Chibuluma TD 1,Chibuluma TD 2, NFCA TD 6,Luano,Musakashi and Chambishi Metals tailings storage facilities had unrestricted access. In some instances, illegal miners were seen on site while in other instances, community members were seen bathing, playing and fishing in the dump/dam sites. (See pictures below)
Woman seen washing clothes in the Lubengele Tailings Dam- KCM Konkola
Teenagers playing on the Lubengele Tailings Dam-KCM Konkola
Sparsely vegetated embarkments of Mutimpa Tailings Facility- KCM Nchanga exposing loose particles that can easily be blown by wind.
No Hazardous Warning and Safety Signs
Out of nineteen (19)facilities, thirteen (13) facilities namely Bwana Mkubwa TD 5A, TD 5B and TD 4;Musi; Lubengele; Kansanshi sulphide and oxide, Muntimpa; Chibuluma South; Chibuluma TD 1;Chibuluma TD 2; NFCA TD6,Luano and Musakashi TSF had no warning and safety signs displayed.
Progressive Re-vegetation
Out of six (6) TSFs visited, three (3)facilities namely NFCA TD6,Luano and Bwana Mkubwa TD 5A and 5B drainages were overgrown with grass.
It was also observed that while all the mines had started carrying out progressive re-vegetation of the TSF, fourteen (14) facilities had sparsely vegetated and bare sections of the embankments and top beaches. As a result of the sparsely vegetated and bare sections of the embankments and top beaches, there was evidence of erosion gullies and wind-blown dust from the bare tailings surfaces.

Management of Environmental Degradation Caused by Mining Activities in Zambia.26
Pollution of Surface Water Bodies
Four (4) TSFs namely; KCM – Lubengele, Muntimpa TD, Chibuluma South and NFCA TD 6 showed pollution of surface water bodies in terms of Total Suspended Solids and in some instances Total Iron, Total Cobalt, Total Copper and Total Manganese. Lumwana Plc released water to the environment without ZEMA license between April 2009 and April 2010.
Pollution of Underground Water Bodies
Four (4) TSFs namely; Bwana Mkubwa TD 5A, 5B and 4,KCM – Lubengele and Muntimpa TD showed evidence of pollution of underground water bodies with respect to Total Suspended Solids and in some instances Total Iron, Total Cobalt, Total Copper and Total Manganese.
Proximity of Residential Areas To The Dams/Dumps
Two (2) TSFs namely Chibuluma South Tailings dump and NFCA Luano TD were less than 500 metres from the nearest settlements; and the communities were growing vegetables on the toe of the Luano TD.
Submission of Bi annual and Statutory Dump Reports
Luanshya Copper Mine did not submit bi annual reports in the period 2009 - 2011.There were also no statutory dump reports for Copper Tailing dump site under Barrick Lumwana Plc contrary to the regulations.
ii. Slag Dumps (Appendix 25)
Restricted Access
MCM slag dump No.1, L.C.M – old and new slag dumps, KCM unlicensed slag dump and dump No 67, Nkana slag dump-Chambishi Metals Mine had unrestricted access.
Sparsely vegetated embarkments of Chibuluma South Tailings Storage Facility exposing loose particles that can easily be blown by wind
oreroded by rain water into the environment.

27Management of Environmental Degradation Caused by Mining Activities in Zambia.
(See picture/s below)
Illegal miners on old slag dump at LCMDug-out holes created by illegal miners on Nkana slag dump owned by Chambishi Metals mine
Lack of Warning And Safety SignsMCM slag dump Nos. 1 and 2, LCM – old and new slag dumps, KCMunlicensed slag dump and slag dump No.67, Nkana slag dump-Chambishi Metals Mine had no warning and safety signs displayed.
Pollution of Surface and Underground Water Bodies
Seepage of water at the toe of the new slag dump No.25 for KCM mine and borehole results for MCM slag dump Nos. 1 and 2 were not tested for potential pollutants and that runoff water had the potential to carry with it slag particles from the dump into the Chingola stream and subsequently the Kafue River.
Proximity of Residential Areas to the Dumps
Roan Township was within 200 metres from the L.C.M old and new slag dumps.
Submission of Bi annual and Statutory Dump Reports
Luanshya Copper Mine Plc. did not submit bi annual reports in the period under review while Chambishi Metals, Chambishi Copper Smelter and KCM unlicensed dump had no statutory dump reports from an independent competent person contrary to the environmental regulations.
iii. Overburden/ Waste Rocks Dumps (Appendix 26 and 27)
Restricted Access
Out of a total of eighteen (18) dumps inspected, thirteen (13) facilities namely;South and Southwest waste rock dumps No. 18 and 14respectively - L.C.M, Waste rock dump No. 5, 17, 18 and 20 and OB 1 and 2 - NFCA, OB 1, 2, 22, 23- KCM Nchanga, Chibuluma Mine OB had unrestricted access. Illegal miners were also seen on site.

Management of Environmental Degradation Caused by Mining Activities in Zambia.28
Lack of Warning and Safety Signs
Out of nineteen (19), eleven (11) facilities namely South and southwest waste rock dumps No. 18 and 14 respectively – L.C.M, Waste rock dump No 5, 17, 18 and 20 and OB 1 and 2 – NFCA, OB 1, 2, 22, 23 – KCM Nchanga, Chibuluma mine OB had no warning and safety signs displayed.
Disposal of Waste other than Waste Rock or Overburden Material
The dump site in Mopani Nkana was used asan illegal dump site for industrial waste without authorization from ZEMA.
Progressive Re-vegetation
While most mines had started carrying out progressive re-vegetation of waste rock and overburden dumps, fourteen (14) facilities had sparsely vegetated and bare sections of slopes. As a result of the sparsely vegetated and bare sections of the slopes, there was evidence of erosion gullies and wind-blown dust from the bare slopes.
Illegal miners seen ferrying waste rock – LCM
Erosion gullies – OB dump- KCM Nchanga Un - vegetated dump – Kansanshi Mine
Pollution of Surface Water Bodies
There were thirteen (13) facilities namely OB 1,2, 22,23 under KCM, Izuma A and B under Maamba Collieries and waste rock dump No.18 under NFCA which indicated pollution of surface water bodies in terms of Total Suspended Solids.

29Management of Environmental Degradation Caused by Mining Activities in Zambia.
Proximity of Residential Areas to the Dumps
Dumps namely MCM waste rock dumps Nos. 13 and 17, OB 23 – KCM, South waste rock dump No. 18 and South west rock dumps No 14 – LCM and Izuma B dump – Maamba Collieries which were located less than 500 metres from the nearest settlements.
Submission of Bi annual and Statutory Dump Reports
Luanshya Copper Mine Plc did not submit bi annual reports in the period under review. It was also observed that Barrick Lumwana Mining Company did not submit Statutory Dump reports for its uranium stock pile, Mulundwe waste rock and overburden dumps while KCM did not submit Statutory Dump reports for waste rock dumps A and B contrary to the environmental regulations.
e) Used Oil Storage Facilities (Appendix 28)
All hazardous waste including used oil should be stored in an area with restricted access to unauthorized personnel, a bunded and impermeable floor and adequate ventilation to avoid build-up of hazardous fumes.
A review of compliance monitoring reports and the physical inspections carried out revealed that except for Maamba Collieries Limited light vehicle workshop, all the sixteen (16) mining sites visited had adequate bunded and impermeable floors and the storage facilities had adequate ventilation to avoid build-up of fumes.
It was however observed that Konkola Copper Mine – Nchanga SBU, Chibuluma South Copper Mine, Ndola Lime Company Ltd, Maamba Collieries Plc and Chambishi Copper Smelter oil storage facilities had not restricted access to the facilities.
Oil storage facility well ventilated, restricted with adequate Safety and warning signs –
MCM Mufulira
Unrestricted access-Maamba Collieries Plc
Chibuluma Mine - no restricted access.
Unrestricted access – Ndola Lime

Management of Environmental Degradation Caused by Mining Activities in Zambia.30
A review of compliance monitoring reports and a physical inspection revealed that Chambishi Copper Smelter, Maamba Collieries Plc. and Konkola Nchanga had no warning signs.
It was also observed that storage facilities for Chambishi Copper Smelter, Ndola Lime Co. Ltd, Chambishi Metals Plc., Luanshya Copper Mine, Maamba Collieries Ltd, Kansanshi, Chibuluma, Mopani Nkana Mine, Mopani Copper Mine - Mufulira and KCM - Nkana had oil spillages in or around their oil storage facilities. Chibuluma Mine storage facility had a wash bay nearby and the silt from the wash bay was mixing with the oil spills around the storage facility and ended up in unlined drainages and the environment outside the mining area. See pictures below.
Oil- contaminated water from the wash bay released to the environment-Chibuluma Mine Plc
Spilled oil comingling with water from the Mine wash bay and eventually to the environment
-Chibuluma Mining Plc
Oil Contaminated silts in the drainage from wash bay -Chibuluma Mining Plc
KCM Nchanga - inadequate hazardous signage

31Management of Environmental Degradation Caused by Mining Activities in Zambia.
All the mining facilities visited with the exception of Luanshya Copper Mine Plc, had fire fighting equipment. It was also observed that KCM- Nchanga, Lumwana Mining Co, Chambishi Copper Smelter and Chibuluma Mine had no first aid kits on site contrary to the provisions of regulations. It was further observed that Maamba Collieries Plc. had an empty first aid box. See picture below.
The Chambishi Copper Smelter, Chibuluma, Chambishi Metals, Maamba Collieries Plc. Ndola Lime Co Ltd. Kansanshi, KCM Konkola, KCM – Nkana, KCM - Nchanga and Mopani - Nkana had no periodic inspection records on site contrary to the licensing conditions.
Empty first aid kit-Maamba Collieries Plc

Management of Environmental Degradation Caused by Mining Activities in Zambia.32
8. CONCLUSION
Mining is an important economic activity in Zambia. However, despite the numerous benefits derived from mining, with it also come serious environmental consequences such as air, land and water pollution both from surface water bodies and underground aquifers. The other environmental consequences arise from windblown dust and landslides due to instability of tailings, slag and overburden dumps. If not adequately managed, environmental damage has dire effects on not only the economy but the citizenry as well. Our audit findings presented above give us reasons to draw the following conclusions:
The goal and overall objective of Government on environment and natural resources as set out in the National Policy on Environment of supporting Governments developmental priority of improving the quality of life of the people of Zambia through protection and management of the environment and natural resources in its entirety, balancing the needs for social and economic development and environmental integrity to the maximum extent possible, while keeping adverse activities to the minimum is not being achieved.
8.1. Mining Companies are Polluting The Environment In Terms Of Air, Surface And Ground Water, And Land.
a) Air pollution
Mining companies are not following the laid down laws and regulation set by Government with the aim of minimizing air pollution to the environment. For instance mining companies have not systematically produced test results on air emitted to the environment and submitted the statutory reports inform of bi annual reports to the regulatory authorities. In addition, air released to the environment was up to 155% higher than ZEMA minimum standards in terms of Sulphur dioxide emissions. Dust, copper, arsenic and lead emissions to the environment were higher than the standards prescribed by ZEMA.
b) Surface and Ground Water Pollution
Surface water bodies are also being polluted. For instance, waste water released to the environment was polluted in that the pH value of water released was outside the parameters set by government of 6 to 7 to as low as 3 to 4. In addition, total suspended solids, dissolved solids, sulphates and chemical contents such as Total Copper, Total Cobalt, Total Manganese and Total Iron were higher than minimum standards set by ZEMA. Five(5) mines did not submit the test results/biannual reports for some periods contrary to environmental laws.
c) Management of Dumps/Dams
i. Failure to Subject the Dumps to Assessments by a Competent Independent Person.
Contrary to the section 17(1)(a) to (e) of the mines and minerals (environmental) regulations, 1997 that require that the developer shall obtain a report from an independent competent person(s) on each active dump stating the condition of the of the ground between a dump and all surface intersections of vertical planes drawn from the boundaries of any mine workings less than one hundred metres from the nearest edge of the dump; every matter which may affect the security or safety of the dump, ground or mine workings; any significant impact on the environment not originally predicted; and the progress made in implementing the environmental impact statement. The audit revealed that some mining companies did not subject the dumps to independent assessments.

33Management of Environmental Degradation Caused by Mining Activities in Zambia.
As a result there is no guarantee that the dumps in question are safe
ii. Restricted Access
Some mines have not effectively restricted access to tailings, slag, waste rock and overburden dumps. This has had the direct impact of increasing illegal mining activities which has in some cases lead to death. Furthermore, illegal mining on dumps undermines the stability of dumps thus posing the risk of landslides and in turn polluting adjacent land. The unstabilised surfaces or embankments of the dumps also pose a risk of soil erosion from runoff rain water or windblown erosion. The eroded materials end up polluting the aquatic and other surrounding environment.
iii. Lack of Warning and Safety Signs
Mining companies have not placed warning and safety signs on the dumps thus exposing the general public to potentially risky situations especially that some dumps are very close to the communities.
iv. Failure to Carry out Progressive Re-Vegetation of The Wastes Dumps.
While some mines have started to carry out progressive re-vegetation of the dumps, other mines have not re-vegetated the embankments and top beaches of the dumps. As a result, the waste is blown off by wind to surrounding environments. In some cases the unvegetated embankments have suffered water erosions which have resulted in the silts being discharged into the surrounding environments.
d) Used Oil Storage Facilities
Mining companies are not following the laid down licencing conditions for storing and maintaining the used oil storage facilities. Six (6) mining companies did not adequately restrict access to the storage facility, three (3) mines did not mount warning and safety signs, ten (10) mines had oil spillages in or around their storage facilities resulting dangerous slippery surfaces. In addition, one (1) mine had no fire fighting equipment in the oil storage facility while four (4) mines had no first aid kits contrary to the licencing conditions. It was also noted that while it was a requirement by ZEMA that oil storage facilities are inspected periodically to avoid polluting the environment and hazards and inspection results recorded in a book to be kept at the storage facility, ten (10) mining companies had no inspection records on the used oil storage sites contrary to the regulations.
The risks associated with human and other species exposure to hash organic and chemical content are as follows:
i. pH (Potential Hydrogen) - Low pH in water bodies means that the water is highly acidic and this presents several risks, some of which are death of aquatic species such as fish, tadpoles and crayfish. Plants and animals are also harmed when exposed to acidic environments.
ii. TDS (Total Dissolved Solids) - A high concentration of TDS is an indicator that harmful contaminants, such as iron, manganese, sulphate, bromide and arsenic, are present in the water. Some of the diseases that may result as a result of high exposure to the above minerals include cancer, lung disease and body poisoning.
iii. TSS (Total Suspended Solids) – High concentrations of suspended solids can lower water quality by absorbing light. Waters then become warmer and lessen the ability of the water to hold oxygen necessary for aquatic life. Because aquatic plants also receive less light, photosynthesis decreases and less oxygen is produced. The combination of warmer water, less light and less oxygen makes it impossible for some forms of life to

Management of Environmental Degradation Caused by Mining Activities in Zambia.34
exist. Suspended solids affect life in other ways. They can clog fish gills, reduce growth rates, decrease resistance to disease, and prevent egg and larval development. Particles that settle out can smother fish eggs and those of aquatic insects, as well as suffocate newly-hatched larvae. The material that settles also fills the spaces between rocks and makes these microhabitats unsuitable for various aquatic insects, such as mayfly nymphs, stonefly nymphs and caddis fly larva.
iv. SO4(Sulphates) - Health concerns regarding sulphate in drinking water have been raised because of reports of diarrhoea associated with the ingestion of water containing high levels of sulphates. Particularly vulnerable to the ingestion of high levels of sulphates are infants and children.
v. TCu (Total Copper) – Too much copper can be toxic. One can get too much copper from dietary supplements, from drinking contaminated water, and from exposure to fungicides that contain copper sulphate. Excess copper in the liver can overflow and build up in the kidneys, brain, and eyes. This excess copper can kill liver cells and cause neurological damage. Excess copper can also interfere with how the human body absorbs zinc and iron.
vi. TCO(Total Cobalt) – Excess cobalt consumption through contaminated drinking water for humans can have dire effects. When too much cobalt is taken into a human body, harmful health effects can occur. Serious effects on the lungs, including asthma, pneumonia, and wheezing and skin rashes have been reported in people exposed to higher levels of cobalt. Some cancers are also reportedly caused by exposure to cobalt.
vii. TMn- The high toxicity of manganese is well documented to have caused diseases such as Parkinson’s and Wilson’s diseases.
viii. TFe(Iron) – Despite being an essential element in human nutrition, excessive consumption of iron plays a role in degenerative brain diseases, such as Parkinson’s and Alzheimer’s disease. Iron compounds such as FeCl2 and FeSO4can form in water and may have negative impact upon health than iron does by itself. Healthy people are rarely affected by iron overdose although the risks are increased with excessive supplementation and drinking water exceptionally high in iron.
From the problems identified above, it is clear that the minimum standards that Government has put in place to safeguard the environment are not being strictly adhered to by the mining companies. This means therefore, that the Government’s goal of protecting and managing the environment and natural resources in its entirety, balancing the needs for social and economic development and environmental integrity to the maximum extent possible, while keeping adverse activities to the minimum1 is not being achieved. Failure to meet the goals set means that environmental protection and management is ineffective.
8.2. Measures that Government has put in place to ensure that the environmental degradations caused by mining activities are adequately managed are not working effectively and efficiently.
a) Failure to review the implementation of the National Policy on Environment
Although there was no separate policy to deal with environmental issues associated with mining companies, there is a Comprehensive National Policy on the Environment issued in November 2007 that has addressed and domesticated a number of regional and international protocols, treaties or conventions that Zambia has signed and ratified that deal with air, water and land pollution.
1 Environmental Protection Policy 2007

35Management of Environmental Degradation Caused by Mining Activities in Zambia.
The policy has also included protocols on how to manage toxic substances. Despite the National Policy on Environment being in place, the audit has revealed that since its launch in 2007 about six (6) years ago, the policy have not been reviewed to ascertain its suitability in implementation of environmental protection and control.
A review of responses to the questionnaire sent to ZEMA revealed that some of the provisions and obligations under some of the international protocols that have been domesticated into the policy demand costly technology and other technical resources which are still a challenge.
The risk of not reviewing the policy to ascertain its suitability in the implementation of the environmental directives renders the policy to be a mere statement of intent.
b) Failure to Regulate and Enforce the Law.
The goal and overall objective of Government on environment and natural resources of supporting Government’s developmental priority of improving the quality of life of the people of Zambia through regulation and enforcement2 of the laws has not been achieved. For instance, although the principal Act, the Environmental Protection and Pollution Control Act (EPPCA) of 1990 had been replaced with the Environmental Management Act (EMA) of 2011, the subsidiary legislation such as the Environmental Impact Assessment, Water and Air pollution regulations have not been reviewed despite funds being available. Furthermore, although the ministry responsible for mines reviewed, repealed and replaced the principal legislation the Mines and Mineral Act in 2008, the subsidiary legislation, the Mines and Mineral (Environmental) Regulations of 1997 and Environmental Protection Fund Regulation of 1998 were not reviewed, repealed or replaced. Failure to revise laws relating to the environment has led to among other things; continued pollution of water bodies, improper handling of waste and out-dated environmental practices.
c) Poor management of the Environmental Protection Fund
The Environment Protection Fund put in place by Government to secure the environment against future environmental liabilities that may arise in case the mines, fail to meet the environmental liabilities at closure of business is not working effectively. The management of the Fund was characterised by failure by mining companies to fully contribute to the Fund, mining companies providing bank bonds or guarantees not validated by the Bank of Zambia as required by laid down procedures and failure by management to take action against defaulting companies. The audit also revealed that the current Fund manager has no financial skills to manage the Fund effectively. Consequently, the investment portfolio has been restricted to cash and cash equivalents such fixed bank deposits despite the Fund’s investment policy clearly stating that the investment portfolio should be diversified to include other hedging strategies such as government securities.
Based on the findings above, it is clear that MSD has not effectively implemented the requirements of the Environmental Protection Fund.
d) Poor Monitoring and Evaluation of Environment Degradation Caused By Mining Companies.
The current monitoring can be considered to be ineffective and does not meet the information requirements of the country’s environmental monitoring objectives. ZEMA and MSD do not carry out independent sample testing of the air emissions and waste water effluent that the mines are releasing to the environment as they had not set up and registered the laboratories to be used to test the samples collected. Instead, ZEMA and MSD have relied upon the test
2 Environmental Protection Policy 2007

Management of Environmental Degradation Caused by Mining Activities in Zambia.36
results that the mining companies have submitted to ZEMA through bi – annual reports despite Government having procuring the monitoring equipment. The audit also showed that some laboratory equipment had not been calibrated while some of the equipment was non-operational.
In some instances, bi-annual reports are not submitted by the mining companies as stipulated in the laws or licencing conditions. Both ZEMA and MSD lacked adequate staff to carry out effective monitoring and evaluation.
The implication of relying on biannual reports are that detection of the air and water pollution was left too late i.e. after six months after it has occurred and that the test results provided by mining companies may have been understated rendering them unreliable.
It is clear from the information above that the objectives as set by government in National Policy on the Environment of building individual and institutional capacity to sustain the environment are not being realised.

37Management of Environmental Degradation Caused by Mining Activities in Zambia.
9. RECOMMENDATIONS
The audit findings and conclusions have revealed that there are many weaknesses in the management of mining activities in Zambia. Based on the findings mentioned above the Office of the Auditor General recommends as follows:
9.1. Air, Ground and Surface Water Pollution
ZEMA should ensure that air released to the environment by mining companies does not exceed the minimum set parameters. Companies that are polluting the air should be held accountable.
Mines should submit bi annual reports as stipulated in licensing conditions. ZEMA should carry out their own sampling, testing and analysis of emissions and effluences to confirm information provided by mining companies.
9.2. Management of Dumps/Dams
ZEMA and MSD should ensure that dumps and dams are managed properly by ensuring that:
a) Restricted Access
Tailings, slag and overburden dumps should be secured and entry restricted to authorised personnel only. This will safeguard not only the public from exposure to contaminated materials but also the integrity and stability of the dumps to avoid pollution of the environment from both air and water erosion of the loose particles. In addition, illegal mining will be curbed.
ZEMA should also sensitise the public on the dangers of accessing such restricted areas.
b) Lack of warning and safety signs
All tailings, slag and overburden facilities should have hazardous, warning and safety signs displayed at appropriate places.
c) Progressive Re-vegetation
Progressive rehabilitation, including vegetation management should be carried out regularly in line with licensing conditions and other guidelines.
d) Proximity of residential areas to the dams/dumps
In line with licensing conditions, there should be no residential areas within 500metres of tailings, slag and overburden dumps. In addition, the practice of communities cultivating vegetables on the toe of dumps should be halted forthwith. Where need arises, Government in collaboration with the mining companies should consider relocating affected communities.
9.3. Used Oil Storage Facilities
All used oil storage facilities should have bunded and impermeable floors, adequate ventilation, warning and safety signs and restricted access at all times. In addition, fire fighting equipment and fully stocked first aid kits should always be available at these facilities. These facilities should be inspected periodically and ensure that inspection records are readily available for inspection by regulatory authorities.
9.4. Policy formulation
ZEMA and the ministry responsible for environmental protection should review the National Policy to assess its suitability for implementation in protecting the environment.

Management of Environmental Degradation Caused by Mining Activities in Zambia.38
9.5. Development and enforcement of legislationThe statutory instruments on Environmental Impact Assessment (EIA), Water and Air Pollution Control regulations should be reviewed to address changes in mining practices. Furthermore, legislation on all producer responsibility for all companies generating waste should be developed and implemented.
9.6. Environment Protection Fund
MSD should ensure that all mines that are required to contribute to the Fund are compelled to do so and necessary action should be taken against defaulters.
All bank accounts held by EPF should be brought to the fore and reconciled by competent personnel. In addition, the Ministry of Mines should ensure that a competent person is deployed to manage the funds on behalf of Mine Safety Department and the EPF committee as a matter of urgency.
The EPF funds should be invested in such a way as to ensure that the time value of money is maintained and the risk of the investments is diversified as per the investment policy.

39Management of Environmental Degradation Caused by Mining Activities in Zambia.
Appendix 1
Name of Mines and Facilities Visited
Name of mineList of facilities emitting air to the environment-Stack emissions
List of facilities discharging effluent to the environment –ground water
List of facilities discharging effluent to the environment – surface water
1. Bwana Mkubwa Nil
1. Little Mukulungwe -Upstream Site SW2 2. Little Mukulungwe -Downstream Site SW3
2. Chambeshi Copper Smelter ( CCS)
1. Chimney 12. Anode furnace3. Slag cleaning furnace
1.Sulphuric Acid storage plant 3. smelter drain 4. Acid plant drain
3. Chambeshi Metals Nil 5. New dam overflow -SW13
4. Chibuluma South Mine Nil 6. Effluent Water 7. Musakashi dam effluent discharge
5. Non Ferous Copper Mine Africa (NFCA)
Nil
8. Combined drain leading to TD6 9. TD6 overflow effluent quality 10. Water treatment ponds overflow 11. Water treatment ponds overflow drain effluent quality
6. Konkola Copper Mine (KCM) - Konkola
Nil
12. Lubengele dam into Lubengele stream 13. Engineering workshop overflow into Lubengele stream14. Plant overflow into Kakosa Stream
7. Konkola Copper Mine (KCM)- Nchanga
4 Cobalt recovery furnace
15. PCD Spillway 16. Muntimpa spillway 17. Combined concentrator drain into Nchanga Stream18. Nchanga open pit spillage into Nchanga stream
8. Konkola Copper Mine (KCM)- Nkana
Nil 2.Acid loading bay 19. South Uchi
9. Luanshya Copper Mine(LCM) Nil 20. Musi dam into Luanshya stream
10. Maamba Collieries Nil 21. Mine effluent22. Downstream -Izuma stream
11. Mopani Copper Mine (MCM) - Mufulira
5 Converter slag blow6. Converter copper blow7. Matte settling furnace
3.Concentrate shed borehole no. 94.Acid loading bay
5. Borehole no. 18 between Tank house
23. TD 11 spillway24. Mufurira west discharge
12. Ndola lime8. Vertical Kiln
9. Horizontal Kiln10. Hydrator
25. Chilanga26. Kafubu
13. Mopani Copper Mine (MCM) - Nkana 11. Cobalt plant
6. Old CVW7. Cobalt plant deep aquifer
8.Cobalt plant shallow aquifer27. North Uchi
14. Kansanshi Mining Nil 28. Concentrator
15. Lumwana Mining Company Nil
16. KONNOC Still under development Still under development Still under development

Management of Environmental Degradation Caused by Mining Activities in Zambia.40
Appendix 2Environmental Protection Fund Performance Estimates As At 30 April 2012 (US$)
Mbuva - Chibolele Emerald Project 2 221,493 208,203 13,290 13,290
-
Grizzly Mine 2 286,174 269,004 17,170 17,170 -
Kagem Mine 2 224,889 206,871 13,493 21,248 206,871 Kansanshi Mine 3 8,665,284 7,625,450 1,039,834 1,039,834 7,625,450 Konkola Mine 1 21,542,037 20,895,776 646,261 705,306 -
Nampundwe Mine 1 2,353,151 2,282,556 70,595 87,586 -
Nchanga Mine 1 73,953,947 71,735,329 2,218,618 1,983,587 -
KCM Nkana mine 1 19,947,100 19,348,687 598,413 628,389 -
Ndola & Lusaka plants 3 3,635,770 3,344,908 290,862 290,862 -
Lumwana Mining 1 10,468,483 10,259,113 209,370 314,055 10,259,113 Bwana Mkubwa Mine 2 1,404,640 1,292,269 84,278 112,371 1,348,454 Kafironda Factory 3 227,939 200,586 27,353 27,353 -
Chambishi Copper Smelter 2 1,636,191 1,538,020 98,171 98,171 1,505,296 Chambishi Metals 2 4,257,999 4,002,519 255,480 255,480 -
CLM Operations 2 7,974,293 7,495,835 478,458 348,009 14,499,401 CLM Decom & Classified 3 1,995,455 1,756,000 239,455 146,381 -
Muliashi Copper Project 2 5,963,988 5,606,149 357,839 155,875 -
Maamba Collieries 3 15,858,167 13,955,187 1,902,980 200,000 -
Chibuluma South Mine 2 967,244 909,209 58,035 58,035 -
Chibuluma East West Mines 3 1,369,147 1,204,849 164,298 164,298 -
Nkana Mine 2 14,667,797 13,787,729 880,068 1,300,534 -
Mufulira Mine 2 14,047,859 13,007,880 842,872 1,442,675 -
Ndola Lime 3 2,767,005 2,434,964 332,041 331,693 -
Chambishi Mine 2 5,024,500 4,723,030 301,470 301,470 -
Chambishi Factory & Sanfex 3 196,917 173,287 23,630 23,630 -
Kabwe Operations 2 453,461 426,253 27,208 27,208 -
Sino Metals Leach 3 460,000 404,800 55,200 55,200 -
Zambezi Portland Cement 3 2,118,361 2,033,627 84,734 84,734 -
Munali nickel mining project 1 2,397,689 2,325,758 71,931 71,930 -
Collum Coal Mining Industries. 2 234,538 220,466 14,072 4,692 4,522,050 SUB-TOTAL 225,321,518 213,674,314 11,417,479 10,311,066 39,966,635
Lodged CashUS$
Bank Guarantee
LodgedUS$
Mine facility (Large Scale) Category
Total Closure
CostUS$
Bank Guarantee
US$
Cash Contribution
US$
Source: Mine Safety Department

41Management of Environmental Degradation Caused by Mining Activities in Zambia.
Appendix 2 (Cont)Environmental Protection Fund Performance Estimates As At 30April 2012 (US$)
Lodged CashUS$
Bank Guarantee
LodgedUS$
Mine facility (Small Scale) Category
Total Closure
CostUS$
Bank Guarantee
US$
Cash Contribution
US$
Calustone emerald mine 2 20,089 18,884 1,205 - - Zebesha mine 3 160,872 141,567 19,305 - - Demar emerald mine 3 95,592 84,121 11,471 7,648 - Mununga Quarry 3 98,335 86,535 11,800 1,967 - Hi-Qwalime mine 3 35,604 31,332 4,272 4,272 - Scirocco Enterprises 3 50,336 35,138 6,040 15,198 - Ebenezer mine 3 100,390 88,343 12,047 - - United Quarries 3 191,356 168,393 22,963 - - Santas emerald mine 3 35,298 31,062 4,236 - - Luwingu Quarry 3 82,100 72,248 9,852 3,284 - Aggregates 2 74,199 69,747 4,452 4,308 - Shimabala Quarry 3 18,130 15,954 2,176 725 - Sinda quarry 3 89,400 78,672 10,728 3,576 - Arius emerald mines 1 40,928 39,699 1,228 1,229 - E & M Storti mine 3 107,162 94,303 12,859 9,244 - Mapatizya Mine Site 3 40,417 37,184 3,233 1,617 - Nkana General Dealers 3 20,089 18,482 1,607 834 - Lions Group Quarries 3 32,860 30,231 2,629 - - Dabwisa Emeralds MinesGemfields SUB-TOTAL 1,328,455 1,174,369 144,927 55,021 69,612 GRAND TOTAL 226,649,973 214,848,683 11,562,406 10,366,087 40,036,247
3 35,298 32,474 2,824 1,119 69,612
Source: Mine Safety Department
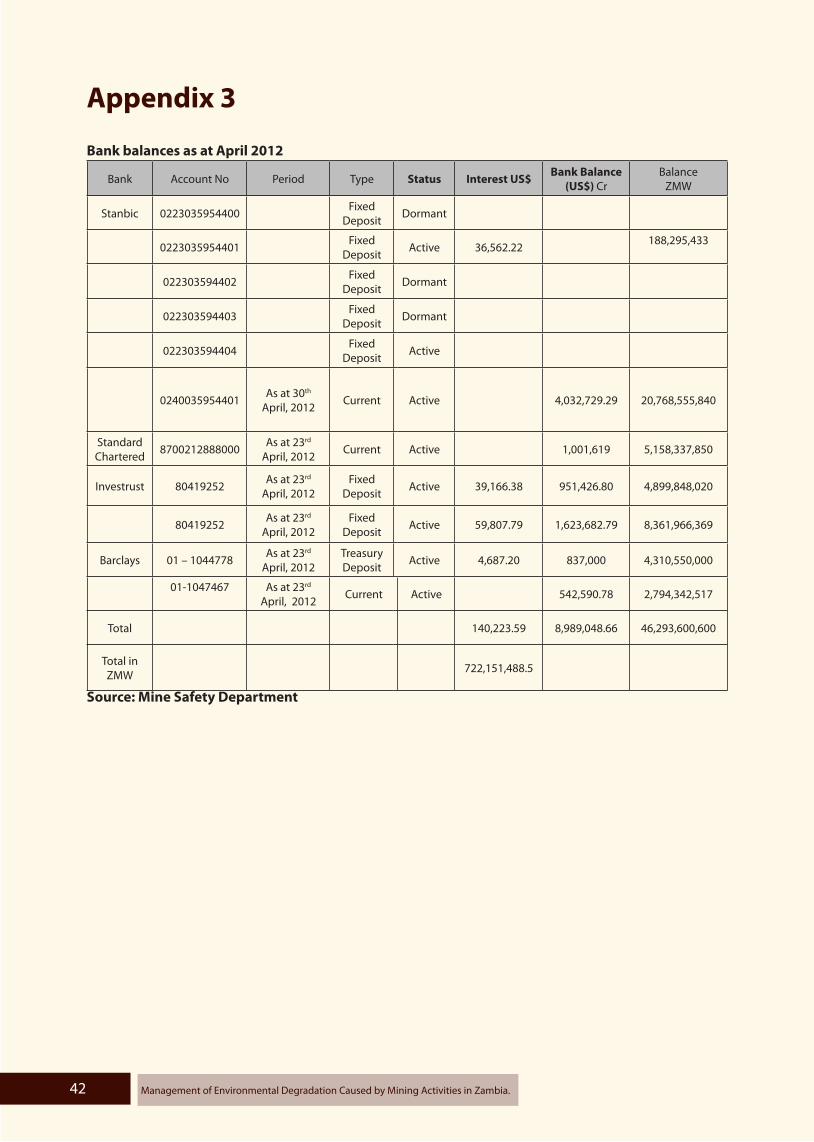
Management of Environmental Degradation Caused by Mining Activities in Zambia.42
Appendix 3
Bank balances as at April 2012
Bank Account No Period Type Status Interest US$ Bank Balance (US$) Cr
Balance ZMW
Stanbic 0223035954400 Fixed Deposit Dormant
0223035954401 Fixed Deposit Active 36,562.22 188,295,433
022303594402 Fixed Deposit Dormant
022303594403 Fixed Deposit Dormant
022303594404 Fixed Deposit Active
0240035954401 As at 30th April, 2012 Current Active 4,032,729.29 20,768,555,840
Standard Chartered 8700212888000 As at 23rd
April, 2012 Current Active 1,001,619 5,158,337,850
Investrust 80419252 As at 23rd April, 2012
Fixed Deposit Active 39,166.38 951,426.80 4,899,848,020
80419252 As at 23rd
April, 2012Fixed
Deposit Active 59,807.79 1,623,682.79 8,361,966,369
Barclays 01 – 1044778 As at 23rd April, 2012
Treasury Deposit Active 4,687.20 837,000 4,310,550,000
01-1047467 As at 23rd April, 2012 Current Active 542,590.78 2,794,342,517
Total 140,223.59 8,989,048.66 46,293,600,600
Total in ZMW 722,151,488.5
Source: Mine Safety Department

43Management of Environmental Degradation Caused by Mining Activities in Zambia.
Appendix 4
Assets Procured under CEP in 2009
NAME OF EQUIPMENT QTY AMOUNTZMW
1 Opsis SM200 particulate Analyser for PM10 and PM 2.5 1 277,522 2 Teledyne - API Model 100E SO2 Analyser 1 76,065 3 Teledyne - API Model 200E NO2 Analyser 1 82,058 4 Teledyne - API Model 400E O3 Analyser 1 60,852 5 PCF Model 528 BTX Analyse 1 277,522 6 Zero Air Generator System for model 528 1 -7 Opsis D256 Data logger 1 38,724 8 Meteorological measurement system 1 30,426 9 Contractor's Caravan to houe equipment 1 132,307
10 Long Term water Quality and level monitor 1 49,723 11 Botom Sample 1 40,556 12 Dust/Particulate sampling Kit 1 8,720 13 Hydro Carbon Analyser 1 54,532 14 Geiger Courder Radiation Meter 1 6,638 15 Refrigerant Identifier 4 68,228 16 land Measuring wheel 3 4,949 17 Radiation Meter 2 3,603 18 Rotameter 1 1,288 19 PH Meter Case & PH Meter 1 1,542 20 Do Data meter 1 3,225 21 Conductivity meter 1 2,261 22 sidekick Sample Pump 1 9,465 23 Turbidity meter 1 2,337 24 Ambient Sampling Machine 1 3,787 25 Ground Water Sampling Pump 1 45,275 26 Generator Yanmar 1 15,983 27 Trace Metals Analyser 2 137,072 28 Trace Metals Analyser 1 69,201 29 Deioniser 3 57,309
compact balance 2 17,325 30 Magnetic stirer 2 15,924 31 Portable monitoring system 2 28,980 32 Ambient Sampling Machine 2 313,344 33 Portable monitoring system 1 14,746 34 Ambient Sampler 2 22,721 35 Dust Dectector 1 31,360 36 740 monitor 2 14,249 37 water quality level meter 1 53,975 38 multi parameter display system 1 6,783 39 current flow meter 1 23,763 40 Gas monitoring Equipment 1 27,262 41 Multi parameter water Quality monitoring 1 19,881 42 Multiprobe System Data logger 1 11,076

Management of Environmental Degradation Caused by Mining Activities in Zambia.44
Appendix 4(cont)Assets Procured under CEP in 2009
NAME OF EQUIPMENT QTY AMOUNTZMW
source: ZEMA
43 Out board Engine Evinrude 1 68,395 44 PH Meter Meter 1 1,542 45 Conductivity meter 1 2,261 46 Turbidity meter 1 2,337 47 Sound level meter 1 3,005 48 Do meter 1 5,687 49 GPS (ExTrex Summit) 1 2,071 50 land Measuring wheel 1 1,650 51 HP Laptop Computer 1 7,184 52 Cyanide Meter 1 1,619 53 Sulphate meter 1 1,635 54 Dota Data Meter 1 3,225 55 PH Meter (Portable PH Meter) 1 1,542 56 Conductivity meter 1 27,262 57 Turbidity meter 1 2,337 58 Generator Yanmar 1 15,983 59 Ground Water Sampling Pump 1 45,275 60 Trace Metals Analyser 1 68,536 61 Portable monitoring Equipment(Pertol Sensor) 1 14,746 62 Tur bidity 740 Monitor 1 7,124 63 Current flow meter 1 23,764 64 Gas monitoring Equipment 1 27,262 65 MultiProbe System Data logger(portable) 1 11,076 66 Opsis SM200 particulate Analyser for PM10 and PM 2.5 1 277,577 67 Teledyne- API Model 100E SO2 Analyser 1 76,065 68 Teledyne- API Model200E NO2 Analyser 1 82,058 69 Teledyne- API Model 400E SO2 Analyser 1 60,852 70 PCF Model 530 BTX Analyser 1 277,522 71 Zero Air Generator System for model 530 BTX Analyser 1 -72 Opsis DL256 Datalogger 1 38,724 73 Meteorological measurement system 1 30,426 74 Contractor's Caravan to houe equipment 1 132,307
Total 3,483,601

45Management of Environmental Degradation Caused by Mining Activities in Zambia.
Appendix 5
Air Pollution - Sulphur dioxide (SO2)
Name of mine and facility
Chambishi Copper Smelter- Chimney 1
Chambishi Copper Smelter-Anode Furnance
Chambishi Copper Smelter-Slag cleaning furnance
Konkola Copper Mine - Nchanga SBU-Cobalt recovery furnance
Mopani Copper Mine - Mufulira SBU-Converter
slag blow
Mopani Copper Mine - Mufulira SBU-Converter
copper blow Mopani Copper Mine -
Mufulira SBU-Acid plant Mopani Copper Mine -Nkana - Cobalt plant
mg/Nm³. mg/Nm³. mg/Nm³. mg/Nm³. mg/Nm³. mg/Nm³. mg/Nm³. mg/Nm³.ZEMA statutory limits 1,000 1,000 1,000 1,000 1,000 1,000 1,000 1,000
2009 Jan *Dev Dev Dev Dev 26,676 20,007 6,773 No resultsFeb Dev Dev Dev Dev 38,109 33,345 6,574 No resultsMar Dev Dev Dev Dev 46,112 28,582 6,860 No resultsApr Dev Dev Dev Dev Care and maintenance Care and Maintenance 7,529 131,475 May Dev Dev Dev Dev 17,149 17,149 7,834 52,161 Jun Dev Dev Dev Dev 30,487 40,014 8,051 93,366 Jul Dev Dev Dev Dev 72,407 40,014 7,731 96,835 Aug Dev Dev Dev Dev 38,109 40,014 7,606 90,318 Sep Dev Dev Dev Dev 28,582 60,021 8,832 102,894 Oct Dev Dev Dev Dev 94,314 34,298 9,140 81,458 Nov Dev Dev Dev Dev 28,582 83839 8,919 90,508 Dec Dev Dev Dev Dev 47,159 36203 No results 57,163
2010 Jan **No results No results No results Dev 70,501 55,258 No results 62,880 Feb No results No results No results Dev 28581.6 621879 8241 45,731 Mar No results No results No results Dev 28,582 28,582 5,691 27,153 Apr No results No results No results Dev 15,244 45,731 12,993 51,447 May No results No results No results Dev No results No results No results 51,447 Jun No results No results No results Dev 69,739 34,298 8,017 96,034 Jul No results 25.72 No results 200.07 24,770 28,582 8,017 45,731 Aug No results 314.4 No results 1524.35 Care and maintenance Care and Maintenance 12,566 51,447 Sep No results 0 No results 148.6 24,771 45,731 11,118 90,032 Oct No results 2544 No results 0 47,636 38,109 14,291 147,195 Nov No results 56.21 No results 785.99 47,636 38,109 475.4 90,508 Dec No results 2276.5 No results 161.96 27,152 36,203 3,263 131,475
2011 Jan 1137 72.88 41.92 89.56 35,727 47,160 9,520 135,286 Feb 1332 2550.19 733.83 172.92 35,013 35,727 10,290 66,690 Mar 1227 314.4 1313.8 1876.86 34,299 34,298 9,864 33,345 Apr 1306 35.25 16.2 148.62 No results No results 8,303 112,420 May 1314 487.32 28.58 0 22,865 47,636 5,870 85,745 Jun No results 43.59 40.01 113.37 61,927 48,589 8,592 155,769 Jul No results No results No results 295.11 24,771 30,487 5,976 93,367 Aug No results No results No results 50.02 60,021 53,352 8,316 128,617 Sep No results No results No results 257.2 41,920 95,272 8,841 ***Care and maintenanceOct 1045 No results No results 122.9 95,272 57,163 8,963 Care and maintenanceNov 1030 No results No results 148.6 66,690 47,637 9,370 Care and maintenanceDec 1070 No results No results No results No results 47,636 No results Care and maintenanceSource: Bi annual reports submitted to ZEMA by the Mining Companies*Dev- means that mine was under going development stage** No results means that mine did not submit return or test results contrary to air polution regeulations ***Care and maintenance- means that mine facility was shut down for care and maintenance**** Ndola lime did not analyse for Sulphur dioxide (SO₂) DATA ANALYSIS
Minimum value 1030.0 0.0 16.2 0.0 15243.5 17149.0 475.4 27152.5Median value 1182.0 193.6 41.0 148.6 36917.9 40014.0 8303.0 90317.9Maximum value 1332.0 2550.2 1313.8 1876.9 95272.0 621879.0 14291.0 155769.0Average value 1182.6 726.7 362.4 358.6 43470.9 62287.7 8311.4 86155.0
No returns/results 15 12 18 1 3 2 4 2No. Above ZEMA limit 8 3 1 2 30 31 30 29No Measurements 15 12 18 1 3 2 4 3No. 30x above limit 0 0 0 0 19 27 0 28

Management of Environmental Degradation Caused by Mining Activities in Zambia.46
Appendix 6
Air Pollution – Dust
Name of Mine
Chambishi Copper Smelter Chimney 1
Chambishi Copper Smelter Anode Furnance
Chambishi Copper Smelter Slag cleaning furnance
Konkola Copper Mine - Nchanga SBU Cobalt recovery furnance
Mopani Copper Mine - Mufulira Converter slag
blow
Mopani Copper Mine - Mufulira Converter
copper blow
Mopani Copper Mine -
Mufulira Matte
settling furnance
Mopani Copper Mine -Nkana Cobalt plant Ndola Lime Vertical Kiln Ndola Lime Horizontal Kiln
Ndola Lime Hydrator
ZEMA statutory limits 50 50 50 50 50 50 50 50 50 50 50 2009 Jan **Dev Dev Dev Dev 914 643 No Results no results No return No return No return
Feb Dev Dev Dev Dev 270 584 No Results no results No return No return No returnMar Dev Dev Dev Dev 793 425 No Results no results No return No return No returnApr Dev Dev Dev Dev No Results No Results No Results no results No return No return No returnMay Dev Dev Dev Dev 490 856 No Results no results No return No return No returnJun Dev Dev Dev Dev 763 1,431 No Results no results No return No return No returnJul Dev Dev Dev Dev 938 1,364 90 221 No return No return No returnAug Dev Dev Dev Dev 526 527 176 216 No return No return No returnSep Dev Dev Dev Dev 827 409 122 156 No return No return No returnOct Dev Dev Dev Dev 275 357 173 260 No return No return No returnNov Dev Dev Dev Dev 620 1,102 No Results 231 No return No return No returnDec Dev Dev Dev Dev 240 892 No Results 239 No return No return No return
2010 Jan * ***No return No return Dev 727 539 248 1,242 1,868 No return No returnFeb * No return No return Dev 2,140 1,658 No Results 490 2,076 No return No returnMar * No return No return Dev 646 698 101 550 2,817 No return No returnApr * No return No return Dev 496 409 262 162 2,096 No return 180May * No return No return Dev no results no results no results 346 2,622 No return 189Jun * No return No return Dev 736 634 101 357 2,306 No return 183Jul * 226 444 208 577 1,195 35 490 No return No return No returnAug * 192 190 1,955 Care and Maintenance Care and Maintenance 33 162 No return No return No returnSep * 376 96 734 370 466 72 448 No return No return No returnOct * 165 46 73 500 367 68 791 No return No return No returnNov * 200 357 191 503 612 248 185 No return No return No returnDec * 204 434 1,413 450 232 63 332 No return No return No return
2011 Jan * 1,982 169 276 416 395 58 536 3,238 360 L Feb * 162 445 288 598 485 197 211 3,190 180 46Mar * 67 1,253 1,362 554 503 208 291 2,799 223 48Apr * 4 13 94 - - 644 410 2,852 142 45May * 143 237 25 365 242 74 106 3,285 190 46Jun * 584 358 957 323 999 169 533 3,005 196 5550Jul * No return No return 773.27 891 741 194 275 No return No return No returnAug * No return No return 256.9 1,185 1,353 24 1,027 No return No return No returnSep * No return No return 238.3 1,020 683 345 Care and maintainace No return No return No returnOct * No return No return 302.7 1,068 1,959 118 Care and maintainace No return No return No returnNov * No return No return 1442.4 636 505 153 Care and maintainace No return No return No returnDec * No return No return No return no result 75 112 Care and maintainace No return No return No return
Source: Bi annual reports submitted to ZEMA by the Mining Companies* Chambeshi copper metals did not assess the dust parameter**Dev - mine was under development*** No return- Mine did not submit return contrary to air pollution regeulations
Minimum value 4.0 13.1 24.8 239.7 75.1 23.8 105.5 1868.0 142.0 45.0Median value 196.0 297.0 288.3 598.0 598.0 119.8 311.3 2808.0 193.0 114.0Maximum value 1982.2 1253.2 1955.0 2140.4 1959.0 644.0 1242.1 3285.0 360.0 5550.0Average value 358.8 336.8 622.9 672.9 729.4 157.1 394.8 2679.5 215.2 785.9

47Management of Environmental Degradation Caused by Mining Activities in Zambia.
Appendix 7
Air Pollution – Arsenic (As)
Name of Mine
Chambishi Copper Smelter
Chimney 1
Chambishi Copper Smelter Anode Furnance
Chambishi Copper Smelter Slag
cleaning furnance
Konkola Copper Mine - Nchanga SBU
Cobalt recovery furnance
Mopani Copper Mine -
Mufulira Converter slag blow
Mopani Copper Mine -
Mufulira Converter
copper blow
Mopani Copper Mine -
Mufulira Matte settling
furnance
Mopani Copper Mine -Nkana
Cobalt plant
Ndola Lime Vertical Kiln
Ndola Lime Horizontal
Kiln
Ndola Lime Hydrator
ZEMA statutory limits 0.5 0.5 0.5 0.5 0.5 0.5 0.5 0.5 0.5 0.5 0.5 2009 Jan Dev Dev Dev Dev 2.25 0.38 no results no results No Return No Return No Return
Feb Dev Dev Dev Dev 0.08 0.35 no results no results No Return No Return No ReturnMar Dev Dev Dev Dev 0.11 0.07 no results no results No Return No Return No ReturnApr Dev Dev Dev Dev No Return No Return no results no results No Return No Return No ReturnMay Dev Dev Dev Dev 1.61 1.42 no results no results No Return No Return No ReturnJun Dev Dev Dev Dev 8.37 0.84 no results no results No Return No Return No ReturnJul Dev Dev Dev Dev 2.08 0.54 No Results no results No Return No Return No ReturnAug Dev Dev Dev Dev 2.03 0.51 0.97 no results No Return No Return No ReturnSep Dev Dev Dev Dev 1.80 0.28 No Results no results No Return No Return No ReturnOct Dev Dev Dev Dev 0.67 0.56 0.64 no results No Return No Return No ReturnNov Dev Dev Dev Dev 0.55 0.66 No Results no results No Return No Return No ReturnDec Dev Dev Dev Dev 1.09 1.51 No Results no results No Return No Return No Return
2010 Jan No Return No Return No Return Dev 37.01 20.4 1.13 1.3 No Return No Return No ReturnFeb No Return No Return No Return Dev 38.79 7.99 No Results 0.28 No Return No Return No ReturnMar No Return No Return No Return Dev 0.63 0.14 No Results 0.15 No Return No Return No ReturnApr No Return No Return No Return Dev 1.16 0.63 2.6 0.32 No Return No Return No ReturnMay No Return No Return No Return Dev No Results No Results No Results 0.096 No Return No Return No ReturnJun No Return No Return No Return Dev 0.58 0.25 No Results 6.6 No Return No Return No ReturnJul * 0 ****L 0 0.17 0.12 0.06 0.28 No Return No Return No Return
Aug *0 L 0 Care &
maintenance Care &
maintenance 0.09 0.32
No Return No Return No ReturnSep * 0 L 0 0.84 0.55 0.21 0.26 No Return No Return No ReturnOct * 0.47 L 0.07 1.18 0.71 0.33 0.23 No Return No Return No ReturnNov * 0.75 L 0.08 6.44 4.86 0.29 0.32 No Return No Return No ReturnDec * 4.19 L 0.7 3.16 2.54 0.72 0.25 No Return No Return No Return
2011 Jan * 2.36 0.45 0.33 2.92 0.66 0.49 0.41 No Return No Return No ReturnFeb * 3.31 0.31 0.22 2.08 0.96 8.51 0.27 No Return No Return No ReturnMar * 3.76 0.75 0.67 3.77 5.79 1.71 1.59 No Return No Return No ReturnApr * 0.22 0.07 0.04 No Results No Results 1.17 1.02 No Return No Return No ReturnMay * 2.36 0.28 0.16 0.76 0.65 0.84 0.21 No Return No Return No ReturnJun * 9.59 0.42 5.89 1.06 0.3 0.45 0.42 No Return No Return No ReturnJul No Return No Return No Return 1.19 1.68 0.35 1.00 0.21 No Return No Return No ReturnAug No Return No Return No Return 0 7.29 1.59 0.25 no results No Return No Return No ReturnSep No Return No Return No Return No Result 4.36 1.92 1.48 Care and MaintainanceNo Return No Return No ReturnOct No Return No Return No Return 0.44 7.11 1.54 1.5 Care and MaintainanceNo Return No Return No ReturnNov No Return No Return No Return 0.16 5.49 5.46 0.38 Care and MaintainanceNo Return No Return No ReturnDec No Return No Return No Return No Return no result 0.13 0.3 Care and MaintainanceNo Return No Return No ReturnSource: Bi annual reports submitted to ZEMA by the Mining Companies* Chambeshi copper metals did not assess the Arsenic (As)parameter**Dev - mine was under development*** No return- Mine did not submit return contrary to air pollution regeulations****L- Means that the parameter was lower than set limit of 0.5mg/Nm³Minimum value 0.0 0.1 0.0 0.1 0.1 0.1 0.1 N/A N/A N/AMedian value 1.6 0.4 0.2 1.8 0.7 0.7 0.3 N/A N/A N/AMaximum value 9.6 0.8 5.9 38.8 20.4 8.5 6.6 N/A N/A N/AAverage value 2.3 0.4 0.6 4.7 2.0 1.1 0.8 N/A N/A N/A
No returns 12 12 1 1 1 0 0 36 36 36No. Above limit 7 1 4 28 22 12 4 N/A N/A N/ANo. Measurements 0 0 0 2 2 14 13 N/A N/A N/A
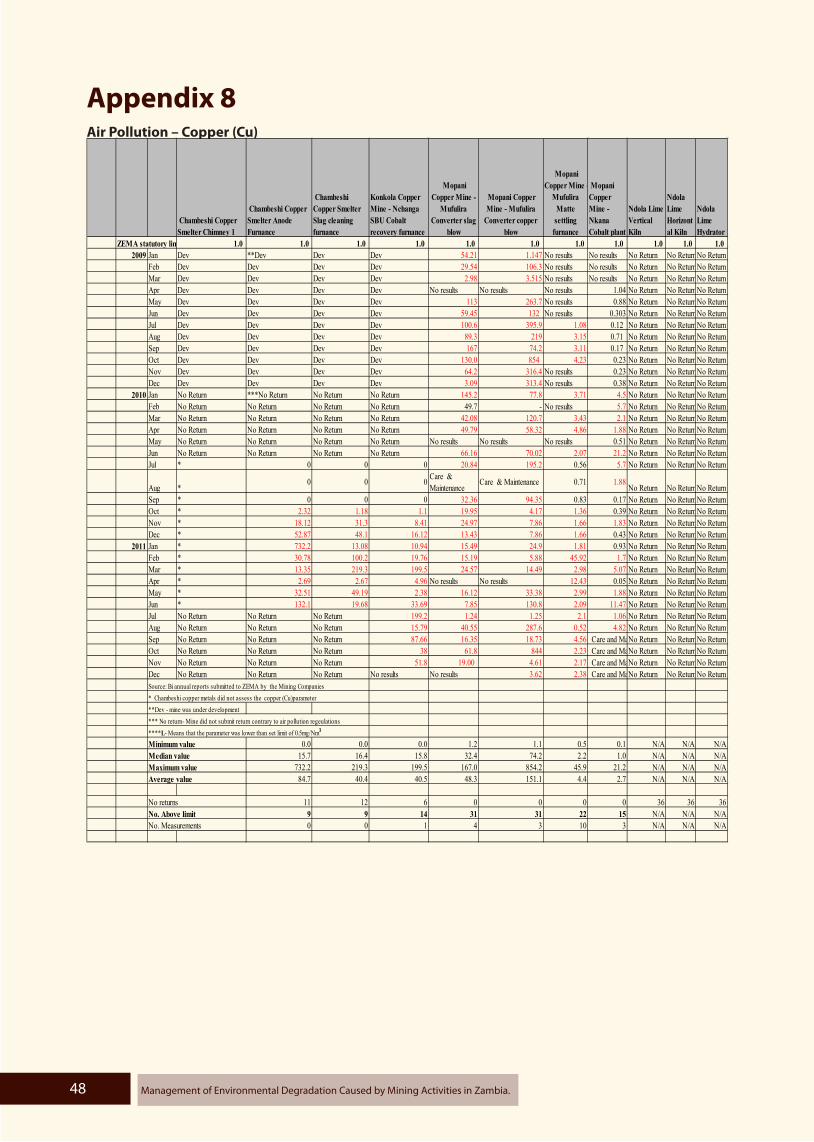
Management of Environmental Degradation Caused by Mining Activities in Zambia.48
Appendix 8Air Pollution – Copper (Cu)
Chambeshi Copper Smelter Chimney 1
Chambeshi Copper Smelter Anode Furnance
Chambeshi Copper Smelter Slag cleaning furnance
Konkola Copper Mine - Nchanga SBU Cobalt recovery furnance
Mopani Copper Mine -
Mufulira Converter slag
blow
Mopani Copper Mine - Mufulira
Converter copper blow
Mopani Copper Mine -
Mufulira Matte settling furnance
Mopani Copper Mine -Nkana Cobalt plant
Ndola Lime Vertical Kiln
Ndola Lime Horizontal Kiln
Ndola Lime Hydrator
ZEMA statutory limits 1.0 1.0 1.0 1.0 1.0 1.0 1.0 1.0 1.0 1.0 1.0 2009 Jan Dev **Dev Dev Dev 54.21 1.147 No results No results No Return No ReturnNo Return
Feb Dev Dev Dev Dev 29.54 106.3 No results No results No Return No ReturnNo ReturnMar Dev Dev Dev Dev 2.98 3.515 No results No results No Return No ReturnNo ReturnApr Dev Dev Dev Dev No results No results No results 1.04 No Return No ReturnNo ReturnMay Dev Dev Dev Dev 113 263.7 No results 0.88 No Return No ReturnNo ReturnJun Dev Dev Dev Dev 59.45 132 No results 0.303 No Return No ReturnNo ReturnJul Dev Dev Dev Dev 100.6 395.9 1.08 0.12 No Return No ReturnNo ReturnAug Dev Dev Dev Dev 89.3 219 3.15 0.71 No Return No ReturnNo ReturnSep Dev Dev Dev Dev 167 74.2 3.11 0.17 No Return No ReturnNo ReturnOct Dev Dev Dev Dev 130.0 854 4.23 0.23 No Return No ReturnNo ReturnNov Dev Dev Dev Dev 64.2 316.4 No results 0.23 No Return No ReturnNo ReturnDec Dev Dev Dev Dev 3.09 313.4 No results 0.38 No Return No ReturnNo Return
2010 Jan No Return ***No Return No Return No Return 145.2 77.8 3.71 4.5 No Return No ReturnNo ReturnFeb No Return No Return No Return No Return 49.7 - No results 5.7 No Return No ReturnNo ReturnMar No Return No Return No Return No Return 42.08 120.7 3.43 2.1 No Return No ReturnNo ReturnApr No Return No Return No Return No Return 49.79 58.32 4.86 1.88 No Return No ReturnNo ReturnMay No Return No Return No Return No Return No results No results No results 0.51 No Return No ReturnNo ReturnJun No Return No Return No Return No Return 66.16 70.02 2.07 21.2 No Return No ReturnNo ReturnJul * 0 0 0 20.84 195.2 0.56 5.7 No Return No ReturnNo Return
Aug *0 0 0 Care &
MaintenanceCare & Maintenance 0.71 1.88
No Return No ReturnNo ReturnSep * 0 0 0 32.36 94.35 0.83 0.17 No Return No ReturnNo ReturnOct * 2.32 1.18 1.1 19.95 4.17 1.36 0.39 No Return No ReturnNo ReturnNov * 18.12 31.3 8.41 24.97 7.86 1.66 1.83 No Return No ReturnNo ReturnDec * 52.87 48.1 16.12 13.43 7.86 1.66 0.43 No Return No ReturnNo Return
2011 Jan * 732.2 13.08 10.94 15.49 24.9 1.81 0.93 No Return No ReturnNo ReturnFeb * 30.78 100.2 19.76 15.19 5.88 45.92 1.7 No Return No ReturnNo ReturnMar * 13.35 219.3 199.5 24.57 14.49 2.98 5.07 No Return No ReturnNo ReturnApr * 2.69 2.67 4.96 No results No results 12.43 0.05 No Return No ReturnNo ReturnMay * 32.51 49.19 2.38 16.12 33.38 2.99 1.88 No Return No ReturnNo ReturnJun * 132.1 19.68 33.69 7.85 130.8 2.09 11.47 No Return No ReturnNo ReturnJul No Return No Return No Return 199.2 1.24 1.25 2.1 1.06 No Return No ReturnNo ReturnAug No Return No Return No Return 15.79 40.55 287.6 0.52 4.82 No Return No ReturnNo ReturnSep No Return No Return No Return 87.66 16.35 18.73 4.56 Care and MaintainanceNo Return No ReturnNo ReturnOct No Return No Return No Return 38 61.8 844 2.23 Care and MaintainanceNo Return No ReturnNo ReturnNov No Return No Return No Return 51.8 19.00 4.61 2.17 Care and MaintainanceNo Return No ReturnNo ReturnDec No Return No Return No Return No results No results 3.62 2.38 Care and MaintainanceNo Return No ReturnNo ReturnSource: Bi annual reports submitted to ZEMA by the Mining Companies* Chambeshi copper metals did not assess the copper (Cu)parameter**Dev - mine was under development*** No return- Mine did not submit return contrary to air pollution regeulations****L- Means that the parameter was lower than set limit of 0.5mg/Nm³Minimum value 0.0 0.0 0.0 1.2 1.1 0.5 0.1 N/A N/A N/AMedian value 15.7 16.4 15.8 32.4 74.2 2.2 1.0 N/A N/A N/AMaximum value 732.2 219.3 199.5 167.0 854.2 45.9 21.2 N/A N/A N/AAverage value 84.7 40.4 40.5 48.3 151.1 4.4 2.7 N/A N/A N/A
No returns 11 12 6 0 0 0 0 36 36 36No. Above limit 9 9 14 31 31 22 15 N/A N/A N/ANo. Measurements 0 0 1 4 3 10 3 N/A N/A N/A

49Management of Environmental Degradation Caused by Mining Activities in Zambia.
Appendix 9
Air Pollution – Lead (Pb)
Chambishi Copper Smelter- Chimney 1
Chambishi Copper Smelter-Anode Furnance
Chambishi Copper Smelter- Slag cleaning furnance
Konkola Copper Mine - Nchanga SBU-Cobalt recovery furnance
Mopani Copper Mine - Mufulira SBU-Converter slag
blow
Mopani Copper Mine -
Mufulira-Converter
copper blow
Mopani Copper Mine - Mufulira-
Matte settling furnance
Mopani Copper Mine -Nkana-Cobalt plant
Ndola Lime -Vertical Kiln
Ndola Lime -Horizontal Kiln
Ndola Lime -
HydratorZEMA statutory limits 0.2 0.2 0.2 0.2 0.2 0.2 0.2 0.2 0.2 0.2 0.2
2009 Jan Dev Dev ** Dev Dev 26.25 0.064 No results No results No Return No ReturnNo ReturnFeb Dev Dev Dev Dev 11.55 13.17 No results No results No Return No ReturnNo ReturnMar Dev Dev Dev Dev 11.63 4.31 No results No results No Return No ReturnNo ReturnApr Dev Dev Dev Dev No results No results No results No results No Return No ReturnNo ReturnMay Dev Dev Dev Dev 9.28 2.42 No results No results No Return No ReturnNo ReturnJun Dev Dev Dev Dev 18.15 10.11 No results No results No Return No ReturnNo ReturnJul Dev Dev Dev Dev 37.2 17.4 1.18 No results No Return No ReturnNo ReturnAug Dev Dev Dev Dev 30.3 11.5 4.87 No results No Return No ReturnNo ReturnSep Dev Dev Dev Dev 13.8 3.68 1.66 No results No Return No ReturnNo ReturnOct Dev Dev Dev Dev 6.8 15 1.27 No results No Return No ReturnNo ReturnNov Dev Dev Dev Dev 6.7 2.6 No results No results No Return No ReturnNo ReturnDec Dev Dev Dev Dev 13.2 35.8 No results No results No Return No ReturnNo Return
2010 Jan No Return No Return No Return Dev 75.9 33.9 0.66 0.2 No Return No ReturnNo ReturnFeb No Return No Return No Return Dev 20.97 28.5 No results 0.1 No Return No ReturnNo ReturnMar No Return No Return No Return Dev 1.38 0.9 4.83 0.3 No Return No ReturnNo ReturnApr No Return No Return No Return Dev 28.14 9.79 10.01 0.1 No Return No ReturnNo ReturnMay No Return No Return No Return Dev No Results No results No results 1.0 No Return No ReturnNo ReturnJun No Return No Return No Return Dev 15.18 6.73 0.43 0.5 No Return No ReturnNo ReturnJul * 0 0 0 59.1 24.05 0.31 0.03 No Return No ReturnNo Return
Aug *0 0 0 Care &
maintenanceCare & maintenance
2.430.1 No Return No ReturnNo Return
Sep * 0 0 0 10.53 6.97 1.26 0.04 No Return No ReturnNo ReturnOct * 11.92 2.55 6.15 33.85 19.42 4.59 0.1 No Return No ReturnNo ReturnNov * 0.12 5.69 0.19 25.66 33.8 1.98 0.2 No Return No ReturnNo ReturnDec * 0.87 4.93 18.36 14.01 13.47 0.93 0.1 No Return No ReturnNo Return
2011 Jan * 0.79 6.91 5.9 42.33 3.57 1.81 No results No Return No ReturnNo ReturnFeb * 0.48 7.73 14.05 9.55 2.89 30.08 No results No Return No ReturnNo ReturnMar * 0.48 15.83 10.12 38.5 17.4 0.71 No results No Return No ReturnNo ReturnApr * 0.66 3.52 2.78 No Results No results 1.62 No results No Return No ReturnNo ReturnMay * 0.51 13.21 0.9 10.3 2.15 4.25 No results No Return No ReturnNo ReturnJun * 2.08 1.64 2.95 5.76 8.47 0.75 No results No Return No ReturnNo ReturnJul No Return No Return No Return 55.8 15.72 19.19 1.93 0.08 No Return No ReturnNo ReturnAug No Return No Return No Return 21.9 25.65 15.48 0.45 1.46 No Return No ReturnNo ReturnSep No Return No Return No Return 3.91 49.83 27.56 8.54 Cara and MaintainanceNo Return No ReturnNo ReturnOct No Return No Return No Return 12.05 35.7 10.1 2.77 Cara and MaintainanceNo Return No ReturnNo ReturnNov No Return No Return No Return 15 21.97 24.6 3.04 Cara and MaintainanceNo Return No ReturnNo ReturnDec No Return No Return No Return no result no result 0.04 2.18 Cara and MaintainanceNo Return No ReturnNo Return
Source: Bi annual reports submitted to ZEMA by the Mining Companies* Chambeshi copper metals did not assess the lead (Pb)parameterDev ** - mine was under developmentData analysisMin 0.0 0.0 0.0 0.0 1.4 0.0 0.3 0.0 N/A N/A N/AMedian N/A 0.5 4.2 5.9 18.2 10.8 1.9 0.1 N/A N/A N/AMax 0.0 11.9 15.8 55.8 75.9 35.8 30.1 1.5 N/A N/A N/AAverage N/A 1.5 5.2 10.0 23.4 13.3 3.6 0.3 N/A N/A N/A
No returns 12 12 12 0 0 0 0 0 36 36 36No. Above limit 0 8 9 13 31 30 26 5 N/A N/A N/ANo. Measurements 0 0 0 0 3 3 10 18 0 0 0

Management of Environmental Degradation Caused by Mining Activities in Zambia.50
Appendix 10
Mines that did not submit Bi annual reports for surface water monitoring.
Name of mine Name of facility Period
1. 1. Bwana Mukubwa Mine
Little Mukulungwe -Upstream Site SW2Little Mukulungwe -Downstream Site SW3
Jan-June 2009
2. Chambishi Copper SmelterSmelter DrainAcid plant Drain
July to December 2010
3. Chibuluma South Effluent waterJan – Dec 2009July-Dec 2010July to Dec 2011
4. Non Ferrous Non FerrousCoppermine Africa
Musakashi dam effluent dischargeCombined drain leading to TD6TD6 overflow effluent qualityWater treatment ponds overflow
January to December2011
5. Konkola Copper Mine - Nkana North Uchi July to December 2010
6. Konkola Coppermine Nchanga
PCD SpillwayMuntimpa spillwayCombined concentrator drain into Nchanga StreamNchanga open pit spillage into Nchanga stream
July to December 2009July to December 2011
Luanshya river
January –December 2009January –December 2010January December 2011
TD 24 also known as the ‘Old tailings dump’
January –December 2009January –December 2010January December 2011
Musi TD
January –December 2009January –December 2010January December 2011
Mine effluent Jan-June 2011Downstream -Izuma stream January –June 2011
Chilanga
January –December 2009January –December 2010
Kafubu
January –December 2009January –December 2010
10. Kansashi Mine All Facilities
January –December 2009January –December 2010January December 2011
7. Luanshya Copper Mine
9. Ndola Lime
8. Mamba Collieries

51Management of Environmental Degradation Caused by Mining Activities in Zambia.
Appendix 11
Surface Water Particles – TSS mg/l
Zema limit
NFCA- Musakashi dam effluent discharge
NFCA-Combined drain leading to TD6
NFCA-TD6 overflow effluent quality
NFCA-Water treatment ponds overflow
KCM Konkola-Lubengele dam into Lubengele stream
KCM Konkola-Engineering workshop overflow into Lubengele stream
KCM Konkola-Plant overflow into Kakosa Stream
KCM Nchanga- PCD Spillway
KCM Nchanga- Combined concentrator drain into Nchanga Stream
KCM Nchanga- Nchanga open pit spillage into Nchanga stream
mg/l mg/l mg/l mg/l mg/l mg/l mg/l mg/l mg/l mg/l mg/l2009 Jan 100 31 19,513 1,469 400 39 - 156 9,953 3,440
Feb 100 71.50 3,477 1,419 429 1,036 - 157 26,448 5,521 1,930 Mar 100 83 3,518 1,095 1,009 178 27 159 43,833 5,936 504 Apr 100 65 2,905 1,161 460 332 - 179 21,539 3,137 111 May 100 285 3,445 827 415 86 - 147 14,127 1,893 793 Jun 100 146 8,826 6,220 427 32 - 147 27,218 1,802 233 Jul 100 57 1,282 2,037 254 376 - 129 - - - Aug 100 40 1,685 - 951 193 - 340 - - - Sep 100 77 3,488 - 633 66 235 134 - - - Oct 100 63 537 - 283 8 2,121 183 - - - Nov 100 72 1,218 157 482 10 65 103 - - - Dec 100 70 2,597 144 255 18 170 381 - - -
2010 Jan 100 93 572 72 130 15 104 266 11,449 183 195 Feb 100 122 1,959 158 295 2,741 104 208 2,972 324 1,193 Mar 100 27 1,151 759 371 62 55 371 3,467 647 1,058 Apr 100 56 885 379 300 37 48 240 3,229 2,443 184 May 100 65 509 372 456 67 81 235 20,482 224 249 Jun 100 333 921 50 621 53 80 166 8,976 2,942 11 Jul 100 274 4,894 118 975 26 64 184 12,568 474 154 Aug 100 81 1,275 179 239 70 13 229 5,102 112 - Sep 100 103 384 556 731 1,724 35 248 8,905 1,370 85 Oct 100 98 1,009 366 255 2,873 29 277 6,901 396 - Nov 100 101 1,673 347 259 - - 182 48,069 493 346 Dec 100 49 4,328 1,058 351 - - 152 4,922 677 361
2011 Jan 100 No Return No Return No Return No Return no flow no flow 96 5,025 187 117 Feb 100 No Return No Return No Return No Return no flow no flow 120 6,537 896 1,055 Mar 100 No Return No Return No Return No Return 13 no flow 217 5,414 638 175 Apr 100 No Return No Return No Return No Return 16 no flow 191 4,068 1,118 223 May 100 No Return No Return No Return No Return 32 no flow 104 6,989 930 368 Jun 100 No Return No Return No Return No Return 13 no flow 151 1,153 975 167 Jul 100 No Return No Return No Return No Return 9 - 139 732 749 106 Aug 100 No Return No Return No Return No Return 17 - 130 no results 2,330 no resultsSep 100 No Return No Return No Return No Return 11 - 88 817 2,145 176 Oct 100 No Return No Return No Return No Return 14 - 67 255 1,393 58 Nov 100 No Return No Return No Return No Return 19 - 116 514 1,690 35 Dec 100 No Return No Return No Return No Return 25 - 80 782 1,909 198
Source: Bi annual reports submitted to ZEMA by the Mining CompaniesData analysis Data AnalysisMin 26.7 384.3 0.0 130.3 0.0 0.0 67.0 0.0 0.0 0.0Median 74.0 1,679.0 369.0 407.3 32.0 6.5 158.0 5,025.0 822.5 175.5 Max 333.0 19,512.7 6,219.5 1,009.3 2,873.0 2,121.0 381.0 48,069.0 5,936.3 1,929.7 Average 102.4 3,002.0 789.2 457.4 300.3 107.7 179.8 8,927.1 1,304.8 315.1
No returns 12 12 12 12 0 0 0 0 0 0No. Above limit 7 24 19 24 8 5 32 29 30 22No. Measurements 0 0 0 0 0 0 0 1 0 1
Source: Bi annual reports

Management of Environmental Degradation Caused by Mining Activities in Zambia.52
Appendix 12
Surface Water Pollution (Other Facilities) – TCu
Name of Facility
Chambishi Metals-New dam overflow -SW13
NFCA-Combined drain leading to TD6
NFCA- TD6 overflow effluent quality
NFCA-Water treatment ponds overflow
KCM Konkola -Lubengele dam into Lubengele stream
KCM Konkola -Engineering workshop overflow into Lubengele stream
KCM Konkola -Plant overflow into Kakosa Stream
KCM Nchanga- PCD Spillway
KCM Nchanga-Muntimpa spillway
KCM Nchanga-Cobined concentrator drain into Nchanga Stream
KCM Nchanga-Nchanga open pit spillage into Nchanga stream
Konkola Copper Mine - Nkana-South Uchi
Mopani Copper Mine -
Mufulira Mufulira
west discharge
Mopani Copper Mine - Nkana -North Unchi
ZEMA statutory limits 1.5 1.5 1.5 1.5 1.5 1.5 1.5 1.5 1.5 1.5 1.5 1.5 1.5 1.5
2009 Jan 0.1 103.6 32.4 0.4 <0.01 * 1.2 336.7 0.3 192.9 No results YTD AverageNo Flow 1.34Feb 0.8 106.0 99.7 1.1 4.2 * 1.8 221.6 0.4 159.3 9.3 YTD AverageNo Flow 1.5Mar 0.3 41.5 60.1 4.4 0.7 <0.01 1.8 280.9 0.2 120.7 3.7 YTD AverageNo Flow 2Apr 0.3 17.1 38.7 3.6 2.1 * 1.3 273.9 0.2 102.8 3.4 YTD AverageNo Flow 2.3May - 12.7 90.4 1.1 0.0 * 0.7 117.7 0.2 31.7 5.6 YTD AverageNo Flow 1.6Jun - 11.2 34.8 1.3 0.4 * 1.9 252.5 0.3 29.0 22.1 YTD AverageNo Flow 2.3Jul 0.1 3.5 13.3 0.3 8.5 * 2.2 No results No results No results No results YTD Average 0.1 1.5Aug 0.3 7.6 No flow 2.1 2.0 * 3.3 No results No results No results No results YTD Average 0.1 1.0Sep 0.3 7.1 No flow 1.8 2.4 <0.01 0.9 No results No results No results No results YTD Average 0.0 2.3Oct 0.3 3.0 No flow 0.7 0.1 17.0 2.1 No results No results No results No results YTD Average 0.0 1.7Nov - 2.3 2.6 1.1 10.3 1.7 14.1 No results No results No results No results YTD Average 0.2 1.6Dec 0.6 46.5 2.3 0.6 1.7 1.4 8.3 No results No results No results No results YTD Average 0.4 2.2
2010 Jan 0.9 45.2 10.4 0.4 3.0 1.1 7.9 272.0 0.3 106.0 5.7 7.5 0.4 1.3Feb 0.1 59.6 6.0 0.2 5.6 0.6 2.5 147.0 0.2 248.0 5.0 3.1 0.3 6.4Mar 1.6 24.1 3.9 0.4 2.7 0.0 1.4 787.0 0.1 36.0 1.9 2.8 55.5 0.5Apr 1.7 17.9 20.1 1.4 4.0 4.6 2.9 152.0 0.1 36.0 0.3 8.2 33.9 1.0May 0.1 1.7 2.6 1.6 0.9 1.0 1.4 161.0 0.2 502.0 5.3 0.8 24.6 2.7Jun 1.8 1.2 0.9 1.5 0.1 0.1 0.2 192.0 0.1 79.0 0.9 1.9 2.2 1.2Jul 1.0 6.8 0.4 1.8 0.2 * 3.1 144.2 0.6 9.1 2.2 No results 1.2 8.5 Aug 0.8 1.9 0.7 0.4 0.9 * 1.5 218.4 2.3 0.1 - No results 1.4 13.0 Sep 0.5 0.9 0.2 0.6 9.8 * 4.5 108.1 0.1 45.7 0.3 No results 2.1 11.6 Oct 0.3 2.6 0.9 0.5 17.6 * 2.2 251.3 - 9.0 - No results 3.2 3.5 Nov 1.3 3.4 0.8 0.6 * * 1.6 55.6 0.1 5.1 0.0 No results 0.3 5.2 Dec 0.2 63.0 12.6 0.7 * * 1.1 283.2 0.0 0.7 0.0 No results 16 1.5
2011 Jan 0.2 No results No results No results no flow no flow 1.2 295.6 0.3 0.6 1.3 7.0 18.9 1.7Feb 0.1 No results No results No results no flow no flow 3.8 136.4 0.3 38.8 13.9 8.4 0.3 1.6Mar 0.2 No results No results No results 0.7 no flow 3.1 178.3 0.6 75.8 2.4 5.8 4.3 3.2Apr 0.1 No results No results No results 0.5 no flow 0.9 29.6 2.2 32.4 8.1 2.9 1.7 1.7May 0.1 No results No results No results 0.4 no flow 1.8 162.1 2.5 99.9 5.5 2.0 0.5 0.7Jun 0.1 No results No results No results 0.3 no flow 1.6 35.1 0.8 1.8 2.6 2.0 0.0 5.1Jul 0.5 No results No results No results 0.3 No results 4.2 51.1 0.5 76.9 3.8 5.8 6.8 0.625Aug 0.1 No results No results No results 0.1 No results 2.6 No results 1.7 109.7 No results 3.8 4.2 1.2Sep 0.6 No results No results No results 0.2 No results 0.5 170.2 0.4 82.4 4.5 4.0 2.4 1.3Oct 0.7 No results No results No results 0.2 No results 1.4 77.7 10.6 99.5 0.4 13.1 10.2 0.8Nov 0.6 No results No results No results 0.7 No results 1.8 29.5 1.2 36.1 0.5 3.0 18.2 0.95
Dec 1.0 No results No results No results
0.8 No results 1.8 78.8 0.6 63.5 5.1 4.5 0.5
0.68Source: Bi annual reports submitted to ZEMA by the Mining Companies* Other mines were below the limits.Data analysisMin 0.0 0.9 0.2 0.2 0.0 0.0 0.2 29.5 0.0 0.1 0.0 0.8 0.0 0.5Median 0.3 9.4 6.0 0.9 0.8 1.1 1.8 162.1 0.3 54.6 3.6 3.9 1.6 1.6Max 1.8 106.0 99.7 4.4 17.6 17.0 14.1 787.0 10.6 502.0 22.1 13.1 55.5 13.0Average 0.5 24.6 20.7 1.2 2.6 3.1 2.6 189.6 0.9 81.0 4.4 4.8 7.0 2.7
No returns 0 0 0 0 0 0 0 0 0 0 0 0 0 0No. Above limit 3 22 15 6 13 3 24 29 5 27 18 17 15 20No. Measurements 0 12 12 12 0 6 0 7 6 6 8 6 0 0

53Management of Environmental Degradation Caused by Mining Activities in Zambia.
Appendix 13
Surface Water Pollution (Other Facilities) – TCo
ZEMA statutory limitsChambishi Metals- New dam overflow-SW13
NFCA-Combined drain leading to TD6
NFCA-TD6 overflow effluent quality
KCM Konkola-Lubengele dam into Lubengele stream
KCM Konkola-Plant overflow into Kakosa Stream
KCM Nhanga -PCD Spillway
KCM Nchanga- Muntimpa spillway
KCM Nchanga-Cobined concentrator drain into Nchanga Stream
KCM Nchanga open pit spillage into Nchanga stream
MCM-North Uchi
mg/L mg/L mg/L mg/L mg/L mg/L mg/L mg/L mg/L mg/L mg/L2009 Jan 1.0 2.4 51.5 19.7 0.0 0.0 3.6 1.8 4.1 0.7
Feb 1.0 2.7 N/A 16.0 14.7 2.1 7.0 3.2 7.1 0.5 1.3 Mar 1.0 2.0 6.5 14.3 2.1 2.2 7.7 1.8 1.9 0.5 0.9 Apr 1.0 0.6 6.9 21.6 0.2 0.1 5.2 2.1 2.9 0.4 0.7 May 1.0 0.8 2.0 25.5 0.0 0.0 5.1 0.6 6.3 0.6 0.5 Jun 1.0 0.9 2.1 21.5 0.3 1.6 10.0 0.7 0.7 1.1 0.6 Jul 1.0 0.3 2.8 10.6 5.1 2.6 No results No results No results No results 3.7 Aug 1.0 0.1 1.2 No flow 2.1 5.9 No results No results No results No results 0.4 Sep 1.0 0.1 0.9 No flow 0.1 0.1 No results No results No results No results 0.5 Oct 1.0 0.1 0.4 No flow 0.1 2.6 No results No results No results No results 1.0 Nov 1.0 0.1 1.4 6.2 1.3 12.2 No results No results No results No results 0.8 Dec 1.0 0.5 38.1 6.8 1.2 8.1 No results No results No results No results 0.5
2010 Jan 1.0 2.1 9.8 15.4 0.2 0.1 5.8 1.0 0.7 * 1.0 Feb 1.0 0.9 15.6 7.5 0.1 0.0 3.1 0.7 1.1 * 3.9 Mar 1.0 0.5 11.3 7.7 0.0 0.1 1.5 0.4 0.8 * 2.9 Apr 1.0 0.6 3.4 15.3 0.8 0.2 2.0 0.3 0.5 * 1.8 May 1.0 0.8 0.7 16.9 0.1 0.3 1.9 0.5 0.7 * 3.7 Jun 1.0 1.0 <0.01 9.5 <0.01 0.0 2.2 1.4 2.2 * 0.7 Jul 1.0 1.1 0.7 10.2 <0.01 0.2 4.4 6.8 0.9 2.3 1.9 Aug 1.0 0.7 0.7 10.2 0.1 0.1 4.0 6.3 0.2 - 3.5 Sep 1.0 0.5 0.1 8.9 0.8 0.1 2.6 1.7 0.9 0.0 4.3 Oct 1.0 0.4 0.3 7.2 1.3 0.1 9.7 - 0.5 - 4.0 Nov 1.0 0.5 0.6 9.6 * 0.1 2.8 0.9 0.4 311.0 1.9 Dec 1.0 0.8 20.1 23.2 * 0.0 2.4 1.5 0.3 81.0 1.9
2011 Jan 1.0 1.9 No results No results no flow 0.1 3.8 1.0 1.2 0.2 0.9 Feb 1.0 1.4 No results No results no flow 0.5 2.4 0.6 1.1 0.7 0.8 Mar 1.0 1.2 No results No results 0.1 0.2 4.2 0.5 2.5 0.3 1.1 Apr 1.0 0.1 No results No results 0.0 0.2 0.9 0.4 1.2 0.4 3.4 May 1.0 0.3 No results No results 0.1 0.1 3.7 13.1 3.2 0.3 0.4 Jun 1.0 1.0 No results No results 0.8 0.9 1.3 2.8 1.8 0.4 2.4 Jul 1.0 0.9 No results No results 0.1 0.2 1.2 2.9 1.1 1.7 0.5 Aug 1.0 0.9 No results No results 0.0 0.1 No results 4.1 No results 4.1 1.1 Sep 1.0 0.6 No results No results 0.0 0.1 5.9 1.3 0.3 1.5 1.1 Oct 1.0 0.8 No results No results 0.3 0.3 3.8 1.4 0.1 3.5 1.0 Nov 1.0 0.4 No results No results 0.0 0.1 1.4 0.4 0.0 1.5 0.6 Dec 1.0 1.0 No results No results 0.1 0.1 3.1 0.4 0.2 2.8 0.6
Source: Bi annual reports submitted to ZEMA by the Mining Companies* Chambeshi copper metals did not assess the lead (Pb)parameterData analysisMin 0.1 0.1 6.2 0.0 0.0 0.9 0.3 0.0 0.0 0.4Median 0.8 2.1 10.6 0.1 0.1 3.6 1.3 0.9 0.7 1.0Max 2.7 51.5 25.5 14.7 12.2 10.0 13.1 7.1 311.0 4.3Average 0.9 8.0 13.5 1.1 1.2 3.9 2.1 1.5 19.7 1.6

Management of Environmental Degradation Caused by Mining Activities in Zambia.54
Appendix 14
Surface Water Pollution ( Other Facilities) - TMn
Appendix 14Performance audit on environmental degradation caused by mining activitiesSurface Water Pollution (other facilities) - TMn
Name of Facility
ZEMA statutory limits
NFCA Combined drain leading to TD6
NFCA TD6 overflow effluent quality
NFCA -Water treatment ponds overflow
KCM Nchanga -PCD spillway
KCM Nchanga -Muntimpa spillway
KCM Nchanga - Combined concentrator drain into Nchanga Stream
KCM Nchanga - Nchanga open pit spillage into Nchanga stream
MCM Mufulira-
TD 11 Spillway
MCM- Mufulira
west discharge
MCM Nkana-North Uchi
2009 Jan 1.0 16.5 30.0 1.1 11.0 43.0 3.8 9.6 NO FLOW 1.6 Feb 1.0 17.5 16.4 1.6 25.8 13.5 11.6 1.6 9.7 NO FLOW 1.1 Mar 1.0 8.2 7.5 1.6 25.1 14.5 62.1 6.2 9.6 NO FLOW 2.0 Apr 1.0 4.8 6.9 1.0 9.3 7.6 3.7 0.4 7.1 NO FLOW 2.3 May 1.0 9.5 13.1 2.7 16.0 7.2 19.5 1.8 0.5 NO FLOW 1.7 Jun 1.0 9.8 11.4 0.6 53.5 15.5 3.2 1.9 0.3 NO FLOW 2.0 Jul 1.0 0.9 3.4 0.6 No results No results No results No results 0.9 0.1 14.7 Aug 1.0 1.9 No flow 4.0 No results No results No results No results 0.6 0.1 1.1 Sep 1.0 6.4 No flow 1.0 No results No results No results No results 0.4 0.0 1.0 Oct 1.0 1.3 No flow 0.4 No results No results No results No results 1.1 0.0 4.4 Nov 1.0 1.9 1.0 0.6 No results No results No results No results 2.3 0.1 2.9 Dec 1.0 47.9 2.4 0.2 No results No results No results No results 4.0 0.1 1.0
2010 Jan 1.0 24.6 10.2 0.5 201.1 6.3 1.7 1.3 2.6 0.2 2.1 Feb 1.0 43.5 17.4 0.4 6.2 8.7 2.8 1.0 2.6 0.1 5.6 Mar 1.0 28.5 12.0 0.4 4.1 6.2 1.8 1.0 4.1 8.1 5.9 Apr 1.0 10.8 16.7 0.9 6.1 6.1 3.8 0.5 1.9 2.3 3.2 May 1.0 1.8 17.1 0.5 3.7 4.4 2.2 0.6 2.2 4.0 12.0 Jun 1.0 1.0 20.2 0.5 4.2 24.5 5.0 0.9 1.6 0.7 3.0 Jul 1.0 5.0 30.6 1.1 5.0 9.4 2.9 1.7 4.6 1.2 8.3 Aug 1.0 1.4 21.8 0.6 6.0 73.9 0.4 - 3.2 1.6 5.5 Sep 1.0 0.8 26.0 3.0 5.5 56.6 2.9 0.7 3.5 0.7 10.7 Oct 1.0 1.6 12.9 0.3 63.2 - 1.5 - 3.4 1.5 4.0 Nov 1.0 2.0 23.1 0.4 9.4 4.4 2.0 0.0 1.3 0.4 7.6 Dec 1.0 49.5 29.3 0.7 7.4 11.1 3.9 0.0 0.3 0.4 0.9
2011 Jan 1.0 No results No results No results 7.3 8.7 6.0 1.2 4.5 0.2 2.5 Feb 1.0 No results No results No results 13.7 8.2 6.4 6.4 3.9 0.4 1.2 Mar 1.0 No results No results No results 16.6 8.7 7.0 1.3 2.6 0.6 2.5 Apr 1.0 No results No results No results 3.8 10.9 2.9 1.7 1.3 0.5 1.0 May 1.0 No results No results No results 14.0 23.5 7.2 0.8 1.3 0.6 0.7 Jun 1.0 No results No results No results 10.1 31.6 8.0 5.5 1.0 0.7 3.5 Jul 1.0 No results No results No results 9.2 53.8 5.6 5.5 2.3 2.1 2.5 Aug 1.0 No results No results No results No results 34.0 6.3 0.1 2.4 2.1 2.3 Sep 1.0 No results No results No results 20.1 36.1 5.9 No results 2.0 1.8 2.9 Oct 1.0 No results No results No results 28.7 37.5 9.4 1.0 2.5 14.0 0.7 Nov 1.0 No results No results No results 10.6 18.1 3.5 0.3 0.9 4.1 1.1 Dec 1.0 No results No results No results 7.9 11.5 6.4 0.8 0.7 0.5 0.5
Source: Bi annual reports submitted to ZEMA by the Mining CompaniesData analysisMin 0.8 1.0 0.2 3.7 4.4 0.4 0.0 0.3 0.0 0.5Median 5.7 16.4 0.6 9.4 11.5 3.8 1.0 2.3 0.6 2.4Max 49.5 30.6 4.0 201.1 73.9 62.1 6.4 9.7 14.0 14.7Average 12.4 15.7 1.0 20.8 20.5 7.0 1.7 2.8 1.6 3.5
No returns 0 0 0 0 0 0 0 0 0 0No. Above limit 21 20 8 29 29 29 12 27 11 31No. Measurements 12 12 12 7 6 6 7 0 0 0

55Management of Environmental Degradation Caused by Mining Activities in Zambia.
Appendix 15
Surface Water Pollution (Other Facilities) – TFe
Name of Facility
ZEMA statutory
limits
Konkola Copper Mine
- Konkola SBU-Plant
overflow into Kakosa Stream
Konkola Copper Mine -
Nchanga SBU-PCD SPILWAY
Konkola Copper Mine -
Nchanga SBU-
Muntimpa spillway
Konkola Copper Mine - Nchanga SBU-
Combined concentrator
drain into Nchanga Stream
Konkola Copper Mine -
Nchanga SBU-
Nchanga open pit
spillage into Nchanga stream
Mopani Copper Mine -
Mufulira-Mufulira
west discharge
Mopani Copper Mine - Nkana-North
Uchi
2009 Jan 2.0 0.3 443.0 0.4 75.0 * 1.7 Feb 2.0 0.2 305.9 1.6 226.3 10.8 No Flow 2.5 Mar 2.0 0.5 381.4 6.4 191.3 11.8 No Flow 1.7 Apr 2.0 1.6 320.4 1.0 114.2 6.0 No Flow 2.0 May 2.0 1.1 109.2 1.4 46.6 19.6 No Flow 3.3 Jun 2.0 0.3 382.8 0.8 15.1 80.6 No Flow 2.2 Jul 2.0 0.4 No results No results No results No results 0.1 1.2 Aug 2.0 0.5 No results No results No results No results 0.2 1.2 Sep 2.0 6.6 No results No results No results No results 0.0 1.9 Oct 2.0 0.2 No results No results No results No results 0.1 2.2 Nov 2.0 0.6 No results No results No results No results 0.1 0.9 Dec 2.0 1.0 No results No results No results No results 0.5 1.2
2010 Jan 2.0 3.1 155.0 0.4 119.0 10.8 5.1 1.2 Feb 2.0 2.2 160.0 0.2 40.4 18.0 0.6 2.9 Mar 2.0 1.6 295.0 0.5 365.0 3.2 4.7 0.9 Apr 2.0 2.3 199.0 1.7 365.0 5.2 15.6 0.6 May 2.0 1.4 237.0 1.6 115.0 5.5 35.2 1.2 Jun 2.0 0.2 368.0 1.7 6,752.0 1.7 2.5 1.6 Jul 2.0 3.9 2.3 1.4 9.7 2.8 2.6 0.8Aug 2.0 1.0 295.1 0.3 1.4 - 1.6 2.5Sep 2.0 5.4 216.7 0.2 47.7 3.3 0.7 4.9Oct 2.0 3.7 465.1 - 11.9 - 1.5 1.7Nov 2.0 2.5 64.4 0.6 5.1 0.0 0.4 2.2Dec 2.0 0.6 290.1 1.9 1.9 0.0 0.4 1.6
2011 Jan 2.0 1.9 300.8 1.7 1.3 1.2 2.0 2.1 Feb 2.0 5.8 333.0 1.0 126.5 8.1 0.5 1.8 Mar 2.0 4.5 262.7 0.8 189.2 13.6 0.7 1.5 Apr 2.0 1.5 65.3 2.1 69.9 11.5 1.6 0.5 May 2.0 3.2 165.0 8.7 128.9 25.1 1.2 1.0 Jun 2.0 2.5 107.5 4.0 217.0 4.1 2.0 6.3 Jul 2.0 6.5 135.0 1.8 155.7 5.5 3.4 1.1 Aug 2.0 5.5 No results 1.7 104.5 No results 3.8 1.5 Sep 2.0 7.0 418.8 1.3 176.9 17.4 21.1 0.3 Oct 2.0 5.8 206.9 37.5 142.8 1.0 8.3 0.9 Nov 2.0 2.1 47.0 0.8 53.6 1.0 8.6 0.7 Dec 2.0 3.0 127.4 1.3 132.8 6.8 0.2 0.7
Source: Bi annual reports submitted to ZEMA by the Mining CompaniesData analysisMin 0.2 2.3 0.2 1.3 0.0 0.0 0.3Median 2.0 237.0 1.4 114.6 5.8 1.5 1.5Max 7.0 465.1 37.5 6752.0 80.6 35.2 6.3Average 2.5 236.5 2.9 333.4 10.6 4.2 1.7
No returns 0 0 0 0 0 0 0No. Above limit 18 29 5 27 20 12 10No. Measurements 0 7 6 6 7 0 0

Management of Environmental Degradation Caused by Mining Activities in Zambia.56
Appendix 16
Underground Water Pollution (Other Facilities) – pH
Name of Facility
Chembeshi copper smelter Suphiric acid storage facility
Konkola Copper Mine - Nkana SBU Acid loding Bay
Mopani copper mine mufulira Acid
loading bay borehole no. 15
Mopani copper mine mufulira Borehole no. 18 between tank
hse 5 and refinery change house
Mopani Copper Mine -Nkana oldCVW
Mopani Copper Mine -Nkana colbalt plant
Mopani Copper Mine -Nkana colbalt plant
Deep Shallow Deep shallow ZEMA statutory limits 6-9 6-9 6-10 6-11 6-9 6-9 6-9 6-9 6-9
2009 Jan Dev YTD Average QTR Average QTR Average 6.2 6.8 2.9 4.2 4.5 Feb Dev YTD Average QTR Average QTR Average 6.2 6.4 3.3 5.7 5.4 Mar Dev YTD Average 6.1 5.7 5.9 6.3 No Results No Results No ResultsApr Dev YTD Average QTR Average QTR Average 7.2 7.6 5.4 6.3 5.7 May Dev YTD Average QTR Average QTR Average 6.3 6.7 3.4 6.2 6.0 Jun Dev YTD Average 6.3 6.7 No Results No Results 2.9 6.3 5.9 Jul No Results YTD Average QTR Average QTR Average 6.6 6.9 No Results 6.2 5.7 Aug No Results YTD Average QTR Average QTR Average 6.2 7.0 3.1 6.2 5.7 Sep No Results YTD Average 6.3 6.8 6.6 6.8 No Results No Results No ResultsOct No Results YTD Average QTR Average QTR Average 5.9 6.4 No Results 6.4 5.9 Nov No Results YTD Average QTR Average QTR Average 5.9 6.5 3.2 6.3 5.8 Dec No Results YTD Average Vandalised Vandalised 6.4 6.4 3.5 4.7 5.1
2010 Jan No Results Discontinued QTR Average QTR Average 5.9 6.1 3.1 3.3 4.3 Feb No Results Discontinued QTR Average QTR Average 6.0 6.4 3.0 4.2 3.7 Mar No Results Discontinued 6.4 5.3 6.4 7.9 3.8 4.6 3.8 Apr No Results Discontinued QTR Average QTR Average 6.5 6.7 3.0 3.0 4.3 May No Results Discontinued QTR Average QTR Average 6.0 6.4 3.0 3.0 4.1 Jun No Results Discontinued 6.5 6.1 6.8 6.8 3.2 3.4 4.7 Jul No Results Discontinued QTR Average QTR Average 6.2 6.9 3.2 3.2 4.7 Aug No Results Discontinued QTR Average QTR Average 6.7 7.2 3.2 3.2 4.3 Sep No Results Discontinued 6.5 6.8 6.5 6.9 3.2 3.1 4.4 Oct No Results Discontinued QTR Average QTR Average 7.7 8.1 3.7 3.2 5.1 Nov No Results Discontinued QTR Average QTR Average 7.4 7.6 3.4 4.8 4.4 Dec No Results Discontinued 6.5 7.1 6.6 6.8 3.5 4.7 3.7
2011 Jan No Results Discontinued QTR Average QTR Average 6.3 6.7 3.4 4.3 4.6 Feb No Results Discontinued QTR Average QTR Average 6.5 6.5 3.2 3.2 4.6 Mar No Results Discontinued 5.5 7.0 6.8 6.3 3.3 3.9 4.7 Apr No Results Discontinued QTR Average QTR Average 6.5 6.5 3.5 5.4 6.0 May No Results Discontinued QTR Average QTR Average 6.7 6.2 3.9 6.0 6.0 Jun No Results Discontinued 5.6 6.5 7.2 7.2 5.7 6.1 6.0 Jul No Results Discontinued QTR Average QTR Average 6.7 6.6 No Results No Results No ResultsAug No Results Discontinued QTR Average QTR Average 6.4 6.4 3.2 3.5 4.4 Sep No Results Discontinued 6.1 6.5 7.2 7.8 Not sampled Not sampled Not sampledOct No Results Discontinued QTR Average QTR Average 7.6 7.2 3.2 3.3 4.4 Nov No Results Discontinued QTR Average QTR Average 6.3 No flow 3.3 6.4 6.8 Dec No Results Discontinued 5.7 6.3 6.5 No flow 3.2 3.5 4.7 Source: Bi annual reports submitted to ZEMA by the Mining Companies
Minimum value 0.0 0.0 5.5 5.3 5.9 6.1 2.9 3.0 3.7Median value N/A N/A 6.3 6.5 6.5 6.7 3.2 4.5 4.7Maximum value 0.0 0.0 6.5 7.1 7.7 8.1 5.7 6.4 6.8Average value N/A N/A 6.1 6.4 6.5 6.8 3.4 4.6 5.0
Mopani copper mine mufulira Concentrate smelter shed borehole no.
9

57Management of Environmental Degradation Caused by Mining Activities in Zambia.
Appendix 17
Underground Water Pollution (Other Facilities) – TSS
Name of Facility
Chambeshi Copper Smelter-Suphiric acid storage facility
Konkola Copper Mine - Nkana SBU- Acid offloading bay
Mopani Copper Mine - Mufulira-Acid
loading bay borehole no. 15
Mopani Copper Mine - Mufulira-Borehole no. 18
between tank hse 5 and refinery change house
Mopani Copper Mine -Nkana - oldCVW
Mopani Copper Mine -Nkana - colbalt plant
Mopani Copper Mine -Nkana - colbalt plant
Deep Shallow Deep Shallow ZEMA statutory limits 100 100 100 100 100 100 100 100 100
2009 Jan Dev QTR averageQTR average 24.0 396.0 No results No results No resultsFeb Dev YTD average QTR averageQTR average 39.0 1,500.0 No results No results No resultsMar Dev YTD average 286.0 82.0 12.0 2,400.0 No results No results No resultsApr Dev YTD average QTR averageQTR average 32.0 600.0 No results No results No resultsMay Dev YTD average QTR averageQTR average 15.0 300.0 No results No results No resultsJun Dev YTD average 171.0 144.0 Not sampled Not sampled No results No results No resultsJul No results YTD average QTR averageQTR average 1.0 975.0 No results No results No resultsAug No results YTD average QTR averageQTR average 20.0 179.0 No results No results No resultsSep No results YTD average 165.0 150.0 1.0 160.0 No results No results No resultsOct No results YTD average QTR averageQTR average 4.0 1,408.0 No results No results No resultsNov No results YTD average QTR averageQTR average 2.0 5,304.0 No results No results No resultsDec No results YTD average Vandalised Vandalised 5.0 3,501.0 No results No results No results
2010 Jan No results No flow QTR averageQTR average 2.0 736.0 No results No results No resultsFeb No results No flow QTR AverageQTR Average 2.0 160.0 No results No results No resultsMar No results discontinued 18.0 122.0 9.0 3,845.0 No results No results No resultsApr No results discontinued QTR AverageQTR Average 2.0 3,788.0 No results No results No resultsMay No results discontinued QTR AverageQTR Average 1,026.0 717.0 No results No results No resultsJun No results discontinued 825.0 789.0 31.0 17.0 No results No results No resultsJul No results discontinued QTR AverageQTR Average 251.0 693.0 No results No results No resultsAug No results discontinued QTR AverageQTR Average 18.0 1,251.0 No results No results No resultsSep No results discontinued 42.0 35.0 1,973.0 27.0 No results No results No resultsOct No results discontinued QTR AverageQTR Average 12.0 2,102.0 No results No results No resultsNov No results discontinued QTR AverageQTR Average 19.0 1,048.0 No results No results No resultsDec No results discontinued 18.0 34.0 15.0 10,563.0 No results No results No results
2011 Jan No results discontinued QTR averageQTR average 5.0 2,318.0 No results No results No resultsFeb No results discontinued QTR averageQTR average 3.0 381.0 No results No results No resultsMar No results discontinued - - - - No results No results No resultsApr No results discontinued QTR averageQTR average 14.0 165.0 No results No results No resultsMay No results discontinued QTR averageQTR average 5.0 12.0 No results No results No resultsJun No results discontinued 60.0 16.0 10.0 34.0 No results No results No resultsJul No results discontinued QTR averageQTR average 4.0 819.0 No results No results No resultsAug No results discontinued QTR averageQTR average 70.0 4,881.0 No results No results No resultsSep No results discontinued 142.0 89.0 10.0 3,196.0 No results No results No resultsOct No results discontinued QTR averageQTR average 21.0 1,370.0 No results No results No resultsNov No results discontinued QTR averageQTR average 60.0 No flow No results No results No resultsDec No results discontinued 15.0 62.0 84.0 No flow No results No results No resultsSource: Bi annual reports submitted to ZEMA by the Mining Companies
ANALYSISMinimum value N/A N/A 15.0 16.0 1.0 12.0 N/A N/A N/AMedian value N/A N/A 101.0 85.5 13.0 897.0 N/A N/A N/AMaximum value N/A N/A 825.0 789.0 1973.0 10563.0 N/A N/A N/AAverage value N/A N/A 174.2 152.3 111.8 1713.9 N/A N/A N/A
N/A
Mopani Copper Mine - Mufulira-Concentrate
smeter shed borehole no. 9

Management of Environmental Degradation Caused by Mining Activities in Zambia.58
Appendix 18
Underground Water Pollution (Other Facilities) – TDS
Name of Facility
Chambeshi Copper Smelter- Suphiric acid storage facility
Konkola Copper Mine - Nkana Acid loading Bay
MCM Mufulira-Acid loading bay borehole no. 15
MCM Mufulira-Borehole no. 18
between tank hse 5 and
refinery change house
MCM Nkana-oldCVW
MCM Nkanacolbalt plant
MCM Nkana-colbalt plant
Deep Shallow Deep Shallow ZEMA statutory limits 3000 3000 3000 3000 3000 3000 3000 3000 3000
2009 Jan Dev YTD Average QTR Average QTR Average 63.0 1,820.0 1,135.0 2,457.0 1,859.0 Feb Dev YTD Average QTR Average QTR Average 1,400.0 <0.1 1,769.0 2,198.0 1,876.0 Mar Dev YTD Average 1400 108 61.0 <0.1 No results No results No resultsApr Dev YTD Average QTR Average QTR Average 1,700.0 <0.1 1,031.0 1,795.0 1,697.0 May Dev YTD Average QTR Average QTR Average 1,100.0 No results 1,431.0 2,196.0 2,089.0 Jun Dev YTD Average 500 115 No results No results 1,541.0 2,234.0 2,074.0 Jul No results YTD Average QTR Average QTR Average 1,200.0 200.0 No results 2,234.0 1,993.0 Aug No results YTD Average QTR Average QTR Average 800.0 400.0 1,476.0 2,227.0 1,997.0 Sep No results YTD Average 480 87 1,000.0 1,246.0 No results No results No resultsOct No results YTD Average QTR Average QTR Average 1,000.0 140.0 No results 2,161.0 1,882.0 Nov No results YTD Average QTR Average QTR Average 1,200.0 300.0 1,336.0 2,048.0 1,794.0 Dec No results YTD Average 640 266 1,100.0 200.0 1,423.0 2,470.0 1,770.0
2010 Jan No results Discontinued QTR Average QTR Average 1,400.0 1,000.0 1,543.0 9,694.0 1,893.0 Feb No results Discontinued QTR Average QTR Average 2,000.0 1,200.0 1,551.0 1,822.0 7,629.0 Mar No results Discontinued 1610 1600 1,103.0 2,130.0 1,480.0 1,901.0 10,116.0 Apr No results Discontinued QTR Average QTR Average 2,144.0 561.0 1,612.0 11,063.0 2,046.0 May No results Discontinued QTR Average QTR Average 0.1 400.0 1,455.0 10,567.0 2,310.0 Jun No results Discontinued <0.1 <0.1 1,010.0 312.0 1,560.0 10,582.0 2,149.0 Jul No results Discontinued QTR Average QTR Average 1,782.0 312.0 No results No results No resultsAug No results Discontinued QTR Average QTR Average 1,866.0 294.0 No results No results No resultsSep No results Discontinued 1202 1434 1,943.0 637.0 No results No results No resultsOct No results Discontinued QTR Average QTR Average 1,961.0 180.0 No results No results No resultsNov No results Discontinued QTR Average QTR Average 4,230.0 752.0 1,436.0 1,599.0 3,641.0 Dec No results Discontinued 2122 1186 2,959.0 2,576.0 1,366.0 2,199.0 5,098.0
2011 Jan No results Discontinued QTR Average QTR Average 2,699.0 2,422.0 1,465.0 3,870.0 1,553.0 Feb No results Discontinued QTR Average QTR Average 2,005.0 101.0 1,602.0 1,729.0 9,775.0 Mar No results Discontinued 1405 1518 1,922.0 1,988.0 1,482.0 5,831.0 1,649.0 Apr No results Discontinued QTR Average QTR Average 288.0 561.0 1,513.0 2,113.0 1,662.0 May No results Discontinued QTR Average QTR Average 1,369.0 543.0 No results No results No resultsJun No results Discontinued 1357 614 1,767.0 277.0 1,699.0 2,213.0 2,236.0 Jul No results Discontinued QTR Average QTR Average 1,977.0 285.0 No results No results No resultsAug No results Discontinued QTR Average QTR Average 1,943.0 251.0 1,982.0 7,511.0 1,846.0 Sep No results Discontinued 1425 1654 1,457.0 171.0 No results No results No resultsOct No results Discontinued QTR Average QTR Average 1,103.0 152.0 2,033.0 10,190.0 1,970.0 Nov No results Discontinued QTR Average QTR Average 1,442.0 No Flow 2,102.0 434.0 462.0 Dec No results Discontinued 1377 1093 1,953.0 No Flow 2,064.0 809.0 1,567.0 Source: Bi annual reports submitted to ZEMA by the Mining Companies
ANALYSISMinimum value N/A N/A 480.0 87.0 0.1 101.0 1031.0 434.0 462.0Median value N/A N/A 1377.0 1093.0 1442.0 400.0 1513.0 2213.0 1970.0Maximum value N/A N/A 1377.0 1654.0 4230.0 2576.0 2102.0 11,063 10,116.0 Average value N/A N/A 1377.0 879.5 1512.8 738.3 1563.5 3931.4 2838.3
No returns 0 0 0 0 0 0 0 0 0No. Above ZEMA limit N/A N/A N/A N/A 1 0 0 8 5No Measurements 27 0 36 36 1 2 11 9 9
MCM Mufulira- Concentrate smeter shed borehole no. 9

59Management of Environmental Degradation Caused by Mining Activities in Zambia.
Appendix 19
Underground Water Pollution (Other Facilities) – SO4
Name of Facility
Chambishi Copper Smelter- Suphiric acid storage facility
Konkola Copper Mine - Nkana Acid loading bay
Mopani Copper Mine - Mufulira Acid loading bay
borehole no. 16
Mopani Copper Mine - Mufulira Borehole no. 18
between tank hse 5 and refinery change house
Mopani Copper Mine -Nkana oldCVW
Mopani Copper Mine -Nkana colbalt plant
Mopani Copper Mine -Nkana colbalt plant
Deep Shallow Deep Shallow ZEMA statutory limits 1,500 1,500 1,500 1,500 1,500 1,500 1,500 1,500 1,500
2009 Jan Dev YTD Average QTR AverageQTR Average 28.0 871.0 N o results N o results N o resultsFeb Dev YTD Average QTR AverageQTR Average 853.0 786.0 No Results No Results No ResultsMar Dev YTD Average 853 72 28.0 1,159.0 No Results No Results No ResultsApr Dev YTD Average QTR AverageQTR Average 939.0 144.0 No Results No Results No ResultsMay Dev YTD Average QTR AverageQTR Average 782.0 230.0 No Results No Results No ResultsJun Dev YTD Average 316 32 Not sampled Not sampled No Results No Results No ResultsJul No Results YTD Average QTR AverageQTR Average 545.0 96.0 No Results No Results No ResultsAug No Results YTD Average QTR AverageQTR Average 423.0 214.0 No Results No Results No ResultsSep No Results YTD Average 279 11 546.0 82.0 No Results No Results No ResultsOct No Results YTD Average QTR AverageQTR Average 554.0 73.0 No Results No Results No ResultsNov No Results YTD Average QTR AverageQTR Average 877.0 112.0 No Results No Results No ResultsDec No Results YTD Average 321 23 584.0 99.0 No Results No Results No Results
2010 Jan No Results Discountinued QTR AverageQTR Average 720.0 584.0 N o results N o results N o resultsFeb No Results Discountinued QTR AverageQTR Average 1,020.0 556.0 No Results No Results No ResultsMar No Results Discountinued 759 712 544.0 1,179.0 No Results No Results No ResultsApr No Results Discountinued QTR AverageQTR Average 1,247.0 307.0 No Results No Results No ResultsMay No Results Discountinued QTR AverageQTR Average 80.0 173.0 No Results No Results No ResultsJun No Results Discountinued 140 240 485.0 171.0 No Results No Results No ResultsJul No Results Discountinued QTR AverageQTR Average 805.0 142.0 No Results No Results No ResultsAug No Results Discountinued QTR AverageQTR Average 842.0 134.0 No Results No Results No ResultsSep No Results Discountinued 545 645 877.0 290.0 No Results No Results No ResultsOct No Results Discountinued QTR AverageQTR Average 884.0 81.0 No Results No Results No ResultsNov No Results Discountinued QTR AverageQTR Average 38.0 344.0 No Results No Results No ResultsDec No Results Discountinued 1038 581 1,336.0 1,185.0 No Results No Results No Results
2011 Jan No Results Discountinued QTR AverageQTR Average 1,215.0 1,090.0 N o results N o results N o resultsFeb No Results Discountinued QTR AverageQTR Average 79.0 47.0 No Results No Results No ResultsMar No Results Discountinued 636 686 869.0 897.0 No Results No Results No ResultsApr No Results Discountinued QTR AverageQTR Average 807.0 256.0 No Results No Results No ResultsMay No Results Discountinued QTR AverageQTR Average - - No Results No Results No ResultsJun No Results Discountinued - - 1,006.0 56.0 No Results No Results No ResultsJul No Results Discountinued QTR AverageQTR Average 1,079.0 111.0 No Results No Results No ResultsAug No Results Discountinued QTR AverageQTR Average 1,011.0 102.0 No Results No Results No ResultsSep No Results Discountinued 864 959 656.0 77.0 No Results No Results No ResultsOct No Results Discountinued QTR AverageQTR Average 722.0 71.0 No Results No Results No ResultsNov No Results Discountinued QTR AverageQTR Average 652.0 no flow No Results No Results No ResultsDec No Results Discountinued 629 498 879.0 no flow No Results No Results No ResultsSource: Bi annual reports submitted to ZEMA by the Mining Companies
Mopani Copper Mine - Mufulira
Concentrate smeter shed borehole no. 9

Management of Environmental Degradation Caused by Mining Activities in Zambia.60
Appendix 20
Ground Water Pollution (Other Facilities) – TCu
Name of Facility
Chambishi Copper Smelter- Suphiric acid storage facility
Konkola Copper Mine - Nkana SBU Acid offloading Bay
Mopani Copper Mine - Mufulira Acid
loading bay borehole no.
16
Mopani Copper Mine - Mufulira Borehole no. 18
between tank hse 5 and
refinery change house
Mopani Copper Mine -Nkana oldCVW
Mopani Copper Mine -Nkana colbalt plant
Mopani Copper Mine -Nkana colbalt plant
Deep Shallow Deep Shallow ZEMA statutory limits 1.5 1.5 1.5 1.5 1.5 1.5 1.5 1.5 1.5
2009 Jan Dev YTD Average QTR AverageQTR Average 0.6 1.4 3.1 6.5 7.8Feb Dev YTD Average QTR AverageQTR Average 1.9 6.1 3.7 38.2 7.2Mar Dev YTD Average 11 5.8 0.9 5.6 No Results No Results No ResultsApr Dev YTD Average QTR AverageQTR Average 0.7 2.2 2.1 0.4 2.9May Dev YTD Average QTR AverageQTR Average 0.4 0.9 4.4 1 1.4Jun Dev YTD Average 4.7 6.9 No Results No Results 5.8 1.3 1Jul No Results YTD Average QTR AverageQTR Average 1.0 2.1 No Results 0.7 1Aug No Results YTD Average QTR AverageQTR Average 0.9 0.2 3.8 0.6 1Sep No Results YTD Average 4 7.1 4.2 1.9 No Results No Results No ResultsOct No Results YTD Average QTR AverageQTR Average 10.0 1.5 No Results 0.9 1.6Nov No Results YTD Average QTR AverageQTR Average 10.0 3.5 0.9 0.7 2.3Dec No Results YTD Average VandalisedVandalised 12.7 11.8 5.7 7.3 4.6
2010 Jan No Results Discontinued QTR Average QTR Average 7.0 3.0 5.5 52.8 13.5Feb No Results Discontinued QTR Average QTR Average 7.5 0.5 4.5 8.4 30.7Mar No Results Discontinued 2.5 4.0 10.9 5.3 3.7 10.4 43.7Apr No Results Discontinued QTR Average QTR Average 11.0 10.7 3.6 50 9.7May No Results Discontinued QTR Average QTR Average 9.2 3.3 3.2 55.5 10.8Jun No Results Discontinued 3.7 3.7 11.5 1.7 3.3 60 14.1Jul No Results Discontinued QTR Average QTR Average 7.5 1.1 3.2 58.5 27.2Aug No Results Discontinued QTR Average QTR Average 9.8 2.7 2.1 118.0 6.6Sep No Results Discontinued 3.2 3.4 8.9 1.0 96.9 98.0 29Oct No Results Discontinued QTR Average QTR Average 7.4 5.3 7.0 63.0 2.7Nov No Results Discontinued QTR Average QTR Average 2.3 8.7 0.9 0.5 0.8Dec No Results Discontinued 4.5 2.6 4.1 19.0 1.0 0.8 1.0
2011 Jan No Results Discontinued QTR Average QTR Average 3.7 3.3 12.3 6.7Feb No Results Discontinued QTR Average QTR Average 1.9 1.6 4.3 20.1 7.5Mar No Results Discontinued 2.9 5 0.7 1.9 2.8 20.8 4.5Apr No Results Discontinued QTR Average QTR Average 0.3 0.8 4.9 3.4 0.2May No Results Discontinued QTR Average QTR Average 0.4 0.5 7.8 0.4 0.3Jun No Results Discontinued 4.3 4.6 Not sampled 0.2 5.8 12.6 1.2Jul No Results Discontinued QTR Average QTR Average 1.0 1.2 * * *Aug No Results Discontinued QTR Average QTR Average 0.7 6.3 4.0 24.9 6.9Sep No Results Discontinued 7.5 6.5 0.2 4.7 * * *Oct No Results Discontinued QTR Average QTR Average <0.1 5.4 5.3 30.8 9.8Nov No Results Discontinued QTR Average QTR Average 0.9 No flow 6.1 <0.1 <0.1Dec No Results Discontinued 1.6 1.6 3.7 No flow 5.0 30.1 7.0
Source: Bi annual reports submitted to ZEMA by the Mining CompaniesNo Bore Hole means the bore hole had not yet been sunk.No sample means that the mines did not submit test resultsYTD average means that the mine submited the annual averages instead of the monthly averaagesANALYSIS
Minimum value N/A N/A 1.6 1.6 0.2 0.2 0.9 0.4 0.2Median value N/A N/A 4.0 4.6 3.0 2.2 3.9 12.3 6.6Maximum value N/A N/A 11.0 7.1 12.7 19.0 96.9 118.0 43.7Average value N/A N/A 4.5 4.7 4.7 3.8 7.1 25.4 8.5
No returns/results N/A N/A 0 0 1 1 4 2 2No. Above ZEMA limit N/A N/A 11 11 19 22 27 21 22
Mopani Copper Mine - Mufulira Concentrate smeter shed borehole
no. 9

61Management of Environmental Degradation Caused by Mining Activities in Zambia.
Appendix 21
Ground Water Pollution (Dumps) – TCo
Name of Facility
Chambishi Copper Smelter Suphiric acid storage facility
Mopani Copper Mine
- Mufulira Acid loading bay borehole
no. 16
Mopani Copper Mine - Mufulira Borehole no. 18
between tank hse 5 and refinery change house
Mopani Copper Mine -Nkana oldCVW
Mopani Copper Mine -Nkana colbalt plant
Mopani Copper Mine -Nkana colbalt plant
Deep Shallow Deep Shallow ZEMA statutory limits 1.0 1.0 1.0 1.0 1.0 1.0 1.0 1.0
2009 Jan Dev QTR Average QTR Average <0.1 <0.1 1.1 444.2 276.8 Feb Dev QTR Average QTR Average <0.1 <0.1 1.3 130.0 110.0 Mar Dev <0.1 <0.1 <0.1 <0.1 No Results No Results No ResultsApr Dev QTR Average QTR Average <0.1 <0.1 0.9 16.3 33.4 May Dev QTR Average QTR Average 0.1 <0.1 1.3 13.6 14.4 Jun Dev <0.1 <0.1 No Results No Results 1.4 28.4 9.1 Jul No Results QTR Average QTR Average 0.1 0.1 No Results 7.9 21.2 Aug No Results QTR Average QTR Average <0.1 <0.1 0.8 7.6 21.2 Sep No Results <0.1 <0.1 0.1 <0.1 No Results No Results No ResultsOct No Results QTR Average QTR Average <0.1 <0.1 No Results 6.3 47.5 Nov No Results QTR Average QTR Average 0.3 <0.1 0.4 5.8 56.0 Dec No Results Vandalised Vandalised 0.2 <0.1 1.6 290.3 93.6
2010 Jan No Results QTR Average QTR Average <0.1 <0.1 1.2 3,992.3 347.9 Feb No Results QTR Average QTR Average 0.1 0.1 1.0 295.1 1,780.7 Mar No Results <0.1 <0.1 0.4 0.4 1.3 320.1 1,884.3 Apr No Results QTR Average QTR Average 0.4 0.2 0.9 2,200.0 183.0 May No Results QTR Average QTR Average 0.3 0.1 0.6 2,342.5 232.0 Jun No Results <0.1 <0.1 0.2 <0.1 1.0 4,200.0 298.0 Jul No Results QTR Average QTR Average 0.3 <0.1 0.4 3,029.3 1,215.0 Aug No Results QTR Average QTR Average 0.5 <0.1 0.8 2,402.0 210.0 Sep No Results <0.1 0.1 0.3 0.1 30.0 1,340.0 2,781.0 Oct No Results QTR Average QTR Average 0.2 0.1 1.8 515.0 160.0 Nov No Results QTR Average QTR Average <0.1 <0.1 0.7 24.0 92.5 Dec No Results <0.1 <0.1 <0.1 <0.1 0.7 2.9 90.9
2011 Jan No Results QTR Average QTR Average 0.1 <0.1 0.6 320.0 151.0 Feb No Results QTR Average QTR Average 0.1 0.4 1.2 910.0 2.3 Mar No Results <0.1 0.1 0.1 0.1 0.3 1,570.0 96.7 Apr No Results QTR Average QTR Average <0.1 <0.1 1.2 75.4 9.4 May No Results QTR Average QTR Average <0.1 <0.1 1.0 14.0 13.8 Jun No Results <0.1 <0.1 <0.1 <0.1 0.8 157.0 34.9 Jul No Results QTR Average QTR Average 0.1 <0.1 No Results No Results No ResultsAug No Results QTR Average QTR Average <0.1 <0.1 0.2 112.3 45.3 Sep No Results <0.1 <0.1 <0.1 <0.1 No Results No Results No ResultsOct No Results QTR Average QTR Average <0.1 <0.1 0.6 123.1 78.6 Nov No Results QTR Average QTR Average 0.1 No flow 0.6 <0.1 <0.1 Dec No Results <0.1 <0.1 <0.1 No flow 0.5 58.6 51.7
Source: Bi annual reports submitted to ZEMA by the Mining CompaniesANALYSISMinimum value N/A N/A 0.1 0.1 0.1 0.2 2.9 2.3Median value N/A N/A 0.1 0.2 0.1 0.9 157.0 92.5Maximum value N/A N/A 0.1 0.5 0.4 30.0 4200.0 2781.0Average value N/A N/A 0.1 0.2 0.2 1.9 805.0 336.8
No returns/results N/A N/A 0 1 1 6 4 4No. Above ZEMA limit 0 0 0 0 0 11 31 31No Measurements 0 0 0 0 0 0 0 0No. 30x above limit 0 0 0 0 0 0 21 24
Mopani Copper Mine - Mufulira Concentrate
smeter shed borehole no. 9

Management of Environmental Degradation Caused by Mining Activities in Zambia.62
Appendix 22
Underground Water Pollution (Other facilities) – TMn
Name of Facility
Chambishi Copper Smelter Suphiric acid storage facility
Konkola Copper Mine - Nkana Acid loading Bay
Mopani Copper Mine -
Mufulira Acid
loading bay
borehole no. 16
Mopani Copper Mine -
Mufulira Borehole
no. 18 between
tank hse 5 and
refinery change house
Mopani Copper Mine -Nkana oldCVW
Mopani Copper Mine -Nkana colbalt plant
Mopani Copper Mine -Nkana colbalt plant
Deep Shallow Deep Shallow ZEMA statutory limits 1.0 1.0 1.0 1.0 1.0 1.0 1.0 1.0 1.0
2009 Jan Dev YTD AverageQTR Average QTR Average 0.6 0.6 3.2 18.9 10.4 Feb Dev YTD AverageQTR Average QTR Average 0.7 0.7 5.9 6.5 6.0 Mar Dev YTD Average 1.7 0.4 1.4 1.4 No ResultsNo ResultsNo ResultsApr Dev YTD AverageQTR Average QTR Average 0.2 0.2 9.0 0.9 3.9 May Dev YTD AverageQTR Average QTR Average <0.1 <0.1 4.4 0.5 1.0 Jun Dev YTD Average 1.2 <0.1 No ResultsNo Results 7.4 3.9 1.0 Jul No ReturnYTD AverageQTR Average QTR Average 0.1 0.5 No Results 0.6 2.1 Aug No ReturnYTD AverageQTR Average QTR Average <0.1 0.7 2.2 0.6 2.2 Sep No ReturnYTD Average 1.3 <0.1 1.4 0.1 No ResultsNo ResultsNo ResultsOct No ReturnYTD AverageQTR Average QTR Average 2.6 0.2 No Results 0.9 3.5 Nov No ReturnYTD AverageQTR Average QTR Average 2.6 0.4 0.8 0.9 4.2 Dec No ReturnYTD AverageVandalisedVandalised 3.5 4.4 3.1 15.1 5.4
2010 Jan No ReturnDiscontinuedQTR Average QTR Average 0.5 1.5 3.1 178.0 12.7 Feb No ReturnDiscontinuedQTR Average QTR Average 3.0 0.3 1.1 11.3 123.6 Mar No ReturnDiscontinued 0.3 0.3 3.8 0.9 0.9 12.6 157.3 Apr No ReturnDiscontinuedQTR Average QTR Average 0.1 3.7 1.7 180.0 9.6 May No ReturnDiscontinuedQTR Average QTR Average 2.9 1.1 2.5 235.8 19.9 Jun No ReturnDiscontinued 0.9 <0.1 3.6 1.3 2.4 230.0 15.6 Jul No ReturnDiscontinuedQTR Average QTR Average 3.2 0.6 1.9 181.5 10.4 Aug No ReturnDiscontinuedQTR Average QTR Average 3.4 1.0 2.0 205.0 8.8 Sep No ReturnDiscontinued 0.2 1.1 2.7 0.5 2.1 9.1 176.0 Oct No ReturnDiscontinuedQTR Average QTR Average 2.5 1.7 7.9 14.1 0.9 Nov No ReturnDiscontinuedQTR Average QTR Average <0.1 2.2 3.0 9.0 51.0 Dec No ReturnDiscontinued<0.1 <0.1 <0.1 5.2 0.3 0.4 0.6
2011 Jan No ReturnDiscontinuedQTR Average QTR Average 0.3 1.2 2.0 31.0 9.3 Feb No ReturnDiscontinuedQTR Average QTR Average 0.1 0.3 4.0 29.4 12.4 Mar No ReturnDiscontinued 0.8 1.5 0.4 0.5 1.9 90.0 7.1 Apr No ReturnDiscontinuedQTR Average QTR Average 0.1 0.6 3.1 9.8 0.9 May No ReturnDiscontinuedQTR Average QTR Average 0.1 0.3 4.2 1.4 1.3 Jun No ReturnDiscontinued 0.7 1.2 0.3 0.3 3.2 21.3 3.5 Jul No ReturnDiscontinuedQTR Average QTR Average 0.2 0.2 No ResultsNo ResultsNo ResultsAug No ReturnDiscontinuedQTR Average QTR Average 0.2 2.3 1.8 40.0 12.3 Sep No ReturnDiscontinued 1.0 1.7 0.2 1.7 No ResultsNo ResultsNo ResultsOct No ReturnDiscontinuedQTR Average QTR Average <0.1 1.4 3.3 18.1 10.1 Nov No ReturnDiscontinuedQTR Average QTR Average <0.1 No flow 3.6 2.1 0.6 Dec No ReturnDiscontinued 0.9 0.9 <0.1 No flow 2.2 50.1 11.9
Source: Bi annual reports submitted to ZEMA by the Mining CompaniesDATA ANALYSISMinimum value N/A N/A 0.2 0.3 0.1 0.1 0.3 0.4 0.6Median value N/A N/A 0.9 1.1 0.7 0.7 2.8 13.4 8.0Maximum value N/A N/A 1.7 1.7 3.8 5.2 9.0 235.8 176.0Average value N/A N/A 0.9 1.0 1.5 1.2 3.1 50.3 21.7
No returns/results N/A N/A 0 0 1 1 6 4 4No. Above ZEMA limit 0 0 3 4 13 13 27 25 26
Mopani Copper Mine - Mufulira
Concentrate smeter shed
borehole no. 9

63Management of Environmental Degradation Caused by Mining Activities in Zambia.
Appendix 23
Ground Water Pollution (Dumps) – TFe
Name of Facility
Chambishi Copper Smelter Suphiric acid storage facility
Konkola Copper Mine - Nkana SBU Acid loding Bay
Mopani Copper Mine
- Mufulira Acid loading bay borehole
no. 16
Mopani Copper Mine -
Mufulira Borehole no. 18 between tank hse 5
and refinery change house
Mopani Copper Mine -Nkana oldCVW
Mopani Copper Mine -Nkana colbalt plant
Mopani Copper Mine -Nkana colbalt plant
Deep Shallow Deep Shallow ZEMA statutory limits 2.0 2.0 2.0 2.0 2.0 2.0 2.0 2.0 2.0
2009 Jan Dev YTD Average QTR Average QTR Average 1.0 1.6 6.9 1 4.7Feb Dev YTD Average QTR Average QTR Average <0.1 0.3 14.1 1.5 2.4Mar Dev YTD Average 2.9 4.2 <0.1 28.8 No results No results No resultsApr Dev YTD Average QTR Average QTR Average <0.1 63.3 3.2 0.4 3.2May Dev YTD Average QTR Average QTR Average <0.1 <0.1 4.3 0.9 1.6Jun Dev YTD Average 0.9 7.6 No results No results 5.1 0.9 1.9Jul Not sampled YTD Average QTR Average QTR Average 0.2 12.5 No results 0.1 0.1 Aug Not sampled YTD Average QTR Average QTR Average <0.1 7.0 0.3 0.1 0.1 Sep Not sampled YTD Average 1.7 0.7 0.4 2.0 No results No results No resultsOct Not sampled YTD Average QTR Average QTR Average 0.1 5.8 No results 1.7 1.0 Nov Not sampled YTD Average QTR Average QTR Average 0.7 28.1 1.6 1.8 11.7 Dec Not sampled YTD Average 1.7 5 0.8 147.0 1.3 0.8 1.0
2010 Jan Not sampled Discontinued QTR Average QTR Average 0.4 0.3 20.9 27.6 34.3 Feb Not sampled Discontinued QTR Average QTR Average 0.7 5.0 28.9 2.3 14.1 Mar Not sampled Discontinued 2.7 6.5 0.2 29.4 23.4 3.2 18.7 Apr Not sampled Discontinued QTR Average QTR Average <0.1 71.2 18.3 20.1 9.4 May Not sampled Discontinued QTR Average QTR Average <0.1 14.6 10.9 4.3 4.2 Jun Not sampled Discontinued 0.1 6.5 0.2 10.4 5 2.2 12.9 Jul Not sampled Discontinued QTR Average QTR Average 0.3 11.8 0.1 0.3 0.1 Aug Not sampled Discontinued QTR Average QTR Average 1.0 14.8 0.3 2.1 0.4 Sep Not sampled Discontinued 1.4 1.5 0.2 6.1 15.1 0.3 10.1 Oct Not sampled Discontinued QTR Average QTR Average 0.3 29.4 0.3 0.2 0.1 Nov Not sampled Discontinued QTR Average QTR Average 0.5 52.4 <0.1 <0.1 <0.1Dec Not sampled Discontinued 5.9 <0.1 0.9 214.0 <0.1 <0.1 <0.1
2011 Jan Not sampled Discontinued QTR Average QTR Average 0.3 20.9 <0.1 1 0.9 Feb Not sampled Discontinued QTR Average QTR Average 0.3 5.0 10.9 4.3 14.1 Mar Not sampled Discontinued 0.5 0.7 0.1 6.7 <0.1 1.6 0.9 Apr Not sampled Discontinued QTR Average QTR Average 0.3 1.8 0.3 0.2 0.2 May Not sampled Discontinued QTR Average QTR Average 0.3 0.8 1.3 0.7 1.2 Jun Not sampled Discontinued 0.5 0.3 0.8 1.0 <0.1 0.6 20.0 Jul Not sampled Discontinued QTR Average QTR Average 0.3 4.7 No results No results No resultsAug Not sampled Discontinued QTR Average QTR Average 1.8 41.6 <0.1 0.2 <0.1 Sep Not sampled Discontinued 7.3 5 0.9 24.2 No results No results No resultsOct Not sampled Discontinued QTR Average QTR Average 0.1 1.2 0.7 1.2 0.3 Nov Not sampled Discontinued QTR Average QTR Average 3.5 No flow 0.3 0.5 1.6 Dec Not sampled Discontinued 0.8 1.7 3.8 No flow 17.4 14.2 10.1
No of times higher - rangeSource: Bi annual reports submitted to ZEMA by the Mining CompaniesANALYSISMinimum value N/A N/A 0.1 0.3 0.1 0.3 0.1 0.1 0.1Median value N/A N/A 1.6 4.2 0.4 11.1 4.7 1.0 1.9Maximum value N/A N/A 7.3 7.6 3.8 214.0 28.9 27.6 34.3Average value N/A N/A 2.2 3.6 0.7 27.0 8.0 3.2 6.3
No returns/results N/A N/A 0 0 1 1 6 4 4No. Above ZEMA limit 0 0 4 6 2 24 14 9 14
Mopani Copper Mine - Mufulira
Concentrate smeter shed
borehole no. 9

Management of Environmental Degradation Caused by Mining Activities in Zambia.64
Appendix 24
Assessment of Tailings Storage Facilities (Dumps/dams)
Name ofMine
Name ofFacility
Dump status
Restricted access
Hazardous and warningsigns
Drainages in goodcondition / Nosinkholes / Notension cracks
Evidence ofgullies
Evidence ofvegetation
Pollution ofsurrounding areas e.g. dust
Illegal waste disposal
Pollution ofsurface water
Pollution of ground waterResidential areaswithin 500metres fromthe dam wall
Bwana Mkubwa Mining Limited
Tailings DamNo. 5A and5B
ActiveAccess isrestricted
There are nohazardous andsafety signs
There are lineddrains.Some toe drainageshave overgrownvegetation
Few gullies onthe northeastern section of thedump.
Vegetation along themain eastern walland the lower part ofthe western flank isemerging andestablishing. However, thenorthern and otherwalls remaingenerally bare.
There areincidences offugitive dust fromthe bare tailingssurfaces.
NoneThere is no effluentdischarge to theenvironment
The collected effluent fromthe plant including runoff ishighly acidic and requiresneutralizationThe monitoring results frombore hole 2,5 and10 showedinstances of high aciditylevels i.e. pH belowminimum levels of 6,highTDS,DCu,DFe and DMn
Although the nearestcommunity is said to be5km away, there havebeen complaints of waterpollution in theMukulungwe stream bythe residents ofMukulungwe farms.
Tailings DamNo. 4
ReclaimedAccess isrestricted
There are nohazardous andsafety signs
Storm waterdiversion channelswere seen.
The dam wasreclaimed
Poorly vegetated High possibility ofdust due tosparse vegetation
NoneThere is no effluentdischarge to theenvironment
The monitoring results frombore hole 4,9 and 13showed instances of highacidity levels i.e. pH belowminimum levels of 6,highTDS,TSS,DCu,DFe,EC andDMn
Although the nearestcommunity is said to be5km away, there havebeen complaints of waterpollution in theMukulungwe stream bythe residents ofMukulungwe farms.
Luanshya Copper MinePlc
Musi TailingsDam
ActiveUnrestricted access to thesite
No safety andhazardous signswere seen
Lined drains wereseen
Gully formation onthe dam waspronounced.
Eastern wall of thedump is sparselyvegetated
Dust emissionswere high asmost parts of thedam are bare
NoneNo bi annualssubmitted
Contrary to regulations, noground water monitoringwas conducted for theperiod 2010 - 2011
No residential areaswithin 500m radius.
Lumwana Mining Company
Copper Tailing Dump
Active yes yes
Dam had water thatthe mine wasrequesting ZEMA torelease to theenvironment as it was compromising thestability of the dump
Nono dump stilllow(new)
No No
according to ZEMA report Dated April2010 water wasreleased toLumwana riverwithout licencebetween April 2009and April 2010.
No borehole resultsNo statutory dump report
No but Lumwana riverwas accessed by locals
Chambeshi Metals Plc
Chambishi Metals Tailings Storage Facility
ActiveAccess notrestricted
Hazardous andsafety signswere seen.
Drainages areunderground and arein good condition
None
The walls are barewith very littlevegetation in isolatedplaces
No incidences ofwind-blown erosion.
None
The effluentdischarge from thetailings dam is sentto a return waterpond and back tothe plant.
Test results show that allparameters are compliantwith statutory limits
None

65Management of Environmental Degradation Caused by Mining Activities in Zambia.
Appendix 24 (Cont)
Assessment of Tailings Storage Facilities(Dumps/dams)
Name ofMine
Name ofFacility
Dump status
Restricted access
Hazardous and warningsigns
Drainages in goodcondition / Nosinkholes / Notension cracks
Evidence ofgullies
Evidence ofvegetation
Pollution ofsurrounding arease.g. dust
Illegal waste disposal
Pollution of surfacewater
Pollution of ground waterResidential areaswithin 500metres fromthe dam wall
Chambishi Copper Smelter
Slag Dump Active no only at theentrance to thedup
None No dump reportDump dicharges in luelastream
Approximately 700m arefarms
Mopani Copper Mines
Plc-NkanaTD 15 A active
northern side has borrow pits caused by illigal mining and are
no adequate sinage to keep away people
the picolo dicant discharges into unlined drains
gullies on the access ramps
Generally well vegetated except for the western wall. The vegitation in the western wall are covered in
Yes from the top beaches that can not be revegetated as the dump is still active. No wind breaks erected. Dust is impacting the no
Piccolo dicant drains into the Fikondo stream
Some element of high TMn in borehole test results
5km from kalulushi township. Squatter compound was found about 300m from the edge of the dump.
Mopani Copper Mines Plc-Mufulira
TD 11 active yes yes ok no
the south wall upto south west is largely bare but other areas are well vegetated
yes from the top beaches that can not be revegetated as the dump is still active. No wind breaks erected. Dust is impacting the surounding vegetation.
no
Seepage from filters drain directly into the mufulira stream. Spillway dicants into the mufulira stream. Discharge from both spillway and seepage has evidence of High TMn and Tfe
test results from borehole has evidence of High TMn and Tfe.
Approximately 2km from the closest town ship.
Konkola Copper MinePlc-Konkola IBU
Lubengele Tailings Dam-Dump C
No restrictedaccess to thedump. Therewas evidenceof peoplefishing, bathing andwashing.
There are nohazardous andwarning signsdisplayed
few erosiongullies wereobserved
Downstream slopesare well vegetatedhowever the flanksand upper slopeshave patches of barefaces
Wind erosion hascontinued to affect thebeach areas
None
• Instances of highelevation of totalsuspended solids,Total iron, TotalCobalt and TotalCopper· Evidence of finetailings silting thedownstream areas.
Instances of pH and TotalCopper being outside theapproved parameters
None
Konkola Copper MinePlc-Nchanga IBU
Tailings Dump No. 7
Not assessed Not assessed
The bareslopes of theembankments are characterized with numerous gullies extending down to thetoe area.
The top parts of theembankment aregenerally wellvegetated with treesand grass while therest of the slopes aregenerally bare withno vegetation cover.
Windblown dust is likelyto be generated frombare exposed tailingssurfaces but its impacton human settlementsare deemed to beinsignificant.
None
The dump materialdoes not generateacidic drainage, andsubsequently, metalleaching is notexpected. No waterpollution is expectedfrom the currentsetting.
None
The dump is locatedapproximately 3km northwest of the nearest township.
Kamana North Dump(TD3)
Not assessed Not assessed None
The top surface iswell vegetatedthrough naturalcolonization while theslopes are poorlyvegetated.
None None None. NoneThe dump is located over2km West of the nearestfarm settlement.
NoneThe dump surfaces arewell vegetated apartfrom a patch on thewestern side, and thesetting and condition ofthe dump mean thatthere is littlesusceptibility to dustblows.
Mutimpa Tailings Dam(TD 5)
No restrictedaccess
No hazardousand warningsigns
Evidence ofgullies on thewestern side
Eastern sidevegetated butwestern side wasbare
Wind erosion hascontinued to affect thewestern side which isbare
None
Siltation of MutimpaStream was noticed.In addition effluentdischarged from theMuntimpa Spillway tothe Muntimpa Streamwas non complaintwith respect to TDS,Fe and Mn.
Out of the parametersmonitored pH was noncompliant
Confirm with dumpreports
Kansanshi Mining Plc
Kansanshi Sulphide Tailings Storage
Yes
There are nohazardous andwarning signsdisplayed
few erosiongullies wereobserved
Toe areas are wellvegetated with grassand trees. The topsurfaces where thereis still deposition isbare.
Wind erosion hascontinued to affect thebeach surface during dry season and dustgenerated along accessroads.
None
The current setting ofthe TSF does notpose significantsurface waterpollution contamination risks.
The current setting of theTSF does not posesignificant ground waterpollution contaminationrisks.
None
TD4 Not assessed None None NoneNot assessedSevere erosion gullies
Surfaces wellestablished vegetation and nofurther re-vegetationrequired presentpending reclamation
None

Management of Environmental Degradation Caused by Mining Activities in Zambia.66
Appendix 24 (Cont)Assessment of Tailings Storage Facilities(Dumps/dams)
Name ofMine
Name ofFacility
Dump status
Restricted access
Hazardous and warningsigns
Drainages in goodcondition / Nosinkholes / Notension cracks
Evidence ofgullies
Evidence ofvegetation
Pollution ofsurrounding areas e.g. dust
Illegal waste disposal
Pollution ofsurface water
Pollution of ground waterResidential areaswithin 500metres fromthe dam wall
TD4 Not assessed Not assessedSevere erosion gullies
Surfaces wellestablished vegetation and nofurther re-vegetationrequired presentpending reclamation
NoneThe dumpsurfaces are wellvegetated apartfrom a patch onthe western side,and the settingand condition ofthe dump meanthat there is littlesusceptibility todust blows.
None None None None
Mutimpa Tailings Dam(TD 5)
No restrictedaccess
No hazardousand warningsigns
Evidence ofgullies on thewestern side
Eastern sidevegetated butwestern side wasbare
Wind erosion hascontinued toaffect thewestern sidewhich is bare
None
Siltation of Mutimpa Stream wasnoticed. In additioneffluent dischargedfrom the MuntimpaSpillway to theMuntimpa Streamwas non complaintwith respect toTDS, Fe and Mn.
Out of the parametersmonitored pH was noncompliant
Confirm with dumpreports
Kansanshi Mining Plc
Kansanshi Sulphide Tailings Storage
Yes
There are nohazardous andwarning signsdisplayed
few erosiongullies wereobserved
Toe areas are wellvegetated with grassand trees. The topsurfaces where thereis still deposition isbare.
Wind erosion hascontinued toaffect the beachsurface duringdry season anddust generatedalong accessroads.
None
The current settingof the TSF does notpose significantsurface waterpollution contamination risks.
The current setting of theTSF does not posesignificant ground waterpollution contaminationrisks.
None
Kansanshi Oxide Tailings Storage Facility
Yes
There are nohazardous andwarning signsdisplayed
None
Dump is active andtop surface cannotbe rehabilitated.Progressive plantingof self sustaining onthe downstreamfaces of the earth hillembankment willcommence.
None None None None
Chibuluma Mine
Chibuluma South TailingsDump
No restrictedaccess
Displayed None
The toe area waswell vegetated butthe top embankmentsand bench werebare.
Large quantitiesof dust emanatingfrom the dumpand the mostaffected community is thePwele village.
None
Settling pond highlysilted henceoverflow was notclear indicatingpresence of hightotal suspendedsolids
Pwele Village is within100meters away from thedump.
Chibuluma Tailings Dam No. 1
No restrictedaccess
There are nohazardous andwarning signsdisplayed
Eastern embankment highly erodedand vandalized byillegal stonecrushers
No vegetation on thetop beach
Too much dustand the townbeing affected isKalulushi township
The dump isdecommissioned and there was nowater discharge
No ground water monitoring tests
Kalulushi township
Chibuluma Tailings Dump No. 2
No restrictedaccess-the waste rockbuttresses was beingillegally reclaimed thereby exposing thetailings to theenvironment
There are nohazardous andwarning signsdisplayed
The dumpwalls wereinaccessible as there wasno roadaccess.
No vegetation on thetop beach
Too much dustand the townbeing affected is
There wasillegal dumping ofdomestic waste.
The dump isdecommissioned and there was nowater discharge
No ground water monitoring tests
Kalulushi township
NFC AfricaMining Plc
Tailings Dump No. 6
ActiveAccess is notrestricted
No warning andhazardous signsseen.
The toe drain isovergrown with grassand this may impedethe design function.Unlined drains fromthe metallurgicalprocessing plant areused to feed effluentinto the dump.
The Northernpart of thedump plateauis gullied
Vegetation on isbeginning to takehold on eastern sideand the dumpsurface is sparselyvegetated
Discharge from thedecant into theChambeshi streamwas clouded withtailings material.This meant that thetailings are findingtheir way to thenew dambo-thenatural bio filter forthe area.
There are no residentialareas within the statedradius.
Luano Tailings Dump(TD16)
Decommissioned
Access notrestricted
Vegetable gardens wereseen at thetoe of thedump
No warning andhazardous signsseen.
The toe drains are ingood condition.However, the easternends require clearingof overgrown grass
None
The eastern side ofdump is well withgrass and occasionalshrubs. The retainingwalls are wellvegetated with grassand some shrubsThe central andwestern parts havescanty vegetation.
There wasillegal dumping ofdomestic waste.
No bi annuals
There are settlementswithin 500M of the dam.The dump was reclaimedon the eastern side bySino metals .Thisreclamation has leftburrow pits which arenow filled with water.This is a health hazard tolocal children.
Musakashi Tailings Dump (TD19)
ActiveAccess notrestricted
No warning andhazardous signsseen.
Spillway is lined NoneVegetation hasbegun to take hold onthe dam wall slopes
None None None
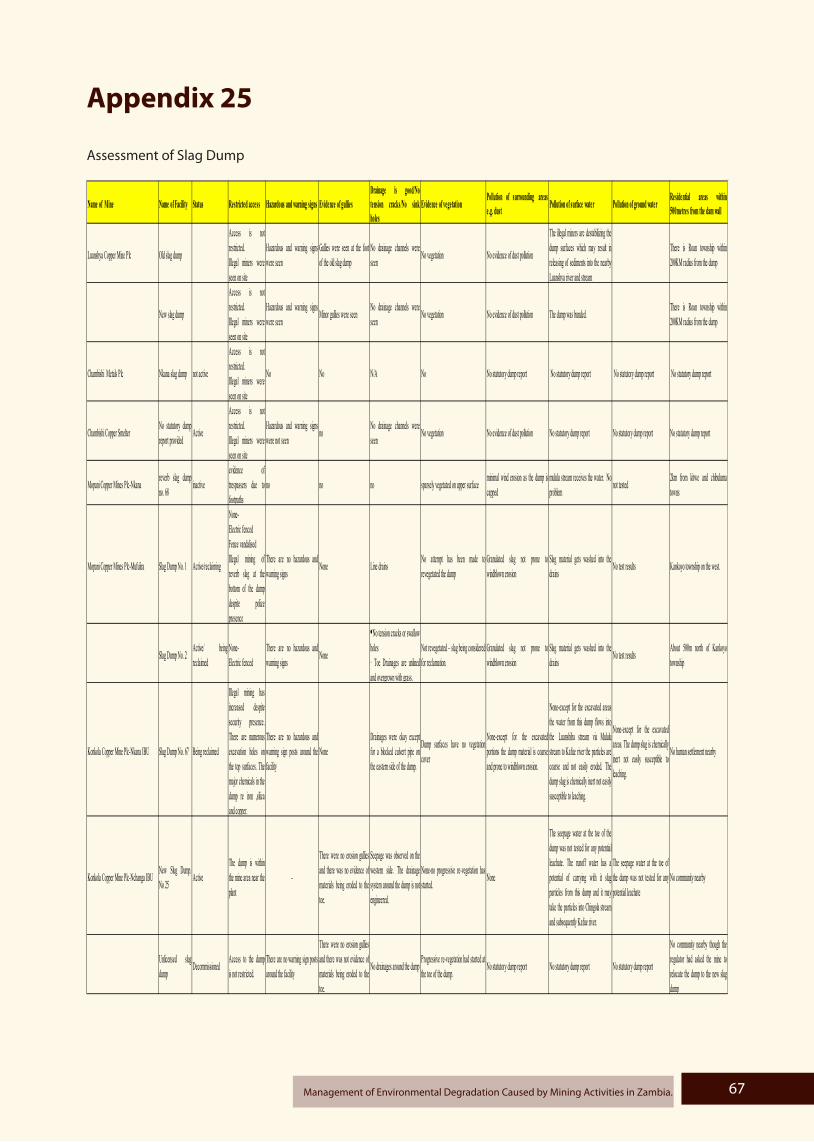
67Management of Environmental Degradation Caused by Mining Activities in Zambia.
Appendix 25
Assessment of Slag Dump
Name of Mine Name of Facility Status Restricted access Hazardous and warning signs Evidence of gulliesDrainage is good/Notension cracks/No sinkholes
Evidence of vegetationPollution of surrounding arease.g. dust Pollution of surface water Pollution of ground water
Residential areas within500metres from the dam wall
Luanshya Copper Mine Plc Old slag dump
Access is notrestricted.Illegal miners wereseen on site
Hazardous and warning signswere seen
Gullies were seen at the footof the old slag dump
No drainage channels wereseen
No vegetation No evidence of dust pollution
The illegal miners are destabilizing thedump surfaces which may result inreleasing of sediments into the nearbyLuanshya river and stream
There is Roan township within200KM radius from the dump
New slag dump
Access is notrestricted.Illegal miners wereseen on site
Hazardous and warning signswere seen
Minor gullies were seenNo drainage channels wereseen
No vegetation No evidence of dust pollution The dump was bunded.There is Roan township within200KM radius from the dump
Chambishi Metals Plc Nkana slag dump not active
Access is notrestricted.Illegal miners wereseen on site
No No N/A No No statutory dump report No statutory dump report No statutory dump report No statutory dump report
Chambishi Copper SmelterNo statutory dumpreport provided
Active
Access is notrestricted.Illegal miners wereseen on site
Hazardous and warning signswere not seen
noNo drainage channels wereseen
No vegetation No evidence of dust pollution No statutory dump report No statutory dump report No statutory dump report
Mopani Copper Mines Plc-Nkanareverb slag dumpno. 68
inactiveevidence oftrespassers due tofootpaths
no no no sparsely vegetated on upper surfaceminimal wind erosion as the dump iscapped
mululu stream receives the water. Noproblem
not tested2km from kitwe and chibulumatowns
Mopani Copper Mines Plc-Mufulira Slag Dump No. 1 Active/reclaiming
None-Electric fencedFence vandalisedIllegal mining ofreverb slag at thebottom of the dumpdespite policepresence
There are no hazardous andwarning signs
None Line drainsNo attempt has been made torevegetated the dump
Granulated slag not prone towindblown erosion
Slag material gets washed into thedrains
No test results Kankoyo township on the west.
Slag Dump No. 2Active/ beingreclaimed
None-Electric fenced
There are no hazardous andwarning signs
None
• No tension cracks or swallow holes· Toe Drainages are unlinedand overgrown with grass.
Not revegetated – slag being considered for reclamation.
Granulated slag not prone towindblown erosion
Slag material gets washed into thedrains
No test resultsAbout 500m north of Kankoyotownship
Konkola Copper Mine Plc-Nkana IBU Slug Dump No. 67 Being reclaimed
Illegal mining hasincreased despitesecurity presence.There are numerousexcavation holes onthe top surfaces. Themajor chemicals in thedump re iron ,silicaand copper.
There are no hazardous andwarning sign posts around thefacility
NoneDrainages were okay exceptfor a blocked culvert pipe onthe eastern side of the dump.
Dump surfaces have no vegetationcover
None-except for the excavatedportions the dump material is coarseand prone to windblown erosion.
None-except for the excavated areasthe water from this dump flows intothe Luanshiba stream via Mululustream to Kafue river the particles arecoarse and not easily eroded. Thedump slug is chemically inert not easilysusceptible to leaching.
None-except for the excavatedareas. The dump slug is chemicallyinert not easily susceptible toleaching.
No human settlement nearby
Konkola Copper Mine Plc-Nchanga IBUNew Slug Dump.No 25
ActiveThe dump is withinthe mine area near the plant
-
There were no erosion gulliesand there was no evidence ofmaterials being eroded to thetoe.
Seepage was observed on thewestern side. The drainagesystem around the dump is notengineered.
None-no progressive re-vegetation hasstarted.
None
The seepage water at the toe of thedump was not tested for any potentialleachate. The runoff water has apotential of carrying with it slugparticles from this dump and it maytake the particles into Chingola streamand subsequently Kafue river.
The seepage water at the toe ofthe dump was not tested for anypotential leachate
No community nearby
Unlicensed slugdump
DecommissionedAccess to the dumpis not restricted.
There are no warning sign postsaround the facility
There were no erosion gulliesand there was not evidence ofmaterials being eroded to thetoe.
No drainages around the dumpProgressive re-vegetation had started atthe toe of the dump.
No statutory dump report No statutory dump report No statutory dump report
No community nearby though theregulator had asked the mine torelocate the dump to the new slugdump

Management of Environmental Degradation Caused by Mining Activities in Zambia.68
Appendix 26
Assessment of Overburden Dumps
Name of Mine Name ofFacility
Status Restricted access
Hazardous and warning signs Evidence of gullies Drainage is good/No tensioncracks/No sink holes
Evidence of vegetationPollution ofsurrounding areas e.g. dust
Pollution ofsurface water
Pollution ofground water
Residential areaswithin 500metresfrom the dam wall
Lumwana Mining Company Active yes No No No statutory dump reports Partially some section were barevegetated
No statutory dumpreports
No statutorydump reports
No statutorydump reports
No
Konkola Copper Mine Plc-Nchanga IBUOverburden No. 23
Access is notrestricted.
There are no warning sign postsaround the facility
Plain wall very steep Numerous gullies onthe northern and eastern side. Active gullyon the lower slope of the rump and thematerials has been washed into the toeroad and Nchanga stream diversion
There is no side drain beside thebund wall.
The toe and southern part arewell vegetated. The northern,Some sections of western frontand top surfaces are still bare.
Potential forgeneration of dustfrom fine materialsand couldpotentially impactthe township closeto the dumpnamely KabundiEast andKabuta/Kapisha townships and tothe East ofMuzabwela township.
The run offalong the toeroad s cuttingnew flowchannels alongthe bund into the Nchanga stream.Suspended siltmaterial polluting the Nchangastream end uppolluting theKafue river.
None
North of KabundiEast andKabuta/Kapisha townships and tothe East ofMuzabwela township
The dump is generally poorlyvegetated. There is novegetation cover on the westernside due to erosion and illegalexcavation.
The southern wall has sparsevegetation.
Overburden Dump No.2
Towards thenorth westernthere isevidence ofillegal reclamation activities
There are no hazardous and warningsigns around the facility
Northern frank has several gullies andsteep slopes. There are very large gulliesfurther west of the dump and material havebeen washed to the toe. there is severeerosion compounded by lack ofvegetation.
The dump has drains that dischargeinto Nchanga and Chingola streamboth tributaries of the Kafue river.
Poorly vegetated
There is dustpollution especially from theexposed illegallyexcavated portionswhich may affectthe surroundingenvironment butnot humans
The dump hastoe drains thatcollect rainsurface waterand dischargesto Nchanga andChingola Streams. The toedrains alsoconvey suspended silts.There is alsopotential toeventually pollute the Kafue river.
NoneNo humansettlements nearby.
Overburden Dump No. 1
Illegal miningon the northeastern side
There are no hazardous and warningsigns around the facility
Active gullies on the north eastern sideand the walls are steep. A few gullies onthe western and eastern walls.
Tension cracks on the southernaccess road. There is a drainagechannel that passes through OB2and drains into the Chingola stream.
Northern ,Western and Southern sides are well vegetated
Only on someselected portionsthat are notvegetated.
The Nchangastream flows tothe northernedge of thedump and thereis high potentialof silt to end upin the spoon.
NoneNo humansettlements nearby.
No humansettlements nearby.
Erosion gullies on the entire westernlength, the northern and the southernwalls.
Drainages are desilted resulting intosiltation of Chingola Stream
The top surfacesare bare and apartfrom polluting thesurrounding areathere are no human settlements nearby.
Surface run-offfrom the westernfonts andnorthern frontsdrains intowestern drains.There is build upof silt after thebund wall whicheventually pollute theadjacent Chingola Streamand ultimatelyinto the Kafueriver.
NoneOverburden dump No. 22
There is illegalmining whichcauses whichcauses two (2)predominant gullies from thetop to thebottom of thewestern wall.There alsoexcavation pitson the westernand on topsurfaces thatare affecting the stability of the
There are no hazardous and warningsigns around the facility
Overburden dump No. 20
The dump isguarded
There are no hazardous and warningsigns.
Water isdischarged into the open pit and formspart of theopen pitdewatering.
The dump is withinthe mine and noexposure to anytownship.
The eastern and western side has erosiongullies.
The drains on the southern side aregood but there are tension crackson the western wall.
Walls on the eastern side arerelatively bare. The northernside is well vegetated.
The dump is within the mine and noexposure to anytownship.
Water isdischarged intothe open pit andforms part of theopen pitdewatering.

69Management of Environmental Degradation Caused by Mining Activities in Zambia.
Appendix 26(cont)Assessment of Overburden Dumps
Name of MineName ofFacility Status
Restricted access Hazardous and warning signs Evidence of gullies
Drainage is good/No tensioncracks/No sink holes Evidence of vegetation
Pollution ofsurrounding areas e.g. dust
Pollution ofsurface water
Pollution ofground water
Residential areaswithin 500metresfrom the dam wall
KCM Nchanga IBUOverburden Dump No. 1
Illegal miningon the northeastern side
There are no hazardous and warningsigns around the facility
Active gullies on the north eastern sideand the walls are steep. A few gullies onthe western and eastern walls.
Tension cracks on the southernaccess road. There is a drainagechannel that passes through OB2and drains into the Chingola stream.
Northern ,Western and Southern sides are well vegetated
Only on someselected portionsthat are notvegetated.
The Nchangastream flows tothe northernedge of thedump and thereis high potentialof silt to end upin the spoon.
NoneNo humansettlements nearby.
Kansanshi Mining Plc
Kansanshi Overburden/Waste rockdumps complex
There isrestricted Access
hazardous and warning signs aredisplayed
few erosion gullies were observed at thetop of the dump
Some cracks observed on theaccess road
The dumps are predominantlybare with no vegetation on thesurfaces.
Dust mainly fromthe dust roads.However, there areno humansettlements nearby.
Rain runoff fromthe dump surface drains into theKansanshi stream, Kamasasebende stream and thedambo area.suspended siltmaterials haspotential tocause waterpollution andsiltation ofdambo areas.However there isa bund wall.
Ground water monitoring borehole between South westrock dumpand Kansanshi dambo hasshown someincidences of high acidity.i.e. pH below6.
No humansettlements nearby
Chibuluma Mine
Chibuluma Mine Overburden dump
No restrictedaccess. Onlyperiodic patrolsare done. Illegalmining was alsotaking place
There are no hazardous and warningsigns displayed
Some gullies were noticed. The slopes ofthe dump were not re-profiled and re-vegetated.
Toe not accessible as there were noaccess roads
Some re-vegetation has startedon the lower bench for400meters or 1 hectare out of 9hectares
Prone to dustpollution on areasnot re-vegetatedand where finesare exposed
The nearestwater source was Nselaki streambut the streamwas inaccessibleas there were noaccess roads.
No testresults provided forground water testing
Human settlementon the eastern side.However this couldnot be accessed asthere were no access roads.
Fairly vegetated on the easternside. However, the dump hassome bare patches on top.The western side is partiallyvegetated with grass.
Overburden dump No 2 Decommissioned
No restrictedaccess
There are no hazardous and warningsigns displayed Few gullies were seen
Storm water diversion channelswere seen Poorly vegetated
No evidence ofdust pollution
Bund structureswere in place
No testresults provided forground water testing
No humansettlements withinthe radius stated
Source: Statutory Dump report and physical inspectionsNo overburden dumps were assessed for Bwana Mkubwa, Luanshya Coppermine, Chambishi Metals, Chambishi Copper Smelter, Maamba Collieries and KCM Nkana
NFC Africa Mining Plc.Overburden dump No 1 Decommissioned
No restrictedaccess
There are no hazardous and warningsigns displayed Few gullies were seen
The dump drains into Chambeshistream. The dump has drainagesystem and is bunded
No evidence ofdust pollution
Nearest watersource is theChambeshi River, however,bund structures
No testresults provided forground water testing
No humansettlements withinthe stated radius

Management of Environmental Degradation Caused by Mining Activities in Zambia.70
Appendix 27
Assessment of Waste Rock Dumps
Name of Mine Name ofFacility
Status Restricted access Hazardous andwarning signs
Evidence of gullies-soil erosion
Drainage is good/No tensioncracks/No sink holes
Evidence ofvegetation
Pollution ofsurrounding areas e.g. dust
Pollution ofsurface water
Pollution ofground water
Residential areas within500metres fromthe dam wall
Ndola LimeSouth Eastwaste rockdump
Decommissioned Access is restrictedSign posts wasseen
There were no notableerosion gullies
There are no storm water diversionchannels as all storm water goesdirectly to the quarry from the dump.
Sparsely vegetated dump
There was noevidence of dustpollution
No water isdischarged to theenvironment
No results ofground watertesting wereprovided
There are nohuman settlementswithin the statedradius.
South WasteRock dumpNo 18
Decommissioned
No restricted accessThere was evidence of illegal mining – Dug out holes
No warning andhazardous signswere seen
Huge erosion gullieswere seen
• There are no storm waterdiversion channels· The dump was in thecaving area as was evidenced bysubsidence observed creatingdepressions on the dump surface
Sparsely vegetated dumpsurfaces. Thedump surfacesare affected byillegal reclamation activities.
• Dust pollution due toillegal mining andsparse vegetation· Wasteother than wasterock was seen atthe dump.
There is no bundwall to limit releaseof solids to theenvironment.
No results ofground watertesting wereprovided
There are human settlements a few metres away from the dumpsRoan Mpatamatu
South westwaste rockdump No 14
Decommissioned
No restricted accessThere was evidence of illegal mining – Dug out holes
No warning andhazardous signswere seen
Huge erosion gullieswere seen
•There are no storm water diversionchannels
Sparsely vegetated dumpsurfaces. Thedump surfacesare affected byillegal reclamation activities.
Dust pollution due to illegal mining andsparse vegetation
There is no bundwall to limit releaseof solids to theenvironment.The rivers closest tothe dump areLuanshya river andFisansa stream
No results ofground watertesting wereprovided
There are human settlements a few metres away from the dumps
Lumwana MiningCompany
Mulundwe waste rockdump -MR 1
Active yesNo statutorydump reports
No statutory dumpreports
No statutory dump reportsPartially vegetated at thetoe
noNo statutory dumpreports
No results ofground watertesting wereprovided
no
Mulundwe waste rockdump -MR 2
Active YesNo statutorydump reports
No statutory dumpreports
No statutory dump reportsPartially vegetated at thetoe
noNo statutory dumpreports
No results ofground watertesting wereprovided
no
Chambishi MetalsPlc
N/A N/A N/A N/A N/A N/A N/A N/A N/A
Chambishi CopperSmelter
N/A N/A N/A N/A N/A N/A N/A N/A N/A
Mopani CopperMines Plc-Nkana
waste rockno. 14
active nofew small gulliesnorthern side
no no
reclamation anddumping was takingplace and evidenceof dust
dump is close toMindolo stream. No test results
no test results1km from Mindolotownshio
Luanshya Copper Mine Plc

71Management of Environmental Degradation Caused by Mining Activities in Zambia.
Appendix 27 (Cont)
Assessment of Waste Rock Dumps
Name of Mine Name ofFacility
Status Restricted access Hazardous andwarning signs
Evidence of gullies-soil erosion
Drainage is good/No tensioncracks/No sink holes
Evidence ofvegetation
Pollution ofsurrounding areas e.g. dust
Pollution ofsurface water
Pollution ofground water
Residential areas within500metres fromthe dam wall
Waste RockDump No. 28
active yes no need reprofilling stable no sink holessparsely vegetated topsurfaces
dust fromreclamation polluteimmediate surrounding only
no discharge to anywater course
No results ofground watertesting wereprovided
1.5km fromnearest settlment
Mopani CopperMines Plc-Mufulira
Waste rock11
active
evidence of informalreclamation on severaloccasions that whereaffecting the stability ofthe dump
yes no drains and silt traps are availableno vegetationonthe top surfacesand the slopes
nono test results dumpis 100m from theriver
no test results
Kankoyo approximately 600m from thedump. Butondosch approximately500m
Waste rock 13
active yes yes minor gullies no drainagesbare dump wallsand top surfaces
dust from dumpngactivities and dryseason and winddirection is fromnorth east to southwest(kankoyo)
no direct drain to thestream
no test resultsKankoyo is theclosest township
Lufubu Wasterock dump 14/reclaimed
Active Being claimed by aprivate contractor
There are nowarning signposts around thefacility
Excavated holes fromthe private contractorhave emerged
Lined drainages are present Not vegetated
Dust is generatedfrom thereclamation processand affect thesurrounding environments- bushes
Effluent from thecrushing activitiesdischarge intoMufulira stream andare not monitoredfor TSS and othermetals
No test resultsNot prone toacid rockdrainage
800m away fromKankoyo township
Waste rock 17
active yes yesmultiple gullies on thesouth west
unlined drainsno progressiverehabilitation hastaken place
no significant dustconcern
not close to thestream but run offwater is directed tothe stream from thedrainage sumps
no test results
Kankoyo townshipis the closesttownship to thenortheast
Maamba CollieriesPlc
Izuma A Decommissioned There is restricted accessHazardous andsafety signs wereseen.
There were notablegullies on the dumpwalls
The dump had unlined drainages
There was somevegetation on theeastern side ofthe dump. Allother sides werebare
Despite efforts toreprofile the dumpswith inert material,there was evidenceof spontaneouscombustion on thedumps. Combustionhas an impact ofreleasing carbonmonoxide andsulphurous gasesinto the atmosphere.
The Kanzinzi streamwas diverted fromits normal course bysilt
Boreholes forwater samplingand analysispurpose s were not installed atthe Kanzinzistream
Sikimina village isabout 500 M fromthe dump.However theydepend on waterfrom the Kanzinzistream
Izuma B Active There is restricted accessNo hazardous and safety signs wereseen.
No notable erosiongullies
The dump had unlined drainages No vegetation
Despite efforts toreprofile the dumpswith inert material,there was evidenceof spontaneouscombustion on thedumps. Combustionhas an impact ofreleasing carbonmonoxide andsulphurous gasesinto the atmosphere.
The Kanzinzi streamwas diverted fromits normal course bysilt
Boreholes forwater samplingand analysispurpose s were not installed atthe Kanzinzistream
Izuma A infill Active There is restricted accessNo hazardous and safety signs wereseen.
No notable erosiongullies
The dump had unlined drainages No vegetation
Despite efforts toreprofile the dumpswith inert material,there was evidenceof spontaneouscombustion on thedumps. Combustionhas an impact ofreleasing carbonmonoxide andsulphurous gasesinto the atmosphere.
The Kanzinzi streamwas diverted fromits normal course bysilt
Boreholes forwater samplingand analysispurpose s were not installed atthe Kanzinzistream
There were nohuman settlementswithin the statedradius.
Konkola CopperMine Plc-KonkolaIBU
Waste Rockdump A
Dump report not providedDump report notprovided
Dump report not provided
Dump report not providedDump report not provided
Dump report not provided
Dump report not provided
Dump report not provided
Dump report not provided
Waste Rock dump B
Dump report not providedDump report notprovided
Dump report not provided
Dump report not providedDump report not provided
Dump report not provided
Dump report not provided
Dump report not provided
Dump report not provided

Management of Environmental Degradation Caused by Mining Activities in Zambia.72
Appendix 27(Cont)Assessment of Waste Rock Dumps
Name of Mine Name ofFacility
Status Restricted access Hazardous andwarning signs
Evidence of gullies-soil erosion
Drainage is good/No tensioncracks/No sink holes
Evidence ofvegetation
Pollution ofsurrounding areas e.g. dust
Pollution ofsurface water
Pollution ofground water
Residential areas within500metres fromthe dam wall
KansanshiMining Plc
Kansanshi Overburden/Waste rockdumps complex
Complex report dealtwith under overburden
Complex report dealt with under overburden
Complex report dealt with under overburden
Complex report dealt with under overburden
Complex report dealt with under overburden
Complex report dealt with under overburden
Complex report dealt with under overburden
Complex report dealt with under overburden
Complex report dealt with under overburden
Chibuluma MineChibuluma Mine WasteRock dump
Complex report dealtwith under overburden
Complex report dealt with under overburden
Complex report dealt with under overburden
Complex report dealt with under overburden
Complex report dealt with under overburden
Complex report dealt with under overburden
Complex report dealt with under overburden
Complex report dealt with under overburden
Complex report dealt with under overburden
NFC Africa MiningPlc
Waste rock dump No 5
Decommissioned Unrestricted accessWarning andsafety signs seen
Minor gullies wereobserved on the eastern side
There is subsidence in the cavingarea south of the open pit
Generally wellvegetated withgrass and shrubs. Some parts ofthe western wallare completelycovered withvegetation
The dump poses noimmediate environmental concerns in terms of fugitive dust
None
Waste rock dump No 17
Decommissioned Unrestricted accessWarning andsafety signs wereseen
Minor gullies were seenThere was evidence of tensioncracks
Partially vegetated
No threat of dustpollution
The drainagechannel channelswater into theChambeshi stream
None
Waste rock dump No 18
Active Unrestricted AccessWarning andsafety signs werenot seen
Minor gullies seenNo defined drainage system for the
dump
The crushing plantproduces crushedstone sludge whichis flowing into thesurrounding areas.However there areno incidences offugitive dust
Part of the surfacewater is directed toChambeshi streamon the astern side.There are alsoreclamation activities on the eastern side.
Waste rock dump No 20
Active Unrestricted accessWarning andsafety signs werenot seen
Minor gullies seen
Drainage is via surface run off andan open drainage channel leading toTD 6 on the eastern side of thedump
No vegetation asdumping is stillongoing
Possibility of dustpollution as thedump is notvegetated.
None
Source :Statutory Dump report and physical inspection
KONNOCO was under development – not assessed

73Management of Environmental Degradation Caused by Mining Activities in Zambia.
Appendix 28
Assessment of used oil storage facilities
Name of Mine Name of Facility Restricted access
Bunded and Impermeable
floor
Adequate ventilation
Adequate/ Appropriate warning and safety signs
Appropriate storage facilities to hold the waste
Proper handling of waste to avoid
spills
Spills properly cleaned up
firefighting equipment
first aid equipment
Internal Inspections of
facilities
Ndola LimeNo restricted
accessYes Yes Yes Yes
Oil spills were noticed on the floor
No
The firefighting equipment was
stored in a place that was difficult to
access i.e. separated by a wall
fence
The first aid equipment was
stored in a place that was difficult to
access i.e. separated by a wall
fence
There were no records of used oil
inspections
Luanshya Copper Mine Plc
Concentrator Yes Yes Yes Yes YesOil spills were seen
on the groundNo
There was no firefighting
equipment seen
There was no first aid equipment seen
Yes
Lumwana Mining Company
Mulundwe Yes Yes Yes Yes Yes Yes Yes YesNo first aid
equipment was on site
Yes
Chambeshi Metals Plc
Zone A Yes Yes Yes Yes YesOil spills were seen
on the groundSawdust was used to clean up oil spills
Yes YesNo internal
inspection records for used oil
Chambeshi Copper Smelter
No restricted access
No bunded wall YesNo adequate warning signs
Yes Yes Yes YesNo first aid
equipment was on site
No internal inspection records
for used oil
Near the smelter Yes Yes Yes Yes YesOil spills were noticed on the
groundNo Yes Yes
No internal inspection records
for used oil
Mopani Copper Mines Plc-Nkana
Salvage Yard Yes Yes Yes Yes Yes Yes Yes Yes YesNo internal
inspection records for used oil
Zone A Yes Yes Yes Yes YesThere were
spillages
Sawdust was spread on top of
the spillagesYes No first equipment
No internal inspection records
for used oil
Mopani Copper Mines Plc-Mufulira
Yes Yes Yes Yes YesThere were
spillages on the ground
Yes Yes Yes Yes
Maamba Collieries Plc
Contractors garage No Yes Yes NoThe storage
capacity was inadequate
Yes Yes YesFirst aid box was
seen though it had no contents.
Light vehicles workshop
No No Yes No No No No No No No
Konkola Copper Mine Plc-Konkola
IBUYes Yes Yes Yes Yes Yes
Saw dust sprinkled on the spills
Yes Yes no
Konkola Copper Mine Plc-Nkana
IBUYes Yes Yes Yes Yes
There was evidence of spills
Yes Yes Yes
No Inspection Reports carried out by Environmental department of the
mine
Konkola Copper Mine Plc-Nchanga
IBU
No restricted access-no gate
Yes YesNo hazardous and
warning signs Yes Yes Yes Yes No first aid kit No
KansanshiMining Plc
Yes Yes Yes Yes
Storage facility is surrounded by
grass which may make it prone to
fire
There was evidence of spills
Yes Yes Yes
No Inspection Reports carried out by Environmental department of the
mine
Chibuluma Mine
No restricted access-oil storage
facility also used as wash bay
Yes Yes Yes YesThere was
evidence of spills
No· oil separator was
not working· drainages were
blocked· contaminated soil· mixture of water from wash bay and
oils
Yes No first aidNo inspection
records
NFC Africa Mining Plc
YesThe impermeable floor had cracks
Yes Yes Yes Yes Yes Yes Yes Yes
*KONNOCO could not be assesses as it was still under development phase.
**Source; ZEMA compliance monitoring reports and physical verification

Management of Environmental Degradation Caused by Mining Activities in Zambia.74

75Management of Environmental Degradation Caused by Mining Activities in Zambia.

Management of Environmental Degradation Caused by Mining Activities in Zambia.76


![[Shahamat U. Khan] Pesticides in the Soil Environm(BookFi.org)](https://static.fdocuments.net/doc/165x107/55cf9cd3550346d033ab2dad/shahamat-u-khan-pesticides-in-the-soil-environmbookfiorg.jpg)


