Report about Passengers Satisfaction Toward Airline Service Quality in Indonesia 2013
66
Report date: November 2013 Creator: Nusaresearch team PASSENGERS SATISFACTION TOWARD AIRLINE SERVICES QUALITY Research time: 05.9.2013 – 25.9.2013 Based on Nusaresearch’s panelist
-
Upload
ws-holdings -
Category
Services
-
view
131 -
download
2
Transcript of Report about Passengers Satisfaction Toward Airline Service Quality in Indonesia 2013
Report date: November 2013
Creator: Nusaresearch team
PASSENGERS SATISFACTION
TOWARD AIRLINE SERVICES
QUALITY
Research time: 05.9.2013 – 25.9.2013
Based on Nusaresearch’s panelist
A. Executive summary[1] Most Respondents had at least travelled by plane once to two times in the last 6 months
(February – August 2013)
• More than 70% of the surveyed respondents have at least ever traveled by plane for once to two times. And, there were 8.3% of the
respondents who have ever traveled by air for more than five times in the last 6 months.
• There is a slight difference with regard to the frequency of traveling by Air between Male and Female, where out of 214 male
respondents, 34.6% have ever traveled for at least one time, while out of 242 female respondents, 37.6% and 35.1% have ever
traveled by air for one time and two times, respectively.
• The frequency of traveling by air varied slightly across the Age Groups. There are 40.4% of 235 respondents aged under 20 – 29
years old and 31.7% of 221 respondents aged above 30 years old who have ever traveled once by airplane in recent 6 months.
• Most respondents with lower monthly household expenditure have ever traveled for one time (49.6%), while respondents with
middle expenditure have mostly ever traveled by air for two times (35.3%). And finally, most respondents from upper monthly
expenditure traveled by air for two times which account for 36.1% compared to 25% of respondents who travelled once in the last 6
months.
[2] The Top Three Airline the respondents travelled on are Lion Air, Garuda Indonesia and Airasia
•There are some quite significant differences among top three Airlines. Lion Air is the most preferred Airline which account for
34.9% of the respondents (159 passengers). In addition, there is a significant difference on the number of respondents who have
traveled with Garuda Indonesia compared to those have traveled with Lion Air, which account for 25.4% or 116 passengers.
•Categorized by gender, it is obvious that both male and female respondents prefer to travel by Lion air, Garuda and Airasia. Among
those respondents, 38.8% of male respondents had experience of traveling with Lion Air, whereas 31.4% of female respondents had
experience of flying with Lion Air.
•Both respondents aged under 20 – 29 years old and aged above 30 years old preferred to travel with Lion Air which account for
38.5% and 31.5%, respectively. Meanwhile, in the second place, there is Garuda Indonesia that has been chosen by 26% of
respondents aged under 20 – 29 years old and 24.9% of respondents aged above 30 years old.
•There are 27.1% of respondents with higher monthly household expenditure who chose Garuda Indonesia as their reliable Airline to
fly with. Meanwhile, Lion Air was also chosen by more than 30% respondents from each groups of monthly household expenditure.
A. Executive summary[3] There is a significant difference on the route of traveling, where 89.9% respondents had domestic flight
experience in the last 6 months
• There are almost 90% of surveyed respondents have travelled by plane for domestic destination and there is only 10.1% of 456
respondents who have traveled by air for international destination.
•There is a slight difference of percentage between male and female respondents who have ever traveled within Indonesia which
account for 92.5% and 87.6% respectively. Meanwhile, there is at least 12.4% of the female respondents who have ever experienced
international flight in the last 6 months.
•There is 11.5% of respondents aged under 20 – 29 years old who have traveled overseas, whereas more respondents aged above 30
years old have mainly travelled to domestic destination (91.4%) compared to those who have traveled overseas (8.6%).
•Domestic air travel is dominated by 90% of respondents with lower and middle monthly household expenditure. However, there is
no significant difference when it is compared to those respondents with higher expenditure, which account for 87.5%. Meanwhile, it
is obvious that those respondents with higher expenditure had more International air travel which account for 12.5%.
[4] The Air Travel is dominated by business, in-holiday and leisure Passengers
• There are almost 38% of the respondents who had family holidays trip, whereas there are 32.2% of respondents who were in
corporate or business trip and finally 21.9% are leisure passengers who spent traveling time for shopping.
•For male respondents, they chose air travel mainly for corporate/business trip which accounts for 42.1%, whereas female
respondents had experience traveling by plane for family holidays which accounts for 44.2% compared to only 23.6% of female
respondents who had business trip in recent 6 months.
•The occasion for traveling varied slightly between the two age groups. Most respondents aged under 20 – 29 years old have
traveled by plane for family holidays which accounts for 37.9%. Otherwise, there are 40.3% respondents aged above 30 years old
who have traveled for business purpose.
•However, there is quite considerable difference between these two age groups in term of their occasion for Leisure trip. There are
27.2% respondents aged 20 – 29 years old who have traveled for leisure trip whereas there is only 16.3% of respondents aged above
30 years old who have traveled for leisure.
•Most respondents with lower and middle expenditure chose air travel for family holidays which accounts for 40.3% and 40.5%
respectively. In contrast, those respondents with higher monthly household expenditure traveled for corporate/business trip (38.2%).
[5] Economy Class was the most preferred seat/fare class for Respondents to have flight experience with the
selected Airline
• There are 87.7% of respondents who had flight experience with Economy seat class. Meanwhile, there are only 11.6% of
respondents who prefer to choose executive class for a trip to their destination city.
• There is a slight difference between male and female respondents who have traveled with economy class which account for
87.4% and 88% respectively. In contrast, there are more male respondents (12.1%) who chose executive class for their air travel
compared to female respondents (11.2%).
• Both respondents aged under 20 – 29 years old and above 30 years old chose the lower price of air ticket where they travelled
with economy class. Meanwhile, there are total of 23.2% respondents of both age groups who chose executive class for their
flight experience with the selected Airline.
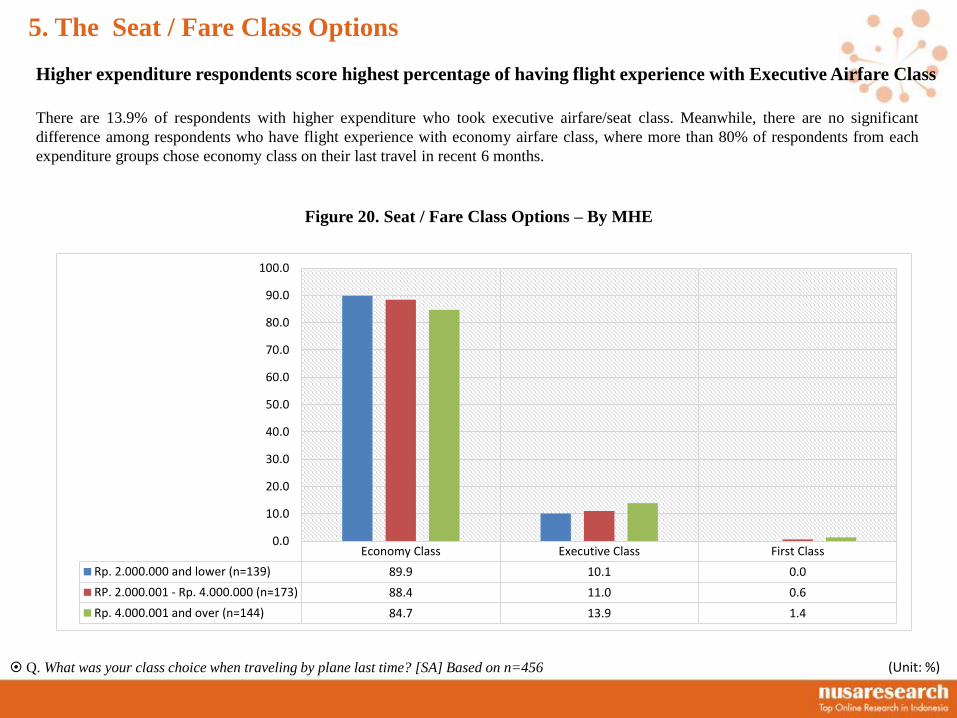
• Higher expenditure respondents score highest percentage of having flight experience with Executive Airfare Class. There are
13.9% of respondents with higher expenditure who took executive airfare/seat class. Meanwhile, there are no significant
difference among respondents who have flight experience with economy airfare class, where more than 80% of respondents from
each expenditure groups chose economy class on their last travel in recent 6 months.
[6] The average ticket price purchased is ranged from IDR 700.001 to IDR 900.000
• From various kind of airfare class the respondents traveled on, IDR 700.001 toIDR 900.000 is the average ticket price they
bought when traveling last time in the last 6 months (February – August 2013).
• Most of male respondents bought their airfare for IDR 500.001 – IDR 700.000 which accounts for 23.8%. Meanwhile, 19.8% of
female respondents admited that they bought the ticket for IDR 700.001 – IDR 900.000.
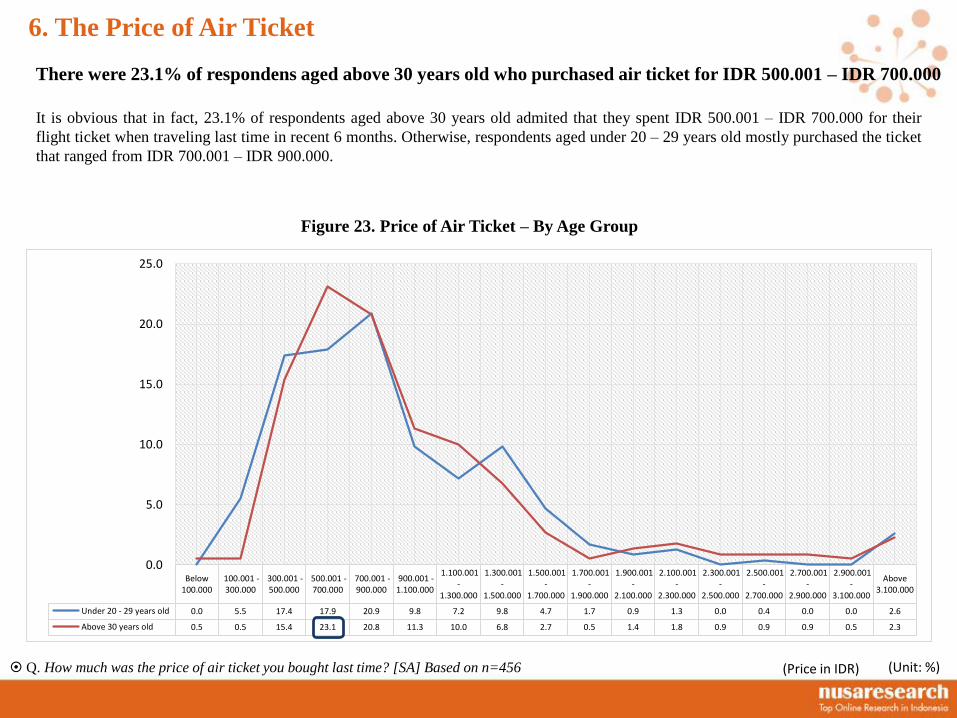
• There are 23.1% of respondents aged above 30 years old admitted that they spent IDR 500.001 – IDR 700.000 for their flight
ticket when traveling last time in recent 6 months. Meanwhile, respondents aged under 20 – 29 years old mostly purchased the
ticket that ranged from IDR 700.001 – IDR 900.000.
• Most respondents with lower expenditure bought the ticket that ranged from IDR 300.000 to IDR 700.000, while the higher
expenditure respondents mostly traveled by plane with the price ranged from IDR 500.001 – IDR 900.000.
A. Executive summary
[7] Online payment is the most preferred method to make a flight ticket reservation
• The respondents prefer to make flight / ticket reservation in different ways, where most respondents chose online services as their
mode of flight ticket reservation. In the second place, respondents chose to arrange their flight travel to the travel agency and
official reservation office, which accounts for 26.3% and 23.9% respectively.
• Categorized by gender, the top three of most preferred method of ticket reservation are Online reservation, travel agency and
official reservation office. More than 40% of both male and female respondents chose online service as the reliable method of
booking a flight ticket.
• There is a significant difference on the number of respondents between two age groups who chose travel agency to arrange their
flight ticket. There is only 19.6% of respondents aged under 20 – 29 years old entrusted travel agency, while 33.5% of 221
respondents aged above 30 years old chose travel agency to arrange their flight ticket. However, online reservation is the most
preferred method for both age group to make a flight reservation with.
• Respondents from different group of MHE chose online reservation as their most reliable method for flight ticket reservation.
Furthermore, official reservation office is their second preference to arrange their travel with. where there are 28.8% of lower
expenditure respondents chose this method.
[8] Almost 75% of participated respondents are satisfied with Pre-flight services quality of the Airline they
traveled on last time in the recent 6 months
• Percentage of respondents who feel satisfied with the Pre-flight services quality of the selected Airline they traveled on last time is
quite high which leads to high satisfaction mean of 3.906.
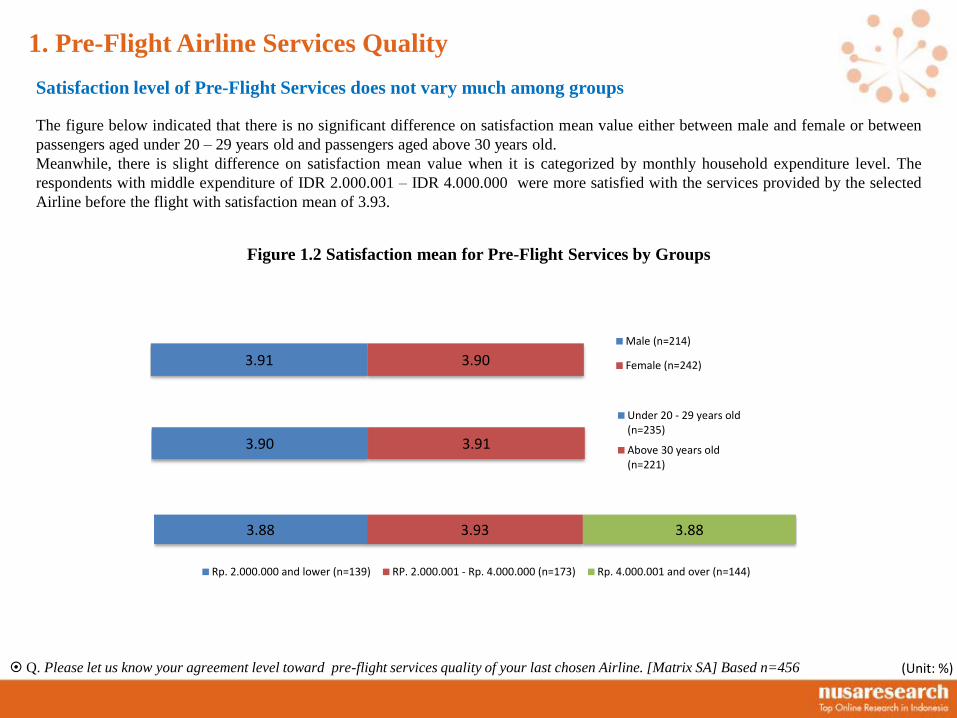
• There is no significant difference on satisfaction mean value either between male and female or between passengers aged under 20
– 29 years old and passengers aged above 30 years old.
• Meanwhile, there is slight difference on satisfaction mean value when it is categorized by monthly household expenditure level.
The respondents with middle expenditure of IDR 2.000.001 – IDR 4.000.000 were more satisfied with the services provided by the
selected Airline before the flight with satisfaction mean of 3.93.
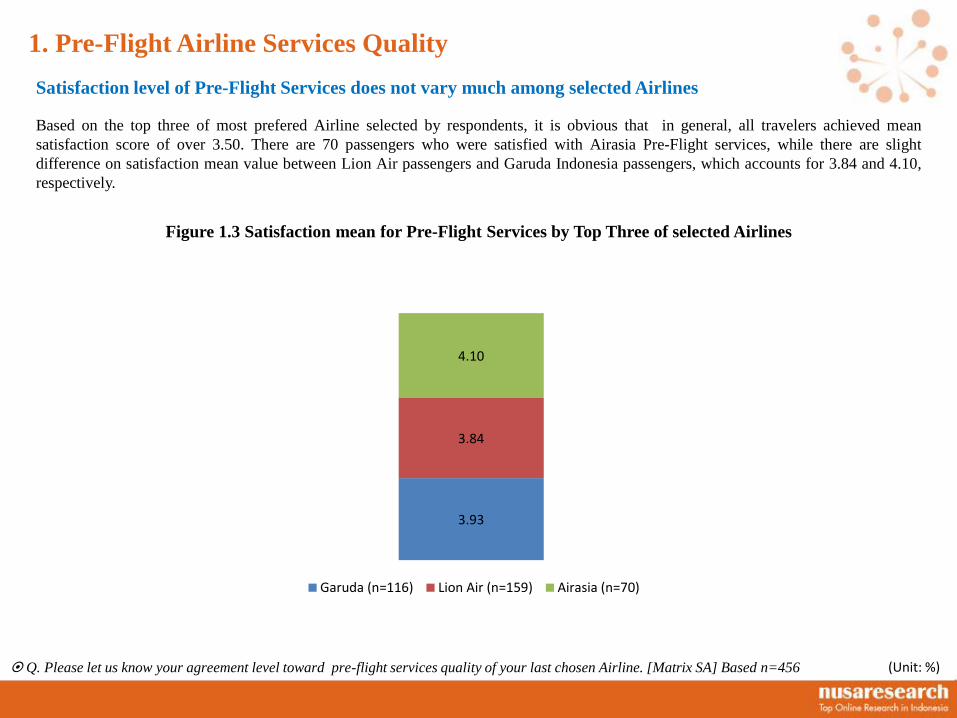
• Based on the top three of most prefered Airline selected by respondents, it is obvious that in general, all travelers achieved mean
satisfaction score of over 3.50. There are 70 passengers who were satisfied with Airasia Pre-Flight services, while there are slight
difference on satisfaction mean value between Lion Air passengers and Garuda Indonesia passengers, which accounts for 3.84 and
4.10, respectively.
A. Executive summary
[8.1] Satisfaction level of Passengers differs from item to item of Pre-Flight Airline Services (Reliability)
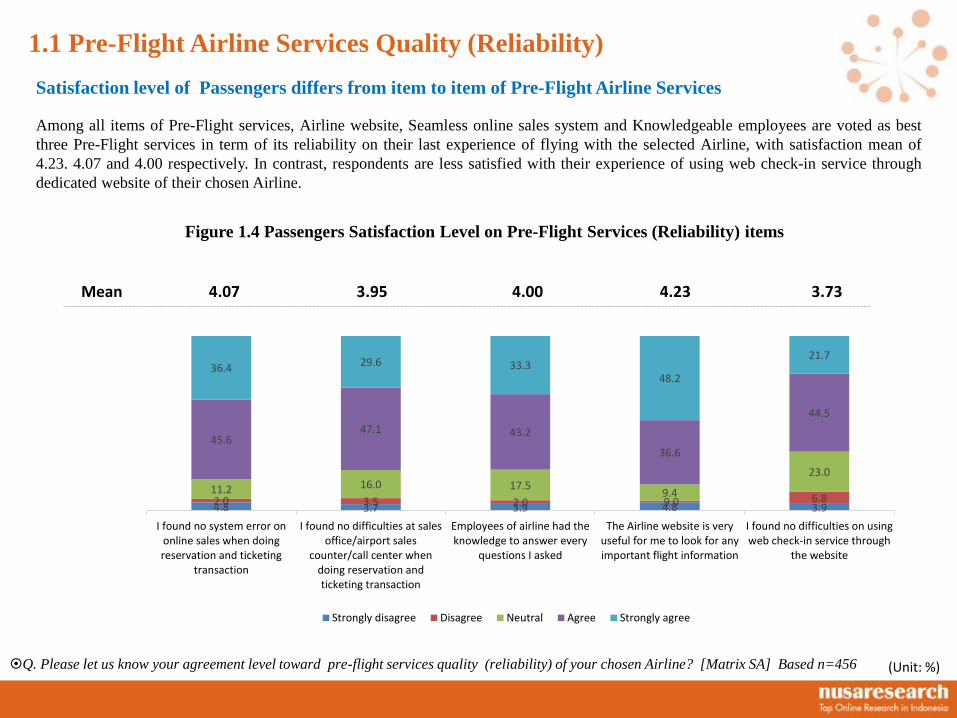
Among all items of Pre-Flight services, Airline website, Seamless online sales system and Knowledgeable employees are voted as
the top three Pre-Flight services (reliability) on their last experience of flying with the selected Airline, with satisfaction mean of
4.23, 4.07 and 4.00 respectively. In contrast, respondents are less satisfied with their experience of using web check-in service
through dedicated website of their chosen Airline.
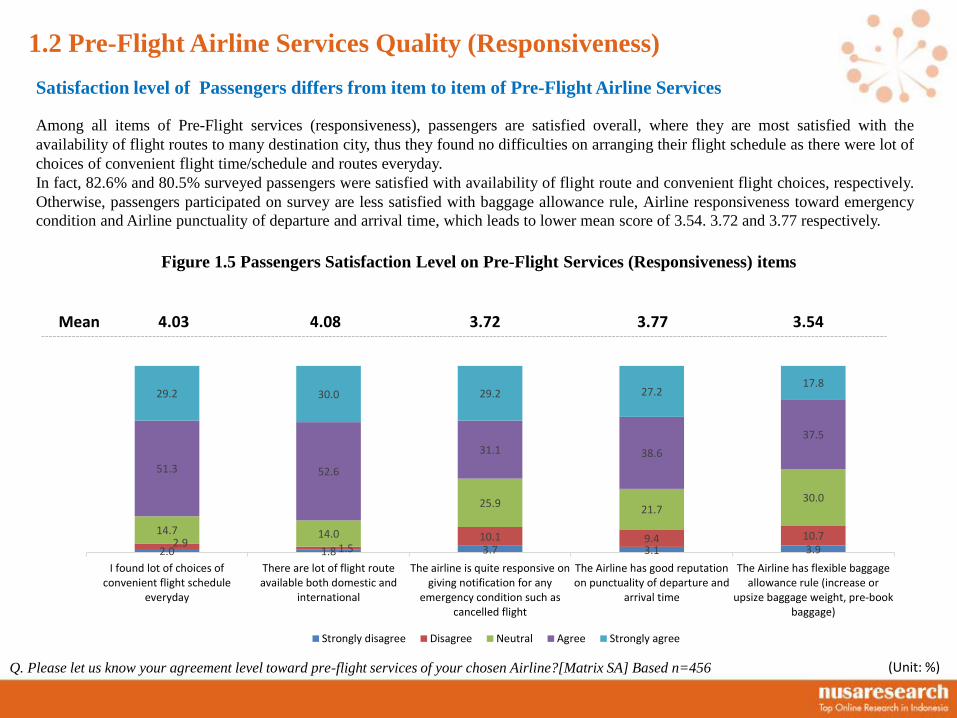
[8.2] Passengers are satisfied overall with the Pre-Flight Airline Services (Responsiveness)
• The passengers are most satisfied with the availability of flight routes to many destination city, thus they found no difficulties on
arranging their flight schedule as there were lot of choices of convenient flight time/schedule and routes everyday.
• In fact, 82.6% and 80.5% surveyed passengers were satisfied with the availability of flight route and convenient flight choices,
respectively. Otherwise, passengers participated on survey are less satisfied with baggage allowance rule, Airline responsiveness
toward emergency condition and Airline punctuality of departure and arrival time, which leads to lower mean score of 3.54. 3.72
and 3.77 respectively.
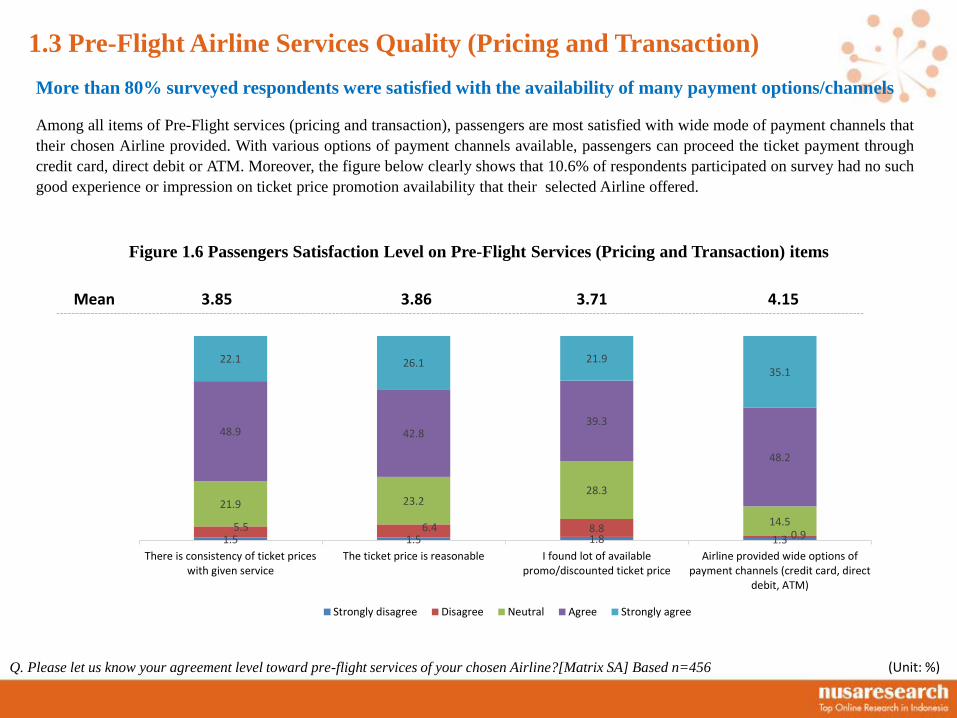
[8.3] More than 80% surveyed respondents were satisfied with the availability of payment options/channels
offered
Among all items of Pre-Flight services (pricing and transaction), passengers are most satisfied with wide mode of payment
channels that their chosen Airline provided. With various options of payment channels available, passengers can proceed the
ticket payment through credit card, direct debit or ATM. Moreover, there are 10.6% of respondents participated on survey who
had no such good experience or impression on ticket price promotion availability that their selected Airline offered.
A. Executive summary
[9] Satisfaction level of passengers toward In-Flight Airline services is slightly higher than passengers’
satisfaction toward Pre-Flight services
• There are 72.9% of participated respondents who are satisfied with In-flight services quality of their chosen Airline compared to
4.70 of dissatisfied percentage. Percentage of respondents who feel satisfied with the In-flight services quality is quite high which
leads to high satisfaction mean of 3.936.
• Generally, all groups achieved high mean satisfaction score of over 3.90 where the highest mean score is 3.99, indicated that
respondents with middle expenditure were highly satisfied with the In-flight services they got during their trip.
• From the top three of most preferred Airline, 116 passengers were more satisfied with Garuda Indonesia In-Flight services compared
to 159 respondents traveling with Lion Air which has a little lower satisfaction mean of 3.84.
[9.1] The Air traveller had relatively positive impression on some of the tangible facilities provided on the plane
More than 80% of surveyed respondents agreed that their chosen airline has clean cabin room, comfortable and nice interior and
well-equipped safety percussion. Meanwhile, the respondents were less satisfied with the in-flight shopping offering as well as the
seats on the plane that made them uncomfortable during the flight which leads to lower satisfaction mean of 3.42 and 3.77,
respectively. Finally, there were 75.9% passengers who admitted that they felt safe when traveling with the Airline they chose.
[9.2] The Respondents were highly satisfied with the Flight Attendant Performance during the flight
In term of courtesy of the cabin crew, more than 85% of respondents participated on survey were satisfied with the attractiveness of
the cabin crew both the dressing and appearance; the friendliness, politeness and language competency of the cabin crew; and also
well-presented safety rules. In contrast, although the passengers are highly satisfied with the cabin crew performance during flight,
only 48.7% admitted that they did not get much individual attention from the cabin crew, which leads to lower satisfaction mean
score (3.50).
A. Executive summary
[10] The Passengers’ satisfaction level toward Post-Flight services quality is not as high as the satisfaction
level toward In-Flight services quality
• Less than 60% passengers participated in the survey were satisfied with Post-flight services quality of their chosen airline when
traveling last time with satisfaction mean score of 3.721.
• The satisfaction mean score for Post-Flight Airline services ranged from 3.67 to 3.74, where those passengers with middle
expenditure has highest figure (mean=3.74) and those with higher monthly household expenditure has lowest figure (mean=
3.67). However, there is no significant difference among categories.
• The satisfaction mean score for Post-Flight Airline services when being categorized by selected Airlines ranged from the lowest
of 3.63 to the highest of 3.86. The passengers who have ever traveled with Garuda Indonesia admited that they were satisfied with
the overall post-flight airline service quality. Meanwhile, 70 Airasia passengers were satisfied with the overall post-flight services
provided which leads to satisfaction mean score of 3.80.
[10.1] Satisfaction level of passengers differ from item to item of Post-Flight Airline services quality
In term of Airline Post-flight services quality, the satisfaction level is not as high as the satisfaction level on In-flight services
quality. 71.1% passengers felt satisfied with the appreciation that the Airline gave toward their feedback and concern on their
experience traveling with the chosen Airline.
A. Executive summary
B. Research information
Research method : Quantitative research (Online survey)
Timing : 05.9.2013 – 25.9.2013
Sample size : 456
Research area : Nationwide (Indonesia)
Target : Male & Female aged 17 years old and over; and ever
used Airline services in last 6 months (February-August 2013)
Research objectives : Find out how factors affect the passengers’ satisfaction
on Airline services quality and perform regression analysis of
satisfaction
Sampling method : Internet sampling (Nusaresearch panel)
Part 1. Respondents’ Experience on Traveling by Airplane
Part 2.Overall Passengers Satisfaction toward Airline Services Quality
Part 3. Regression analysis on Passengers Satisfaction toward Airline Services Quality
B. Research Findings
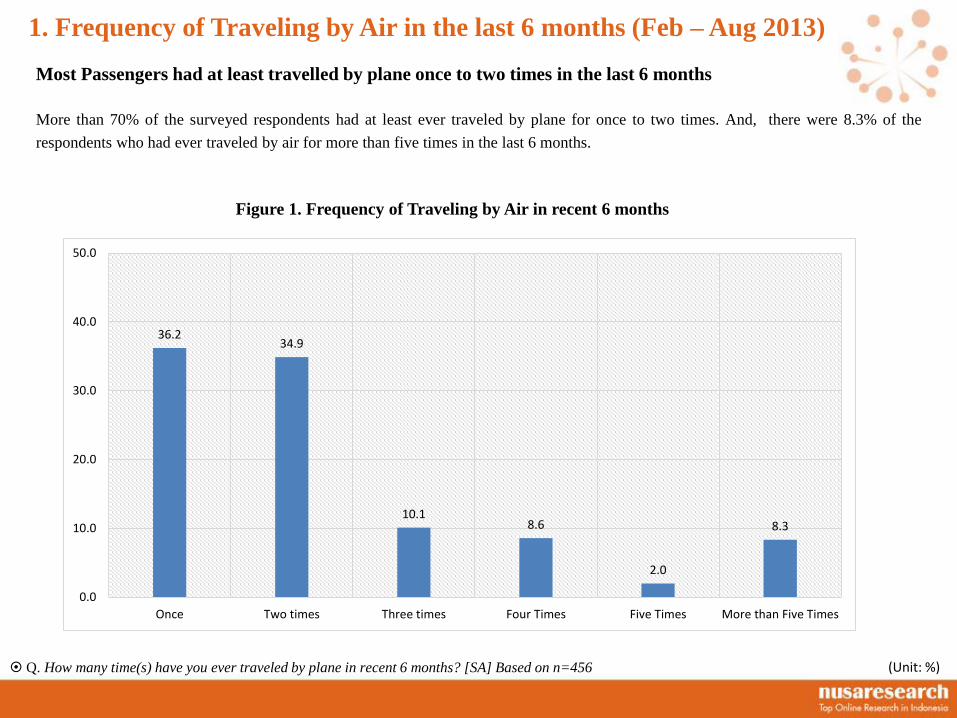
More than 70% of the surveyed respondents had at least ever traveled by plane for once to two times. And, there were 8.3% of the
respondents who had ever traveled by air for more than five times in the last 6 months.
Most Passengers had at least travelled by plane once to two times in the last 6 months
Figure 1. Frequency of Traveling by Air in recent 6 months
Q. How many time(s) have you ever traveled by plane in recent 6 months? [SA] Based on n=456
1. Frequency of Traveling by Air in the last 6 months (Feb – Aug 2013)
(Unit: %)
36.234.9
10.18.6
2.0
8.3
0.0
10.0
20.0
30.0
40.0
50.0
Once Two times Three times Four Times Five Times More than Five Times
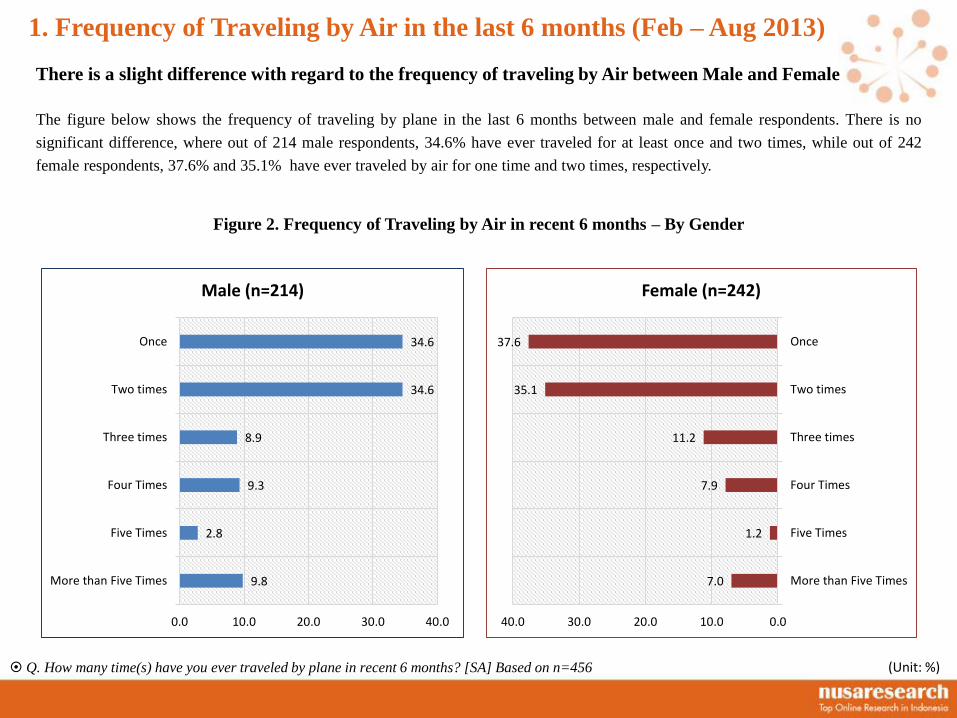
The figure below shows the frequency of traveling by plane in the last 6 months between male and female respondents. There is no
significant difference, where out of 214 male respondents, 34.6% have ever traveled for at least once and two times, while out of 242
female respondents, 37.6% and 35.1% have ever traveled by air for one time and two times, respectively.
Figure 2. Frequency of Traveling by Air in recent 6 months – By Gender
Q. How many time(s) have you ever traveled by plane in recent 6 months? [SA] Based on n=456 (Unit: %)
1. Frequency of Traveling by Air in the last 6 months (Feb – Aug 2013)
There is a slight difference with regard to the frequency of traveling by Air between Male and Female
9.8
2.8
9.3
8.9
34.6
34.6
0.0 10.0 20.0 30.0 40.0
More than Five Times
Five Times
Four Times
Three times
Two times
Once
Male (n=214)
7.0
1.2
7.9
11.2
35.1
37.6
0.010.020.030.040.0
More than Five Times
Five Times
Four Times
Three times
Two times
Once
Female (n=242)
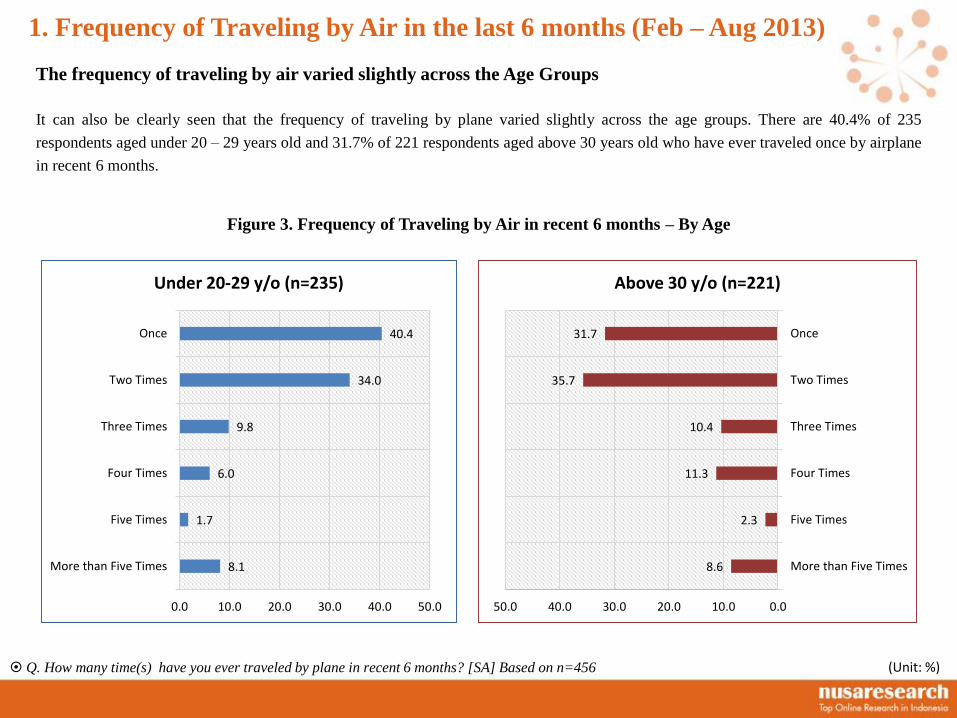
It can also be clearly seen that the frequency of traveling by plane varied slightly across the age groups. There are 40.4% of 235
respondents aged under 20 – 29 years old and 31.7% of 221 respondents aged above 30 years old who have ever traveled once by airplane
in recent 6 months.
Figure 3. Frequency of Traveling by Air in recent 6 months – By Age
Q. How many time(s) have you ever traveled by plane in recent 6 months? [SA] Based on n=456 (Unit: %)
1. Frequency of Traveling by Air in the last 6 months (Feb – Aug 2013)
The frequency of traveling by air varied slightly across the Age Groups
8.1
1.7
6.0
9.8
34.0
40.4
0.0 10.0 20.0 30.0 40.0 50.0
More than Five Times
Five Times
Four Times
Three Times
Two Times
Once
Under 20-29 y/o (n=235)
8.6
2.3
11.3
10.4
35.7
31.7
0.010.020.030.040.050.0
More than Five Times
Five Times
Four Times
Three Times
Two Times
Once
Above 30 y/o (n=221)
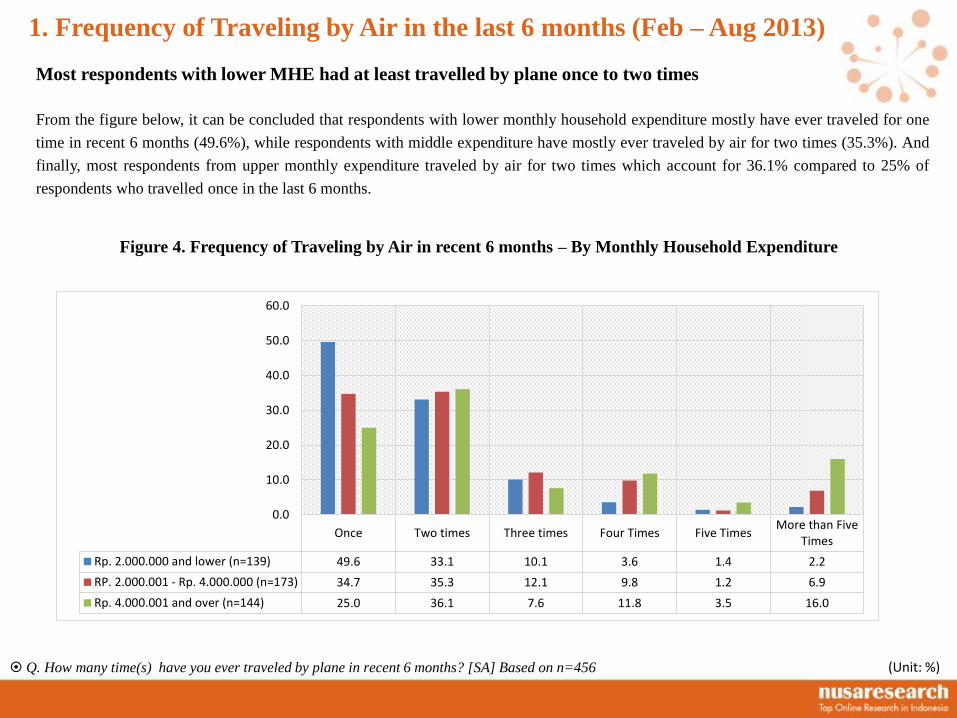
From the figure below, it can be concluded that respondents with lower monthly household expenditure mostly have ever traveled for one
time in recent 6 months (49.6%), while respondents with middle expenditure have mostly ever traveled by air for two times (35.3%). And
finally, most respondents from upper monthly expenditure traveled by air for two times which account for 36.1% compared to 25% of
respondents who travelled once in the last 6 months.
Figure 4. Frequency of Traveling by Air in recent 6 months – By Monthly Household Expenditure
Q. How many time(s) have you ever traveled by plane in recent 6 months? [SA] Based on n=456 (Unit: %)
1. Frequency of Traveling by Air in the last 6 months (Feb – Aug 2013)
Most respondents with lower MHE had at least travelled by plane once to two times
Once Two times Three times Four Times Five TimesMore than Five
Times
Rp. 2.000.000 and lower (n=139) 49.6 33.1 10.1 3.6 1.4 2.2
RP. 2.000.001 - Rp. 4.000.000 (n=173) 34.7 35.3 12.1 9.8 1.2 6.9
Rp. 4.000.001 and over (n=144) 25.0 36.1 7.6 11.8 3.5 16.0
0.0
10.0
20.0
30.0
40.0
50.0
60.0
Q. What Airline did you choose for traveling last time in recent 6 months? [SA] Based on n=456
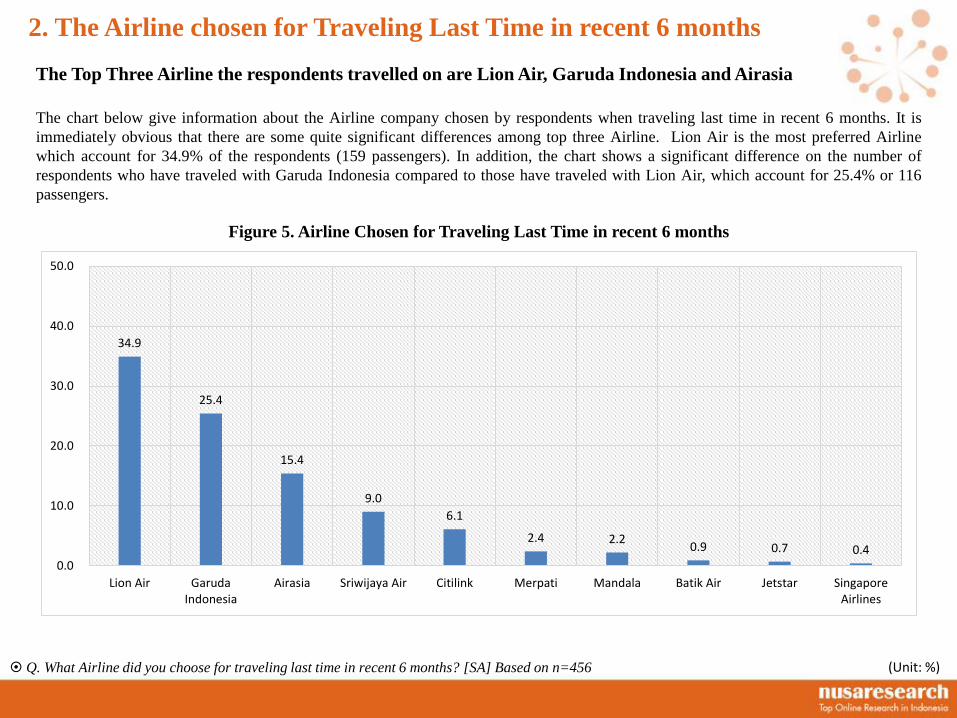
The chart below give information about the Airline company chosen by respondents when traveling last time in recent 6 months. It is
immediately obvious that there are some quite significant differences among top three Airline. Lion Air is the most preferred Airline
which account for 34.9% of the respondents (159 passengers). In addition, the chart shows a significant difference on the number of
respondents who have traveled with Garuda Indonesia compared to those have traveled with Lion Air, which account for 25.4% or 116
passengers.
Figure 5. Airline Chosen for Traveling Last Time in recent 6 months
(Unit: %)
2. The Airline chosen for Traveling Last Time in recent 6 months
The Top Three Airline the respondents travelled on are Lion Air, Garuda Indonesia and Airasia
34.9
25.4
15.4
9.0
6.1
2.4 2.2 0.9 0.7 0.4
0.0
10.0
20.0
30.0
40.0
50.0
Lion Air GarudaIndonesia
Airasia Sriwijaya Air Citilink Merpati Mandala Batik Air Jetstar SingaporeAirlines
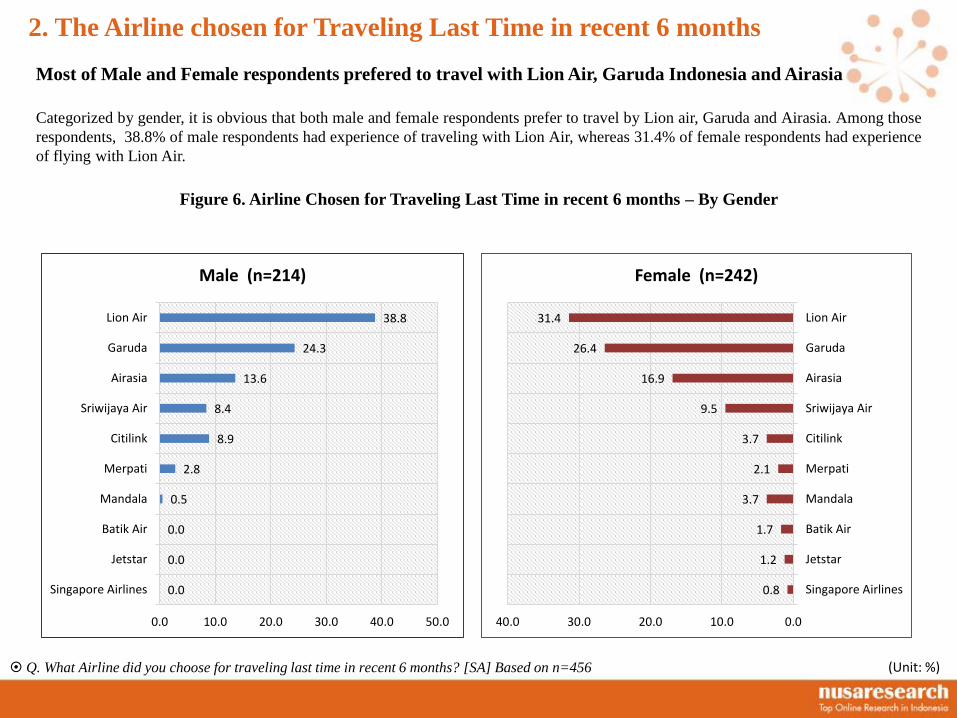
Categorized by gender, it is obvious that both male and female respondents prefer to travel by Lion air, Garuda and Airasia. Among those
respondents, 38.8% of male respondents had experience of traveling with Lion Air, whereas 31.4% of female respondents had experience
of flying with Lion Air.
Figure 6. Airline Chosen for Traveling Last Time in recent 6 months – By Gender
Q. What Airline did you choose for traveling last time in recent 6 months? [SA] Based on n=456 (Unit: %)
2. The Airline chosen for Traveling Last Time in recent 6 months
Most of Male and Female respondents prefered to travel with Lion Air, Garuda Indonesia and Airasia
0.0
0.0
0.0
0.5
2.8
8.9
8.4
13.6
24.3
38.8
0.0 10.0 20.0 30.0 40.0 50.0
Singapore Airlines
Jetstar
Batik Air
Mandala
Merpati
Citilink
Sriwijaya Air
Airasia
Garuda
Lion Air
Male (n=214)
0.8
1.2
1.7
3.7
2.1
3.7
9.5
16.9
26.4
31.4
0.010.020.030.040.0
Singapore Airlines
Jetstar
Batik Air
Mandala
Merpati
Citilink
Sriwijaya Air
Airasia
Garuda
Lion Air
Female (n=242)
Q. What Airline did you choose for traveling last time in recent 6 months? [SA] Based on n=456
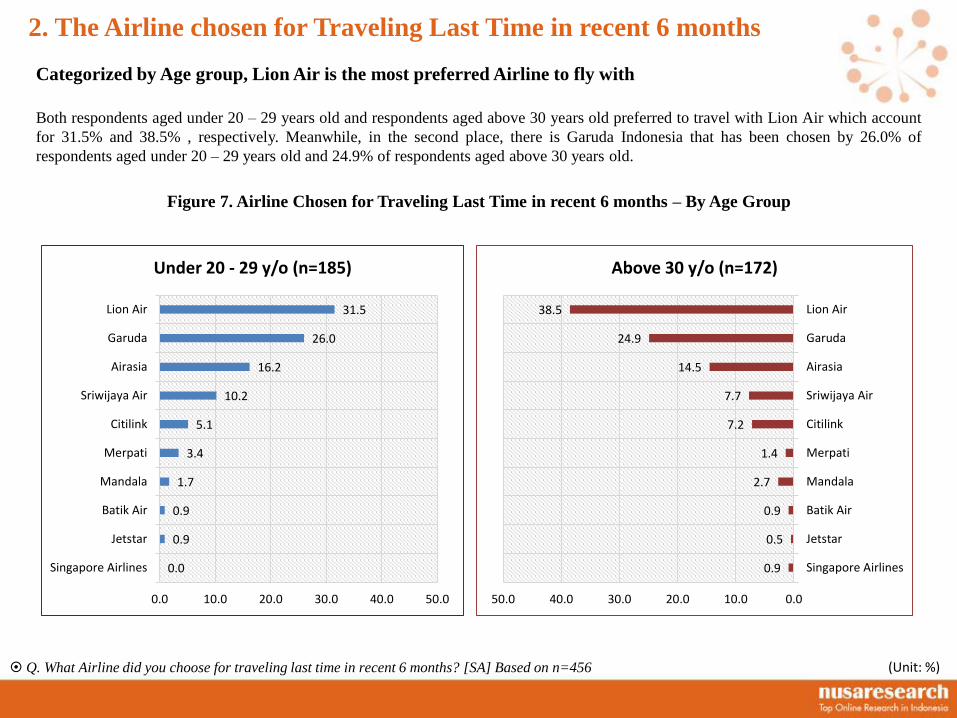
Figure 7. Airline Chosen for Traveling Last Time in recent 6 months – By Age Group
Both respondents aged under 20 – 29 years old and respondents aged above 30 years old preferred to travel with Lion Air which account
for 31.5% and 38.5% , respectively. Meanwhile, in the second place, there is Garuda Indonesia that has been chosen by 26.0% of
respondents aged under 20 – 29 years old and 24.9% of respondents aged above 30 years old.
(Unit: %)
2. The Airline chosen for Traveling Last Time in recent 6 months
Categorized by Age group, Lion Air is the most preferred Airline to fly with
0.0
0.9
0.9
1.7
3.4
5.1
10.2
16.2
26.0
31.5
0.0 10.0 20.0 30.0 40.0 50.0
Singapore Airlines
Jetstar
Batik Air
Mandala
Merpati
Citilink
Sriwijaya Air
Airasia
Garuda
Lion Air
Under 20 - 29 y/o (n=185)
0.9
0.5
0.9
2.7
1.4
7.2
7.7
14.5
24.9
38.5
0.010.020.030.040.050.0
Singapore Airlines
Jetstar
Batik Air
Mandala
Merpati
Citilink
Sriwijaya Air
Airasia
Garuda
Lion Air
Above 30 y/o (n=172)
Q. What Airline did you choose for traveling last time in recent 6 months? [SA] Based on n=456
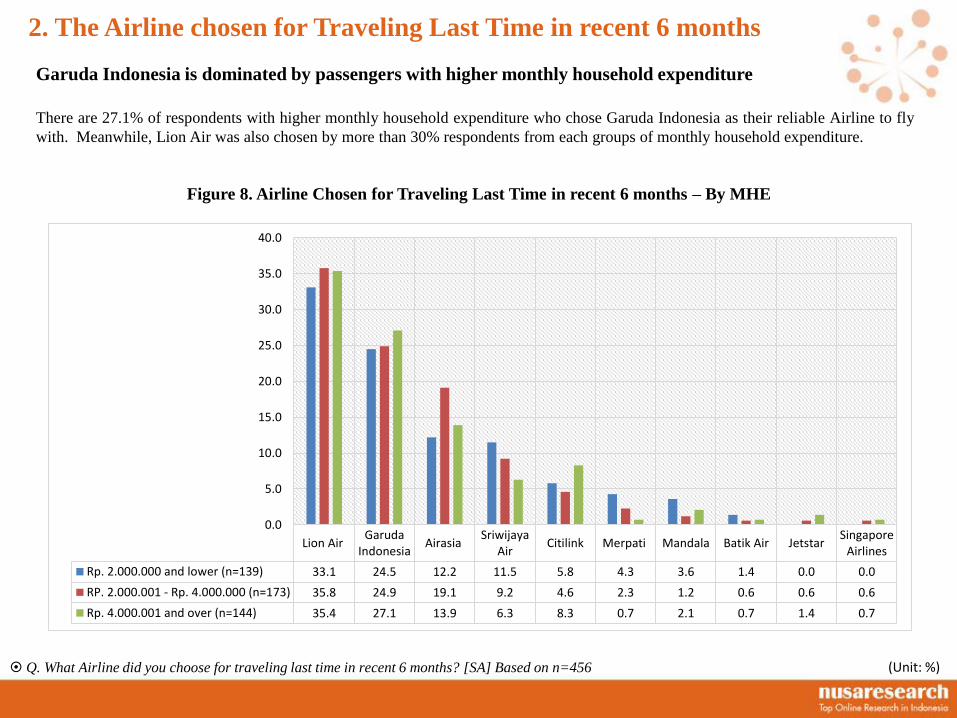
There are 27.1% of respondents with higher monthly household expenditure who chose Garuda Indonesia as their reliable Airline to fly
with. Meanwhile, Lion Air was also chosen by more than 30% respondents from each groups of monthly household expenditure.
Figure 8. Airline Chosen for Traveling Last Time in recent 6 months – By MHE
(Unit: %)
2. The Airline chosen for Traveling Last Time in recent 6 months
Garuda Indonesia is dominated by passengers with higher monthly household expenditure
Lion AirGaruda
IndonesiaAirasia
SriwijayaAir
Citilink Merpati Mandala Batik Air JetstarSingapore
Airlines
Rp. 2.000.000 and lower (n=139) 33.1 24.5 12.2 11.5 5.8 4.3 3.6 1.4 0.0 0.0
RP. 2.000.001 - Rp. 4.000.000 (n=173) 35.8 24.9 19.1 9.2 4.6 2.3 1.2 0.6 0.6 0.6
Rp. 4.000.001 and over (n=144) 35.4 27.1 13.9 6.3 8.3 0.7 2.1 0.7 1.4 0.7
0.0
5.0
10.0
15.0
20.0
25.0
30.0
35.0
40.0
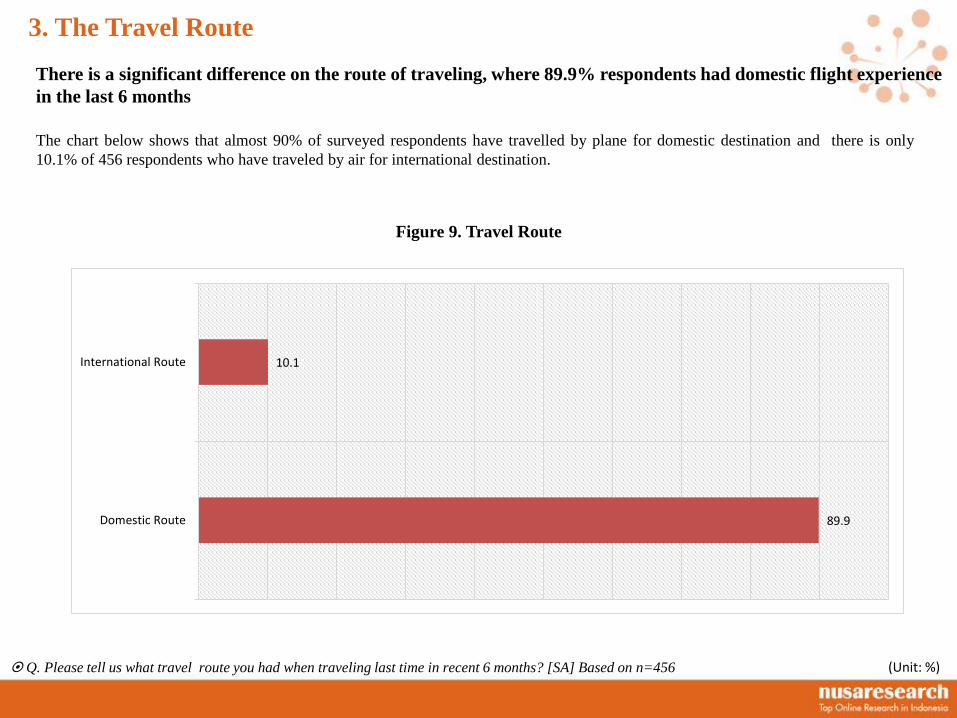
The chart below shows that almost 90% of surveyed respondents have travelled by plane for domestic destination and there is only
10.1% of 456 respondents who have traveled by air for international destination.
Figure 9. Travel Route
Q. Please tell us what travel route you had when traveling last time in recent 6 months? [SA] Based on n=456
89.9
10.1
Domestic Route
International Route
(Unit: %)
3. The Travel Route
There is a significant difference on the route of traveling, where 89.9% respondents had domestic flight experience
in the last 6 months

Both male and female took domestic travel on their last experience of traveling by plane in recent 6 months. There is slight difference
of percentage between male and female respondents who have ever traveled within Indonesia which account for 92.5% and 87.6%
respectively. Meanwhile, there is at least 12.4% of the female respondents who have ever experienced international flight in the last 6
months (February – August 2013).
Figure 10. Travel Route – By Gender
Q. Please tell us what travel route you had when traveling last time in recent 6 months? [SA] Based on n=456 (Unit: %)
3. The Travel Route
The travel route is dominated by Domestic flight
92.587.6
7.512.4
0.0
10.0
20.0
30.0
40.0
50.0
60.0
70.0
80.0
90.0
100.0
Male (n=214) Female (n=242)
Domestic Route International Route
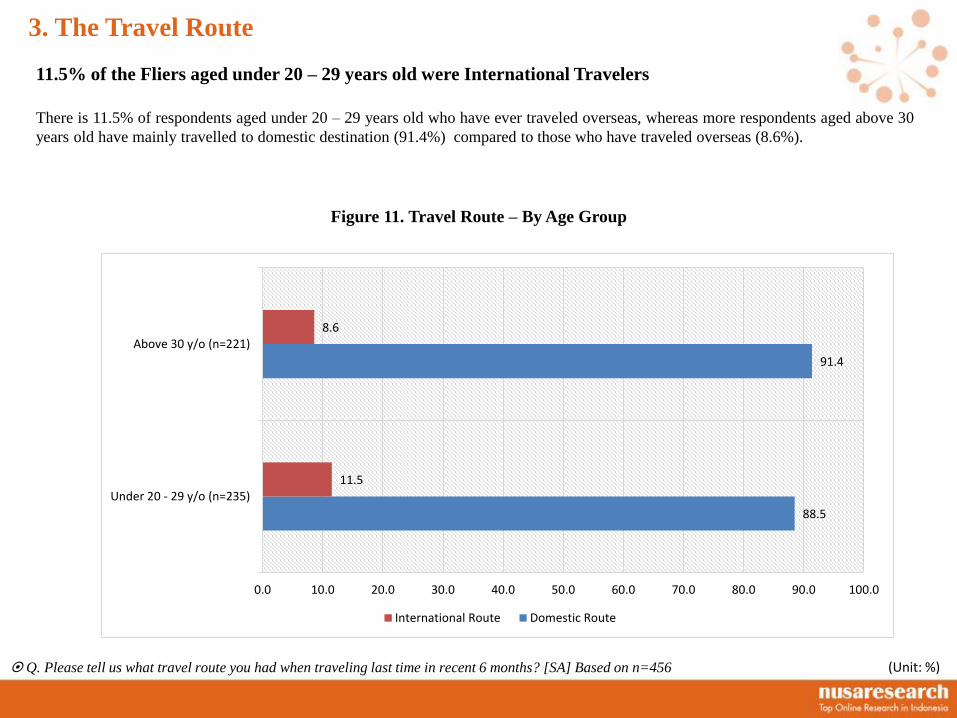
There is 11.5% of respondents aged under 20 – 29 years old who have ever traveled overseas, whereas more respondents aged above 30
years old have mainly travelled to domestic destination (91.4%) compared to those who have traveled overseas (8.6%).
Figure 11. Travel Route – By Age Group
Q. Please tell us what travel route you had when traveling last time in recent 6 months? [SA] Based on n=456 (Unit: %)
3. The Travel Route
11.5% of the Fliers aged under 20 – 29 years old were International Travelers
88.5
91.4
11.5
8.6
0.0 10.0 20.0 30.0 40.0 50.0 60.0 70.0 80.0 90.0 100.0
Under 20 - 29 y/o (n=235)
Above 30 y/o (n=221)
International Route Domestic Route
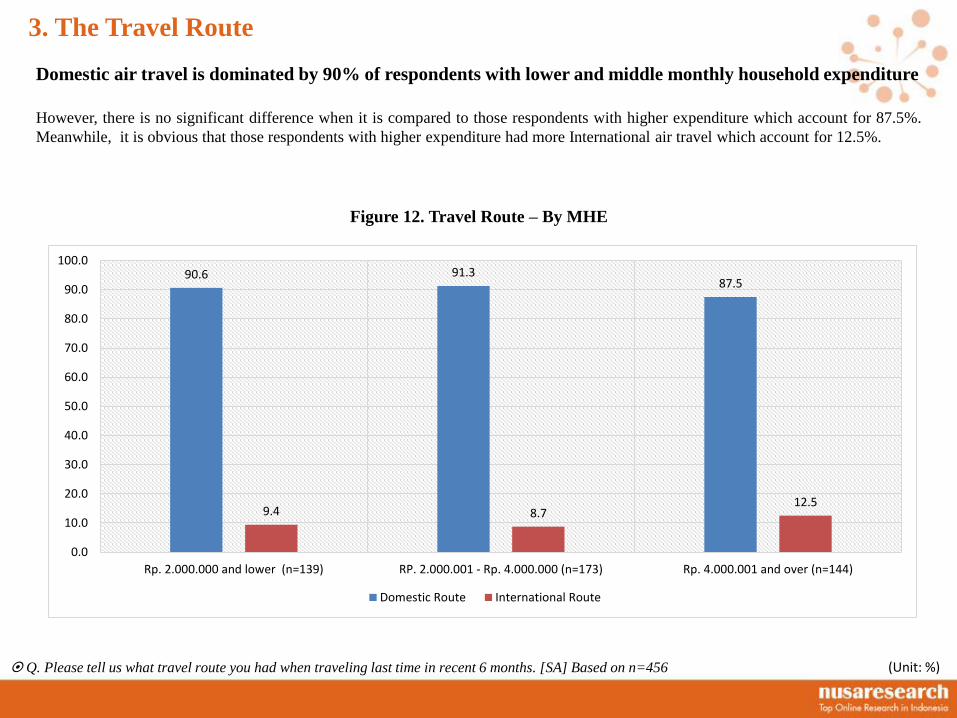
However, there is no significant difference when it is compared to those respondents with higher expenditure which account for 87.5%.
Meanwhile, it is obvious that those respondents with higher expenditure had more International air travel which account for 12.5%.
Figure 12. Travel Route – By MHE
Q. Please tell us what travel route you had when traveling last time in recent 6 months. [SA] Based on n=456 (Unit: %)
3. The Travel Route
Domestic air travel is dominated by 90% of respondents with lower and middle monthly household expenditure
90.6 91.387.5
9.4 8.712.5
0.0
10.0
20.0
30.0
40.0
50.0
60.0
70.0
80.0
90.0
100.0
Rp. 2.000.000 and lower (n=139) RP. 2.000.001 - Rp. 4.000.000 (n=173) Rp. 4.000.001 and over (n=144)
Domestic Route International Route
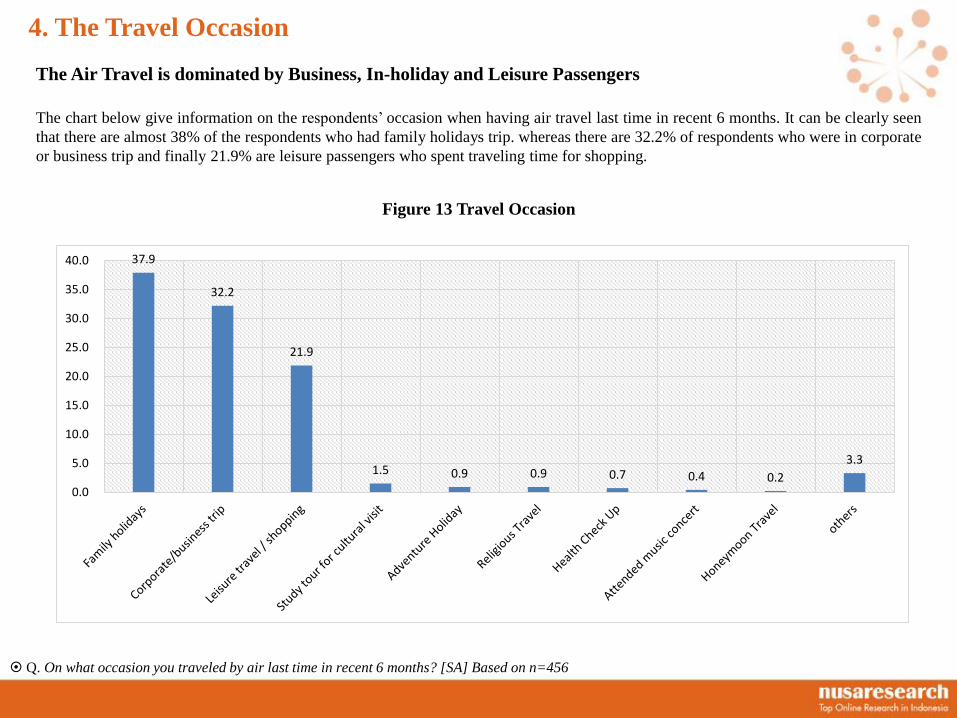
The chart below give information on the respondents’ occasion when having air travel last time in recent 6 months. It can be clearly seen
that there are almost 38% of the respondents who had family holidays trip. whereas there are 32.2% of respondents who were in corporate
or business trip and finally 21.9% are leisure passengers who spent traveling time for shopping.
Figure 13 Travel Occasion
Q. On what occasion you traveled by air last time in recent 6 months? [SA] Based on n=456
4. The Travel Occasion
The Air Travel is dominated by Business, In-holiday and Leisure Passengers
37.9
32.2
21.9
1.5 0.9 0.9 0.7 0.4 0.2
3.3
0.0
5.0
10.0
15.0
20.0
25.0
30.0
35.0
40.0
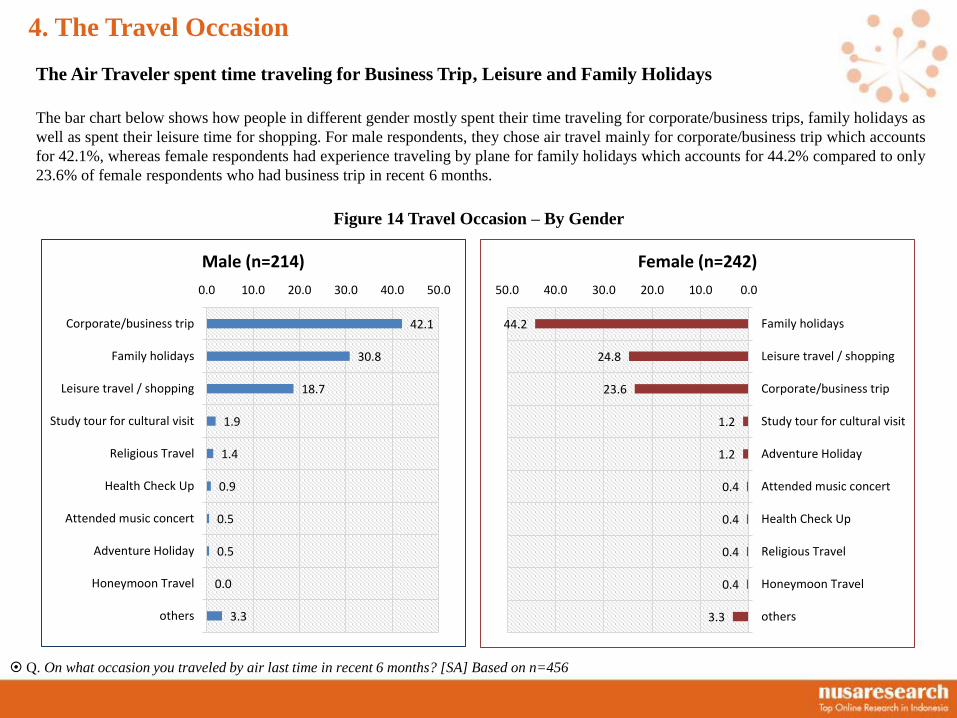
The bar chart below shows how people in different gender mostly spent their time traveling for corporate/business trips, family holidays as
well as spent their leisure time for shopping. For male respondents, they chose air travel mainly for corporate/business trip which accounts
for 42.1%, whereas female respondents had experience traveling by plane for family holidays which accounts for 44.2% compared to only
23.6% of female respondents who had business trip in recent 6 months.
Figure 14 Travel Occasion – By Gender
Q. On what occasion you traveled by air last time in recent 6 months? [SA] Based on n=456
4. The Travel Occasion
The Air Traveler spent time traveling for Business Trip, Leisure and Family Holidays
3.3
0.0
0.5
0.5
0.9
1.4
1.9
18.7
30.8
42.1
0.0 10.0 20.0 30.0 40.0 50.0
others
Honeymoon Travel
Adventure Holiday
Attended music concert
Health Check Up
Religious Travel
Study tour for cultural visit
Leisure travel / shopping
Family holidays
Corporate/business trip
Male (n=214)
3.3
0.4
0.4
0.4
0.4
1.2
1.2
23.6
24.8
44.2
0.010.020.030.040.050.0
others
Honeymoon Travel
Religious Travel
Health Check Up
Attended music concert
Adventure Holiday
Study tour for cultural visit
Corporate/business trip
Leisure travel / shopping
Family holidays
Female (n=242)
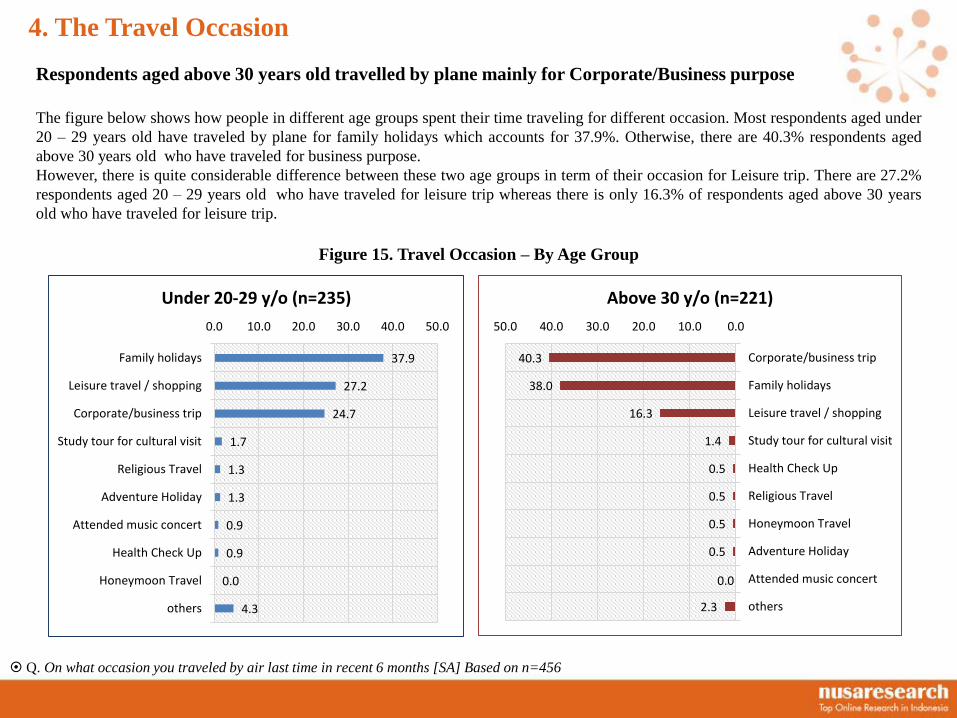
The figure below shows how people in different age groups spent their time traveling for different occasion. Most respondents aged under
20 – 29 years old have traveled by plane for family holidays which accounts for 37.9%. Otherwise, there are 40.3% respondents aged
above 30 years old who have traveled for business purpose.
However, there is quite considerable difference between these two age groups in term of their occasion for Leisure trip. There are 27.2%
respondents aged 20 – 29 years old who have traveled for leisure trip whereas there is only 16.3% of respondents aged above 30 years
old who have traveled for leisure trip.
Figure 15. Travel Occasion – By Age Group
Q. On what occasion you traveled by air last time in recent 6 months [SA] Based on n=456
4. The Travel Occasion
Respondents aged above 30 years old travelled by plane mainly for Corporate/Business purpose
4.3
0.0
0.9
0.9
1.3
1.3
1.7
24.7
27.2
37.9
0.0 10.0 20.0 30.0 40.0 50.0
others
Honeymoon Travel
Health Check Up
Attended music concert
Adventure Holiday
Religious Travel
Study tour for cultural visit
Corporate/business trip
Leisure travel / shopping
Family holidays
Under 20-29 y/o (n=235)
2.3
0.0
0.5
0.5
0.5
0.5
1.4
16.3
38.0
40.3
0.010.020.030.040.050.0
others
Attended music concert
Adventure Holiday
Honeymoon Travel
Religious Travel
Health Check Up
Study tour for cultural visit
Leisure travel / shopping
Family holidays
Corporate/business trip
Above 30 y/o (n=221)
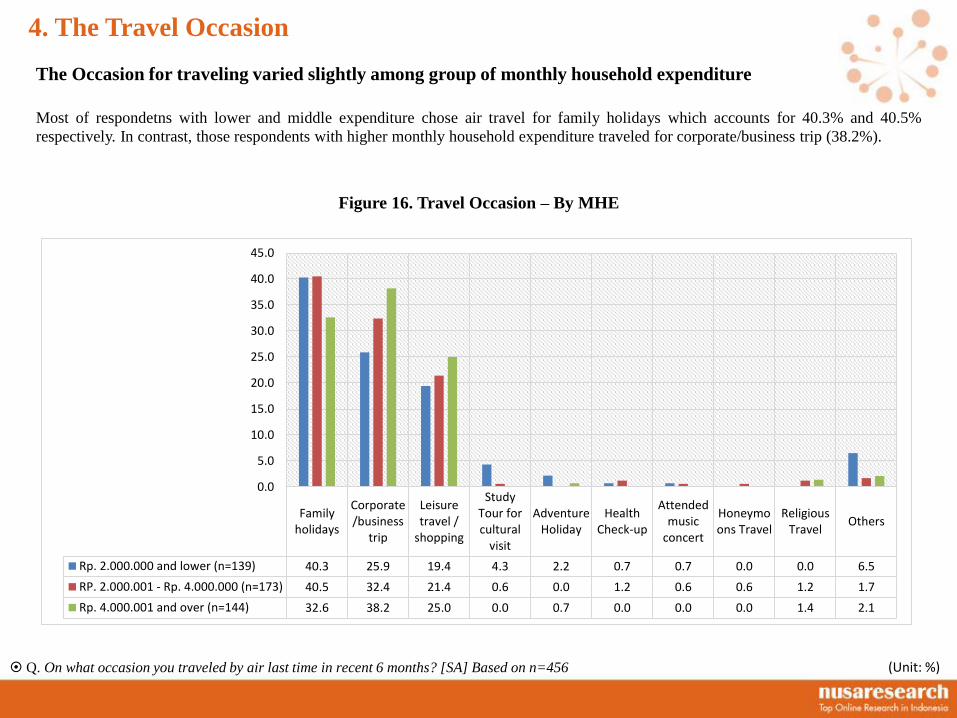
Most of respondetns with lower and middle expenditure chose air travel for family holidays which accounts for 40.3% and 40.5%
respectively. In contrast, those respondents with higher monthly household expenditure traveled for corporate/business trip (38.2%).
Figure 16. Travel Occasion – By MHE
Q. On what occasion you traveled by air last time in recent 6 months? [SA] Based on n=456 (Unit: %)
4. The Travel Occasion
The Occasion for traveling varied slightly among group of monthly household expenditure
Familyholidays
Corporate/business
trip
Leisuretravel /
shopping
StudyTour forcultural
visit
AdventureHoliday
HealthCheck-up
Attendedmusic
concert
Honeymoons Travel
ReligiousTravel
Others
Rp. 2.000.000 and lower (n=139) 40.3 25.9 19.4 4.3 2.2 0.7 0.7 0.0 0.0 6.5
RP. 2.000.001 - Rp. 4.000.000 (n=173) 40.5 32.4 21.4 0.6 0.0 1.2 0.6 0.6 1.2 1.7
Rp. 4.000.001 and over (n=144) 32.6 38.2 25.0 0.0 0.7 0.0 0.0 0.0 1.4 2.1
0.0
5.0
10.0
15.0
20.0
25.0
30.0
35.0
40.0
45.0
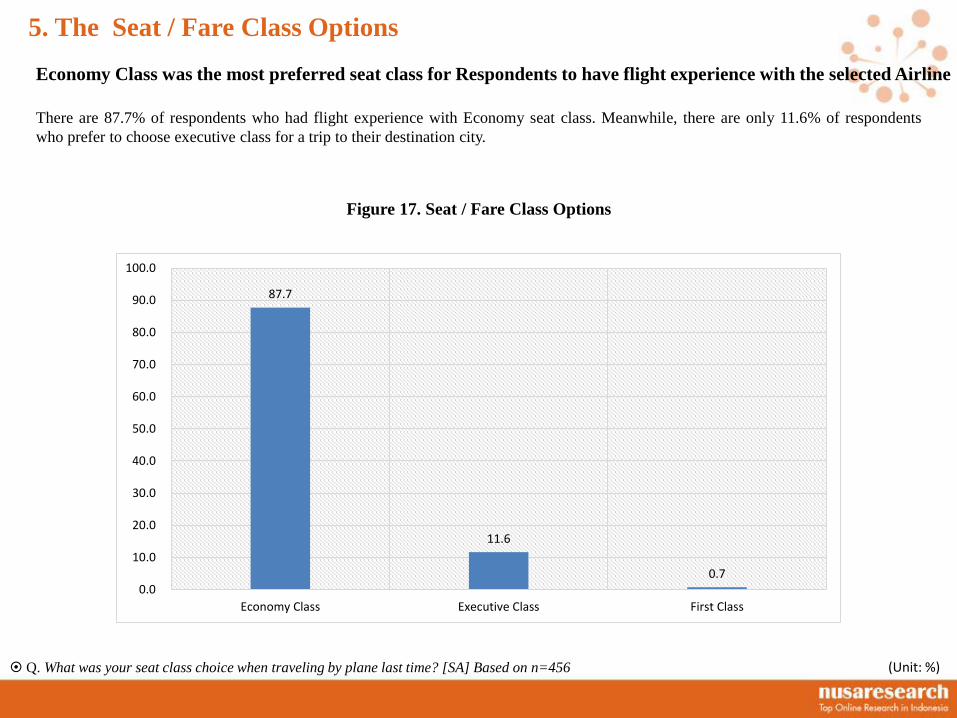
There are 87.7% of respondents who had flight experience with Economy seat class. Meanwhile, there are only 11.6% of respondents
who prefer to choose executive class for a trip to their destination city.
Figure 17. Seat / Fare Class Options
Q. What was your seat class choice when traveling by plane last time? [SA] Based on n=456 (Unit: %)
5. The Seat / Fare Class Options
Economy Class was the most preferred seat class for Respondents to have flight experience with the selected Airline
87.7
11.6
0.7 0.0
10.0
20.0
30.0
40.0
50.0
60.0
70.0
80.0
90.0
100.0
Economy Class Executive Class First Class
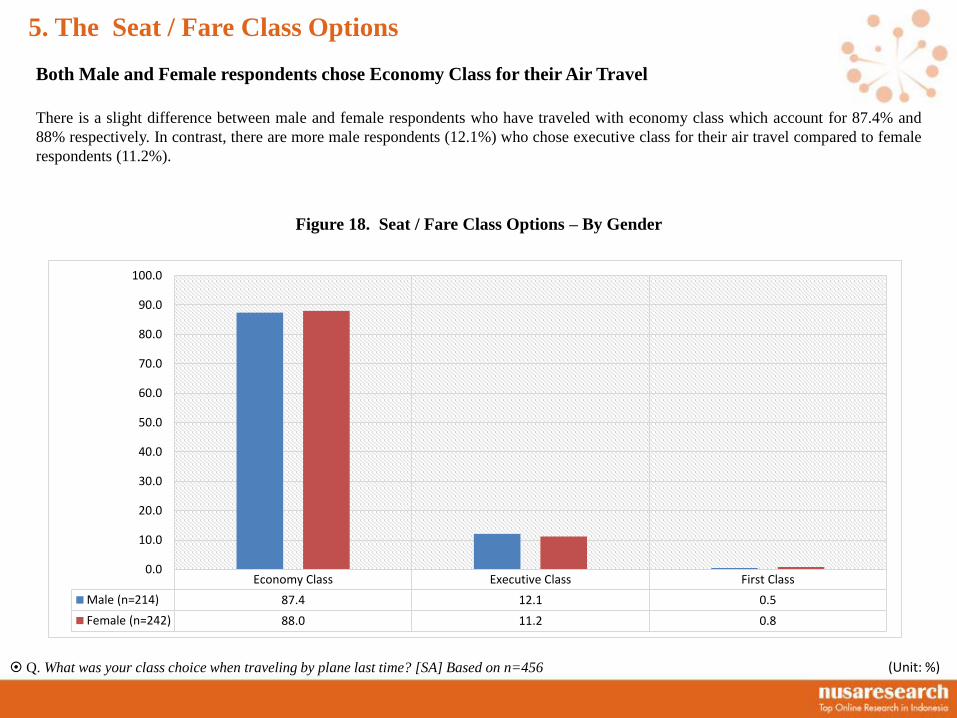
There is a slight difference between male and female respondents who have traveled with economy class which account for 87.4% and
88% respectively. In contrast, there are more male respondents (12.1%) who chose executive class for their air travel compared to female
respondents (11.2%).
Figure 18. Seat / Fare Class Options – By Gender
Q. What was your class choice when traveling by plane last time? [SA] Based on n=456 (Unit: %)
5. The Seat / Fare Class Options
Both Male and Female respondents chose Economy Class for their Air Travel
Economy Class Executive Class First Class
Male (n=214) 87.4 12.1 0.5
Female (n=242) 88.0 11.2 0.8
0.0
10.0
20.0
30.0
40.0
50.0
60.0
70.0
80.0
90.0
100.0
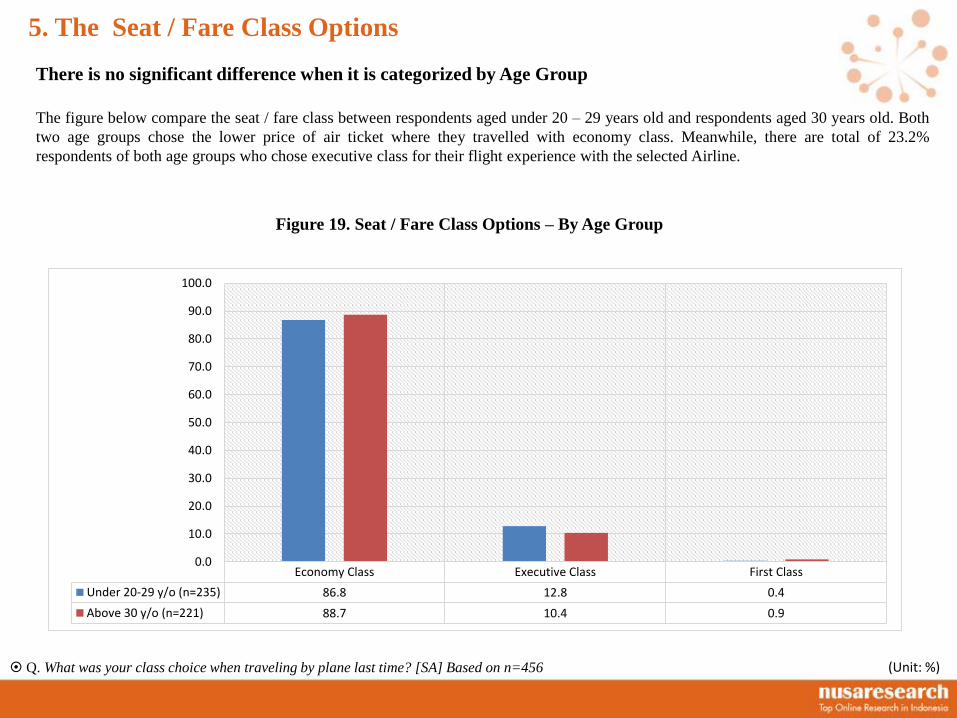
The figure below compare the seat / fare class between respondents aged under 20 – 29 years old and respondents aged 30 years old. Both
two age groups chose the lower price of air ticket where they travelled with economy class. Meanwhile, there are total of 23.2%
respondents of both age groups who chose executive class for their flight experience with the selected Airline.
Figure 19. Seat / Fare Class Options – By Age Group
Q. What was your class choice when traveling by plane last time? [SA] Based on n=456 (Unit: %)
5. The Seat / Fare Class Options
There is no significant difference when it is categorized by Age Group
Economy Class Executive Class First Class
Under 20-29 y/o (n=235) 86.8 12.8 0.4
Above 30 y/o (n=221) 88.7 10.4 0.9
0.0
10.0
20.0
30.0
40.0
50.0
60.0
70.0
80.0
90.0
100.0
There are 13.9% of respondents with higher expenditure who took executive airfare/seat class. Meanwhile, there are no significant
difference among respondents who have flight experience with economy airfare class, where more than 80% of respondents from each
expenditure groups chose economy class on their last travel in recent 6 months.
Figure 20. Seat / Fare Class Options – By MHE
Q. What was your class choice when traveling by plane last time? [SA] Based on n=456 (Unit: %)
5. The Seat / Fare Class Options
Higher expenditure respondents score highest percentage of having flight experience with Executive Airfare Class
Economy Class Executive Class First Class
Rp. 2.000.000 and lower (n=139) 89.9 10.1 0.0
RP. 2.000.001 - Rp. 4.000.000 (n=173) 88.4 11.0 0.6
Rp. 4.000.001 and over (n=144) 84.7 13.9 1.4
0.0
10.0
20.0
30.0
40.0
50.0
60.0
70.0
80.0
90.0
100.0
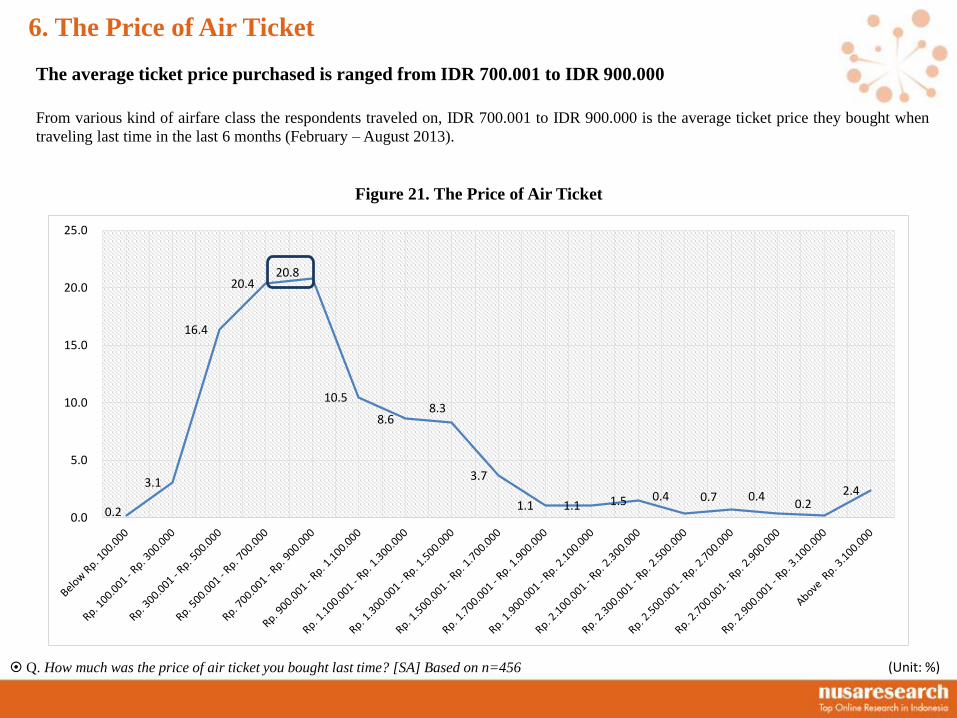
Figure 21. The Price of Air Ticket
Q. How much was the price of air ticket you bought last time? [SA] Based on n=456
From various kind of airfare class the respondents traveled on, IDR 700.001 to IDR 900.000 is the average ticket price they bought when
traveling last time in the last 6 months (February – August 2013).
0.2
3.1
16.4
20.4 20.8
10.5
8.6 8.3
3.7
1.1 1.1 1.5 0.4 0.7 0.4 0.2
2.4
0.0
5.0
10.0
15.0
20.0
25.0
(Unit: %)
6. The Price of Air Ticket
The average ticket price purchased is ranged from IDR 700.001 to IDR 900.000
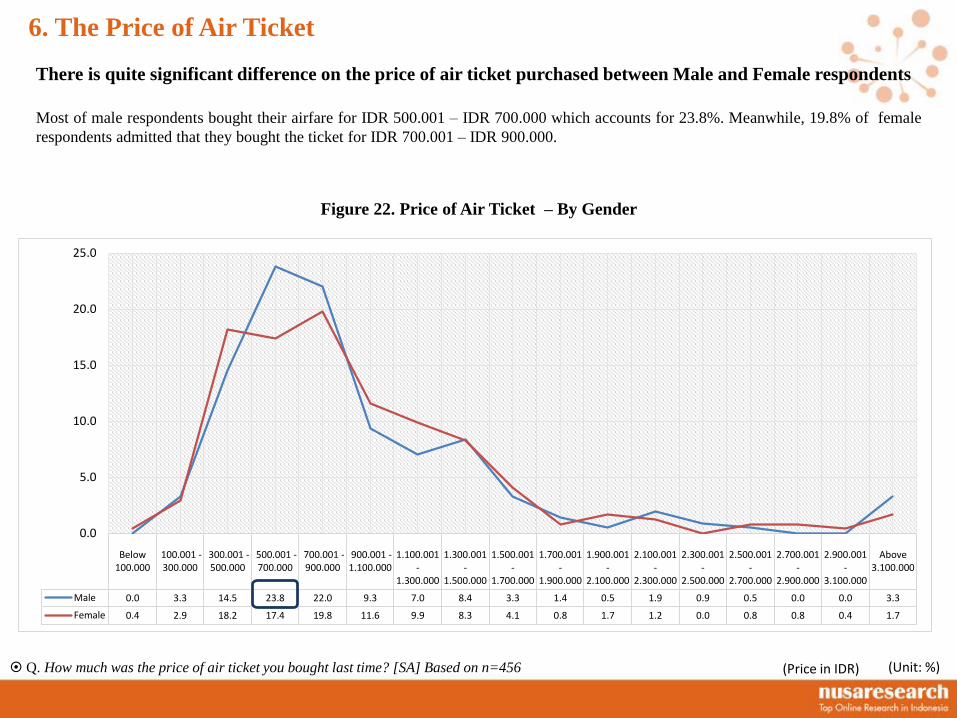
Most of male respondents bought their airfare for IDR 500.001 – IDR 700.000 which accounts for 23.8%. Meanwhile, 19.8% of female
respondents admitted that they bought the ticket for IDR 700.001 – IDR 900.000.
Figure 22. Price of Air Ticket – By Gender
Q. How much was the price of air ticket you bought last time? [SA] Based on n=456 (Unit: %)
6. The Price of Air Ticket
There is quite significant difference on the price of air ticket purchased between Male and Female respondents
(Price in IDR)
Below100.000
100.001 -300.000
300.001 -500.000
500.001 -700.000
700.001 -900.000
900.001 -1.100.000
1.100.001-
1.300.000
1.300.001-
1.500.000
1.500.001-
1.700.000
1.700.001-
1.900.000
1.900.001-
2.100.000
2.100.001-
2.300.000
2.300.001-
2.500.000
2.500.001-
2.700.000
2.700.001-
2.900.000
2.900.001-
3.100.000
Above3.100.000
Male 0.0 3.3 14.5 23.8 22.0 9.3 7.0 8.4 3.3 1.4 0.5 1.9 0.9 0.5 0.0 0.0 3.3
Female 0.4 2.9 18.2 17.4 19.8 11.6 9.9 8.3 4.1 0.8 1.7 1.2 0.0 0.8 0.8 0.4 1.7
0.0
5.0
10.0
15.0
20.0
25.0
It is obvious that in fact, 23.1% of respondents aged above 30 years old admited that they spent IDR 500.001 – IDR 700.000 for their
flight ticket when traveling last time in recent 6 months. Otherwise, respondents aged under 20 – 29 years old mostly purchased the ticket
that ranged from IDR 700.001 – IDR 900.000.
Figure 23. Price of Air Ticket – By Age Group
Q. How much was the price of air ticket you bought last time? [SA] Based on n=456 (Unit: %)
6. The Price of Air Ticket
There were 23.1% of respondens aged above 30 years old who purchased air ticket for IDR 500.001 – IDR 700.000
(Price in IDR)
Below100.000
100.001 -300.000
300.001 -500.000
500.001 -700.000
700.001 -900.000
900.001 -1.100.000
1.100.001-
1.300.000
1.300.001-
1.500.000
1.500.001-
1.700.000
1.700.001-
1.900.000
1.900.001-
2.100.000
2.100.001-
2.300.000
2.300.001-
2.500.000
2.500.001-
2.700.000
2.700.001-
2.900.000
2.900.001-
3.100.000
Above3.100.000
Under 20 - 29 years old 0.0 5.5 17.4 17.9 20.9 9.8 7.2 9.8 4.7 1.7 0.9 1.3 0.0 0.4 0.0 0.0 2.6
Above 30 years old 0.5 0.5 15.4 23.1 20.8 11.3 10.0 6.8 2.7 0.5 1.4 1.8 0.9 0.9 0.9 0.5 2.3
0.0
5.0
10.0
15.0
20.0
25.0
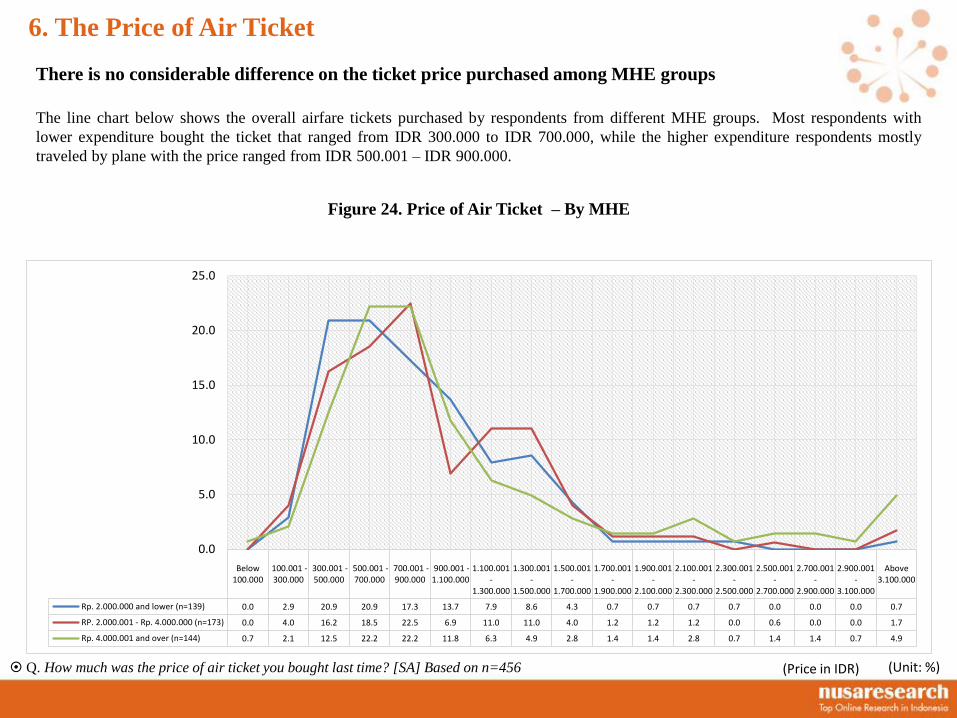
The line chart below shows the overall airfare tickets purchased by respondents from different MHE groups. Most respondents with
lower expenditure bought the ticket that ranged from IDR 300.000 to IDR 700.000, while the higher expenditure respondents mostly
traveled by plane with the price ranged from IDR 500.001 – IDR 900.000.
Figure 24. Price of Air Ticket – By MHE
Q. How much was the price of air ticket you bought last time? [SA] Based on n=456 (Unit: %)
6. The Price of Air Ticket
There is no considerable difference on the ticket price purchased among MHE groups
(Price in IDR)
Below100.000
100.001 -300.000
300.001 -500.000
500.001 -700.000
700.001 -900.000
900.001 -1.100.000
1.100.001-
1.300.000
1.300.001-
1.500.000
1.500.001-
1.700.000
1.700.001-
1.900.000
1.900.001-
2.100.000
2.100.001-
2.300.000
2.300.001-
2.500.000
2.500.001-
2.700.000
2.700.001-
2.900.000
2.900.001-
3.100.000
Above3.100.000
Rp. 2.000.000 and lower (n=139) 0.0 2.9 20.9 20.9 17.3 13.7 7.9 8.6 4.3 0.7 0.7 0.7 0.7 0.0 0.0 0.0 0.7
RP. 2.000.001 - Rp. 4.000.000 (n=173) 0.0 4.0 16.2 18.5 22.5 6.9 11.0 11.0 4.0 1.2 1.2 1.2 0.0 0.6 0.0 0.0 1.7
Rp. 4.000.001 and over (n=144) 0.7 2.1 12.5 22.2 22.2 11.8 6.3 4.9 2.8 1.4 1.4 2.8 0.7 1.4 1.4 0.7 4.9
0.0
5.0
10.0
15.0
20.0
25.0
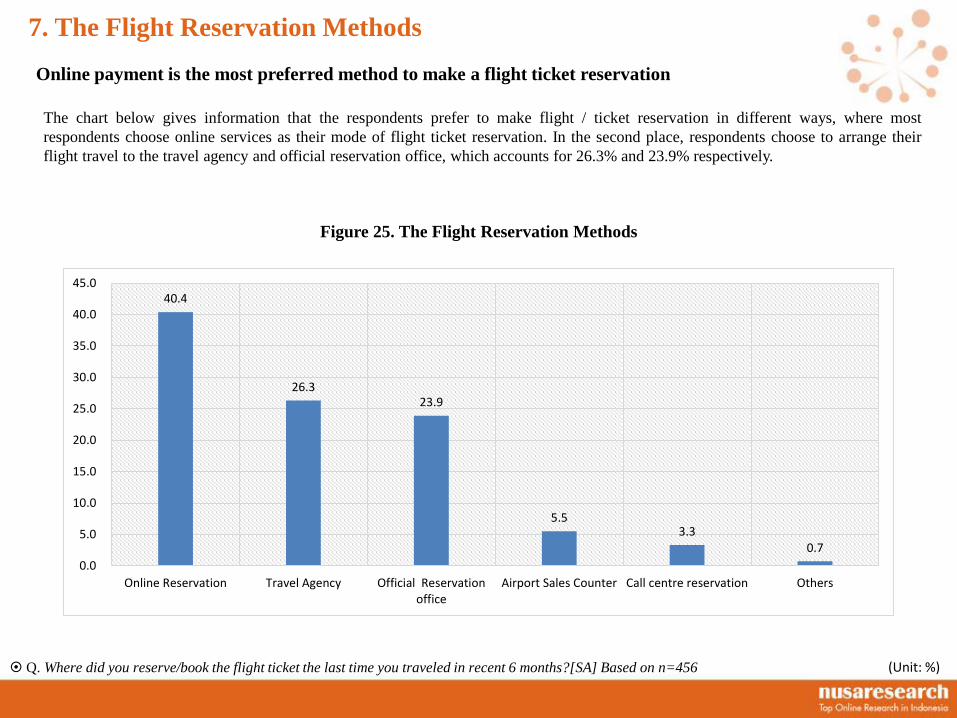
The chart below gives information that the respondents prefer to make flight / ticket reservation in different ways, where most
respondents choose online services as their mode of flight ticket reservation. In the second place, respondents choose to arrange their
flight travel to the travel agency and official reservation office, which accounts for 26.3% and 23.9% respectively.
Figure 25. The Flight Reservation Methods
(Unit: %)
7. The Flight Reservation Methods
Online payment is the most preferred method to make a flight ticket reservation
Q. Where did you reserve/book the flight ticket the last time you traveled in recent 6 months?[SA] Based on n=456
40.4
26.3 23.9
5.5 3.3
0.7
0.0
5.0
10.0
15.0
20.0
25.0
30.0
35.0
40.0
45.0
Online Reservation Travel Agency Official Reservationoffice
Airport Sales Counter Call centre reservation Others
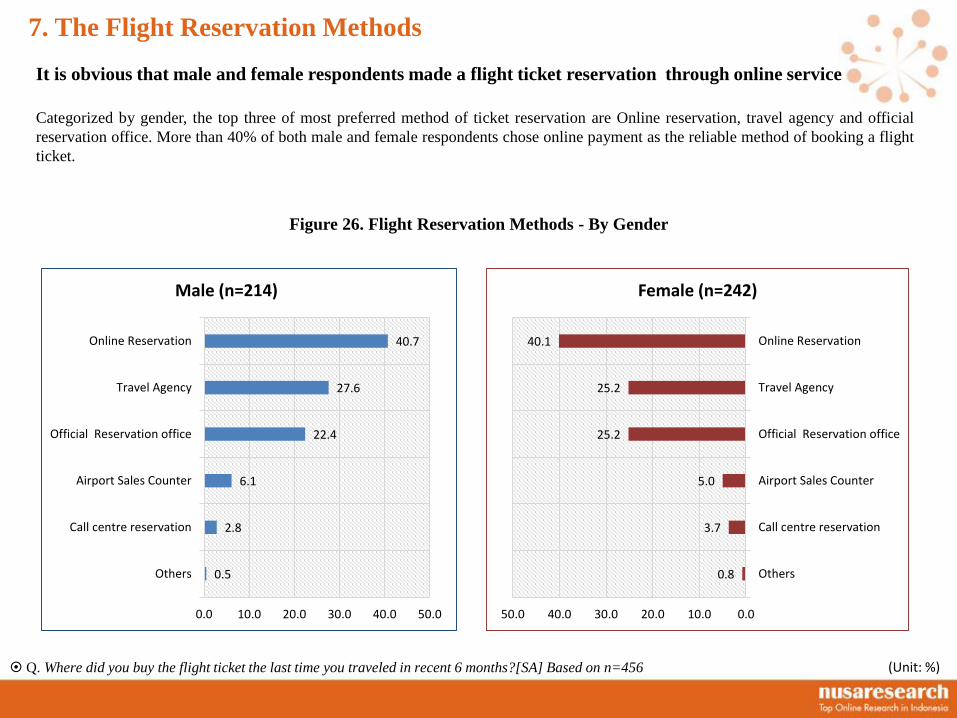
Figure 26. Flight Reservation Methods - By Gender
Categorized by gender, the top three of most preferred method of ticket reservation are Online reservation, travel agency and official
reservation office. More than 40% of both male and female respondents chose online payment as the reliable method of booking a flight
ticket.
(Unit: %)
7. The Flight Reservation Methods
It is obvious that male and female respondents made a flight ticket reservation through online service
Q. Where did you buy the flight ticket the last time you traveled in recent 6 months?[SA] Based on n=456
0.5
2.8
6.1
22.4
27.6
40.7
0.0 10.0 20.0 30.0 40.0 50.0
Others
Call centre reservation
Airport Sales Counter
Official Reservation office
Travel Agency
Online Reservation
Male (n=214)
0.8
3.7
5.0
25.2
25.2
40.1
0.010.020.030.040.050.0
Others
Call centre reservation
Airport Sales Counter
Official Reservation office
Travel Agency
Online Reservation
Female (n=242)
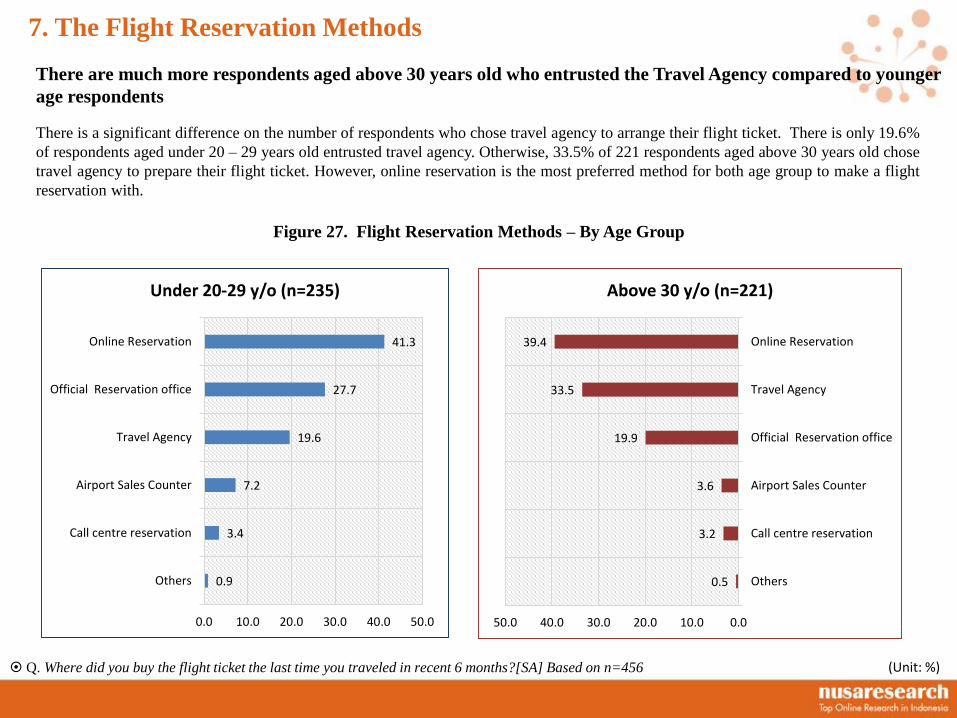
There is a significant difference on the number of respondents who chose travel agency to arrange their flight ticket. There is only 19.6%
of respondents aged under 20 – 29 years old entrusted travel agency. Otherwise, 33.5% of 221 respondents aged above 30 years old chose
travel agency to prepare their flight ticket. However, online reservation is the most preferred method for both age group to make a flight
reservation with.
Figure 27. Flight Reservation Methods – By Age Group
Q. Where did you buy the flight ticket the last time you traveled in recent 6 months?[SA] Based on n=456 (Unit: %)
7. The Flight Reservation Methods
There are much more respondents aged above 30 years old who entrusted the Travel Agency compared to younger
age respondents
0.9
3.4
7.2
19.6
27.7
41.3
0.0 10.0 20.0 30.0 40.0 50.0
Others
Call centre reservation
Airport Sales Counter
Travel Agency
Official Reservation office
Online Reservation
Under 20-29 y/o (n=235)
0.5
3.2
3.6
19.9
33.5
39.4
0.010.020.030.040.050.0
Others
Call centre reservation
Airport Sales Counter
Official Reservation office
Travel Agency
Online Reservation
Above 30 y/o (n=221)
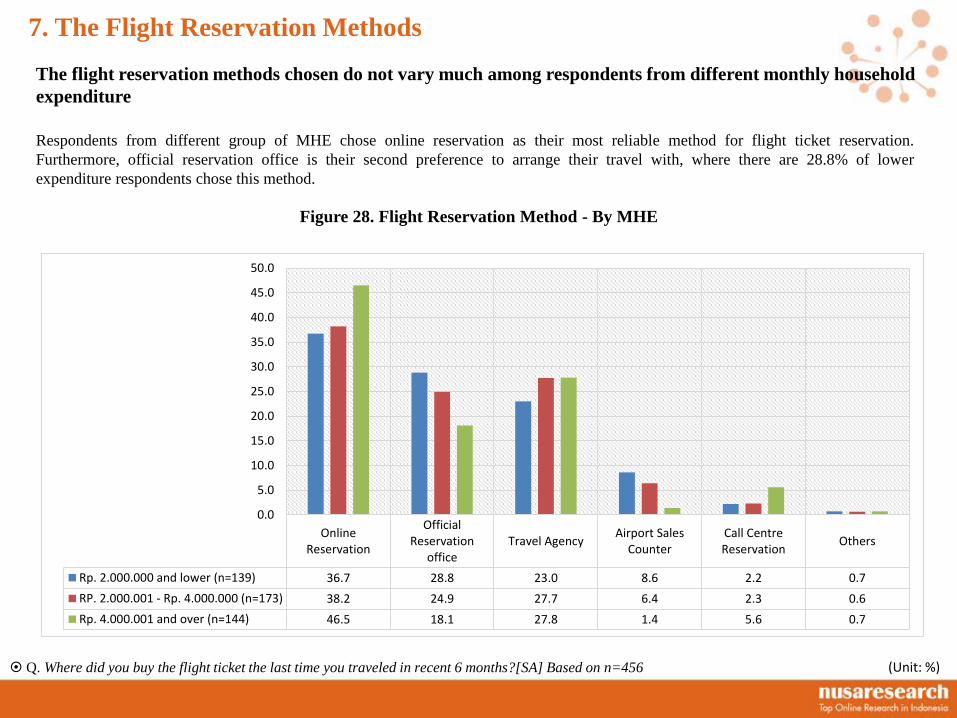
Respondents from different group of MHE chose online reservation as their most reliable method for flight ticket reservation.
Furthermore, official reservation office is their second preference to arrange their travel with, where there are 28.8% of lower
expenditure respondents chose this method.
Figure 28. Flight Reservation Method - By MHE
Q. Where did you buy the flight ticket the last time you traveled in recent 6 months?[SA] Based on n=456 (Unit: %)
7. The Flight Reservation Methods
The flight reservation methods chosen do not vary much among respondents from different monthly household
expenditure
OnlineReservation
OfficialReservation
officeTravel Agency
Airport SalesCounter
Call CentreReservation
Others
Rp. 2.000.000 and lower (n=139) 36.7 28.8 23.0 8.6 2.2 0.7
RP. 2.000.001 - Rp. 4.000.000 (n=173) 38.2 24.9 27.7 6.4 2.3 0.6
Rp. 4.000.001 and over (n=144) 46.5 18.1 27.8 1.4 5.6 0.7
0.0
5.0
10.0
15.0
20.0
25.0
30.0
35.0
40.0
45.0
50.0
Part 1.
Respondents’ Experience of Traveling by Airplane
Part 2.
Overall Passengers Satisfaction toward Airline
Services Quality
Part 3.
Regression model on Passengers Satisfaction toward
Airline Services Quality
B. Research Findings
Part 2. Overall Passengers Satisfaction toward Airline
Services Quality
1. Pre-Flight Airline Services Quality1.1 Reliability 1.2 Responsiveness1.3 Pricing and Transaction
2. In-Flight Airline Services Quality2.1 Tangible2.2 Courtesy of Cabin Crew
3. Post-Flight Aitline Services Quality
Satisfaction Mean3.906
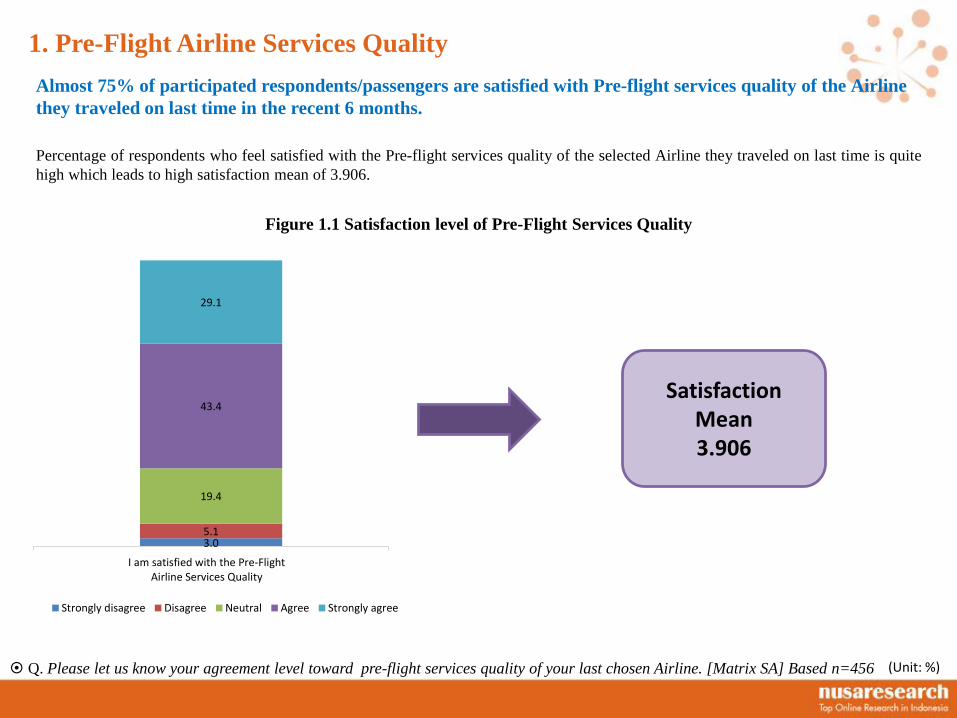
Percentage of respondents who feel satisfied with the Pre-flight services quality of the selected Airline they traveled on last time is quite
high which leads to high satisfaction mean of 3.906.
Almost 75% of participated respondents/passengers are satisfied with Pre-flight services quality of the Airline
they traveled on last time in the recent 6 months.
Figure 1.1 Satisfaction level of Pre-Flight Services Quality
Q. Please let us know your agreement level toward pre-flight services quality of your last chosen Airline. [Matrix SA] Based n=456
3.05.1
19.4
43.4
29.1
I am satisfied with the Pre-FlightAirline Services Quality
Strongly disagree Disagree Neutral Agree Strongly agree
(Unit: %)
1. Pre-Flight Airline Services Quality
The figure below indicated that there is no significant difference on satisfaction mean value either between male and female or between
passengers aged under 20 – 29 years old and passengers aged above 30 years old.
Meanwhile, there is slight difference on satisfaction mean value when it is categorized by monthly household expenditure level. The
respondents with middle expenditure of IDR 2.000.001 – IDR 4.000.000 were more satisfied with the services provided by the selected
Airline before the flight with satisfaction mean of 3.93.
Figure 1.2 Satisfaction mean for Pre-Flight Services by Groups
3.91 3.90
Male (n=214)
Female (n=242)
3.90 3.91
Under 20 - 29 years old(n=235)
Above 30 years old(n=221)
3.88 3.93 3.88
Rp. 2.000.000 and lower (n=139) RP. 2.000.001 - Rp. 4.000.000 (n=173) Rp. 4.000.001 and over (n=144)
(Unit: %)
1. Pre-Flight Airline Services Quality
Satisfaction level of Pre-Flight Services does not vary much among groups
Q. Please let us know your agreement level toward pre-flight services quality of your last chosen Airline. [Matrix SA] Based n=456 (Unit: %)
Based on the top three of most prefered Airline selected by respondents, it is obvious that in general, all travelers achieved mean
satisfaction score of over 3.50. There are 70 passengers who were satisfied with Airasia Pre-Flight services, while there are slight
difference on satisfaction mean value between Lion Air passengers and Garuda Indonesia passengers, which accounts for 3.84 and 4.10,
respectively.
Figure 1.3 Satisfaction mean for Pre-Flight Services by Top Three of selected Airlines
Q. Please let us know your agreement level toward pre-flight services quality of your last chosen Airline. [Matrix SA] Based n=456
3.93
3.84
4.10
Garuda (n=116) Lion Air (n=159) Airasia (n=70)
(Unit: %)
1. Pre-Flight Airline Services Quality
Satisfaction level of Pre-Flight Services does not vary much among selected Airlines
Among all items of Pre-Flight services, Airline website, Seamless online sales system and Knowledgeable employees are voted as best
three Pre-Flight services in term of its reliability on their last experience of flying with the selected Airline, with satisfaction mean of
4.23. 4.07 and 4.00 respectively. In contrast, respondents are less satisfied with their experience of using web check-in service through
dedicated website of their chosen Airline.
Q. Please let us know your agreement level toward pre-flight services quality (reliability) of your chosen Airline? [Matrix SA] Based n=456
Figure 1.4 Passengers Satisfaction Level on Pre-Flight Services (Reliability) items
4.8 3.7 3.9 4.8 3.92.0 3.5 2.0 .9.0 6.8
11.2 16.0 17.59.4
23.0
45.647.1 43.2
36.6
44.5
36.4 29.6 33.348.2
21.7
I found no system error ononline sales when doingreservation and ticketing
transaction
I found no difficulties at salesoffice/airport sales
counter/call center whendoing reservation andticketing transaction
Employees of airline had theknowledge to answer every
questions I asked
The Airline website is veryuseful for me to look for anyimportant flight information
I found no difficulties on usingweb check-in service through
the website
Strongly disagree Disagree Neutral Agree Strongly agree
(Unit: %)
1.1 Pre-Flight Airline Services Quality (Reliability)
Satisfaction level of Passengers differs from item to item of Pre-Flight Airline Services
Mean 4.07 3.95 4.00 4.23 3.73
Among all items of Pre-Flight services (responsiveness), passengers are satisfied overall, where they are most satisfied with the
availability of flight routes to many destination city, thus they found no difficulties on arranging their flight schedule as there were lot of
choices of convenient flight time/schedule and routes everyday.
In fact, 82.6% and 80.5% surveyed passengers were satisfied with availability of flight route and convenient flight choices, respectively.
Otherwise, passengers participated on survey are less satisfied with baggage allowance rule, Airline responsiveness toward emergency
condition and Airline punctuality of departure and arrival time, which leads to lower mean score of 3.54. 3.72 and 3.77 respectively.
Figure 1.5 Passengers Satisfaction Level on Pre-Flight Services (Responsiveness) items
Q. Please let us know your agreement level toward pre-flight services of your chosen Airline?[Matrix SA] Based n=456
2.0 1.8 3.7 3.1 3.92.9 1.5
10.1 9.4 10.714.7 14.0
25.921.7
30.0
51.3 52.6
31.1 38.6
37.5
29.2 30.0 29.2 27.217.8
I found lot of choices ofconvenient flight schedule
everyday
There are lot of flight routeavailable both domestic and
international
The airline is quite responsive ongiving notification for any
emergency condition such ascancelled flight
The Airline has good reputationon punctuality of departure and
arrival time
The Airline has flexible baggageallowance rule (increase or
upsize baggage weight, pre-bookbaggage)
Strongly disagree Disagree Neutral Agree Strongly agree
(Unit: %)
1.2 Pre-Flight Airline Services Quality (Responsiveness)
Satisfaction level of Passengers differs from item to item of Pre-Flight Airline Services
Mean 4.03 4.08 3.72 3.77 3.54
Among all items of Pre-Flight services (pricing and transaction), passengers are most satisfied with wide mode of payment channels that
their chosen Airline provided. With various options of payment channels available, passengers can proceed the ticket payment through
credit card, direct debit or ATM. Moreover, the figure below clearly shows that 10.6% of respondents participated on survey had no such
good experience or impression on ticket price promotion availability that their selected Airline offered.
Figure 1.6 Passengers Satisfaction Level on Pre-Flight Services (Pricing and Transaction) items
Q. Please let us know your agreement level toward pre-flight services of your chosen Airline?[Matrix SA] Based n=456
1.5 1.5 1.8 1.35.5 6.4 8.8
0.9
21.9 23.228.3
14.5
48.9 42.839.3
48.2
22.1 26.1 21.935.1
There is consistency of ticket priceswith given service
The ticket price is reasonable I found lot of availablepromo/discounted ticket price
Airline provided wide options ofpayment channels (credit card, direct
debit, ATM)
Strongly disagree Disagree Neutral Agree Strongly agree
(Unit: %)
1.3 Pre-Flight Airline Services Quality (Pricing and Transaction)
Mean 3.85 3.86 3.71 4.15
More than 80% surveyed respondents were satisfied with the availability of many payment options/channels
1. Pre-Flight Airline Services Quality1.1 Reliability 1.2 Responsiveness1.3 Pricing and Transaction
2. In-Flight Airline Services Quality2.1 Tangible2.2 Courtesy of Cabin Crew
3. Post-Flight Airline Services Quality
Part 2. Overall Passengers Satisfaction toward Airline
Services Quality
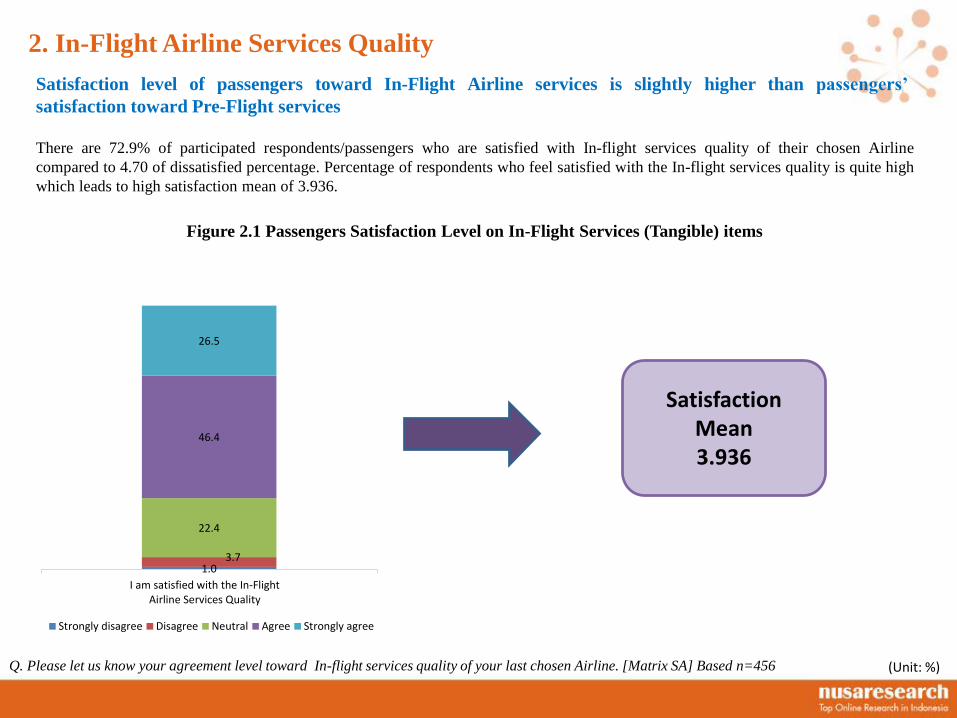
There are 72.9% of participated respondents/passengers who are satisfied with In-flight services quality of their chosen Airline
compared to 4.70 of dissatisfied percentage. Percentage of respondents who feel satisfied with the In-flight services quality is quite high
which leads to high satisfaction mean of 3.936.
Figure 2.1 Passengers Satisfaction Level on In-Flight Services (Tangible) items
Q. Please let us know your agreement level toward In-flight services quality of your last chosen Airline. [Matrix SA] Based n=456
1.03.7
22.4
46.4
26.5
I am satisfied with the In-FlightAirline Services Quality
Strongly disagree Disagree Neutral Agree Strongly agree
(Unit: %)
2. In-Flight Airline Services Quality
Satisfaction level of passengers toward In-Flight Airline services is slightly higher than passengers’
satisfaction toward Pre-Flight services
Satisfaction Mean3.936
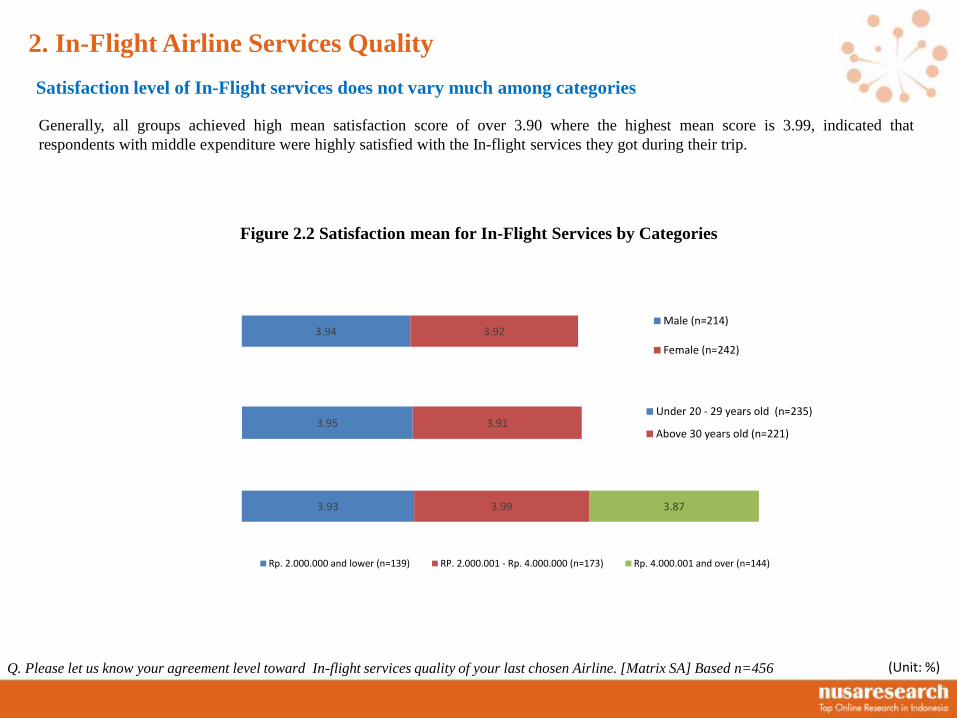
Generally, all groups achieved high mean satisfaction score of over 3.90 where the highest mean score is 3.99, indicated that
respondents with middle expenditure were highly satisfied with the In-flight services they got during their trip.
Figure 2.2 Satisfaction mean for In-Flight Services by Categories
Q. Please let us know your agreement level toward In-flight services quality of your last chosen Airline. [Matrix SA] Based n=456
3.94 3.92Male (n=214)
Female (n=242)
3.95 3.91Under 20 - 29 years old (n=235)
Above 30 years old (n=221)
3.93 3.99 3.87
Rp. 2.000.000 and lower (n=139) RP. 2.000.001 - Rp. 4.000.000 (n=173) Rp. 4.000.001 and over (n=144)
(Unit: %)
2. In-Flight Airline Services Quality
Satisfaction level of In-Flight services does not vary much among categories
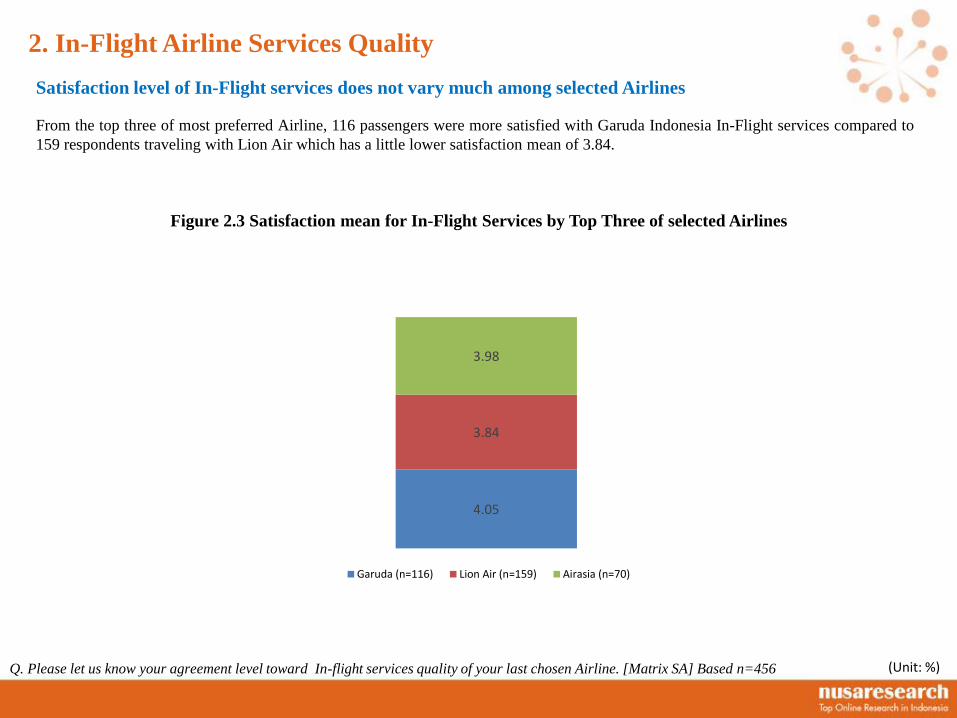
From the top three of most preferred Airline, 116 passengers were more satisfied with Garuda Indonesia In-Flight services compared to
159 respondents traveling with Lion Air which has a little lower satisfaction mean of 3.84.
Figure 2.3 Satisfaction mean for In-Flight Services by Top Three of selected Airlines
Q. Please let us know your agreement level toward In-flight services quality of your last chosen Airline. [Matrix SA] Based n=456
4.05
3.84
3.98
Garuda (n=116) Lion Air (n=159) Airasia (n=70)
(Unit: %)
2. In-Flight Airline Services Quality
Satisfaction level of In-Flight services does not vary much among selected Airlines
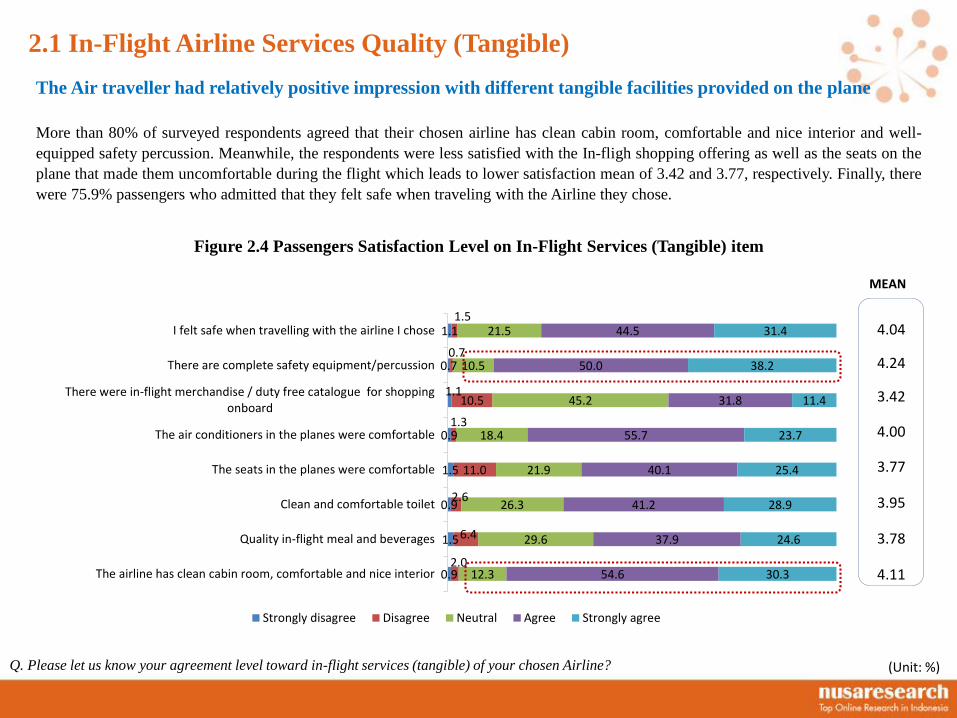
More than 80% of surveyed respondents agreed that their chosen airline has clean cabin room, comfortable and nice interior and well-
equipped safety percussion. Meanwhile, the respondents were less satisfied with the In-fligh shopping offering as well as the seats on the
plane that made them uncomfortable during the flight which leads to lower satisfaction mean of 3.42 and 3.77, respectively. Finally, there
were 75.9% passengers who admitted that they felt safe when traveling with the Airline they chose.
Figure 2.4 Passengers Satisfaction Level on In-Flight Services (Tangible) item
Q. Please let us know your agreement level toward in-flight services (tangible) of your chosen Airline?
0.9
1.5
0.9
1.5
0.9
1.1
0.7
1.1
2.0
6.4
2.6
11.0
1.3
10.5
0.7
1.5
12.3
29.6
26.3
21.9
18.4
45.2
10.5
21.5
54.6
37.9
41.2
40.1
55.7
31.8
50.0
44.5
30.3
24.6
28.9
25.4
23.7
11.4
38.2
31.4
The airline has clean cabin room, comfortable and nice interior
Quality in-flight meal and beverages
Clean and comfortable toilet
The seats in the planes were comfortable
The air conditioners in the planes were comfortable
There were in-flight merchandise / duty free catalogue for shoppingonboard
There are complete safety equipment/percussion
I felt safe when travelling with the airline I chose
Strongly disagree Disagree Neutral Agree Strongly agree
4.04
4.24
3.42
4.00
3.77
3.95
3.78
4.11
MEAN
(Unit: %)
2.1 In-Flight Airline Services Quality (Tangible)
The Air traveller had relatively positive impression with different tangible facilities provided on the plane
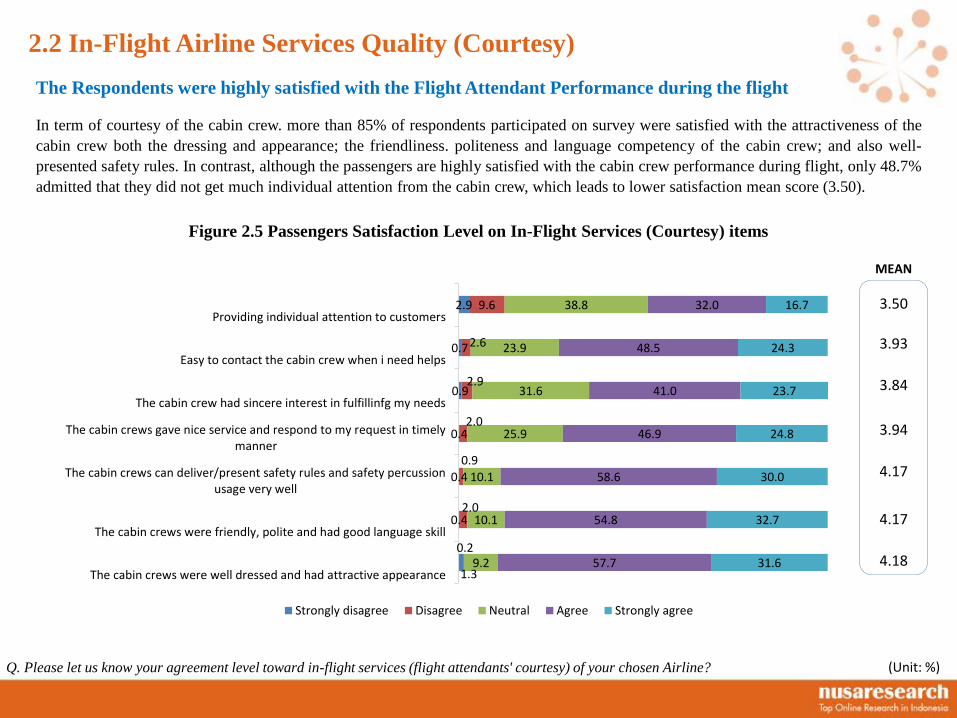
In term of courtesy of the cabin crew. more than 85% of respondents participated on survey were satisfied with the attractiveness of the
cabin crew both the dressing and appearance; the friendliness. politeness and language competency of the cabin crew; and also well-
presented safety rules. In contrast, although the passengers are highly satisfied with the cabin crew performance during flight, only 48.7%
admitted that they did not get much individual attention from the cabin crew, which leads to lower satisfaction mean score (3.50).
Figure 2.5 Passengers Satisfaction Level on In-Flight Services (Courtesy) items
Q. Please let us know your agreement level toward in-flight services (flight attendants' courtesy) of your chosen Airline?
1.3
0.4
0.4
0.4
0.9
0.7
2.9
0.2
2.0
0.9
2.0
2.9
2.6
9.6
9.2
10.1
10.1
25.9
31.6
23.9
38.8
57.7
54.8
58.6
46.9
41.0
48.5
32.0
31.6
32.7
30.0
24.8
23.7
24.3
16.7
The cabin crews were well dressed and had attractive appearance
The cabin crews were friendly, polite and had good language skill
The cabin crews can deliver/present safety rules and safety percussionusage very well
The cabin crews gave nice service and respond to my request in timelymanner
The cabin crew had sincere interest in fulfillinfg my needs
Easy to contact the cabin crew when i need helps
Providing individual attention to customers
Strongly disagree Disagree Neutral Agree Strongly agree
(Unit: %)
2.2 In-Flight Airline Services Quality (Courtesy)
3.50
3.93
3.84
3.94
4.17
4.17
4.18
MEAN
The Respondents were highly satisfied with the Flight Attendant Performance during the flight
1. Pre-Flight Airline Services Quality1.1 Reliability 1.2 Responsiveness1.3 Pricing and Transaction
2. In-Flight Airline Services Quality2.1 Tangible2.2 Courtesy of Cabin Crew
3. Post-Flight Airline Services Quality
Part 3. Overall Passengers Satisfaction toward Airline
Services Quality
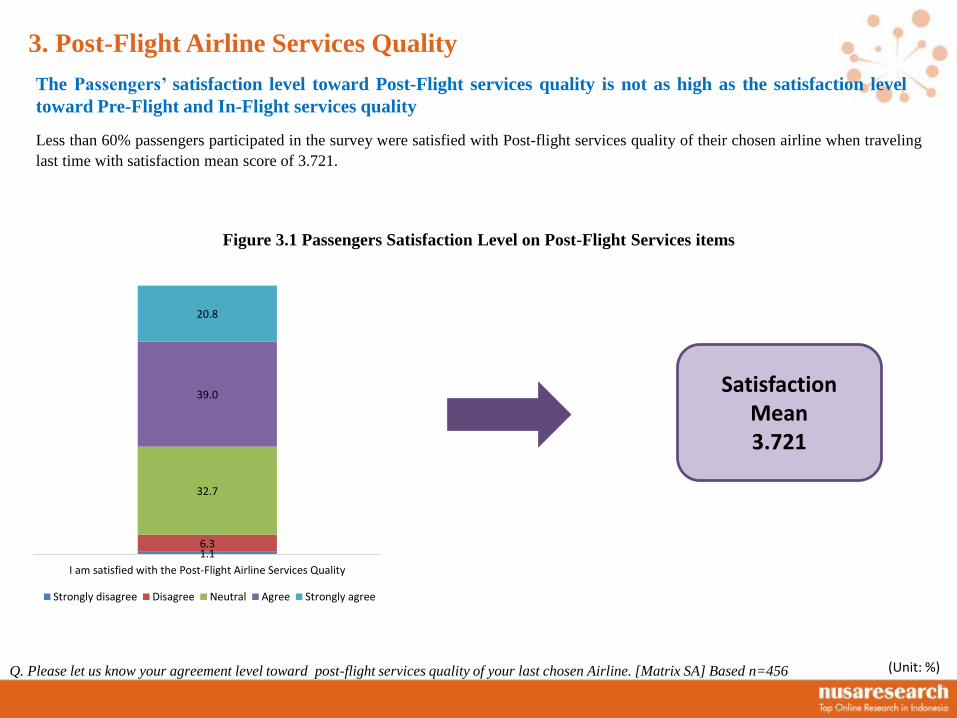
Less than 60% passengers participated in the survey were satisfied with Post-flight services quality of their chosen airline when traveling
last time with satisfaction mean score of 3.721.
Figure 3.1 Passengers Satisfaction Level on Post-Flight Services items
Q. Please let us know your agreement level toward post-flight services quality of your last chosen Airline. [Matrix SA] Based n=456
1.16.3
32.7
39.0
20.8
I am satisfied with the Post-Flight Airline Services Quality
Strongly disagree Disagree Neutral Agree Strongly agree
(Unit: %)
3. Post-Flight Airline Services Quality
The Passengers’ satisfaction level toward Post-Flight services quality is not as high as the satisfaction level
toward Pre-Flight and In-Flight services quality
Satisfaction Mean3.721
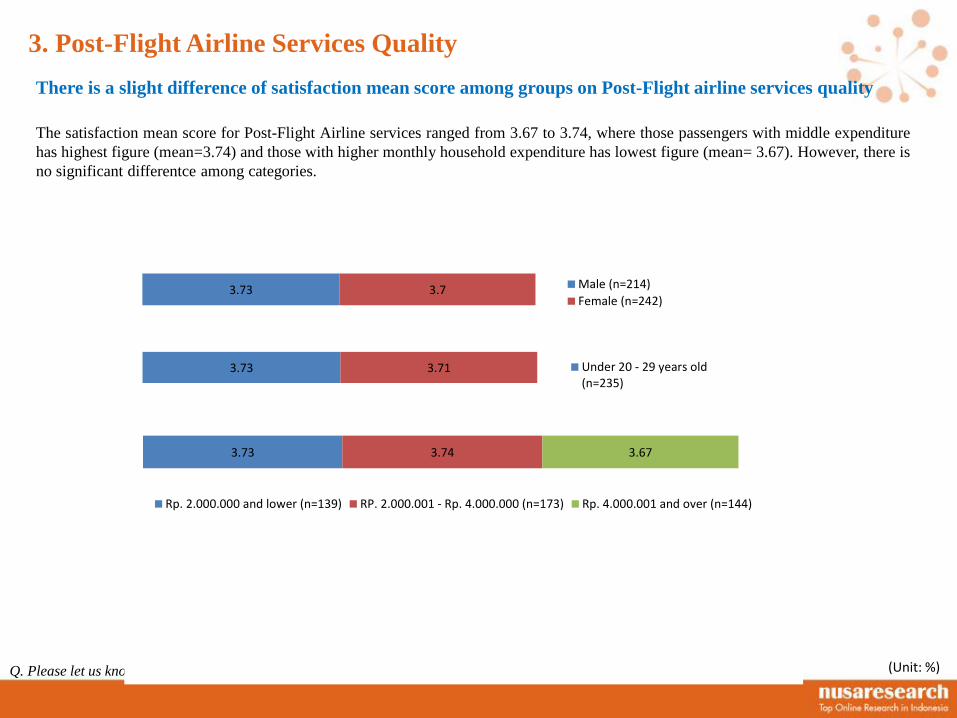
The satisfaction mean score for Post-Flight Airline services ranged from 3.67 to 3.74, where those passengers with middle expenditure
has highest figure (mean=3.74) and those with higher monthly household expenditure has lowest figure (mean= 3.67). However, there is
no significant differentce among categories.
Figure 3.2 Satisfaction mean for Pre-Flight Services by Groups
Q. Please let us know your agreement level toward post-flight services quality of your last chosen Airline. [Matrix SA] Based n=456
3.73 3.7 Male (n=214)
Female (n=242)
3.73 3.71 Under 20 - 29 years old(n=235)
3.73 3.74 3.67
Rp. 2.000.000 and lower (n=139) RP. 2.000.001 - Rp. 4.000.000 (n=173) Rp. 4.000.001 and over (n=144)
(Unit: %)
3. Post-Flight Airline Services Quality
There is a slight difference of satisfaction mean score among groups on Post-Flight airline services quality
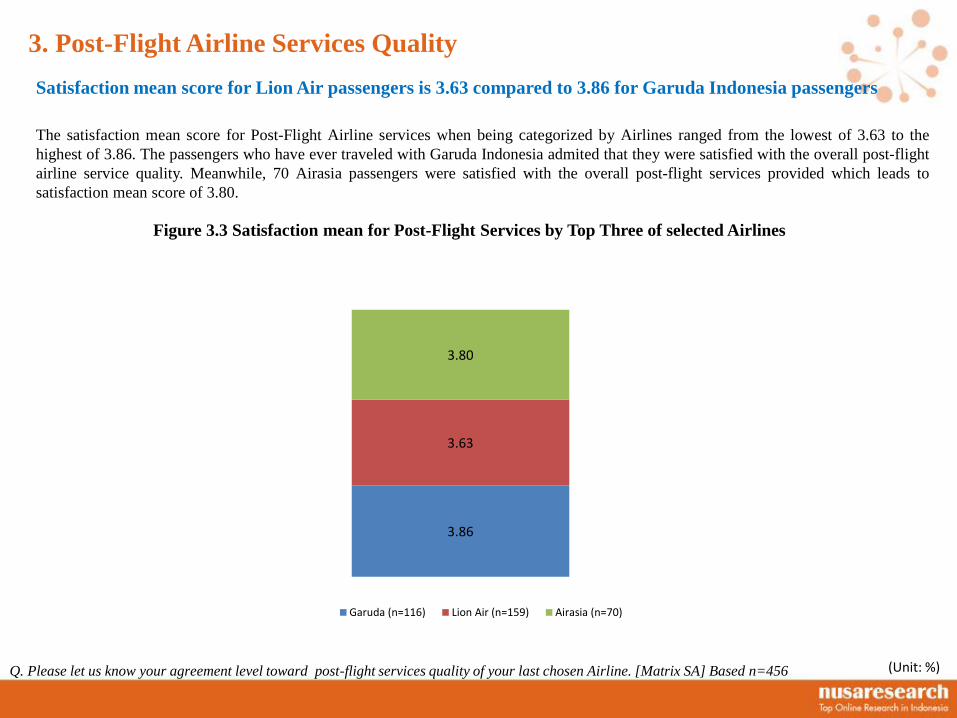
The satisfaction mean score for Post-Flight Airline services when being categorized by Airlines ranged from the lowest of 3.63 to the
highest of 3.86. The passengers who have ever traveled with Garuda Indonesia admited that they were satisfied with the overall post-flight
airline service quality. Meanwhile, 70 Airasia passengers were satisfied with the overall post-flight services provided which leads to
satisfaction mean score of 3.80.
Figure 3.3 Satisfaction mean for Post-Flight Services by Top Three of selected Airlines
Q. Please let us know your agreement level toward post-flight services quality of your last chosen Airline. [Matrix SA] Based n=456
3.86
3.63
3.80
Garuda (n=116) Lion Air (n=159) Airasia (n=70)
(Unit: %)
3. Post-Flight Airline Services Quality
Satisfaction mean score for Lion Air passengers is 3.63 compared to 3.86 for Garuda Indonesia passengers
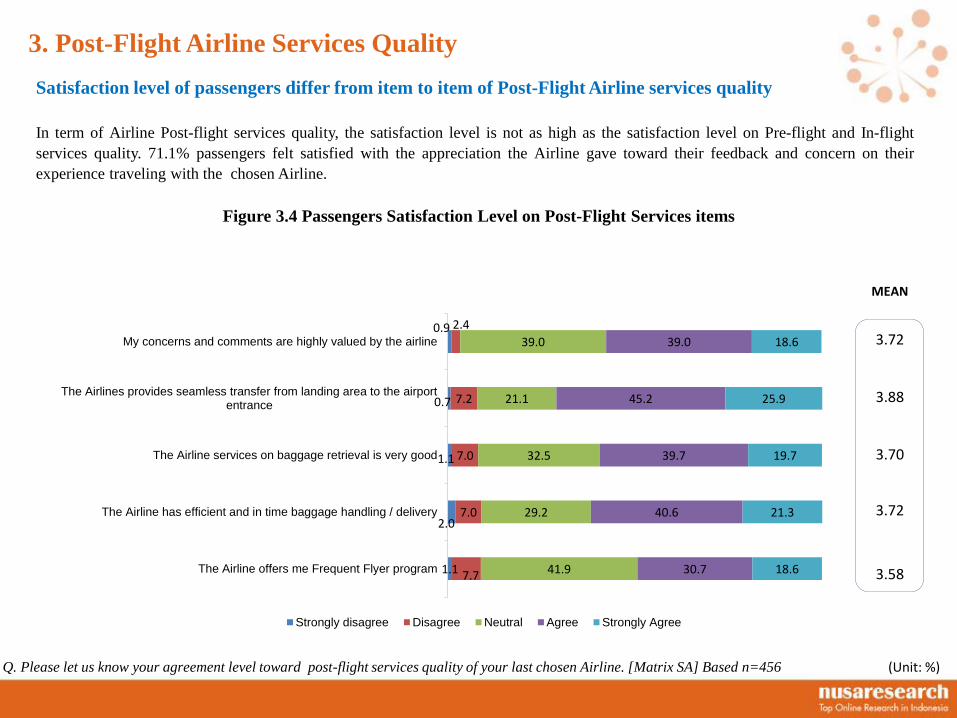
In term of Airline Post-flight services quality, the satisfaction level is not as high as the satisfaction level on Pre-flight and In-flight
services quality. 71.1% passengers felt satisfied with the appreciation the Airline gave toward their feedback and concern on their
experience traveling with the chosen Airline.
Figure 3.4 Passengers Satisfaction Level on Post-Flight Services items
Q. Please let us know your agreement level toward post-flight services quality of your last chosen Airline. [Matrix SA] Based n=456 (Unit: %)
3. Post-Flight Airline Services Quality
Satisfaction level of passengers differ from item to item of Post-Flight Airline services quality
3.72
3.88
3.70
3.72
3.58
MEAN
1.1
2.0
1.1
0.7
0.9
7.7
7.0
7.0
7.2
2.4
41.9
29.2
32.5
21.1
39.0
30.7
40.6
39.7
45.2
39.0
18.6
21.3
19.7
25.9
18.6
The Airline offers me Frequent Flyer program
The Airline has efficient and in time baggage handling / delivery
The Airline services on baggage retrieval is very good
The Airlines provides seamless transfer from landing area to the airportentrance
My concerns and comments are highly valued by the airline
Strongly disagree Disagree Neutral Agree Strongly Agree
Part 1.
Respondents’ Experience of Traveling by Airplane
Part 2.
Overall Passengers Satisfaction toward Airline Services
Quality
Part 3.
Regression analysis on Passengers Satisfaction toward
Airline Services Quality
B. Research Findings
Part 3. Regression Analysis on Overall Passengers
Satisfaction toward Airline Services Quality
1.Factors – Independent Variables
2.Factors – Dependent Variables
3.Regression Analysis
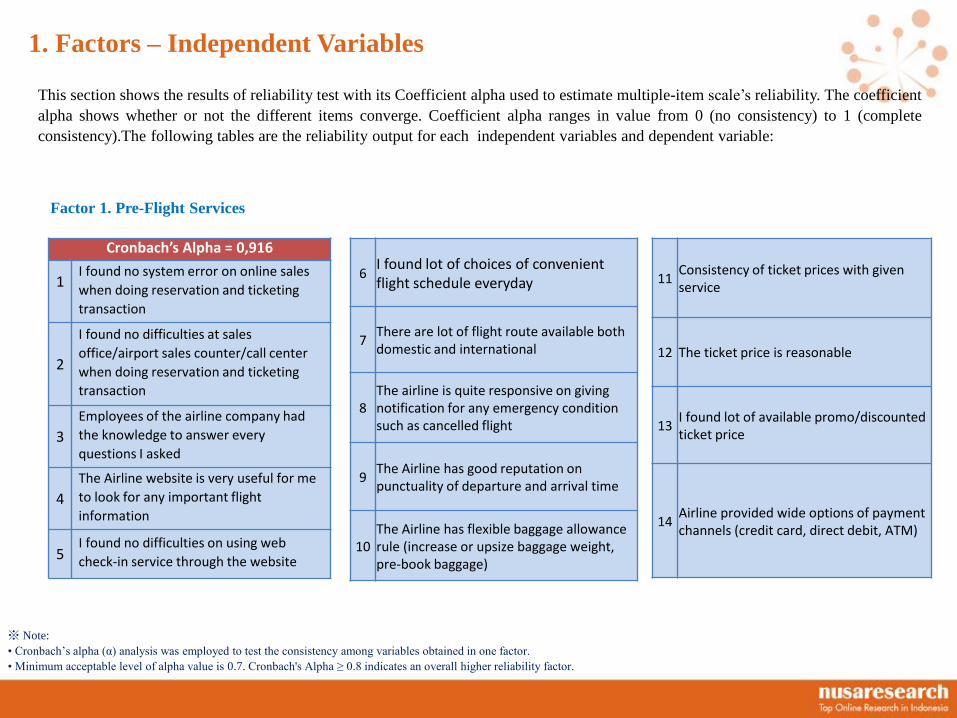
This section shows the results of reliability test with its Coefficient alpha used to estimate multiple-item scale’s reliability. The coefficient
alpha shows whether or not the different items converge. Coefficient alpha ranges in value from 0 (no consistency) to 1 (complete
consistency).The following tables are the reliability output for each independent variables and dependent variable:
Cronbach’s Alpha = 0,916
1I found no system error on online sales
when doing reservation and ticketing
transaction
2
I found no difficulties at sales
office/airport sales counter/call center
when doing reservation and ticketing
transaction
3
Employees of the airline company had
the knowledge to answer every
questions I asked
4
The Airline website is very useful for me
to look for any important flight
information
5I found no difficulties on using web
check-in service through the website
※ Note:
• Cronbach’s alpha (α) analysis was employed to test the consistency among variables obtained in one factor.
• Minimum acceptable level of alpha value is 0.7. Cronbach's Alpha ≥ 0.8 indicates an overall higher reliability factor.
Factor 1. Pre-Flight Services
1. Factors – Independent Variables
6I found lot of choices of convenient flight schedule everyday
7There are lot of flight route available both domestic and international
8The airline is quite responsive on giving notification for any emergency condition such as cancelled flight
9The Airline has good reputation on punctuality of departure and arrival time
10The Airline has flexible baggage allowance rule (increase or upsize baggage weight, pre-book baggage)
11Consistency of ticket prices with given service
12 The ticket price is reasonable
13I found lot of available promo/discounted ticket price
14Airline provided wide options of payment channels (credit card, direct debit, ATM)
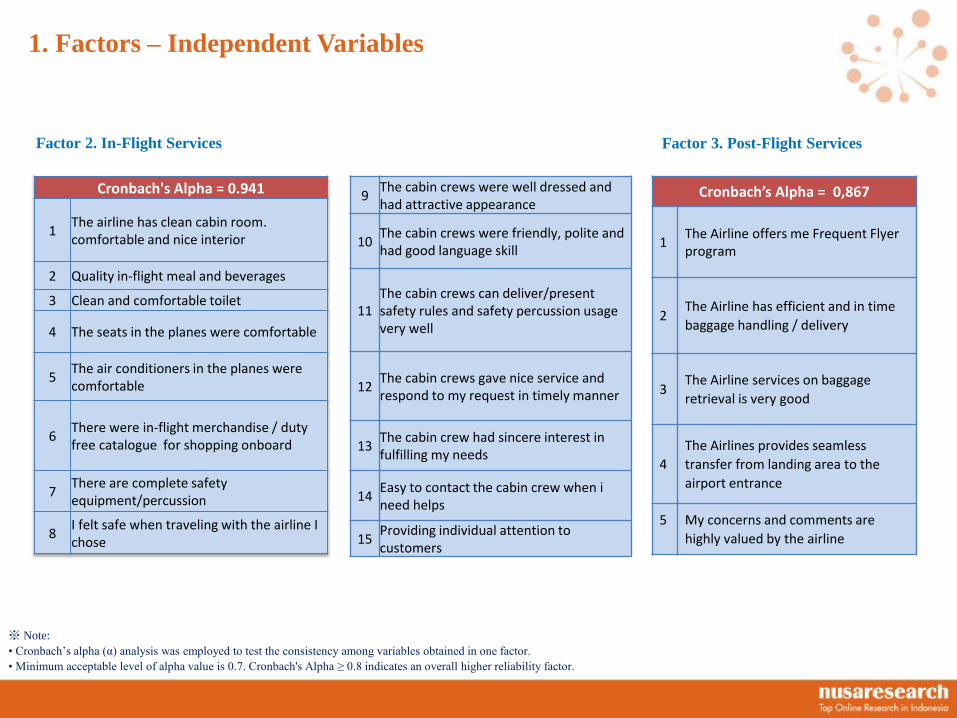
Cronbach’s Alpha = 0,867
1The Airline offers me Frequent Flyer program
2The Airline has efficient and in time
baggage handling / delivery
3The Airline services on baggage
retrieval is very good
4
The Airlines provides seamless
transfer from landing area to the
airport entrance
5 My concerns and comments are
highly valued by the airline
Factor 2. In-Flight Services Factor 3. Post-Flight Services
※ Note:
• Cronbach’s alpha (α) analysis was employed to test the consistency among variables obtained in one factor.
• Minimum acceptable level of alpha value is 0.7. Cronbach's Alpha ≥ 0.8 indicates an overall higher reliability factor.
1. Factors – Independent Variables
Cronbach's Alpha = 0.941
1The airline has clean cabin room. comfortable and nice interior
2 Quality in-flight meal and beverages
3 Clean and comfortable toilet
4 The seats in the planes were comfortable
5The air conditioners in the planes were comfortable
6There were in-flight merchandise / duty free catalogue for shopping onboard
7There are complete safety equipment/percussion
8I felt safe when traveling with the airline I chose
9The cabin crews were well dressed and had attractive appearance
10The cabin crews were friendly, polite and had good language skill
11The cabin crews can deliver/present safety rules and safety percussion usage very well
12The cabin crews gave nice service and respond to my request in timely manner
13The cabin crew had sincere interest in fulfilling my needs
14Easy to contact the cabin crew when ineed helps
15Providing individual attention to customers
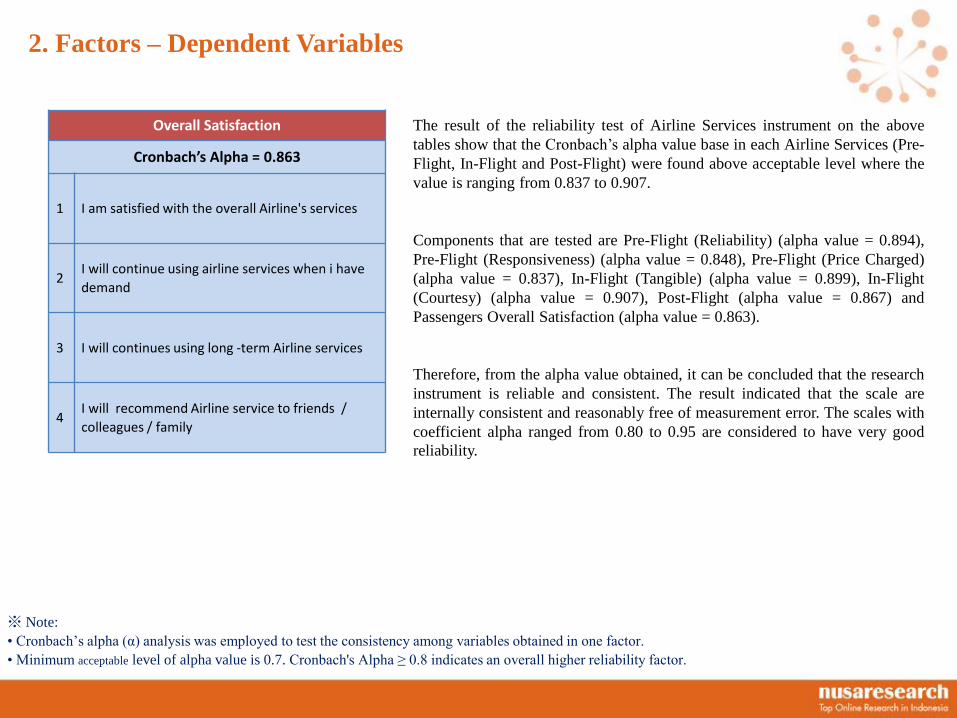
Overall Satisfaction
Cronbach’s Alpha = 0.863
1 I am satisfied with the overall Airline's services
2I will continue using airline services when i have
demand
3 I will continues using long -term Airline services
4I will recommend Airline service to friends /
colleagues / family
The result of the reliability test of Airline Services instrument on the above
tables show that the Cronbach’s alpha value base in each Airline Services (Pre-
Flight, In-Flight and Post-Flight) were found above acceptable level where the
value is ranging from 0.837 to 0.907.
Components that are tested are Pre-Flight (Reliability) (alpha value = 0.894),
Pre-Flight (Responsiveness) (alpha value = 0.848), Pre-Flight (Price Charged)
(alpha value = 0.837), In-Flight (Tangible) (alpha value = 0.899), In-Flight
(Courtesy) (alpha value = 0.907), Post-Flight (alpha value = 0.867) and
Passengers Overall Satisfaction (alpha value = 0.863).
Therefore, from the alpha value obtained, it can be concluded that the research
instrument is reliable and consistent. The result indicated that the scale are
internally consistent and reasonably free of measurement error. The scales with
coefficient alpha ranged from 0.80 to 0.95 are considered to have very good
reliability.
※ Note:
• Cronbach’s alpha (α) analysis was employed to test the consistency among variables obtained in one factor.
• Minimum acceptable level of alpha value is 0.7. Cronbach's Alpha ≥ 0.8 indicates an overall higher reliability factor.
2. Factors – Dependent Variables
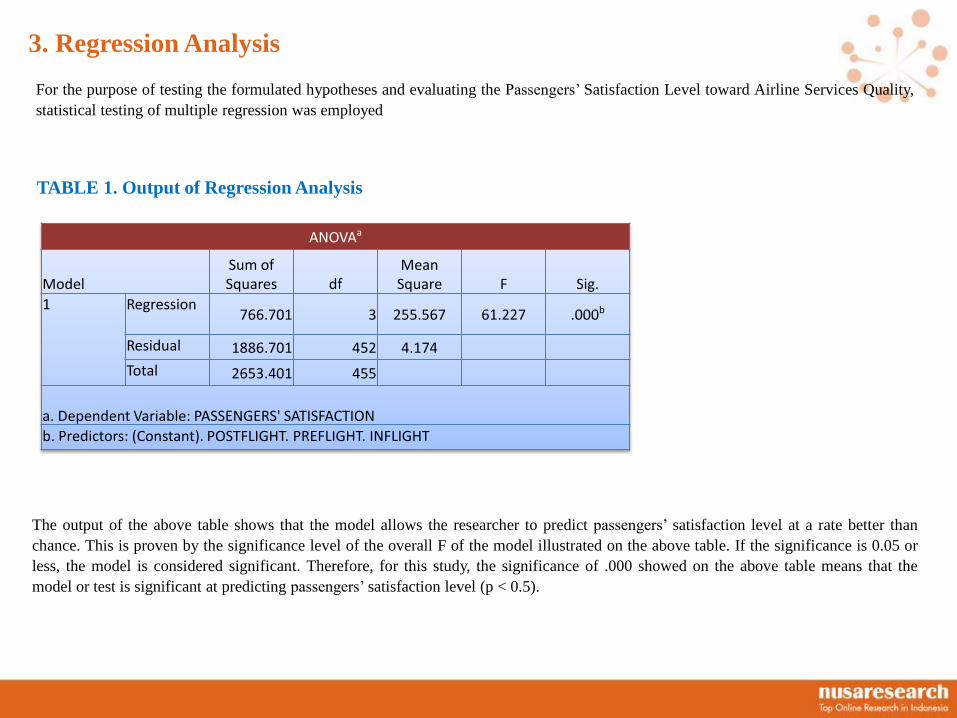
For the purpose of testing the formulated hypotheses and evaluating the Passengers’ Satisfaction Level toward Airline Services Quality,
statistical testing of multiple regression was employed
TABLE 1. Output of Regression Analysis
The output of the above table shows that the model allows the researcher to predict passengers’ satisfaction level at a rate better than
chance. This is proven by the significance level of the overall F of the model illustrated on the above table. If the significance is 0.05 or
less, the model is considered significant. Therefore, for this study, the significance of .000 showed on the above table means that the
model or test is significant at predicting passengers’ satisfaction level (p < 0.5).
ANOVAa
ModelSum of Squares df
Mean Square F Sig.
1 Regression766.701 3 255.567 61.227 .000b
Residual 1886.701 452 4.174
Total 2653.401 455
a. Dependent Variable: PASSENGERS' SATISFACTION
b. Predictors: (Constant). POSTFLIGHT. PREFLIGHT. INFLIGHT
3. Regression Analysis
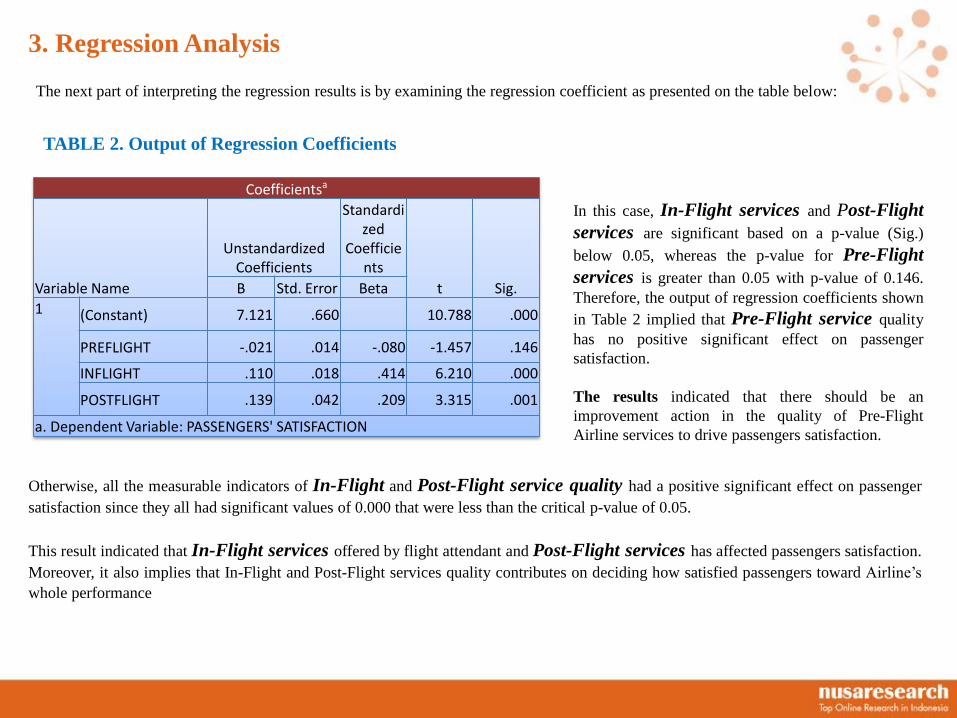
The next part of interpreting the regression results is by examining the regression coefficient as presented on the table below:
TABLE 2. Output of Regression Coefficients
Otherwise, all the measurable indicators of In-Flight and Post-Flight service quality had a positive significant effect on passenger
satisfaction since they all had significant values of 0.000 that were less than the critical p-value of 0.05.
This result indicated that In-Flight services offered by flight attendant and Post-Flight services has affected passengers satisfaction.
Moreover, it also implies that In-Flight and Post-Flight services quality contributes on deciding how satisfied passengers toward Airline’s
whole performance
In this case, In-Flight services and Post-Flight
services are significant based on a p-value (Sig.)
below 0.05, whereas the p-value for Pre-Flight
services is greater than 0.05 with p-value of 0.146.
Therefore, the output of regression coefficients shown
in Table 2 implied that Pre-Flight service quality
has no positive significant effect on passenger
satisfaction.
The results indicated that there should be an
improvement action in the quality of Pre-Flight
Airline services to drive passengers satisfaction.
Coefficientsa
Variable Name
Unstandardized Coefficients
Standardized
Coefficients
t Sig.B Std. Error Beta
1 (Constant) 7.121 .660 10.788 .000
PREFLIGHT -.021 .014 -.080 -1.457 .146
INFLIGHT .110 .018 .414 6.210 .000
POSTFLIGHT .139 .042 .209 3.315 .001
a. Dependent Variable: PASSENGERS' SATISFACTION
3. Regression Analysis
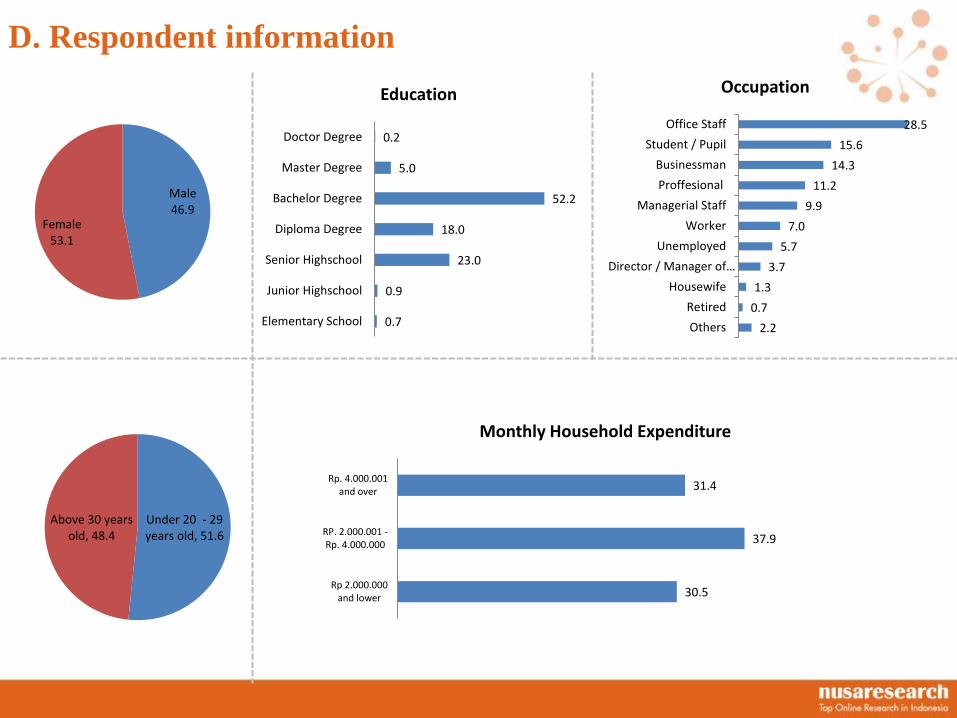
D. Respondent information
Male 46.9
Female 53.1
0.7
0.9
23.0
18.0
52.2
5.0
0.2
Elementary School
Junior Highschool
Senior Highschool
Diploma Degree
Bachelor Degree
Master Degree
Doctor Degree
Education
Under 20 - 29 years old, 51.6
Above 30 years old, 48.4
30.5
37.9
31.4
Rp 2.000.000and lower
RP. 2.000.001 -Rp. 4.000.000
Rp. 4.000.001and over
Monthly Household Expenditure
2.2
0.7
1.3
3.7
5.7
7.0
9.9
11.2
14.3
15.6
28.5
Others
Retired
Housewife
Director / Manager of…
Unemployed
Worker
Managerial Staff
Proffesional
Businessman
Student / Pupil
Office Staff
Occupation
PT. Nusaresearch is 100% Japanese invested. Our main professions are ‘Online market research’. ‘Web
creative’ and ‘Web marketing’. Online research is conducted based on Nusaresearch – our actively
managed over 56.000 members panel with various segmentations across Indonesia.
FOR FURTHER INQUIRIES. PLEASE CONTACT:
PT. Nusaresearch
» Address: 21H. Grand Slipi Tower. Jl. S. Parman Kav. 22 - 24. Slipi. Jakarta Barat 11480.
Jakarta. Indonesia
» Office phone: +62 21 29022227 Fax: +62 21 29022244
» Email: [email protected]
» Website: http://nusaresearch.com
The copyright of this report belongs to PT. Nusaresearch. The results (analyzing. wording. data. tables and
graphs) of this survey can be publicly used. but must be cited and sourced from PT. Nusaresearch (also
include its website address http://nusaresearch.com).

![Chap3 Airline Economics[2] - George Mason University2].pdf · • Airline networks create complications for analysis of market demand and supply – Not all A‐B passengers will](https://static.fdocuments.net/doc/165x107/5e28d55e19622b7d056664c7/chap3-airline-economics2-george-mason-university-2pdf-a-airline-networks.jpg)