Report 1 Sample Design
79
CHIS 2007 Methodology Report Series March, 2009 Report 1 Sample Design
Transcript of Report 1 Sample Design

CHIS 2007 Methodology Report Series March, 2009
Report 1 Sample Design

CHIS 2007 METHODOLOGY SERIES
REPORT 1
SAMPLE DESIGN
MARCH 2009
This report was prepared for the California Health Interview Survey by Ismael Flores Cervantes and J. Michael Brick of Westat.

www.chis.ucla.edu This report provides analysts with information about the sampling methods used for CHIS 2007, including both the household and person (within household) sampling. This report also provides a discussion on achieved sample size and how it compares to the planned sample size. Suggested citation:
California Health Interview Survey. CHIS 2007 Methodology Series: Report 1 - Sample Design. Los Angeles, CA: UCLA Center for Health Policy Research, 2009.
Copyright © 2009 by the Regents of the University of California. The California Health Interview Survey is a collaborative project of the UCLA Center for Health Policy Research, the California Department of Public Health, the Department of Health Care Services, and the Public Health Institute. Funding for CHIS 2007 came from multiple sources: the California Department of Public Health, the Department of Health Care Services, the California Endowment, the National Cancer Institute, NIH Office of Behavioral and Social Sciences Research, the California Wellness Foundation, the First 5 California, the Robert Wood Johnson Foundation, the California Department of Mental Health, the California Office of the Patient Advocate, Kaiser Permanente, Blue Shield of California Foundation, LA Care Health Plan, the San Diego County Human and Health Services Agency, and the California Attorney General's Crime and Violence Prevention Center.

PREFACE
Sample Design is the first in a series of methodological reports describing the 2007 California Health Interview Survey (CHIS 2007). The other reports are listed below.
CHIS is a collaborative project of the University of California, Los Angeles (UCLA) Center
for Health Policy Research, the California Department of Public Health, the Department of Health Care Services, and the Public Health Institute. Westat was responsible for the data collection and the preparation of five methodological reports for the 2007 survey. The survey examines public health and health care access issues in California. The CHIS telephone survey is the largest state health survey ever undertaken in the United States. The plan is to monitor the health of Californians and examine changes over time by conducting periodic surveys in the future.
Methodological Reports
The first five methodological reports for CHIS 2007 are as follows:
Report 1: Sample Design;
Report 2: Data Collection Methods;
Report 3: Data Processing Procedures;
Report 4: Response Rates; and
Report 5: Weighting and Variance Estimation.
This report describes the procedures used to design and select the sample from CHIS 2007. An appropriate sample design is a feature of a successful survey, and CHIS 2007 presented many issues that had to be addressed at the design stage. This report explains why the design features of CHIS were selected and presents the alternatives that were considered.
This report provides analysts information about the sampling methods used for CHIS 2007,
including both the household and person (within household) sampling. In general terms, once a household was sampled, an adult within that household was sampled. If there were children and/or adolescents in the household, one child and/or one adolescent was eligible for sampling. This report also provides a discussion on achieved sample size and how it compares to the planned sample size.

TABLE OF CONTENTS
Chapter Page
PREFACE........................................................................................................ ii
CHIS 2007 DESIGN AND METHODOLOGY SUMMARY....................................... 1-1
1.1 Overview............................................................................................. 1-1 1.2 Sample Design Objectives .................................................................. 1-2 1.3 Data Collection ................................................................................... 1-3 1.4 Response Rate..................................................................................... 1-5 1.5 Weighting the Sample......................................................................... 1-9 1.6 Imputation Methods............................................................................ 1-10 1.7 Methodology Report Series ................................................................ 1-12
TELEPHONE SAMPLING METHODS ....................................................................... 2-1 2.1 List-Assisted Random-Digit-Dial Sampling of Landlines.................. 2-2 2.2 Households without Landline Telephones.......................................... 2-3 2.3 Methods to Increase the Efficiency of Data Collection ...................... 2-4 2.4 Supplemental Sampling ............................................................. 2-5
SAMPLING HOUSEHOLDS........................................................................................ 3-1 3.1 Population of Interest.......................................................................... 3-1 3.2 Sample Design .................................................................................... 3-1
3.2.1 The Base Landline Sample.................................................. 3-2 3.2.2 Stratification of the Landline Sample.................................. 3-5 3.2.3 Supplemental Geographic Samples..................................... 3-8 3.2.4 Supplemental Surname List Samples.................................. 3-9 3.2.5 Cell Phone Sample .............................................................. 3-11 3.2.6 Area Sample ........................................................................ 3-13
3.3 Sample Selection................................................................................. 3-17 3.4 Expected Design Effect ...................................................................... 3-18
WITHIN-HOUSEHOLD SAMPLING .......................................................................... 4-1 4.1 Sampling Alternatives......................................................................... 4-1 4.2 Child First Procedure .......................................................................... 4-2 4.3 Adult Sampling................................................................................... 4-5
4.3.1 Adult Sampling in the Cell Sample..................................... 4-6 4.4 Child Sampling ................................................................................... 4-6 4.5 Adolescent Sampling .......................................................................... 4-8
ACHIEVED SAMPLE SIZES....................................................................................... 5-1

TABLE OF CONTENTS (Continued)
REFERENCES............................................................................................................... R-1
APPENDIX A ................................................................................................................ A-1
List of Tables Table Page
1-1 California county and county group strata used in the CHIS 2007 sample design................................................................................................... 1-2
1-2 Number of completed CHIS 2007 interviews by type of sample and instrument 1-4
1-3 CHIS 2007 survey topic areas by instrument .................................................. 1-6
2-1 CSS result codes and their distribution in the CHIS 2007 sample................... 2-4
3-1 Targeted number of complete adult interviews for the landline sample by county ............................................................................................. 3-4
3-2 Definition of sampling substratum, number of exchanges, and total number of households for Los Angeles county, San Diego county, Orange county, and Santa Clara county........................................................... 3-7
3-3 Targeted number of adult interviews for San Diego County by service regions ................................................................................................. 3-9
3-4 Targeted number of complete adult interviews for the Korean and Vietnamese samples......................................................................................... 3-10
3-5 Surname frames and sample sizes.................................................................... 3-10
3-6 Assignment of cell phone area codes to counties and regions ......................... 3-12
3-7 Cell sample sampling rate, original sample counts, yield targets and observed yield by geographic regions.............................................................. 3-13
3-8 Area frame characteristics for Los Angeles county by Service Planning Area 3-15
3-9 Frame and sample of addresses Los Angeles County by Service Planning Area .................................................................................................. 3-16
3-10 Number of expected completed interviews, by telephone and in person for Los Angeles county by service planning area ................................ 3-17
3-11 Number of telephone numbers drawn by type of sample ................................ 3-18
3-12 Expected design effects and effective adult sample size associated with the sample allocation for the base landline sample.................................. 3-20
4-1 Effect of the child-first procedure on completed child and adolescent interviews 4-4

TABLE OF CONTENTS (CONTINUED)
List of Tables Table Page
4-2 Distribution of households with children by type of child sampling ............... 4-8
5-1 Number of telephone numbers drawn by type of sample ................................ 5-2
5-2 Number of completed adult interviews for the base landline and geographic samples by sampling and self-reported stratum .............................................. 5-3
5-3 Number of completed child and adolescent interviews for the base landline and geographic samples by sampling and self-reported stratum........ 5-5
5-4 Number of completed adult, child, and adolescent interviews by surname list sample ....................................................................................................... 5-7
5-5 Number of completed adult interviews for the cell phone sample by sampling and self-reported region geographic regions .................................... 5-7
5-6 Number of completed adult interviews for the area sample by data collection mode ........................................................................................ 5-8
Appendix
A-1 Stratum definitions for CHIS 2001, 2003, 2005 and 2007 .............................. A-1
A-2 Number of telephone numbers and addresses drawn by sample type and sampling stratum ...................................................................................... A-3
A-3 Number of adult completed interviews by sample type and self-reported stratum ........................................................................................ A-6
A-4 Number of child completed interviews by self-reported stratum..................... A-8
A-5 Number of adolescent completed interviews by self-reported stratum............ A-10
A-6 Number of telephone numbers drawn in the cell phone sample by region...... A-12

1-1
1. CHIS 2007 DESIGN AND METHODOLOGY SUMMARY
1.1 Overview
The California Health Interview Survey (CHIS) is a population-based telephone survey of California’s population conducted every other year since 2001. CHIS is the largest health survey conducted in any state and one of the largest health surveys in the nation. CHIS is based at the UCLA Center for Health Policy Research (CHPR) and is conducted in collaboration with the California Department of Public Health, the Department of Health Care Services, and the Public Health Institute. CHIS collects extensive information for all age groups on health status, health conditions, health-related behaviors, health insurance coverage, access to health care services, and other health and health related issues.
The sample is designed to meet and optimize two objectives: Provide estimates for large- and medium-sized counties in the state, and for groups of
the smallest counties (based on population size), and
Provide statewide estimates for California’s overall population, its major racial and ethnic groups, as well as several ethnic subgroups.
The CHIS sample is representative of California’s non-institutionalized population living in households. This series of reports describes the methods used in collecting data for CHIS 2007, the
fourth CHIS data collection cycle, which was conducted between June 2007 and early March 2008. The previous CHIS cycles (2001, 2003, and 2005) are described in similar series, available at http://www.chis.ucla.edu/methods.html.
CHIS data and results are used extensively by federal and State agencies, local public health
agencies and organizations, advocacy and community organizations, other local agencies, hospitals, community clinics, health plans, foundations, and researchers. The data are widely used for analyses and publications to assess public health and health care needs, to develop and advocate policies to meet those needs, and to plan and budget health care coverage and services.

1-2
1.2 Sample Design Objectives
To achieve the sample design objectives stated above, CHIS employed a multi-stage sample design. For the first time, the random-digit-dial (RDD) sample included telephone numbers assigned to both landline and cellular service. For the landline RDD sample, the state was divided into 44 geographic sampling strata, including 41 single-county strata and three multi-county strata comprised of the 17 remaining counties. Within each geographic stratum, residential telephone numbers were selected, and within each household, one adult (age 18 and over) respondent was randomly selected. In those households with adolescents (ages 12-17) and/or children (under age 12), one adolescent and one child were randomly selected; the adolescent was interviewed directly, and the adult most knowledgeable about the child’s health completed the child interview.
Table 1-1 shows the 44 sampling strata for CHIS 2007, which include 41 independent
county strata. A sufficient number of adult interviews were allocated to each stratum to support the first sample design objective—to provide health estimates for adults at the local level. The geographic stratification of the state was the same as that used in CHIS 2005. In the first two CHIS cycles there were 41 total sampling strata, including 33 individual counties. The CHIS 2007 samples in Los Angeles and San Diego Counties were enhanced with additional funding by implementing further stratification within county.
The main landline RDD CHIS sample size is sufficient to accomplish the second objective.
To increase the precision of estimates for Koreans and Vietnamese, areas with relatively high concentrations of these groups were sampled at higher rates. These geographically targeted oversamples were supplemented by telephone numbers associated with group-specific surnames drawn from listed telephone directories to further increase the sample size for Koreans and Vietnamese.
To help compensate for the increasing number of households without landline telephone
service, a separate RDD sample was drawn of telephone numbers assigned to cellular service. In CHIS 2007, the goal was to complete 800 interviews statewide with adults in cell-only households. Because data are not available for numbers assigned to cellular service to support the same level of geographic stratification as the landline sample, the cell RDD sample was stratified by area code. Sampled cellular numbers were screened to identify whether they belonged to cell-only households. Cellular numbers from households with landline telephone numbers were considered out of scope. If the sampled number was shared by two or more adult members of a cell-only household, one household member was selected for

1-3
the adult interview. Otherwise, the adult owner of the sampled number was selected. No interviews with adolescents or about children were conducted from the CHIS 2007 cell RDD sample.
Table 1-1. California county and county group strata used in the CHIS 2007 sample design 1. Los Angeles 16. Sonoma 31. Napa 2. San Diego 17. Stanislaus 32. Kings 3. Orange 18. Santa Barbara 33. Madera 4. Santa Clara 19. Solano 34. Monterey 5. San Bernardino 20. Tulare 35. Humboldt 6. Riverside 21. Santa Cruz 36. Nevada 7. Alameda 22. Marin 37. Mendocino 8. Sacramento 23. San Luis Obispo 38. Sutter 9. Contra Costa 24. Placer 39. Yuba 10. Fresno 25. Merced 40. Lake 11. San Francisco 26. Butte 41. San Benito 12. Ventura 27. Shasta 42. Colusa, Glen, Tehama 13. San Mateo 28. Yolo 43. Plumas, Sierra, Siskiyou,
Lassen, 14. Kern 29. El Dorado Modoc, Trinity, Del Norte 15. San Joaquin 30. Imperial 44. Mariposa, Mono,
Tuolumne, Alpine, Amador,
Calaveras, Inyo Source: UCLA Center for Health Policy Research, 2007 California Health Interview Survey.
In an attempt to assess nonresponse bias, CHIS 2007 also included an area probability
sample in Los Angeles County, with a target of 800 completed adult interviews. A clustered sample was selected from US Postal Service address lists, stratified by Los Angeles County Service Planning Area (SPA). Within each SPA, a number of smaller geographic areas (segments composed of blocks or groups of blocks) were selected, and within each segment specific addresses were selected. Sampled addresses for which a telephone number could be matched were initially treated the same as landline RDD cases, except that adolescent and child interviews were not attempted. Matched addresses where a screening interview could not be completed by telephone and all unmatched addresses were then assigned to recruiters who visited the sampled addresses in person to attempt to obtain cooperation.
1.3 Data Collection
To capture the rich diversity of the California population, interviews were conducted in five languages: English, Spanish, Chinese (Mandarin and Cantonese dialects), Vietnamese, and Korean. These

1-4
languages were chosen based on analysis of 2000 Census data to identify the languages that would cover the largest number of Californians in the CHIS sample that either did not speak English or did not speak English well enough to otherwise participate.
Westat, a private firm that specializes in statistical research and large-scale sample surveys,
conducted the CHIS 2007 data collection under contract with the UCLA Center for Health Policy Research. For the landline RDD sample, Westat staff interviewed one randomly selected adult in each sampled household, and sampled one adolescent and one child if present in the household and the sampled adult was the parent or legal guardian. Up to three interviews could have been completed in each household. In households with children where the sampled adult was not the screener respondent, children and adolescents could be sampled as part of the screening interview, and the extended child (and adolescent) interviews could be completed before the adult interview. This “child-first” procedure was new for CHIS 2005 and substantially increased the yield of child interviews. While numerous subsequent attempts were made to complete the adult interview, there were completed child and/or adolescent interviews in households for which an adult interview was not completed. For the cell RDD and area samples, only one randomly selected adult in each household was interviewed. Table 1-2 shows the number of completed adult, child, and adolescent interviews in CHIS 2007 by the type of sample (landline RDD, surname list, cell RDD, and area sample).
Table 1-2. Number of completed CHIS 2007 interviews by type of sample and instrument
Type of sample Adult Child Adolescent Total all samples 51,048 9,913 3,638 Landline RDD 48,791 9,818 3,622 Surname list 451 95 16 Cell RDD 825 N/A N/A Area (Los Angeles County) 981 N/A N/A
Source: UCLA Center for Health Policy Research, 2007 California Health Interview Survey.
Interviews in all languages were administered using Westat’s computer-assisted telephone
interviewing (CATI) system. The average adult interview took about 35 minutes to complete. The average child and adolescent interviews took about 17.5 minutes and 20 minutes, respectively. For “child-first” interviews, additional household information asked as part of the child interview averaged about 9 minutes. Interviews in non-English languages generally took longer to complete. More than 8 percent of the adult interviews were completed in a language other than English, as were almost 16 percent of all child (parent proxy) interviews and 7 percent of all adolescent interviews.

1-5
Table 1-3 shows the major topic areas for each of the three survey instruments (adult, child,
and adolescent).
1.4 Response Rates
The overall response rate for CHIS 2007 is a composite of the screener completion rate (i.e., success in introducing the survey to a household and randomly selecting an adult to be interviewed) and the extended interview completion rate (i.e., success in getting one or more selected persons to complete the extended interview). To maximize the response rate, especially at the screener stage, an advance letter in five languages was mailed to all sampled telephone numbers for which an address could be obtained from reverse directory services. An advance letter was mailed for approximately 67 percent of the sampled telephone numbers. As in CHIS 2005, a $2 bill was included with the advance letter to promote cooperation.
The CHIS 2007 screener completion rate for the landline sample was 35.5 percent, and was
higher for households that were sent the advance letter. For the cell phone sample, the screener completion rate was 30.5 percent in cell-only households. For the area sample, the screener response rate was 32.0 percent, compared with 31.5 percent for the landline sample in Los Angeles County. The extended interview completion rate for the landline sample varied across the adult (52.8 percent), child (73.7 percent) and adolescent (44.1 percent) interviews. The adolescent rate includes getting permission from a parent or guardian. The adult interview completion rate for the cell sample was 52.0 percent, and for the area sample 69.0 percent. Multiplying the screener and extended rates gives an overall response rate for each type of interview. The percentage of households completing one or more of the extended interviews (adult, child, and/or adolescent) is a useful summary of the overall performance of the landline sample. For CHIS 2007, the landline sample household response rate was 21.1 percent (the product of the screener response rate and the completion rate at the household level of 57.9 percent). All of the household and person level response rates vary by sampling stratum. For more information about the CHIS 2007 response rates, please see CHIS 2007 Methodology Series: Report 4 – Response Rates.

1-6
Table 1-3. CHIS 2007 survey topic areas by instrument
Health status Adult Teen Child General health status, height and weight Days missed from school due to health problems
Health conditions Adult Teen Child Asthma Diabetes Gestational diabetes Heart disease, high blood pressure Infertility Falls (elderly) Attention deficit disorder (ADD/ADHD), developmental
disorders
Parental concerns with child development
Mental health Adult Teen Child Mental health status Perceived need, use of mental health services Emotional functioning
Health behaviors Adult Teen Child Dietary intake Physical activity and exercise Sedentary time Parental influence over diet and exercise Parental exposure to messages about obesity, smoking Developmental screening tests Colon cancer screening Flu Shot Alcohol and tobacco use Drug use Sexual behavior, STD testing Birth control practices
Women’s health Adult Teen Child Pap test screening, mammography screening, hormone
replacement therapy
Emergency contraception HPV – knowledge and awareness; vaccine use and attitudes Pregnancy status
Dental health Adult Teen Child Last dental visit Not getting needed care Days missed from school due to dental problems Dental insurance coverage

1-7
Table 1-3. CHIS 2007 survey topic areas by instrument (Continued) Food insecurity/hunger Adult Teen Child Availability of food in household over past 12 months
Access to and use of health care Adult Teen Child Usual source of care, visits to medical doctor Emergency room visits Delays in getting care (prescriptions, tests, treatment) Communication problems with doctor Ability to understand medical instructions
Health insurance Adult Teen Child Current insurance coverage, spouse’s coverage, who pays
for coverage
Health plan enrollment, characteristics of plan Whether employer offers coverage, respondent/spouse
eligibility
Coverage over past 12 months Reasons for lack of insurance
Public program eligibility Adult Teen Child Household poverty level Program participation (TANF, CalWorks, Public Housing,
Food Stamps, SSI, SSDI, WIC)
Assets, alimony/child support/social security/pension Eligible for Medi-Cal and healthy families Reason for Medi-Cal nonparticipation among potential
eligibles
Neighborhood Adult Teen Child Neighborhood safety, use of parks Mode of local transportation
Interpersonal Violence Adult Teen Child Experiencing violence from intimate partner, details of
most recent experience
Experiencing violence from acquaintance
Parental involvement/adult supervision Adult Teen Child Adult presence after school Child’s activities with family

1-8
Table 1-3. CHIS 2007 survey topic areas by instrument (Continued) Child care and school attendance Adult Teen Child Current child care arrangements Paid child care Preschool/school attendance, name of school
Employment Adult Teen Child Employment status, spouse’s employment status Work in last week Hours worked at all jobs
Income Adult Teen Child Respondent’s and spouse’s earnings last month before taxes Household income (annual before taxes) Number of persons supported by household income
Respondent characteristics Adult Teen Child Age, gender, height, weight, education Race and ethnicity Marital status Sexual orientation Citizenship, immigration status, country of birth, length of
time in U.S., languages spoken at home, English language proficiency
Source: UCLA Center for Health Policy Research, 2007 California Health Interview Survey.
The CHIS response rate is comparable to response rates of other scientific telephone surveys
in California, such as the 2007 California Behavioral Risk Factor Surveillance System (BRFSS) Survey. Using calculations that are as comparable as possible to those of CHIS 2007, the combined screener and adult response rate for the 2007 BRFSS is 18.7 percent, exactly the same as that for the CHIS 2007 landline sample. California as a whole and the state’s urban areas in particular are among the most difficult parts of the nation in which to conduct telephone interviews. Survey response rates tend to be lower in California than nationally, and over the past decade response rates have been declining both nationally and in California. Information about CHIS data quality and nonresponse bias is available at http://www.chis.ucla.edu/dataquality.html.
Adults who completed at least approximately 80 percent of the questionnaire (i.e., through Section K (on employment, income, poverty status, and food security), after all follow-up attempts were exhausted to complete the full questionnaire, were counted as “complete.” At least some items in the

1-9
employment and income series or public program eligibility and food insecurity series are missing from those cases that did not complete the entire interview.
Proxy interviews were allowed for frail and ill persons over the age of 65 who were unable
to complete the extended adult interview in order to avoid biases for health estimates of elderly persons that might otherwise result. Eligible selected persons were recontacted and offered a proxy option. For 168 elderly adults, a proxy interview was completed by either a spouse/partner or adult child. A reduced questionnaire, with questions identified as appropriate for a proxy respondent, was administered. (Note: questions not administered in proxy interviews are given a value of “-2” in the data files.)
1.5 Weighting the Sample
To produce population estimates from the CHIS data, weights are applied to the sample data to compensate for the probability of selection and a variety of other factors, some directly resulting from the design and administration of the survey. The sample is weighted to represent the non-institutionalized population for each sampling stratum and statewide. The weighting procedures used for CHIS 2007 accomplish the following objectives:
Compensate for differential probabilities of selection for households and persons;
Reduce biases occurring because nonrespondents may have different characteristics than respondents;
Adjust, to the extent possible, for undercoverage in the sampling frames and in the conduct of the survey; and
Reduce the variance of the estimates by using auxiliary information.
As part of the weighting process, a household weight was created for all households that completed the screener interview. This household weight is the product of the “base weight” (the inverse of the probability of selection of the telephone number) and a variety of adjustment factors. The household weight is used to compute a person-level weight, which includes adjustments for the within-household sampling of persons and nonresponse. The final step is to adjust the person-level weight using a raking method so that the CHIS estimates are consistent with population control totals. Raking is an iterative procedure that forces the CHIS weights to sum to known population control totals from an independent data source (see below). The procedure requires iteration to make sure all the control totals, or raking dimensions, are simultaneously satisfied within a specified tolerance.

1-10
Population control totals of the number of persons by age, race, and sex at the stratum level
for CHIS 2007 were created primarily from the California Department of Finance’s 2007 Population Estimates and 2007 Population Projections. The raking procedure used 11 raking dimensions, which are combinations of demographic variables (age, sex, race, and ethnicity), geographic variables (county, Service Planning Area in Los Angeles County, and Health Region in San Diego County), household composition (presence of children and adolescents in the household), and socio-economic variables (home ownership and education). The socio-economic variables are included to reduce biases associated with excluding households without landline telephones from the sample frame. One limitation of using Department of Finance data is that it includes about 2.4 percent of the population of California who live in “group quarters” (i.e., persons living with nine or more unrelated persons). These persons were excluded from the CHIS target population and as a result, the number of persons living in group quarters was estimated and removed from the Department of Finance control totals prior to raking.
1.6 Imputation Methods
Missing values in the CHIS data files were replaced through imputation for nearly every variable. This was a massive task designed to enhance the analytic utility of the files. Westat imputed missing values for a handful of variables used in the weighting process and UCLA-CHPR staff imputed values for nearly all other variables.
Two different imputation procedures were used by Westat to fill in missing responses for
items essential for weighting the data. The first imputation technique was a completely random selection from the observed distribution of respondents. This method was used only for a few variables when the percentage of the items missing was very small. The second technique was hot deck imputation without replacement. The hot deck approach is probably the most commonly used method for assigning values for missing responses. With a hot deck, a value reported by a respondent for a particular item is assigned or donated to a “similar” person who did not respond to that item. The characteristics defining “similar” vary for different variables. To carry out hot deck imputation, the respondents to a survey item form a pool of donors, while the nonrespondents are a group of recipients. A recipient is matched to the subset pool of donors based on household and individual characteristics. A value for the recipient is then randomly imputed from one of the donors in the pool. Once a donor is used, it is removed from the pool of donors for that variable. Hot deck imputation was used to impute the same items in CHIS 2003, CHIS 2005 and CHIS 2007 (i.e., race, ethnicity, home ownership, and education).

1-11
UCLA-CHPR imputed missing values for nearly every variable in the data files other than
those handled by Westat and some sensitive variables in which nonresponse had its own meaning. Overall, item nonresponse rates in CHIS 2007 were low, with most variables missing valid responses for less than 2% of the sample. However, there were a few exceptions where item nonresponse rate was greater than 20%, such as household income.
The imputation process conducted by UCLA-CHPR started with data editing, sometimes
referred to as logical or relational imputation: for any missing value, a valid replacement value was sought based on known values of other variables of the same respondent or other sample(s) from the same household. For the remaining missing values, hierarchical sequential hot-deck imputation with donor replacement was used. This method replaces a missing value for one respondent using a valid response from another respondent with similar characteristics as defined by a set of control variables. The control variables were ranked in order from the most to the least important. This procedure allowed control variables to be dropped if certain conditions (such as the minimum number of donors) were not met. The control variables were dropped sequentially, starting from the variable ranked least important. Once a responding case was used as a donor, it was dropped from the donor pool preventing using one donor multiple times.
Control variables used in forming donor pools for hot-decking always included the
following: gender, age group, race/ethnicity, poverty level (based on household income), educational attainment, and region. Other control variables were also used depending on the nature of the imputed variable. Among the control variables, gender, age, race/ethnicity and regions were imputed by Westat. UCLA-CHPR then imputed household income and educational attainment in order to impute other variables. Household income, for example, was imputed using the hot-deck method within ranges from a set of auxiliary variables such as income range and/or poverty level.
The imputation order of the other variables followed the questionnaire. After all imputation
was done, logic checks and edits were performed once again to ensure consistency between the imputed and nonimputed values on a case-by-case basis.

1-12
1.7 Methodology Report Series
A series of five methodology reports is available with more detail about the methods used in CHIS 2007:
Report 1 – Sample Design;
Report 2 – Data Collection Methods;
Report 3 – Data Processing Procedures;
Report 4 – Response Rates; and
Report 5 – Weighting and Variance Estimation.
For further information on CHIS data and the methods used in the survey, visit the California Health Interview Survey Web site at http://www.chis.ucla.edu or contact CHIS at [email protected].

2-1
2. TELEPHONE SAMPLING METHODS
This chapter describes the sampling methods used in the CHIS 2007 telephone survey. CHIS 2007 consisted of three samples: (1) a landline random digit dialing (RDD) sample1 combined with supplemental Korean and Vietnamese surname list samples, (2) a statewide RDD cell phone sample, and (3) an area probability sample in Los Angeles County. The landline and cell phone samples were drawn using RDD approaches, whereas the list samples were drawn from separate surname lists of telephone numbers. The area probability sample was drawn in two stages. In the first stage, primary sampling units (PSUs) that represented geographic areas in Los Angeles County were selected with probability proportional to the number of occupied residential units; and in the second stage, residential addresses of households in the selected PSUs were drawn with equal probability.
The first section describes the list-assisted RDD sampling methodology for the landline
sample. It also discusses some sources of undercoverage associated with landline telephone samples, such as persons who cannot be interviewed because of language limitations.
The second section describes problems associated with the increasing noncoverage of
landline samples due to the move to greater reliance on cellular telephone use and a drop in landline telephone services. The new cell phone sample in CHIS 2007 addressed this problem by sampling and contacting cell phone numbers.
The third section describes the procedures implemented to save costs by reducing the
number of calls to sampled but ineligible telephone numbers for interviews. The methods implemented were the use of tritone and business purges of unproductive numbers, and subsampling of refusals to the screening interview for refusal conversion.
The last section reviews the supplemental samples in CHIS 2007. In order to increase the
sample size for Koreans and Vietnamese, geographic areas with high concentrations of these populations were targeted in the landline sample. In addition, lists of surnames were used to supplement the landline sample. CHIS 2007 also included a geographic supplemental sample for San Diego County to increase the sample size and precision of county-level estimates.
1 Supplemental samples selected by taking proportionally larger samples in certain geographic areas are part of the landline RDD sample.

2-2
2.1 List-Assisted Random Digit Dial Sampling of Landlines
List-assisted RDD sampling is currently the standard method for telephone surveys and has been the primary sampling method for all cycles of CHIS. This method was designed to produce an unclustered sample that has good operational features (Tucker, Lepkowski, and Piekarski, 2002). In the 100 series list-assisted sampling, the set of all telephone numbers in operating telephone prefixes is composed of 100-banks, each containing 100 telephone numbers with the same first eight digits. All 100-banks with at least one residential number listed in a published telephone directory are used to create the sampling frame. A simple random or a systematic sample of telephone numbers is selected from this frame. Initially, this method had a small amount of noncoverage because telephone numbers in 100-banks with no listed telephone numbers (i.e., zero banks) were not sampled. Brick et al. (1995) showed that the bias from this approach was negligible for most estimates.
More recently, changes in the structure of the U.S. telecommunications industry and an
increasing number of residential exchanges have had a large impact on the 100 series list-assisted methodology. Fahimi et al. (2008) found that the exclusion of 100-banks without any listed telephone number could result in coverage losses of up to 20 percent of the households with a landline. Although there is no current information on the characteristics of the households, it is likely that these households have different characteristics. Although the CHIS 2007 landline sample does not have a specific method to address this undercoverage directly, the weighting methods using control totals representing the entire population in California should mitigate its effects. In addition, the area sample can provide some information about the characteristics of the excluded households. The results of this emerging research may affect the sample design for future cycles of CHIS.
Another source of coverage error in telephone surveys arises when persons who do not speak
English are sampled but are not interviewed because of language limitations. These cases are typically treated as nonresponse, but could be thought of as a coverage problem since none of the persons speaking languages other than those included in the survey protocol are interviewed.
In CHIS 2007 and previous cycles, significant efforts have been made to limit this potential
bias by interviewing in multiple languages (Lee et al., 2008). In CHIS 2007, interviews were conducted in five languages: English, Spanish, Chinese (Cantonese and Mandarin dialects), Korean, and Vietnamese. This effort eliminates a potentially large source of the bias that might result if interviewers had only been conducted in English.

2-3
2.2 Households without Landline Telephones
In most telephone surveys, households with no access to landline telephones (households with only cellular telephones and households with no telephone service of any type) are not sampled. For estimates correlated with socioeconomic measures such as health insurance coverage, food security, and poverty, this coverage loss could introduce biases. The bias depends on the number of households with no landline telephones and the difference in characteristics of persons in households with and without a landline telephone.
Households with cell only service account for the largest proportion of those without a
landline. The numbers of households and persons in the United States who have cell phones have greatly increased in the last few years. The most recent estimate of cell-phone-only households is 15.8 percent nationally for the last 6 months of 2007 (Blumberg and Luke, 2008). This estimate has more than doubled since the estimate from a supplement to the February 2004 Current Population Survey (CPS) reported in Tucker et al. (2007). Blumberg and Luke (2008) also reported that a sizeable proportion of households may be difficult to reach even though they have a landline because they rely on cell phones for most of their calls. This source of bias is likely to grow along with the prevalence of cell phones.
The characteristics of persons in cell-phone-only households are different from those in
households with landlines. For example, the cell-phone-only adults were much less likely to be insured than the adults in households with landlines. Demographics such as age and gender are also associated with cell-phone-only households, where the younger and males are more likely to live in cell-only households. Additionally, adults living in cell-only households are positively associated with renters and those living with unrelated adults. Since this population is excluded from landline telephone surveys, there is increasing concern about the quality of estimates. For example, some observed decreases in certain prevalence measures among young adults are thought to be the result of undercoverage of young adults in cell-phone-only households (Delnevo et al., 2008). Such findings suggest that bias due to the failure to cover these households is possible.
CHIS 2007 included a cell phone sample component that addresses the potential biases from
excluding cell phone only households. The feasibility of a cell phone sample was evaluated in 2005 with a pilot study of cell phone numbers using the CHIS 2005 adult questionnaire (Brick, Edwards, and Lee 2007). This line of research initiated in 2005 was expanded to an operational statewide cell phone sample allocated by regions as an additional component to CHIS 2007. Additional details for the selection of this sample are described in Section 3.2.

2-4
2.3 Methods to Increase the Efficiency of Data Collection
When landline telephone numbers are sampled, special procedures are often implemented before data collection to reduce costs and to increase efficiency of the sampling and data collection effort. Several techniques that had been used in previous cycles of CHIS were implemented again in 2007.
The first technique is the use of tritone (the distinctive three-bell sound heard when dialing a
nonworking number) and business purge methods to reduce the number of unproductive numbers (i.e., business and nonworking numbers). The procedure, called Comprehensive Screening Service (CSS), is offered by Market Systems Group (MSG), the vendor that also provided the sampling frames for CHIS. In the CSS, telephone numbers are matched to numbers in the White and Yellow Pages to identify nonresidential business numbers. A second procedure is a tritone-test to identify nonworking numbers; a telephone number is classified as a nonresidential number if a tritone is encountered in two separate tests. All numbers, including those identified as listed in the White Pages, were included in the tritone-test. The method also identifies cell phone numbers that were ported from landline exchanges; in CHIS 2007, these numbers were included in the cell sample.
Table 2-1 shows the CSS result codes as well as the distribution of the sampled telephone
numbers in CHIS 2007. Approximately 47 percent of the sampled numbers (CSS result codes LB, FM, NR NW, and some UB) were excluded from dialing. This was 3 percentage points higher than the 45 percent purged in CHIS 2005.
Table 2-1. CSS result codes and their distribution in the CHIS 2007 sample
CSS result code Description Number of telephones Percentage CP Agent identified cell phone 91 0.01 DK Undetermined 276,962 33.74 FM Fax/modem 29,260 3.56 LA Language barrier 5,478 0.67 LB Listed business 34,974 4.26 NR No-ring back 6,761 0.82 NW Nonworking 279,818 34.08 PM Privacy manager 9,419 1.15 RS Residence 131,613 16.03 UB Unlisted business 45,433 5.53 WR Wireless number 1,155 0.14
Total 820,964 100.00
Source: UCLA Center for Health Policy Research, 2007 California Health Interview Survey.

2-5
The second technique used to reduce costs while improving the sample efficiency in CHIS 2007 was subsampling of refusals for refusal conversion (Brick et al., 2005). In this procedure, a larger sample of telephone numbers than would otherwise be selected is drawn in the first phase. Each number in the first-phase sample is randomly assigned to one of two conditions in the second-phase: subsampled for refusal conversion or not. When refusals are encountered at the screening stage of data collection, only numbers in the subsample condition are eligible for refusal conversion follow-up interviews at the screener level. The numbers subsampled for refusal conversion are generally fielded first so that refusal cases are worked completely (i.e., all of the appropriate scheduling procedures including holding periods for refusal cases can be fully implemented).
The rationale for refusal subsampling depends on two observations: refusal cases comprise
the majority of screener nonresponse in CHIS; and substantial effort is expended to gain cooperation in households where a member refuses to participate in the study at the screener level. The cost savings result from the shift of resources from the less productive labor-intensive task of refusal conversion to the more productive task of completing extended interviews. The principles for refusal subsampling are well established (Hansen and Hurwitz 1946; Elliott, Little, and Lewitzky 2000) and the method has been used in other surveys such as the American Community Survey conducted by U.S. Census Bureau.
One disadvantage of refusal subsampling is that a weighting adjustment is needed to account
for the subsampling. Those cases that refuse and are subsampled are weighted to represent themselves and the cases that refuse and are not subsampled. This weighting decreases the precision of the survey estimates, but only very slightly. The weighting adjustment is discussed in CHIS 2007 Methodology Series: Report 5 – Weighting and Variance Estimation. A subsampling rate of approximately 60 percent was used in CHIS 2007, meaning that 60 percent of the refusal cases at the screener level were eligible for refusal conversion efforts. This subsampling rate of refusal cases is expected to increase the standard error of the estimates less than 3 percent.
2.4 Supplemental Sampling
The first type of supplemental sample implemented in CHIS 2007 was geographic sampling designed to increase the sample size in specified geographic areas. In CHIS 2007, geographic supplemental sample was used only for San Diego County. Additional details for the selection of this sample are described in Section 3.2.

2-6
The second type of supplemental sampling in CHIS was used to improve the sample size and precision of the estimates for specific race and ethnic groups. As mentioned in Chapter 1, one of the goals of CHIS 2007 and previous cycles was to produce reliable estimates for Koreans and Vietnamese in California. These two ethnic groups are important for analytical reasons, but constitute a small proportion of the total California population. The expected sample yield from the landline sample was too small to support inferences for these groups at the desired level of precision. Since CHIS 2003, two sampling strategies have been used to meet a target sample yield of 500 for Korean and 500 Vietnamese adult interviews (Edwards et al., 2002 These sampling strategies are disproportionate stratified sampling and multiple frame sampling used to oversample rare or small populations (Flores Cervantes and Kalton, 2007, Kalton and Anderson, 1986; and Sudman, Sirken, and Cowan, 1988). The CHIS 2003 Methodology Series: Report 1 - Sample Design discusses other strategies considered, along with the reasons for choosing those that were adopted.
The first strategy for oversampling Korean and Vietnamese populations was geographic
targeting using the same substrata as in 2003 and 2005. These strata were created classifying exchanges based on the concentration of Korean and Vietnamese residing in the exchange2 within selected counties. Under disproportionate stratified sampling, telephone numbers in exchanges located in areas with a relatively high proportion of members (high-density strata) were sampled at a higher rate than the numbers in the other strata (low-density strata). Since the stratification was based on information from the 2000 Census, we examined the observed sample from the previous cycles and reclassified the telephone exchanges using the sample distribution of these populations in previous cycles of CHIS. Reclassifying exchanges reflected the changes in the Korean and Vietnamese populations in these areas.
The second strategy used to increase the number of Korean and Vietnamese interviews
included supplemental samples from other frames (i.e., surname lists of the race-ethnic groups). This sampling strategy is based on the concept of a dual frame design. In this approach, the landline sample is supplemented with a much less expensive sample drawn from a list of telephone numbers likely to include members of the target group(s). The list frame does not have to be complete to be useful, although the more complete the list is, the greater the potential for increasing the precision of the estimates. The composition of the list affects its efficiency (that is, the proportion of sampled numbers that lead to a member of the target group), but not the ability to produce unbiased estimates. Unbiased estimates can be produced if the list membership of every sampled unit (telephone number) from the other frame (landline in our case) can be determined. The cost associated with the use of the surname lists was much lower than
2 Refer to the CHIS 2003 Methodology Series: Report 1 Sample Design for additional details on the creation of the substrata.

2-7
the cost for locating and interviewing members of the groups from the landline sample. The identification of eligible (i.e. Korean or Vietnamese) adults in the list samples was done
through a question in the screener interview. This strategy was relatively simple to implement and has good statistical properties, except for any measurement error that may be introduced by asking a question about the ethnicity of the adults at the beginning of the interview. Screening was not necessary for the cases sampled from the high/low density strata because these cases were part of the base landline sample where all households are eligible for further interviewing. Although the use of surname lists was an effective way to increase the number of completed cases for these groups, the variances of the estimates for these groups is not greatly reduced by this approach.

3. SAMPLING HOUSEHOLDS
This chapter describes the sample design and selection of households for CHIS 2007. We begin by defining the target population and the persons included in and excluded from the survey. Target numbers of completed adult interviews by county and for the supplemental samples are then described. The remainder of the chapter describes the types of supplemental samples and the selection of telephone numbers in order to achieve the stated goals. We also review the statistical issues considered in arriving at the allocation of the sample for the different components of the survey.
3.1 Population of Interest
As in previous CHIS cycles, the 2007 sample was intended to represent the adult (age 18 and older) residential population of California, as well as adolescents (age 12-17) and children (age 11 and under). Eligible residential households included houses, apartments, and mobile homes occupied by individuals, families, multiple families, extended families or multiple unrelated persons, if the number of unrelated persons was less than nine. Persons living temporarily away from home were eligible and enumerated at their usual residences. These include college students in dormitories, patients in hospitals, vacationers, business travelers, and so on. The survey excluded group quarters – any unit occupied by nine or more unrelated persons (e.g., communes, convents, shelters, halfway houses, or dormitories). Institutionalized persons (e.g., those living in prisons, jails, juvenile detention facilities, psychiatric hospitals and residential treatment programs, and nursing homes for the disabled and aged), the homeless, persons in transient or temporary arrangements, and those in military barracks were also excluded. As described in Chapter 2, some individuals who were part of the residential population did not have a chance of selection. These include those living in households without any telephone service, and children and adolescents living in a household without a parent or legal guardian.
3.2 Sample Design
The principal goals of the CHIS 2007 sample design were (1) to produce reliable statewide estimates for the total population in California and for its larger race/ethnic groups, as well as for several smaller ethnic groups (i.e., Koreans and Vietnamese), and (2) to produce reliable estimates at the county

level for as many counties as possible. In CHIS 2007, similar to the previous cycles in CHIS, a base landline sample and surname list samples were drawn in order to meet these goals. However, CHIS 2007 included two new samples: a statewide cell-phone sample, and an area probability sample for Los Angeles County. The cell phone sample supplemented the landline sample while the area sample was used to evaluate nonresponse bias and coverage issues in the survey. The base landline and the other samples are described in the following sections.
At the beginning of the study, different allocations of the sample consistent with the
available budget were evaluated. The UCLA CHIS staff consulted with various constituencies to assess the relative importance of particular types of estimates. Westat statistical staff helped evaluate each alternative and examined the consequences of the sample allocations. The main statistical issues were communicated by computing effective sample sizes for the main groups for the alternative designs. The expected effective sample size computations are discussed in Section 3.5.
3.2.1 The Base Landline Sample
The CHIS 2007 sample had an initial goal of completing 40,000 statewide adult interviews with 39,000 cases from the landline sample and 500 each of Koreans and Vietnamese from the landline RDD and list samples combined. When more funding became available, the goal was augmented to 48,402 cases with two additional samples. The first was a statewide supplement with 6,616 cases while the second sample supplemented Los Angeles County with 1,690 cases. Slightly less than half of the statewide supplement was used to increase the sample in smaller counties by 100 cases, while the remaining was allocated proportionally among the larger counties.
Because in previous CHIS cycles it had proven difficult to control the data collection closely
enough to meet the stratum goals exactly, an adjusted goal of 95 percent of the original goal was set in most counties, except for Los Angeles and San Diego. Thus, the overall adjusted goal for the landline sample was 46,600 adult interviews, with the expectation that the adjusted goals would be exceeded in some counties.
The landline adjusted goal for adult interviews in CHIS 2007 was 9,958 interviews (25
percent) higher than the adjusted landline sample goal for CHIS 20053. Although the number of child and
3 Goals excluded the geographic and surname samples in CHIS 2005 and 2007

adolescent interviews was not predetermined, we expected to get between 3,000 to 4,000 completed adolescent interviews (depending on compliance since parental consent and adolescent agreement are required) and between 10,000 to 11,000 child interviews based on the CHIS 2005 results.
The goals of the base landline sample required allocating the sample into the sampling strata
using a compromise between objectives. To achieve the most reliable statewide estimates, the optimal design is to allocate the sample to counties proportional to their population. On the other hand, the optimal allocation for producing individual, county-level estimates is to assign each county an equal sample size.
The stratification of California’s 58 counties used in CHIS 2007 was the same as the one
used in 2005. The design consisted of 44 strata, with 41 single-county strata and 3 strata with multiple counties. The multiple-county strata were created by grouping the remaining counties into three geographic areas. The stratum assignment was based on the population residing in the county. Table 3-1 shows the 44 geographic sampling strata, the original and adjusted target numbers of adult for CHIS 2007. Table A-1 in the appendix shows the assignment of counties to geographic strata across the CHIS cycles.
Because of the need to produce reliable estimates at the county level, the sample allocation
was not proportional to the population in the counties. With a proportional allocation, the estimates from the smaller counties would be based on small sample sizes and would not be adequate for the envisioned analyses. To achieve the goal of producing local or county estimates, the target sample sizes from medium and smaller counties was fixed at 500 or 600 interviews. The remaining sample was allocated proportional to the population size. More details about the landline sample are given after discussing the designs for the other samples.

Table 3-1. Targeted number of complete adult interviews for the landline sample by county
Targeted number of interviews Adult
Stratum Original Adjusted Population size
State Total 48,302 46,600
1 Los Angeles* 11,139 11,139 Over 9,000,000
2 San Diego 3,123 3,123
3 Orange 2,895 2,750
4 Santa Clara 1,690 1,606
5 San Bernardino 1,751 1,664
6 Riverside 1,818 1,727
7 Alameda 1,606 1,526
8 Sacramento 1,517 1,441
1,200,000 or greater
9 Contra Costa 1,087 1,033
10 Fresno 807 767 800,000 to 1,200,000
11 San Francisco 956 908
12 Ventura 754 716
13 San Mateo 736 699
14 Kern 691 656
15 San Joaquin 632 600
500,000 to 800,000
16 Sonoma 600 570
17 Stanislaus 600 570
18 Santa Barbara 600 570
19 Solano 600 570
20 Tulare 600 570
21 Santa Cruz 600 570
22 Marin 600 570
23 San Luis Obispo 600 570
24 Placer 600 570
25 Merced 600 570
26 Butte 600 570
27 Shasta 600 570
28 Yolo 600 570
Medium counties 100,000 to 500,000

Table 3-1. Targeted number of complete adult interviews for the landline sample by county (Continued)
Targeted number of interviews Adult
Stratum Original Adjusted Population size
29 El Dorado 600 570
30 Imperial 600 570
31 Napa 600 570
32 Kings 600 570
33 Madera 600 570
34 Monterey 600 570
35 Humboldt 600 570
Medium counties 100,000 to 500,000
36 Nevada 600 570
37 Mendocino 600 570
38 Sutter 600 570
39 Yuba 600 570
40 Lake 600 570
41 San Benito 600 570
Small counties less than 100,000
population per county
42 Colusa, Glenn, Tehama 500 475
43
Del Norte, Lassen, Modoc, Plumas, Sierra, Siskiyou, Trinity 500 475
44
Amador, Alpine, Calaveras, Inyo, Mariposa, Mono, Tuolumne 500 475
Small counties combined
Source: UCLA Center for Health Policy Research, 2007 California Health Interview Survey.
3.2.2 Stratification of the Landline Sample
In this section, we describe the detailed steps used to select the sample of telephone numbers for the landline sample. These steps include stratifying the telephone numbers, selecting the sample of numbers after adjusting for expected losses due to nonresponse, and subsampling the numbers based on refusal status to improve the efficiency of the sample.
The first step was stratifying the sampling frame of 100-banks with one or more listed
telephone numbers into the nonoverlapping strata, each corresponding to a county or a group of counties

as shown in Table 3-1. The procedure for assigning the numbers to strata was the same as that used in previous CHIS cycles. The geographic information required for stratification was available only at the exchange level4, so 100-banks could not be assigned directly to a single stratum. All banks within an exchange were stratified indirectly by mapping the exchanges to a county represented by the stratum. However, some telephone exchanges actually service households in more than one county.
To solve the stratification problem, the procedure used coverage reports for each county
produced by MSG, the sampling vendor. The coverage reports listed all the exchanges in the county. For each exchange, the report showed the total number of listed households in the exchange and the proportion of listed households that were within the county. After combining the information of the coverage reports for all 58 counties, we created a frame of exchanges with variables for the number of listed households in each county that the exchange covers. Each exchange was then assigned to the county with the most listed households. There was also interest in obtaining a better sample distribution for Los Angeles County by Service Planning Areas (SPAs). Using ZIP Code information, telephone exchanges in Los Angeles were classified into eight subsampling strata, each representing a SPA. Telephone exchanges that crossed SPAs were assigned to the SPA with the most listed households. There were no targets for individual SPAs, so the sample for Los Angeles was allocated proportionally by these substrata, except for the sample for Antelope Valley. The sample for Antelope Valley included an additional sample to yield 250 adult interviews more than what would be expected from proportional allocation.
As mentioned in Chapter 2, disproportionate stratified sampling was used to oversample
Koreans and Vietnamese without increasing the sample size allocated to any stratum (the stratum sample size was fixed). An analysis done in CHIS 2003 to help with the allocation found that six percent or more Korean or Vietnamese in the exchanges was optimal for the creation of the substrata. In addition, the analysis showed that oversampling the substrata with high concentration at twice the rate of the low concentration strata did not inordinately inflate the design effect nor decrease the effective sample sizes for other race-ethnic groups of interest. See CHIS 2003 Methodology Series: Report 1 - Sample Design for additional details of the analysis for the creation of high- and low-density substrata.
Since the creation of the high/low density designation used information from Census 2000,
the assignment of telephone exchanges was revised in CHIS 2007. Tabulations of the number of Korean
4A telephone exchange consists of 10,000 consecutive telephone numbers with the same first six digits including area code. An exchange is a set of area codes and prefixes serving the same geographic area.

or Vietnamese interviews by telephone exchange were produced using data from previous CHIS cycles. Using this information, some exchanges were reallocated to the high/low density strata depending on the number of interviews completed from adults of Korean or Vietnamese descent. The high/low density subsampling strata were created in San Diego County, Orange County, and Santa Clara County. Fourteen substrata were created in Los Angeles County by classifying the SPAs into high/low density substrata.
Soon after the beginning of the data collection, the target sample size for San Diego County
was increased. The sample design required the number of adult interviews from the landline and geographic supplemental samples combined to be approximately of the same size in each of the six San Diego Health and Human Services Agency (HHSA) Service Regions. Because substrata were already created using the high/low density areas, we proceeded to divide them by HHS Service Region, thus creating eight new substrata in the county. The sample selection for the additional cases considered the fact that telephone numbers from the landline sample were already selected and fielded in the county. Additional telephone numbers in the eight substrata in San Diego County were released sequentially depending on the number of completed interviews that had been achieved during data collection.
Table 3-2 shows the definition of the substrata for Los Angeles County, San Diego County,
Orange County and Santa Clara County. The table also shows the number of telephone exchanges and the estimated number of households in the substrata. Table 3-2. Definition of sampling substratum, number of exchanges, and total number of households
for Los Angeles County, San Diego County, Orange County, and Santa Clara County
Stratum Substratum SPA/Service Region DensityNumber of telephone
exchanges Number of households
1. Los Angeles 1.012 San Fernando SPA High 31 50,945 1.013 San Gabriel SPA High 75 160,190 1.014 Metro SPA High 110 131,072 1.017 South SPA High 34 41,693 1.018 South Bay SPA High 51 81,935 1.021 Antelope Valley SPA Low 42 99,137 1.022 San Fernando SPA Low 375 692,159 1.023 San Gabriel SPA Low 236 400,706 1.024 Metro SPA Low 183 267,456 1.025 West SPA Low 242 343,197 1.026 South SPA Low 169 268,730 1.027 East SPA Low 156 326,197 1.028 South Bay SPA Low 244 427,497

Table 3-2. Definition of sampling substratum, number of exchanges, and total number of households for Los Angeles County, San Diego County, Orange County, and Santa Clara County (Continued)
Stratum Substratum SPA/Service Region DensityNumber of telephone
exchanges Number of households
2. San Diego 2.012 North Central Service Region High 52 78,827 2.013 Central Service Region High 24 68,388 2.021 North Coastal Service Region Low 90 188,707 2.022 North Central Service Region Low 96 115,751 2.023 Central Service Region Low 71 124,653 2.024 South Service Region Low 64 112,574 2.025 East Service Region Low 69 163,024 2.026 North Inland Service Region Low 106 171,195 3. Orange 3.01 N/A High 255 335,605 3.02 N/A Low 367 614,255 4. Santa Clara 4.01 N/A High 154 191,604 4.02 N/A Low 307 379,117 Total 3,603 5,834,614
Source: UCLA Center for Health Policy Research, 2007 California Health Interview Survey.
3.2.3 Supplemental Geographic Samples
In CHIS 2007, one supplemental geographic sample was added at the request of San Diego County after funding was arranged. Officials in this county were interested in a larger sample (4,800 adult interviews) for a more detailed analysis. Since this supplemental sample covered the entire county, we considered it as a part of the landline sample. The geographic supplement to San Diego County was drawn using the same methodology used in the landline sample. That is, we allocated the supplemental sample to achieve approximately the same number of completed adults by the six HHSA Service Regions. We also stratified the telephone exchanges in San Diego County into eight strata that corresponded to the six Service regions as described in Section 3.2.2. As in the main landline sample, exchanges that crossed regions were assigned to the region with the largest number of households in the exchange.
We did not screen the telephone numbers in the supplemental sample to determine if the
respondent resided in San Diego County. Therefore, there was no difference in the instruments between the landline supplemental samples for San Diego. Table 3-3 shows the targeted number of adult interviews for San Diego County.

Table 3-3. Targeted number of adult interviews for San Diego County by service regions
Targeted number of interviews Substratum Main Geographic Total
Total 3,123 1,677 4,800
1 North Coastal 561 236 798
2 North Central 511 181 693
3 Central 539 448 987
4 South 344 396 740
5 East 616 207 824
6 North Inland 551 209 760
Source: UCLA Center for Health Policy Research, 2007 California Health Interview Survey.
3.2.4 Supplemental Surname List Samples
The second type of supplemental sample was the surname sample used to increase the number of completed interviews of adults of Korean and Vietnamese descent. The statewide goal was 500 completed adult interviews from each ethnic group from the combined landline and surname samples. As in this and previous cycles of CHIS, the Korean and Vietnamese supplemental samples were drawn from lists of telephone numbers with Korean and Vietnamese surnames maintained by the sampling vendor. We screened the telephone numbers in these samples to determine eligible adults (i.e., adults of Korean or Vietnamese descent) in the household. If there were no eligible adults, the interview was terminated and the case was coded as ineligible.
Table 3-4 shows the sampling goals for completed adult interviews for Koreans and
Vietnamese in CHIS 2007. The targets of the surname list sample were adjusted during data collection, as the actual landline and surname samples yields became known. In CHIS 2007, the landline sample did not produce the expected number of Korean and Vietnamese cases; therefore, we drew additional numbers from the list frames during the data collection period.

Table 3-4. Targeted number of complete adult interviews for the Korean and Vietnamese samples
Targeted number of adult interviews
Subgroup Landline sample Supplemental list sample Total
Korean 472 28 500
Vietnamese 366 134 500
Total 838 162 1,000
Source: UCLA Center for Health Policy Research, 2007 California Health Interview Survey.
The list frames were created by the sampling vendor by compiling lists of surnames likely to
be Korean or Vietnamese from telephone directories in California. The vendor provided five non-overlapping surname frames; the first two frames included telephone numbers whose associated surnames were very likely to be Korean only or Vietnamese only, and not any other race group. The third and fourth frames included those surnames likely to be either Korean and any other group, or Vietnamese and any other group. The last frame included telephone numbers of those surnames likely to be Korean or Vietnamese, and not from any other group.
Separate samples were drawn from each of the five frames. The fourth and fifth frames were
undersampled because we expected a low yield based on the 2005 results. Households were eligible for the extended interview if they included an adult who was either Korean or Vietnamese, regardless of which frame the number was drawn from. Table 3-5 shows the size of the surname list frames used in 2007 and the number of telephone numbers drawn from each frame.
Table 3-5. Surname frames and sample sizes
Surname frame Number of records Sample size Korean only 144,430 6,044 Vietnamese only 106,715 15,348 Korean and some other race but Vietnamese 234,457 100 Vietnamese and some other race but Korean 196,809 400 Korean or Vietnamese 89,816 4,088
Source: UCLA Center for Health Policy Research, 2007 California Health Interview Survey.

3.2.5 Cell Phone Sample
The CHIS 2007 cell phone sample had a state-wide target of completing 800 interviews with adults living in households with only cellular telephone service, called cell phone-only households. Only adult interviews were conducted in the cell sample. The 2007 CHIS cell phone sample design was based on the results of the 2005 cell phone pilot of 100 adult interviews.
The cell phone sample design was different from the landline design and presented its own
challenges. The main cell phone sample was drawn by the sampling vendor using the latest Telcordia database. This sample was selected from 1000-series blocks in California dedicated to wireless service.5 Telephone numbers that were ported from a landline to a cell phone could not be selected from these exchanges because these numbers were in exchanges assigned to landlines. To address this problem, telephone numbers identified as ported cell phones in the base landline sample were included as part of the cell phone sample. The ported numbers were identified by disposition code in the CSS (see Table 2-1). The remainder of this section discusses the sampling of the main cell sample.
One problem that is unique to cell phone sampling is assigning a geography to a number. Although cell phone numbers are sampled from exchanges assigned to wireless service, the geographic area covered by the exchange does not necessarily indicate the geographic area where the respondent resides. This is because the cell phone exchange generally corresponds to the geographic areas where the cell phone was purchased. In addition, unlike the landline sample where the numbers were drawn from banks with a 100 numbers, the cell phone numbers were drawn from groups of 1,000 numbers. Another difference is the lack of detailed demographic and socio-economic information (e.g. number of households, percentage of homeowners, African Americans, etc.) on the geographic area from which the cell phone is sampled.
Since there was not exact information on the geographic area covered by the cell phone exchange, the sampling strata were created in an indirect way. First, we determined the counties covered by the area code using the number of households in each area code. While some area codes were completely contained in a single county (Los Angeles County, for example); most area codes covered multiple counties. Counties with the greatest proportion of households among all counties in an area code were assigned to the area code. For example, 41 percent of all the households in area code 209 fell in San 5 There are some additional, technical restrictions in the sampling, such as making sure the number can be dialed into and that toll-free numbers
are excluded.
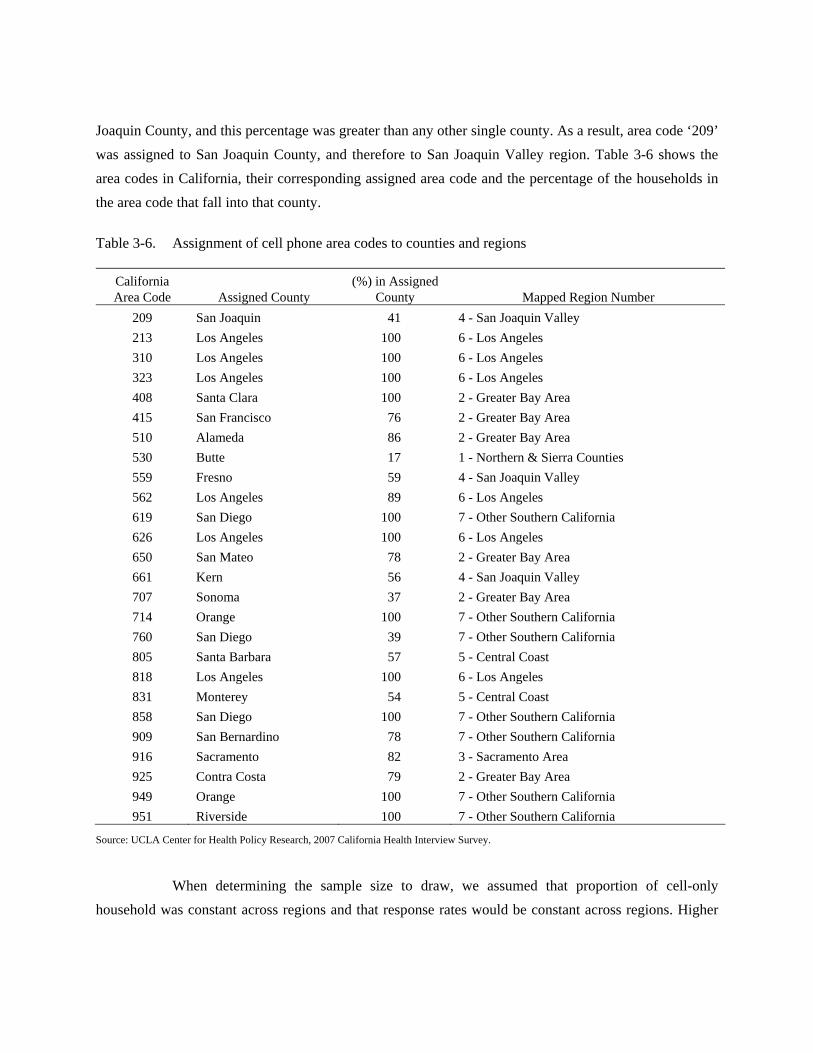
Joaquin County, and this percentage was greater than any other single county. As a result, area code ‘209’ was assigned to San Joaquin County, and therefore to San Joaquin Valley region. Table 3-6 shows the area codes in California, their corresponding assigned area code and the percentage of the households in the area code that fall into that county.
Table 3-6. Assignment of cell phone area codes to counties and regions
California Area Code Assigned County
(%) in Assigned County Mapped Region Number
209 San Joaquin 41 4 - San Joaquin Valley 213 Los Angeles 100 6 - Los Angeles 310 Los Angeles 100 6 - Los Angeles 323 Los Angeles 100 6 - Los Angeles 408 Santa Clara 100 2 - Greater Bay Area 415 San Francisco 76 2 - Greater Bay Area 510 Alameda 86 2 - Greater Bay Area 530 Butte 17 1 - Northern & Sierra Counties 559 Fresno 59 4 - San Joaquin Valley 562 Los Angeles 89 6 - Los Angeles 619 San Diego 100 7 - Other Southern California 626 Los Angeles 100 6 - Los Angeles 650 San Mateo 78 2 - Greater Bay Area 661 Kern 56 4 - San Joaquin Valley 707 Sonoma 37 2 - Greater Bay Area 714 Orange 100 7 - Other Southern California 760 San Diego 39 7 - Other Southern California 805 Santa Barbara 57 5 - Central Coast 818 Los Angeles 100 6 - Los Angeles 831 Monterey 54 5 - Central Coast 858 San Diego 100 7 - Other Southern California 909 San Bernardino 78 7 - Other Southern California 916 Sacramento 82 3 - Sacramento Area 925 Contra Costa 79 2 - Greater Bay Area 949 Orange 100 7 - Other Southern California 951 Riverside 100 7 - Other Southern California
Source: UCLA Center for Health Policy Research, 2007 California Health Interview Survey.
When determining the sample size to draw, we assumed that proportion of cell-only
household was constant across regions and that response rates would be constant across regions. Higher

sampling rates (but less than oversampling by a factor of 2) were used in three regions: Northern & Sierra Counties, Central Coast and Sacramento Area. All the other regions were assigned the same sampling rate. These rates were expected to yield at least 60 completed interviews in the more sparsely populated regions of California. Table 3-7 shows the target yield and the sampling rate for each region, along with the sample size drawn from each region. Although the sampling rate assignment was done at the region level, the sample was selected using the exchange as a sampling stratum (see Table A-6 in Appendix A).
Table 3-7. Cell sample sampling rate, original sample counts, yield targets and observed yield by
geographic regions
California Region Sampling Rate Sampled Phone
Numbers Yield Targets Observed Yield
1 - Northern & Sierra Counties 0.0062 2,645 60 53
2 - Greater Bay Area 0.0039 8,690 150 180
3 - Sacramento Area 0.0050 2,552 60 50
4 - San Joaquin Valley 0.0039 4,552 70 93
5 - Central Coast 0.0052 3,185 60 72
6 - Los Angeles 0.0039 9,861 200 167
7 - Other Southern California 0.0039 11,005 200 210
Total 0.0041 42,490 800 825
Source: UCLA Center for Health Policy Research, 2007 California Health Interview Survey.
There were also differences in the way the cell sample was processed after it was selected.
Unproductive numbers in the cell phone sample (i.e., nonworking and business telephone numbers) could not be purged using directory matching because no cell phone directories exist. In addition, there are prohibitions on predictive dialing of cell phone numbers, so the other components of the CSS purging for nonproductive or nonworking numbers could not be done. Thus, the full selected cell phone sample was sent to be dialed by interviewers.
3.2.6 Area Sample
The area sample was a two-stage design conducted only in Los Angeles County in CHIS 2007. The goal of this sample was to help better understand the magnitude and nature of the errors due to nonresponse and noncoverage on CHIS estimates. The target was 800 complete adult interviews, and they were proportionally allocated to the Service Planning Areas (SPAs) in Los Angeles. No child or

adolescent interviews were conducted in this study. The area sample used an approximately self-weighting two-stage sample of addresses from
Los Angeles. The first stage was a stratified, probability-proportional-to-size sample of clusters. The number of addresses was determined for each of the sampled clusters. The second stage was the sampling of addresses from the selected clusters. These steps are described in detail below.
First, we created a sampling frame for Los Angeles County using census data. Primary sampling units (PSUs) were generally census block groups (these are small geographic areas defined by the Census Bureau that are made up of one or more blocks); small block groups were combined with other block groups when necessary to form PSUs of sufficient size. A minimum PSU size of 50 occupied housing units was set to ensure that 20 addresses per segment could be sampled. Another goal of having relatively large segments was to reduce the effects of clustering on the variance of estimates. The procedure minimized the creation of PSUs that crossed census tract boundaries (these are census designations that are larger than block groups); no PSU crossed SPA boundaries. Eight non-overlapping strata were created based the SPA definitions and each PSU was classified into one stratum.
The overall sample size was designed to yield 800 completed adult interviews proportionally
allocated across SPAs. At the first stage of sample selection, 212 PSUs were selected within each sampled stratum with probability of selection proportional to size. The measure of size for PSU selection was the number of occupied housing units as reported in the 2000 decennial census. The number of PSUs selected in each stratum was allocated approximately proportionally to the number of occupied housing units in the stratum. Table 3-8 shows the number of occupied units, number of PSUs, and average size of PSUs in each stratum and in the frame. The table also shows the expected number of sampled PSUs using proportional allocation, along with the number of PSUs that were sampled. The number of PSUs drawn in each stratum was rounded to the next largest even number to make variance estimation consistent with the variance estimation scheme that was used for the landline sample.

Table 3-8. Area frame characteristics for Los Angeles County by Service Planning Area
SPA
Total number of Occupied
Units Total number of
PUS
Average number of
occupied units per PSU
Expected number of sample PSUs
Number of sampled PSUs
Antelope Valley 95,493 1,181 80.9 6.4 6
San Fernando 679,886 6,410 106.1 46.4 46
San Gabriel 524,625 5,718 91.7 35.7 36
Metro 414,707 3,493 118.7 28.3 28
West 280,146 2,532 110.6 19.2 18
South 255,884 2,938 87.1 17.3 18
East 357,461 3,974 89.9 24.3 24
South Bay 525,572 5,637 93.2 35.7 36
Total 3,133,774 31,883 98.3 212
Source: UCLA Center for Health Policy Research, 2007 California Health Interview Survey
In the next step, we obtained lists of residential addresses from a vendor. The vendor created
these lists based on the U.S. Postal Service delivery sequence files (DSF). Since the vendor provides address lists by ZIP Code, addresses were obtained for all ZIP Codes within the sampled PSUs. For several reasons, especially the time difference between the DSF and the Census 2000 data, the number of addresses in the DSF did not match the number of occupied units in the PSU used in selecting the sample of PSUs.
Once the counts of addresses were known for each sampled PSU, the second stage sample
could be selected. An equal probability sample of 20 addresses per PSU was drawn in this second stage. The combination of probability proportional to size sampling at the first stage and an equal number of addresses sampled at the second stage produces an approximately equal probability sample of households. Table 3-9 shows the number of addresses in the frame and sampled PSUs.

Table 3-9 Frame and sample of addresses Los Angeles County by Service Planning Area
Service Planning Area
Number of sampled PSUs
Total number of addresses
Average number of addresses per PSU Sampled addresses
Antelope Valley 6 1,003 167.2 122
San Fernando 46 9,290 202.0 933
San Gabriel 36 4,446 123.5 733
Metro 28 5,176 184.9 601
West 18 2,765 153.6 373
South 18 2,693 149.6 373
East 24 2,727 113.6 480
South Bay 36 5,346 148.5 674
Total 212 33,446 157.8 4,289
Source: UCLA Center for Health Policy Research, 2007 California Health Interview Survey
Table 3-10 shows the expected number of interviews by SPA from this sample. These numbers were expected by using a variety of data collection procedures.
Reverse telephone matching procedures were used to obtain a telephone number for the
sampled addresses. This process yielded a telephone number for about 40 percent of the addresses. Cases with a telephone number were treated as landline cases operationally. There were two main differences: there were no subsampling of refusals and initial refusals were not followed up by telephone. In-person attempts were made to contact the remaining cases (addresses without a telephone number), as well as cases attempted but not completed by telephone.6 Additional details on the other operations of the area sample are described in CHIS 2007 Methodology Series: Report 2 – Data Collection.
6 A few very hostile or abusive telephone refusals were not sent to the field.

Table 3-10. Number of expected completed interviews, by telephone and in person for Los Angeles County by Service Planning Area
Service Planning Area Expected completed
interviews Expected completed
telephone Expected completed
in-person Antelope Valley 23 8 15 San Fernando 175 60 115 San Gabriel 137 47 90 Metro 113 39 74 West 70 24 46 South 70 24 46 East 90 31 59 South Bay 126 43 83 Total 804 276 528
3.3 Sample Selection
The number of telephone numbers selected in any telephone survey has to be greater than the targeted number of completed interviews to account for a variety of factors. For example, a substantial percentage of the sampled telephone numbers are not residential. For CHIS 2007 the sample of telephone numbers was inflated to deal with losses due to the following sources:
Nonworking, nonresidential, and never answered numbers;
Nonresponse to the screening interview;
Nonresponse to the extended interview.
Ineligible households in the surname list and cell phone samples; and
Subsampling for refusal conversion;
The first three sources noted above are typical of all telephone surveys. To deal with these losses we used information from CHIS 2005 to estimate the percentage of telephone numbers that would not be residential and the percentage that would not respond to the screener and extended interviews, and increased the sample size accordingly. Estimates of the eligibility rates were taken from CHIS 2005 (surname samples) and published research using cell phone samples. As mentioned in Chapter 2, during CHIS 2007 sample selection, 60 percent of the telephone numbers were flagged for refusal conversion. Refusal conversion efforts were made only to flagged telephone numbers after the respondent refused to do the screener interview.

Taking all of these factors into consideration, 863,454 telephone numbers7 were sampled for CHIS 2007. Not all the telephone numbers were selected at the same time, as the sample design was modified several times during the field period to reflect the observed yield and changes in the targeted number of completed interviews. After each selection, duplicate telephone numbers (those numbers that had been previously sampled) were removed from the samples. Table 3-11 summarizes the size of each type of sample. Table A-2 in the appendix shows the sample size by sampling stratum for the different samples. The data collection procedures are discussed in CHIS 2007 Methodology Series: Report 2 - Data Collection Methods.
Table 3-11. Number of telephone numbers drawn by type of sample
Sample type Number of telephone numbers drawn Base landline sample 784,298
Geographic supplemental sample 22,105 San Diego
Surname List samples Korean only 6,044 Korean and other 100 Vietnamese only 15,348 Vietnamese and other 400 Korean and Vietnamese 4,088 Cell phone sample 42,490
Total 879,132
Source: UCLA Center for Health Policy Research, 2007 California Health Interview Survey.
3.4 Expected Design Effect
Previous sections described the allocation of the sample of telephone numbers by sampling stratum and substratum and noted that it involved compromises among three goals: to produce reliable estimates for the entire state, to produce estimates at the county level, and to oversample Koreans and Vietnamese. Allocating the sample proportionally to the population in the counties would be approximately optimal for statewide estimates. For county estimates, an equal allocation would be more efficient. In this section, we describe the statistical methods used to examine the efficiency of the sample under different allocations. These methods helped guide the allocation of the CHIS 2007 sample.
7 This total excludes the area sample matched numbers.

If CHIS 2007 had been a simple random sample, it would be relatively simple to predict the
precision of the estimates. Under the assumption of simple random sampling, suppose we wish to estimate a proportion of adults with a characteristic, say p. If the sample size is large enough, then the standard (1-α)⋅100 percent confidence interval of the estimated proportion, p̂ , is
1 / 2 1 / 2ˆ ˆ ˆ ˆ(1 ) (1 )ˆ ˆ,p p p pp z p z
n nα α− −⎛ ⎞− −
− +⎜ ⎟⎝ ⎠
(1)
where 1 / 2z α− is the critical value from the standard normal distribution and n is the number of completed interviews. This form of confidence interval is not appropriate for CHIS 2007 for several reasons. The main reason is that the allocation of the sample to the counties does not produce a simple random sample across the state. Other reasons why the estimated proportion given in (1) is not fully appropriate are sampling within households and other adjustments made to the weights. These issues are covered in CHIS 2007 Methodology Series: Report 5 - Weighting and Variance Estimation.
To adjust (1) to account for the sample allocation to the counties or strata we introduce the
concept of a design effect. Kish (1992) discusses the design effect in some detail. Here we simply note that in stratified designs like CHIS, the design effect measures the departures from proportionate allocation across strata. A sample with proportionate allocation has a design effect of one. Departures from proportionate allocation result in design effects greater than one.
The design effect can be computed as
1 1
H H hh h
h h h
WD W kk= =
⎛ ⎞⎛ ⎞= ∑ ∑⎜ ⎟⎜ ⎟⎝ ⎠⎝ ⎠
, (2)
where hW is the proportion of stratum h in the population computed as ( ) 1
h h hW N N −= ∑ , where hN is
the population total in stratum h, and hk is the relative sampling rate for stratum h. More specifically, hk
is defined as 1
1
hh
h
n NkN n
= , where hn is the sample size in stratum h and the reference stratum is set to be
stratum 1 so that 1 1k ≡ (the choice of the reference stratum does not affect the computations since the
relative sampling rates are the only factors involved).
Using the design effect computed this way we can estimate the effective sample size for a

stratified sample with a given allocation. The effective sample size is the number of cases needed from a stratified sample to produce estimates with the same precision that would be expected from a simple random sample design. The effective sample size effn is computed as
effnnD
= . (3)
where n is the nominal sample size and D the design effect defined above.
In CHIS 2007, we expected to complete 46,600 adult interviews from the landline sample
(the supplemental geographic sample and the supplemental list samples were not included in this evaluation). The expected nominal sample sizes (the number of adult interviews), the expected design effects due to the sample allocation to the strata using (2), and the expected effective sample sizes using (3) are given in Table 3-12. The expected design effects and effective sample sizes are given for the entire state and for domains defined by race and ethnicity. It is important to remember that the design effects are computed at the household level and do not include any adjustments for nonresponse, within-household sampling, or other weighting adjustments.
Table 3-12. Expected design effects and effective adult sample size associated with the sample allocation
for the base landline sample
Race* and ethnicity Expected nominal
sample size Expected
design effect Expected effective
sample size
Total 46,600 1.17 39,844
White alone non-Latino 25,523 1.20 21,220
African American alone non-Latino 2,869 1.05 2,727
American Indian alone non-Latino 533 1.34 399
Asian alone non-Latino 4,230 1.06 3,973
Native Hawaiian or Pacific Islander 121 1.11 109
Multiple race non-Latino 973 1.18 826
Latino 12,352 1.14 10,810
* Office of Management and Budget definition of race
Source: UCLA Center for Health Policy Research, 2007 California Health Interview Survey.

For example, the expected yield from the CHIS 2007 sample for Latino was 12,352 adults for the landline sample. Due to the allocation of the sample, the expected effective sample size was 10,810. The 95 percent confidence interval for an estimated proportion can be computed by using the entries in this table and replacing n in (1) by effn . For example, for estimating a proportion of p = 0.5 for American Indian/Alaska Natives, the 95 percent confidence interval is
( )2 20.5 0.50.5 1.96 , 0.5 1.96 , 0.4509, 0.5491
399 399
⎛ ⎞− + =⎜ ⎟⎜ ⎟
⎝ ⎠
As the UCLA CHIS staff consulted with various groups in California to evaluate the data needs that CHIS could help to support, they developed different allocation schemes for distributing the sample to the counties. The effects of these allocations were examined by using the methods presented above. The UCLA CHIS staff then chose the sample allocation that best satisfied the needs of survey data users.

4-1
4. WITHIN-HOUSEHOLD SAMPLING
Once the sample of telephone numbers was selected, interviewers called the numbers and conducted interviews with sampled persons within the household. This chapter describes the procedures for selecting the sample of persons within households for CHIS 2007. Samples of adults, children, and adolescents within the household were selected using different sampling procedures, but one adult and up to one child and one adolescent were sampled within a given household. The within-household sampling procedures were developed to maximize the analytic utility of the data collected from the respondents. As noted earlier, the within-household sampling for the cell and area samples did not include sampling of children or adolescents. The sampling of adults for the area sample was the same as used for the landline RDD sample, but the methods of sampling adults were slightly different for the cell phone sample.
The next section describes the within-household sampling alternatives we evaluated and the
reasons for choosing the specific method of sampling. The second section describes the operational “child-first” procedure used to increase the number of child interviews. The last sections describe the methodology used for sampling adults, children, and adolescents in CHIS 2007.
4.1 Sampling Alternatives
The general idea for the sample design over the CHIS cycles has been to sample one adult randomly from all the adults in the sampled household. In addition, in those households with adolescents (ages 12-17) and/or children (under age 12), one adolescent and one child were to be sampled and interviewed (a parent of the child was interviewed about the child). One approach to accomplishing these goals is to simply list all the persons in the age group (adult, child, and adolescent) in the household and select one person randomly from each group. We call this the completely random sampling method.
The completely random sampling method is not a problem in most households because most
households have only one family. However, in households with two or more families, the completely random method could result in selecting persons from different age groups who were not members of the same family. This situation is undesirable because the adult interview collects data about the family of the sampled adult. The data from the adult interview are of great value for the analysis of the data from the child and adolescent interviews. If the sampled child and/or sampled adolescent were not members of the

4-2
same family as the sampled adult, then the data collected about them would be of very limited utility. To resolve this analytic problem, a second sampling alternative was adopted and has been
used since CHIS 2001. We call this method the linked sampling approach. In this approach, children and/or adolescents for whom a sampled adult was a blood or adoptive parent or a legal guardian were considered as linked to or “associated” with that adult.
In the linked sampling method, persons are sampled in two phases. In the first phase, an
adult is randomly sampled from all the adults in the household. In the second phase, a child is sampled from all the children associated with the sampled adult. Since the sampling of children is a two-phase procedure, the probability of selection of the child is the product of the probability of selecting the adult (phase one) and the probability of selecting the child from all children associated with that adult (phase two). Adolescents are sampled in the same way, that is, one adolescent is selected from all adolescents associated with the adult sampled in the first phase.
To use the linked sampling method, data are needed to link children and adolescents in a
household to the sampled adult and his/her spouse/partner (children or adolescents linked to both the sampled adult and spouse/partner could be selected if either adult was sampled). These data were collected during the screener interview or the adult interview in CHIS 2007. We expected that in a very few households it would not be possible to link or associate a child or adolescent to an adult because of unusual household structures. A child or adolescent not associated with an adult does not have a chance of being selected. Beginning in 2003, the UCLA Institutional Review Board (IRB) directed that only children and adolescents of the sampled adult could be interviewed. Therefore, unassociated children and adolescents in a household could not be randomly linked to an adult in the household in 2007 and most previous cycles of the survey. The bias due to excluding unassociated children and adolescents was expected to be very small; however, it is not possible to evaluate this bias.
4.2 Child First Procedure
In the first two cycles of CHIS, children and adolescents were enumerated and sampled during the adult extended interview. The child and/or adolescent interviews were then conducted following the adult interview. Beginning in 2005, the child and adolescent interviews could be conducted prior to the adult interview under certain conditions. These changes in the order a child and/or adolescent

4-3
was selected and interviewed are called the “child-first” procedure. This procedure was an operational method (not a sampling method) used to increase the sample yield for child interviews.
In 2001 and 2003, children and adolescents were enumerated and sampled at about the
mid-point of the adult interview (section G). If the adult did not complete the extended interview, the child and adolescent could not be interviewed. The child-first procedure was used only when the screener respondent was the spouse or partner of the sampled adult, there were children in the household associated with the sampled adult, and the sampled adult was not available at the time of the interview. If these conditions were met, a child and or adolescent could be sampled and the appropriate interview was conducted without waiting for the completion of the adult interview. When the child-first criteria were not met, the sampling for children or adolescents was not done until the adult was interviewed.
Table 4-1 shows the distribution of completed screener interviews for households with
children and the number of households where the child-first procedure was used in CHIS 2007. In CHIS 2007, 15,154 households with children8 completed the screener interview. The child-first procedure was used in 41.9 percent of households with children with a completed screener interview. A child interview was completed in 70.9 percent (4,499 interviews) of the households with children where the child-first procedure was used. In comparison, a child interview was completed in only 61.4 percent (5,414 cases) of households with children where the procedure was not used.
Although the child-first procedure was intended to increase the number of child interviews,
it did not have a large effect on the number of adolescent interviews. The child-first procedure was used in 21.2 percent of the households with adolescents and 35.9 percent of those completed the adolescent interview. In only 36.2 percent of the households with adolescents where the child first procedure was not used the adolescent interview was completed.
See CHIS 2007 Methodology Series: Report 2 - Data Collection for more detail on the
child-first procedures and further evaluation of the yields.
8 This number is includes households with children but where the sample adult is not related to any of the children in the household.

4-4
Table 4-1. Effect of the child-first procedure on completed child and adolescent interviews Households with children that completed a screener interview Count Percentage
Total number of households with children 15,154 100.0
Participated in the child-first procedure 6,342 41.9
Did not participate in the child-first procedure 8,812 58.1
Households with children that completed a screener interview and participated in the child-first procedure Count Percentage
Total number of households participating in the child-first procedure 6,342 100.0
Completed the extended interview 4,499 70.9
Did not complete the extended interview 1,843 29.1
Households with children that completed a screener interview and did not participate in the child-first procedure Count Percentage
Total number of households not participating in the child-first procedure 8,812 100.0
Completed the extended interview 5,414 61.4
Did not complete the extended interview 3,398 38.6
Households with adolescents that completed a screener interview Count Percentage
Total number of households with adolescents 10,072 100.0
Participated in the child-first procedure 2,134 21.2
Did not participate in the child-first procedure 7,938 78.8
Households with adolescents that completed a screener interview and participated in the child-first procedure Count Percentage
Total number of households participating in the child-first procedure 2,134 100.0
Completed the extended interview 766 35.9
Did not complete the extended interview 1,368 64.1
Households with adolescents that completed a screener interview and did not participate in the child-first procedure Count Percentage
Total number of households not participating in the child-first procedure 7,938 100.0
Completed the extended interview 2,872 36.2
Did not complete the extended interview 5,066 63.8
Source: UCLA Center for Health Policy Research, 2007 California Health Interview Survey.

4-5
4.3 Adult Sampling
For CHIS, an adult is defined as any person 18 years or older residing in the household. The procedure to select adults in CHIS 2007 for the landline sample and the area sample was the same as that used since 2003, called the Rizzo method (see Rizzo et al., 2004, for a complete discussion of the method and its implementation). The principal advantage of this method is that the enumeration of adult household members is bypassed in most households, so it is less intrusive while still resulting in a valid probability sample. In this method, all sampled adults have an equal probability of selection. A sampled adult is selected using the following steps:
Ask the screener respondent (who must be an adult living in the household) how many
adults are in the household (i.e., N). The respondent answers N = 1, 2, 3, . . . .;
If there is only one adult in the household (i.e., N = 1), then that adult is selected;
If there are two adults in the household (i.e., N = 2), then the CATI system accesses a pre-generated uniform random number between 0 and 1.
- If the random number is less than or equal to 0.5 then the screener respondent is selected;
- If the random number is greater than 0.5 then the other adult is selected;
If there are more than two adults in the household (i.e., N > 2), then the CATI system accesses a pre-generated uniform random number between 0 and 1.
- If the random number is less than or equal to 1/N (i.e., the inverse of the number of adults in the household) then the screener respondent is selected;
- If the random number is greater than 1/N, then the screener respondent is asked which of the other adults is the next to have a birthday; and
If the screener respondent knows which of the other adults is next to have a birthday, then the adult with the next birthday is selected.
If the screener respondent does not know which of the other adults is next to have a birthday then the screener respondent is asked to list the adults in the household (excluding himself/herself) and the CATI system randomly chooses one of the adults from this roster.
If the number of adults in the household is unknown then the screener respondent is asked to list the adults in the household (including the screener respondent) and the CATI system randomly chooses one of the adults from this roster. No other sampling steps are necessary.

4-6
4.3.1 Adult Sampling in the Cell Sample
Procedures for the sampling of adults within the cell-only household were developed and implemented in the CHIS 2005 cell-phone pilot and were based on principles similar to those used in landline RDD surveys (Brick, Edwards, and Lee 2007). Adults were sampled during the screening interview.
In cell-only households with only one adult, no sampling was required. In households with
more than one adult, sampling adults depended on whether other household members shared the cell phone. If adults shared the cell phone, the same within-household sampling method used in base landline sample was implemented. That is the screener respondent (SR) is randomly selected for the adult interview with a probability equal to the inverse of the number of adults in the household. In case the SR is not selected, then one adult other than the SR is selected for the adult interview using the next birthday method. If the cell phone was not shared, then the SR is sampled.
This sampling scheme assumes that, in cell-only households with more than one adult, each
adult has a cell phone (or shares a different cell phone) if the sampled cell phone is not shared. However, this assumption may not be true; about 36 percent of SRs in the study said that they did not share this cell phone but reported more adults than cell phones in the household. This difference could be due to response error, but it may also indicate that the assumption of all adults having their own cell does not hold universally even in this situation.
This weakness in the sampling scheme was recognized during the pilot in 2005. However,
the alternative approach required asking the full battery of items required to ascertain the cell phone status of each adult in the household, which was viewed as a heavy burden that could detract from gaining cooperation. In other words, while the sampling scheme did not address all possible forms of within-household undercoverage, it was believed this was a good compromise between reducing the potential for increased nonresponse and coverage errors.
4.4 Child Sampling
In an earlier cycle of CHIS, the child sampling procedure was modified to increase the

4-7
number of interviews for younger children (0 to 5 years old) while reducing the number of interviews for older children (6 to 11 years old). Previously all children were sampled at the same rate. If there were only younger or older children in the sampled households, a child was selected with equal probability of selection as in all previous cycles. In contrast, in households with both younger and older children, children were sampled with differential probabilities of selection. Younger children in such households were assigned a greater probability of selection with respect to the older children. The probability assigned to children i in the household h, hip , was assigned as
⎪⎪⎩
⎪⎪⎨
⎧
+
+=child)(older old years11 and 6between is householdin child of age If
2
child)(younger old years5 and 0between is householdin child of age If2
2
21
2
21
1
hiNCNC
NC
hi NCNC
NC
p
hh
h
hh
h
hi
where hNC1 is the number of younger children and hNC2 is the number of older children in the
household h. For example, in a household with one young child and one older child, the young child was twice as likely to be selected as the older child. The disadvantage of this approach is that the number of interviews about older children was reduced and there was a slight increase in the design effect for estimates for all children due to the disproportionate sampling.
Table 4-2 shows the number of households with a completed screener interview in which the enumeration and selection of children were completed (either at the end of the extended interview for child-first cases or in section G of the adult extended interview) in CHIS 2007. Children were selected with unequal probability of selection in approximately 24 percent of the households with children.

4-8
Table 4-2. Distribution of households with children by type of child sampling
Type of child sampling Type of household
Number of households Percentage
Household with children 0 to 5 years old 4,816 34.8 Equal probability Household with children 6 to 11 years old 5,642 40.8
Unequal probability Household with children 0 to 5 and 6 to 11 years old 3,366 24.4
Total 13,824 100.0
4.5 Adolescent Sampling
The sampling method used in CHIS 2007 to select an adolescent did not change from previous cycles. That is, an adolescent was sampled with equal probability from among all eligible adolescents associated with the sampled adult in a household. Adolescents were enumerated and sampled at the end of the screener interview if the child-first procedure was used or in section G of the adult extended interview. Since adolescents could be sampled and interviewed before the adult interview, there were some households with a completed adolescent interview where adult and/or child interviews were not completed. CHIS 2007 Methodology Series: Report 5 - Weighting and Estimation describes how the probabilities of selection are computed for the sampled adults, children, and adolescents.

5-1
5. ACHIEVED SAMPLE SIZES
This chapter summarizes the number of completed interviews in CHIS 2007 for the landline and other samples and the relationship between the targeted and the achieved numbers. As mentioned in the previous chapters, the targeted goals for CHIS 2007 were stated in terms of the total number of completed adult interviews. The actual number of completed interviews is a function of the number of telephone numbers sampled, the within-household person sampling, and different reasons for nonresponse. These reasons were discussed in more detail in Chapter 3. Detailed information about the response rates is presented in CHIS 2007 Methodology Series: Report 4 – Response Rates.
Table 5-1 shows the number of completed interviews by sample type compared to the
adjusted targets. The table shows that, in general, the target goals were met in CHIS 2007 at the state level.

5-2
Table 5-1. Number of telephone numbers drawn by type of sample
Sample type Number of Completed
interviews Adjusted
Goal % Completed Base landline and surname list samples
Adults 49,242 49,277 99.9
Child 9,913 — —
Adolescent 3,638 — —
Cell phone sample (adults) 825 800 103.1
Area sample (adults) 981 800 122.6
Total 64,599
Source: UCLA Center for Health Policy Research, 2007 California Health Interview Survey.
Table 5-2 also shows the number of completed interviews as percentages of the targeted
number of adult interviews (adjusted targets) for the landline samples set at the time of the design. A percentage of 100 or greater indicates the targeted number of adult interviews was reached in the stratum. The targets were met or surpassed in 42 strata of the 44 strata based on the sampling location information that was available at the time of data collection. For the self-reported location, 34 of the 44 strata met or surpassed the target number of completes. The discrepancies between the two location classifications are largely a function of how well the sampling classification matched with the self-reported classification.

5-3
Table 5-2. Number of completed adult interviews for the base landline and geographic samples by sampling and self-reported stratum*
Sampling location Self-reported location
Stratum
Completed interviews
% of Targeted interviews
Completed interviews
% of Targeted interviews
State 48,791 101.1 48,791 101.1
Los Angeles 11,048 99.2 11,054 99.2
San Diego 4,873 101.5 4,878 101.6
Orange 2,775 100.9 2,723 99.0
Santa Clara 1,629 101.4 1,676 104.4
San Bernardino 1,677 100.8 1,686 101.3
Riverside 1,745 101.0 1,763 102.1
Alameda 1,556 102.0 1,490 97.6
Sacramento 1,451 100.7 1,450 100.6
Contra Costa 1,051 101.7 1,134 109.8
Fresno 794 103.5 804 104.8
San Francisco 923 101.7 910 100.2
Ventura 724 101.1 741 103.5
San Mateo 730 104.4 717 102.6
Kern 672 102.4 677 103.2
San Joaquin 601 100.2 600 100.0
Sonoma 579 101.6 590 103.5
Stanislaus 581 101.9 564 98.9
Santa Barbara 593 104.0 592 103.9
Solano 567 99.5 551 96.7
Tulare 583 102.3 584 102.5
Santa Cruz 583 102.3 569 99.8
Marin 573 100.5 574 100.7
San Luis Obispo 577 101.2 579 101.6
Placer 571 100.2 571 100.2
Merced 577 101.2 595 104.4
Butte 594 104.2 605 106.1
Shasta 575 100.9 603 105.8
Yolo 586 102.8 593 104.0
El Dorado 579 101.6 589 103.3

5-4
Table 5-2. Number of completed adult interviews for the base landline and geographic samples by sampling and self-reported stratum* (Continued)
Sampling stratum Self-reported stratum
Stratum Completed interviews
% of Targeted interviews
Completed interviews
% of Targeted interviews
Imperial 581 101.9 574 100.7
Napa 573 100.5 586 102.8
Kings 585 102.6 585 102.6
Madera 569 99.8 559 98.1
Monterey 570 100.0 613 107.5
Humboldt 602 105.6 617 108.2
Nevada 582 102.1 575 100.9
Mendocino 614 107.7 592 103.9
Sutter 576 101.1 573 100.5
Yuba 582 102.1 544 95.4
Lake 572 100.4 558 97.9
San Benito 574 100.7 536 94.0
Colusa, Glenn, Tehama 483 101.7 460 96.8 Del Norte, Lassen, Modoc, Plumas, Sierra, Siskiyou, Trinity 476 100.2 474 99.8 Alpine, Amador, Calaveras, Inyo, Mariposa, Mono, Tuolumne 485 102.1 483 101.7
*Partially completed interviews (completed through at least Section J) are counted as complete
Source: UCLA Center for Health Policy Research, 2007 California Health Interview Survey.
Table 5-3 shows the number of completed child and adolescent interviews for the base landline and geographic sample. Because there were not predetermined targets by stratum for children and adolescents, columns for the percentages of the targeted number of interviews are not included in the table. However, we expected between 10,000 to 11,000 child interviews based on the CHIS 2005 results and 9,913 interviews were completed. Similarly, we expected between 3,000 and 4,000 completed adolescent interviews and 3,638 were completed.

5-5
Table 5-3. Number of completed child and adolescent interviews for the base landline and geographic samples by sampling and self-reported stratum
Completed interviews
Child Adolescents
Stratum Sampling location Self-reported
location Sampling location Self-reported
location
State Total 9,818 9,818 3,622 3,622
Los Angeles 2,157 2,155 802 799
San Diego 1,012 1,009 315 317
Orange 589 586 198 191
Santa Clara 390 398 116 118
San Bernardino 420 418 153 157
Riverside 361 364 146 145
Alameda 320 293 126 117
Sacramento 248 244 110 109
Contra Costa 220 246 76 84
Fresno 175 175 64 64
San Francisco 126 121 30 30
Ventura 161 166 62 66
San Mateo 139 138 58 56
Kern 147 148 60 61
San Joaquin 135 133 41 40
Sonoma 107 109 36 34
Stanislaus 148 140 65 61
Santa Barbara 121 121 41 42
Solano 127 122 45 44
Tulare 163 163 47 47
Santa Cruz 115 112 45 43
Marin 85 86 35 36
San Luis Obispo 71 72 39 39
Placer 110 118 43 46
Merced 134 143 50 55
Butte 97 98 40 39
Shasta 95 96 49 51
Yolo 109 111 53 53

5-6
Table 5-3. Number of completed child and adolescent interviews for the base landline and geographic samples by sampling and self-reported stratum (Continued)
Completed interviews
Child Adolescents
Stratum Sampling location Self-reported
location Sampling location Self-reported
location
El Dorado 109 110 54 56
Imperial 163 163 58 58
Napa 86 92 38 41
Kings 149 150 46 46
Madera 146 147 49 49
Monterey 123 131 40 44
Humboldt 101 105 44 46
Nevada 83 79 36 33
Mendocino 90 85 40 38
Sutter 107 104 52 53
Yuba 151 147 37 35
Lake 83 81 38 38
San Benito 147 141 60 58
Colusa, Glenn, Tehama 87 85 34 32 Del Norte, Lassen, Modoc, Plumas, Sierra, Siskiyou, Trinity 61 63 32 32 Alpine, Amador, Calaveras, Inyo, Mariposa, Mono, Tuolumne 50 50 19 19
Source: UCLA Center for Health Policy Research, 2007 California Health Interview Survey.
Table 5-4 shows the number of completed adult interviews for the Korean and Vietnamese
surname list samples. The supplemental sample targets were revised during the data collection period as experience was gained on the actual landline sample yield. The target was exceeded for the number of completed Korean adult interviews but was not met for the Vietnamese interviews. The yield both from the base landline and from the Vietnamese supplemental sample was well below what was expected.

5-7
Table 5-4. Number of completed adult, child, and adolescent interviews by surname list sample
Number of completed interviews Sample Korean Vietnamese Other
Base landline sample 424 252 47,258
Korean only list 134 0 1
Korean and other list 0 0 0
Vietnamese only list 3 208 9
Vietnamese and other list 0 10 0
Korean-Vietnamese list 73 11 2
Total 634 481 47,270
Target 500 500 N/A
Percentage of Target 126.8 96.2 N/A
Source: UCLA Center for Health Policy Research, 2007 California Health Interview Survey.
Table 5-5 shows the number of completed interviews in the cell phone sample by type of cell
phone (i.e., ported landline number and exchanges assigned for wireless service). The difference between the sampled region and the self-reported region is large, as expected, for the cell phone numbers sampled from the exchanges assigned to wireless services. The goal of 800 completed adult interviews was met for this sample.
Table 5-5. Number of completed adult interviews for the cell phone sample by sampling and self-
reported region geographic regions
Ported Wireless assigned Total
California Region Sampling stratum
Self-reported stratum
Sampling stratum
Self-reported stratum
Sampling stratum
Self-reported stratum
1 - Northern & Sierra Counties 2 3 51 38 53 41
2 - Greater Bay Area 17 15 163 149 180 164
3 - Sacramento Area 2 2 48 72 50 74
4 - San Joaquin Valley 3 4 90 74 93 78
5 - Central Coast 9 9 63 69 72 78
6 - Los Angeles 17 14 150 152 167 166
7 - Other Southern California 16 19 194 205 210 224
Total 66 66 759 759 825 825
Source: UCLA Center for Health Policy Research, 2007 California Health Interview Survey.

5-8
Table 5-6 shows the number of completed adult interviews for the area sample by data collection mode. Although the sample goals were exceeded, we had expected roughly half to be completed by telephone and half to be completed in person. As the table shows, we did not complete as many interviews by telephone as expected, even though the total was met.
Table 5-6. Number of completed adult interviews for the area sample by data collection mode
Service Planning Area Completed interviews Completed
by telephone Completed from field Percent of target
Antelope Valley 33 8 25 143.5
San Fernando 186 51 135 106.3
San Gabriel 219 41 178 159.9
Metro 118 25 93 104.4
West 73 26 47 104.3
South 110 15 95 157.1
East 126 31 95 140.0
South Bay 116 40 76 92.1
Total 981 237 744 122.0
Source: UCLA Center for Health Policy Research, 2007 California Health Interview Survey.
Tables A-3 through A-5 in the Appendix show the number of completed interviews by
self-reported stratum for the adult, child, and adolescent samples by the different sample types.

R-1
REFERENCES
Blumberg SJ, Luke JV.(2008). Wireless substitution: Early release of estimates from the National Health
Interview Survey, January-June 2008. National Center for Health Statistics. Available from: http://www.cdc.gov/nchs/nhis.htm. December 17, 2008.
Brick, J.M., and Waksberg, J. (1991). Avoiding sequential sampling with RDD. Survey Methodology, 17(1), 27-41.
Brick, J.M., Edwards. W.S., Lee S. (2007). Sampling telephone numbers and adults, interview length, and weighting in the California Health Interview Survey cell phone pilot study. Public Opinion Quarterly, 71:793-813.
Brick, J.M., Montaquila, J., Hagedorn, M.C., Brock Roth, S., and Chapman, C. (2005). Implications for RDD design from an incentive experiment. Journal of Official Statistics, 21(4), 571-589.
Brick, J.M., Waksberg, J., Kulp, D., and Starer, A. (1995). Bias in list-assisted telephone surveys. Public Opinion Quarterly, 59(2), 218-235.
Delnevo C. D., Gundersen D. A., and Hagman B. T. (2007). Declining estimated prevalence of alcohol drinking and smoking among young adults nationally: artifacts of sample undercoverage?, American Journal of Epidemiolofy,167(1):15-9.
Department of Health Education and Behavioral Sciences, School of Public Health, University of Medicine and Dentistry of New Jersey, New Brunswick, NJ 08901, USA. [email protected]
Edwards, W.S., Brick, J.M., Flores Cervantes, I., DiSogra, C., and Yen, W. (2002). Sampling race and ethnic groups in RDD surveys. Proceedings of the Survey Methods Section of the American Statistical Association [CD-ROM].
Elliott, M R., Little R. J.A., and Lewitzky S. (2000). Subsampling callbacks to improve survey efficiency. Journal of the American Statistical Association, 95:451, 730-738.
Fahimi, M., Kulp, D., and Brick, J. M. (2008). “Bias in List-Assisted 100-Series RDD Sampling.” Survey Practice, September 28, 2008.
Flores Cervantes, I, and Kalton, G. (2007), “Methods for Sampling Rare Populations in Telephone Surveys” in Lepkowski, J.M, Tucker, C., Brick, J. M., de Leeuw, E. D., Japec, L., Lavrakas, P. J., Link, M.W., and Sangster, R.L. (Eds.). Advances in Telephone Survey Methodology. New York. John Wiley & Sons.
Hansen, M.H., and Hurwitz, W.N. (1946). The problem of nonresponse in sample surveys. Journal of the American Statistical Association, 41, 517–529.
Kalton, G., and Anderson, D.W. (1986). Sampling rare populations. Journal of the Royal Statistical Society, A, 149, 65-82.

R-2
Kish, L. (1992). Weighting for unequal Pi. Journal of Official Statistics, 8, 183-200.
Lee, S., Kurata, J., Nguyen, H.A., and Jawad, M. (2008). Linguistic minorities and nonresponse error.”Public Opinion Quarterly, 72, 470-486. Rizzo, L, Brick, J.M., and Park, I. (2004). A minimally intrusive method for sampling persons in Random
Digit Dialing Surveys. Public Opinion Quarterly, 68, 267-274.
Sudman, S., Sirken, M.G., and Cowan, C.D. (1988). Sampling rare and elusive populations. Science, 240, 991-9.
Tucker, C., Brick, J. M., and Meekins, B. (2007). Household Telephone Service and Usage Patterns in the U.S. in 2004: Implications for Telephone Samples, Public Opinion Quarterly, 71, 3-22.
Tucker, C., Lepkowski, J., and Piekarski, L. (2002). The current efficiency of list-assisted telephone sampling designs. Public Opinion Quarterly, 66, 321-338.

APPENDIX A


A-1
Table A-1. Stratum definitions for CHIS 2001, 2003, 2005 and 2007
County 2005 and 2007 Stratum 2001 and 2003 Stratum Los Angeles 1 1 San Diego 2 2 Orange 3 3 Santa Clara 4 4 San Bernardino 5 5 Riverside 6 6 Alameda 7 7 Sacramento 8 8 Contra Costa 9 9 Fresno 10 10 San Francisco 11 11 Ventura 12 12 San Mateo 13 13 Kern 14 14 San Joaquin 15 15 Sonoma 16 16 Stanislaus 17 17 Santa Barbara 18 18 Solano 19 19 Tulare 20 20 Santa Cruz 21 21 Marin 22 22 San Luis Obispo 23 23 Placer 24 24 Merced 25 25 Butte 26 26 Shasta 27 27 Yolo 28 28 El Dorado 29 29 Imperial 30 30 Napa 31 31 Kings 32 32 Madera 33 33
34 Monterey San Benito 41
34
40 Lake Mendocino 37
37
38 Sutter Yuba 39
39

A-2
Table A-1. Stratum definitions for CHIS 2001, 2003, 2005 and 2007 (continued)
County 2005 and 2007 Stratum 2001 and 2003 Stratum Colusa Glen Tehama
42 38
35 Humboldt Del Norte, 35
Lassen Modoc Siskiyou Trinity
36 43
Plumas Sierra Nevada 36
40
Alpine Amador Calaveras Inyo Mariposa Mono Tuolumne
44 41

A-3
Table A-2. Number of telephone numbers and addresses drawn by sample type and sampling stratum
Supplemental Samples Surname*
Stratum Base Sample
Landline Cell
Phone Landline
GeographicKorean Only
Korean and Other
Vietnamese Only
Vietnamese and Other
Korean/ Vietnamese
Area Sample** Total
State 783,105 43,705 22,083 6,044 100 15,348 400 4,088 4,259 879,132
1 Los Angeles 221,715 10,116 0 2,402 34 2,897 90 1,588 4,259 243,101
2 San Diego 61,006 4,930 22,083 244 1 967 12 164 0 89,407
3 Orange 58,857 3,027 0 795 11 3,791 65 710 0 67,256
4 Santa Clara 34,159 1,628 0 403 14 2,682 61 427 0 39,374
5 San Bernardino 23,763 1,858 0 220 3 399 8 138 0 26,389
6 Riverside 24,372 1,385 0 172 5 418 10 103 0 26,465
7 Alameda 28,158 1,754 0 351 10 1,000 42 262 0 31,577
8 Sacramento 20,869 2,582 0 155 2 759 19 106 0 24,492
9 Contra Costa 16,181 1,190 0 120 1 236 7 69 0 17,804
10 Fresno 12,890 1,528 0 86 2 185 4 23 0 14,718
11 San Francisco 27,453 1,375 0 275 9 583 43 176 0 29,914
12 Ventura 11,080 19 0 72 1 138 3 37 0 11,350
13 San Mateo 15,287 1,020 0 150 4 135 14 74 0 16,684
14 Kern 9,279 1,221 0 41 0 74 1 14 0 10,630
15 San Joaquin 8,398 1,833 0 58 0 224 7 26 0 10,546
16 Sonoma 7,252 1,918 0 49 0 92 1 14 0 9,326
17 Stanislaus 6,798 2 0 31 0 58 1 7 0 6,897
18 Santa Barbara 9,975 2,177 0 37 0 53 1 13 0 12,256
19 Solano 7,796 3 0 24 1 72 2 16 0 7,914

A-4
Table A-2. Number of telephone numbers and addresses drawn by sample type and sampling stratum (Continued)
Supplemental Samples Surname*
Stratum
Base Sample
Landline Cell
Phone Landline
GeographicKorean Only
Korean and Other
Vietnamese Only
Vietnamese and Other
Korean/ Vietnamese
Area Sample** Total
20 Tulare 8,791 8 0 11 0 24 0 6 0 8,840
21 Santa Cruz 7,982 18 0 19 0 35 2 9 0 8,065
22 Marin 9,484 16 0 32 0 61 0 11 0 9,604
23 San Luis Obispo 7,013 285 0 17 0 34 1 6 0 7,356
24 Placer 7,688 12 0 34 0 66 1 13 0 7,814
25 Merced 6,898 1 0 12 0 22 1 2 0 6,936
26 Butte 5,394 2,648 0 14 0 36 1 2 0 8,095
27 Shasta 5,299 1 0 13 0 15 0 1 0 5,329
28 Yolo 6,394 5 0 28 1 64 0 18 0 6,510
29 El Dorado 7,092 8 0 18 0 17 0 8 0 7,143
30 Imperial 8,398 2 0 3 0 4 1 3 0 8,411
31 Napa 8,661 38 0 10 0 12 0 3 0 8,724
32 Kings 6,593 5 0 10 0 7 0 0 0 6,615
33 Madera 6,885 12 0 5 0 9 0 0 0 6,911
34 Monterey 11,192 1,039 0 45 0 51 1 27 0 12,355
35 Humboldt 5,898 1 0 12 0 11 1 1 0 5,924
36 Nevada 5,994 6 0 11 0 14 0 0 0 6,025
37 Mendocino 6,497 3 0 9 0 10 0 0 0 6,519
38 Sutter 6,591 9 0 5 1 7 0 1 0 6,614
39 Yuba 6,596 3 0 10 0 10 0 1 0 6,620

A-5
Table A-2. Number of telephone numbers and addresses drawn by sample type and sampling stratum (Continued)
Supplemental Samples Surname*
Stratum
Base Sample
Landline Cell
Phone Landline
GeographicKorean Only
Korean and Other
Vietnamese Only
Vietnamese and Other
Korean/ Vietnamese
Area Sample** Total
40 Lake 6,595 3 0 8 0 10 0 1 0 6,617
41 San Benito 8,397 2 0 3 0 2 0 1 0 8,405
42 Colusa, Glenn, Tehama 4,698 1 0 4 0 10 0 1 0 4,714
43
Del Norte, Lassen, Modoc, Plumas, Sierra, Siskiyou, Trinity 6,392 8 0 14 0 24 0 1 0 6,439
44
Alpine, Amador, Calaveras, Inyo, Mariposa, Mono, Tuolumne 6,395 5 0 12 0 30 0 5 0 6,447
* Not drawn by sampling stratum.
** Addresses were drawn in the area sample
Source: UCLA Center for Health Policy Research, 2007 California Health Interview Survey.

A-6
Table A-3. Number of adult completed interviews by sample type and self-reported stratum
Supplemental Samples Surname*
Stratum
Base Sample
LandlineCell
Phone Landline
GeographicKorean Only
Korean and
Other Vietnamese
Only Vietnamese and Other
Korean/ Vietnamese
Area Sample Total
State 47,934 825 857 135 0 220 10 86 981 51,048
1 Los Angeles 11,052 166 2 72 0 35 0 43 981 12,351
2 San Diego 4,023 67 855 3 0 18 1 4 0 4,971
3 Orange 2,723 71 0 24 0 63 2 17 0 2,900
4 Santa Clara 1,676 31 0 8 0 42 5 5 0 1,767
5 San Bernardino 1,686 42 0 3 0 8 0 4 0 1,743
6 Riverside 1,763 40 0 1 0 3 0 1 0 1,808
7 Alameda 1,490 42 0 9 0 17 1 3 0 1,562
8 Sacramento 1,450 45 0 1 0 8 0 2 0 1,506
9 Contra Costa 1,134 18 0 2 0 3 0 0 0 1,157
10 Fresno 804 17 0 1 0 1 0 0 0 823
11 San Francisco 910 23 0 2 0 6 0 2 0 943
12 Ventura 741 29 0 0 0 3 0 2 0 775
13 San Mateo 717 14 0 2 0 1 0 0 0 734
14 Kern 677 19 0 2 0 1 0 1 0 700
15 San Joaquin 600 13 0 0 0 3 0 0 0 616
16 Sonoma 590 17 0 0 0 0 0 0 0 607
17 Stanislaus 564 18 0 0 0 0 0 0 0 582
18 Santa Barbara 592 16 0 0 0 1 0 0 0 609
19 Solano 551 13 0 0 0 1 1 0 0 566
20 Tulare 584 6 0 0 0 0 0 0 0 590
21 Santa Cruz 569 9 0 0 0 0 0 0 0 578
22 Marin 574 5 0 0 0 1 0 0 0 580
23 San Luis Obispo 579 11 0 0 0 0 0 1 0 591
24 Placer 571 12 0 0 0 1 0 0 0 584
25 Merced 595 2 0 0 0 0 0 0 0 597
26 Butte 605 8 0 1 0 0 0 0 0 614

A-7
Table A-3. Number of adult completed interviews by sample type and self-reported stratum (Continued)
Supplemental Samples Surname*
Stratum
Base Sample
LandlineCell
Phone Landline
GeographicKorean Only
Korean and
Other Vietnamese
Only Vietnamese and Other
Korean/ Vietnamese
Area Sample Total
27 Shasta 603 8 0 0 0 0 0 0 0 611
28 Yolo 593 11 0 0 0 2 0 0 0 606
29 El Dorado 589 6 0 0 0 0 0 1 0 596
30 Imperial 574 4 0 0 0 0 0 0 0 578
31 Napa 586 1 0 1 0 1 0 0 0 589
32 Kings 585 1 0 0 0 0 0 0 0 586
33 Madera 559 2 0 0 0 0 0 0 0 561
34 Monterey 613 9 0 3 0 1 0 0 0 626
35 Humboldt 617 5 0 0 0 0 0 0 0 622
36 Nevada 575 3 0 0 0 0 0 0 0 578
37 Mendocino 592 3 0 0 0 0 0 0 0 595
38 Sutter 573 1 0 0 0 0 0 0 0 574
39 Yuba 544 0 0 0 0 0 0 0 0 544
40 Lake 558 2 0 0 0 0 0 0 0 560
41 San Benito 536 4 0 0 0 0 0 0 0 540
42 Colusa, Glenn, Tehama 460 2 0 0 0 0 0 0 0 462
43
Del Norte, Lassen, Modoc, Plumas, Sierra, Siskiyou, Trinity 474 8 0 0 0 0 0 0 0 482
44
Alpine, Amador, Calaveras, Inyo, Mariposa, Mono, Tuolumne 483 1 0 0 0 0 0 0 0 484
* Not drawn by sampling stratum.
Source: UCLA Center for Health Policy Research, 2007 California Health Interview Survey.

A-8
Table A-4. Number of child completed interviews by self-reported stratum
Supplemental Samples Surname*
Stratum
Base Sample
Landline Landline
GeographicKorean Only
Korean and
Other Vietnamese
Only Vietnamese and Other
Korean/ Vietnamese
Area Sample
State 9,637 181 18 0 60 2 15 9,913
1 Los Angeles 2,154 1 10 0 8 0 4 2,177
2 San Diego 829 180 0 0 6 0 1 1,016
3 Orange 586 0 5 0 17 2 2 612
4 Santa Clara 398 0 1 0 8 0 4 411
5 San Bernardino 418 0 0 0 5 0 0 423
6 Riverside 364 0 0 0 0 0 0 364
7 Alameda 293 0 1 0 5 0 2 301
8 Sacramento 244 0 0 0 6 0 0 250
9 Contra Costa 246 0 0 0 0 0 0 246
10 Fresno 175 0 0 0 0 0 0 175
11 San Francisco 121 0 0 0 1 0 0 122
12 Ventura 166 0 1 0 0 0 2 169
13 San Mateo 138 0 0 0 0 0 0 138
14 Kern 148 0 0 0 0 0 0 148
15 San Joaquin 133 0 0 0 1 0 0 134
16 Sonoma 109 0 0 0 0 0 0 109
17 Stanislaus 140 0 0 0 0 0 0 140
18 Santa Barbara 121 0 0 0 0 0 0 121
19 Solano 122 0 0 0 0 0 0 122
20 Tulare 163 0 0 0 0 0 0 163
21 Santa Cruz 112 0 0 0 0 0 0 112
22 Marin 86 0 0 0 0 0 0 86
23 San Luis Obispo 72 0 0 0 0 0 0 72
24 Placer 118 0 0 0 0 0 0 118
25 Merced 143 0 0 0 0 0 0 143
26 Butte 98 0 0 0 0 0 0 98
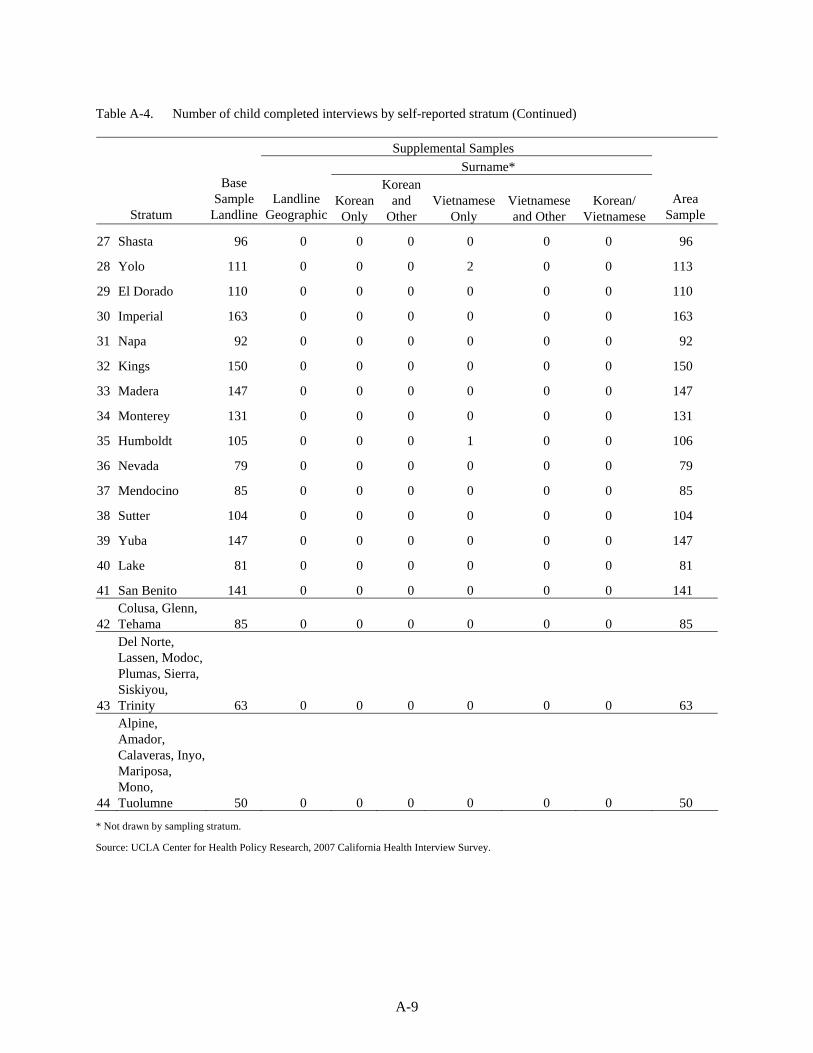
A-9
Table A-4. Number of child completed interviews by self-reported stratum (Continued)
Supplemental Samples Surname*
Stratum
Base Sample
Landline Landline
GeographicKorean Only
Korean and
Other Vietnamese
Only Vietnamese and Other
Korean/ Vietnamese
Area Sample
27 Shasta 96 0 0 0 0 0 0 96
28 Yolo 111 0 0 0 2 0 0 113
29 El Dorado 110 0 0 0 0 0 0 110
30 Imperial 163 0 0 0 0 0 0 163
31 Napa 92 0 0 0 0 0 0 92
32 Kings 150 0 0 0 0 0 0 150
33 Madera 147 0 0 0 0 0 0 147
34 Monterey 131 0 0 0 0 0 0 131
35 Humboldt 105 0 0 0 1 0 0 106
36 Nevada 79 0 0 0 0 0 0 79
37 Mendocino 85 0 0 0 0 0 0 85
38 Sutter 104 0 0 0 0 0 0 104
39 Yuba 147 0 0 0 0 0 0 147
40 Lake 81 0 0 0 0 0 0 81
41 San Benito 141 0 0 0 0 0 0 141
42 Colusa, Glenn, Tehama 85 0 0 0 0 0 0 85
43
Del Norte, Lassen, Modoc, Plumas, Sierra, Siskiyou, Trinity 63 0 0 0 0 0 0 63
44
Alpine, Amador, Calaveras, Inyo, Mariposa, Mono, Tuolumne 50 0 0 0 0 0 0 50
* Not drawn by sampling stratum.
Source: UCLA Center for Health Policy Research, 2007 California Health Interview Survey.

A-10
Table A-5. Number of adolescent completed interviews by self-reported stratum
Supplemental Samples Surname*
Stratum
Base Sample
Landline Landline
GeographicKorean Only
Korean and
Other Vietnamese
Only Vietnamese and Other
Korean/ Vietnamese
Area Sample
State 3,574 48 3 0 9 0 4 3,638
1 Los Angeles 799 0 2 0 1 0 1 803
2 San Diego 269 48 0 0 0 0 0 317
3 Orange 191 0 0 0 4 0 1 196
4 Santa Clara 118 0 0 0 2 0 0 120
5 San Bernardino 157 0 0 0 1 0 0 158
6 Riverside 145 0 0 0 0 0 0 145
7 Alameda 117 0 1 0 0 0 0 118
8 Sacramento 109 0 0 0 1 0 0 110
9 Contra Costa 84 0 0 0 0 0 0 84
10 Fresno 64 0 0 0 0 0 0 64
11 San Francisco 30 0 0 0 0 0 0 30
12 Ventura 66 0 0 0 0 0 2 68
13 San Mateo 56 0 0 0 0 0 0 56
14 Kern 61 0 0 0 0 0 0 61
15 San Joaquin 40 0 0 0 0 0 0 40
16 Sonoma 34 0 0 0 0 0 0 34
17 Stanislaus 61 0 0 0 0 0 0 61
18 Santa Barbara 42 0 0 0 0 0 0 42
19 Solano 44 0 0 0 0 0 0 44
20 Tulare 47 0 0 0 0 0 0 47
21 Santa Cruz 43 0 0 0 0 0 0 43
22 Marin 36 0 0 0 0 0 0 36
23 San Luis Obispo 39 0 0 0 0 0 0 39
24 Placer 46 0 0 0 0 0 0 46
25 Merced 55 0 0 0 0 0 0 55
26 Butte 39 0 0 0 0 0 0 39

A-11
Table A-5. Number of adolescent completed interviews by self-reported stratum (Continued)
Supplemental Samples Surname*
Stratum
Base Sample
Landline Landline
GeographicKorean Only
Korean and
Other Vietnamese
Only Vietnamese and Other
Korean/ Vietnamese
Area Sample
27 Shasta 51 0 0 0 0 0 0 51
28 Yolo 53 0 0 0 0 0 0 53
29 El Dorado 56 0 0 0 0 0 0 56
30 Imperial 58 0 0 0 0 0 0 58
31 Napa 41 0 0 0 0 0 0 41
32 Kings 46 0 0 0 0 0 0 46
33 Madera 49 0 0 0 0 0 0 49
34 Monterey 44 0 0 0 0 0 0 44
35 Humboldt 46 0 0 0 0 0 0 46
36 Nevada 33 0 0 0 0 0 0 33
37 Mendocino 38 0 0 0 0 0 0 38
38 Sutter 53 0 0 0 0 0 0 53
39 Yuba 35 0 0 0 0 0 0 35
40 Lake 38 0 0 0 0 0 0 38
41 San Benito 58 0 0 0 0 0 0 58
42 Colusa, Glenn, Tehama 32 0 0 0 0 0 0 32
43
Del Norte, Lassen, Modoc, Plumas, Sierra, Siskiyou, Trinity 32 0 0 0 0 0 0 32
44
Alpine, Amador, Calaveras, Inyo, Mariposa, Mono, Tuolumne 19 0 0 0 0 0 0 19
* Not drawn by sampling stratum.
Source: UCLA Center for Health Policy Research, 2007 California Health Interview Survey.

A-12
Table A-6. Number of telephone numbers drawn in the cell phone sample by sampling
Region Stratum Number of telephones drawn
All All 42,490
1 - Northern & Sierra Counties 2008 2,645
2 - Greater Bay Area 2005 1,594
2006 1,331
2007 1,713
2013 1,007
2015 1,871
2024 1,174
3 - Sacramento Area 2023 2,552
4 - San Joaquin Valley 2001 1,833
2009 1,518
2014 1,201
5 - Central Coast 2018 2,153
2020 1,032
6 - Los Angeles 2002 387
2003 2,397
2002 1,958
2010 1,532
2012 1,426
2019 2,161
7 - Other Southern California 2011 1,662
2016 1,959
2017 2,361
2021 804
2022 1,824
2025 1,035
2026 1,360