Reoprt on Microinsurance in India _Final
157
1 Microinsurance in India: Outreach & Efficacy Basanta K. Sahu, Researcher Centre for Microfinance Research (CMR) (Main Centre, Lucknow) Bankers Institute of Rural Development (BIRD) Lucknow-226012
-
Upload
farheen-ahmad -
Category
Documents
-
view
35 -
download
3
description
microinsurance report
Transcript of Reoprt on Microinsurance in India _Final
1
Microinsurance in India: Outreach & Efficacy
Basanta K. Sahu,
Researcher
Centre for Microfinance Research (CMR)
(Main Centre, Lucknow)
Bankers Institute of Rural Development (BIRD)
Lucknow-226012
2
ACKNOWLEDGEMENTS
The study benefited from the experiences of members of self-help groups, microcredit
clients, MFIs, insurers (microinsurance), bankers, experts, researchers and others,
particularly from the states of Tamilnadu and Orissa who provided some critical and
interesting insights. Support from MFIs (ASA Gram Vidiyal, Mahasemam and
BISWA) during the field survey was invaluable in covering different groups.
Several rounds of discussions with the Director, BIRD and others at CMR, BIRD,
Lucknow helped me in providing a proper direction to this study. Support from office
staff at BIRD is also duly acknowledged without which the document preparation
would have been difficult.
Thanks are also due to Mr. Arvind Yadav who generously helped with the data
processing work for the study.
Usual disclaimer applies.
3
CONTENTS
Page No
Acknowledgement
Executive Summary
7-10
Chapter - 1
Introduction
Meaning and Definition of Microinsurance
Microinsurance India
Microinsurance & Social Security
Review of Literature
Structure of the study
11-27
Chapter -2 Objectives, Methodology, Data & Study Areas
Partner-Agent Model of Microinsurance
Advantages and Limitation of Agent -Partner Model
Research Questions:
Objectives
Methodology
Selection of Study Area
Data Collection
Sampling & Data Collection Methods
Features of Methodology
Field Visit
Primary Data Analysis
Limitations of the Study
28-39
Chapter -3 Insurance Sector in India and Outreach of
Microinsurance
Performance of Insurance Sector in Post-Reform Period
Obligations of Life insurers
Outreach of Microinsurance in India
Opportunity for Microinsurance in India
40-51
Chapter -4 Introduction to Select MFI & Microinsurance in Study
Areas
Introduction
BISWA, (Sambalpur, Orissa)
Mahasemam, (Madurai, Tamil Nadu)
ASA Gram Vidiyal, (Tiruchirapally
Comparative Observations & Suggestions of MFIs on
Microinsurance
Summary
52-74
4
Chapter -5 Microinsurance, Household Risks and Coping Strategy
in Study Areas
Household Features
House Types
Education & Skills
Household Employment Pattern
Household Income Pattern
Household Borrowing & Saving Pattern
Household Asset Holding Pattern
Household Participation in Microinsurance
Microinsurance and Household‘s Perception and Priority
Demand for Insurance
Summary
75-124
Chapter -6 Conclusions & Policy Suggestions
125-132
References
133-135
Appendix – I: Case Study on Understanding Insurance
Products and its Use
136-137
Appendix - II Some Socio-Economic Features of
Selected States in India
137
Appendix – III Questionnaire for Household
138-150
Appendix – IV Questionnaire for MFI
151-153
Glossary
154-157
5
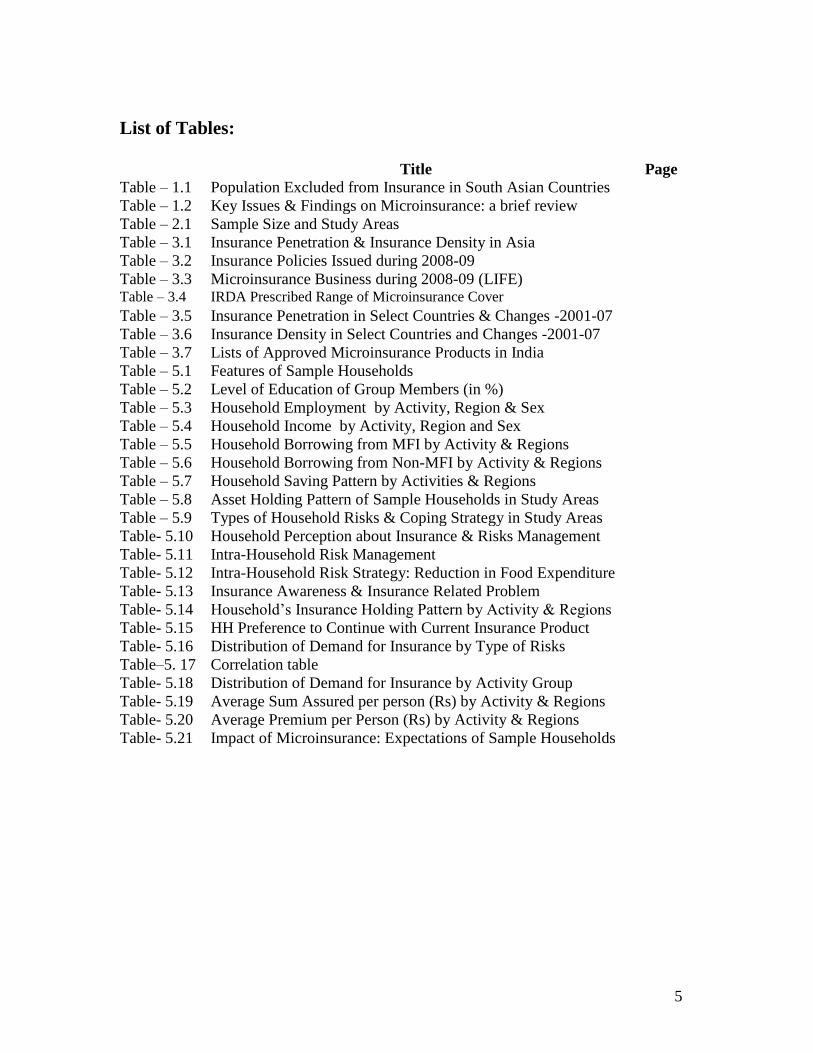
List of Tables:
Title Page
Table – 1.1 Population Excluded from Insurance in South Asian Countries
Table – 1.2 Key Issues & Findings on Microinsurance: a brief review
Table – 2.1 Sample Size and Study Areas
Table – 3.1 Insurance Penetration & Insurance Density in Asia
Table – 3.2 Insurance Policies Issued during 2008-09
Table – 3.3 Microinsurance Business during 2008-09 (LIFE) Table – 3.4 IRDA Prescribed Range of Microinsurance Cover
Table – 3.5 Insurance Penetration in Select Countries & Changes -2001-07
Table – 3.6 Insurance Density in Select Countries and Changes -2001-07
Table – 3.7 Lists of Approved Microinsurance Products in India
Table – 5.1 Features of Sample Households
Table – 5.2 Level of Education of Group Members (in %)
Table – 5.3 Household Employment by Activity, Region & Sex
Table – 5.4 Household Income by Activity, Region and Sex
Table – 5.5 Household Borrowing from MFI by Activity & Regions
Table – 5.6 Household Borrowing from Non-MFI by Activity & Regions
Table – 5.7 Household Saving Pattern by Activities & Regions
Table – 5.8 Asset Holding Pattern of Sample Households in Study Areas
Table – 5.9 Types of Household Risks & Coping Strategy in Study Areas
Table- 5.10 Household Perception about Insurance & Risks Management
Table- 5.11 Intra-Household Risk Management
Table- 5.12 Intra-Household Risk Strategy: Reduction in Food Expenditure
Table- 5.13 Insurance Awareness & Insurance Related Problem
Table- 5.14 Household‘s Insurance Holding Pattern by Activity & Regions
Table- 5.15 HH Preference to Continue with Current Insurance Product
Table- 5.16 Distribution of Demand for Insurance by Type of Risks
Table–5. 17 Correlation table
Table- 5.18 Distribution of Demand for Insurance by Activity Group
Table- 5.19 Average Sum Assured per person (Rs) by Activity & Regions
Table- 5.20 Average Premium per Person (Rs) by Activity & Regions
Table- 5.21 Impact of Microinsurance: Expectations of Sample Households
6
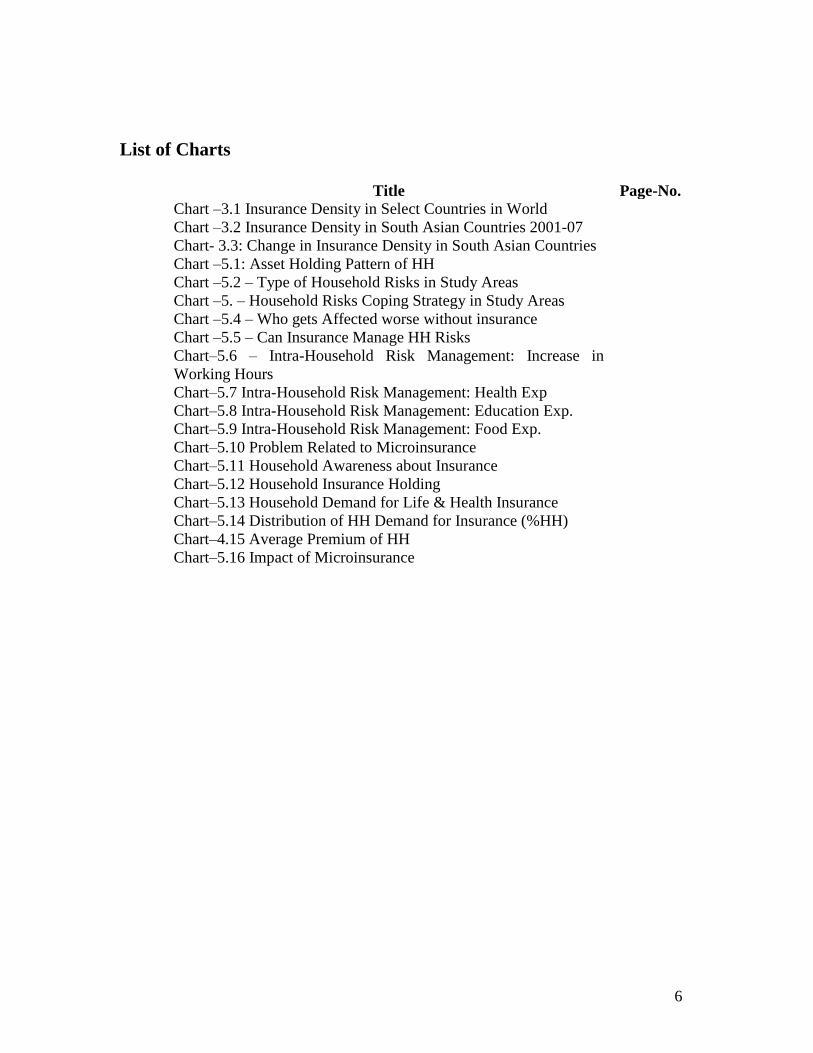
List of Charts
Title Page-No.
Chart –3.1 Insurance Density in Select Countries in World
Chart –3.2 Insurance Density in South Asian Countries 2001-07
Chart- 3.3: Change in Insurance Density in South Asian Countries
Chart –5.1: Asset Holding Pattern of HH
Chart –5.2 – Type of Household Risks in Study Areas
Chart –5. – Household Risks Coping Strategy in Study Areas
Chart –5.4 – Who gets Affected worse without insurance
Chart –5.5 – Can Insurance Manage HH Risks
Chart–5.6 – Intra-Household Risk Management: Increase in
Working Hours
Chart–5.7 Intra-Household Risk Management: Health Exp
Chart–5.8 Intra-Household Risk Management: Education Exp.
Chart–5.9 Intra-Household Risk Management: Food Exp.
Chart–5.10 Problem Related to Microinsurance
Chart–5.11 Household Awareness about Insurance
Chart–5.12 Household Insurance Holding
Chart–5.13 Household Demand for Life & Health Insurance
Chart–5.14 Distribution of HH Demand for Insurance (%HH)
Chart–4.15 Average Premium of HH
Chart–5.16 Impact of Microinsurance
7
Executive Summary
1. Coping with risks such as health problems, crop failure, loss of livestock, death of a
family member, loss of asset, income and employment is much harder on the part of
poor and low income groups than others. Many poor households involve in activities of
smaller scale but carrying higher degree of risk and uncertainty and hence prone to
financial and income risks.
2. Microinsurance is believed to work as a powerful risk management tool for low income
and vulnerable groups by preventing them from falling into the poverty trap. But not
much is known about outreach and efficacy of microinsurance across regions and
groups.
3. In India, though government plays a proactive role in providing insurance cover to the
poor through subsidized insurance schemes and other programmes. The size and
potential of microinsurance market is enormous due a sizeable portion of poor and low
income population who live without any formal insurance.
4. A recent UNDP study (2007) found that about 90% of the Indian population (950
million people) is not covered by insurance and it constituted an untapped market of
about US$2 billion. India has lower insurance penetration of 4.7 percentage (ratio of
premium to GDP) and insurance density of USD 46.6 (ratio of premium to population)
compared to world average of 7.5 percent and USD 607.7 respectively. However,
within South Asian region, India has experienced a positive and faster change in
insurance density in recent years.
5. More than 50 microinsurance schemes are in operation in India and most of them have
been launched during last 4-5 years. Around 43 schemes cover 5.2 million people and
about 66% insurance schemes are linked with micro finance services provided by
specific institutions (ILO, 2004a). Life and health insurance risk related products are
generally demanded by people. Most of these insurance schemes (74%) operate in 4
southern states: Andhra Pradesh (27%), Tamil Nadu (23%), Karnataka (17%) and
Kerala (8%). The microinsurance sector in India is characterized by uneven
development and limited to a few products.
6. The present study has attempted to analyze microinsurance in India under Partner -
Agent Model where, insurers utilize MFI as intermediary or delivery channel to provide
sales and basic services to the clients with lower administrative cost.

8
7. The present study is based on primary field survey covering 75 women micro credit
clients randomly selected from 23 centers in 11 development blocks in three districts of
two states (Trichy and Madurai in Tamil Nadu and Sambalpur in Orissa). The analysis
of microinsurance has been made mainly on the basis of information collected from
select MFIs and household data with focus on enterprise/occupation, groups and
regions.
8. About a quarter of the sample households reported had faced some adverse (risk)
during last two years (prior to the date of field survey) that severely affected their
financial condition and economic situation. Common Risks observed among sample
household ranged from major health related expenditure, health problems of females,
accidents, crop loss, loss of livestock, market related problems, and other problems
such as divorce.
9. Common risk coping strategies adopted by households were reduction in household
expenditure ( on food, education and health), borrowing from informal sources, dis-
saving (in kind/cash), migrating out, distress sale of produce and other assets,
increasing average working hours (observed mainly among females), postponement of
social expenditures etc. However, these coping strategies were no longer found
adequate and effective to manage sharp fluctuations in household income and
consumption, especially when faced with multiple risk events.
10. Over and above the microinsurance product, (mostly life insurance of microcredit
clients comes with microcredit loan) the priority accorded to various risk coping
strategy among households varied across occupation groups and regions. About 42
percent households resorted to borrowing from informal sources, 18 percent
households used dis-saving, 16 percent households undertook supplementary non-farm
activity and about 14 percent undertook distress sale of assets as coping mechanism. To
some degree, this underscores the importance of linkage between savings, formal credit
and insurance in risk avoidance behavior of households.
11. Though about 88 percent of sample households in the study had some idea about life
insurance their understanding was inadequate, unclear and very different. However,
lack of understanding, information and options for insurance products was found one of
the key constraints for wider outreach of insurance. About 44 percent of households
had heard about livestock and asset insurance but they did not possess any further
information. Surprisingly, only 30 percent households knew about health insurance and
only a few of them had tried it at least once. Preference for health insurance was more.
9
It reflects the gap between supply of microinsurance and potential demand for the same
among the poor households.
12. Similarly, households‘ complaints against existing insurance products were found to be
very high and it varied with different aspects of insurance products and household
characteristics. About 85 percent of households were not happy with the design of
insurance product offered to them. A sizeable proportion of households reported having
problems related to insurance premium (65 percent) and claim settlement (60 percent).
Non-coverage of spouse and other family members in life and health insurance scheme
was one of the main cause of dissatisfaction among households.
13. High male mortality rate (two to four times higher than female) was believed to be one
of the key factors for not providing coverage to spouse of the female group members,
especially when premium under microinsurance has been kept low.
14. However, findings of our analysis do not support the argument that a household‘s risk
assessment and experience of shocks has a direct correlation on household decision to
participate in insurance market. Households exposed more to risks are less likely to use
available formal insurance products than others. Some lower income groups feel that
use of insurance product as an additional risk as they have to pay premium regularly.
Their poor understanding about the functioning of insurance services and lack of trust
on the staff of insurers drives them away from insurance.
15. Household borrowing, saving, family size, level of education, asset holding etc. did not
reflect much association with household participation in insurance or continuance.
Many low income households reported using borrowing from informal sources in the
event of crisis such as illness, crop loss, livestock loss and death of a earning member
rather than participating in any formal insurance scheme.
16. However, household participation in insurance, through microcredit programme by
MFIs was found to be mostly involuntary in nature. Many microcredit clients believed
that it is difficult to pay premium out of their small loan amount from MFIs. Under the
given arrangement and conditions of household borrowing from MFIs, insurance
uptake did not appear to be very effective.
17. It appears that there is a vicious circle of uptake and renewal of insurance products in
operation. The situation of inability to pay premium led to a position of no insurance
cover (no risk cover – more vulnerable to risks of income and expenditure – high cost
of coping with risks - borrowing and liquidation of asset – low capacity and
productivity – low income - inability to pay premium/- no insurance).
10
18. In many cases, what poor households are willing to pay and able to pay for the
insurance was led to inability to cover risks adequately. Under this situation, dire credit
need of poor households often surpasses their need for insurance.
19. Demand for insurance found to be dependent on household income flows, nature of
enterprise or activities undertaken.
20. On supply side, constraints of the insurers and intermediaries (MFIs) help to explain
why there has been so little development of the microinsurance market. While insurers
look to experiment and explore the large client base of MFIs and to fulfill the social
and rural obligations imposed by the regulator, the intermediaries (MFIs) are keen to
protect their credit. It also partly explains the low voluntary demand for insurance and
wide gaps between the client‘s needs and insurance products on offer.
21. MFIs as distribution channel of microinsurance can prove to be useful in reducing
administrative costs of penetrating rural markets, but underutilization of this
distribution channels is visible. Though MFIs enjoy flexibility to choose insurance
partner through bargaining process, some of them change insurance partners frequently
which further affects the insurance activity.
22. The microcredit-linked insurance business is one of the key factors for growth of the
microfinance sector in India. For the insurers, it is beneficial to gain access to the huge
rural client base of MFIs and there is enormous market potential for customized
insurance products and dire need for innovation. In this regard, a comprehensive
health-cum- livestock insurance product, particularly in lower segment may offer better
opportunity.
23. Creation of complete awareness, flexibility for premium payment options, efficient
claims processing system, trained and trustworthy insurance agents or staff and
effective client redressal system are some core areas for policy intervention. Role of
MFIs along with involvement of local institutions (Gram Panchayat, Gram Sabha and
other community based institutions) could be useful in addressing insurance related
matters such as, claim settlement, premium payment, client identification in
consultation with the insurers. The documentation and submission of proof of claim
need to be standardized. Insurers should involve MFIs and representatives of clients in
product design and development. MFIs may obtain clients feed-back and use it in
negotiations with the insurers. Better incentives for intermediaries and training for field
staff are also suggested.
11
Chapter - 1
Introduction
Risk is pervasive in the lives of poor and low-income groups. Economic, social, natural,
and other factors distort household‘s risk management capability and their struggle to
come out of poverty. Faced with multiplicity of risks, poor and weaker sections are
often forced to deplete their financial, physical, social and human assets just to cope
with the contingencies. Some common risks they confront with are unemployment,
illness, accident, death of main earning members of the family, crop loss, loss of
livestock, fire, theft, drought, flood, and loss in petty trading activity due to market
factors. Some groups are more vulnerable to many of these risks than the others and
unable to cope with risk events. Hence, uninsured risk leaves many poor households
more vulnerable to the losses from negative shocks. However, impact of such risks
lingers for a longer period depending on the nature and severity of risks and strategy
adopted by the household for coping. On the other hand, household exposure to risks
not only results in substantial financial losses but also the suffering accentuates the fear
and uncertainty relating to the risk. Because of this perpetual apprehension, many poor
households are less likely to take advantage of income-generating opportunities which
could be a way out of poverty.
Risk pooling and informal insurance are not entirely new to many low income
households. Informal risk-sharing practices have been around for generations. Options
for protecting against risks includes diversifying household resources and income,
building assets, stocking food, investing in livestock, renewing & strengthening social
networks, saving and borrowing from informal sources, participating in public social
security programme, enrolling in insurance schemes etc. The risk management
approaches differ under socio-economic and agro-climatic conditions and also
depending upon its exposure to risk. Unfortunately, risk coping mechanisms are limited
in assuring benefits and typically cover only a small portion of the total loss of income
and income generating opportunity. Household‘s informal means to manage risks may
12
not provide adequate and long term protection, especially to poor and low income
groups who are prone to loss of entitlements incurred due to variety of risks.
Households follow variety of coping strategies to manage different kind and nature of
risks that affect their income and consumption smoothing. But many informal risk
coping strategies come at a cost, as assets are depleted when trying to cope with risk
such as distress sale during crises, reduction of household expenditure on food,
withdrawing children from school, postponing or avoiding expenditure on health, social
functions etc. It has both short term and long-term adverse impacts on households.
Though household diversification often viewed as positive response against risk events
many such coping strategies followed by the poor do compensate the entire loss. If
household risks are not carefully designed and strategically handled it may result in
bigger welfare losses. The situation would be worse when risks to life and livelihoods
recur more frequently and there is limited risk managing options. So provision of
formal insurance cover to these vulnerable groups could be useful to protect them
against risks and supplement their risk managing capacity. As formal insurance can
directly impact on households‘ ex-post risk coping mechanisms, it is believed that
households participation in insurance would help to maintain income and consumption
soothing and avoid asset loss.
But access to and provision of formal insurance is limited for the poor and low income
groups. State-provided social security measures are inadequate to cover all kinds of
household risks. Under this condition many poor households may tend to behave as
resilient to risk events or their risk coping behaviour may result in huge welfare loss
due to wrongly managed or unable to manage risks. It may also induce many poor
households to focus on low risk and low return activities or rely on a range of informal
ex-post options, relief measures, public social security measures etc. It provides huge
scope for policy interventions as well as business opportunity.
Therefore, it is important from policy point of view to understand different household
risks and risk-management strategies in one hand and the need and demand for
13
insurance products, particularly for low income groups. On the other hand, interestingly
microinsurance has drawn attention of the policy makers, insurers, business leaders and
others in recent years. Microinsurance has been seen as one of the major risk managing
tools for the poor and low income groups and a potential market for business.
Experiences across countries in the world show that microinsurance has potential to
reduce household risk impacts and to provide business opportunity. By offering a
payout after the loss, it may avoid more costly ways of risk coping by the poor
household and leaves their future income earning opportunities intact. The sense of
security linked to being insured through microinsurance augment household welfare
with positive impacts.
Poverty and vulnerability among low income groups mainly stems from their poor risk
management capacity and exclusion from the financial markets. Hence it is important to
understand their need as well as demand for financial products including insurance.
Many poor and low income households may involve in activities or enterprises of
smaller scale but higher risk and uncertainty. It makes them disadvantageous because
they are more prone to economic and financial collapse. Under this situation it is
interesting to analyze how microinsurance can play a meaningful role in household risk
managing efforts, in rural credit and insurance market and providing business
opportunity. In this regard we like to focus on current scenario of outreach and efficacy
of microinsurance in India, major factors that encourage and prevent growth of
microinsurance and other related issues for achieving broader objectives such as
financial inclusion and inclusive development.
Meaning and Definition of Microinsurance:
Microinsurance, commonly called as insurance for the poor, has recently drawn the
attention of practitioners in developing countries. In common parlance, microinsurance
is the provision of insurance services to low-income households, which serves as an
important tool to reduce risks for the already vulnerable population. There is no
unanimously accepted definition of microinsurance despite its profound use and
understanding across stakeholders and others. A simple definition of microinsurance is
14
offered by Churchill (2006) is that it is an insurance that (i) operates by risk-pooling (ii)
financed through regular premiums and (iii) tailored to the poor who would otherwise
not be able to take out insurance. Microinsurance is defined as ―...insurance that is
accessed by the low-income population, provided by a variety of different entities, but
run in accordance with generally accepted insurance practices ... Importantly this means
that the risk insured under a microinsurance policy is managed based on insurance
principles and funded by premiums‖ (International Association of Insurance
Supervisors, 2007).
Microinsurance is different from usual form of insurance. A macro definition of
microinsurance states that it is the provision of financial protection contingent on the
occurrence of predefined risk in exchange for an ex-ante premium payment affordable
to the clients. In terms of micro definition, microinsurance is more complicated as there
are different approaches. ―Micro‖ as reference to low premium and low benefits may be
affordable but it may not be effective enough to manage risks of different types of
different categories of clients. Microinsurance is often believed to be an important
component of a broader set of financial services under microfinance – making available
financial services for poor households and enterprises to sustain their livelihoods.
Basically there are two broad categories of microinsurance often commonly understood
– one focused on extending social protection to the poor in the absence of appropriate
government schemes and the other offering a vital financial service to low-income
households by developing an appropriate business model that enables the poor to be a
profitable (or sustainable) market segment for commercial or cooperative insurers.
Microinsurance is also taken as group insurance that can cover thousands of customers
under one contract. It requires an intermediary between the customer and the insurance
company. This intermediary role has been played mainly by non-governmental
organization (NGO) and microfinance institutions (MFI). The role of intermediaries in
growth of microinsurance in India is well documented.
15
Currently around 135 million, or 5%, of low income people in developing countries are
using microinsurance products. But the size of insurance market for low income groups
is large and it constitutes about 1.5 to 3 billion potential clients (Microinsurance Centre,
2007). According to a research carried out by Swiss Re in 2007, most growth in the
insurance industry over the past decade has come from the wealthy and middle income
markets in emerging economies. Premiums grew by 3.3% globally and by 11.8% in the
emerging markets in that year. Though partly this was due to a growing number of
clients moving into the wealthy and middle income brackets in these countries, it is also
attributable to insurance expanding into new markets. The number of people covered
under microinsurance is estimated about 78 millions in 77 countries out of 100 less
developed countries (Roth et al 2007).
Microinsurance in India
In India development of microinsurance sector and related policy discussions has
started few years back. Within very short period, the sector has drawn attention of
policy makers due to its importance both at household level and the economy as a
whole. Two major and recent studies by the ILO (2004a and 2004b) depict broad
picture of microinsurance sector in India. As regard to the microinsurance products the
study highlights that out of 80 listed insurance products 45 cover only a single risk and
only two or three products cover multiple risks. Majority of the insurance products
cover life (52%) or accident-related risks and addressed to individuals. Out of the 12
currently available health insurance products seven products have been designed and
restricted to groups and five products have chosen to coverage to some critical illness at
individual level but not the reimbursement of hospitalization expenses. Most of the
products require a single payment of premium (i.e., a one-time payment) upon
subscription. Private insurers had three times more products than their public
counterparts.
Some important observations about the demand for microinsurance in India are made in
a recent study by ILO (2004b). The study provides details of micro-insurance schemes
operational in India. Out of 51 schemes that are operational in India most schemes
16
have started operations during the last few years. As regards to beneficiaries, about 43
schemes, for which the information is available, cover 5.2 million people. About 66%
of the microinsurance schemes are linked with micro finance services provided by
specialized institutions (17 schemes) or non-specialized organizations (17 schemes).
Twenty two percent of the schemes are implemented by community based
organizations, and 12% by health care providers. Life and health are the two most
popular risks for which insurance is demanded. Twenty-five out of 37 schemes received
some external funds to initiate their schemes. Twenty out of 32 schemes received
external technical assistance in the form of advisory services, technical services,
training or even referral services for their schemes. As regard, to the regional
distribution of microinsurance outreach about 74 % of total schemes operate in 4
southern states constituting Andhra Pradesh (27%), Tamil Nadu (23%), Karnataka
(17%) and Kerala (8%). Two western states Maharashtra (12%) and Gujarat (6%)
account for 18% of the schemes. About 56% of schemes deal with one single risk. This
shows low outreach and unequal distribution of microinsurance in the country. The
study also reflect the linkage between micro-insurance and micro-finance.
Development of microinsurance is often related to microcredit, particularly in
developing countries like India. Though microcredit has dominated in microfinance
market the entry of microinsurance is only in recent past. In India microinsurance is a
relatively new financial service and its outreach is rather limited and unevenly
distributed across states. The over all performance of microinsurance in India is not
very encouraging. According to a recent study by UNDP (2007), the outreach of
microinsurance is around 5 million people covering only 2 percent of the poor in the
country. It shows there is huge potential for microinsurance market in the country. A
conservative estimation of size of microinsurance market (both life and non life) in
India ranges between INR 62,304.70 to 84,267.55 million (US$ 1,384.55 to 1,872.61
million). In case of life insurance, the market potential is estimated to be between
INR15,393 to 20,141 million (US$ 342.07 to 447.58 million) and in case of non-life
insurance, it is between INR46,911.70 to 64,126.55 million (US$1,042.48 to 1,425.03
million). The non-life insurance estimation is limited to four types of coverage – milch
17
animals, livestock, health and crop insurance. The population used for this estimation is
40-50 percent of those earning less than US$1 a day and 50-70 percent of those earning
between US$1 – 2 a day. This is expected to increase as demand grows and a wider
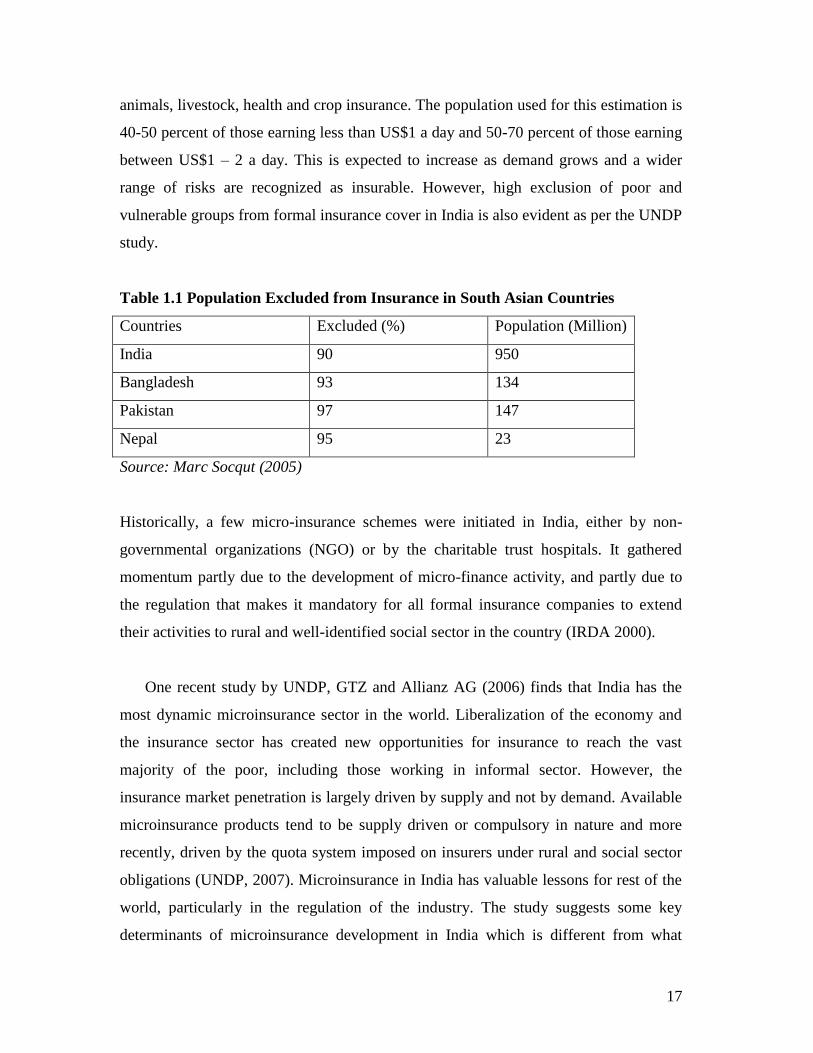
range of risks are recognized as insurable. However, high exclusion of poor and
vulnerable groups from formal insurance cover in India is also evident as per the UNDP
study.
Table 1.1 Population Excluded from Insurance in South Asian Countries
Countries Excluded (%) Population (Million)
India 90 950
Bangladesh 93 134
Pakistan 97 147
Nepal 95 23
Source: Marc Socqut (2005)
Historically, a few micro-insurance schemes were initiated in India, either by non-
governmental organizations (NGO) or by the charitable trust hospitals. It gathered
momentum partly due to the development of micro-finance activity, and partly due to
the regulation that makes it mandatory for all formal insurance companies to extend
their activities to rural and well-identified social sector in the country (IRDA 2000).
One recent study by UNDP, GTZ and Allianz AG (2006) finds that India has the
most dynamic microinsurance sector in the world. Liberalization of the economy and
the insurance sector has created new opportunities for insurance to reach the vast
majority of the poor, including those working in informal sector. However, the
insurance market penetration is largely driven by supply and not by demand. Available
microinsurance products tend to be supply driven or compulsory in nature and more
recently, driven by the quota system imposed on insurers under rural and social sector
obligations (UNDP, 2007). Microinsurance in India has valuable lessons for rest of the
world, particularly in the regulation of the industry. The study suggests some key
determinants of microinsurance development in India which is different from what
18
commonly assumed that a microinsurance policy is simply a low-premium insurance
policy. Some of the key factors that hinder growth of microinsurance are remote
location of clients, illiteracy and unfamiliar with the insurance products, illness due to
poor food consumption pattern, work conditions and lack of regular medical check-ups
and lack of access to formal financial services. Higher transaction costs on the part of
policyholders in terms of premium deposit, claim settlement and other matters is often
considered as major factor preventing growth of microinsurance in the country.
In a pioneering study by UNDP (2007), pro-poor insurance sector growth in India
was discussed with some key issues and constraints, pertinent to the growth of the
microinsurance sector.
(1) There are specific reasons for low demand for insurance in spite of intense
need. Suppliers have their own concerns, which help to explain why there has been
slow development in microinsurance market. The rural financial markets characterized
by limited and inappropriate services, inadequate information and capacity gaps also
hinder growth of rural insurance market.
(2) There are challenges in insurance product design, which result in a mismatch
between client‘s needs and standard products on offer. Inadequate effort in product
development could be due to different perspective of stakeholders.
(3) Absence of adequate and suitable insurance data is a major concern. In the
absence of a suitable insurance database calculation of premium, costs, benefits,
willingness to pay, based on macro aggregates may not give actual insights. Building
and sharing claims histories can help in aligning pricing decisions with actuarial
calculations, thereby reducing price.
(4) Difficulty in distribution is one of the most cited reasons for absence of rural
insurance. The high costs of penetrating rural markets, combined with under utilization
of available distribution channels, hinder the growth of rural insurance services.
(5) Cumbersome and inappropriate procedures inhibit the development of this
sector.
(6) Contrasting perspectives of the insured and the insurers, lead to low customiza-
tion of products and low demand for what is available.
19
Microinsurance & Social Security
Social protection measure is often related with microinsurance for the poor and low
income groups. Microinsurance can play a crucial role as a comprehensive tool to
reduce poverty, inequality and vulnerability, particularly where public social protection
measures are inadequate and unevenly distributed. Unfortunately, more than half of the
world‘s total poor do not benefit from any form of social protection measures. Since
microinsurance is designed for the protection of low-income people to cope with
common risks, it can also strive to cover the excluded such as poor, women and
workers in informal sector. In many developing countries like India, the proportion of
informal workforce in total workforce is substantial and there is increasing tendency
towards casual nature of labour. Under this situation, it becomes daunting task on the
part of the government to provide social security to all. About 90 percent of the
working population of India is employed in the informal sector and about thirty percent
of the unorganized workers are very poor who needs public social security supports.
Although current social protection measures consist of health, disability, death, old age
and economic risks are prioritized, its funding and implementation remain challenging.
In India social protection being a concurrent subject, it has its own political economy.
So in the absence of a dependable social protection, the importance of microinsurance
becomes interminable.
With inherent limitations of the existing social protection measures in the country, there
is also a high demand to combat the adverse impacts of natural disasters such as
drought, floods, cyclone etc. Unfortunately, the ex-post coping mechanisms primarily
supported by the Government are not sufficient and do not cover all groups in all
sectors. Though India has exhibited with series of pro-poor anti-poverty measures
oriented towards reduction of risks and vulnerability, microinsurance can contribute
indirectly as it often exclude covariant risks from their portfolio.
There are a wide range of developmental programmes being supported by the
Government like Swarna Jayanti Gram Swarojgar Yojana (SGSY), National Rural
20
Employment Guarantee Scheme (NREGS), Rastriya Swasthya Bima Yojana (RSBY),
Rastriya Health Mission (RHM), Aam Aadmi Bima Yojana (AABY), Indira Awas
Yojana (IAY), Public Distribution (PDS), old age allowances, drought relief etc. which
have facilitated the improvement of income levels of poor households. The public-
package of ―Doubling Flow of Agricultural Credit‖ has also enabled greater
institutional credit flow for agriculture and allied activities. However, all these policy
interventions, though ambitious in stated intent, only incidentally address household
risks. The most vulnerable rural population, particularly women, older people and rural
people are mostly excluded from the insurance market. It implies the need of this
segment of population for protection of their lives / income-generating assets against
various perils. At present, Personal Accident Insurance Scheme (PAIS) which is being
provided as a bundled offering along with the Kisan Credit Card (KCC) Scheme and
the Rashtriya Krishi Bima Yojana (RKBY) for insuring crops, are, probably, the only
borrowed-linked risk mitigation mechanisms available to rural households. Similarly,
the progress in enrolment of the poor in the Rashtriya Swasthya Bima Yojana1 (RSBY)
in its third year of operation does not seem to meet the target to cover all poor by 2012 (
Narayana, 2010).
Under this situation, prospect of microinsurance is expected to be much wider and
challenging, especially with huge network of financial infrastructure in the country. For
instance, many commercial banks have partnered foreign insurance companies for
providing life insurance policies. Thus, banking outlets (which number close to 70,000)
and more than 1 lakh cooperative societies could provide the needed outreach to purvey
micro-insurance facilities without much addition to transaction costs. Unfortunately, the
desired outreach and efficacy of microinsurance sector in India has not been achieved.
Review of Literature:
In this section, we have summarized findings and major issues of some important
studies and reports on microinsurance in general and in India in particular with focus on
1 Prior to launch of RSBY in 2003, Universal Health Insurance Scheme was introduced in 2003 to
provide a health benefit package to poor with sum assured of Rs 30000/-
21
household risks and risk managing strategy, outreach of microinsurance products,
major policy regulation and constraints. It helps us to develop a framework for analysis
of the present study which is presented in subsequent chapters. Available literature
evaluating the impact of insurance in low-income countries is limited. There is also
unbalance between different types of insurance products. Overall, the emphasis is
concentrated on different health insurance schemes, and their impact on health care-
utilization, out-of-pockets expenditure or social inclusion. Very few studies evaluate
the impact of insurance on household income, nutrition, or other dimensions of welfare
than those directly related to the insurance. Study on other insurance products are also
limited and hindered by the lack of systematic baseline data on individual beneficiaries
and groups.
Cohen and Sebstad (2006) highlighted the need to carefully study of clients‘ insurance
needs before introducing a new product, where market research can include studying (i)
clients‘ needs, (ii) specific products, or (iii) the size of the potential market. Analyzing
insurance demand from Uganda, Malawi, Philippines, Vietnam, Indonesia, Lao P.D.R.,
Georgia, Ukraine and Bolivia they found that the most prevalent risks relate to health
and loss of wage earners. In a recent study by Ito and Kono (2010) on health
microinsurance in Karnataka, India found that take-up rates of microinsurance have
been low despite its perceived need and the enthusiasm of microfinance practitioners.
They found some evidence that people behave in a risk-loving way when facing the risk
of losses.
However, despite these patterns, households‘ priorities regarding demand for insuring
risks are nevertheless context specific. More research is essential to understand and
identify the means for increasing insurance take-up rates and decreasing dropout rates.
A general understanding about attributes of microinsurance products from a client
perspective is awareness, easy to understand, simple, affordable, valuable and trust.
These factors are determinants of uptake and therefore, determine the impact of
microinsurance at household level.

22
In case of weather insurance, some recently studies have attempted to asses its impacts
on household incomes and also on risk-taking behaviour (Gine et al., 2007a; 2007b;
Gine and Yang, 2007). The findings do not show substantial impacts; for example,
Gine and Yang (2007) undertake a study in Malawi and shows that those with
insurance did not increase the uptake of risky technologies, one of the expected
outcomes. In terms of the impact of new schemes on existing mechanisms, Jowett et al.
(2003) found that social cohesion and informal financial networks are negatively
associated with insurance uptake, suggesting that the former crowd out public voluntary
health insurance. Dercon and Krishnan (2003) present evidence that suggests a
crowding out effect of informal risk-sharing arrangements by food aid. On the other
hand, Morduch (2006) argues towards a possible negative price effect of insurance
during times of shocks when insured individuals drive up the price of goods, for
example food products.
On the other hand, more educated households have been found to be more likely to take
up insurance (Chankova et al., 2008; Gine et al., 2007b). It emphasizes on effort to
improve communication and financial education on risk-pooling, insurance and rights
of policyholders tailored to low-educated and illiterate individuals and simplify
policies. Similarly, households with a sick household head are less likely to purchase
insurance. This might capture the fact that households with a sick household head have less
income flow and have difficulty in financing the insurance premium (Ito and Kono, 2010)
Clients‘ understanding of insurance products and ability and willingness to pay are key
to take up of insurance.
As regard, to constraints of microinsurance products it could be region and group
specific. Some common constraints already documented in literature are low take-up
rates, high claim rates, low renewal rates, poor delivery channels, high transaction costs
and poor insurance literacy. Another serious constraint to the uptake of insurance is
trust on each other. The contrast of microinsurance with microcredit helps to see the
difference between these two activities. Lenders have to trust borrowers; while insurers
have to be trusted by clients. Radermacher et al. (2006) underline the importance of
23
trust along these two dimensions: first, that the insurer is willing to make payments to
clients; and second, that the insurer is able to deliver the payments. The demand, uptake
and renewal of insurance clients also depend on the market conditions and constraints
to insurance provision.
Willingness to pay for insurance is crucial in promoting enrolment by low-income
households (Chankova, 2008). Paying premiums should be in line with households‘
cash flows (Cohen and Sebstad, 2006). Dror et al. (2007) study households‘ willingness
to pay, analyzing data on households in India find a higher level of nominal willingness
to pay and household income and nominal willingness to pay are positively correlated,
while household income and willingness to pay as a percentage of household income is
negatively correlated. Household size is the most important determinant of willingness
to pay levels.
As regard, to supply of microinsurance products some common findings are emerged
from across studies. While different perspective of different stakeholders constitutes as
a major supply constraint, availability of suitable distributive channel, pricing and
regulation determine the overall supply of microinsurance products. Interestingly, most
of the low segment insurance markets are supply driven. From the insurers‘
perspective, microinsurance opens a huge market, especially for the ones facing market
saturation. Insurers aim to develop new business models that create mechanisms which
cater to this low-income market who will be future high-income clients. Unfortunately,
standardized insurance product may not respond to client needs.
As regard to the designing of microinsurance products, Brown and Churchill (2000a)
argues for some criteria,
(i) a large number of similar units exposed to risk,
(ii) limited policyholder control over the insured event,
(iii) the existence of insurable interest,
(iv) losses can be identified and measured,
(v) losses should not be catastrophic,
24
(vi) chance of loss is calculable and
(vii) Premiums are economically affordable.
Potential demand for insurance may get influenced by type and nature of risks and
vulnerability. Leftley and Mapfumo (2006) highlight, the importance of demand side
factors for developing a successful product depending on the operational and regulatory
environment as well as risk carrier options. The risk coverage-premium tradeoff by
providing a menu of choices and letting clients chose their desired coverage and
corresponding premium has been developed (Dror, 2007). In Ethiopia, it was found that
the risk inherent in a modern high-return input (fertiliser) caused lower than optimal
uptake (Dercon and Christiaensen, 2007). Unable to insure agricultural risk, aversion to
risk led to choices that suppressed expected returns. The UNDP (2007) study on India,
found that health insurance was perhaps in most demanded products but short in
supply, because of operating such insurance schemes.
Managing moral hazard is another key constraint in microinsurance sector. Households
with a higher ratio of sick members are more likely to purchase insurance (Ito and
Kono 2010), showing some evidence of presence of moral hazard. To manage moral
hazard and adverse selection problems composite insurance products is recommended
by Cohen and McGuinness (McCord 2008). But Roth and Chamberlain (2006), warn
that in practice the potential benefit of bundled microinsurance in terms of lower
premium is hardly passed on to its clients.
As regard, to delivery channel of microinsurance using intermediaries such as NGOs
and MFIs is common, particularly in rural areas. However, within institutional models
and delivery channels there are four major delivery models such as (1) partner-agent
model, (2) community based model, (3) full-service model, and (4) public insurance
provider model. Partner-agent model found referred in many cases (McCord 2006, Roth
and Athreye, 2005). Number of studies evaluated different microinsurance insurance
schemes and focus on several aspects beyond just the purchase of insurance. Some of
the general findings of these studies are complied and presented below.
25
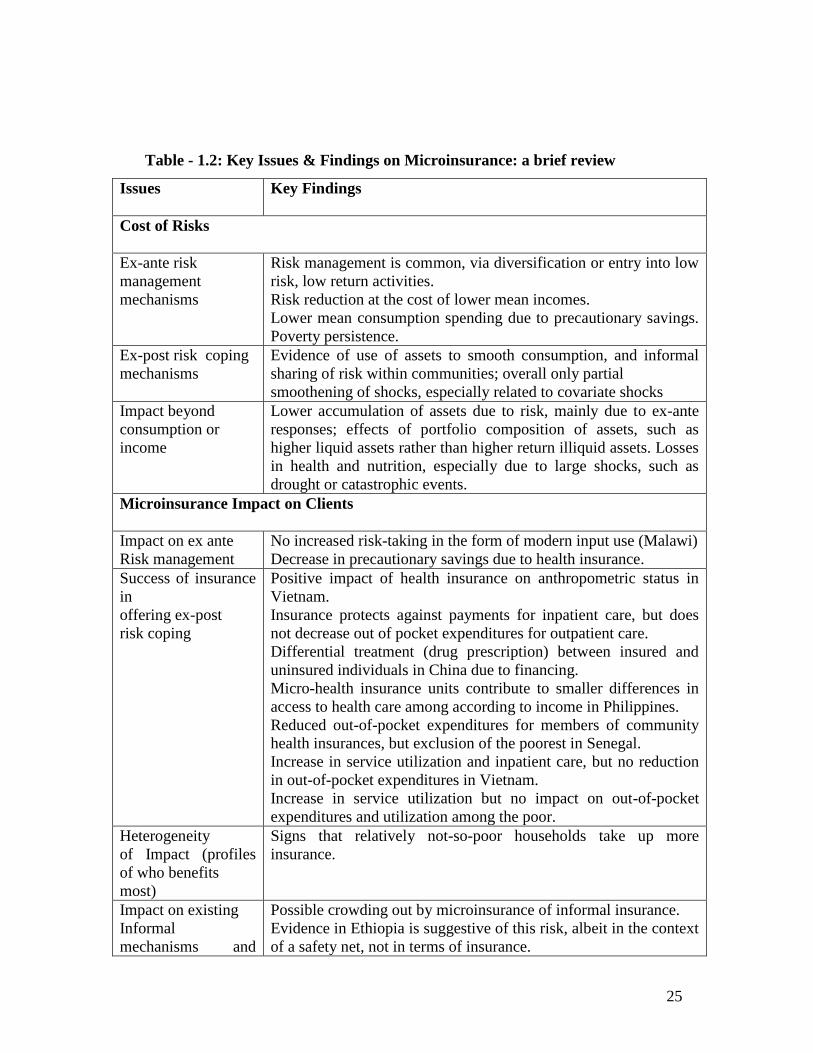
Table - 1.2: Key Issues & Findings on Microinsurance: a brief review
Issues Key Findings
Cost of Risks
Ex-ante risk
management
mechanisms
Risk management is common, via diversification or entry into low
risk, low return activities.
Risk reduction at the cost of lower mean incomes.
Lower mean consumption spending due to precautionary savings.
Poverty persistence.
Ex-post risk coping
mechanisms
Evidence of use of assets to smooth consumption, and informal
sharing of risk within communities; overall only partial
smoothening of shocks, especially related to covariate shocks
Impact beyond
consumption or
income
Lower accumulation of assets due to risk, mainly due to ex-ante
responses; effects of portfolio composition of assets, such as
higher liquid assets rather than higher return illiquid assets. Losses
in health and nutrition, especially due to large shocks, such as
drought or catastrophic events.
Microinsurance Impact on Clients
Impact on ex ante
Risk management
No increased risk-taking in the form of modern input use (Malawi)
Decrease in precautionary savings due to health insurance.
Success of insurance
in
offering ex-post
risk coping
Positive impact of health insurance on anthropometric status in
Vietnam.
Insurance protects against payments for inpatient care, but does
not decrease out of pocket expenditures for outpatient care.
Differential treatment (drug prescription) between insured and
uninsured individuals in China due to financing.
Micro-health insurance units contribute to smaller differences in
access to health care among according to income in Philippines.
Reduced out-of-pocket expenditures for members of community
health insurances, but exclusion of the poorest in Senegal.
Increase in service utilization and inpatient care, but no reduction
in out-of-pocket expenditures in Vietnam.
Increase in service utilization but no impact on out-of-pocket
expenditures and utilization among the poor.
Heterogeneity
of Impact (profiles
of who benefits
most)
Signs that relatively not-so-poor households take up more
insurance.
Impact on existing
Informal
mechanisms and
Possible crowding out by microinsurance of informal insurance.
Evidence in Ethiopia is suggestive of this risk, albeit in the context
of a safety net, not in terms of insurance.
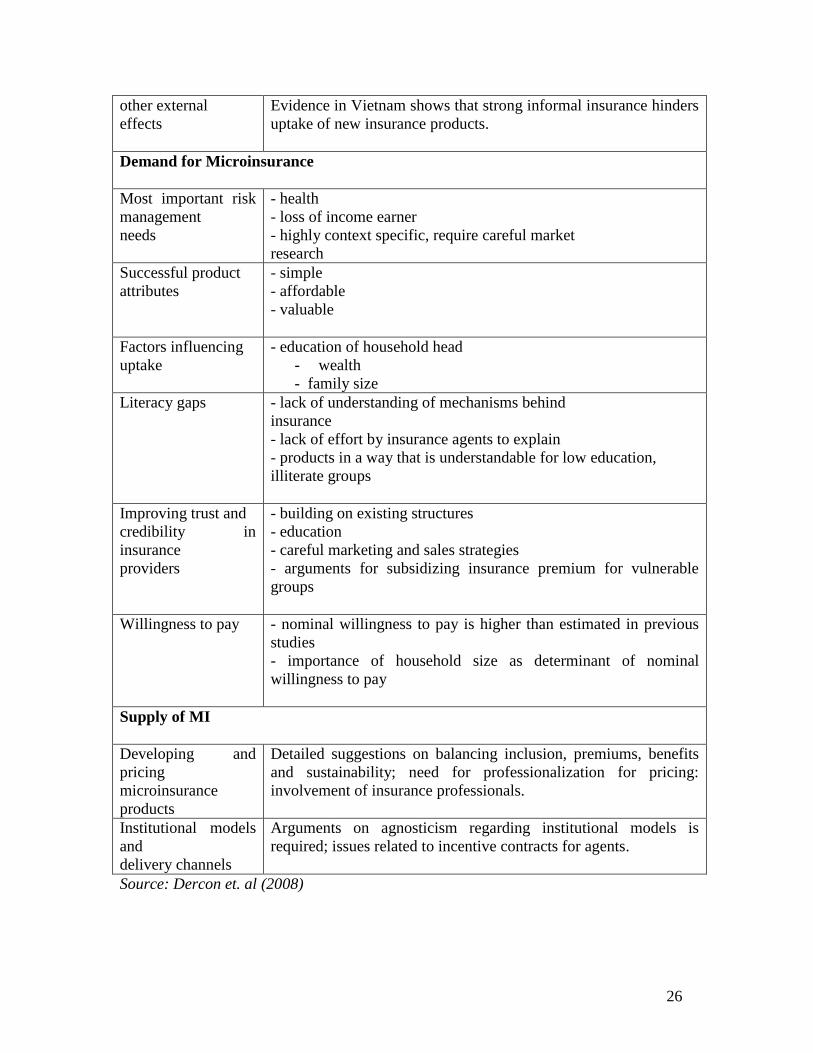
26
other external
effects
Evidence in Vietnam shows that strong informal insurance hinders
uptake of new insurance products.
Demand for Microinsurance
Most important risk
management
needs
- health
- loss of income earner
- highly context specific, require careful market
research
Successful product
attributes
- simple
- affordable
- valuable
Factors influencing
uptake
- education of household head
- wealth
- family size
Literacy gaps - lack of understanding of mechanisms behind
insurance
- lack of effort by insurance agents to explain
- products in a way that is understandable for low education,
illiterate groups
Improving trust and
credibility in
insurance
providers
- building on existing structures
- education
- careful marketing and sales strategies
- arguments for subsidizing insurance premium for vulnerable
groups
Willingness to pay - nominal willingness to pay is higher than estimated in previous
studies
- importance of household size as determinant of nominal
willingness to pay
Supply of MI
Developing and
pricing
microinsurance
products
Detailed suggestions on balancing inclusion, premiums, benefits
and sustainability; need for professionalization for pricing:
involvement of insurance professionals.
Institutional models
and
delivery channels
Arguments on agnosticism regarding institutional models is
required; issues related to incentive contracts for agents.
Source: Dercon et. al (2008)
27
Structure of the Study Report:
The present study is divided into five chapters. Chapter 1 contains introduction and
statement of the problem followed by review of literature to offer a general framework
to understand the link between risk and risk coping behaviour, need and potential
demand for insurance and other aspects of microinsurance.
Chapter 2 discusses objectives, research methodology, data, scope and limitations of
the study.
Chapter 3 highlights some aspects of insurance industry in India, development of
microinsurance and insurance regulation.
Chapter 4 summarizes profile of select MFIs and their experiences in microinsurance
and suitable case studies.
Chapter 5 presents an analysis of original primary data, findings and some emerging
issues on microinsurance. The field data based on household survey direct interactions
with current and potential clients are suitably presented. This chapter constitutes brief
introduction to study areas, features of sample household including income,
employment, borrowing, saving and asset holding pattern. It discusses some major risks
faced by the sample households, their risk coping mechanism; impact of risk and intra-
household risk management; how sample households perceived risks and prioritized
insurance need. Household participation in insurance, demand for specific insurance
product, expectation and suggestions etc are highlighted in this chapter.
Chapter 6 concludes with some suitable policy suggestions based on the findings of the
study. It contains specific recommendations regarding product design, pricing, claim
settlements and strategies for further improvement. Specific recommendations for
different stakeholders: service suppliers and regulators and Government, including the
IRDA, are proposed.
28
Chapter-2
Objectives, Methodology, Data and Study Areas
The literature on microinsurance generally focuses on two major aspects of
microinsurance i) reduction of vulnerability and poverty ii) saving for future
contingency. While reaching out the potential clients through MFIs could be an
opportunity for the insurers to scale up insurance activity, the role of intermediaries
such as MFI cannot be undermined as regard to outreach and efficacy of
microinsurance products in developing populous countries like India. It is well captured
in three different dimensions of outreach based on the framework developed by
Schreiner (2002): depth, quality and scope of outreach. The present study, however,
does not attempt to measure it rather focus on microinsurance products delivered by
MFIs – quite popular in recent years. This is one of the limitations of the study.
There are different microinsurance models and delivery structures used by
microinsurers across the countries. Some important models are given below.
– Partnerships between insurers and distribution agents such as cooperatives and MFIs
– Regulated insurance companies that serve the low-income market directly
– Healthcare providers offering a financing package and absorbing the insurance risk
– Community-based programmes that pool funds, carry risk and manage a relationship
with a healthcare provider
– Government-sponsored or -subsidized insurance schemes
– Self-insuring MFIs that assume the risk of offering insurance to their clients
The present study aims to analyze outreach and efficacy of microinsurance under
partner agent model because of its increasing popularity in the country and elsewhere.
In the partner-agent model, the insurer teams up with a local agent, for example, a
microfinance institution, informal savings institution or other grass-root organizations.
Under this setup, the comparative advantage of the insurer in developing and pricing
policies is combined with the comparative advantage of the local agent by having
experience in reaching the poor, with networks already in place, and enjoying the trust
of large numbers of clients. For example, In India, Tata-AIG has developed a model of
29
micro-agents in addition to MFIs as agents. As microfinance interventions has been
widening, deepening and upscaling in the country, it has provided the institutional
precincts on which the edifice of micro-insurance could be built in rural areas. It also
justify selecting this model of microinsurance for the present study.
Therefore, the study is based on microcredit clients of select MFI to discuss the nature,
structure and outreach of microinsurance product among low income poorer groups and
learn how to improve and supplement their risk-management options using
microinsurance products. The study also attempts to highlight on current practice &
coverage select microinsurance products in select study areas, household risk-
management strategy & options and potential benefits and the impact of the insurance
on low-income groups etc. Although scope of the study is limited to the microcredit
clients of selected MFIs in two states (Tamilnadu and Orissa) it aims at to offer some
specific policy suggestions for better outreach and efficacy of microinsurance frontier
in India.
The research agenda is divided into three main areas: 1) Type of risks and risk aversion
behaviour of poor households 2) Nature of MFI loan-linked, microinsurance products
and its impact on the microcredit clients, 3) understanding difficulties, demand, supply
and other aspects of microinsurance in the study areas. Since most of the risks are
associated with the household‘s occupation and activities and its asset holding and asset
use pattern most of the research questions in the study (listed below) are generic and
concern with broad activity groups and regions. However, individual response, views
and suggestions and its implications are given importance wherever possible.
The association between household features and its risk aversion behaviour and demand
for insurance product across activity groups and regions are specially focused in this
study to understand the client value (potential benefit) of different microinsurance
products in different contexts. Demand for microinsurance, in terms of appropriateness
(demanded protection coverage), affordability (willing and ability to pay total cost
including premium) and accessibility (simplicity, physical access, convenience) are also
30
attempted to analyze with risk-management mechanisms of sample households
(including informal borrowing and savings, insurance, intra-household risk
management, participation in anti-poverty and social security programme). The study
aims at to discuss on household participation in insurance with focus on current credit-
saving linked microinsurance products (life insurance in Madurai & Trichy and life,
health and asset insurance in Sambalpur). Efforts are made to highlight on supply side
information collected from major stakeholders with focus on product design, selection
of partners & negotiation process, overall performance, major difficulties, use of
technology, and other issues.
Partner-Agent Model of Microinsurance
It is a partnership between an insurer and an agent that provides some kind of financial
service to large numbers of low-income people. This could be a microfinance
organization, an NGO, or a business that supplies products to large numbers of low-
income people, such as a fertilizer supplier. This party is an agent, selling insurance
policies to the clients on behalf of the insurance provider (usually) in exchange for a
commission or fee. The insurance provider utilizes the established distribution channels
of this agent and its financial transactions with low-income groups that would
otherwise be too costly to set up. The partnership model uses the comparative
advantage of each partner so that each can focus on its core business, the insurance
provider is responsible for designing and pricing the product, the final claims
management, and the investment of reserves, and absorbs all the insurance risks. In
addition to selling the policies, the agent offers its infrastructure for product servicing
such as marketing the product, premium collection, and assists in claims management.
Advantages and Limitation of Agent -Partner Model of insurance delivery
The delivery system under this model is argued works better because the synergies are
maximized, enabling both organizations to focus on their core business and expertise.
With a single partnership agreement it is possible to sell microinsurance to more
number of clients with fewer skills for the agent than other models. Like other formal
31
insurance product delivery system, it is legally recognized insurance companies and
operates under the insurance laws and regulation. Possibility of reduction of the
overhead costs of both the agent and the insurance company is better as the agent can
use its infrastructure. Information asymmetries are minimized as the agent is familiar
with the needs of clients and their situations, which reduces the time needed for claims
verification and settlement, while receiving feedback on client satisfaction and product
design. There is some incentive for the agent to earn as commission without risk, while
the insurer earns profits. Major limitation of this model is that the insurers depend on
the quality of the agent. So reputation and performance of the agents is crucial.
Conflicts of interest may occur, especially when working with non-financial
institutions. NGOs or MFIs staff or management may develop sympathy for a client
and be lax about underwriting or claims verification. It should be noted that this is less
likely to occur with an MFIs partner that is used to financial discipline with its lending
activities
Research Questions:
The primary research questions are: What are the nature and structure of risks and risk
aversion behaviour of poor households? What is the outreach and efficacy of MFI loan
linked microinsurance? Are intermediaries such as MFIs and their partners able to meet
the insurance need of these clients? What are major difficulties and suggestions offered
by different stakeholders, particularly by the potential clients, to improve the efficacy
and outreach of microinsurance?
Specific questions:
What are major risks/shocks poor and low income groups mostly confronted with?
What is the understanding and practice of formal insurance among microcredit clients?
How risk and risk management behavior are different across groups & other contexts?
What are the nature and benefits of existing microinsurance product in study areas?

32
How do poor household combine microinsurance with their existing risk management
strategies? To what extent does having insurance coverage promote undertaking higher-
risk, more productive economic activities?
Would they like to continue with existing insurance policy?
What are major difficulties and suggestions for microinsurance reported in the study
areas?
What is the room for market-based insurance that enhances household welfare?
Objectives:
The thrust of the study is to analyze the outreach, efficacy and prospect of
microinsurance, particularly among microcredit clients currently under the cover of
insurance and suggest the ways in which microinsurance services can become more
inclusive to enhance pro-poor risk management capability. Some Specific objectives of
the study are :
- Examine different risks faced by the poor and low income groups, their current
coping mechanisms, categorization and prioritization of risks by the client
population. This is expected to help in identifying factors that inhibit demand.
- identifying major issues of outreach and efficacy of microinsurance and the
demand and supply sides constraints.
- To understand perception of the target groups about microinsurance through
direct interactions and to explore the market potential for microinsurance in In-
dia.
- To identify activity and group specific problems and issues relating to
microinsurance such as product design, pricing, claim settlements etc.
- To suggest some implementable policy suggestions for facilitation of desired
growth and outcome of the microinsurance sector.
Methodology:
To study outreach and efficacy of microinsurance, the present study has focused on
select microcredit clients and the areas where spread of microcredit is better. Selection
33
of MFIs for the study was based on their coverage and overall performance in delivery
of financial services such as microcredit and microinsurance. The study primarily
looked at experiences in South India, especially in TamilNadu where spread of
microcredit is relatively better. Selection of Orissa was considered on the basis of
incidence of microfinance, level of poverty and variety of microinsurance products in
operation. Out of different microcredit group models2 and microinsurance delivery
structures3 partnerships between insurers and distribution agents such as MFIs was
selected as it is popular within and out of the study areas.
Keeping in mind limited variety of microinsurance products/schemes and most of are
only recently launched, we selected the study areas and microcredit clients of some
known MFI in Tamilnadu & Orissa, deal in microinsurance for fairly longer period, for
detail study. As most of the insurers have focused on the simplest insurance products
such as life insurance, attempt was made to capture some important features of the
product design, premium, coverage, and benefits, acceptability, difficulties and
suggestions made by the respondents. Detail information about household such as
demographic feature, occupation, income, employment, borrowing, saving, asset
holding, participation in insurance etc were netted out through using a structured
questionnaire. Some of intermediaries other than selected MFIs and local organizations
were identified and contacted before selecting the study areas. A pilot field visit was
undertaken before finalizing for field survey. Respondents were randomly selected
from rural, semi-urban and urban centres of the operation areas under select MFIs.
Random selection of households was mostly done during their centre meeting at early
morning. Prior information about the centre was collected from the concern branch
2 Gramin Bank model having 5 members in a group and 4-5 groups constitute a centre and Self-Help
Group (SHG) model having 10-20 members 3 Different microinsurance models are - Partnerships between insurers and distribution agents such as
MFIs, Regulated insurance companies that serve the low-income market directly, Healthcare providers
offering a financing package and absorbing the insurance risk, Community-based programmes that pool
funds, carry risk and manage a relationship with a healthcare provider, Government-sponsored or -
subsidized insurance schemes, self-insuring MFIs that assume the risk of offering insurance to their
clients
34
mangers and analyzed prior to visit to the centre and selection of the respondents for
detail interview to gather household level information.
The study employed both secondary and primary method of research.
(a) Secondary research based mainly on a review of the literature and secondary data
analysis relating to risks, insurance, credit, poverty and household behaviour.
(b) Primary research based on field survey in three districts in two states in India. This
included field investigations in three selected states of India - Orissa, Rajasthan and
Tamil Nadu - covering different geographic regions. These states also capture
differences in stages of microfinance development in the country, with Tamil Nadu
being relatively advanced. The investigations were in the form of focused group
discussions among the target population, complemented by in-depth interviews among
selected stakeholders.
Selection of Study Areas
With given constraints, the states of Tamil Nadu and Orissa were selected as they are
quite distinct in socio-economic development, allowing us to capture considerable
variability of circumstance relevant for rural insurance, as well as the different stages of
development of this industry. Field investigations were supplemented by number of
consultation with local organization, experts and stakeholders covering operational,
strategic and policy level issues. All this provides clarity on (a) the differing
perspectives of clients, insurers and intermediaries, (b) need and willingness to pay for
customized insurance products. As most vulnerable groups - in particular, women - are
largely excluded from the insurance market, this study is designed to focus on female
microcredit clients who are covered under some microinsurance scheme to analyze its
impacts.
The present study attempts to cover part of the total microinsurance sector in India by
focusing on insurance for microfinance clients in two districts (Madurai and
Tiruchirapally) in Tamil Nadu and one district (Sambalpur) in Orissa. The study is
based on primary field surveys and investigations, focus group discussion, consultation
with local experts, institutions and major stakeholders. Prior to field survey relevant
35
secondary data and information from different published and unpublished sources are
collected analyzed. Selection of Tamil Nadu was based on its better performance and
progress in the field of microfinance. It was also found to be relatively developed in
terms of higher overall insurance coverage in comparisons to other states (UNDP
2007).
Data Collection:
Secondary data were collected from different published reports and document, IRDA
Annual Reports and relevant online sources.
In this study, multiple sources of both qualitative and quantitative information are used
to answer the key research questions raised above. They are grouped in three main
categories:
(a) Contextual information on household including information on the household
features, loaned activity, income, employment, borrowing, saving, household assets.
(b) Information about household risks and risk coping mechanism such as formal
insurance, informal borrowing, distress sale, intra-household risk management etc.
(c) Views and observations about current insurance products, its impacts, major
difficulties and suggestions are gathered from sample households, selected
representative MFIs and concern insurers.
Sampling & Data Collection Methods
The research questions are addressed through a structured schedule for collection of
household level data. Despite of time constraint, to cover larger sample and more
regions, the current contents and coverage of data for the study has extensive
exploratory goals. However, the results of the study may not be amenable to
generalization, but the theory building exploration may be used in subsequent studies.
The field survey inquiry relies on multiple information and sources of evidence. Detail
of the study location and sample size presented in subsequent chapter (Table-2.1).
Primary data was gathered from randomly selected microcredit clients of selected MFIs
one each, located and operated in Trichurapally, Madurai and Sambalpur across
36
economic activities and social groups. Cluster of groups called ‗center‘ consists of 20-
45 group members was the unit of selection for household survey. After their regular
centre meeting early at morning we selected 4-6 members randomly for complete
interview and collect information with the help of structured questionnaire. Selection of
centres was made randomly at branch level with consultation with concerned branch
managers and other field staffs at branch. Branches were selected one each from rural,
semi-urban and urban areas depending on the nature of activities and period of
implementation of microinsurance products. Relevant information and discussions
were also made at headquarter of respective MFIs with the concerned staffs about the
selected sample units at each level.
Participatory approach of data collection was also followed by applying ‗cooperative-
cum-cross-checked‘ method among the group members in order to neutralizing and
minimizing personal errors and biases of the respondents. Similar procedure was
followed for conducting focus group discussions (FGDs), among the current members
and potential clients randomly selected during their centre/group meetings. Field data
was gathered through primary survey method using mixed method for data collection as
explained below.
Methods of primary data collection was done using following methods:
1. Household survey method
2. Focus Group Discussion
3. Interview with Key informants
4. Interview with local organization/institutions
5. Case Study
Features of Methodology:
(1) use of multidimensional quantitative data on household activities to show whether
microinsurance influence household risk aversion behaviour or not.
(2) use of mixed data collection methods (household survey, focus group discussion,
case study, interview with key informants) mostly quantitative, (to link household‘s
ability and its own coping strategy against risks with formal insurance products)
37
(3) use of purposive sampling to explore some new and innovative primary findings
and better understanding about household‘s behaviour on coping strategy with
insurance products.
(4) use of multidimensional data on microinsurance intermediaries (MFI)
Focused group discussions (FGDs) among current and potential clients were carried out
in all locations in each state. The FGDs were based on a pre-designed survey
instruments and check list that provided qualitative information to help assess client
perspectives on the efficacy and constraints of microinsurance.
Use of mixed methods consists of surveys with 75 group members (current clients of
three selected MFIs), 6 focus group discussions with about 60 current group members
(two each in select districts), interviews with 6 senior staffs of MFI and 4
representatives of insurance companies and two case studies.
Field Visit
The field visit consisted of two phases. The first phase was pilot survey involved two
field visits to Trichurapally and Madurai to explore current status of microinsurance
potential intermediary, clients and other issues to be studied. The first field visit was in
early November 2009 for a week. The second phase was to conduct field survey in
Tiruchirapalli, Madurai (Tamil Nadu) and Sambalpur (Orissa) lasted for three weeks
during late November to December 2009. The objective was to gather primary data and
interaction with different stakeholders according to the systematic methods presented
above.
For field data collection a team of research investigators was selected and trained by the
researcher prior to household survey in the study areas. Collection of primary data
includes key information of sample households with focus on their socio-economic-
risk-insurance features to respond the questions presented above. Primary data also
collected from the select MFIs about their experience and operation in microinsurance,
constraints and suggestion.
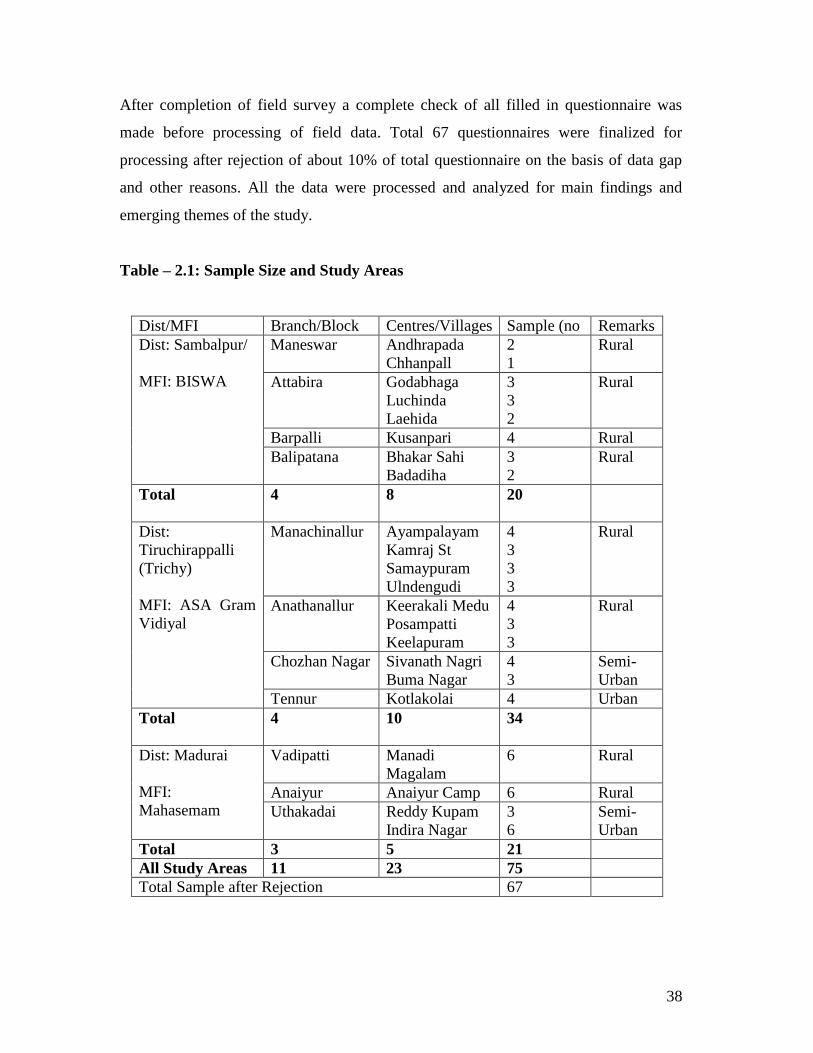
38
After completion of field survey a complete check of all filled in questionnaire was
made before processing of field data. Total 67 questionnaires were finalized for
processing after rejection of about 10% of total questionnaire on the basis of data gap
and other reasons. All the data were processed and analyzed for main findings and
emerging themes of the study.
Table – 2.1: Sample Size and Study Areas
Dist/MFI Branch/Block Centres/Villages Sample (no Remarks
Dist: Sambalpur/
MFI: BISWA
Maneswar Andhrapada
Chhanpall
2
1
Rural
Attabira Godabhaga
Luchinda
Laehida
3
3
2
Rural
Barpalli Kusanpari 4 Rural
Balipatana Bhakar Sahi
Badadiha
3
2
Rural
Total 4 8 20
Dist:
Tiruchirappalli
(Trichy)
MFI: ASA Gram
Vidiyal
Manachinallur Ayampalayam
Kamraj St
Samaypuram
Ulndengudi
4
3
3
3
Rural
Anathanallur Keerakali Medu
Posampatti
Keelapuram
4
3
3
Rural
Chozhan Nagar Sivanath Nagri
Buma Nagar
4
3
Semi-
Urban
Tennur Kotlakolai 4 Urban
Total 4 10 34
Dist: Madurai
MFI:
Mahasemam
Vadipatti Manadi
Magalam
6 Rural
Anaiyur Anaiyur Camp 6 Rural
Uthakadai Reddy Kupam
Indira Nagar
3
6
Semi-
Urban
Total 3 5 21
All Study Areas 11 23 75
Total Sample after Rejection 67
39
Primary Data Analysis
The findings of the data are presented in two chapters. Description of context includes a
profile of the microinsurance intermediaries in the study locations and the environment
in which it was in operation. The first part is a narrative account of socio-economic
feature of sample households followed by their asset holding, income and employment
generating activities, borrowing and saving, risk management tools and strategy,
understanding about insurance, issues and suggestion about insurance products. These
descriptions are intended to provide context for the factors that may have influenced the
risk managing behaviour of household. In most of the cases, the analysis is made on the
basis of broad group activities, study region and overall samples. The analysis has been
made at the level of seven broad activity groups, three different regions and overall
sample. Both quantitative and qualitative indicators are presented wherever possible.
Overall, analysis of both primary and secondary data provides some useful insights into
the potential for the microinsurance sector. The information on experience and
differences in perspectives across clients, intermediaries, suppliers and policy makers
helped to arrive at very specific suggestions for the way forward.
Limitations of the Study
The study has some limitations in its scope and interpretation of the results. It covers
smaller number of location, groups and respondents to draw conclusion and policy
suggestion which may not to represent the country as a whole. There are many areas in
other parts of the country which may display different risk pattern and risk coping
management and have different constraints regarding outreach and efficacy of
microinsurance. Limitation of time and resources also prevent a full scale sample
survey with wider coverage. The subjective nature of analysis, while providing some
interesting insights, could lead to some biases of the respondents and / or inadvertent
generalizations. However, despite of these limitations the present study has come out
with some meaningful findings and policy suggestions for further actions.
40
Chapter – 3
Insurance Sector in India and Outreach of Microinsurance
Insurance sector in India started in the nineteenth century and it progressed in the early
twentieth century with incorporation of National Insurance Company Ltd. in 1906 and
New India Assurance Company Ltd. in 1919. Later other insurance players joined the
industry. The formal insurance industry started in 1818 with the establishment of the
Oriental Life Insurance Company in Calcutta. General insurance business (non-life)
came into existence in 1850 with the commencement of the Triton Insurance Company.
The first Insurance Act was formulated in the pre-independence period in 1938. After
merging of 240 private insurance companies, the first public sector insurance company
called Life Insurance Corporation of India (LIC) was set up in 1956. Non-life insurance
companies were nationalized in 1972 and were taken over by General Insurance
Corporation (GIC) and its four subsidiaries - United India Insurance Company Limited,
Oriental Insurance Company Limited, National Insurance Company Limited and New
India Assurance Company Limited.
The insurance sector has undergone some notable changes during last few decades
with more policy emphasis on growth and efficiency. The broad objective of these
policy changes is to achieve inclusive financial development by enhancing risk
managing capability of people with rural and pro-poor focus.
A special committee (The Malhotra Committee) was appointed in 1993 to look into the
insurance industry to make recommendations for the expansion of this sector. The
recommendations of The Malhotra committee were focused on efficiency and growth
of insurance sector. One of the most important outcomes of the committee
recommendations was the Insurance Regulatory and Development Authority (IRDA)
legislation passed in 1999 and the Insurance Regulatory and Development Authority
was established in 2000. Since then continuous efforts have been made to bring about
changes in policy regulations and promotion of insurance sector. The IRDA has enacted
27 regulations on a number of issues such as registration of insurers, regulation of
41
agents, solvency margins, re-insurance, obligation of insurers to rural and social
sectors, investment and accounting procedures, and protection of client interests till
2005.
In 2003, Govt. of India constituted a Consultative Group on Micro-Insurance to
examine existing insurance schemes for rural and urban poor with specific reference to
outreach, pricing, products, servicing and promotion. It also attempted to examine
existing regulations with a view to promoting micro-insurance organizations with
specific reference to capital requirements, licensing, monitoring and review. One of the
key issues featured in the consultative group report was that micro-insurance is not as
viable as a standalone insurance product and it has not penetrated rural markets.
Traditional insurers have not made much headway in bringing micro-insurance
products to the poor in rural as well as urban areas. However, the committee viewed
that the partnership between insurer and organisation like NGO would be desirable to
promote micro-insurance by drawing on their mutual strengths. It re-emphasized on the
design of micro-insurance products that must have the features of simplicity,
availability, affordability, accessibility and flexibility. Unfortunately, overall insurance
industry in India has been dismal despite the fact that the country has a large population
base and insurable risks (UNDP, 2007). While it shows an enormous potential for
growth of insurance sector, much is not known about lower segment insurance market
across regions and groups.
Performance of Insurance Sector in India during Post-Reform Period
Performance of Indian insurance sector has been not satisfactory in comparison to other
countries in the world. It continued to lag behind the overall performance of the
economy. India accounts for less than two percent of the world‘s insurance market
(1.34) while it accommodates more than 16 percent of total world population and
sizeable portion of total world poor. Though India ranked second, after China among
emerging markets, insurance is viewed as a tax saving instrument and risk cover in life
insurance is almost incidental in the country. Some unit-linked instruments are
becoming popular but pure risk insurance product has taken a back seat (IRDA 2009).
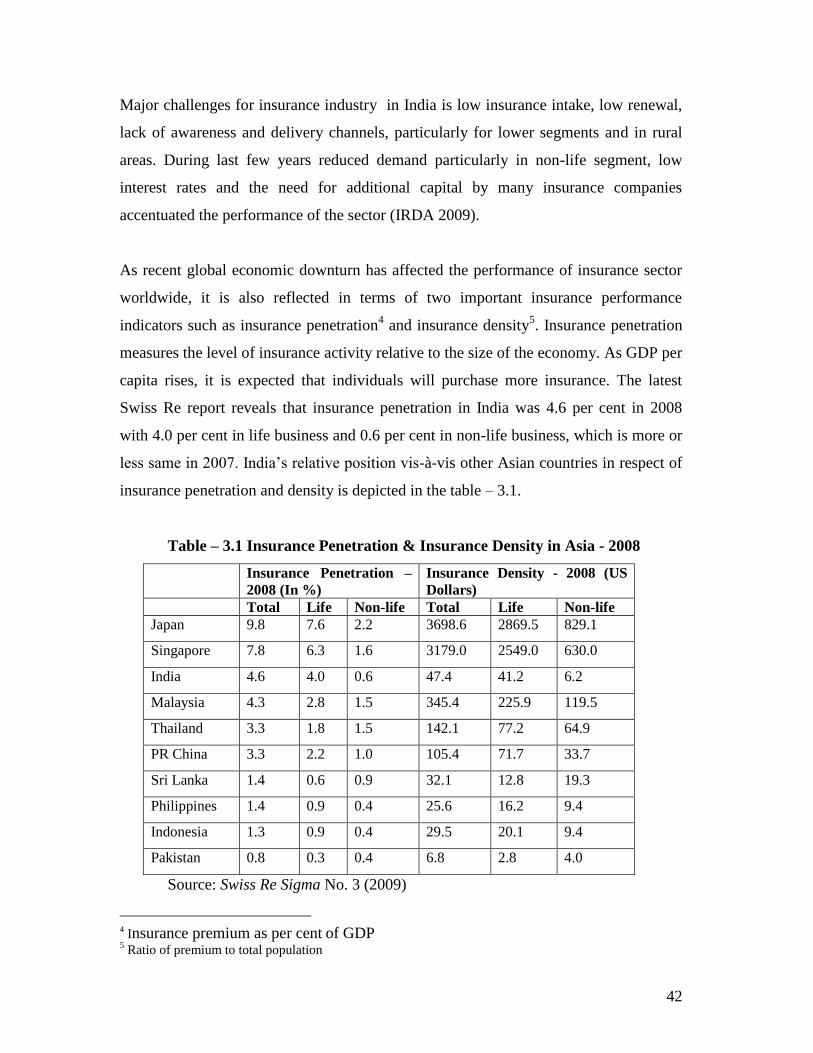
42
Major challenges for insurance industry in India is low insurance intake, low renewal,
lack of awareness and delivery channels, particularly for lower segments and in rural
areas. During last few years reduced demand particularly in non-life segment, low
interest rates and the need for additional capital by many insurance companies
accentuated the performance of the sector (IRDA 2009).
As recent global economic downturn has affected the performance of insurance sector
worldwide, it is also reflected in terms of two important insurance performance
indicators such as insurance penetration4 and insurance density
5. Insurance penetration
measures the level of insurance activity relative to the size of the economy. As GDP per
capita rises, it is expected that individuals will purchase more insurance. The latest
Swiss Re report reveals that insurance penetration in India was 4.6 per cent in 2008
with 4.0 per cent in life business and 0.6 per cent in non-life business, which is more or
less same in 2007. India‘s relative position vis-à-vis other Asian countries in respect of
insurance penetration and density is depicted in the table – 3.1.
Table – 3.1 Insurance Penetration & Insurance Density in Asia - 2008
Insurance Penetration –
2008 (In %)
Insurance Density - 2008 (US
Dollars)
Total Life Non-life Total Life Non-life
Japan 9.8 7.6 2.2 3698.6 2869.5 829.1
Singapore 7.8 6.3 1.6 3179.0 2549.0 630.0
India 4.6 4.0 0.6 47.4 41.2 6.2
Malaysia 4.3 2.8 1.5 345.4 225.9 119.5
Thailand 3.3 1.8 1.5 142.1 77.2 64.9
PR China 3.3 2.2 1.0 105.4 71.7 33.7
Sri Lanka 1.4 0.6 0.9 32.1 12.8 19.3
Philippines 1.4 0.9 0.4 25.6 16.2 9.4
Indonesia 1.3 0.9 0.4 29.5 20.1 9.4
Pakistan 0.8 0.3 0.4 6.8 2.8 4.0
Source: Swiss Re Sigma No. 3 (2009)
4 Insurance premium as per cent of GDP
5 Ratio of premium to total population
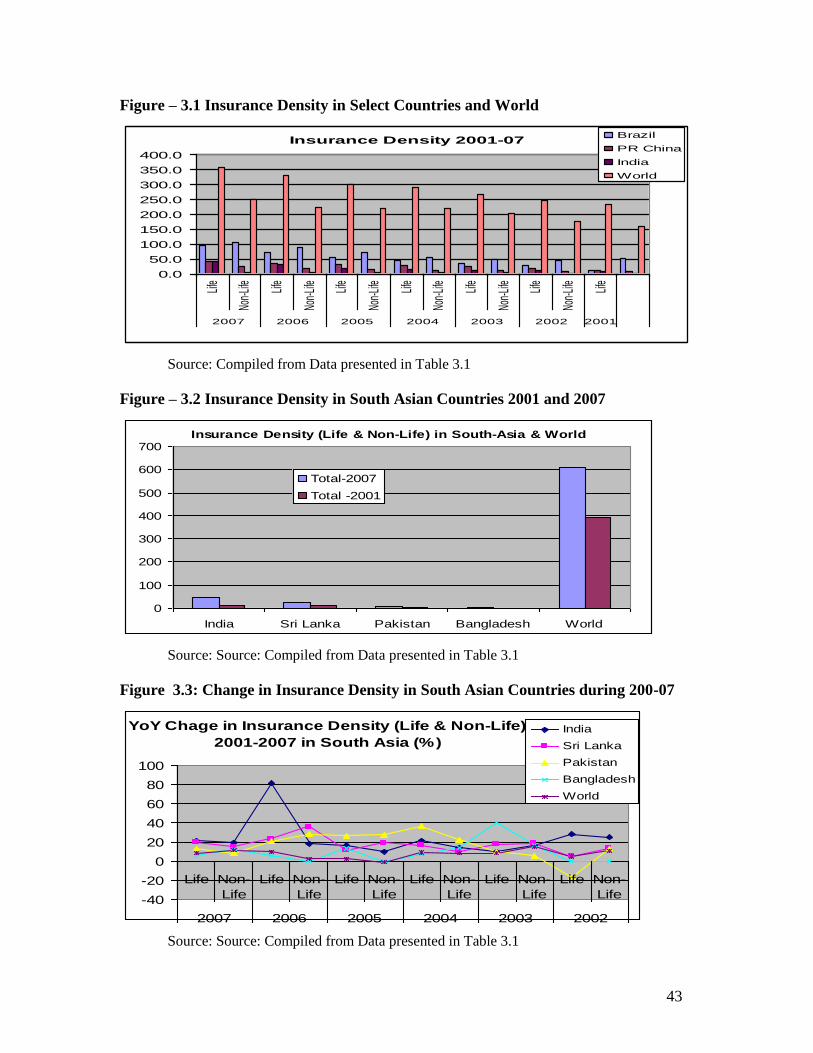
43
Figure – 3.1 Insurance Density in Select Countries and World
Insurance Density 2001-07
0.0
50.0
100.0
150.0
200.0
250.0
300.0
350.0
400.0
Life
Non-
Life
Life
Non-
Life
Life
Non-
Life
Life
Non-
Life
Life
Non-
Life
Life
Non-
Life
Life
2007 2006 2005 2004 2003 2002 2001
Brazil
PR China
India
World
Source: Compiled from Data presented in Table 3.1
Figure – 3.2 Insurance Density in South Asian Countries 2001 and 2007
Insurance Density (Life & Non-Life) in South-Asia & World
0
100
200
300
400
500
600
700
India Sri Lanka Pakistan Bangladesh World
Total-2007
Total -2001
Source: Source: Compiled from Data presented in Table 3.1
Figure 3.3: Change in Insurance Density in South Asian Countries during 200-07
YoY Chage in Insurance Density (Life & Non-Life)
2001-2007 in South Asia (%)
-40
-20
0
20
40
60
80
100
Life Non-
Life
Life Non-
Life
Life Non-
Life
Life Non-
Life
Life Non-
Life
Life Non-
Life
2007 2006 2005 2004 2003 2002
India
Sri Lanka
Pakistan
Bangladesh
World
Source: Source: Compiled from Data presented in Table 3.1
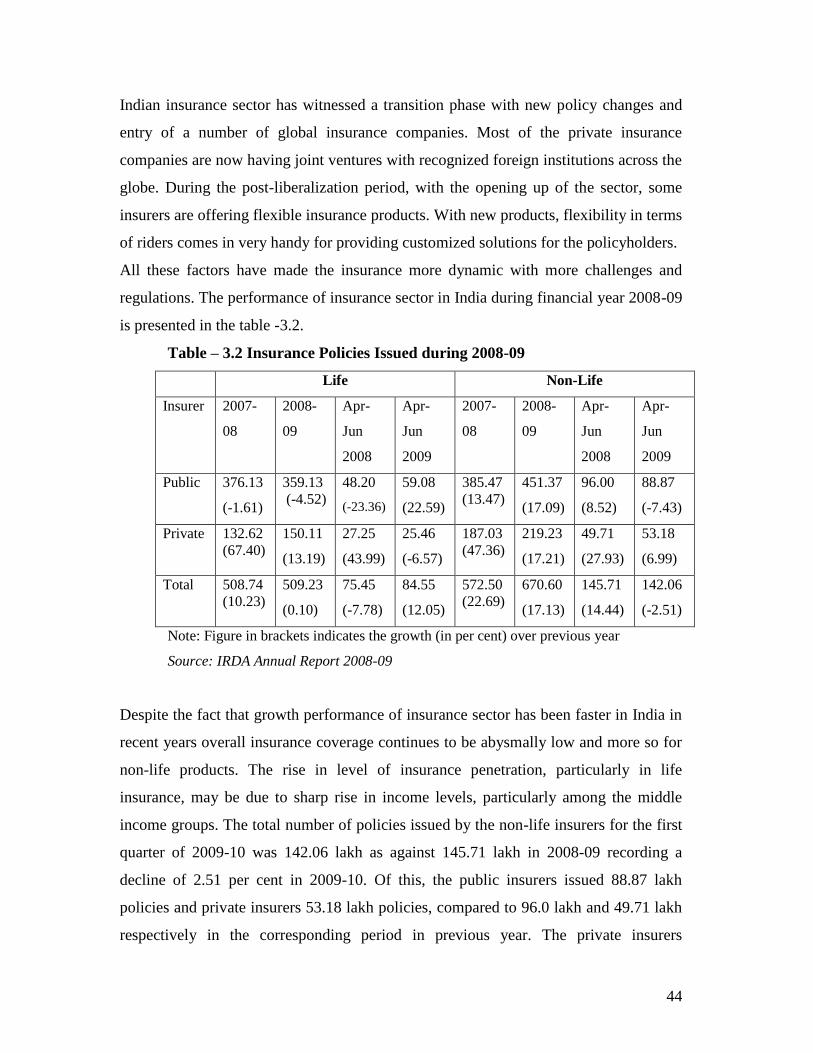
44
Indian insurance sector has witnessed a transition phase with new policy changes and
entry of a number of global insurance companies. Most of the private insurance
companies are now having joint ventures with recognized foreign institutions across the
globe. During the post-liberalization period, with the opening up of the sector, some
insurers are offering flexible insurance products. With new products, flexibility in terms
of riders comes in very handy for providing customized solutions for the policyholders.
All these factors have made the insurance more dynamic with more challenges and
regulations. The performance of insurance sector in India during financial year 2008-09
is presented in the table -3.2.
Table – 3.2 Insurance Policies Issued during 2008-09
Life Non-Life
Insurer
2007-
08
2008-
09
Apr-
Jun
2008
Apr-
Jun
2009
2007-
08
2008-
09
Apr-
Jun
2008
Apr-
Jun
2009
Public 376.13
(-1.61)
359.13
(-4.52)
48.20
(-23.36)
59.08
(22.59)
385.47
(13.47)
451.37
(17.09)
96.00
(8.52)
88.87
(-7.43)
Private 132.62
(67.40)
150.11
(13.19)
27.25
(43.99)
25.46
(-6.57)
187.03
(47.36)
219.23
(17.21)
49.71
(27.93)
53.18
(6.99)
Total 508.74
(10.23)
509.23
(0.10)
75.45
(-7.78)
84.55
(12.05)
572.50
(22.69)
670.60
(17.13)
145.71
(14.44)
142.06
(-2.51)
Note: Figure in brackets indicates the growth (in per cent) over previous year
Source: IRDA Annual Report 2008-09
Despite the fact that growth performance of insurance sector has been faster in India in
recent years overall insurance coverage continues to be abysmally low and more so for
non-life products. The rise in level of insurance penetration, particularly in life
insurance, may be due to sharp rise in income levels, particularly among the middle
income groups. The total number of policies issued by the non-life insurers for the first
quarter of 2009-10 was 142.06 lakh as against 145.71 lakh in 2008-09 recording a
decline of 2.51 per cent in 2009-10. Of this, the public insurers issued 88.87 lakh
policies and private insurers 53.18 lakh policies, compared to 96.0 lakh and 49.71 lakh
respectively in the corresponding period in previous year. The private insurers

45
registered a growth of 6.99 per cent, while public insurers witnessed a negative growth
of - 7.43 per cent. Though public sector has recovered in issue of life insurance policies
during later years it failed to do so non-life insurance policies. On the other hand
private sector has performed better than public sector in terms of issuing number of
policies except in life insurance sector during April-June 2009. It appears that insurers
in private sector have little advantage in non-life insurance products than their
counterparts in public sector.
As regard to type of insurance product, endowment products have been dominant in
insurance market because of its saving component. While dominance of the life
insurance products is well documented in Indian insurance sector, the need for health
insurance is very high (UNDP, 2007). This could be the one of the factors for sudden
surge of health insurance with a 60 per cent growth. Since, health insurance portfolio is
new to the Indian domain such growth may not be significant. On the other hand, as
most of the healthcare spending is self-funded and arranged through informal
borrowing. It may aggravate economic condition of many poor households without
adequate health insurance cover. Similarly, non-renewal and lapse of policy is a serious
issue.
As more ambitious public policies such as covering all poor under insurance, provision
of health insurance to senior citizens and more penetration in rural areas are undertaken
by the government the importance of insurance sector has increased. However, the gap
between policy and performance of insurance sector is evident. There is need focus to
policy specific to people, products and players to bridge the wide gap in insurance
needs and potential demand. Development of microinsurance in terms of better
outreach and efficacy could be effective in addressing these issues.
Insurance for Rural and Social Sector
One of the key features of insurance sector in India is insurers have to fulfill the social
and rural sector obligation on an annual basis as defined by the regulator. The rural and
social obligations as stipulated in the IRDA Regulations, 2002 lay down the
46
requirements to be complied with by the insurers during the first five years of their
operations. In case of public sector insurers, these obligations have been linked to their
performance in the year 2001-02. However, with the amendments notified in 2007-08,
the obligation of the private insurers up to the tenth year of operations has been laid
down. Simultaneously, the obligations of the public sector insurers were also revisited.
The obligations of the private insurers are as under:
Rural sector:
Life insurer: commencing from seven per cent of the total policies written direct in the
first financial year to twenty per cent in the tenth financial year.
Non-life insurer: commencing from two per cent of total gross premium income written
direct in the first financial year to seven per cent from the ninth financial year
onwards.
Social sector: (all insurers commencing from five thousand lives in the first financial
year to fifty five thousand lives in the tenth financial year.
Though rural and social sector obligations have helped to expand outreach of
microinsurance the poor are not adequately perceived as a potential business op-
portunity.
Microinsurance in India:
Development of microinsurance sector in India is recent phenomenon. Micro-insurance
portfolio has made steady progress during last few years after IRDA (Micro-insurance)
Regulations 2005 that allow the insurers for composite covers or package products.
According to IRDA source, more life insurers have commenced their micro-Insurance
operations and many new products have been launched during the year 2008-09. With
expansion of distribution infrastructure and new business has shown upward trend in
microinsurance sector but it is still much smaller than the desired level.
However, micro-insurance business in India largely constitutes group portfolio. Under
the individual policy category microinsurance though more policies are underwritten
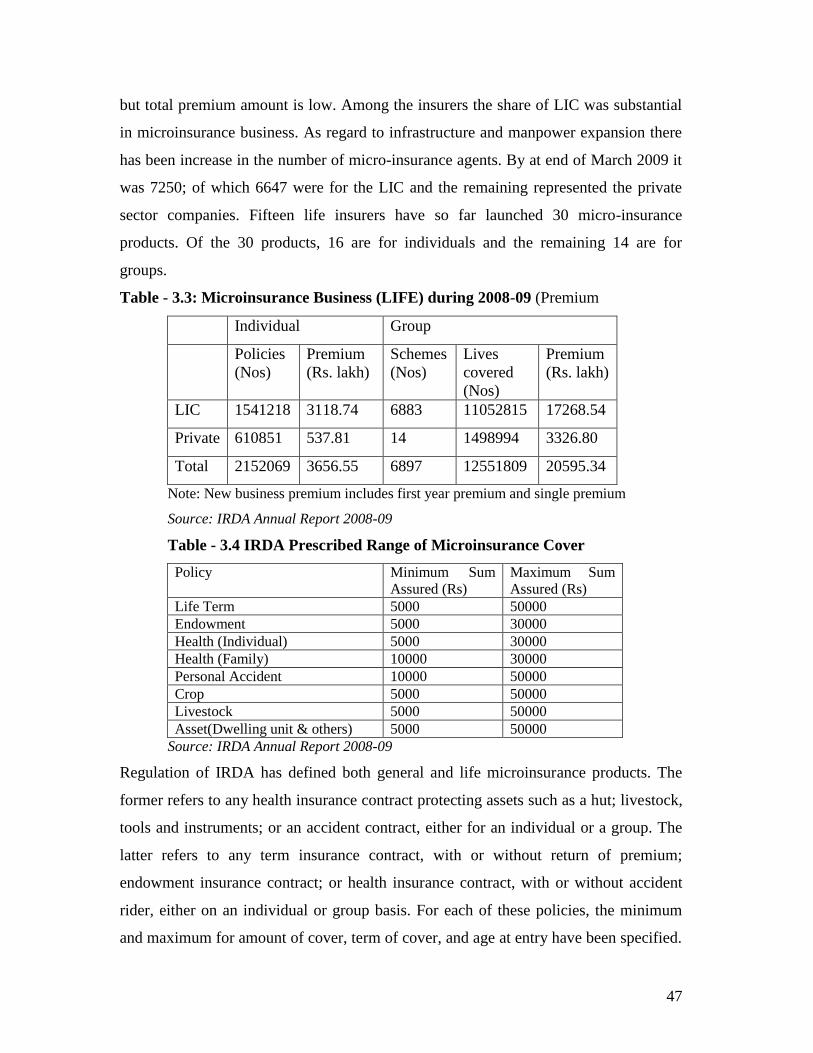
47
but total premium amount is low. Among the insurers the share of LIC was substantial
in microinsurance business. As regard to infrastructure and manpower expansion there
has been increase in the number of micro-insurance agents. By at end of March 2009 it
was 7250; of which 6647 were for the LIC and the remaining represented the private
sector companies. Fifteen life insurers have so far launched 30 micro-insurance
products. Of the 30 products, 16 are for individuals and the remaining 14 are for
groups.
Table - 3.3: Microinsurance Business (LIFE) during 2008-09 (Premium
Individual Group
Policies
(Nos)
Premium
(Rs. lakh)
Schemes
(Nos)
Lives
covered
(Nos)
Premium
(Rs. lakh)
LIC 1541218 3118.74 6883 11052815 17268.54
Private 610851 537.81 14 1498994 3326.80
Total 2152069 3656.55 6897 12551809 20595.34
Note: New business premium includes first year premium and single premium
Source: IRDA Annual Report 2008-09
Table - 3.4 IRDA Prescribed Range of Microinsurance Cover
Policy Minimum Sum
Assured (Rs)
Maximum Sum
Assured (Rs)
Life Term 5000 50000
Endowment 5000 30000
Health (Individual) 5000 30000
Health (Family) 10000 30000
Personal Accident 10000 50000
Crop 5000 50000
Livestock 5000 50000
Asset(Dwelling unit & others) 5000 50000
Source: IRDA Annual Report 2008-09
Regulation of IRDA has defined both general and life microinsurance products. The
former refers to any health insurance contract protecting assets such as a hut; livestock,
tools and instruments; or an accident contract, either for an individual or a group. The
latter refers to any term insurance contract, with or without return of premium;
endowment insurance contract; or health insurance contract, with or without accident
rider, either on an individual or group basis. For each of these policies, the minimum
and maximum for amount of cover, term of cover, and age at entry have been specified.
48
Companies have to design products under these specifications and get special approval
from IRDA for them to qualify as microinsurance products.
Gap & Opportunity in Microinsurance in India:
With higher economic growth and expansion of income earning opportunity more
intensive pro-poor policy can create a good environment for microinsurance sector in
India. Increased policy attention towards rural and agriculture credit and financial
services progressive growth of microfinance sector are potential factors for achieving
robust growth in microinsurance sector. With wide spread SHG activities, participation
of women in development programme and their increasing credit and saving activities,
provision of insurance product could be much easier. Inspite of all these conducive
factors outreach of microinsurance in India is very low. It is estimated about 5.2 million
people constituting only two percent of total poor in the country (UNDP, 2007). Some
guaranteed public insurance schemes have been implemented under poverty alleviation
programme and often designed along with a credit package for the low income groups.
Due to lack of perception and understanding and awareness the concept of insurance
lost its spirit and ultimate result. For instance, insurance covered in livestock and crop
loans are often not known to the clients. It may affect the benefits of insurance services
and growth in low segment level.
There is wide gap between the supply and demand for insurance for the poor and for
rural areas. While targeting lower segment and rural areas require changes in product
design, delivery models, poor infrastructure, information, awareness among people
pose challenges for rapid growth of microinsurance in India. Targeting low income
groups or poor requires necessary changes in product design and insurance models. As
microinsurance expands, more products are being offered through a variety of insurer
models and delivery channels. But the product development process is a complex and
resource consuming activity which is too often skipped by commercial insurers. The
approach of microinsurance supply is more product-driven—in the way microcredit
was initially provided—than market driven. It might have contributed to increasing the
gap between supply and demand, particularly in low segment insurance market.
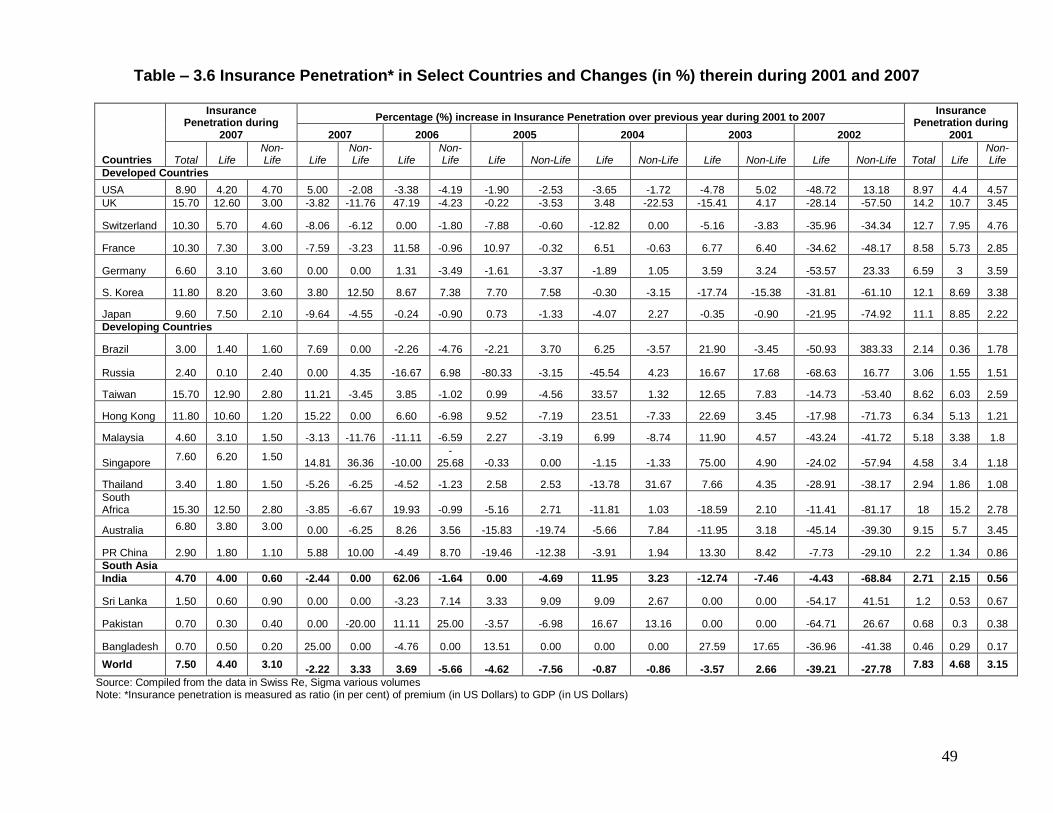
49
Table – 3.6 Insurance Penetration* in Select Countries and Changes (in %) therein during 2001 and 2007
Countries
Insurance Penetration during
2007
Percentage (%) increase in Insurance Penetration over previous year during 2001 to 2007 Insurance
Penetration during 2001 2007 2006 2005 2004 2003 2002
Total Life Non-Life Life
Non-Life Life
Non-Life Life Non-Life Life Non-Life Life Non-Life Life Non-Life Total Life
Non-Life
Developed Countries
USA 8.90 4.20 4.70 5.00 -2.08 -3.38 -4.19 -1.90 -2.53 -3.65 -1.72 -4.78 5.02 -48.72 13.18 8.97 4.4 4.57
UK 15.70 12.60 3.00 -3.82 -11.76 47.19 -4.23 -0.22 -3.53 3.48 -22.53 -15.41 4.17 -28.14 -57.50 14.2 10.7 3.45
Switzerland 10.30 5.70 4.60 -8.06 -6.12 0.00 -1.80 -7.88 -0.60 -12.82 0.00 -5.16 -3.83 -35.96 -34.34 12.7 7.95 4.76
France 10.30 7.30 3.00 -7.59 -3.23 11.58 -0.96 10.97 -0.32 6.51 -0.63 6.77 6.40 -34.62 -48.17 8.58 5.73 2.85
Germany 6.60 3.10 3.60 0.00 0.00 1.31 -3.49 -1.61 -3.37 -1.89 1.05 3.59 3.24 -53.57 23.33 6.59 3 3.59
S. Korea 11.80 8.20 3.60 3.80 12.50 8.67 7.38 7.70 7.58 -0.30 -3.15 -17.74 -15.38 -31.81 -61.10 12.1 8.69 3.38
Japan 9.60 7.50 2.10 -9.64 -4.55 -0.24 -0.90 0.73 -1.33 -4.07 2.27 -0.35 -0.90 -21.95 -74.92 11.1 8.85 2.22
Developing Countries
Brazil 3.00 1.40 1.60 7.69 0.00 -2.26 -4.76 -2.21 3.70 6.25 -3.57 21.90 -3.45 -50.93 383.33 2.14 0.36 1.78
Russia 2.40 0.10 2.40 0.00 4.35 -16.67 6.98 -80.33 -3.15 -45.54 4.23 16.67 17.68 -68.63 16.77 3.06 1.55 1.51
Taiwan 15.70 12.90 2.80 11.21 -3.45 3.85 -1.02 0.99 -4.56 33.57 1.32 12.65 7.83 -14.73 -53.40 8.62 6.03 2.59
Hong Kong 11.80 10.60 1.20 15.22 0.00 6.60 -6.98 9.52 -7.19 23.51 -7.33 22.69 3.45 -17.98 -71.73 6.34 5.13 1.21
Malaysia 4.60 3.10 1.50 -3.13 -11.76 -11.11 -6.59 2.27 -3.19 6.99 -8.74 11.90 4.57 -43.24 -41.72 5.18 3.38 1.8
Singapore 7.60 6.20 1.50
14.81 36.36 -10.00 -
25.68 -0.33 0.00 -1.15 -1.33 75.00 4.90 -24.02 -57.94 4.58 3.4 1.18
Thailand 3.40 1.80 1.50 -5.26 -6.25 -4.52 -1.23 2.58 2.53 -13.78 31.67 7.66 4.35 -28.91 -38.17 2.94 1.86 1.08
South Africa 15.30 12.50 2.80 -3.85 -6.67 19.93 -0.99 -5.16 2.71 -11.81 1.03 -18.59 2.10 -11.41 -81.17 18 15.2 2.78
Australia 6.80 3.80 3.00 0.00 -6.25 8.26 3.56 -15.83 -19.74 -5.66 7.84 -11.95 3.18 -45.14 -39.30 9.15 5.7 3.45
PR China 2.90 1.80 1.10 5.88 10.00 -4.49 8.70 -19.46 -12.38 -3.91 1.94 13.30 8.42 -7.73 -29.10 2.2 1.34 0.86
South Asia
India 4.70 4.00 0.60 -2.44 0.00 62.06 -1.64 0.00 -4.69 11.95 3.23 -12.74 -7.46 -4.43 -68.84 2.71 2.15 0.56
Sri Lanka 1.50 0.60 0.90 0.00 0.00 -3.23 7.14 3.33 9.09 9.09 2.67 0.00 0.00 -54.17 41.51 1.2 0.53 0.67
Pakistan 0.70 0.30 0.40 0.00 -20.00 11.11 25.00 -3.57 -6.98 16.67 13.16 0.00 0.00 -64.71 26.67 0.68 0.3 0.38
Bangladesh 0.70 0.50 0.20 25.00 0.00 -4.76 0.00 13.51 0.00 0.00 0.00 27.59 17.65 -36.96 -41.38 0.46 0.29 0.17
World 7.50 4.40 3.10 -2.22 3.33 3.69 -5.66 -4.62 -7.56 -0.87 -0.86 -3.57 2.66 -39.21 -27.78 7.83 4.68 3.15
Source: Compiled from the data in Swiss Re, Sigma various volumes Note: *Insurance penetration is measured as ratio (in per cent) of premium (in US Dollars) to GDP (in US Dollars)
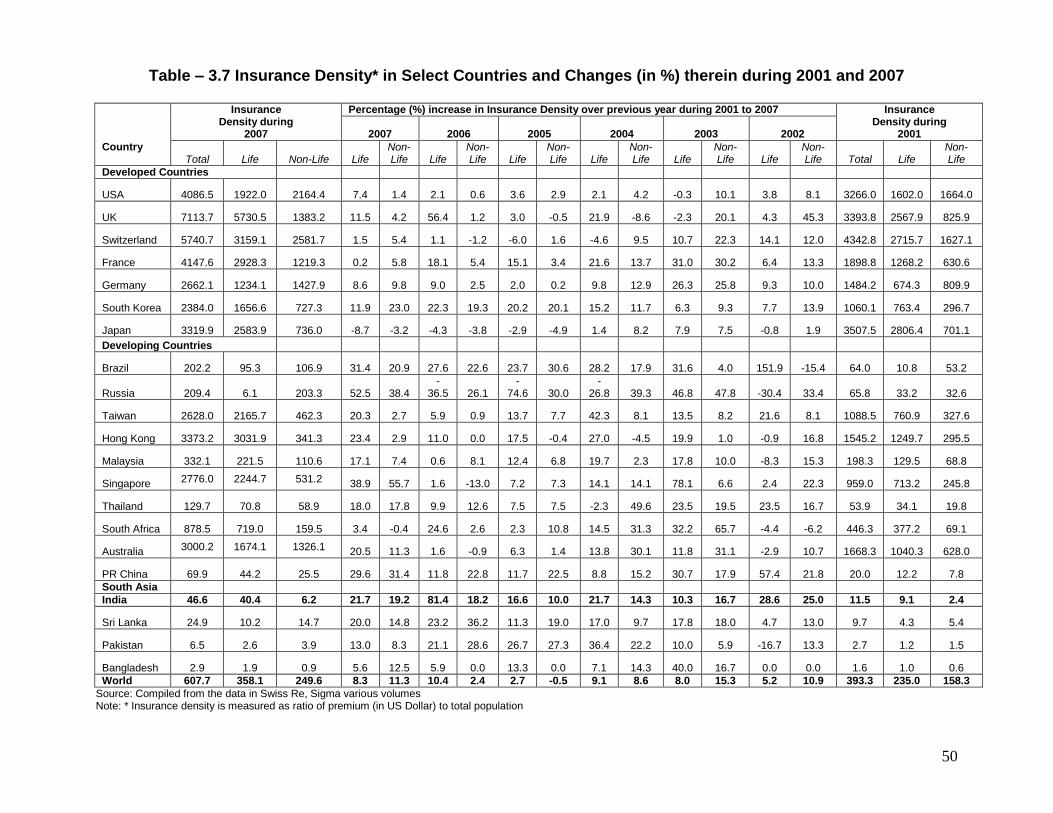
50
Table – 3.7 Insurance Density* in Select Countries and Changes (in %) therein during 2001 and 2007
Country
Insurance Density during
2007
Percentage (%) increase in Insurance Density over previous year during 2001 to 2007 Insurance Density during
2001 2007 2006 2005 2004 2003 2002
Total Life Non-Life Life Non-Life Life
Non-Life Life
Non-Life Life
Non-Life Life
Non-Life Life
Non-Life Total Life
Non-Life
Developed Countries
USA 4086.5 1922.0 2164.4 7.4 1.4 2.1 0.6 3.6 2.9 2.1 4.2 -0.3 10.1 3.8 8.1 3266.0 1602.0 1664.0
UK 7113.7 5730.5 1383.2 11.5 4.2 56.4 1.2 3.0 -0.5 21.9 -8.6 -2.3 20.1 4.3 45.3 3393.8 2567.9 825.9
Switzerland 5740.7 3159.1 2581.7 1.5 5.4 1.1 -1.2 -6.0 1.6 -4.6 9.5 10.7 22.3 14.1 12.0 4342.8 2715.7 1627.1
France 4147.6 2928.3 1219.3 0.2 5.8 18.1 5.4 15.1 3.4 21.6 13.7 31.0 30.2 6.4 13.3 1898.8 1268.2 630.6
Germany 2662.1 1234.1 1427.9 8.6 9.8 9.0 2.5 2.0 0.2 9.8 12.9 26.3 25.8 9.3 10.0 1484.2 674.3 809.9
South Korea 2384.0 1656.6 727.3 11.9 23.0 22.3 19.3 20.2 20.1 15.2 11.7 6.3 9.3 7.7 13.9 1060.1 763.4 296.7
Japan 3319.9 2583.9 736.0 -8.7 -3.2 -4.3 -3.8 -2.9 -4.9 1.4 8.2 7.9 7.5 -0.8 1.9 3507.5 2806.4 701.1
Developing Countries
Brazil 202.2 95.3 106.9 31.4 20.9 27.6 22.6 23.7 30.6 28.2 17.9 31.6 4.0 151.9 -15.4 64.0 10.8 53.2
Russia 209.4 6.1 203.3 52.5 38.4 -
36.5 26.1 -
74.6 30.0 -
26.8 39.3 46.8 47.8 -30.4 33.4 65.8 33.2 32.6
Taiwan 2628.0 2165.7 462.3 20.3 2.7 5.9 0.9 13.7 7.7 42.3 8.1 13.5 8.2 21.6 8.1 1088.5 760.9 327.6
Hong Kong 3373.2 3031.9 341.3 23.4 2.9 11.0 0.0 17.5 -0.4 27.0 -4.5 19.9 1.0 -0.9 16.8 1545.2 1249.7 295.5
Malaysia 332.1 221.5 110.6 17.1 7.4 0.6 8.1 12.4 6.8 19.7 2.3 17.8 10.0 -8.3 15.3 198.3 129.5 68.8
Singapore 2776.0 2244.7 531.2 38.9 55.7 1.6 -13.0 7.2 7.3 14.1 14.1 78.1 6.6 2.4 22.3 959.0 713.2 245.8
Thailand 129.7 70.8 58.9 18.0 17.8 9.9 12.6 7.5 7.5 -2.3 49.6 23.5 19.5 23.5 16.7 53.9 34.1 19.8
South Africa 878.5 719.0 159.5 3.4 -0.4 24.6 2.6 2.3 10.8 14.5 31.3 32.2 65.7 -4.4 -6.2 446.3 377.2 69.1
Australia 3000.2 1674.1 1326.1 20.5 11.3 1.6 -0.9 6.3 1.4 13.8 30.1 11.8 31.1 -2.9 10.7 1668.3 1040.3 628.0
PR China 69.9 44.2 25.5 29.6 31.4 11.8 22.8 11.7 22.5 8.8 15.2 30.7 17.9 57.4 21.8 20.0 12.2 7.8
South Asia
India 46.6 40.4 6.2 21.7 19.2 81.4 18.2 16.6 10.0 21.7 14.3 10.3 16.7 28.6 25.0 11.5 9.1 2.4
Sri Lanka 24.9 10.2 14.7 20.0 14.8 23.2 36.2 11.3 19.0 17.0 9.7 17.8 18.0 4.7 13.0 9.7 4.3 5.4
Pakistan 6.5 2.6 3.9 13.0 8.3 21.1 28.6 26.7 27.3 36.4 22.2 10.0 5.9 -16.7 13.3 2.7 1.2 1.5
Bangladesh 2.9 1.9 0.9 5.6 12.5 5.9 0.0 13.3 0.0 7.1 14.3 40.0 16.7 0.0 0.0 1.6 1.0 0.6
World 607.7 358.1 249.6 8.3 11.3 10.4 2.4 2.7 -0.5 9.1 8.6 8.0 15.3 5.2 10.9 393.3 235.0 158.3
Source: Compiled from the data in Swiss Re, Sigma various volumes Note: * Insurance density is measured as ratio of premium (in US Dollar) to total population
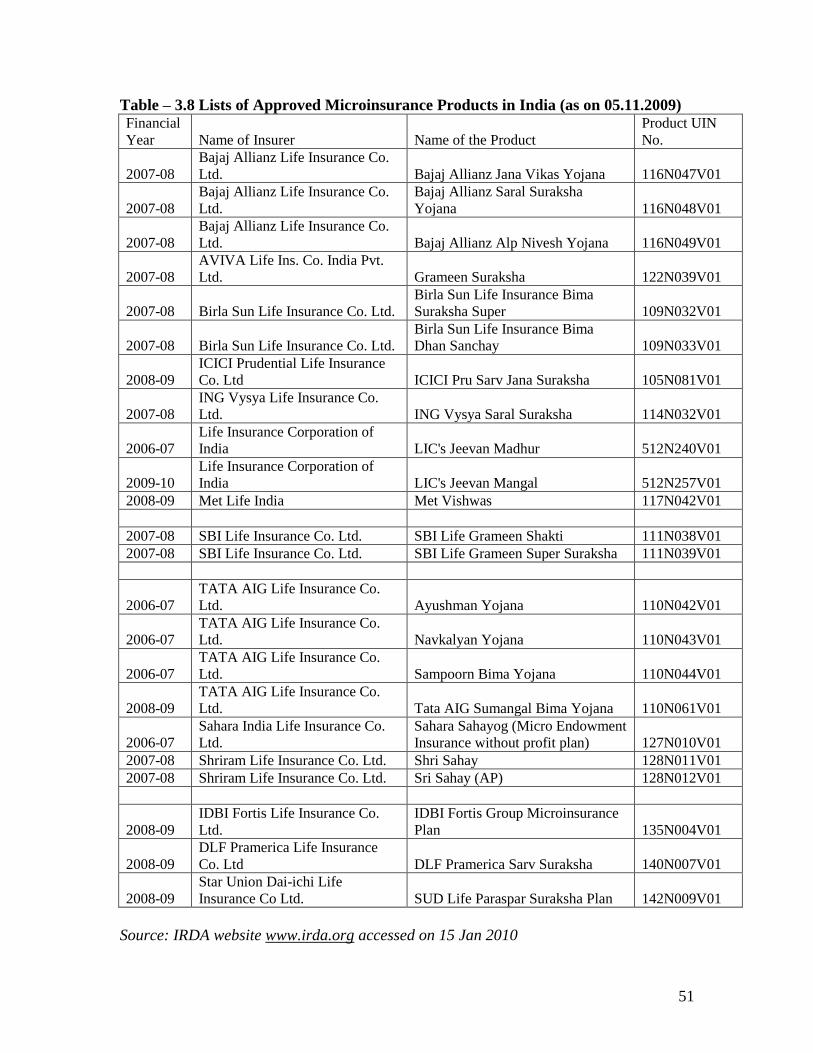
51
Table – 3.8 Lists of Approved Microinsurance Products in India (as on 05.11.2009) Financial
Year Name of Insurer Name of the Product
Product UIN
No.
2007-08
Bajaj Allianz Life Insurance Co.
Ltd. Bajaj Allianz Jana Vikas Yojana 116N047V01
2007-08
Bajaj Allianz Life Insurance Co.
Ltd.
Bajaj Allianz Saral Suraksha
Yojana 116N048V01
2007-08
Bajaj Allianz Life Insurance Co.
Ltd. Bajaj Allianz Alp Nivesh Yojana 116N049V01
2007-08
AVIVA Life Ins. Co. India Pvt.
Ltd. Grameen Suraksha 122N039V01
2007-08 Birla Sun Life Insurance Co. Ltd.
Birla Sun Life Insurance Bima
Suraksha Super 109N032V01
2007-08 Birla Sun Life Insurance Co. Ltd.
Birla Sun Life Insurance Bima
Dhan Sanchay 109N033V01
2008-09
ICICI Prudential Life Insurance
Co. Ltd ICICI Pru Sarv Jana Suraksha 105N081V01
2007-08
ING Vysya Life Insurance Co.
Ltd. ING Vysya Saral Suraksha 114N032V01
2006-07
Life Insurance Corporation of
India LIC's Jeevan Madhur 512N240V01
2009-10
Life Insurance Corporation of
India LIC's Jeevan Mangal 512N257V01
2008-09 Met Life India Met Vishwas 117N042V01
2007-08 SBI Life Insurance Co. Ltd. SBI Life Grameen Shakti 111N038V01
2007-08 SBI Life Insurance Co. Ltd. SBI Life Grameen Super Suraksha 111N039V01
2006-07
TATA AIG Life Insurance Co.
Ltd. Ayushman Yojana 110N042V01
2006-07
TATA AIG Life Insurance Co.
Ltd. Navkalyan Yojana 110N043V01
2006-07
TATA AIG Life Insurance Co.
Ltd. Sampoorn Bima Yojana 110N044V01
2008-09
TATA AIG Life Insurance Co.
Ltd. Tata AIG Sumangal Bima Yojana 110N061V01
2006-07
Sahara India Life Insurance Co.
Ltd.
Sahara Sahayog (Micro Endowment
Insurance without profit plan) 127N010V01
2007-08 Shriram Life Insurance Co. Ltd. Shri Sahay 128N011V01
2007-08 Shriram Life Insurance Co. Ltd. Sri Sahay (AP) 128N012V01
2008-09
IDBI Fortis Life Insurance Co.
Ltd.
IDBI Fortis Group Microinsurance
Plan 135N004V01
2008-09
DLF Pramerica Life Insurance
Co. Ltd DLF Pramerica Sarv Suraksha 140N007V01
2008-09
Star Union Dai-ichi Life
Insurance Co Ltd. SUD Life Paraspar Suraksha Plan 142N009V01
Source: IRDA website www.irda.org accessed on 15 Jan 2010
52
Chapter - 4
Select MFIs and Microinsurance Products in Study Areas
In this section we have analyzed about microinsurance products supplied by select
microfinance institutions (MFIs) and their functioning and experiences in microinsurance
activity in study areas. Here we look at microinsurance from the perspective of
microfinance institutions, which are one of the important microinsurance delivery
channels. By reviewing the profile and experiences of three different MFIs — BISWA in
Orissa and Mahasemam and ASA Gram Vidiyal in Tamil Nadu — we have summarized
their microinsurance activity, performance, agent -partner development process, product
deliver mechanism and other features. Even though these MFIs operate in more or less
similar environments, they have adopted different approaches, which presumably make
sense given their experiences, degree of maturity, and intentions. Insights into the choices
they made, and the reasons for making those choices, may benefit others. In this regard,
comparisons between these MFIs are made wherever possible.
ASA Gram Vidiyal is an older and large MFI that started with its in-house life insurance
scheme with simple benefits and later moved into partner-agent model of microinsurance
with good numbers of professional insurers. On the other hand, BISWA is relatively
younger NGO but offering a range of insurance products (life, health, assets) in
partnership with different insurers. Its objective is to provide comprehensive social
protection to its group members. The third MFI, Mahasema, falls somewhere in between.
It has a long experience with different insurance products using both in-house and
partner-agent models, and now with the advent of Indian regulations that require insurers
to serve the low-income market it appears to have both foot firmly in the partner-agent
camp.
All three MFIs have offered microinsurance fairly longer period to provide valuable
lessons for other microfinance institutions. The main lessons, organized around four
major themes - a) mission, vision and overall performance b) delivery mechanisms; c)
product design and d) constraints in handling microinsurance activity. For this, a brief
53
profile of the three selected MFIs are prepared and presented in this chapter with focus
on their structure, current operation areas and products, insurance and fund partners,
constraints and suggestion about microinsurance which highlight broad picture of
microinsurance in study areas. It will be interesting to observe different priority of
different stakeholders - MFIs (may be to protect their credit first), the insurers (may look
for simpler and easier products to launch to minimize administrative costs) and clients
(may need different products than what are offered to them – almost as compulsory with
their loan).
A. BISWA, (Sambalpur, Orissa)
1. Profile
Name & Location: Bharat Integrated Social Welfare Agency (BISWA), Sambalpur,
Orissa
Type of Institution: NGO – MFI – NBFC
Started as a Philanthropic organization in 1994 in Sambalpur District, Orissa. Registered
in 1995 and entered into MFI since 1996 and adopted SHG Model as a strategy of
intervention. Since then, BISWA adopted the integrated approach (Five pillars) to reach
the masses. Successful partnership with CASHE (Credit And Saving for Household
Enterprises – A Programme of CARE India in 2002 with following basic principles
Integrity, Honesty, Cohesive approach, Team work, Participatory approach, Involvement
of grass-root workers in planning process. Registered under Societies Registration Act
XXI of 1860, Govt.of India vide, Regn No-22060-41 of 2005-06 dated 01.07.2005
(issued against old Regn No-4824-22 of 1995-96 dated 15.07.1995)
Vision: A Just and equitable society with greater emphasis on Social, Economic and
Spiritual well being with peace and compassion.
Mission: To make a real and lasting social, financial, psychological and spiritual impact
on individuals, help build strong cohesive communities and generate substantial
employment opportunities by increasing availability of a wider range of services.
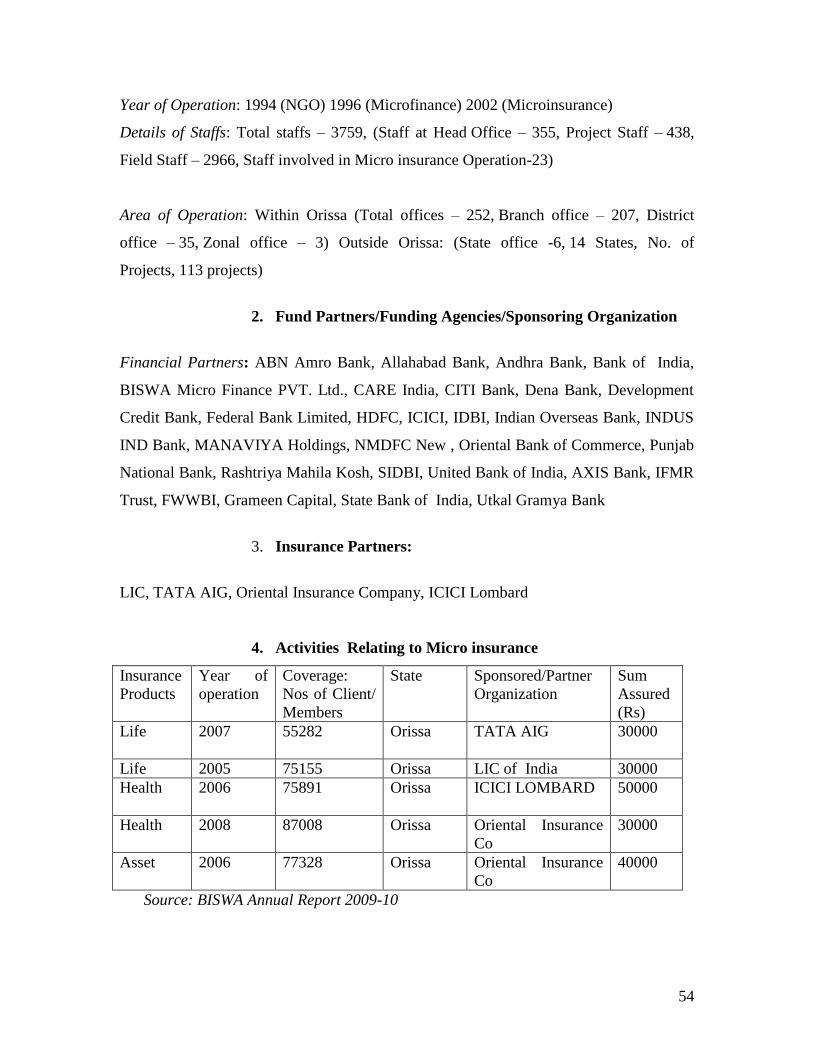
54
Year of Operation: 1994 (NGO) 1996 (Microfinance) 2002 (Microinsurance)
Details of Staffs: Total staffs – 3759, (Staff at Head Office – 355, Project Staff – 438,
Field Staff – 2966, Staff involved in Micro insurance Operation-23)
Area of Operation: Within Orissa (Total offices – 252, Branch office – 207, District
office – 35, Zonal office – 3) Outside Orissa: (State office -6, 14 States, No. of
Projects, 113 projects)
2. Fund Partners/Funding Agencies/Sponsoring Organization
Financial Partners: ABN Amro Bank, Allahabad Bank, Andhra Bank, Bank of India,
BISWA Micro Finance PVT. Ltd., CARE India, CITI Bank, Dena Bank, Development
Credit Bank, Federal Bank Limited, HDFC, ICICI, IDBI, Indian Overseas Bank, INDUS
IND Bank, MANAVIYA Holdings, NMDFC New , Oriental Bank of Commerce, Punjab
National Bank, Rashtriya Mahila Kosh, SIDBI, United Bank of India, AXIS Bank, IFMR
Trust, FWWBI, Grameen Capital, State Bank of India, Utkal Gramya Bank
3. Insurance Partners:
LIC, TATA AIG, Oriental Insurance Company, ICICI Lombard
4. Activities Relating to Micro insurance
Insurance
Products
Year of
operation
Coverage:
Nos of Client/
Members
State Sponsored/Partner
Organization
Sum
Assured
(Rs)
Life
2007 55282 Orissa TATA AIG 30000
Life 2005 75155 Orissa LIC of India 30000
Health
2006 75891 Orissa ICICI LOMBARD 50000
Health 2008 87008 Orissa Oriental Insurance
Co
30000
Asset 2006 77328 Orissa Oriental Insurance
Co
40000
Source: BISWA Annual Report 2009-10
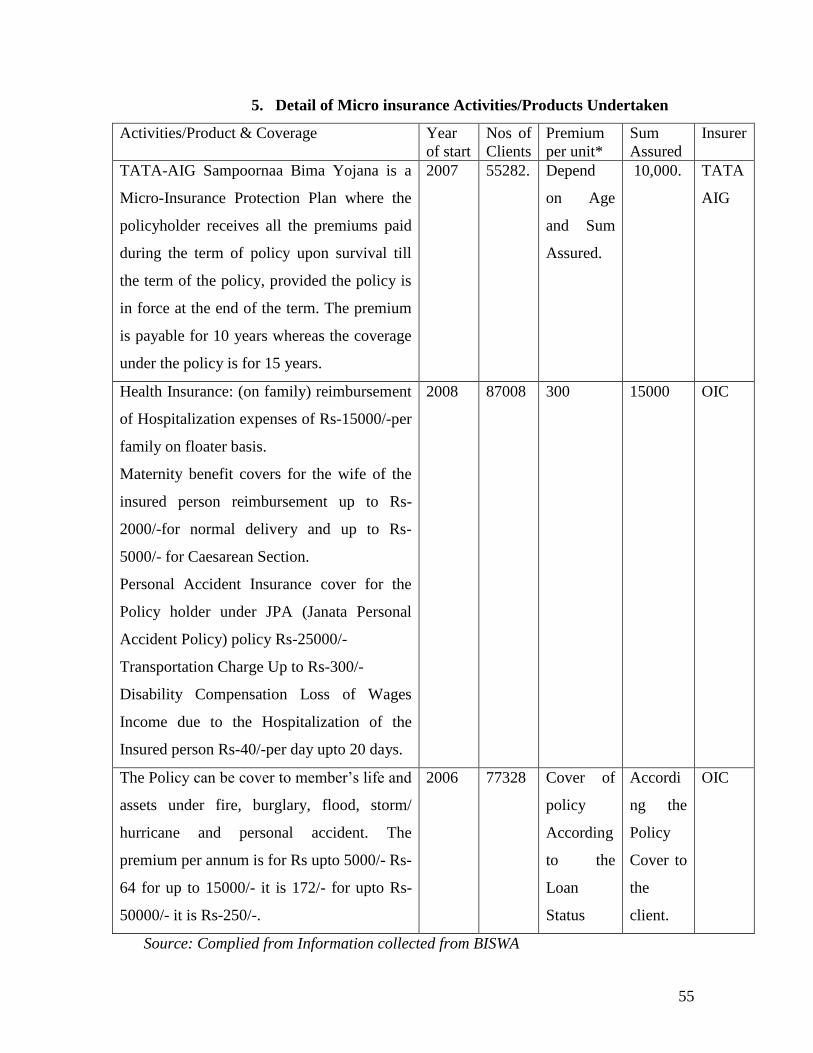
55
5. Detail of Micro insurance Activities/Products Undertaken
Activities/Product & Coverage Year
of start
Nos of
Clients
Premium
per unit*
Sum
Assured
Insurer
TATA-AIG Sampoornaa Bima Yojana is a
Micro-Insurance Protection Plan where the
policyholder receives all the premiums paid
during the term of policy upon survival till
the term of the policy, provided the policy is
in force at the end of the term. The premium
is payable for 10 years whereas the coverage
under the policy is for 15 years.
2007 55282. Depend
on Age
and Sum
Assured.
10,000. TATA
AIG
Health Insurance: (on family) reimbursement
of Hospitalization expenses of Rs-15000/-per
family on floater basis.
Maternity benefit covers for the wife of the
insured person reimbursement up to Rs-
2000/-for normal delivery and up to Rs-
5000/- for Caesarean Section.
Personal Accident Insurance cover for the
Policy holder under JPA (Janata Personal
Accident Policy) policy Rs-25000/-
Transportation Charge Up to Rs-300/-
Disability Compensation Loss of Wages
Income due to the Hospitalization of the
Insured person Rs-40/-per day upto 20 days.
2008 87008 300 15000 OIC
The Policy can be cover to member‘s life and
assets under fire, burglary, flood, storm/
hurricane and personal accident. The
premium per annum is for Rs upto 5000/- Rs-
64 for up to 15000/- it is 172/- for upto Rs-
50000/- it is Rs-250/-.
2006 77328 Cover of
policy
According
to the
Loan
Status
Accordi
ng the
Policy
Cover to
the
client.
OIC
Source: Complied from Information collected from BISWA
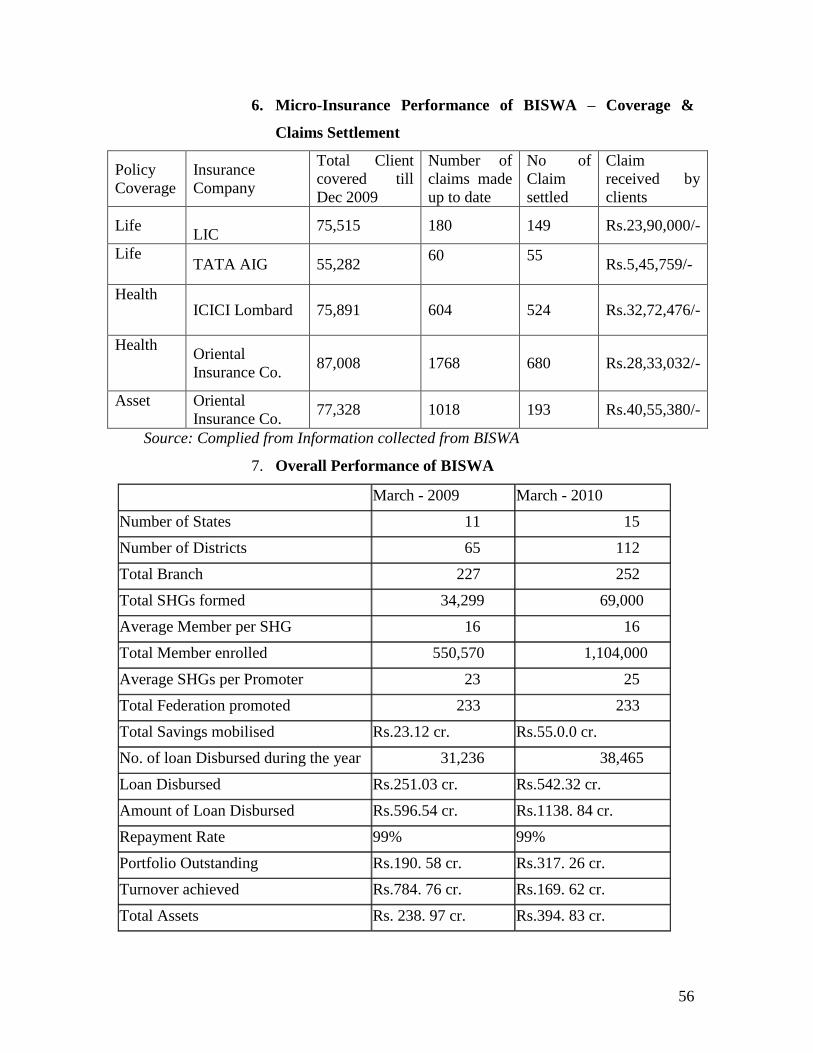
56
6. Micro-Insurance Performance of BISWA – Coverage &
Claims Settlement
Policy
Coverage
Insurance
Company
Total Client
covered till
Dec 2009
Number of
claims made
up to date
No of
Claim
settled
Claim
received by
clients
Life
LIC 75,515 180 149 Rs.23,90,000/-
Life
TATA AIG 55,282
60
55
Rs.5,45,759/-
Health
ICICI Lombard 75,891 604 524 Rs.32,72,476/-
Health Oriental
Insurance Co. 87,008
1768
680 Rs.28,33,032/-
Asset Oriental
Insurance Co. 77,328 1018 193 Rs.40,55,380/-
Source: Complied from Information collected from BISWA
7. Overall Performance of BISWA
March - 2009 March - 2010
Number of States 11 15
Number of Districts 65 112
Total Branch 227 252
Total SHGs formed 34,299 69,000
Average Member per SHG 16 16
Total Member enrolled 550,570 1,104,000
Average SHGs per Promoter 23 25
Total Federation promoted 233 233
Total Savings mobilised Rs.23.12 cr. Rs.55.0.0 cr.
No. of loan Disbursed during the year 31,236 38,465
Loan Disbursed Rs.251.03 cr. Rs.542.32 cr.
Amount of Loan Disbursed Rs.596.54 cr. Rs.1138. 84 cr.
Repayment Rate 99% 99%
Portfolio Outstanding Rs.190. 58 cr. Rs.317. 26 cr.
Turnover achieved Rs.784. 76 cr. Rs.169. 62 cr.
Total Assets Rs. 238. 97 cr. Rs.394. 83 cr.
57
Total Liabilities Rs.189. 32 cr. Rs.332. 59 cr.
Net Worth Rs.49. 64 cr. Rs.62. 24 cr.
8. Observations & Suggestion on Microinsurance (BISWA)
BISWA believes that poor households are especially vulnerable to risk, in both the form
of natural calamities as well as more regular occurrences of illnesses and accidents.
Micro-Finance Institutions (MFIs) have played an active role in reducing and protecting
them against such situations by providing credit for increasing income-earning
opportunities; and by providing savings services to build up resources that can be utilized
in case of emergencies. As one of its development interventions and as a social security
measure, BISWA cover its clients in three major micro-insurance schemes. To BISWA
Micro Insurance means the insurance which their SHG members can easily afford. It is
the SHG members particularly the BPL members suffered the most due to absence of
microinsurance. As a social security measure it has paid great dividend. Many BISWA
SHG members have been benefited from three different microinsurance products as given
below available to the group members along with group loan.
I. Life insurance ( from LIC and TATA-AIG),
II. Health insurance (from ICICI-Lombard and Oriental Insurance Company Ltd.),
III. Assets insurance (from Oriental Insurance Company Ltd.).
Name of the insurance products are Janashree Bima Yojana (life) of LIC, Nabakalyan
and Sampoorna Bima Yojana with TATA-AIG (life), Health insurance from ICICI
Lombard and Oriental Insurance Company and Asset insurance from Oriental Insurance
Company. The target clients are mainly SHG members promoted by BISWA both loanee
and non-loanee groups spread across BISWA‘s operational area and about 40% of total
members are already covered.
Health Insurance: BISWA in collaboration with Oriental Insurance Company Limited
has launched health insurance scheme in October 2007. Premium is Rs.325/- per annum
and coverage is Rs. 15,000/ for a maximum of 4 persons (member & 3 specified
nominees). Besides, there is provision of Rs.300/- maximum per year as transportation
allowance and a maximum of Rs.800/- per year as subsistence allowance for the insured
member in case of hospitalization only. Since beginning, leaflets in Oriya have been
58
prepared and widely circulated among the members for better awareness and proper data
collection.
Assets Insurance: It has become very common that poor people are badly affected by
natural calamities every year. Hence, it is very much important to cover their assets under
insurance in order to meet financial loss. Hence BISWA is also covering them under its
various asset insurance policies such as Live Stock Insurance, Kishan Package Policy,
Janata Personal Accident Policy.
Claim Settlement: As a microinsurance partner, BISWA has given priority for the
settlement of claims in all Insurance Schemes. In the case of death claims, LIC has settled
149 claims and TATA AIG has settled 55 claims till December 2009. In health insurance
claims ICICI Lombard has settled 524 claims and Oriental Insurance settled 668 claims.
In asset insurance Oriental Insurance has settled 163 claims. Usually the insurance claims
are processed by BISWA and negotiated with the respective Insurance Companies for
settlement. As per the norms of the Insurance Companies, the claim amount is either
directly given to the client‘s nominee or upon receipt, BISWA hands over the amount to
the respective nominee.
Other Programmes on Micro Insurance: Under Janashree Bima Yojana (JBY) of LIC
455 students are been awarded scholarship of Rs. 240500.
Bima Village: In another effort to provide Insurance to the poor at the doorstep four
villages have been declared as Bima Villages. Every household of these villages has been
covered with a Life Insurance Policy. The names of the villages are: Matikhai,
Kankudipali and Balaranga of Sambalpur District and Rangamatia of Bargarh District. To
make insurance popular campaign for insurance products among poor are conducted on
monthly basis in different district offices of BISWA.
Loan for Insurance Premium: All members who avails a loan from BISWA got
insurance cover as applicable. At the time of loan disbursement the premium amount of
the selected Insurance for one year is usually collected and deposited with BISWA for
onward transfer to the respective Insurance Companies. Any member unable to pay
premium can avail credit for premium with same terms and conditions as the group loan.
Training: BISWA staff are given training on the Insurance products which is conducted
by the concerned Insurance Companies and the trained staff in turn creates awareness
59
among the members about Insurance products. This orientation is done prior to the
disbursement of loan.
Major constraints, Issues and Suggestions Relating to Micro insurance
i. Life Insurance:
Constraints:
Service tax on Micro Insurance Life product.
No grace period of renewal payment in case the policy gets lapsed.
The Insurers accept the policy proposal with certain age proof or without any age
proof but while settling the claim they ask for standard age proof or reject the
claims on the ground of non disclosure of correct age.
Suggestions:
Service tax should be waived off in Micro-insurance product
The policy should be allowed for minimum 5 years once premium is paid. The
claims may be settled (in the period when premium is not paid) after deducting
the premium and interest. The policy gets lapsed in most cases due to non-
service, migration, non-regular cash flow & awareness etc.
If Insurance companies are not satisfied with the age proof then they should not
issue the policy. Once it is issued they should not insist on standard age proof.
Certification by the Sarpanch or the SHG members should be acceptable.
ii. Health Insurance
Constraints:
Health Insurance premium is non-refundable.
Authenticity of Documents submitted questioned and claims rejected i.e. admit
and discharge summary, first prescription, medicine, lab test bills along with
transport details.
Claims are rejected on the ground pre-existence of the disease vary from insurers.
The insurance company insists the patient should be under health policy of the
same insurance company at the time of identification of the disease.
60
Any claim is admissible for settlement if the patient is admitted for a period of
more than 24 hours.
Suggestions:
It discourages clients as customer regularly renew the policy after five years does
not get back anything if there is no claim. At least 50% of the premium should be
refunded.
Insurers should consider authenticity of the SHG report of the disease of the
concerned member for quick settlement.
The insurance company should accept it if the pre-existence diseases happen
under any insurance company should not reject the claim. The doctor‘s report
should not constitute the only base of the exact occurrence of the disease since
due to ignorance the patient may not mention the exact timing of occurrence of
the disease.
Claims should be admitted for less than 24 hours of hospitalization, all medicine,
other expenses of (OPD/clinics without facilities for hospitalization/ ayurvedic
doctors/ homeopathy doctors/ village quacks/RMPs etc) if found genuine.
iii. Asset Insurance
Certification or documentation of claim or loss, high transaction on cost and delay
in claim settlement
Suggestions:
Village Sarpanch/Samiti Member/ School Teachers/ Representative of NGOs
certificate should be considered along with photo proof. Time to submit FIR to
insurance companies should be increased to 72 hours instead of 24 hours. NGOs
should be given power to some extent to settle claims.
61
B. Mahasemam, (Madurai, Tamil Nadu)
1. Profile
Name & Location: Mahasemam, Madurai, Tamil Nadu
Type of Institution: NGO/Trust – MFI- NBFC
In 1997‚ Mahasemam trust was established with the aim of helping the women to attain
financial sufficiency and stability helping a poverty free life with the family. Today‚
Mahasemam Trust is one of the fastest growing microfinance organizations in the state‚
actively undertaking the poverty alleviation efforts through the coordinated and
disciplined women centric work culture. Mahasemam provides loans to poor women for
various income generation activities‚ trains them in basic marketing skills to equip them,
harness their skills and supports them to start livelihood projects of their choice to
generate a steady income for her family. This multi-pronged focused approach for
helping the poor‚ which have shown unbelievable results in poverty alleviation and
creating sustainable livelihood opportunity for the members. Micro Credit Rating
International Ltd. (M-CRIL) has rated Mahasemam as the Beta + microfinance
institution. Mahasemam works towards empowering poor women to become self
sufficient by providing innovative and sustainable financial services with following
objectives:
Vision & Mission:
- To empower women by improving their social and economic status.
- To strengthen and increase women‘s saving and credit through Grameen Group
model.
- To improve and develop viable income generating activities and to train the
women in entrepreneurships.
- To provide health services to tackle the health issues of women and community.
- To instill positive attitude among men towards women and to encourage them to
accept women in new roles
Year of Operation: 1997(Trust), June 2000 (Microinsurance), Registration April 2000
Details of Staffs: Operation staffs (1100), Supervisor & Auditor (175), Managers (42),
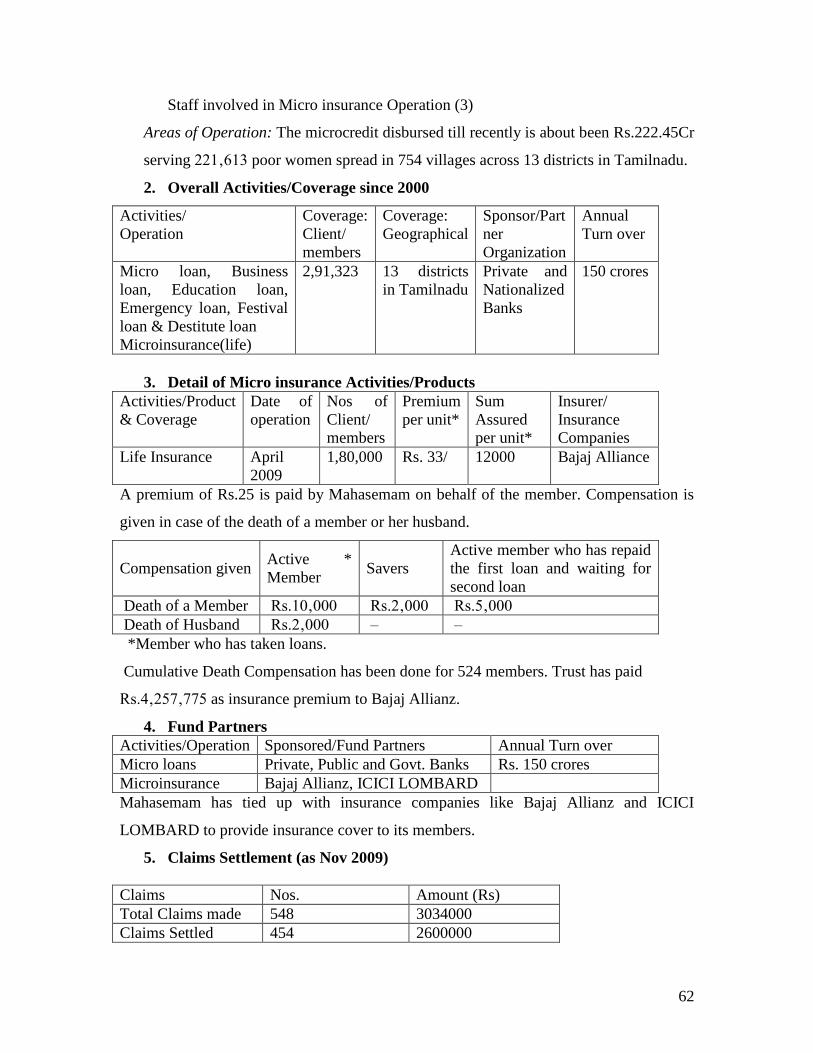
62
Staff involved in Micro insurance Operation (3)
Areas of Operation: The microcredit disbursed till recently is about been Rs.222.45Cr
serving 221‚613 poor women spread in 754 villages across 13 districts in Tamilnadu.
2. Overall Activities/Coverage since 2000
Activities/
Operation
Coverage:
Client/
members
Coverage:
Geographical
Sponsor/Part
ner
Organization
Annual
Turn over
Micro loan, Business
loan, Education loan,
Emergency loan, Festival
loan & Destitute loan
Microinsurance(life)
2,91,323 13 districts
in Tamilnadu
Private and
Nationalized
Banks
150 crores
3. Detail of Micro insurance Activities/Products
Activities/Product
& Coverage
Date of
operation
Nos of
Client/
members
Premium
per unit*
Sum
Assured
per unit*
Insurer/
Insurance
Companies
Life Insurance
April
2009
1,80,000 Rs. 33/ 12000 Bajaj Alliance
A premium of Rs.25 is paid by Mahasemam on behalf of the member. Compensation is
given in case of the death of a member or her husband.
Compensation given Active *
Member Savers
Active member who has repaid
the first loan and waiting for
second loan
Death of a Member Rs.10‚000 Rs.2‚000 Rs.5‚000
Death of Husband Rs.2‚000 – –
*Member who has taken loans.
Cumulative Death Compensation has been done for 524 members. Trust has paid
Rs.4‚257‚775 as insurance premium to Bajaj Allianz.
4. Fund Partners
Activities/Operation Sponsored/Fund Partners Annual Turn over
Micro loans Private, Public and Govt. Banks Rs. 150 crores
Microinsurance Bajaj Allianz, ICICI LOMBARD
Mahasemam has tied up with insurance companies like Bajaj Allianz and ICICI
LOMBARD to provide insurance cover to its members.
5. Claims Settlement (as Nov 2009)
Claims Nos. Amount (Rs)
Total Claims made 548 3034000
Claims Settled 454 2600000
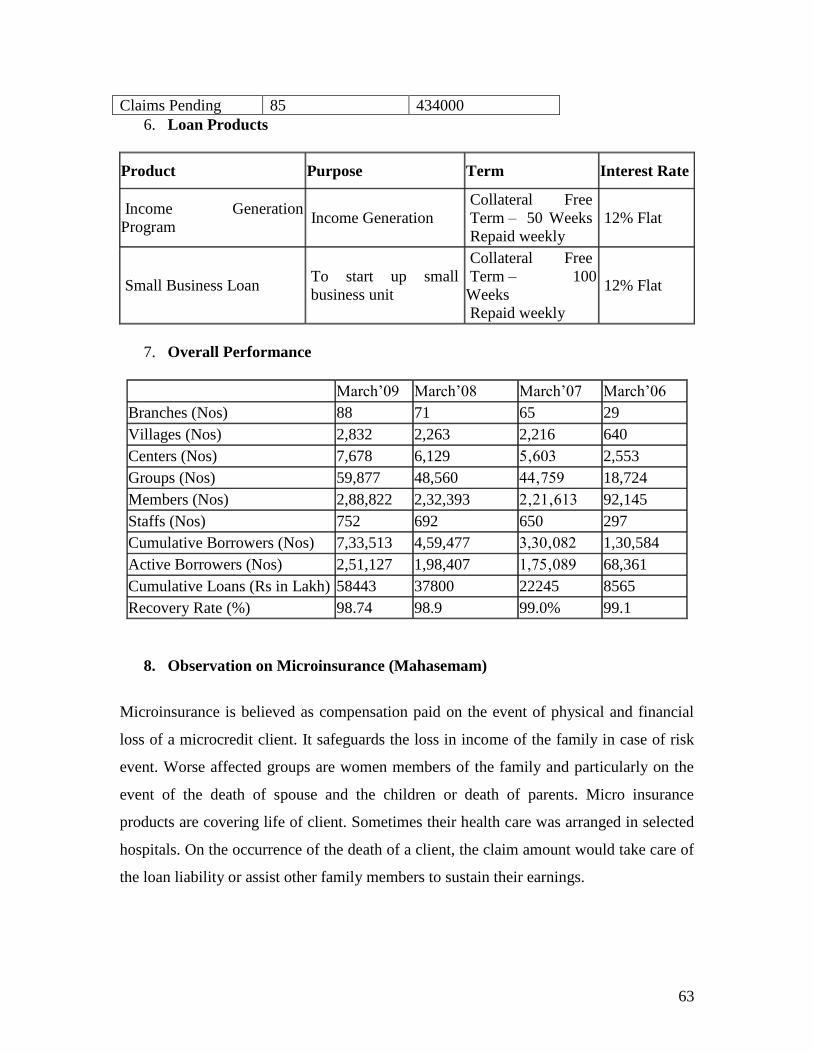
63
Claims Pending 85 434000
6. Loan Products
Product Purpose Term Interest Rate
Income Generation
Program Income Generation
Collateral Free
Term – 50 Weeks
Repaid weekly
12% Flat
Small Business Loan To start up small
business unit
Collateral Free
Term – 100
Weeks
Repaid weekly
12% Flat
7. Overall Performance
March‘09 March‘08 March‘07 March‘06
Branches (Nos) 88 71 65 29
Villages (Nos) 2,832 2,263 2,216 640
Centers (Nos) 7,678 6,129 5‚603 2,553
Groups (Nos) 59,877 48,560 44‚759 18,724
Members (Nos) 2,88,822 2,32,393 2‚21‚613 92,145
Staffs (Nos) 752 692 650 297
Cumulative Borrowers (Nos) 7,33,513 4,59,477 3,30‚082 1,30,584
Active Borrowers (Nos) 2,51,127 1,98,407 1,75‚089 68,361
Cumulative Loans (Rs in Lakh) 58443 37800 22245 8565
Recovery Rate (%) 98.74 98.9 99.0% 99.1
8. Observation on Microinsurance (Mahasemam)
Microinsurance is believed as compensation paid on the event of physical and financial
loss of a microcredit client. It safeguards the loss in income of the family in case of risk
event. Worse affected groups are women members of the family and particularly on the
event of the death of spouse and the children or death of parents. Micro insurance
products are covering life of client. Sometimes their health care was arranged in selected
hospitals. On the occurrence of the death of a client, the claim amount would take care of
the loan liability or assist other family members to sustain their earnings.
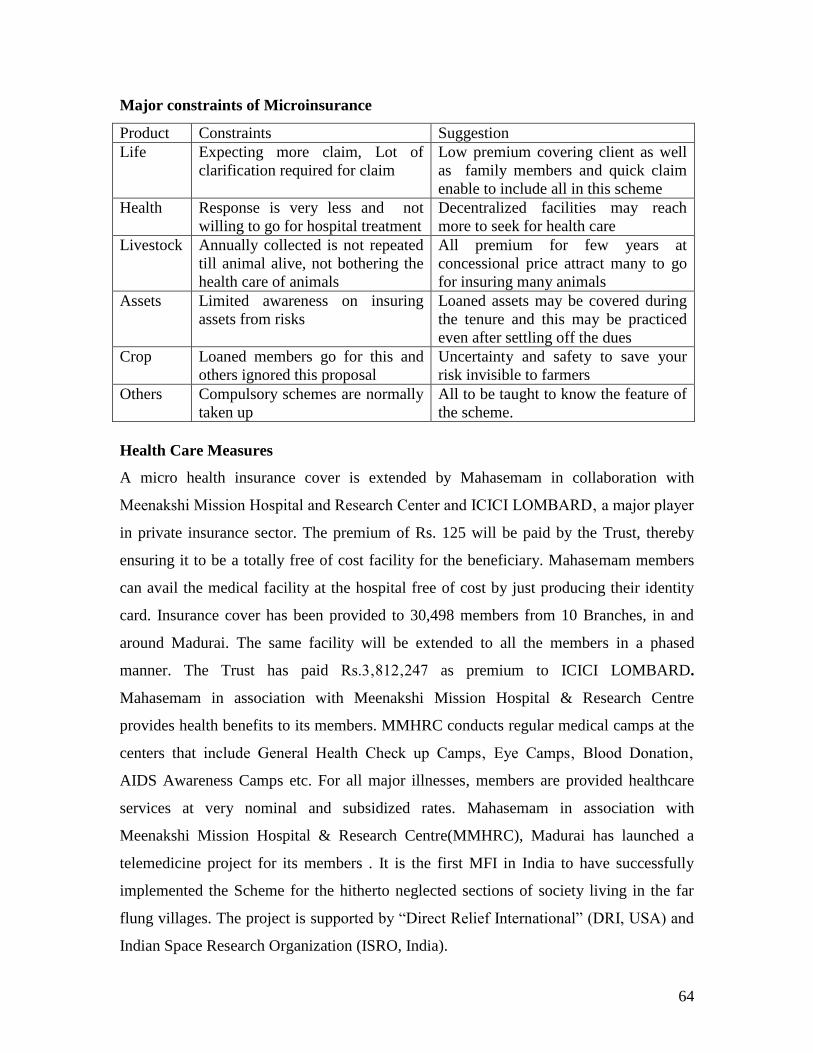
64
Major constraints of Microinsurance
Product Constraints Suggestion
Life
Expecting more claim, Lot of
clarification required for claim
Low premium covering client as well
as family members and quick claim
enable to include all in this scheme
Health
Response is very less and not
willing to go for hospital treatment
Decentralized facilities may reach
more to seek for health care
Livestock
Annually collected is not repeated
till animal alive, not bothering the
health care of animals
All premium for few years at
concessional price attract many to go
for insuring many animals
Assets
Limited awareness on insuring
assets from risks
Loaned assets may be covered during
the tenure and this may be practiced
even after settling off the dues
Crop
Loaned members go for this and
others ignored this proposal
Uncertainty and safety to save your
risk invisible to farmers
Others Compulsory schemes are normally
taken up
All to be taught to know the feature of
the scheme.
Health Care Measures
A micro health insurance cover is extended by Mahasemam in collaboration with
Meenakshi Mission Hospital and Research Center and ICICI LOMBARD‚ a major player
in private insurance sector. The premium of Rs. 125 will be paid by the Trust, thereby
ensuring it to be a totally free of cost facility for the beneficiary. Mahasemam members
can avail the medical facility at the hospital free of cost by just producing their identity
card. Insurance cover has been provided to 30,498 members from 10 Branches, in and
around Madurai. The same facility will be extended to all the members in a phased
manner. The Trust has paid Rs.3‚812‚247 as premium to ICICI LOMBARD.
Mahasemam in association with Meenakshi Mission Hospital & Research Centre
provides health benefits to its members. MMHRC conducts regular medical camps at the
centers that include General Health Check up Camps‚ Eye Camps‚ Blood Donation‚
AIDS Awareness Camps etc. For all major illnesses, members are provided healthcare
services at very nominal and subsidized rates. Mahasemam in association with
Meenakshi Mission Hospital & Research Centre(MMHRC), Madurai has launched a
telemedicine project for its members . It is the first MFI in India to have successfully
implemented the Scheme for the hitherto neglected sections of society living in the far
flung villages. The project is supported by ―Direct Relief International‖ (DRI, USA) and
Indian Space Research Organization (ISRO, India).
65
C. ASA Gram Vidiyal, (Tiruchirapally)
1. Profile
Name & Location: - ASA Gram Vidiyal, Tiruchirapally, Tamil Nadu
Type of Institution: Trust – MFI – NBFC
Grama Vidiyal is a microfinance institution that provides, collateral-free loans to women
without access to formal credit, thus facilitating the economic, social and political
empowerment of these women and their families. Grama Vidiyal‘s parent organisation,
Activists for Social Alternatives (ASA) is a public charitable trust founded in 1986. It has
been in existence as a Public Charitable Trust since 1996. It received the Non Banking
Financial Company Licence in February 2007 and transformed itself in January 2008.
It has provided small loans to poor women who do not have much access to formal credit.
Later, it started offering a range of financial products to its members. Its success during
last one and half decade has helped and to transform it from a charitable trust to a
regulated Non-Bank Financial Company (NBFC). After becoming a NBFC, Grama
Vidiyal has achieved an accelerated outreach in microfinance field.
Vision: Free, Productive, Prosperous, Humane and Sustainable "Grama Vidiyal" Family
Mission: To empower women of the poorest families socially, economically and
politically through networking them into community institutions and through efficient
poverty alleviation and microfinance programme.
Year of Operation: 1996 (Trust) 2007 (NBFC) - Grama Vidiyal Micro Finance Private
limited GVMF(P)L, 1993 (Microinsurance – at own initiative)
Details of Staffs: Total staff – 3759 (Staffs at Head Office – 355, Project Staff – 438,
Field Staff – 2966, Staff involved in Micro insurance Operation-23)
Area of Operation: Total 408685 members, 154 branches operated in 21 districts of
Tamilnadu and Puducherry.
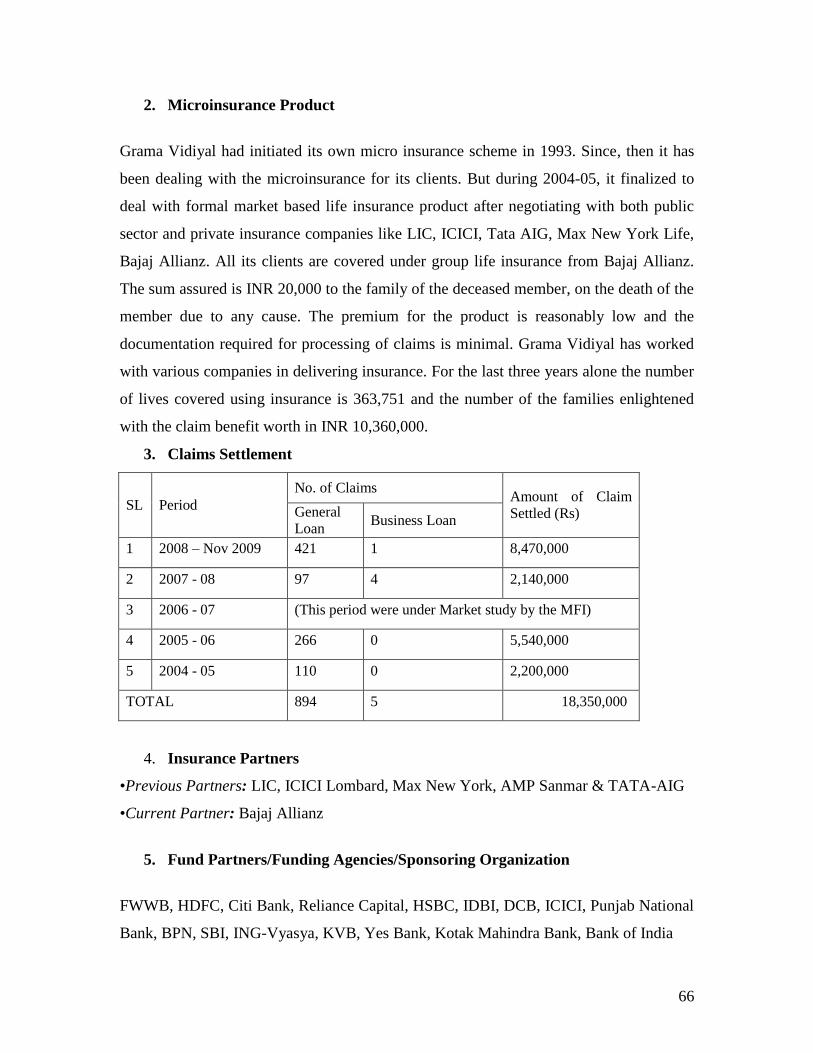
66
2. Microinsurance Product
Grama Vidiyal had initiated its own micro insurance scheme in 1993. Since, then it has
been dealing with the microinsurance for its clients. But during 2004-05, it finalized to
deal with formal market based life insurance product after negotiating with both public
sector and private insurance companies like LIC, ICICI, Tata AIG, Max New York Life,
Bajaj Allianz. All its clients are covered under group life insurance from Bajaj Allianz.
The sum assured is INR 20,000 to the family of the deceased member, on the death of the
member due to any cause. The premium for the product is reasonably low and the
documentation required for processing of claims is minimal. Grama Vidiyal has worked
with various companies in delivering insurance. For the last three years alone the number
of lives covered using insurance is 363,751 and the number of the families enlightened
with the claim benefit worth in INR 10,360,000.
3. Claims Settlement
SL Period
No. of Claims Amount of Claim
Settled (Rs) General
Loan Business Loan
1 2008 – Nov 2009 421 1 8,470,000
2 2007 - 08 97 4 2,140,000
3 2006 - 07 (This period were under Market study by the MFI)
4 2005 - 06 266 0 5,540,000
5 2004 - 05 110 0 2,200,000
TOTAL 894 5 18,350,000
4. Insurance Partners
•Previous Partners: LIC, ICICI Lombard, Max New York, AMP Sanmar & TATA-AIG
•Current Partner: Bajaj Allianz
5. Fund Partners/Funding Agencies/Sponsoring Organization
FWWB, HDFC, Citi Bank, Reliance Capital, HSBC, IDBI, DCB, ICICI, Punjab National
Bank, BPN, SBI, ING-Vyasya, KVB, Yes Bank, Kotak Mahindra Bank, Bank of India
67
6. Loan Activity:
General Loan:
The General Loan currently comprises about 80% of Grama Vidiyal‘s total loan
portfolio. These are small, collateral free loans offered to women entrepreneurs. The
loans are disbursed to women federated in groups of 5 or more, with the other members
serving as guarantors. Repayments for the loans are made at weekly centre meetings,
facilitated by field managers. General loans range in size from Rs. 5,000 to Rs. 15,000.
Seasonal Loan:
Grama Vidiyal provides Seasonal Loans to members who already have a General Loan
outstanding and have a history of regular and prompt repayment and regular centre
meeting attendance. These loans are offered at times of school admissions and festivals.
Seasonal Loans of Rs.1,000 to 2,000 are offered. The Seasonal Loan business is a small
part of Grama Vidiyal‘s operations, comprising only 7 to 10% of the outstanding loan
portfolio.
Business Loan:
After providing financial services to entrepreneurial women for more than a decade,
many members had stabilized and grown their businesses to a great extent. To meet the
needs of these clients, Grama Vidiyal launched another loan product – the Business Loan.
Business Loans are offered to members with at least two years of repayment history. The
Business Loan is an individual loan and does not require the guarantee of other group
members, but does require a more extensive application in which the business concept,
cash flows, and profitability of the business activity is considered. A two year or one year
loan will be offered depending upon client‘s repayment capacity. Size of business Loans
ranges from Rs.25,000 to Rs.50,000. These loans currently make up 7 to 10% of the total
loan portfolio.
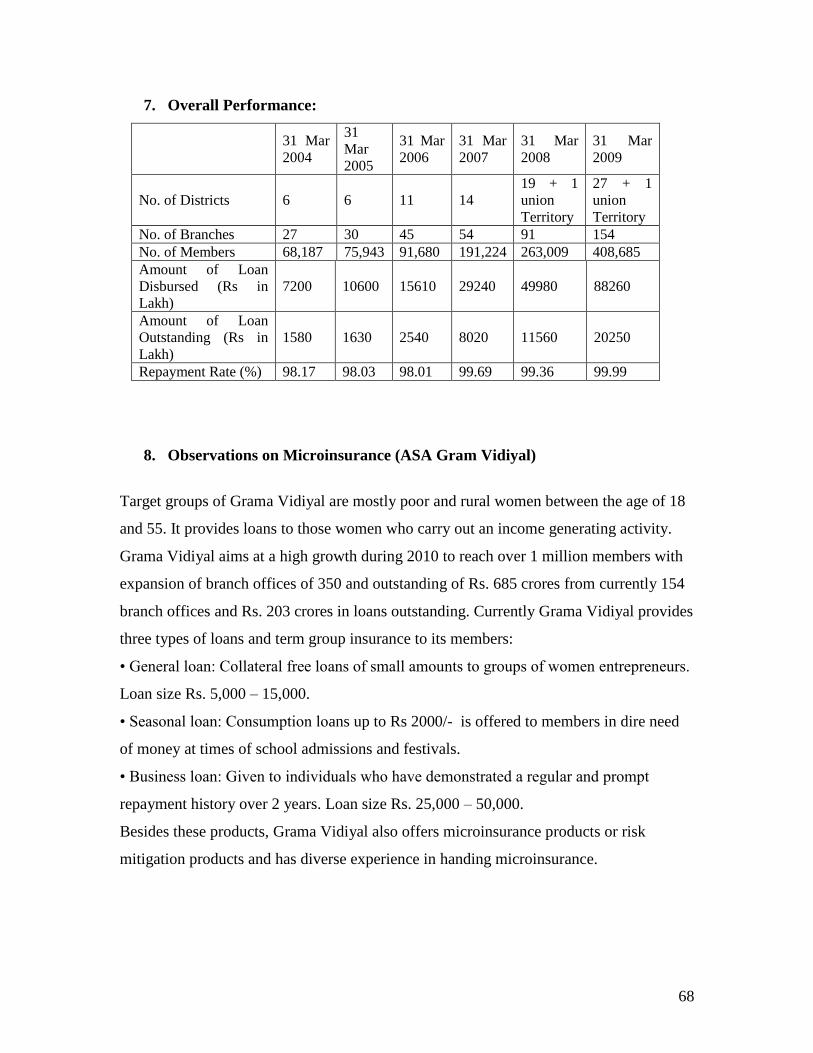
68
7. Overall Performance:
31 Mar
2004
31
Mar
2005
31 Mar
2006
31 Mar
2007
31 Mar
2008
31 Mar
2009
No. of Districts 6 6 11 14
19 + 1
union
Territory
27 + 1
union
Territory
No. of Branches 27 30 45 54 91 154
No. of Members 68,187 75,943 91,680 191,224 263,009 408,685
Amount of Loan
Disbursed (Rs in
Lakh)
7200 10600 15610 29240 49980 88260
Amount of Loan
Outstanding (Rs in
Lakh)
1580 1630 2540 8020 11560 20250
Repayment Rate (%) 98.17 98.03 98.01 99.69 99.36 99.99
8. Observations on Microinsurance (ASA Gram Vidiyal)
Target groups of Grama Vidiyal are mostly poor and rural women between the age of 18
and 55. It provides loans to those women who carry out an income generating activity.
Grama Vidiyal aims at a high growth during 2010 to reach over 1 million members with
expansion of branch offices of 350 and outstanding of Rs. 685 crores from currently 154
branch offices and Rs. 203 crores in loans outstanding. Currently Grama Vidiyal provides
three types of loans and term group insurance to its members:
• General loan: Collateral free loans of small amounts to groups of women entrepreneurs.
Loan size Rs. 5,000 – 15,000.
• Seasonal loan: Consumption loans up to Rs 2000/- is offered to members in dire need
of money at times of school admissions and festivals.
• Business loan: Given to individuals who have demonstrated a regular and prompt
repayment history over 2 years. Loan size Rs. 25,000 – 50,000.
Besides these products, Grama Vidiyal also offers microinsurance products or risk
mitigation products and has diverse experience in handing microinsurance.
69
Diverse Experience of the Gram Vidiyal (GV) in Micro-Insurance:
GV has diverse of experiences in microinsurance over one and half decade.
I. 1993-1997: Rs 10 for the first 1000 rupees of every loan and Rs. 5 for every
additional 1000 was deducted as a proxy for premium for insurance of the
borrowed members. In case of eventuality Rs. 500 was paid to meet funeral
expenses on the same day to the family of the deceased member.
II. 1997-2000: Capital insurance payment Rs. 500 was collected, which is refundable
(or) Premium Payment Rs. 50 was collected per annum for a coverage of Rs. 5000
per member in case of natural death or accidental death
III. 2000-01: Capital insurance payment Rs. 500 was collected, which is,
refundable (or) Premium Payment was raised to Rs. 60 per annum for insurance
cover of Rs.5000 (In-house) in case of natural death and for an accident policy of
Rs.25000 (Linked with United India Insurance – for a premium of Rs. 15)
Experience With Public Sector Insurer: LIC
LIC – JBY Scheme (Jan 2001- May 2002)
Coverage: SHG members
Policy Term: One Year
Premium Payment: Rs. 100
Government contribution: Rs. 100
Age : 18- 60 Years
Sum Assured : Natural death – Rs.20000
: Accidental death – Rs.50000
: Partial Disabilities- Rs. 25000
: Total Disabilities - Rs. 50000
Major Constraints with LIC: Insisting on cumbersome process of handing insurance such
as manual document (individual signature), lengthy documentation (death certificate,
copy of FIR from Police station, identity proof ), delay in claim settlement, not covering
past diseases, mode of payment: (payment through Bank only) and non-coverage of
common events (suicide, snake bite, drowned in the well, mortality during the pregnancy)
were major constraints with LIC.
70
Partnership model (ASA-UIIC, ICICI Lombard) Jan 2002 to June 2002
Premium Payment :Rs. 100 (Premium payment to company Rs. 27.25 + Premium in
house coverage Rs. 72.75)
Age : 18- 60 Yrs
Coverage : Natural death– Rs.20,000/- by (in-house policy of Gram Vidiyal)
: Accidental death – Rs.50,000 by General Insurance Company
: 1100 members
: Manual Documentation – with client signature
Major Constraints with Partnership Model: Life Insurance was done in-house – 20000
members, More death occurred of natural causes, Possibilities for death caused by
accident are very low in rural areas, Insurance does not covered causes such as suicide,
snake bite, and drowned in the well,
In House Insurance Model (July 2002- Feb 2003)
Premium Payment :Rs. 100
Age : 18- 60 Yrs
Coverage : Natural death & Accident Death – Rs.20,000 by ASA
Feature : No need death certificate , Member‘s declaration enough
: Within a week time sum assured amount settled
: 20 Claims settled by ASA with total amount Rs. 400,000
Negotiated with Insurers
Insurers Premium per person (Rs)
Birla Sunlife :Rs. 90-156 (Age based )
HDFC Standard : Rs. 180
ICICI prudential : Rs. 200
ING Vysya : No response
Max New York Life : Rs.70.40
Om Kotak Mahindra : Rs.144
SBI Life : Rs.36
Met Life : RS.72
TATA AIG : Rs.72-180 ( Age based)
Allianz Bajaj : Rs.36
AMP Sanmar :Rs.36
Dabur Aviva : No response
It was finalized with Allianz Bajaj because of low premium of Rs. 36 for Sum
Assured of Rs. 20,000. A strong negotiation, regular communication, simplified and
minimum claim settlement procedure and support services (staff training) are the
merits to select this insurance over others.
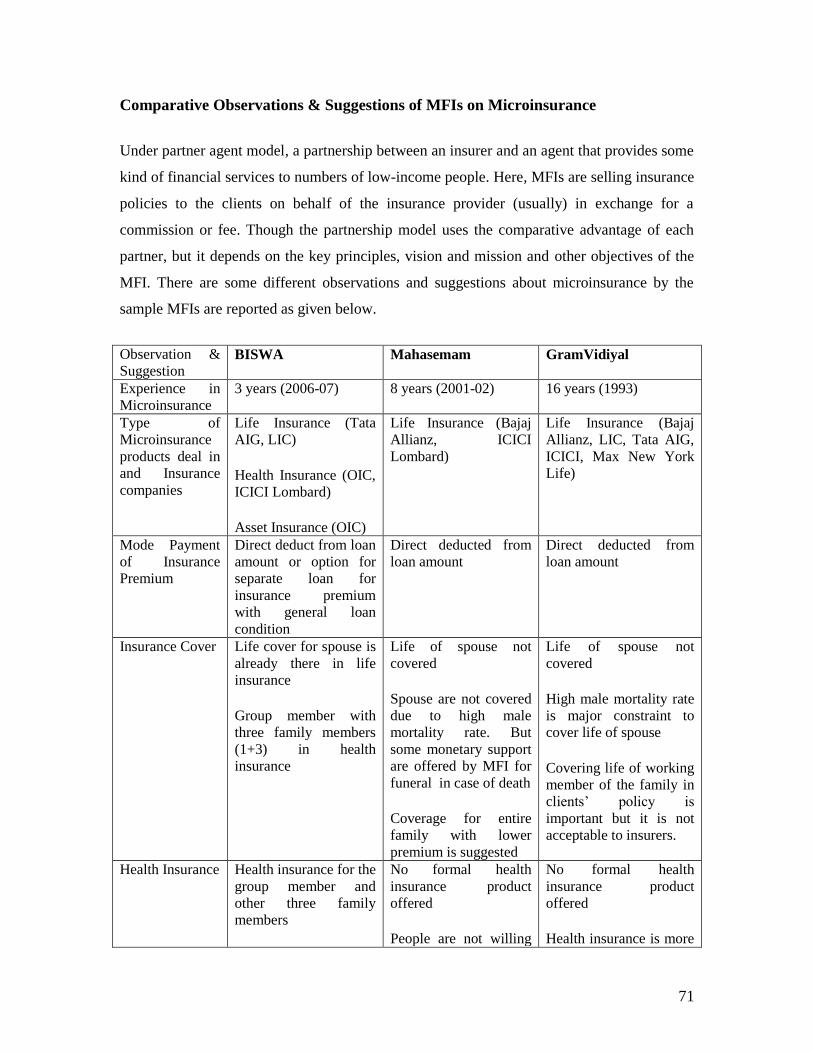
71
Comparative Observations & Suggestions of MFIs on Microinsurance
Under partner agent model, a partnership between an insurer and an agent that provides some
kind of financial services to numbers of low-income people. Here, MFIs are selling insurance
policies to the clients on behalf of the insurance provider (usually) in exchange for a
commission or fee. Though the partnership model uses the comparative advantage of each
partner, but it depends on the key principles, vision and mission and other objectives of the
MFI. There are some different observations and suggestions about microinsurance by the
sample MFIs are reported as given below.
Observation &
Suggestion BISWA Mahasemam GramVidiyal
Experience in
Microinsurance
3 years (2006-07) 8 years (2001-02) 16 years (1993)
Type of
Microinsurance
products deal in
and Insurance
companies
Life Insurance (Tata
AIG, LIC)
Health Insurance (OIC,
ICICI Lombard)
Asset Insurance (OIC)
Life Insurance (Bajaj
Allianz, ICICI
Lombard)
Life Insurance (Bajaj
Allianz, LIC, Tata AIG,
ICICI, Max New York
Life)
Mode Payment
of Insurance
Premium
Direct deduct from loan
amount or option for
separate loan for
insurance premium
with general loan
condition
Direct deducted from
loan amount
Direct deducted from
loan amount
Insurance Cover Life cover for spouse is
already there in life
insurance
Group member with
three family members
(1+3) in health
insurance
Life of spouse not
covered
Spouse are not covered
due to high male
mortality rate. But
some monetary support
are offered by MFI for
funeral in case of death
Coverage for entire
family with lower
premium is suggested
Life of spouse not
covered
High male mortality rate
is major constraint to
cover life of spouse
Covering life of working
member of the family in
clients‘ policy is
important but it is not
acceptable to insurers.
Health Insurance Health insurance for the
group member and
other three family
members
No formal health
insurance product
offered
People are not willing
No formal health
insurance product
offered
Health insurance is more
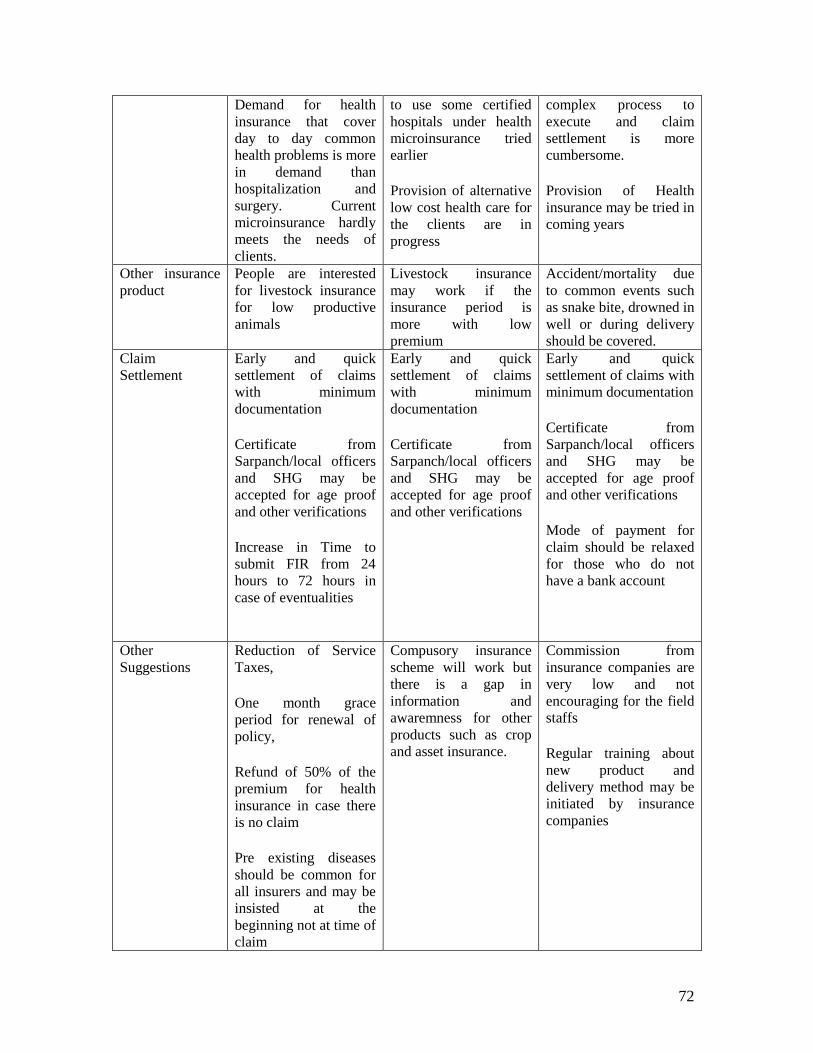
72
Demand for health
insurance that cover
day to day common
health problems is more
in demand than
hospitalization and
surgery. Current
microinsurance hardly
meets the needs of
clients.
to use some certified
hospitals under health
microinsurance tried
earlier
Provision of alternative
low cost health care for
the clients are in
progress
complex process to
execute and claim
settlement is more
cumbersome.
Provision of Health
insurance may be tried in
coming years
Other insurance
product
People are interested
for livestock insurance
for low productive
animals
Livestock insurance
may work if the
insurance period is
more with low
premium
Accident/mortality due
to common events such
as snake bite, drowned in
well or during delivery
should be covered.
Claim
Settlement
Early and quick
settlement of claims
with minimum
documentation
Certificate from
Sarpanch/local officers
and SHG may be
accepted for age proof
and other verifications
Increase in Time to
submit FIR from 24
hours to 72 hours in
case of eventualities
Early and quick
settlement of claims
with minimum
documentation
Certificate from
Sarpanch/local officers
and SHG may be
accepted for age proof
and other verifications
Early and quick
settlement of claims with
minimum documentation
Certificate from
Sarpanch/local officers
and SHG may be
accepted for age proof
and other verifications
Mode of payment for
claim should be relaxed
for those who do not
have a bank account
Other
Suggestions
Reduction of Service
Taxes,
One month grace
period for renewal of
policy,
Refund of 50% of the
premium for health
insurance in case there
is no claim
Pre existing diseases
should be common for
all insurers and may be
insisted at the
beginning not at time of
claim
Compusory insurance
scheme will work but
there is a gap in
information and
awaremness for other
products such as crop
and asset insurance.
Commission from
insurance companies are
very low and not
encouraging for the field
staffs
Regular training about
new product and
delivery method may be
initiated by insurance
companies
73
Summary
Functioning and experiences of all three selected MFIs in dealing with microinsurance
offer some important points for other microfinance institutions in particular and other
stakeholders in general. MFIs can be one of the channels for microinsurance products but
many of them do not deal with the products and services that the clients need. Some
issues and constraints relating to microinsurance activity emerged in above discussion, as
informed by the MFIs, are worth noting here. From the above discussion it appears that
demand for insurance services and issues relating to microinsurance activity are diverse
in nature. The challenge for the MFIs and its clients is to figure out the most cost-
effective solutions to their primary problems. There may be a trade-off between reaching
many people with a simple (mandatory) product working in the study areas. Some major
constraints, specific to partner-agent model, of microinsurance are summarized here.
Experiences and views of MFIs, may be used while designing and expanding
microinsurance products. By ensuring this microinsurance products can be made more
attractive to more groups and areas. Suggestions of MFIs on inclusion of spouse in
insurance policy, especially for women to really benefit from life insurance, should be
welcome with precaution to meet adverse selection problems such as age of husband etc.
It makes sense for MFIs to start with a simple life policy to learn about insurance and
once they know how to manage insurance risks, they may deal in variety of insurance
product to meets clients‘ needs. But it did not appear in our study areas. It is interesting to
see that relatively older and experienced MFIs (ASA GV and Mahasema) are dealing
with mainly life insurance products as compared to a younger MFIs – BISWA – dealing
in life, health and asset insurance. Perhaps, the mission, vision and principle of respective
MFI considerably influenced which products were selected and how they chose to sell
and service them.
The insurance product is closely linked with clients‘ loan activities with MFIs. Though
this link is believed to improve efficiency and outreach of microinsurance, but risk events
can happen before or after loan period or for those who do not have a loan. On the other
74
hand, as insurers are legally compelled to sell insurance to low-income clients, it is
difficult to see the advantages of an MFIs selling insurance, unless the commission for
doing this is adequate. Similarly, choosing and changing insurance partner by MFIs pose
challenges to meet their targets. For instance, all three MFIs in our study had undergone
several rounds of rigorous and lengthy process of negotiation to finalize the business.
Still they had to change insurance partners quite often, which can affect their activity and
cause confusion among the clients and staffs. In this context, experiences of ASA GV is
quite interesting, especially in negotiating hard to get good products and processes from
insurers at a decent price. On the other hand, an alternative to the situation for frequent
change of insurance partners BISWA followed a practice of reducing business with its
earlier partners and explored new suitable partners to minimize adverse effects and
confusion among staffs and clients.
As regard to claims processing system, MFIs are insisting that they would pay the claims,
and then be reimbursed from the insurer, based on documentation that is appropriate for
their clients. As MFIs might undertake prevention strategies to fulfill its social mission
and these interventions could have the additional advantage of reducing claims. Though it
make sense but they have not been successful in negotiating with their insurance partners.
Regarding efficiency in product delivery, it depends on the simplicity of the product or
product menu. Simple products are easier to administer and easier for clients to
understand. This could be the reason why life insurance products are found dominant in
the study area. However, different perceptions and priorities of different stakeholders
about microinsurance can significantly influence its outreach and efficacy. A cost-
effective solution to different perspectives of the stakeholders did not emerge out of
above discussion. But the principles, mission and vision of respective MFIs‘ seems
influence the selection of insurers and the products to sell and service them. It appears
that MFIs are keen to meet their target of reaching many people with a simple
(mandatory) product – life insurance. Ensuring the products that meet clients‘ needs,
reduction of service tax on insurance products, quick claim settlement, easy
documentation and more incentives for MFIs are some common issues that need more
policy attention. These issues may be addressed suitably at policy level.
75
Chapter -5
Microinsurance, Household Risks and Coping Strategy in Study Areas
For the poor and low income groups protecting their incomes and assets could be more
effective way out of poverty and vulnerability. In other words protecting their economic
and financial loses through affordable and effective risk management is as important as to
generate additional employment and income and provision of social safety measures for
these sections. Although pro-poor income-employment generation schemes are wide
spread across the country, less attention has been given to protect incomes of the target
groups in a systematic way. In this context, microinsurance is believed to play an
important role and can be a part of broader poverty reduction and social security policy
strategy. Recently, it has drawn attention of policy makers, development practitioners,
donors, insurers and others to discuss and debate on status, efficacy and outreach of
microinsurance. While the timing of the debate is strategic there is not enough study on
microinsurance available at micro level, especially among different groups and regions.
The present study is a modest attempt to fulfill this gap.
Households with low assets and incomes can have disproportionately large and multiple
adverse impacts with occurrence of smaller risk event. While some sections may
overcome such negative impacts with better risk management tools, many less prepared
households fail to do so. The situation can be worse for some specific groups such as
asset-poor, low-income groups and women due to their low capacity to manage risks.
This is possible, particularly, in absence of adequate formal insurance cover. However,
use of formal insurance and institutionalization of household risk management, is
abysmally low among these groups due to several factors. One of the key factors is the
nature of credit access and occupation/enterprises of household. Though access to
financial services - credit, saving and insurance and its effects on their risk coping
behaviour have been debated in development literature it vary widely across groups and
regions. Part of this debate has focused on the potential role of financial services in
76
helping the affected groups to manage common risks and prepare them better for such
events in future.
Microinsurance is an important component of financial services mainly available to the
low income groups under different supply channels involved in microcredit. In this
chapter we have analyzed participation of some select women microcredit clients in
microinsurance and discussed other related issues to understand the outreach and efficacy
of microinsurance. In this regard, the relationship between household‘s major activity,
differential access to financial services and their risks and risk coping behaviour are
highlighted. To begin with, sample households are categorized into some broad groups on
the basis of their major occupations, most of which are financed by microcredit
programme. The categorization was made keeping in mind distortions in household
income and employment due to their uninsured risks and their likely risk coping strategy
for income and consumption smootheing. It will also depict a broad idea about their risk,
needs for insurance and other financial services. Analysis is made at the level of seven
groups, three regions (three study areas) and total sample.
Households encounter different types of risks with different severity impact. At
household level, risks mitigation can take place at two different stages. The first stage
refers to ex-ante arrangements for exposure to risk which aims to maintain income flows
or income and expenditure smoothening in case there is income shortfalls. Measures for
lowering the ex-ante risks generally consist of conservative production decisions and
diversifying household activities (traditional farming, mixed cropping, non-farm activity,
multiple occupations, increasing working members and hours). These arrangements by
the households to cope with risks lead however, mostly to losses in the profitability of the
respective economic activities (Morduch, 1995, Ruthven and Kumar 2002).
The second stage refers to ex-post mechanism of dealing with the loss or damage. It
consists of borrowing, receiving remittance, adjustment in major consumption and other
expenditure (on education, health, food, festival), diversifying household resources
(putting women and child on work, and increasing working hours) and other measures.
77
These risk coping mechanisms can have wide and lasting adverse socio-economic impact
on poor and low-income households. Adequate and effective financial and insurance
arrangements such as saving, insurance and borrowing could be important options to deal
with such situation and damages. But formal insurance products and process are hardly
known to many poor people.
Insurance is an ex-ante risk management tool through which household hedge potential
financial losses in exchange for fixed premium payments. As access to and use of
financial services including insurance is low and irregular among low income groups,
their self-insurance arrangement determine their risk managing capability. In this
situation, the nature and quantum of social security measures do matter in managing risks
and augmenting capability of the households to cope with adverse events. In the context
of limited coverage of social safety measures and absence of household access to
adequate formal insurance, role of microinsurance could be encouraging.
Risks can be classified as idiosyncratic6 and covariant risks
7. At household level, there
are two types of risks we focus in this study that affect household income and
expenditure smoothening. One, risks related to life and life cycle events such as death,
disability and illness. Two, risks related to livelihoods such as loss of crop, livestock,
fisheries etc. Rosenzweig and Binswanger (1993) investigated the effects of risk on the
allocation of production resources among farmers, differentiated by wealth. Using the
panel data set from the ICRISAT villages in India and its information on investment,
wealth and rainfall, they examined how the composition of productive and non-
productive asset holdings varies across farmers with different levels of total wealth and
across farmers facing different degrees of weather risk. The results show that farmers in
riskier environments select portfolios of assets that are less sensitive to rainfall variation
and less profitable. Vulnerable households are more likely to diversify their plots. In
agriculture dominated economy like India, poorer households tend to choose less risky
production strategies and the tendency to shift to a less risky portfolio is greater among
6 Idiosyncratic risks are risk particular to a household
7 Covariant risks are systematic shocks common to the community or region
78
households with less inherited wealth. Households with borrowing constraints choose
less risky portfolios of crops and plots. These contexts are quite similar in our study areas
and households behave as least risk takers may be due to their own socio-economic
characteristics or due to their low access, arrangements and use of financial services such
as insurance. Under this background, we will discuss the nature of microinsurance, risk
and risk coping behaviour of household in study areas. In the next section we have
briefly analyzed features of sample households and linked it with their participation in
financial and insurance product, wherever possible.
5.1 Household Features
Household features such as family size, literacy, working members, type of house, asset
holding, occupation and other socio-economic characteristics are crucial in determining
household need for finance. It is believed that there is strong relationship between
household composition, family size and asset holding pattern and demand for different
financial products. For example, households having bigger family may be less likely to
opt for formal insurance. More educated and better-off people may go for insurance as
they can afford and are able to understand the concept and principle of insurance and its
technical procedures.
On the other hand, lower level of education associated with less productive jobs and
lower income can reduce possibility of having market based insurance. Ownership of
productive assets, land, consumer durables and house can induce demand for insurance
and other financial products. In sum, better asset-endowed households have positive
effect on taking up more and more financial products. Since most of the sample
households do not possess land, their non-land asset holding may act as an important
determinant for household participation in insurance products.
It may be seen the data presented in the table – 5.1 that average household size in the
study areas is 4.1 persons and it varies from 3.8 persons in Madurai to 4.8 persons in
Sambalpur. In activity groups, average household size is found higher in more labour
intensive and low-return activities such as handicraft (5.6 persons) agriculture (4.6
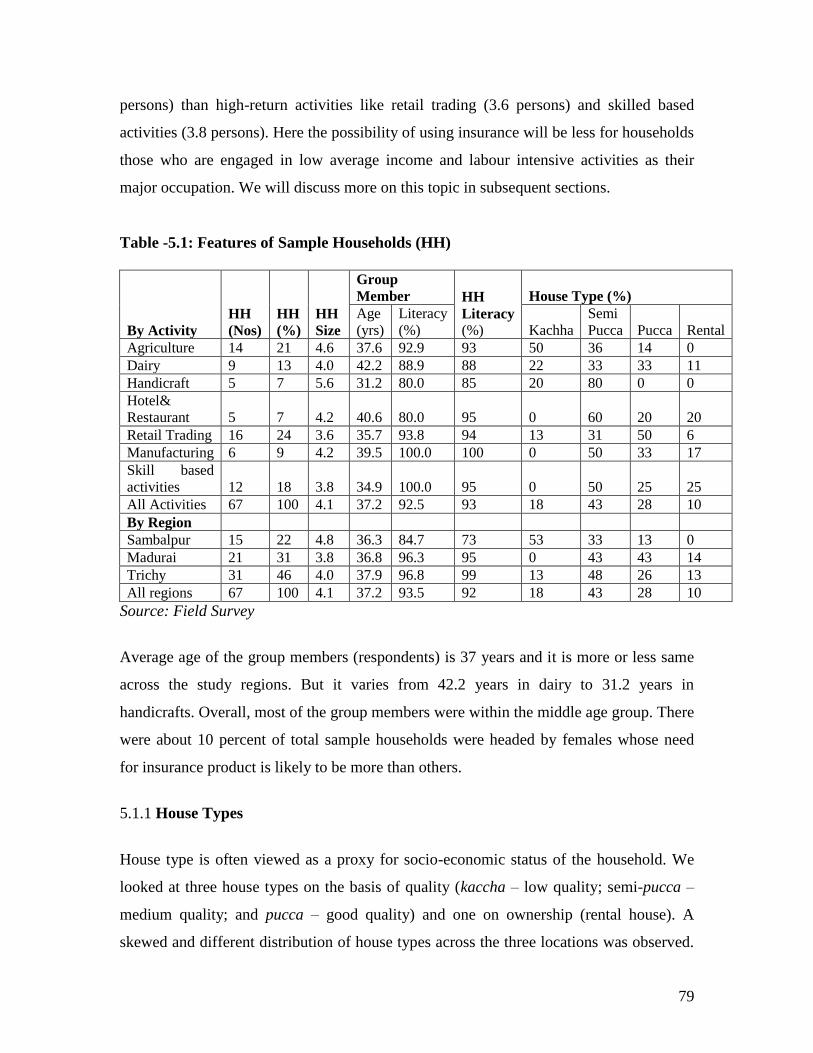
79
persons) than high-return activities like retail trading (3.6 persons) and skilled based
activities (3.8 persons). Here the possibility of using insurance will be less for households
those who are engaged in low average income and labour intensive activities as their
major occupation. We will discuss more on this topic in subsequent sections.
Table -5.1: Features of Sample Households (HH)
By Activity
HH
(Nos)
HH
(%)
HH
Size
Group
Member HH
Literacy
(%)
House Type (%)
Age
(yrs)
Literacy
(%) Kachha
Semi
Pucca Pucca Rental
Agriculture 14 21 4.6 37.6 92.9 93 50 36 14 0
Dairy 9 13 4.0 42.2 88.9 88 22 33 33 11
Handicraft 5 7 5.6 31.2 80.0 85 20 80 0 0
Hotel&
Restaurant 5 7 4.2 40.6 80.0 95 0 60 20 20
Retail Trading 16 24 3.6 35.7 93.8 94 13 31 50 6
Manufacturing 6 9 4.2 39.5 100.0 100 0 50 33 17
Skill based
activities 12 18 3.8 34.9 100.0 95 0 50 25 25
All Activities 67 100 4.1 37.2 92.5 93 18 43 28 10
By Region
Sambalpur 15 22 4.8 36.3 84.7 73 53 33 13 0
Madurai 21 31 3.8 36.8 96.3 95 0 43 43 14
Trichy 31 46 4.0 37.9 96.8 99 13 48 26 13
All regions 67 100 4.1 37.2 93.5 92 18 43 28 10
Source: Field Survey
Average age of the group members (respondents) is 37 years and it is more or less same
across the study regions. But it varies from 42.2 years in dairy to 31.2 years in
handicrafts. Overall, most of the group members were within the middle age group. There
were about 10 percent of total sample households were headed by females whose need
for insurance product is likely to be more than others.
5.1.1 House Types
House type is often viewed as a proxy for socio-economic status of the household. We
looked at three house types on the basis of quality (kaccha – low quality; semi-pucca –
medium quality; and pucca – good quality) and one on ownership (rental house). A
skewed and different distribution of house types across the three locations was observed.
80
Range of kaccha type houses vary from about 73% in Sambalpur to almost absent in
Madurai. Similarly, range of pucca houses vary from 13% in Sambalpur to 43% in
Trichy. Implication of different type of houses owned by the households is also reflected
in terms of their participation in type of economic activities and financial services.
Activity wise, half of the houses in agriculture group were kaccha and half of the houses
of those involved in trading activity were pucca. Better type of housing was negatively
associated with household size showing that families living in better houses reported
fewer numbers of members. These households are likely to have better financial services
than their counterparts in other categories. About 10 percent of total sample households
use houses on rent, mainly those who are involved in high return activities such as skill-
based activities, hotel & restaurants and manufacturing. The overall picture emerging
from the household features discussed above, is that households having better house,
smaller family size and high return activity are likely to have more financial products. In
this regard many household in Sambalpur are less likely to have more financial products,
particularly insurance product.
5.1.2 Education & Skill
Surprisingly, overall literacy rate in the study areas was reported to be very high. In
activity groups except hotel & restaurant and dairy activities, literacy rate was found
more or less same with the group members in respective activities. High female literacy
and low differences between male and female literacy rate among the sample household
was also reported. Gender neutralization in education could have positive relation with
insurance uptake and renewal. A visible gap in literacy rate between group members and
household categories across study regions is evident. For instance, literacy rate of female
group members was 85 percent in Sambalpur which is also higher than overall household
literacy rate. It was found almost full literacy (97 percent) in Trichy. In activity groups it
varies 80 percent in handicrafts, hotel & restaurant to full literacy rate in skilled based
activity and manufacturing. As regard to level of education among the group members
about 45 percent were in primary level and 28 percent were in matriculation level. The
group members having the higher level of education was found in the category of above
secondary level and only in retail trading activity (Table- 5.2).
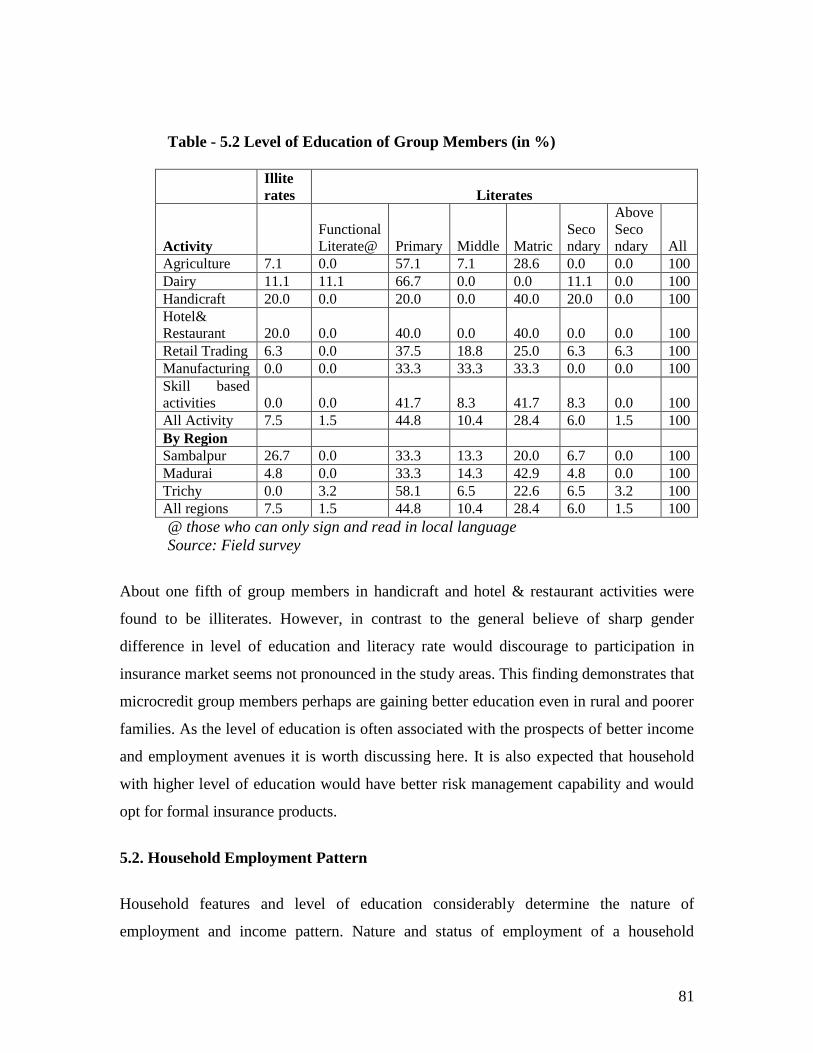
81
Table - 5.2 Level of Education of Group Members (in %)
Illite
rates Literates
Activity
Functional
Literate@ Primary Middle Matric
Seco
ndary
Above
Seco
ndary All
Agriculture 7.1 0.0 57.1 7.1 28.6 0.0 0.0 100
Dairy 11.1 11.1 66.7 0.0 0.0 11.1 0.0 100
Handicraft 20.0 0.0 20.0 0.0 40.0 20.0 0.0 100
Hotel&
Restaurant 20.0 0.0 40.0 0.0 40.0 0.0 0.0 100
Retail Trading 6.3 0.0 37.5 18.8 25.0 6.3 6.3 100
Manufacturing 0.0 0.0 33.3 33.3 33.3 0.0 0.0 100
Skill based
activities 0.0 0.0 41.7 8.3 41.7 8.3 0.0 100
All Activity 7.5 1.5 44.8 10.4 28.4 6.0 1.5 100
By Region
Sambalpur 26.7 0.0 33.3 13.3 20.0 6.7 0.0 100
Madurai 4.8 0.0 33.3 14.3 42.9 4.8 0.0 100
Trichy 0.0 3.2 58.1 6.5 22.6 6.5 3.2 100
All regions 7.5 1.5 44.8 10.4 28.4 6.0 1.5 100
@ those who can only sign and read in local language
Source: Field survey
About one fifth of group members in handicraft and hotel & restaurant activities were
found to be illiterates. However, in contrast to the general believe of sharp gender
difference in level of education and literacy rate would discourage to participation in
insurance market seems not pronounced in the study areas. This finding demonstrates that
microcredit group members perhaps are gaining better education even in rural and poorer
families. As the level of education is often associated with the prospects of better income
and employment avenues it is worth discussing here. It is also expected that household
with higher level of education would have better risk management capability and would
opt for formal insurance products.
5.2. Household Employment Pattern
Household features and level of education considerably determine the nature of
employment and income pattern. Nature and status of employment of a household
82
influence its economic and financial behaviour. A sound employment status can induce
better saving and insurance options. It may be seen in the table – 5.3 that activities
undertaken by sample households (mostly financed by MFI, hence it is called as loan
activity) are wide spread and shows potential variations in household risk and risk coping
variations in the study areas. It may be noted that loan activities constitute a sizeable
portion of total household employment in all regions and in all activity groups. It shows
the importance of microcredit programme for low-income groups. As expected, the
dominance of female workers in these activities is evident, particularly in dairy, retail
trading, manufacturing and skill –based activity. This is also reflected in terms of average
number of employment (mandays) as discussed bellow.
Except, in agriculture, all loan activities provide more than six months of employment to
who participates in these activities. It reiterates the significance of rural mocrocredit
programme of MFI in the study areas. Depending on the nature of activity and household
strategy total employment from these activities has been shared by male and female
workers. However, feminization of labour intensive activities is depicted from the data
presented in table 5.3. Dairy, retail trading, skilled activity and agriculture are the
activities provide higher employment to female workers than their male counterparts.
Low average employment in non-loan activity (activity not directly financed by
microcredit from MFI) was found where average male employment in loan activity was
low. A positive association between high average employment (mandays) and high
dependency ratio was also found in skilled activity, manufacturing and dairy. It may be
due to higher average income expected from these activities or it could be due to high
work participation rate among working poor. High dependence ratio shows proportion of
non-working member such as school going children and elderly people are more in
numbers. High dependency ratio in agriculture with low average employment could be
due to low labour absorption in farming activity and lack of alternate avenues available to
those households. In sum, the employment scenario of the sample households discussed
above gives an indication that they are likely to be more vulnerable to income and
employment related risks and shocks.
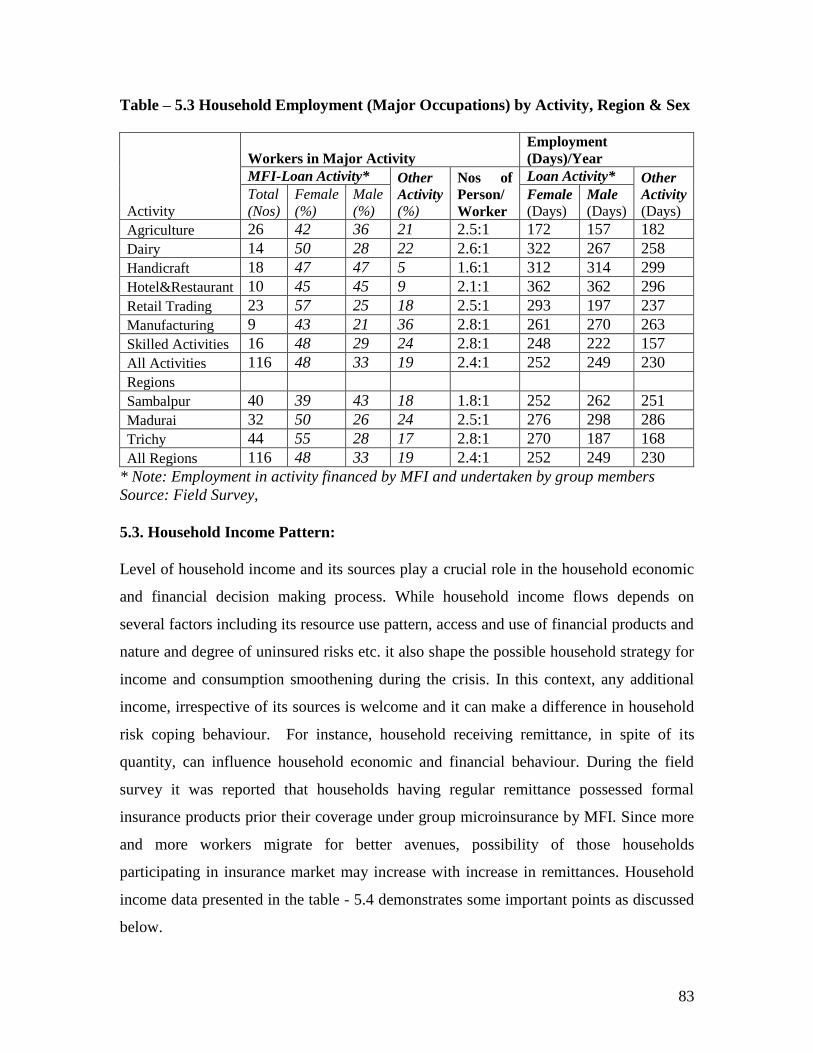
83
Table – 5.3 Household Employment (Major Occupations) by Activity, Region & Sex
Activity
Workers in Major Activity
Employment
(Days)/Year
MFI-Loan Activity* Other
Activity
(%)
Nos of
Person/
Worker
Loan Activity* Other
Activity
(Days)
Total
(Nos)
Female
(%)
Male
(%) Female
(Days) Male
(Days)
Agriculture 26 42 36 21 2.5:1 172 157 182
Dairy 14 50 28 22 2.6:1 322 267 258
Handicraft 18 47 47 5 1.6:1 312 314 299
Hotel&Restaurant 10 45 45 9 2.1:1 362 362 296
Retail Trading 23 57 25 18 2.5:1 293 197 237
Manufacturing 9 43 21 36 2.8:1 261 270 263
Skilled Activities 16 48 29 24 2.8:1 248 222 157
All Activities 116 48 33 19 2.4:1 252 249 230
Regions
Sambalpur 40 39 43 18 1.8:1 252 262 251
Madurai 32 50 26 24 2.5:1 276 298 286
Trichy 44 55 28 17 2.8:1 270 187 168
All Regions 116 48 33 19 2.4:1 252 249 230
* Note: Employment in activity financed by MFI and undertaken by group members
Source: Field Survey,
5.3. Household Income Pattern:
Level of household income and its sources play a crucial role in the household economic
and financial decision making process. While household income flows depends on
several factors including its resource use pattern, access and use of financial products and
nature and degree of uninsured risks etc. it also shape the possible household strategy for
income and consumption smoothening during the crisis. In this context, any additional
income, irrespective of its sources is welcome and it can make a difference in household
risk coping behaviour. For instance, household receiving remittance, in spite of its
quantity, can influence household economic and financial behaviour. During the field
survey it was reported that households having regular remittance possessed formal
insurance products prior their coverage under group microinsurance by MFI. Since more
and more workers migrate for better avenues, possibility of those households
participating in insurance market may increase with increase in remittances. Household
income data presented in the table - 5.4 demonstrates some important points as discussed
below.
84
Average annual income was found much higher in dairy activity followed by hotel and
restaurant, retail trading and manufacturing. It was lowest in handicraft activity which
accounts for only half of the household income in dairy activity. Surprisingly, average
household income in skilled activities was also found low – little higher than only to
handicraft activity. It may be due to lower average return of the activity as average
number of employment is not bad. Possibility of avoiding high return high risks as a
coping strategy of such households cannot be ruled out. A higher annual average income
in non-loan activities than loan activity is reported. Similarly, average income per person
from non-loan activity was found higher than average income of female worker in loan
activities in all regions and all activities except in hotel and restaurant. Average income
of a male worker in other skilled activity was found notably higher than the
corresponding income in loan activity. It shows the lower return or average income from
loan activities, particularly for women workers. Conventionally, lower average income
does not encourage insurance uptake and renewal, particularly for females. Low average
income of loan-activities, in spite of its high employment potential, is a matter of concern
but detail analysis of this is beyond the Scope of present study. Risk of low and irregular
income of the sample households from their current occupations is evident and might
influence their participation in insurance market.
From the above discussion on household employment and income, conventional gender
inequality in income and working period is visible. This is more pronounced in skilled
activities, retail trading and manufacturing activities. It may be noted that female workers
share more number of employment (mandays) but it may not fetch them more average
income. This is found true in retail trading, skilled activities and manufacturing activities
where average employment in loan activity for female workers was high but not in terms
of average income. It implies that the rate and intensity of employment is high in case of
female workers but it does not necessarily translate into higher level of income. Low
average income in handicraft and agriculture, mostly labour intensive activity, also
corroborates this trend. Implication of this trend is it may have adverse impact on
women‘s bargaining power and household decision, especially opting for insurance
uptake and its renewal for female members.
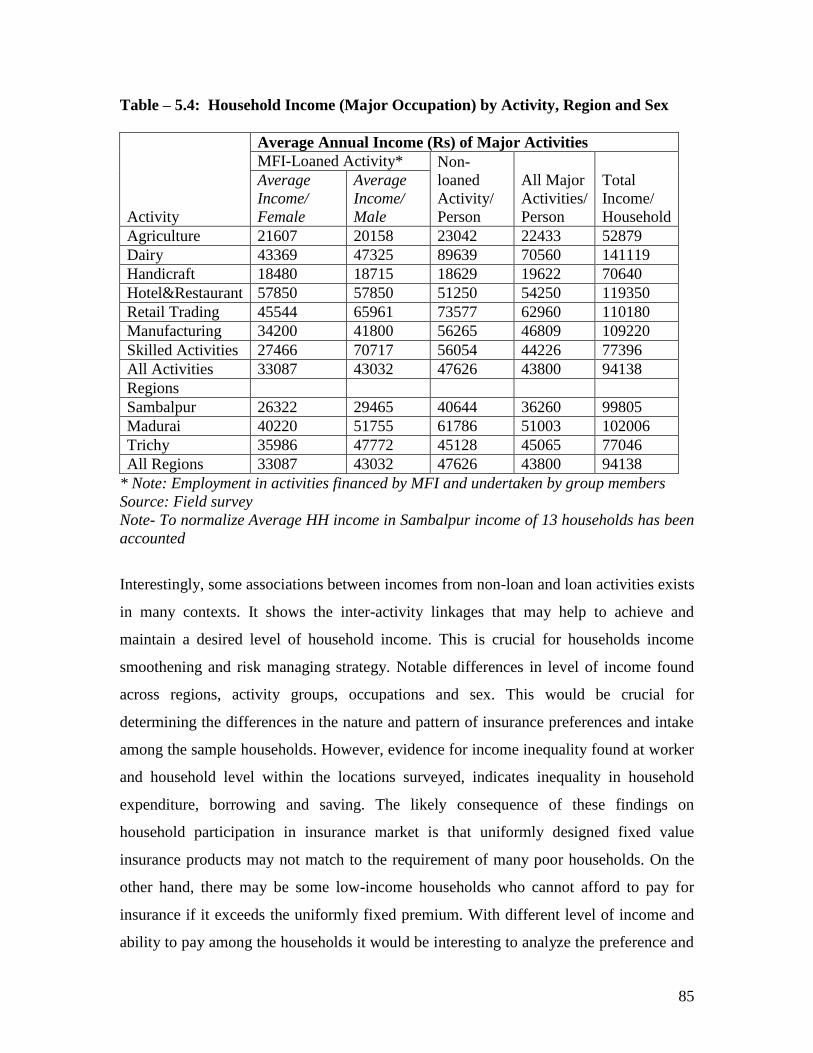
85
Table – 5.4: Household Income (Major Occupation) by Activity, Region and Sex
Activity
Average Annual Income (Rs) of Major Activities
MFI-Loaned Activity* Non-
loaned
Activity/
Person
All Major
Activities/
Person
Total
Income/
Household
Average
Income/
Female
Average
Income/
Male
Agriculture 21607 20158 23042 22433 52879
Dairy 43369 47325 89639 70560 141119
Handicraft 18480 18715 18629 19622 70640
Hotel&Restaurant 57850 57850 51250 54250 119350
Retail Trading 45544 65961 73577 62960 110180
Manufacturing 34200 41800 56265 46809 109220
Skilled Activities 27466 70717 56054 44226 77396
All Activities 33087 43032 47626 43800 94138
Regions
Sambalpur 26322 29465 40644 36260 99805
Madurai 40220 51755 61786 51003 102006
Trichy 35986 47772 45128 45065 77046
All Regions 33087 43032 47626 43800 94138
* Note: Employment in activities financed by MFI and undertaken by group members
Source: Field survey
Note- To normalize Average HH income in Sambalpur income of 13 households has been
accounted
Interestingly, some associations between incomes from non-loan and loan activities exists
in many contexts. It shows the inter-activity linkages that may help to achieve and
maintain a desired level of household income. This is crucial for households income
smoothening and risk managing strategy. Notable differences in level of income found
across regions, activity groups, occupations and sex. This would be crucial for
determining the differences in the nature and pattern of insurance preferences and intake
among the sample households. However, evidence for income inequality found at worker
and household level within the locations surveyed, indicates inequality in household
expenditure, borrowing and saving. The likely consequence of these findings on
household participation in insurance market is that uniformly designed fixed value
insurance products may not match to the requirement of many poor households. On the
other hand, there may be some low-income households who cannot afford to pay for
insurance if it exceeds the uniformly fixed premium. With different level of income and
ability to pay among the households it would be interesting to analyze the preference and
86
uptake of uniform insurance products among the target groups. Before discussing this in
detail we highlight household borrowing and saving pattern which constitute important
part of household‘s demand for financial products. It is believed that household
participation in credit, saving and insurance markets are interlinked.
5.4. Household Borrowing & Saving Pattern
Conventionally, asset-poor and low-income groups, in rural areas, are less likely to use
credit from bank or institutional sources than depend on informal credit from local
moneylenders and others. Considering the welfare costs of exclusion from the banking
sector, especially for the rural poor are high, widespread government intervention in the
banking sector of low income countries is well document (Besley, 1995). Promoting
growth of microfinance is also an important intervention in this regard. Here we have
discussed some aspects of household borrowing and saving in the study areas and tried to
link with their participation in microinsurance. Here we have examined household
borrowing by analyzing the amount and sources of lending, rate of interest, incidence of
multiple borrowing etc. by activity groups. Household preferences for lending sources
and the gap between the credit demand and credit obtained are particularly highlighted.
Since all respondents are microcredit clients their loan activities from MFIs constitutes an
important part of total borrowing activity.
Households engaged in regular borrowing and saving activities may have better exposure
to financial markets and there is possibility that they would like to explore insurance
markets. Since our respondents are already exposed to microcredit programme and other
financial transactions their participation in insurance may be easier now. However,
availability and functioning of banking infrastructure and credit policy interventions play
a key role in household exposure to financial markets. In recent years, series of state led
credit, savings and insurance programs though a welcome step in this direction, but its
success in reaching the poor and targeted groups remains debatable.
As expected, average household loans from informal sources tend to be larger and with
very high rates of interest. It may be seen in the tables 5.5 and 5.6 that, average
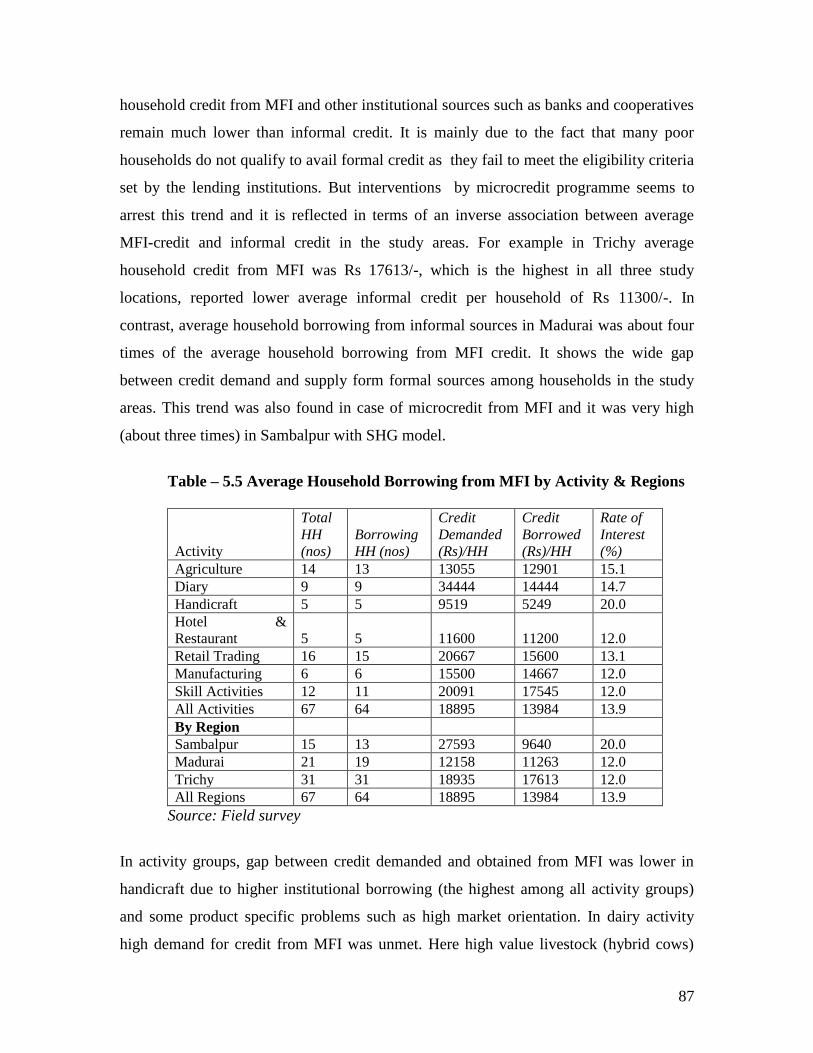
87
household credit from MFI and other institutional sources such as banks and cooperatives
remain much lower than informal credit. It is mainly due to the fact that many poor
households do not qualify to avail formal credit as they fail to meet the eligibility criteria
set by the lending institutions. But interventions by microcredit programme seems to
arrest this trend and it is reflected in terms of an inverse association between average
MFI-credit and informal credit in the study areas. For example in Trichy average
household credit from MFI was Rs 17613/-, which is the highest in all three study
locations, reported lower average informal credit per household of Rs 11300/-. In
contrast, average household borrowing from informal sources in Madurai was about four
times of the average household borrowing from MFI credit. It shows the wide gap
between credit demand and supply form formal sources among households in the study
areas. This trend was also found in case of microcredit from MFI and it was very high
(about three times) in Sambalpur with SHG model.
Table – 5.5 Average Household Borrowing from MFI by Activity & Regions
Activity
Total
HH
(nos)
Borrowing
HH (nos)
Credit
Demanded
(Rs)/HH
Credit
Borrowed
(Rs)/HH
Rate of
Interest
(%)
Agriculture 14 13 13055 12901 15.1
Diary 9 9 34444 14444 14.7
Handicraft 5 5 9519 5249 20.0
Hotel &
Restaurant 5 5 11600 11200 12.0
Retail Trading 16 15 20667 15600 13.1
Manufacturing 6 6 15500 14667 12.0
Skill Activities 12 11 20091 17545 12.0
All Activities 67 64 18895 13984 13.9
By Region
Sambalpur 15 13 27593 9640 20.0
Madurai 21 19 12158 11263 12.0
Trichy 31 31 18935 17613 12.0
All Regions 67 64 18895 13984 13.9
Source: Field survey
In activity groups, gap between credit demanded and obtained from MFI was lower in
handicraft due to higher institutional borrowing (the highest among all activity groups)
and some product specific problems such as high market orientation. In dairy activity
high demand for credit from MFI was unmet. Here high value livestock (hybrid cows)
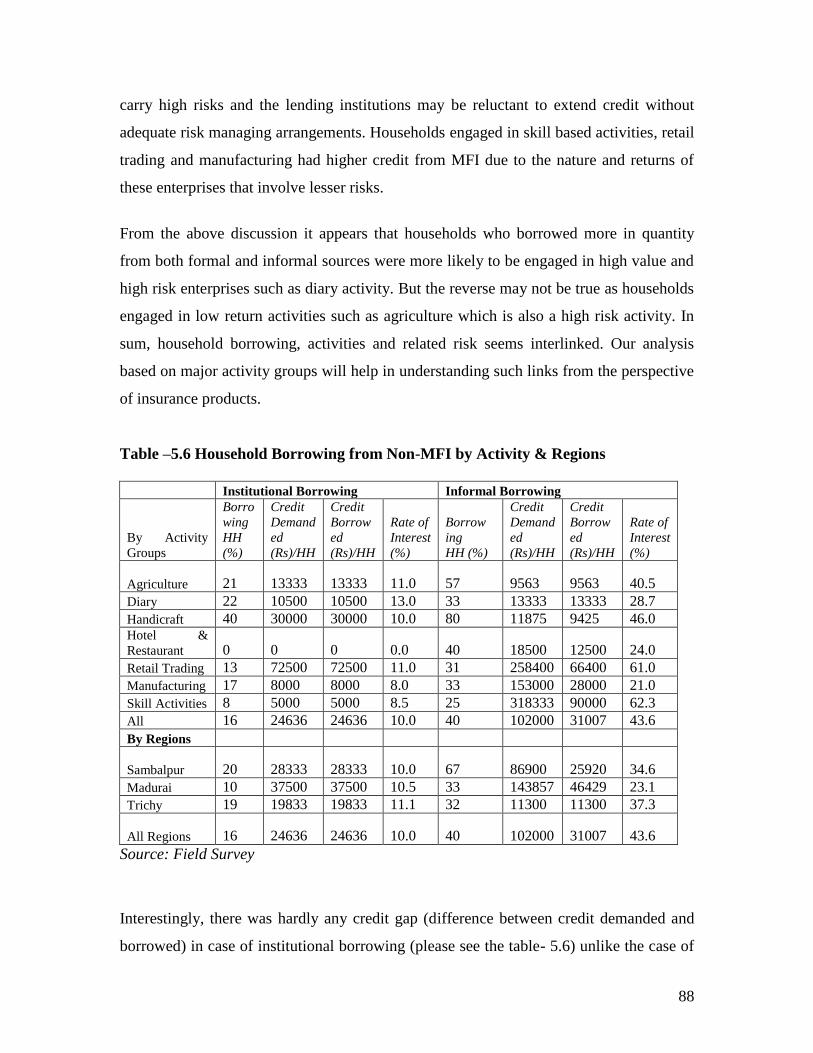
88
carry high risks and the lending institutions may be reluctant to extend credit without
adequate risk managing arrangements. Households engaged in skill based activities, retail
trading and manufacturing had higher credit from MFI due to the nature and returns of
these enterprises that involve lesser risks.
From the above discussion it appears that households who borrowed more in quantity
from both formal and informal sources were more likely to be engaged in high value and
high risk enterprises such as diary activity. But the reverse may not be true as households
engaged in low return activities such as agriculture which is also a high risk activity. In
sum, household borrowing, activities and related risk seems interlinked. Our analysis
based on major activity groups will help in understanding such links from the perspective
of insurance products.
Table –5.6 Household Borrowing from Non-MFI by Activity & Regions
Institutional Borrowing Informal Borrowing
By Activity
Groups
Borro
wing
HH
(%)
Credit
Demand
ed
(Rs)/HH
Credit
Borrow
ed
(Rs)/HH
Rate of
Interest
(%)
Borrow
ing
HH (%)
Credit
Demand
ed
(Rs)/HH
Credit
Borrow
ed
(Rs)/HH
Rate of
Interest
(%)
Agriculture 21 13333 13333 11.0 57 9563 9563 40.5
Diary 22 10500 10500 13.0 33 13333 13333 28.7
Handicraft 40 30000 30000 10.0 80 11875 9425 46.0 Hotel &
Restaurant 0 0 0 0.0 40 18500 12500 24.0
Retail Trading 13 72500 72500 11.0 31 258400 66400 61.0
Manufacturing 17 8000 8000 8.0 33 153000 28000 21.0
Skill Activities 8 5000 5000 8.5 25 318333 90000 62.3
All 16 24636 24636 10.0 40 102000 31007 43.6
By Regions
Sambalpur 20 28333 28333 10.0 67 86900 25920 34.6
Madurai 10 37500 37500 10.5 33 143857 46429 23.1
Trichy 19 19833 19833 11.1 32 11300 11300 37.3
All Regions 16 24636 24636 10.0 40 102000 31007 43.6
Source: Field Survey
Interestingly, there was hardly any credit gap (difference between credit demanded and
borrowed) in case of institutional borrowing (please see the table- 5.6) unlike the case of
89
MFI and informal sources. However, it does not imply that formal financial institutions
have met the entire credit need of these groups rather it is a part of the total credit needs
that qualify institutional credit conditions. In some of our focus group discussions (FGD)
it was reported that many households do not want to borrow from banks due to the
stringent term and conditions, timing of credit and high transaction costs that outweigh
low rate of interest. Another important point emerged here from the household borrowing
data is proportion of household borrowing from informal sources is very high in the
region where average microcredit from MFI was low. In Sambalpur about two third of
sample households borrowed from informal sources at average interest rate of 34.6
percent. It implies that although microcredit programmes become important source of
credit for the poor and low income groups it does not meet their total credit requirements.
Adequate and timely credit availability appears important than source of credit and rates
of interest. It provides an advantage to moneylenders, traders and other informal sources
to become prominent than formal creditors.
These findings indicate that the formal financial sector fail to meet the total credit
requirement of low-income groups and they continue to depend more on different
informal sources. This is substantiated from the fact that only 16 percent of sample
households borrowed from formal institutions against 40 percent of household from
informal sources in the study areas. This is not an encouraging condition for functioning
and development of low segment formal insurance markets. Unfortunately, there is
hardly any insurance service being supplied along with informal credit.
5.5. Household Saving
Household saving is directly linked with level of income, expenditure and borrowing. In
broader way, it works as proxy insurance during the contingency and plays a crucial role
in household decision making. Households borrow to invest into production and then
repay the past borrowing out of revenue and take decision on saving. However, in a
standard MFI credit-saving model, households calculate how much money to spend in
each period and how much to save. In practice, households tie the loan repayment
90
schedule to their cash flows or the income schedule. So the scope for saving remain
secondary, unless it is mandatory to save.
Under this condition, many poor and low income households often find themselves in a
low profile cycle of borrowing – production - repaying – saving. In other words a
household producing at a subsistence level finds it difficult to accumulate savings.
Therefore, household saving pattern is influenced by the nature and condition of
household borrowings. The conditions and repayment schedules within microcredit
programs (MFI) typically requires loan repayment in fixed weekly installments without a
grace period. Borrowers are often under pressure to repay as soon as the income is
earned. This in turn requires an investment that generates immediate and rapid rate of
return if repayments are to be made from the enterprise‘s income. If households fail to
make weekly repayment entirely from income arising from the loan activity, then it is
obvious the repayment to be paid from savings out of an alternate cash flow into the
household. This may limit household ability to save which may affect household‘s
borrowing and risk coping behavior. This could be one of the major reasons for poor
saving performance of the household in the study areas. It may be seen the data presented
in the table - 5. 7 that Non-MFI formal saving constitute the major part of total saving.
Only 34 percent households had formal saving (bank, cooperatives, post office etc) with
an average saving of Rs 7899 per household. In terms of value of saving, MFI-lead group
saving is a formality rather thinking it as proxy for insurance. It may be seen that average
saving per household is very low in Madurai and Sambalpur and absent in Trichy
depending on different terms and conditions of microcredit groups. Interestingly, within
formal saving, post-office saving is equally popular as saving in banks. Households in
hotel and restaurant, retail trading and dairy activities mostly save in formal forms.
We consider household choice for all major financial services such as borrowing and
saving along with insurance are interconnected. Users of one service may have an
informational advantage to know about additional services. Studies show that there is
increasing participation of low-income households in financial markets but many of these
studies focused on one financial service without relating one another. However, financial
91
services can be used for income generation on the one hand and for income and
consumption smoothing on the other hand. While insurance and savings are ex-ante or
preventive strategy, consumption credit is typically used ex-post to an event. Some
possible links between household borrowing, saving, insurance and other key variables
are discussed in subsequent parts of the chapter.
5.6 Household Expenditure Pattern
Another way to look at socio-economic status of a household is its expenditure pattern. In
our study, more than half of household income was spent on food, similar to the general
trend in the country. Other major expenditure items include healthcare (19 %), travel and
transportation (6%), clothing (9%), education (6%), repayment of old debts (5%), and
housing (5%).
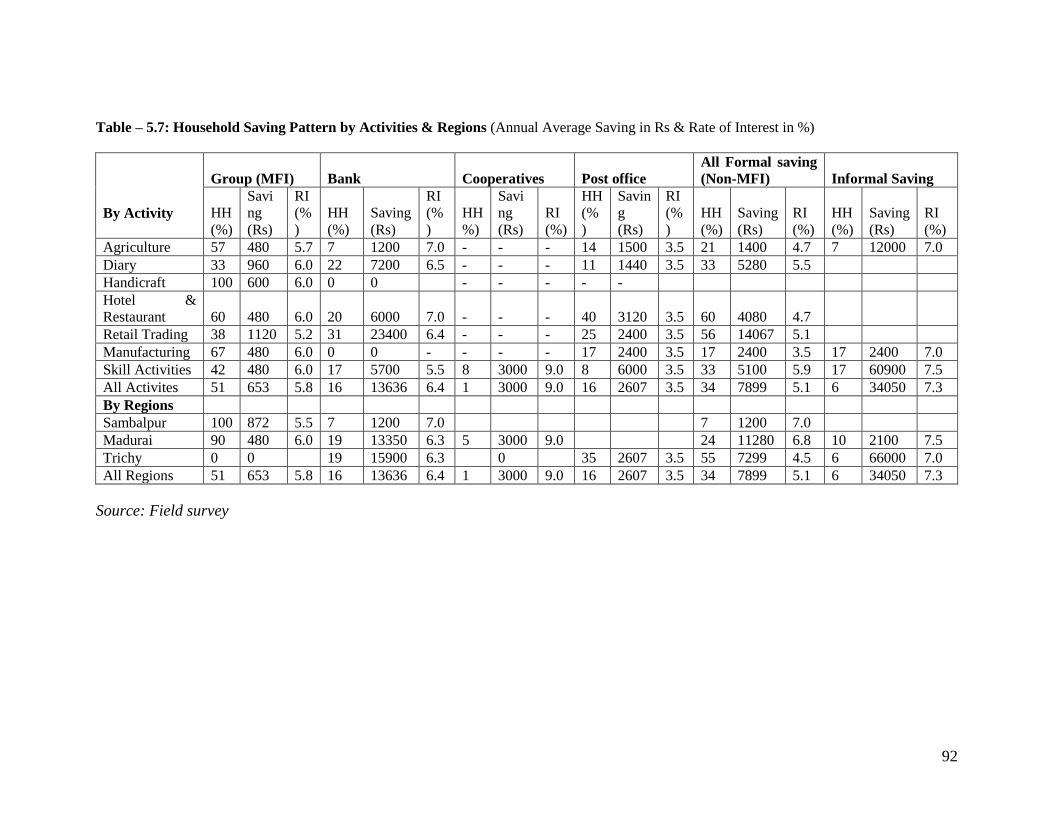
92
Table – 5.7: Household Saving Pattern by Activities & Regions (Annual Average Saving in Rs & Rate of Interest in %)
By Activity
Group (MFI) Bank Cooperatives Post office
All Formal saving
(Non-MFI) Informal Saving
HH
(%)
Savi
ng
(Rs)
RI
(%
)
HH
(%)
Saving
(Rs)
RI
(%
)
HH
%)
Savi
ng
(Rs)
RI
(%)
HH
(%
)
Savin
g
(Rs)
RI
(%
)
HH
(%)
Saving
(Rs)
RI
(%)
HH
(%)
Saving
(Rs)
RI
(%)
Agriculture 57 480 5.7 7 1200 7.0 - - - 14 1500 3.5 21 1400 4.7 7 12000 7.0
Diary 33 960 6.0 22 7200 6.5 - - - 11 1440 3.5 33 5280 5.5
Handicraft 100 600 6.0 0 0 - - - - -
Hotel &
Restaurant 60 480 6.0 20 6000 7.0 - - - 40 3120 3.5 60 4080 4.7
Retail Trading 38 1120 5.2 31 23400 6.4 - - - 25 2400 3.5 56 14067 5.1
Manufacturing 67 480 6.0 0 0 - - - - 17 2400 3.5 17 2400 3.5 17 2400 7.0
Skill Activities 42 480 6.0 17 5700 5.5 8 3000 9.0 8 6000 3.5 33 5100 5.9 17 60900 7.5
All Activites 51 653 5.8 16 13636 6.4 1 3000 9.0 16 2607 3.5 34 7899 5.1 6 34050 7.3
By Regions
Sambalpur 100 872 5.5 7 1200 7.0 7 1200 7.0
Madurai 90 480 6.0 19 13350 6.3 5 3000 9.0 24 11280 6.8 10 2100 7.5
Trichy 0 0 19 15900 6.3 0 35 2607 3.5 55 7299 4.5 6 66000 7.0
All Regions 51 653 5.8 16 13636 6.4 1 3000 9.0 16 2607 3.5 34 7899 5.1 6 34050 7.3
Source: Field survey
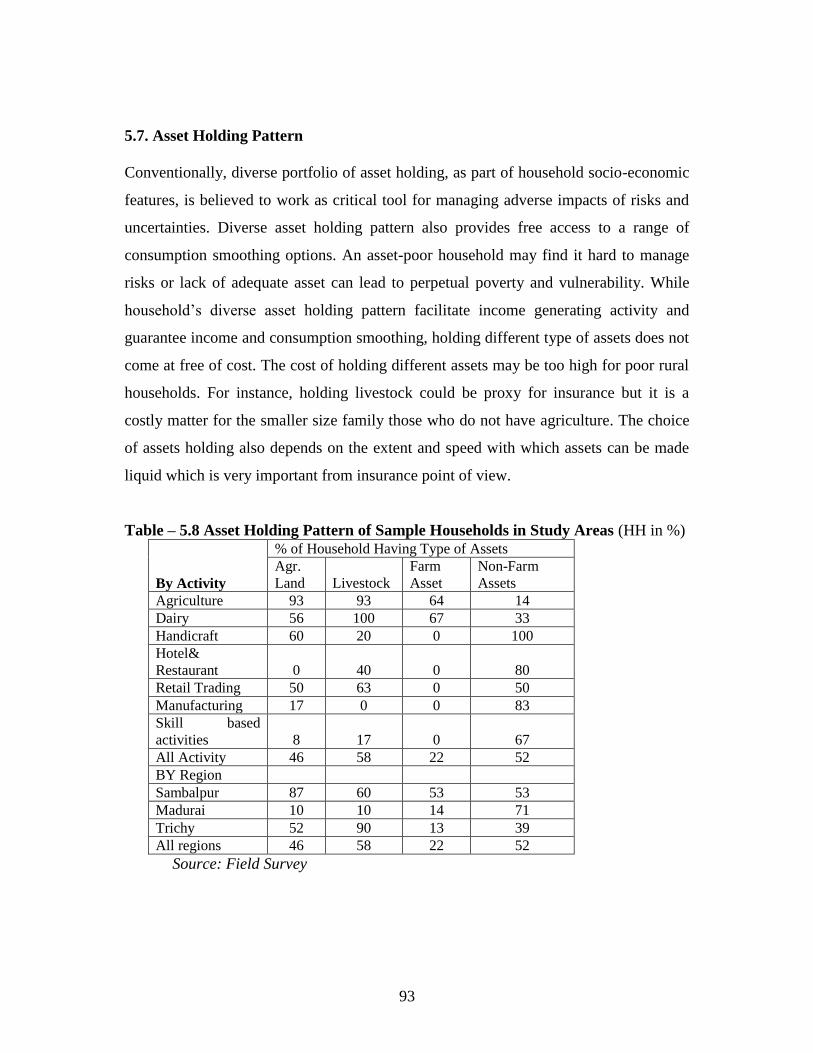
93
5.7. Asset Holding Pattern
Conventionally, diverse portfolio of asset holding, as part of household socio-economic
features, is believed to work as critical tool for managing adverse impacts of risks and
uncertainties. Diverse asset holding pattern also provides free access to a range of
consumption smoothing options. An asset-poor household may find it hard to manage
risks or lack of adequate asset can lead to perpetual poverty and vulnerability. While
household‘s diverse asset holding pattern facilitate income generating activity and
guarantee income and consumption smoothing, holding different type of assets does not
come at free of cost. The cost of holding different assets may be too high for poor rural
households. For instance, holding livestock could be proxy for insurance but it is a
costly matter for the smaller size family those who do not have agriculture. The choice
of assets holding also depends on the extent and speed with which assets can be made
liquid which is very important from insurance point of view.
Table – 5.8 Asset Holding Pattern of Sample Households in Study Areas (HH in %)
By Activity
% of Household Having Type of Assets
Agr.
Land Livestock
Farm
Asset
Non-Farm
Assets
Agriculture 93 93 64 14
Dairy 56 100 67 33
Handicraft 60 20 0 100
Hotel&
Restaurant 0 40 0 80
Retail Trading 50 63 0 50
Manufacturing 17 0 0 83
Skill based
activities 8 17 0 67
All Activity 46 58 22 52
BY Region
Sambalpur 87 60 53 53
Madurai 10 10 14 71
Trichy 52 90 13 39
All regions 46 58 22 52
Source: Field Survey
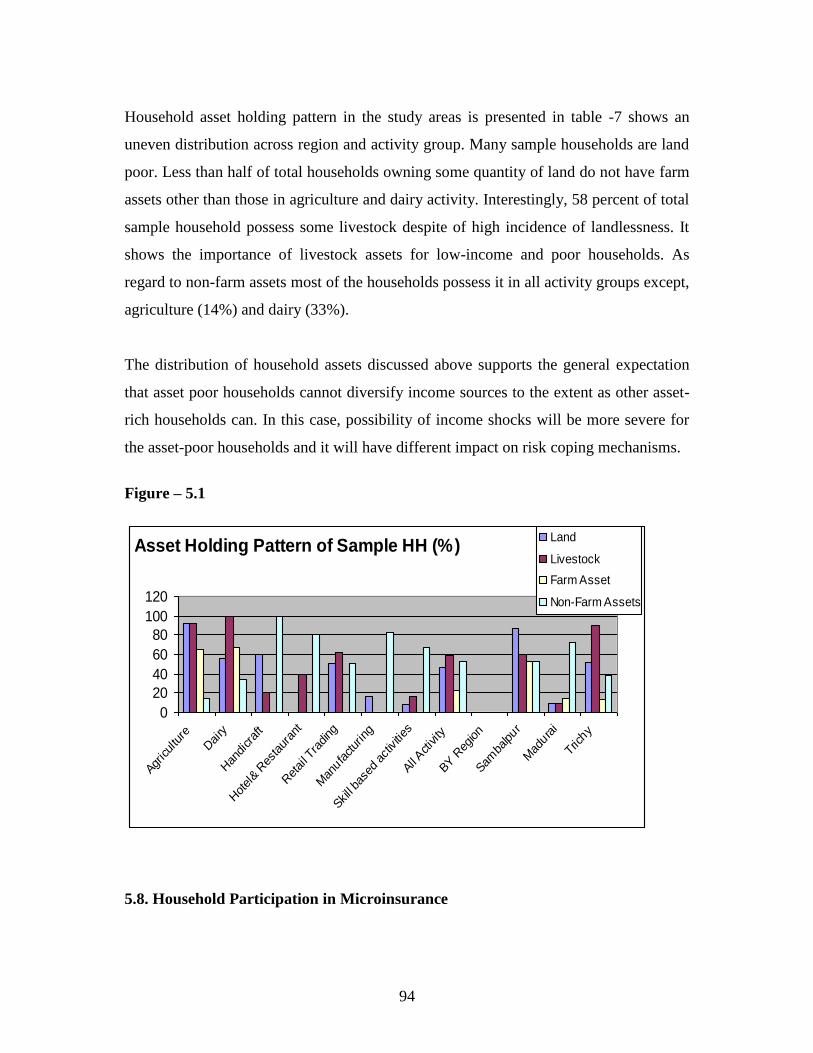
94
Household asset holding pattern in the study areas is presented in table -7 shows an
uneven distribution across region and activity group. Many sample households are land
poor. Less than half of total households owning some quantity of land do not have farm
assets other than those in agriculture and dairy activity. Interestingly, 58 percent of total
sample household possess some livestock despite of high incidence of landlessness. It
shows the importance of livestock assets for low-income and poor households. As
regard to non-farm assets most of the households possess it in all activity groups except,
agriculture (14%) and dairy (33%).
The distribution of household assets discussed above supports the general expectation
that asset poor households cannot diversify income sources to the extent as other asset-
rich households can. In this case, possibility of income shocks will be more severe for
the asset-poor households and it will have different impact on risk coping mechanisms.
Figure – 5.1
Asset Holding Pattern of Sample HH (%)
0
20
40
60
80
100
120
Agriculture
Dairy
Han
dicraft
Hotel& R
estaur
ant
Retail T
rading
Man
ufactur
ing
Skill ba
sed ac
tivities
All Activity
BY R
egion
Samba
lpur
Mad
urai
Trichy
Land
Livestock
Farm Asset
Non-Farm Assets
5.8. Household Participation in Microinsurance
95
Above analysis on major household features provides a background for better
understanding of household risk and risk coping strategy, including participation in
insurance market, in the study area. As discussed in the literature review, it is expected
that households which are more exposed to risks are more likely to opt for insurance
products. It is also expected that household risks has a positive effect on use of financial
products such as credit and saving. Uninsured households may seek loans or use their
saving to maintain consumption smoothing during post risk period. However,
households may also employ variety of indigenous ‗non-market‘ methods to cope with
risk, particularly, where credit and insurance markets are not complemented.
Keeping in mind the diverse nature of household risks and characteristics of household
activity or enterprise we discuss different household risks and risk management
strategies across activity groups in the study areas in the perspective of microinsurance.
In particular, we study household‘s participation in microcredit programme that
facilitate and expose to insurance product and subsequent household decision making.
We look at this question at ex-ante perspective, particularly when household decides to
change its economic and financial profile before the loss has occurred. As all sample
households are already covered under some insurance scheme through their access to
microcredit (MFI), it is expected that household may demand for more insurance cover
and variety of products, especially with increase in their income. Though the literature
on demand for insurance focuses on the income effect, the theoretical analysis reveals
that the effect of income on demand for insurance depends on the absolute risk aversion
(Gravelle and Rees 2004). However, there are several other factors related to the
availability, awareness, access, product design, claims settlement records, premium and
product delivery which determine the demand for insurance and which vary across
groups and regions.
The present study, despite of its limitations, attempts to analyze some of these major
issues in the broader perspective of outreach and efficacy of microinsurance in India. In
following sections we have briefly discussed household risks and risk coping
96
mechanism, participation in microinsurance market and its impact on household
decision making. The study does not consider household insurance alone but take
formal credit and saving products into consideration as household choice for different
financial products are interrelated. Household using one financial service is assumed to
be more likely to demand for additional services – such as insurance policy than a
household using no financial services. Motivation for using these financial services can
be for income generation in one hand and for income and consumption smoothing on
the other hand. While insurance and saving are ex-ante – that is used as risk coping
strategy, consumption credit is used typically ex-post – used to minimize or defuse
impacts of risks. However, household motivation for using different financial and
insurance products can be different for one product and between products. It depends on
household socio-economic-demographic features such as family occupation, asset
holding, family size, number of working members, level of skill, education etc.
Information collected about major risks and household coping strategy adopted by the
sample household during last two years prior to the field survey is presented in the table
– 5.9. As expected, sizeable portion of sample households (about one-third) have had
some kind of major risks in the recent past that has considerably affected their normal
way of life. It has distorted their consumption smoothing and major decision making.
Reported household risks were diverse in nature ranging from crop failure to risks
related to social problems. Shocks related to health was prominent and accounted for
about one-forth of total affected households. Second most important household risk was
employment related due to partial or full job loss. Surprisingly, risk events occurred due
to social factor were also substantial, which often ignored by the insurers, creditors and
policy makers.
About 14 percent of sample households suffered from risk related to their past debt.
Lower risks related to household assets reported in the study areas show low productive
asset holding for which immediate insurance need may be low. But risk occurred due to
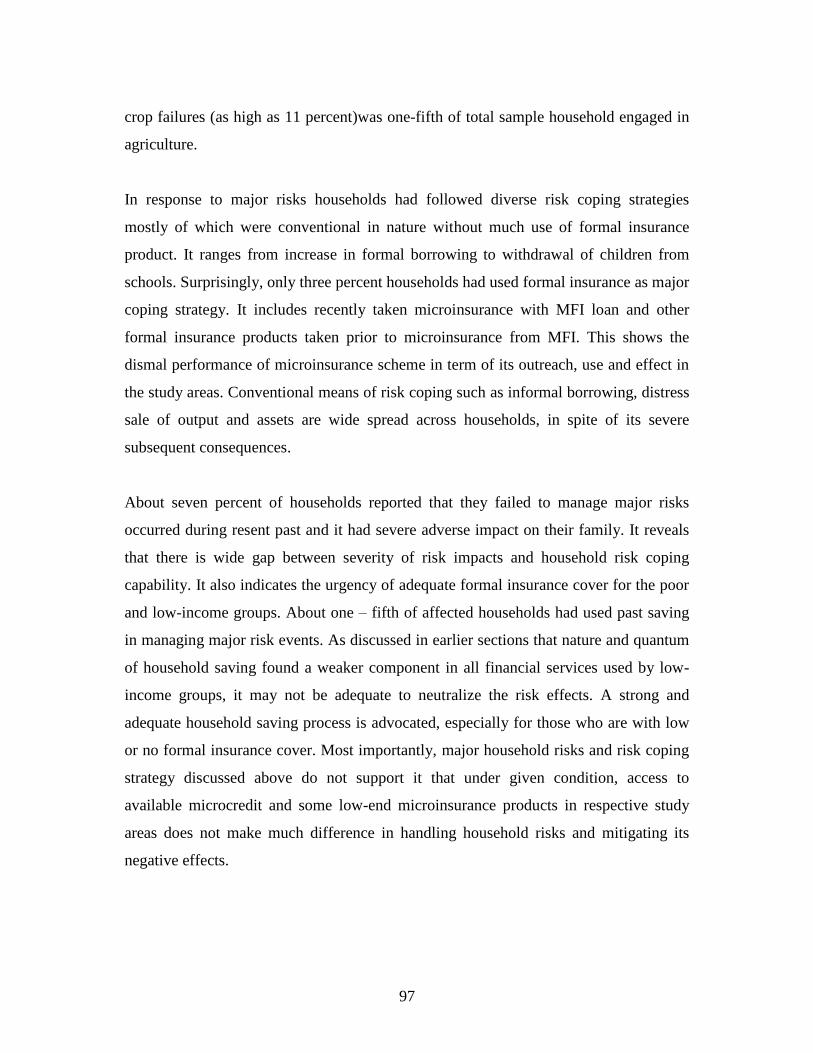
97
crop failures (as high as 11 percent)was one-fifth of total sample household engaged in
agriculture.
In response to major risks households had followed diverse risk coping strategies
mostly of which were conventional in nature without much use of formal insurance
product. It ranges from increase in formal borrowing to withdrawal of children from
schools. Surprisingly, only three percent households had used formal insurance as major
coping strategy. It includes recently taken microinsurance with MFI loan and other
formal insurance products taken prior to microinsurance from MFI. This shows the
dismal performance of microinsurance scheme in term of its outreach, use and effect in
the study areas. Conventional means of risk coping such as informal borrowing, distress
sale of output and assets are wide spread across households, in spite of its severe
subsequent consequences.
About seven percent of households reported that they failed to manage major risks
occurred during resent past and it had severe adverse impact on their family. It reveals
that there is wide gap between severity of risk impacts and household risk coping
capability. It also indicates the urgency of adequate formal insurance cover for the poor
and low-income groups. About one – fifth of affected households had used past saving
in managing major risk events. As discussed in earlier sections that nature and quantum
of household saving found a weaker component in all financial services used by low-
income groups, it may not be adequate to neutralize the risk effects. A strong and
adequate household saving process is advocated, especially for those who are with low
or no formal insurance cover. Most importantly, major household risks and risk coping
strategy discussed above do not support it that under given condition, access to
available microcredit and some low-end microinsurance products in respective study
areas does not make much difference in handling household risks and mitigating its
negative effects.
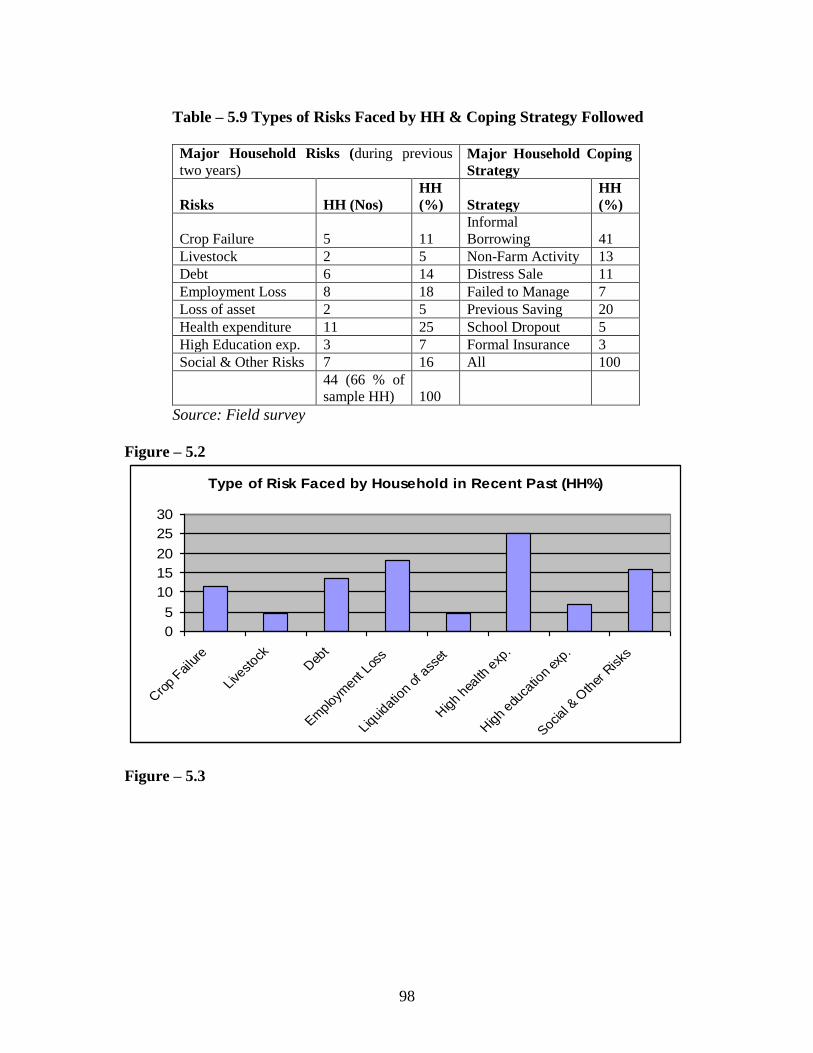
98
Table – 5.9 Types of Risks Faced by HH & Coping Strategy Followed
Major Household Risks (during previous
two years) Major Household Coping
Strategy
Risks HH (Nos)
HH
(%) Strategy
HH
(%)
Crop Failure 5 11
Informal
Borrowing 41
Livestock 2 5 Non-Farm Activity 13
Debt 6 14 Distress Sale 11
Employment Loss 8 18 Failed to Manage 7
Loss of asset 2 5 Previous Saving 20
Health expenditure 11 25 School Dropout 5
High Education exp. 3 7 Formal Insurance 3
Social & Other Risks 7 16 All 100
44 (66 % of
sample HH) 100
Source: Field survey
Figure – 5.2
Type of Risk Faced by Household in Recent Past (HH%)
0
5
10
15
20
25
30
Cro
p Failure
Livestock
Deb
t
Emplo
yment
Los
s
Liquid
ation
of a
sset
High h
ealth
exp
.
High e
duca
tion
exp.
Social &
Oth
er R
isks
Figure – 5.3
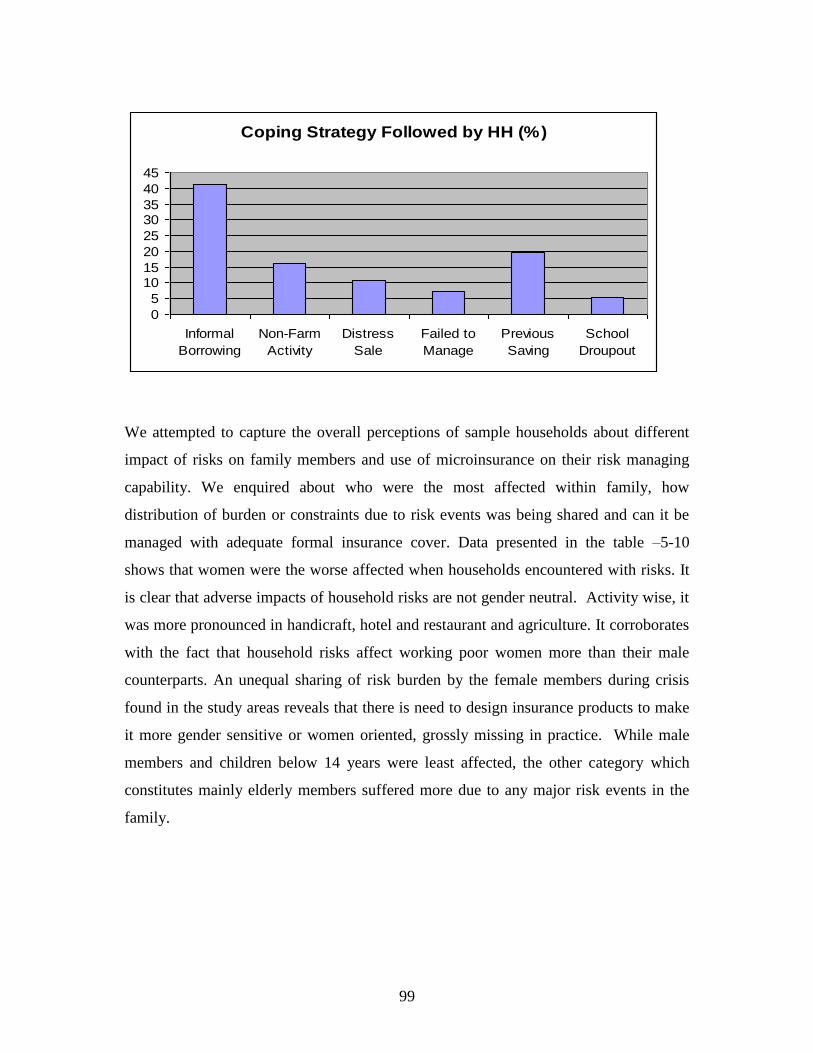
99
Coping Strategy Followed by HH (%)
0
5
1015
20
25
3035
40
45
Informal
Borrowing
Non-Farm
Activity
Distress
Sale
Failed to
Manage
Previous
Saving
School
Droupout
We attempted to capture the overall perceptions of sample households about different
impact of risks on family members and use of microinsurance on their risk managing
capability. We enquired about who were the most affected within family, how
distribution of burden or constraints due to risk events was being shared and can it be
managed with adequate formal insurance cover. Data presented in the table –5-10
shows that women were the worse affected when households encountered with risks. It
is clear that adverse impacts of household risks are not gender neutral. Activity wise, it
was more pronounced in handicraft, hotel and restaurant and agriculture. It corroborates
with the fact that household risks affect working poor women more than their male
counterparts. An unequal sharing of risk burden by the female members during crisis
found in the study areas reveals that there is need to design insurance products to make
it more gender sensitive or women oriented, grossly missing in practice. While male
members and children below 14 years were least affected, the other category which
constitutes mainly elderly members suffered more due to any major risk events in the
family.
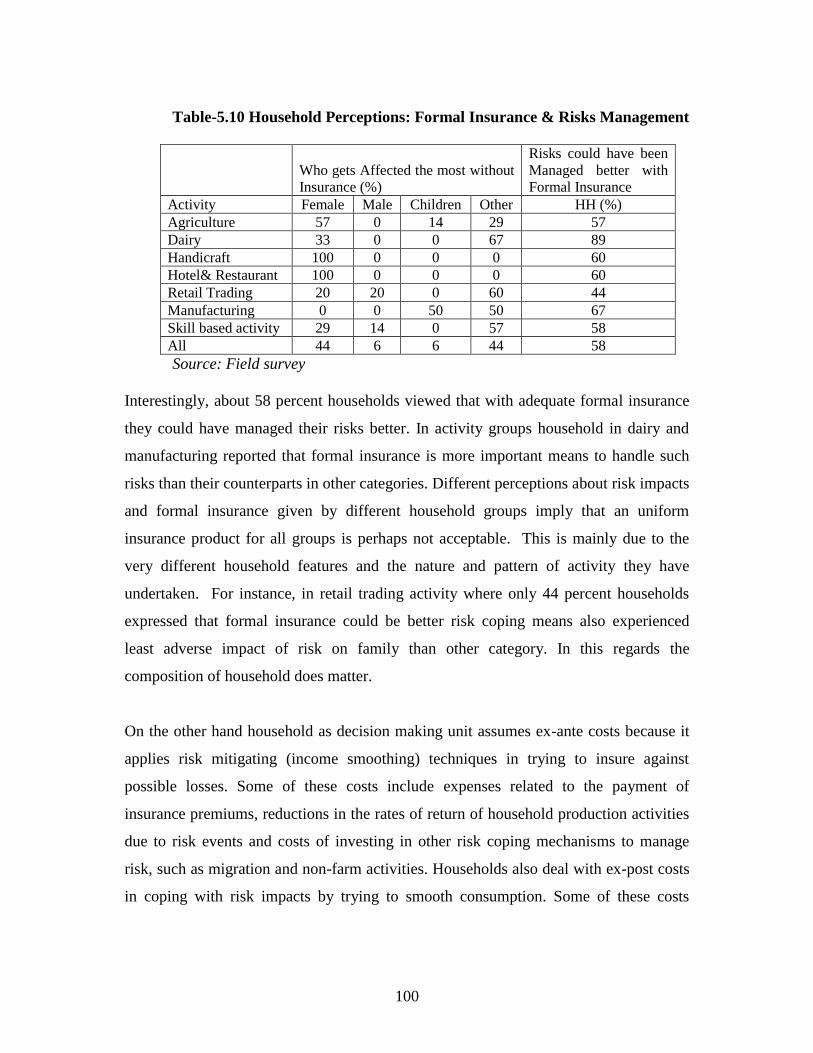
100
Table-5.10 Household Perceptions: Formal Insurance & Risks Management
Who gets Affected the most without
Insurance (%)
Risks could have been
Managed better with
Formal Insurance
Activity Female Male Children Other HH (%)
Agriculture 57 0 14 29 57
Dairy 33 0 0 67 89
Handicraft 100 0 0 0 60
Hotel& Restaurant 100 0 0 0 60
Retail Trading 20 20 0 60 44
Manufacturing 0 0 50 50 67
Skill based activity 29 14 0 57 58
All 44 6 6 44 58
Source: Field survey
Interestingly, about 58 percent households viewed that with adequate formal insurance
they could have managed their risks better. In activity groups household in dairy and
manufacturing reported that formal insurance is more important means to handle such
risks than their counterparts in other categories. Different perceptions about risk impacts
and formal insurance given by different household groups imply that an uniform
insurance product for all groups is perhaps not acceptable. This is mainly due to the
very different household features and the nature and pattern of activity they have
undertaken. For instance, in retail trading activity where only 44 percent households
expressed that formal insurance could be better risk coping means also experienced
least adverse impact of risk on family than other category. In this regards the
composition of household does matter.
On the other hand household as decision making unit assumes ex-ante costs because it
applies risk mitigating (income smoothing) techniques in trying to insure against
possible losses. Some of these costs include expenses related to the payment of
insurance premiums, reductions in the rates of return of household production activities
due to risk events and costs of investing in other risk coping mechanisms to manage
risk, such as migration and non-farm activities. Households also deal with ex-post costs
in coping with risk impacts by trying to smooth consumption. Some of these costs
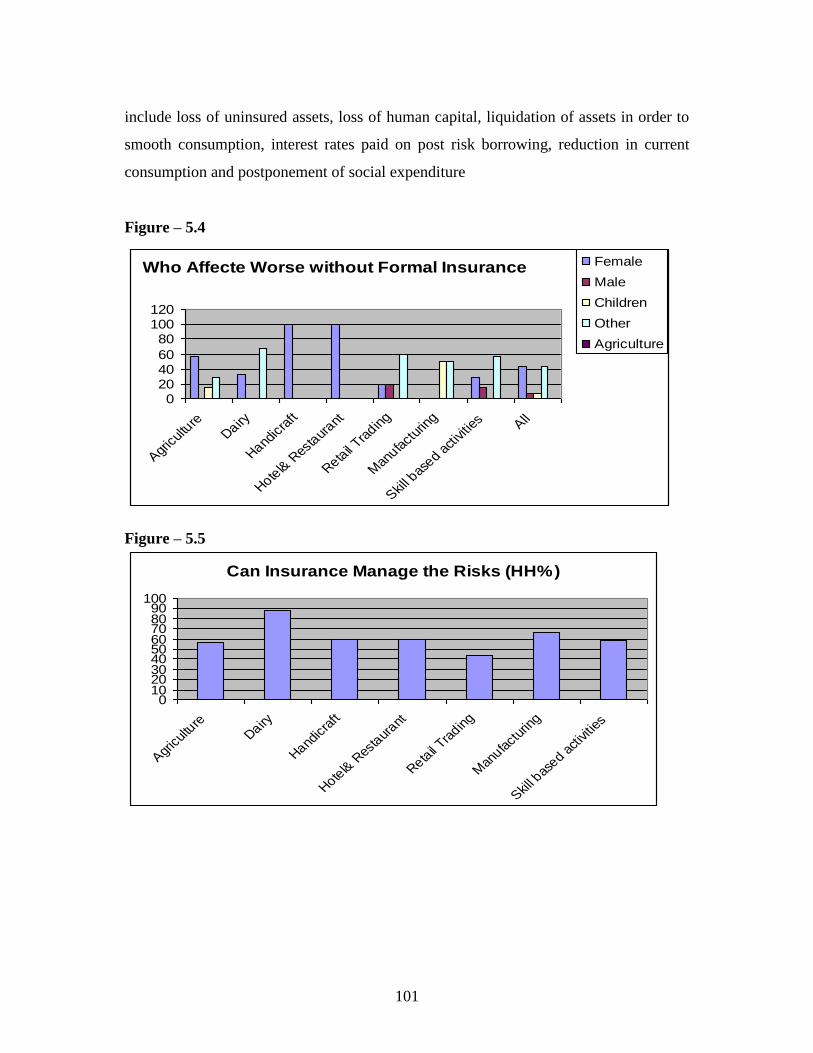
101
include loss of uninsured assets, loss of human capital, liquidation of assets in order to
smooth consumption, interest rates paid on post risk borrowing, reduction in current
consumption and postponement of social expenditure
Figure – 5.4
Who Affecte Worse without Formal Insurance
0204060
80100120
Agric
ultu
reDairy
Handic
raft
Hotel&
Res
taur
ant
Retail T
radin
g
Man
ufact
urin
g
Skill b
ased
activ
ities All
Female
Male
Children
Other
Agriculture
Figure – 5.5
Can Insurance Manage the Risks (HH%)
0102030405060708090
100
Agric
ultu
reDairy
Handic
raft
Hotel&
Res
taur
ant
Retail T
radin
g
Man
ufact
urin
g
Skill b
ased
activ
ities
102
Intra-Household Risk Coping
We have also attempted to highlight some intra-household risk coping mechanism in
terms of intra-household allocation of labor, reduction in critical household
expenditures (expenditure on food, health, education) in buffering the effects of
uninsured risks. As very recently the sample households are covered only under the
group term life insurance supplied with microcredit loan from MFI we assume that most
of their risks are uninsured with few exceptions. Two basic questions addressed here
are, First, do household risks induce a reallocation of labor within family? Second, if so,
is it distressed induced and gender neutral? Exogenous risk may induce reallocation of
labor within the household resulting in redistribution of work burden and possible
reduction of household expenditure. Here, the important implication from policy point
of view is that any policy intervention to improve the household‘s ability to manage
risks may also consider the issues of intra-household resource allocation.
It is believed that an adverse income or wealth impacts of risk may reduce the
household‘s overall welfare in the utilitarian sense. In contrast to the general belief of
bias against female members we found that intra-household allocation of labor between
male and female members was undertaken more or less in balanced way. Overall,
increase in working hours was being equally shared by males and females as a
household risk-induced coping strategy (see the table – 5.11). It may be noted that
within household the risk sharing and its impacts may vary with different intensity. It is
not easy to net out to show the actual working hours or work burden of females,
particularly incase of a risk event due to several socio-cultural factors well documented
in the literature. However, a sharp gender inequality evident from the data in terms of
reduction in health expenditure for women reiterates the fact that adverse impact of
risks are not gender neutral. It is also visible in terms of reduction of education
expenditure as girls are bearing bigger part of the reduction than boys. In common
practice, girls are the first to withdraw from schools in case of household contingency.
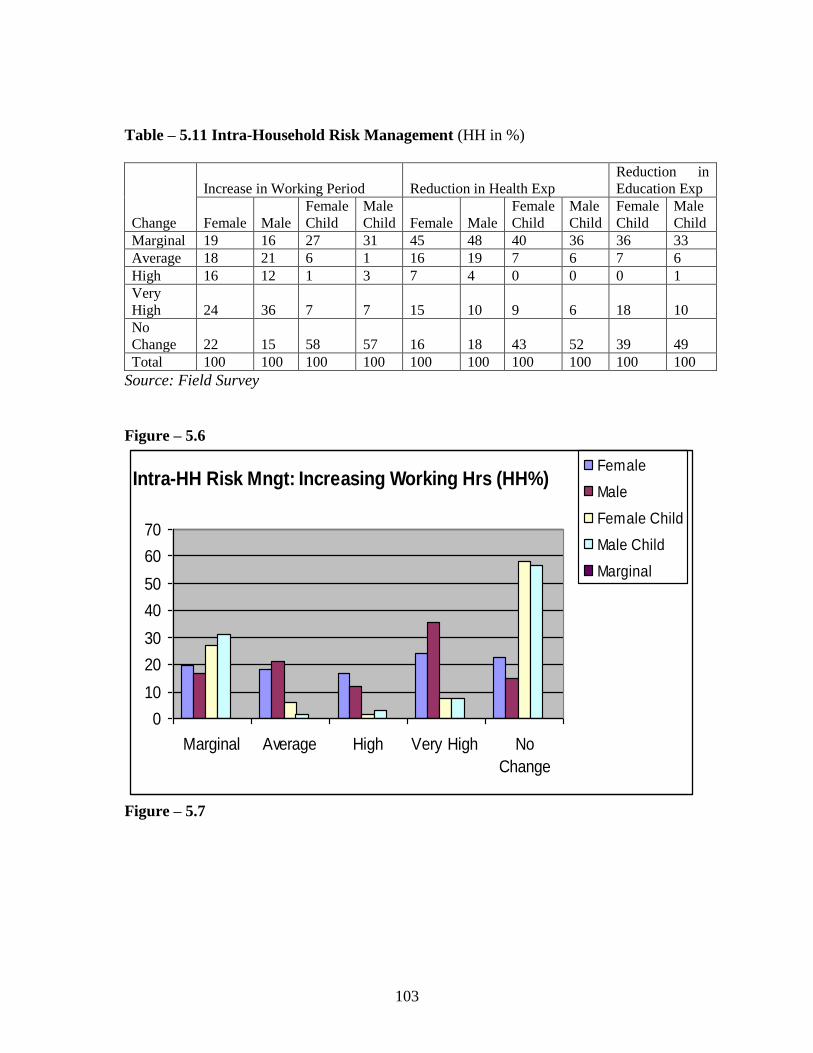
103
Table – 5.11 Intra-Household Risk Management (HH in %)
Change
Increase in Working Period Reduction in Health Exp
Reduction in
Education Exp
Female Male
Female
Child
Male
Child Female Male
Female
Child
Male
Child
Female
Child
Male
Child
Marginal 19 16 27 31 45 48 40 36 36 33
Average 18 21 6 1 16 19 7 6 7 6
High 16 12 1 3 7 4 0 0 0 1
Very
High 24 36 7 7 15 10 9 6 18 10
No
Change 22 15 58 57 16 18 43 52 39 49
Total 100 100 100 100 100 100 100 100 100 100
Source: Field Survey
Figure – 5.6
Intra-HH Risk Mngt: Increasing Working Hrs (HH%)
0
10
20
30
40
50
60
70
Marginal Average High Very High No
Change
Female
Male
Female Child
Male Child
Marginal
Figure – 5.7
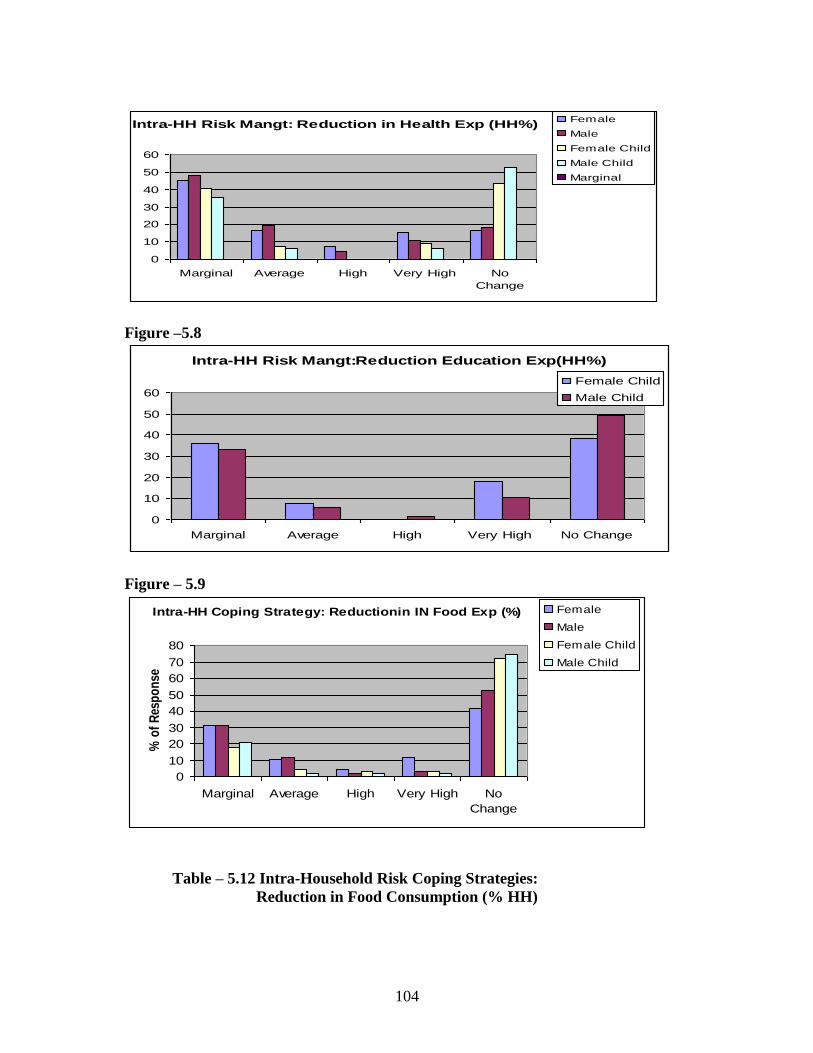
104
Intra-HH Risk Mangt: Reduction in Health Exp (HH%)
0
10
20
30
40
50
60
Marginal Average High Very High No
Change
Female
Male
Female Child
Male Child
Marginal
Figure –5.8
Intra-HH Risk Mangt:Reduction Education Exp(HH%)
0
10
20
30
40
50
60
Marginal Average High Very High No Change
Female Child
Male Child
Figure – 5.9
Intra-HH Coping Strategy: Reductionin IN Food Exp (%)
0
10
20
30
40
50
60
70
80
Marginal Average High Very High No
Change
% o
f R
esp
on
se
Female
Male
Female Child
Male Child
Table – 5.12 Intra-Household Risk Coping Strategies:
Reduction in Food Consumption (% HH)
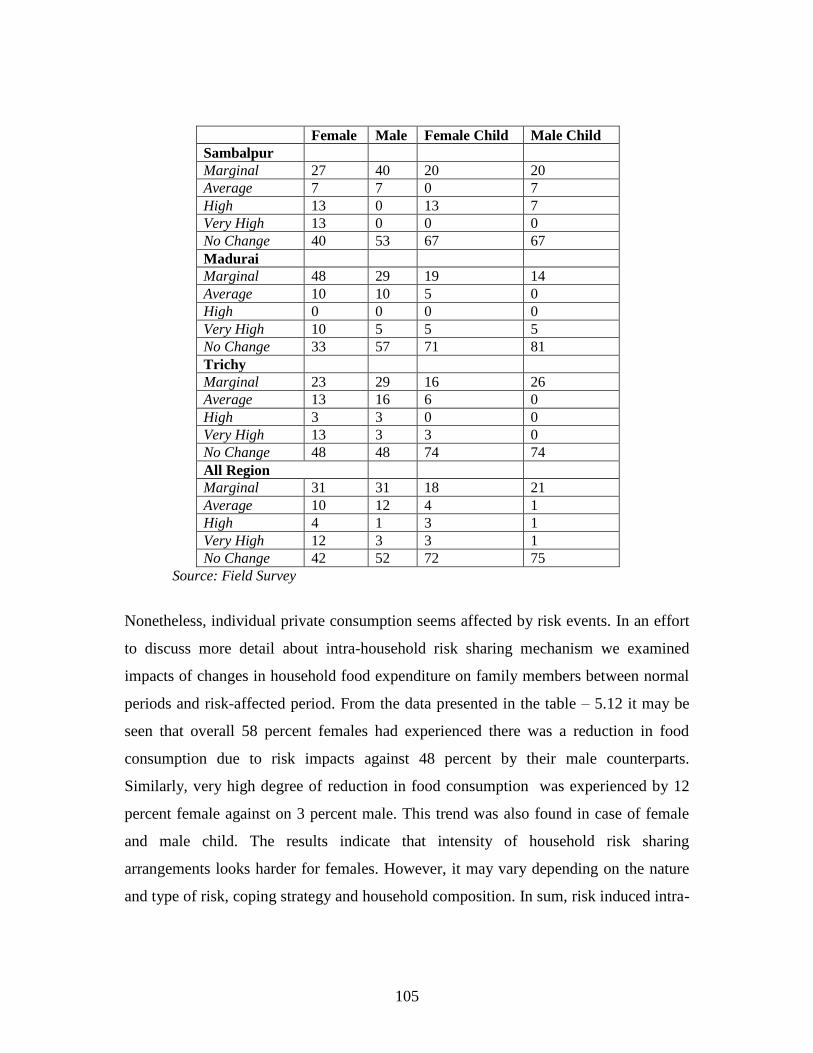
105
Female Male Female Child Male Child
Sambalpur
Marginal 27 40 20 20
Average 7 7 0 7
High 13 0 13 7
Very High 13 0 0 0
No Change 40 53 67 67
Madurai
Marginal 48 29 19 14
Average 10 10 5 0
High 0 0 0 0
Very High 10 5 5 5
No Change 33 57 71 81
Trichy
Marginal 23 29 16 26
Average 13 16 6 0
High 3 3 0 0
Very High 13 3 3 0
No Change 48 48 74 74
All Region
Marginal 31 31 18 21
Average 10 12 4 1
High 4 1 3 1
Very High 12 3 3 1
No Change 42 52 72 75
Source: Field Survey
Nonetheless, individual private consumption seems affected by risk events. In an effort
to discuss more detail about intra-household risk sharing mechanism we examined
impacts of changes in household food expenditure on family members between normal
periods and risk-affected period. From the data presented in the table – 5.12 it may be
seen that overall 58 percent females had experienced there was a reduction in food
consumption due to risk impacts against 48 percent by their male counterparts.
Similarly, very high degree of reduction in food consumption was experienced by 12
percent female against on 3 percent male. This trend was also found in case of female
and male child. The results indicate that intensity of household risk sharing
arrangements looks harder for females. However, it may vary depending on the nature
and type of risk, coping strategy and household composition. In sum, risk induced intra-
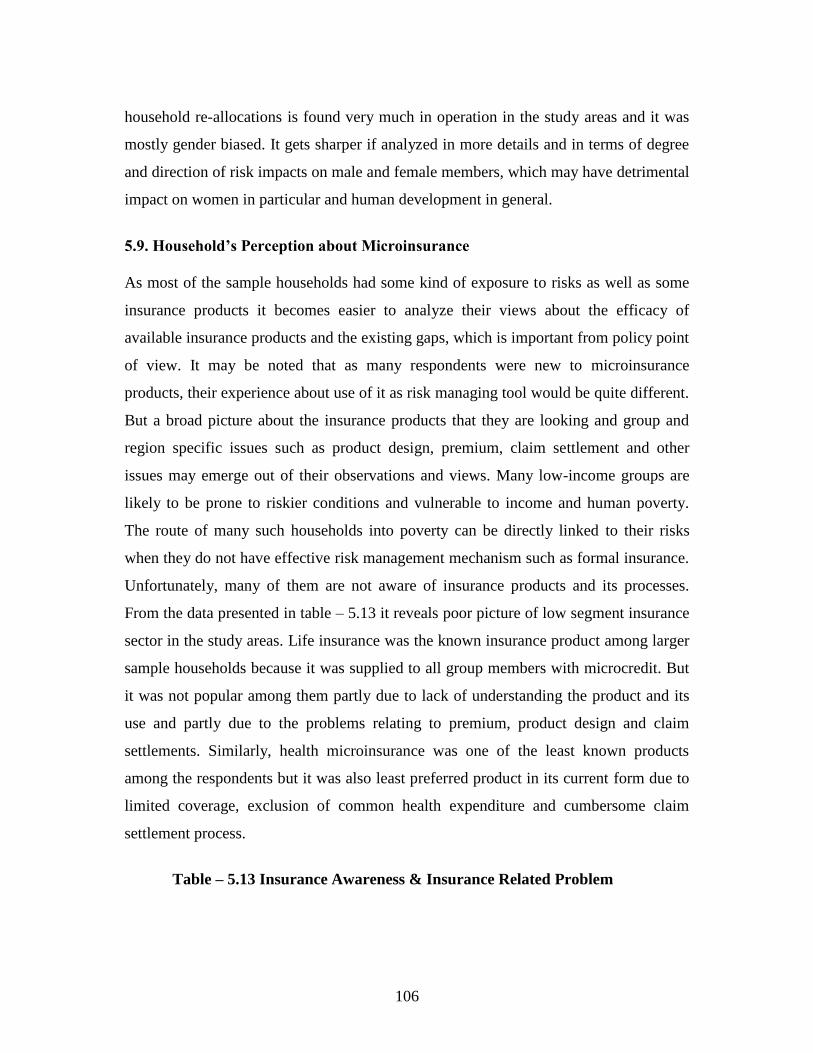
106
household re-allocations is found very much in operation in the study areas and it was
mostly gender biased. It gets sharper if analyzed in more details and in terms of degree
and direction of risk impacts on male and female members, which may have detrimental
impact on women in particular and human development in general.
5.9. Household’s Perception about Microinsurance
As most of the sample households had some kind of exposure to risks as well as some
insurance products it becomes easier to analyze their views about the efficacy of
available insurance products and the existing gaps, which is important from policy point
of view. It may be noted that as many respondents were new to microinsurance
products, their experience about use of it as risk managing tool would be quite different.
But a broad picture about the insurance products that they are looking and group and
region specific issues such as product design, premium, claim settlement and other
issues may emerge out of their observations and views. Many low-income groups are
likely to be prone to riskier conditions and vulnerable to income and human poverty.
The route of many such households into poverty can be directly linked to their risks
when they do not have effective risk management mechanism such as formal insurance.
Unfortunately, many of them are not aware of insurance products and its processes.
From the data presented in table – 5.13 it reveals poor picture of low segment insurance
sector in the study areas. Life insurance was the known insurance product among larger
sample households because it was supplied to all group members with microcredit. But
it was not popular among them partly due to lack of understanding the product and its
use and partly due to the problems relating to premium, product design and claim
settlements. Similarly, health microinsurance was one of the least known products
among the respondents but it was also least preferred product in its current form due to
limited coverage, exclusion of common health expenditure and cumbersome claim
settlement process.
Table – 5.13 Insurance Awareness & Insurance Related Problem
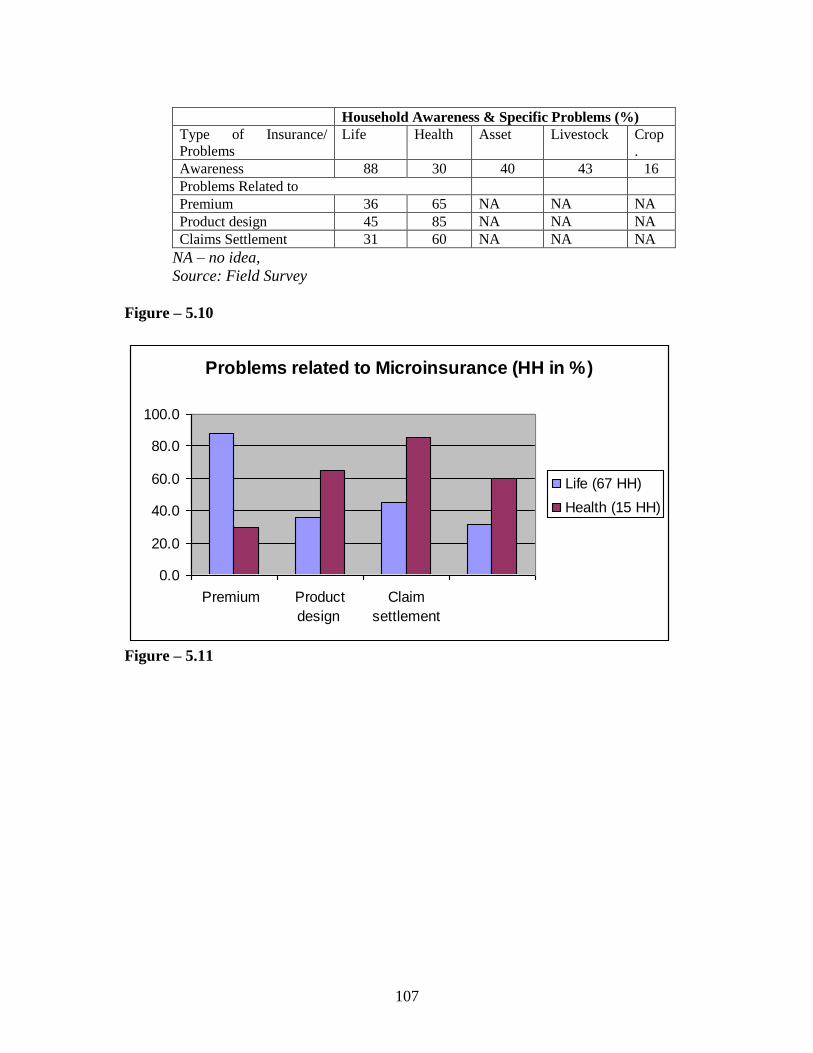
107
Household Awareness & Specific Problems (%)
Type of Insurance/
Problems
Life
Health
Asset
Livestock
Crop
.
Awareness 88 30 40 43 16
Problems Related to
Premium 36 65 NA NA NA
Product design 45 85 NA NA NA
Claims Settlement 31 60 NA NA NA
NA – no idea,
Source: Field Survey
Figure – 5.10
Problems related to Microinsurance (HH in %)
0.0
20.0
40.0
60.0
80.0
100.0
Premium Product
design
Claim
settlement
Life (67 HH)
Health (15 HH)
Figure – 5.11
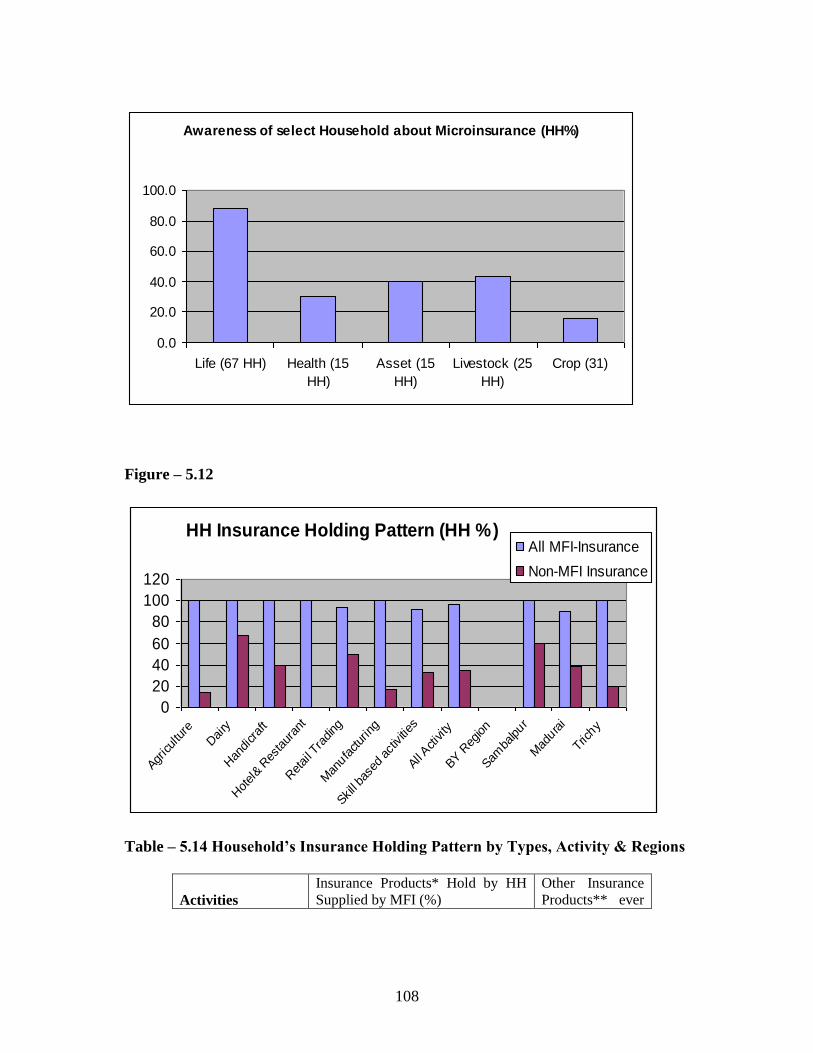
108
Awareness of select Household about Microinsurance (HH%)
0.0
20.0
40.0
60.0
80.0
100.0
Life (67 HH) Health (15
HH)
Asset (15
HH)
Livestock (25
HH)
Crop (31)
Figure – 5.12
HH Insurance Holding Pattern (HH %)
0
20
40
60
80
100
120
Agricul
ture
Dai
ry
Han
dicr
aft
Hot
el& R
esta
uran
t
Ret
ail T
rading
Man
ufactur
ing
Skill ba
sed
activ
ities
All Activity
BY R
egion
Samba
lpur
Mad
urai
Trichy
All MFI-Insurance
Non-MFI Insurance
Table – 5.14 Household’s Insurance Holding Pattern by Types, Activity & Regions
Activities
Insurance Products* Hold by HH
Supplied by MFI (%)
Other Insurance
Products** ever
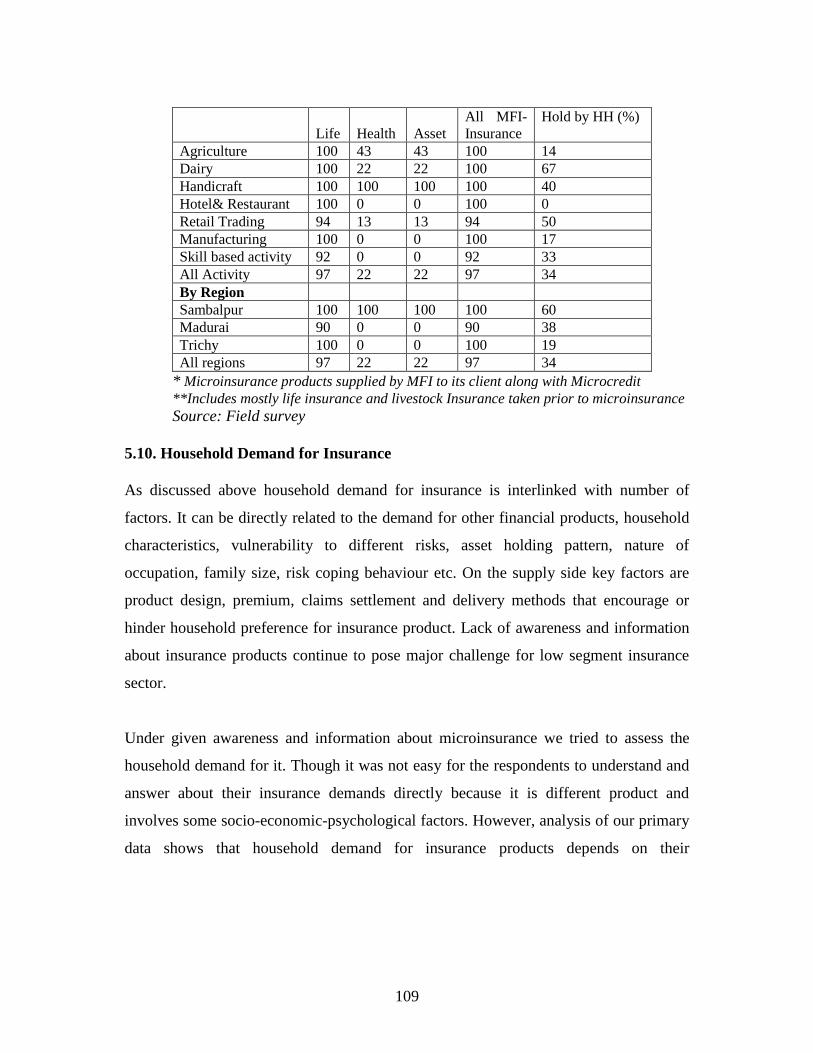
109
Life Health Asset
All MFI-
Insurance
Hold by HH (%)
Agriculture 100 43 43 100 14
Dairy 100 22 22 100 67
Handicraft 100 100 100 100 40
Hotel& Restaurant 100 0 0 100 0
Retail Trading 94 13 13 94 50
Manufacturing 100 0 0 100 17
Skill based activity 92 0 0 92 33
All Activity 97 22 22 97 34
By Region
Sambalpur 100 100 100 100 60
Madurai 90 0 0 90 38
Trichy 100 0 0 100 19
All regions 97 22 22 97 34
* Microinsurance products supplied by MFI to its client along with Microcredit
**Includes mostly life insurance and livestock Insurance taken prior to microinsurance
Source: Field survey
5.10. Household Demand for Insurance
As discussed above household demand for insurance is interlinked with number of
factors. It can be directly related to the demand for other financial products, household
characteristics, vulnerability to different risks, asset holding pattern, nature of
occupation, family size, risk coping behaviour etc. On the supply side key factors are
product design, premium, claims settlement and delivery methods that encourage or
hinder household preference for insurance product. Lack of awareness and information
about insurance products continue to pose major challenge for low segment insurance
sector.
Under given awareness and information about microinsurance we tried to assess the
household demand for it. Though it was not easy for the respondents to understand and
answer about their insurance demands directly because it is different product and
involves some socio-economic-psychological factors. However, analysis of our primary
data shows that household demand for insurance products depends on their
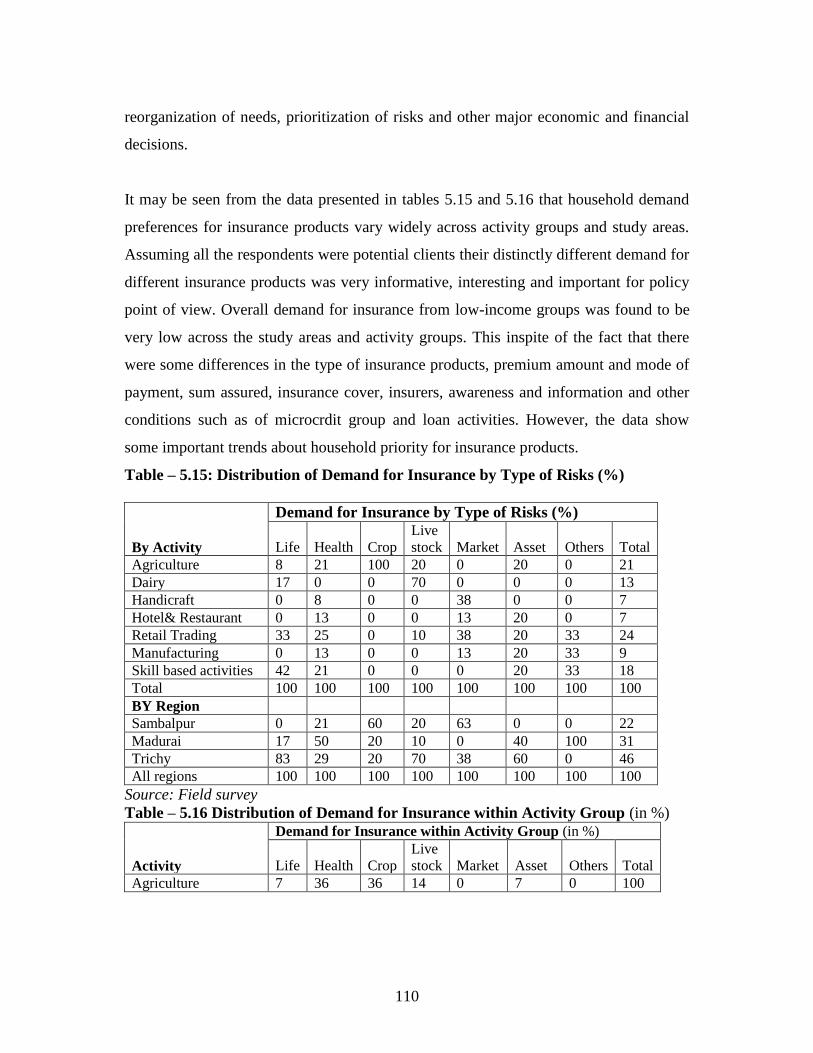
110
reorganization of needs, prioritization of risks and other major economic and financial
decisions.
It may be seen from the data presented in tables 5.15 and 5.16 that household demand
preferences for insurance products vary widely across activity groups and study areas.
Assuming all the respondents were potential clients their distinctly different demand for
different insurance products was very informative, interesting and important for policy
point of view. Overall demand for insurance from low-income groups was found to be
very low across the study areas and activity groups. This inspite of the fact that there
were some differences in the type of insurance products, premium amount and mode of
payment, sum assured, insurance cover, insurers, awareness and information and other
conditions such as of microcrdit group and loan activities. However, the data show
some important trends about household priority for insurance products.
Table – 5.15: Distribution of Demand for Insurance by Type of Risks (%)
By Activity
Demand for Insurance by Type of Risks (%)
Life Health Crop
Live
stock Market Asset Others Total
Agriculture 8 21 100 20 0 20 0 21
Dairy 17 0 0 70 0 0 0 13
Handicraft 0 8 0 0 38 0 0 7
Hotel& Restaurant 0 13 0 0 13 20 0 7
Retail Trading 33 25 0 10 38 20 33 24
Manufacturing 0 13 0 0 13 20 33 9
Skill based activities 42 21 0 0 0 20 33 18
Total 100 100 100 100 100 100 100 100
BY Region
Sambalpur 0 21 60 20 63 0 0 22
Madurai 17 50 20 10 0 40 100 31
Trichy 83 29 20 70 38 60 0 46
All regions 100 100 100 100 100 100 100 100
Source: Field survey
Table – 5.16 Distribution of Demand for Insurance within Activity Group (in %)
Activity
Demand for Insurance within Activity Group (in %)
Life Health Crop
Live
stock Market Asset Others Total
Agriculture 7 36 36 14 0 7 0 100
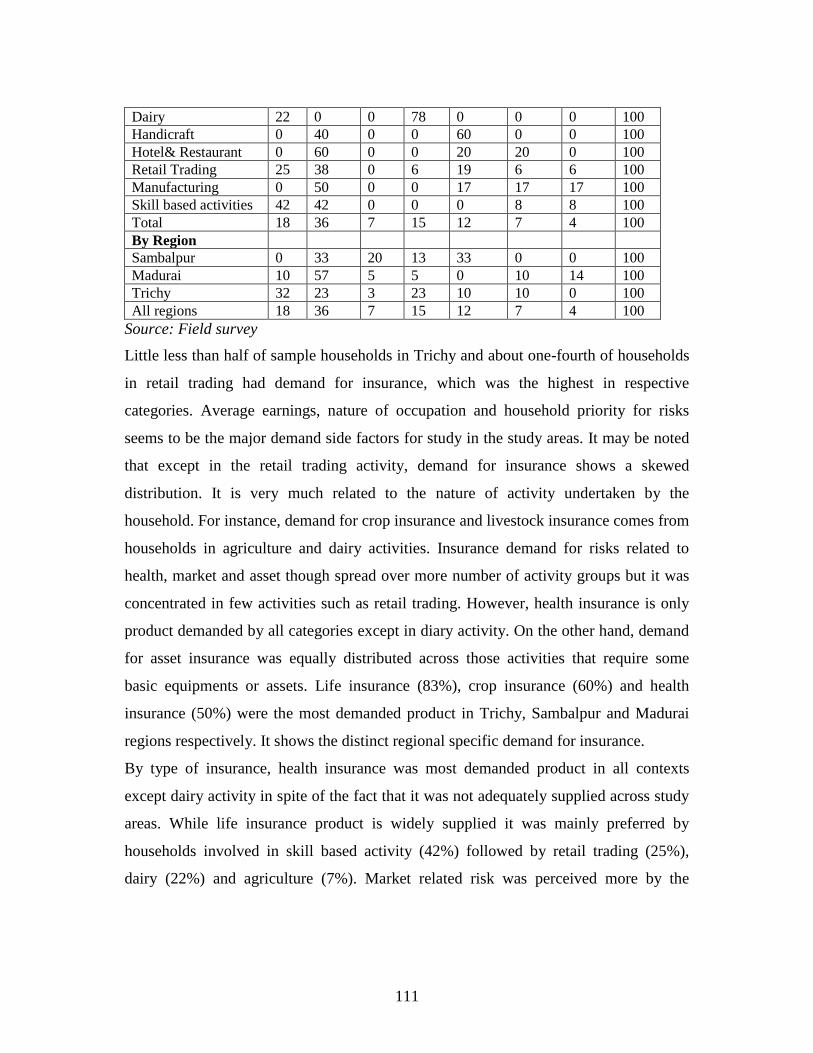
111
Dairy 22 0 0 78 0 0 0 100
Handicraft 0 40 0 0 60 0 0 100
Hotel& Restaurant 0 60 0 0 20 20 0 100
Retail Trading 25 38 0 6 19 6 6 100
Manufacturing 0 50 0 0 17 17 17 100
Skill based activities 42 42 0 0 0 8 8 100
Total 18 36 7 15 12 7 4 100
By Region
Sambalpur 0 33 20 13 33 0 0 100
Madurai 10 57 5 5 0 10 14 100
Trichy 32 23 3 23 10 10 0 100
All regions 18 36 7 15 12 7 4 100
Source: Field survey
Little less than half of sample households in Trichy and about one-fourth of households
in retail trading had demand for insurance, which was the highest in respective
categories. Average earnings, nature of occupation and household priority for risks
seems to be the major demand side factors for study in the study areas. It may be noted
that except in the retail trading activity, demand for insurance shows a skewed
distribution. It is very much related to the nature of activity undertaken by the
household. For instance, demand for crop insurance and livestock insurance comes from
households in agriculture and dairy activities. Insurance demand for risks related to
health, market and asset though spread over more number of activity groups but it was
concentrated in few activities such as retail trading. However, health insurance is only
product demanded by all categories except in diary activity. On the other hand, demand
for asset insurance was equally distributed across those activities that require some
basic equipments or assets. Life insurance (83%), crop insurance (60%) and health
insurance (50%) were the most demanded product in Trichy, Sambalpur and Madurai
regions respectively. It shows the distinct regional specific demand for insurance.
By type of insurance, health insurance was most demanded product in all contexts
except dairy activity in spite of the fact that it was not adequately supplied across study
areas. While life insurance product is widely supplied it was mainly preferred by
households involved in skill based activity (42%) followed by retail trading (25%),
dairy (22%) and agriculture (7%). Market related risk was perceived more by the
112
households engaged in handicrafts because the production is largely external market
oriented. It was reflected in terms of their high demand for insurance to cover market
risks. But there was hardly any such insurance available to low income groups.
In many contexts, demand for health insurance is pronounced than life insurance. On
the other hand, production oriented and need specific insurance demand was found to be
substantial in the study areas. For instance, high demand for livestock insurance among
households involved in diary activity shows their customized insurance needs. It gives
some market signal that can be used by the insurance companies. It is possible that in
the absence of customized insurance products, many households would tend to depend
upon less formal coping mechanisms. Similarly, market related risks affect some groups
more than others depending on several factors but there was no such provision to cover
market risks as perceived by the households.
From the above discussion, it is evident that there is diverse demand for insurance
product at low segment market mainly coming out of the household‘s features and their
priorities. Since available insurance products are mostly supply driven and limited
variety, a huge gap in low segment insurance market is visible. It appears that there is
either poor understanding about low segment insurance market or there are some other
issues such as infrastructure, cost of operation and technology use, policy interventions
etc. affecting the functioning of this market.
Figure – 5.13
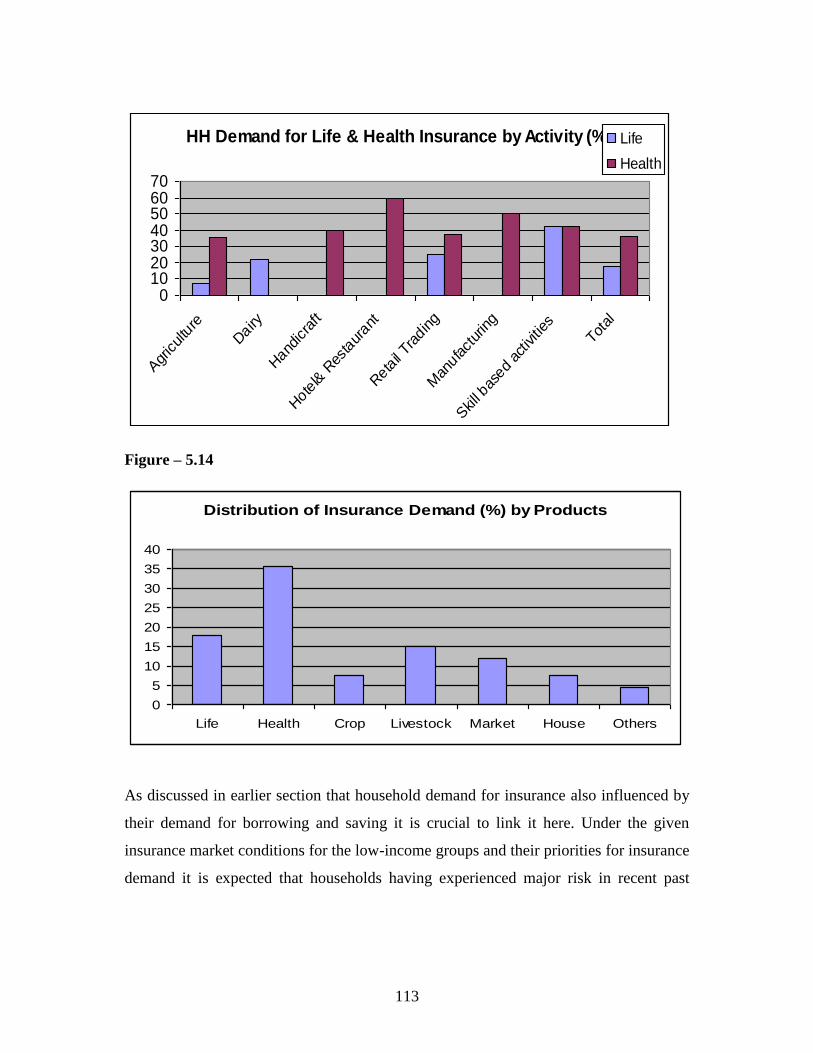
113
HH Demand for Life & Health Insurance by Activity (%)
010203040506070
Agr
icultu
re
Dairy
Hand
icra
ft
Hote
l& R
esta
urant
Reta
il Tra
ding
Man
ufact
uring
Skill bas
ed ac
tivities
Total
Life
Health
Figure – 5.14
Distribution of Insurance Demand (%) by Products
0
5
10
15
20
25
30
35
40
Life Health Crop Livestock Market House Others
As discussed in earlier section that household demand for insurance also influenced by
their demand for borrowing and saving it is crucial to link it here. Under the given
insurance market conditions for the low-income groups and their priorities for insurance
demand it is expected that households having experienced major risk in recent past
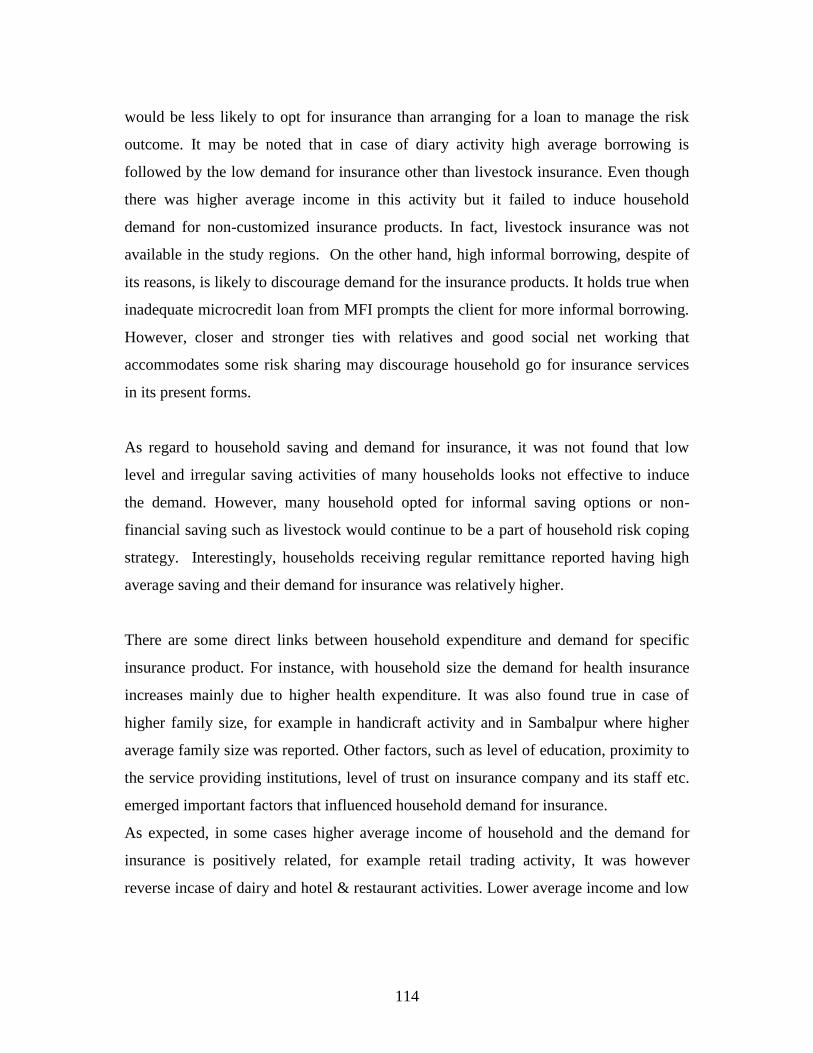
114
would be less likely to opt for insurance than arranging for a loan to manage the risk
outcome. It may be noted that in case of diary activity high average borrowing is
followed by the low demand for insurance other than livestock insurance. Even though
there was higher average income in this activity but it failed to induce household
demand for non-customized insurance products. In fact, livestock insurance was not
available in the study regions. On the other hand, high informal borrowing, despite of
its reasons, is likely to discourage demand for the insurance products. It holds true when
inadequate microcredit loan from MFI prompts the client for more informal borrowing.
However, closer and stronger ties with relatives and good social net working that
accommodates some risk sharing may discourage household go for insurance services
in its present forms.
As regard to household saving and demand for insurance, it was not found that low
level and irregular saving activities of many households looks not effective to induce
the demand. However, many household opted for informal saving options or non-
financial saving such as livestock would continue to be a part of household risk coping
strategy. Interestingly, households receiving regular remittance reported having high
average saving and their demand for insurance was relatively higher.
There are some direct links between household expenditure and demand for specific
insurance product. For instance, with household size the demand for health insurance
increases mainly due to higher health expenditure. It was also found true in case of
higher family size, for example in handicraft activity and in Sambalpur where higher
average family size was reported. Other factors, such as level of education, proximity to
the service providing institutions, level of trust on insurance company and its staff etc.
emerged important factors that influenced household demand for insurance.
As expected, in some cases higher average income of household and the demand for
insurance is positively related, for example retail trading activity, It was however
reverse incase of dairy and hotel & restaurant activities. Lower average income and low
115
insurance demand in some groups such as handicraft activity shows that pricing of
insurance products is a sensitive matter, even if it is offered at lower price. In fact,
some low-income households believed that payment of premium during a crisis period
itself is a risk. However, during our survey we came across of number of people who
were keen to pay the prescribed price or even more for a well customized insurance
product, particularly for health risks that will take care of their specific needs. On the
other hand, a higher insurance demand with relatively lower average income, as the
case of skill based activity, shows the household high priority for the formal insurance
for risk management. Here, household features such as level of education and small
family size also matter in shaping household insurance demand.
Regarding the level of household income and their participation in insurance market, as
discussed earlier, does not hold stronger, especially where household income from non-
loan activities is not high. In contrast to some common believe that MFI‘s microcredit
programme and its income generating effect would induce increase in insurance uptake
among its clients may not be always true. It may be noted that microinsurance and
microcredit programme in study areas are closely related in terms of access, premium
payment, claim settlement and other services. From the above discussion it appears that
to meet the twin objectives of outreach and efficacy of microinsurance in the current
form is under doubt. Though much is not known about all contexts of microinsurance
and it is also not appropriate to generalize with the findings of smaller study like the
present one but some important trends emerging from this study may be used by
different stakeholders.
We have tried to capture some degree and direction of relationships among major
variables that influence directly and indirectly household risk coping behaviour and
other economic decision making. The correlation results are presented in the correlation
given below. As discussed above, there is high and significant positive correlation
between households exposed to risk and informal borrowing which reemphasizes that
informal household borrowing continues as key risk aversion tool. Other key factors
116
such as formal borrowing, income from major activity, total household income and
saving are negatively related with household risks showing some kind of risk reduction
role played by these variables but at insignificant level.
On the other hand, household demand for insurance significantly related to household
income and saving. Though this trend seems not match with some general observations
of sample households, as discussed elsewhere, the difference in nature and earning
pattern of major activity/occupation might be reflected here. In other words, households
involved in a high-return activity having relatively higher surplus may opt for variety of
financial product including insurance, unlike the households engaged in low-return
activity.
Intra-household risk-sharing and gender variables are positive and significant in many
contexts. This substantiates the argument that in case of risk events females, particularly
female working members are likely to share more burden than their male counterparts.
This reflected in terms of high and positive correlation between size of working
members, female worker and family size. It may be noted that the formal borrowing and
demand for insurance shows high positive association as compared to informal
borrowing, but it is found insignificant. In sum, the overall trends emerged from our
discussions based on sample households‘ observations and perceptions are more or less
similar to the results presented in the correlation table given below.
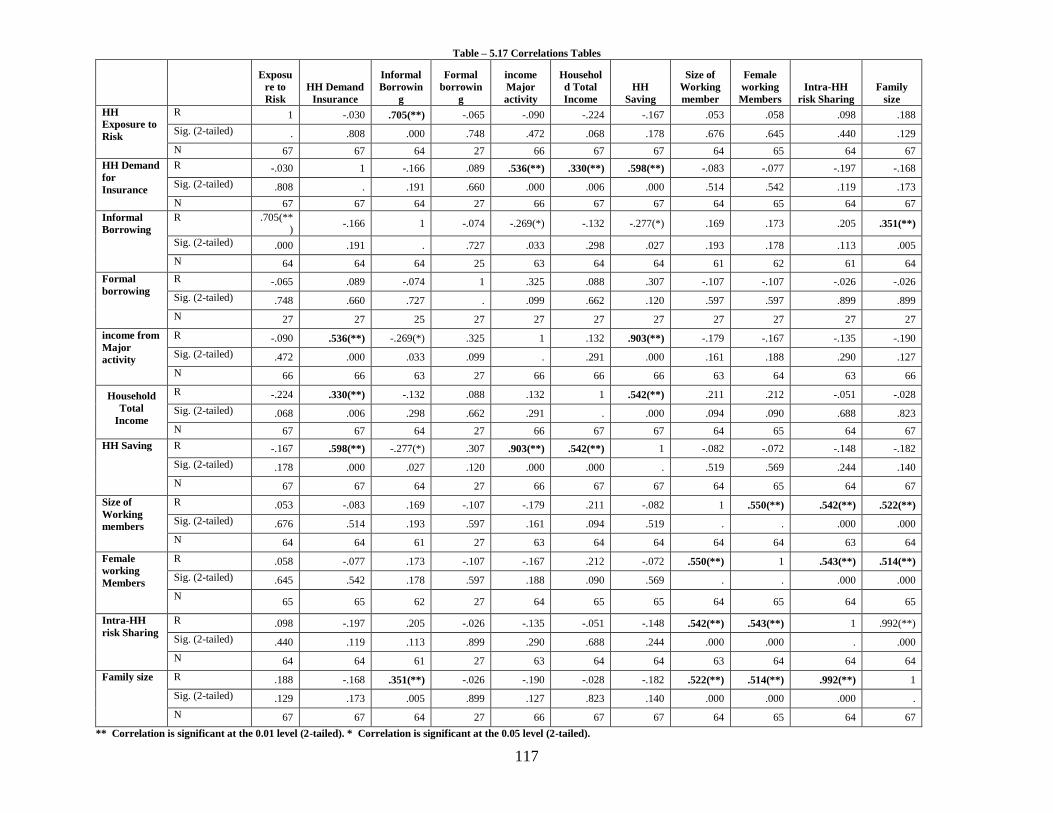
117
Table – 5.17 Correlations Tables
Exposu
re to
Risk
HH Demand
Insurance
Informal
Borrowin
g
Formal
borrowin
g
income
Major
activity
Househol
d Total
Income
HH
Saving
Size of
Working
member
Female
working
Members
Intra-HH
risk Sharing
Family
size
HH
Exposure to
Risk
R 1 -.030 .705(**) -.065 -.090 -.224 -.167 .053 .058 .098 .188
Sig. (2-tailed) . .808 .000 .748 .472 .068 .178 .676 .645 .440 .129
N 67 67 64 27 66 67 67 64 65 64 67
HH Demand
for
Insurance
R -.030 1 -.166 .089 .536(**) .330(**) .598(**) -.083 -.077 -.197 -.168
Sig. (2-tailed) .808 . .191 .660 .000 .006 .000 .514 .542 .119 .173
N 67 67 64 27 66 67 67 64 65 64 67
Informal
Borrowing
R .705(**)
-.166 1 -.074 -.269(*) -.132 -.277(*) .169 .173 .205 .351(**)
Sig. (2-tailed) .000 .191 . .727 .033 .298 .027 .193 .178 .113 .005
N 64 64 64 25 63 64 64 61 62 61 64
Formal
borrowing
R -.065 .089 -.074 1 .325 .088 .307 -.107 -.107 -.026 -.026
Sig. (2-tailed) .748 .660 .727 . .099 .662 .120 .597 .597 .899 .899
N 27 27 25 27 27 27 27 27 27 27 27
income from
Major
activity
R -.090 .536(**) -.269(*) .325 1 .132 .903(**) -.179 -.167 -.135 -.190
Sig. (2-tailed) .472 .000 .033 .099 . .291 .000 .161 .188 .290 .127
N 66 66 63 27 66 66 66 63 64 63 66
Household
Total
Income
R -.224 .330(**) -.132 .088 .132 1 .542(**) .211 .212 -.051 -.028
Sig. (2-tailed) .068 .006 .298 .662 .291 . .000 .094 .090 .688 .823
N 67 67 64 27 66 67 67 64 65 64 67
HH Saving
R -.167 .598(**) -.277(*) .307 .903(**) .542(**) 1 -.082 -.072 -.148 -.182
Sig. (2-tailed) .178 .000 .027 .120 .000 .000 . .519 .569 .244 .140
N 67 67 64 27 66 67 67 64 65 64 67
Size of
Working
members
R .053 -.083 .169 -.107 -.179 .211 -.082 1 .550(**) .542(**) .522(**)
Sig. (2-tailed) .676 .514 .193 .597 .161 .094 .519 . . .000 .000
N 64 64 61 27 63 64 64 64 64 63 64
Female
working
Members
R .058 -.077 .173 -.107 -.167 .212 -.072 .550(**) 1 .543(**) .514(**)
Sig. (2-tailed) .645 .542 .178 .597 .188 .090 .569 . . .000 .000
N 65 65 62 27 64 65 65 64 65 64 65
Intra-HH
risk Sharing
R .098 -.197 .205 -.026 -.135 -.051 -.148 .542(**) .543(**) 1 .992(**)
Sig. (2-tailed) .440 .119 .113 .899 .290 .688 .244 .000 .000 . .000
N 64 64 61 27 63 64 64 63 64 64 64
Family size
R .188 -.168 .351(**) -.026 -.190 -.028 -.182 .522(**) .514(**) .992(**) 1
Sig. (2-tailed) .129 .173 .005 .899 .127 .823 .140 .000 .000 .000 .
N 67 67 64 27 66 67 67 64 65 64 67
** Correlation is significant at the 0.01 level (2-tailed). * Correlation is significant at the 0.05 level (2-tailed).
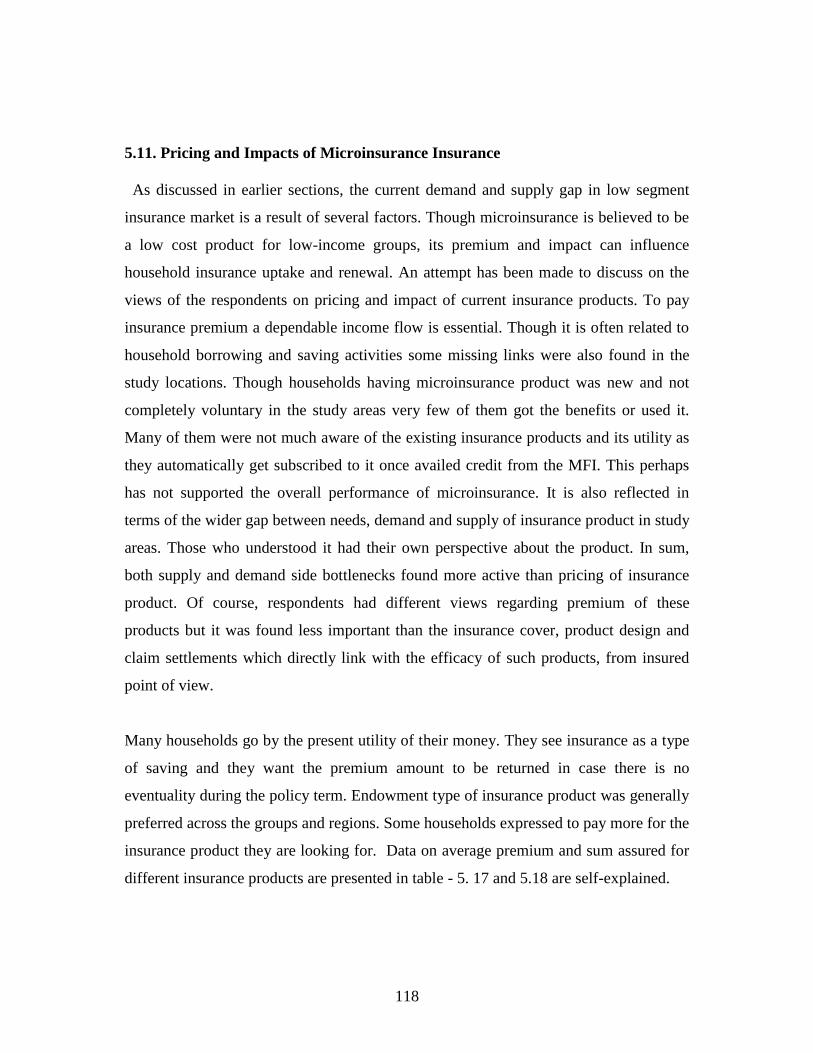
118
5.11. Pricing and Impacts of Microinsurance Insurance
As discussed in earlier sections, the current demand and supply gap in low segment
insurance market is a result of several factors. Though microinsurance is believed to be
a low cost product for low-income groups, its premium and impact can influence
household insurance uptake and renewal. An attempt has been made to discuss on the
views of the respondents on pricing and impact of current insurance products. To pay
insurance premium a dependable income flow is essential. Though it is often related to
household borrowing and saving activities some missing links were also found in the
study locations. Though households having microinsurance product was new and not
completely voluntary in the study areas very few of them got the benefits or used it.
Many of them were not much aware of the existing insurance products and its utility as
they automatically get subscribed to it once availed credit from the MFI. This perhaps
has not supported the overall performance of microinsurance. It is also reflected in
terms of the wider gap between needs, demand and supply of insurance product in study
areas. Those who understood it had their own perspective about the product. In sum,
both supply and demand side bottlenecks found more active than pricing of insurance
product. Of course, respondents had different views regarding premium of these
products but it was found less important than the insurance cover, product design and
claim settlements which directly link with the efficacy of such products, from insured
point of view.
Many households go by the present utility of their money. They see insurance as a type
of saving and they want the premium amount to be returned in case there is no
eventuality during the policy term. Endowment type of insurance product was generally
preferred across the groups and regions. Some households expressed to pay more for the
insurance product they are looking for. Data on average premium and sum assured for
different insurance products are presented in table - 5. 17 and 5.18 are self-explained.
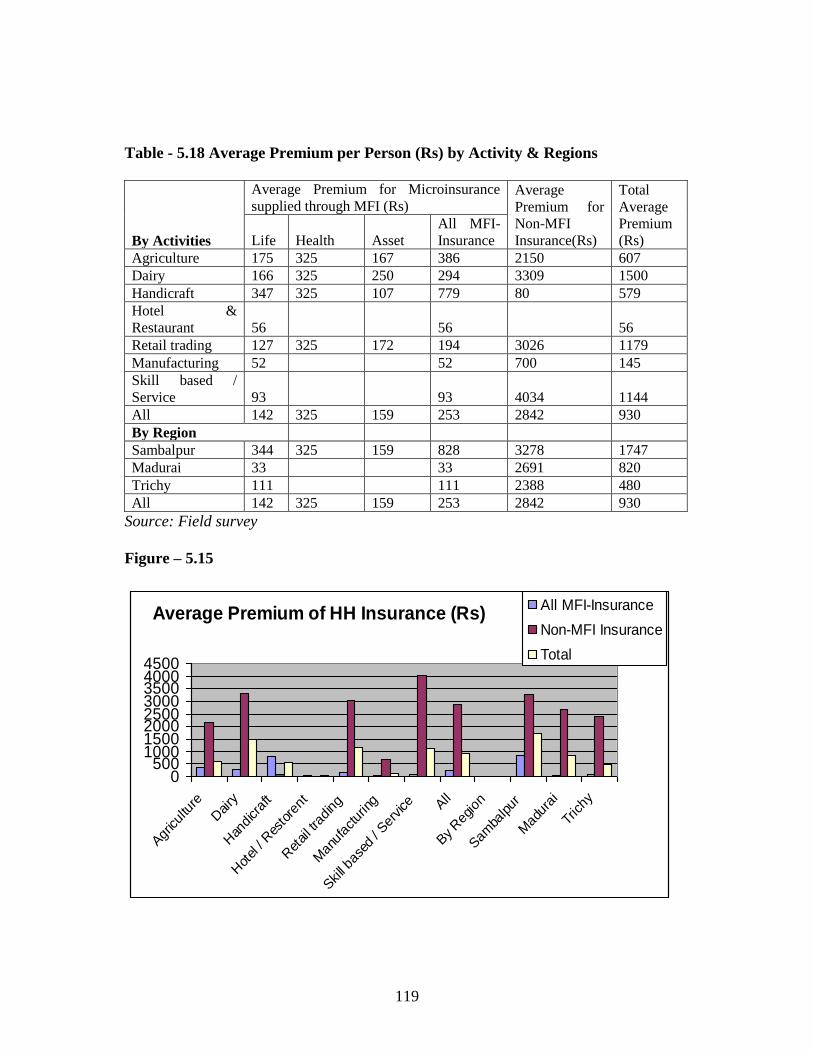
119
Table - 5.18 Average Premium per Person (Rs) by Activity & Regions
By Activities
Average Premium for Microinsurance
supplied through MFI (Rs) Average
Premium for
Non-MFI
Insurance(Rs)
Total
Average
Premium
(Rs) Life Health Asset
All MFI-
Insurance
Agriculture 175 325 167 386 2150 607
Dairy 166 325 250 294 3309 1500
Handicraft 347 325 107 779 80 579
Hotel &
Restaurant 56 56 56
Retail trading 127 325 172 194 3026 1179
Manufacturing 52 52 700 145
Skill based /
Service 93 93 4034 1144
All 142 325 159 253 2842 930
By Region
Sambalpur 344 325 159 828 3278 1747
Madurai 33 33 2691 820
Trichy 111 111 2388 480
All 142 325 159 253 2842 930
Source: Field survey
Figure – 5.15
Average Premium of HH Insurance (Rs)
0500
10001500200025003000350040004500
Agr
icul
ture
Dairy
Han
dicr
aft
Hot
el /
Res
tore
nt
Ret
ail tra
ding
Man
ufac
turin
g
Skill ba
sed
/ Ser
vice A
ll
By Reg
ion
Sam
balpur
Mad
urai
Trichy
All MFI-Insurance
Non-MFI Insurance
Total
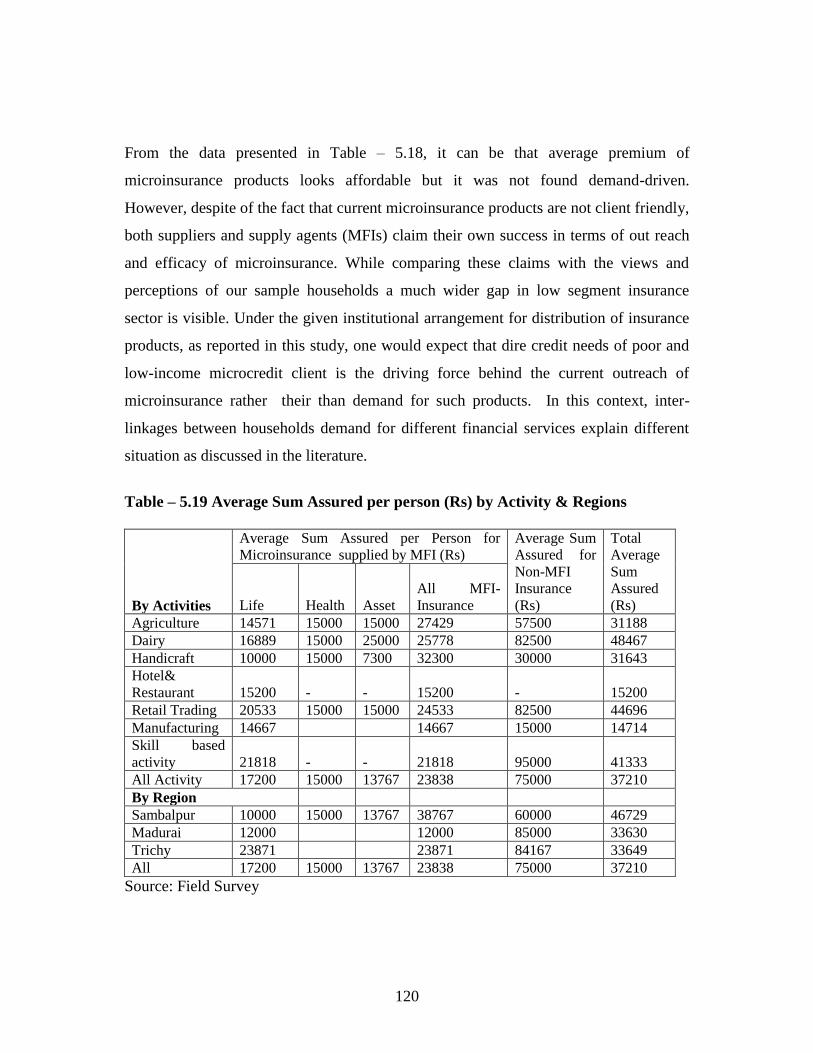
120
From the data presented in Table – 5.18, it can be that average premium of
microinsurance products looks affordable but it was not found demand-driven.
However, despite of the fact that current microinsurance products are not client friendly,
both suppliers and supply agents (MFIs) claim their own success in terms of out reach
and efficacy of microinsurance. While comparing these claims with the views and
perceptions of our sample households a much wider gap in low segment insurance
sector is visible. Under the given institutional arrangement for distribution of insurance
products, as reported in this study, one would expect that dire credit needs of poor and
low-income microcredit client is the driving force behind the current outreach of
microinsurance rather their than demand for such products. In this context, inter-
linkages between households demand for different financial services explain different
situation as discussed in the literature.
Table – 5.19 Average Sum Assured per person (Rs) by Activity & Regions
By Activities
Average Sum Assured per Person for
Microinsurance supplied by MFI (Rs)
Average Sum
Assured for
Non-MFI
Insurance
(Rs)
Total
Average
Sum
Assured
(Rs) Life Health Asset
All MFI-
Insurance
Agriculture 14571 15000 15000 27429 57500 31188
Dairy 16889 15000 25000 25778 82500 48467
Handicraft 10000 15000 7300 32300 30000 31643
Hotel&
Restaurant 15200 - - 15200 - 15200
Retail Trading 20533 15000 15000 24533 82500 44696
Manufacturing 14667 14667 15000 14714
Skill based
activity 21818 - - 21818 95000 41333
All Activity 17200 15000 13767 23838 75000 37210
By Region
Sambalpur 10000 15000 13767 38767 60000 46729
Madurai 12000 12000 85000 33630
Trichy 23871 23871 84167 33649
All 17200 15000 13767 23838 75000 37210
Source: Field Survey
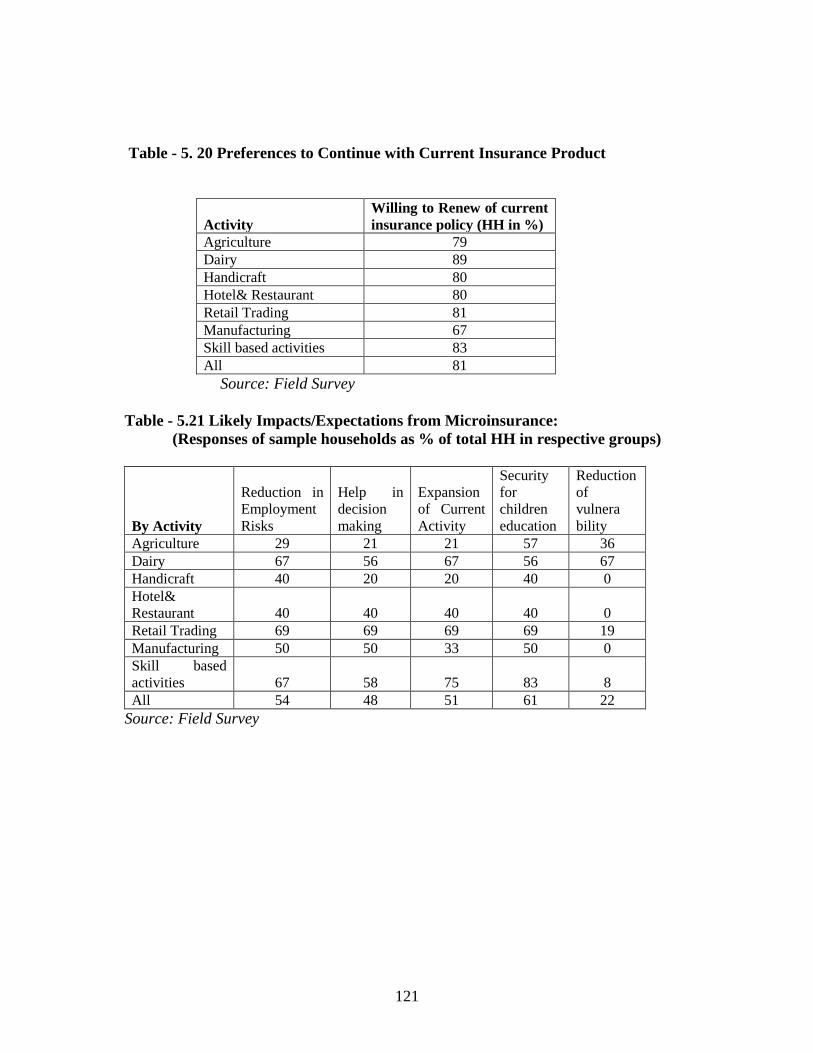
121
Table - 5. 20 Preferences to Continue with Current Insurance Product
Activity
Willing to Renew of current
insurance policy (HH in %)
Agriculture 79
Dairy 89
Handicraft 80
Hotel& Restaurant 80
Retail Trading 81
Manufacturing 67
Skill based activities 83
All 81
Source: Field Survey
Table - 5.21 Likely Impacts/Expectations from Microinsurance:
(Responses of sample households as % of total HH in respective groups)
By Activity
Reduction in
Employment
Risks
Help in
decision
making
Expansion
of Current
Activity
Security
for
children
education
Reduction
of
vulnera
bility
Agriculture 29 21 21 57 36
Dairy 67 56 67 56 67
Handicraft 40 20 20 40 0
Hotel&
Restaurant 40 40 40 40 0
Retail Trading 69 69 69 69 19
Manufacturing 50 50 33 50 0
Skill based
activities 67 58 75 83 8
All 54 48 51 61 22
Source: Field Survey
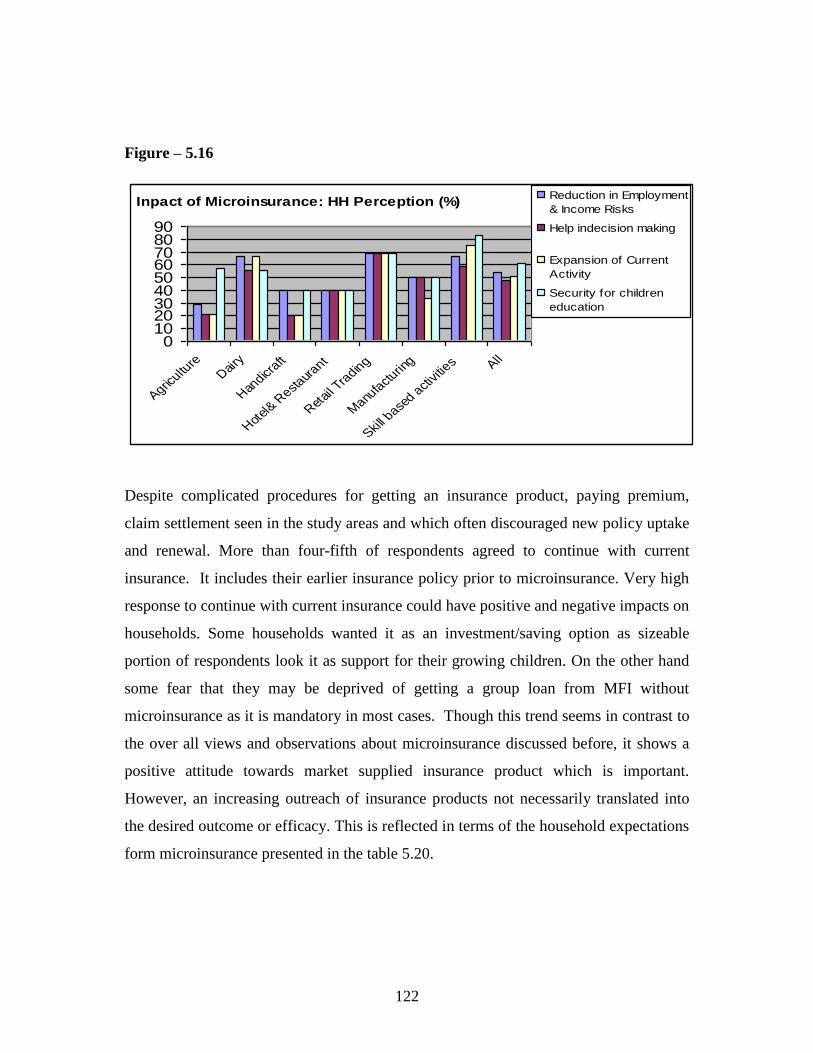
122
Figure – 5.16
Inpact of Microinsurance: HH Perception (%)
0102030405060708090
Agricultu
reD
airy
Han
dicraft
Hot
el& R
estaur
ant
Ret
ail T
radin
g
Manu
fact
uring
Skill b
ased a
ctiv
ities All
Reduction in Employment
& Income Risks
Help indecision making
Expansion of Current
Activity
Security for children
education
Despite complicated procedures for getting an insurance product, paying premium,
claim settlement seen in the study areas and which often discouraged new policy uptake
and renewal. More than four-fifth of respondents agreed to continue with current
insurance. It includes their earlier insurance policy prior to microinsurance. Very high
response to continue with current insurance could have positive and negative impacts on
households. Some households wanted it as an investment/saving option as sizeable
portion of respondents look it as support for their growing children. On the other hand
some fear that they may be deprived of getting a group loan from MFI without
microinsurance as it is mandatory in most cases. Though this trend seems in contrast to
the over all views and observations about microinsurance discussed before, it shows a
positive attitude towards market supplied insurance product which is important.
However, an increasing outreach of insurance products not necessarily translated into
the desired outcome or efficacy. This is reflected in terms of the household expectations
form microinsurance presented in the table 5.20.
123
Summary:
The analysis on household risks, risk coping strategy and participation in
microinsurance in the study areas shows some trends may be useful for different
stakeholders. It indicates that many low-income households who experienced some
major risks in recent past followed multiple informal risk management tools and there
was very low incidence of use of market based insurance. However, household‘s
participation in insurance market considerably depends on their household feature,
major occupation and prioritization of risks. In contrast to the common belief positive
association between such participation with the demand for other financial products
such as credit and saving was not clear. There is huge gap in awareness and information
about insurance. Current microinsurance products are largely involuntary in nature as it
comes with microcredit group loan from MFI. Poor product design, limited insurance
coverage, cumbersome claim settlement and other problems are more or less common
across groups and region. The analysis confirms that there is huge need for insurance by
the low-income groups but they do not demand current insurance products due to low
customization to meet their needs. Choice for health insurance found profound in all
contexts followed by insurance for market related risks and livestock. Different intra-
household coping mechanism found very much in operation in the study areas but it was
not gender neutral. Given the insurance choice, most of households would use it for
education and better life of their children.
In contrast to our expectation, household features such as borrowing and saving pattern,
family size, level of education, asset holding etc. seem not much associated with
household participation in insurance market but it gives a broader idea about household
prioritization for risk and risk coping management. Household depend more on informal
borrowing in the event of crisis. The wide gap between the household credit demand
and credit obtained is evident in the study. So, arranging credit to meet current needs
seems given priority than actual need for insurance.
124
Nature and structure of household activity or enterprise seems to influence demand for
insurance products showing the need for group specific insurance product design. Our
analysis across the activity groups helps in understanding the nature of household
participation and diversity in insurance needs. Income from multiple activity,
remittance and high income activity induce insurance uptake and renewal. However,
access to better and preferred insurance products may carry higher costs and hence it
remains out of reach of the low-income groups. It is also possible that household may
undertake conventional risk aversion activities like crop diversification, seasonal
migration, non-farm activity and use of community property resources. Under given
condition, as discussed above, wider outreach of microinsurance may be easier to meet
some quantitative targets but the desired outcome and efficacy of microinsurance looks
a distance goal.
However, our analysis does not support the argument that a household‘s exposure to
risks would automatically prompt it to participate in insurance market. With some
exception, household exposed more to risks than other were less likely to use insurance
products. This finding is in contrast to our earlier expectation, particularly in low
income less endowed households. In spite of low pricing of insurance products many
respondents viewed that use of current insurance product is an additional risk. However,
there was high demand for customized health insurance and endowment or money back
type of insurance product as many people look insurance as saving or investment
option. It may be due to the fact that the relationship between the household risk
assessment and participation in insurance is simply the other way around.
Though some of the findings are in contrast to the conventional belief about low-
income group‘s participation in financial markets but the visible gap in low segment
insurance market as discussed in this chapter is found common with earlier studies.
125
Chapter – 6
Conclusions & Policy Suggestions
The study intends to contribute to understanding and the current discussion and debate
on microinsurance in India with focus on its outreach and efficacy and participation of
the target groups. It has achieved its goal to the satisfactory level and come out with
some important findings about microinsurance programme in India at regional or sub-
national level. By examining and analyzing the process, products, observations and
other aspects of microinsurance programme in select areas study concludes that in many
contexts the existing microinsurance products are not demand driven in both high and
low outreach areas. There is lack of understanding, awareness, extension services and
development of insurance market that grossly affect wider use of insurance products
and its uptake, particularly, among low-income groups. Our analysis, based on primary
household data and information collected from other stakeholders, has come out with
some important findings from policy point of view. However, these findings need to be
considered with required caution as data used may be constrained by several subjective
and endogenous problems. There are also other limitations of the study such as smaller
sample size and groups of respondents.
The study affirmed some common notions that poor and low income groups face
multiple risks and are more vulnerable than their better-off counterparts. Two broad
types of household risks are considered here. First, risks specific to a particular
household depending on its major activity, asset holding and socio-economic and
demographic features called idiosyncratic risk. Second, risks common to a particular
region such as drought, flood, epidemic etc. called covariate risks. To cope with these
risks many households generally used different informal coping tools than uptake and
renewal of formal or market based insurance products. However, most of the informal
126
risk coping mechanism followed by the household found neither strong enough to avoid
adverse risk impacts as found in other studies Jowett (2003) nor it encouraged uptake of
formal insurance products.
It appears that there is lack of pro-active risk management among the sample
households with an adequate market based insurance products. Risk management via
diversification or entry into low risk, low return activities, reduction of household
expenditure were found which supports the earlier studies (Morduch 1995; Dercon
2005). Evidence of use of assets to smooth consumption, and informal sharing of risk
within family also found common in the study areas.
About one-fourth of sample households had faced some major risks during past two
years prior to the field survey such as health shocks, personal accident, crop loss, loss of
livestock , market related risks and social problems such as divorce. About one-fifth of
household risks were related to employment followed by sudden health expenditure,
loss of livestock, bad market conditions resulting in loss of income, social problems and
other type of risks. Interestingly, risk related to mortality was reported abysmally low
though in almost all cases life insurance products were on offer.
The coping strategy adopted in response to these risks in the study areas were mostly
conventional and it includes informal borrowing (42%), saving (18%), off-farm
activities (16%) and distress sale of assets (14%). While desperate risk management
among the sample households is evident some degree of association between financial
products also emerged in our study. Diversification of family labour and intra-
household risk coping was found to be common. However, it was not gender neutral as
female members of the affected households had to share disproportionately higher
burden due to risk events in terms of increasing in working hours and reduction in basic
expenditure including food and health. Children were pushed to work more or less
127
equally during a risk event but in case of reduction in expenditure on health and
education, a visible gender bias was reported. It indicated the unequal impact of risks on
gender which is detrimental for the household and human development.
As regard to access to and use of insurance products many household were first timers
with lack of awareness and information. Those who had some information about
insurance products and used it were not very satisfied with the current product design
(85%), premium related (65%), claim settlement (60%) and offered insurance cover.
Not-covering spouse and other family members in the life and health insurance schemes
was one of the major discouraging factors for insurance demand among sample
households. On supply side, high male mortality, two to four times higher than female
mortality, was one of the key factors for not covering spouse in low-cost
microinsurance schemes. Similarly, complaints about age-specific differential premium
was also reported. The current claim settlement process was widely objected due to its
lengthy and cumbersome documentation processes and resultant delay in payments,
particularly in the case of health insurance claims. This was also true in case of
livestock insurance claim.
One of the merits of this study is its analysis of microinsurance based on activity based
groups to capture the different occupation and livelihood linked risks and risk coping
management of the households. It also shows the household‘s priority regarding risks
and risk management which is crucial for all stakeholders. As the nature and pattern of
household activity or enterprise pose major threat for household income and
consumption smoothing it is important to understand the risks originated from
household‘s occupations. Our analysis across the activity groups helps in understanding
it and offers some important aspects of household‘s needs and participation in
insurance. Income from sources other than the activity for which loan was taken from
which MFI gives loan, remittance, seasonal livestock activity etc. found crucial factors
128
for uptake of insurance. However, level of income seems less active than the
beneficiaries‘ insurance need for customized product. Similarly, household feature like
size, age, asset holding and education level etc though influence the participation in
insurance market but found not significant in some contexts. In case of larger family
size households lesser interest in insurance was reported, particularly for health
insurance. It is possible that, risk impacts may be shared by larger numbers of family
members unlike the case of smaller family. Under this condition, efforts to enhance
outreach of microinsurance may result in meeting some quantitative targets without
much efficacy and desired outcome.
A customized insurance product for family health care, covering common diseases and
illness, was the most preferred insurance product across activity groups and regions. It
shows multiple negative impacts of health related problems, particularly where
affordable health care facility is poor. It is substantiated with our finding that demand
for health insurance was high where average annual household income was low,
particularly household engaged in low-return activity like handicraft and agriculture.
Despite of its need there was low uptake of available health insurance in the study areas
that match to the findings of some recent study (Ito & Kono; 2010). Health
microinsurance in some study areas seem not cover against payments for day to day
common health care expenditures and hence failed to reduce out of pocket expenditures
of the households. This is in contrast to earlier arguments for success of insurance in
offering ex-post risk coping (Dror et al. 2007).
About 18 % households expressed their demand for life insurance followed by 12 %
households for livestock insurance products on offer. While it shows low preferences of
the target groups for the current insurance products offered to them, a good number of
households were willing to pay even more than the present premium for well designed
insurance products that meet their needs. Their expectation from insurance also includes
129
some assured return at the end of the policy term. However, willing to pay premium
varies across groups and regions. It shows that uniform insurance product has limited
uptake in low segment insurance market. This finding matches to the earlier study
The study provides some insights into the link between microinsurance and microcredit
programme and participation of the poor and low income groups in financial products.
Though access to microinsurance has been largely due access to microcredit loan from
MFI individual stakeholders‘ perspective seems outweigh the core objective of
microinsurance programme. In many cases uptake of insurance product was involuntary
in nature and it was considered more as a saving than a tool for risk management.
Findings of our analysis do not support the argument that a household‘s exposure to
risks would have visible impact on participation in insurance market. With few
exceptions, it was reported that households exposed to more risks are less likely to use
insurance products than others. Some believed that taking insurance product itself as an
additional risk. It may be due to the fact that the relationship between the household
risk assessment and participation in insurance is simply the other way around.
Adequate awareness, information and use of insurance products are grossly lacking in
the study areas. Cumbersome and lengthy process of documentation and claim
settlements, inconvenient premium payment system, lack of proximity to the financial
institution and lack of trust on staff of the providers are some key factors that
discourage uptake and renewal of microinsurance among low-income groups.
Correcting problems may translate insurance needs of many low-income households
into potential demand. Lack of effort by insurers and MFI staff to explain products in a
way that is understandable for the target groups is evident in the present study as found
by others (UNDP 2007; Chankova et al. 2008). Similarly, factors influencing insurance
uptake were level of income, education of household head, occupations and asset
holding which corroborate arguments of Chankova et al.(2008); Gine et al. (2007b).
130
MFIs as distribution channels of microinsurance though found sound in delivery of the
product but without much action in provision of pre-insurance arrangement and post-
insurance services. It appears that there is poor coordination between insurers and MFIs.
While partner-agent model offers an opportunity to reduce administrative costs for both
stakeholders their poor coordination and planning may lead to underutilization of MFIs
as distribution of channel. Though MFIs enjoy flexibility to choose insurance partner
frequent changes in insurance partners, as reported in the study, can cause confusion
among the clients and staff.
The study concludes with some important issues relating to microinsurance in policy
perspectives. Major findings of the study reveal that the usage of microinsurance was
low and less effective. In many cases it was involuntary among low income microcredit
clients of MFIs. Factors which influenced the demand for insurance were diverse at
group and regional level not adequately considered while designing the insurance
product. Household having different activity or enterprise exhibited differently in
prioritizing risks and risk coping and insurance uptake. While low demand for insurance
is largely due to low customization of products contrasting perspectives of insurance
clients, MFIs and insurers is reflected in the analysis. Some trend in demand for
insurance emerge from the analysis are high preference for comprehensive health
insurance and money back or endowment type of insurance products. This will meet
some expectation of the target groups who are looking for good value for money spent
on insurance products.
From regulation policy point, the rural and social sector obligations imposed on formal
insurers seems helped in expanding outreach of microfinance. The experiment with new
distribution models through MFIs also looks sound but impacts of such expansion have
not been impressive in many contexts. Under this situation, existing microinsurance
seems not turned out to be a win-win situation for the all major stakeholders – insurers,
131
MFIs and the poor. It may be too early to arrive at any concrete outcome as many of
microinsurance schemes were started only few years back with inadequate
infrastructure and other arrangements. It is also not appropriate to generalize the
findings of a study based on smaller samples like the current one. However, the study
has come out with some important findings and observations which can be used by
different stakeholders.
Policy Suggestions
The timing of this study is strategic when there is a renewed policy interest in
microinsurance sector in India to achieve variety of socio-economic goals. Some
important liberal regulatory policy initiatives have been introduced recently to improve
outreach and growth of the sector. Insurers are now permitted to deal in both life and
non-life products. Microinsurance industry in India poised for faster growth. But at the
micro level, situations specific to different groups and regions, looks different with
different perspectives of stakeholders. It may need more attention. Based on the major
findings of the study the following policy suggestions are offered for better outreach
and efficacy of microinsurance in regional and group perspective.
I. Response to clients‘ needs and preferences across groups and regions need to be
considered along with affordability and simplicity aspects while designing
insurance products. Hence, well designed and simple insurance product with
lasting effects and matching to the needs of target population is emphasized. For
instance, comprehensive health insurance that covers additional family members
and common local health problems are suggested.
II. While designing new insurance products regular consultations with all
stakeholders is crucial for better customization and to minimize the differences
in stakeholders‘ perspectives.
132
III. The issue of affordability should be factored into product customization.
Selection of partners and distributive channels should be more competitive and
to ensure it suitable guidelines should be prescribed.
IV. Understanding local conditions, adequate awareness and information, effective
customer orientation practices can translate many insurance needs of low-
income groups into an insurable proposition as insurers are often not completely
aware about local conditions and needs.
V. Product pricing should be done by needs and aligning with risks to make it feel
more affordable and induce client‘s willingness to pay for the service.
VI. Microinsurance as a pro-poor risk coping tool may be integrated with social
security measures. Possibility of such integration can be explored in the areas of
women entrepreneurship development, poverty reduction measures, public
health programme etc.
VII. As intermediaries of microinsurance,‘ like MFIs prioritize to protect their assets
rather than looking for a long term insurance business. They may be involved as
a business partner rather as intermediaries on some commission basis.
Possibility of involving local institutions such as post-office, RRBs and
community-based organization may be experimented as distribution channel.
VIII. Capacity building for MFIs, insurance agents and others is an important area for
policy action. Many field level staffs are not well trained to deal with important
insurance matters and often lose trust of the clients. Training and awareness
programme should be conducted on regular basis.
IX. Partial abolition of service tax on microinsurance products and provision of
performance-based incentives may be considered to motivate intermediaries and
their field staffs.
X. MFIs may be assigned more role as a partner and it should obtain clients feed-
back on regular basis and use it in negotiations with the insurers.
133
At macro level some key policy suggestions include building competitive business
environment in microinsurance sector for innovations and designing (products,
pricing, distribution, documentation processes), making it more gender neutral
tool for risk management, provision of required infrastructure etc. Lack of
availability of relevant insurance data is a serious issue. Investment in insurance
data collection and use of technology in handling such data and other key
information such as claim settlement need to be addressed on priority.
In sum, estimating actual market potential of microinsurance sector under the given
condition may be erroneous because of the actual demand is miss-matched with the
needs of the target groups and the supply is grossly influenced by suppliers perceptions
rather willingness and ability to pay by the potential clients. There is an enormous
market potential for customized microinsurance products and a huge space for
innovation. In order to realize macro impacts of microinsurance, wider outreach is
desirable but its effectiveness is equally importance. However, more region and group
specific policy attentions are urged to improve the efficacy of microinsurance sector
without compromising its out reach.
134
References:
BISWA (2009), Annual Report 2009-10 Bharat Integrated, Social welfare Agency,
Sambalpur, Orisssa.
Besley, Timothy (1995),‘Saving, Credit and Insurance‘, in Behrman J. and T.N.
Srinivasan (eds), Handbook of Development Economics, North Holland,
Amsterdam
Brown, W. and Churchill, C.F. (2000a). Insurance Provision in Low Income
Communities. Part I: A primer on insurance principles and products, USAID –
Microenterprise Best Practices (MBP) Project.
Chankova, S., Sulzbach, S. and Diop, F. (2008). Impact of mutual health organizations:
evidence from West Africa, Health Policy and Planning, 23(4):264-276.
Cohen, M. and Sebstad, J. (2006). The demand for microinsurance, in C. Churchill
(ed.), Protecting the poor, A microinsurance compendium, International Labor
Organisation,Geneva.
Churchill, C. (2006). What is insurance for the poor? in C. Churchill (ed.), Protecting
the poor, A microinsurance compendium, International Labor Organisation,
Geneva.
Dercon, S. and Krishnan, P. (2003). Risk Sharing and Public Transfers, Economic
Journal, 113(486): C86-C94.
Dercon, S. and Christiaensen, L. (2007). Consumption risk, technology adoption and
poverty traps: evidence from Ethiopia, World Bank Policy Research Working
Paper 4257.
Dror D.M., Radermacher, R. and Koren, R.(2007). Willingness to Pay for Health
Insurance Among Rural and Poor Persons: Field Evidence from Seven Micro
Health Insurance Units in India, Health Policy, (82):1.
Dror, I. (2007). Demystifying Micro Health Insurance Package Design - Choosing
Healthplans All Together (Chat), Microfinance Insights, 4:17-19.
Gine, X., Townsend, R.M. and Vickery, J. (2007a). Statistical Analysis of Rainfall
Insurance Payouts in Southern India, American Journal of Agricultural
Economics, 89(5): 1248-1254.
Gine, X., Townsend, R.M. and Vickery, J. (2007b). Patterns of Rainfall Insurance
Participation in Rural India, Policy Research Working Paper Series 4408, The
World Bank.
Gravelle, H and Rees Ray (2004), Microeconomics, 3rd
Edition, Pearson Education
135
Grama Vidiyal (2009), Lighting the Lives – Annual report 2008-09, GV Microfinance
P. Ltd, Tiruchirapally, Tamilnadu
ILO (2004a). India: Insurance Products Provided by Insurance Companies to the
Disadvantaged Groups, Strategies and Tools Against Social Exclusion and
Poverty (STEP), March
ILO (2004b). India: An Inventory of Community-based Micro-insurance Schemes,
Strategies and Tools Against Social Exclusion and Poverty (STEP), February.
IRDA (2000). Insurance Regulatory and Development Authority (Obligations of
Insurers to Rural Social Sectors) Regulations. IRDA Notification dated on July
14, 2000, New Delhi.
IRDA (2009). Insurance Regulatory and Development Authority, Annual report
200809, New Delhi
Jowett M., Contoyannis P., Vinh N.D. (2003). The impact of public voluntary health
insurance on private health expenditures in Vietnam, Social Science and
Medicine, 56: 333–342.
Leftley, R. and Mapfumo, S. (2006). Effective microinsurance programs to reduce
vulnerability. Opportunity International Network.
Mahasemam (2009), Mahasemam Annual Report 2008-09, Mahasemam Trust,
Madurai, Tamil Nadu
McCord, M.J. (2008). Visions of the future of Microinsurance, and thoughts on getting
there, Microinsurance note no. 9, United States Agency for International
Development.
McCord, M.J. (2006). The Partner-Agent Model: Challenges and Opportunities, in C.
Churchill (ed.), Protecting the poor, A microinsurance compendium,
International Labor Organisation, Geneva.
Marc Socquet (2005) ILO/STEP, Microinsurance Workshop, October, Hyderabad.
Microinsurance Centre (2007) Microinsurance in the World‘s 100 poorest Countries,
Microinsurance Centre (2007) Lloyd‘s 360° Risk Insight Insurance in developing
countries: Exploring opportunities in microinsurance
Morduch, J. (1995). Income Smoothing and Consumption Smoothing, Journal of
Economic Perspectives, 9(3):103-114
Morduch, J. (2006). Microinsurance: the next revolution? in A.V. Banerjee, R. Benabou
and D. Mookherjee (eds.), Understanding Poverty, Oxford University Press.
M-CRIL (2008) Micro-Insurance regulation in the Indian financial landscape - – A case
study, Micro-Credit Ratings International Limited, March
136
Narayana, D. (2010). Review of Rastriya Swathya Bima Yojana, Economic & Political
Weekly, No 29, July 17,
Ruthven, O and Sushil Kumar (2002), ―Fine-Grain Finance: Financial Choice and
Strategy among the Poor in North India‖, Finance & Devwelopment Research
Programme Working Paper Series, Vol 57, Manchester University, Mnchaster.
Roth Jim, Micahael Mc Cord and Dominic Liber (2007), The Landscape on
Roth, J. and Chamberlain, D. (2006). Retailers as microinsurance distribution channels,
in C. Churchill (ed.), Protecting the poor, A microinsurance compendium,
International Labor Organisation, Geneva.
Roth, J. and Athreye, V. (2005). TATA-AIG Life Insurance Company Ltd., India,
CGAP Working Group on Microinsurance, Good and Bad Practices Case Study
No. 14 (Geneva, ILO Social Finance Programme)
Rosenzweig, M. and Binswanger, H. (1993). Wealth, Weather Risk and the
Composition and Profitability of Agricultural Investments, Economic Journal,
103:56-78.
Ruthven, O. and S. Kumar. (2002). ‗Fine-Grain Finance: Financial Choice and Strategy
among the Poor in Rural North India‘, in Institute for Development Policy and
Management (ed.) Finance & Development Research Programme Working
Paper Series, Vol. 57, Manchester, University of Manchester.
Schreiner, M. (2002). Aspects of outreach: A framework for the discussion of the social benefits of microfinance. Journal of International Development, 14, 1-13.
Swiss Reinsurance Company, (2008). ―Sigma Report 3/2008.‖ Zurich, Switzerland.
UNDP (2007), ‘Building Security for the Poor Potential and Prospects for
Microinsurance‘, Human Development Report Unit, UNDP Regional Centre,
Colombo
UNDP, GTZ and Allianz AG (2006), Microinsurance: Demand and Market prospects -
India,
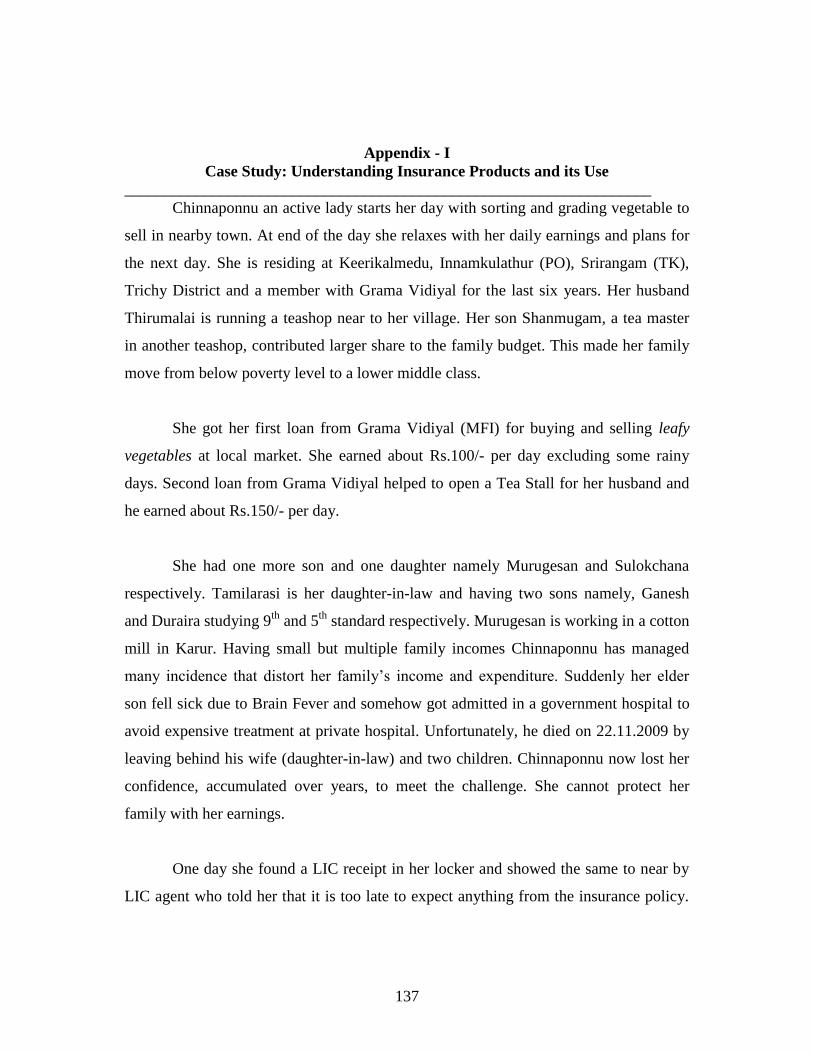
137
Appendix - I
Case Study: Understanding Insurance Products and its Use
__________________________________________________________________
Chinnaponnu an active lady starts her day with sorting and grading vegetable to
sell in nearby town. At end of the day she relaxes with her daily earnings and plans for
the next day. She is residing at Keerikalmedu, Innamkulathur (PO), Srirangam (TK),
Trichy District and a member with Grama Vidiyal for the last six years. Her husband
Thirumalai is running a teashop near to her village. Her son Shanmugam, a tea master
in another teashop, contributed larger share to the family budget. This made her family
move from below poverty level to a lower middle class.
She got her first loan from Grama Vidiyal (MFI) for buying and selling leafy
vegetables at local market. She earned about Rs.100/- per day excluding some rainy
days. Second loan from Grama Vidiyal helped to open a Tea Stall for her husband and
he earned about Rs.150/- per day.
She had one more son and one daughter namely Murugesan and Sulokchana
respectively. Tamilarasi is her daughter-in-law and having two sons namely, Ganesh
and Duraira studying 9th
and 5th
standard respectively. Murugesan is working in a cotton
mill in Karur. Having small but multiple family incomes Chinnaponnu has managed
many incidence that distort her family‘s income and expenditure. Suddenly her elder
son fell sick due to Brain Fever and somehow got admitted in a government hospital to
avoid expensive treatment at private hospital. Unfortunately, he died on 22.11.2009 by
leaving behind his wife (daughter-in-law) and two children. Chinnaponnu now lost her
confidence, accumulated over years, to meet the challenge. She cannot protect her
family with her earnings.
One day she found a LIC receipt in her locker and showed the same to near by
LIC agent who told her that it is too late to expect anything from the insurance policy.
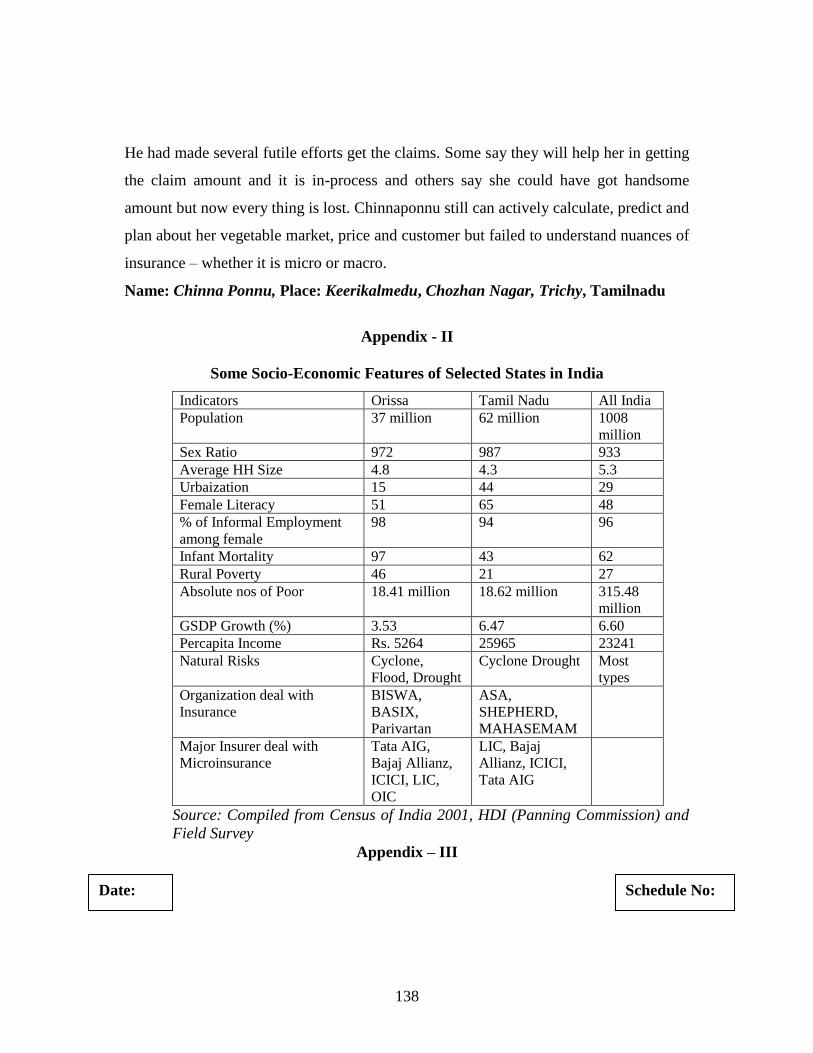
138
He had made several futile efforts get the claims. Some say they will help her in getting
the claim amount and it is in-process and others say she could have got handsome
amount but now every thing is lost. Chinnaponnu still can actively calculate, predict and
plan about her vegetable market, price and customer but failed to understand nuances of
insurance – whether it is micro or macro.
Name: Chinna Ponnu, Place: Keerikalmedu, Chozhan Nagar, Trichy, Tamilnadu
Appendix - II
Some Socio-Economic Features of Selected States in India
Indicators Orissa Tamil Nadu All India
Population 37 million 62 million 1008
million
Sex Ratio 972 987 933
Average HH Size 4.8 4.3 5.3
Urbaization 15 44 29
Female Literacy 51 65 48
% of Informal Employment
among female
98 94 96
Infant Mortality 97 43 62
Rural Poverty 46 21 27
Absolute nos of Poor 18.41 million 18.62 million 315.48
million
GSDP Growth (%) 3.53 6.47 6.60
Percapita Income Rs. 5264 25965 23241
Natural Risks Cyclone,
Flood, Drought
Cyclone Drought Most
types
Organization deal with
Insurance
BISWA,
BASIX,
Parivartan
ASA,
SHEPHERD,
MAHASEMAM
Major Insurer deal with
Microinsurance
Tata AIG,
Bajaj Allianz,
ICICI, LIC,
OIC
LIC, Bajaj
Allianz, ICICI,
Tata AIG
Source: Compiled from Census of India 2001, HDI (Panning Commission) and
Field Survey
Appendix – III
Schedule No: Date:
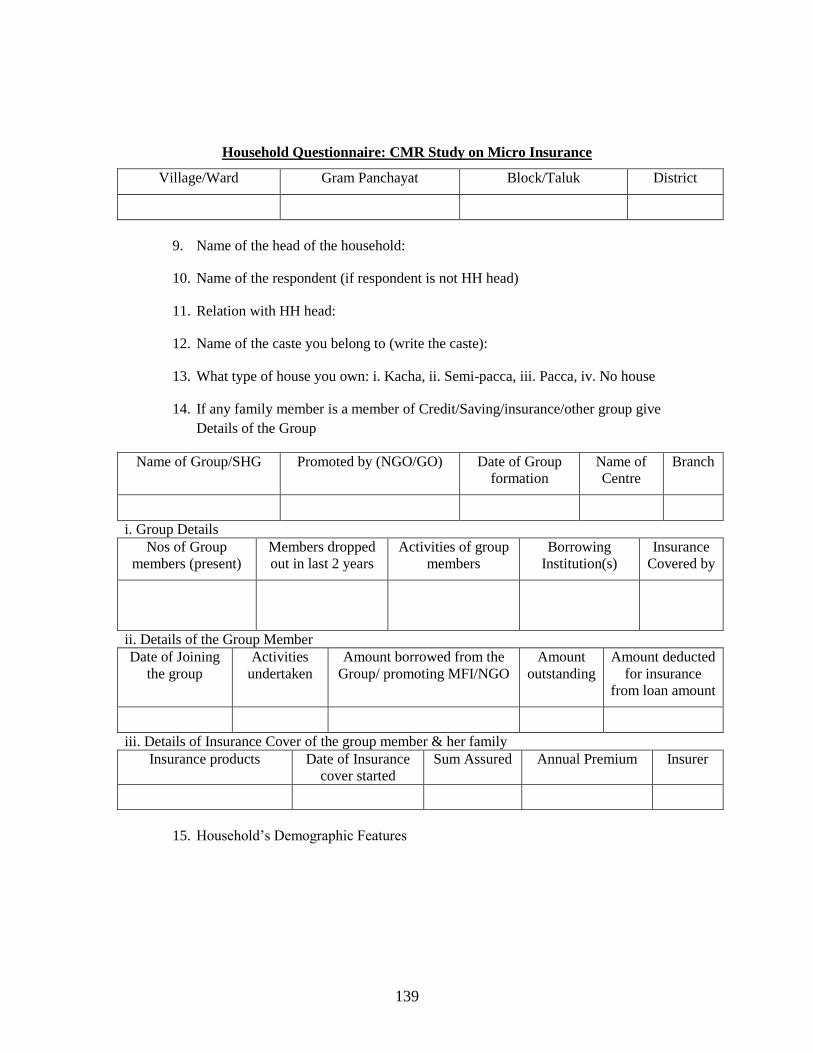
139
Household Questionnaire: CMR Study on Micro Insurance
Village/Ward Gram Panchayat Block/Taluk District
9. Name of the head of the household:
10. Name of the respondent (if respondent is not HH head)
11. Relation with HH head:
12. Name of the caste you belong to (write the caste):
13. What type of house you own: i. Kacha, ii. Semi-pacca, iii. Pacca, iv. No house
14. If any family member is a member of Credit/Saving/insurance/other group give
Details of the Group
Name of Group/SHG Promoted by (NGO/GO) Date of Group
formation
Name of
Centre
Branch
i. Group Details
Nos of Group
members (present)
Members dropped
out in last 2 years
Activities of group
members
Borrowing
Institution(s)
Insurance
Covered by
ii. Details of the Group Member
Date of Joining
the group
Activities
undertaken
Amount borrowed from the
Group/ promoting MFI/NGO
Amount
outstanding
Amount deducted
for insurance
from loan amount
iii. Details of Insurance Cover of the group member & her family
Insurance products Date of Insurance
cover started
Sum Assured Annual Premium Insurer
15. Household‘s Demographic Features
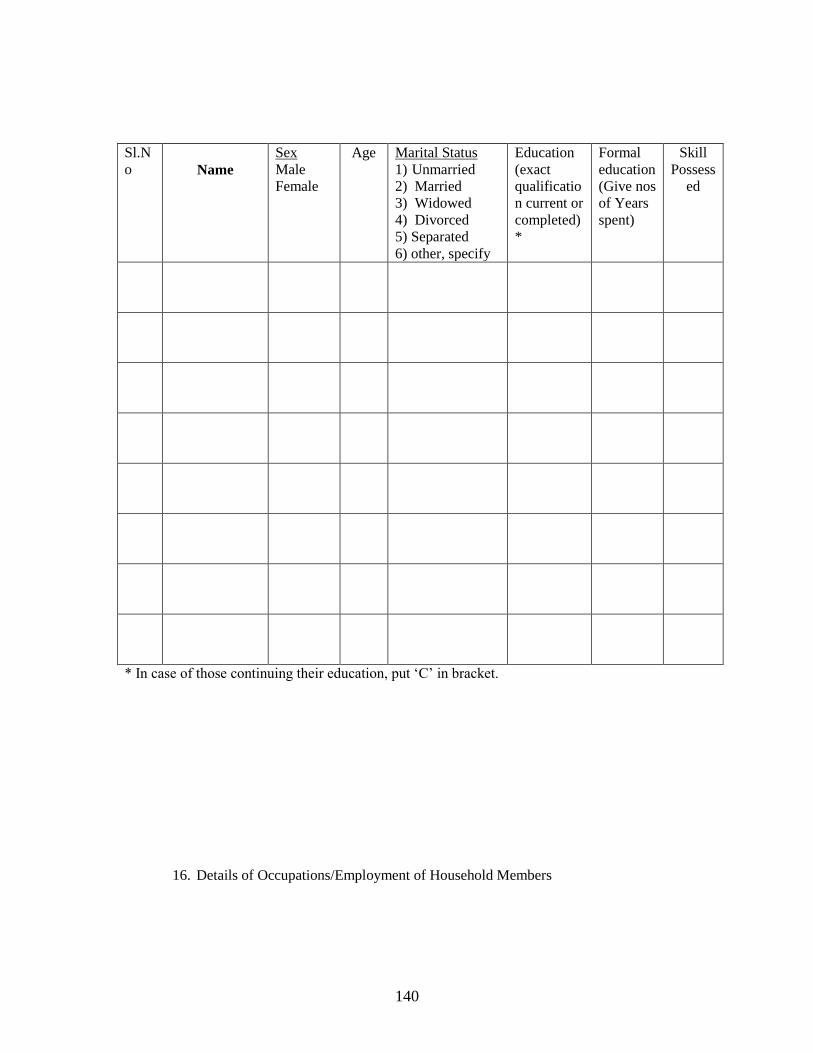
140
Sl.N
o
Name
Sex
Male
Female
Age Marital Status
1) Unmarried
2) Married
3) Widowed
4) Divorced
5) Separated
6) other, specify
Education
(exact
qualificatio
n current or
completed)
*
Formal
education
(Give nos
of Years
spent)
Skill
Possess
ed
* In case of those continuing their education, put ‗C‘ in bracket.
16. Details of Occupations/Employment of Household Members
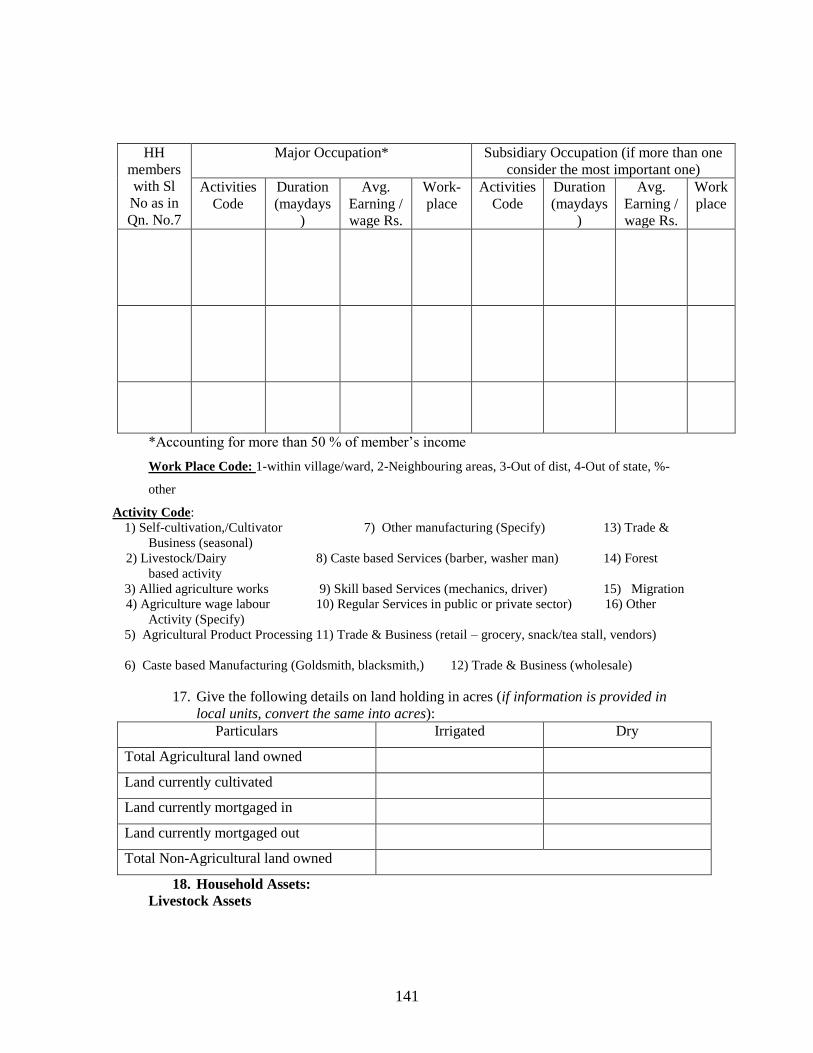
141
HH
members
with Sl
No as in
Qn. No.7
Major Occupation* Subsidiary Occupation (if more than one
consider the most important one)
Activities
Code
Duration
(maydays
)
Avg.
Earning /
wage Rs.
Work-
place
Activities
Code
Duration
(maydays
)
Avg.
Earning /
wage Rs.
Work
place
*Accounting for more than 50 % of member‘s income
Work Place Code: 1-within village/ward, 2-Neighbouring areas, 3-Out of dist, 4-Out of state, %-
other
Activity Code:
1) Self-cultivation,/Cultivator 7) Other manufacturing (Specify) 13) Trade &
Business (seasonal)
2) Livestock/Dairy 8) Caste based Services (barber, washer man) 14) Forest
based activity
3) Allied agriculture works 9) Skill based Services (mechanics, driver) 15) Migration
4) Agriculture wage labour 10) Regular Services in public or private sector) 16) Other
Activity (Specify)
5) Agricultural Product Processing 11) Trade & Business (retail – grocery, snack/tea stall, vendors)
6) Caste based Manufacturing (Goldsmith, blacksmith,) 12) Trade & Business (wholesale)
17. Give the following details on land holding in acres (if information is provided in
local units, convert the same into acres):
Particulars Irrigated Dry
Total Agricultural land owned
Land currently cultivated
Land currently mortgaged in
Land currently mortgaged out
Total Non-Agricultural land owned
18. Household Assets:
Livestock Assets
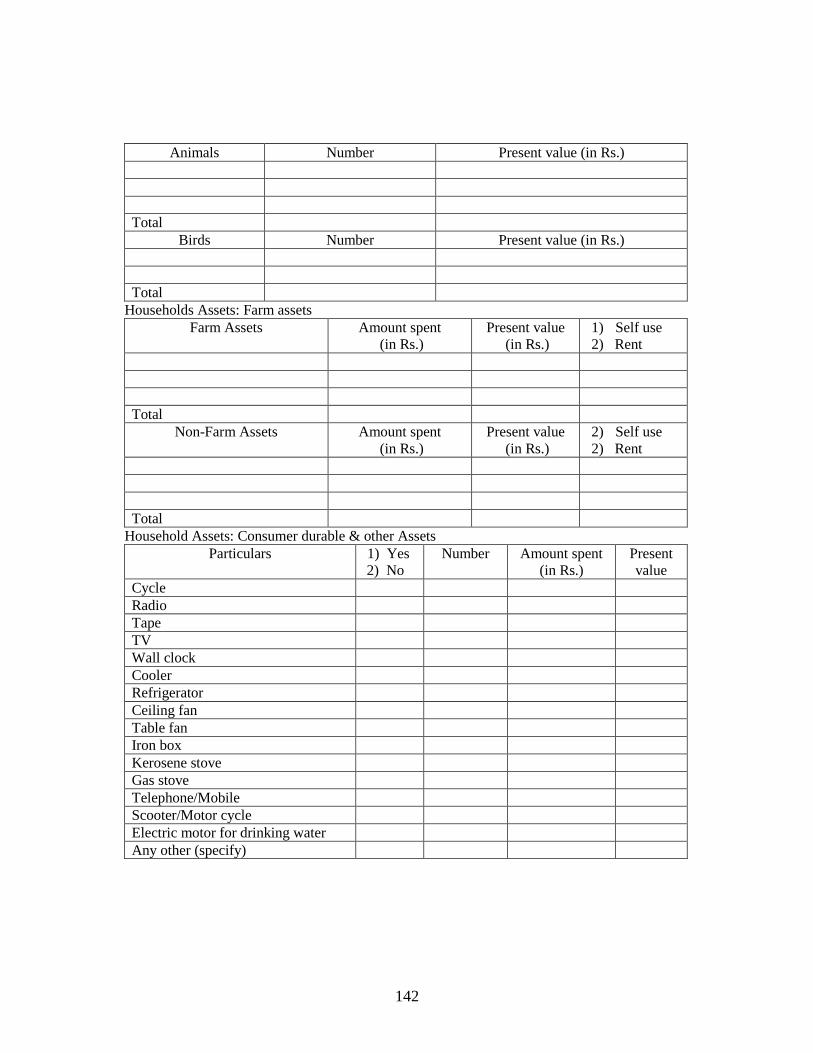
142
Animals Number Present value (in Rs.)
Total
Birds Number Present value (in Rs.)
Total
Households Assets: Farm assets
Farm Assets Amount spent
(in Rs.)
Present value
(in Rs.)
1) Self use
2) Rent
Total
Non-Farm Assets Amount spent
(in Rs.)
Present value
(in Rs.)
2) Self use
2) Rent
Total
Household Assets: Consumer durable & other Assets
Particulars 1) Yes
2) No
Number Amount spent
(in Rs.)
Present
value
Cycle
Radio
Tape
TV
Wall clock
Cooler
Refrigerator
Ceiling fan
Table fan
Iron box
Kerosene stove
Gas stove
Telephone/Mobile
Scooter/Motor cycle
Electric motor for drinking water
Any other (specify)
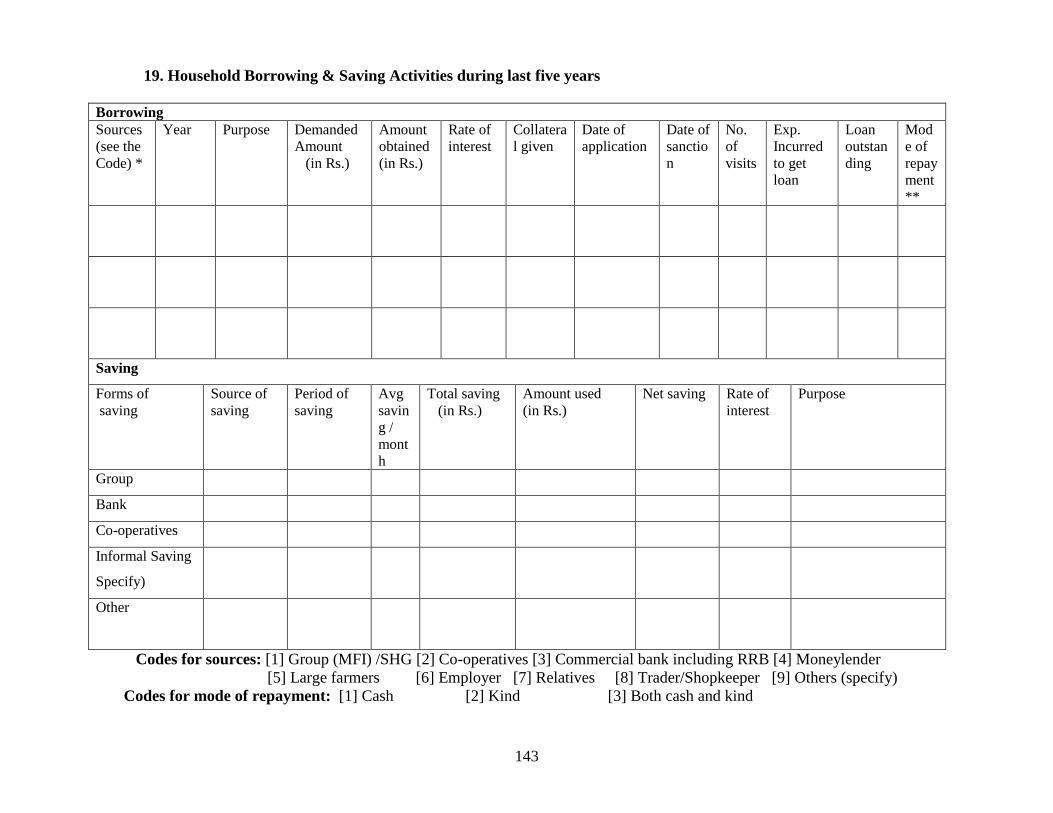
143
19. Household Borrowing & Saving Activities during last five years
Borrowing
Sources
(see the
Code) *
Year Purpose Demanded
Amount
(in Rs.)
Amount
obtained
(in Rs.)
Rate of
interest
Collatera
l given
Date of
application
Date of
sanctio
n
No.
of
visits
Exp.
Incurred
to get
loan
Loan
outstan
ding
Mod
e of
repay
ment
**
Saving
Forms of
saving
Source of
saving
Period of
saving
Avg
savin
g /
mont
h
Total saving
(in Rs.)
Amount used
(in Rs.)
Net saving Rate of
interest
Purpose
Group
Bank
Co-operatives
Informal Saving
Specify)
Other
Codes for sources: [1] Group (MFI) /SHG [2] Co-operatives [3] Commercial bank including RRB [4] Moneylender
[5] Large farmers [6] Employer [7] Relatives [8] Trader/Shopkeeper [9] Others (specify)
Codes for mode of repayment: [1] Cash [2] Kind [3] Both cash and kind
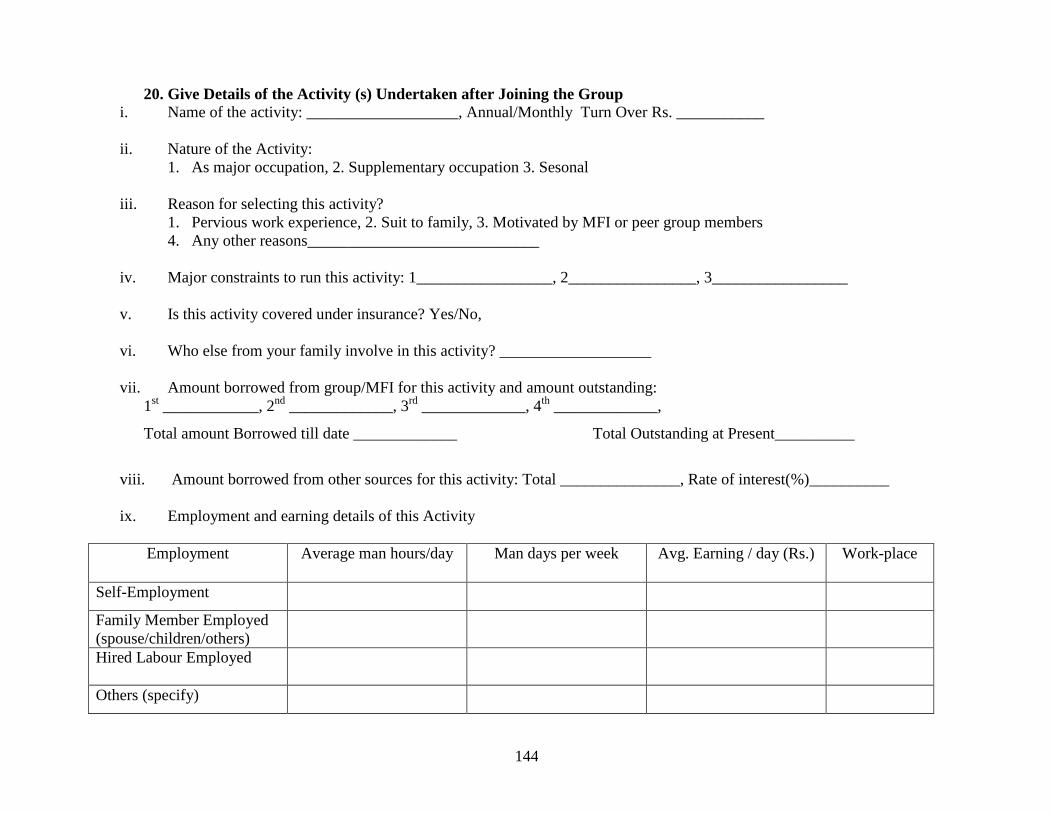
144
20. Give Details of the Activity (s) Undertaken after Joining the Group
i. Name of the activity: ___________________, Annual/Monthly Turn Over Rs. ___________
ii. Nature of the Activity:
1. As major occupation, 2. Supplementary occupation 3. Sesonal
iii. Reason for selecting this activity?
1. Pervious work experience, 2. Suit to family, 3. Motivated by MFI or peer group members
4. Any other reasons_____________________________
iv. Major constraints to run this activity: 1_________________, 2________________, 3_________________
v. Is this activity covered under insurance? Yes/No,
vi. Who else from your family involve in this activity? ___________________
vii. Amount borrowed from group/MFI for this activity and amount outstanding:
1st ____________, 2
nd _____________, 3
rd _____________, 4
th _____________,
Total amount Borrowed till date _____________ Total Outstanding at Present__________
viii. Amount borrowed from other sources for this activity: Total _______________, Rate of interest(%)__________
ix. Employment and earning details of this Activity
Employment Average man hours/day Man days per week Avg. Earning / day (Rs.) Work-place
Self-Employment
Family Member Employed
(spouse/children/others)
Hired Labour Employed
Others (specify)
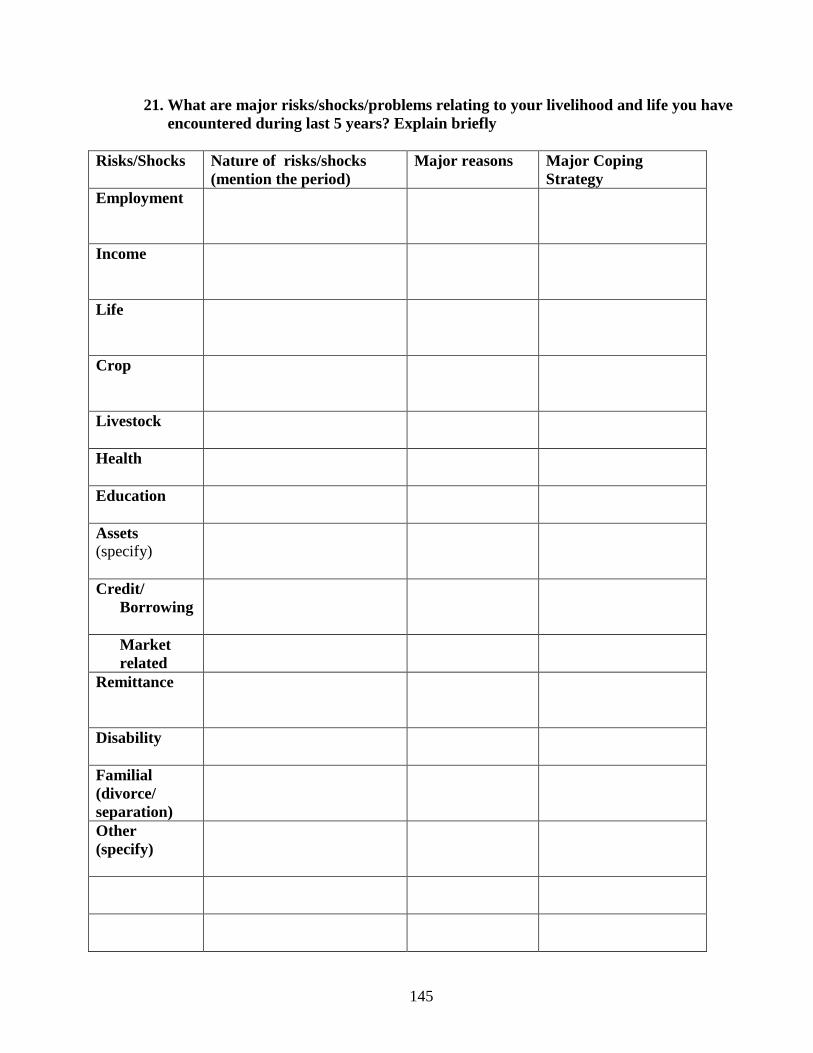
145
21. What are major risks/shocks/problems relating to your livelihood and life you have
encountered during last 5 years? Explain briefly
Risks/Shocks Nature of risks/shocks
(mention the period)
Major reasons Major Coping
Strategy
Employment
Income
Life
Crop
Livestock
Health
Education
Assets
(specify)
Credit/
Borrowing
Market
related
Remittance
Disability
Familial
(divorce/
separation)
Other
(specify)
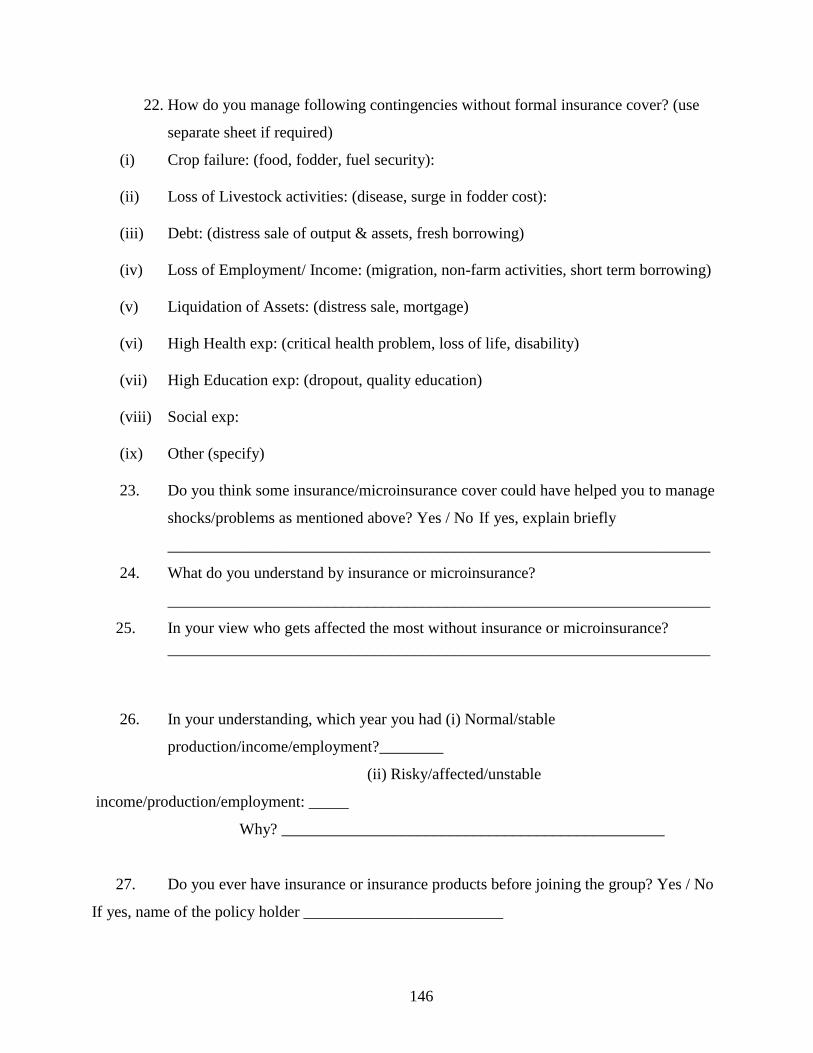
146
22. How do you manage following contingencies without formal insurance cover? (use
separate sheet if required)
(i) Crop failure: (food, fodder, fuel security):
(ii) Loss of Livestock activities: (disease, surge in fodder cost):
(iii) Debt: (distress sale of output & assets, fresh borrowing)
(iv) Loss of Employment/ Income: (migration, non-farm activities, short term borrowing)
(v) Liquidation of Assets: (distress sale, mortgage)
(vi) High Health exp: (critical health problem, loss of life, disability)
(vii) High Education exp: (dropout, quality education)
(viii) Social exp:
(ix) Other (specify)
23. Do you think some insurance/microinsurance cover could have helped you to manage
shocks/problems as mentioned above? Yes / No If yes, explain briefly
____________________________________________________________________
24. What do you understand by insurance or microinsurance?
____________________________________________________________________
25. In your view who gets affected the most without insurance or microinsurance?
____________________________________________________________________
26. In your understanding, which year you had (i) Normal/stable
production/income/employment?________
(ii) Risky/affected/unstable
income/production/employment: _____
Why? ________________________________________________
27. Do you ever have insurance or insurance products before joining the group? Yes / No
If yes, name of the policy holder _________________________
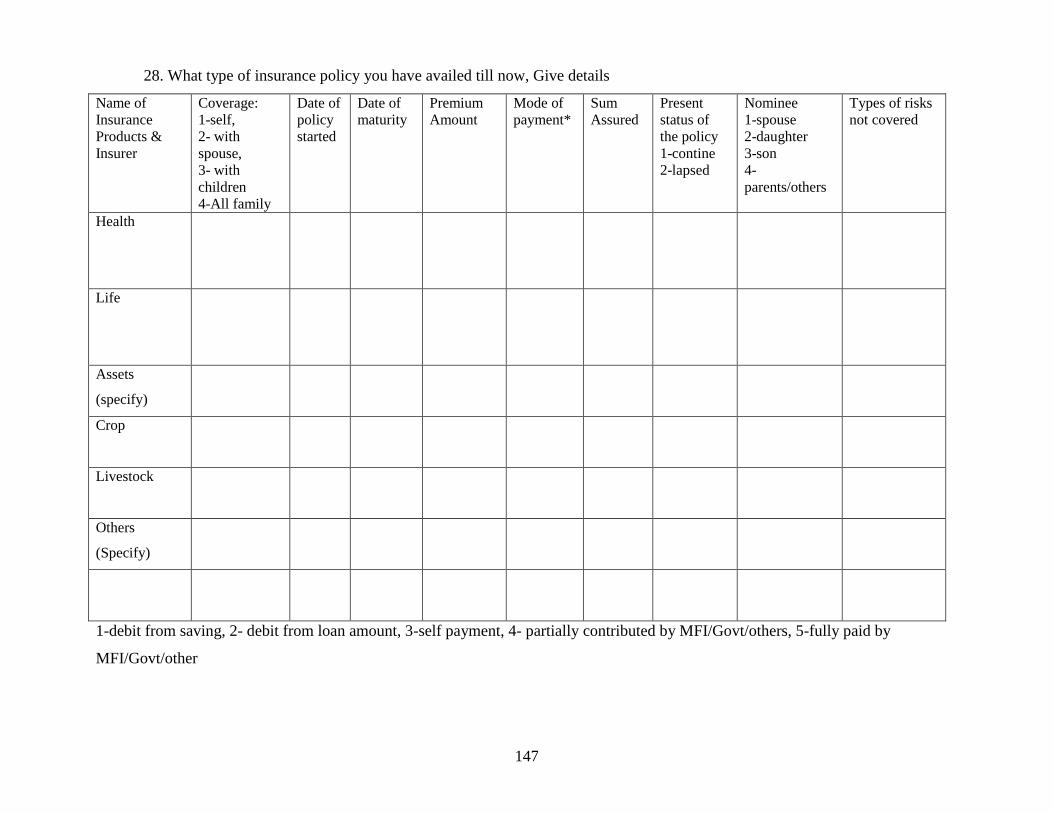
147
28. What type of insurance policy you have availed till now, Give details
Name of
Insurance
Products &
Insurer
Coverage:
1-self,
2- with
spouse,
3- with
children
4-All family
Date of
policy
started
Date of
maturity
Premium
Amount
Mode of
payment*
Sum
Assured
Present
status of
the policy
1-contine
2-lapsed
Nominee
1-spouse
2-daughter
3-son
4-
parents/others
Types of risks
not covered
Health
Life
Assets
(specify)
Crop
Livestock
Others
(Specify)
1-debit from saving, 2- debit from loan amount, 3-self payment, 4- partially contributed by MFI/Govt/others, 5-fully paid by
MFI/Govt/other
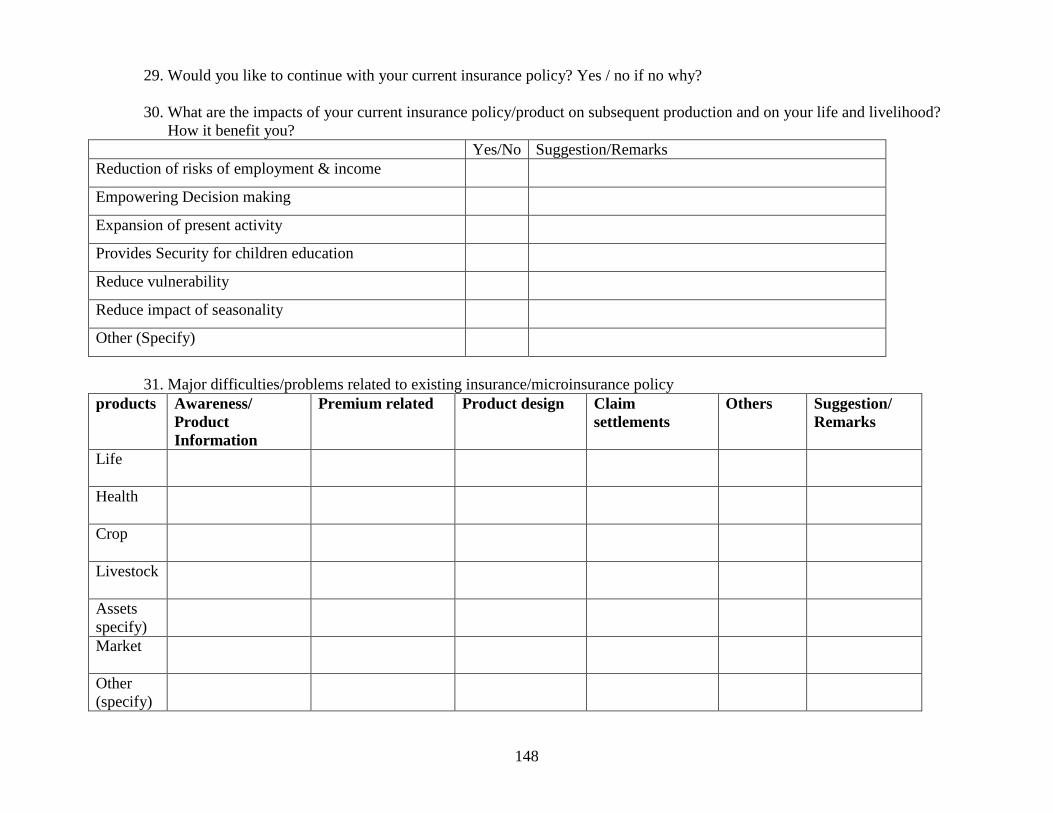
148
29. Would you like to continue with your current insurance policy? Yes / no if no why?
30. What are the impacts of your current insurance policy/product on subsequent production and on your life and livelihood?
How it benefit you?
Yes/No Suggestion/Remarks
Reduction of risks of employment & income
Empowering Decision making
Expansion of present activity
Provides Security for children education
Reduce vulnerability
Reduce impact of seasonality
Other (Specify)
31. Major difficulties/problems related to existing insurance/microinsurance policy
products Awareness/
Product
Information
Premium related Product design Claim
settlements
Others Suggestion/
Remarks
Life
Health
Crop
Livestock
Assets
specify)
Market
Other
(specify)
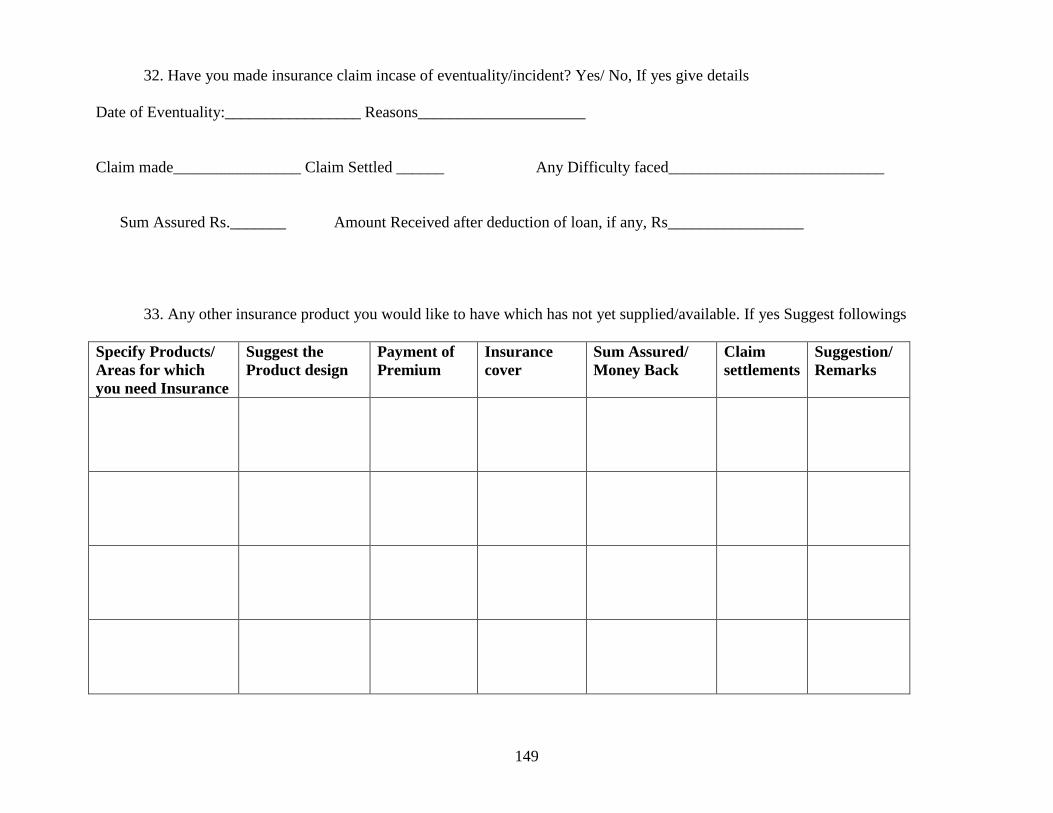
149
32. Have you made insurance claim incase of eventuality/incident? Yes/ No, If yes give details
Date of Eventuality:_________________ Reasons_____________________
Claim made________________ Claim Settled ______ Any Difficulty faced___________________________
Sum Assured Rs._______ Amount Received after deduction of loan, if any, Rs_________________
33. Any other insurance product you would like to have which has not yet supplied/available. If yes Suggest followings
Specify Products/
Areas for which
you need Insurance
Suggest the
Product design
Payment of
Premium
Insurance
cover
Sum Assured/
Money Back
Claim
settlements
Suggestion/
Remarks
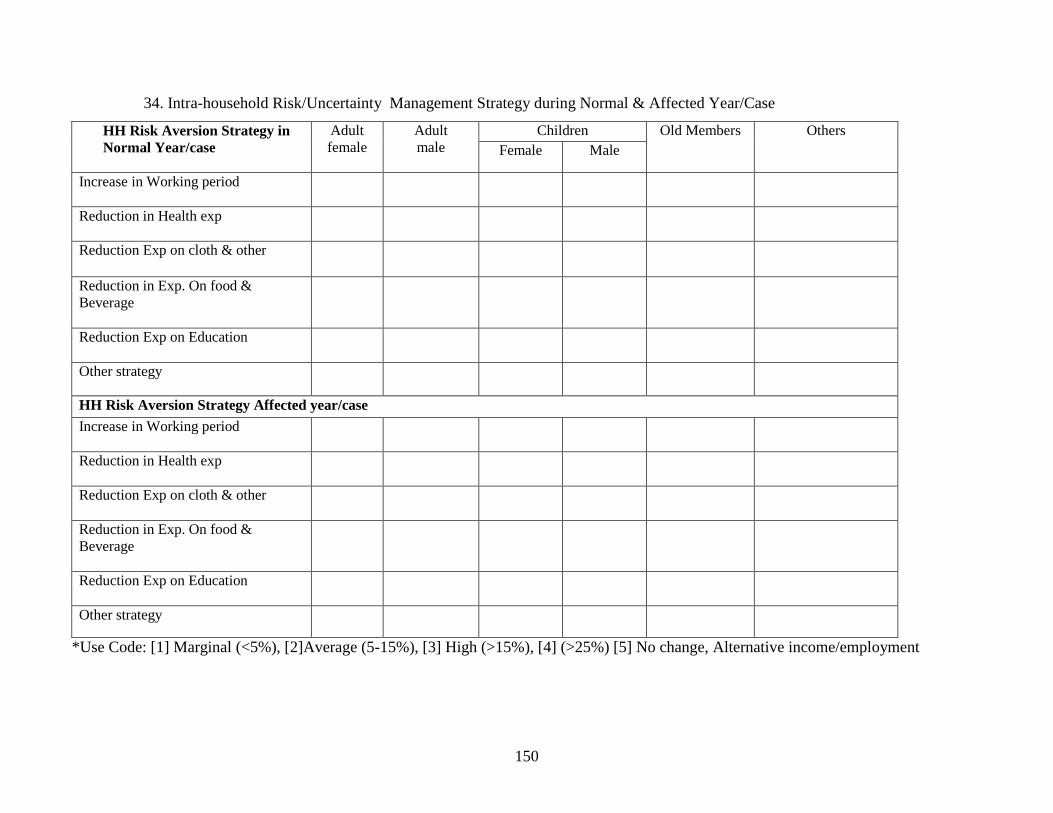
150
34. Intra-household Risk/Uncertainty Management Strategy during Normal & Affected Year/Case
HH Risk Aversion Strategy in
Normal Year/case
Adult
female
Adult
male
Children Old Members Others
Female Male
Increase in Working period
Reduction in Health exp
Reduction Exp on cloth & other
Reduction in Exp. On food &
Beverage
Reduction Exp on Education
Other strategy
HH Risk Aversion Strategy Affected year/case
Increase in Working period
Reduction in Health exp
Reduction Exp on cloth & other
Reduction in Exp. On food &
Beverage
Reduction Exp on Education
Other strategy
*Use Code: [1] Marginal (<5%), [2]Average (5-15%), [3] High (>15%), [4] (>25%) [5] No change, Alternative income/employment
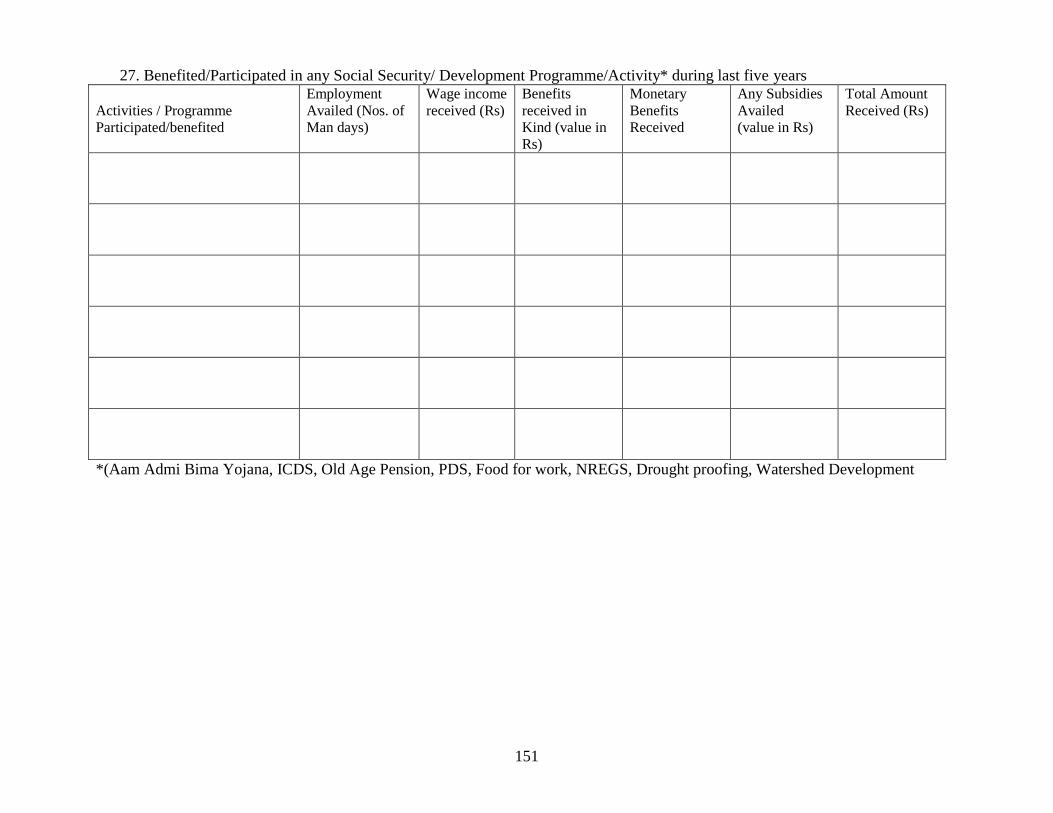
151
27. Benefited/Participated in any Social Security/ Development Programme/Activity* during last five years
Activities / Programme
Participated/benefited
Employment
Availed (Nos. of
Man days)
Wage income
received (Rs)
Benefits
received in
Kind (value in
Rs)
Monetary
Benefits
Received
Any Subsidies
Availed
(value in Rs)
Total Amount
Received (Rs)
*(Aam Admi Bima Yojana, ICDS, Old Age Pension, PDS, Food for work, NREGS, Drought proofing, Watershed Development
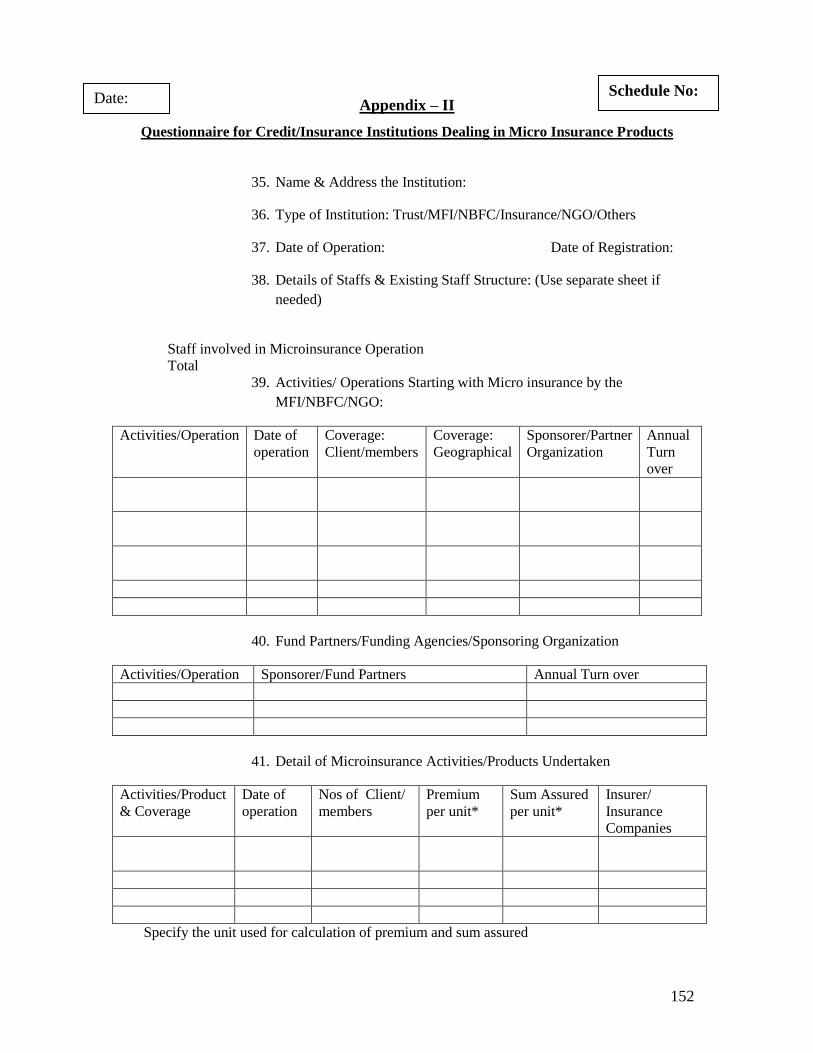
152
Appendix – II
Questionnaire for Credit/Insurance Institutions Dealing in Micro Insurance Products
35. Name & Address the Institution:
36. Type of Institution: Trust/MFI/NBFC/Insurance/NGO/Others
37. Date of Operation: Date of Registration:
38. Details of Staffs & Existing Staff Structure: (Use separate sheet if
needed)
Staff involved in Microinsurance Operation
Total
39. Activities/ Operations Starting with Micro insurance by the
MFI/NBFC/NGO:
Activities/Operation Date of
operation
Coverage:
Client/members
Coverage:
Geographical
Sponsorer/Partner
Organization
Annual
Turn
over
40. Fund Partners/Funding Agencies/Sponsoring Organization
Activities/Operation Sponsorer/Fund Partners Annual Turn over
41. Detail of Microinsurance Activities/Products Undertaken
Activities/Product
& Coverage
Date of
operation
Nos of Client/
members
Premium
per unit*
Sum Assured
per unit*
Insurer/
Insurance
Companies
Specify the unit used for calculation of premium and sum assured
Schedule No: Date:
‗
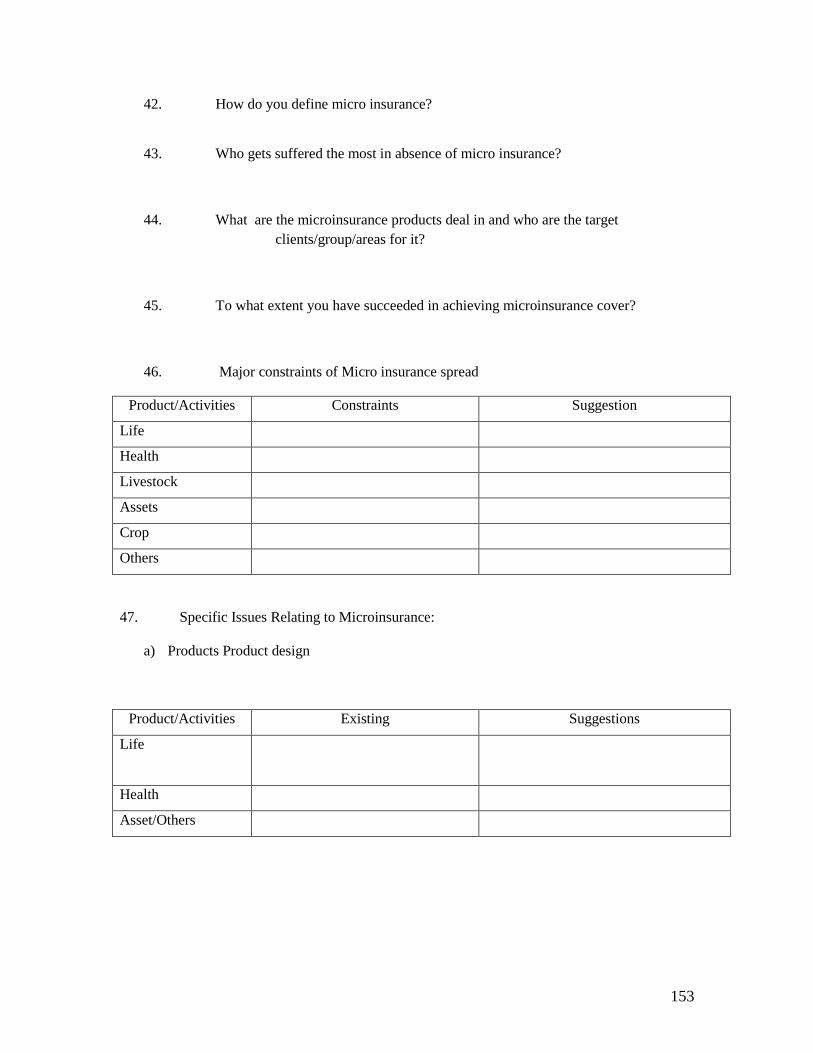
153
42. How do you define micro insurance?
43. Who gets suffered the most in absence of micro insurance?
44. What are the microinsurance products deal in and who are the target
clients/group/areas for it?
45. To what extent you have succeeded in achieving microinsurance cover?
46. Major constraints of Micro insurance spread
Product/Activities Constraints Suggestion
Life
Health
Livestock
Assets
Crop
Others
47. Specific Issues Relating to Microinsurance:
a) Products Product design
Product/Activities Existing Suggestions
Life
Health
Asset/Others
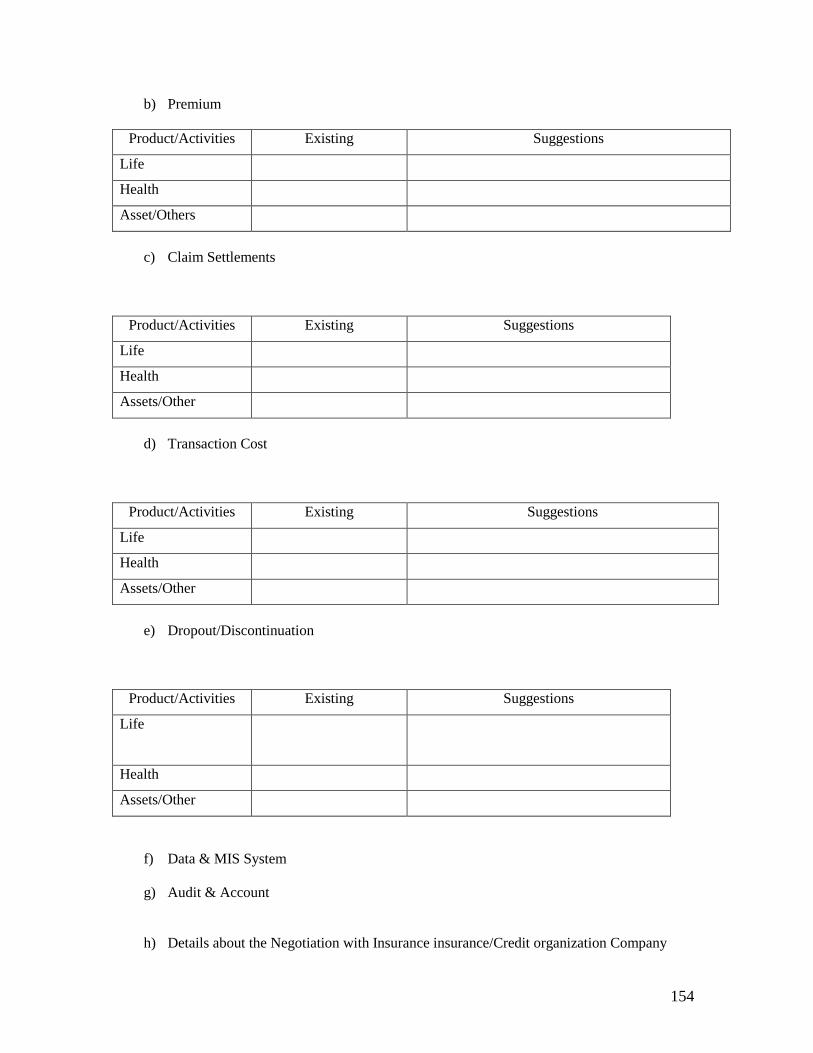
154
b) Premium
Product/Activities Existing Suggestions
Life
Health
Asset/Others
c) Claim Settlements
Product/Activities Existing Suggestions
Life
Health
Assets/Other
d) Transaction Cost
Product/Activities Existing Suggestions
Life
Health
Assets/Other
e) Dropout/Discontinuation
Product/Activities Existing Suggestions
Life
Health
Assets/Other
f) Data & MIS System
g) Audit & Account
h) Details about the Negotiation with Insurance insurance/Credit organization Company
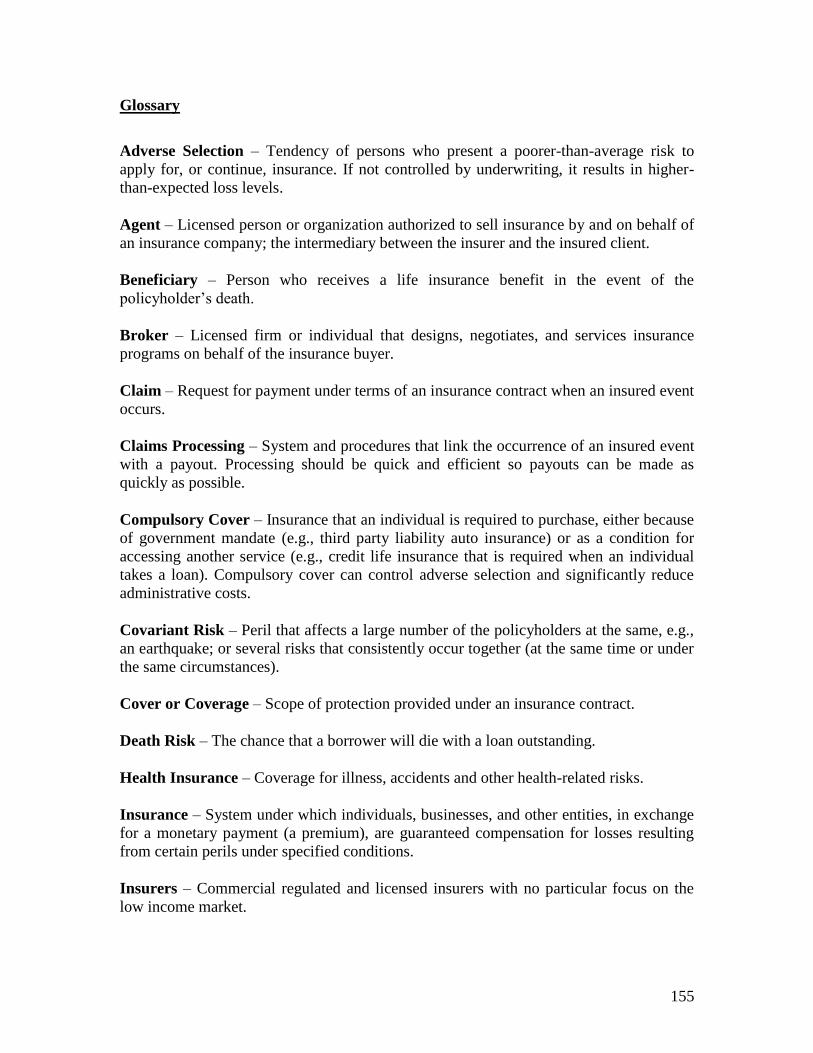
155
Glossary
Adverse Selection – Tendency of persons who present a poorer-than-average risk to
apply for, or continue, insurance. If not controlled by underwriting, it results in higher-
than-expected loss levels.
Agent – Licensed person or organization authorized to sell insurance by and on behalf of
an insurance company; the intermediary between the insurer and the insured client.
Beneficiary – Person who receives a life insurance benefit in the event of the
policyholder‘s death.
Broker – Licensed firm or individual that designs, negotiates, and services insurance
programs on behalf of the insurance buyer.
Claim – Request for payment under terms of an insurance contract when an insured event
occurs.
Claims Processing – System and procedures that link the occurrence of an insured event
with a payout. Processing should be quick and efficient so payouts can be made as
quickly as possible.
Compulsory Cover – Insurance that an individual is required to purchase, either because
of government mandate (e.g., third party liability auto insurance) or as a condition for
accessing another service (e.g., credit life insurance that is required when an individual
takes a loan). Compulsory cover can control adverse selection and significantly reduce
administrative costs.
Covariant Risk – Peril that affects a large number of the policyholders at the same, e.g.,
an earthquake; or several risks that consistently occur together (at the same time or under
the same circumstances).
Cover or Coverage – Scope of protection provided under an insurance contract.
Death Risk – The chance that a borrower will die with a loan outstanding.
Health Insurance – Coverage for illness, accidents and other health-related risks.
Insurance – System under which individuals, businesses, and other entities, in exchange
for a monetary payment (a premium), are guaranteed compensation for losses resulting
from certain perils under specified conditions.
Insurers – Commercial regulated and licensed insurers with no particular focus on the
low income market.
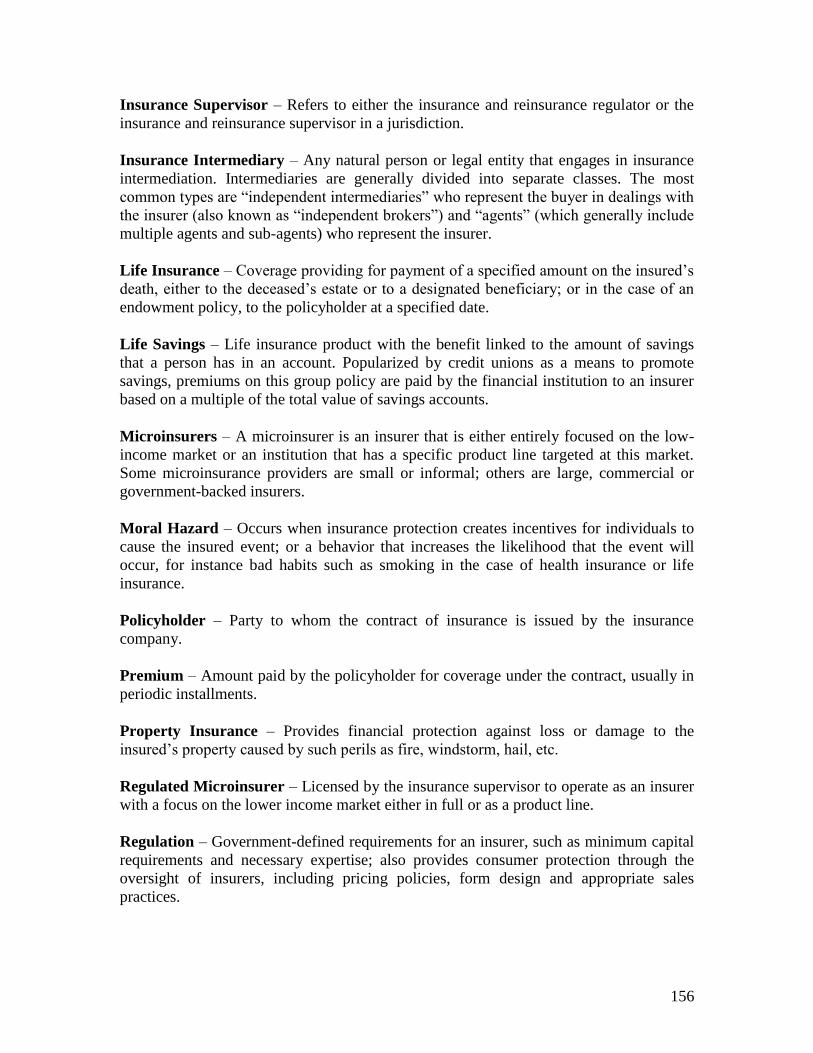
156
Insurance Supervisor – Refers to either the insurance and reinsurance regulator or the
insurance and reinsurance supervisor in a jurisdiction.
Insurance Intermediary – Any natural person or legal entity that engages in insurance
intermediation. Intermediaries are generally divided into separate classes. The most
common types are ―independent intermediaries‖ who represent the buyer in dealings with
the insurer (also known as ―independent brokers‖) and ―agents‖ (which generally include
multiple agents and sub-agents) who represent the insurer.
Life Insurance – Coverage providing for payment of a specified amount on the insured‘s
death, either to the deceased‘s estate or to a designated beneficiary; or in the case of an
endowment policy, to the policyholder at a specified date.
Life Savings – Life insurance product with the benefit linked to the amount of savings
that a person has in an account. Popularized by credit unions as a means to promote
savings, premiums on this group policy are paid by the financial institution to an insurer
based on a multiple of the total value of savings accounts.
Microinsurers – A microinsurer is an insurer that is either entirely focused on the low-
income market or an institution that has a specific product line targeted at this market.
Some microinsurance providers are small or informal; others are large, commercial or
government-backed insurers.
Moral Hazard – Occurs when insurance protection creates incentives for individuals to
cause the insured event; or a behavior that increases the likelihood that the event will
occur, for instance bad habits such as smoking in the case of health insurance or life
insurance.
Policyholder – Party to whom the contract of insurance is issued by the insurance
company.
Premium – Amount paid by the policyholder for coverage under the contract, usually in
periodic installments.
Property Insurance – Provides financial protection against loss or damage to the
insured‘s property caused by such perils as fire, windstorm, hail, etc.
Regulated Microinsurer – Licensed by the insurance supervisor to operate as an insurer
with a focus on the lower income market either in full or as a product line.
Regulation – Government-defined requirements for an insurer, such as minimum capital
requirements and necessary expertise; also provides consumer protection through the
oversight of insurers, including pricing policies, form design and appropriate sales
practices.
157
Reinsurance – Insurance that is purchased by insurance companies for their own
protection. The risk of loss is spread so that a disproportionately large loss under a single
policy doesn't fall on one company. Reinsurance enables an insurance company to
expand its capacity; stabilize its underwriting results; finance its expanding volume and
secure catastrophe protection against shock losses.
Term Insurance – Life insurance payable to a beneficiary only when the insured person
dies within a specified period.
Underwriting – Process by which an insurance company evaluates and selects risks to be
insured and determines terms and conditions under which they will accept the risk.
Unregulated Providers – These are subdivided into two categories: a) formal providers
(established under any other law/regulation) such as cooperatives or microfinance
institutions, and b) the entirely informal providers which are under no legal provision at
all, such as informal funeral societies.