RENUKA HOLDINGS PLC · 2017-08-16 · 2011: The Shaw Wallace Group is acquired, consisting of Shaw...
108
BUILDING ON A FOUNDATION OF 150 YEARS RENUKA HOLDINGS PLC Annual Report 2017
Transcript of RENUKA HOLDINGS PLC · 2017-08-16 · 2011: The Shaw Wallace Group is acquired, consisting of Shaw...

BUILDING ON A FOUNDATION OF 150 YEARS
RENUKA HOLDINGS PLCAnnual Report 2017

CONTENTOrigin/History 2The Group Today 3Sector Analysis 4-7Our Locations 8Our Brands 9At a Glance 10Profile of Directors 11Chairperson’s Review 12Corporate Governance 13-18Audit Committee Report 19-20Related Party Transactions Review Committee Report 21Remunerations Committee Report 22Nominations Committee Report 23Risk Management 24-26Sustainability Report 27-28Report of the Directors 29-32Statement of Directors Responsibility 33
Financial Reports Auditor’s Report 34Statement of Financial Position 35-36Statement of Income 37Statement of Comprehensive Income 38Statement of Changes in Equity 39Statement of Cash Flows 40-41Notes to the Accounts 42-94Real Estate Portfolio 95-96Five Year Summary 97Shareholders’ Information 98-100Notice of Meeting 101Form of Proxy 103-104

RENUKA HOLDINGSANNUAL REPORT 2017 1
Coconut Tea & Superfoods Organic Plantations FMCG
Automotive Property Investments and Services
Dairy
The Renuka family consists of over 1,855 individuals and a further 7,030 farmer families through our outgrower networks. It is their contribution and dedication which enables us to achieve world class possibilities.
WORLD CLASS POSSIBILITIESRenuka Holdings PLC is a diversified organization listed on the Colombo Stock Exchange and is the holding company for subsidiaries engaged in Agri Food, Organic Plantations, FMCG, Dairy, Automotive, Property, Investments and Services, tracing its roots to 1866.
Today we are Sri Lanka’s leading manufacturer & exporter of Coconut based food and beverage products with our own Organic certified plantations, in addition to a century of experience in the tea industry. We are one of the top 05 dairy manufacturers and represent two Fortune 500 companies in the Automotive sector.
We also have been awarded the “Best Under a Billion USD” title by Forbes Asia and we are also winners of numerous Presidential, National, and International awards for excellence in manufacturing, exports, brands and distribution.
One of the most respected entities in Sri Lanka
Within the top 100 firms in Sri Lanka as per LMD
Owners of several leading brands as per Brand Finance
Renuka’s culture reflect more than a structure, it is a statement of values. Our commitment to a Responsive, Enterprising, Nuturing, Unre-lenting, Knowledgeable and Accountable workplace enables us to build relationships with clients and with colleagues, on honesty and trust. It drives our ability to deliver great products and services and to generate superior long-term financial performance for our shareholders.
Culture and Values
RENUKA HOLDINGSANNUAL REPORT 2017 1

RENUKA HOLDINGSANNUAL REPORT 20172
1975: Renuka Enterprises Ltd is established by Mrs. I. Renuka Rajiyah and within the first three years of operations becomes one of the leading exporters of agriculture commodities – desiccated coconut and spices from Sri Lanka. The export business grows by 500% in the first 3 years, paving the way for invest-ments in other areas.
1976: Renuka House, an office and warehouse building is constructed in Colombo 2.1978: Dr. S. Ranjit Rajiyah, a medical doctor by profession, joins the business. Renuka Holdings Ltd is incorporated to act as a promoter for infrastructure development projects such as the construction of the Mahaweli dams, with foreign partners. The Kent warehouse complex is constructed in Colombo 09.
1980: Renuka Teas Ceylon (Pvt) Ltd commences as a producer and exporter of Ceylon tea bags from Sri Lanka.1980: The Cargo Boat Development Co PLC commences construction of a high rise building in Colombo Fort and is listed under the property sector of the Colombo Stock Exchange.1982: Renuka Agro Exports Ltd commences as Sri Lanka’s pioneer value added exporter of Coconut products.1989: Ceylon Botanicals Ltd is formed to venture into organic cultivation and processing; its Wiharagama Estate, Matale Valley having been in the family since the turn of the century. The successor to the company Kandy Plantations Ltd establishes Sri Lanka’s largest organic certified coconut farms.1989: Renuka Group Ltd emerges as the parent company, with only minority affiliate stakes retained in Renuka Hotels and Cargo Boat.
1866: The Cargo Boat Despatch Co. Ltd is established with the aim of launching into the world of shipping. In 1936, Mr. Alfred L. Thambiyah, Member of Parliament of Ceylon, acquires controlling interest of the company from its then foreign owners, and grows it to the forefront of shipping, trading and agriculture, accounting for the majority of the business of the port of Colombo prior to nationalization in 1958. In 1969 Mr. Thambiyah establishes Renuka Hotels Ltd, the company being named after Mr. Thambiyah’s youngest daughter, Renuka.
Also Mr. Thambiyah’s association with Sir Chittampalam A. Gardiner paves the way for the founding of C.T. Holdings PLC (formerly Ceylon Theaters). He was Chairman and Managing Director of Millers and Cargills Ceylon, as well as a Director of Hatton National Bank, where the group had significant shareholdings until his demise.
1990: Renuka Foods PLC (formerly known as Coco Lanka PLC) is established and becomes the leading manufacturer of value added coconut based food products. In 1994 it is listed on the Colombo Stock Exchange under the Food and Beverage sector.
1860s’00 - 19606000’ s’’’’’’’000 1970s’00
1980s’00
1990s’
2000s’00
ORIGINS
2001:The next generation of the family joins the organization.2003: The business of Renuka Foods PLC is expanded by its subsidiary Renuka Agri Foods PLC, commissioning a state-of-the-art Coconut based food and coconut water beverage manufacturing facility.2008: Renuka Holdings PLC is listed on the Colombo Stock Exchange and becomes a sub holding company.2010: Renuka Agri Foods PLC is listed on the Colombo Stock Exchange.2011: The Shaw Wallace Group is acquired, consisting of Shaw Wallace Ceylon (est. 1909), Bois Bros. & Co Ltd, (Est 1891), and Shaw Wallace Properties. Shaw Wallace Ceylon is a leading FMCG Food and Beverage, Automotive business house with strong national brands. Bois Bros. & Co. is one of the pioneering firms of Ceylon’s Tea industry.2012: The Renuka Building, a state-of-the-art 61000 Sq.ft. office building in Colombo 08, is opened to house group companies.2012: McShaw Automotive Ltd is incorporated as a joint venture by the transfer of the automotive business, while the Tea business of Bois Bros. is amalgamated with Renuka Teas.2012: Richlife Dairies Ltd, Sri Lanka’s first UHT Dairy milk manufacturer, is acquired.2014: Unagahadeniya Desiccated Coconut Mills (est. 1961) is acquired, while Renuka Agri Organics Ltd opens an expanded Virgin Coconut Oil manufacturing facility.2015: The property companies of the group are combined under Renuka Development Ltd to form a new sector. Galle Face Properties Ltd commences a high rise building project in the Central Business District of Colombo.2016: Renuka Capital PLC (formally known as Kalamazoo Systems PLC), established in 1958, is acquired. The company becomes an investment trust. 2017: Acquisition of Mayfair Foods (Pvt) Ltd, Sri Lanka’s market leader in Bubblegum and related confectionery products.2017: Investment in Royal Candle Works Ceylon (Pvt) Ltd, with over a century of experience in candle manufacturing and exports.
RENUKA HOLDINGSANNUAL REPORT 20172

RENUKA HOLDINGSANNUAL REPORT 2017 3
THE GROUP TODAY
USD 25 MnIN FOREIGN EXCHANGE
EARNINGS
2.8 BNCONTRIBUTION TO THE RURAL
ECONOMY
7,030FARMER FAMILIES
BENEFITED
WITHIN THE
TOP 5 LOCAL DAIRY PRODUCERS
1,855PEOPLE
DIRECTLYEMPLOYED
LEADINGVALUE ADDED
COCONUT BASEDF&B PRODUCER
IN THE COUNTRY
DISTRIBUTION
71,000 OUTLETS
IN SRI LANKA AND
61 COUNTRIES WORLDWIDE
REPRESENTS2 FORTUNE
500COMPANIES
IN SRI LANKA
NO.1 BRANDIN
- CANNED FISH- COCONUT MILK
- SNACKS
RENUKA HOLDINGSANNUAL REPORT 2017 3
RENUKA HOLDINGSANNUAL REPORT 20174
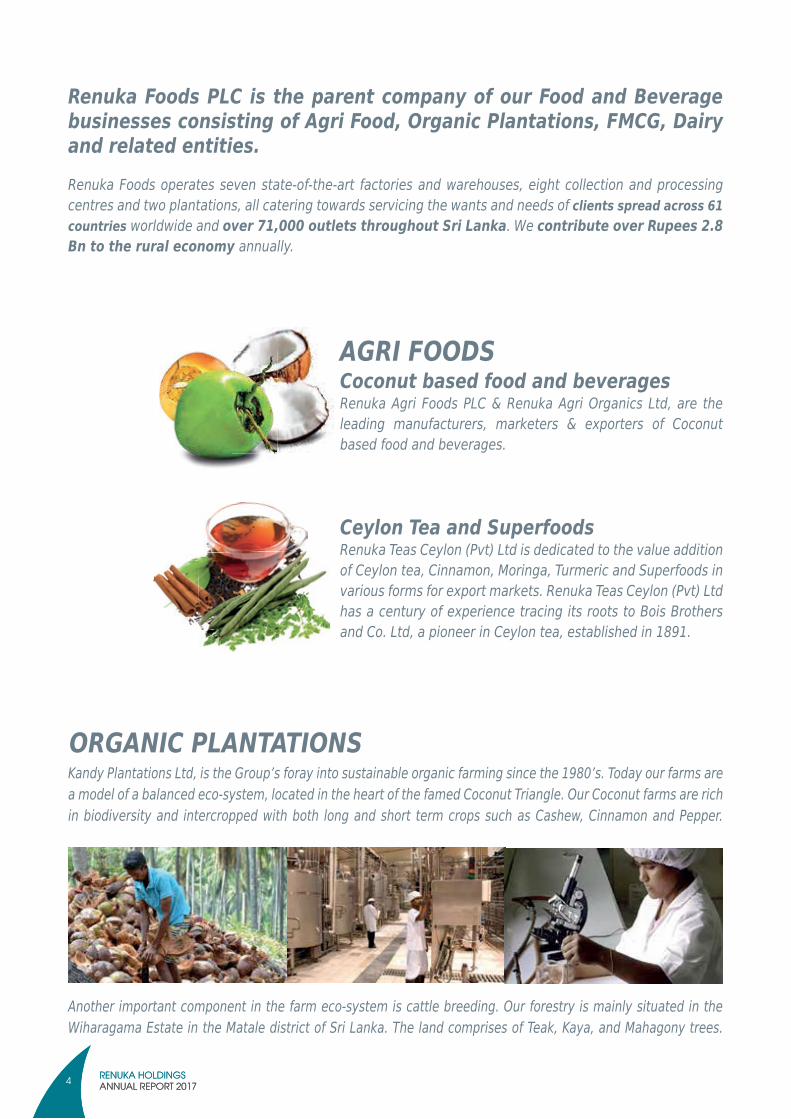
Renuka Foods operates seven state-of-the-art factories and warehouses, eight collection and processing centres and two plantations, all catering towards servicing the wants and needs of clients spread across 61 countries worldwide and over 71,000 outlets throughout Sri Lanka. We contribute over Rupees 2.8 Bn to the rural economy annually.
Renuka Foods PLC is the parent company of our Food and Beverage businesses consisting of Agri Food, Organic Plantations, FMCG, Dairy and related entities.
AGRI FOODSCoconut based food and beveragesRenuka Agri Foods PLC & Renuka Agri Organics Ltd, are the leading manufacturers, marketers & exporters of Coconut based food and beverages.
Ceylon Tea and SuperfoodsRenuka Teas Ceylon (Pvt) Ltd is dedicated to the value addition of Ceylon tea, Cinnamon, Moringa, Turmeric and Superfoods in various forms for export markets. Renuka Teas Ceylon (Pvt) Ltd has a century of experience tracing its roots to Bois Brothers and Co. Ltd, a pioneer in Ceylon tea, established in 1891.
ORGANIC PLANTATIONSKandy Plantations Ltd, is the Group’s foray into sustainable organic farming since the 1980’s. Today our farms are a model of a balanced eco-system, located in the heart of the famed Coconut Triangle. Our Coconut farms are rich in biodiversity and intercropped with both long and short term crops such as Cashew, Cinnamon and Pepper.
Another important component in the farm eco-system is cattle breeding. Our forestry is mainly situated in the Wiharagama Estate in the Matale district of Sri Lanka. The land comprises of Teak, Kaya, and Mahagony trees.
RENUKA HOLDINGSANNUAL REPORT 20174
RENUKA HOLDINGSANNUAL REPORT 2017 55
DAIRY
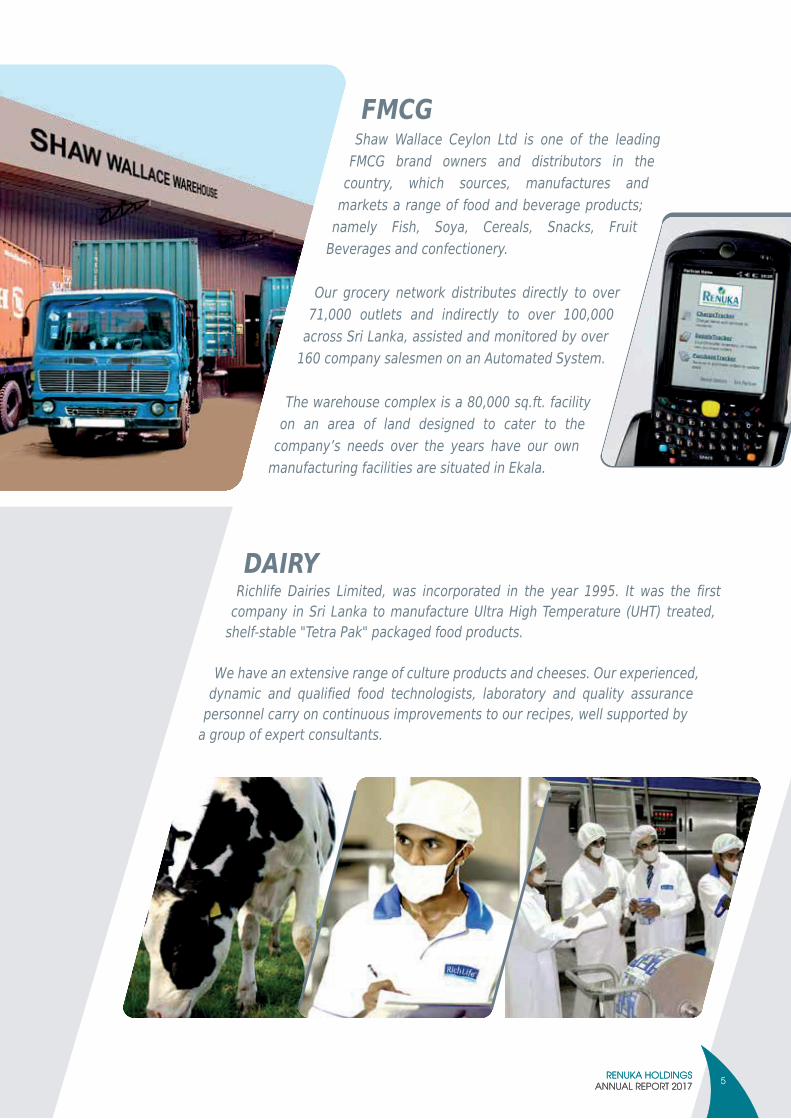
Shaw Wallace Ceylon Ltd is one of the leading FMCG brand owners and distributors in the
country, which sources, manufactures and markets a range of food and beverage products;
namely Fish, Soya, Cereals, Snacks, Fruit Beverages and confectionery.
Our grocery network distributes directly to over 71,000 outlets and indirectly to over 100,000
across Sri Lanka, assisted and monitored by over 160 company salesmen on an Automated System.
The warehouse complex is a 80,000 sq.ft. facility on an area of land designed to cater to the
company’s needs over the years have our own manufacturing facilities are situated in Ekala.
Richlife Dairies Limited, was incorporated in the year 1995. It was the firstcompany in Sri Lanka to manufacture Ultra High Temperature (UHT) treated,
shelf-stable "Tetra Pak" packaged food products.
We have an extensive range of culture products and cheeses. Our experienced, dynamic and qualified food technologists, laboratory and quality assurance
personnel carry on continuous improvements to our recipes, well supported by a group of expert consultants.
FMCG
RENUKA HOLDINGSANNUAL REPORT 2017 5

RENUKA HOLDINGSANNUAL REPORT 20176
AUTOMOTIVE
McShaw Automotive Ltd is a joint venture for the distributorship of renowned global brands such as Delphi Lockheed. A portfolio of products ranging from lubricants such as brake oil, engine oil, radiator coolant, auto parts, accessories, and car care products. The brand is a market leader and the No. 1 in the brake oil category.
The company has a team of 70 dedicated personnel in the key automotive sector covering the segments of key accounts, franchise car dealers, service stations, fuel stations, retailers, spare parts shops, IWS (individual workshops) and franchise workshops.
Interocean Lubricants (Pvt) Ltd is the exclusive distributor and license holder in Sri Lanka for SINOPEC. SINOPEC Lubricant Co, Ltd’s parent company is China Petrochemical Corporation which is among the Global 500 companies, specializing in integrated operations of lubricants. It is one of the world’s largest lubricant companies, holding 1/3 of China’s medium to high-end lubricant market share.
RENUKA HOLDINGSANNUAL REPORT 20176
RENUKA HOLDINGSANNUAL REPORT 2017 7
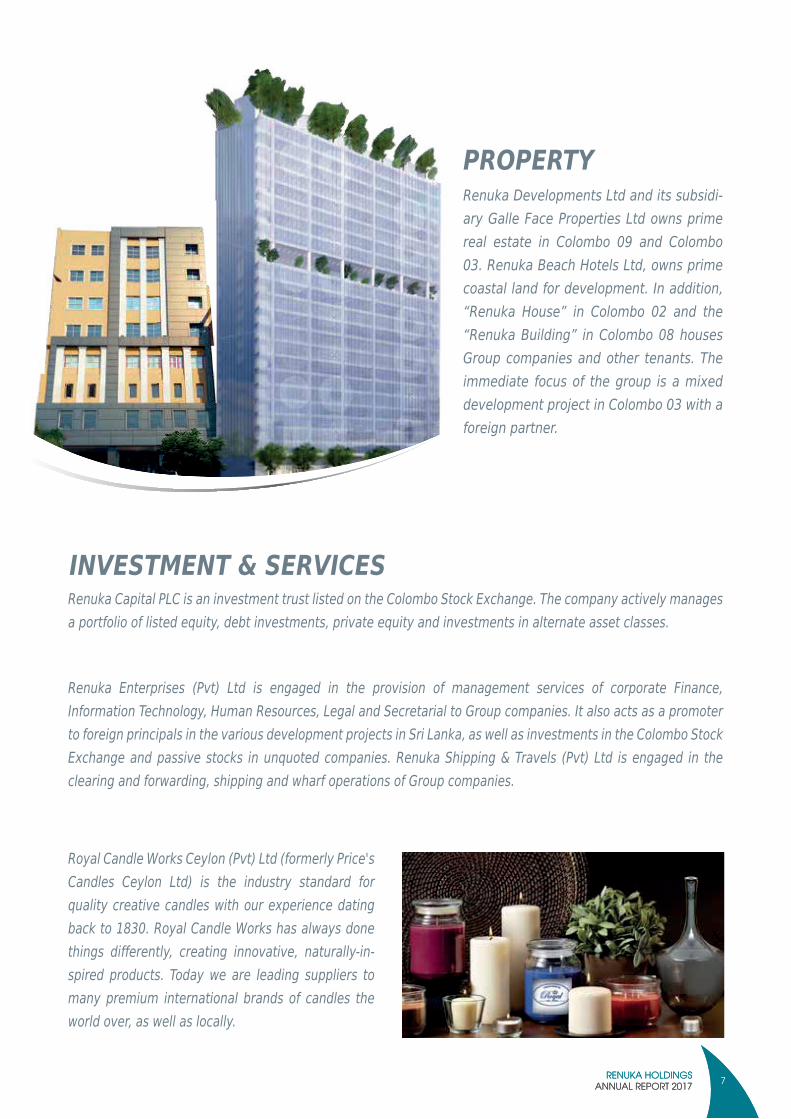
Renuka Developments Ltd and its subsidi-ary Galle Face Properties Ltd owns prime real estate in Colombo 09 and Colombo 03. Renuka Beach Hotels Ltd, owns prime coastal land for development. In addition, “Renuka House” in Colombo 02 and the “Renuka Building” in Colombo 08 houses Group companies and other tenants. The immediate focus of the group is a mixed development project in Colombo 03 with a foreign partner.
PROPERTY
INVESTMENT & SERVICESRenuka Capital PLC is an investment trust listed on the Colombo Stock Exchange. The company actively manages a portfolio of listed equity, debt investments, private equity and investments in alternate asset classes.
Renuka Enterprises (Pvt) Ltd is engaged in the provision of management services of corporate Finance,
to foreign principals in the various development projects in Sri Lanka, as well as investments in the Colombo Stock Exchange and passive stocks in unquoted companies. Renuka Shipping & Travels (Pvt) Ltd is engaged in the clearing and forwarding, shipping and wharf operations of Group companies.
Royal Candle Works Ceylon (Pvt) Ltd (formerly Price's Candles Ceylon Ltd) is the industry standard for quality creative candles with our experience dating back to 1830. Royal Candle Works has always done things differently, creating innovative, naturally-in-spired products. Today we are leading suppliers to many premium international brands of candles the world over, as well as locally.
RENUKA HOLDINGSANNUAL REPORT 2017 7
RENUKA HOLDINGSANNUAL REPORT 20178
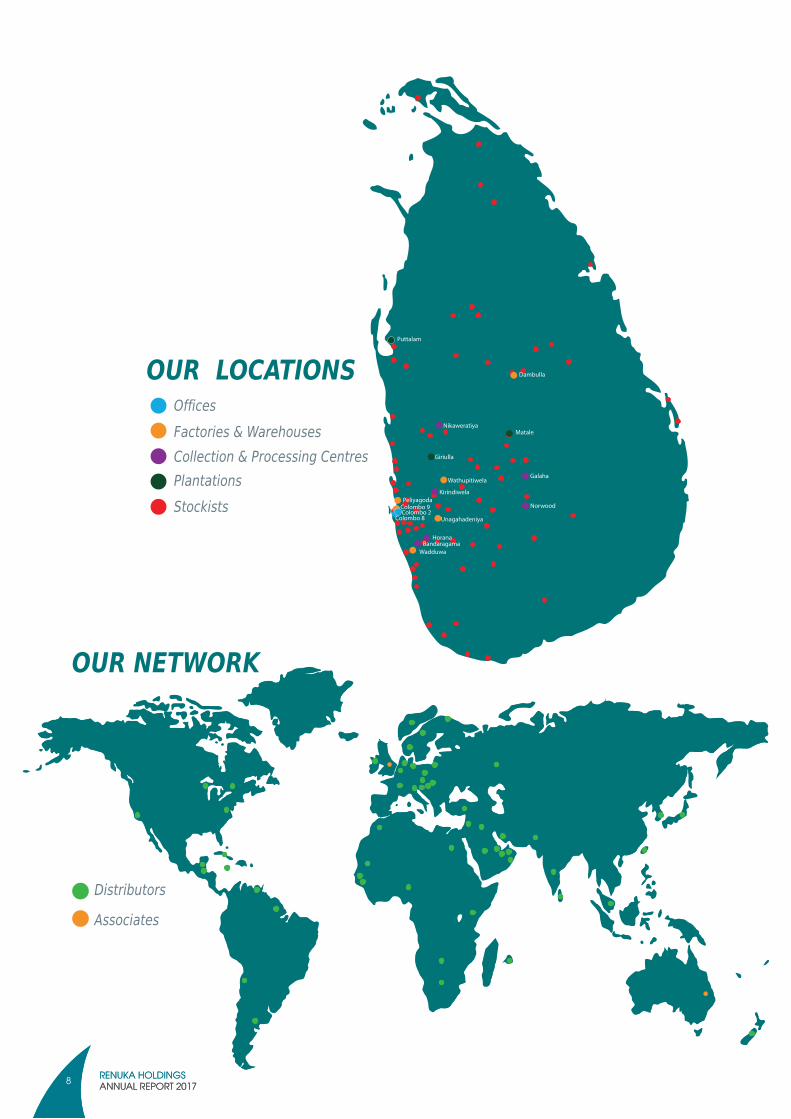
Offices
Stockists
Factories & Warehouses
Distributors
Associates
Collection & Processing Centres Plantations
PeliyagodaColombo 9
Wathupitiwela
Giriulla
Unagahadeniya
Nikaweratiya
Galaha
Norwood
HoranaBandaragama
Kirindiwela
Dambulla
Matale
Puttalam
Wadduwa
Colombo 8 Colombo 2
OUR LOCATIONS
OUR NETWORK
RENUKA HOLDINGSANNUAL REPORT 20178

RENUKA HOLDINGSANNUAL REPORT 2017 9
OUR CERTIFICATIONS
RENUKA HOLDINGSANNUAL REPORT 2017 9

RENUKA HOLDINGSANNUAL REPORT 201710 RENUKA HOLDINGSANNUAL REPORT 2010
1,306Ebit
LKR
Million
1,052Net Profit
Million
1,855Employees
Nos’
11,816Total Assets
Million
8,426Revenue
Million
Rupees(’000)
8,000,000
10,000,000
6,000,000
4,000,000
2,000,000
2013 Year
Revenue Profit
2014 2016 20172015
Group Revenue and Profit after Tax
Revenue in Year 20178,426 Mn
1,052 MnProfit in Year 2017
Rupees(’000)
2013 Year
Assets Liabilities
2014 2016 20172015
Total Assets and Total Liabilities
Total Assets in Year 201711,816 Mn
3,377 MnTotal Liabilities in Year 2017
Rupees(’000)
2013 Year
Equity Long Term Liabilities
2014 2016 20172015
Total Equity and Long Term Liabilities
Total Equity in Year 20178,438 Mn
986 MnLong Term Liabilities in Year 2017
VALUE
AT A GLANCE
ADDEDDISTRIBUTION
Taxes
Salaries
Dividend
04%27%02%
Operations22%
LKR
LKR
LKR
- 2,000,000 4,000,000 6,000,000 8,000,000
10,000,000 12,000,000 14,000,000
- 2,000,000 4,000,000 6,000,000 8,000,000
10,000,000
0%
5%
10%
15%
20%
25%
30%
35%
40%
45%
50%
Retained45%
RENUKA HOLDINGSANNUAL REPORT 201710

RENUKA HOLDINGSANNUAL REPORT 2017 11
Mrs I.R.Rajiyah (Chairperson)
Mrs. I.R. Rajiyah is the Executive Chairperson of the Company. She is qualified in Business Studies from the United Kingdom and is a fellow of the British Institute of Management. She counts over 40 years of corporate experience in founding and running businesses. She was presented with the Best Women Exporter Award in 2009 by the National Chamber of Exporters Sri Lanka. She is also the Executive Deputy Chairperson of Renuka Foods PLC, Renuka Agri Foods PLC, Non-Executive Director of Shaw Wallace Ceylon Ltd, Richlife Dairies Ltd and several un-listed companies.
Dr. S. R. Rajiyah (Managing Director)
Dr S.R.Rajiyah is the Group Managing Director of the Company.He is also the Executive Chairman of Renuka Foods PLC and Renuka Agri Foods PLC, Chairman of Shaw Wallace Ceylon Ltd, Director of Richlife Dairies Ltd and the Managing Director of Renuka Group Ltd. He is a medical doctor qualified in Sri Lanka and counts over 40 years of corporate experience in operations, quality management, research and development as well as in founding and running businesses.
Mr. S. V. Rajiyah
Mr. S.V.Rajiyah is an Executive Director of the Company. He is also an Executive Director of Renuka Foods PLC, Renuka Agri Foods PLC, Shaw Wallace Ceylon Ltd and Richlife Dairies Ltd. He is the Executive Chairman of Renuka Capital PLC. Mr Rajiyah is a graduate in Management from the Warwick Business School, University of Warwick, United Kingdom. His direct interest includes corporate strategy, key product and brand development and portfolio management. He has over 15 years of experience in General Management. He is a member of the Economic Fiscal Policy Planning Committee of the Ceylon Chamber of Commerce.
Mr. M. S. Dominic
Mr. M.S. Dominic is an Independent Non-Executive Director and holds a BSc (Hons) degree in Information Technology from the University of South Bank, United Kingdom. He has over 35 years of experience in the Information Technology field. He is also Director of The Autodrome PLC, Renuka Foods PLC and Renuka Capital PLC. He is also a Director of Sithi Jaya Fund.
Mrs A.L.Rajiyah
Mrs. A.L. Rajiyah is an Non-Executive Director of the Company and holds a BSc (Hons) degree in Accounting and Finance from the University of Warwick and MSc in Law and Accounting from the London School of Economics.
She spent 3 years at the investment bank, Morgan Stanley in London where she was involved in the structuring of credit derivative products linked to European corporates. She subsequently joined Alcentra Limited (a subsidiary of Bank of New York Mellon Corporation) which is a USD 18 Bn asset management firm in London, where she was a Vice President involved in portfolio management, trading and investing in credit derivative products for Alcentra’s structured products platform. She is also an Executive Director of Renuka Agri Foods PLC and Non-Executive Director of Renuka Foods PLC.
PROFILE OF DIRECTORS
Mr L.M.Abeywickrama
Mr. Lasantha Abeywickrama is a Non-Executive Director of the company. He is a Management consultant and trainer with over 30 years of management experience in the private sector both Sri Lanka and Overseas. He holds a Bachelors Degree in Science from the University of Colombo, a Post Graduate Diploma in Marketing from the Chartered Institute of Marketing and MBA from the American University Washington DC. He is a fellow of the Chartered Institute of Marketing and a past Chairman of the CIM Sri Lanka region. He serves as a Non-Executive Director on the Boards of Renuka Agri Foods PLC and Renuka Foods PLC.
Mr T.K.Bandaranayake
Mr. T.K. Bandaranayake is an Independent Non-Executive Director of the Company. He is a Fellow Member of the Institute of Chartered Accountants of Sri Lanka. He was in public practice with Ernst & Young for 27 years since 1982. He was a Senior Partner managing a large portfolio of clients. He is also a Director of Renuka Foods PLC, Nawaloka Hospitals PLC, Overseas Realty (Ceylon) PLC, Samson International PLC, Laugfs Gas PLC, Browns & Company PLC, Harischandra Mills PLC, Micro Holdings Ltd.
Dr. J. M. Swaminathan
Dr. J. M. Swaminathan is an independent, Non-Executive Directors of the Company. He holds LLB (Ceylon), LLM, M. Phil. (Colombo) and LLD (Honoris Causa) Degrees and is an Attorney-at-Law. He has been in the legal profession for over 53 years. He is the Precedent Partner of Messrs. Julius & Creasy and is a Member of the Law Commission of Sri Lanka and Former Member of the Council of Legal Education. He is also a Member of the Company Law Advisory Commission and Intellectual Property Law Advisory Commission. He was a Member of the Board of the Faculty of Law of the University of Colombo. He also served as a Member of the Legal Cluster of the National Council for Economic Development and the Financial Systems Stability Committee of the Central Bank of Sri Lanka. He has also served as a Visiting Lecturer and an Examiner at the Faculty of Law, University of Colombo and was a Lecturer at the Institute of Advanced Legal Studies Unit of the Sri Lanka Law College and was also a Faculty Member for the LLM Courses of the University of Wales and LLM Colombo. He is a member of the Council of the University of Colombo and serves on the Board of Management of the University School of Computing. He is also a Member of the Standing Committee on Legal Studies of the University Grants Commission. He also serves on the Boards of several public and private companies.
Mr. C. J. De S. Amaratunge
Mr. C.J.De.S.Amaratunge is an Independent, Non Executive Director of the Company. He is an Attorney at law and Notary Public and was called to Bar in 1967. He is the Senior Partner of M/s Dissanayake Amaratunge Associates, Attorneys at Law, Notaries Public and Solicitors. He counts over 50 years of experience in all civil branches of the law including Commercial Corporate Conveyancing and Litigation. He is the Non-Executive Chairman of Richlife Dairies Ltd and serves as a Director on several boards of both private and public companies.

RENUKA HOLDINGSANNUAL REPORT 201712
CHAIRPERSON’S REVIEW
I have pleasure in presenting the Annual Report for the year ended 31st March 2017 together with the Financial Statements. I am also pleased to welcome all our valued stakeholders to the 37th Annual General Meeting of Renuka Holdings PLC.
The Economy
The global economy continues to recover, albeit at a slow pace, but with increased uncertainty. Growth projections have been revised downwards by 10% since IMF’s forecasts with growth now projected at 4.5% in 2017. This is a result of slow growth in advanced economies, rebalancing of China, and further decline in commodity prices.
Year 2017 was the second year under the new Government. As evidence by the Government policy documents and the two budgets presented in 2016 and 2017, Sri Lanka is moving away from a debt financing economy to a globally competitive, export-led economy with an emphasis on foreign direct investments. In this policy turnaround the Government had to make three firm decisions. One was to curtail credit to the private sector by increasing interest rates. Secondly, increasing taxes to mobilise revenue in order to balance the budget; in particular increasing the Value Added Tax (VAT) from 11% to 15%. Thirdly, agreeing to a stabilization package with the International Monetary Fund (IMF) in June 2017.
The Performance
This year we have made the changes needed to re-energise the operation. We have guided our efforts with the three priorities we set out as we commenced the financial year, that is to consolidate our positions across all business sectors, to build systems, processes, and future leaders, to ensure our readiness for the opportunities ahead, while ensuring that the foundation of trust and sustainable value-creation continues to remain deep-rooted in our corporate culture.
As a result, Group revenue increased by 8% YOY to Rs 8.4 billion in 2017 compared to Rs 7.8 billion in 2016. The revenue represented by Agribusiness 47% (2016 – 53%), FMCG 45.3% (2016 – 46%), Automotive 7.4% (2016 – Nil), Investment & Services 0.2% (2016 – 0.8%) and Property 0.02% (2016 – 0.02%) of the Group revenue. All segments recorded a commendable performance making a significant contribution to the Group’s bottom line.
Net Profit before Income tax was Rs. 1,142 million reflecting a 14% increase from the previous year. The Net Profit for the year after Tax recorded a commendable Rs. 1,052 Million during the year as against Rs. 905 Million last year. Our total Group Non-Current Assets recorded a 7% increase, to a position of Rs. 6.67 Billion which is mainly contributed from the increase in Property, Plant and Equipment together with Investment Properties amounting to Rs. 566 Million. The Group Net Asset has grown by 10% amounting to Rs. 8.4 Billion as at 31st March 2017.
The Company’s philosophy on corporate governance is to conduct its business in a manner which is ethical and transparent to all stakeholders in the company, including shareholders, creditors and employees. The company operates in compliance with all regulatory and policy requirements. The Company’s philosophy on corporate governance is thus concerned with the ethics, values and morals of the company and its directors, who are expected to act in the best interests of the company and remain accountable to shareholders and other beneficiaries for their actions.
The Future
It is our fervent hope that the Government will ensure consistency, transparency and long term horizons of policies as this would be the best incentive for the private sector to implement long-term investment strategies to add value to the Sri Lankan economy and harness its potential.
Sri Lanka’s location holds great potential as a gateway to Europe, Asia and Africa, and hence brims with potential to become a global logistics hub, whilst our natural resources have given us the advantage to become an agricultural country. Combined with a democratic society and a stable Government, these are all things that we can take pride in and leverage on in order to take Sri Lanka to a new level of development and prosperity. Our optimism is further supported by the fact that Sri Lanka is one of the safest countries in the world today, insulated from security concerns and threats that challenge many nations at present.
One of the Group’s greatest strengths is the diversity of the sectors in which it operates and the group is working towards making all its sectors significant income generators by using its existing asset and resource base.
Acknowledgement
There are many to whom I would like to convey my heartfelt gratitude, for their contributions have been the fuel behind your Group’s ability to imagine and create, meet opportunities and exceed expectations. My sincere appreciation to my colleagues on the Board for their guidance and constant support; to the members that make up our team, for their passion, unwavering commitment and tireless efforts; to our customers, shareholders, business associates and other stakeholders for their continued support and inspiration.
Sgd.
Mrs. I.R Rajiyah
Chairperson
15th August 2017

RENUKA HOLDINGSANNUAL REPORT 2017 13
CORPORATE GOVERNANCE
Corporate Governance of Renuka Holdings PLC has been built on core principles of accountability, participation and transparency. Through the corporate governance system it manages the wider range of companies in the group. This is a robust framework of structures, policies & procedures, codes and processes to ensure that our group values and standards are maintained through out the companies in the group. Corporate Governance essentially involves balancing the interests of the many stakeholders in the company - these include its shareholders, management, customers, suppliers, financiers, government and the community. Since Corporate Governance also provides the framework for attaining a company’s objectives, it encompasses practically every sphere of management, from action plans and internal controls to performance measurement and corporate disclosure.
The Company holds itself accountable to the highest standards of Corporate Governance and provides public accessibility to the information of the Company. Corporate Governance has been institutionalized at all levels in the Group through a strong set of corporate values which have been adhered to by the senior management and Board of Directors in the performance of their official duties andin other situations which could affect the Group image. The Group is committed to the highest standards of integrity, ethical values and professionalism in all its activities.
In Renuka Holding Group, we set our framework of Corporate Governance in line with Code of Best Practice on Corporate Governance issued by the Institute of Chartered Accountants of Sri Lanka and the rules set out in the Colombo Stock Exchange Listing Rules and also comply with the Country’s Legislative and Regulatory requirement.
Corporate Governance System
The Board of Directors who are appointed by the shareholders are the ultimate governing body of the Company and the highest decision making authority and has overall responsibility for determining the strategic directions of the company and the group. In all action taken by the Board of Directors are expected to exercise their business judgment considering the best interest of the Company.
COMPOSITION OF THE BOARD AND DIRECTORS INDEPENDENCE
The Board comprised of nine Directors of which three Directors are Executive and six Directors are Non-Executive. Out of six Non-Executive Directors there are four Independent Directors. The status of Directors are given below.
Name of Director Executive Non – Executive
Independent
Mrs I.R. Rajiyah √
Dr S.R. Rajiyah √
Mr S.V. Rajiyah √
Name of Director Executive Non – Executive
Independent
Mrs A.L. Rajiyah √
Mr C. J. De. S. Amaratunge √ √
Mr. T.K. Bandaranayake √ √
Mr L.M. Abeywickrama √
Mr M.S. Dominic √ √
Mr J. M. Swaminathan √ √
The Board determined that the Independence of the Directors are measured in accordance with the Colombo Stock Exchange Rules and the Independent Non-Executive Directors have submitted signed confirmation of their Independence.
The profiles of the directors are given in page 11 to this Annual Report which states that all Directors are having diverse experience, professionalism and has a wide range of expertise in diverse fields in the corporate world.
Board Role & Responsibilities
The Boards aims at fulfilling its responsibilities by creating value for all stakeholders that is sustainable and beneficial. Under the direction of the Executive Directors and oversight of the Board, the business of the Company is conducted by its managers, officers and employees to enhance the longterm value of the Company.
The Board gives leadership in setting the strategic direction and establishing a sound control framework for the successful functioning of the Company. The Boards composition reflects a sound balance of independence.
The Board meets regularly and gives full consideration to the following:
• Review strategic and operational issues• Approve interim and annual budgets• Review profit and working capital forecasts and
monthly management accounts• Provide advice and guidelines to senior Managers• Approve major Investments• Approve interim and annual reports
Board Balance
The balance of Executive, Non-Executive and Independent Non-Executive Directors on the Board who are professionals/academics/business leaders holding senior positions in their respective fields ensures a right balance between executive expediency and independent judgment as no individual Director or small group of Directors dominate the Board discussion and decision making.
Directors are provided with monthly reports of performance and minutes of the Boards Meetings and are given the

RENUKA HOLDINGSANNUAL REPORT 201714
CORPORATE GOVERNANCE (CONT.)
specific documentation necessary, in advance of such meetings.
There is a distinct and clear division of responsibilities between the Chairperson and the Management to ensure that there is a balance of power and authority. The roles of the Chairperson and the management are separated and clearly defined. The Chairperson is responsible for ensuring Board effectiveness and conduct whilst the Management has overall responsibilities over the operating units, organizational effectiveness and implementation of Board policies and decisions.
Board Meetings and Attendance
The Board convened four times during the year ended 31st March 2017 and Directors attendance to these meetings is as follows.
Name of Director Eligible to attend
Attended
Dr. S.R. Rajiyah 4 4/4
Mrs. I.R. Rajiyah 4 2/4
Mr. S.V. Rajiyah 4 4/4
Mrs. A.L. Rajiyah 4 1/4
Mr. L.M. Abeywickrema 4 2/4
Mr. C.J. De S.Amaratunge 4 1/4
Mr. M.S. Dominic 4 3/4
Mr. T.K. Bandaranayake 4 3/4
Mr. J.M. Swaminathan 4 2/4
The Chairperson ensures that Board members has access to adequate information and provided with sufficientopportunity to obtain clarifications on the matters before the meetings through presentations and documents prepared by the management and their teams. Board members are also have access to key management personnel for any clarifications. Chief Executive Officer -Shared Services, present the updates on performance of the company, compliance with regulatory requirements such as Colombo Stock Exchange Listing rules, Companies Act requirements and compliance with tax regulations.
Board Appointment and Re-election of Directors
The Company’s Articles of Association call for one third of the Non-Executive Directors retire at each Annual General Meeting and the Director who retires are those who have served for the longest period after their appointment/re-appointment.
Access to Independent Professional Advice
In the process of preserving the independence of the Board and for effective decision making process the Directors obtain independent and professional advice where necessary.
Access to Advice and Services of Company Secretary
All Directors have access to the advice and services of the Company Secretarial function provided by Renuka
Enterprises (Pvt.) Ltd., who is responsible for ensuring that Board procedures are followed, compliance with rules and regulation, directions and statutes keeping minutes and maintaining required records of the companies in the Group.
Independent Judgment
Directors bring independent judgment to bearing on issues of strategy, performance, resources and standards on business conduct. Composition of the Board ensures that there is a sufficient balance of power and contribution byall directors without domination by one or few directors on Board processes or decision making.
Dedication of Adequate Time and Effort to Matters of the Board and the Company
Director are ensure that they dedicate adequate time and effort to the matters of the Board and the Company and ensure that the duties and responsibilities owed to the Company are satisfactorily discharged. Accordingly dates of quarterly Board meetings and Board Sub-Committee meetings are scheduled well in advance and the relevant papers and documents are circulated a week prior to the meeting giving sufficient time for review. There is provisionto circulate papers closer to the meeting on an exceptional basis.
Board Sub Committees
To assist the Board in discharging its duties various Board Committees are established. The functions and terms of references of the Board Sub-Committee are clearly defined where applicable and comply with the recommendation of the Code of Best Practice on Corporate Governance.
The Four Board Sub Committees are as followsi. Audit Committeeii. Remuneration Committeeiii. Related Party Transactions Review Committeeiv. Nomination Committee
Audit Committee
The Board has established an Audit Committee which has oversight responsibility for financial reporting system of the company considering how they should select and apply accounting policies, financial reporting and establish internal controls and maintaining an appropriate relationship with the external auditors.
All members of the Audit Committee consist of Independent Non-executive Directors who are appointed by and responsible to the Board of Directors. The Executive Director – Mr S.V. Rajiyah, Chief Executive Officer – SharedServices and Chief Financial Officer attended the meetingsby invitation. Other members of the Board, members of Management as well as External Auditors were present when required. The Company Secretary serves as Secretary to the committee.
The Audit Committee reviews the Accounting Policies and
RENUKA HOLDINGSANNUAL REPORT 2017 15
presentation for external audit function and ensures that an objectives and professional relationship is maintained with the External Auditors. Also Audit Committee reviews and assists the Board in maintaining a sound system of internal control.
The Committee has full access to the External Auditors who, in turn, have access at all times to the Chairman of the Committee. The Committee meets with the External Auditors without any executive present at least once a year, in line with good Corporate Governance Practice.
The Report of the Audit Committee is presented on pages 19 to 20 and the duties of the Audit Committee are included therein.
Remuneration Committee
The Remuneration Committee determines the remuneration of the Chairman/Chief Executive and the Executive Directors and sets guidelines for the remuneration of the key management staff within the Group.
The Remuneration Committee consist of three Directors out of which two Directors are independent and all three Directors are Non-Executive Directors. The Chairman of the Committee is an Independent Non-Executive Director and the Company Secretary serves as Secretary to the Committee.
The Report of the Remuneration Committee is presented on page 22 and the duties of the Remuneration Committee are included therein.
Related Party Transactions Review Committee
The objective of the Committee is to exercise oversight on behalf of the Board of Renuka Holdings PLC and its listed Subsidiaries, to ensure compliance with the Code on Related Party Transactions, as issued by the Securities and Exchange Commission of Sri Lanka (“The Code”) and with the Listing Rules of the Colombo Stock Exchange (CSE). The Committee has also adopted best practices as recommended by the Institute of Chartered Accountants of Sri Lanka and the CSE.
The Related Party Transactions Review Committee consist of three Independent Non-Executive Directors who are appointed by and responsible to the Board.
The Executive Director – Mr S.V. Rajiyah, Chief Executive Officer – Shared Services and Chief Financial Officer attended the meetings by invitation and the Company Secretary serves as Secretary to the Committee.
The Report of the RPTR Committee is presented on page 21 and the duties of the Committee are included therein.
Nomination Committee
The Committee objective is to define and establish the nomination process for Non-Executive Directors, lead the process of Board appointments and make recommendations to the Board. The Committee scope out
the tasks such as assess skills required to be on the Board, periodic review of the extent of skills required are represent on the Board, Review the clear description of role and capabilities required for a particular Board appointment and Identify and recommend suitable candidate to the Board.
All three Directors in the Nomination Committee are Non-Executive Directors of which two Directors are Independent.
The Report of the Nomination Committee is presented on page 23 and the duties of the Committee are included therein.
Stakeholder Management and Shareholder Relationship
The Board considers the Annual General Meeting as a prime opportunity to communicate with shareholders. The Shareholders are given the opportunity of exercising their rights at the Annual General Meeting. The notice of the Annual General Meeting and the relevant documents required are published and sent to the shareholders within the statutory period.
The Company circulates the agenda for the meeting and shareholders vote on each issue separately. All shareholders are invited and encourage participating at the Annual General Meeting. The Annual General Meeting provides an opportunity for shareholders to seek and obtain clarifications and information on the performance of the Company and to informally meet the Directors. The external Auditors are also present at the Annual General Meeting to render any professional assistance that may be required. Shareholders who are not in a position to attend the Annual General Meeting in person are entitled to have their voting rights exercised by a proxy of their choice.
The Company published quarterly accounts and Annual Report in a timely manner as its principle communication with shareholders and others. This enables stakeholders to make a rational judgment of the Company.
Internal Audit And Control
The Board is responsible for the Group’s internal control and its effectiveness. Internal control is established with emphasis placed on safeguarding assets, making available accurate and timely information and imposing greater discipline on decision making. It covers all controls, including financial, operational and compliance control and risk management. It is important to state, that any system can ensure only reasonable and not absolute assurance that errors and irregularities are prevented or detected within a reasonable time.
The Group obtains the services of an independent, a leading professional accounting firm other than the statutory auditors to carryout internal audits and reviews. These reports along with management comments discuss with Audit Committee and with the Board. Further at each meeting follow up issues from previous meeting also discuss in order to make sure implementation of appropriate policies and procedures as prevention mechanism.
CORPORATE GOVERNANCE (CONT.)

RENUKA HOLDINGSANNUAL REPORT 201716
CORPORATE GOVERNANCE (CONT.)
External Audit
The Group uses four Processional Accounting Firms for its external audits. Some of them provide non-assurance services to the Group. The restrictions provided in terms of rulings issued by CSE and other commitments were taken into consideration when entering engagements with the Group auditor.
The Knowledge and experience of the Audit Committee ensure effective usage of the expertise of the auditors, while maintain independence, in order to derive transparent Financial Statements. This Group maintains independence from financial and non-financial interest between auditors and re-assesses the same on a regular basis.
Major Transactions
There are no transactions during the year under review which fall within the definition of ‘Major Transaction’ in terms of the Companies Act.
Going Concern
The Directors, upon making necessary inquiries and reviews including reviews of the Group budget for the following year, capital expenditure requirements and available financing facilities, have a reasonable expectation of the Company’s existence in the foreseeable future. Therefore, the going concern basis is adopted in the preparation of the Financial Statements.
Corporate Governance Compliance Statement
Renuka Holdings PLC is fully complied with the Corporate Governance listing requirement of the Colombo Stock Exchange and adheres to the different regulating authorities including,
• Companies Act No.7 of 2007• Code of Best Practices on Corporate Governance
issued jointly by the CA Sri Lanka and the Securities & Exchange Commission of Sri Lanka
• Inland Revenue Act• Exchange Control Act• Board of Investment Regulations• Customs Ordinance

RENUKA HOLDINGSANNUAL REPORT 2017 17
CSE RuleReference
Corporate Governance Principles Compliance Status
Company’s Extent of Adoption
7.10 COMPLIANCE
a./b./c. Compliance with Corporate Governance Rules Compliant This report declares the confirmation on compliance and refer Page 16 for “CORPORATE GOVERNANCE COMPLIANCE STATEMENT”
7.10.1 NON-EXECUTIVE DIRECTORS (NED)a. At least 2 members or 1/3 of the Board, whichever is
higher should be NEDsCompliant Six out of Nine Directors are Non-Executive Directors
b. The Total number of Directors is to be calculated based on the number as at the conclusion of the immediately preceding Annual General Meeting
Compliant Calculation is based on number as at the conclusion of the immediately preceding Annual General Meeting
c. Any change occurring to this ratio shall be rectified within ninety (90) days from the date of the change
Compliant No applicable
7.10.2 INDEPENDENT DIRECTORS a. 2 or 1/3 of NEDs, whichever is higher shall be
‘independent’Compliant Three out of six Non-Executive Directors are
independent b. Each NED to submit a signed and dated declaration
annually of his/her independence or non-independence
Compliant All Non-Executive Independent Directors have submitted their confirmation on independence
7.10.3 DISCLOSURES RELATING TO DIRECTORS a./b. Board shall annually determine the independence or
otherwise of NEDsCompliant The Board assessed the independence declared
by Directors and determined the Directors who are independent.
c. A brief resume of each Director should be included in the Annual Report including the Directors’ experience
Compliant Refer page 11 for a brief resume of each Director
d. Provide a resume of new Directors appointed to the Board along with details
N/A There are no new appointments during the year ended 31st March 2017.
7.10.4 CRITERIA FOR DEFINING INDEPENDENCEa. - h. Requirements for meeting the criteria to be an
Independent DirectorCompliant As per 7.10.2 a & b in determining of the
independence or otherwise of NEDs, Board reviewed the criteria for defining independence as per 7.10.4 a to h
7.10.5 REMUNERATION COMMITTEEa.1 Remuneration Committee shall comprise of NEDs, a
majority of whom will be independentCompliant The Remuneration Committee comprises of 3 Non-
Executive Directors of whom 2 are Independent. a.2 One Non-Executive Director shall be appointed as
Chairman of the Committee by the Board of DirectorsCompliant Mr. M.S. Dominic is the Chairman of the Committee
who is a Non-Executive Director.b. Remuneration Committee shall recommend the
remuneration of the CEO and the Executive DirectorsCompliant Refer Page 22 for Remuneration Committee scope
c.1 Names of Remuneration Committee members Compliant Refer Page 22 for names of the Committee membersc.2 Statement of Remuneration policy Compliant Refer Page 22c.3 Aggregate remuneration paid to EDs and NEDs Compliant Refer to Note No. 34 of the Finance Statements
7.10.6 AUDIT COMMITTEEa.1 Audit Committee shall comprise of NEDs, or a majority
of whom should be independentCompliant The Audit Committee comprises of three Non-
Executive Directors of whom all three are independenta.2 A NED shall be the Chairman of the Committee Compliant The Chairman of the Committee is an Independent
Non-Executive Directora.3 CEO and CFO should attend Audit Committee
meetingsCompliant Refer to pages 19 & 20
a.4 The Chairman of the Audit Committee or one member should be a member of a professional accounting body
Compliant The Chairman of the Audit Committee is a Fellow Member of the Institute of Chartered Accountants of Sri Lanka.
CORPORATE GOVERNANCE (CONT.)

RENUKA HOLDINGSANNUAL REPORT 201718
CSE RuleReference
Corporate Governance Principles Compliance Status
Company’s Extent of Adoption
b. Functions of the Audit Committee
b.1 Overseeing of the preparation, presentation and adequacy of disclosure in the financials
Compliant Refer pages 19 & 20 for Audit Committee Report
b.2 Overseeing the compliance with financial reporting requirements, information requirements as per the laws and regulations
Compliant Refer pages 19 & 20 for Audit Committee Report
b.3 Ensuring the internal controls and risk management are adequate to meet the requirements of the SLFRS/LKAS
Compliant Refer pages 19 & 20 for Audit Committee Report
b.4 Assessment of the independence and performance of the Entity’s external auditors
Compliant Refer pages 19 & 20 for Audit Committee Report
b.5 Make recommendations to the Board pertaining to appointment, re-appointment and removal of external auditors and to approve the remuneration and terms of engagement of the external auditors.
Compliant Refer pages 19 & 20 for Audit Committee Report
c.1 Names of the Audit Committee members shall be disclosed
Compliant Refer pages 19 & 20 for Audit Committee Report
c.2 Audit Committee shall make a determination of the independence of the external auditors
Compliant Refer pages 19 & 20 for Audit Committee Report
c.3 Report on the manner in which Audit Committee carried out its functions
Compliant Refer pages 19 & 20 for Audit Committee Report
Below summary list Company compliance with Companies Act No 7 of 2007 Section Companies Act Requirements Compliance
StatusReference
168 (1) (a) The state of the Company’s affairs and nature of the business of the Company or any of its subsidiaries together with any change thereof during the accounting period
Compliant Refer Note No. 01 of the Financial Statements
168 (1) (b) Signed Financial Statement of the Company and its subsidiaries for the accounting period completed
Compliant Refer page 36 of the Annual Report
168 (1) (c) Auditors Report on Financial Statements of the Group and the Company
Compliant Refer page 34 of the Annual Report
168 (1) (d) Accounting Policies and any changes therein Compliant Refer Note No. 01 to 06 of the Financial Statement
168 (1) (e) Particulars of the entries made in the interests Register during the accounting period
Compliant Refer Page 30 of the Annual Report
168 (1) (f) Remuneration and other benefits paid to Directors of the Company during the accounting period
Compliant Refer Note No. 34 of the Financial Statements
168 (1) (g) Corporate donations made by the Company during the accounting period
Compliant Refer page 31 of the Annual Report
168 (1) (h) Names of the Directors of the Company and its Subsidiaries at the end of the accounting period and name of Directors who ceased to hold office duringthe accounting period
Compliant Refer page 84 of the Annual Report
168 (1) (i) Amounts paid/payable to the External Auditor as audit fees and fees for other services rendered during the accounting period
Compliant Refer Note No. 34(a) of the Financial Statements
168 (1) (j) Other relationships or any interest of Auditors with the Company and its subsidiaries
Compliant Refer pages 19 to 20 of the Annual Report for Audit Committee Report
168 (1) (k) Acknowledgment of the content of this report and signature on behalf of the Board
Compliant Refer pages 29 to 32 of the Annual Report for Report of the Board of Directors
CORPORATE GOVERNANCE (CONT.)

RENUKA HOLDINGSANNUAL REPORT 2017 19
The Board has established an Audit Committee which has oversight responsibility for considering how they should select and apply accounting policies, financial reporting and internal control principles and maintaining an appropriate relationship with the external auditors. The audit committee is in line with the Code of the Best Practice on Corporate Governance and the requirement of the Securities and Exchange Commission for Public Listed Companies. The Audit committee functions, authority and duties have been clearly identified in the Audit Committee Charter. This Charter integrates all the requirements of the Securities and Exchange Commission and the Code of Best Practice on Corporate Governance.
Composition Of The Audit Committee
The Audit Committee consist of Independent Non-Executive Directors who are appointed by and responsible to the Board of Directors.
Audit Committee MembersMr. T.K. Bandaranayake(Independent Non-Executive Director) – Chairman
Mr. M.S. Dominic(Independent Non-Executive Director)
Mr. J M Swaminathan(Independent Non-Executive Director)(Appointed w.e.f. 01.08.2016)
Mr. C.J.De.S. Amaratunge(Independent Non-Executive Director)Resigned w.e.f. 01.08.2016
Brief profiles of each member are given on page 11 of this report. Their individual and collective financial knowledge and business acumen and the independence of the Committee are brought to bear on their deliberations and judgments on the matters that come within the Committee’s purview.
Number of Committee Meetings
The committee has met five times during the year under review. The attendance of the members of Audit Committee meeting is stated in the table below. Name of Director Eligible to
AttendAttended
Mr. T.K. Bandaranayake 5 5/5Mr. C.J.De.S. Amaratunge 2 0/2Mr. M.S. Dominic 5 4/5Mr. J M Swaminathan 3 3/3
Company Secretary act as the Secretary to the Audit Committee. The Executive Director – Mr S.V. Rajiyah, Chief Executive Officer – Shared Services and Chief FinancialOfficer, attended the meetings by invitation. Othermembers of the Board, Management members as well as External Auditors were present at the discussions when required.
Functions of the Audit Committee• Oversee the preparation, presentation and
adequacy of disclosures in the Financial Statements in accordance with Sri Lanka Accounting Standards
• Oversee the Entity’s compliance with financial reporting requirements, information requirements of the Companies Act and other relevant financial reporting related regulations and requirements.
• Oversee the processes of the Company to ensure that the internal controls and risk management are adequate, to meet the requirements of the Sri Lanka Auditing Standards.
• Assess the independence and performance of the external auditors.
• Make recommendations to the board pertaining to appointment, re-appointment and removal of external auditors and to approve the remuneration and terms of engagement of the external auditors.
• Discussion of the audit plan, key audit issues and their resolution, management responses and the proposed remuneration of the Auditors.
• Discussion of the Company’s Annual Audited Financial Statements and Quarterly Financial Statements with management and the Auditors.
• Ensue that a process of sound system of internal control is in place in the company and its subsidiaries.
The Audit Committee reviews the scope and results of the audit and its effectiveness, the independence and objectivity of the external auditors. They also review the nature and extent of non audit services provided by the auditors to ensure that auditors are able to maintain objectivity and independence.
Charter of the Audit Committee
“Rules on Corporate Governance” under the listing rules of Colombo Stock Exchange and “Code of Best Practice on Corporate Governance” issued jointly by Institute of Chartered Accountants of Sri Lanka and the Securities and Exchange Commission of Sri Lanka further regulate the composition, role and functions of the Board Audit Committee.
The proceedings of the Audit Committee are regularly reported to the Board of Directors.
Internal Audit• The Committee reviewed the process to assess the
effectiveness and coverage of the internal financial controls that have been designed to provide reasonable assurance to the Directors that assets are safeguarded and that the financial reporting system can be relied upon in preparation and presentation of Financial Statements.
• Also evaluates compliance with laws, regulations and established policies and procedures of the Company.
AUDIT COMMITTEE REPORT

RENUKA HOLDINGSANNUAL REPORT 201720
• Internal Audits are outsourced to leading audit firms in line with an agreed audit plan. Follow-up reviews are scheduled to ascertain that audit recommendations are being acted upon. These reports reviewed by the Committee and compliance with the recommendations of the Internal Auditors have been followed through at subsequent reviews.
Controls and Risks
During the year, the Committee reviewed the effectiveness of the Company’s system of Internal Control. The Committee also assessed the major business and control risks and the control environment prevalent in the Company and advised the Board on action to be taken where weaknesses were observed.
The Audit Committee is satisfied that the Group’s accounting policies and operational controls provide reasonable assurance that affairs of the Group are managed in accordance with Group policies and that Group assets are properly accounted for and adequately safeguarded.
External Auditors
The Audit Committee evaluated the independence of the External Auditors and the effectiveness of the audit process. The Committee met with the External Auditors in relation to the scope of the audit and also to discuss the Management letter at the conclusion of the Audit.
The Committee reviewed the Audited Financial Statements with the External Auditors who are responsible to express an opinion on its conformity with the Sri Lanka Accounting Standards. And also the External Auditor’s kept the Audit Committee advised on an on-going basis regarding any unresolved matters of significance.
The Audit Committee evaluated the independence of the External Auditors and recommended to the Board of Directors that M/s Kreston MNS & Co be appointed as Auditors for the financial year ending 31st March 2018 subject to the approval of the shareholders at the Annual General Meeting.
Sgd.
Tissa K. Bandaranayake
Chairman
15th August 2017.
AUDIT COMMITTEE REPORT (CONT.)

RENUKA HOLDINGSANNUAL REPORT 2017 21
The Related Party Transactions Review Committee (RPTR) was constituted with an objective of keeping in line with the Code of Best Practice on Corporate Governance and the requirement of the Securities and Exchange Commission with a view to ensure that the interests of shareholders as a whole are taken into account by Renuka Holdings PLC and are consistent with the Code when entering into Related Party Transactions and made required disclosures in a timely manner. The committee has also adopted the Best Practices as recommended by the Chartered Institute of Accountants of Sri Lanka and CSE.
Composition of the Related Party Transactions Review Committee (RPTR)
The committee comprises three Independent Non-executive Directors who are appointed by and responsible to the Board of Directors.
Members of Related Party Transactions Review Committee
Mr. T.K. Bandaranayake (Independent Non-Executive Director) – Chairman
Mr. M.S. Dominic (Independent Non-Executive Director)
Mr. J. M. Swaminathan (Independent Non-Executive Director) - Appointed w.e.f. 01.08.2016
Mr. C. J. De S. Amarathunge (Independent Non-Executive Director) - Resigned w.e.f. 01.08.2016
Brief profiles of each member are given on page 11 of this Annual Report.
Their individual and collective financial knowledge and business acumen and the independence of the Committee are brought to bear on their deliberations and judgments on the matters that come within the Committee’s purview.
Number of Committee Meetings
The Committee has met four times during the period under review. The attendance of the members of Committee meeting is stated in the table below.
Name of Director Eligible to attend Attended
Mr. T.K. Bandaranayake 4 4/4
Mr. M.S. Dominic 4 4/4
Mr. J. M. Swaminathan 3 3/4
Mr. C.J. De. S. Amaratunga (Resigned on 01.08.2016)
1 0/1
Attendance by Invitation
The Executive Director – Mr S.V. Rajiyah and Chief Executive Officer – Shared Services attended the meetings byinvitation.
Polices and procedures of Related Party Transactions Review Committee
• Establishing and defining the threshold values of each listed related party transaction as per the Code which require discussion in detail and disclose.
• Identifying related party transactions that need pre-approval from the Board of Directors and need immediate market disclosure. And identify transactions that need shareholder approval and disclosure in the Annual Report.
• Formulating a standard template to implement to all listed subsidiaries in the group to follow when documenting RPT when presenting to RPTR Committee.
• Establishing proper guide lines to identify recurrent & non-recurrent Related party transactions to review economic and commercial substance of the related party transaction.
• Establishing a method of having access to adequate knowledge or expertise to assess all aspects of proposed related party transactions where necessary and procedure for obtaining appropriate professional and expert advice from appropriately qualified persons.
• Providing guidelines which senior management must follow in dealing with related parties.
• Quarterly reviewing to ensure that adequate disclosures have been done in the market or Annual Report as required by the Code.
• The Committee communicates its comments/observations to the Board of Directors after each review of related party transactions.
Task of the Committee
The Committee reviewed the related party transaction presented to them by the management and their compliance in Renuka Holdings PLC and communicated the same to the Board of Directors.
The Board of Directors declared that no RPT falling within the scope of the Code was entered into by the Company during the financial year 2016/17 other than discuss in Note No. 46 on page 83 to the Annual Report.
Sgd.
Tissa K. Bandaranayake
Chairman
15th August 2017.
RELATED PARTY TRANSACTIONS REVIEW COMMITTEE

RENUKA HOLDINGSANNUAL REPORT 201722
Composition of the Committee
The committee consists of three non-executive directors out of which two Directors who independent. The members of the committee have wide experience and knowledge of the business industry we are engage in.
Members of Remuneration Committee
Mr. M. S. Dominic (IND/NED) - Chairman
Mr.T.K.Bandaranayake (IND/NED)
Mr.L.M. Abeywickrema (NED)
IND - Independent director, NED - non-Executive Director
The brief profile of the directors are given on page 11 of the Annual Report.
Meetings
The Committee met once during the year under review. Attendances of the directors in such meetings are given below.
Attendance of the committee
Name of Directors Eligible to Attend
Attended
Mr. M. S. Dominic 1 1/1
Mr.T.K.Bandaranayake 1 1/1
Mr.L.M. Abeywickrema 1 1/1
Attendance by Invitation
The managing director may attend the committee meetings on invitation and consult on the performance and remuneration of the Key management staff to make recommendations.
Independence of the Committee
The committee is independent from the management of the business and not involve any business operations.
The scope of the Committee• The committee study and recommends the
remuneration policy of Directors & Key Management Personnel
• Review the performances of Key Management personnel on periodic basis
• The Committee recommends the remuneration based on the prevailing market rates and perquisites applicable to the Key Management personnel of the Company and makes appropriate recommendations to the Board of Directors for Approval.
• The Committee also carries out periodic reviews to ensure that the remunerations are in line with market conditions.
The Remuneration Policy is to attract and retain best professional managerial talent within the Renuka Group and also to motivate and encourage them to perform at the highest possible level. The Group has a structure and professional methodology in evaluate the performance of employees. The policy ensure equally and fairness between the various employees is maintained.
Sgd.
M.S. Dominic
Chairman
15th August 2017
REMUNERATION COMMITTEE REPORT

RENUKA HOLDINGSANNUAL REPORT 2017 23
NOMINATION COMMITTEE REPORT
The Nomination Committee of Renuka Holdings PLC as at 31st March 2017 was consist of three Non-Executive Directors out of which two Directors are Independent as follows.
Members of the Nomination Committee
Mr. L. M. Abeywickrema - (Non - Executive) Chairman
Mr. M.S. Dominic - (Independent Non - Executive)
Mr. T K Bandaranayake - (Independent Non - Executive)
The directives of the Committee are, • To identify suitable persons who could be considered
to become Board member as a Non-Executive Director
• To recommend to the Board the process of selection of Chairman and Deputy Chairman
• Make necessary recommendation to the Board as when needed by the Board
The Scope of the Committee are,
• To define and establish the nomination process for Non-Executive Directors,
• Lead the process of Board appointments and make recommendations to the Board.
• The committee scope out the tasks such as assess skills required to be on the Board
• Periodic review of the extent of skills required which are represent on the Board
• Review description of role and capabilities required for a particular Board appointment and Identify and recommend suitable candidate to the Board.
During the period under review, the Committee had met once, with all members in attendance. The attendances of the meetings are given below.
Name of Directors Eligible to Attend
Attended
Mr.L.M. Abeywickrema 1 1/1
Mr. M.S. Dominic 1 1/1
Mr. T K Bandaranayak 1 1/1
Company Secretary acts as the Secretary to the Committee.
Sgd.
L. M. Abeywickrema
Chairman
Nomination Committee
15th August 2017.

RENUKA HOLDINGSANNUAL REPORT 201724
RISK MANAGEMENT
Risk Management is an integral part of our business, since management of risks against returns is a critical trade off decision business have to make every day when it comes to investment and operational decision making.
We reviewed and refined our investment and business processes balancing rigor and consistency with responsiveness and flexibility. The aim was to lay a sound foundation to integrate our risk management activities as part and parcel of our business operations.
Our Approach to Risk Management
Our definition for risk is the potential occurance of an external or internal event that may negatively impact our ability to achieve the Groups’ business objectives.
The process of embedding risk management system within our groups systems and procedure can be outline as below:
1. Identify Controls that are already operating2. Monitor those controls to ensure their effectiveness3. Improve and refine as per the requirement4. Document evidence of monitoring and control
operation
Group’s risk management framework takes into account the range of risks to be managed, and summery in to below categories.
1. Strategic Risk - A possible source of loss that might arise from an unsuccessful strategic decision taken by the organization. These content strategies related to growth and strategic positioning which ultimately affect the overall mission of the group.
2. Operational Risk - is the potential loss that might arise in business operation resulting from inadequate or failed internal processes, people and system or external events which ultimately affect the day to day activities of the Group.
3. Financial Risk- The likelihood of loss inherent in financing procedures which may weaken the ability to deliver adequate return to the Group. This may include liquidity risk, currency risk, and interest rate risk.
The systems and process are in place to deal with these risks, and the chain of responsibility within the organization to monitor the effectiveness of our mitigation measures.
Enterprise Risk Management Process
Risk Identification, Prioritization and Assessment
As the initial step of the risk framework it is important to identify risks for efficient management. Renuka Holdingidentifies all the risks by key stakeholders. We consider risk identification to be a key component of a robust Risk management framework. In the absence of a proper risk identification process, the organization is incapable of effectively managing its key risks.
We evaluate risks according to the likelihood of occurrence and magnitude of impact. This assessment provides a
prioritized risk list, identifying those risks that need the most urgent attention.
Low Medium High
High
Medium
LowPro
ba
bilit
y
Impact
Develop Risk management Strategy
The Risk management strategies address how Group intend to assess risk, respond to risk and making explicit and transparent the risk perceptions that organization routinely use in making both investment and operational decisions.
The above concept has been embedded with risk mapping in order to develop a robust framework to determine an appropriate risk management strategy as shown below.
Mitigate or Reduce the Risk
Avoid the Risk
Accept the RiskShare or Transfer
the Risk
Event Impact
Hig
h
High
Eve
nt P
rob
ab
ility
The Risk Management process in place ensures the clear allocation and segregation of responsibilities relating to risk identification, assessment, mitigation, monitoring, control and communication. We have in place several measures to strengthen our risk management process which are linked to our business processes. These include policies to mitigate business risks along with the upgrading of the support system that enable easy monitoring and management risks.
The main categories of risks that we take into account in the pursuit of our business goals are detailed below.

RENUKA HOLDINGSANNUAL REPORT 2017 25
RISK MANAGEMENT (CONTD)
Strategic Risk
Risk Impact Risk Management Strategies
Competitive Risk
Risks to the group’sreputation and Brandimage
Reduced market share and rates reducing revenue, cash flow and profitability.
Increased promotional Expenditure.
The positive correlation between cost of resources and competition.
Aim to have a broad appeal in price, range and format in a way that allows us to compete effectively in different markets.
Formed strategic relationships with a diverse pool of suppliers, enabling flexibility in pricing contracts and hedging mechanisms are used wherever possible to mitigate exposure to commodity price fluctuations.
The Group’s service excellence, committed and award winning staff, uniqueness of properties, innovative products and service developments and the strength of its brands enables the group to counter threats from new and existing players.
Maintaining a positive relationship with employees with a better remuneration and performance appraisal scheme.
Operational risk
Risk Impact Risk Management Strategies
Employee Risk
Risk from not being able to attract and retain skilled and experienced staff.
Reduced productivity.
Reduced quality of service resulting in reduced market share and Group’s image
Significant resources are invested in strengthening our human capital through the deployment of the latest Human Resource Information Systems, regular staff training & development, succession planning and fostering a performance-based culture.
Maintaining cordial relationships with labour unions and adopting interest based negotiations for win-win solutions.
Implemented well structured talent management process to Identify critical employees and retain them in the long run.
Periodic employee satisfaction surveys to ensure that remuneration is in line with the market.
Investments in strengthening employee brand image.
Issue Pertaining to Employees and industrial Relationship
Adverse impact on service levels, expected qualitystandards, operationalefficiency and groupreputation.
Loss of revenue.
Review all the issues with regard to employees and Industrial Regulations which affect the performance of the Group.
Steps taken to ensure employees are satisfied at all the levels and their issues are addressed in order to retain talented employees.
Maintain cordial relationship with Trade Unions and adopting interest-based negotiations for win-win solutions.
Well structured grievance handling system is in place to handle the grievance of employees at all levels and development of a Multi-skilled work force through structured and focused training programmes.
Ensure proper industrial relationships with all the government agencies.
IT systems and infrastructure
Inability to obtain timely and accurate information due to failures in IT systems.
Potential disruption to operations
Significant financial losses.
Implementation of effective IT infrastructure and to ensure consistency of delivery,
All relevant staffs are effectively engaged to mitigate IT related risks through effective policy and procedures as well as increased awareness.
Implementation of a comprehensive IT policy within the Group, supported by adequate systems and controls, ensure the safety and security of data. Contingency plans are in place to mitigate any short term loss on IT services.
All employees are bound by the code of conduct to safeguard the Group’s information, irrespective of its physical form.
A dedicated central IT team is in place to support all IT related aspects of the group.
Product Risk Product risk implies any effect of perceived impact of our product on stakeholders in general which could bring down our market share.
In order to eliminate loss of market share or market leadership, we monitor market leadership and customer needs.
Develop innovation that add value to our customers.
Enhance productivity and efficiency to improve price competitiveness andinvesting in high quality machinery and equipment.
Employ established operating procedures to review and approve all raw material prior to use to ensure that quality control is maintained.

RENUKA HOLDINGSANNUAL REPORT 201726
RISK MANAGEMENT (CONTD)
Operational risk
Risk Impact Risk Management Strategies
Take into account safety, health and environmental hazards to cover all avenues of possible negative publicity.
Research and development team is equipped to field any technical questions about our product,
Marketing and distribution procedures ensure complete control of the supply chain.
Supply Chain and Operational Risk
Operational disruption can occur due to inadequate quantity or quality of raw material supplies, longer lead time, supply disruption caused by global Supply and Demand.
Unable to maintain strong bond with critical suppliers over the period.
Operational risks cover the areas of system failure, continuity of decision making, dealing with contingencies and ensuring there are know deficiency in operations, application of recommended management practices.
Consistent engagement with a diverse pool of suppliers to maintain strong relationships
Structured processes are in place to add value to our supplier base through livelihood development programmes.
Technical support and guidance on enhancing quality.
Manage operational risks by identifying areas of risk, formulating plans for their management, promoting best practices.
Implement internal controls and systems and monitoring compliance.
Legal Regulatory Compliance
Risk of legal action due to non performance of legal and statutory requirements
Result high cost of legal and penalty fees that reduced profitability
Adversely impact to the Groups’ reputation and brand image.
The legal support services to Renuka Holdings PLC management come through the legal department which ensure all legal and regulatory provisions are complied with .
The legal function proactively identified and sets up appropriate system and processes for legal regulatory compliance in any foreign country that we operate in, and in such instances through legal council retained in those environments.
Internal audit function of the Group ensures the safeguarding of company assets and recommends process improvements in areas where process control failure are noted.
The operations of the Renuka Holding PLC come within the rules and regulations applicable to companies listed on the CSE and regulations applicable to securities trading set by the Securities and Exchange Commission of Sri Lanka. Our systems and processes are structured to satisfy the criteria set by these regulations and staffs are constantly kept aware of the compliance needs imposed by these regulation.
Break down of Internal Controls
Wastage of management time and resources.
Possible loss of data.
Increased possibility of fraud and misuse.
Disruptions to the normal course of operations.
lack of ability to trackperformance againstbudgets, forecasts andschedules.
Illegal transactions including theft or misappropriation ofassets by employees
Regular reviews of the effectiveness of internal controls by the corporate internal audit department supplemented by regular management audits carried out by internal teams within the Group ensures the robustness of internal controls. The Company uses comprehensive general and specific reporting and monitoring systems to identify, assess and manage risks.
Making each employee accountable for ethical behavior, high standards for business conduct and adherence to laws ensures that transactions occur in a reliable way.
Staff rotation and Special verification audits across the Group.
Internal auditors are also engaged to carry out special reviews wherever necessary.
The Company uses comprehensive general and specific reporting and monitoring systems to identify, assess and manage risks.
Ensuring that only trained, trustworthy, knowledgeable and competent personnel perform tasks, prevents errors, irregularities and fraud.
Financial Risk
Financial risk management obligations and policies have been described in the note No 52 of the notes to the Financial Statement.

RENUKA HOLDINGSANNUAL REPORT 2017 27
SUSTAINABILITY REPORT
We emphasise the importance of our stakeholders when developing our strategies through the competitiveness in order to achieve a common value.
Overview
Sustainability is the key element of our strategy for future growth where the utilization of resources efficiently,environmentally responsible manufacturing of product and provision of services that deliver sustainability benefits which can leverage commercial advantage for the group.
The key business drives for sustainability are internal operations and stakeholder engagement. The first focuses on our internal operations and manufacturing our products and provision of our services more efficiently using fewerresources. This approach helps us to reduce costs of goods manufactured and provision of services and at the same time reduces our impact on the environment. The second approach focuses on our partnerships with our stakeholders. Stakeholders are any individual or party that has an interest in our group, and who are affected by or can affect out organizational activities. Partnerships help to builds trust amount out key stakeholders and to reach better understanding on a variety of issues. It can also pave the way for more successful solutions to problems, concerns and challenges.
Reuka impact on economic performance
In Economic Performance, Group focused on operational excellence across all its business divisions and subsidiaries and value addition to economic development. Operational excellence measured in terms of efficiencyand effectiveness of manufacturing process, process improvement and reduces waste. Further investment in IT/ERP helps measurement of operational results on time with increase accuracy. Group has made substantial investment during the year to improve value addition to economic development. These investments have helped to improve resources utilization as well as minimization of waste and pollution.
Renuka Sustainability Policy and guidelines
Identify the stakeholders and rate them in line with the degree of influence and importance. Such stakeholders thus identified are,
• Investors• Employees• Customers• Key suppliers and business partners• The society• Environment
Renuka has then formulated sustainability strategies to create value for those identified stakeholders. We have created formal and informal channels to develop effective communication systems and engagements programs to involve our stakeholders and implement continuous monitoring systems through the management team in order to gauge our impact on the stakeholders.
ENVIRONMENTAL IMPACT
Renuka has strived to ensure that all our manufacturing and production processes will not knowingly harm people and will minimize the negative impact our businesses will have on human life as well as environment. In fact, we promote organic products to our customers due to health and other environmental benefits. This has created awareness among the farmer community of the long term benefits of sustainable farming.
Our Stakeholder Engagement Process
Investors support Renuka business activities
Shareholder engagement is important to us to have access to growth capital and in the process we must make a sound return to them. In meeting global challenges and evolving consumer needs we must be geared to be proactive with new ideas and ready with the output as well. When we operate according to these principles the shareholders should realize a fair return.
Method of engagement• We have open doors policy which enables
shareholders to keep in contact, visit and obtain information from the Company Secretaries and engage in dialogue.
• Further e-mail address provided for comments and suggestions.
• Update with latest financials for shareholders/investor to take rational decisions which is very important.
• We produce company performance in timely and relevant manner through quarterly Financial reports and Annual Report published in the Colombo Stock Exchange web site.
• We hold Annual General meetings, Extra Ordinary meetings to hear shareholders voice.
Our Concern
Our concern is to increase the return on investment, sustainable profitability, good governance and transparency in carrying out group operations.
Employees at Renuka work place
At Renuka we have created a work place policy and created employee awareness for the total group. With an employee base of over 1,720, creation of Group identity and belongings is priority. We care for our employees and health and safety is priority, keeping much attention at work place including factories and workplaces.
Method of engagement• We have an open communication policy and
have implemented a process to identify and report corruption within the business units.
• We have adopted effective two way communication system with employees and management through human resources division which has created short and long term benefits to the group.

RENUKA HOLDINGSANNUAL REPORT 201728
• We also have adopted other communication methods like e-mails, presentations and team briefings on daily operations for betterment of the organization. Employees are also encouraged to access the corporate websites.
• We organize team building activities such as get-togethers, sports meets and CSR projects.
• Factories of the group companies are equipped with adequate safety measures and educated the employees to minimise accidents.
Our Concern
Our concern is to create a friendly environment to our employees who are motivated and talent developed to offer effective service.
Customers
World class quality products and customer satisfaction is our key with our customers. The group uses its competencies and decades of experiences to identify the needs and wants of our customers in order to provide quality product and services creating value-for-money.
Method of engagement• We engage our customers through regular meetings,
visits and web portal.• On going participation for Industry exhibitions and
trade fairs locally and internationally. • We allow buyer inspections and audits to ensure
compliance with global quality standards
Our Concern
We concern about the quality of our products manufactured in compliance with global standards and creation of innovative products to cater customer needs.
Suppliers and business partners supports Renuka business processes
We have built lasting business relationships all over the world and not only centered in Sri Lanka. It is through our business partners that we co-exist to full fill customer needs and wants.
Method of engagement• We look at our business partners as a resource base to
develop business efficiency and innovative products.• Develop long term purchase contracts with our
business partners & suppliers to support responsible supply chain
• Participate for industry exhibitions and trade fairs
Our Concern
We maintain effective long term relationship with our business partners and suppliers who benefit from our growth, and share knowledge.
Our society around Renuka
Renuka has been actively involved in supporting the rural farmer network for our coconut division as well as the dairy division. Renuka procures over Rs. 2.5Bn worth of produce from our farmer network.
Method of engagement• We conducts farmer training programs, medical
camps, veterinary services which assist in improving the livelihood and wellness of the communities within Sri Lanka.
• Local engagement through purchasing.
Our Concern
We take measure to carryout our operations minimising carbon foot print and saving energy by effective utilization of limited resources while reducing wastage so as have minimal negative impact on society to have safe environment.
Renuka considers engagement to be an increasingly important component of its corporate citizenship strategy. Our engagement efforts help Renuka identify those issues that are most material to our business operations and shape our approach to addressing a range of areas relating to the financial, Social and environmental performance of the organization.
SUSTAINABILITY REPORT (CONTD)

RENUKA HOLDINGSANNUAL REPORT 2017 29
REPORT OF THE DIRECTORS
1.Overview
The directors of Renuka Holdings PLC pleased to present their report on the affairs of the company together with Audited Financial Statements for the year ended 31st March 2017. The details set out herein provide the pertinent information required under section 168 of Companies Act No. 07 of 2007, Colombo Stock Exchange Listing Rules and the recommended best practices on Corporate Governance.
Renuka Holdings PLC is a public limited liability company incorporated in Sri Lanka under the Companies Act No. 17 of 1982, quoted on the Colombo stock Exchange and re-registered as required under the provisions of the Companies Act No. 7 of 2007.
2. Review of Business
2.1. Principal Business Activities
Renuka Holdings PLC is a holding company that owns, directly and indirectly, investments in the numerouse companies constituting the Renuka holding Group. The group consist of a portfolio of diverse busines operations. The main subsidiaries and their principle activities of Renuka Holdigs PLC are listed on page 87.
2.2. Review of operations of the company and the group
The company’s businesses and the performance during the year, with comments on financial results, as well as future business developments are presented in the Chairman’s message.
2.3 Financial Statements of the Company and the Group
The Financial Statements of the Company and the Group are given on pages 35 to 94 of this Annual Report.
2.4 Directors’ Responsibility for Financial Statements
The statement of Directors’ responsibilities for the Financial Statements is given on page 33 to this Annual Report.
2.5 Auditor’s Report
The Auditor’s Report on the Financial Statements of the Company and the Group is given on page 34.
2.6 Accounting Policies and Changes During the Year
The Financial Statements have been prepared in accordance with the Sri Lanka Accounting and Auditing Standards Act No. 15 of 1995 which requires compliance with Sri Lanka Accounting Standards. The detailed accounting policies adopted in the preparation of the Financial Statements are given on pages 42 to 54. Changes in accounting policies if any that are made during the accounting period are described under pages 42 to 54 of the Accounting Policies.
2.7 Performance of the year
The group turnover for the year ended 31st March 2017 was Rs. 8,427 Mn , compared to Rs. 7,804 Mn during the previous year. A detailed analysis of the group turnover is given in
Note No. 29 of the Financial Statements. Further Net profit of the group was Rs. 1,052 Mn Compared with the net profit of Rs. 905 Mn for the previous year.
2.8 Group Investments
The company has invested in quoted shares of wider portfolio during the year amounted to Rs. 39.7 Mn Detailed portfolio of the investments held by the company is given in Note No. 14 to the Financial Statements.
2.9 Property, Plant & Equipment
Group has incurred Capital Expenditure during the year on Property, Plant & Equipment (including capital work-in-progress), Biological assets, Investment Properties, Intangible assets amounting to Rs. 343 Mn (2016 - Rs. 420 Mn).
Detailed information relating to capital expenditure on Property, Plant & Equipment (including capital work-in-progress), Biological assets, Investment Properties, Intangible assets are given in Note No. 08 to 12 to the Financial Statements.
Extent, locations, number of buildings and valuations of the properties of the Group are given under Real Estate Portfolio on Pages 95 to 96 and the market values of the Land & Buildings owned by the company and Group are included on the basis of valuation carries out by a professionally qualified valuer is given in Note No. 8.1 to the Financial Statement.
2.10 Stated capital
The company did not issue any shares during the year ended 31st March 2017. The Stated capital of the company as at 31st March 2017 was Rs. 1,199 Mn comprising 101,891,456 ordinary shares.
2.11 Reserves
The Group reserves as at 31st March 2017 amount to Rs 4.2 Bn (2016 - 3.5Bn) representing revaluation reserves and Retained Earning and the detailed movement of the revenue shown in the Statement of Changes in Equity in the Financial Statements.
3. Major Shareholdings
Details of the twenty largest shareholders with the percentage of their respective shareholdings as at 31st March 2017 are given on page 100 together with comparative shareholdings.
3.1 Public Holding
There were 2,266 (2016 - 2,439) registered voting shareholders as at 31st March 2017 with the percentage of shares held by the public, as per the Colombo Stock Exchange rules, being 36.12 % (2016 - 42.14 %).
3.2 Shareholdings/ Share information
Information relating to earnings, dividends, net assets, market value per share, share trading and distribution of shareholding is given on pages 98 to 100 to this Annual Report.

RENUKA HOLDINGSANNUAL REPORT 201730
REPORT OF THE DIRECTORS (CONTD.)
3.3 Ratio and market price information
The ratios relating to equity as required by the listing requirement by the Colombo Stock Exchange are given on pages 98 to 100 this Annual Report.
3.4 Equitable treatment to all shareholders
The company has made every endeavor to ensure the equitable treatment to all shareholders and adopted adequate measures to prevent information asymmetry.
3.5 Information to Shareholders
The Board strives to be transparent and provide accurate information to shareholders in all public material. The quarterly financial information during the year has been sent to the Colombo Stock Exchange in a timely manner.
4. Directors
The names of the directors who held office during thefinancial year are given below. The brief profile of the Board of directors appear on page 11 to this Annual Report.
Name of Directors Executive Non-Executive
Independent
Dr. S R Rajiyah XMrs. I R Rajiyah XMr. S V Rajiyah XMs. A L Rajiyah XMr. C J De S
AmaratungeX X
Mr. L M Abeywickrema XMr. T K Bandaranayake X XMr. J M Swaminathan X XMr. M s Dominic X X
The basis on which Directors are classified as Independent and Non-Executive directors is discussed in the Corporate Governance Report.
4.1 Recommendation for re-election1. 1To re-elect Mr.M.S.Dominic as a Director who retires
by rotation in terms of Article 28 (1). 2. To re-appoint Mr. C.J. De S. Amaratunge who is 77
years of age, as a director in terms of Section 211 of the Companies Act No. 7 of 2007 and it is specifically declared that the age limit of 70 years referred to in section 210 of the Companies Act No. 7 of 2007 shall not apply to the said Mr. C.J. De S. Amaratunge.
3. To re-appoint Mr. T.K. Bandaranayake who is 74 years of age, as a director in terms of Section 211 of the Companies Act No. 7 of 2007 and it is specifically declared that the age limit of 70 years referred to in Section 210 of the Companies Act No. 7 of 2007 shall not apply to the said Mr. T.K. Bandaranayake.
4. To re-appoint Mr. J.M. Swaminathan who is 76 years of age, as a director in terms of Section 211 of the Companies Act No. 7 of 2007 and it is specifically declared that the age limit of 70 years referred to in Section 210 of the Companies Act No. 7 of 2007 shall not apply to the said Mr. J.M. Swaminathan.
4.2 Entries in the Interest Register
The company, in compliance with the Companies Act No. 7 of 2007, maintains the Interest Register. The directors have made the declarations required by the said Act. and they have been entered in to the Interest Register.
4.3 Directors’ Interest in transactions
The company carried out transactions in the ordinary cause of business with the entries which a Director of the company is a Director. The transactions with the entries where a Director of the company either has control or exercises significant influence have been classified as related party transaction and disclosed in Note No. 46 to Financial Statements. The Directors have no direct or indirect interest in any other contract or proposed contract with the Company.
4.4 Directors’ Interest in Shares
Directors of the company and its subsidiaries who have relevant interest in shares of their respective companies have disclosed their shareholdings and any acquisitions/ disposals to their Boards, in compliance with section 200 of the Companies Act.
Directors holdings, in ordinary shares of the Company are given on below table.
AS AT 31ST March 2017 2016Name of Directors Voting Non-
votingVoting Non-
votingMrs. I. R. Rajiyah - - - - Dr. S.R. Rajiyah - - - - Dr. & Mrs. Rajiyah (Jt) 8,898,204 171,422 4,542,058 171,422 Mr. S. V. Rajaiyah 306,392 435,414 306,392 435,414 Mr. S. V. Rajaiyah & Mrs. J. J. B. Aloysius Rajiyah (Jt)
1,000,000 - - -
Ms. A. L. Rajiyah 330,783 42,850 330,783 42,850 Mr. C J De Silva Amaratunge
23,282 - 23,282 -
Mr. L. M. Abeywickrama
- - - -
Mr. T. K. Bandaranayake
- - - -
Mr. M. S. Dominic - - - - Mr. J. M. Swaminathan - - - -
10,558,661 649,686 5,202,515 649,686
Share dealings by Directors during the year were disclosed to Colombo Stock Exchange.
4.5 Remuneration of Directors
The remuneration of Directors in respect of the Company for the year ended 31st March 2017 is given in Note No. 34 to Financial Statements.
4.6 Directors Meetings
Details of the Board Meetings are presented on page 14 and details of the sub committee are presented with related committee report (Audit committee report on page 19, Remuneration Committee on page 22, Related Party Transactions Review Committee on page 21 and Nomination Committee on page 23.)

RENUKA HOLDINGSANNUAL REPORT 2017 31
4.7 Directors Responsibility for Financial Reporting
The Directors are responsible for the preparation of Financial Statements of the Company to reflect a true & fair view of the status of its affairs. The Directors are of the view that these Financial Statements have been prepared in conformity with the requirements of the Sri Lanka Accounting Standards (SLFRS/LKAS) issued by the Institute of Chartered Accountants of Sri Lanka, Companies Act No. 7 of 2007, Sri Lanka Accounting and Auditing Standards Act no.15 of 1995 and the Listing Rules of Colombo Stock Exchange.
4.8 Board Committees
The board has established committees for better monitoring and guidance of different aspects of operations and controls of the Company.
4.9 Audit Committee
The composition of Board Audit Committee comprising of Non-Executive Directors is provided on page 19 to this Annual Report. Detailed scope of the Audit Committee and their work during the year disclosed in Audit Committee Report given on pages 19 to 20 this Annual Report.
4.10 Remuneration Committee
The composition of board Remuneration Committee and report is given on page 22 to this Annual Report.
4.11 Nomination Committee
The composition of Nomination Committee and their report is given on page 23 to this Annual Report.
4.12 Related Party Transactions Review Committee
The composition of Related Party Transactions Review Committee and their report is given on page 21 to this Annual Report.
5. Corporate Donations
Donations made by the Company amounted to Rs. 119,339. (2016 - Rs. 67,000.)
6. Future Developments
Details of the future development of the Company are stated in the Chairman’s Report on page 12 this Annual Report.
7. Dividends
The Board of Directors has recommended payment of Rs 0.35 per share payable for 2016/17 (2015/16 Rs 0.35 per share)
The Directors are confident that the Company would meet the solvency test requirement under section 56 (2) of Companies Act No. 7 of 2007 immediately after the proposed final dividends distribution.
8. Solvency Test
Solvency test has been carried out by the Board of Directors before the payment of the Final dividend as required by the Companies Act No 7 of 2007.
A solvency certificate has been received in respect of the first and final dividend of Rs. 0.35 per share (2016 - Rs. 0.35) proposed to be paid to the holders of the Company as at the close of the business on 16TH September 2017.
9. Related Party Transactions
The Board of Directors has given the following statement in respect of the related party transactions. The related party transactions of the Company during the financial year have been reviewed by the Related Party Transactions Review Committee and are in compliance with the Section 09 of the CSE Listing Rules.
10. Statutory Payment
The directors, to the best of their knowledge and belief are satisfied that all statutory payments are due to the Government, other regulatory institutions and those related to employees (if any) have been made on time.
Declaration relating to statutory payments is made in the statement of Directors’ Responsibilities on the page 33 to this Annual Report.
11. Events Occurred After the Reporting Date
There are no events of material and significance nature that requires adjustment to the Financial Statements, occurred subsequent to the date of the reporting date , other than those disclosed in Note No. 40 to the Financial Statements.
12. Going Concern
The Directors, after considering the financial position, operating conditions, regulatory and other factors including matters addressed in the Corporate Governance Code, have a reasonable expectation that the Company has adequate resources to continue in operational existence for the foreseeable future. Therefore the going concern basis has been adopted in the preparation of the Financial Statements.
13. Exposure to risk
The Company has a structured risk management process in place to support its operations. The Renuka Holdings PLC Board Audit Committee play a major role in this process. The Risk Management Report elaborates these processes and the Company’s risk factors.
14. Capital Commitments
No significant capital commitments exist as at 31st March
REPORT OF THE DIRECTORS (CONTD.)
RENUKA HOLDINGSANNUAL REPORT 201732
2017 other than those disclosed in Note no. 42 to the Financial Statements.
15. Compliance with Laws and Regulations
The Company has taken all reasonable measures to comply with all applicable laws and regulations. A compliance checklist is signed-off on a quarterly basis by responsible officers and any violations are reported to the Board AuditCommittee. Detailed report of the Audit Committee is given on Pages 19 to 20 to this Annual Report.
16. Code of Conduct
The Company demands impeccable standards of conduct from its Directors and employees in the performance of their official duties and in situations that could affect theCompany’s image.
17. Internal Controls
The Directors acknowledge their responsibility for the Company’s system of internal control. The system is designed to give assurance, inter alia, regarding the safeguarding of assets, the maintenance of proper accounting records and the reliability of financial information generated.
However, any system can only ensure reasonable and not absolute assurance that errors and irregularities are either prevented or detected within a reasonable time period. The Board, having reviewed the system of internal controls, is satisfied with the Group’s adherence to and effectiveness of these controls for the year up to the date of signing the Financial Statements.
18. Corporate Governance
The Company has complied with the Corporate Governance rules laid down under the Listing Rules of the Colombo Stock Exchange. The Corporate Governance Report on pages 13 to 18 details this further.
19. Compliance with Transfer Pricing Regulations
All transactions are entered in to with associated persons during the period are on an arm’s length basis, and are comparable with transactions carried out with non-associated parties.
20. Employees and Industrial Relations
The Renuka Group has a structure to assess the competencies and commitments of its employees. There are no employees attached to Renuka Holdings PLC as such no material issues pertaining to employees and industrial relations of the entity.
21. Appointment of Auditors
Messrs Kreston M N S & Co., Chartered Accountants, who are the company auditors during the year, are deemed reappointed, in terms of Section 158 of the Companies Act No.7 of 2007, as Auditors of the Company. The retired auditors have expressed their willingness to continue in
office. A resolution to re-appoint them as Auditors of thecompany and authorizing directors to fix their remuneration will be proposed at the forthcoming Annual General Meeting.
22. Auditors’ Remuneration and Interest in contracts
The fee amount paid/payable for the services provided to the company during the year with corresponding figures for the previous year is presented in Note No. 34.
23. Annual Report
The Board of Directors approved the Consolidated Financial Statements along with company Financial statements on 15th August 2017. The appropriate number of copies of this report will be submitted to Colombo Stock Exchange and to the Sri Lanka Accounting and Auditing Standards Monitoring Board on or before 31st August 2017.
24. Annual General Meeting
The Annual General Meeting will be held at the Sri Lanka Foundation Institute, No. 100, Independent Square, Colombo 7on 15th September 2017 at 4.00 p.m.
The Notice of the Annual General Meeting appears on page 101.
For and on behalf of the Board
Sgd.
Dr. S.R.Rajiyah
Sgd.
T. K. Bandaranayake
Sgd.
Renuka Enterprises (Pvt.) Ltd.
Secretaries
15th August 2017
REPORT OF THE DIRECTORS (CONTD.)
RENUKA HOLDINGSANNUAL REPORT 2017 33
STATEMENT OF DIRECTORS RESPONSIBILITY
The Directors are responsible to prepare financial statements for each financial year giving a true and fair view of the state of affairs of the Company and the Group as at the end of the financial year and of the profit & loss of the Company and the Group for the financial year as required under sections 150 (1), 151, 152 (1),) & 153 of the Companies Act No. 7 of 2007.
The responsibility of the Directors in relation to the Financial Statements for the year ended 31st March 2017 which have been prepared and presented in accordance with the requirements of the Sri Lanka Accounting Standards, the Listing Rules of the Colombo Stock Exchange and the Companies Act No.7 of 2007 is set out in the following statement.
As per the provisions of the Companies Act No. 7 of 2007, the Directors are required to prepare Financial Statements, for each financial year and presented before a General Meeting which comprise
a. A statement of Income and Statement of Comprehensive Income of the Company and its subsidiaries which present a true and fair view of the profit or loss of the Company for the financial year
b. A Statement of Financial Position, which presents a true and fair view of the state of affairs of the Company and its subsidiaries as at the end of the financial year together with explanatory notes to the financial statements
c. A statement of changes in Equity which presents a true and fair view of the changes in the Company’s and its Subsidiaries’ retained earnings for the financial year
d. A Cash Flow Statement which presents a true and fair view of the flow of cash in and out of the Company and its subsidiaries for the financial year; and notes to the Financial Statements and which comply with the requirements of the Act.
The Directors are of the view that, in preparing these Financial Statements:
a. The appropriate accounting policies have been selected and applied in a consistent manner, material deviations if any have been disclosed and explained;
b. All applicable Accounting Standards, in accordance with the Sri Lanka Accounting Standards (SLFRS/LKAS) as relevant have been applied
c. reasonable and prudent judgments have been made so that the form and substance of transactions properly reflected
d. It provide the information required by and otherwise complies with the Companies Act No. 7 of 2007, Listing Rules of Colombo Stock Exchange and
requirement of any other regulatory authority as applicable to the company.
Further the Directors have a responsibility to ensure that the Company maintains sufficient accounting recordsto disclose, with reasonable accuracy of the financial position of the Company and of the Group, also to reflect the transparency of transactions and to ensure that the Financial Statements presented comply with the requirements of the Companies Act.
The External Auditors, M/s Kreston MNS & Co who were deemed reappointed in terms of the Companies Act No. 07 of 2007 were provided with every opportunity to undertake the inspections they considered appropriate to enable them to form their opinion the Financial Statements. The Report of the Auditors, shown on page 34 set out their responsibilities in relation to the Financial Statements.
The Directors are also of the view that the Company and its subsidiaries have adequate resources to continue in operations and have applied the going concern basis in preparing these Financial Statements.
The Directors are also responsible for taking reasonable steps to safeguard the Assets of the Company and that of the Group and in this regard to give proper consideration to the establishment of appropriate internal control systems with a view to preventing and detecting fraud and other irregularities.
As required by Companies Act, the Board of Directors has authorized distribution of the dividend now proposed, being satisfied based on information available to it that the Company would satisfy the solvency test after such distribution in accordance with the Section 57 of the Companies Act, and have sought in respect of the dividend now proposed, a certificate of solvency from the Auditors.
COMPLIANCE REPORT
The Directors confirm that to the best of their knowledge, all taxes, duties and levies payable by the company, all contributions, levies and taxes payable on behalf of and in respect of the employees of the company and its group and all other known statutory dues as were due and payable by the company and its group companies as at the reporting date have been paid or where relevant provided for.
By order of the Board Renuka Enterprises (Pvt.) Ltd
Sgd. Company Secretaries
15th August 2017

RENUKA HOLDINGSANNUAL REPORT 201734
TO THE SHAREHOLDERS OF RENUKA HOLDINGS PLC
Report on the Financial Statements
We have audited the accompanying Financial Statements of RENUKA HOLDINGS PLC, (“the Company”), and the Consolidated Financial Statements of the Company and its subsidiaries (“the Group”), which comprise the Statement of Financial Position as at 31st March 2017, and the Statement of Income, Statement of Comprehensive Income, Statement of Changes in Equity and Cash Flow Statement for the year then ended, and notes comprising a summary of significant accounting policies and other explanatory notes, exhibited on pages 35 to 94.
Board’s Responsibility for the Financial Statements
The Board of Directors (“the Board”) is responsible for the preparation of these Financial Statements that give a true and fair view in accordance with Sri Lanka Accounting Standards and for such internal control as Board determines is necessary to enable the preparation of Financial Statements that are free from material misstatement, whether due to fraud or error. Auditor’s Responsibility
Our responsibility is to express an opinion on these Financial Statements based on our audit. We conducted our audit in accordance with Sri Lanka Auditing Standards. Those standards require that we comply with ethical requirements and plan and perform the audit to obtain reasonable assurance about whether the Financial Statements are free from material misstatement.
An audit involves performing procedures to obtain audit evidence about the amounts and disclosures in the Financial Statements. The procedures selected depend on the auditors’ judgment, including the assessment of the risks of material misstatement of the Financial Statements, whether due to fraud or error. In making those risk assessments, the auditor considers internal control relevant to the entity’s preparation of the Financial Statements that give a true and fair view in order to design audit procedures that are appropriate in the circumstances, but not for the purpose of expressing an opinion on the effectiveness of the entity’s internal control. An audit also includes evaluating the appropriateness of accounting policies used and the reasonableness of accounting estimates made by Board, as well as evaluating the overall presentation of the Financial Statements.
We believe that the audit evidence we have obtained is sufficient and appropriate to provide a basis for our audit opinion.
Opinion
In our opinion, the Consolidated Financial Statements give a true and fair view of the financial position of the Group as at 31st March 2017, and of its financial performance and cash flows for the year then ended in accordance with Sri Lanka Accounting Standards.
Report on Other Legal and Regulatory Requirements As required by section 163 (2) of the Companies Act No. 07 of 2007, we state the following:
a. The basis of opinion and scope and limitations of the audit are as stated above.b. In our opinion:
• we have obtained all the information and explanations that were required for the audit and, as far as appears from our examination, proper accounting records have been kept by the Company.
• the Financial Statements of the Company give a true and fair view of its financial position as at 31st March 2017, and of its financial performance and cash flows for the year then ended in accordance with Sri Lanka Accounting Standards.
• the Financial Statements of the Company and the Group, comply with the requirements of Section 151 and 153 of the Companies Act No. 07 of 2007.
CHARTERED ACCOUNTANTSCOLOMBO15th August 2017
INDEPENDENT AUDITOR'S REPORT
CHARTERED ACCOUC NTANTS

RENUKA HOLDINGSANNUAL REPORT 2017 35
STATEMENT OF FINANCIAL POSITION
Group Company AS AT 31ST MARCH 2017 2016 2017 2016
Note Rs. Rs. Rs. Rs. AssetsNon-Current Assets
Property, Plant & Equipment 8 4,299,167,677 4,158,815,382 - -
Intangible Assets 9 228,187,528 140,090,864 - - Investment Property 10 1,703,800,000 1,277,850,000 - - Right to Use land 11 277,568,003 283,893,535 - - Biological Assets 12 54,915,883 51,476,902 - - Investment in Subsidiaries 13(a) - - 1,636,641,578 1,585,825,010
Investment in Associates 13(b) - 4,633,954 - -
Investment in Joint Ventures 13(c) 44,398,110 51,054,611 59,491,500 59,491,500
Other Investments 13(d) 56,883,552 272,970,452 - -
Deferred Tax Asset 22 7,418,496 3,212,053 - -
6,672,339,249 6,243,997,753 1,696,133,078 1,645,316,510
Current AssetsShort Term Investments in Shares 14 39,704,885 2,477,388 - - Inventories 15 1,444,155,192 1,224,813,811 - - Trade and Other Receivables 16 1,179,818,076 767,752,220 - - Other Current Assets 17 63,820,408 97,738,480 - - Income Tax Refund Due 28 4,875,504 24,979,663 96,046 82,602 Amounts due from Related Company 18 - - 2,900,000 - Short Term Investments in Deposits 19 1,244,005,900 1,784,074,092 2,930,459 703,225 Cash at Bank and Cash in Hand 20 1,167,204,517 351,511,129 5,118,275 1,211,281
5,143,584,482 4,253,346,783 11,044,780 1,997,108 Total Assets 11,815,923,731 10,497,344,536 1,707,177,858 1,647,313,618
Equity And LiabilitiesCapital and ReservesStated Capital 21 1,198,897,063 1,198,897,063 1,198,897,063 1,198,897,063 Revaluation Reserve 289,009,000 288,292,965 - - Retained Earnings 3,886,622,927 3,186,444,636 455,712,060 445,245,458 Equity Attributable to Owners of the Company 5,374,528,990 4,673,634,664 1,654,609,123 1,644,142,521 Non Controlling Interest 3,063,934,255 3,003,226,556 - - Total Equity 8,438,463,245 7,676,861,220 1,654,609,123 1,644,142,521
Non-Current LiabilitiesDeferred Tax Liability 22 206,924,180 200,085,729 - - Interest Bearing Borrowings due after one year 23(a) 625,414,293 836,264,345 50,267,123 - Non current portion of Finance Lease obligation 23(e) 57,744,150 55,000,000 - -Retirement Benefit Obligation 24 96,411,702 73,750,328 - -
986,494,325 1,165,100,402 50,267,123 -
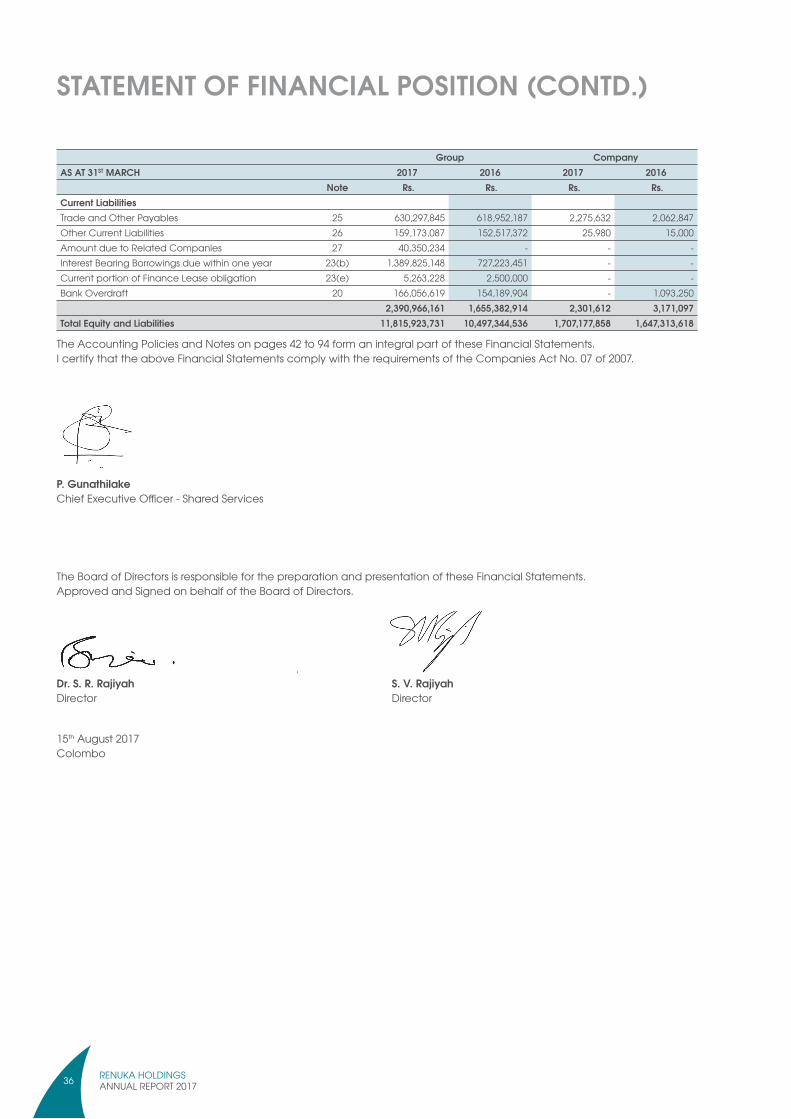
RENUKA HOLDINGSANNUAL REPORT 201736
Group Company AS AT 31ST MARCH 2017 2016 2017 2016
Note Rs. Rs. Rs. Rs. Current LiabilitiesTrade and Other Payables 25 630,297,845 618,952,187 2,275,632 2,062,847 Other Current Liabilities 26 159,173,087 152,517,372 25,980 15,000 Amount due to Related Companies 27 40,350,234 - - - Interest Bearing Borrowings due within one year 23(b) 1,389,825,148 727,223,451 - - Current portion of Finance Lease obligation 23(e) 5,263,228 2,500,000 - - Bank Overdraft 20 166,056,619 154,189,904 - 1,093,250
2,390,966,161 1,655,382,914 2,301,612 3,171,097 Total Equity and Liabilities 11,815,923,731 10,497,344,536 1,707,177,858 1,647,313,618
The Accounting Policies and Notes on pages 42 to 94 form an integral part of these Financial Statements. I certify that the above Financial Statements comply with the requirements of the Companies Act No. 07 of 2007.
P. Gunathilake Chief Executive Officer - Shared Services
The Board of Directors is responsible for the preparation and presentation of these Financial Statements. Approved and Signed on behalf of the Board of Directors.
. Dr. S. R. Rajiyah S. V. Rajiyah Director Director
15th August 2017Colombo
STATEMENT OF FINANCIAL POSITION (CONTD.)

RENUKA HOLDINGSANNUAL REPORT 2017 37
Group Company
FOR THE YEAR ENDED 31ST MARCH 2017 2016 2017 2016
Note Rs. Rs. Rs. Rs.
Revenue 29 8,426,563,053 7,803,859,430 53,533,085 61,495,700
Cost of Sales (6,291,093,978) (5,970,940,637) - -
Gross Profit 2,135,469,075 1,832,918,793 53,533,085 61,495,700
Other Operating Income 30 446,914,227 307,141,898 - -
Administrative Expenses (698,587,624) (526,384,424) (7,277,874) (7,246,592)
Distribution Expenses (751,060,272) (682,427,720) - -
Other Operating Expenses (10,285,346) (1,241,241) - -
Profit from Operations 1,122,450,060 930,007,306 46,255,211 54,249,108
Finance Income 31 170,706,321 113,480,243 184,059 40,695,122
Finance Cost 32 (163,761,440) (104,789,452) (276,960) (5,103)
Other Financial Items 33 (1,899,242) 37,013,623 - -
Share of Profit of Equity Accounted Investee 39(a) 28,515,137 24,995,877 - -
Loss on Disposals of Subsidiaries 38(b) (14,006,256) - - -
Profit before Taxation 34 1,142,004,580 1,000,707,597 46,162,310 94,939,127
Taxation 35 (90,014,309) (95,656,290) (33,499) (23,386)
Profit for the year 1,051,990,271 905,051,307 46,128,811 94,915,741
Attributable to :
Equity Holder of the Parent 669,600,284 430,518,375 46,128,811 94,915,741
Non Controlling Interest 382,389,987 474,532,932 - -
1,051,990,271 905,051,307 46,128,811 94,915,741
Earnings Per Share (Rs.) 36 6.57 4.23 0.45 0.93
Dividend per Share (Rs.) 37 0.35 0.35 0.35 0.35
The Accounting Policies and Notes on pages 42 to 94 form an integral part of these Financial Statements.
Figures in brackets indicate deductions
STATEMENT OF INCOME

RENUKA HOLDINGSANNUAL REPORT 201738
Group Company
FOR THE YEAR ENDED 31ST MARCH 2017 2016 2017 2016
Note Rs. Rs. Rs. Rs.
Profit for the year 1,051,990,271 905,051,307 46,128,811 94,915,741
Other Comprehensive Income / (Expenses) not to be reclassified to Profit or Loss in subsequent periods
Defined benefits plan actuarial Gains / (Loss) 24 1,418,840 (7,774,361) - -
Revaluation reserve on land & Buildings 716,035 71,850,080 - -
Tax on Other Comprehensive Income 22 (568,476) (3,036,702) - -
Other Comprehensive Income / (Expenses) to be reclassified to Profit or Loss in subsequent periods
- - - -
Other Comprehensive Income for the year 1,566,399 61,039,017 - -
Total Comprehensive Income for the year 1,053,556,670 966,090,324 46,128,811 94,915,741
Total Comprehensive Income Attributable to
Equity Holder of the Parent 671,299,031 473,193,406 46,128,811 94,915,741
Non Controlling Interest 382,257,639 492,896,918 - -
Total Comprehensive Income for the year 1,053,556,670 966,090,324 46,128,811 94,915,741
The Accounting Policies and Notes on pages 42 to 94 form an integral part of these Financial Statements.
Figures in brackets indicate deductions.
STATEMENT OF COMPREHENSIVE INCOME

RENUKA HOLDINGSANNUAL REPORT 2017 39
GROUP Stated Capital Revaluation Reserve
Retained Earnings
Non Controlling
Interest
Total
Rs. Rs. Rs. Rs. Rs.Balance as at 1st April 2015 1,198,897,063 244,371,473 3,047,001,115 2,769,400,455 7,259,670,106 Profit for the year - - 430,518,375 474,532,932 905,051,307 Other Comprehensive Income - 43,921,492 (1,246,461) 18,363,986 61,039,017 Total Comprehensive Income - 43,921,492 429,271,914 492,896,918 966,090,324
Share issues Expenses - - (992,671) (2,734,689) (3,727,360)Adjustments due to Acquisition of subsidiaries - - - (74,793) (74,793)Share Redemption - Non Controlling Interest - - - (125,000,000) (125,000,000)Adjustments due to changes in shareholdings of Subsidiaries
- - (253,173,713) 18,822,190 (234,351,523)
Dividend Paid - - (35,662,009) (150,083,526) (185,745,535)Balance as at 31st March 2016 1,198,897,063 288,292,965 3,186,444,636 3,003,226,556 7,676,861,220
Profit for the year - - 669,600,284 382,389,987 1,051,990,271 Other Comprehensive Income for the year - 716,035 982,712 (132,348) 1,566,399
Total Comprehensive Income - 716,035 670,582,996 382,257,639 1,053,556,670
Adjustments due to Acquisition of subsidiaries - Note 38 (a)
- - - 18,073,162 18,073,162
Adjustment due to Disposal of subsidiaries - Note 38 (b)
- - - (198,810,271) (198,810,271)
Adjustments due to changes in shareholdings of Subsidiaries
- - 65,257,504 (48,773,628) 16,483,876
Dividend Paid - - (35,662,209) (92,039,203) (127,701,412)Balance as at 31st March 2017 1,198,897,063 289,009,000 3,886,622,927 3,063,934,255 8,438,463,245
COMPANY Stated Capital
Retained Earnings
Total
Rs. Rs. Rs.Balance as at 1st April 2015 1,198,897,063 385,991,726 1,584,888,789 Profit for the year - 94,915,741 94,915,741 Other Comprehensive Income for the year - - -Total comprehensive income for the year - 94,915,741 94,915,741
Dividend Paid - (35,662,009) (35,662,009)Balance as at 31st March 2016 1,198,897,063 445,245,458 1,644,142,521
Profit for the year - 46,128,811 46,128,811 Other Comprehensive Income - - -Total Comprehensive Income - 46,128,811 46,128,811
Dividend Paid - (35,662,209) (35,662,209)Balance as at 31st March 2017 1,198,897,063 455,712,060 1,654,609,123
The Accounting Policies and Notes on pages 42 to 94 form an integral part of these Financial Statements.
STATEMENT OF CHANGES IN EQUITY

RENUKA HOLDINGSANNUAL REPORT 201740
CASH FLOW STATEMENT
FOR THE YEAR ENDED 31ST MARCH
Group Company
2017 2016 2017 2016
Rs. Rs. Rs. Rs.
CASH FLOW FROM OPERATING ACTIVITIES
Profit before Taxation 1,142,004,580 1,000,707,597 46,162,310 94,939,127
Adjustments :
Share of Profit of Equity Accounted Investee (28,515,137) (24,995,877) - -
Interest Income (170,706,321) (113,480,243) (184,059) (40,695,122)
Loss from Change in market Value of Current Investments 1,305,432 - - -
VAT Receivable written off 4,500,000 - - -
Income Tax refund due written off 4,445,696 - - -
Provision for Retiring Gratuity 25,117,313 18,580,225 - -
Depreciation 229,799,000 195,003,086 - -
Amortization of Intangible Assets 2,818,963 5,686,894 - -
Interest Expense 163,331,032 104,786,893 276,960 5,103
Lease Interest 430,408 2,559 - -
Goodwill on Acquisition of Subsidiaries - 26,690 - -
Amortisation of Leasehold Assets 6,325,532 6,332,426 - -
(Loss) on Disposal of Property Plant & Equipment (3,003,003) (10,406,149) - -
Change in fair value of Investment Property (425,950,000) (276,850,000) - -
Biological Assets written off - 85,585 - -
Fair value adjustment of biological assets (3,308,981) (5,719,655) - -
Written off Trade license 12,375,000 - - -
Loss of disposal of subsidiaries 14,006,256 - - -
Provision for impairment of Doubtful debtors 21,716,085 596,932 - -
Impairment on Property Plant & Equipment 10,274,825 - - -
Operating Profit before changes in Working Capital 1,006,966,680 900,356,963 46,255,211 54,249,108
(Increase) / Decrease in :
Inventories (63,138,387) (17,963,158) - -
Trade & Other Receivables (306,627,610) (21,220,366) - -
Other Current Assets 38,994,775 163,354,370 - -
Amounts due from Related Companies - - (2,900,000) 9,310,000
Short Term Financial Assets (41,466,247) 2,796,661 - -
Increase / (Decrease) in :
Trade & Other Payables (37,631,675) 24,401,305 212,785 637,447
Other Current Liabilities 6,677,217 (29,542,799) 10,980 (90,106)
Amount due to Related Companies 41,578,111 - - -
Cash Generated from Operations 645,352,864 1,022,182,977 43,578,976 64,106,449
Gratuity Paid (4,576,086) (5,949,338) - -
Tax on Deemed Interest Income (769,697) (9,616,363) - -
Income Tax / WHT / ESC Paid (53,662,832) (56,892,731) (46,943) (72,691)
Tax effect on Group Dividend (6,284,868) (4,857,617) - -
Interest Income 170,706,321 113,480,243 184,059 40,695,122
Interest Paid (163,331,032) (104,786,893) (9,837) (5,103)
Net Cash from Operating Activities 587,434,669 953,560,278 43,706,255 104,723,777
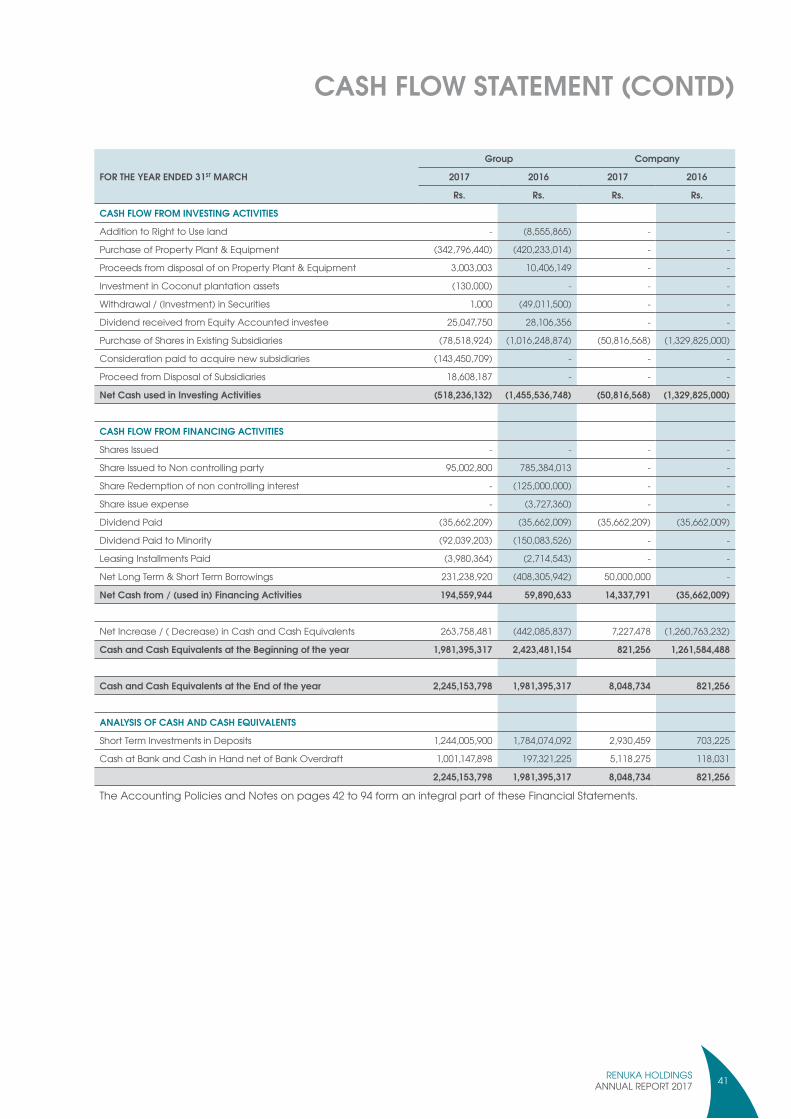
RENUKA HOLDINGSANNUAL REPORT 2017 41
CASH FLOW STATEMENT (CONTD)
FOR THE YEAR ENDED 31ST MARCH
Group Company
2017 2016 2017 2016
Rs. Rs. Rs. Rs.
CASH FLOW FROM INVESTING ACTIVITIES
Addition to Right to Use land - (8,555,865) - -
Purchase of Property Plant & Equipment (342,796,440) (420,233,014) - -
Proceeds from disposal of on Property Plant & Equipment 3,003,003 10,406,149 - -
Investment in Coconut plantation assets (130,000) - - -
Withdrawal / (Investment) in Securities 1,000 (49,011,500) - -
Dividend received from Equity Accounted investee 25,047,750 28,106,356 - -
Purchase of Shares in Existing Subsidiaries (78,518,924) (1,016,248,874) (50,816,568) (1,329,825,000)
Consideration paid to acquire new subsidiaries (143,450,709) - - -
Proceed from Disposal of Subsidiaries 18,608,187 - - -
Net Cash used in Investing Activities (518,236,132) (1,455,536,748) (50,816,568) (1,329,825,000)
CASH FLOW FROM FINANCING ACTIVITIES
Shares Issued - - - -
Share Issued to Non controlling party 95,002,800 785,384,013 - -
Share Redemption of non controlling interest - (125,000,000) - -
Share issue expense - (3,727,360) - -
Dividend Paid (35,662,209) (35,662,009) (35,662,209) (35,662,009)
Dividend Paid to Minority (92,039,203) (150,083,526) - -
Leasing Installments Paid (3,980,364) (2,714,543) - -
Net Long Term & Short Term Borrowings 231,238,920 (408,305,942) 50,000,000 -
Net Cash from / (used in) Financing Activities 194,559,944 59,890,633 14,337,791 (35,662,009)
Net Increase / ( Decrease) in Cash and Cash Equivalents 263,758,481 (442,085,837) 7,227,478 (1,260,763,232)
Cash and Cash Equivalents at the Beginning of the year 1,981,395,317 2,423,481,154 821,256 1,261,584,488
Cash and Cash Equivalents at the End of the year 2,245,153,798 1,981,395,317 8,048,734 821,256
ANALYSIS OF CASH AND CASH EQUIVALENTS
Short Term Investments in Deposits 1,244,005,900 1,784,074,092 2,930,459 703,225
Cash at Bank and Cash in Hand net of Bank Overdraft 1,001,147,898 197,321,225 5,118,275 118,031
2,245,153,798 1,981,395,317 8,048,734 821,256
The Accounting Policies and Notes on pages 42 to 94 form an integral part of these Financial Statements.
RENUKA HOLDINGSANNUAL REPORT 201742
CORPORATE INFORMATION
1.1. REPORTING ENTITY
Renuka Holdings PLC is a Public Quoted Limited Liability Company,incorporated in Sri Lanka on 08.02.1979 and re-registered under the Companies Act No. 07 of 2007 (PQ 227) (PVS 5524/PBS) and domiciled in Sri Lanka. The shares were listed in the Colombo Stock Exchange on 10th March 2008.
The registered office of the Company is located at No. 69,Sri Jinaratana Road, Colombo 02. The Financial Statements are authorized for issue by the Directors on 15th August 2017.
1.2. PRINCIPAL ACTIVITIES AND NATURE OF OPERATIONS
During the year, the principal activities of the Company, Subsidiaries and Joint venture entities are given in Note 50.
1.3. PARENT ENTERPRISE AND ULTIMATE PARENT ENTERPRISE
The Company’s parent undertaking and ultimate parent Enterprise Renuka Group Limited holds 51.19% of the shares of the Company.
2. STATEMENT OF COMPLIANCE
The Statement of Financial Position, Statement of Income and Statement of Comprehensive Income, Statement of Changes in Equity and Cash Flows Statement, together with Notes to the Financial Statements (“Financial Statements”) of the Group as at 31st March 2017 and for the year then ended, comply with the Sri Lanka Accounting Standards (SLFRSs / LKASs) as laid down by the Institute of Chartered Accountants of Sri Lanka and the requirements of the Companies Act No. 07 of 2007.
2.1. BASIS OF PREPARATION
These financial statements for the year ended 31st March 2017 are prepared in accordance with Sri Lanka Accounting Standards (SLFRS & LKAS) effective for the periods beginning on or after 01st January 2012.
The preparation and presentation of these Financial Statements is in compliance with the Companies Act No. 07 of 2007.
The consolidated financial statements are presented in Sri Lankan Rupees (Rs.)which is the group’s functional & presentation currency.
2.2. BASIS OF MEASUREMENT
The financial statements have been prepared on the historical cost basis except for the following material items in the statement of financial position:
• Biological assets are measured at fair value less costs to sell
• Investment property is measured at fair value• Liability for Defined Benefit Obligations is recognised
as the present value of the defined benefit obligation.• Land and Buildings are carried at fair value
2.3. BASIS OF CONSOLIDATION
The consolidated Financial Statements comprise the Financial Statements of the Group and its subsidiaries as at 31st March 2017.
Subsidiaries
Subsidiaries are those entities controlled by the group. Control over an investee is achieved when the Group is exposed, or has rights, to variable returns from its involvement with the investee and has the ability to affect those returns through its power over the investee. Specifically, the Group controls an investee if, and only if,the Group has:
• Power over the investee (i.e., existing rights that give it the current ability to direct the relevant activities of the investee)
• Exposure, or rights, to variable returns from its involvement with the investee
• The ability to use its power over the investee to affect its returns when the Group has less than a majority of the voting or similar rights of an investee; the group considers all relevant facts and circumstances in assessing whether it has power over an investee, including:
- The contractual arrangement with the other vote holders of the investee;
- Rights arising from other contractual arrangements; and
- The Group’s voting rights and potential voting rights.
The Group re-assesses whether or not it controls an investee, if facts and circumstances indicate that there are changes to one or more of the three elements of control. Consolidation of a subsidiary begins when the Group obtains control over the subsidiary and ceases when the Group loses control of the subsidiary. Assets, liabilities,income and expenses of a subsidiary acquired or disposed of during the year are included in the consolidated financial statements from the date the Group gains control until the date the Group ceases to control the subsidiary. Profit or loss and each component of other comprehensive income (OCI) are attributed to the equity holders of the parent of the Group and to the non-controlling interests, even if this results in the non-controlling interests having a deficit balance.
The Financial Statements of the subsidiaries are prepared for the same reporting period as the parent Company, using consistent accounting policies. All intra-group balances, transactions, unrealised gains and losses resulting from intra-group transactions and dividends are eliminated in full.
A change in the ownership interest of a subsidiary, without a loss of control, is accounted for as an equity transaction.
If the Group loses control over a subsidiary, it derecognises the related assets (including goodwill), liabilities, non-controlling interest and other components of equity while
NOTES TO FINANCIAL STATEMENTS

RENUKA HOLDINGSANNUAL REPORT 2017 43
2.3. BASIS OF CONSOLIDATION (CONTD.)
any resultant gain or loss is recognised in the income statement. Any investment retained is recognised at fair value. The total profits and losses for the year of the Company and of its subsidiaries included in consolidation are shown in the consolidated income statement and consolidated statement of comprehensive income and all assets and liabilities of the Company and of its subsidiaries included in consolidation are shown in the consolidated statement of financial position. Non-controlling interest which represents the portion of profit or loss and net assets not held by the Group, are shown as a component of profit for the year in the Consolidated income statement and statement of comprehensive income and as a component of equity in the Consolidated statement of financial position, separately from equity attributable to the shareholders of the parent .The Consolidated statement of cash flows includes the cash flows of the Company and its subsidiaries.
A list of subsidiaries within the Group together with contingent liabilities of subsidiaries is set out in Note 13(a) and 43(a) to the financial statements. Although the direct shareholdings in some of these Group Companies are below 50% of the equity, the accounts of such Companies are consolidated in recognition of the effective management control exercised by the Parent Company.
The details of non-controlling interests are given in Note 13(e) to the financial statements.
2.4 MATERIALITY AND AGGREGATION.
Each material class of similar items is presented separately in the Consolidated Financial Statements. Items of a dissimilar nature or function are presented separately unless they are immaterial.
SUMMARY OF SIGNIFICANT ACCOUNTING POLICIES APPLIED
2.5.1. CHANGES IN ACCOUNTING POLICIES
The accounting policies adopted are consistent with those of the previous financial year.
The following are the significant accounting policies applied by the Group in preparing its consolidated financial statements:
2.5.2. COMPARATIVE INFORMATION
The presentation and classification of the financial statements of the previous year has been amended, where relevant for better presentation and to be comparable with those of the current year.
2.6. BUSINESS COMBINATIONS AND GOODWILL
Business combinations are accounted for using the acquisition method. The cost of an acquisition is measured as the aggregate of the consideration transferred, measured at acquisition date fair value and the amount of any non-controlling interest in the acquiree. For each
business combination, the Group elects whether it measures the non-controlling interest in the acquiree at fair value or at the proportionate share of the acquiree’s identifiable net assets. Acquisition related costs incurred are expensed as incurred and included in administrative expenses.
When the Group acquires a business, it assesses the financial assets and liabilities assumed for appropriate classification and designation in accordance with the contractual terms, economic circumstances and pertinent conditions as at the acquisition date. This includes the separation of embedded derivatives in host contracts by the acquiree.
If the business combination is achieved in stages, the previously held equity interest is re-measured at its acquisition date fair value and any resulting gain or loss is recognised in profit or loss. Any contingent consideration to be transferred by the acquirer will be recognised at fair value at the acquisition date. Contingent consideration which is deemed to be an asset or liability that is a financial instrument and within the scope of LKAS 39 Financial Instruments: Recognition and Measurement, is measured at fair value with changes in fair value either in profit or loss or as a change to other comprehensive income (OCI). If the contingent consideration is not within the scope of LKAS 39, it is measured in accordance with the appropriate SLFRS.
Contingent consideration that is classified as equity is not remeasured and subsequent settlement is measured at fair value with changes in fair value either in a profit or loss or as a change to the Other Comprehensive Income (OCI). If the contingent consideration is not within the scope of LKAS 39, it is measured in accordance with the appropriate SLFRS Contingent consideration that is classified as equity is not remeasured and subsequent settlement is accounted for within equity.
Goodwill is initially measured at cost, being the excess of the aggregate of the consideration transferred and the amount recognised for non-controlling interest over the net identifiable assets acquired and liabilities assumed. If the fair value of the net assets acquired is in excess of the aggregate consideration transferred, the gain is recognised in profit or loss.
After initial recognition, goodwill is measured at cost less any accumulated impairment losses. For the purpose of impairment testing, goodwill acquired in a business combination is, from the acquisition date, allocated to each of the Group’s cash generating units that are expected to benefit from the combination.
Where goodwill has been allocated to a cash-generating unit and part of the operation within that unit is disposed of, the goodwill associated with the operation disposed of is included in the carrying amount of the operation when determining the gain or loss on disposal of the operation. Goodwill disposed of in this circumstance is measured based on the relative values of the operation disposed of and the portion of the cash-generating unit retained.
NOTES TO FINANCIAL STATEMENTS (CONTD.)

RENUKA HOLDINGSANNUAL REPORT 201744
2.7 NON CONTROLLING INTEREST.
Profit or loss and each component of other comprehensive income are attributed to equity holders of the parent of the group and to the non-controlling interests, even if this results in the non-controlling interests having a deficit balance.
2.8. INVESTMENT IN ASSOCIATES
The Group investment in associates is accounted for using the equity method. An associate is an entity in which the Group has significant influence.
Under the equity method, the investment is initially recognised at cost. The carrying amount of the investment is adjusted to recognize changes in the Group’s share of net assets of associate since acquisition date. Goodwill relating to the associate is included in the carrying amount of the investment and is neither amortised nor individually tested for impairment.
The Income Statement reflects the Group’s share of results of operations of the associate. When there has been a change recognised directly in the equity of the associate, the Group recognises its share of any changes, when applicable, in the statement of changes in equity. Unrealised gains and losses resulting from transactions between the Group and the associate are eliminated to the extent of the interest in the associate.
The Group’s share of the profit or loss of an associate is shown on the face of the Income Statement and represents profit or loss after tax and non-controlling interests in the subsidiaries of the associate.
The Financial Statements of the associate are prepared for the same reporting period as the Group. When necessary, adjustments are made to bring the accounting policies in line with those of the Group.
After application of the equity method, the Group determines whether it is necessary to recognise an impairment loss on its investment in its associate. The Group determines at each reporting date whether there is any objective evidence that the investment in the associate is impaired. If this is the case, the Group calculates the amount of impairment as the difference between the recoverable amount of the associate and its carrying value and recognises the amount in ‘share of losses of an associate in the Income Statement.
Upon loss of significant influence over the associate, the Group measures and recognises any retained investment at its fair value. Any difference between the carrying amount of the associate upon loss of significant influence and the fair value of the retaining investment and proceeds from disposal is recognised in profit or loss.
A listing of the Group’s Associates is set out in Notes 13(b) to the Financial Statements.
Summarised financial information of the Associate of the Group is given in Note 39(b) to the Financial Statements.
2.9. INVESTMENT IN JOINT VENTURES
A Joint Venture is a type of joint arrangement whereby the parties that have joint control of the arrangement have rights to the net assets of the joint venture.
The group Investment in Joint Ventures is accounted using Equity method.
2.10 TRANSACTION ELIMINATED ON CONSOLIDATION
All intra-group assets, liabilities, equity, Income, expenses and cash flows relating to transactions between members of the group are eliminated in full on consolidation.
Unrealised gains arising from transactions with equity accounted investees are eliminated against the investment to the extent of the Group’s interest in the investee. Unrealised losses are eliminated in the same way as unrealised gains, but only to the extent that there is no evidence of impairment.
2.11. FOREIGN CURRENCY TRANSLATION
The Group’s consolidated financial statements are presented in Sri Lankan Rupees, which is also the Parent Company’s functional currency. For each entity the Group determines functional currency and items included in the financial statements of each entity are measured using that functional currency.
2.12. TRANSACTIONS AND BALANCES
Transactions in foreign currencies are initially recorded by the Group entities at their functional currency spot rate at the date the transaction first qualifies for recognition.
Monetary assets and liabilities denominated in foreign currencies are retranslated at the functional currency spot rate of exchange ruling at the reporting date. Differences arising on settlement or translation of monetary items are recognised in profit or loss.
Non-monetary items that are measured in terms of historical cost in a foreign currency are translated using the exchange rates as at the dates of the initial transactions. Non-monetary items measured at fair value in a foreign currency are translated using the exchange rates at the date when the fair value is determined. The gain or loss arising on translation of non-monetary measured at fair value is treated in line with the recognition of gain or loss on change in fair value in the item (i.e., the translation differences on items whose fair value gain or loss is recognised in OCI or profit or loss are also recognised in OCI or profit or loss, respectively.)
2.13 CURRENT VERSUS NON CURRENT CLASSIFICATION
The group presents assets and liabilities in the Statement of Financial Position based on current /non-current classification. An asset is current when it is:
• Expected to be realised or intended to sold or consumed in a normal operating cycle
• Held primarily for the purpose of trading
NOTES TO FINANCIAL STATEMENTS (CONTD.)

RENUKA HOLDINGSANNUAL REPORT 2017 45
2.13 CURRENT VERSUS NON CURRENT CLASSIFICATION (CONTD.)
• Expected to be realised within twelve months after the reporting period or
• Cash or cash equivalent unless restricted from being exchanged or used to settle a liability for at least twelve months after the reporting period.
All other assets are classified as non-current.
A liability is current when:
• It is expected to be settled in a normal operating cycle.
• It is held primarily for the purpose of trading.• It is due to be settled within twelve months after the
reporting period, or • There is no unconditional right to defer the settlement
of the liability for at least twelve months after the reporting period.
The group classifies all other liabilities as non-current.
2.14. INCOME TAX
Income Tax expense comprises current and deferred tax. Income tax expense is recognized in income statement except to the extent that it relates to items recognized directly in equity, in which case it is recognized in equity. Income Tax has been computed in accordance with the provisions of the Inland Revenue Act No.10 of 2006 and amendments thereto. Income Tax details of the group companies are as follows.
i. Renuka Holdings PLCa. Profit on Sale of Shares
According to section 13 (t) of the Income Tax Act No.10 of 2006, profit earned on sale of shares on which share transaction levy under Section 7 of the Finance Act No.05 of 2005, is paid is exempt from income tax.
b. Interest IncomeInterest income is liable to income tax at 28%.
ii. Renuka Agro Exports LimitedThe Company’s export profit is liable to income tax at 12%.The Company is liable to income tax on other income at 28%
iii. Renuka Foods PLC
a. Profit on Sale of SharesAccording to section 13 (t) of the Income Tax Act No. 10 of 2006, profit earned on sale of shares on which share transaction levy under Section 7 of the Finance Act No. 05 of 2005, is paid is exempt from income tax.
b. Interest IncomeInterest income is liable to income tax at 28%
iv. Renuka Agri Foods PLC In terms of the agreement with Board of investment
of Sri Lanka (BOI), business profit of the Company is exempted from income tax for a period of 12 years from the date of commencement of its business,
which came to an end in the year of assessment 2011/12. Subsequently the said exemption period was extended for another three years of assessment ending 2014/15 by a supplementary agreement. After the expiration of said tax exemption period, the Company will be liable for taxation at the rate of 12%. However, in terms of section 59(A) of the inland Revenue Act No. 6 of 2006, export profit of the Company have been tax at the rate 10%. Further in terms of section 59(2) of the same Act, the Company is entitle to a 50% tax credit on the income tax liability of the business of food processing.
Dividend paid by the Company out of exempt profits during the 12 years tax holiday period or within one year thereafter is exempted from tax. Other income is liable for income tax at the rate of 28%.
v. Renuka Organics (Pvt) Ltd.According to the agreement entered into with Board of Investment of Sri Lanka, the profit and income of the Company were exempt from income tax for a period of five (5) years. This tax holiday period expired on 31st March 1999.From the year of assessments 2006/2007, under section 16 of the inland revenue act No. 10 of 2006, the Company's profit was exempted from income tax for a period of five years. This tax holiday period expired on 31st March 2011. The Company is liable to income tax at 12% on profit from the year of assessment 2011/2012.Company's other income is liable for income tax at the rate of 28%.
vi. Kandy Plantations Ltd.The profit from Agriculture Activity of the Company is liable to income tax at 10%. The profit from export sales is liable to income tax at 12%.The other income of the Company is liable to income tax at 28%.
vii. Renuka Teas Ceylon (Pvt) Ltd.The company’s export Profit is liable to income tax at a concessionary rate 12%. Local sales and other income is liable to Income tax at 28%.
viii. Renuka Beach Hotels (Pvt) Ltd.The company is liable to income tax at 28%.
ix. Renuka Developments LimitedThe company is liable to tax at 28%.
x. Renuka Enterprises (Pvt) LtdThe company is liable to tax at 28%.
xi. Renuka Consumer Foods LtdThe company is liable to tax at 28%
xii. Renuka Shipping and Travel (Pvt) LtdThe company is liable to tax at 28%.
xiii. Ceylon Forestry (Pvt) Ltda. In accordance with the provision of Section 17 of the
Board of Investment of Sri Lanka Law No.4 of 1978 the Company will be entitled to the following exemptions, benefits with regard to income tax.
NOTES TO FINANCIAL STATEMENTS (CONTD.)

RENUKA HOLDINGSANNUAL REPORT 201746
2.14. INCOME TAX (CONTD.)
b. For a period of eight (08) years reckoned from the Year of Assessment as may be determined by the BOI, the profits & income of the Company is exempt from tax. For the above purpose, the year of assessment shall be reckoned from the year in which the Company commences to make profits or any year of assessment not later than two (02) years reckoned from the date of commencement of commercial operations whichever year is earlier,as specified in a certificate issued by the BOI.
c. After the expiration of the aforesaid tax exemption period, the Profits and income of the Company shall for each year of assessment be charged at the rate of ten per centum (10%) for a period of two (2) years(“concessionary period”) immediately succeeding the last date of the tax exemption period during which the profits and income of the Company is exempted from income tax.
d. After the expiration of the aforesaid concessionary period referred to in paragraph (c) above, the profits and income of the Company shall be charged for any year of assessment at the rate of twenty per centum (20%). However, other income would be liable to income Tax @ 28%.
xiv. Ceylon Botanicals (Pvt) Ltd
The company is liable to tax at 28%.
xv. Bois Bros & Co (Pvt) Ltd
The company is liable to tax at 28%.
xvi. Galle Face Properties Limited
The company shall be entitled for a tax exemption period of 8 years in terms Inland Revenue Act No. 10 of 2006.The year of assessment shall be reckoned from the year in which the enterprise commences to make profits or any year of assessment not later than 2 years reckoned from the date of commencement of commercial operations, whichever year is earlier as may be specified in a certificate issued by Board of Investments in Sri Lanka.
After the expiration of aforesaid tax exemption period the profit and income of the enterprise shall, for any year of assessment, be charged at 15%.
The other income is liable to income tax at 28%.
xvii. Shaw Wallace Ceylon Ltd
The company is liable to tax at 28%.
xviii. Shaw Wallace Properties Ltd
As per the renewal agreement the effective percentage for the year 2016/2017 is 20%.
xix. McShaw Automotive Ltd
The company is liable to tax at 28%.
xx. Inter Ocean Lubricants (Pvt) Ltd
The company is liable to tax at 28%.
xxi. Richlife Dairies Ltd
The Company is liable to income tax at 10% on profit from Agriculture and at 28% on other Income.
xxii. Renuka Agri Organics Ltd
a. The Company shall be entitled for a tax exemption period of 4 years in term Inland Revenue Act No. 10 of 2006 as amended by the Inland Revenue (amendment) Act No. 8 of 2012 (Section 16C). The year of assessment shall be reckoned from the year in which the enterprise commences to make profit or any year of assessment not later than 2 year reckoned from the date commencement of commercial operations, whichever comes first as determined by the Commissioner General of Inland Revenue.
The Company commenced to make profits from Y/A 2014/15.
b. Local Sales
Local Sales are liable to tax at 12%.
c. Interest Income
Interest Income is liable tax at 28%.
xxiii. Mayfair Foods (Pvt) Ltd
The company is liable to tax at 28%.
xxiv. Renuka Capital PLC
The company is liable to tax at 28%.
xxv. Coco Lanka (Pvt) Ltd
The company is liable to income tax at the rate of 12%.
2.15. DEFERRED TAX
Deferred tax is provided using the liability method on temporary differences between the tax bases of assets and liabilities and their carrying amounts for financial reporting purposes at the reporting date.
Deferred tax assets are recognised for all deductible temporary differences, carry forward of unused tax credits and unused tax losses, to the extent that it is probable that taxable profit will be available against which the deductible
NOTES TO FINANCIAL STATEMENTS (CONTD.)

RENUKA HOLDINGSANNUAL REPORT 2017 47
2.15. DEFERRED TAX (CONTD.)
temporary differences, and the carry forward of unused tax credits and unused tax losses can be utilised.
The carrying amount of deferred tax assets is reviewed at each reporting date and reduced to the extent that it is no longer probable that sufficient taxable profit will beavailable to allow all or part of the deferred tax asset to be utilised. Unrecognised deferred tax assets are reassessed at each reporting date and are recognised to the extent that it has become probable that future taxable profits will allow the deferred tax asset to be recovered.
Deferred tax assets and liabilities are measured at the tax rates that are expected to apply in the year when the asset is realized or the liability is settled, based on Tax rates (and tax laws) that have been enacted or substantively enacted at the reporting date.
Deferred tax relating to items recognised outside profit or loss is recognised outside profit or loss. Deferred tax items are recognized in correlation to the underlying transaction either in other comprehensive income or directly in equity.
Deferred tax assets and deferred tax liabilities are offset if a legally enforceable right exists to set off current tax assets against current income tax liabilities and the deferred taxes relate to the same taxable entity and the same taxation authority.
2.16. SALES TAX
Revenues, expenses and assets are recognised net of the amount of sales tax, except:
Where the sales tax incurred on a purchase of assets or services is not recoverable from the taxation authority, in which case, the sales tax is recognised as part of the cost of acquisition of the asset or as part of the expense item, as applicable. Receivables and payables are stated with the amount of sales tax included.
The net amount of sales tax recoverable from, or payable to, the taxation authority is included as part of receivables or payables in the statement of financial position.
2.17. PROPERTY, PLANT & EQUIPMENT
The group applies the requirements of LKAS 16 on ‘Property, Plant & Equipment’ in accounting for its owned assets which are held for and use in the provision of the services or for administration purposes and are expected to be used for more than a year.
Property, Plant & Equipment other than Land & Buildings is stated at historical cost less accumulated depreciation and accumulated impairment losses. The cost of property, plant & equipment is the cost of acquisition or construction to seller with any incidental expenses thereon.
Land and buildings are stated at fair value.
The cost of replacing a component of an item of property, plant & equipment is recognised in the carrying amount of the item if it is probable that the future economic benefit
embodied within the part will flow to the Group & its cost can be measured reliably.
The cost of the repair & maintenance of property, plant & equipment are recognised in the Statement of Income as incurred. Depreciation is calculated on the straight line method to write-off the cost of each asset, to their residual values over their estimated useful lives which are reviewed annually are as follows:
Percentage
Buildings 2.5 – 5
Plant & Machinery 10 – 20
Motor Vehicles 20
Equipment & Tools 10 – 20
Furniture & Fittings 5 – 15
Electrical Installation 10 – 20
Computers & Software 25
Milk Collection Centre 5
Waste Water Treatment Plant 5
Land is not depreciated as it is deemed to have an indefinite life.
Depreciation of an asset begins when it is available for use and ceases at the earliest of the date, the asset is classified as held for sale and the date that the asset is derecognised.
Gains and losses on disposal of Property, Plant & Equipment are determined by comparing proceeds with carrying amount and are taken into account in determining operating profit.
2.17.1. LEASES
The determination of whether an arrangement is, or contains,a lease is based on the substance of the arrangement at the inception date, whether fulfillment of the arrangement is dependent on the use of a specific asset or assets or the arrangement conveys a right to use the asset, even if that right is not explicitly specified in an arrangement.
Group as a Lessee
Finance leases which transfer to the Group substantially all the risks and benefits incidental to ownership of the leased item, are capitalised at the commencement of the lease at the fair value of the leased property or,if lower, at the present value of the minimum lease payments. Lease payments are apportioned between finance charges and reduction of the lease liability so as to achieve a constant rate of interest on the remaining balance of the liability. Finance charges are recognised in finance costs in the income statement.
NOTES TO FINANCIAL STATEMENTS (CONTD.)

RENUKA HOLDINGSANNUAL REPORT 201748
2.17.1. LEASES (CONTD.)
A leased asset is depreciated over the useful life of the asset. However, if there is no reasonable certainty that the Group will obtain ownership by the end of the lease term, the asset is depreciated over the shorter of the estimated useful life of the asset and the lease term.
Operating lease payments are recognised as an operating expense in the income statement on a straight-line basis over the lease term.
2.17.2. WITHDRAWAL OF UITF RULINGS
The Urgent Issue Task Force (UITF) rulings issued prior to 1 January 2012 have been superseded by the Sri Lanka Accounting Standards (SLFRS and LKAS) with effect from 1st January 2012. Consequently it is now required to treat transactions in which any of UITF rulings applied, in accordance with Sri Lanka Accounting Standards (SLFRS and LKAS) effective from 1st January 2012.
The Group has recorded Lease Hold Property (Leasehold Right to the Land) and correspondent liability in terms of UITF ruling issued by The Institute of Chartered Accountants of Sri Lanka prior to 1st January 2012. It has been superseded by the Statement of Recommended Practice (SoRP) for Right-To-Use of Land on Lease which was approved by the Council of the Institute of Chartered Accountants of Sri Lanka on 19th December 2012. Accordingly,the Leasehold Property is re-classified as “Right-To-Use of Land”.Corresponding net liability to lessor re-classified as “Liability to make lease payment.
2.17.3. BIOLOGICAL ASSETS
Biological assets are classified into mature biological assets and immature biological assets. Mature biological assets are those that have attained harvestable specifications or are able to sustain regular harvests. Immature biological assets are those that have not yet attained harvestable specification. Coconut, timber trees, other plantations and nurseries are classified as biological assets.
The cost of land preparation, rehabilitation, new planting,replanting, crop diversification, inter planting and fertilizing, etc.,incurred between the time of planting and harvesting (when the planted area attains maturity), are classified as immature plantations. These immature plantations are shown at direct costs plus attributable overheads. The expenditure incurred on bearer biological assets which comes into bearing during the year, is transferred to mature plantations. Expenditure incurred on consumable biological assets is recorded at cost at initial recognition and thereafter at fair value at the end of each reporting period.
Permanent impairments to Biological Assets are charged to the Income Statement in full and reduced to the net carrying amounts of such asset in the year of occurrence after ascertaining the loss.
Biological assets are further classified as bearer biological assets and consumable biological assets. Bearer biological
asset includes mainly coconut plants, those that are not intended to be sold or harvested, however used to grow for harvesting agriculture produce. Consumable biological assets includes managed timber trees those that are to be harvested as agricultural produce from biological assets or sold as biological assets.
The entity recognise the biological assets when, and only when,the entity controls the assets as a result of past event, it is probable that future economic benefits associated with the assets will flow to the entity and the fair value or cost of the assets can be measured reliably.
The bearer biological assets are measured at cost less accumulated depreciation and accumulated impairment losses, if any, in terms of LKAS 16 – Property Plant & Equipment as per the ruling issued by The Institute of Chartered Accountants of Sri Lanka.
2.18. INVESTMENT PROPERTY
Investment property is property held either to earn rental income or for capital appreciation or both, but not for sale in the ordinary course of business, use in the production or supply of goods or services or for administrative purposes
Investment property is measured initially at cost, including transaction costs. Subsequent to initial recognition, investment property is stated at fair value, which reflects market conditions at the reporting date. Gains or losses arising from changes in the fair values of investment property are included in the income statement in the period in which they arise. Fair values are evaluated annually by an accredited external, independent valuer, applying an appropriate valuation model. Investment property is derecognized when either they have been disposed of or when the investment property is permanently with drawn from use and no future economic benefit is expected from its disposal.
The difference between the net disposal proceeds and the carrying amount of the asset is recognised in the income statement in the period of derecognition. Transfers are made to or from investment property only when there is a change in use. For a transfer from investment property to owner-occupied property, the deemed cost for subsequent accounting is the fair value at the date of change. If owner-occupied property becomes an investment property, the Group accounts for such property in accordance with the policy stated under property, plant and equipment up to the date of change. Where Group companies occupy a significant portion of the investment property of a subsidiary, such investment properties are treated as property, plant & equipment in the Consolidated Financial Statements, and accounted using Group accounting policy for property, plant & equipment.
2.19. BORROWING COSTS
Borrowing costs directly attributable to the acquisition, construction or production of an asset that necessarily takes a substantial period of time to get ready for its intended use
NOTES TO FINANCIAL STATEMENTS (CONTD.)

RENUKA HOLDINGSANNUAL REPORT 2017 49
2.19. BORROWING COSTS (CONTD.)
or sale are capitalised as part of the cost of the respective assets. All other borrowing costs are expensed in the period they occur. Borrowing costs consist of interest and other costs that an entity incurs in connection with the borrowing of funds.
2.20. RELATED PARTY TRANSACTIONS
Disclosures are made in respect of the transactions in which one party has the ability to control or exercise significant influence over the financial and operating policies or decisions of the other irrespective of whether price is being charged.
2.21. EVENTS OCCURRING AFTER THE REPORTING PERIOD.
All material events occurring after the reporting period have been considered and where necessary adjustments or disclosure have been made in the Financial Statements.
2.22 EARNINGS PER SHARE.
The group presents basic and diluted earnings per share (EPS) for its ordinary shares. Basic EPS is calculated by dividing the profit or loss attributable to ordinary shareholders of the Company by the weighted average number of ordinary shares outstanding during the period.
Diluted EPS is determined by adjusting the profit or loss attributable to ordinary shareholders and the weighted average number of ordinary shares outstanding for the effects of all dilutive potential ordinary shares.
2.23. GOING CONCERN
The Board of Directors has confirmed that the company had adequate resources to continue its operations in the foreseeable future.
Therefore, going concern basis has been adopted in preparing these Financial Statements.
2.24. USE OF ESTIMATES & JUDGMENTS
The preparation of Financial Statements requires management to make judgments estimates and assumptions that affect the application of accounting policies and the reported amounts of Assets, Liabilities, Income and Expenses. Actual results may differ from these estimates.
Estimates and underlying assumptions are reviewed on an ongoing basis. Revisions to accounting estimates are recognised in the period in which the estimate is revised and in any future periods affected.
2.25. MANAGEMENT’S RESPONSIBILITY FOR THE FINANCIAL STATEMENTS
Management is responsible for the preparation and fair presentation of these financial statements in accordance with Sri Lanka Accounting Standards. This responsibility
includes: designing,implementing and maintaining internal control relevant to the preparation and fair presentation of financial statements that are free from material misstatement, whether due to fraud or error; selecting and applying appropriate accounting policies;and making accounting estimates that are reasonable in the circumstances.
2.26. INVENTORIES
Inventories are stated at the lower of cost or net realisable value. Cost is determined by the weighted average method. The cost of finished goods and work-in-progress comprises raw materials,direct labour, other direct costs and related production overheads,but excludes interest expense.
Net realisable value is the estimate of the selling price in the ordinary course of business less the costs of completion and selling expenses. Provision is made, where necessary, for obsolete, slow moving and defective inventories
2.26.1. AGRICULTURAL PRODUCE HARVESTED FROM BIOLOGICAL ASSETS
Agricultural produce harvested from its biological assets are measured at their fair value less cost to sell at the point of harvest. The finished and semi-finished inventories from agriculture produce are valued by adding the cost of conversion to the fair value of the agricultural produce.
2.26.2. INPUT MATERIAL, SPARES AND CONSUMABLES
At actual cost on weighted average basis.
2.27. EMPLOYEE BENEFIT COST
2.27.1. DEFINED BENEFIT PLAN – GRATUITY
A defined benefit plan is a post-employment benefit plan other than a defined contributions plan. The liability recognized in the Statement of Financial Position in respect of defined benefit plan is the present value of the defined benefit obligation at the reporting date. Benefits falling due more than 12 months after the reporting date are discounted to present value.
The defined benefit obligation is calculated annually by independent actuaries using Projected Unit Credit Method (PUC) as recommended by LKAS - 19, Employees benefits. The present value of the defined benefit obligation is determined by discounting the estimated future cash outflows.
However, according to the Payment of Gratuity Act No. 12 of 1983,the liability for the gratuity payment to an employee arises only on the completion of 5 years of continued service with the Company.
The actuarial gains and losses are charged or credited to Statement of Comprehensive Income in the period in which they arise.
NOTES TO FINANCIAL STATEMENTS (CONTD.)

RENUKA HOLDINGSANNUAL REPORT 201750
2.27.2. DEFINED CONTRIBUTION PLAN-EMPLOYEE’S PROVIDENT FUND AND EMPLOYEE’S TRUST FUND.
All employees who are eligible for Employee’s Provident Fund Contribution and Employee’s Trust Fund Contributions are covered by relevant contribution funds in line with respective Statutes and Regulations.
Contribution to Provident Fund and Trust Fund covering the employees are recognized as an expense in the Income Statement in the period in which it is incurred.
2.28. CASH AND CASH EQUIVALENTS
Cash and cash equivalents are defined as cash in hand, demand deposits and short-term highly liquid investments, readily convertible to known amounts of cash and subject to insignificant risk of changes in value.
For the purpose of Statement of Cash Flow, Cash and Cash Equivalents consist of cash in hand and deposits in banks net of outstanding bank overdrafts.
2.29. PROVISIONS
Provisions are recognised when the Company has a present legalor constructive obligation as a result of past events, it is probable that an outflow of resources embodying economic benefits will be required to settle the obligation, and a reliable estimate of the amount of the obligation can be made.
2.30. CAPITAL COMMITMENTS AND CONTINGENCIES
All material capital commitments and contingencies of the Group as at the Statement of Financial Position date are disclosed in the notes to the Financial Statements.
2.31. CONTINGENT ASSETS AND CONTINGENT LIABILITIES
All contingent liabilities are disclosed as a note to the Financial Statements unless the outflow of resources is remote. Contingentassets are disclosed, where inflow of economic benefit is probable.
2.32. INTANGIBLE ASSETS
BASIS OF RECOGNITION
An Intangible asset is recognized if it is probable that future economic benefits associated with the asset will flow to the Group and the cost of the asset can be reliably measured.
BASIS OF MEASUREMENT
Intangible assets acquired separately are measured on initial recognition at cost. The cost of intangible assets acquired in a business combination is the fair value as at the date of acquisition.
Following initial recognition, intangible assets are carried at cost less any accumulated amortization and any accumulated impairment losses.
Internally generated intangible assets, excluding capitalized development costs, are not capitalized, and expenditure is
charged against income statement in the year in which the expenditure is incurred.
USEFUL ECONOMIC LIVES, AMORTISATION AND IMPAIRMENT
The useful lives of intangible assets are assessed as either finite or indefinite lives. Intangible assets with finite lives are amortised over the useful economic life and assessed for impairment whenever there is an indication that the intangible asset may be impaired.
2.33 TRANSFER PRICING REGULATION
The Group is subject to income-taxes and other taxes including transfer pricing regulations. Prevailing uncertainties with respect to the interpretation of respective transfer pricing regulations necessitated using management judgment to determine the impact of transfer pricing regulations. Accordingly critical judgments and estimates were used in applying the regulations in aspects including but not limited to identifying associated undertakings,estimation of the respective arm’s length prices and selection of appropriate pricing mechanism. The current tax charge is subject to such judgments. Differences between estimated income tax charge and actual payable may arise as a result of management's interpretation and application of transfer pricing regulation.
3. FINANCIAL INSTRUMENTS-INITIAL RECOGNITION AND SUBSEQUENT MEASUREMENT
3.1. FINANCIAL ASSETS
3.1.1. INITIAL RECOGNITION AND MEASUREMENT
Financial assets within the scope of LKAS 39 are classified as financial assets at fair value through profit or loss, loans and receivables,held-to-maturity investments, available-for-sale financial assets or, as appropriate. The Group determines the classification of its financial assets at initial recognition.
All financial assets other than those classified as fair value through profit or loss are recognised initially at fair value plus transaction costs.
The Group`s financial assets are disclosed in Note 7.1
3.1.2. SUBSEQUENT MEASUREMENT
The subsequent measurement of financial assets depends on their classification as described below:
3.2. FINANCIAL ASSETS AT FAIR VALUE THROUGH PROFIT OR LOSS
Financial assets at fair value through profit or loss include financial assets held-for-trading and financial assets designated upon initial recognition at fair value through profit or loss. Financial assets are classified as held-for-trading if they are acquired for the purpose of selling or repurchasing in the near term. Financial assets at fair value through profit and loss are carried in the statement of financial position at fair value with changes in fair value recognised in the income statement.
NOTES TO FINANCIAL STATEMENTS (CONTD.)

RENUKA HOLDINGSANNUAL REPORT 2017 51
NOTES TO FINANCIAL STATEMENTS (CONTD.)
3.2. FINANCIAL ASSETS AT FAIR VALUE THROUGH PROFIT OR LOSS (CONTD.)
The Group evaluates its financial assets held-for-trading, to determine whether the intention to sell them in the near term is still appropriate. When the Group is unable to trade these financial assets due to inactive markets and management the Group may elect to reclassify these financial assets in rare circumstances. There classification to loans and receivables, available-for-sale or held to-maturity depends on the nature of the asset. This evaluation does not affect any financial assets designated at fair value through profit or loss using the fair value option at designation.
3.3. LOANS AND RECEIVABLES
Loans and receivables are non-derivative financial assets with fixed or determinable payments that are not quoted in an active market. After initial measurement, such financial assets are subsequently measured at amortised cost using the effective interest rate method(EIR), less impairment.Amortised cost is calculated by taking in to account any discount or premium on acquisition and fees or costs that are an integral part of the EIR. The EIR amortisation is included in finance income in the income statement. The losses arising from impairment are recognised in the income statement in finance costs.
Discounting is omitted where the effect of discounting is immaterial or where the balances are recoverable on demand.
3.4. HELD-TO-MATURITY INVESTMENTS
Non derivative financial assets with fixed or determinable payments and fixed maturities are classified as held-to-maturity when the Group has the positive intention and ability to hold them to maturity. After initial measurement, held-to-maturity investments are measured at amortised cost using the effective interest method, less impairment. Amortised cost is calculated by taking into accountancy discount or premium on acquisition and fees or costs that are an integral part of the EIR. The EIR amortisation is included in finance income in the income statement. The losses arising from impairment are recognised in the income statement in finance costs.
3.5. AVAILABLE-FOR-SALE FINANCIAL INVESTMENTS
Available-for-sale financial investments held at the reporting date consist of equity securities. Equity investments classified as available-for-sale are those, neither classified as held-for-trading nor designated at fair value through profit or loss.
After initial measurement, available-for-sale financial investments are subsequently measured at fair value with unrealised gains or losses recognised as other comprehensive income in the available for-sale reserve until the investment is derecognised, at which time,the cumulative gain or loss is recognised in other operating income,or determined to be impaired, at which time the cumulative loss is reclassified to the income statement in finance costs and removed from the available-for-sale reserve.
3.6. DERECOGNITION
A financial asset (or, where applicable, a part of a financial asset or part of a group of similar financial assets) is derecognised when:
• The rights to receive cash flows from the asset have expired
• The Group has transferred its right to receive cash flows from the asset or has assumed an obligation to pay the received cash flows in full without material delay to a third party under a “pass through”arrangement; and either (a) the Group/Company has transferred substantially all the risks and rewards of the asset, or (b) the Group/Company has neither transferred nor retained substantially all the risks and rewards of the asset, but has transferred control of the asset.
When the Group has transferred its rights to receive cash flows from an asset or has entered into a pass-through arrangement,and has neither transferred nor retained substantially all of the risks and rewards of the asset nor transferred control of it, the asset is recognised to the extent of the Group’s continuing involvement in it.
In such case, the Group also recognises an associated liability. The transferred asset and the associated liability are measured on a basis that reflects the rights and obligations that the Group has retained. Continuing involvement that takes the form of a guarantee over the transferred asset is measured at the lower of the original carrying amount of the asset and the maximum amount of consideration that the Group could be required to repay.
3.7. IMPAIRMENT OF FINANCIAL ASSETS
The Group assesses at each reporting date whether there is any objective evidence that a financial asset or a group of financial assets is impaired. A financial asset or a group of financial assets is deemed to be impaired if, there is objective evidence of impairment as a result of one or more events that has occurred after e initial recognition of the asset (an incurred’ loss event’) and that loss event has an impact on the estimated future cash flows of the financial asset or the group of financial assets that can be reliably estimated.
Evidence of impairment may include indications that the debtors or a group of debtors is experiencing significant financial difficulty,default or delinquency in payments, theprobability that they will enter bankruptcy or other financial reorganisation and where observable data indicate that there is a measurable decrease in the estimated future cash flows, such as changes in arrears or economic conditions that correlate with defaults.
For financial assets carried at amortised cost, the Group first assesses whether objective evidence of impairment exists individually for financial assets that are individually significant.
If there is objective evidence that an impairment loss has been incurred, the amount of the loss is measured as the

RENUKA HOLDINGSANNUAL REPORT 201752
NOTES TO FINANCIAL STATEMENTS (CONTD.)
3.7. IMPAIRMENT OF FINANCIAL ASSETS (CONTD.)
difference between the asset carrying amount and the present value of estimated future cash flows. The present value of the estimated future cash flows is discounted at the financial asset’s original effective interest rate.
The carrying amount of the asset is reduced through the use of an allowance account and the amount of the loss is recognized in the income statement. The assets are written off when there is no realistic prospect of future recovery. If, in a subsequent year, the amount of the estimated impairment loss increases or decreases because of an event occurring after the impairment was recognised, the previously recognised impairment loss is increased or reduced by adjusting the allowance account. If a write-off is later recovered, the recovery is credited to the Statement of Income.
For available-for-sale financial investments, the Group assesses at each reporting date whether there is objective evidence that an investment or a group of investments is impaired.
In the case of equity investments classified as available-for-sale,objective evidence would include a significant or prolonged decline in the fair value of the investment below its cost. “Significant is evaluated against the original cost of the investment and“prolonged” against the period in which the fair values have been below its original cost.
Where there is evidence of impairment, the cumulative loss -measured as the difference between the acquisition cost and the current fair value, less any impairment loss on that investment previously recognised in the income statement-is removed from other comprehensive income and recognised in the income statement. Impairment losses on equity investments are not reversed through the income statement; increases in their fair value after impairment are recognised directly in other comprehensive income.
3.8. FINANCIAL LIABILITIES
3.8.1. INITIAL RECOGNITION AND MEASUREMENT
Financial liabilities within the scope of LKAS 39 are classified as financial liabilities at fair value through profit or loss, loans and borrowings or, as appropriate. The Group determines the classification of its financial liabilities at initial recognition. All Financial liabilities are recognised initially at fair value and, in the case of loans and borrowings, carried at amortised cost. This includes directly attributable transaction costs.
The Group’s financial liabilities are disclosed in Note 7.1.
3.8.2. SUBSEQUENT MEASUREMENT OF LOANS AND BORROWINGS
After initial recognition, interest bearing loans and borrowings are subsequently measured at amortised cost using the effective interest rate method. Gains and losses are recognised in the income statement when the liabilities are derecognised as well as through the effective interest
rate method (EIR) amortisation process.
Amortised cost is calculated by taking into account any discount or premium on acquisition and fees or costs that are an integral part of the EIR. The EIR amortisation is included in finance costs in the income statement.
3.8.3. DERECOGNITION
A financial liability is derecognised when the obligation under the liability is discharged or canceled or expires.
When an existing financial liability is replaced by another from the same lender on substantially different terms, or the terms of an existing liability are substantially modified, such an exchange or modification is treated as a derecognition of the original liability and the recognition of a new liability. The difference in the respective carrying amounts is recognised in the Statement of Income.
3.9. OFFSETTING OF FINANCIAL INSTRUMENTS
Financial assets and financial liabilities are offset with the net amount reported in the consolidated statement of financial position only if there is a current enforceable Legal right to offset the recognised amounts and intent to settle on a net basis, or to realize the assets and settle the liabilities simultaneously.
3.10. IMPAIRMENT OF NON-FINANCIAL ASSETS
The Group assesses at each reporting date whether there is an indication that an asset may be impaired. If any indication exists, or when annual impairment testing for an asset is required, the Group makes an estimate of the asset’s recoverable amount. An asset’s recoverable amount is higher of asset’s or cash generating unit’s fair value less costs to sell and its value in use and is determined for an individual asset, unless the asset does not generate cash in flows that are largely independent of those from other assets or groups of assets. Where the carrying amount of an asset exceeds its recoverable amount, the asset is considered impaired and is written down to its recoverable amount.
In assessing value in use, the estimated future cash flows are discounted to their present value using a pre Tax discount rate that reflects current market assessment of the time value of money and the risks specific to the asset. In determining fair value less cost of disposal, recent market transactions are taken into account. If no such transactions can be identified, an appropriate valuation model is used. These calculations are corroborated by valuation multiples, quoted share prices for publicly traded companies or other available fair value indicators.
Impairment losses of continuing operations are recognised in the Income Statement expense categories consistent with the function of the impaired asset, except for properties previously revalued with the revaluation taken to OCI. For such properties, the impairment is recognised in OCI up to the amount of any previous revaluations.
For assets, an assessment is made at each reporting date as to whether there is any indication that previously

RENUKA HOLDINGSANNUAL REPORT 2017 53
NOTES TO FINANCIAL STATEMENTS (CONTD.)
3.10. IMPAIRMENT OF NON-FINANCIAL ASSETS (CONTD.)
recognized impairment losses may no longer exist or may have decreased. If such indication exists, the Group makes an estimate of the recoverable amount. A previously recognised impairment loss is reversed only if there has been a change in the estimates used to determine the asset’s recoverable amount since the last impairment loss was recognised. If that is the case the carrying amount of the asset is increased to its recoverable amount and the increased amount cannot exceed the carrying amount that would have been determined, net of depreciation, had no impairment loss been recognised for the asset in prior years. Such reversal is recognised in the Statement of Income.
3.11. DETERMINATION OF FAIR VALUE
Fair value is the price that would be received to sell an asset or paid to transfer a liability in an orderly transaction between market participants at the measurement date.
The fair value measurement is based on the presumption that the transaction to sell the asset or transfer the liability takes place either:
• In the principal market for the asset or liability or• in the absence of a principal market, in the most
advantageous market for the asset or liability.
All assets and liabilities for which fair value is measured or disclosed in the financial statements are categorised within the fair value hierarchy, described as follows, based on the lowest level input that is significant to the fair value measurement as a whole:
• Level 1 - Quoted (unadjusted) market prices in active markets for identical assets or liabilities
• Level 2 - Valuation techniques for which the lowest level input that is significant to the fair value measurement is directly or indirectly observable
• Level 3 - Valuation techniques for which the lowest level input that is significant to the fair value measurement is unobservable
Level 1
When available, the Company measures the fair value of an instrument using active quoted prices or dealer price quotations(assets and long positions are measured at a bid price; liabilities and short positions are measured at an asking price), without any deduction for transaction costs. A market is regarded as active if quoted prices are readily and regularly available and represent actual and regularly occurring market transactions on an arm’s length basis.
Level 2
If a market for a financial instrument is not active, then the Company establishes fair value using a valuation technique. Valuation techniques include using recent arm’s length transactions between knowledgeable, willing parties (if available), reference to the current fair value of other instruments that are substantially the same, discounted cash flow analyses, credit models, option pricing models
and other relevant valuation models. The chosen valuation technique makes maximum use of market inputs, relies as little as possible on estimates specific to the Company, incorporates all factors that market participants would consider in setting a price, and is consistent with accepted economic methodologies for pricing financial instruments. Inputs to valuation techniques reasonably represent market expectations and measures of the risk-return factors inherent in the financial instrument. The Company calibrates valuation techniques and tests them for validity using prices from observable current market transactions in the same instrument or based on other available observable market data.
The best evidence of the fair value of a financial instrument at initial recognition is the transaction price, i.e. the fair value of the consideration given or received, unless the fair value of that instrument is evidenced by comparison with other observable current market transactions in the same instrument, i.e. without modification or repackaging, or based on a valuation technique whose variables include only data from observable markets. When transaction price provides the best evidence of fair value at initial recognition, the financial instrument is initially measured at the transaction price and any difference between this price and the value initially obtained from a valuation model is subsequently recognised in profit or loss on an appropriate basis over the life of the instrument but not later than when the valuation is supported wholly by observable market data or the transaction is closed out.
Level 3
Certain financial instruments are recorded at fair value using valuation techniques in which current market transactions or observable market data are not available. Their fair value is determined by using valuation models that have been tested against prices or inputs to actual market transactions and also using the best estimate of the most appropriate model assumptions. Models are adjusted to reflect the spread for bid and ask prices to reflect costs to close out positions, credit and debit valuation adjustments, liquidity spread and limitations in the models. Also,profit or loss calculated when such financial instruments are first recorded (‘Day 1’ profit or loss) is deferred and recognised only when the inputs become observable or on derecognition of the instrument.
4. INCOME STATEMENT
4.1. REVENUE RECOGNITION
Revenue is recognised to the extent that it is probable that the economic benefit will flow to the Group and the revenue can be reliably measured. The following specific recognition criteria must also be met before revenue is recognised.
4.2. SALE OF GOODS
Revenue from the sale of goods is recognised when the significant risks and rewards of ownership of the goods have passed to the buyer, usually on delivery of the goods.

RENUKA HOLDINGSANNUAL REPORT 201754
NOTES TO FINANCIAL STATEMENTS (CONTD.)
4.3. RENDERING OF SERVICES
Revenue from services rendered is recognised in profit or loss in proportion to the stage of completion of the transaction at the reporting date.
4.4. INTEREST
For all financial instruments measured at amortised cost and interest bearing financial assets classified as available for sale, interest income or expense is recorded using the effective interest rate (EIR),which is the rate that exactly discounts the estimated future cash payments or receipts through the expected life of the financial instrument or a shorter period.
4.5. DIVIDEND INCOME
Dividend is recognised when the Group`s right to receive the payment is established, which is generally when share holders approve the dividend.
Others Gains or losses of a revenue nature on the disposal of Property, Plant & Equipment have been accounted for in the Income Statement.
4.6. EXPENDITURE RECOGNITION
4.6.1. REVENUE EXPENDITURE
All expenditure incurred in the running of the business and in maintaining the capital assets in a state of efficiency, hasbeen charged to revenue in arriving at the profit or loss for the year.
4.6.2. CAPITAL EXPENDITURE
Expenditure incurred for the purpose of acquiring, extending or improving assets of a permanent nature by means of which to carry on the business or for the purpose of increasing the earning capacity of the business has been treated as capital expenditure.
For the purpose of presentation of the Income Statement, the Directors are of the opinion that function of expenses method fairly present the elements of the Company’s performance, hence such presentation method is adopted.
5. REPORTING SEGMENTS
An Operating segment is a component of the Group that engages in business activities from which it may earn revenues and incur expenses, including revenues and expenses that relate to transactions with any of the Group’s other components. All operating segments’ operating results are reviewed regularly by the Chairman and the board to make decisions about resources to be allocated to the segment and assess its performance, and for which discrete financial information is available. The operating results of the segments are described in Note 50 to the financial statements.
6. EFFECT OF SRI LANKA ACCOUNTING STANDARDS ISSUED BUT NOT YET EFFECTIVE
The Standards and interpretations that are issued but not yet effective up to the date of issuance of the Group’s Financial Statements are disclosed below.
6.1. SRI LANKA ACCOUNTING STANDARD (SLFRS 9) –“FINANCIAL INSTRUMENTS:
In December 2014, the CA Sri Lanka issued the final version of SLFRS9 Financial Instruments which reflects all phases of the Financial Instruments project and replaces LKAS 39 Financial Instruments: Recognition and Measurement. The standard introduces new requirements for classification and measurement, impairment and hedge accounting. SLFRS 9 is effective for annual periods beginning on or after 1st January 2018, with early application permitted.
6.2. SRI LANKA ACCOUNTING STANDARD (SLFRS 15) –“REVENUE FROM CONTRACTS WITH CUSTOMERS”
SLFRS 15 establishes a comprehensive framework for determining whether, how much and when revenue is recognised. It replaces existing revenue recognition guidance, including Sri Lanka Accounting Standard (LKAS 18) – “Revenue”, Sri Lanka Accounting Standard (LKAS 11)– “Construction Contracts” and IFRIC 13 –“Customer Loyalty Programmes”. This standard is effective for the annual periods beginning on or after 01 January 2018.
6.3. SRI LANKA ACCOUNTING STANDARD (SLFRS 16) –“LEASES”
SLFRS 16 provides a single lessee accounting model requiring leases to recognize assets & liabilities for all leases unless the lease term is 12 months or less or the underlying asset has a low value. This supersedes LKAS 17 Leases, IFRIC 4 determining whether an arrangement contains a lease, SIC 15 Operating Leases – Incentives, SIC 27 evaluating the substance of transactions involving the legal form of a lease. Earlier application is permitted for entities that apply SLFRS 15 Revenue from Contracts with customers.
SLFRS 16 is effective for annual reporting periods beginning on or after 01 January 2019.
The Group will adopt these standards when they become effective. pending the completion of detailed review, the financial impact is not reasonably estimable as at the date of publication of these Financial Statements.

RENUKA HOLDINGSANNUAL REPORT 2017 55
NOTES TO FINANCIAL STATEMENTS (CONTD.)
NOTE 7 - ANALYSIS OF FINANCIAL INSTRUMENTS BY MEASUREMENT BASISThe carrying amounts of Financial Assets and Financial Liabilities in each category are as follows.7.1 GROUP FAIR VALUE
THROUGH PROFIT & LOSS
(CARRIED AT FV)
AVAILABLE FOR SALE
(CARRIED AT FV)
HELD TO MATURITY
(CARRIED AT AMORTISED
COST)
LOANS & RECEIVABLES (CARRIED AT AMORTISED
COST)
TOTAL
31ST MARCH 2017 NOTE Rs. Rs. Rs. Rs. Rs.Financial AssetsOther Investments 13(d) - 56,883,552 - - 56,883,552
Short Term Investment in Shares 14 39,704,885 - - - 39,704,885
Trade & Other Receivables 16 - - - 1,179,818,076 1,179,818,076Short Term Investment in Deposits 19 - - 2,531,999 1,241,473,901 1,244,005,900 Cash at Bank & in Hand 20 - - - 1,167,204,517 1,167,204,517
39,704,885 56,883,552 2,531,999 3,588,496,494 3,687,616,930
OTHER LIABILITIES (AT FVTPL)
OTHER LIABILITIES (AT AMORTISED
COST)
TOTAL
NOTE Rs. Rs. Rs.Financial LiabilitiesInterest Bearing Borrowings 23(a) & (b) - 2,015,239,441 2,015,239,441 Trade & Other Payables 25 - 630,297,845 630,297,845 Amount due to Related Companies 27 - 40,350,234 40,350,234Bank Overdrafts 20 - 166,056,619 166,056,619
- 2,851,944,139 2,851,944,139
FAIR VALUE THROUGH
PROFIT & LOSS (CARRIED AT FV)
AVAILABLE FOR SALE
(CARRIED AT FV)
HELD TO MATURITY
(CARRIED AT AMORTISED
COST)
LOANS & RECEIVABLES (CARRIED AT AMORTISED
COST)
TOTAL
31ST MARCH 2016 NOTE Rs. Rs. Rs. Rs. Rs.Financial AssetsOther Investments 13(d) - 272,970,452 - - 272,970,452 Short Term Investment in shares 14 2,477,388 - - - 2,477,388 Trade & Other Receivables 16 - - - 767,752,220 767,752,220 Short Term Investment in Deposits 19 - 1,668,638,646 1,072,927 114,362,519 1,784,074,092 Cash at Bank & in Hand 20 - - - 351,511,129 351,511,129
2,477,388 1,941,609,098 1,072,927 1,233,625,868 3,178,785,281
OTHER LIABILITIES (AT FVTPL)
OTHER LIABILITIES
(AT AMORTISED COST)
TOTAL
NOTE Rs. Rs. Rs.Financial LiabilitiesInterest Bearing Borrowings 23(a) & (b) - 1,563,487,796 1,563,487,796 Trade & Other Payables 25 - 618,952,187 618,952,187 Bank Overdrafts 20 - 154,189,904 154,189,904
- 2,336,629,887 2,336,629,887
A description of the Company's Financial Instrument risks, including risk management objectives and policies is given in Note 52.
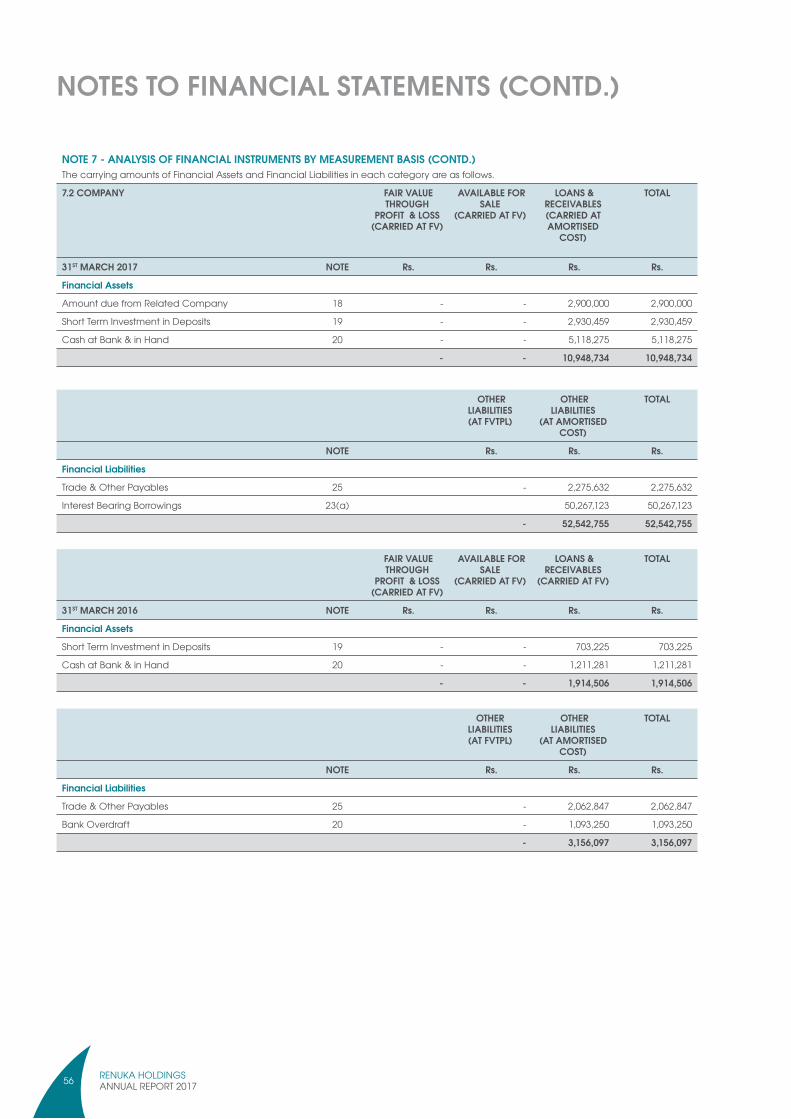
RENUKA HOLDINGSANNUAL REPORT 201756
NOTE 7 - ANALYSIS OF FINANCIAL INSTRUMENTS BY MEASUREMENT BASIS (CONTD.)The carrying amounts of Financial Assets and Financial Liabilities in each category are as follows.
7.2 COMPANY FAIR VALUE THROUGH
PROFIT & LOSS (CARRIED AT FV)
AVAILABLE FOR SALE
(CARRIED AT FV)
LOANS & RECEIVABLES (CARRIED AT AMORTISED
COST)
TOTAL
31ST MARCH 2017 NOTE Rs. Rs. Rs. Rs.
Financial Assets
Amount due from Related Company 18 - - 2,900,000 2,900,000
Short Term Investment in Deposits 19 - - 2,930,459 2,930,459
Cash at Bank & in Hand 20 - - 5,118,275 5,118,275
- - 10,948,734 10,948,734
FAIR VALUE THROUGH
PROFIT & LOSS (CARRIED AT FV)
AVAILABLE FOR SALE
(CARRIED AT FV)
LOANS & RECEIVABLES
(CARRIED AT FV)
TOTAL
31ST MARCH 2016 NOTE Rs. Rs. Rs. Rs.
Financial Assets
Short Term Investment in Deposits 19 - - 703,225 703,225
Cash at Bank & in Hand 20 - - 1,211,281 1,211,281
- - 1,914,506 1,914,506
OTHER LIABILITIES (AT FVTPL)
OTHER LIABILITIES
(AT AMORTISED COST)
TOTAL
NOTE Rs. Rs. Rs.
Financial Liabilities
Trade & Other Payables 25 - 2,275,632 2,275,632
Interest Bearing Borrowings 23(a) 50,267,123 50,267,123
- 52,542,755 52,542,755
OTHER LIABILITIES (AT FVTPL)
OTHER LIABILITIES
(AT AMORTISED COST)
TOTAL
NOTE Rs. Rs. Rs.
Financial Liabilities
Trade & Other Payables 25 - 2,062,847 2,062,847
Bank Overdraft 20 - 1,093,250 1,093,250
- 3,156,097 3,156,097
NOTES TO FINANCIAL STATEMENTS (CONTD.)

RENUKA HOLDINGSANNUAL REPORT 2017 57
NOTE
8 -
PRO
PERT
Y, P
LANT
& E
QUI
PMEN
TG
ROUP
AS
AT
01.
04.2
016
TRAN
SFER
S TO
RE
VALU
ATIO
N RE
SERV
E A
CQ
UISI
TION
OF
SUB
SIDI
ARIE
S A
DDITI
ONS
/ TR
ANSF
ERS
DIS
POSA
L OF
SUB
SIDI
ARIE
S D
ISPO
SALS
IM
PAIR
MEN
T A
S AT
3
1.03
.201
7 C
ost /
Val
uatio
n R
s. R
s. R
s. R
s. R
s. R
s. R
s. R
s.Fr
eeho
ld L
and
1,2
99,4
22,1
30
26,
136,
410
- 1
32,4
67,6
00
- -
- 1
,458
,026
,140
Build
ings
1,2
58,7
21,3
51
(25,
420,
375)
- 4
9,93
6,08
8 -
- (3
34,7
14)
1,2
82,9
02,3
50
Leas
ehol
d Bu
ildin
gs 2
33,6
13,5
00
- -
350
,000
-
- -
233
,963
,500
Plan
t & M
achi
nery
1,4
56,9
78,5
87
- 3
3,13
8,92
0 1
23,0
72,3
65
(14,
388,
920)
- (6
,875
,300
) 1
,591
,925
,652
Mot
or V
ehic
les
172
,094
,109
-
7,03
0,26
3 3
4,57
5,39
3 (6
,725
) (9
,900
,000
) -
203
,793
,040
Equi
pmen
t & To
ols
329
,350
,898
-
8,8
07,4
26
11,
370,
796
(2,1
15,7
34)
- (3
4,41
3,63
5) 3
12,9
99,7
50
Furn
iture
& F
ittin
gs 9
7,324
,290
-
6,1
32,2
26
6,6
84,2
07
(726
,810
) -
(1,3
12,6
00)
108
,101
,313
Elec
trica
l Insta
llatio
n 1
9,42
3,69
8 -
4,7
62,1
16
2,1
58,6
91
(1,4
98,8
29)
- (9
21,0
05)
23,
924,
671
Com
pute
r & S
oftw
are
9,1
19,1
79
- 8
,398
,539
1
71,3
55
(1,5
97,8
59)
- -
16,
091,
214
Was
te W
ater
Trea
tmen
t Pla
nt
2,3
56,8
39
- -
- -
- 2
,356
,839
M
ilk C
olle
ctio
n C
entre
2,1
74,3
50
- -
- -
- -
2,1
74,3
50
Cal
vert
Reno
vatio
n -
- -
8,8
54,0
00
- -
- 8
,854
,000
4
,880
,578
,931
7
16,0
35
68,
269,
490
369
,640
,495
(2
0,33
4,87
7) (9
,900
,000
) (4
3,85
7,254
) 5
,245
,112
,818
GRO
UP A
S AT
0
1.04
.201
6 A
CQ
UISI
TION
OF
SUB
SIDI
ARIE
S C
HARG
E FO
R TH
E YE
AR
DIS
POSA
L OF
SUB
SIDI
ARIE
S D
EPRE
CIA
TION
ON
DIS
POSA
L IM
PAIR
MEN
T A
S AT
3
1.03
.201
7 Ac
cum
ulat
ed D
epre
ciat
ion
Rs.
Rs.
Rs.
Rs.
Rs.
Rs.
Rs.
Free
hold
Lan
d -
- -
- -
- -
Build
ings
32,
981,
444
- 3
9,58
3,18
0 -
- (1
,707
,942
) 7
0,85
6,68
2 Le
aseh
old
Build
ings
899
,343
-
782
,500
-
- -
1,6
81,8
43
Plan
t & M
achi
nery
477
,423
,176
1
2,03
2,21
4 1
18,9
14,3
15
(12,
956,
214)
- (6
,670
,149
) 5
88,7
43,3
42
Mot
or V
ehic
les
124
,946
,828
1
,664
,521
2
2,10
0,86
5 (6
,726
) (9
,900
,000
)-
138
,805
,488
Eq
uipm
ent &
Tool
s 1
20,6
62,5
95
7,25
4,20
9 2
4,44
3,39
4 (2
,115
,732
) -
(24,
168,
699)
126
,075
,767
Fu
rnitu
re &
Fitt
ings
78,
893,
219
3,9
13,9
15
19,
868,
751
(726
,810
) -
(553
,783
) 1
01,3
95,2
91
Elec
trica
l Insta
llatio
n 1
4,69
8,06
1 4
,733
,617
7
87,2
47
(1,4
98,8
30)
- (4
81,8
57)
18,
238,
238
Com
pute
r & S
oftw
are
6,1
99,6
04
5,2
88,1
59
3,0
59,0
59
(1,5
97,8
59)
- -
12,
948,
963
Was
te W
ater
Trea
tmen
t Pla
nt
117
,842
-
117
,842
-
- -
235
,684
M
ilk C
olle
ctio
n C
entre
124
,961
-
141
,847
-
- -
266
,808
8
56,9
47,0
73
34,
886,
635
229
,799
,000
(1
8,90
2,17
1) (9
,900
,000
) (3
3,58
2,43
0) 1
,059
,248
,106
NOTES TO FINANCIAL STATEMENTS (CONTD.)
AS
AT 3
1.03
.201
7 A
S AT
31.
03.2
016
Rs.
Rs.
Writ
ten
Dow
n Va
lue
4,1
85,8
64,7
12
4,0
23,6
31,8
59
Cap
ital W
ork
in P
rogr
ess
113
,302
,965
1
35,1
83,5
24
4,2
99,1
67,6
77
4,1
58,8
15,3
82
• Ba
sed
on th
e as
sess
men
t car
ried
out i
nter
nally
by
the
Boar
d of
Dire
ctor
s, no
furth
er P
rovi
sion
was
requ
ired
for t
he p
oten
tial im
pairm
ent o
f fixe
d as
sets
as a
t 31
Mar
ch 2
017.
• Pr
oper
ty, P
lant
and
Equ
ipm
ent i
nclu
de fu
lly d
epre
ciat
ed a
sset
s hav
ing
a gr
oss a
mou
nt o
f Rs.
368,
561,
997
as a
t 31
Mar
ch 2
017.
(Rs.
152,
953,
628
as o
f 31
Mar
ch 2
016)
• Th
ere
wer
e no
rest
rictio
ns o
n th
e tit
le o
f the
Pro
perty
, Pla
nt a
nd E
quip
men
t as a
t 31
Mar
ch 2
017
othe
r tha
n th
ose
disc
lose
d in
Not
e 23
(g).
• Th
ere
wer
e no
item
s of P
rope
rty, P
lant
and
Equ
ipm
ent P
ledg
ed a
s sec
urity
as a
t 31
Mar
ch 2
017
othe
r tha
n th
ose
disc
lose
d in
Not
e 23
(g).
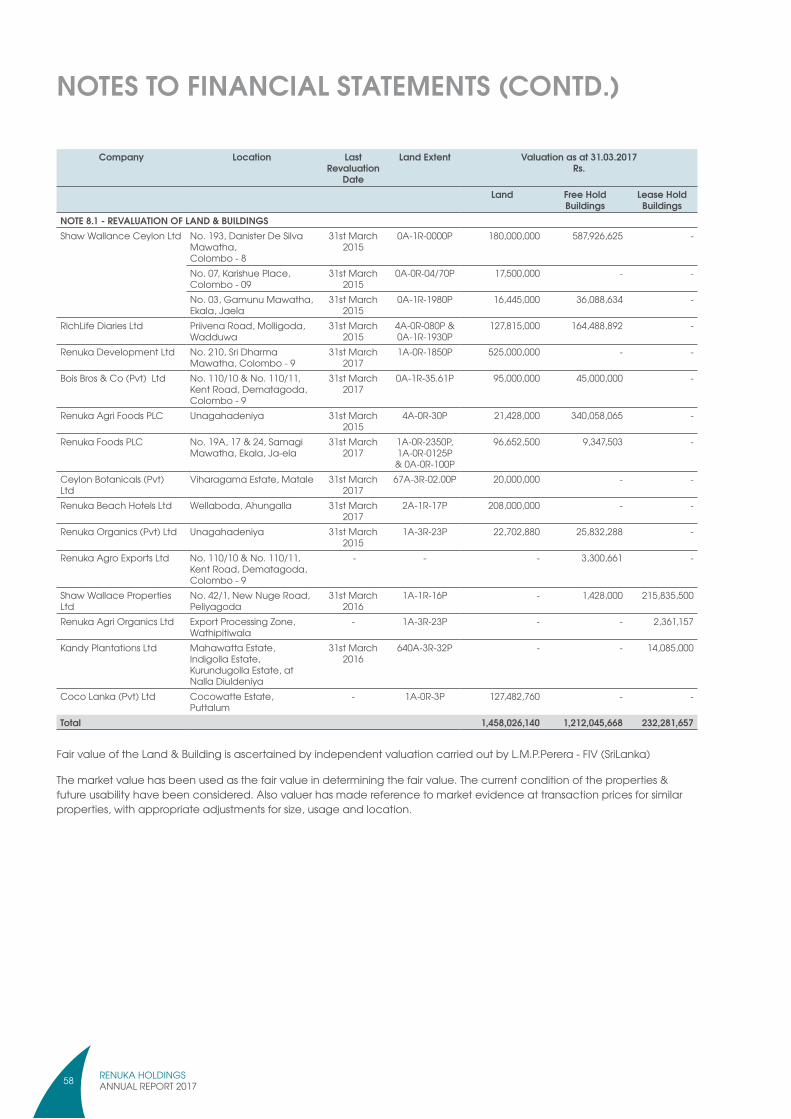
RENUKA HOLDINGSANNUAL REPORT 201758
NOTES TO FINANCIAL STATEMENTS (CONTD.)
Company Location Last Revaluation
Date
Land Extent Valuation as at 31.03.2017 Rs.
Land Free Hold Buildings
Lease Hold Buildings
NOTE 8.1 - REVALUATION OF LAND & BUILDINGSShaw Wallance Ceylon Ltd No. 193, Danister De Silva
Mawatha, Colombo - 8
31st March 2015
0A-1R-0000P 180,000,000 587,926,625 -
No. 07, Karishue Place, Colombo - 09
31st March 2015
0A-0R-04/70P 17,500,000 - -
No. 03, Gamunu Mawatha, Ekala, Jaela
31st March 2015
0A-1R-1980P 16,445,000 36,088,634 -
RichLife Diaries Ltd Priivena Road, Molligoda, Wadduwa
31st March 2015
4A-0R-080P & 0A-1R-1930P
127,815,000 164,488,892 -
Renuka Development Ltd No. 210, Sri Dharma Mawatha, Colombo - 9
31st March 2017
1A-0R-1850P 525,000,000 - -
Bois Bros & Co (Pvt) Ltd No. 110/10 & No. 110/11, Kent Road, Dematagoda, Colombo - 9
31st March 2017
0A-1R-35.61P 95,000,000 45,000,000 -
Renuka Agri Foods PLC Unagahadeniya 31st March 2015
4A-0R-30P 21,428,000 340,058,065 -
Renuka Foods PLC No. 19A, 17 & 24, Samagi Mawatha, Ekala, Ja-ela
31st March 2017
1A-0R-2350P, 1A-0R-0125P & 0A-0R-100P
96,652,500 9,347,503 -
Ceylon Botanicals (Pvt) Ltd
Viharagama Estate, Matale 31st March 2017
67A-3R-02.00P 20,000,000 - -
Renuka Beach Hotels Ltd Wellaboda, Ahungalla 31st March 2017
2A-1R-17P 208,000,000 - -
Renuka Organics (Pvt) Ltd Unagahadeniya 31st March 2015
1A-3R-23P 22,702,880 25,832,288 -
Renuka Agro Exports Ltd No. 110/10 & No. 110/11, Kent Road, Dematagoda, Colombo - 9
- - - 3,300,661 -
Shaw Wallace Properties Ltd
No. 42/1, New Nuge Road, Peliyagoda
31st March 2016
1A-1R-16P - 1,428,000 215,835,500
Renuka Agri Organics Ltd Export Processing Zone, Wathipitiwala
- 1A-3R-23P - - 2,361,157
Kandy Plantations Ltd Mahawatta Estate, Indigolla Estate, Kurundugolla Estate, at Nalla Diuldeniya
31st March 2016
640A-3R-32P - - 14,085,000
Coco Lanka (Pvt) Ltd Cocowatte Estate, Puttalum
- 1A-0R-3P 127,482,760 - -
Total 1,458,026,140 1,212,045,668 232,281,657 Fair value of the Land & Building is ascertained by independent valuation carried out by L.M.P.Perera - FIV (SriLanka)
The market value has been used as the fair value in determining the fair value. The current condition of the properties & future usability have been considered. Also valuer has made reference to market evidence at transaction prices for similar properties, with appropriate adjustments for size, usage and location.

RENUKA HOLDINGSANNUAL REPORT 2017 59
NOTE 9 - INTANGIBLE ASSETS Goodwill Trade License Trade Mark Computer
SoftwareTotal
Rs Rs Rs Rs Rs
Cost
Balance on 1st April 2016 116,053,065 15,000,000 15,000,000 13,648,153 159,701,218
Acquisition of Subsidiaries (Note 38(a)) 88,290,627 - 15,000,000 - 103,290,627
Written - off during the year - (15,000,000) - - (15,000,000)
Balance on 31st March 2017 204,343,692 - 30,000,000 13,648,153 247,991,845
Accumulated Amortization/ Impairment
Balance on 1st April 2016 - 1,500,000 4,656,164 13,454,190 19,610,354
Amortization during the year - 1,125,000 1,500,000 193,963 2,818,963
Written off during the year - (2,625,000) - - (2,625,000)
Balance on 31st March 2017 - - 6,156,164 13,648,153 19,804,317
Net Book Value
Balance on 1st April 2016 116,053,065 13,500,000 10,343,836 193,963 140,090,864
Balance on 31st March 2017 204,343,692 - 23,843,836 - 228,187,528
Goodwill
Goodwill represents the excess of an acquisition over the group interest in the net fair value of the identifiable assets, liabilities and contingent liabilities at the date of acquisition, and is carried at cost less accumulated impairment losses. The Group goodwill has been allocated to the following cash generating units, for impairment testing.
AS AT 31ST MARCH 2017 2016
Name of the Subsidiary Rs. Rs.
Shaw Wallace Ceylon Ltd 49,621,455 49,621,455
Richlife Dairies Ltd 66,431,610 66,431,610
Mayfair Foods (Pvt) Ltd 3,868,461 -
Renuka Capital PLC (Formerly Kalamazoo Systems PLC)
37,579,244 -
Interocean Lubricants (Pvt) Ltd 46,842,922 -
204,343,692 116,053,065
When testing for impairment for goodwill the recoverable amount of a cash generating unit is determined on the basis of value-in-use calculations. These calculations use cash flow projections based on financial budgets, which are approved by the management typically covering a five year period. Cash flows beyond the five year period are extrapolated using the estimated growth rates. The cash flows were discounted at an appropriate pre-tax discount rate. The management is of the view that a provision for impairment of goodwill is not required as at the reporting date.
Trade License
Renuka Organics (Private) Limited acquired the Trade License to operate Desiccated Coconut Mill at Unagahadeniya for a sum of Rs. 15Mn during 2014/15. The Management decided to amortise the cost of the Trade License over a period of 10 years from financial year 2015/16. However, during the year, Management decided to write off the carrying value of license fully due to change in the policy of the Coconut Board.
Trademark
(a) Shaw Wallace Ceylon Limited has acquired the "Mr. POP", "Pic Nic", "Rockers", "Chatters" and associated Trade Mark for a sum of Rs. 15 Million during 2012/13. The management is of the opinion that the trade mark has a useful economic life of 10 years.
(b) Mayfair Foods (Pvt) Ltd has acquired the "Mayfair" Trade Mark for a sum of Rs. 15 Million during 2016/17. The management is of the opinion that the trade mark has a useful economic life of 10 years.
Computer Software
Renuka Agri Foods PLC has acquired an ERP system for a sum of Rs. 13,648,153 on 30th April 2011. The management is of the opinion that the computer software has useful economic life of 5 years.
NOTES TO FINANCIAL STATEMENTS (CONTD.)
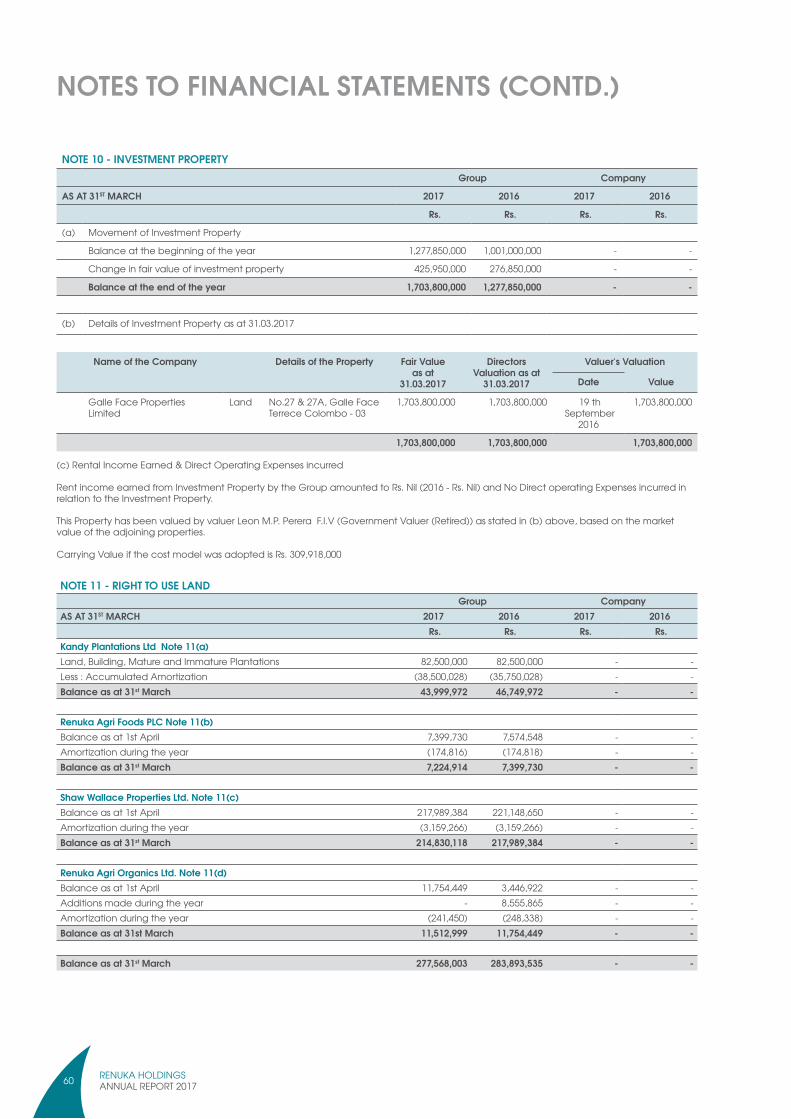
RENUKA HOLDINGSANNUAL REPORT 201760
Name of the Company Details of the Property Fair Value as at
31.03.2017
Directors Valuation as at
31.03.2017
Valuer's Valuation
Date Value
Galle Face Properties Limited
Land No.27 & 27A, Galle Face Terrece Colombo - 03
1,703,800,000 1,703,800,000 19 th September
2016
1,703,800,000
1,703,800,000 1,703,800,000 1,703,800,000
(c) Rental Income Earned & Direct Operating Expenses incurred Rent income earned from Investment Property by the Group amounted to Rs. Nil (2016 - Rs. Nil) and No Direct operating Expenses incurred in relation to the Investment Property. This Property has been valued by valuer Leon M.P. Perera F.I.V (Government Valuer (Retired)) as stated in (b) above, based on the market value of the adjoining properties.
Carrying Value if the cost model was adopted is Rs. 309,918,000
NOTE 11 - RIGHT TO USE LAND Group Company
AS AT 31ST MARCH 2017 2016 2017 2016 Rs. Rs. Rs. Rs.
Kandy Plantations Ltd Note 11(a)Land, Building, Mature and Immature Plantations 82,500,000 82,500,000 - - Less : Accumulated Amortization (38,500,028) (35,750,028) - - Balance as at 31st March 43,999,972 46,749,972 - -
Renuka Agri Foods PLC Note 11(b)Balance as at 1st April 7,399,730 7,574,548 - - Amortization during the year (174,816) (174,818) - - Balance as at 31st March 7,224,914 7,399,730 - -
Shaw Wallace Properties Ltd. Note 11(c)Balance as at 1st April 217,989,384 221,148,650 - - Amortization during the year (3,159,266) (3,159,266) - - Balance as at 31st March 214,830,118 217,989,384 - -
Renuka Agri Organics Ltd. Note 11(d)Balance as at 1st April 11,754,449 3,446,922 - - Additions made during the year - 8,555,865 - - Amortization during the year (241,450) (248,338) - - Balance as at 31st March 11,512,999 11,754,449 - -
Balance as at 31st March 277,568,003 283,893,535 - -
NOTES TO FINANCIAL STATEMENTS (CONTD.)
NOTE 10 - INVESTMENT PROPERTY Group Company
AS AT 31ST MARCH 2017 2016 2017 2016
Rs. Rs. Rs. Rs.
(a) Movement of Investment Property
Balance at the beginning of the year 1,277,850,000 1,001,000,000 - -
Change in fair value of investment property 425,950,000 276,850,000 - -
Balance at the end of the year 1,703,800,000 1,277,850,000 - -
(b) Details of Investment Property as at 31.03.2017

RENUKA HOLDINGSANNUAL REPORT 2017 61
NOTES TO FINANCIAL STATEMENTS (CONTD.)
NOTE 11(a) - KANDY PLANTATIONS LIMITEDLease have been executed for 3 estates (Primarily coconut) comprising 33 contiguous allotments of Land called and known as "Giriulla Estate" in Giriulla situated in the Gampaha District, Western Province.
As per Survey Plan No. 45/27, prepared in May 1926 and April 1927 by Mr. L.H.Croos Dabrera, this contiguous allotments of Land comprise a total extent of 640A-3R-32P. This lease has been executed for a period of 30 years under 2 separate lease agreements. The first lease agreement relates to 10 years period from 1st April 2003 to 31st March 2013 and the second lease agreement relates to the next 20 years commencing from 1st April 2013 and ending on 31st March 2033.A valuation report dated 11th October 2003 prepared by Leon M.P. Perera Dip.In.Val.F.I.V. indicates only the method of ascertaining the maximum amount payable to the owner of the Estate for the 30 years period which was Rs. 88,000,000/-. The agreed amount payable of Rs. 82.5Mn had been capitalized on the basis that it represents the value of immovable assets taken over by Kandy Plantations Ltd.
NOTE 11(b) - RENUKA AGRI FOODS PLC This represents the premiums paid to the Board of Investment of Sri Lanka for the acquisition of leasehold land in 2001 and 2014. These premiums are amortized over the leasehold period of 50 years with effect from the years 2001 and 2014 respectively.
NOTE 11(c) - SHAW WALLACE PROPERTIES LIMITEDThe acquisition cost of the leasehold rights of the Land situated at No. 42/1, New Nuge Road, Peliyagoda is recognized under Right to use Land. This Land is on a ninety nine year lease from the Urban Development Authority. This lease, which was assigned by the previous lessee, to the Company on 12th June 2008, expires on 31st August 2085.
NOTE 11(d) - RENUKA AGRI ORGANICS LIMITEDThe land was acquired under 50 years lease term from Board of Investment of Sri Lanka. The total lease rent is being amortised during lease term from 2014/15 at 2% per annum.
NOTE 12 - BIOLOGICAL ASSETS Group Company
AS AT 31ST MARCH 2017 2016 2017 2016
Rs. Rs. Rs. Rs.
(a) Bearer Biological Assets - Coconut Plantations
Balance as at 1st April - 85,585 - -
Additions during the year 130,000 - - -
Disposal during the year - (85,585) - -
Balance as at 31ST March 130,000 - - -
(b) Consumable Biological Assets - Timber Plantations
Balance as at 1st April 51,476,902 45,757,247 - -
Gain arising from changes in fair value 3,308,981 5,719,655 - -
Balance as at 31ST March 54,785,883 51,476,902 - -
Total 54,915,883 51,476,902 - -
Bearer Biological Assets - Kandy Plantation Limited.
During the year, Kandy Plantation Limited has incurred a sum of Rs. 130,000/- in planting a Coconut Nursery. The Nursery is for inplant vacant areas of the plantation held by Kandy Plantation Limited.
The biological asset is carried at cost as at reporting date, since the nursery has just started its operations, and the expected useful life estimated to be 2-3 years.

RENUKA HOLDINGSANNUAL REPORT 201762
Sensitivity Analysis
Sensitivity variation on sales price
Values as appearing in the Statement of Financial Position are very sensitive to price changes with regard to the average sales prices applied. Simulations made for timber, shows that an increase or a decrease by 10% of the estimated future selling price has the following effect on the net present value of biological assets:
Sales price fluctuation +10% 0 -10%
AS AT 31ST MARCH 2017 Rs Rs Rs
Managed Timber 60,264,472 54,785,883 49,307,295
60,264,472 54,785,883 49,307,295
Sensitivity Variation on Discount Rate
Values as appearing in the Statement of Financial Position are very sensitive to changes of the discount rate applied. Simulations made for timber, shows that an increase or a decrease by 0.5% of the estimated discount rate has the following effect on the net present value of biological assets:
Discount rate fluctuation +0.5% 0 -0.5%
AS AT 31ST MARCH 2017 Rs Rs Rs
Managed Timber 51,878,090 54,785,883 57,902,301
51,878,090 54,785,883 57,902,301
NOTE 12 - BIOLOGICAL ASSETS (CONTD.)Consumable Biological Assets - Ceylon Forestry (Private) Limited.Timber Plantation
The biological asset harvested is on the land owned by Ceylon Botanicals (Private) Limited (a subsidiary company of the group), for which rent has been paid by Ceylon Forestry (Private) Limited. The total extent of the land is 67 acres. The planted area is 42 acres. Number of Trees are 20331. Managed trees include commercial teak timber plantations cultivated on the estates in Matale. The cost of immature trees up to 5 years from planting are treated as approximate fair value particularly on the grounds of little biological transformation has taken place and impact of the biological transformation on price is not material. When such plantation become mature, the additional investment since taken over to bring them to maturity are transferred from immature to mature. The fair value of managed trees was ascertained in accordance with LKAS 41 - "Agriculture" which is applicable only for managed agricultural activity in terms of the ruling issued by the Institute of Chartered Accountants of Sri Lanka. The Valuation was carried out by an independent Chartered Valuation Surveyor Mr. W.M. Chandrasena using discounted Cash Flows (DCF) method. Key assumptions used in valuation are as follows
Variable Comment
Timber Content Estimated based on the girth, height and considering the growth and present age of the trees of each species in different geographical regions, factoring all the prevailing statutory regulations enforced against harvesting of timber coupled with forestry plan of the Company approved by the Forestry Department.
Economic Useful Life Estimated based on normal life span of each species by factoring the forestry plan of the Company approved by the Forestry Department
Selling Price Estimated based on prevailing Sri Lankan market prices factoring all the conditions to be fulfilled in bringing the trees in to salable condition.
Discount Rate Future cash flows are discounted at the rate of 13% (2016 - 12.5%)
The valuations, as presented in the external valuation models based on net present values, take into account the long-term exploitation of the timber plantation. Because of the inherent uncertainty associated with the valuation at fair value of the biological assets due to the volatility of the variables, their carrying value may differ from their realizable value. The Board of Directors retains their view that commodity markets are inherently volatile and that long-term price projections are highly unpredictable. Hence, the sensitivity analysis regarding selling price and discount rate variations as included in this note allows every investor to reasonably challenge the financial impact of the assumptions used in the LKAS 41 against his own assumptions.
Inter-relationship between key unobservable inputs and fair value measurement:
The estimated average future sales price of timber may increase or decrease within a +10% to -10% range. The risk-adjusted discount rate of 13% may stimulate an increase or a decrease between the ranges +0.5% to -0.5%
NOTES TO FINANCIAL STATEMENTS (CONTD.)
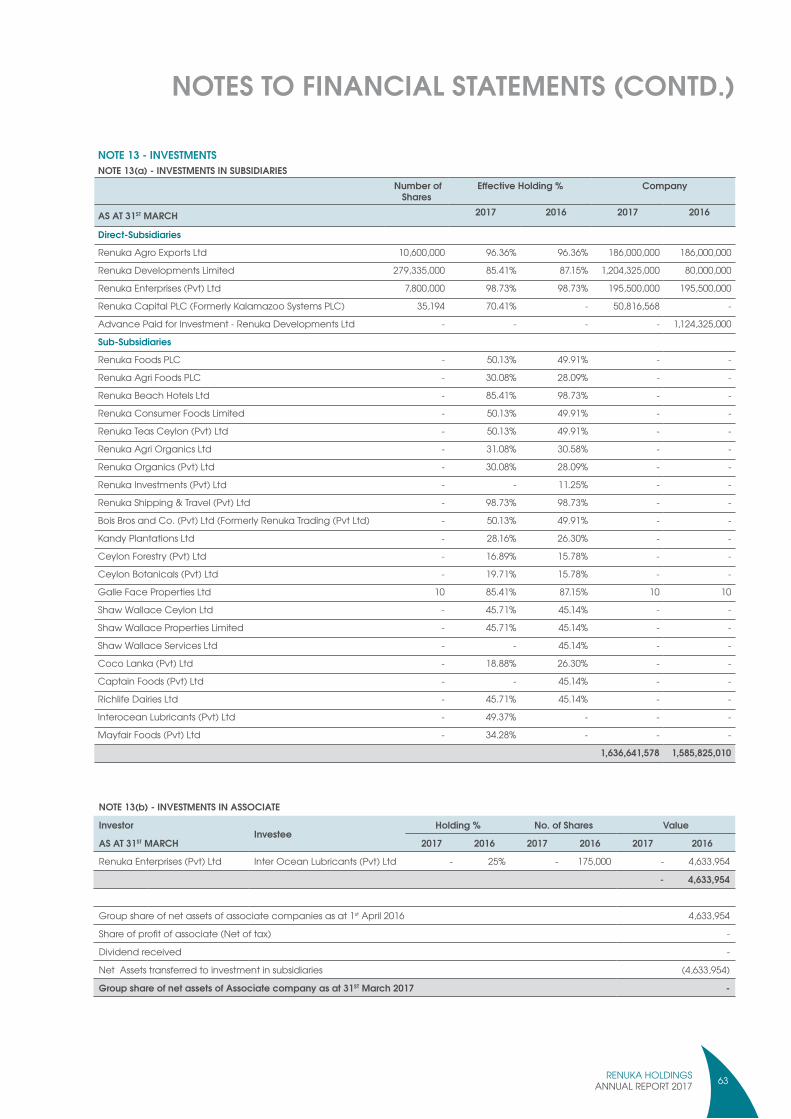
RENUKA HOLDINGSANNUAL REPORT 2017 63
NOTE 13 - INVESTMENTSNOTE 13(a) - INVESTMENTS IN SUBSIDIARIES
Number of Shares
Effective Holding % Company
AS AT 31ST MARCH 2017 2016 2017 2016
Direct-Subsidiaries
Renuka Agro Exports Ltd 10,600,000 96.36% 96.36% 186,000,000 186,000,000
Renuka Developments Limited 279,335,000 85.41% 87.15% 1,204,325,000 80,000,000
Renuka Enterprises (Pvt) Ltd 7,800,000 98.73% 98.73% 195,500,000 195,500,000
Renuka Capital PLC (Formerly Kalamazoo Systems PLC) 35,194 70.41% - 50,816,568 -
Advance Paid for Investment - Renuka Developments Ltd - - - - 1,124,325,000
Sub-Subsidiaries
Renuka Foods PLC - 50.13% 49.91% - -
Renuka Agri Foods PLC - 30.08% 28.09% - -
Renuka Beach Hotels Ltd - 85.41% 98.73% - -
Renuka Consumer Foods Limited - 50.13% 49.91% - -
Renuka Teas Ceylon (Pvt) Ltd - 50.13% 49.91% - -
Renuka Agri Organics Ltd - 31.08% 30.58% - -
Renuka Organics (Pvt) Ltd - 30.08% 28.09% - -
Renuka Investments (Pvt) Ltd - - 11.25% - -
Renuka Shipping & Travel (Pvt) Ltd - 98.73% 98.73% - -
Bois Bros and Co. (Pvt) Ltd (Formerly Renuka Trading (Pvt Ltd) - 50.13% 49.91% - -
Kandy Plantations Ltd - 28.16% 26.30% - -
Ceylon Forestry (Pvt) Ltd - 16.89% 15.78% - -
Ceylon Botanicals (Pvt) Ltd - 19.71% 15.78% - -
Galle Face Properties Ltd 10 85.41% 87.15% 10 10
Shaw Wallace Ceylon Ltd - 45.71% 45.14% - -
Shaw Wallace Properties Limited - 45.71% 45.14% - -
Shaw Wallace Services Ltd - - 45.14% - -
Coco Lanka (Pvt) Ltd - 18.88% 26.30% - -
Captain Foods (Pvt) Ltd - - 45.14% - -
Richlife Dairies Ltd - 45.71% 45.14% - -
Interocean Lubricants (Pvt) Ltd - 49.37% - - -
Mayfair Foods (Pvt) Ltd - 34.28% - - -
1,636,641,578 1,585,825,010
NOTES TO FINANCIAL STATEMENTS (CONTD.)
NOTE 13(b) - INVESTMENTS IN ASSOCIATE
Investor
AS AT 31ST MARCHInvestee
Holding % No. of Shares Value
2017 2016 2017 2016 2017 2016
Renuka Enterprises (Pvt) Ltd Inter Ocean Lubricants (Pvt) Ltd - 25% - 175,000 - 4,633,954
- 4,633,954
Group share of net assets of associate companies as at 1st April 2016 4,633,954
Share of profit of associate (Net of tax) -
Dividend received -
Net Assets transferred to investment in subsidiaries (4,633,954)
Group share of net assets of Associate company as at 31ST March 2017 -
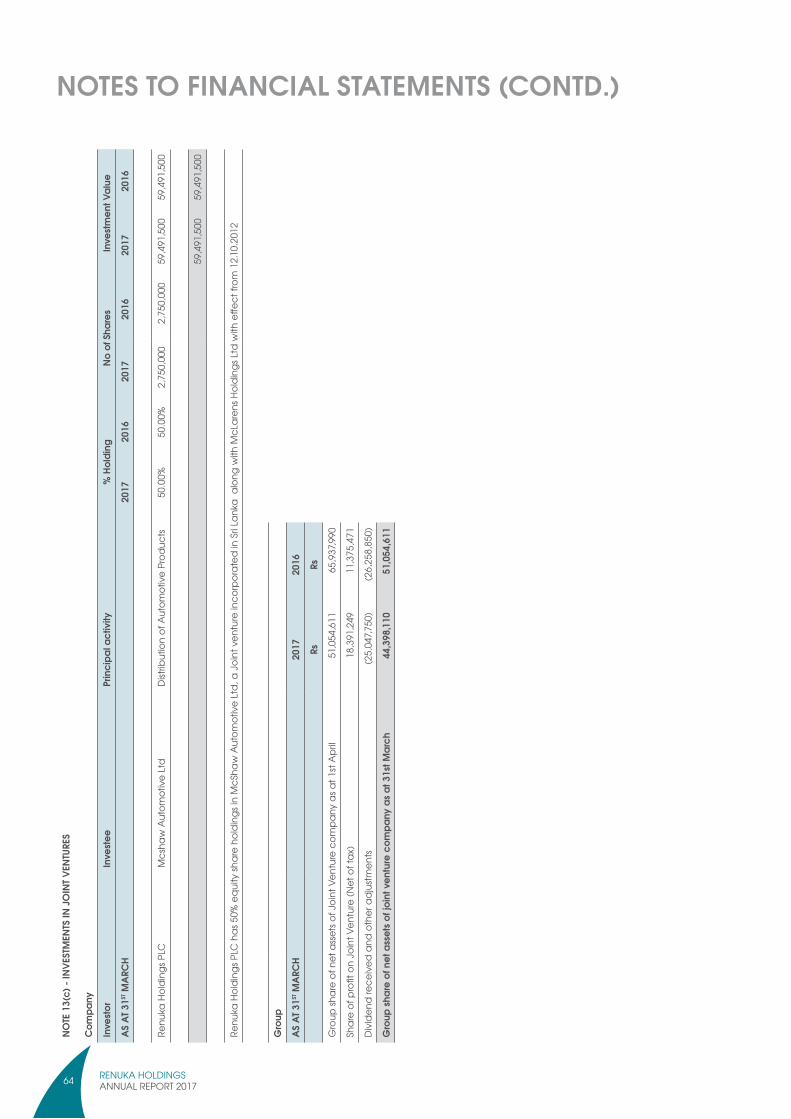
RENUKA HOLDINGSANNUAL REPORT 201764
NOTE
13(
c) -
INVE
STM
ENTS
IN J
OIN
T VEN
TURE
S
Com
pany
Inve
stor
Inve
stee
Prin
cipa
l act
ivity
%
Hol
ding
No
of S
hare
s In
vest
men
t Val
ue
AS A
T 31ST
MAR
CH
2017
2016
20
17
2016
20
1720
16
Renu
ka H
oldi
ngs P
LCM
csha
w A
utom
otiv
e Lt
dD
istrib
utio
n of
Aut
omot
ive
Prod
ucts
50.0
0%50
.00%
2,7
50,0
00
2,7
50,0
00
59,
491,
500
59,
491,
500
59,
491,
500
59,
491,
500
Renu
ka H
oldi
ngs P
LC h
as 5
0% e
quity
shar
e ho
ldin
gs in
McS
haw
Aut
omot
ive
Ltd,
a J
oint
ven
ture
inco
rpor
ated
in S
ri La
nka
alo
ng w
ith M
cLar
ens H
oldi
ngs L
td w
ith e
ffect
from
12.
10.2
012
NOTES TO FINANCIAL STATEMENTS (CONTD.)
Gro
up
AS A
T 31ST
MAR
CH
2017
2016
RsRs
Gro
up sh
are
of n
et a
sset
s of J
oint
Ven
ture
com
pany
as a
t 1st
Apr
il 5
1,05
4,61
1 6
5,93
7,990
Shar
e of
pro
fit o
n Jo
int V
entu
re (N
et o
f tax
) 1
8,39
1,24
9 1
1,37
5,47
1
Div
iden
d re
ceiv
ed a
nd o
ther
adj
ustm
ents
(25,
047,7
50)
(26,
258,
850)
Gro
up sh
are
of n
et a
sset
s of j
oint
ven
ture
com
pany
as a
t 31s
t Mar
ch 4
4,39
8,11
0 5
1,05
4,61
1

RENUKA HOLDINGSANNUAL REPORT 2017 65
NOTE
13(
d) -
OTH
ER IN
VEST
MEN
TS
Inve
stor
Inve
stee
% H
oldi
ng N
o of
Sha
res
Valu
e
AS A
T 31ST
MAR
CH
2017
2016
20
17
2016
20
1720
16
Renu
ka E
nter
prise
s (Pv
t) Lt
dC
rese
nt L
aund
ers &
Dry
Cle
aner
s (Pv
t) L
td
44.2
5%44
.25%
265
,500
2
65,5
00
56,
882,
542
56,
882,
542
The
Car
go B
oat D
espa
tch
Co.
Ltd
-
- 1
,000
1
,000
1
0 1
0
Renu
ka H
otel
s Ltd
- -
100
1
00
1,0
00
1,0
00
56,
883,
552
56,
883,
552
Renu
ka In
vest
men
t (Pv
t) Lt
dRe
nuka
Con
sulta
nts &
Ser
vice
s Ltd
-
20.7
1% -
12,
420
- 9
6,11
2,57
0
Lanc
aste
r Hol
ding
s Ltd
-
20.6
4% -
12,
386
- 2
4,90
1,31
0
Renu
ka P
rope
rties
Ltd
-
20.6
4% -
12,
386
- 4
6,06
2,52
0
Renu
ka V
illas (
Pvt)
Ltd
- 65
% -
16,
500
- 1
6,50
0
Renu
ka H
otel
s Ltd
- -
- 1
00
- 1
,000
Am
alga
mat
ed Th
eate
rs (P
vt) L
td -
24%
- 1
2,24
8 -
48,
992,
000
- 21
6,08
5,90
0
Renu
ka B
each
Hot
els L
tdRe
nuka
Res
orts
Ltd
-1,
000
- 1
,000
56,
883,
552
272,
970,
452
* The
Gro
up p
erce
ntag
e ho
ldin
g in
Cre
sent
Lau
nder
s & D
ry C
lear
ners
(Pvt
) Lt
d is
mor
e th
an 2
0% a
s at 3
1st M
arch
201
7. Ho
wev
er, t
here
is n
o re
pres
enta
tion
in th
e di
rect
orsh
ip in
this
com
pany
by
the
Gro
up. I
n th
e ab
senc
e of
sign
ifican
t infl
uenc
e in
this
com
pany
, thi
s inv
estm
ent h
as n
ot b
een
acco
unte
d as
Inve
stm
ent i
n A
ssoc
iate
.
NOTES TO FINANCIAL STATEMENTS (CONTD.)

RENUKA HOLDINGSANNUAL REPORT 201766
NOTE 13(e) - PRINCIPAL SUBSIDIARIES AND NON-CONTROLLING INTEREST
AS AT MARCH 2017
The following disclosure excerpt highlights the group composition and the portion of ownership interests held by NCI
Company and Country of Incorporation/ Operation
Principal Activities Class of Shares held
Group effective
Interest (%)
Non Controlling effective
Interest (%)Sri Lanka
Renuka Food PLC Fast Moving Consumer Goods Ordinary 50.13% 49.87%
Renuka Agri Foods PLC Manufacture & markets a range of coconut products Ordinary 30.08% 69.92%
Renuka Teas Ceylon (Pvt) Ltd Export bulk tea, value added tea products Ordinary 50.13% 49.87%
Renuka Organics (Pvt) Ltd Organic certification license holder and investment in plantation/farm & vertical integration projects
Ordinary 30.08% 69.92%
Kandy Plantations Ltd Engaged in organic certified cultivation of agriculture Ordinary 28.16% 71.84%
Bois Bros and Co. (Pvt) Ltd (Formerly Renuka Trading (Pvt Ltd)
Providing warehousing facilities Ordinary 50.13% 49.87%
Ceylon Forestry (Pvt) Ltd Planting and managing forestry Ordinary 16.89% 83.11%
Ceylon Botanicals (Pvt) Ltd Investment in agricultural property Ordinary 19.71% 80.29%
Renuka Agro Exports Ltd Sourcing, manufacturing & exporting ethnic food products
Ordinary 96.36% 3.64%
Renuka Agri Organics Ltd Export coconut based products Ordinary 31.08% 68.92%
Renuka Developments Ltd The company is in the business of property development
Ordinary 85.41% 14.59%
Renuka Enterprises (Pvt) Ltd Provide support services to Group companies Ordinary 98.73% 1.27%
Renuka Shipping & Travel (Pvt) Ltd Provide shipping,clearing and wharf services oil and greases
Ordinary 98.73% 1.27%
Galle Face Properties Ltd The company is in the business of property development
Ordinary 85.41% 14.59%
Renuka Consumer Foods Ltd FMCG Ordinary 50.13% 49.87%
Richlife Dairies Ltd Manufacturing of dairy and fruit juice based products Ordinary 45.71% 54.29%
Shaw Wallace Ceylon Ltd Manufacturing and distribution of fast moving consumer goods
Ordinary 45.71% 54.29%
Coco Lanka (Pvt) Ltd Organic cultivation of Agriculture Produce Ordinary 18.88% 81.12%
Shaw Wallace Properties Ltd Providing warehousing facilities Ordinary 45.71% 54.29%
Renuka Beach Hotel (Pvt) Ltd Investment in tourism property Ordinary 85.41% 14.59%
Interocean Lubricants (Pvt) Ltd Importing,blending, distributing and marketing lubricant oil and greases
Ordinary 49.37% 50.64%
Mayfair Foods (Pvt) Ltd Manufacture and sale of Confectionery Products Ordinary 34.28% 65.72%
Renuka Capital PLC (Formerly Kalamazoo Systems PLC)
Investing and trading in debt, equity and other Class of Instruments
Ordinary 70.41% 29.59%
Non- controlling interest represent the equity in subsidiaries that are not attributable, directly or indirectly to that parent company. Profit or loss and each component of other comprehensive income are attributed to the Company and non- controlling interests. Losses are attributable to non -controlling interest even if the non- controlling interests balance reported in the consolidated statement of financial position in negative.
Non-controlling interests are directly recognized as the difference between the proceeds received and the carrying amount of the acquired interests. The difference is recorded as a reduction or increase in equity under transactions with non-controlling interests. Upon disposal of rights in a subsidiary that does not result in loss of control, an increase or decrease in equity is recognized as the difference between the consideration received by the Group and the carrying amount of the non-controlling interests in the subsidiary adjusted for the disposal of goodwill in the subsidiary, if any, and amounts recognized in other comprehensive income, if any, Transaction costs in respect of transaction with non-controlling interests also recorded in equity.
Significant inter group balances and transaction and gain and losses resulting from intergroup transactions are eliminated in full in the consolidated financial statements.
The financial statement of the company and of the consolidated investees are prepared as of the same date and period. The accounting policies in the financial statements of those investees are applied consistently and uniformly with the policy applied in the financial statement of the company.
NOTES TO FINANCIAL STATEMENTS (CONTD.)

RENUKA HOLDINGSANNUAL REPORT 2017 67
NOTES TO FINANCIAL STATEMENTS (CONTD.)
Change in Non-Controlling Interest
a) Galle Face Properties Ltd
Renuka Development Limited has invested Rs. 200 Mn. in Galleface Properties Limited on 31st January 2017.
b) Renuka Developments Ltd
Renuka Organics (Pvt) Limited has invested Rs. 225 Mn. in Renuka Development Limited on 31st January 2017.
c) Renuka Beach Hotels Ltd
Renuka Enterprises (Pvt) Limited has sold its shares in Renuka Beach Hotels Ltd to Renuka Developments Ltd for a total consideration of Rs. 200 Mn. on 1st June 2016.
Renuka Developments Limited has invested Rs. 15 Mn. in Renuka Beach Hotels Ltd on 28th February 2017.
d) Renuka Capital PLC (Formerly Kalamazoo Systems PLC)
Renuka Holdings PLC has invested Rs. 50,518,116 in Renuka Capital PLC on 20th July 2016.
Renuka Holdings PLC has further invested Rs. 298,452 in Renuka Capital PLC on 31st August 2016.
Renuka Enterprises (Pvt) Limited has invested Rs. 8,089 in Renuka Capital PLC on 5th December 2016.
e) Inter Ocean Lubricants (Pvt) Ltd
Renuka Enterprises (Pvt) Limited has invested Rs.51,975,000 in Inter Ocean Lubricants (Pvt) Ltd on 30th May 2016.
f) Renuka Investments (Pvt) Ltd
Renuka Investments (Pvt) Limited has re-purchased shares in Renuka Enterprises (Pvt) Ltd for a total consideration of Rs. 7,250,000 on 13th July 2016.
g) Renuka Organics (Pvt) Limited
Renuka Agri Foods PLC has invested Rs. 232,855,000 and Rs. 70,000,000 respectively in ordinary shares issued by Renuka Organics (Pvt) Ltd on 27th December 2016 and 31st January 2017.
h) Renuka Agri Foods PLC
Renuka Foods PLC has invested Rs. 40,837,240 and Rs. 31,695,589 respectively in ordinary shares of Renuka Agri Foods PLC on 30th September 2016 and 30th October 2016.
i) Ceylon Botanicals (Pvt) Limited
Kandy Plantation Ltd has purchased ordinary shares of Ceylon Botanicals (Pvt) Ltd from Ceylon Forestry (Pvt) Ltd amounting to Rs.6,249,000 on 31st January 2017.
j) Mayfair Foods (Pvt) Ltd
Shaw Wallace Ceylon Ltd has invested Rs.33,750,000 represents 75% holding in Mayfair Foods (Pvt) Ltd on 3rd February 2017.
k) Coco Lanka (Pvt) Ltd
Renuka Agri Foods PLC has invested Rs.44,999,000 in Coco Lanka (Pvt) Ltd on 15th December 2016 and Kandy Plantations Ltd has invested Rs.52,498,000 in Coco Lanka (Pvt) Ltd on 31st December 2016.
l) Renuka Agri Organics Ltd
Renuka Foods PLC has invested Rs. 17,500,000 and Renuka Organics (Pvt) Ltd has invested Rs. 15,000,000 in Renuka Agri Organics (Pvt) Ltd on 02nd January 2017.
m) Bois Bros & Co (Private) Limited. ( Formerly Renuka Trading (Pvt) Limited )
Shares to the sum of Rs. 5,000,000 were issued to Renuka Teas Ceylon (Pvt) Ltd by Bois Bros & Co (Pvt) Ltd on 28th February 2017.

RENUKA HOLDINGSANNUAL REPORT 201768
NOTES TO FINANCIAL STATEMENTS (CONTD.)
NOTE 14 - SHORT TERM INVESTMENT IN SHARES
No of Shares Carrying Value of Shares/ Market Value
AS AT 31ST MARCH 2017 2016 2017 2016
Rs. Rs. Rs. Rs. Renuka City Hotels PLC 100 6,436 29,450 2,087,838
Hayles PLC 117,262 - 31,074,430 - AIA Insurance Lanka PLC 102 - 30,630 - Aitken Spense PLC 100 - 5,620 - Asiri Hospitals Holdings PLC 100 - 2,580 - Blue Diamonds Jewellery Worldwide PLC 100 - 90 - Browns & Company PLC 100 - 7,100 - Cargills (Ceylon) PLC 100 - 18,390 - Cargo Boat Development Company PLC 100 3,675 8,230 389,550 Carsons Cumberbatch PLC 100 - 16,320 - Central Finance Company PLC 207 - 17,843 - Chevron Lubricants Lanka PLC 200 - 34,000 - CIC Holdings PLC 100 - 8,010 -
Commercial Bank of Ceylon PLC 105 - 13,692 - DFCC Bank PLC 5,000 - 570,000 - Dialog Axiata PLC 100 - 1,130 - DIMO Engineering PLC 100 - 55,990 - Expo Lanka Holdings PLC 100 - 820 - The Colombo Fort Land & Buildings PLC 100 - 1,810 - Haycarb PLC 4,000 - 604,000 - Hemas Holdings PLC 100 - 10,850 - Janashakthi Insurance 25,304 - 382,090 - John Keells Holdings PLC 43,774 - 6,036,435 - Lankem Ceylon PLC 100 - 4,400 - LB Finance PLC 180 - 21,312 - Lee Hedges PLC 100 - 6,500 - LOLC Finance PLC 100 - 6,100 - MTD Walkers PLC 7,500 - 262,500 - National Development Bank PLC 107 - 14,295 - Nation Trust Bank PLC 100 - 7,400 - Nestle Lanka PLC 100 - 208,930 - Overseas Reality (Ceylon) PLC 10,100 - 204,828 - Printcare PLC 100 - 3,460 - Richard Peiris & Company PLC 100 - 830 - Singer Srilanka PLC 100 - 13,990 - Srilanka Telecom PLC 100 - 3,330 - Softlogic Holdings PLC 100 - 1,190 - Sunshine Holdings PLC 100 - 4,610 - United Motors Lanka PLC 150 - 11,700 -
39,704,885 2,477,388

RENUKA HOLDINGSANNUAL REPORT 2017 69
NOTE 15 - INVENTORIES Group Company
AS AT 31ST MARCH 2017 2016 2017 2016 Rs. Rs. Rs. Rs.
Raw Materials 383,937,532 109,904,947 - - Finished Goods 698,108,826 650,302,875 - - Packing Material & Chemicals 175,895,671 151,196,172 - - Machinery Spare Parts 106,868,420 81,651,836 - - Goods in Transit 74,739,965 174,076,859 - - Work in Progress 57,227,434 65,234,346 - - Harvested Crop 3,890,781 9,274,856 - Others 693,837 6,335,582 - - Less: Provision for Stock Loss (57,207,274) (23,163,662) - -
1,444,155,192 1,224,813,811 - -
NOTE 16 - TRADE AND OTHER RECEIVABLES16.1 Summary
Trade Debtors 965,939,276 754,774,684 - -
Less : Provision for Impairment (16.2) (64,327,885) (42,611,800) - -
901,611,391 712,162,884 - -
Refundable Deposits 166,500 166,500 - -
Other Debtors 278,040,185 55,422,836 - -
278,206,685 55,589,336 - -
1,179,818,076 767,752,220 - -
16.2 Provision for Impairment
Balance at the beginning of the year 42,611,800 42,014,868 - -
Provision made during the year 21,716,085 596,932 - -
Balance at the end of the year 64,327,885 42,611,800 - -
NOTES TO FINANCIAL STATEMENTS (CONTD.)
NOTE 17 - OTHER CURRENT ASSETSAdvances & Prepayments 16,651,666 23,356,976 - -
Other Current Assets 47,168,742 74,381,504 - -
63,820,408 97,738,480 - -
NOTE 18 - AMOUNT DUE FROM RELATED COMPANYRenuka Capital PLC (Formerly Kalamazoo Systems PLC) - - 2,900,000
- - 2,900,000 -

RENUKA HOLDINGSANNUAL REPORT 201770
NOTES TO FINANCIAL STATEMENTS (CONTD.)
NOTE 20 - CASH AND CASH EQUIVALENTS
20.1 Favorable Cash and Cash Equivalents Balances
Cash & Bank Balances 1,167,204,517 351,511,129 5,118,275 1,211,281
1,167,204,517 351,511,129 5,118,275 1,211,281
20.2 Unfavorable Cash and Cash Equivalents Balances
Bank Overdrafts (166,056,619) (154,189,904) - (1,093,250)
(166,056,619) (154,189,904) - (1,093,250)
Total Cash and Cash Equivalents 1,001,147,898 197,321,225 5,118,275 118,031
NOTE 19 - SHORT TERM INVESTMENTS IN DEPOSITS Group Company
AS AT 31ST MARCH 2017 2016 2017 2016
Rs. Rs. Rs. Rs.
Short Term Deposits 1,123,080 1,072,927 - -
Call Deposits 64,481,083 103,049,983 2,930,459 703,225
Fixed Deposits 1,176,992,818 11,312,536 - -
Interest Receivable - Repo 1,408,919 - - -
Unit Trusts - 1,668,638,646 - -
1,244,005,900 1,784,074,092 2,930,459 703,225
NOTE 21 - STATED CAPITAL Group / Company
AS AT 31ST MARCH 2017 2016
Rs. Rs. Number of Ordinary Shares Issued and Fully Paid
Balance at the beginning of the year 101,891,456 101,891,456
Issue of Shares - -
Balance at the end of the year 101,891,456 101,891,456
Stated Capital
Balance at the beginning of the year 1,198,897,063 1,198,897,063 Issue of Shares - -Balance at the end of the year 1,198,897,063 1,198,897,063
NOTE 22 - DEFERRED TAXATION Group Company
AS AT 31ST MARCH 2017 2016 2017 2016
Rs. Rs. Rs. Rs.
The gross movement in Deferred tax account
Balance at the beginning of the year 196,873,676 156,928,494 - -
Deferred Tax Charged / (Reversed) to Income Statement 5,623,250 36,908,480 - -
Deferred Tax Charged / (Reversed) to Statement of Other Comprehensive Income
568,476 3,036,702 - -
Adjustment Due to Acquisition Of Subsidiaries (6,388,663) - - -
Adjustment Due to Disposal Of Subsidiaries 2,828,945 - -
Balance at the end of the year 199,505,684 196,873,676 - -

RENUKA HOLDINGSANNUAL REPORT 2017 71
NOTES TO FINANCIAL STATEMENTS (CONTD.)
NOTE 23 - INTEREST BEARING BORROWINGS & LEASE INSTALMENTSNOTE 23(a) - INTEREST BEARING BORROWINGS DUE AFTER ONE YEAR
Long Term Loan (23[c]) 625,414,293 836,264,345 50,267,123 -
Total Non-Current Portion of Interest Bearing Borrowings 625,414,293 836,264,345 50,267,123 -
NOTE 23(b) - INTEREST BEARING BORROWINGS DUE WITHIN ONE YEAR
Long Term Borrowings (23[c]) 789,216,558 420,116,027 - -
Project Loan (23[d]) 377,730,000 269,000,000 - -
Other Loans 222,878,590 38,107,424 - -
Total Current Portion of Interest Bearing Borrowings 1,389,825,148 727,223,451 - -
NOTE 23(c) - LONG TERM BORROWINGS
Balance as at 1st April 1,256,380,372 1,662,221,554 - -
Adjustment due to Acquisition of Subsidiary 220,512,726 - -
Loans Obtained During the year 917,535,795 348,421,050 50,000,000
Interest Payable 351,466 - 267,123 -
Payments made during the year (980,149,508) (754,262,232) - -
Balance as at 31st March 1,414,630,851 1,256,380,372 50,267,123 -
Payments due within one year 789,216,558 420,116,027 - -
Payments due after one year 625,414,293 836,264,345 50,267,123 -
Note 23(d) - PROJECT LOAN DUE WITHIN ONE YEAR
Balance as at 1st April 269,000,000 171,000,000 - -
Loans obtained during the year 1,084,730,000 543,000,000 - -
Payments made during the year (976,000,000) (445,000,000) - -
Balance as at 31ST March 377,730,000 269,000,000 - -
NOTE 22 - DEFERRED TAXATION (CONTD.) Group Company
AS AT 31ST MARCH 2017 2016 2017 2016
Rs. Rs. Rs. Rs.
Deferred income tax assets and liabilities are offset when there is a legally enforceable right to off-set current tax assets against current tax liabilities and when the deferred income taxes relate to the same fiscal authority.
Deferred tax Liabilities 206,924,180 200,085,729 - -
Deferred tax Assets (7,418,496) (3,212,053) - -
199,505,684 196,873,676 - -

RENUKA HOLDINGSANNUAL REPORT 201772
NOTES TO FINANCIAL STATEMENTS (CONTD.)
NOTE 23 - INTEREST BEARING BORROWINGS & LEASE INSTALLMENTS (CONTD) Group Company
AS AT 31ST MARCH 2017 2016 2017 2016
Rs. Rs. Rs. Rs.
NOTE 23(e) - LIABILITIES TO MAKE LEASE PAYMENTS (TO THE OWNER OF THE ESTATE / LESSOR)
Total Lease installments payable under the 82,500,000 82,500,000 - -
Lease for 30 years commencing 01.04.2003 -
Amount paid up to the year end (27,500,000) (25,000,000)
Balance payable on lease as at 31st March 55,000,000 57,500,000
Lease Installments payable in the ensuing year (2,500,000) (2,500,000)
Lease installments payable after one year 52,500,000 55,000,000 - -
Non-Current portion of Lease obligation
Lease Installment payable to owner of Estate 23(e) 52,500,000 55,000,000 - -
Finance lease obligation (Motor Vehicle) 23(f) 5,244,150 - - -
57,744,150 55,000,000
Current portion of Lease obligation
Lease Installment payable to owner of Estate 23(e) 2,500,000 2,500,000
Finance lease obligation (Motor Vehicle) 23(f) 2,763,228 -
5,263,228 2,500,000
NOTE 23(f) - FINANCE LEASE OBLIGATION (MOTOR VEHICLES)
Lease Liability
Balance as at 1st April - 108,551 - -
Adjustment due to Acquisition of Subsidiary 4,886,735 -
Lease obtained during the year 6,997,440 -
Installments Paid during the year (1,480,364) (108,551) - -
Balance as at 31st March 10,403,811 - - -
Interest in Suspense
Balance as at 1st April - 2,559 - -
Acquisition of Subsidiary 792,901 - - -
Lease obtained during the year 2,033,940 -
Charged to Income Statement (430,408) (2,559) - -
Balance as at 31st March 2,396,433 - - -
Net Balance 8,007,378 - - -
Installments payable within one year 2,763,228 - - -
Installments payable after one year 5,244,150 - - -

RENUKA HOLDINGSANNUAL REPORT 2017 73
NOTE
23(
g) -
DETA
ILS O
F LO
NG TE
RM B
ORR
OW
ING
S
Finan
cial
In
stitu
tion
Faci
lity
Obt
aine
dIn
tere
st ra
teRe
paym
ent T
erm
sAs
sets
Pled
ged
Out
stand
ing
Bala
nce
(Rs)
31st
Mar
ch 2
017
31st
Mar
ch 2
016
Renu
ka A
gri F
oods
PLC
HNB
Med
ium
Term
Loa
n1
mon
th U
SD L
IBO
R +3
% (M
onth
ly R
evie
w)
Repa
yabl
e on
dem
and
N/A
- 1
59,1
59,0
00
Pack
ing
Cre
dit L
oan
4.25
% p
.aRe
paya
ble
on d
eman
dLo
dgm
ent o
f con
firm
ed o
rder
s 1
51,9
90,0
00
-
DFC
CBo
iler L
oan
AWPL
R +
6.5%
p.a
To b
e pa
id in
72
insta
llmen
ts w
ith a
gra
ce
perio
d of
24
mon
ths o
f Rs.2
67,3
63/-
star
ting
from
Jul
y 20
08
Prim
ary
mor
tgag
e ov
er le
aseh
old
right
s of a
n al
lote
d pl
ot o
f lan
d de
pict
ed o
n 28
lot n
o 28
, Ya
tada
wal
a
- 2
05,8
08
Nat
iona
l D
evel
opm
ent
Bank
Pack
ing
Cre
dit L
oan
5.9%
p.a
Repa
yabl
e on
dem
and
N/A
159
,584
,251
2
3,85
4,05
0
311
,574
,251
1
83,2
18,8
58
Shaw
Wal
lace
Cey
lon
Ltd
HNB
Lete
r of C
redi
ts1
mon
th m
oney
m
arke
t rat
eM
axim
um ro
ll ove
r ten
or-1
mon
thC
orpo
rate
gua
rant
ee g
iven
by
Renu
ka F
oods
PL
C to
the
valu
e of
Rs.
300
Mn.
377
,730
,000
2
69,0
00,0
00
Term
Loa
n 8
.5%
p.a
. W
ithin
5 y
ears
incl
udin
g gr
ace
perio
d of
2
year
s w.e
.f Ja
nuar
y 20
15N
/A 4
72,0
00,0
00
500
,000
,000
849
,730
,000
7
69,0
00,0
00
Renu
ka Te
as C
eylo
n (P
rivat
e) Lt
d
Nat
iona
l D
evel
opm
ent
Bank
Pack
ing
Cre
dit L
oan
5% p
.aPa
yabl
e w
ithin
per
iod
of 1
20 d
ays
a) P
rimar
y m
ortg
age
bond
ove
r Rs.2
2,50
0,00
0 8
4,42
4,88
9 2
5,57
9,42
3
b) A
gree
men
t to
mor
tgag
e ov
er st
ocks
and
book
deb
ts fo
r Rs.6
0,00
0,00
0
84,
424,
889
25,
579,
423
Kand
y Pl
anta
tions
Ltd
Nat
iona
l D
evel
opm
ent
Bank
Term
Loa
n8%
p.a
Ann
ual r
epay
men
ts co
mm
enci
ng fr
om
June
201
4N
/A 4
,178
,687
6
,141
,515
4,1
78,6
87
6,1
41,5
15
Renu
ka F
oods
PLC
HNB
Term
Loa
nAW
PLR
+1.5
% p
.aTo
be
paid
in 2
4 m
onth
sN
/A 4
5,00
0,00
0 3
0,00
0,00
0
45,
000,
000
30,
000,
000
NOTES TO FINANCIAL STATEMENTS (CONTD.)
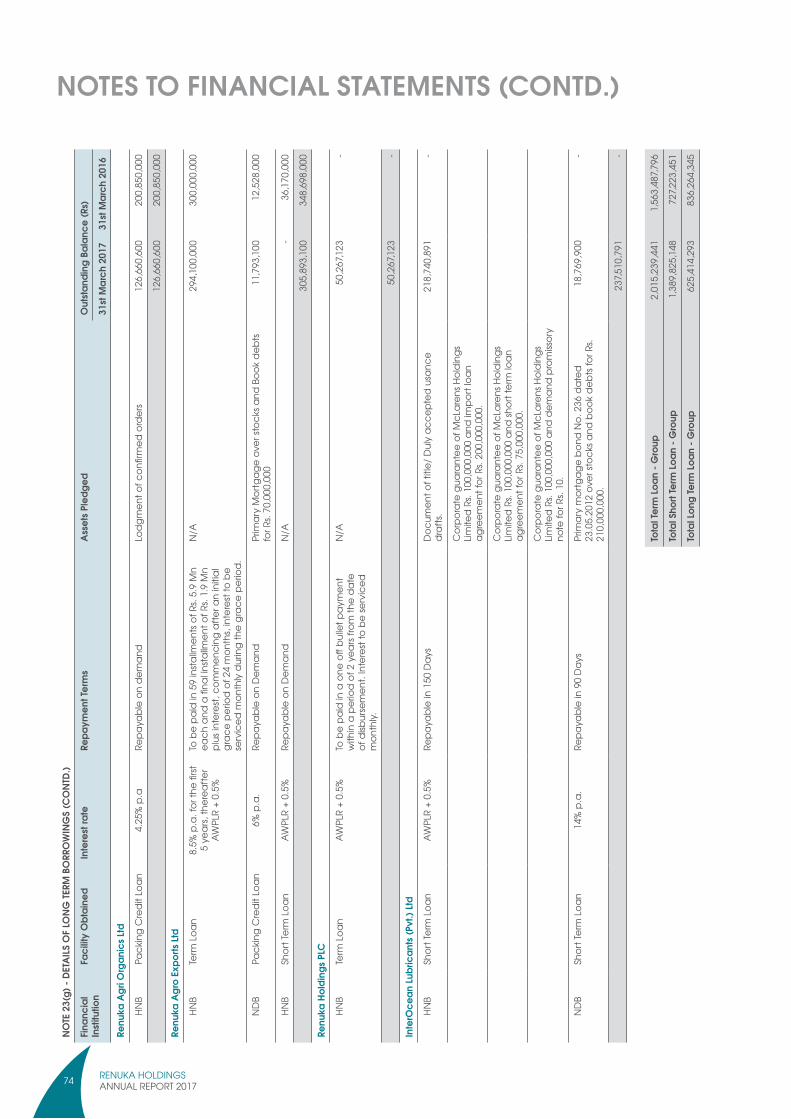
RENUKA HOLDINGSANNUAL REPORT 201774
NOTE
23(
g) -
DETA
ILS O
F LO
NG TE
RM B
ORR
OW
ING
S (C
ONT
D.)
Finan
cial
In
stitu
tion
Faci
lity
Obt
aine
dIn
tere
st ra
teRe
paym
ent T
erm
sAs
sets
Pled
ged
Out
stand
ing
Bala
nce
(Rs)
31st
Mar
ch 2
017
31st
Mar
ch 2
016
Renu
ka A
gri O
rgan
ics L
td
HNB
Pack
ing
Cre
dit L
oan
4.25
% p
.aRe
paya
ble
on d
eman
dLo
dgm
ent o
f con
firm
ed o
rder
s 1
26,6
60,6
00
200
,850
,000
126
,660
,600
2
00,8
50,0
00
Renu
ka A
gro
Expo
rts Lt
d
HNB
Term
Loa
n8.
5% p
.a. f
or th
e fir
st
5 ye
ars,
ther
eafte
r AW
PLR
+ 0.
5%
To b
e pa
id in
59
insta
llmen
ts of
Rs.
5.9
Mn
each
and
a fi
nal in
stallm
ent o
f Rs.
1.9
Mn
plus
inte
rest
, com
men
cing
afte
r an
initi
al
grac
e pe
riod
of 2
4 m
onth
s, in
tere
st to
be
serv
iced
mon
thly
dur
ing
the
grac
e pe
riod.
N/A
294
,100
,000
3
00,0
00,0
00
ND
BPa
ckin
g C
redi
t Loa
n6%
p.a
.Re
paya
ble
on D
eman
dPr
imar
y M
ortg
age
over
stoc
ks a
nd B
ook
debt
s fo
r Rs.
70,0
00,0
00 1
1,79
3,10
0 1
2,52
8,00
0
HNB
Shor
t Ter
m L
oan
AWPL
R +
0.5%
Repa
yabl
e on
Dem
and
N/A
- 3
6,17
0,00
0
305
,893
,100
3
48,6
98,0
00
Renu
ka H
oldi
ngs P
LC
HNB
Term
Loa
nAW
PLR
+ 0.
5%To
be
paid
in a
one
off
bulle
t pay
men
t w
ithin
a p
erio
d of
2 y
ears
from
the
date
of
disb
urse
men
t. In
tere
st to
be
serv
iced
m
onth
ly.
N/A
50,
267,1
23
-
50,
267,1
23
-
Inte
rOce
an Lu
bric
ants
(Pvt
.) Ltd
HNB
Shor
t Ter
m L
oan
AWPL
R +
0.5%
Repa
yabl
e in
150
Day
sD
ocum
ent o
f titl
e/ D
uly
acce
pted
usa
nce
draf
ts.21
8,74
0,89
1 -
Cor
pora
te g
uara
ntee
of M
cLar
ens H
oldi
ngs
Limite
d Rs
. 100
,000
,000
and
impo
rt lo
an
agre
emen
t for
Rs.
200,
000,
000.
Cor
pora
te g
uara
ntee
of M
cLar
ens H
oldi
ngs
Limite
d Rs
. 100
,000
,000
and
shor
t ter
m lo
an
agre
emen
t for
Rs.
75,0
00,0
00.
Cor
pora
te g
uara
ntee
of M
cLar
ens H
oldi
ngs
Limite
d Rs
. 100
,000
,000
and
dem
and
prom
issor
y no
te fo
r Rs.
10.
ND
BSh
ort T
erm
Loa
n14
% p
.a.
Repa
yabl
e in
90
Day
sPr
imar
y m
ortg
age
bond
No.
236
dat
ed
23.0
5.20
12 o
ver s
tock
s and
boo
k de
bts f
or R
s. 21
0,00
0,00
0.
18,7
69,9
00 -
237
,510
,791
-
Tota
l Ter
m Lo
an -
Gro
up 2
,015
,239
,441
1
,563
,487
,796
Tota
l Sho
rt Te
rm Lo
an -
Gro
up1,
389,
825,
148
727,2
23,4
51
Tota
l Lon
g Te
rm Lo
an -
Gro
up62
5,41
4,29
383
6,26
4,34
5
NOTES TO FINANCIAL STATEMENTS (CONTD.)

RENUKA HOLDINGSANNUAL REPORT 2017 75
NOTES TO FINANCIAL STATEMENTS (CONTD.)
NOTE 24 - RETIREMENT BENEFIT OBLIGATION Group Company
AS AT 31ST MARCH 2017 2016 2017 2016
Rs. Rs. Rs. Rs.
Movement in the Present Value of the Defined Benefit Obligation
Balance at the beginning of the year 73,750,328 53,345,079 - -
Adjustment due to Acquisition of Subsidiaries 7,309,192 - - -
Adjustment Due to Disposal of Subsidiaries (3,770,205) - - -
Current Service Cost 16,126,481 12,393,469 - -
Interest Cost 8,990,832 6,186,756 - -
Actuarial (gain) / loss (1,418,840) 7,774,361 - -
Benefit Paid (4,576,086) (5,949,338) - -
Balance at the end of the year 96,411,702 73,750,328 - -
24.1 NET BENEFIT EXPENSES CATAGORIZED UNDER PERSONAL EXPENSES
Provision made during the year
Current Service Cost 16,126,481 12,393,469 - -
Interest Cost 8,990,832 6,186,756 - -
25,117,313 18,580,225 - -
24.2 This obligation is not externally funded.
24.3 Gratuity liability is based on the actuarial valuation carried out by Messrs. Actuarial and Management Consultants (Private) Limited, Actuaries, on 31st March 2017. The principal assumptions used in the actuarial valuation are as follows:
Discount rate 11% 11%
Retirement Age 55 years 55 years
Future salary increase 12% 12%
In addition to the above, demographic assumptions such as mortality, withdrawal and disability, and retirement age were considered for the actuarial valuation. “A67/07 mortality table” issued by the Institute of Actuaries, London was used to estimate the gratuity liability of the Group.
Sensitivity Analysis
Values appearing in the Financial Statements are very sensitive to the changes in financial and non financial assumptions used. The sensitivity was carried out for both the salary escalation rate and discount rate. Simulations made for retirement benefit obligation show that an increase or decrease by 1% of salary escalation rate and discount rate has the following effect on the retirement benefit obligation.
Revised Defined Benefit Obligation
(Group)
Salary escalation Rate Discount Rate Rs.
One point increase As given in Report - 11% 99,583,485
One point decrease As given in Report - 11% 87,368,017
As given in Report - 12% One point increase 87,720,333
As given in Report - 12% One point decrease 99,303,139
NOTE 25 - TRADE & OTHER PAYABLESTrade Creditors 485,662,513 436,060,902 - -
Accrued Expenses & Other Payables 144,635,332 182,891,285 2,275,632 2,062,847
630,297,845 618,952,187 2,275,632 2,062,847
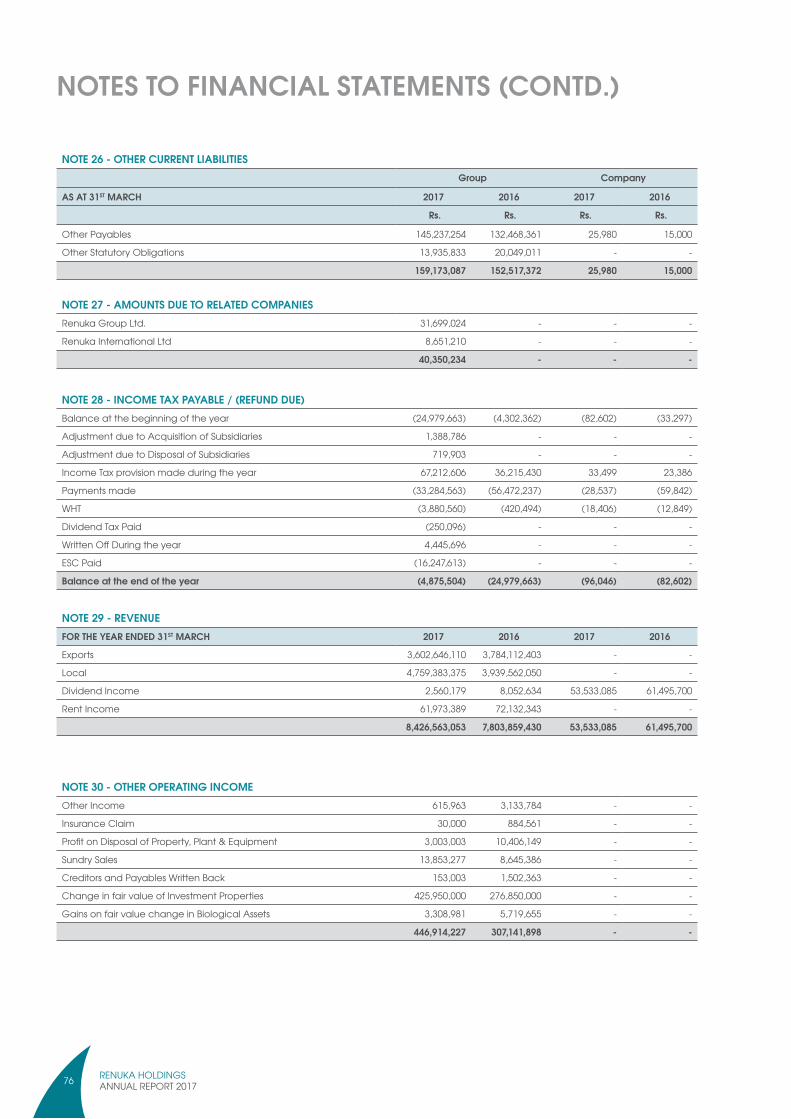
RENUKA HOLDINGSANNUAL REPORT 201776
NOTES TO FINANCIAL STATEMENTS (CONTD.)
NOTE 29 - REVENUEFOR THE YEAR ENDED 31ST MARCH 2017 2016 2017 2016
Exports 3,602,646,110 3,784,112,403 - -
Local 4,759,383,375 3,939,562,050 - -
Dividend Income 2,560,179 8,052,634 53,533,085 61,495,700
Rent Income 61,973,389 72,132,343 - -
8,426,563,053 7,803,859,430 53,533,085 61,495,700
NOTE 30 - OTHER OPERATING INCOMEOther Income 615,963 3,133,784 - -
Insurance Claim 30,000 884,561 - -
Profit on Disposal of Property, Plant & Equipment 3,003,003 10,406,149 - -
Sundry Sales 13,853,277 8,645,386 - -
Creditors and Payables Written Back 153,003 1,502,363 - -
Change in fair value of Investment Properties 425,950,000 276,850,000 - -
Gains on fair value change in Biological Assets 3,308,981 5,719,655 - -
446,914,227 307,141,898 - -
NOTE 28 - INCOME TAX PAYABLE / (REFUND DUE)Balance at the beginning of the year (24,979,663) (4,302,362) (82,602) (33,297)
Adjustment due to Acquisition of Subsidiaries 1,388,786 - - -
Adjustment due to Disposal of Subsidiaries 719,903 - - -
Income Tax provision made during the year 67,212,606 36,215,430 33,499 23,386
Payments made (33,284,563) (56,472,237) (28,537) (59,842)
WHT (3,880,560) (420,494) (18,406) (12,849)
Dividend Tax Paid (250,096) - - -
Written Off During the year 4,445,696 - - -
ESC Paid (16,247,613) - - -
Balance at the end of the year (4,875,504) (24,979,663) (96,046) (82,602)
NOTE 27 - AMOUNTS DUE TO RELATED COMPANIESRenuka Group Ltd. 31,699,024 - - -
Renuka International Ltd 8,651,210 - - -
40,350,234 - - -
NOTE 26 - OTHER CURRENT LIABILITIES Group Company
AS AT 31ST MARCH 2017 2016 2017 2016
Rs. Rs. Rs. Rs.
Other Payables 145,237,254 132,468,361 25,980 15,000
Other Statutory Obligations 13,935,833 20,049,011 - -
159,173,087 152,517,372 25,980 15,000

RENUKA HOLDINGSANNUAL REPORT 2017 77
NOTE 31 - FINANCE INCOME Group Company
FOR THE YEAR ENDED 31ST MARCH 2017 2016 2017 2016 Rs. Rs. Rs. Rs.
Interest Income on • Call Deposits 9,293,769 2,402,165 184,059 128,493 • Foreign Currency Account 1,429,071 2,518,918 - - • Fixed Deposits 44,215,418 9,098,874 - - • Repo 1,973,677 - - - • Unit Trust 111,252,760 96,528,435 - 40,566,629 • Savings 714,000 2,445,155 - - • Term Deposit 496,659 486,696 - - • Others 1,330,967 - - -
170,706,321 113,480,243 184,059 40,695,122
NOTES TO FINANCIAL STATEMENTS (CONTD.)
NOTE 32 - FINANCE COSTInterest on Loans & Bank Overdraft 160,652,343 93,174,500 276,960 5,103
Lease Interest 430,408 2,559 - -
Others 2,678,689 11,612,393 - -
163,761,440 104,789,452 276,960 5,103
NOTE 33 - OTHER FINANCIAL ITEMSExchange Gain / (Loss) (1,899,242) 37,013,623 - -
(1,899,242) 37,013,623 - -
NOTE 34 - PROFIT BEFORE TAXATIONis stated after charging all expenses including the following :
Directors Remuneration and fees 36,765,670 38,515,000 245,000 245,000
Auditors Remuneration - Note 34 (a) 4,744,284 5,269,613 290,400 264,000
Depreciation on Property, Plant & Equipment 229,799,000 195,003,086 - -
Donation 119,339 67,000 - -
Staff Cost
Defined Benefit Plan 25,117,313 18,580,225 - -
Other Staff Cost (Including EPF & ETF) 524,078,693 583,022,205 - -
Amortisation of Intangible assets 2,818,963 5,686,894 - -
Amortisation of Right to use Land 6,325,532 6,332,426 - -
Trade license written off 12,375,000 - - -
Impairment of Property, Plant and Equipment 10,274,825 - - -
VAT Receivable written off 4,500,000 - - -
Income Tax refund due written off 4,445,696 - - -
Loss from change in market value of Current Investment 1,305,432 - - -
NOTE 34(a) - AUDITOR'S REMUNERATION
Fees payable to Kreston MNS & Co.
for the audit of annual accounts of Renuka Holdings PLC 290,400 264,000 290,400 264,000
Fees payable to Kreston MNS & Co.
for the audit of subsidiaries of Renuka Holdings PLC 1,366,300 1,091,420 - -
Fees payable to Other auditors
for the audit of subsidiaries of Renuka Holdings PLC 3,087,584 3,914,193 - -
4,744,284 5,269,613 290,400 264,000

RENUKA HOLDINGSANNUAL REPORT 201778
NOTES TO FINANCIAL STATEMENTS (CONTD.)
NOTE 35 - TAXATION Group Company
FOR THE YEAR ENDED 31ST MARCH 2017 2016 2017 2016
Rs. Rs. Rs. Rs.
Current year Income Tax 67,212,606 36,215,430 33,499 23,386
Tax Charge on Associate and Joint ventures 10,123,888 8,058,400 - -
Tax effect on Group Dividend 6,284,868 4,857,617 - -
Transferred to / (from) Deferred Taxation 5,623,250 36,908,480 - -
Tax on deemed interest Income (2012/13 & 2013/14) 769,697 9,616,363 - -
90,014,309 95,656,290 33,499 23,386
NOTE 35.1 - RECONCILIATION BETWEEN TAXABLE PROFIT AND THE ACCOUNTING PROFIT
Profit before Taxation 1,142,004,580 1,000,707,597 46,162,310 94,939,127
Aggregate Disallowed Items 379,793,767 151,303,614 - -
Aggregate Allowed Items (395,341,131) (504,745,855) - (61,624,197)
Other Source of Income (113,988,617) - 184,059 -
Tax Exempt Income (504,077,643) (191,340,091) (53,533,085) (40,566,629)
508,390,956 455,925,265 (7,186,716) (7,251,699)
Tax loss Adjustment 125,638,471 (1,812,447) 7,306,354 7,335,222
Taxable Income 634,029,427 454,112,819 119,638 83,523
Income Tax @ 28% 43,756,086 8,613,973 33,499 23,386
Income Tax @ 20% 5,134,429 - - -
Income Tax @ 12% 11,128,518 22,125,276 - -
Income Tax @ 10% 36,046,734 5,227,403 - -
Tax Reductions (24,809,935) - - -
(Over) / under provision in the previous year (4,043,226) 248,778 - -
Current Income Tax 67,212,606 36,215,430 33,499 23,386

RENUKA HOLDINGSANNUAL REPORT 2017 79
NOTES TO FINANCIAL STATEMENTS (CONTD.)
NOTE 37 - DIVIDEND PER SHARE1. The final dividend of Rs. 0.35 per share for the financial year ended 31st March 2016 was paid on 30th September 2016
2. The Final Dividend of Rs. 0.35 per share for the financial year ended 31st March 2015 was paid on 30th September 2015
NOTE 36 - EARNINGS PER SHARE Group Company
FOR THE YEAR ENDED 31ST MARCH 2017 2016 2017 2016
Rs. Rs. Rs. Rs.
Basic Earnings Per Share
36.1 Basic Earnings per Share is calculated by dividing the Profit for the year attributable to ordinary shareholders by the weighted average number of ordinary Shares outstanding during the year.
36.2 The following reflect the Income and Share data used in the basic Earnings per Share computation.
Amount used as the Numerator
Profit Attributable to equity holders
of the Company for basic Earnings per share 669,600,284 430,518,375 46,128,811 94,915,741
Number of Ordinary Shares used as Denominator
Weighted Average number of Ordinary Shares
in issue applicable to basic Earnings per Share 101,891,456 101,891,456 101,891,456 101,891,456
Basic Earnings per Share 6.57 4.23 0.45 0.93
36.3 Diluted Earnings Per Share
Amount used as the Numerator
Profit / (Loss) Attributable to equity holders
of the Company for basic Earnings per share 669,600,284 430,518,375 46,128,811 94,915,741
Number of Ordinary Shares used as Denominator
Weighted Average number of Ordinary Shares
in issue applicable to basic Earnings per Share 101,891,456 101,891,456 101,891,456 101,891,456
Diluted Earnings per Share 6.57 4.23 0.45 0.93
Diluted earnings per share is calculated by dividing the net profit for the year attributable to ordinary shareholders by the number of ordinary shares outstanding during the year after adjustment for the effects of all dilutive potential ordinary shares. As at 31st March 2017 & as at 31st March 2016 there were no dilutive potential ordinary shares. Hence, diluted earnings per share is same as basic earnings per share.

RENUKA HOLDINGSANNUAL REPORT 201780
NOTES TO FINANCIAL STATEMENTS (CONTD.)
NOTE 38 - CHANGES IN SUBSIDIARIES (a) Acquisition of Subsidiaries Renuka Capital PLC
(Formerly Kalamazoo Systems PLC)
Interocean Lubricant (Pvt) Ltd
Mayfair Foods (Pvt) Ltd
Total
AssetsProperty,Plant & Equipment 2,454,079 12,178,776 18,750,000 33,382,855 Intangible Assets - 15,000,000 15,000,000 Deferred Tax Assets 6,016,731 371,932 - 6,388,663 Inventories - 156,202,993 - 156,202,993 Trade and Other Receivables 8,899,959 130,690,960 - 139,590,919 Due From Related Companies 7,602,866 - - 7,602,866 Income Tax Refund 4,970,916 - - 4,970,916 Cash & Cash Equivalents 4,150,155 1,603,641 550 5,754,346 Other Financial Assets 5,087,281 - - 5,087,281
39,181,987 301,048,302 33,750,550 373,980,839
LiabilitiesRetirement Benefit Obligation 4,625,846 2,683,346 - 7,309,192 Borrowings - 224,606,560 - 224,606,560 Trade & Other Payables 13,184,690 37,802,309 20,000 51,006,999 Income Tax Payable - 6,359,702 - 6,359,702 Amount Due to Related Companies 1,064,682 - 12,160 1,076,842 Bank Over Draft 1,809,852 11,152,087 - 12,961,939
20,685,070 282,604,004 32,160 303,321,234
Net Identifiable Assets 18,496,917 18,444,298 33,718,390 70,659,605 Non Controlling Interest (5,558,045) (8,678,266) (3,836,851) (18,073,162)Net identifiable Assets Acquired 12,938,872 9,766,032 29,881,539 52,586,443 Net Assets Transferred from Investment in Associate - (4,633,954) - (4,633,954)Goodwill Acquired 37,579,244 46,842,922 3,868,461 88,290,627 Consideration paid for Acquisition 50,518,116 51,975,000 33,750,000 136,243,117
The effect of acquisition on Cash flowConsideration settled in cash (50,518,116) (51,975,000) (33,750,000) (136,243,116)Less : Cash and Cash Equivalents of Subsidiary - Acquired 2,340,303 (9,548,446) 550 (7,207,593)Net Cash flow on Acquisition (48,177,813) (61,523,446) (33,749,450) (143,450,709)
(b) Disposal of SubsidiariesKalamazoo Industries (Pvt) Ltd
Renuka Investment
LtdTotal
AssetsProperty,Plant and Equipment 1,432,706 - 1,432,706 Investment in shares - 2,477,388 2,477,388 Deferred Tax Assets 2,828,945 - 2,828,945 Trade and Other Receivables 7,439,695 496,892 7,936,587 Due from Related Companies 1,966,163 560,000 2,526,163 Other Financial Assets 5,543,211 - 5,543,211 Other Investments 216,085,900 216,085,900 Income Tax Refund 687,917 31,986 719,903 Short Term investment - 168,974 168,974 Cash At Bank & In Hand 148,180 - 148,180
20,046,817 219,821,140 239,867,957 LiabilitiesRetirement Benefit Obligation 3,770,205 - 3,770,205 Trade and Other Payables 2,029,664 - 2,029,664 Other Current Liabilities - 21,500 21,500 Due to Related Companies 2,304,719 - 2,304,719 Bank Over Draft 1,985,210 490,131 2,475,341
10,089,798 511,631 10,601,429 Net Identifiable Assets 9,957,019 219,309,509 229,266,528

RENUKA HOLDINGSANNUAL REPORT 2017 81
NOTES TO FINANCIAL STATEMENTS (CONTD.)
NOTE 38 - CHANGES IN SUBSIDIARIES (CONTD.)(b) Disposal of Subsidiary (Contd.) Kalamazoo
Industries (Pvt) Ltd
Renuka Investment
Ltd
Total
Less: Non Controlling Interest (2,992,183) (195,818,088) (198,810,271)Net identifiable Assets Disposed 6,964,835 23,491,421 30,456,256Consideration Received from Disposal (9,200,000) (7,250,000) (16,450,000)Disposal (Gain) or Loss (2,235,165) 16,241,421 14,006,256
The effect of acquisition on Cash flowConsideration received in cash (9,200,000) (7,250,000) (16,450,000)Less : Cash and Cash Equivalents of Subsidiary - Disposed (1,837,030) (321,157) (2,158,187)Net Cash flow on Disposed (11,037,030) (7,571,157) (18,608,187)
NOTE 39 - CHANGES IN JOINT VENTURE AND ASSOCIATESNOTE 39(a) - SHARE OF PROFIT OF EQUITY ACCOUNTED INVESTEEThe Revenue, Profit before tax and the Group's share of profit before tax of the Associate and the Joint Venture are given below.FOR THE YEAR ENDED 31ST MARCH 2017 2016
Rs. Rs.McShaw Automotive Ltd - Joint VentureRevenue 1,532,095,018 1,483,053,515 Profit before tax 57,030,273 34,336,619 Group's share of profit before tax 28,515,137 17,168,310 (-) Tax on Joint venture results (10,123,888) (5,792,839)Group share of profit after tax 18,391,249 11,375,471
Inter Ocean Lubricants (Pvt) Ltd - AssociateRevenue - 584,620,883 Profit before tax - 31,718,520 Group's share of profit before tax - 7,828,131 (-) Tax on Associate results - (2,265,561)Group share of profit after tax - 5,562,570
Renuka Villas (Pvt) Ltd - AssociateRevenue - - Loss before tax - (564)Group share of loss after tax - (564)Total Share of profit before tax 28,515,137 24,995,877
NOTE 39(b) - SUMMARIZED FINANCIAL INFORMATION OF JOINT VENTURE AND ASSOCIATESAS AT 31ST MARCH 2017 2016McShaw Automotive Ltd - Joint Venture Rs. Rs.Current Assets 712,215,565 639,792,113 Non Current Assets 45,087,591 36,218,842
757,303,156 676,010,955 Current Liabilities 669,761,907 576,987,265 Non Current Liabilities 7,006,070 6,243,137
676,767,977 583,230,402 Inter Ocean Lubricants (Pvt) Ltd - AssociateCurrent Assets - 288,497,594 Non Current Assets - 12,550,708
- 301,048,302 Current Liabilities - 277,318,008 Non Current Liabilities - 5,413,440
- 282,731,448

RENUKA HOLDINGSANNUAL REPORT 201782
NOTES TO FINANCIAL STATEMENTS (CONTD.)
NOTE 41 - LITIGATIONS AGAINST THE GROUPThere were no material litigation that require disclosure in the Financial Statements as at the Financial Reporting date other than the following:- Group Kandy Plantations Limited Land Reform Commission has filed a case in the District Court of Attanagalla against the Trustees of John Leo De Cross Trust for which Kandy Plantations Limited is a defendant. In the opinion of the Company’s Lawyers, there is a strong likelihood of the outcome of this case being awarded in favour of the Trustees The John Leo De Croos Trust.
Company There were no material litigations that require adjustment to or disclosed in the Financial Statements as at the Financial Reporting date.
NOTE 42 - CAPITAL COMMITMENTSThere were no material commitments that require disclosure in the Financial Statements as at the Financial Reporting date.
NOTE 43 - CONTINGENT LIABILITIES OF SUBSIDIARIES AND ASSOCIATES(a) Company
There were no contingent liabilities as at the reporting date that require adjustment to or disclosure in the Financial Statements. (b) Contingent Liabilities of Subsidiaries
There are no contingent liabilities which would require adjustments to or disclosure in the Financial Statements. (c) Contingent Liabilities of Associate and Joint Venture
There are no contingent liabilities which would require adjustments to or disclosure in the Financial Statements.
NOTE 44 - DIRECTORS' RESPONSIBILITY STATEMENTThe Directors are responsible for the preparation of the Financial Statements of the Company in accordance with the Sri Lanka Accounting Standards and also for the provision of information as required by the Companies Act No. 07 of 2007. The Directors are accordingly satisfied that the Financial Statements presented herein give a true and fair view of the state of affairs of the Company as at 31st March 2017 and the Profit for the year then ended.
NOTE 45 - GOING CONCERN OF SUBSIDIARIESThe Board of Directors are of the view that all subsidiaries in the group have ability to continue on a going concern and satisfied that they have the resources to continue in business for the foreseeable future.
NOTE 40 - EVENTS OCCURRING AFTER THE REPORTING DATEThe name of one of the subsidiary Company Kalamazoo System PLC was changed from to Renuka Capital PLC on 14th June 2017.
Renuka Capital PLC (Formerly Kalamazoo Systems PLC), one of the subsidiaries has increased its Stated Capital by Rs. 877,752,200 (1,687,985 Shares) by way of a Rights Issue in 28th June 2017.
There were no other material events occurring after the reporting date that require adjustment to or disclosure in the Financial Statements.
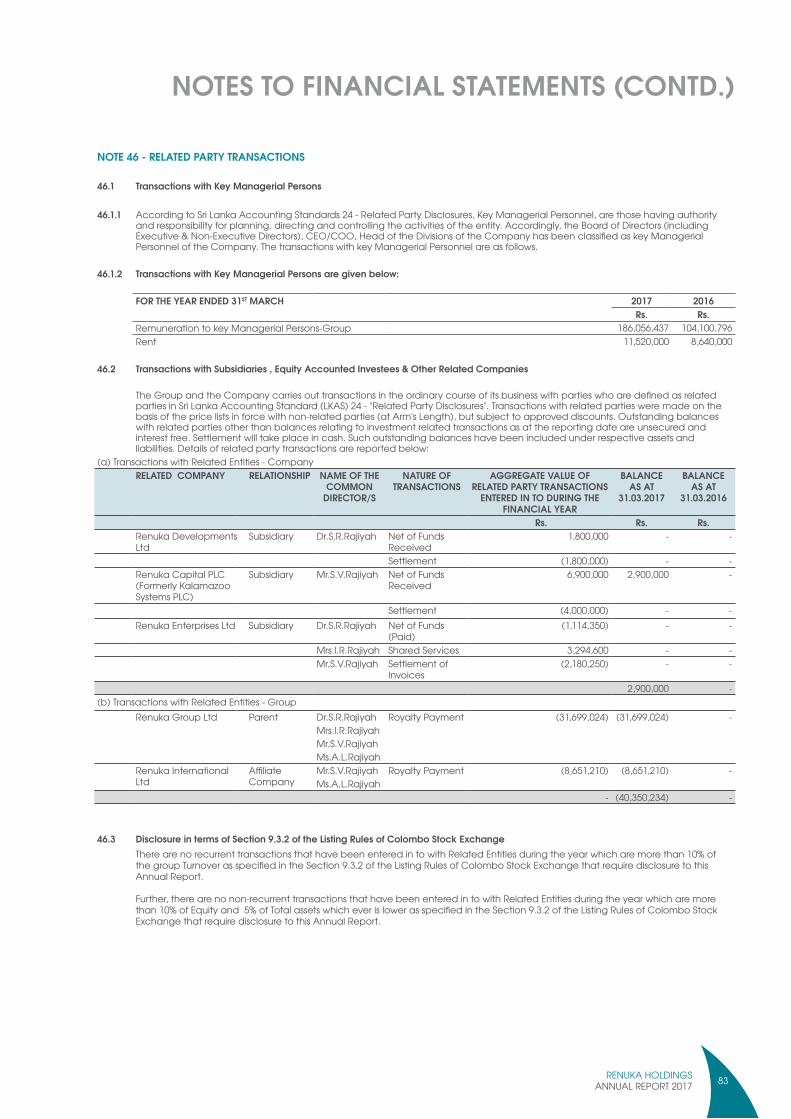
RENUKA HOLDINGSANNUAL REPORT 2017 83
NOTE 46 - RELATED PARTY TRANSACTIONS
46.1 Transactions with Key Managerial Persons
46.1.1 According to Sri Lanka Accounting Standards 24 - Related Party Disclosures, Key Managerial Personnel, are those having authority and responsibility for planning, directing and controlling the activities of the entity. Accordingly, the Board of Directors (including Executive & Non-Executive Directors), CEO/COO, Head of the Divisions of the Company has been classified as key Managerial Personnel of the Company. The transactions with key Managerial Personnel are as follows.
46.1.2 Transactions with Key Managerial Persons are given below:
FOR THE YEAR ENDED 31ST MARCH 2017 2016Rs. Rs.
Remuneration to key Managerial Persons-Group 186,056,437 104,100,796 Rent 11,520,000 8,640,000
46.2 Transactions with Subsidiaries , Equity Accounted Investees & Other Related Companies
The Group and the Company carries out transactions in the ordinary course of its business with parties who are defined as related parties in Sri Lanka Accounting Standard (LKAS) 24 - "Related Party Disclosures". Transactions with related parties were made on the basis of the price lists in force with non-related parties (at Arm's Length), but subject to approved discounts. Outstanding balances with related parties other than balances relating to investment related transactions as at the reporting date are unsecured and interest free. Settlement will take place in cash. Such outstanding balances have been included under respective assets and liabilities. Details of related party transactions are reported below:
(a) Transactions with Related Entities - CompanyRELATED COMPANY RELATIONSHIP NAME OF THE
COMMON DIRECTOR/S
NATURE OF TRANSACTIONS
AGGREGATE VALUE OF RELATED PARTY TRANSACTIONS
ENTERED IN TO DURING THE FINANCIAL YEAR
BALANCE AS AT
31.03.2017
BALANCE AS AT
31.03.2016
Rs. Rs. Rs.Renuka Developments Ltd
Subsidiary Dr.S.R.Rajiyah Net of Funds Received
1,800,000 - -
Settlement (1,800,000) - -Renuka Capital PLC (Formerly Kalamazoo Systems PLC)
Subsidiary Mr.S.V.Rajiyah Net of Funds Received
6,900,000 2,900,000 -
Settlement (4,000,000) - -Renuka Enterprises Ltd Subsidiary Dr.S.R.Rajiyah Net of Funds
(Paid)(1,114,350) - -
Mrs.I.R.Rajiyah Shared Services 3,294,600 - -Mr.S.V.Rajiyah Settlement of
Invoices(2,180,250) - -
2,900,000 -(b) Transactions with Related Entities - Group
Renuka Group Ltd Parent Dr.S.R.RajiyahMrs.I.R.RajiyahMr.S.V.RajiyahMs.A.L.Rajiyah
Royalty Payment (31,699,024) (31,699,024) -
Renuka International Ltd
AffiliateCompany
Mr.S.V.RajiyahMs.A.L.Rajiyah
Royalty Payment (8,651,210) (8,651,210) -
- (40,350,234) -
46.3 Disclosure in terms of Section 9.3.2 of the Listing Rules of Colombo Stock ExchangeThere are no recurrent transactions that have been entered in to with Related Entities during the year which are more than 10% of the group Turnover as specified in the Section 9.3.2 of the Listing Rules of Colombo Stock Exchange that require disclosure to this Annual Report. Further, there are no non-recurrent transactions that have been entered in to with Related Entities during the year which are more than 10% of Equity and 5% of Total assets which ever is lower as specified in the Section 9.3.2 of the Listing Rules of Colombo Stock Exchange that require disclosure to this Annual Report.
NOTES TO FINANCIAL STATEMENTS (CONTD.)

RENUKA HOLDINGSANNUAL REPORT 201784
NOTE
47
- Dire
ctor
s of G
roup
Com
pani
esDi
rect
ors o
f Gro
up C
ompa
nies
RHRFD
RAF
RTCL
ROL
KPL
BBLCF
LCB
LRA
ELRA
OLRD
LREL
RSTL
GFP
COCO
RCF
RLDL
SWCL
SWPL
MAL
ILPL
RBH
MFL
RC
Mrs.
I.R.R
ajiya
h (C
hairp
erso
n)√
√√
√√
√√
√√
√√
√√
√√
√√
√√
√-
-√
--
Dr.S
.R.R
ajiya
h√
√√
√√
√√
√√
√√
√√
√√
√√
√√
√-
-√
--
Mr.S
.V.R
ajiya
h√
√√
√√
√√
√√
√√
√√
√√
√√
√√
√√
√√
√√
Mr.L
.M.A
beyw
ickr
ama
√√
√-
--
--
--
--
--
--
√-
--
--
--
-
Mr.S
.Vas
anth
akum
ara
-√
√√
√√
-√
--
√-
--
√√
√√
√√
--
--
-
Mr.T
.K.B
anda
rana
yake
√√
--
--
--
--
--
--
--
--
--
--
--
-
Mr.M
.S.D
omin
ic√
√-
--
--
--
--
--
-√
--
--
--
--
-√
Ms.A
.L.R
ajiya
h√
√√
--
--
--
-√
--
--
--
√-
--
--
--
Mr.C
.J.d
e Sil
va A
mar
atun
ge√
--
--
√-
--
√-
√-
-√
-√
√√
√-
--
--
Mr.J
.M.S
wam
inat
han
√-
--
--
--
--
--
--
--
--
--
--
--
-
Dr.J
.A.S
.Fel
ix-
√-
--
--
--
--
--
--
--
--
--
--
--
Mr.S
.Nag
araj
ah-
-√
--
--
--
--
--
--
--
--
--
--
--
Mr.M
.Terfl
oth
--
√-
--
--
--
--
--
--
--
--
--
--
-
Mr.T
.G.H
ockle
y-
--
--
--
√-
--
--
--
--
--
--
--
--
Mr.P
.Gun
athi
lake
--
--
--
--
--
-√
√-
√-
--
--
√√
-√
√
Mrs.
S.R.
Nirm
alal
inga
m-
--
--
--
--
--
--
--
--
--
--
--
--
Mr.D
.J.N
irmal
alin
gam
--
--
--
--
--
--
--
--
--
--
--
--
-
Mrs.
S.S.
W.S
enan
ayak
e-
--
--
--
--
--
-√
--
--
--
--
--
--
Mr.A
.U.K
odag
oda
-√
--
--
--
--
--
--
--
--
√-
--
--
-
Mrs.
J.J.
B.A
.Raj
iyah
--
--
--
--
--
-√
--
√-
--
--
√-
--
-
Mr.R
.N.R
ajap
aksh
e-
--
--
√-
--
--
--
--
--
--
--
--
--
Ms.A
.S.P
atel
--
--
--
--
--
--
--
--
--
√-
--
--
-
Mr R
F N
Jay
asoo
riya
--
--
--
--
--
--
--
--
-√
--
--
-√
-
Mr E
Dei
vana
yaga
m-
--
--
--
--
--
--
--
--
--
--
--
√-
Mr.S
.N.A
lles
--
--
--
--
--
--
--
--
--
--
--
--
√
Mr.D
.S.A
rang
ala
--
√-
--
--
--
--
--
--
--
--
--
--
-
Mr.K
.Liya
naga
mag
e-
-√
--
--
--
--
--
--
--
--
--
--
--
RHRe
nuka
Hol
ding
s PLC
BBL
Bois
Bros
. & C
o. (P
vt) L
tdRE
LRe
nuka
Ent
erpr
ises (
Pvt)
Ltd
SWCL
Shaw
Wal
lace
Cey
lon
Ltd
RFD
Renu
ka F
oods
PLC
CFL
Cey
lon
Fore
stry
(Pvt
) Ltd
RSTL
Renu
ka S
hipp
ing
& Tr
avel
s (Pv
t) Lt
dSW
PLSh
aw W
alla
ce P
rope
rties
Ltd
RAF
Renu
ka A
gri F
oods
PLC
CBL
Cey
lon
Bota
nica
ls (P
vt) L
tdGF
PG
alle
Fac
e Pr
oper
ties L
tdMA
LM
csha
w A
utoM
otiv
e Lt
dRTC
LRe
nuka
Teas
Cey
lon
(Pvt
) Ltd
RAEL
Renu
ka A
gro
Expo
rts L
tdCO
COC
oco
Lank
a (P
vt) L
tdILP
LIn
ter O
cean
Lubr
ican
ts (P
vt) L
tdRO
LRe
nuka
Org
anic
s (Pv
t) Lt
dRA
OLRe
nuka
Agr
i Org
anic
s Ltd
RCF
Renu
ka C
onsu
mer
Foo
ds L
tdRB
HRe
nuka
Bea
ch H
otel
s Ltd
KPL
Kand
y Pl
anta
tions
Ltd
RDL
Renu
ka D
evel
opm
ents
Ltd
RLDL
Rich
life D
airie
s Ltd
MFL
May
fair
Food
s (Pv
t) Lt
dRC
Renu
ka C
apita
l PLC
NOTES TO FINANCIAL STATEMENTS (CONTD.)
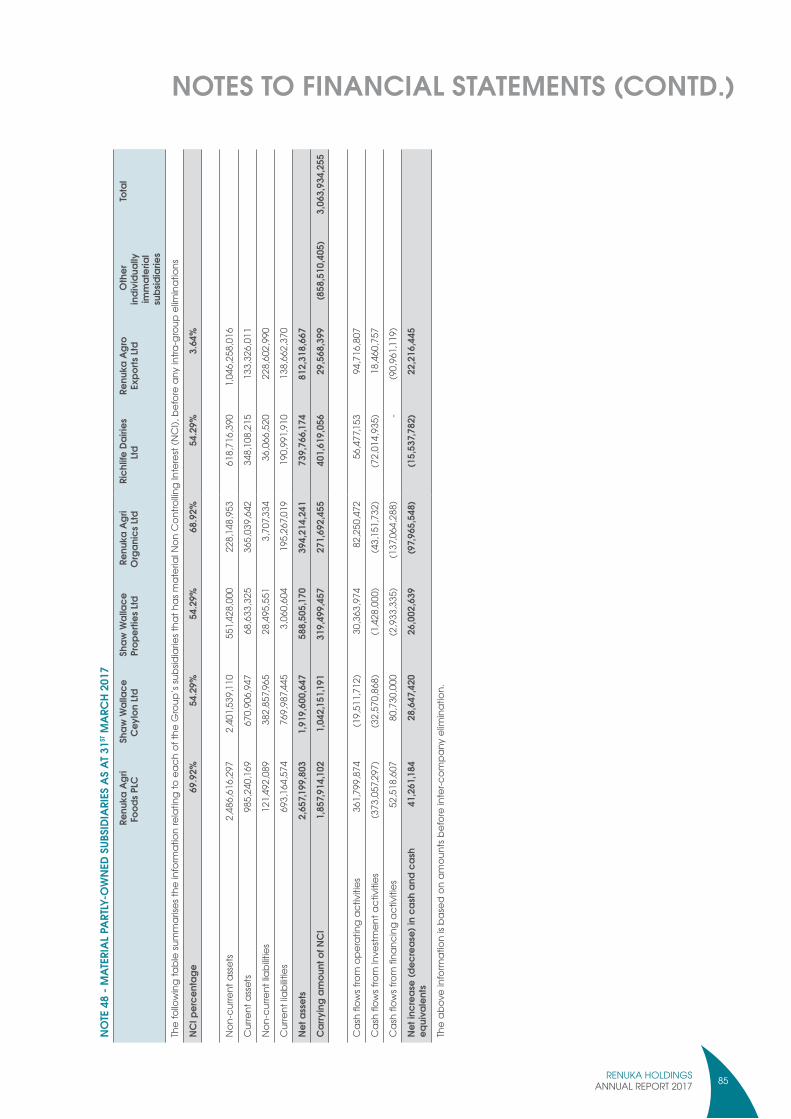
RENUKA HOLDINGSANNUAL REPORT 2017 85
NOTE
48
- MAT
ERIA
L PAR
TLY-
OW
NED
SUBS
IDIA
RIES
AS
AT 3
1ST M
ARC
H 20
17 R
enuk
a Ag
ri Fo
ods P
LC
Sha
w W
alla
ce
Cey
lon
Ltd
Sha
w W
alla
ce
Prop
ertie
s Ltd
R
enuk
a Ag
ri O
rgan
ics L
td
Ric
hlife
Dai
ries
Ltd
Renu
ka A
gro
Expo
rts Lt
d O
ther
in
divi
dual
ly
imm
ater
ial
subs
idia
ries
Tota
l
The
follo
win
g ta
ble
sum
mar
ises t
he in
form
atio
n re
latin
g to
eac
h of
the
Gro
up’s
subs
idia
ries t
hat h
as m
ater
ial N
on C
ontro
lling
Inte
rest
(NC
I), b
efor
e an
y in
tra-g
roup
elim
inat
ions
NCI p
erce
ntag
e69
.92%
54.2
9%54
.29%
68.9
2%54
.29%
3.64
%
Non
-cur
rent
ass
ets
2,4
86,6
16,2
97
2,4
01,5
39,1
10
551
,428
,000
2
28,1
48,9
53
618
,716
,390
1
,046
,258
,016
Cur
rent
ass
ets
985
,240
,169
6
70,9
06,9
47
68,
633,
325
365
,039
,642
3
48,1
08,2
15
133
,326
,011
Non
-cur
rent
liabi
litie
s 1
21,4
92,0
89
382
,857
,965
2
8,49
5,55
1 3
,707
,334
3
6,06
6,52
0 2
28,6
02,9
90
Cur
rent
liabi
litie
s 6
93,1
64,5
74
769
,987
,445
3
,060
,604
1
95,2
67,0
19
190
,991
,910
1
38,6
62,3
70
Net a
sset
s 2
,657
,199
,803
1
,919
,600
,647
5
88,5
05,1
70
394
,214
,241
7
39,7
66,1
74
812
,318
,667
Car
ryin
g am
ount
of N
CI
1,8
57,9
14,1
02
1,0
42,1
51,1
91
319
,499
,457
2
71,6
92,4
55
401
,619
,056
2
9,56
8,39
9 (8
58,5
10,4
05)
3,06
3,93
4,25
5
Cas
h flo
ws f
rom
ope
ratin
g ac
tiviti
es36
1,79
9,87
4 (1
9,51
1,71
2) 3
0,36
3,97
4 8
2,25
0,47
2 5
6,47
7,153
9
4,71
6,80
7
Cas
h flo
ws f
rom
Inve
stm
ent a
ctiv
ities
(373
,057
,297
) (3
2,57
0,86
8) (1
,428
,000
) (4
3,15
1,73
2) (7
2,01
4,93
5) 1
8,46
0,75
7
Cas
h flo
ws f
rom
fina
ncin
g ac
tiviti
es52
,518
,607
80,
730,
000
(2,9
33,3
35)
(137
,064
,288
) -
(90,
961,1
19)
Net i
ncre
ase
(dec
reas
e) in
cas
h an
d ca
sh
equi
vale
nts
41,2
61,1
84 2
8,64
7,420
2
6,00
2,63
9 (9
7,965
,548
) (1
5,53
7,782
) 2
2,21
6,44
5
The
abov
e in
form
atio
n is
base
d on
am
ount
s bef
ore
inte
r-com
pany
elim
inat
ion.
NOTES TO FINANCIAL STATEMENTS (CONTD.)

RENUKA HOLDINGSANNUAL REPORT 201786
NOTE 49 - FAIR VALUE HIERARCHYNon financial assets - Group
Level 1 - Quoted (unadjusted) Market prices in active markets for identical assets or liabilities
Level 2 - Valuation techniques for which the lowest level input that is significant to the fair value measurement is directly or indirectly observable
Level 3 - Valuation techniques for which the lowest level input that is significant to the fair value measurement is unobservable
Level 1 Level 2 Level 3
AS AT 31ST MARCH 2017 2016 2017 2016 2017 2016
Asset measured at Fair value
Land & Buildings - - 2,670,071,808 2,558,143,481
Building on Lease hold Land - - 232,281,657 233,613,500
Investment Property - - 1,703,800,000 1,277,850,000
In determining the fair value, highest and best use of the property including the current condition of the properties, future usability and associated redevelopment requirements have been considered. Also, the values have made reference to market evidence of transaction prices for similar properties, with appropriate adjustments for size and location. The appraised fair values are rounded within the range of values.
Non financial assets - Company
Level 1 - Quoted (unadjusted) Market prices in active markets for identical assets or liabilities
Level 2 - Valuation techniques for which the lowest level input that is significant to the fair value measurement is directly or indirectly observable
Level 3 - Valuation techniques for which the lowest level input that is significant to the fair value measurement is unobservable
Level 1 Level 2 Level 3
AS AT 31ST MARCH 2017 2016 2017 2016 2017 2016
Asset measured at Fair value - - - - - -
NOTES TO FINANCIAL STATEMENTS (CONTD.)
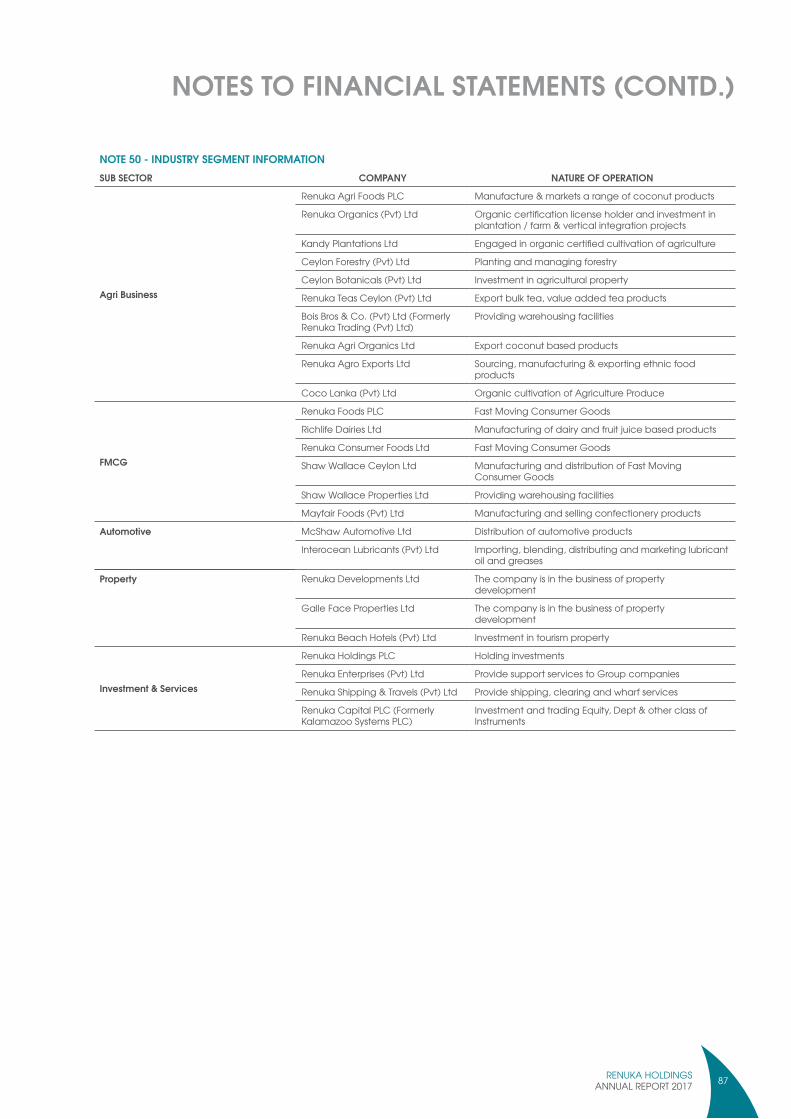
RENUKA HOLDINGSANNUAL REPORT 2017 87
NOTES TO FINANCIAL STATEMENTS (CONTD.)
NOTE 50 - INDUSTRY SEGMENT INFORMATIONSUB SECTOR COMPANY NATURE OF OPERATION
Agri Business
Renuka Agri Foods PLC Manufacture & markets a range of coconut products
Renuka Organics (Pvt) Ltd Organic certification license holder and investment inplantation / farm & vertical integration projects
Kandy Plantations Ltd Engaged in organic certified cultivation of agriculture
Ceylon Forestry (Pvt) Ltd Planting and managing forestry
Ceylon Botanicals (Pvt) Ltd Investment in agricultural property
Renuka Teas Ceylon (Pvt) Ltd Export bulk tea, value added tea products
Bois Bros & Co. (Pvt) Ltd (Formerly Renuka Trading (Pvt) Ltd)
Providing warehousing facilities
Renuka Agri Organics Ltd Export coconut based products
Renuka Agro Exports Ltd Sourcing, manufacturing & exporting ethnic foodproducts
Coco Lanka (Pvt) Ltd Organic cultivation of Agriculture Produce
FMCG
Renuka Foods PLC Fast Moving Consumer Goods
Richlife Dairies Ltd Manufacturing of dairy and fruit juice based products
Renuka Consumer Foods Ltd Fast Moving Consumer Goods
Shaw Wallace Ceylon Ltd Manufacturing and distribution of Fast MovingConsumer Goods
Shaw Wallace Properties Ltd Providing warehousing facilities
Mayfair Foods (Pvt) Ltd Manufacturing and selling confectionery products
Automotive McShaw Automotive Ltd Distribution of automotive products
Interocean Lubricants (Pvt) Ltd Importing, blending, distributing and marketing lubricantoil and greases
Property Renuka Developments Ltd The company is in the business of propertydevelopment
Galle Face Properties Ltd The company is in the business of propertydevelopment
Renuka Beach Hotels (Pvt) Ltd Investment in tourism property
Investment & Services
Renuka Holdings PLC Holding investments
Renuka Enterprises (Pvt) Ltd Provide support services to Group companies
Renuka Shipping & Travels (Pvt) Ltd Provide shipping, clearing and wharf services
Renuka Capital PLC (Formerly Kalamazoo Systems PLC)
Investment and trading Equity, Dept & other class of Instruments

RENUKA HOLDINGSANNUAL REPORT 201788
NOTES TO FINANCIAL STATEMENTS (CONTD.)NO
TE 5
1 - I
NDUS
TRY
SEG
MEN
T INF
ORM
ATIO
NAG
RI B
USIN
ESS
FM
CG
PR
OPE
RTY
AUTO
MO
TIVE
INVE
STM
ENT &
SER
VIC
ESG
ROUP
TOTA
L
FOR
THE
YEAR
END
31ST
MAR
CH
2017
2016
2017
2016
2017
2016
2017
2016
2017
2016
2017
2016
Rs.
‘000
Rs.
‘000
Rs.
‘000
Rs.
‘000
Rs.
‘000
Rs.
‘000
Rs.
‘000
Rs.
‘000
Rs.
‘000
Rs.
‘000
Rs.
‘000
Rs.
‘000
Reve
nue
4,3
95,0
97
4,4
39,9
44
3,9
60,2
99
3,5
62,7
50
1,8
00
1,8
00
622
,417
-
141
,946
1
45,2
34
9,1
21,5
59
8,1
49,7
28
Intra
Gro
up
(431
,299
) (2
65,9
62)
(141
,151
) -
- -
- -
(122
,546
) (7
9,90
7) (6
94,9
96)
(345
,869
)Se
gmen
t Rev
enue
3
,963
,798
4
,173
,982
3
,819
,148
3,5
62,7
50
1,8
00
1,8
00
622
,417
-
19,
400
65,
327
8,4
26,5
63
7,80
3,85
9
Gro
ss P
rofit
1,
003,
726
1,0
51,7
85
917,1
31 7
69,7
06
1,8
00
1,8
00
194
,890
-
17,9
22
9,6
28
2,1
35,4
69
1,8
32,9
19
Oth
er O
pera
ting
Inco
me
11,
021
23,
597
1,3
81
4,8
22
425
,950
2
76,8
50
9
- 8
,553
1
,873
4
46,9
14
307
,142
Ad
min
istra
tive
Expe
nses
(314
,973
) (2
04,2
76)
(203
,184
) (2
31,9
63)
(13,
664)
(6,5
93)
(125
,886
) -
(93,
354)
(83,
552)
(751
,061
) (5
26,3
84)
Dist
ribut
ion
Expe
nses
(60,
732)
(226
,165
) (6
17,4
51)
(455
,452
)-
- (2
0,37
5) -
(29)
(811
) (6
98,5
87)
(682
,428
)O
ther
ope
ratin
g Ex
pens
es (4
,500
) (9
71)
- (1
63)
- -
- -
(5,7
85)
(107
) (1
0,28
5) (1
,241
)Pr
ofit f
rom
Ope
ratio
ns
634
,542
6
43,9
70
97,8
77
86,
950
414
,086
2
72,0
57
48,
638
- (7
2,69
3) (7
2,97
0) 1
,122
,450
9
30,0
07
Finan
ce In
com
e 2
2,35
4 2
4,93
6 6
,299
2
,954
1
32,9
94
43,
828
- -
9,0
60
41,
762
170
,707
1
13,4
80
Finan
ce C
ost
(46,
368)
(45,
665)
(90,
444)
(58,
905)
(4)
(73)
(26,
315)
- (6
31)
(146
) (1
63,7
62)
(104
,789
)
Oth
er F
inan
cial
Item
s (6
,310
) 4
3,88
4 5
,053
(6
,870
) -
- (6
42)
- -
- (1
,899
) 3
7,014
Ne
t Fin
ance
Inco
me/
(Cos
t) (3
0,32
4) 2
3,15
5 (7
9,09
2) (6
2,82
1) 1
32,9
90
43,
755
(26,
958)
- 8
,429
4
1,61
6 5
,046
4
5,70
5 Lo
ss o
n D
ispos
al o
f Sub
sidia
ries
--
--
--
--
(14,
006)
- (1
4,00
6)-
Shar
e of
pro
fit o
f Equ
ity A
ccou
nted
Inve
stee
- -
- -
- -
28,
515
24,
996
- -
28,
515
24,
996
Profi
t bef
ore
Taxa
tion
604
,218
6
67,1
25
18,
785
24,
129
547
,076
3
15,8
12
50,
196
24,
996
(78,
270)
(31,
354)
1,1
42,0
05
1,0
00,7
08
Taxa
tion
(58,
428)
(66,
236)
(10,
554)
(10,
447)
(7,4
17)
(9,8
30)
(6,2
68)
(8,0
58)
(7,3
47)
(1,0
85)
(90,
014)
(95,
656)
Profi
t for
the
year
545
,790
6
00,8
89
8,2
31 1
3,68
2 5
39,6
59
305
,982
4
3,92
8 1
6,93
8 (8
5,61
7) (3
2,43
9) 1
,051
,991
9
05,0
52
AG
RIBU
SINE
SS
FM
CG
P
ROPE
RTY
AUT
OM
OTIV
E IN
VEST
MEN
T &
SERV
ICES
G
ROUP
TOTA
L
AS A
T 31ST
MAR
CH
2017
2016
2017
2016
2017
2016
2017
2016
2017
2016
2017
2016
Rs.
‘000
Rs.
‘000
Rs.
‘000
Rs.
‘000
Rs.
‘000
Rs.
‘000
Rs.
‘000
Rs.
‘000
Rs.
‘000
Rs.
‘000
Rs.
‘000
Rs.
‘000
Prop
erty
, Pla
nt &
Equ
ipm
ent
1,5
29,6
27
1,4
52,5
91
2,0
20,6
21
1,9
78,6
72
737
,343
7
26,7
95
9,5
92
- 1
,985
7
57
4,2
99,1
68
4,1
58,8
15
Inta
ngib
le A
sset
s -
13,
694
138
,700
1
0,34
4 -
- 4
8,04
0 -
41,
448
- 2
28,1
88
24,
038
Righ
t To
use
Land
62,
738
58,
504
214,
813
225
,389
-
- -
- -
- 2
77,5
68
283
,893
In
vest
men
t Pro
perty
- -
- -
1,70
3,80
0 1
,277
,850
-
- 1
,703
,800
-
1,7
03,8
00
1,2
77,8
50
Biol
ogic
al A
sset
54,
916
51,
477
- -
- -
- -
- -
54,
916
51,
477
Goo
dwill
- -
- 1
16,0
53
- -
- -
- -
- 1
16,0
53
Inve
stm
ent i
n Jo
int V
entu
re-
- -
- -
- 44
,398
- -
51,
055
44,
398
51,
055
Inve
stm
ent i
n A
ssoc
iate
s-
- -
- -
- -
- -
4,6
34
- 4
,634
O
ther
Inve
stm
ents
- -
- -
- -
- -
56,
884
272
,970
5
6,88
4 2
72,9
70
Def
erre
d Ta
x A
sset
228
2
78
- -
- -
595
- 6
,596
2
,934
7,
418
3,2
12
SEG
MEN
T NO
N C
URRE
NT A
SSET
S 1
,647
,509
1
,576
,544
2
,374
,152
2
,330
,458
2
,441
,143
2
,004
,645
1
03,7
81
- 10
5,75
5 3
32,3
50
6,6
72,3
39
6,2
43,9
97

RENUKA HOLDINGSANNUAL REPORT 2017 89
NOTES TO FINANCIAL STATEMENTS (CONTD.) A
GRI
BUSI
NESS
F
MC
G
PRO
PERT
Y A
UTO
MO
TIVE
INVE
STM
ENT
& SE
RVIC
ES
GRO
UP TO
TAL
AS A
T 31ST
MAR
CH
2017
2016
2017
2016
2017
2016
2017
2016
2017
2016
2017
2016
Rs.
‘000
Rs.
‘000
Rs.
‘000
Rs.
‘000
Rs.
‘000
Rs.
‘000
Rs.
‘000
Rs.
‘000
Rs.
‘000
Rs.
‘000
Rs.
‘000
Rs.
‘000
Inve
ntor
ies
738
,570
6
00,1
19
521
,361
6
24,6
95
- -
184,
225
- -
- 1
,444
,155
1
,224
,814
Sh
ort T
erm
Inve
stm
ents
in S
hare
s-
- -
- -
- -
- 3
9,70
5 2
,477
3
9,70
5 2
,477
Tra
de a
nd O
ther
Rec
eiva
bles
592
,609
318
,752
4
19,5
76
448
,050
-
- 16
6,59
9 -
1,0
34 9
50
1,1
79,8
18
767
,752
O
ther
Cur
rent
Ass
ets
42,
153
88,
246
6,0
77
8,6
30
- -
- -
15,5
90 8
63
63,
820
97,7
39
Inco
me
Tax
Refu
nd D
ue (2
4,44
9) 1
3,76
9 3
5,74
5 1
0,79
3 (3
,597
) 3
03
(1,9
58)
- (8
65)
115
4
,876
2
4,98
0 Sh
ort T
erm
Inve
stm
ents
in D
epos
its 3
27,9
87
267
,071
-
3,0
67
840,
812
1,5
00,4
09
- -
75,2
07 1
3,52
7 1
,244
,006
1
,784
,074
C
ast a
t Ban
k an
d C
ash
in H
and
253
,712
246
,332
5
3,32
9 9
3,23
6 78
8,97
0 6
,743
72
4 -
70,4
70 5
,201
1
,167
,205
3
51,5
12
SEG
MEN
T CUR
RENT
ASS
ETS
1,9
30,5
82
1,5
34,2
89
1,0
36,0
86
1,1
88,4
71
1,6
26,1
84
1,5
07,4
55
349,
590
- 2
01,1
41
23,
133
5,1
43,5
84
4,2
53,3
48
TOTA
L SEG
MEN
T ASS
ETS
3,5
78,0
91
3,1
10,8
33
3,4
10,2
38
3,5
18,9
29
4,0
67,3
27
3,5
12,1
00
453
,372
-
306,
896
355
,483
1
1,81
5,92
4 1
0,49
7,345
Def
erre
d Ta
x Lia
bilit
y 9
7,845
8
3,51
6 1
09,0
80
116
,570
-
- -
- -
- 2
06,9
24
200
,086
In
tere
st B
earin
g Bo
rrow
ings
278
,647
3
61,2
64
349
,000
5
30,0
00
- -
5,24
4 -
50,
267
- 6
83,1
58
891
,264
Re
tirem
ent B
enefi
t Obl
igat
ion
47,4
83
35,
074
36,
958
31,
864
121
-
3,31
3 -
8,53
8 6
,812
9
6,41
2 7
3,75
0 SE
GM
ENT N
ON
CUR
RENT
LIAB
ILITIE
S 4
23,9
74
479
,854
4
95,0
37
678
,434
1
21
- 8,
557
- 5
8,80
5 6
,812
9
86,4
94
1,1
65,1
00
Trade
and
Oth
er P
ayab
les
301
,802
2
46,5
86
234
,926
3
69,9
95
97
92
91,0
08 -
2,4
65
2,2
79
630
,298
6
18,9
52
Oth
er C
urre
nt L
iabi
litie
s 5
5,89
9 8
9,29
8 9
7,164
5
3,29
2 1
75
18
1,75
1 -
4,1
84
9,9
10
159
,173
1
52,5
18
Am
ount
due
to R
elat
ed C
ompa
nies
4
0,35
0 -
- -
- -
- -
- -
40,
350
- Sh
ort T
erm
Inte
rest
Bea
ring
Borro
win
gs
609
,084
4
60,7
23
545
,730
2
69,0
00
- -
240,
274
- -
- 1
,395
,088
7
29,7
23
Bank
Ove
rdra
ft 9
3,09
8 6
1,96
9 6
3,96
0 8
7,820
2
23
832
4,
884
- 3,
892
3,5
69
166
,057
1
54,1
90
TOTA
L CUR
RENT
LIAB
ILITIE
S 1
,100
,234
8
58,5
76
941
,780
7
80,1
07
494
942
33
7,917
- 1
0,54
1 1
5,75
8 2
,390
,966
1
,655
,383
TO
TAL S
EGM
ENT L
IABI
LITIE
S 1
,524
,209
1
,338
,430
1
,436
,818
1
,458
,541
6
14
942
34
6,47
3 -
69,
347
22,
570
3,3
77,4
60
2,8
20,4
83
NOTE
51
- IND
USTR
Y SE
GM
ENT I
NFO
RMAT
ION
(CO
NTD.
)

RENUKA HOLDINGSANNUAL REPORT 201790
NOTE 52 - FINANCIAL RISK MANAGEMENT OBJECTIVES AND POLICIES
Risk Management framework
The board of Directors have overall responsibility for the establishment and oversight of the Group's risk management framework.
The Group's risk management policies are establish to identify and anlyze the risks face by the group, to set appropriate risk limits and controls, and to monitor risks and adherence to limit. Risk Management policies and systems are reviewed regularly to reflect changes in market conditions and Group's activities.
The Group, through its training and management standards and procedures, aims to develop a disciplined and constructive control environment in which all employees understand their roles and obligations. The Group Audit committee overseas how management monitors compliance with the group risk management policies and procedures, and review the adquacy of the risk management frame work in relation to the risks faced by the Group.
Financial Risks Factors
The activities of the company's and the Group exposed to variety of financial risks:
1. Market risk - Currency risk
- Interest rate risk
- Price risk
2. Credit risk
3. Liquidity risk
4. Capital Management risk
5. Operational risk
The company's and the Group's overall financial risk management programme focusses on the unpredictability of financial markets and seeks to minimise potential adverse effects on the financial performance of the company and the Group. Financial risk management is carried out though risk reviews, internal control systems, insurance programmes and adhearence to the company's and the Group's financial risk management polices.
1. Market Risk
Market risks that changes in market prices, such as foreign exchange rates and interest rates will affect the Group income or the value of its holdings of its financial instruments. The objective of market risk management os to manage and control market risk exposures within acceptable parameters, while optomizing the returns.
a. Currency Risk
The risk that the fair value of future cash flows of a financial instrument fluctuate due to changes in foreign exchange rates. The Group is exposed to currency risk on sales, purchases that are denominated in a currency other than Sri Lanka Rupees (LKR). the foreign currencies in which transactions primarily denominated is US Dollars.
NOTES TO FINANCIAL STATEMENTS (CONTD.)

RENUKA HOLDINGSANNUAL REPORT 2017 91
NOTE 52 - FINANCIAL RISK MANAGEMENT OBJECTIVES AND POLICIES (CONTD.)Exposure to Currency riskThe Group exposure to foreign currency risk was as follows based on notional amounts. The Group involves with foreign currency transactions and exposed to foreign exchange risk arising from various currency exposures, primarily with respect to US Dollar. Foreign exchange risk arises when future commercial transactions or recognized assets or liabilities are denominated in a currency that is not the entity's functional currency.
AS AT 31ST MARCH 2017 2016Rs USD Rs USD
Amounts due to Related Company - - - -Trade and Other Payables (630,297,845) (4,254,170) (618,952,187) (4,434,443)Trade and Other Receivables 1,179,818,076 7,963,135 767,752,220 5,500,511 Cash and Cash Equivalants 1,167,204,517 7,878,000 351,511,129 2,518,379 Bank Overdraft (166,056,619) (1,120,793) (154,189,904) (1,104,684)Gross Statement of Financial Position Exposure 1,550,668,129 10,466,172 346,121,258 2,479,763
The following significant exchange rates were applcable during the year.Average Rate Reporting Date spot rate
2017 2016 2017 2016 Rs Rs Rs RsUS Dollars 148.16 139.58 151.99 144.69
Sensitivity AnalysisA strengthening of the LKR, as indicated below, against the US Dollar at 31st March 2017 would have increased / (Decreased) the equity and Profit or Loss by the amount shown below. This analysis is based on foreign currency exchange rate variances that the company considered to be reasonably possible at the end of the reporting period. The analysis assumes that all other variables in particular interest rates, remain constant.
Strengthening WeakeningProfit or Loss Profit or Loss
Rs Rs31st March 2017USD (10% movement) 155,069,312 (155,069,312)
31st March 2016USD (10% movement) 34,612,126 (34,612,126)
NOTES TO FINANCIAL STATEMENTS (CONTD.)

RENUKA HOLDINGSANNUAL REPORT 201792
NOTE 52 - FINANCIAL RISK MANAGEMENT OBJECTIVES AND POLICIES (CONTD.)b. Interest rate risk
The risk that the fair value or future cashflows of financal instrument will fluctuate due to chnages in market interest rates at the reporting date, the company's interest bearing financial instruments were as follows.
Carrying Amount
AS AT 31ST MARCH 2017 2016
Rs Rs
Variable rate Instruments
Financial Assets
Call and Savings Deposits 1,244,005,900 1,784,074,092
Financial Liabilities
Bank Overdraft (166,056,619) (154,189,904)
Borrowings (2,015,239,441) (1,563,487,796)
(937,290,160) 66,396,392
C. Price Risk
Risk that the value of a financial instrument will fluctuate as a result of changes in market prices, whether those changes are ceased by factors specific to the individual instrument or ots issuer or factors affecting all instruments traded in the market.
2. Credit Risk
Risk that one party to a financial instrument will fail to discharge an obligation and cause the other party to incur a financial loss. Credit risk managed on company and the group basis. Credit risk arises from cash equivalent, derivative financial instruments and deposits with banks and financial institutions as well as credit exposures to customers, including outstanding receivables (net of deposits held). Individual risk limits are set, based on internal or external ratings. the utilization of credit limits is regularly monitored. the company and the group place its cash equivalent with a number of credit worthy financial institutions. the maximum credit risk exposure of the financial assets of the company and the Group are approximately their carrying amount as at Statement of financial Position date.
Exposure Credit risk
The carrying amount of financial assets represent the maximum credit exposure. The maximum exposure to credit risk at the reporting date was as follows.
AS AT 31ST MARCH 2017 2016
Rs Rs
Trade and Other receivables 1,179,818,076 767,752,220
Balances with Banks 1,167,204,517 351,511,129
2,347,022,593 1,119,263,349
NOTES TO FINANCIAL STATEMENTS (CONTD.)

RENUKA HOLDINGSANNUAL REPORT 2017 93
NOTE 52 - FINANCIAL RISK MANAGEMENT OBJECTIVES AND POLICIES (CONTD.)Impairment losses
The company establishes an allowance for impairment that represent its estimate of incurred losses in respect of trade and other receivables. The main components of this allowance are a specific loss component that relates to individually significant exposures, and a collective loss allowance is determined based on historical data of payment statistics for similar financial assets.
The maximum exposure to credit risk for Trade and Other Receivables as at reporting date by geographic was as follows.
Carrying amount
2017 2016
Rs Rs
Domestic 778,318,604 493,643,165
Europe 193,451,059 162,926,235
Middle East 36,461,251 29,894,038
Asia 11,693,661 10,235,213
United States 86,631,265 21,696,505
Canada - 4,299,964
Africa 18,596,552 44,681,048
Australia 54,665,685 376,052
1,179,818,076 767,752,220
Cash and bank balances
The company held favorable cash and bank balances Rs. 1,167,204,517 as at 31st March 2017 (Rs. 351,511,129/- as at 31st March 2016) which represent its maximum credit exposure on these assets.
3. Liquidity Risk
Liquidity risk is the risk that company will encounter difficulty in meeting the obligations associated with its financial liabilities thatare settled by delivering cash or another financial asset. The company's approach to managing liquidity risk is to ensure, as far as possible, that it will always have sufficient liquidity to meet its liabilities when due, without incurring inacceptable losses or riskingdamage to the company's reputation.
Prudent liquidity risk management implies maintaining sufficient liquid funds to meet its financial obligations. In the management ofliquidity risk, the company and the Group monitor and maintaining a level of cash and cash equivalents deemed adequate by the management to finance the company's and the Group's operations and to mitigate the effects of fluctuations in cashflows. due to the dynamic nature of the underlying business, the company and the Group aim at maintaining flexibility in funding by keeping both committed and uncommitted credit lines available.
AS AT 31ST MARCH 2017 Carrying amount
0-12 Months More than one year
Rs Rs Rs
Financial Liabilities (Non- Derivative)
Interest Bearing borrowings 2,015,239,441 1,389,825,148 625,414,293
Trade and Other Payable 630,297,845 630,297,845 -
Amount due to Related Companies 40,350,234 40,350,234
Bank Overdraft 166,056,619 166,056,619 -
2,851,944,139 2,226,529,846 625,414,293
AS AT 31ST MARCH 2016 Carrying amount
0-12 Months More than one year
Rs Rs Rs
Financial Liabilities (Non-Derivative)
Interest Bearing borrowings 1,563,487,796 727,223,451 836,264,345
Trade and Other Payable 618,952,187 618,952,187 -
Bank Overdraft 154,189,904 154,189,904 -
2,336,629,887 1,500,365,542 836,264,345
NOTES TO FINANCIAL STATEMENTS (CONTD.)

RENUKA HOLDINGSANNUAL REPORT 201794
NOTE 52 - FINANCIAL RISK MANAGEMENT OBJECTIVES AND POLICIES (CONTD.)4. Capital Management risk
The primary objective of the company's and the Group's capital management is to ensure that its maintains a strong credit rating and healthy capital ratios in order to support its business and maximize shareholder value. The company and the Group mange its capital structure and make adjustments to it in light of changes in economic conditions. To maintain or adjust the capital structure, the company and the Group may or may not make dividend payments to shareholders, return capital to shareholders or issue new shares or other instruments. Consistent with others in the industry, the company and the Group monitor capital on the basis of the gearing ratio. this ratio is calculated as total borrowings divided by total equity. Total borrowings including non-current and current borrowings as shown in the statement of Financial Position. Total equity is calculated as 'Total Equity' in the statement of financial Position.
The gearing ratio as at 31st March was as follows. Group Company
2017 2016 2017 2016
Rs Rs Rs Rs
Borrowings (Note 23) 2,015,239,441 1,563,487,796 50,267,123 -
Total Equity 8,438,463,245 7,676,861,220 1,654,609,123 1,644,142,521
Gearing ratio % 24% 20% 3% -
5. Operational Risk
Operational risk is the risk of direct or indirect loss arising from a wide variety of causes associated with the company's processes, personnel, technology and infrastructure and from external factors other than credit , market and liquidity risk such as those arising from legal and regulatory requirements and generally accepted standards of corporate behavior. Operational risks arise from all of the company's operations.
The primary responsibility for the development and implementation of controls to address operational risk is assigned to senior management. This responsibility is supported by the development of overall company standards for the management of operational risk in the following areas.
• Requirement for appropriate segmentation of duties, including the independent authorization of transactions
• Requirements for the reconciliations and monitoring of transactions
• Documentation of controls and procedures
• Requirements for the periodic assessment of operational risks faced and the adequacy of controls and procedures to address the risks identified
• Development of contingency plans
• Training and professional development
NOTES TO FINANCIAL STATEMENTS (CONTD.)

RENUKA HOLDINGSANNUAL REPORT 2017 95
REAL ESTATE PORTFOLIOla
nd e
xten
t (Pe
rche
s)Bu
ildin
gC
LASS
IFIC
ATIO
N C
OM
PANY
CLA
SSIF
ICAT
ION
GRO
UP O
RIG
INAL
C
OST
OF
PURC
HASE
FAIR
VAL
UE A
S AT
31
.03.
2017
UND
ER FA
IR
VALU
E M
ETHO
Dco
mpa
nylo
catio
nla
nd/
build
ing
free
hold
/ le
aseh
old
no o
f bu
ildin
gs B
UILD
ING
IN
SQ
.FT
Renu
ka D
evel
opm
ents
Ltd
Sri D
harm
a M
w, C
olom
bo-9
Land
184
320,
279,
000
525
,000
,000
Bu
ildin
g2
7,50
7 PP
EPP
E
Bois
Bros
(Pvt
) Ltd
Kent
Roa
d, D
emat
agod
a,
Col
ombo
-9La
nd76
63,
177,0
00
95,
000,
000
Build
ing
3 3
2,79
9 IP
PPE
47,0
01,3
20
45,
000,
000
Shaw
Wal
lanc
e C
eylo
n Lt
dKa
rishu
e Pl
ace,
Col
ombo
-9La
nd5
PPE
PPE
17,5
00,0
00
17,5
00,0
00
Dan
ister
De
Silva
Maw
atha
Land
40PP
EPP
E 1
14,6
99,0
00
180
,000
,000
Dan
ister
De
Silva
Maw
atha
Build
ing
1 7
1,107
IP
PPE
289
,341
,098
5
87,9
26,6
25
Gam
unu
Maw
atha
,Eka
laLa
nd60
PPE
PPE
28,
000,
000
16,
445,
000
Gam
unu
Maw
atha
,Eka
laBu
ildin
g2
10,
150
PPE
PPE
36,
088,
634
Shaw
Wal
lanc
e Pr
oper
ties L
tdN
ew N
uge
Road
, Pel
iyago
daLa
nd21
6IP
PPE
95,
000,
000
334
,944
,000
Bu
ildin
g2
61,
969
IPPP
E 1
19,9
80,4
71
205
,056
,000
Renu
ka F
oods
PLC
Sam
agi M
w, E
kala
Ja-
Ela
Land
215
IPPP
E 5
3,68
7,500
9
6,65
2,50
0 Bu
ildin
g9
37,3
90
40,
570,
885
9,3
47,5
00
Cey
lon
Bota
nica
ls (P
vt) L
tdVi
hara
gam
a Es
tate
, Mat
ale
Land
1084
2IP
PPE
20,
000,
000
20,
000,
000
Rich
life D
airie
s Ltd
Piriv
ena
Road
, Wad
duw
aLa
nd68
2 1
28,5
52,0
00
127
,815
,000
Bu
ildin
g6
57,5
00
PPE
PPE
194
,843
,169
1
64,4
88,8
92
Kand
y Pl
anta
tion
Ltd
Mah
awat
ta E
state
, Ind
igol
la
Esta
te, K
urun
dugo
lla E
state
, at
Nal
la D
iuld
eniya
Righ
t to
use
Esta
te10
2552
PPE
PPE
49,
499,
976
43,
999,
968
Build
ing
4 1
2,74
3 PP
EPP
E 1
4,08
5,00
0
Renu
ka A
gri F
oods
PLC
Unag
ahad
eniya
Land
420.
4 2
1,42
8,00
0 2
1,42
8,00
0 EP
Z, W
athu
pitiw
ela
Build
ing
9 8
1,36
4 PP
EPP
E 1
58,4
52,2
64
340
,058
,065
Renu
ka B
each
Hot
els L
tdA
hung
alla
Land
377
PPE
PPE
204
,984
,840
2
08,0
00,0
00
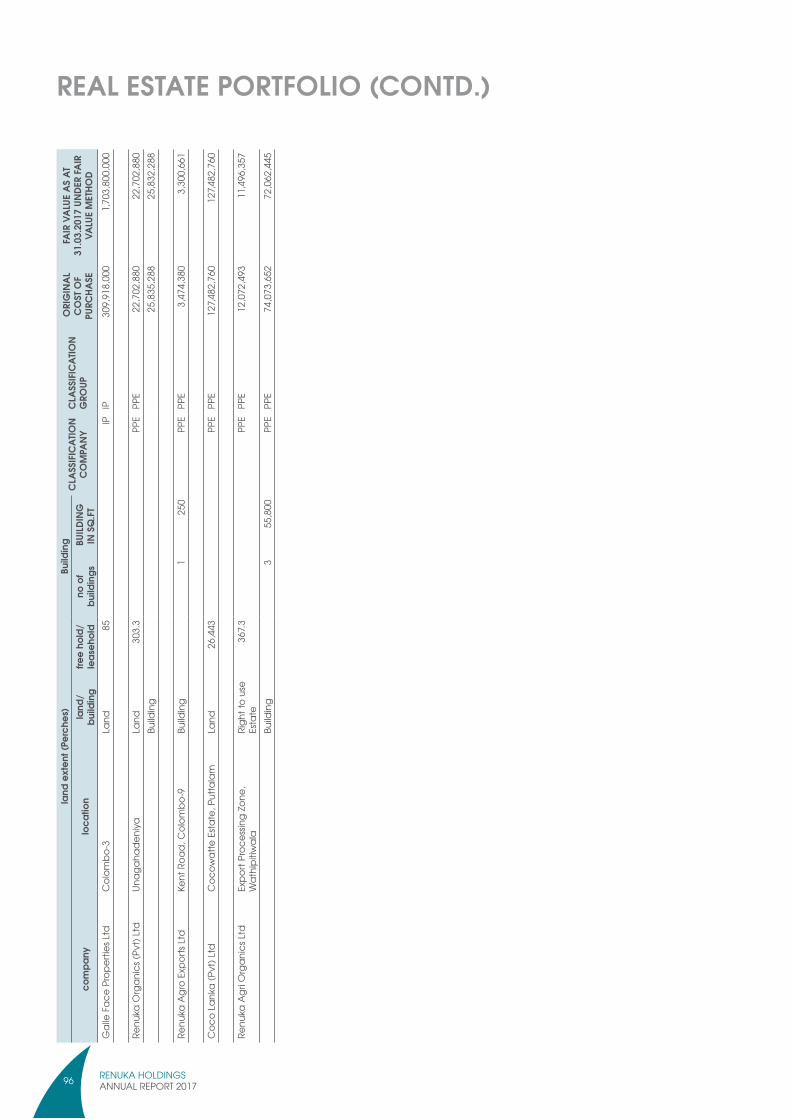
RENUKA HOLDINGSANNUAL REPORT 201796
REAL ESTATE PORTFOLIO (CONTD.)la
nd e
xten
t (Pe
rche
s)Bu
ildin
gC
LASS
IFIC
ATIO
N C
OM
PANY
CLA
SSIF
ICAT
ION
GRO
UP O
RIG
INAL
C
OST
OF
PURC
HASE
FAIR
VAL
UE A
S AT
31
.03.
2017
UND
ER FA
IR
VALU
E M
ETHO
Dco
mpa
nylo
catio
nla
nd/
build
ing
free
hold
/ le
aseh
old
no o
f bu
ildin
gs B
UILD
ING
IN
SQ
.FT
Gal
le F
ace
Prop
ertie
s Ltd
Col
ombo
-3La
nd85
IPIP
309
,918
,000
1
,703
,800
,000
Renu
ka O
rgan
ics (
Pvt)
Ltd
Unag
ahad
eniya
Land
303.
3PP
EPP
E 2
2,70
2,88
0 2
2,70
2,88
0 Bu
ildin
g25
,835
,288
25,8
32,2
88
Renu
ka A
gro
Expo
rts L
tdKe
nt R
oad,
Col
ombo
-9Bu
ildin
g1
250
PP
EPP
E 3
,474
,380
3
,300
,661
Coc
o La
nka
(Pvt
) Ltd
Coc
owat
te E
state
, Put
tala
mLa
nd 2
6,44
3 PP
EPP
E 1
27,4
82,7
60
127
,482
,760
Renu
ka A
gri O
rgan
ics L
tdEx
port
Proc
essin
g Zo
ne,
Wat
hipi
tiwal
aRi
ght t
o us
e Es
tate
367.3
PPE
PPE
12,
072,
493
11,
496,
357
Build
ing
3 5
5,80
0 PP
EPP
E 7
4,07
3,65
2 7
2,06
2,44
5

RENUKA HOLDINGSANNUAL REPORT 2017 97
Year Ended 31st MARCH 2017 2016 2015 2014 2013Rs. ‘000 Rs. ‘000 Rs. ‘000 Rs. ‘000 Rs. ‘000
a) Summery of OperationRevenue 8,426,563 7,803,859 7,041,657 6,041,518 6,521,084 Gross Profit 2,135,469 1,832,919 1,726,038 1,158,627 1,356,230 Profit before finance cost and tax 1,305,766 930,007 632,350 314,855 445,556 Profit before taxation 1,142,005 1,000,708 667,723 298,898 282,604 Taxation (90,014) (95,656) (49,492) (29,302) (10,634)Profit after tax 1,051,990 905,051 618,231 269,596 271,969 Profit attributable to equity holders of the company 669,600 430,518 395,850 191,316 188,881
As At 31st March 2017 2016 2015 2014 2013Rs. ‘000 Rs. ‘000 Rs. ‘000 Rs. ‘000 Rs. ‘000
b) Summery of Financial PositionCapital and reservesStated capital 1,198,897 1,198,897 1,198,897 175,000 175,000 Revaluation Reserve 289,009 288,293 244,371 Retained Earnings 3,886,623 3,186,445 3,047,001 2,652,601 2,081,549 Shareholders' Fund 5,374,529 4,673,635 4,490,270 2,827,601 2,256,549 Minority interest 3,063,934 3,003,227 2,769,400 2,012,815 1,974,004 Total Equity 8,438,463 7,676,862 7,259,670 4,840,415 4,230,552
LiabilitiesNon- Current liabilities 986,494 1,165,100 1,228,082 270,095 348,095 Current liabilities 2,390,966 1,655,383 2,072,912 1,704,493 1,474,646 Total Liabilities 3,377,460 2,820,483 3,300,994 1,974,588 1,822,741
Total Equity and Liabilities 11,815,924 10,497,345 10,560,665 6,815,003 6,053,293
AssetsProperty, plant and equipment 4,299,168 4,158,815 3,861,735 2,511,137 2,480,286 Investment properties 1,703,800 1,277,850 1,001,000 937,000 788,008 Investments 101,282 328,659 290,832 654,941 223,959 Other non-current assets 568,090 478,673 575,247 476,387 481,448 Current assets 5,143,584 4,253,347 4,831,850 2,235,538 2,079,593 Total Assets 11,815,924 10,497,345 10,560,665 6,815,003 6,053,294
c) Key IndicatorsEarnings per share (Rs.) 6.57 4.23 6.02 3.77 3.71 Net profit margin (%) 12.48% 11.59% 8.78% 4.46% 4.17%Net assets value per share (Rs.) 52.75 45.86 44.07 55.50 44.29 Dividends per share (Rs.) 0.35 0.35 0.70 0.70 0.70 Dividends payout (%) 5.33% 8.27% 18.56% 18.86% 6.70%Dividend cover (times) 18.78 12.08 5.38 5.30 14.92 Interest cover (times) 7.97 9.95 10.69 5.41 2.95 Current ratio (times) 2.15 2.57 2.33 1.31 1.41 Gearing ratio (%) 24.63% 21.11% 30.50% 16.46% 5.67%Return on equity (%) 13.33% 9.21% 13.76% 9.51% 6.43%
FIVE YEAR SUMMARY

RENUKA HOLDINGSANNUAL REPORT 201798
SHARE HOLDER’S INFORMATION
SHARE INFORMATION 2017 2016
Voting Non Voting Voting Non Voting
Total No of Shareholders 2,266 1,075 2,439 1,115
Total No of Shares 89,034,626 12,856,830 89,034,626 12,856,830
PUBLIC SHARE HOLDING
The percentage of Shares held by the public 2017 2016
Voting 36.12% 42.14%
Non Voting 94.14% 94.14%
No of Shareholders Voting 2,258 2,432
Non Voting 1,070 1,110
SHARE TRADING INFORMATION 2017 2016
1st of April to 31st March Voting Non Voting Voting Non Voting
Share Price
Highest (Rs.) 27.40 24.00 27.90 22.60
Lowest (Rs.) 17.10 13.30 18.50 15.00
As at 31St March 20.20 14.60 21.10 19.20
Dividends
Proposed/paid final Dividend (Rs.) 35,662,010 35,662,010
(Rs. 0.35 cents per Share) (Rs. 0.35 cents per Share)
Market Capitalization
As at 31St March (Rs. ‘000) 1,986,209 2,125,482
No of Trades 2,127 577 5,260 978
No of shares Traded 11,162,960 697,272 11,930,351 1,501,877
Value of Shares Traded (Rs.) 276,055,481 12,764,205 355,649,794 36,734,997
VOTING SHARES 31st MARCH 2017 31st MARCH 2016No of
ShareholdersNo of Shares % No of
ShareholdersNo of Shares %
No of Shares Held - Voting1 - 1,000 1,168 338,474 0.38% 1,210 365,744 0.41%1,001 - 10,000 772 2,809,599 3.16% 861 3,185,319 3.58%10,001 - 100,000 277 8,399,289 9.43% 317 9,660,700 10.85%100,001 1,000,000 41 11,204,526 12.59% 43 10,710,615 12.03%1,000,000 & Over 8 66,282,738 74.44% 8 65,112,248 73.13%
2,266 89,034,626 100% 2,439 89,034,626 100%
Analysis of Shareholders - VotingIndividuals 2,109 28,709,466 32.25% 2,267 22,843,433 25.66%Institutions 157 60,325,160 67.75% 172 66,191,193 74.34%Total 2,266 89,034,626 100% 2,439 89,034,626 100%
Analysis of Shareholders - VotingResident 2,232 81,452,082 91.48% 2,406 83,716,072 94.03%Non Resident 34 7,582,544 8.52% 33 5,318,554 5.97%Total 2,266 89,034,626 100% 2,439 89,034,626 100%

RENUKA HOLDINGSANNUAL REPORT 2017 99
Non-VOTING SHARES 31st MARCH 2017 31st MARCH 2016No of
ShareholdersNo of Shares % No of
ShareholdersNo of Shares %
No of Shares Held - Non-Voting1 - 1,000 489 136,228 1.06% 508 140,756 1.09%1,001 - 10,000 359 1,379,277 10.73% 375 1,393,152 10.84%10,001 - 100,000 200 5,349,362 41.60% 205 5,451,971 42.41%100,001 1,000,000 27 5,991,963 46.61% 27 5,870,951 45.66%1,000,000 & Over - - - - - -
1,075 12,856,830 100% 1,115 12,856,830 100%
Analysis of Shareholders - Non-VotingIndividuals 999 8,648,063 67.26% 1,037 8,855,308 68.88%Institutions 76 4,208,767 32.74% 78 4,001,522 31.12%Total 1,075 12,856,830 100% 1,115 12,856,830 100%
Analysis of Shareholders - Non-VotingResident 1,048 11,225,578 87.31% 1,088 11,297,669 87.87%Non Resident 27 1,631,252 12.69% 27 1,559,161 12.13%Total 1,075 12,856,830 100% 1,115 12,856,830 100%
Analysis of Shareholders - Non-VotingDirectors and Spouses 5 753,207 5.86% 5 753,207 5.86%Public 1,070 12,103,623 94.14% 1,110 12,103,623 94.14%Total 1,075 12,856,830 100.00% 1,115 12,856,830 100.00%
Percentage of Shares held by the Public as at 31st March 2017 is 94.14%
SHARE HOLDER’S INFORMATION (CONTD).
VOTING SHARES 31st MARCH 2017 31st MARCH 2016No of
ShareholdersNo of Shares % No of
ShareholdersNo of Shares %
Analysis of ShareholdersRenuka Group Limited 1 45,577,498 51.19% 1 45,577,498 51.19%Directors and Spouses 7 11,293,262 12.68% 6 5,937,116 6.67%Holding of 10% or more - - 0.00% - - 0.00%Public 2,258 32,163,866 36.13% 2,432 37,520,012 42.14%Total 2,266 89,034,626 100.00% 2,439 89,034,626 100.00%
Percentage of Shares held by the Public as at 31st March 2017 is 36.12%

RENUKA HOLDINGSANNUAL REPORT 2017100
SHARE HOLDER’S INFORMATION (CONTD).
TOP 20 MAJOR SHAREHOLDERS Voting as at 31.03.2017 Voting as at 31.03.2016No. Name No. of shares % No. of shares %1 RENUKA GROUP LIMITED 45,577,498 51.19 45,577,498 51.19 2 DR. S.R. RAJIYAH & MRS. I.R. RAJIYAH (JT) 8,898,204 9.99 4,542,058 5.10 3 EMPLOYEES TRUST FUND BOARD 2,914,330 3.27 2,914,330 3.27 4 ELGIN INVESTMENTS LIMITED 2,512,548 2.82 2,143,271 2.41 5 MR. M.M.S. DAWOOD 1,840,808 2.07 1,840,808 2.07 6 DR. S. YADDEHIGE 1,801,213 2.02 1,801,213 2.02 7 SRI LANKA INSURANCE CORPORATION LTD - LIFE FUND 1,526,316 1.71 1,526,316 1.71 8 BANK OF CEYLON NO. 1 ACCOUNT 1,211,821 1.36 1,211,821 1.36 9 MR. S.V.RAJIYAH & MRS. J.J.B. ALOYSIUS RAJIYAH (JT) 1,000,000 1.12 - - 10 MR. A.N.ESUFALLY 956,200 1.07 495,663 0.56 11 WALDOCK MACKENZIE LTD/ HI-LINE TRADING (PVT) LTD 760,000 0.85 760,000 0.85 12 ALLIANCE FINANCE COMPANY PLC 674,529 0.76 674,529 0.76 13 DR. G RAJIYAH 403,818 0.45 403,818 0.45 14 MR. K.C. VIGNARAJAH 394,395 0.44 394,355 0.44 15 SEYLAN BANK PLC / T. SENTHILVERL 393,808 0.44 393,808 0.44 16 MR. A. K. H. LIYANAGE 386,366 0.43 400,000 0.45 17 CORPORATE DRUIDS (PVT) LIMITED 352,580 0.40 352,580 0.40 18 MS. A.L. RAJIYAH 330,783 0.37 330,783 0.37 18 MS. S.R. RAJIYAH 330,783 0.37 330,783 0.37 20 SAMPATH BANK PLC/ MR. V. SUBRAMANIAM 320,075 0.36 320,075 0.36
72,586,075 81.53 67,215,499 75.49
TOP 20 MAJOR SHAREHOLDERS Non-Voting as at 31.03.2017 non-Voting as at 31.03.2016
No. Name No. of shares % No. of shares %
1 MR. K.C. VIGNARAJAH 626,753 4.87 626,753 4.87
2 NATIONAL SAVINGS BANK 466,438 3.63 466,438 3.63
3 MR. S.V. RAJIYAH 435,414 3.39 435,414 3.39
4 E.W. BALASURIYA & CO. (PVT) LTD 306,521 2.38 306,521 2.38
5 HALLSVILLE TRADING GROUP INC. 295,977 2.30 295,977 2.30
6 COMMERCIAL BANK OF CEYLON PLC A/C NO. 04 265,368 2.06 265,368 2.06
7 MR. A. SITHAMPALAM 251,797 1.96 251,797 1.96
8 PAN ASIA BANKING CORPORATION PLC/MR R. E. RAMBUKWELLE
250,000 1.94 265,000 2.06
9 MR. P.V.E. JOSEPH 210,911 1.64 210,911 1.64
10 SAMPATH BANK PLC / DR. SENTHILVERL 210,471 1.64 210,471 1.64
11 CORPORATE DRUIDS (PVT) LIMITED 202,000 1.57 202,000 1.57
12 MR. F. G. N. MENDIS 200,000 1.56 200,000 1.56
13 A. T. COORAY PVT LTD 195,428 1.52 195,428 1.52
14 MUBASHER FINANCIAL SERVICES BSC 192,200 1.49 192,200 1.49
15 SENKADAGALA FINANCE COMPANY PLC 183,274 1.43 183,274 1.43
16 MR. R. GAUTAM 179,080 1.39 169,080 1.32
17 WALDOCK MACKENZIE LTD/ MR. K.R.E.M.D.M.B. JAYASUNDARA
172,077 1.34 172,077 1.34
18 DR. S.R. RAJIYAH & MRS. I.R. RAJIYAH (JT) 171,422 1.33 171,422 1.33
19 ELGIN INVESTMENTS LIMITED 153,467 1.19 153,467 1.23
20 MR. K. D. A. M. KUMARAGE 150,000 1.17 150,000 1.17
20 H. A. CABRAAL 150,000 1.17 108,904 0.85
5,268,598 39.81 5,232,502 39.85

RENUKA HOLDINGSANNUAL REPORT 2017 101
NOTICE OF MEETING
Notice is hereby given that the 37th Annual General Meeting of the Company will be held at the Sri Lanka Foundation Institute, No. 100, Independence Square, Colombo 7 on 15th September 2017 at 4.00 p.m. for the following purposes :-
1. To receive and consider the Report of the Directors and the Statement of the Audited Financial Statements for the year ended 31st March 2017 with the Report of the Auditors thereon.
2. To re-elect Mr.M.S.Dominic as a Director who retires by rotation in terms of Article 28 (1).
3. To re-appoint Mr. C.J. De S. Amaratunge who is 77 years of age, as a director in terms of Section 211 of the Companies Act No. 7 of 2007 and it is specifically declared that the age limit of 70 years referred to in section 210 of the Companies Act No. 7 of 2007 shall not apply to the said Mr. C.J. De S. Amaratunge.
4. To re-appoint Mr. T.K. Bandaranayake who is 74 years of age, as a director in terms of Section 211 of the Companies Act No. 7 of 2007 and it is specifically declared that the age limit of 70 years referred to in Section 210 of the Companies Act No. 7 of 2007 shall not apply to the said Mr. T.K. Bandaranayake.
5. To re-appoint Mr. J.M. Swaminathan who is 76 years of age, as a director in terms of Section 211 of the Companies Act No. 7 of 2007 and it is specifically declared that the age limit of 70 years referred to in Section 210 of the Companies Act No. 7 of 2007 shall not apply to the said Mr. J.M. Swaminathan.
6. To declare a dividend of Rs 0.35 per share.
7. To authorise the Directors to determine the contribution to charity.
8. To re-appoint M/s Kreston MNS & Co., Chartered Accountants as the Auditors and authorise the Directors to determine their remuneration.
By Order of the Board,
Sgd.
Renuka Enterprises (Pvt) Ltd
Company Secretaries
15th August 2017
Note:-
i. A member entitled to attend and vote at the above Meeting is entitled to appoint a proxy to attend and vote instead of the member, such proxy need not be a member.
ii. A Form of Proxy is enclosed with this Annual Report.iii. The completed Form of Proxy should be deposited at the Registered Office of the Company at “Renuka House”, No.
69, Sri Jinaratana Road, Colombo 2, on or before 4.00 p.m. on 13th September 2017, being not less than 48 hours before the time appointed for the holding of the Meeting.
RENUKA HOLDINGSANNUAL REPORT 2017102
NOTES
.........................................................................................................................................................................................................................
.........................................................................................................................................................................................................................
.........................................................................................................................................................................................................................
.........................................................................................................................................................................................................................
.........................................................................................................................................................................................................................
.........................................................................................................................................................................................................................
.........................................................................................................................................................................................................................
.........................................................................................................................................................................................................................
.........................................................................................................................................................................................................................
.........................................................................................................................................................................................................................
.........................................................................................................................................................................................................................
.........................................................................................................................................................................................................................
.........................................................................................................................................................................................................................
.........................................................................................................................................................................................................................
.........................................................................................................................................................................................................................
.........................................................................................................................................................................................................................
.........................................................................................................................................................................................................................
.........................................................................................................................................................................................................................
.........................................................................................................................................................................................................................
.........................................................................................................................................................................................................................
.........................................................................................................................................................................................................................
.........................................................................................................................................................................................................................
.........................................................................................................................................................................................................................
.........................................................................................................................................................................................................................
.........................................................................................................................................................................................................................
.........................................................................................................................................................................................................................
.........................................................................................................................................................................................................................
.........................................................................................................................................................................................................................
.........................................................................................................................................................................................................................

RENUKA HOLDINGSANNUAL REPORT 2017 103
FORM OF PROXY
I / We .......................................................................................................................................... of ………………………………….……………………………………………………………. being a member/members of Renuka Holdings PLC, hereby appoint; ..........................................................................................................…………………………………………………….……………... (NIC No. …….…………..)
of ……………………...........................................................................................…………………………......................... Or failing her/him
• Mrs. I.R. Rajiyah or failing her• Dr. S.R. Rajiyah or failing him• Mr. S.V. Rajiyah or failing him• Mr. C.J. de S. Amaratunge or failing him• Mr. L.M. Abeywickrama or failing him• Mr. T.K. Bandaranayake or failing him• Mr. M.S. Dominic or failing him• Ms. A.L. Rajiyah or failing her• Mr. J.M. Swaminathan or failing him
as my/ our proxy to represent me / us and to speak and to vote on my / our behalf at the Annual General Meeting of the Company to be held on the 15th day of September 2017 and at any adjournment thereof and at every poll which may be taken in consequence thereof.
For Against
1. To receive and consider the Report of the Directors and the Statement of the Audited Financial Statements for the year ended 31st March 2017 with the Report of the Auditors thereon.
2. To re-elect Mr.M.S.Dominic as a Director
3. To re-appoint Mr. C.J. De S. Amaratunge as a Director
4. To re-appoint Mr. T.K. Bandaranayake as a Director
5. To re-appoint Mr. J.M. Swaminathan as a Director
6. To declare a dividend of Rs 0.35 per share.
7. To authorise the Directors to determine the contribution to charity.
8. To re-appoint M/s Kreston MNS & Co., Chartered Accountants as Auditors to the Company and authorise the Directors to determine their remuneration.
Dated this …………………………. day of ……………………………. 2017.
…………………………….
Signature of Shareholder
Note:
(a) A proxy need not be a member of the Company.
(b) Instructions regarding completion appear overleaf.

RENUKA HOLDINGSANNUAL REPORT 2017104
1. 1To be valid, the completed Form of Proxy should be deposited at the Registered Office of the Company, at “Renuka
House”, No. 69, Sri Jinaratana Road, Colombo 2, on or before 4.00 p.m. on 13th September 2017 being not less than 48
hours before the time appointed for the holding of the Meeting.
2. In perfecting the Form of Proxy, please ensure that all the details are legible.
3. Please indicate with an ‘X’ in the space provided how your proxy to vote on each resolution. If no indication is given
the proxy, in his discretion, will vote, as he thinks fit.
4. In the case of a Company / Corporation, the proxy must be under its Common Seal which should be affixed and
attested in the manner prescribed by its Articles of Association.
5. In the case of proxy signed by the Attorney, the Power of Attorney must be deposited at the Registered Office at
“Renuka House”, No. 69, Sri Jinaratana Road, Colombo 2, for registration.
INSTRUCTIONS AS TO COMPLETION OF THE FORM OF PROXY

CORPORATE INFORMATIONName Of CompanyRenuka Holdings PLC
Registration No.PQ 227
Legal FormQuoted Public Company With Limited Liability
Principal ActivityIt is the holding company for subsidiaries engaged in the sectors of Agri Business (Plantations, manufac-turein & Export), FMCG (Distribution & Dairy), Auto-motive, Property & Strategic Investments.
Subsidiaries:Renuka Foods PLCRenuka Agri Foods PLCRenuka Agro Exports LtdRenuka Developments LtdRenuka Enterprises (Pvt) LtdRenuka Capital PLCRenuka Shipping & Travels (Pvt) LtdGalle Face Properties LtdRenuka Beach Hotels LtdInter Ocean Lubricants (Pvt) LtdRenuka Agri Organics LtdRenuka Consumer Foods LtdRenuka Organics (Pvt) LtdRenuka Teas Ceylon (Pvt) LtdRichlife Dairies LtdShaw Wallace Ceylon LtdShaw Wallace Properties LtdMayfair Foods (Pvt.) LtdKandy Plantations LtdCeylon Forestry (Pvt) LtdCeylon Botanicals (Pvt) LtdBois Bros. & Co. (Pvt) LtdCoco Lanka (Pvt) Ltd
Joint Venture:McShaw Automotive Ltd
Board of DirectorsMrs. I.R. Rajiyah - (Chairperson)Dr. S.R. Rajiyah Mr. C.J. De S. AmaratungeMr. S.V. Rajiyah Mr. L.M. Abeywickrama Mr. M.S. DominicMr. T.K. Bandaranayake Mr. J.M. SwaminathanMs. A.L. Rajiyah
Company SecretariesRenuka Enterprises (Pvt) Ltd.No. 69, Sri Jinaratana Road,Colombo 2.Registrar S.S.P. Corporate Services (Pvt) Ltd.No. 546, Galle Road,Colombo 3. Registered Office“Renuka House”No. 69, Sri Jinaratana Road,Colombo 2, Sri Lanka.Telephone : 0094-11-2314750-5Email : [email protected] : 0094-11-2445549Postal AddressP.O. Box 25, Colombo
Stock Exchange ListingColombo Stock Exchange
Audit Committee Mr. T.K. Bandaranayake (Chairman)Mr. J. M. SwaminathanMr. M.S. Dominic
Remuneration Committee Mr. M.S. Dominic (Chairman)Mr. L.M. AbeywickremaMr. T.K. Bandaranayake
Related Party Transactions Review CommitteeMr. T.K. Bandaranayake (Chairman)Mr. J. M. SwaminathanMr. M.S. Dominic
Nomination CommitteeMr. L.M. Abeywickrema (Chairman)Mr. M.S. DominicMr. T.K. Bandaranayake
AuditorsKreston MNS & Co, Chartered Accountants
Legal Consultants Nithya Partners – Attorneys -at-Law
Bankers National Development Bank PLCHatton National Bank PLCPeoples BankBank of CeylonCommercial Bank of Ceylon PLCHong Kong & Shanghai Banking Corporation Ltd.DFCC Bank PLC

“Renuka House” No. 69, Sri Jinaratana Road, Colombo 2, Sri Lanka.Telephone: 0094-11-2314750-5 Fax : 0094-11-2445549Email: [email protected]: www.renukagroup.com