Rent Expense Analysis for Companies in the S&P 500 · Rent Expense Analysis for Companies in the...
13
Rent Expense Analysis for Companies in the S&P 500 Executive Summary In this paper, Savills Studley analyzes rent expense for companies in the S&P 500. We explore trends by industry on both an individual company and aggregate basis. We find that while companies are largely spending more on rent in absolute dollar terms, rent expense as a percentage of total operating expense and revenue has fallen. How Much Do Companies Spend on Rent? A Look at Companies in the S&P 500 How much do companies spend on rent? Have companies’ changes in rent expenditures been commensurate with their change in revenue, and more broadly, headcount? Have companies’ occupancy costs fallen as a percentage of operating expenses?
Transcript of Rent Expense Analysis for Companies in the S&P 500 · Rent Expense Analysis for Companies in the...

Rent Expense Analysis
for Companies
in the S&P 500
Executive Summary
In this paper, Savills Studley analyzes rent expense for companies in the S&P 500. We explore trends by industry on both an individual company and aggregate basis. We find that while companies are largely spending more on rent in absolute dollar terms, rent expense as a percentage of total operating expense and revenue has fallen.
How Much Do Companies Spend on Rent?
A Look at Companies in the S&P 500
How much do companies spend on rent? Have companies’ changes in rent expenditures been commensurate with their change in revenue, and more broadly, headcount? Have companies’ occupancy costs fallen as a percentage of operating expenses?
Rent Expense Analysis for Companies in the S&P 500
2
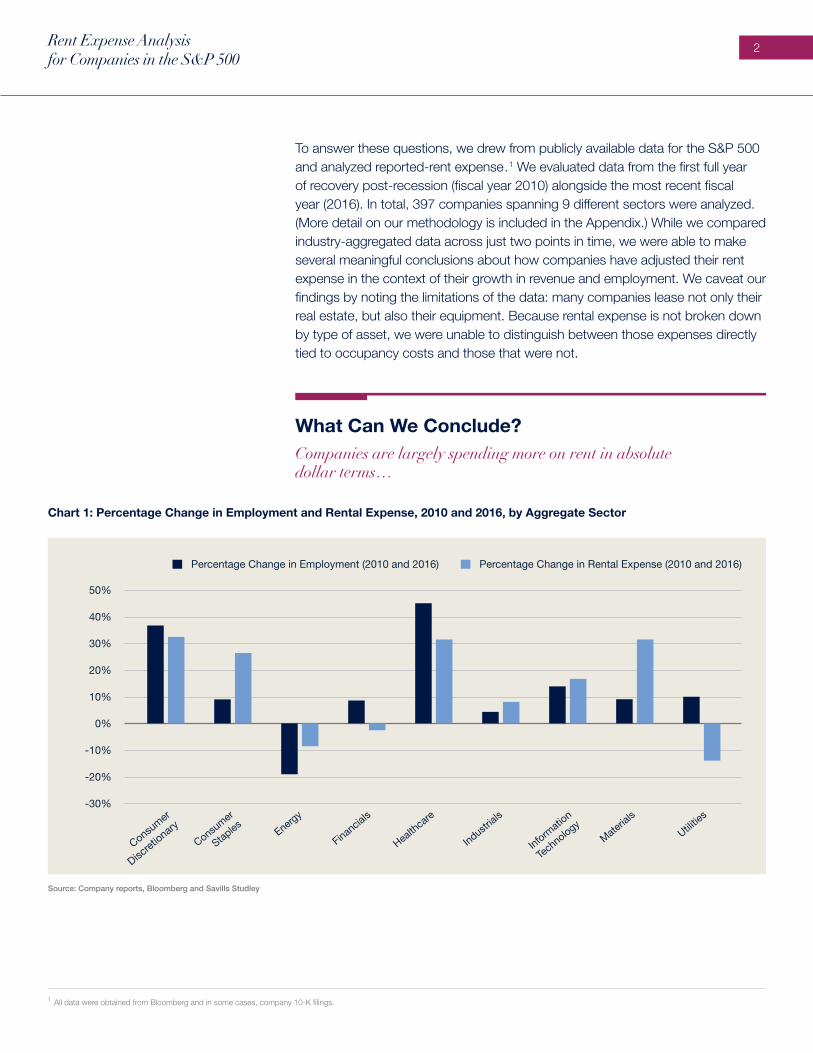
To answer these questions, we drew from publicly available data for the S&P 500 and analyzed reported-rent expense.1 We evaluated data from the first full year of recovery post-recession (fiscal year 2010) alongside the most recent fiscal year (2016). In total, 397 companies spanning 9 different sectors were analyzed. (More detail on our methodology is included in the Appendix.) While we compared industry-aggregated data across just two points in time, we were able to make several meaningful conclusions about how companies have adjusted their rent expense in the context of their growth in revenue and employment. We caveat our findings by noting the limitations of the data: many companies lease not only their real estate, but also their equipment. Because rental expense is not broken down by type of asset, we were unable to distinguish between those expenses directly tied to occupancy costs and those that were not.
What Can We Conclude?
Companies are largely spending more on rent in absolute dollar terms…
Chart 1: Percentage Change in Employment and Rental Expense, 2010 and 2016, by Aggregate Sector
Source: Company reports, Bloomberg and Savills Studley
1 All data were obtained from Bloomberg and in some cases, company 10-K filings.
40%
30%
10%
-10%
-20%
-30%
Consumer
Discret
ionary
20%
0%
Percentage Change in Employment (2010 and 2016)
50%
Percentage Change in Rental Expense (2010 and 2016)
Consumer
Staples Energ
y
Financia
ls
Health
care
Industrial
s
Informati
on
Tech
nologyMate
rials
Utilitie
s

Rent Expense Analysis for Companies in the S&P 500
3
Rental expense increased in 2016 vs. 2010 across most sectors, consistent with a broad increase in employment.2 Notable exceptions included Utilities and Energy companies, as well as Financials (Chart 1). With energy prices dropping by more than 40% over this period, the dramatic decline in headcount across firms in the Energy sector (and a smaller decline in Energy sector rental expense) should not be altogether surprising. Similarly, financial firms—and banks in particular—have taken measures to aggressively reduce expenses in the wake of a stricter regulatory climate that has restricted many former sources of revenue. For the Healthcare and Consumer Discretionary sectors—where headcount grew the most—rental expenses grew, but at a slower pace than the corresponding increase in employment.
…but are spending less on rent as a percentage of operating expenses and revenues.
Even as rent comprises a relatively small fraction of overall operating expense (and an even smaller percentage of revenue), aggregate rent expenditures across all industries increased by 14% in fiscal year 2016 vs. 2010. However, this increase is substantially smaller than the overall increase in operating expenses over the same time period, which rose by more than 25%. With the exception of a few sectors (such as Materials, where companies likely lease a significant amount of equipment in the course of normal operations) rent as a percentage of adjusted operating expense3 (Chart 2) and revenue (Chart 3) fell or remained flat.
Chart 2: Rent as a Percentage of Adjusted Operating Revenue, 2010 and 2016, by Aggregate Sector
Source: Company reports, Bloomberg and Savills Studley
18%
15%
9%
3%
Consumer
Discret
ionary
12%
6%
Rent as a % of Adjusted Operating Expense (2010)
21%
Rent as a % of Adjusted Operating Expense (2016)
Consumer
Staples Energ
y
Financia
ls
Health
care
Industrial
s
Informati
on
Tech
nologyMate
rials
Utilitie
s0%
2 Many companies only report aggregate employment totals, which typically exclude contract workers. Where companies provided full-time and part-time workers, we included the combined figure. 3 To account for one-time expenses and profits, such as those from restructuring charges or gains on divestitures, we used adjusted operating expense, rather than GAAP operating expense, in order to make the figures more comparable across time.
Companies are largely spending
more on rent in absolute dollar terms…but are
spending less on rent as a percentage
of operating expenses and
revenue.

Rent Expense Analysis for Companies in the S&P 500
4
Chart 3: Rent as a Percentage of Revenue, 2010 and 2016, by Aggregate Sector
Source: Company reports, Bloomberg and Savills Studley
*Adjusted net revenue, which includes the effect of interest expense, is used for financial firms
1.5%
0.5%
Consumer
Discret
ionary
2.0%
1.0%
Rental Expense as % Revenue (2010)
2.5%
Rental Expense as % Revenue (2016)
Consumer
Staples Energ
y
Financia
ls
Health
care
Industrial
s
Informati
on
Tech
nologyMate
rials
Utilitie
s0.0%
Do the conclusions differ when growth in rents and rental expense as a percentage of revenue and adjusted operating expense is calculated on an individual company basis? While the prior analysis aggregates data by sector—giving more weight to larger companies—do smaller companies show different patterns of rent growth from their larger counterparts? We looked at 40 companies in the Financials sector and calculated rental growth, rent expense as a percentage of adjusted operating expense and rent expense as a percentage of adjusted net revenue on a company-by-company basis.4 The companies varied widely by size and annual expenditures; CBOE Holdings spent $4.4M in rent expense in fiscal 2016, while the corresponding figure for JPMorgan Chase was $1.7B. Perhaps not surprisingly, the larger firms, where economies of scale were likely greatest, seem to have been the most aggressive in reducing rental expense costs. This finding is highlighted in Table 1, which shows that while aggregate rents for the sector fell in 2016 vs. 2010, the average percentage change in rent across each individual firm actually rose.
Financial firms with the highest relative rent expenditures appear to have been more likely to see a subsequent decline in rents: while rent expense fell by 52% at Goldman Sachs in 2016 vs. 2010 (2010 rent expense: $508M) and by 31% at Citigroup (2010 rent expense: $1.6B), most of those firms that saw an increase in their rent expense were firms with low levels of spending relative to their peers. Leucadia National’s rent expense increased by 470%, but it climbed from just $14.1M to $80.4M, for example. Next, we test whether this finding is statistically significant.
4 Adjusted net revenues, rather than revenues, were used for all financial companies (where available) to more accurately conform to the standard of reporting net, rather than gross, interest income.

Rent Expense Analysis for Companies in the S&P 500
5
Table 1: Weighted versus Unweighted Rent Metrics for Financials
Source: Company reports, Bloomberg and Savills Studley
Weighted Average
UnweightedAverage
Increase in Rental Expense: 2010-2016 -2.3%
Rent Expense, % of Adjusted Operating Expense, 2010 3.3%
Rent Expense, % of Adjusted Operating Expense, 2016 2.9%
Rent Expense, % of Adjusted Net Revenue, 2010 2.0%
Rent Expense, % of Adjusted Net Revenue, 2016 1.9%
3.6%
3.2%
2.0%
1.7%
26.6%
Are the Companies with the Highest Rent Expenditures More Likely to Trim Rent Expense? Most companies increased their rental expense in 2016 vs. 2010, as shown in Columns A and B in Table 2. However, in some sectors, companies with higher rent expenditures relative to their peers were statistically more likely to see a reduction in future rents than their smaller rent-spending counterparts. In these cases, the largest companies (with the largest rent expenses) appear to have proactively sought to reduce their rent expenditures.
We divided the companies within each sector into two groups: those with 2010 rent expense below the median rent expense for the sector, and those with rent expense above the median. By definition, an equal number of companies fell into the two categories. We then tallied how many companies in each of these two groups saw rents increase in 2016, based on whether their 2010 rent expenses were above or below the median.
If relative rent spending in 2010 had no bearing on whether a given company was more likely to increase rents in 2016, then we would expect to see an equal number of companies with rents above (Column C) and below (Column D) the 2010 median with a subsequent increase in 2016 rent expense. However, for companies in the Financials and Industrial sectors, this was not true. The companies with the largest rent expenditures in 2010 were much more likely to have 2016 rent expenditures that declined than advanced. For example, of the 23 financial companies where rents increased (Column B), only 6 out of these 23 firms (26%) had 2010 rents above the 2010 median (Column C)—an occurrence that leads us to reject the hypothesis that future increases in rent are independent of relative rent expense today.5
5 The likelihood of “high rent” versus “low rent” companies in 2010 experiencing similar probabilities of an increase in rental expense in 2016 was measured by “Fisher’s Exact Test” for small populations, which is used to examine the significance of the association (or contingency) between two kinds of classifications—in this case, between the relative levels of rent spending and the likelihood that rents subsequently increase. We reject the hypothesis that rent increases are independent of relative rent spending for Financials and Industrials with a 95% level of confidence.

Rent Expense Analysis for Companies in the S&P 500
6
Table 2: “High Rent” versus “Low Rent” Companies with Subsequent Increases in Rental Expense by Sector
Source: Company reports, Bloomberg and Savills Studley
Number of Companies Included in Analysis
Consumer Discretionary 73
Consumer Staples 31
Energy 31
Financials 40
Healthcare 54
Industrials 61
Information Technology 62
Materials 22
Utilities 23
Number of Companies With Increase in Rent Expense in 2016 vs. 2010
56
22
19
23
43
40
39
16
6
Number of Companies With Increase in Rent Expense in 2016 vs. 2010, 2010 Rents > Median 2010 Rent
27
12
7
6
20
16
16
8
3
Number of Companies With Increase in Rent Expense in 2016 vs. 2010, 2010 Rents < Median 2010 Rent
29
10
12
17
23
24
23
8
3
Sector
A B C D
Our conclusion that the probability of a rent increase is independent of a company’s relative spending on rent in both the Financial and Industrial sectors ignores the fact that our sample included only established companies; a different result might have been obtained if companies were grouped on the basis of revenue growth or age. For example, increases in rent expense might have been more likely for start-ups than more mature companies in the same sector in the S&P 500. Additionally, our analysis disregards any company-specific issues; a company that restructures and lays off a significant number of workers might see rent expenses fall even if their peers are expanding. To account for these factors, we repeated the analysis, sorting not by 2010 rent, but by 2010 rent as a percentage of adjusted operating expense (“R%AOE”) instead as shown in Table 3. (A company that is undergoing a major downsizing is likely to see its overall operating expenses decline, of which a decline in rent expense is one part.) Fewer companies experienced an increase in rent expressed relative to total adjusted expenses in 2016 vs. 2010 (Column F in Table 3 vs. Column B in Table 2), but there was no difference between those companies that were “high” (Column G) vs. “low” (Column H) rent spenders (as measured by R%AOE) in 2010 and those companies that subsequently saw an increase in this ratio from a statistical standpoint. Companies likely focus on minimizing overall operating expenses, rather than on any one component such as rent.

Rent Expense Analysis for Companies in the S&P 500
7
Table 3: “High Rent” versus “Low Rent” as a Percentage of Adjusted Operating Expense by Sector
Source: Company reports, Bloomberg and Savills Studley
Number of Companies Included in Analysis
Consumer Discretionary 73
Consumer Staples 31
Energy 31
Financials 40
Healthcare 54
Industrials 61
Information Technology 62
Materials 22
Utilities 23
Number of Companies With Increase in R%AOE,2016 vs. 2010
28
13
16
9
12
20
21
9
5
Number of Companies With Increase in R%AOE,2016 vs. 2010, 2010 R%AOE > 2010 Median R%AOE
13
8
7
5
5
11
8
5
1
Number of Companies With Increase in R%AOE,2016 vs. 2010, 2010 R%AOE < 2010 Median R%AOE
15
5
9
4
7
9
13
4
4
Sector
Looking ahead, we suspect that the new FASB lease reporting requirement, which takes effect in 2019, will heighten the attention paid to lease expenses. While income statement treatment for operating leases will remain the same under the new guidelines, balance sheet treatment will change dramatically, as all leases (and not just finance leases) are brought on balance sheet. The presence of a “front-loaded” operating lease liability that amortizes on a non-linear basis and increases over the life of the lease may force companies to take a closer look at their occupancy costs from leased real estate as investors and lenders alike evaluate and interpret these new measures of indebtedness.
Heidi Learner Chief Economist [email protected] 212.326.8648
With research assistance from summer intern, Walter Abrams.
E F G H

Appendix I
Methodology
Since the purpose of the analysis was to estimate rental expenses in the context of total operating expenses and total headcount, we excluded several categories of companies where such examination was not possible as follows:
1 REITs. Rent expense for worker occupancy purposes was not readily available.
2 Insurers. Insurers do not report operating expense in a manner similar to other publicly traded companies, given the inclusion of policyholder benefits and claims, among other items.
3 Restaurants. Rent expense is considered part of the cost of goods sold, rather than an operating expense.
4 Telecommunication companies. With just four companies, we excluded the sector given the small number of constituents.
We also omitted any companies where all data (revenue, headcount, operating expense and rental expense) were not available for both fiscal 2010 and 2016, whether due to incomplete reporting or merger/privatization activity, and excluded companies with zero or immaterial operating lease expenses. Additionally, we excluded companies where rent expense exceeded 100% of a company’s operating expense or adjusted operating expense; it is atypical for a company’s rent expense to exceed its operating expense in a given year since rent expense is just one of many items included in operating expense.
We used non-GAAP “adjusted operating expense” rather than its unadjusted counterpart, so that one-time items did not distort the underlying trajectory of companies’ revenues and expenses.
All data presented are for fiscal 2010 and fiscal 2016; for companies such as retailers, whose fiscal year typically incorporates Christmas and several months following the holiday, fiscal years ended in 2011 and 2017.
Unless otherwise disclosed, metrics (such as rent as a percentage of adjusted operating expense) are presented on an aggregated basis, calculated using data across all companies within a sector, rather than as an average of individual company ratios within a sector.

Appendix II
List of All S&P 500 Companies Included in Analysis
Consumer Discretionary
Best Buy Co Inc. Gap Inc. TJX Companies Inc. Home Depot Inc. Staples Inc. Walt Disney Company General Motors Company Ford Motor Company CBS Corp. Twenty-First Century Fox Foot Locker Inc. L Brands Inc. Dollar General Corp. Bed Bath & Beyond Inc. Comcast Corp. Nike Inc. Omnicom Group Lowe's Cos Inc. Time Warner Inc. Dollar Tree Inc. Ross Stores Inc. Interpublic Group Goodyear Tire & Rubber CompanyMarriott International Ralph Lauren Corp.Signet Jewelers Ltd.Advance Auto Parts Inc.PVH Corp.Kohl’s Corp.Dish Network Corp.Macy's Inc.O'Reilly Automotive Inc.Amazon.com Inc.H&R Block Inc.Whirlpool Corp.Target Corp.AutoZone Inc.
Tiffany & Co.VF Corp.Coach Inc.Tractor Supply CompanyGenuine Parts CompanyNewell Brands Inc.Mattel Inc.Mohawk Industries Inc.Delphi Automotive plcCarMax Inc.Discovery CommunicationsUlta Beauty Inc.Wyndham Worldwide Corp.LKQ Corp.Hanesbrands Inc.Nordstrom Inc.Carnival Corp.AutoNation Inc.Royal Caribbean Cruises Ltd.Expedia Inc.Michael Kors Holdings Ltd.Leggett & Platt Inc.Hasbro Inc.Lennar Corp.PulteGroup Inc.Charter Communications Inc.BorgWarner Inc.DR Horton Inc.Wynn Resorts Ltd.Scripps Networks InteractiveUnder Armour Inc.Netflix Inc.Garmin Ltd.Harley-Davidson Inc.Priceline Group Inc.Tripadvisor Inc.
Rent Expense Analysis for Companies in the S&P 500
10
Customer Staples
Walgreens Boots Alliance Inc.CVS Health Corp.Wal-Mart Stores Inc.Kroger CompanyPepsico Inc.Mondelez International Inc.Whole Foods Market Inc.Kimberly-Clark Corp.Philip Morris InternationalEstee Lauder CompaniesArcher-Daniels-Midland CompanyColgate-Palmolive CompanyTyson Foods Inc.Costco Wholesale Corp.Kellogg CompanyGeneral Mills Inc.Conagra Brands Inc.Constellation Brands Inc. Dr. Pepper Snapple Group Inc.Sysco Corp.Clorox CompanyAltria Group Inc.JM Smucker Co.Campbell Soup Co.Molson Coors Brewing CompanyMcCormick & Co.Hormel Foods Corp.Brown-Forman Corp.Reynolds American Inc.Church & Dwight Company Inc.Monster Beverage Corp.
Energy
Schlumberger Ltd.Transocean Ltd.Chevron Corp.EQT Corp.Murphy Oil Corp.ExxonMobil Corp.Baker Hughes Inc.
TechnipFMC plcCabot Oil & Gas Corp.Valero Energy Corp.Tesoro Corp.National Oilwell Varco Inc.ConocoPhillipsApache Corp.Occidental Petroleum Corp.Devon Energy Corp.Cimarex Energy Co.Marathon Oil Corp.Anadarko Petroleum Corp.Newfield Exploration Co.Pioneer Natural Resources Co.Range Resources Corp.Helmerich & PayneEOG Resources Inc.Kinder Morgan Inc.Noble Energy Inc.Hess Corp.Chesapeake Energy Corp.Marathon Petroleum Corp.Concho Resources Inc.Williams Companies, Inc.
Financials
Berkshire Hathaway Inc.S&P Global Inc.Nasdaq Inc.Moody’s Corp.Schwab (Charles) Corp.Regions Financial Corp.Comerica Inc.M & T Bank Corp.PNC Financial Services GroupPeople’s United Financial, Inc.KeyCorpState Street Corp.Intercontinental Exchange Inc.Zions BancorporationMorgan StanleyBB&T Corp.Leucadia National Corp.Citigroup Inc.

Rent Expense Analysis for Companies in the S&P 500
11
Bank of New York Mellon Corp.JPMorgan Chase & Co.CME Group Inc.Suntrust Banks Inc.Huntington Bancshares Inc.BlackRock Inc.U.S. BancorpNorthern Trust Corp.Wells Fargo & Co.Fifth Third BancorpCapital One Financial Corp.Affiliated Managers GroupE*Trade Financial Corp.Raymond James Financial Inc.Goldman Sachs Group Inc.T. Rowe Price Group Inc.Invesco Ltd.Franklin Resources Inc.Ameriprise Financial Inc.American Express Co.CBOE Holdings Inc.Discover Financial Services
Healthcare
Merck & Co., Inc.Pfizer Inc.Eli Lilly & Co.Johnson & JohnsonUnitedHealth Group Inc.Davita Inc.Laboratory Corporation of America HoldingsQuest Diagnostics Inc.Anthem Inc.Baxter International Inc.McKesson Corp.Aetna Inc.Medtronic plcDanaher Corp.Humana Inc.Bristol-Myers Squibb Co.Cigna Corp.Thermo Fisher Scientific Inc.Amgen Inc.
Boston Scientific Corp.Agilent Technologies Inc.Stryker Corp.Cardinal Health Inc.Becton Dickinson and CompanyHenry Schein Inc.AmerisourceBergen Corp.PerkinElmer Inc.Vertex Pharmaceuticals Inc.Zimmer Biomet Holdings Inc.Biogen Inc.Gilead Sciences Inc.Express Scripts Holding Co.Celgene Corp.Dentsply Sirona Inc.Mylan NVMettler-Toledo InternationalCooper Cos Inc.Waters Corp.Allergan plcVarian Medical Systems Inc.C.R. Bard Inc.Centene Corp.Cerner Corp.Patterson Companies, Inc.Edwards Lifesciences Corp.Hologic Inc.Perrigo Co plcUniversal Health ServicesIllumina Inc.Idexx Laboratories Inc.Regeneron PharmaceuticalsAlexion Pharmaceuticals Inc.Incyte Corp.Align Technology Inc.
Materials
Dow Chemical Co.Sherwin-Williams Co.LyondellBasell IndustriesE.I. du Pont de NemoursPPG Industries Inc.International Paper Co.Monsanto Co.

Rent Expense Analysis for Companies in the S&P 500
12
Ecolab Inc.Praxair Inc.Avery Dennison Corp.Air Products & Chemicals Inc.Mosaic Co.CF Industries Holdings Inc.Ball Corp.Vulcan Materials Co.Martin Marietta MaterialsNewmont Mining Corp.Eastman Chemical Co.Sealed Air Corp.Albemarle Corp.International Flavors & FragrancesFMC Corp.
Utilities
Note: Edison International rent expense excludes power purchase agreements, but includes office space, vehicles and other equipment.
Exelon Corp.Edison InternationalAmerican Electric PowerFirstEnergy Corp.Xcel Energy Inc.Southern CompanyDominion Energy Inc.Duke Energy Corp.NRG Energy Inc.PPL Corp.Sempra EnergyEntergy Corp.Centerpoint Energy Inc.NiSource Inc.AES Corp.DTE Energy CompanyAmerican Water Works Company Inc.Ameren CorporationCMS Energy Corp.PG&E Corp.Pinnacle West CapitalEversource EnergyScana Corp.
Information Technology
Note: Mastercard rent expense includes only office rent expense.
Intl Business Machines Corp.HP Inc.Xerox Corp.Microsoft Corp.Accenture plcOracle Corp.Cisco Systems Inc.Alphabet Inc.Apple Inc.Facebook Inc.Automatic Data ProcessingCA Inc.TE Connectivity Ltd.Intel Corp.Motorola Solutions Inc.Fidelity National Info Services, Inc.eBay Inc.Fiserv Inc.Adobe Systems Inc.Total System Services Inc.Texas Instruments Inc.Electronic Arts Inc.Cognizant Tech SolutionsSymantec Corp.Qualcomm Inc.Corning Inc.NetApp Inc.Visa Inc.Juniper Networks Inc.Citrix Systems Inc.Alliance Data Systems Corp.Salesforce.com Inc.Autodesk Inc.Synopsys Inc.Paychex Inc.Applied Materials Inc.Advanced Micro DevicesIntuit Inc.Micron Technology Inc.Nvidia Corp.

Rent Expense Analysis for Companies in the S&P 500
13
Analog Devices Inc.Harris Corp.Activision Blizzard Inc.Western Union Co.Global Payments Inc.Amphenol Corp.Mastercard Inc.Seagate TechnologyAkamai Technologies Inc.Gartner Inc.Red Hat Inc.Western Digital Corp.F5 Networks Inc.Teradata Corp.FLIR Systems Inc.Broadcom Ltd.Ansys Inc.KLA-Tencor Corp.Microchip Technology Inc.Skyworks Solutions Inc.Lam Research Corp.Xilinx Inc.
Industrials
FedEx Corp.United Continental HoldingsGeneral Electric Co.American Airlines Group Inc.Delta Air Lines Inc.Southwest Airlines CompanyUnion Pacific Corp.United Parcel ServiceNorthrop Grumman Corp.United Technologies Corp.Johnson Controls InternationalHoneywell International Inc.Caterpillar Inc.Emerson Electric Co.Raytheon CompanyAlaska Air Group Inc.Boeing Company3M CompanyGeneral Dynamics Corp.Norfolk Southern Corp.
Ingersoll-Rand plcDeere & Co.L3 Technologies Inc.Eaton Corporation plcIllinois Tool WorksStanley Black & Decker Inc.Cummins Inc.Jacobs Engineering Group Inc.United Rentals Inc.Kansas City SouthernParker Hannifin Corp.Waste Management Inc.Fastenal Co.Masco Corp.Quanta Services Inc.Rockwell Automation Inc.Robert Half Intl Inc.Nielsen Holdings plcTextron Inc.Dover Corp.CSX Corp.Rockwell Collins Inc.Stericycle Inc.Expeditors Intl Wash Inc.Xylem Inc.W.W. Grainger Inc.Republic Services Inc.Flowserve Corp.Cintas Corp.C.H. Robinson Worldwide Inc.Fortune Brands Home & Security Inc.Snap-On Inc.Pentair plcPaccar Inc.Roper Technologies Inc.Verisk Analytics Inc.Ametek Inc.J.B. Hunt Transportations Services Inc.Equifax Inc.Acuity Brands Inc.Transdigm Group Inc.


![· Gift]Awards/MemoriaIs Expense Legal Services Food/Beverage Expense Polling Expense Printing Expense Salaries/Wages/Contract Labor Solicitation/Fundraising Expense](https://static.fdocuments.net/doc/165x107/5c5ef74209d3f2515c8cf3a9/-giftawardsmemoriais-expense-legal-services-foodbeverage-expense-polling-expense.jpg)