Combining energy efficiency & renewables in a sustainable energy system
RENEWABLESGLOBAL STATUS REPORT
2006 Update
www.ren21.net
www.ren21.net
REN21 Steering Committee
Sultan Al-JaberMubadala Development Co.United Arab Emirates
Paulo José Chiarelli Vicente de AzevedoMinistry of External RelationsBrazil
Richard BurrettABN AMRO, Sustainable Development
James CameronClimate Change Capital
Corrado CliniMinistry for the Environment and TerritoryItaly
Michael EckhartAmerican Council on Renewable Energy
Mohamed El-AshryUnited Nations Foundation
Amal HaddoucheCentre de Développement des EnergiesRenouvelablesMorocco
David HalesCollege of the Atlantic United States
Neil HirstEnergy Technology Collaboration DivisionInternational Energy Agency
Michael HofmannFederal Ministry for Economic Cooperationand DevelopmentGermany
Richard HosierGlobal Environment Facility
Jackie JanesDepartment for Environment, Food andRural AffairsUnited Kingdom
Stephen KarekeziAfrican Energy Policy Research Network
Olav KjorvenEnergy and Environment GroupUnited Nations Environment Programme
Hans-Jorgen KochDanish Energy AuthorityDenmark
Li JunfengNational Development and Reform Commission, Energy Research InstituteChinese Renewable Energy Industries AssociationChina
Jennifer Morgan Climate Change ProgrammeWWF
Paul Mubiru Ministry of Energy and Mineral DevelopmentUganda
Rajendra Pachauri The Energy and Resources InstituteIndia
Wolfgang PalzWorld Council for Renewable Energy
Mark RadkaDivision of Technology, Industry and EconomicsUnited Nations Environment Programme
Peter RaeWorld Wind Energy Association
Artur Runge-Metzger DG Environment: Climate, Ozone and EnergyEuropean Commission
Jamal Saghir Energy and WaterThe World Bank
Steve SawyerClimate and EnergyGreenpeace
Virginia Sonntag-O’BrienBasel Agency for Sustainable Energy
Ernst-Christoph StolperNetwork of Regional Governments for Sustainable Development
Griffin ThompsonDepartment of StateUnited States
Ibrahim TogolaMali Folkecenter / Citizens United for Renewable Energy and Sustainability
Arthouros ZervosEuropean Renewable Energy Council Global Wind Energy Council
Ton van der ZonMinistry of Foreign AffairsNetherlands
Disclaimer
REN21 issue papers and reports are released by REN21 to emphasize the importance of renewable energy, and to generate discussion ofissues central to the promotion of renewable energy. While REN21 papers and reports have benefited from the considerations and inputfrom the REN21 community, they do not necessarily represent a consensus among network participants on any given point. Although theinformation given in this report is the best available to the authors at the time, REN21 and its participants cannot be held liable for its accu-racy and correctness.
Renewable Energy Policy Network for the 21st Century
REN21 is a global policy network in which ideas are shared and action is encouraged to promote renewable energy. It providesa forum for leadership and exchange in international policy processes. It bolsters appropriate policies that increase the wiseuse of renewable energies in developing and industrialized economies.
Open to a wide variety of dedicated stakeholders, REN21 connects governments, international institutions, nongovern-mental organizations, industry associations, and other partnerships and initiatives. Linking actors from the energy, develop-ment, and environment communities, REN21 leverages their successes and strengthens their influence for the rapid expansionor renewable energy worldwide.

2006 Update RENEWABLES GLOBAL STATUS REPORT
Lead Author and Research Director
Eric Martinot, Worldwatch Institute and Tsinghua University
Sponsors
German Federal Ministry for Economic Cooperation andDevelopment; German Federal Ministry for Environment,Nature Protection, and Nuclear Safety
Producer
Worldwatch Institute and Deutsche Gesellschaft für Tech-nische Zusammenarbeit (GTZ) GmbH
REN21 Secretariat
Paul Suding and Philippe Lempp
Editing, Design, and Layout
Lisa Mastny and Lyle Rosbotham (Worldwatch Institute)
Country Correspondents
Europe and Germany: Manfred Fischedick and FrankMerten (Wuppertal Institute)
United States: Chris Flavin and Janet Sawin (WorldwatchInstitute); Ryan Wiser (Lawrence Berkeley National Laboratory)
Brazil: Jose Roberto Moreira (Biomass Users Network Brazil)Canada: Jose Etcheverry (David Suzuki Foundation)China: Eric Martinot, Liu Weiliang, and Chai Qimin
(Tsinghua University) and Frank Haugwitz (GTZ)Eastern Africa: Waeni Kithyoma and Derrick Okello
(African Energy Policy Research Network)India: Akanksha Chaurey (The Energy and Resources
Institute)Indonesia: Fabby Tumiwa (Indonesia NGOs Working
Group on Power Sector Restructuring)Japan: Mika Obayashi and Tetsunari Iida (Institute for
Sustainable Energy Policies)Korea: Kyung-Jin Boo (Korean Energy Economics Institute)Mexico: Odon de Buen (National Autonomous University
of Mexico)Philippines: Molly Aeck (Worldwatch Institute) and Red
Constantino (Greenpeace)Spain: Miquel Muñoz and Josep Puig (Autonomous
University of Barcelona)Thailand: Samuel Martin (Asian Institute of Technology)
and Chris Greacen (Palang Thai)
Topical Researchers and Contributors
OECD countries: Piotr Tulej, Jane Barbiere, and SamanthaÖlz (International Energy Agency)
Developing countries: Anil Cabraal, Charles Feinstein,Kilian Reiche, Xiaodong Wang (World Bank)
Wind power markets: Arthouros Zervos (Global WindEnergy Council)
Geothermal markets: John Lund (International GeothermalAssociation/Oregon Institute of Technology)
Solar PV: Paul Maycock (PV Energy Systems); Travis Bradford and Hilary Flynn (Prometheus Institute)
Concentrating solar thermal markets: Fred Morse (MorseAssociates)
Solar hot water markets: Werner Weiss and Irene Bergman(IEA Solar Heating and Cooling Program)
Biofuels: Suzanne Hunt and Peter Stair (Worldwatch Institute)
Companies: John Michael Buethe (Georgetown University);Michael Rogol (Massachusetts Institute of Technologyand CLSA Asia-Pacific)
Jobs: Daniele Guidi (Ecosoluzioni)CO2 emissions: Uwe Fritsche (Öko-Institut)Cities: John Byrne (University of Delaware); Jong-dall Kim
(Kyungpook National University)Energy subsidies: Doug Koplow (Earth Track)
Special Supplement on Private Financeand Investment Trends
Virginia Sonntag-O’Brien, Jasmine Hyman, Akif Chaudhry(BASE/UNEP SEFI); Eric Usher (UNEP SEFI)
Reviewers and Other Contributors
Jeff Bell (World Alliance for Decentralized Energy); VerenaBrinkmann (GTZ); Alyssa Frederick (American Council forRenewable Energy); Thomas Johansson (Lund University);Alyssa Kagel (U.S. Geothermal Energy Association); DanKammen (University of California Berkeley); Simon Kop-pers (German Federal Ministry for Economic Cooperationand Development); Debra Lew (National Renewable EnergyLaboratory); Michael Liebreich (New Energy Finance); LiuDehua (Tsinghua University); Liu Jinghe (China EnergyResearch Society); Luo Zhentao (China Association of SolarThermal Application); Bazilian Morgan (Sustainable EnergyIreland); Qin Haiyan (China Wind Energy Association);Wilson Rickerson (Bronx Community College); JamalSaghir (World Bank); Martin Schöpe (German Federal Min-istry for Environment, Nature Protection and NuclearSafety); Shi Pengfei (China Wind Energy Association);Ralph Sims (Massey University, and IEA); Scott Sklar (StellaGroup); Richard Taylor (International Hydropower Associa-tion); Dieter Uh (GTZ); Bill Wallace (China UNDP Renew-able Energy Capacity Building Project); Wang Sicheng(Beijing Jike); Wang Wei (China World Bank REDP Pro-ject); Wang Zhongying (China Energy Research Institute);Christine Woerlen (Global Environment Facility).
ACKNOWLEDGMENTS
CONTENTS
RENEWABLES GLOBAL STATUS REPORT 2006 Update PAGE 1
Executive Summary . . . . . . . . . . . . . . . . . . . . . 2
Selected Indicators and Top Five Countries . . . 3
1. Global Market Overview . . . . . . . . . . . . . . . 4
2. Investment Flows . . . . . . . . . . . . . . . . . . . . . 6
3. Industry Trends . . . . . . . . . . . . . . . . . . . . . . 7
4. Policy Landscape . . . . . . . . . . . . . . . . . . . . . 8
Policy Targets for Renewable Energy . . . . . . . . 8
Power Generation Promotion Policies . . . . . . . 9
Solar Hot Water/Heating Policies . . . . . . . . . . 10
Biofuels Policies . . . . . . . . . . . . . . . . . . . . . . . 10
Municipal-Level Policies . . . . . . . . . . . . . . . . . 11
5. Rural (Off-Grid) Energy . . . . . . . . . . . . . . . 11
Special Supplement: Private Finance and Investment Trends . . . . . 13
Sources of Data . . . . . . . . . . . . . . . . . . . . . . . 16
Reference Tables . . . . . . . . . . . . . . . . . . . . . . 17
Notes . . . . . . . . . . . . . . . . . . . . . . . . . . . . . . . 24
Supplementary References . . . . . . . . . . . . . . 31
Figures and Tables
Figure 1. Wind Power, Existing World Capacity, 1990–2005 . . . . . . . . . . . . . . . . . . 4
Figure 2. Wind Power Capacity, Top 10 Countries, 2005 . . . . . . . . . . . . . . . . 4
Figure 3. Solar PV, Existing World Capacity,1990–2005 . . . . . . . . . . . . . . . . . . . . . . . . . . 4
Figure 4. Renewable Power Capacities forDeveloping Countries, EU, and Top 6Individual Countries, 2005 . . . . . . . . . . . . . . 5
Figure 5. Solar Hot Water/Heating Capacity Added in 2005 . . . . . . . . . . . . . . . 5
Figure 6. Solar Hot Water/Heating Capacity Existing in 2005 . . . . . . . . . . . . . . . 5
Figure 7. World Fuel Ethanol Production, 2000 and 2005 . . . . . . . . . . . . . . . . . . . . . . 6
Figure 8. World Biodiesel Production, 2000–2005 . . . . . . . . . . . . . . . . . . . . . . . . . 6
Figure 9. Annual Investment in Renewable Energy, 1995–2005 . . . . . . . . . . 7
Figure 10. EU Renewable Energy Targets—Share of Electricity by 2010 . . . . . . 8
Table 1. Renewable Energy Added and Existing Capacities, 2005 . . . . . . . . . . . . . . 17
Table 2. Added and Existing Wind Power, Top 10 Countries, 2005 . . . . . . . . . 18
Table 3. Grid-Connected Solar Rooftop Programs, 2005 . . . . . . . . . . . . . . . . . . . . . 18
Table 4. Renewable Electric Power Capacity, 2005 . . . . . . . . . . . . . . . . . . . . . . 20
Table 5. Solar Hot Water Installed Capacity, Top 10 Countries/EU and World Total, 2005 . . . . . . . . . . . . . . . . . . . 21
Table 6. Biofuels Production, Top 15 Countries plus EU, 2005 . . . . . . . . . . . . . . 22
Table 7. Cumulative Number ofCountries/States/Provinces Enacting Feed-in Policies . . . . . . . . . . . . . . . . . . . . . 23
Table 8. Cumulative Number ofCountries/States/Provinces Enacting RPS Policies, 2005 . . . . . . . . . . . . . . . . . . . 23
Suggested Citation
REN21. 2006. “Renewables Global Status Report 2006 Update” (Paris: REN21 Secretariat and Washington, DC: Worldwatch Institute).
PAGE 2 2006 Update RENEWABLES GLOBAL STATUS REPORT
This update covers major changes since mid-2005 when theRenewables 2005 Global Status Report was written. Back-ground and further information is contained in the originalreport, available at www.ren21.net.
ecord investment in new renewable energycapacity occurred in 2005—$38 billion, upfrom $30 billion in 2004. Germany and Chinawere the investment leaders, with about $7 bil-
lion each, followed by the United States, Spain, Japan, andIndia. Wind power registered the second highest addedcapacity, almost as much as large hydropower, with existingcapacity growing 24 percent to reach 59 gigawatts (GW).Biomass power production saw 50–100 percent increases in annual production in several countries in 2004. Highgrowth rates also occurred in biodiesel (85 percent increasein annual production) and grid-connected solar PV (55 per-cent increase in existing capacity). Solar hot water existingcapacity grew by 23 percent in China and reached recordlevels across Europe as well. And construction began in theUnited States and Spain on the world’s first utility-scalesolar thermal power plants in 20 years.
Country leadership changed or broadened in severalareas. Germany leapt ahead of Japan in grid-connected solarPV, adding 600 megawatts (MW) in one year to achieve ahigher cumulative capacity. The United States was the leaderin wind power additions for the first time since 1992, whileat the same time India’s existing capacity surpassed wind-pioneer Denmark. Ten countries added over 300 MW ofwind, up from five countries that did so in 2004. Indiapassed Japan in total renewable power capacity. In ethanol,U.S. production caught up to Brazil, long the world’s lead-ing producer, and three new European Union (EU) coun-tries became producers. In biodiesel, nine new EU countriesbecame producers.
The renewables industry captured investors attention, asthe number of renewable energy companies or divisionswith market valuations greater than $40 million increasedfrom 60 to 85. The estimated total valuation of companiesin this category was $50 billion, double the 2004 estimate, asseveral high-profile initial public offerings took place. Thesolar PV industry invested record amounts in new plant andequipment (about $6 billion), as did the biofuels industry(more than $1 billion). The wind industry continued inter-national production expansion, including in Australia andChina, where Vestas, Gamesa, Suzlon, Acciona, and GEEnergy were all establishing manufacturing facilities.
Policies were extended, revised, and added. Several EUcountries revised or supplemented feed-in policies. TheUnited States extended its production tax credit through2007. A number of countries dramatically stepped up tar-gets for biofuels and at least 10 states/provinces and sixcountries added blending mandates. Several EU countriesenacted new biofuels tax exemptions. New feed-in laws wereenacted in four states/provinces in India and Canada. Spainbecame the first country to mandate solar PV in new con-struction and the second country (after Israel) to mandatesolar hot water in new buildings as a national policy. Initia-tives for grid-connected solar PV multiplied, including Cali-fornia’s new policy for a million solar roofs by 2017 andprograms in several U.S. states, Australia, China, and the EU.New city-level targets appeared, including a proposal byTokyo to reach a 20 percent share of renewables in primaryenergy consumption by 2020.
Developing countries took new steps in record numbersto incorporate renewables into their energy systems, includ-ing programs and new policy developments in Brazil, Chile,Colombia, Egypt, India, Iran, Madagascar, Malaysia, Mexico,Morocco, Pakistan, the Philippines, South Africa, Thailand,Tunisia, Turkey, and Uganda.
EXECUTIVE SUMMARY
R
RENEWABLES GLOBAL STATUS REPORT 2006 Update PAGE 3
SELECTED INDICATORS AND TOP FIVE COUNTRIES
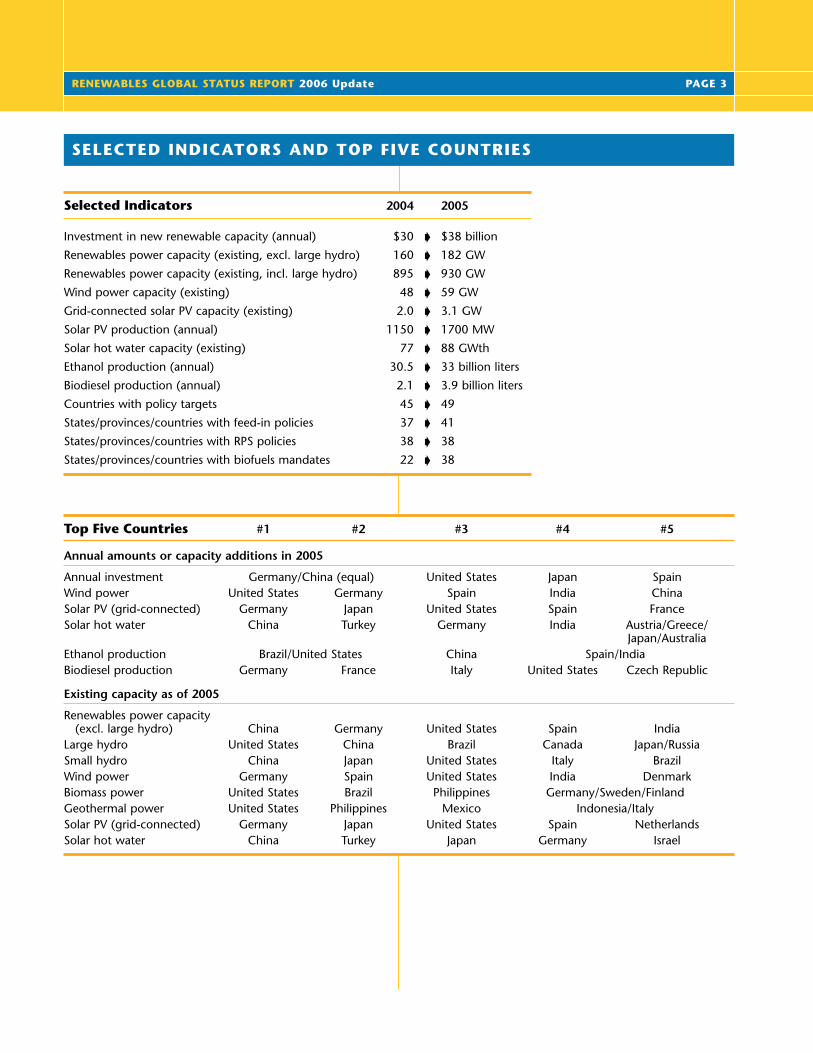
Selected Indicators 2004 2005
Investment in new renewable capacity (annual) $30 s $38 billion
Renewables power capacity (existing, excl. large hydro) 160 s 182 GW
Renewables power capacity (existing, incl. large hydro) 895 s 930 GW
Wind power capacity (existing) 48 s 59 GW
Grid-connected solar PV capacity (existing) 2.0 s 3.1 GW
Solar PV production (annual) 1150 s 1700 MW
Solar hot water capacity (existing) 77 s 88 GWth
Ethanol production (annual) 30.5 s 33 billion liters
Biodiesel production (annual) 2.1 s 3.9 billion liters
Countries with policy targets 45 s 49
States/provinces/countries with feed-in policies 37 s 41
States/provinces/countries with RPS policies 38 s 38
States/provinces/countries with biofuels mandates 22 s 38
Top Five Countries #1 #2 #3 #4 #5
Annual amounts or capacity additions in 2005
Annual investment Germany/China (equal) United States Japan SpainWind power United States Germany Spain India ChinaSolar PV (grid-connected) Germany Japan United States Spain FranceSolar hot water China Turkey Germany India Austria/Greece/
Japan/AustraliaEthanol production Brazil/United States China Spain/IndiaBiodiesel production Germany France Italy United States Czech Republic
Existing capacity as of 2005
Renewables power capacity(excl. large hydro) China Germany United States Spain India
Large hydro United States China Brazil Canada Japan/RussiaSmall hydro China Japan United States Italy BrazilWind power Germany Spain United States India DenmarkBiomass power United States Brazil Philippines Germany/Sweden/FinlandGeothermal power United States Philippines Mexico Indonesia/ItalySolar PV (grid-connected) Germany Japan United States Spain NetherlandsSolar hot water China Turkey Japan Germany Israel
PAGE 4 2006 Update RENEWABLES GLOBAL STATUS REPORT
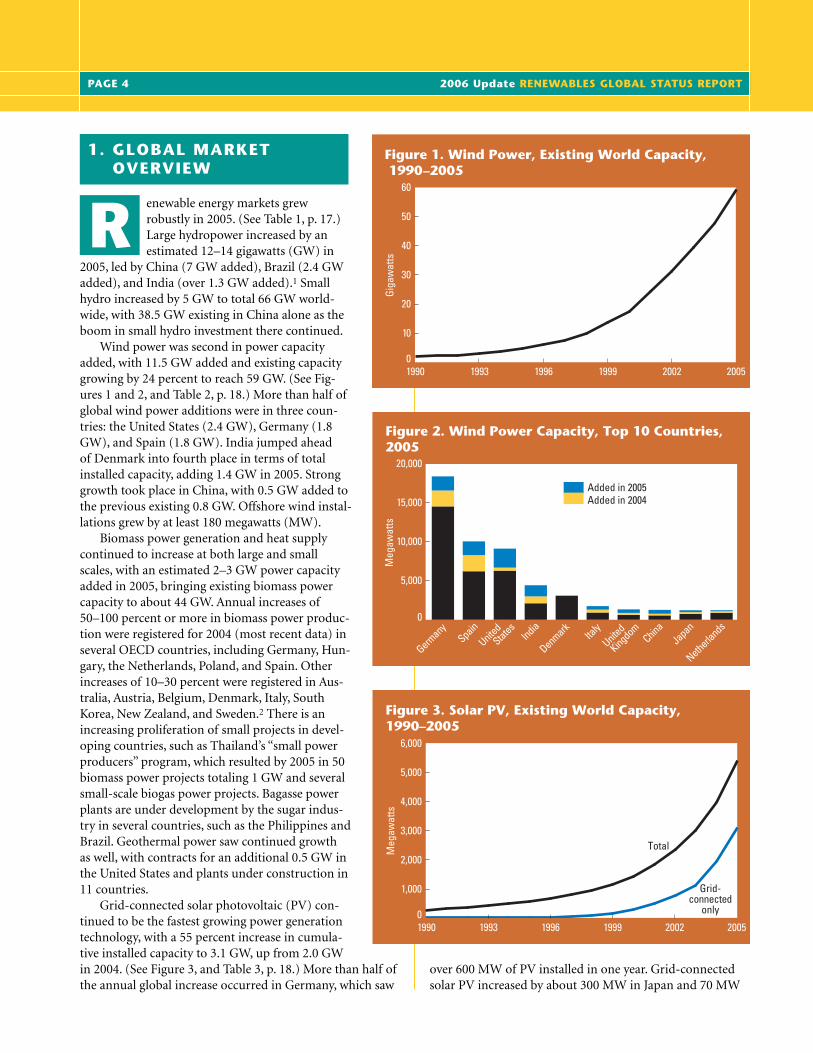
enewable energy markets grewrobustly in 2005. (See Table 1, p. 17.)Large hydropower increased by anestimated 12–14 gigawatts (GW) in
2005, led by China (7 GW added), Brazil (2.4 GWadded), and India (over 1.3 GW added).1 Smallhydro increased by 5 GW to total 66 GW world-wide, with 38.5 GW existing in China alone as theboom in small hydro investment there continued.
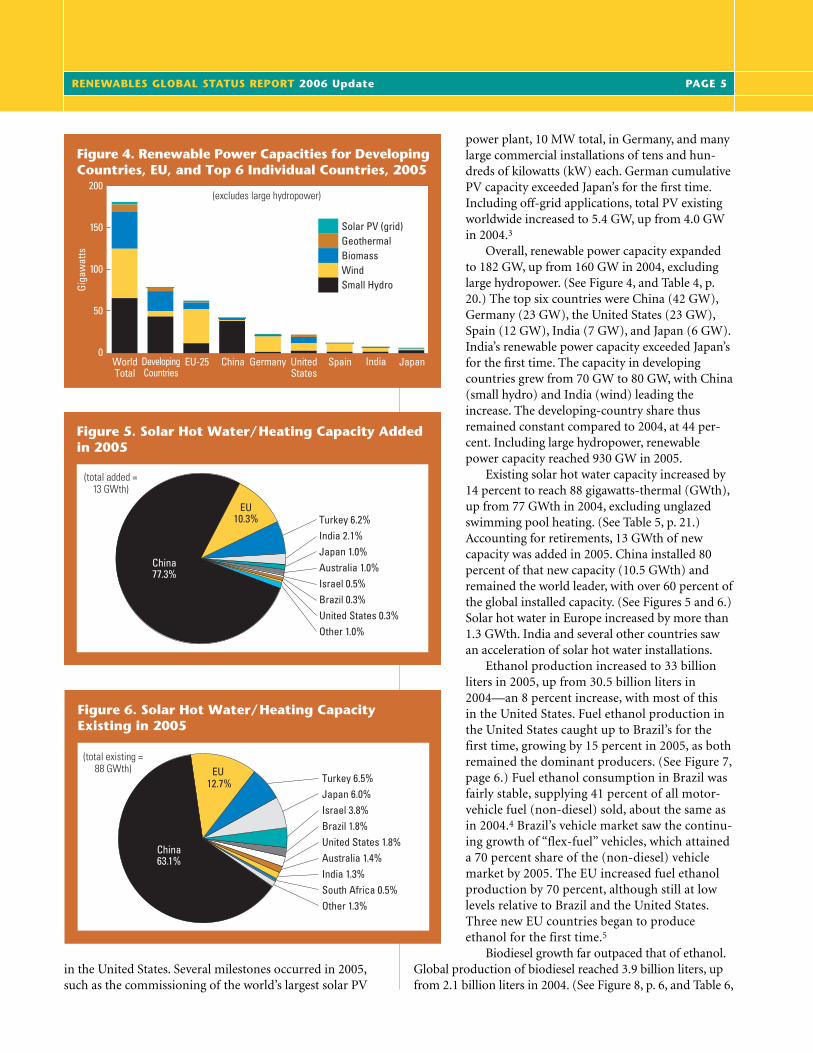
Wind power was second in power capacityadded, with 11.5 GW added and existing capacitygrowing by 24 percent to reach 59 GW. (See Fig-ures 1 and 2, and Table 2, p. 18.) More than half ofglobal wind power additions were in three coun-tries: the United States (2.4 GW), Germany (1.8GW), and Spain (1.8 GW). India jumped ahead of Denmark into fourth place in terms of totalinstalled capacity, adding 1.4 GW in 2005. Stronggrowth took place in China, with 0.5 GW added tothe previous existing 0.8 GW. Offshore wind instal-lations grew by at least 180 megawatts (MW).
Biomass power generation and heat supplycontinued to increase at both large and smallscales, with an estimated 2–3 GW power capacityadded in 2005, bringing existing biomass powercapacity to about 44 GW. Annual increases of50–100 percent or more in biomass power produc-tion were registered for 2004 (most recent data) inseveral OECD countries, including Germany, Hun-gary, the Netherlands, Poland, and Spain. Otherincreases of 10–30 percent were registered in Aus-tralia, Austria, Belgium, Denmark, Italy, SouthKorea, New Zealand, and Sweden.2 There is anincreasing proliferation of small projects in devel-oping countries, such as Thailand’s “small powerproducers” program, which resulted by 2005 in 50biomass power projects totaling 1 GW and severalsmall-scale biogas power projects. Bagasse powerplants are under development by the sugar indus-try in several countries, such as the Philippines andBrazil. Geothermal power saw continued growth as well, with contracts for an additional 0.5 GW inthe United States and plants under construction in11 countries.
Grid-connected solar photovoltaic (PV) con-tinued to be the fastest growing power generationtechnology, with a 55 percent increase in cumula-tive installed capacity to 3.1 GW, up from 2.0 GWin 2004. (See Figure 3, and Table 3, p. 18.) More than half ofthe annual global increase occurred in Germany, which saw
over 600 MW of PV installed in one year. Grid-connectedsolar PV increased by about 300 MW in Japan and 70 MW
1. GLOBAL MARKETOVERVIEW
R
Figure 5. Solar Hot Water/Heating Capacity Addedin 2005
1990 1993 1996 1999 2002 2005
30
60
50
40
20
10
0
Turkey 6.2%India 2.1%Japan 1.0%Australia 1.0%Israel 0.5%Brazil 0.3%United States 0.3%Other 1.0%
Figure 2. Wind Power Capacity, Top 10 Countries, 2005
Meg
awat
ts
Added in 2005Added in 2004
Germany
SpainUnite
d
States
United
Kingdom
DenmarkIndia
Italy
Netherlands
JapanChina
Figure 1. Wind Power, Existing World Capacity, 1990–2005
0
Gig
awat
ts
Figure 4. Renewable Power Capacities for Developing Countries, EU, and Top 6 Individual Countries, 2005
JapanSpain IndiaUnitedStates
GermanyChinaEU-25DevelopingCountries
WorldTotal
Gig
awat
ts
0
50
100
200
150 Solar PV (grid)GeothermalBiomassWindSmall Hydro
0
5,000
10,000
15,000
20,000(excludes large hydropower)
(total added =13 GWth)
Figure 6. Solar Hot Water/Heating CapacityExisting in 2005
Turkey 6.5%Japan 6.0%Israel 3.8%Brazil 1.8%United States 1.8%Australia 1.4%India 1.3%South Africa 0.5%Other 1.3%
(total existing =88 GWth)
Figure 3. Solar PV, Existing World Capacity, 1990–2005
1990 1993 1996 1999 2002 2005
3,000
6,000
5,000
4,000
2,000
1,000
0
Meg
awat
ts
Total
Grid-connected
only
China77.3%
EU10.3%
China63.1%
EU 12.7%
in the United States. Several milestones occurred in 2005,such as the commissioning of the world’s largest solar PV
power plant, 10 MW total, in Germany, and manylarge commercial installations of tens and hun-dreds of kilowatts (kW) each. German cumulativePV capacity exceeded Japan’s for the first time.Including off-grid applications, total PV existingworldwide increased to 5.4 GW, up from 4.0 GWin 2004.3
Overall, renewable power capacity expandedto 182 GW, up from 160 GW in 2004, excludinglarge hydropower. (See Figure 4, and Table 4, p.20.) The top six countries were China (42 GW),Germany (23 GW), the United States (23 GW),Spain (12 GW), India (7 GW), and Japan (6 GW).India’s renewable power capacity exceeded Japan’sfor the first time. The capacity in developingcountries grew from 70 GW to 80 GW, with China(small hydro) and India (wind) leading theincrease. The developing-country share thusremained constant compared to 2004, at 44 per-cent. Including large hydropower, renewablepower capacity reached 930 GW in 2005.
Existing solar hot water capacity increased by14 percent to reach 88 gigawatts-thermal (GWth),up from 77 GWth in 2004, excluding unglazedswimming pool heating. (See Table 5, p. 21.)Accounting for retirements, 13 GWth of newcapacity was added in 2005. China installed 80percent of that new capacity (10.5 GWth) andremained the world leader, with over 60 percent ofthe global installed capacity. (See Figures 5 and 6.)Solar hot water in Europe increased by more than1.3 GWth. India and several other countries sawan acceleration of solar hot water installations.
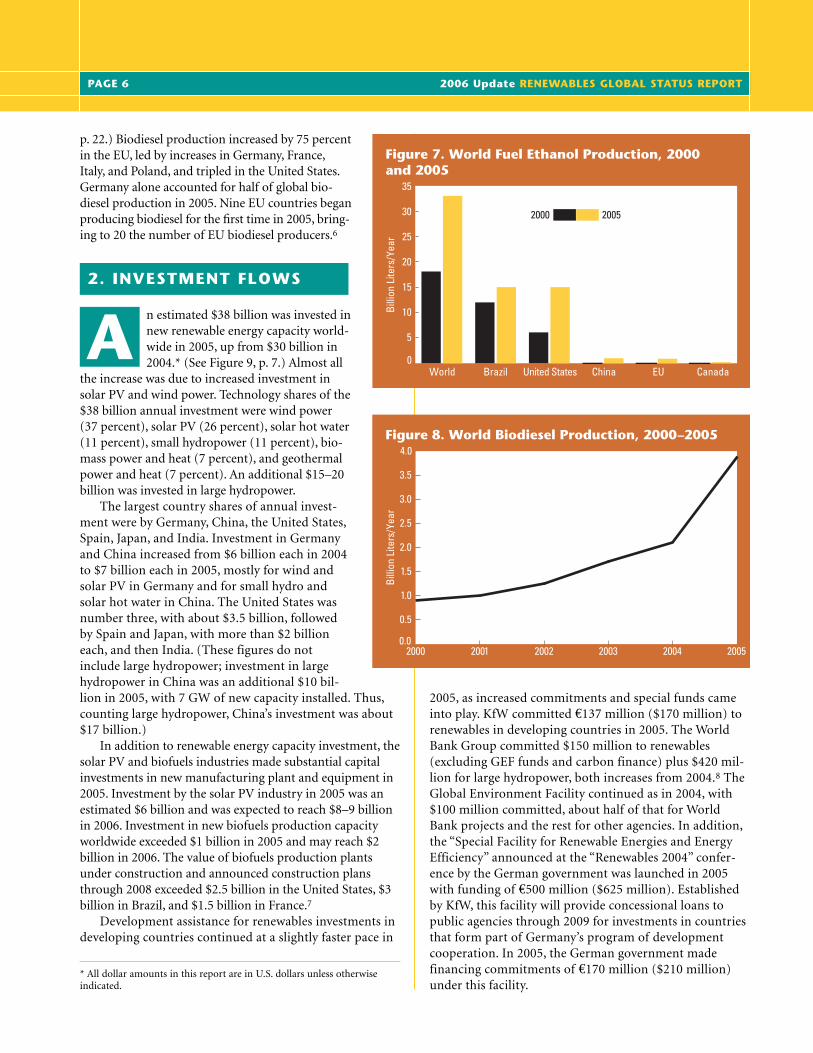
Ethanol production increased to 33 billionliters in 2005, up from 30.5 billion liters in2004—an 8 percent increase, with most of this in the United States. Fuel ethanol production inthe United States caught up to Brazil’s for thefirst time, growing by 15 percent in 2005, as bothremained the dominant producers. (See Figure 7,page 6.) Fuel ethanol consumption in Brazil wasfairly stable, supplying 41 percent of all motor-vehicle fuel (non-diesel) sold, about the same asin 2004.4 Brazil’s vehicle market saw the continu-ing growth of “flex-fuel” vehicles, which attaineda 70 percent share of the (non-diesel) vehiclemarket by 2005. The EU increased fuel ethanolproduction by 70 percent, although still at lowlevels relative to Brazil and the United States.Three new EU countries began to produceethanol for the first time.5
Biodiesel growth far outpaced that of ethanol.Global production of biodiesel reached 3.9 billion liters, upfrom 2.1 billion liters in 2004. (See Figure 8, p. 6, and Table 6,
Figure 5. Solar Hot Water/Heating Capacity Addedin 2005
1990 1993 1996 1999 2002 2005
30
60
50
40
20
10
0
Turkey 6.2%India 2.1%Japan 1.0%Australia 1.0%Israel 0.5%Brazil 0.3%United States 0.3%Other 1.0%
Figure 2. Wind Power Capacity, Top 10 Countries, 2005
Meg
awat
ts
Added in 2005Added in 2004
Germany
SpainUnite
d
States
United
Kingdom
DenmarkIndia
Italy
Netherlands
JapanChina
Figure 1. Wind Power, Existing World Capacity, 1990–2005
0
Gig
awat
ts
Figure 4. Renewable Power Capacities for Developing Countries, EU, and Top 6 Individual Countries, 2005
JapanSpain IndiaUnitedStates
GermanyChinaEU-25DevelopingCountries
WorldTotal
Gig
awat
ts
0
50
100
200
150 Solar PV (grid)GeothermalBiomassWindSmall Hydro
0
5,000
10,000
15,000
20,000(excludes large hydropower)
(total added =13 GWth)
Figure 6. Solar Hot Water/Heating CapacityExisting in 2005
Turkey 6.5%Japan 6.0%Israel 3.8%Brazil 1.8%United States 1.8%Australia 1.4%India 1.3%South Africa 0.5%Other 1.3%
(total existing =88 GWth)
Figure 3. Solar PV, Existing World Capacity, 1990–2005
1990 1993 1996 1999 2002 2005
3,000
6,000
5,000
4,000
2,000
1,000
0
Meg
awat
ts
Total
Grid-connected
only
China77.3%
EU10.3%
China63.1%
EU 12.7%
RENEWABLES GLOBAL STATUS REPORT 2006 Update PAGE 5
PAGE 6 2006 Update RENEWABLES GLOBAL STATUS REPORT
p. 22.) Biodiesel production increased by 75 percentin the EU, led by increases in Germany, France,Italy, and Poland, and tripled in the United States.Germany alone accounted for half of global bio-diesel production in 2005. Nine EU countries beganproducing biodiesel for the first time in 2005, bring-ing to 20 the number of EU biodiesel producers.6
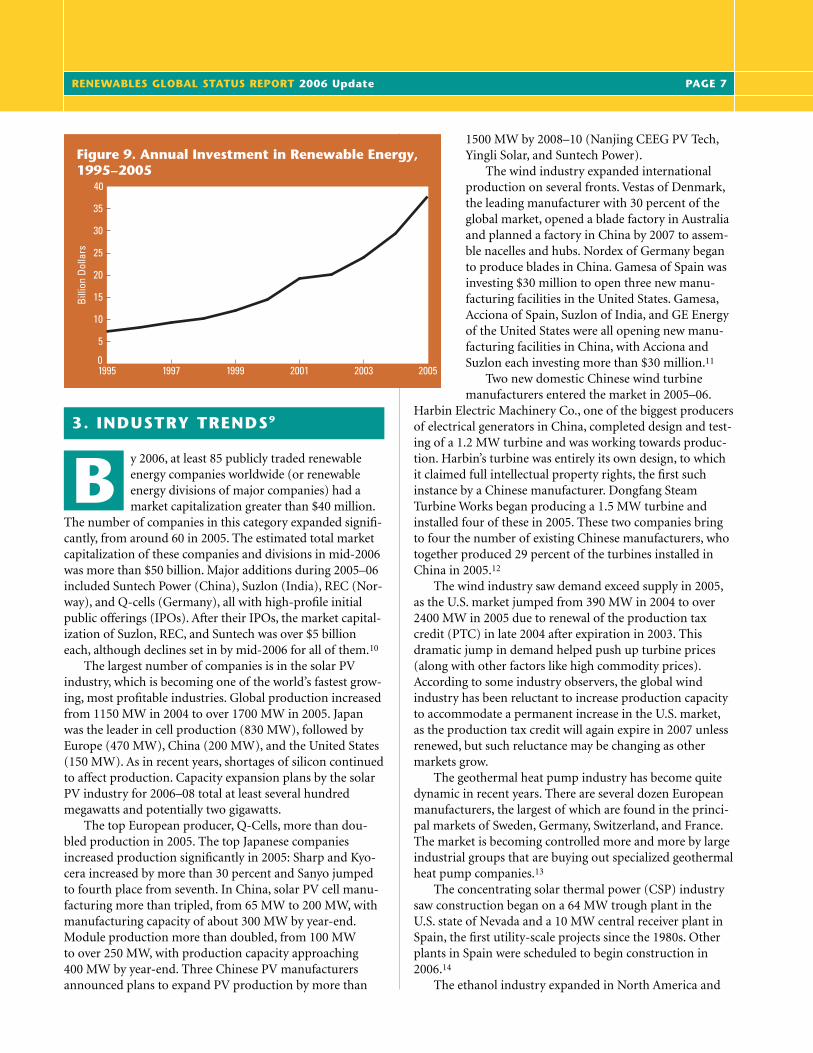
n estimated $38 billion was invested innew renewable energy capacity world-wide in 2005, up from $30 billion in2004.* (See Figure 9, p. 7.) Almost all
the increase was due to increased investment insolar PV and wind power. Technology shares of the$38 billion annual investment were wind power(37 percent), solar PV (26 percent), solar hot water(11 percent), small hydropower (11 percent), bio-mass power and heat (7 percent), and geothermalpower and heat (7 percent). An additional $15–20billion was invested in large hydropower.
The largest country shares of annual invest-ment were by Germany, China, the United States,Spain, Japan, and India. Investment in Germanyand China increased from $6 billion each in 2004to $7 billion each in 2005, mostly for wind andsolar PV in Germany and for small hydro andsolar hot water in China. The United States wasnumber three, with about $3.5 billion, followedby Spain and Japan, with more than $2 billioneach, and then India. (These figures do notinclude large hydropower; investment in largehydropower in China was an additional $10 bil-lion in 2005, with 7 GW of new capacity installed. Thus,counting large hydropower, China’s investment was about$17 billion.)
In addition to renewable energy capacity investment, thesolar PV and biofuels industries made substantial capitalinvestments in new manufacturing plant and equipment in2005. Investment by the solar PV industry in 2005 was anestimated $6 billion and was expected to reach $8–9 billionin 2006. Investment in new biofuels production capacityworldwide exceeded $1 billion in 2005 and may reach $2billion in 2006. The value of biofuels production plantsunder construction and announced construction plansthrough 2008 exceeded $2.5 billion in the United States, $3billion in Brazil, and $1.5 billion in France.7
Development assistance for renewables investments indeveloping countries continued at a slightly faster pace in
2005, as increased commitments and special funds cameinto play. KfW committed €137 million ($170 million) torenewables in developing countries in 2005. The WorldBank Group committed $150 million to renewables(excluding GEF funds and carbon finance) plus $420 mil-lion for large hydropower, both increases from 2004.8 TheGlobal Environment Facility continued as in 2004, with$100 million committed, about half of that for WorldBank projects and the rest for other agencies. In addition,the “Special Facility for Renewable Energies and EnergyEfficiency” announced at the “Renewables 2004” confer-ence by the German government was launched in 2005with funding of €500 million ($625 million). Establishedby KfW, this facility will provide concessional loans topublic agencies through 2009 for investments in countriesthat form part of Germany’s program of developmentcooperation. In 2005, the German government madefinancing commitments of €170 million ($210 million)under this facility.
Figure 8. World Biodiesel Production, 2000–2005
2000 2001 2002 20042003 20050
Bill
ion
Lite
rs/Y
ear
Figure 10. EU Renewable Energy Targets—Share of Electricity by 2010
0 20 40 60 80 100Percent
Some countries also have targets for shares of total energy by 2010:EU-25 - 12%Lithuania - 12%Poland - 7.5%Latvia - 6%Czech Rep. - 5–6%Germany - 4%France - 7%Spain - 12.1%
Figure 7. World Fuel Ethanol Production, 2000 and 2005
Brazil United States EUChina CanadaWorld0
Bill
ion
Lite
rs/Y
ear
0
5
10
15
20
25
30
35
2000 2005
0.5
0.0
1.0
1.5
2.0
2.5
3.0
3.5
4.0
Total (EU-25)Hungary
MaltaEstonia
LuxembourgBelgium
CyprusLithuania
PolandCzech Republic
NetherlandsUnited Kingdom
GermanyIrelandGreeceFrance
ItalyDenmark
SpainSlovak Republic
FinlandSloveniaPortugal
LatviaSwedenAustria
Baseline (actual)1997 Level
Target by 2010
Figure 9. Annual Investment in Renewable Energy, 1995–2005
1995 1997 1999 20032001 20050
Bill
ion
Dol
lars
5
0
10
15
20
25
30
35
40 21.03.6 5.0 5.1 5.7 6.0 6.0 7.0 7.5 8.0 9.0 10.0 12.5 13.2 20.1 21.0 25.0 29.0 29.4 31.0 31.5 33.6 39.0 49.3 60.0 78.0
2. INVESTMENT FLOWS
A
* All dollar amounts in this report are in U.S. dollars unless otherwiseindicated.
RENEWABLES GLOBAL STATUS REPORT 2006 Update PAGE 7
y 2006, at least 85 publicly traded renewableenergy companies worldwide (or renewableenergy divisions of major companies) had amarket capitalization greater than $40 million.
The number of companies in this category expanded signifi-cantly, from around 60 in 2005. The estimated total marketcapitalization of these companies and divisions in mid-2006was more than $50 billion. Major additions during 2005–06included Suntech Power (China), Suzlon (India), REC (Nor-way), and Q-cells (Germany), all with high-profile initialpublic offerings (IPOs). After their IPOs, the market capital-ization of Suzlon, REC, and Suntech was over $5 billioneach, although declines set in by mid-2006 for all of them.10
The largest number of companies is in the solar PVindustry, which is becoming one of the world’s fastest grow-ing, most profitable industries. Global production increasedfrom 1150 MW in 2004 to over 1700 MW in 2005. Japanwas the leader in cell production (830 MW), followed byEurope (470 MW), China (200 MW), and the United States(150 MW). As in recent years, shortages of silicon continuedto affect production. Capacity expansion plans by the solarPV industry for 2006–08 total at least several hundredmegawatts and potentially two gigawatts.
The top European producer, Q-Cells, more than dou-bled production in 2005. The top Japanese companiesincreased production significantly in 2005: Sharp and Kyo-cera increased by more than 30 percent and Sanyo jumpedto fourth place from seventh. In China, solar PV cell manu-facturing more than tripled, from 65 MW to 200 MW, withmanufacturing capacity of about 300 MW by year-end.Module production more than doubled, from 100 MW to over 250 MW, with production capacity approaching 400 MW by year-end. Three Chinese PV manufacturersannounced plans to expand PV production by more than
1500 MW by 2008–10 (Nanjing CEEG PV Tech,Yingli Solar, and Suntech Power).
The wind industry expanded internationalproduction on several fronts. Vestas of Denmark,the leading manufacturer with 30 percent of theglobal market, opened a blade factory in Australiaand planned a factory in China by 2007 to assem-ble nacelles and hubs. Nordex of Germany beganto produce blades in China. Gamesa of Spain wasinvesting $30 million to open three new manu-facturing facilities in the United States. Gamesa,Acciona of Spain, Suzlon of India, and GE Energyof the United States were all opening new manu-facturing facilities in China, with Acciona andSuzlon each investing more than $30 million.11
Two new domestic Chinese wind turbinemanufacturers entered the market in 2005–06.
Harbin Electric Machinery Co., one of the biggest producersof electrical generators in China, completed design and test-ing of a 1.2 MW turbine and was working towards produc-tion. Harbin’s turbine was entirely its own design, to whichit claimed full intellectual property rights, the first suchinstance by a Chinese manufacturer. Dongfang Steam Turbine Works began producing a 1.5 MW turbine andinstalled four of these in 2005. These two companies bringto four the number of existing Chinese manufacturers, whotogether produced 29 percent of the turbines installed inChina in 2005.12
The wind industry saw demand exceed supply in 2005,as the U.S. market jumped from 390 MW in 2004 to over2400 MW in 2005 due to renewal of the production taxcredit (PTC) in late 2004 after expiration in 2003. This dramatic jump in demand helped push up turbine prices(along with other factors like high commodity prices).According to some industry observers, the global windindustry has been reluctant to increase production capacityto accommodate a permanent increase in the U.S. market,as the production tax credit will again expire in 2007 unlessrenewed, but such reluctance may be changing as othermarkets grow.
The geothermal heat pump industry has become quitedynamic in recent years. There are several dozen Europeanmanufacturers, the largest of which are found in the princi-pal markets of Sweden, Germany, Switzerland, and France.The market is becoming controlled more and more by largeindustrial groups that are buying out specialized geothermalheat pump companies.13
The concentrating solar thermal power (CSP) industrysaw construction began on a 64 MW trough plant in theU.S. state of Nevada and a 10 MW central receiver plant inSpain, the first utility-scale projects since the 1980s. Otherplants in Spain were scheduled to begin construction in2006.14
The ethanol industry expanded in North America and
Figure 8. World Biodiesel Production, 2000–2005
2000 2001 2002 20042003 20050
Bill
ion
Lite
rs/Y
ear
Figure 10. EU Renewable Energy Targets—Share of Electricity by 2010
0 20 40 60 80 100Percent
Some countries also have targets for shares of total energy by 2010:EU-25 - 12%Lithuania - 12%Poland - 7.5%Latvia - 6%Czech Rep. - 5–6%Germany - 4%France - 7%Spain - 12.1%
Figure 7. World Fuel Ethanol Production, 2000 and 2005
Brazil United States EUChina CanadaWorld0
Bill
ion
Lite
rs/Y
ear
0
5
10
15
20
25
30
35
2000 2005
0.5
0.0
1.0
1.5
2.0
2.5
3.0
3.5
4.0
Total (EU-25)Hungary
MaltaEstonia
LuxembourgBelgium
CyprusLithuania
PolandCzech Republic
NetherlandsUnited Kingdom
GermanyIrelandGreeceFrance
ItalyDenmark
SpainSlovak Republic
FinlandSloveniaPortugal
LatviaSwedenAustria
Baseline (actual)1997 Level
Target by 2010
Figure 9. Annual Investment in Renewable Energy, 1995–2005
1995 1997 1999 20032001 20050
Bill
ion
Dol
lars
5
0
10
15
20
25
30
35
40 21.03.6 5.0 5.1 5.7 6.0 6.0 7.0 7.5 8.0 9.0 10.0 12.5 13.2 20.1 21.0 25.0 29.0 29.4 31.0 31.5 33.6 39.0 49.3 60.0 78.0
3. INDUSTRY TRENDS9
B
PAGE 8 2006 Update RENEWABLES GLOBAL STATUS REPORT
Europe. By the end of 2005, there were 95 operat-ing ethanol plants in the United States, with totalcapacity of 16.4 billion liters/year. In mid-2006, anadditional 35 plants were under construction and9 plants were being expanded, representing anadded capacity of eight billion liters/year. And sixnew ethanol plants with capacity of 0.7 billionliters/year were under construction in Canada.Brazil had over 300 plants operating, and 80 newdistillers were licensed in 2005. The Brazilianethanol industry was poised for a major jump dur-ing 2006–08, as part of a new national plan toincrease sugar cane production by 40 percent by2009.15 The biodiesel industry similarly expanded.The EU had operating capacity of over 6 billionliters/year by mid-2006. There were 53 operatingplants in the United States, with a capacity of 1.3billion liters/year, and an additional 44 plantsunder construction that would double capacity.Canada had two operating plants with capacity of0.1 billion liters/year.
Policy Targets for Renewable Energy
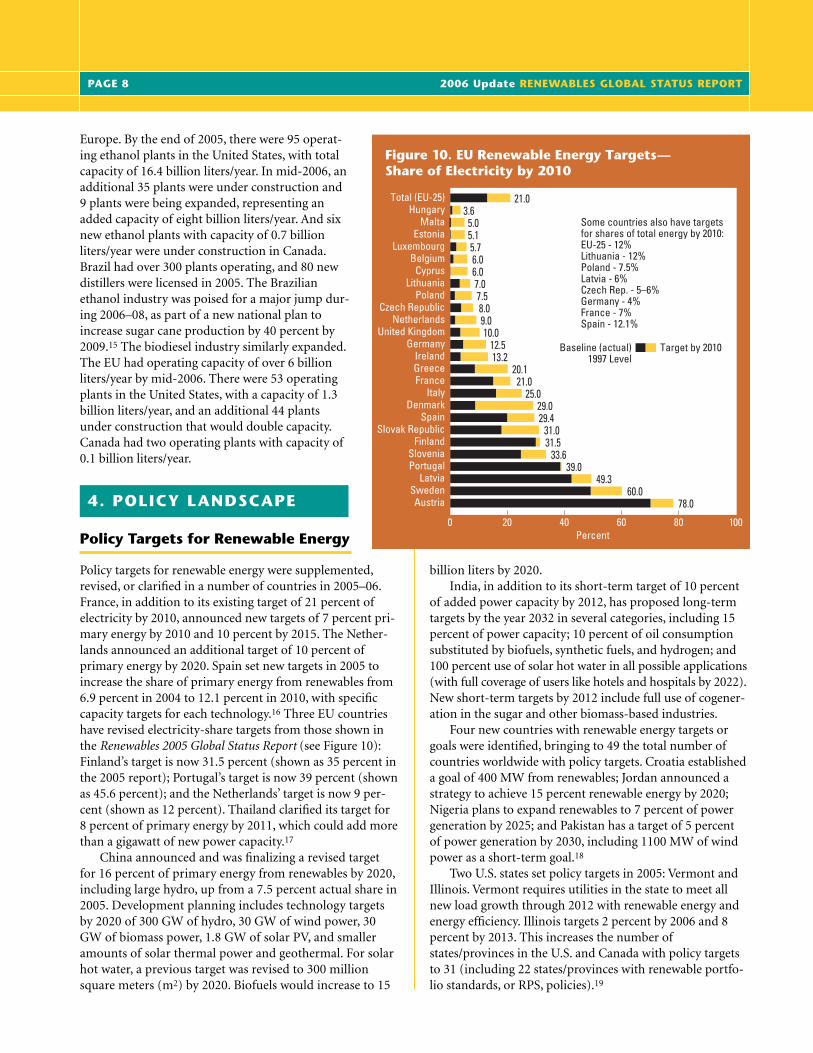
Policy targets for renewable energy were supplemented,revised, or clarified in a number of countries in 2005–06.France, in addition to its existing target of 21 percent ofelectricity by 2010, announced new targets of 7 percent pri-mary energy by 2010 and 10 percent by 2015. The Nether-lands announced an additional target of 10 percent ofprimary energy by 2020. Spain set new targets in 2005 toincrease the share of primary energy from renewables from6.9 percent in 2004 to 12.1 percent in 2010, with specificcapacity targets for each technology.16 Three EU countrieshave revised electricity-share targets from those shown inthe Renewables 2005 Global Status Report (see Figure 10):Finland’s target is now 31.5 percent (shown as 35 percent inthe 2005 report); Portugal’s target is now 39 percent (shownas 45.6 percent); and the Netherlands’ target is now 9 per-cent (shown as 12 percent). Thailand clarified its target for 8 percent of primary energy by 2011, which could add morethan a gigawatt of new power capacity.17
China announced and was finalizing a revised target for 16 percent of primary energy from renewables by 2020,including large hydro, up from a 7.5 percent actual share in2005. Development planning includes technology targetsby 2020 of 300 GW of hydro, 30 GW of wind power, 30GW of biomass power, 1.8 GW of solar PV, and smalleramounts of solar thermal power and geothermal. For solarhot water, a previous target was revised to 300 millionsquare meters (m2) by 2020. Biofuels would increase to 15
billion liters by 2020.India, in addition to its short-term target of 10 percent
of added power capacity by 2012, has proposed long-termtargets by the year 2032 in several categories, including 15percent of power capacity; 10 percent of oil consumptionsubstituted by biofuels, synthetic fuels, and hydrogen; and100 percent use of solar hot water in all possible applications(with full coverage of users like hotels and hospitals by 2022).New short-term targets by 2012 include full use of cogener-ation in the sugar and other biomass-based industries.
Four new countries with renewable energy targets orgoals were identified, bringing to 49 the total number ofcountries worldwide with policy targets. Croatia establisheda goal of 400 MW from renewables; Jordan announced astrategy to achieve 15 percent renewable energy by 2020;Nigeria plans to expand renewables to 7 percent of powergeneration by 2025; and Pakistan has a target of 5 percent of power generation by 2030, including 1100 MW of windpower as a short-term goal.18
Two U.S. states set policy targets in 2005: Vermont andIllinois. Vermont requires utilities in the state to meet allnew load growth through 2012 with renewable energy andenergy efficiency. Illinois targets 2 percent by 2006 and 8percent by 2013. This increases the number ofstates/provinces in the U.S. and Canada with policy targetsto 31 (including 22 states/provinces with renewable portfo-lio standards, or RPS, policies).19
Figure 8. World Biodiesel Production, 2000–2005
2000 2001 2002 20042003 20050
Bill
ion
Lite
rs/Y
ear
Figure 10. EU Renewable Energy Targets—Share of Electricity by 2010
0 20 40 60 80 100Percent
Some countries also have targets for shares of total energy by 2010:EU-25 - 12%Lithuania - 12%Poland - 7.5%Latvia - 6%Czech Rep. - 5–6%Germany - 4%France - 7%Spain - 12.1%
Figure 7. World Fuel Ethanol Production, 2000 and 2005
Brazil United States EUChina CanadaWorld0
Bill
ion
Lite
rs/Y
ear
0
5
10
15
20
25
30
35
2000 2005
0.5
0.0
1.0
1.5
2.0
2.5
3.0
3.5
4.0
Total (EU-25)Hungary
MaltaEstonia
LuxembourgBelgium
CyprusLithuania
PolandCzech Republic
NetherlandsUnited Kingdom
GermanyIrelandGreeceFrance
ItalyDenmark
SpainSlovak Republic
FinlandSloveniaPortugal
LatviaSwedenAustria
Baseline (actual)1997 Level
Target by 2010
Figure 9. Annual Investment in Renewable Energy, 1995–2005
1995 1997 1999 20032001 20050
Bill
ion
Dol
lars
5
0
10
15
20
25
30
35
40 21.03.6 5.0 5.1 5.7 6.0 6.0 7.0 7.5 8.0 9.0 10.0 12.5 13.2 20.1 21.0 25.0 29.0 29.4 31.0 31.5 33.6 39.0 49.3 60.0 78.04. POLICY LANDSCAPE
RENEWABLES GLOBAL STATUS REPORT 2006 Update PAGE 9
A 2006 report by EurObserv’ER analyzed progress withEU renewable energy targets for 2010. According to thereport, the EU share of primary energy from renewablesgrew from 5.1 percent in 2002 to 5.6 percent in 2004(against a target of 12 percent by 2010), and the EuropeanCommission (EC) now anticipates a level of 9 percent by2010. The share of power generation from renewables actu-ally fell, from 14.9 percent in 2003 to 14.2 percent in 2004(against a target of 21 percent by 2010), and the EC nowanticipates a level of 18 percent by 2010. Three countries—Slovenia, Finland, and Denmark—are close to meeting theirtargets, and one country—Latvia—has already exceeded itstarget, although hydropower output in some countries canmake for significant year-to-year fluctuations.
Power Generation Promotion Policies
Several EU countries revised or supplemented their feed-inlaws in 2005–06, including Austria, the Czech Republic,France, Greece, Ireland, the Netherlands, and Portugal. Aus-tria supplemented its feed-in tariffs with additional supportof over €190 million ($240 million) in investment subsidiesthrough 2012. The Czech Republic adopted a new feed-inlaw that establishes tariffs for all renewables technologies.France extended its feed-in law to cover re-powered andrenovated facilities exceeding €800–1000 ($1000–1250) perkW of new investment, which now qualify for higher tariffs.Greece reduced permit requirements, set new tariffs, addedsolar thermal power, and provided subsidies and tax credits.Ireland replaced its competitive tendering system with anew feed-in policy and established new tariffs. The Nether-lands revised feed-in tariffs through to 2007. Portugaladopted a new tariff calculation formula that accounts fortechnology, environmental impacts, and inflation. AndItaly’s new national feed-in tariff for solar PV, established in2004, became operational in 2005, with a first 100 MW ofallocations subscribed quickly and expectations for at least60 MW in 2006.20
In 2006, Ontario became the second province inCanada, after Prince Edward Island, to enact a feed-intariff.21 The Indian states of Karnataka, Uttaranchal, andUttar Pradesh also adopted feed-in tariffs in 2005, bringingto six the number of Indian states with feed-in policies.The state of Maharashtra also updated its 2003 wind-powerfeed-in policy to include biomass, bagasse, and smallhydropower generation. These new policies in Canada andIndia increased the numbers of states/provinces/countriesworldwide with feed-in policies from 37 to 41. (See Table 7,p. 23.) New production incentives, called limited feed-intariffs by some, were also appearing in several U.S. states,including Minnesota, New Mexico, and Wisconsin.22
Although the number of states/provinces with RPSpolices remained constant, four U.S. states updated theirpolicies in 2005. (See Table 8, p. 23.) New Jersey raised its
target to 22.5 percent. Nevada extended its portfolio stan-dard by two years and increased the final requirement by 5percent (to 20 percent by 2010) while allowing for partialcompliance using energy efficiency measures. Connecticutnow requires 1 percent of utility supply from distributedgeneration, increasing to 4 percent by 2010. And Wisconsinnow requires 10 percent from renewables by 2015. Arizonaplanned to revise its requirement later in 2006 to 15 percentby 2020, from an original 1.1 percent by 2007.
New solar PV promotion programs continued to appeararound the world, at national, state/provincial, and local levels. The U.S. government enacted a 30 percent federal tax credit for solar PV, valid through 2007.23 Californiaextended its solar PV subsidy program to 2011 and enacteda $3.2 billion, 11-year plan to install 3 GW of solar PV by2017 for homes, schools, businesses, and farms—the “Cali-fornia Solar Initiative.”24 Three other U.S. states also enactednew investment subsidies and tax credits for solar PV: Con-necticut ($0.20–0.50/watt), Maine ($1–3/watt), and NewMexico (30 percent tax credit). Australia extended its solarPV subsidy program through 2006, providing Aus$4/watt($3/watt) subsidies.25 Sweden earmarked SEK 100 million($12 million) to subsidize solar PV on public buildingsunder a three-year program. Shanghai launched an initiativeto install PV systems on 100,000 rooftops.26 And Spainbecame the first country in the world to require solar PV on new buildings as a national policy, with a new buildingcode enacted in early 2006 that requires solar PV in newconstruction and renovation of certain types of buildings,including shopping centers, office buildings, warehouses,hotels, and hospitals exceeding certain size limits.27
A number of developing countries were working onenacting or strengthening renewable energy promotionpolicies and programs. Egypt was working to develop wind power; Madagascar established a new program forhydropower; Turkey passed a new renewable energy pro-motion law in 2005; Uganda wrote and was expected toapprove a new renewable energy policy in 2006; Iran wasdeveloping a new promotion law and also started to allowindependent power producers; India announced a newnational tariff policy in early 2006 that aims to promoterenewable power generation, including quotas, preferentialtariffs, and guidelines for pricing ‘non-firm’ power; AndThailand was working on a feed-in policy for very smallpower producers. Public bidding in Brazil for future elec-tricity supply was ongoing for small hydro, wind, and bio-mass (bagasse) power as part of the PROINFA program.Pakistan initiated a limited feed-in tariff to boost windpower development, with a 9.5 cents/kWh tariff establishedfor approved projects and competitive selection of projectdevelopers underway for two 50 MW projects.* Pakistanalso waived import duties for wind turbines and was con-
* All cent amounts in this report are in U.S. cents unless otherwise indicated.
PAGE 10 2006 Update RENEWABLES GLOBAL STATUS REPORT
sidering a broader renewable energy promotion law.28
In Mexico, an anticipated renewable energy promotionlaw was sanctioned by one chamber of the national congressin 2005 and passage was expected in 2006. An accelerateddepreciation allowance for renewable energy investments wasenacted, and an existing “self-supply” law from 2001 was clar-ified with new regulations, allowing self-generation to bewheeled to the point of consumption—a form of net metering.
The widely anticipated China feed-in law enacted in2005 took effect at the start of 2006 as part of the broaderrenewable energy promotion law. Contrary to expectations,the feed-in tariff did not apply to wind power, only to bio-mass. Biomass power tariffs are set at province-specific average coal prices plus a premium of RMB 0.25/kWh (3cents/kWh). Wind power tariffs are established through theongoing process of competitive bidding (concessions). Athird round of wind power concession bidding took place in2005, following rounds in 2003 and 2004, with four projectsawarded an additional 450–650 MW, and a fourth roundwas to take place in 2006 for an additional 700 MW.29
Other countries boosted or extended policy support.Public competitive bidding policies continued in Quebec,Canada, when Hydro-Quebec issued a second solicitationfor 2000 MW of wind power in 2005, following the firstsolicitation for 1000 MW in 2004.30 The United Statesextended its production tax credit (PTC) through the end of2007, and extended the credit to other renewables technolo-gies besides wind. Ireland announced Û265 million ($330million) in extra subsidies to support renewables over thenext five years, including Û65 million ($80 million) fundingfor renewable energy investments. Sweden enacted a 30 per-cent tax credit for household solar PV and investments toreplace heating oil with biofuels. Overall, Sweden allocatedSEK 500 ($70 million) each for 2007 and 2008 for energyefficiency and renewable energy.31
Solar Hot Water/Heating Policies
Solar hot water policies continued to be enacted in Spain.In early 2006, the Barcelona city government approved anew solar hot water ordinance, upgrading the existing oneby eliminating the minimum energy demand threshold—meaning all new buildings are now subject to the ordin-ance.32 By early 2006, more than 70 municipalities and citiesthroughout Spain had adopted similar municipal solar ordi-nances. In March 2006, inspired by these ordinances, a newnational building code was enacted that requires minimumlevels of solar hot water and solar PV in new constructionand renovation. Solar hot water must meet 30–70 percent ofhot water energy needs, depending on climatic zone, con-sumption level, and back-up fuel.33
Beyond Spain, a number of cities were working on solarhot water policies during 2005, such as Cape Town, SouthAfrica, and Rome, Italy (with a requirement for 30–50 per-
cent of energy for new buildings). Other states and coun-tries added or modified subsidies for solar hot water. TheU.S. state of Maine introduced a 25 percent investment sub-sidy.34 California will begin a pilot program to support solarhot water. The United States also enacted a federal 30 per-cent tax credit for solar hot water through 2007. A numberof countries in North Africa and the Middle East were con-tinuing to develop solar hot water policies, building codes,and/or promotion programs, including Tunisia, Morocco,Egypt, Jordan, and Syria.
Biofuels Policies
A turning point for biofuels policies occurred in 2005–06,when several countries dramatically stepped up targets andmandates for biofuels. In the EU, several countries took newmeasures. France established an ambitious biofuels plan,with goals of 5.75 percent by 2008 (two years earlier thanthe EU target), 7 percent by 2010, and 10 percent by 2015.Belgium set a 5.75 percent target for 2010. Germany man-dated biofuels blending for the first time, requiring 4.4 per-cent biodiesel blending and 2 percent ethanol blendingstarting in 2007, increasing biodiesel blending to 5.75 per-cent by 2010.35 Italy mandated 1 percent blending for bothethanol and biodiesel. As part of a strategic energy review bythe Commission of European Communities, the EU presi-dency voiced a proposal to set a new EU-wide biofuels tar-get of 8 percent by 2015.
EU countries have also been enacting biofuels taxexemptions. Such exemptions now exist in at least 8 EUcountries, most of these enacted during 2005–06, includingFrance, Germany, Greece, Ireland, Italy, Spain, Sweden,and the United Kingdom. Ireland announced Û265 million($330 million) in extra subsides to support renewables overthe next five years, including Û200 million in excise taxrelief for biofuels.
In the United States, a renewable fuel standard wasenacted in 2005 that requires fuel distributors to increasethe annual volume of biofuels blended up to 7.5 billion gal-lons (28 billion liters) by 2012 (although this target wasexpected to be met anyway through tax incentives). The federal government also extended a 43 cents/gallon (12cents/liter) biodiesel tax credit for blenders through 2008.The state of Wisconsin mandated partial biofuels blendingfor government vehicles.36 Washington state now mandatesB2 blending. Several other states now offer productionincentives and sales tax reductions or exemptions.
Besides the EU and United States, new blending man-dates have appeared in Brazil, Canada, Colombia, Malaysia,and Thailand. In Canada, the province of Saskatchewanbegan mandating E7 in 2005, while Ontario will mandateE5 (average) blending by 2007. National blending mandatesappeared for large cities in Columbia (E10). Malaysia willrequire B5 by 2008. Four provinces in China added man-
RENEWABLES GLOBAL STATUS REPORT 2006 Update PAGE 11
dates for blending in major cities, bringing to nine the num-ber of provinces with blending mandates. The DominicanRepublic will require E15 and B2 by 2015. Brazil started toallow B2 blending in 2005 and will require it starting in2008, increasing to B5 by 2013. Thailand is phasing in anational E10 blend by 2007 and also established a 3 percentbiodiesel target by 2011, to be achieved by promotingbiodiesel in specific regions through 2010.37 The Philippineswas considering E10 and B1 blending, with a proposed goalof 25 percent E10 fuel by 2010.38 The result of recent policyactivity is that biofuels blending mandates now exist at thenational level in at least eight countries and at the sub-national level in at least 30 states and provinces.39
Municipal-Level Policies
Cities around the world, both large and small, continued toset targets for renewable energy shares and enact policiespromoting renewable energy. London announced a target toreduce carbon dioxide emissions by 20 percent by 2010, rela-tive to 1990 levels, and by 60 percent by 2050. New York Cityhad set a target in 2002 for 20 percent reduction by 2010from 1995 levels; this was supplemented by a “U.S. Mayor’sClimate Protection Agreement” in 2005 targeting 7 percentreduction from 1990 levels by 2012. During 2005 and 2006,New York City was joined by more than 200 other U.S. cities,representing a combined population of 41 million people, inmaking the same agreement. In 2006, Tokyo proposed anambitious target of 20 percent of total energy consumptionin the city by 2020. Currently, renewables supply about 2.7percent of Tokyo’s total energy demand. The target was to beformally adopted by 2008 as part of Tokyo’s “EnvironmentBasic Plan,” and a number of policies were to be consideredfor achieving the target. In Japanese towns, local cooperativesfor renewables gained in 2006, with 7 MW of citizen-ownedwind farms commissioned at four sites.40
Progress with rural use of renewable energy is difficult to trackcomprehensively on a year-by-year basis, particularly tradi-tional and modern biomass use, which continues to dominaterural energy consumption. A comprehensive update of therural energy section of the Renewables 2005 Global StatusReport will await future editions and an expanded network of regional correspondents. Below are some highlights.
ural electrification policies and programs usingrenewable energy continued to emerge andprogress. The China Township ElectrificationProgram finished in 2005 after electrifying
about 1.3 million rural people in 1,000 townships (about200,000 households) with solar PV, small hydro, and a small
amount of wind power. During 2006, China was planningthe next program, which will focus on villages, with plans toelectrify 10,000 villages and 3.5 million rural householdswith renewables by 2010, including small hydro and up to270 MW of solar PV. Full rural electrification is planned by2015. In Brazil, the “Luz para todos” program had electrifiedhalf a million households out of its goal of 2.5 million, butwas focusing first on grid connections, with the 200,000households targeted for renewable energy to come later.41
(This apparent trend, to focus on renewables in later phasesof rural electrification programs, was visible in other LatinAmerican countries as well.) The Thailand rural electrifica-tion program using solar home systems continued in 2005and 2006, with 190,000 cumulative households, and was tofinish in 2006 with 200,000 households. In Sri Lanka during2005, another 900 off-grid households were electrified withsmall hydro and 20,000 with solar PV.
New rural electrification programs using renewableswere launched or announced in a few additional countries,including Bolivia, which targets 50 percent access by 2015and full access by 2025. Bolivia plans 20,000 solar home systems as part of the program by 2008. Honduras andEthiopia both announced new universal access goals, with ashare of households to be served with renewables, joiningthe ranks of Argentina, Bolivia, Brazil, Chile, China, andThailand, among others. Ethiopia’s goal is to increase accessfrom 15 percent to 50 percent within five years. Pakistannow plans electrification of 8,000 villages with renewableenergy under a program beginning in 2006. A pilot wascompleted for 400 households in four villages using 90-wattsolar PV systems, and a $19 million development plan wasapproved for a first phase of 400 villages.42
India’s Integrated Rural Energy Program using renewableenergy had served 300 districts and 2,200 villages by early2006. More than 250 remote villages in seven states wereelectrified under the program during 2005, with additionalprojects under implementation in over 800 villages and 700hamlets in 13 states and federal territories. Rural applicationsof solar PV had increased to 340,000 home lighting systems,540,000 solar lanterns, and 7,000 solar-power water pumps.There were 600,000 solar cookers in use. India has recentlyproposed to augment cooking, lighting, and motive powerwith renewables in 600,000 villages by 2032, starting with10,000 remote un-electrified villages by 2012. India also hasachieved 70 MW of small-scale biomass gasification systemsfor rural (off-grid) power generation.
The number of biogas users continued to increase inChina, India, and Nepal. China reported 17 million existingbiogas users in 2005, up from previous reports of 12 mil-lion. Biogas remains a priority in India, with about 3.8 mil-lion household-scale biogas plants now reported installed,up from prior reports of 3.7 million, and 66,000 new plantswere expected to be installed from early April 2005 to April2006. Nepal was providing 75 percent subsidies for family-
5. RURAL (OFF-GRID) ENERGY
R

PAGE 12 2006 Update RENEWABLES GLOBAL STATUS REPORT
scale biogas plants.Anecdotal evidence continues to accumulate about a
variety of applications. In the Philippines, there are nowsome 130 PV-powered drinking water systems and 120telecommunications systems, with average capacity of about1 kW each. The Philippines also commissioned a 28 kWsolar PV village power plant for 200 households. Nepal wasproviding 75 percent subsidies for solar-powering drinkingwater pumping in addition to the family-scale biogas plants.Uganda and Kenya, among others, continued with programsfor solar lighting in rural classrooms and clinics. Cambodiaconducted its first village electrification project using bio-mass gasification, with 7 kW installed, a further 27 kWapproved, and planning for 3,000 villages.
The number of solar home systems added in 2005 wasmore than 270,000 in 2005, bringing the world total toaround 2.4 million households. This includes over 120,000added in China (where a World Bank/GEF project hadcumulatively installed 350,000 systems by 2005); more than90,000 added in Thailand; more than 20,000 each added inIndia, Sri Lanka, and Bangladesh; and smaller numbersadded in other countries.43
Many household stove programs are currently underway around the world, and new commitments are beingmade. Improved biomass stove programs continue in Africa,with 150,000 new stoves in Uganda, 40,000 in Malawi, and60,000 in Ethiopia reported in recent years through interna-tional assistance programs. Several African countries com-mitted to provide access to modern cooking energy at theBonn “Renewables 2004” conference, such as Morocco forone million improved stoves by 2015 and Uganda for 10,000improved stoves by 2008. More recently, the Forum ofEnergy Ministers of Africa, founded in 2005, committed tohaving 50 percent of Africans living in rural areas and usingtraditional biomass for cooking gain access to modernenergy services such as improved cook stoves within 10years. The UN Millennium Project proposed that countriesreduce the number of people without effective access tomodern cooking fuels by 50 percent, and make improvedcook stoves widely available by 2015. The Economic Com-munity of West African States committed to providingmodern cooking energy to 100 percent of the rural popula-tion, or over 300 million people.
RENEWABLES GLOBAL STATUS REPORT 2006 Update PAGE 13
acquisitions remain buoyant; and (10) market growthlooks set to remain sturdy.
(1) Global investment is growing in all regions, but emergingmarkets are expected to become the core.
The majority of firms interviewed agreed that China,Brazil, and India will eventually be the largest renewablemarkets, but they were still focusing their activity in Europeand the United States. Dexia, HVB, GE Energy, and OrmatTechnologies were concentrating on core markets in indus-trialized countries.46 Some investors focused exclusively onspecific markets, such as wind power in Central Europe,because, “while that may not be the biggest market, it is themarket we know.” This suggests that expert knowledge,company contacts, and understanding of local circum-stances can keep investors in familiar markets. Still, manyforesee turning their attention to Asia in the near future.According to one industry analyst, “The emerging marketswon’t be emerging any more; they’ll be core markets.” Chinais perceived as the top investor in renewable energy world-wide. Ernst & Young’s Renewable Energy Country Attrac-tiveness Indices highlights the progress made in India.47
India has replaced the United Kingdom in fourth place inthe Long-Term ALL Renewables Index and Germany inthird place in both the Long-Term and Near-Term WindIndices. The Ernst & Young report also suggests that Indiawill exceed its 5,000 MW wind capacity target in 2006.
(2) Sector preferences reflect the maturity and potential ofthe technology.
Clean Edge, a U.S.-based market tracker, projects thatmarkets for solar PV and wind will each grow from theircurrent level of $11–12 billion to $50 billion by 2015. Thesolar PV industry has been receiving the most attention,probably because it is growing the fastest, with wind rightbehind. Overall, projections for solar and wind power var-ied: investors acknowledged that intermittent power sourceshave inherently capped growth potential, yet at the sametime, wind power was cited as the most promising area forgrowth in emerging markets such as Eastern Europe andNorth Africa. North American investors also emphasizedgrowing interest in wind, due to improved technology andexpertise.48 In 2005, there was new interest in the biofuelsmarket worldwide. Many investors speculated that biofuelswould emerge as a major market player in the comingdecades, because “it’s a steady, not intermittent source offuel. The problem with solar is that it’s intermittent, so untilwe can store it, the market will never capture more than 20percent of grid needs. But biofuels can really expand, andthat’s their appeal.”49 Biofuels sales reached $16 billionglobally in 2005, achieving a 15-percent increase over2004.50 Overall, interviewees concurred that solar PV andbiofuels were the highest growth markets—solar because ofits maturity and biofuels due to its potential.51
The purpose of this special supplement is to trace the types offinancing flows for renewable energy and to gauge trends inattitudes and perceptions of financiers with regard to renew-able energy investments. This supplement complements andsupports the factual information presented above with greaterinsight into trends and ideas about the future. It is based onreview of articles, reports, and publications, as well as directinterviews with a number of leading experts from the interna-tional finance and renewable energy business communities,primarily in Europe and the United States.
This supplement represents the preliminary step of anevolving process by the UNEP/BASE Sustainable EnergyFinance Initiative (SEFI), in collaboration with REN21, toprovide a regular source of quantitative and qualitative infor-mation on financing flows for renewable energy designed toserve both the policy and finance communities. SEFI invitesexperts in renewable energy finance to contribute insights,ideas, and information to make this type of investment reporta comprehensive, reliable, and useful service.
he year 2005 witnessed record investment innew renewable energy capacity. In interviewswith major renewable energy investors, entre-preneurs, and technology developers, some
attributed growth to domestic policy environments,some to Kyoto Protocol ratification, and others to localmarket drivers.44 Investors in North America emphasizedthe importance of consumer preferences, while Asianinvestors noted political support globally. There was con-sensus, however, that increasing technological maturity,growing staff expertise, and better understanding of tech-nology risk were key drivers behind the growth. KatherineBrass from GE Energy put it simply: “We’ve got theexperts, we know the risks, we understand the technologyand we know [how the technology needs to progress] if wewant to see a greater percentage of the power portfoliofrom wind.” 45
A look at renewable energy finance and investmentreveals 10 key trends, elaborated below: (1) global invest-ment is growing in all regions, but emerging markets areexpected to become the core; (2) sector preferences reflectthe maturity and potential of the technology; (3) privateinvestors are becoming more bullish due to policies andpolitical factors; (4) investment banking firms are showinginterest; (5) venture capital favors clean energy; (6) thebond market is starting to finance wind farms; (7) privateequity investments slowed in 2006; (8) renewable energycompany valuations have skyrocketed; (9) mergers and
T
SPECIAL SUPPLEMENT:
PRIVATE FINANCE AND INVESTMENT TRENDS
PAGE 14 2006 Update RENEWABLES GLOBAL STATUS REPORT
(3) Private investors are becoming more bullish due to policies and political factors.
Private-sector players are adopting a more bullishapproach within increasingly favorable political environ-ments. Investors frequently note that policy framework con-ditions are an important determinant of future decisions toinvest. According to a 2005 prognosis by CleanEdgeNews,markets for biofuels, solar PV, wind energy, and fuel cells arepoised to expand four-fold, to $170 billion in global rev-enues by 2015.52 Not only an increasing array of supportingpolicies, but also long-term political priorities are attractingattention. Christian Unger, Head of Energy at Bank of Aus-tria, uses International Energy Agency data to arrive at “thebreathtaking figure of $16 trillion [that] will be invested inthe energy sector until 2030.” He cites oil prices, nationalsecurity considerations, and the need for increased fuelautonomy as the driving factors.53
(4) Investment banking firms are showing interest.Steven Greenwald, head of project finance with Credit
Suisse First Boston’s Energy Group, notes that “capital markets are starting to get comfortable with this space.”54
Examples include Goldman Sachs, which invested $10 mil-lion in a waste-to-energy biotechnology company in 2005,following its purchase the previous year of Horizon WindEnergy (formerly Zilkha Renewable Energy), a U.S. windfarm developer.55 Citigroup’s Sustainable DevelopmentInvestment Program in 2005 invested in Balrampur ChiniMills Ltd., one of the largest sugar producers in India, acompany that intends to expand its ethanol manufacturingcapacity.56 In addition, investment bank UBS AG and Dia-pason Commodities Management S.A. launched the first-ever biological fuels global index in the first quarter of 2006,which covers commodities used in the production ofethanol and biodiesel.57
(5) Venture capital investments are favoring clean energy.Venture capital investments are favoring clean energy
over fossil fuels, because clean energy technology is more inline with the venture capital risk/reward profile than con-ventional energy. Typically, returns in clean energy technol-ogy are in the 20 percent or higher range. Three of thehottest initial public offerings in 2005 were in the solar PVindustry. The ‘European Liquidity Report’ from Dow JonesVenture One, which details trends in venture-backed IPOs,notes that the largest such IPO in 2005 was the Germanrenewable energy company Q-Cells, which was valued over1 billion after its initial public offering, with current marketcapitalization approaching 2 billion.58
Smaller companies for other technologies, includingwind and biofuels, are receiving venture capital investmentsin anticipation of similar gains in going public. John Doerrof Kleiner Perkins Caufield and Byer, a venture capitalistrecognized for astutely investing in Google before it went
public, said at a recent conference that the single largest economic opportunity of this century would be the cleantechnology sector. According to the 2006 Cleantech VentureCapital Report on North American venture capital invest-ing, devotion to the clean technology segment is on theupswing.59 During the dot-com bubble era of 1999–2001,up to 3 percent of all venture capital was carved out forclean tech investments. That commitment inched up to 5–6percent from 2002 to 2005. By 2009, the report suggests itwill jump to 10 percent of all venture capital investmentactivity, which could amount to $6–9 billion.
(6) The bond market is starting to finance wind farms.A noticeable trend is the financing of wind farms
through the bond market, as this provides longer term andless expensive financing than conventional loans thatmature in 12–14 years. Banks are also financing projects bybundling assets from several wind farms to provide collat-eral for bonds. Alex Moss, senior credit analyst at InsightInvestment Management, says, “The trend now is to pooldifferent projects together” so that “it doesn’t matter if onewind farm doesn’t work.” Italian Bank UniCredit’s HVBGroup, for example, sold nearly $600 million in bonds inMay 2006 to pay for 39 wind farms in France and Germany.Dagmar Buhl of HVB believes the market may grow to Û5billion ($6 billion) in coming years. Alte Liebe, which ownseight German wind farms, sold Û102 million ($120 million)of bonds due in 2025.60
(7) Private equity investments slowed in 2006.In contrast to banks or venture capitalists or bond
investors, private equity investors appear to have lost someinterest in renewable energy, as it fits less well with theirinvestment strategy. Private equity investors acquire control-ling stakes in companies using high levels of debt and lookfor companies with strong cash flow. Analysis by NewEnergy Finance suggests that private equity investments inclean energy slowed in the first half of 2006, whereas ven-ture capital investments were over 60 percent higher than in2005. However, this is likely a temporary phenomenon, dueto the surge of activity in late 2005 and supply bottlenecksin the solar and wind sectors. Vincenzo La Ruffa of the pri-vate equity firm NGP Energy Technology Partners believesthat the slowdown in private equity is likely to be short-lived and anticipates that, “by the end of the year, you’regoing to see more funds at least partially devoted to energytechnology…. I think you’re going to see growth in allstages—in the seed stage, early-stage growth capital, and inbuyouts—whereas traditionally, outside of very few discreteinvestments, it’s been mostly an early-stage game.”61
(8) Renewable energy company valuations have skyrocketed.
London’s Alternative Investment Market (AIM) is a lead
RENEWABLES GLOBAL STATUS REPORT 2006 Update PAGE 15
listing candidate for clean energy technology because it isless regulated than the U.S. market.62 Since late 2004, 26clean energy companies have issued initial public offerings(IPOs) on AIM or carried out secondary offerings.63 During2005, the value of AIM’s clean energy stocks rose by 29 per-cent—a performance bested only by Frankfurt’s market.64
In general, smaller clean energy technology companies liston the AIM market, while larger companies often courtNASDAQ.65 As noted in Section 3 of this report, the marketcapitalization of leading renewable energy companies anddivisions valued at over $40 million each jumped from $25 billion in mid-2005 to $50 billion by mid-2006. In theUnited States, more and more solar-related companies arebecoming public, a trend that began markedly in 2005.66
Against the background of this market activity, it isimportant to note that significant market correction hasbeen necessary. New Energy Finance’s NEX index (87 cleanenergy stocks that include technology, equipment, and assetowners on 18 markets internationally) grew by 29 percentcompound from December 2002 to December 2005. Duringthe first 19 weeks of 2006, the index climbed 41 percent andthen crashed. By mid-2006 it was up only 9.5 percent on theyear. The reasons for the correction, according to NewEnergy Finance’s Michael Liebreich, include over-exuber-ance in valuations, particularly in solar PV; the crash in EUEmissions Trading Scheme prices; general market condi-tions; and supply bottlenecks in wind, solar, and biofuels.
(9) Mergers and acquisitions by major renewable energycompanies remain buoyant.
Acquisition prices suggest a willingness to pay substan-tial sums. Two of Australia’s biggest renewable energy gener-ators, Pacific Hydro and Southern Hydro, were acquired in2005 for a total price of Aus$2.3 billion ($1.7 billion), andthe Swedish market power producer Vattenfall boughtSwedish Offshore Wind for $12.7 million to construct the$1 billion Kriegers Flak wind farm in the Baltic Sea.67 NewEnergy Finance suggests that merger and acquisition activityin the global renewable energy sector has been growing at
just under 50 percent per annum for five years, reaching $14 billion in 2005 and, furthermore, activity in the alreadyacquisitive solar PV sector is forecast to increase.68 Accord-ing to Walter Nasdeo of Ardour Capital Partners, the world-wide shortage of silicon has been a key reason for the trendin this sector.69
(10) Market growth looks set to remain sturdy.Renewable energy market growth is happening in
almost all sectors, countries, and investment stages. In a fewsectors the industry is facing bottlenecks, but when theseopen up, renewed growth will be seen. The growth of pri-vate finance and investment flows suggests that the renew-able energy sector has become more than a transient spot onthe edge of financiers’ radar screens. One investment firmcommented that clients really weren’t interested in renew-ables back in 2002 and 2003, but in the last two years “themarket has exploded.” New Energy Finance estimates globalfinancing flows for the clean energy sector at $59 billion in2005, including mergers and acquisitions ($15 billion), assetfinance for large-scale projects ($18 billion), “distributedprojects” or small-scale renewable investments ($7 billion),government R&D ($6 billion), corporate R&D ($4 billion),corporate plant and equipment ($3 billion), public equitiesinvestment ($4.3 billion), and venture capital for plant andequipment ($1.6 billion).70 (These numbers don’t corre-spond directly with investment numbers cited elsewhere inthis report, as they include some non-renewables technolo-gies and don’t count all capacity additions or technologies.)
Overall, the clean energy sector has gone well beyondidealists to include serious entrepreneurs. In the words ofone renewables entrepreneur, “The face of the market hasgone from long hair to business suits—it might be thesame folks with the same values, but the appeal is differentnow.” Indeed, investors are feeling more and more com-fortable committing capital for the long periods requiredby most projects in this sector, particularly as technologiesmature, expertise increases, and risk management is betterunderstood.71
PAGE 16 2006 Update RENEWABLES GLOBAL STATUS REPORT
SOURCES OF DATA
Sources of information for this report and the originalRenewables 2005: Global Status Report are highly diverse.The 2005 report drew from over 250 published references,plus a variety of electronic newsletters, unpublished submis-sions from contributors, personal communications, andWeb sites. There is generally no single source of informationfor any fact globally, as most existing sources report only ondeveloped (OECD) countries or on regional or national lev-els, such as Europe or the United States. (Wind power andsolar hot water are exceptions; single sources for global datado exist.) Thus, global aggregates are built from the bottomup, adding or aggregating individual country information.Developing countries in particular require country-by-country sources, as very little material exists that coversdeveloping countries as a group. All of the information,graphs, and tables in the report are built from multiplesources, often involving triangulation of conflicting or par-tial information using assumptions and growth trends.Key sources of data for the original report and this updateinclude the following (see references in this report and theoriginal 2005 report for details and web links):
• International Energy Agency publishes statistical annualsfor OECD countries, including the Renewables Informa-tion annual reports, and maintains a global renewableenergy policy database.
• U.S. Energy Information Administration publishes statisti-cal and descriptive annuals.
• Interstate Renewable Energy Council maintains the DSIREdatabase of U.S. state-level renewable energy policies.
• Systèmes Solaires publishes the comprehensive “EurOb-serv’ER” statistical and descriptive series for renewableenergy in Europe, with several bulletins each year, eachcovering different technologies.
• World Energy Council publishes a periodic survey ofworld energy resources that includes renewables.
• F. O. Licht publishes comprehensive annual and monthlyreports on global biofuels.
• Industry associations often have up-to-date statistics and information on their web sites, such as Global WindEnergy Council, World Wind Energy Association, Ameri-can Wind Energy Association, European Solar ThermalIndustry Federation, European Biodiesel Board, EuropeanBioethanol Fuel Association (eBIO), U.S. Renewable FuelsAssociation, Canada Renewable Fuels Association.
• REN21 is beginning to post online individual country sub-
missions describing progress with the Bonn “Renewables2004” International Action Programme.
• Magazines and newsletters report on industry and policydevelopments, such as RenewableEnergyAccess.com, PVNews, Photon International, and Renewable Energy World.
• Conference proceedings and online conference presenta-tions may provide up-to-date information.
Global investment numbers reflect a database by EricMartinot of installed capacity by technology and by year.These installed capacity figures are multiplied by assumedaverage capacity costs (i.e., in $/kW or $/m2). Capacity costsare taken globally, with the exception of small hydropowerand solar hot water in China, to which lower cost estimatesare applied. Some costs, such as biomass power generation,vary widely, and a global average becomes problematic.Thus, the investment numbers are approximate, althoughthe time progression, using a consistent set of assumptions,should reasonably portray the growth of investment.
Data for developing countries is often some years olderthan data for developed countries, and thus extrapolationsto the present must be made from older data, based onassumed and historical growth rates. This is one of the rea-sons that capacity data (kW) instead of energy data (kWh)are reported, as capacity expansion is easier to extrapolatethan energy production and is less prone to seasonal andannual variations that are common to many forms ofrenewables. (Other reasons are that capacity data bettermimic investment trends over time, as capacity is usuallydirectly proportion to investment, while energy productionis not; and capacity data is generally more available fordeveloping countries than energy production.)
Most capacity figures are taken from reports of existingcapacity, extrapolating to the present if current-year data arenot available. Recent retirements or rehabilitations mayappear only in future data. Annual increments to capacityare generally available only for wind, solar PV, and solar hotwater. Solar hot water retirements are significant in somecountries, and data reporting attempts to account for theseretirements.
Future editions of this report can improve data sourcesand presentation in several key areas, including shares ofelectricity generation and total primary energy consump-tion, costs and economics, different ways of reporting bio-mass electricity and heat production, and rural energy.72
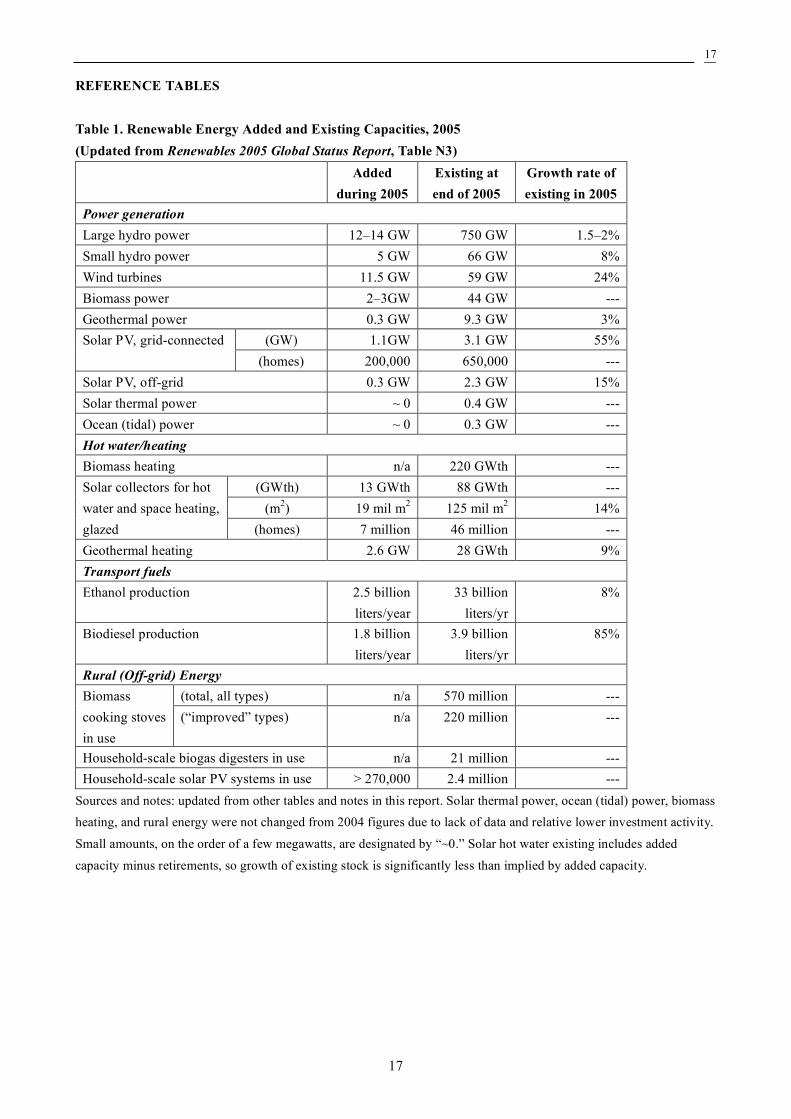
17
17
REFERENCE TABLES Table 1. Renewable Energy Added and Existing Capacities, 2005 (Updated from Renewables 2005 Global Status Report, Table N3)
Added during 2005
Existing at end of 2005
Growth rate of existing in 2005
Power generation Large hydro power 12–14 GW 750 GW 1.5–2% Small hydro power 5 GW 66 GW 8% Wind turbines 11.5 GW 59 GW 24% Biomass power 2–3GW 44 GW --- Geothermal power 0.3 GW 9.3 GW 3%
(GW) 1.1GW 3.1 GW 55% Solar PV, grid-connected (homes) 200,000 650,000 ---
Solar PV, off-grid 0.3 GW 2.3 GW 15% Solar thermal power ~ 0 0.4 GW --- Ocean (tidal) power ~ 0 0.3 GW --- Hot water/heating Biomass heating n/a 220 GWth ---
(GWth) 13 GWth 88 GWth --- (m2) 19 mil m2 125 mil m2 14%
Solar collectors for hot water and space heating, glazed (homes) 7 million 46 million --- Geothermal heating 2.6 GW 28 GWth 9% Transport fuels Ethanol production 2.5 billion
liters/year 33 billion
liters/yr 8%
Biodiesel production 1.8 billion liters/year
3.9 billion liters/yr
85%
Rural (Off-grid) Energy (total, all types) n/a 570 million --- Biomass
cooking stoves in use
(“improved” types) n/a 220 million ---
Household-scale biogas digesters in use n/a 21 million --- Household-scale solar PV systems in use > 270,000 2.4 million ---
Sources and notes: updated from other tables and notes in this report. Solar thermal power, ocean (tidal) power, biomass heating, and rural energy were not changed from 2004 figures due to lack of data and relative lower investment activity.
Small amounts, on the order of a few megawatts, are designated by “~0.” Solar hot water existing includes added
capacity minus retirements, so growth of existing stock is significantly less than implied by added capacity.
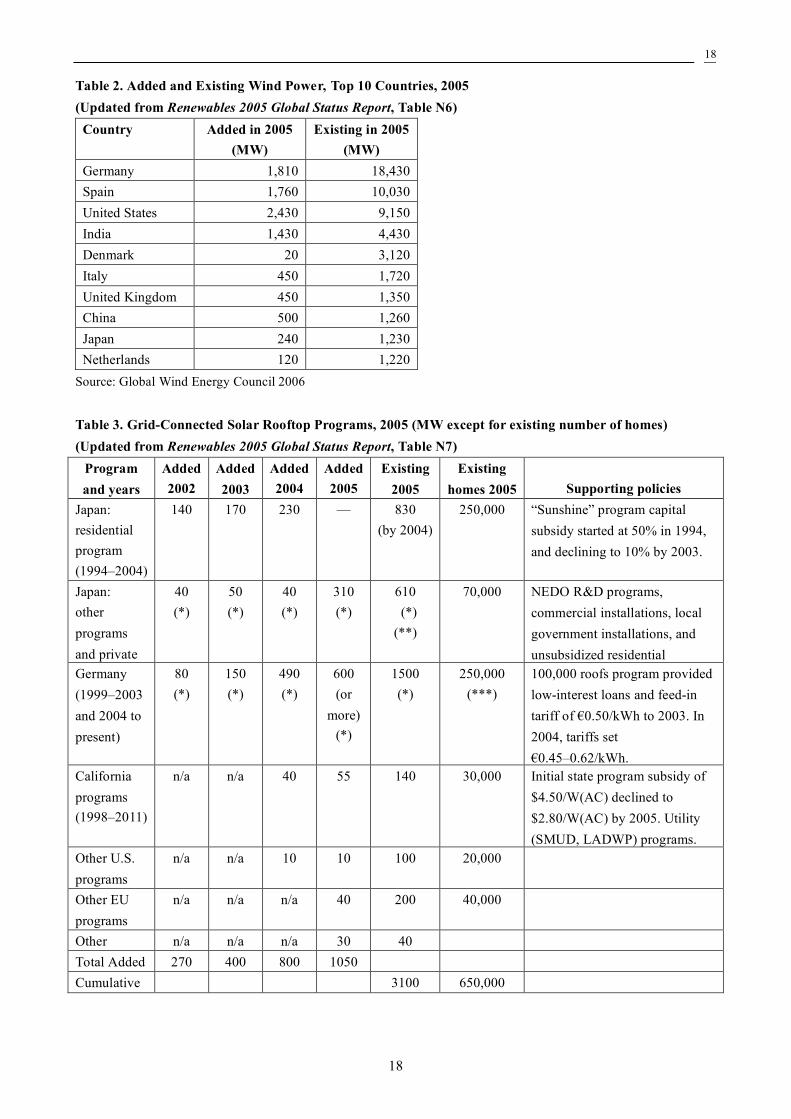
18
18
Table 2. Added and Existing Wind Power, Top 10 Countries, 2005 (Updated from Renewables 2005 Global Status Report, Table N6)
Country Added in 2005 (MW)
Existing in 2005 (MW)
Germany 1,810 18,430 Spain 1,760 10,030 United States 2,430 9,150 India 1,430 4,430 Denmark 20 3,120 Italy 450 1,720 United Kingdom 450 1,350 China 500 1,260 Japan 240 1,230 Netherlands 120 1,220
Source: Global Wind Energy Council 2006
Table 3. Grid-Connected Solar Rooftop Programs, 2005 (MW except for existing number of homes) (Updated from Renewables 2005 Global Status Report, Table N7)
Program and years
Added 2002
Added 2003
Added 2004
Added 2005
Existing 2005
Existing homes 2005
Supporting policies
Japan: residential program (1994–2004)
140 170 230 — 830 (by 2004)
250,000
“Sunshine” program capital subsidy started at 50% in 1994, and declining to 10% by 2003.
Japan: other programs and private
40 (*)
50 (*)
40 (*)
310 (*)
610 (*) (**)
70,000 NEDO R&D programs, commercial installations, local government installations, and unsubsidized residential
Germany (1999–2003 and 2004 to present)
80 (*)
150 (*)
490 (*)
600 (or
more) (*)
1500 (*)
250,000 (***)
100,000 roofs program provided low-interest loans and feed-in tariff of €0.50/kWh to 2003. In 2004, tariffs set €0.45–0.62/kWh.
California programs (1998–2011)
n/a n/a 40 55 140 30,000
Initial state program subsidy of $4.50/W(AC) declined to $2.80/W(AC) by 2005. Utility (SMUD, LADWP) programs.
Other U.S. programs
n/a n/a 10 10 100 20,000
Other EU programs
n/a n/a n/a 40 200 40,000
Other n/a n/a n/a 30 40 Total Added 270 400 800 1050 Cumulative 3100 650,000
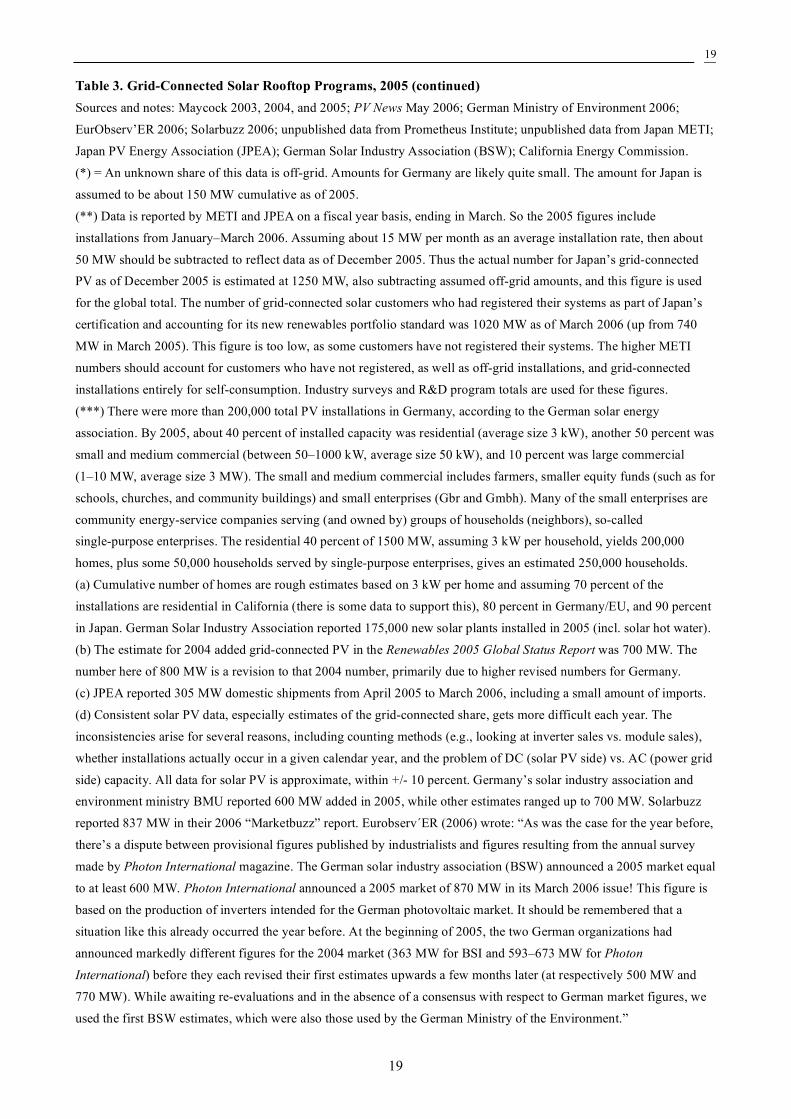
19
19
Table 3. Grid-Connected Solar Rooftop Programs, 2005 (continued) Sources and notes: Maycock 2003, 2004, and 2005; PV News May 2006; German Ministry of Environment 2006;
EurObserv’ER 2006; Solarbuzz 2006; unpublished data from Prometheus Institute; unpublished data from Japan METI;
Japan PV Energy Association (JPEA); German Solar Industry Association (BSW); California Energy Commission.
(*) = An unknown share of this data is off-grid. Amounts for Germany are likely quite small. The amount for Japan is
assumed to be about 150 MW cumulative as of 2005.
(**) Data is reported by METI and JPEA on a fiscal year basis, ending in March. So the 2005 figures include
installations from January–March 2006. Assuming about 15 MW per month as an average installation rate, then about
50 MW should be subtracted to reflect data as of December 2005. Thus the actual number for Japan’s grid-connected PV as of December 2005 is estimated at 1250 MW, also subtracting assumed off-grid amounts, and this figure is used
for the global total. The number of grid-connected solar customers who had registered their systems as part of Japan’s
certification and accounting for its new renewables portfolio standard was 1020 MW as of March 2006 (up from 740
MW in March 2005). This figure is too low, as some customers have not registered their systems. The higher METI
numbers should account for customers who have not registered, as well as off-grid installations, and grid-connected
installations entirely for self-consumption. Industry surveys and R&D program totals are used for these figures.
(***) There were more than 200,000 total PV installations in Germany, according to the German solar energy
association. By 2005, about 40 percent of installed capacity was residential (average size 3 kW), another 50 percent was
small and medium commercial (between 50–1000 kW, average size 50 kW), and 10 percent was large commercial
(1–10 MW, average size 3 MW). The small and medium commercial includes farmers, smaller equity funds (such as for
schools, churches, and community buildings) and small enterprises (Gbr and Gmbh). Many of the small enterprises are
community energy-service companies serving (and owned by) groups of households (neighbors), so-called single-purpose enterprises. The residential 40 percent of 1500 MW, assuming 3 kW per household, yields 200,000
homes, plus some 50,000 households served by single-purpose enterprises, gives an estimated 250,000 households.
(a) Cumulative number of homes are rough estimates based on 3 kW per home and assuming 70 percent of the
installations are residential in California (there is some data to support this), 80 percent in Germany/EU, and 90 percent
in Japan. German Solar Industry Association reported 175,000 new solar plants installed in 2005 (incl. solar hot water).
(b) The estimate for 2004 added grid-connected PV in the Renewables 2005 Global Status Report was 700 MW. The
number here of 800 MW is a revision to that 2004 number, primarily due to higher revised numbers for Germany.
(c) JPEA reported 305 MW domestic shipments from April 2005 to March 2006, including a small amount of imports.
(d) Consistent solar PV data, especially estimates of the grid-connected share, gets more difficult each year. The
inconsistencies arise for several reasons, including counting methods (e.g., looking at inverter sales vs. module sales),
whether installations actually occur in a given calendar year, and the problem of DC (solar PV side) vs. AC (power grid
side) capacity. All data for solar PV is approximate, within +/- 10 percent. Germany’s solar industry association and environment ministry BMU reported 600 MW added in 2005, while other estimates ranged up to 700 MW. Solarbuzz
reported 837 MW in their 2006 “Marketbuzz” report. Eurobserv´ER (2006) wrote: “As was the case for the year before,
there’s a dispute between provisional figures published by industrialists and figures resulting from the annual survey
made by Photon International magazine. The German solar industry association (BSW) announced a 2005 market equal
to at least 600 MW. Photon International announced a 2005 market of 870 MW in its March 2006 issue! This figure is
based on the production of inverters intended for the German photovoltaic market. It should be remembered that a
situation like this already occurred the year before. At the beginning of 2005, the two German organizations had
announced markedly different figures for the 2004 market (363 MW for BSI and 593–673 MW for Photon International) before they each revised their first estimates upwards a few months later (at respectively 500 MW and
770 MW). While awaiting re-evaluations and in the absence of a consensus with respect to German market figures, we
used the first BSW estimates, which were also those used by the German Ministry of the Environment.”
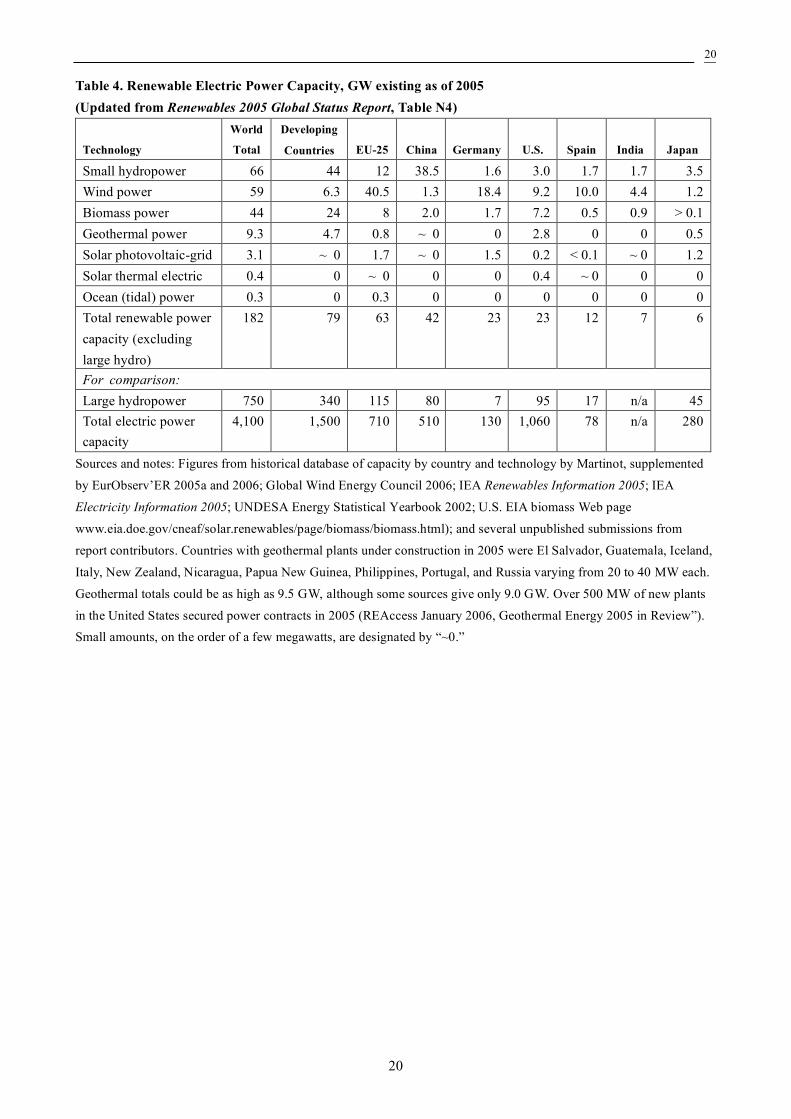
20
20
Table 4. Renewable Electric Power Capacity, GW existing as of 2005 (Updated from Renewables 2005 Global Status Report, Table N4)
Technology
World
Total
Developing
Countries
EU-25
China
Germany
U.S.
Spain
India
Japan
Small hydropower 66 44 12 38.5 1.6 3.0 1.7 1.7 3.5 Wind power 59 6.3 40.5 1.3 18.4 9.2 10.0 4.4 1.2 Biomass power 44 24 8 2.0 1.7 7.2 0.5 0.9 > 0.1 Geothermal power 9.3 4.7 0.8 ~ 0 0 2.8 0 0 0.5 Solar photovoltaic-grid 3.1 ~ 0 1.7 ~ 0 1.5 0.2 < 0.1 ~ 0 1.2 Solar thermal electric 0.4 0 ~ 0 0 0 0.4 ~ 0 0 0 Ocean (tidal) power 0.3 0 0.3 0 0 0 0 0 0 Total renewable power capacity (excluding large hydro)
182 79 63 42 23 23 12 7 6
For comparison: Large hydropower 750 340 115 80 7 95 17 n/a 45 Total electric power capacity
4,100 1,500 710 510 130 1,060 78 n/a 280
Sources and notes: Figures from historical database of capacity by country and technology by Martinot, supplemented
by EurObserv’ER 2005a and 2006; Global Wind Energy Council 2006; IEA Renewables Information 2005; IEA
Electricity Information 2005; UNDESA Energy Statistical Yearbook 2002; U.S. EIA biomass Web page
www.eia.doe.gov/cneaf/solar.renewables/page/biomass/biomass.html); and several unpublished submissions from
report contributors. Countries with geothermal plants under construction in 2005 were El Salvador, Guatemala, Iceland,
Italy, New Zealand, Nicaragua, Papua New Guinea, Philippines, Portugal, and Russia varying from 20 to 40 MW each.
Geothermal totals could be as high as 9.5 GW, although some sources give only 9.0 GW. Over 500 MW of new plants
in the United States secured power contracts in 2005 (REAccess January 2006, Geothermal Energy 2005 in Review”). Small amounts, on the order of a few megawatts, are designated by “~0.”
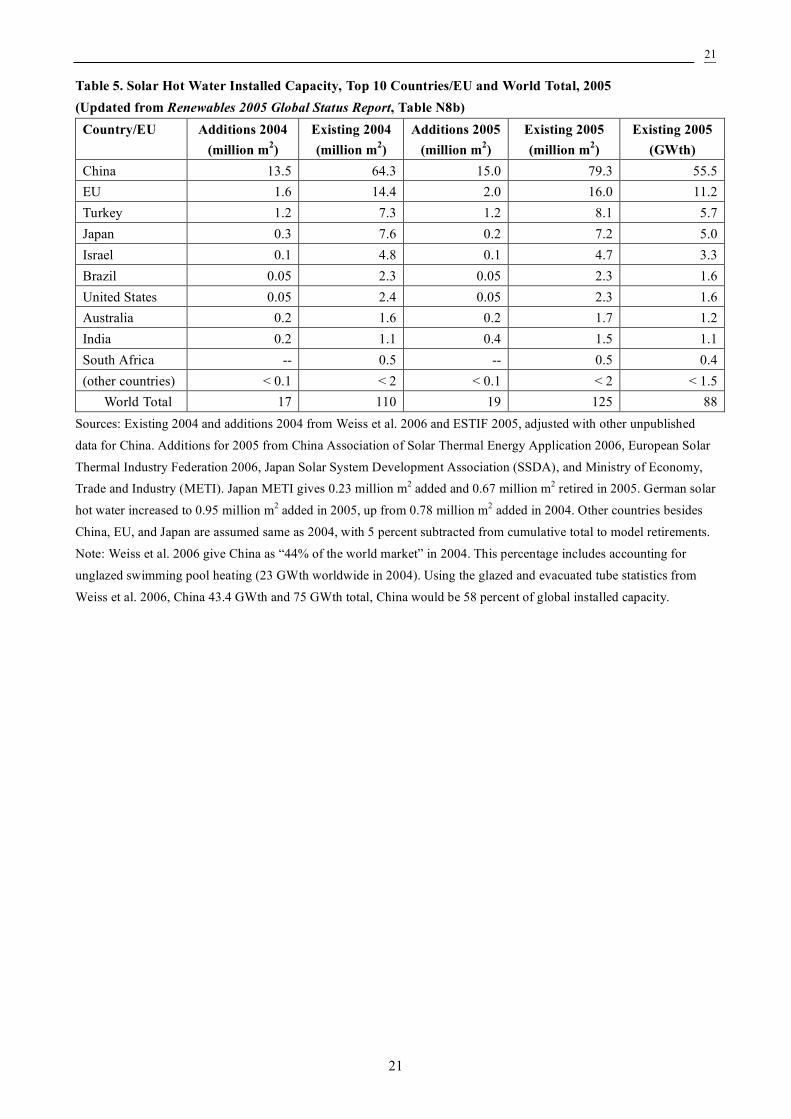
21
21
Table 5. Solar Hot Water Installed Capacity, Top 10 Countries/EU and World Total, 2005 (Updated from Renewables 2005 Global Status Report, Table N8b)
Country/EU Additions 2004 (million m2)
Existing 2004 (million m2)
Additions 2005 (million m2)
Existing 2005 (million m2)
Existing 2005 (GWth)
China 13.5 64.3 15.0 79.3 55.5 EU 1.6 14.4 2.0 16.0 11.2 Turkey 1.2 7.3 1.2 8.1 5.7 Japan 0.3 7.6 0.2 7.2 5.0 Israel 0.1 4.8 0.1 4.7 3.3 Brazil 0.05 2.3 0.05 2.3 1.6 United States 0.05 2.4 0.05 2.3 1.6 Australia 0.2 1.6 0.2 1.7 1.2 India 0.2 1.1 0.4 1.5 1.1 South Africa -- 0.5 -- 0.5 0.4 (other countries) < 0.1 < 2 < 0.1 < 2 < 1.5 World Total 17 110 19 125 88
Sources: Existing 2004 and additions 2004 from Weiss et al. 2006 and ESTIF 2005, adjusted with other unpublished
data for China. Additions for 2005 from China Association of Solar Thermal Energy Application 2006, European Solar
Thermal Industry Federation 2006, Japan Solar System Development Association (SSDA), and Ministry of Economy, Trade and Industry (METI). Japan METI gives 0.23 million m2 added and 0.67 million m2 retired in 2005. German solar
hot water increased to 0.95 million m2 added in 2005, up from 0.78 million m2 added in 2004. Other countries besides
China, EU, and Japan are assumed same as 2004, with 5 percent subtracted from cumulative total to model retirements.
Note: Weiss et al. 2006 give China as “44% of the world market” in 2004. This percentage includes accounting for
unglazed swimming pool heating (23 GWth worldwide in 2004). Using the glazed and evacuated tube statistics from
Weiss et al. 2006, China 43.4 GWth and 75 GWth total, China would be 58 percent of global installed capacity.
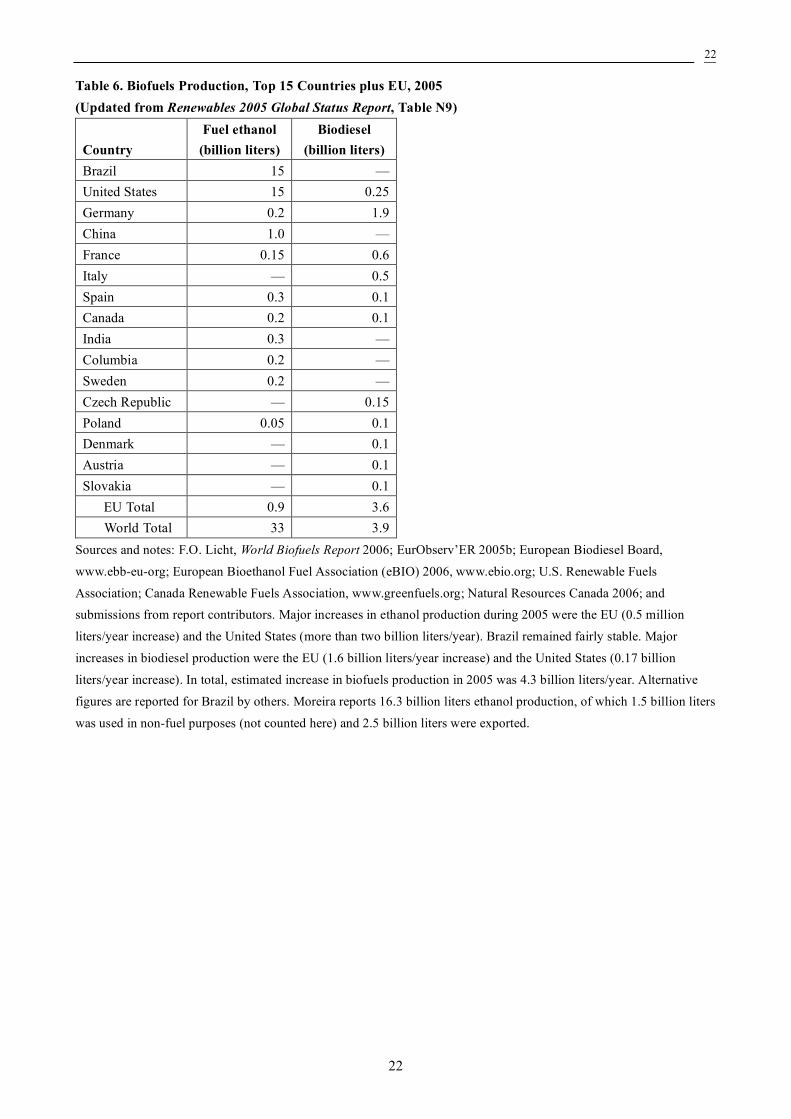
22
22
Table 6. Biofuels Production, Top 15 Countries plus EU, 2005 (Updated from Renewables 2005 Global Status Report, Table N9)
Country
Fuel ethanol (billion liters)
Biodiesel (billion liters)
Brazil 15 — United States 15 0.25 Germany 0.2 1.9 China 1.0 — France 0.15 0.6 Italy — 0.5 Spain 0.3 0.1 Canada 0.2 0.1 India 0.3 — Columbia 0.2 — Sweden 0.2 — Czech Republic — 0.15 Poland 0.05 0.1 Denmark — 0.1 Austria — 0.1 Slovakia — 0.1 EU Total 0.9 3.6 World Total 33 3.9
Sources and notes: F.O. Licht, World Biofuels Report 2006; EurObserv’ER 2005b; European Biodiesel Board,
www.ebb-eu-org; European Bioethanol Fuel Association (eBIO) 2006, www.ebio.org; U.S. Renewable Fuels
Association; Canada Renewable Fuels Association, www.greenfuels.org; Natural Resources Canada 2006; and submissions from report contributors. Major increases in ethanol production during 2005 were the EU (0.5 million
liters/year increase) and the United States (more than two billion liters/year). Brazil remained fairly stable. Major
increases in biodiesel production were the EU (1.6 billion liters/year increase) and the United States (0.17 billion
liters/year increase). In total, estimated increase in biofuels production in 2005 was 4.3 billion liters/year. Alternative
figures are reported for Brazil by others. Moreira reports 16.3 billion liters ethanol production, of which 1.5 billion liters
was used in non-fuel purposes (not counted here) and 2.5 billion liters were exported.
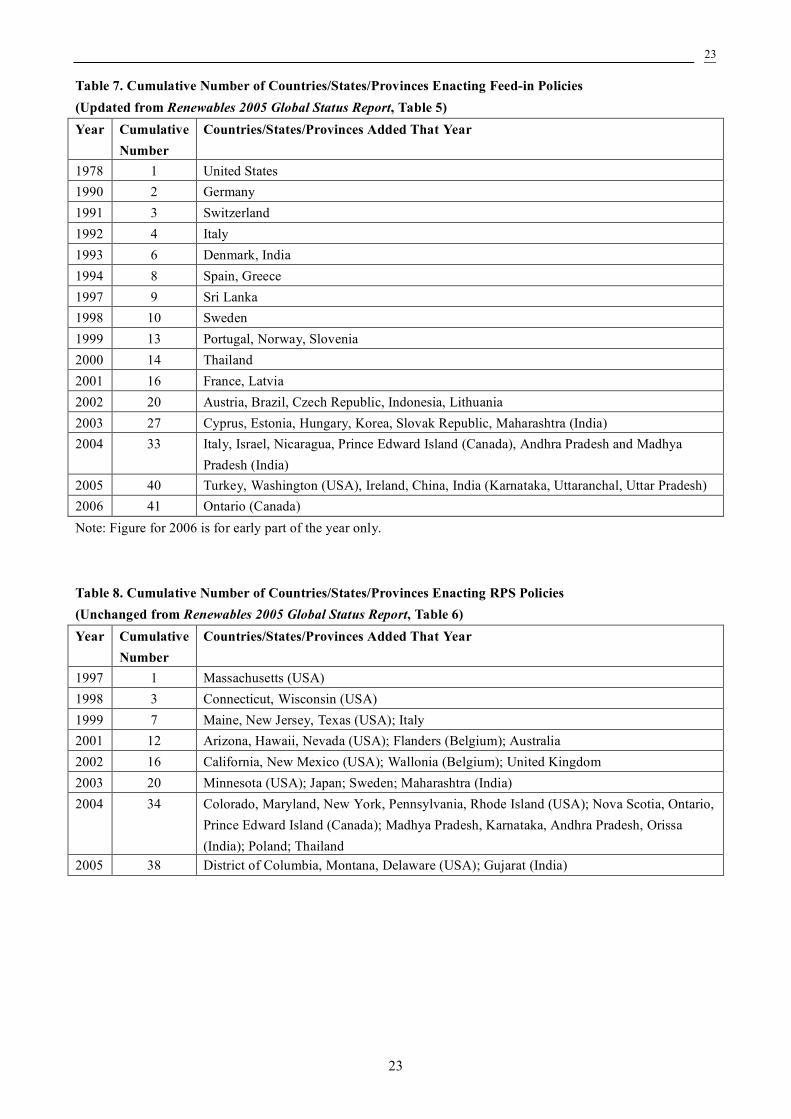
23
23
Table 7. Cumulative Number of Countries/States/Provinces Enacting Feed-in Policies (Updated from Renewables 2005 Global Status Report, Table 5) Year Cumulative
Number Countries/States/Provinces Added That Year
1978 1 United States 1990 2 Germany 1991 3 Switzerland 1992 4 Italy 1993 6 Denmark, India 1994 8 Spain, Greece 1997 9 Sri Lanka 1998 10 Sweden 1999 13 Portugal, Norway, Slovenia 2000 14 Thailand 2001 16 France, Latvia 2002 20 Austria, Brazil, Czech Republic, Indonesia, Lithuania 2003 27 Cyprus, Estonia, Hungary, Korea, Slovak Republic, Maharashtra (India) 2004 33 Italy, Israel, Nicaragua, Prince Edward Island (Canada), Andhra Pradesh and Madhya
Pradesh (India) 2005 40 Turkey, Washington (USA), Ireland, China, India (Karnataka, Uttaranchal, Uttar Pradesh) 2006 41 Ontario (Canada) Note: Figure for 2006 is for early part of the year only. Table 8. Cumulative Number of Countries/States/Provinces Enacting RPS Policies (Unchanged from Renewables 2005 Global Status Report, Table 6) Year Cumulative
Number Countries/States/Provinces Added That Year
1997 1 Massachusetts (USA) 1998 3 Connecticut, Wisconsin (USA) 1999 7 Maine, New Jersey, Texas (USA); Italy 2001 12 Arizona, Hawaii, Nevada (USA); Flanders (Belgium); Australia 2002 16 California, New Mexico (USA); Wallonia (Belgium); United Kingdom 2003 20 Minnesota (USA); Japan; Sweden; Maharashtra (India) 2004 34 Colorado, Maryland, New York, Pennsylvania, Rhode Island (USA); Nova Scotia, Ontario,
Prince Edward Island (Canada); Madhya Pradesh, Karnataka, Andhra Pradesh, Orissa (India); Poland; Thailand
2005 38 District of Columbia, Montana, Delaware (USA); Gujarat (India)
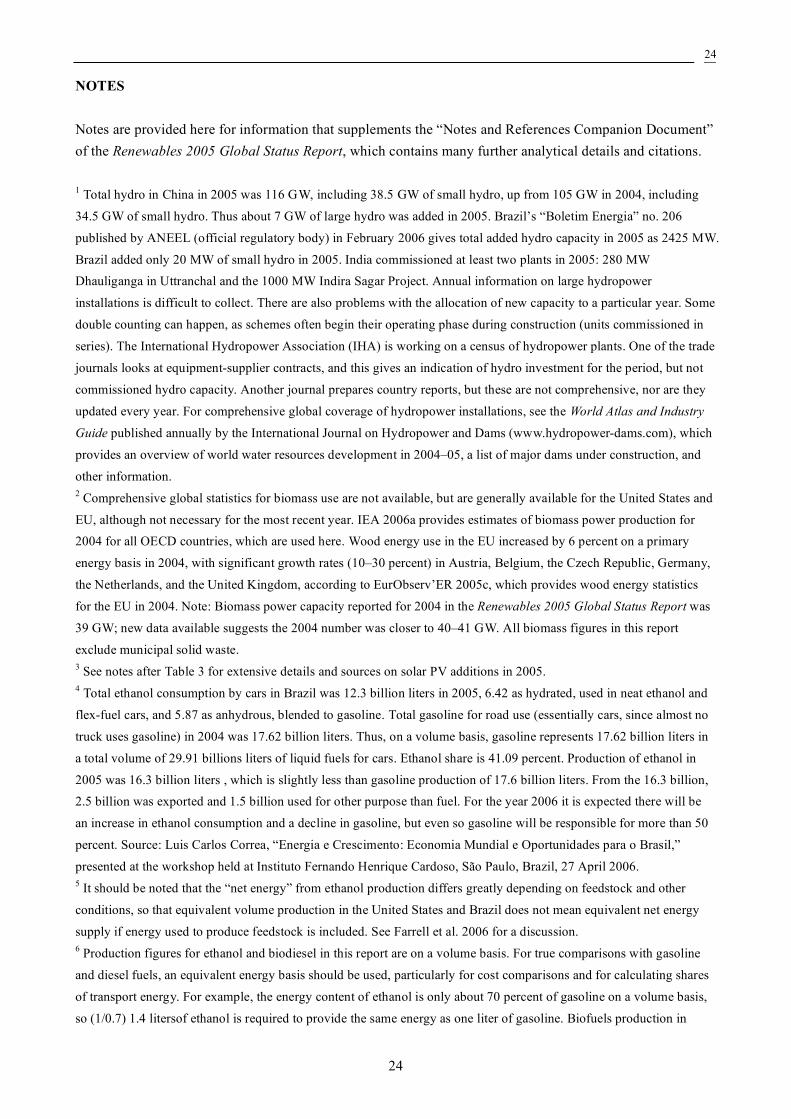
24
24
NOTES Notes are provided here for information that supplements the “Notes and References Companion Document” of the Renewables 2005 Global Status Report, which contains many further analytical details and citations. 1 Total hydro in China in 2005 was 116 GW, including 38.5 GW of small hydro, up from 105 GW in 2004, including
34.5 GW of small hydro. Thus about 7 GW of large hydro was added in 2005. Brazil’s “Boletim Energia” no. 206
published by ANEEL (official regulatory body) in February 2006 gives total added hydro capacity in 2005 as 2425 MW.
Brazil added only 20 MW of small hydro in 2005. India commissioned at least two plants in 2005: 280 MW Dhauliganga in Uttranchal and the 1000 MW Indira Sagar Project. Annual information on large hydropower
installations is difficult to collect. There are also problems with the allocation of new capacity to a particular year. Some
double counting can happen, as schemes often begin their operating phase during construction (units commissioned in
series). The International Hydropower Association (IHA) is working on a census of hydropower plants. One of the trade
journals looks at equipment-supplier contracts, and this gives an indication of hydro investment for the period, but not
commissioned hydro capacity. Another journal prepares country reports, but these are not comprehensive, nor are they
updated every year. For comprehensive global coverage of hydropower installations, see the World Atlas and Industry Guide published annually by the International Journal on Hydropower and Dams (www.hydropower-dams.com), which
provides an overview of world water resources development in 2004–05, a list of major dams under construction, and
other information. 2 Comprehensive global statistics for biomass use are not available, but are generally available for the United States and
EU, although not necessary for the most recent year. IEA 2006a provides estimates of biomass power production for 2004 for all OECD countries, which are used here. Wood energy use in the EU increased by 6 percent on a primary
energy basis in 2004, with significant growth rates (10–30 percent) in Austria, Belgium, the Czech Republic, Germany,
the Netherlands, and the United Kingdom, according to EurObserv’ER 2005c, which provides wood energy statistics
for the EU in 2004. Note: Biomass power capacity reported for 2004 in the Renewables 2005 Global Status Report was
39 GW; new data available suggests the 2004 number was closer to 40–41 GW. All biomass figures in this report
exclude municipal solid waste. 3 See notes after Table 3 for extensive details and sources on solar PV additions in 2005. 4 Total ethanol consumption by cars in Brazil was 12.3 billion liters in 2005, 6.42 as hydrated, used in neat ethanol and
flex-fuel cars, and 5.87 as anhydrous, blended to gasoline. Total gasoline for road use (essentially cars, since almost no
truck uses gasoline) in 2004 was 17.62 billion liters. Thus, on a volume basis, gasoline represents 17.62 billion liters in
a total volume of 29.91 billions liters of liquid fuels for cars. Ethanol share is 41.09 percent. Production of ethanol in
2005 was 16.3 billion liters , which is slightly less than gasoline production of 17.6 billion liters. From the 16.3 billion, 2.5 billion was exported and 1.5 billion used for other purpose than fuel. For the year 2006 it is expected there will be
an increase in ethanol consumption and a decline in gasoline, but even so gasoline will be responsible for more than 50
percent. Source: Luis Carlos Correa, “Energia e Crescimento: Economia Mundial e Oportunidades para o Brasil,”
presented at the workshop held at Instituto Fernando Henrique Cardoso, São Paulo, Brazil, 27 April 2006. 5 It should be noted that the “net energy” from ethanol production differs greatly depending on feedstock and other
conditions, so that equivalent volume production in the United States and Brazil does not mean equivalent net energy
supply if energy used to produce feedstock is included. See Farrell et al. 2006 for a discussion. 6 Production figures for ethanol and biodiesel in this report are on a volume basis. For true comparisons with gasoline
and diesel fuels, an equivalent energy basis should be used, particularly for cost comparisons and for calculating shares
of transport energy. For example, the energy content of ethanol is only about 70 percent of gasoline on a volume basis,
so (1/0.7) 1.4 litersof ethanol is required to provide the same energy as one liter of gasoline. Biofuels production in
25
25
billion liters per year means 10^6 liters per year (English use of the word “billion”). 7 Biofuels Investment and Capacity Costs. The United States added ethanol production capacity of 2.6 billion liters/year
in 2005, representing perhaps $1 billion of investment in 2004–05. And U.S. capacity under construction in early 2006,
6.5 billion liters/year, represented another $2.5 billion of investment. In the EU, biodiesel production capacity almost
tripled from 2004 to mid-2006, representing over four billion liters/year of added capacity and perhaps $1.2 billion of
investment during 2003–05. In 2006, France planned €1 billion of investment through 2008 for 10 new biofuels plants
to fulfill its share of the EU biofuels target (5.75 percent). A February 2006 report by the U.S. Ethanol Fuels
Association estimated construction costs of $1.40/gallon ($0.40/liter) for a new dry mill ethanol plant and $1.00/gallon
($0.27/liter) for a plant expansion. According to the association, the capacity currently under construction or expansion represents an additional $2.4 billion by the ethanol industry. See
www.ethanolrfa.org/objects/documents/576/economic_contribution_2006.pdf.
Biodiesel converted from tons to liters using conversion factor of 1130 liters/ton (average density 0.88), and
ethanol converted using factor of 1260 liters/ton (average density 0.79). Taken from “Bioenergy Conversion Factors” at
http://bioenergy.ornl.gov/papers/misc/energy_conv.html.
In Brazil, a new series of investments in sugar mills and ethanol distilleries began in 2005 that is expected to add 5
billion liters/year ethanol production by 2009. Actual sugar cane harvesting did not increase appreciably in Brazil in
2005. Harvested area went from 5.63 million hectares (ha) to 5.77 million ha in 2005, for a 2.3 percent increase, per
U.N. Food and Agriculture Organization statistics. In 2005, 60 percent of sugar cane was for sugar, so new land area
used for ethanol was probably just 53,000 ha. Production increased from 416 million tons to 420 million tons, although
yield dropped from 739 Hg/ha in 2004 to 728 Hg/ha in 2005. The planned 40 new sugar mills will have an average
installed capacity of three million tons of sugar cane per year. Another 40 new sugar mills are under development but investment figures aren’t available. When fully operational, these 80 plants would require an additional 240 million
tons/year of sugar cane. These sugar mills should be operational by 2009 but some perhaps as early as 2007. Due to
shortages of sugar cane, full operational capacity may not be achieved until 2011. Many sugar mills are being retrofitted
and expanded, which should require more sugar cane supply. Assuming a central value, an average investment cost is
perhaps $150 million per plant, or $6 billion total for 40 plants. A typical plant might produce 127 million liters/year
and take two years to construct. Considering a yield of 85 liters per ton of sugar cane, 80 new plants would add a total
capacity of 10.2 billion liters of ethanol since it is expected that 50 percent of sugar cane will be used for sugar and 50
percent for ethanol. Thus, these sugar mills will also produce 16 million tons of sugar. Assuming the investment cost is
equally shared by sugar and ethanol, this yields a value of $0.59/liter/year ($75 million/127 million liters/year)
produced. This cost is twice the average cost of distilleries and may be explained by the significant increase in land
prices. A sugar mill requires around 5,000 ha for producing 30 percent of its sugar cane demand for alcohol, which
means a cost of $25 million for land. Subtracting this cost, investment attributable to ethanol is reduced to $50 million, yielding a per-unit investment cost of $0.39/liter/year. 8 The World Bank Group also provided carbon finance of $40 million for renewables, including large hydro. This report
does not cover carbon finance, however, so the figures are excluded from the totals in the text. Future editions of the
Renewables Global Status Report could begin to cover carbon finance. 9 Industry employment estimates have not been updated, but some additional data has become available. By 2006, the
global wind industry employed 235,000 people according to WWEA 2006, a substantial difference from the previous
estimate of 40,000–70,000 in the Renewables 2005: Global Status Report. Germany reports 12,500 people employed in
the solar hot water industry and 30,000 people employed in the solar PV industry. 10 Market capitalization. The following list shows companies according to two criteria: (1) publicly traded stock; and (2)
more than $40 million in market capitalization attributable to renewable energy. This list is preliminary and may
inadvertently exclude companies that meet these criteria or incorrectly include companies, with no liability assumed for
26
26
any missing or incorrect entries. This is not investment advice. The list is: Acciona (Spain), Alliant Energy (USA), ATS
Automation (Canada), Beacon Power (USA), Bharat Heavy Electricals (India), Biofuels Corporation (UK), Boralex
(Canada), BP (UK), Brascan (Canada), British Energy (UK), Calpine (USA), Canadian Hydro Developers (Canada),
Carmanah Technologies (USA/Canada), Centrosolar (Germany), Clean Power Income Fund (Canada), Conergy
(Germany), Corning (USA), Cypress Semiconductor (USA), Daystar (USA), Dyesol Ltd. (Australia), Dynamotive
(USA), E.On Energie (Germany), Endesa (Spain), ENEL (Italy), Energiekontor (Germany), Energy Developments
(Australia), Enersis (Chile), ErSol Solar Energy AG (Germany), E-Ton Solar (Taiwan), Evergreen Solar (USA), Florida
Power & Light Energy (USA), Gamesa Energia (Spain), General Electric (USA), Geodynamics (Australia), Great
Lakes Hydro Income Fund (Canada), Ishikawajima-Harima Heavy Industries (Japan), Japan Wind Development (Japan), Kaneka SolarTech (Japan), Kyocera (Japan), Marubeni (Japan), MEMC (USA), Mitsubishi Electric (Japan),
Mitsubishi Heavy Industries (Japan), Motech Industries (Taiwan), NEPC India (India), Nordex Energy (Germany),
Ocean Power Technologies (UK), Omron (Japan), Ormat Technologies (USA), Pacific Hydro (Australia), Pfleiderer
(Germany), Qcells (Germany), REC (Norway), Reinecke+Pohl Sun Energy (Germany), Renewable Energy Holdings
(UK), Repower Systems (Germany), RWE (Norway), SAG Solarstrom (Germany), Sanyo (Japan), Scottish Power (UK),
Sekisui Chemical (Japan), Sharp (Japan), Shell (UK), Siemens (Germany), Solar Integrated Technologies (UK),
Solar-Fabrik (Germany), Solarparc (Germany), Solartron (Thailand), SolarWorld (Germany), Solon (Germany), Spire
(USA), Sunline (Germany), Sunpower (USA), Suntech Power (China), Sunways AG Photovoltaic Technology
(Germany), Suzlon (India), Talisman Energy (Canada), Tokuyama (Japan), TransCanada (Canada), TXU (USA),
Verbund (Austria), Vestas (Denmark), Wacker-Chemie (Germany), XCEL Energy (USA).
In addition to these companies with publicly traded stock, there are many other companies involved in renewable
energy, such as private unlisted companies and public utilities, that are not traded on stock exchanges. There were no clear criteria or data available to include these companies in an expanded list for this version of this report. Prominent
examples of such companies include Iberdrola of Spain, Nuon and Essent of the Netherlands, Electricité de France,
Hydro Quebec of Canada, Hydro Tasmania of Australia, Norsk Hydro and SN Power of Norway, and Enercon of
Germany. The list also excludes project developers that may not have large capital bases of their own but still are major
players in terms of investment flow. Examples include Zilkha Renewables of the United States (owned by Goldman
Sachs), Clipper Windpower and AES of the United States (which just bought Seawest), Eurus of Japan, and many
others. There is also the issue of renewable energy value chains and what part of the value chain constitutes a renewable
energy business—such as PV silicon wafer manufacturers, manufacturing equipment suppliers, and wind turbine blade
manufacturers (notably LM Glasfibre of Denmark). Future versions of the status report could attempt to create a more
comprehensive list based on these and other criteria.
Market capitalization attributable to renewable energy is a rough estimate. For pure play renewable energy stocks
(stocks that have bulk of earnings from renewables), market capitalization is assumed to be 100-percent attributable to renewable energy. For companies engaged in renewable energy as a minority of earnings, we made rough estimates of
earnings from renewable energy, divided this by total earnings, and multiplied this percentage by total market
capitalization to derive a rough estimate of renewable energy market capitalization. In cases where this was not possible
due to information being either confidential or not available, we made an outside-in estimate of renewable energy
capacity, revenue, and operating profit. We then took the ratio of renewable energy operating profit by the comapny's
total operating profit, then multiplied this ratio by the total market capitalization. This is a rough estimate and will be
refined in the future. Categories of renewable energy included in this list include biofuels, biomass, geothermal, hydro,
solar, wave, and wind energy. Sources include: Bloomberg, MarketWatch.com, CLSA Asia-Pacific Markets,
InvestGreen.ca, Investext, Reuters, and company data. 11 Acciona established a joint venture while the others are wholly owned subsidiaries. 12 Goldwind had 90 percent of production by Chinese manufacturers in 2005, with Zhejiang Windey and Dongfang
27
27
Steam Turbine Works each about 5 percent. 13 See EurObserv”ER 2005c. 14 A one-megawatt trough plant in the U.S. state of Arizona was completed in 2005, and there have been other
demonstrations and R&D activities in recent years, including solar dish systems. 15 Sugar cane production was to increase from 420 million tons in 2005 to 570 million tons by 2009. 16 Details for Spain from “Plan de Energías Renovables en España 2005–2010", Ministerio de Industria, Turismo y
Comercio, and IDAE. The plan includes capacity addition targets for the period 2005–10, for small and medium hydro
(900 MW added), biomass (1700 MW added), wind (12,000 MW added), solar PV (400 MW added), and solar thermal
power (500 MW added). The target would mean 20,000 MW of wind power by 2010. The plan also includes an increase in solar hot water from 0.7 million m2 in 2004 to 4.2 million m2 in 2010, and an increase in biofuels from 0.23
million tons of oil equivalent (mtoe) in 2004 to 2.0 mtoe in 2010. 17 Thailand expects 11,600 GWh/year from 2,200 MW by 2011, up from 860 MW in 2005. 18 See World Bank 2006 and the REN21 Web site, www.ren21.net, for reports of progress under the Bonn 2004
International Action Program by Pakistan and others. 19 Both policies might be considered RPS policies, except that the targets are not legally binding on utilities, so strictly
speaking these are policy targets rather than RPS policies. See p. 19 and Note 25 of the Renewables 2005: Global Status Report for breakdown of U.S. and Canadian states/provinces with policy targets and RPS policies. 20 Italy’s feed-in tariff for solar PV is 44.5–49.0 eurocents/kWh for the first 20 years for system sizes between 1 kW and
1 MW, with an initial cap set at 100 MW total. See PV Policy Group newsletter, October 2005, www.pvpolicy.org;
also see S. Castello and S. Guastella, “Italy photovoltaic technology status and prospects,”
www.iea-pvps.org/ar05/ita.htm. 21 Ontario's Standard Offer program will provide Can$0.11/kWh for wind, biomass and small hydro, and
Can$0.42/kWh for solar PV. The program provides power contracts lasting 20 years, with an inflation adjustment.
There is no limit to the number of projects that may apply for a contract, but the size of each project is capped at
10MW. 22 In the United States, four states adopted what some have called feed-in tariffs in 2005: Minnesota (for wind), New
Mexico (for solar PV), Washington (for solar, wind, anaerobic digestion), and Wisconsin (for PV and biogas power).
These policies are considered “limited” because some only apply to specific utilities or types of customers, or have
small program limits on total payments available or capacity installed. Most are designed to supplement or provide a
modest assist to existing RPS policies, and might better be called “production incentives.” However, the definitional
difference between production incentives and feed-in tariff premiums is not precise. New Mexico sets a cap of 1.2 MW
added, and provides a premium of 12 cents/kWh to net metering customers without battery backup, through the use of
purchased renewable energy certificates based on customer generation. Minnesota provides a production incentive of 1.0–1.5 cents/kWh. A Wisconsin utility has offered an experimental tariff of 22.5 cents/kWh for 1.5–100 kW solar PV
systems, with a total program limit of 0.5 MW. There are several other local feed-in tariffs being offered in the U.S. by
individual utilities, some continuing implementation of the PURPA feed-in law of 1978. The Renewables 2005: Global Status Report classified Washington state as having a feed-in tariff in 2005, and that classification remains in this report.
Washington provides a production incentive of 15 cents/kWh capped at $2000/year, with higher tariffs for equipment
manufactured in-state, with a limit on total incentive payments of 0.25 percent of an individual utility’s power sales.
New Mexico, Minnesota, Wisconsin, and others are not included as feed-in policies either because they are not
state-level policies, because program limits are small, or because incentive levels are small relative to renewable power
costs. 23 The U.S. federal tax credit applies to both solar PV and solar hot water, and is capped at $2000 per home for
residential installations.
28
28
24 In California during 2006, solar PV installations less than 30 kW continued to qualify for subsidies, currently
$2.80/watt, under the California Energy Commission's Emerging Renewables Program. There were also continuing
subsidies under the CPUC SGIP program. California will create 3,000 MW of solar electricity in the state by the end of
2017 (RenewableEnergyAccess.com, 01 May 2006). Beginning in 2007, the California Energy Commission will
manage a program of about $400 million, complementing the program approved by the California Public Utilities
Commission (CPUC). The Energy Commission will work with homebuilders and the building industry to accelerate the
growth of PV in new home subdivisions, whereas the CPUC will focus on solar installations on existing residential and
commercial buildings. The CPUC and the Energy Commission plan to accelerate California's renewable energy goal of
20 percent procured renewable power by 2010. 25 Australia’s program provides caps at Aus$4000 per residential system and Aus$8000 per community system. 26 Yingling Liu, “Shanghai Embarks on 100,000 Solar Roofs Initiative,” China Watch (Worldwatch Institute), 10
November 2005. 27 The Spanish PV requirement applies to buildings exceeding 3,000–10,000 m2 of surface area, depending on building
type (or 100+ beds for hotels and hospitals). The minimum PV required is 6.25 kW and is based on building type,
surface area, and climate zone. Installations may range up to 50 kW or more. See Photon International (May 2006) for
the PV requirements in Spain’s new building code. The PV requirement applies to buildings above the following limits:
superstores (5000m2); malls and leisure centers (3000m2); warehouses (10,000 m2); office buildings (4000 m2); hotels
(100 rooms); hospitals (100 rooms); convention centers (10,000 m2). Source: “Codigo Técnico de Edificación,” Real
Decreto 314/2006 + Documento Básico HE. 28 These developing country policies are documented in country submissions showing progress with the Bonn
“Renewables 2004” International Action Programme; see REN21 Secretariat 2006a. 29 Agreed power prices in the third round were RMB 0.46–0.49/kWh (5.8–6.1 cents/kWh) for three of the projects.
Chinese concession prices apply to the first 30,000 full-load hours. The bid evaluation criteria were modified in 2006 to
assign less weight to price and more weight to other factors. 30 See Lewis and Wiser 2006 for the Ontario case. 31 Utility green pricing and renewables certificates remained active markets, although detailed data were not available
for this report. Green Power: In the United States, as of the end of 2004, more than 2,200 MW of new renewables
capacity was being used to supply green power customers, with another 455 MW either under construction or formally
announced. This includes about 700 MW to supply utility green pricing programs (with another 230 MW announced by
utilities), and about 1,530 MW to serve customers purchasing green power in competitive markets or as RECs (with 225
MW of additional capacity planned). Source: Bird and Sweezy 2005. In Japan, purchases of green power certificates
remained popular, with 50 GWh of certificates sold in 2005. 32 The revised Barcelona ordinance also includes improved maintenance requirements and requirements on architectural integration. The ordinance also set explicit fines for violations. By the end of 2005, 427 buildings were covered by the
Barcelona solar ordinance, representing 31,000 m2 of SHW capacity. 33 Spain Solar Hot Water Ordinances: Source: “Codigo Técnico de Edificación,” Real Decreto 314/2006 + Documento
Básico HE. The solar thermal part applies to all new buildings and to those undergoing a renovation. It applies to any
kind of buildings, independent of their use. Some exceptions are defined in the law; mainly in the case of buildings that
either satisfy their (DHW demand by other renewables or by cogeneration or for shaded buildings. The variation of the
solar fraction from 30–70 percent depends on different parameters, mainly the assumed volume of DHW demand and
the geographical position of the building. If back-up energy for heating is electricity, solar contribution must meet
50–70 percent of hot water energy needs, depending on climatic zone and level of consumption. (While most of its
provisions will apply only one year after publication, those concerning energy efficiency and solar energy are expected
to apply within six months, i.e. probably from October 2006. Because the obligation refers to the authorisation of the
29
29
new buildings, it will then take around one further year until the impact will be felt on the solar thermal market.) The
municipal solar obligations, approved in the last few years in dozens of municipalities, including Barcelona and Madrid,
will remain in force as long as they are stronger than the national obligation included in the CTE. (Partial source:
ESTIF, “Spain approves national solar thermal obligation,” press release (21 March 2006)). 34 Maine’s subsidy is capped at $1250/system, and also has a cap on total program subsidies. 35 Offsetting the new mandates, Germany later in 2006 was to replace its past policy of a 100-percent VAT exemption
for biodiesel with reduced taxes—a €0.10/liter tax on biodiesel used in its pure form and a €0.15/liter tax on biodiesel
mixed in refineries. 36 Wisconsin requires that all state agencies reduce gasoline and diesel use in the state's vehicle fleet by 2015 (25 percent reduction of diesel and 50 percent reduction of gasoline), partly through the use of E10 and E85. 37 Thailand’s biodiesel target is equivalent to 0.9 billion liters/year. Thailand also has plans for 1.8 million ha of palm
oil plantations by 2013. 38 The Philippines already uses B1 blending for government vehicles. 39 Countries: Brazil, Colombia, Germany, France, Malaysia, Philippines, Thailand, United States (federal renewable
fuel standard), Dominican Republic. States/Provinces: India (nine states plus four federal territories), China (nine
provinces, cities only in four), Canada (Saskatchewan and Ontario), United States (Hawaii, Minnesota, Montana,
Washington, Wisconsin). 40 Information on New York City and the Mayor’s Climate Protection Agreement comes from Rickerson and Hughes
2006. Tokyo’s policy was announced in the press on 3 April 2006, and delivered orally and via handout at the Second
International Solar Cities Congress, Oxford, United Kingdom, 3–6 April 2006, by Ms. Yuko Nishida of the Tokyo
Metropolitan Government Bureau of Environment. 41 Grid extension or diesel power for rural households was proving cheaper in early phases of the Brazil program, and
some believed higher-cost renewables would be addressed last in the program. 42 However, there is uncertainty about the actual number of working systems based on these installations, as program
and technical monitoring has been weak and maintenance infrastructure is lacking. 43 Sri Lanka numbers available at World Bank/GEF ESD Project Web site,
www.energyservices.lk/statistics/esd_rered.htm. 44 List of interviews: The special supplement on private investment and finance trends is based on literature cited and
the following set of interviews: Katherine Richter Brass and Martin Berkenkamp, GE Energy, by Jasmine Hyman,
Cologne (11 May 2006); Lucien Bronicki Ormat, by Akif Chaudhry, by phone (9 May 2006); Fabrizio Donini-Ferretti,
Dexia, by Akif Chaudhry, by phone (10 May 2006); Sven Hansen, Good Energies, by Akif Chaudhry, by e-mail (9 May
2006); Hans Dieter Hermes, Lahmeyer International, by Jasmine Hyman, Cologne (11 May 2006); James Hunt, Mott
McDonald, by Jasmine Hyman, Cologne (12 May 2006); Celine Lauverjat, Caisse de Depots et Consignations, by Akif Chaudhry, by phone (18 May 2006); Ursula Picewicz, European Investments and Partners, by Jasmine Hyman, Cologne
(11 May 2006); Michaela Pulkert, HVB, by Akif Chaudhry, by phone (11 May 2006); Petro Sporer, G.A.S.
Energietechnologie, by Jasmine Hyman, Cologne (11 May 2006); R. Thirumagen Sri, Asia Carbon Exchange
International B.V, by Jasmine Hyman, Cologne (11 May 2006). 45 Brass and Berkenkamp, op. cit. note 44. 46 See list of interviews, op. cit. note 44. 47 Ernst & Young L.L.P., “Renewable Energy Country Attractiveness Indices” (Spring 2006). 48 Hermes; Brass and Berkenkamp; Sporer; Picewicz; all op. cit. note 44. 49 Hunt, op. cit note 45. Similar views expressed by Hermes, op. cit. note 44. 50 CleanEdgeNews (2006), “Clean Edge’s Annual Trends Report Finds that Global Clean Energy Revenues Soared to
$40 Billion in 2005”
30
30
51 Donini-Ferretti, F; Pulkert, both op. cit. note 44. 52 CleanEdgeNews, “Clean Edge’s Annual Trends Report Finds that Global Clean Energy Revenues Soared to $40
Billion in 2005,” press release (2006). 53 Euromoney, “Renewables to bolster energy security in Eastern Europe,” 2006, at
www.euromoneyenergy.com/default.asp?Page=4&SID=611714&ISS=21352. 54 R. Pospisil, “Finance: This is where the growth is,” Renewable Energy World, September–October 2005, at
www.reeep.org/media/downloadable_documents/b/m/REFF%20NYC%20story%20-%20REW%20Oct%20'05.pdf. 55 CleanEdgeNews, op. cit. note 52; Knowledge@Wharton, “The End of Oil? Venture Capital Firms Raise the Profile
of Alternative Energy,” 26 April 2006, at http://knowledge.wharton.upenn.edu/article/1454.cfm. 56 Citigroup, “The Environment: Sustainable Development Investment Program,” 28 June 2006, at
www.citigroup.com/citigroup/environment/investment.htm. 57 UBS AG, “First ever biofuels index launched by UBS and Diapason,” UBS News Alert, 7 March 2006, at
www.ubs.com/1/e/about/newsalert?newsId=89663. 58 DowJones VentureOne, “Venture-Backed European Companies Continue IPO Trend, Raising Most Capital Since
2000,” press release (19 January 2006). 59 “2006 Cleantech Venture Capital Report,” cited in Knowledge@Wharton, op. cit. note 55. 60 J. Glover and J. Ryan, “Investing: Wind Farms Becoming Bond-Market Collateral,” International Herald Tribune, 16
May 2006, at www.iht.com/articles/2006/05/15/bloomberg/bxinvest.php. 61 J. Kho, “Cleantech Private Equity Slows,” Red Herring: The Business of Technology, 13 June 2006, at
www.redherring.com/Article.aspx?a=17224&hed=Cleantech+Private+Equity+Slows§or=Industries&subsector=En
ergy. 62 Knowledge@Wharton, op. cit. note 55. 63 M. Liebreich, CEO, New Energy Finance, “AIMing too high?” Environmental Finance, April 2006. 64 Ibid. 65 Knowledge@Wharton, op. cit. note 55. 66 Peter Lynch, www.investor.com, 28 March 2006. 67 “Renewable Energy Report,” Platts, No. 94/95, 12 December 2005. 68 C. Lacoursiere, “Silicon Shortages Drives Solar Mergers & Acquisitions,” RenewableEnergyAccess.com, 23
Februrary 2006, at www.renewableenergyaccess.com/rea/news/story?id=43983.
69 Ibid. 70 M. Liebreich, “New Energy Finance New York Network Lunch” (New York: 2006). 71 See List of interviews, op. cit. note 44. 72 For the next edition, it may be possible to begin to report shares of primary energy production from renewables and shares of electricity production from renewables. The International Energy Agency does this for share of primary
energy, with and without solid biomass, in its “Global Fact Sheet” report (IEA 2006d). This type of analysis was
considered useful but was not done for the original 2005 report or this 2006 update.
31
31
SUPPLEMENTARY REFERENCES The following references are provided in addition to those already listed in the Renewables 2005: Global Status Report. These references primarily concern recent updates, but some are added general references. Bird, L. & B. Swezey. (2005). Estimates of New Renewable Energy Capacity Serving U.S. Green Power Markets
(2004). Golden, CO: National Renewable Energy Laboratory. www.eere.energy.gov/greenpower/resources/tables/new_gp_cap.shtml.
California Energy Commission. (2006). Solar homes Web site, www.newsolarhomes.ca.gov. Cameron, A. & E. de Vries. (2006). Top of the list: a quick look at how the major turbine companies fared in 2005
and what’s in store for 2006. Renewable Energy World 9(1): 28–41. Cleantech. (2006). Venture Capital Report. Commission of European Communities. (2005). The Support of Electricity for Renewable Energy Sources. http://
europa.eu.int/comm/energy/res/biomass_action_plan/doc/2005_12_07_comm_biomass_electricity_en.pdf. de Miguel, R. & European Bioethanol Fuel Association (eBIO). (2006, 9–11 May). Outlook for bioethanol in
Europe: boosting consumption. Presentation at World Biofuels 2006, Seville, Spain. www.ebio.org/downloads/publications/060509_eBIO_WBC_Seville_2006_def.pdf.
Ernst and Young. (2006). Renewable Energy Country Attractiveness Indices. EurObserv’ER. (2005a). 2005 Barometer of Renewable Energies. Paris: Systemes Solaires. EurObserv’ER. (2005b). Biofuels Barometer. No. 167. Paris: Systemes Solaires.
www.energies-renouvelables.org/observ-er/stat_baro/observ/baro167b.pdf. EurObserv’ER. (2005c). Wood Energy Barameter.. No. 169. Paris: Systemes Solaires. EurObserv’ER (2005d). Geothermal Barometer. No. 170. Paris: Systemes Solaires.
www.energies-renouvelables.org/observ-er/stat_baro/observ/baro170.pdf. EurObserv’ER. (2006). Solar PV Barometer. No. 172. Paris: Systemes Solaires. EUROPA/European Commission. (2006). EU Energy Fact Sheet.
http://ec.europa.eu/energy/green-paper-energy/index_en.htm. Farrell, A.E. et al. (2006). Ethanol can contribute to energy and environmental goals. Science 311: 506–08. Feed-in Cooperation Web site (cooperation between Germany and Spain on feed-in laws).
www.feed-in-cooperation.org/index.php?option=com_content&task=view&id=12&Itemid=40. German BMU renewables statistics Web site (in English). www.erneuerbare-energien.de/inhalt/36755/36356/. German Ministry of Environment. (2006). Development of Renewable Energies in Germany in 2005. German Solar Industry Association. (2006). Statistics on solar PV and solar hot water industries and installations
(in German).www.solarwirtschaft.de/typo3/fileadmin/user_upload/faktenblatt_fina_20_6_06.pdf. Global Wind Energy Council (GWEC). (2006). Global Wind Power Report 2005.
www.gwec.net/uploads/media/Global_WindPower_05_Report.pdf. GWEC. (2006, 17 February). Record year for wind energy: Global wind power market increased by 43% in 2005.
Press Release. Brussels. International Energy Agency (IEA). (2005). World Energy Outlook. Paris. IEA. (2006a). Renewables Information 2005. Paris. IEA. (2006b). Electricity Information 2005. Paris. IEA. (2006c). Global Renewable Energy Policies and Measures Database. Paris.
www.iea.org/textbase/pamsdb/grindex.aspx. IEA. (2006d). Renewables in Global Energy Supply: An IEA Fact Sheet. Paris.
32
32
Interstate Renewable Energy Council. (2006). Database of State Incentives for Renewable Energy. New York. www.dsireusa.org.
Lewis, J., & R. Wiser. (2006). Wind Industry Development Incentives through Utility Tenders in Quebec: Lessons for China. San Francisco: Center for Resource Solutions and The Energy Foundation.
Liebreich, M. (2006. April). Aiming too high? Environmental Finance. National Renewable Energy Laboratory. (2006). Development of the Geothermal Heat Pump Market in China.
Golden, CO. www.nrel.gov/docs/fy06osti/39443.pdf. Natural Resources Canada. (2006). The State of Energy Efficiency in Canada. Office of Energy Efficiency Report
2006, Transportation. http://oee.nrcan.gc.ca/Publications/statistics/see06/transportation.cfm?attr=0. Photon International. (2006, May). A fundamental step: PV has become obligatory for certain buildings in Spain.
58–59. Platts Renewable Energy Report. (2005). Issue 94/95. Boulder, CO: Platts. PV News. (2006, May). Cambridge, MA: Prometheus Institute for Sustainable Development. REN21 Secretariat. (2006a). Bonn Renewables 2004 International Action Programme, country submissions of
progress achieved, linked to each action program item at www.ren21.net/iap/iap.asp. REN21 Secretariat. (2006b). Interim Report on the Implementation of the International Action Programme of the
International Conference for Renewable Energies, 1–4 June 2004, Bonn, Germany, dated 1 June 2006. www.ren21.net/pdf/IAP_InterimReport_060601.pdf.
Rickerson, W. & K. Hughes. (2006). Municipal climate change initiatives and the policy framework for greenhouse gas reductions in New York City. Presented at the Second International Solar Cities Congress, Oxford, United Kingdom, 3–6 April 2006. Submitted for publication in Energy Policy.
Solar Buzz. (2006). Marketbuzz 2006. www.solarbuzz.com/Marketbuzz2006-intro.htm. Tong, L. (2006, 18 April). Biodiesel – North American Perspective. Presentation slides.
www.gov.mb.ca/est/energy/agri/pdf/us_perspective041806.pdf. U.S. Energy Information Administration, U.S. Department of Energy. (2006). International Energy Annual.
www.eia.doe.gov/iea. U.S. Renewable Fuels Association. (2006). Ethanol Industry Overview. www.ethanolrfa.org/industry/statistics. Weiss, W., I. Bergmann & G. Faniger. (2006). Solar Heat Worldwide: Markets and Contribution to Energy
Supply 2004. Paris: IEA. World Bank. (2006). Proceedings of the International Grid-Connected Renewable Energy Policy Forum, February
1–3, 2006, Mexico City, Mexico, May 2006. www.gridre.org. World Bank. (2005). World Bank Group Progress on Renewable Energy and Energy Efficiency, Fiscal Year 2005.
Washington, DC. World Bank, Energy and Water Department. (2005, September). Technical and Economic Assessment: Off Grid,
Mini-Grid and Grid Electrification Technologies. Final report. Washington, DC. World Health Organization. (2006). Fuel for Life: Household Energy and Health. Geneva. World Wind Energy Association (WWEA). (2006, 7 March). Worldwide wind energy boom in 2005: 58,982 MW
capacity installed. Press Release. WWEA. (2005). Wind Energy International 2005/2006. Worldwatch Institute. (2006). Biofuels for Transportation: Global Potential and Implications for Sustainable
Agriculture and Energy in the 21st Century. Report prepared for BMELV, in cooperation with GTZ and FNR. Washington, DC.
Worldwatch Institute. (2006). Vital Signs 2006–2007. New York: W.W. Norton and Company.