Renewable Energy/Mains Power Integration Controller and ...
97
Renewable Energy/Mains Power Integration Controller and Switching Module Yi-Han (Jennifer) Wen A thesis submitted in partial fulfilment of the requirements for the degree of Master of Engineering in Electrical and Computer Engineering at the University of Canterbury, Christchurch, New Zealand. September 2011
Transcript of Renewable Energy/Mains Power Integration Controller and ...
Renewable Energy/Mains Power
Integration Controller and Switching
Module
Yi-Han (Jennifer) Wen
A thesis submitted in partial fulfilment
of the requirements for the degree of
Master of Engineering
in
Electrical and Computer Engineering
at the
University of Canterbury,
Christchurch, New Zealand.
September 2011


Abstract
This Masters research proposes a new system which deals with the management of renew-
able energy sources in a domestic/commercial small scale environment. The aim of the
project is to develop an intelligent system which will monitor current in individual circuit
loads in a domestic/commercial environment and establish whether the load can be pow-
ered from mains supply or be switched to an alternative energy supply in a dynamic way.
The alternative energy can be solar energy from photovoltaic panels, wind generators or
hydro generation. The switching between supplies is decided by monitoring load currents
using a microcontroller and the switching action is taken only at specific allowed instants.
The CAN (Controller Area Network)communication system is a two-wire differential serial
bus system, developed by Bosch for automotive applications in the early 1980s. Its relia-
bility and robustness in communication between nodes within the control system are the
reasons for its popularity. The CAN system is implemented in the Eco Energy Controller.
The prototype of the Eco Energy Controller is operational and has been tested with 6Ω
resistive load, 24mH inductive load, and three 25W incandescent light bulbs. Experimental
measurements and waveforms indicate that the prototype is successful in switching between
two supplies to each of the loads without causing high current peaks during turn on.


Acknowledgments
It is a pleasure to thank those who made this thesis possible. I would like to start off by
expressing thanks to Richard Rowe and Alastair King for their idea of the project, because
without them, I would not have a topic to work on.
Secondly, I would like to show my deepest gratitude to my supervisor, Dr. Alan Wood for
his guidance, patience and assistance throughout the thesis. Thirdly, I am grateful to tech-
nical staff members: Mr. Philipp Hof for his assistance with the software implementation,
Mr. Michael Cusdin and Mr. Nick Smith for their technical assistance.
I would also like to express my thanks to friends and family, especially to my uncle, for his
support, guidance and encouragement over the years of study. Lastly, I offer my blessings
to all of those who supported me in any respect during the completion of the project.


List of Acronyms
ADC Analogue-to-Digital Converter
B2G Battery to Grid
CAN Controller Area Network
CMRR Printed Circuit Board
CRC Cyclic Redundancy Check
CSMA/CD Carrier Sense Multiple Access with Collision Detection
DIP Dual In-line Package
EEC Eco Energy Controller
EMI Electromagnetic Interference
HLP Higher Layer Protocols
IC Integrated Circuit
IR Infra Red
ISO International Standards Organization
LCD Liquid Crystal Display
LED Light Emitting Diode
MCB Miniature Circuit Breakers
OSI Open Systems Interconnection
PCB Printed Circuit Board
PVP hotovoltaic
RCD Residual Current Devices
RTR Remote Transmission Request

viii LIST OF ACRONYMS
SPI Serial Peripheral Interface
SPST Single Pole Single Throw
USART Universal Asynchronous Receiver/Transmitter
Contents
ABSTRACT iii
ACKNOWLEDGMENTS v
LIST OF ACRONYMS vii
CHAPTER 1 INTRODUCTION 1
1.1 Background 1
1.2 Energy Sources In New Zealand 2
1.3 Small-Scale Renewable Energy Systems 3
1.4 Energy Sources In Other Countries 4
1.5 The Benefits of the Eco Energy Controller 4
1.6 Thesis Outline 5
1.7 Summary 6
CHAPTER 2 BACKGROUND TO THE RENEWABLE SYSTEMS
AND DISTRIBUTION BOARDS 7
2.1 Stand Alone Renewable System 7
2.2 Grid Tied Renewable System 9
2.2.1 No Battery 9
2.2.2 With Battery Backup 9
2.3 Eco Energy Controller System 11
2.4 Domestic Switch Board 12
2.4.1 Residential Current Device 14
2.4.2 Miniature Circuit Breaker 14
2.5 Eco Energy Controller Connection to a Distribution Board 15
2.6 Summary 15
CHAPTER 3 CONTROLLER AREA NETWORK 17
3.1 History of CAN 17
3.2 CAN Overview 18
3.2.1 Higher Layer Protocols 19
3.2.2 Data Link Layer 19
3.2.3 Physical Layer 20
3.3 CAN Protocol 20
x CONTENTS
3.4 Message Based Communication 21
3.5 Summary 22
CHAPTER 4 ECO ENERGY CONTROLLER SYSTEM DESIGN 25
4.1 CAN Implementation Method 26
4.2 Eco Energy Controller System Structure 26
4.3 Eco Main Controller 28
4.3.1 Functionality of Main Controller 29
4.4 Eco Switch Module 29
4.4.1 Functionality of Eco Switch 30
4.4.2 Specification of Eco Switch 30
4.4.3 Type of Loads 31
4.4.3.1 Inductive Load 32
4.4.3.2 Power Electronic Load 34
4.4.4 Components 36
4.4.4.1 Power Triacs 36
4.4.4.2 Triac Driver 36
4.4.4.3 Electromechanical Relay 38
4.4.5 Switching Priority 39
4.5 Summary 40
CHAPTER 5 HARDWARE CONSTRUCTION OF THE ECO
SYSTEM 41
5.1 Grounding 41
5.2 Eco Main Controller 43
5.3 Eco Switch Module 43
5.3.1 Voltage Reading 43
5.3.2 Current Reading 45
5.3.3 DIP Switch 46
5.3.4 Temperature Sensor 47
5.3.5 Triac and Relay 47
5.3.6 Other Details on the Board 50
5.4 Summary 50
CHAPTER 6 SOFTWARE STRUCTURE OF THE ECO ENERGY
CONTROLLER 53
6.1 Main Controller Software Methodology 54
6.2 Eco Switch Software Methodology 58
6.2.1 Switching Algorithm 61
6.3 Summary 66
CHAPTER 7 PROTOTYPE PERFORMANCE 67
7.1 CAN Communication System Tests 67
7.2 Switching Incandescent Light Bulbs 70
7.3 Switching Resistive Load 71
7.4 Switching an Inductive Load 72
7.5 CAN Communication Test 73

CONTENTS xi
7.6 Summary 78
CHAPTER 8 FUTURE DEVELOPMENT AND CONCLUSION 79
8.1 Future Development 79
8.2 Conclusion 80
APPENDIX A CALCULATION OF CMRR 81
REFERENCES 85


Chapter 1Introduction
1.1 BACKGROUND
Substantial greenhouse gas emissions are caused by fossil-fueled electricity generation and
with the world energy demand expected to triple by the end of the 21st century, emissions
and hence concentrations are expected to rise accordingly. In order to achieve the target
of stabilizing emissions relative to 1990 levels set by the Kyoto agreement [1], the energy
sector needs to reduce its reliance on fossil fuels and increase its renewable energy com-
ponent. The renewable options include solar panels, wind turbines, and biomass based
energy sources. These renewable energy sources, however, can only supplement the usu-
ally more substantial and reliable national grids, and not replace them, since the energy
demand is usually greater than the renewable supply. But, their contribution to the global
energy market, both ecologically and financially, should not be underestimated.
Private, community, and generally smaller energy users can opt for solar and wind solutions
to reduce their dependency on the national grid supply. This can be for a number of
reasons. The location may lend itself to either solar or wind turbine systems, or the user
may be determined to reduce the reliance on fossil fuel generation. Whatever the reason
for the choice, a system that converts the renewable energy to usable power is required.
The user may choose to have a completely stand-alone system, needing significant and
expensive energy storage, or choose to use a grid-connected meter, utilising the energy
storage (by avoided generation) capability of the grid. The usefulness of using the grid in
this way is limited by the buy/sell price for local load generation. Another option is to

2 CHAPTER 1 INTRODUCTION
utilise local generation to substitute for grid power. This does not require a grid connected
converter with high compliance requirements.
The Eco Energy Controller (EEC), which will automatically switch to and from the na-
tional grid supply to a small-scale renewable system, is the proposed solution. The par-
ticular advantages of this system in New Zealand and to a greater degree in other parts of
the world, is described in this report.
1.2 ENERGY SOURCES IN NEW ZEALAND
New Zealand, with nearly 73% of electricity generation from renewable energy [2] sources
makes it one of the most sustainable countries in the world . The power from the hydro-
electric stations is fed into New Zealand’s national electricity transmission grid, operated
and maintained by Transpower New Zealand. This is then distributed to local lines com-
panies such as Orion and Unison, and then fed to provincial towns and cities. Most of the
population of New Zealand is connected to the national grid.
The enterprise level renewable sources are hydropower, geothermal and wind energy. New
Zealand also has an excellent solar resource. Although not as good as some parts of Spain
and California, its radiation levels are significantly higher than those in countries like
Germany and Japan [3].
The New Zealand electricity generation system is presently dominated by 60% hydro
generation, followed by a small percentage of geothermal, wind and biomass resources [4].
The effect of climate change due to global warming will affect the productivity levels of
the hydroelectric power stations. This is due to the changes in precipitation patterns that
will alter river flows. Hydropower potential is defined by the river flow, and therefore
changes in flow due to climate change will alter the energy potential. More importantly,
as most of the hydropower schemes in New Zealand are designed for a particular river flow
distribution, plant operation may become non-optimal under the altered flow conditions.
As a result, the ability of hydropower stations to harness the resource will be affected.
Also, the total capacity and annual generation from hydro will probably not increase by
more than 10 to 20% and may decline over the long term due to the increased demand on
water resources for agriculture and drinking water. The consequence will be a reduction
in the proportion of hydropower in our generation mix.

1.3 SMALL-SCALE RENEWABLE ENERGY SYSTEMS 3
1.3 SMALL-SCALE RENEWABLE ENERGY SYSTEMS
In recent years, considerable attention has been given to the development of renewable
energy power systems that are intended to be installed in domestic, farming, and similar
size premises. The idea is to encourage small-scale renewable electricity generation such
as wind and solar, to ensure electricity security in the future. This uses the advantage of
climate change due to global warming, since both the wind and solar intensity may increase.
The users might be private sectors such as farms, small businesses and communities,
especially in rural areas, that are setting up solar/wind systems to supply some of their
daily energy demand. Generally they will be low cost installations which would not be
described as commercial ventures.
The expansion of these smaller local sources of wind/solar generated energy sources will
create a market for systems like the EEC. There will be a demand for inexpensive ’smart’
controllers which optimize the use of the more powerful national grid and the ’cleaner’ but
often fluctuating home-grown energy systems.
In New Zealand, two types of renewable configurations are used. Those that are grid-tied,
where the renewable source is electrically connected to the national grid, and stand-alone
renewable systems that have no connection.
A grid-tied system, connected to the utility grid, permits excess renewable power to be
fed back into the grid. To varying degrees this is possible in countries such as the United
States, Germany and to a lesser extent in some parts of New Zealand. In New Zealand, the
’net-billing’ option for paying electricity is offered by some retailers. It is an option where
network companies credit the amount of electricity exported back into the network from
wind turbines, solar panels or diesel generators. But, because there are no worthwhile
incentives from electricity retailers for customers to sell exported electricity, it makes this
type of investment uneconomic, especially for users with small-scale renewable systems.
A grid-tied system with storage system can reduce the costs of meeting fluctuating demand
if the system is charged during periods when electricity is relatively cheap and discharged
when utility power is comparatively expensive(e.g., during period of peak demand). How-
ever, the installation and regulation cost of grid-tied is considerable.
A typical stand-alone system in New Zealand would not have any connection to the na-
tional grid supply and would usually require an expensive and large battery bank for
excess energy storage. These batteries would account for 30% of the total system cost.
It is accepted that stand-alone renewable energy sources without any form of automatic

4 CHAPTER 1 INTRODUCTION
usage control are more expensive types of installations. They are not likely to gain wide
spread acceptance by smaller users.
For the above reasons, it is believed that the smaller private sector in New Zealand, such
as homes, farms and small businesses will not invest in the high cost enterprise systems,
but may invest in the smaller systems, such as the EEC.
1.4 ENERGY SOURCES IN OTHER COUNTRIES
In most countries, electricity generated from renewable energy sources forms a lower per-
centage of total generation than in New Zealand. In the United States, the year 2009
research has shown that only 23.9% of electricity is from renewable sources [5], 20% in
Italy [6], 5% in Japan [7], and 12% in Germany [8]. For this reason, there is a very strong
ecological argument to supplement the national grids with clean sources of energy such as
wind and solar power.
There are incentives in some countries such as the USA and Germany to feed back any
excess from home generated electricity into the national grid, but this assumes that the
private person or small business will generate more power than is needed.
1.5 THE BENEFITS OF THE ECO ENERGY CONTROLLER
The Eco Energy Controller, or EEC, is a new type of monitoring and control system that
fills a market niche by combining the benefits of the national grid and user operated stand-
alone energy systems, to provide the optimal financial benefit. This assumes that these
customers have renewable technology available and are also connected to the national grid.
The advantages include the following:
The cost of grid-connected system and the technology associated with satisfying
the safety regulations is substantial. The EEC does not connect renewable power
sources to the grid, therefore the connection cost is reduced.
EEC eliminates the need for large battery banks which are normally used for
storing excess renewable supply.
The cost of a small scale renewable energy source is more easily amortized. No
energy is wasted, and the system can be built up as it can be afforded.
1.6 THESIS OUTLINE 5
Farms that have a large area for wind turbines, or houses that have large area of roof
can install their own small-scale renewable system. The EEC assists these small users by
maximising use of the renewable energy being produced, so that customers do not over-
invest in the project. The proposed system is ideally used with a small-scale renewable
system that has been set up, but not designed to satisfy all the electricity demands. If
no one is home to consume the electricity, then the renewable energy generated can be
used for water heating, or charging of a small battery. It is unlikely that there will be any
surplus electricity produced.
The main feature of the EEC is that it dynamically controls individual loads inside the
premises to ensure each of them is powered with a type of supply, either renewable or
grid, depending on the amount of renewable source at the time. A main controller is pro-
grammed to monitor the status of each Eco Switch that is connected to different loads. For
example, Eco Switch A might be responsible for loads less than 1A, such as incandescent
light bulbs, and Eco Switch B might monitor a 10A load. The main controller will observe
the status of the battery and decide whether it is enough to supply light bulbs or the 10A
load. If the amount of renewable supply in the battery is only enough to supply the light
bulbs, then a message is sent to Eco Switch A to instruct it to turn off grid supply, and
turn on renewable supply.
The most important measures of the worth of renewable power sources are the roles they
can play in an investment portfolio designed to minimize the cost of energy services, and
the extent to which their adoption would provide environment benefits. The proposed
EEC clearly has a market niche. It targets a large numbers of smaller users.
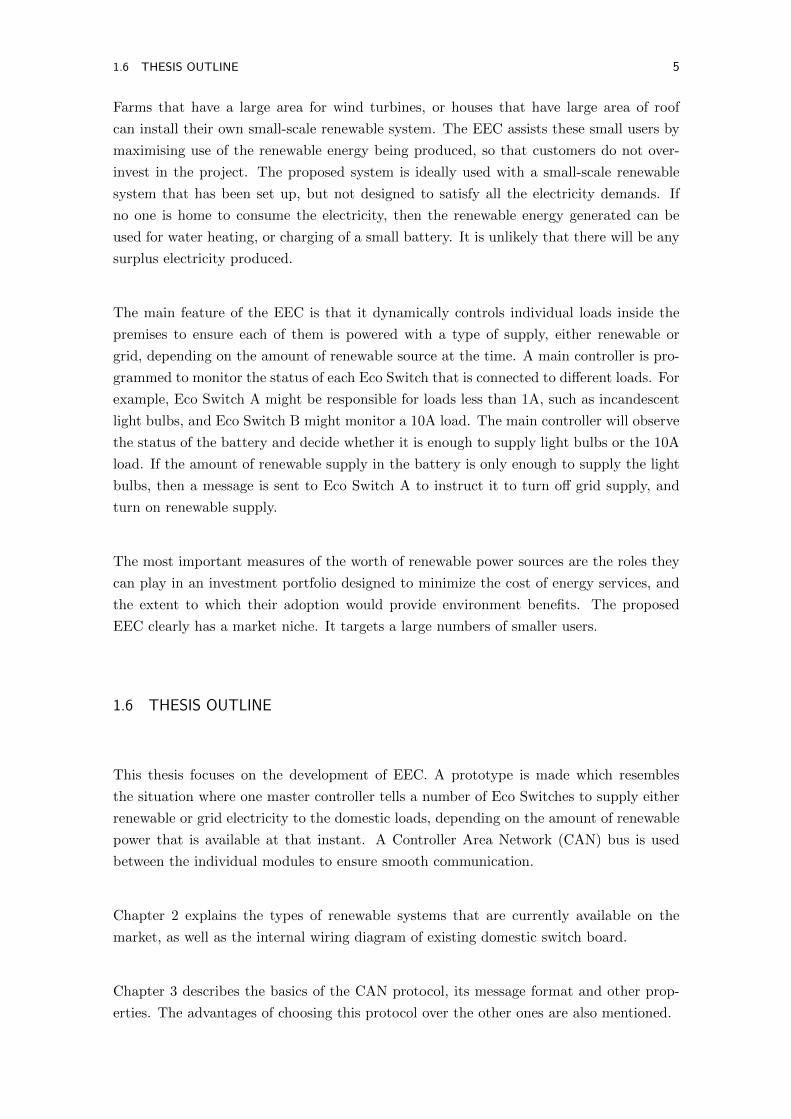
1.6 THESIS OUTLINE
This thesis focuses on the development of EEC. A prototype is made which resembles
the situation where one master controller tells a number of Eco Switches to supply either
renewable or grid electricity to the domestic loads, depending on the amount of renewable
power that is available at that instant. A Controller Area Network (CAN) bus is used
between the individual modules to ensure smooth communication.
Chapter 2 explains the types of renewable systems that are currently available on the
market, as well as the internal wiring diagram of existing domestic switch board.
Chapter 3 describes the basics of the CAN protocol, its message format and other prop-
erties. The advantages of choosing this protocol over the other ones are also mentioned.
6 CHAPTER 1 INTRODUCTION
Chapter 4 introduces the prototype design. This includes block diagrams of where each
module is situated on the CAN bus, the design specifications, load descriptions and main
component selections.
Chapter 5 details the hardware construction of both the main controller and the Eco
Switches within the prototype. Chapter 6 details the software construction for the main
controller, functions within the Eco Switches and the CAN protocol.
Chapter 7 presents the prototype results that confirm the correct operation of the EEC.
Waveforms captured are displayed with explanations.
Finally, Chapter 8 discusses the possible future developments for the EEC to further
enhance its functionality, followed by a conclusion that summarizes the overall system and
signifies the success of the prototype.
1.7 SUMMARY
There is an international commitment to reducing the reliance on fossil fuels in the
production of electricity. Governments have signed up to agreements, and individual
users wanting to contribute to a ’greener’ future, have begun to use solar and wind
turbine systems.
Electric power supply companies have introduced incentives whereby commercial
organizations can feed back any surplus produced into the national grid. This encour-
ages them to maximize their investments, with over production being compensated.
Most users are not large commercial enterprises, but homes, farms, and small
businesses. Despite their smaller solar and wind turbine systems, in total they
represent the largest potential source of renewable energy. They would prefer their
investments to be ’adequate’, rather than maximised. They would have little interest
in a grid-tied system, as there is not likely to be any excess.
With the EEC installed within their electrical system, a small user can have ev-
ery scrap of renewable energy automatically directed to a particular purpose. It
will control the use of the renewable energy supply and decide when, and to which
appliances the normal grid supply will be directed.
There are no ’grid-tied’ system costs, no excessive investment, no large battery
packs, but a modest investment that is scalable.

Chapter 2Background to the Renewable Systems
and Distribution Boards
As mentioned in Section 1.3, small private renewable systems have been implemented
in parts of New Zealand to contribute to the challenges of climate change through the
generation of clean electricity. These renewable systems can be categorized into two main
designs: stand-alone and grid-tied. Stand-alone systems store renewable energy using a
battery, whereas the grid-tied system allows the excess energy to be fed back to the utility
grid. This section explains the specific function of these systems, including the advantages
and disadvantages for each of them. It is then followed by a description of the prototype
of EEC.
2.1 STAND ALONE RENEWABLE SYSTEM
Stand-alone systems are normally used in remote areas and underdeveloped parts of the
world where the grid supply is unavailable. A typical block diagram of the system is shown
in Figure 2.1.
A solar renewable system is used as an example. It consists of the following:
Charge Controller regulates battery charging and ensures it does not overcharge
or undercharge.

8 CHAPTER 2 BACKGROUND TO THE RENEWABLE SYSTEMS AND DISTRIBUTION BOARDS
Figure 2.1 Block diagram for a typical stand-alone renewable system (designed by author)
The renewable energy is stored in the Battery Bank.
The DC/AC Inverter converts the DC power produced by the PV array into AC
power which can then be used by household appliances such as a refrigerator or water
heating.
The main component that distinguishes this from the grid-tied system is the storage de-
vice. Ideally, under suitable charging environment, the available power from PV system is
more than the load requires during periods of low energy use. In this case, the available
renewable energy produced during this period is used to charge a battery bank with a
suitable size to store most of the energy. The storage device provides the power difference
when the available power from the PV panel is smaller than the required power at the
load. This situation is frequently seen when the power produced or load fluctuates on an
hourly or daily basis.
For a stand-alone system, it is crucial for the renewable energy to sufficiently cover the
energy requirements of the loads, since there is no grid supply available for backup. There-
fore, the size of the storage system must be carefully designed to ensure there is enough
power to supply the load at all times. The calculation for a suitable size can be easily
done, but the problem is often the size of the battery banks that is required. For example,
for a solar renewable system, in order to store energy produced in summer to use during
winter will require a large battery bank that would take up a large space on the premises.
Also, the cost associated with installing a storage device is normally between the ranges
of 20% to 34% of the total system cost [9]. Therefore this type of system not only takes
up a large space, but also, it may not be the most cost-effective renewable system.

2.2 GRID TIED RENEWABLE SYSTEM 9
2.2 GRID TIED RENEWABLE SYSTEM
There are two kinds of grid-tied renewable system: with battery, and with no battery.
2.2.1 No Battery
As the title implies, grid-tied systems do not use storage batteries and only require a direct
connection to the utility grid. A block diagram is shown in Figure 2.2. It consists of the
following:
An DC/AC inverter that automatically synchronizes with the AC supply.
The renewable energy and the grid supply, both AC sources, are then fed into the
local Distribution Panel.
The power is then supplied to the Household Appliances.
This configuration allows the excess power in the renewable system to feed back to the
power grid. An import/export meter is normally used to track the amount of electricity
imported from the grid or exported from the inverter. The drawback for this system is
that it is dependent on the grid. If the grid fails, the whole house will lose power, despite
the investment in a solar or wind installation. This type of grid-tied system is, however,
less expensive than the stand-alone system since the cost of battery is eliminated.
2.2.2 With Battery Backup
An extended version of the grid-tied system is to include an energy storage device. It
links to the mains to feed excess renewable supply back to the grid, and when there is
insufficient electricity generated by the renewable system, or that the batteries are not
fully charged, electricity drawn from the grid can make up the shortfall. Therefore, a
Battery to Grid (B2G) system [10], which combines the main features from the previous
two systems, is introduced to the market. Normally, there are three states involved with
these types of systems:
1. No Renewable Energy available: The battery is charged using utility grid and
household loads are supplied by the grid.
10 CHAPTER 2 BACKGROUND TO THE RENEWABLE SYSTEMS AND DISTRIBUTION BOARDS
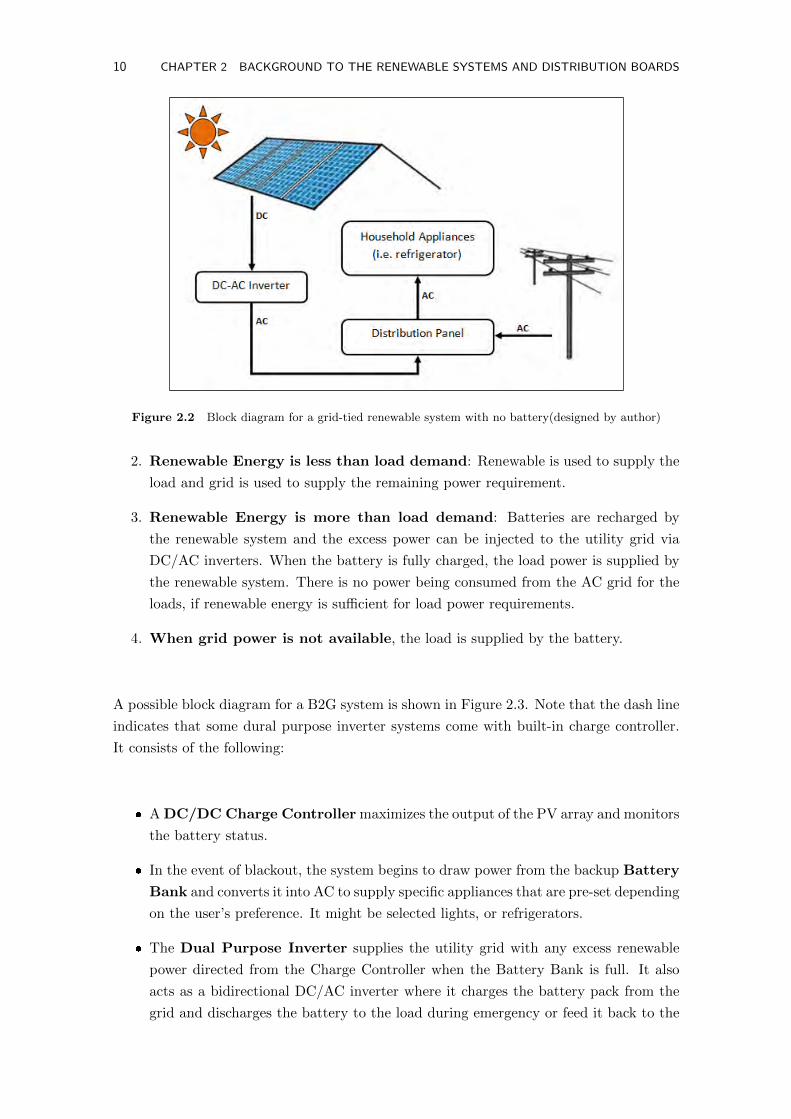
Figure 2.2 Block diagram for a grid-tied renewable system with no battery(designed by author)
2. Renewable Energy is less than load demand: Renewable is used to supply the
load and grid is used to supply the remaining power requirement.
3. Renewable Energy is more than load demand: Batteries are recharged by
the renewable system and the excess power can be injected to the utility grid via
DC/AC inverters. When the battery is fully charged, the load power is supplied by
the renewable system. There is no power being consumed from the AC grid for the
loads, if renewable energy is sufficient for load power requirements.
4. When grid power is not available, the load is supplied by the battery.
A possible block diagram for a B2G system is shown in Figure 2.3. Note that the dash line
indicates that some dural purpose inverter systems come with built-in charge controller.
It consists of the following:
A DC/DC Charge Controller maximizes the output of the PV array and monitors
the battery status.
In the event of blackout, the system begins to draw power from the backup Battery
Bank and converts it into AC to supply specific appliances that are pre-set depending
on the user’s preference. It might be selected lights, or refrigerators.
The Dual Purpose Inverter supplies the utility grid with any excess renewable
power directed from the Charge Controller when the Battery Bank is full. It also
acts as a bidirectional DC/AC inverter where it charges the battery pack from the
grid and discharges the battery to the load during emergency or feed it back to the
2.3 ECO ENERGY CONTROLLER SYSTEM 11
grid. This inverter also contains a second charge controller which ensures that the
Battery Bank is not over-charged by the grid.
The Distribution Panel contains a utility meter which tracks the amount of re-
newable energy going into the grid, and the amount imported from the grid.
The AC supply, either produced from the renewable system or from the utility grid,
is then fed to the Household Appliances.
The advantage of B2G system over the grid-tied system is its available backup power
during emergencies. However, it might not be as cost-effective as a grid-tied system, since
the battery bank and charge controller prices are substantial, plus there is an additional
cost for the routine maintenance associated with batteries.
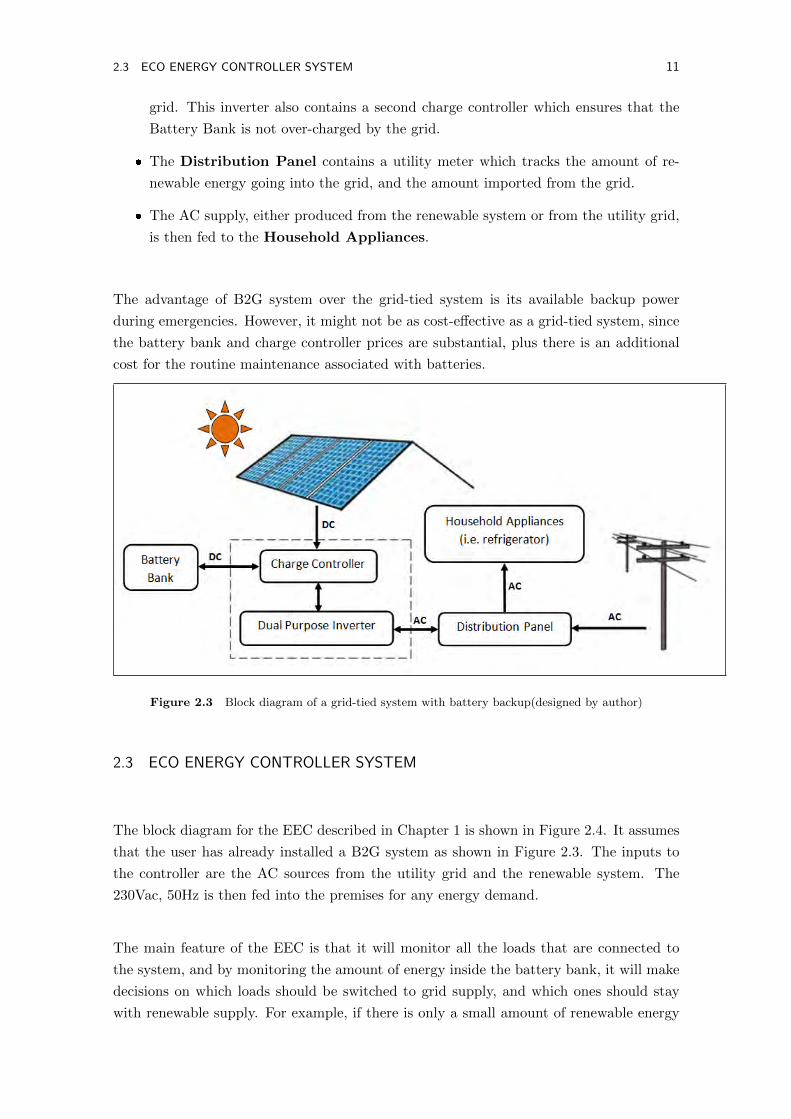
Figure 2.3 Block diagram of a grid-tied system with battery backup(designed by author)
2.3 ECO ENERGY CONTROLLER SYSTEM
The block diagram for the EEC described in Chapter 1 is shown in Figure 2.4. It assumes
that the user has already installed a B2G system as shown in Figure 2.3. The inputs to
the controller are the AC sources from the utility grid and the renewable system. The
230Vac, 50Hz is then fed into the premises for any energy demand.
The main feature of the EEC is that it will monitor all the loads that are connected to
the system, and by monitoring the amount of energy inside the battery bank, it will make
decisions on which loads should be switched to grid supply, and which ones should stay
with renewable supply. For example, if there is only a small amount of renewable energy
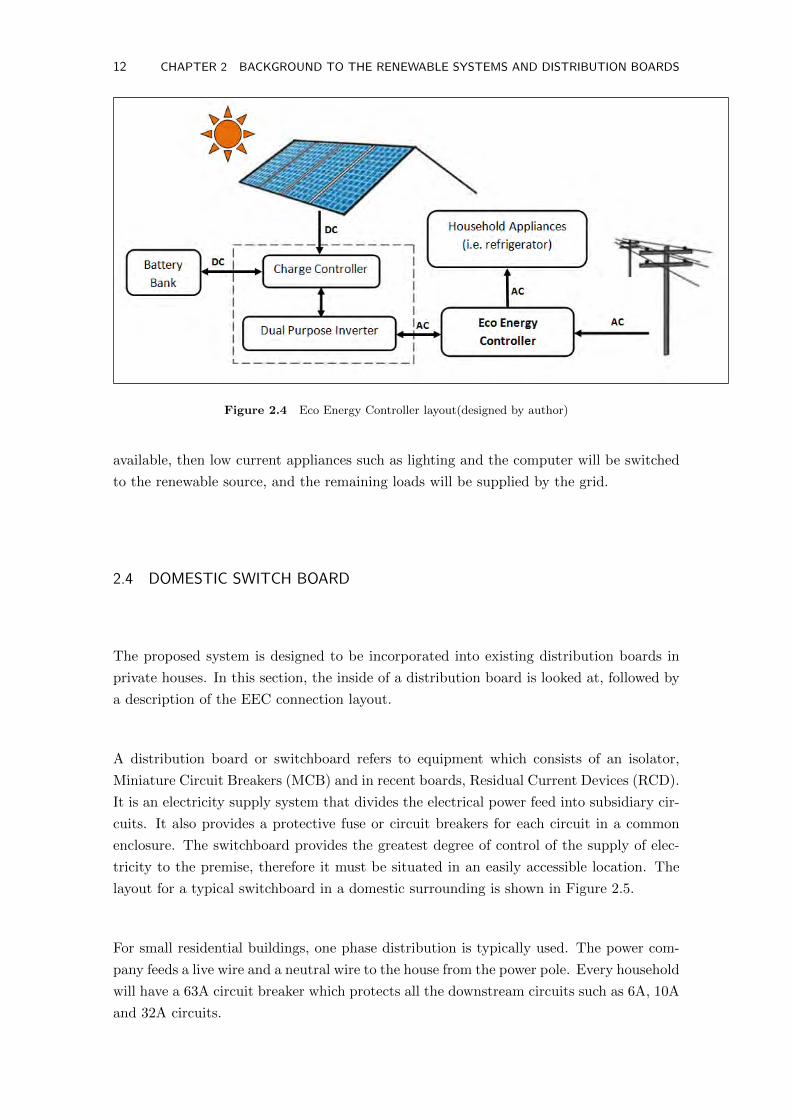
12 CHAPTER 2 BACKGROUND TO THE RENEWABLE SYSTEMS AND DISTRIBUTION BOARDS
Figure 2.4 Eco Energy Controller layout(designed by author)
available, then low current appliances such as lighting and the computer will be switched
to the renewable source, and the remaining loads will be supplied by the grid.
2.4 DOMESTIC SWITCH BOARD
The proposed system is designed to be incorporated into existing distribution boards in
private houses. In this section, the inside of a distribution board is looked at, followed by
a description of the EEC connection layout.
A distribution board or switchboard refers to equipment which consists of an isolator,
Miniature Circuit Breakers (MCB) and in recent boards, Residual Current Devices (RCD).
It is an electricity supply system that divides the electrical power feed into subsidiary cir-
cuits. It also provides a protective fuse or circuit breakers for each circuit in a common
enclosure. The switchboard provides the greatest degree of control of the supply of elec-
tricity to the premise, therefore it must be situated in an easily accessible location. The
layout for a typical switchboard in a domestic surrounding is shown in Figure 2.5.
For small residential buildings, one phase distribution is typically used. The power com-
pany feeds a live wire and a neutral wire to the house from the power pole. Every household
will have a 63A circuit breaker which protects all the downstream circuits such as 6A, 10A
and 32A circuits.
2.4 DOMESTIC SWITCH BOARD 13
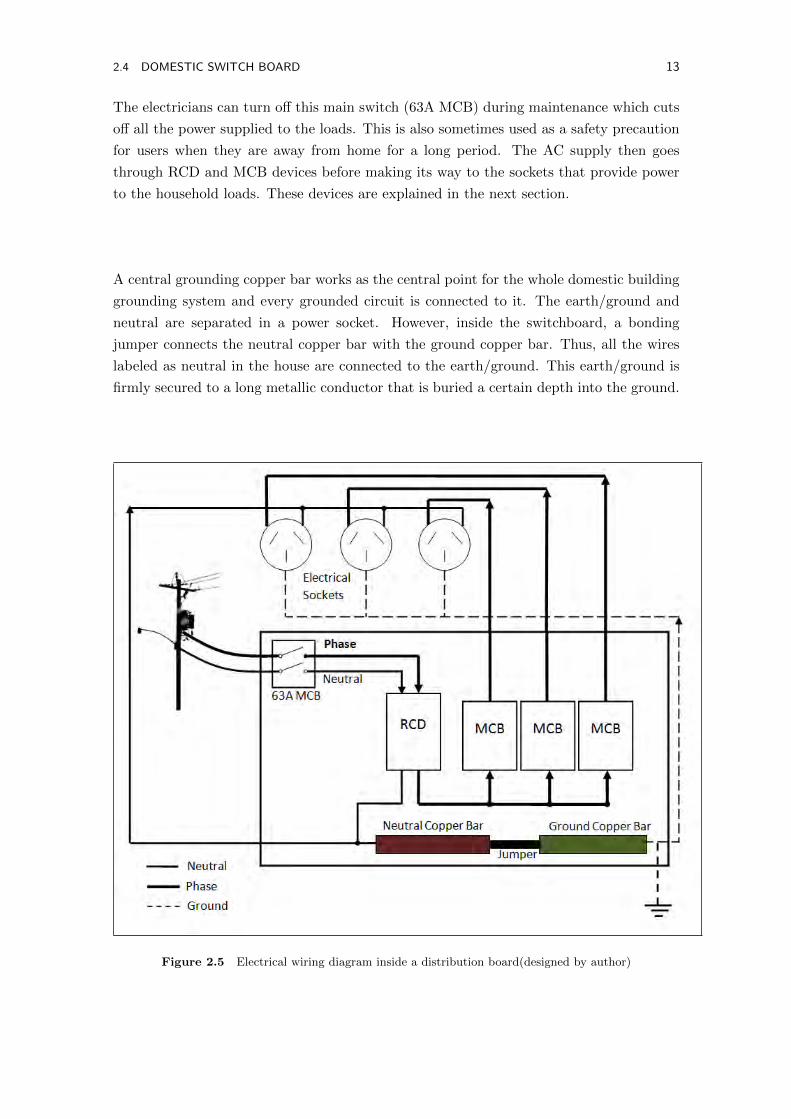
The electricians can turn off this main switch (63A MCB) during maintenance which cuts
off all the power supplied to the loads. This is also sometimes used as a safety precaution
for users when they are away from home for a long period. The AC supply then goes
through RCD and MCB devices before making its way to the sockets that provide power
to the household loads. These devices are explained in the next section.
A central grounding copper bar works as the central point for the whole domestic building
grounding system and every grounded circuit is connected to it. The earth/ground and
neutral are separated in a power socket. However, inside the switchboard, a bonding
jumper connects the neutral copper bar with the ground copper bar. Thus, all the wires
labeled as neutral in the house are connected to the earth/ground. This earth/ground is
firmly secured to a long metallic conductor that is buried a certain depth into the ground.
Figure 2.5 Electrical wiring diagram inside a distribution board(designed by author)

14 CHAPTER 2 BACKGROUND TO THE RENEWABLE SYSTEMS AND DISTRIBUTION BOARDS
2.4.1 Residential Current Device
A RCD is an electrical safety device that disconnects a circuit whenever it detects an
imbalance in the electric current between the phase conductor and the return neutral
conductor. Such an imbalance may be caused by current leakage through the body of a
person who is grounded and accidentally touching the energized part of the circuit. As a
result, that person could receive a fatal electrical shock. RCDs are designed to disconnect
quickly enough to mitigate the harm caused by such shocks. They are, however, not
intended to provide protection against short-circuit conditions.
It is a legal requirement for all new houses to be fitted with RCDs in the switchboard
to provide protection of groups of circuits [11]. This is the best option, as it protects all
the electrical wiring and appliances supplied from that circuit. The new edition of the
Australian/New Zealand Standard for Wiring Rules AS/NZS 3000:2007 was released in
November 2007 and revised by Amendment 1 in July 2009. One of the rules stated that
”not more than three final subcircuits shall be protected by any one RCD and where there
is more than one final subcircuit, a minimum of two RCDs shall be installed. [12]”
2.4.2 Miniature Circuit Breaker
A MCB is a device designed to automatically disconnect the power supply in the event of an
overload or fault. MCBs will not protect people from receiving an electrical shock, however,
this can be used as a manual switch to disconnect a circuit. The power distribution grid
delivers electricity at a consistent voltage, but since resistance of household loads varies,
the current varies. Therefore the many different ratings for household MCB (5A, 6A,
10A and 16A) cater for different loads. These current ratings and labels with the type of
circuit they control are shown in Table 2.1. The number of circuit breakers on the main
switchboards will depend on the number of circuits in the electrical installation.
Circuit Label Current Rating(A)
Lighting ”Light” 6A/10ASocket-Outlets ”GP0” 10A/16A/20ANight Store Heater ”Storage Heater” 16A or higherWater Heating ”W/H” 10A or 16AGarage ”SUB” 16A to 32A
Table 2.1 DIP switch ID and the hexadecimal values programmed in the microcontroller

2.5 ECO ENERGY CONTROLLER CONNECTION TO A DISTRIBUTION BOARD 15
2.5 ECO ENERGY CONTROLLER CONNECTION TO A DISTRIBUTION BOARD
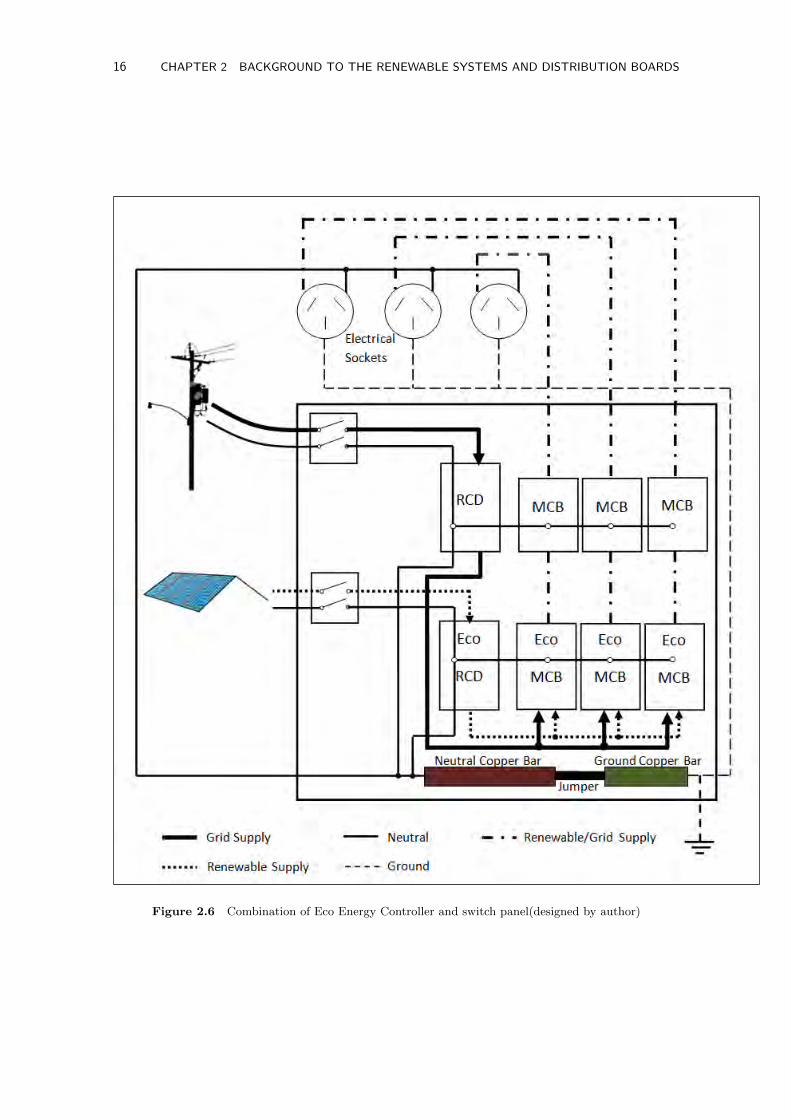
The proposed system can be incorporated to the existing switch panel and the wiring is
shown in Figure 2.6. The renewable energy is sent through a DC/AC inverter and the AC
supply is feed into a separate RCD, labeled Eco RCD. This voltage is then fed into each
Eco MCB along with the existing grid voltage. There will be, however, only one source of
voltage coming out from the Eco Switch and it is the function of the Eco Switch to decide
which voltage it is. This is further explained in Chapter 6. The resulting voltage is sent
through to the existing MCB in the switch panel to supply household loads.
2.6 SUMMARY
The stand-alone system is completely disconnected from the main grid. The re-
newable energy generated by the solar panel is stored in the battery bank and a
DC/AC inverter is used to convert DC power to usable AC power.
The grid-tied system comes in two types: battery, and no battery. These systems
are connected to the grid so that excess renewable energy generated can be sent back
to the grid or if renewable energy is inadequate, grid power can be used to energize
load. The difference between the two types of grid-tied system is the battery which
is used to store energy.
The EEC is not a new type of renewable system, but a controller which monitors
the load connected to the system and determines which load should be powered using
grid and which load should be powered using renewable supply.
The last section of this chapter looks into the function of the components inside
the existing domestic switch board.
16 CHAPTER 2 BACKGROUND TO THE RENEWABLE SYSTEMS AND DISTRIBUTION BOARDS
Figure 2.6 Combination of Eco Energy Controller and switch panel(designed by author)

Chapter 3Controller Area Network
Controller Area Network (CAN) is a well-known communication bus and is widely used in
small-scale distributed systems. The main technical merit of the CAN bus is its robustness
as a flexible real-time communication bus. For this reason, it is implemented in the EEC.
The history and protocols of CAN is explained in detail in this chapter.
3.1 HISTORY OF CAN
CAN is an asynchronous serial bus network that connects devices in a system for control
applications. It was first developed by Robert Bosch GmbH [13]in 1986 for an automobile
communication system with data rates of up to 1 Mbps. It was published in 1991 and
standardized by International Standards Organization (ISO) in 1993. Since then, the
multi-master communication protocol has been used beyond automotive applications as
an embedded communication system for microcontrollers. It was by the mid 1990s that
products based on CAN were proving to be reliable. The applications to date range from as
small as photocopiers and medical equipment, to elevator control systems and automation
systems.
The aim of CAN was to provide a simple, efficient, robust communication system. The
protocol has become readily available, nowadays there are many commercial hardware
implementations of CAN providing numerous low-cost options. CAN has a large market,
a good history and a great deal of technical merit. It is for these reasons that CAN is
applied in the EEC system.

18 CHAPTER 3 CONTROLLER AREA NETWORK
3.2 CAN OVERVIEW
Network applications normally follow a layered approach to system implementation. The
standard that was created by the International Standards Organization (ISO) was used as
a template to follow for this layered approach. It is viewed as an Open Systems Intercon-
nection (OSI) reference model and is shown in Figure 3.1 [15]. The top five layers of the
model are implemented by Higher Layer Protocols (HLPs). The tasks of the HLP can be
summed up as follows:
Initiate startup procedures such as the bit rates and distribute addresses among
nodes.
Determine the structure of the messages.
Provide error handling routines.
Figure 3.1 CAN protocol layers [15]

3.2 CAN OVERVIEW 19
3.2.1 Higher Layer Protocols
The model was made simpler by breaking down each functional layer. The higher layer
protocol is described in this section [14].
1. Application Layer: This is the main interface for the user to interact with the
application. This provides a means to access information on the network.
2. Presentation Layer: This manages the presentation of the information in a mean-
ingful manner. Its primary function converts local host computer data represen-
tations into a standard network format for transmission on the network. On the
receiving side, it changes the network format into the relevant host computer format
so the data can be utilized.
3. Session Layer: This layer manages communications between connected sessions.
This consists of service requests and service responses that occur between applica-
tions located in different network devices.
4. Transport Layer: This layer is responsible for reliable transmission of data between
hosts. This ensures the data transmitted is reliable and timely.
5. Network Layer: This handles the addressing and delivery of data.
3.2.2 Data Link Layer
Each node on the CAN bus is able to send and receive messages, but not simultaneously.
Data messages transmitted from the nodes do not contain addresses of the transmitting
node, instead, is labeled by an unique Identifier (ID). All other nodes on the network
receive the message and each performs an acceptance test on the identifier to determine
if the message is relevant to that particular node. If it is, the content or message will
be processed, otherwise it is ignored. The unique ID also determines the priority of the
message. In situations where two or more nodes attempt to transmit messages on the bus
at the same time, a non-destructive arbitration technique makes sure that messages are
sent in order of priority and that no messages are lost. This technique is described in
Section 3.3. [15]
This extensive error checking mechanism makes the bus robust since messages will not clash
during sending and transmitting.CAN will also operate in extremely harsh environments
with noise interference. Another advantage of the CAN bus is that new nodes that are

20 CHAPTER 3 CONTROLLER AREA NETWORK
acting as receivers can be added to the network without the need to make any changes to
the existing hardware or software. [15]
3.2.3 Physical Layer
The physical CAN communication is a two wire bus with twisted pair. ISO-11898 [16]defines
a two-wire balanced differential signaling scheme at up to 1 Mbps for high bandwidth ap-
plications. ISO-11519 defines a lower speed two-wire balanced differential signaling scheme
at up to 125 kbps for low bandwidth applications. [15]
The main property of the physical layer is providing the two states: ’dominant’ and ’re-
cessive’. They are often referred to as the binary number ’1’(recessive) and ’0’(dominant).
If two nodes transmit bits of opposite value simultaneously, then all nodes should read
’dominant’. In other words, all nodes must transmit a ’1’ in order for the bus state to be
’1’. This feature is highly used for error signaling. [15]
The physical layer has a number of fault-tolerant features which are very important in
providing a reliable service. This is particularly achieved by differential mode signaling,
where two wires are used to carry the signal, usually with opposite voltages being applied to
the two conductors. The actual signal is the voltage difference between them. Differential
signaling is insensitive to external electromagnetic interference (EMI) since interference
will tend to affect each side of a differential signal almost equally. Most noise occurring on
the two conductors will therefore be ignored when the difference between the conductors
is measured. [15]
3.3 CAN PROTOCOL
The CAN communication protocol is a CSMA/CD(Carrier Sense Multiple Access with
Collision Detection)protocol. The CSMA suggests that every node on the network moni-
tors the bus for a period of time when there is no activity before trying to send a message
on the bus. Once this period occurs, every node on the bus has an equal opportunity to
transmit a message, hence Multiple Access. The Collision Detection suggests that if two
nodes start to transmit messages at the same time, the nodes will detect the collision and
appropriate actions are taken. It is called the bitwise arbitration method. [15]
In a case where two nodes are trying to transmit messages, they must monitor the state

3.4 MESSAGE BASED COMMUNICATION 21
of the bus to see if the logic state it is trying to send actually appears on the bus. A
dominant bit state will win arbitration over a recessive bit state, therefore, the lower the
value in the Message Identifier (the field used in the message arbitration process), the
higher the priority of the message. The lower priority message will at some point try
to send a recessive bit, however, the monitored state on the bus is dominant. When
this happens, this node loses arbitration and immediately stops transmitting. The higher
priority message will continue to transmit until it is successful. The node that lost the
arbitration will wait for the next period and will try to transmit again. [15]
3.4 MESSAGE BASED COMMUNICATION
CAN protocol is a message-based protocol, not an address based protocol. This means
that messages are not transmitted from one node to another based on addresses. It is up
to each node in the system to decide whether the message received should be discarded
or processed. A message can be accepted by only one node, or many nodes, depending on
the way the system is designed. [15]
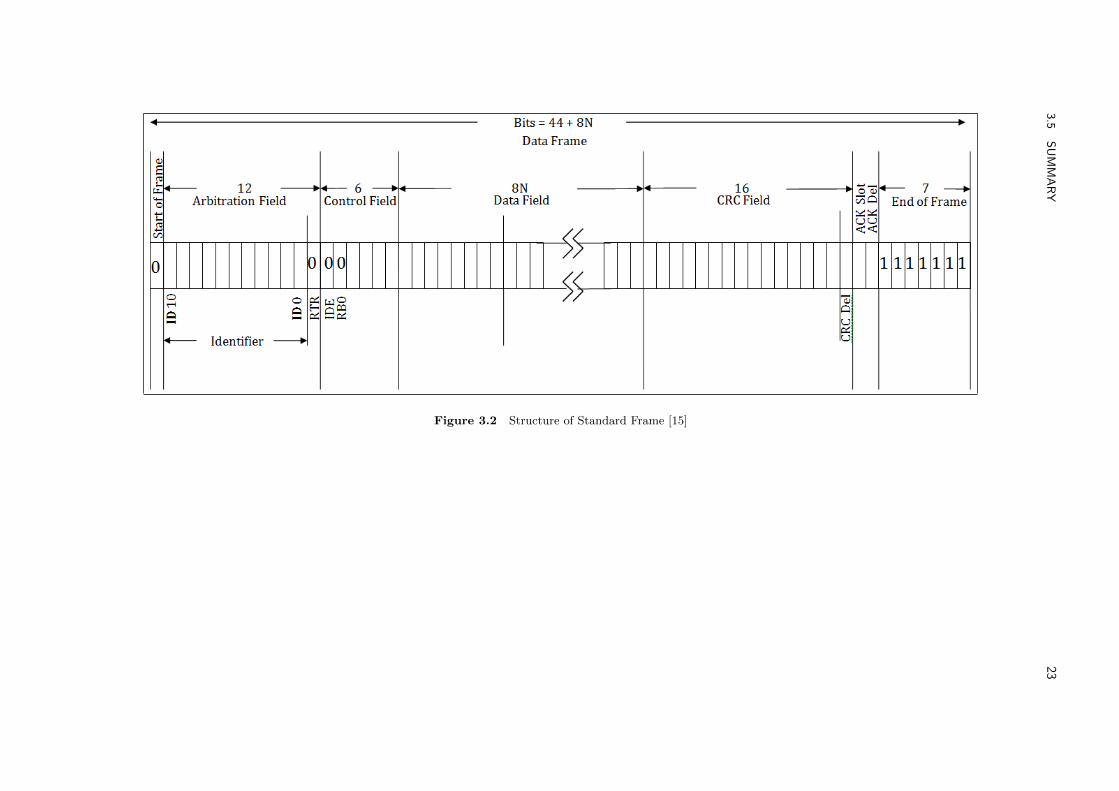
There are two types of frame: one is Standard Frames which is the previous versions of
the CAN specification and the other one is Extended Frames which is the current version.
However, only the Standard Frame is being implemented. Its structure diagram is shown
in Figure 3.2 [15] CAN protocol defines four different types of messages/frames and they
are [15]:
1. Data Frame: This is used when a node transmits information to any or all other
nodes in the system. Data Frame consists of fields that provide additional informa-
tion about the message as defined by the CAN specification. Embedded in the frames
are arbitration fields, control fields, data fields, CRC fields, 2-bit acknowledge field
and an end of frame. The structure of the standard data frame is shown in Figure
3.2.
Start of Frame: This indicates the start of the Data Frame.
Arbitration Fields: This is used to prioritize messages on the bus. The arbi-
tration field consists of 12 bits (11 identifier bits and 1 RTR bits) for Standard
Frames.
Control Fields: The Most Significant Bit in this field (Identifier Extended)
determines if the message is a Standard or Extended Frame. This is followed
by the Reserved Bit Zero (RB0) bit which is defined to be a dominant bit by
the CAN protocol.

22 CHAPTER 3 CONTROLLER AREA NETWORK
Data Fields: This consists of the number of data bytes described in the Control
Field.
Cyclic Redundancy Check (CRC) Fields: This contains 15-bit CRC field
and a CRC delimiter. They are used by receiving nodes to determine if trans-
mission errors have occurred.
Acknowledge (ACK) Field: This field is utilized to indicate if the message
was received correctly. Any node that has correctly received the message, re-
gardless of whether the node processes or discards the data, puts a dominant
bit on the bus in the ACK slot bit time.
End of Frame: This consists of 7 recessive bits.
2. Remote Frame: This is basically a data frame with the Remote Transmit Request
(RTR) bit. A RTR is the ability for a node to request information from other nodes.
3. Error Frame: This is generated by nodes that detect any one of the many protocol
errors defined by CAN.
4. Overload Frame: This is generated by nodes that require more time to process
messages already received.
3.5 SUMMARY
The CAN protocol is the most suitable option for systems that need to transmit and
receive small amounts of information to all the nodes within the network.
It is a message-based protocol, therefore all nodes on the bus will receive every
message, and it is for the individual nodes to decide whether they want to discard
or keep it to be processed.
CAN bus provides fast and robust message transmission, as well as automatically
dropping any faulty nodes off the bus. Benefits such as these are the reasons it is
being implemented in the EEC.
The CAN protocol supports two frame formats: standard and extended. The stan-
dard format was selected for the EEC, since only six nodes are being used.
The next chapter describes the design of the EEC with the CAN protocol.
3.5
SUMMARY
23
Figure 3.2 Structure of Standard Frame [15]


Chapter 4
Eco Energy Controller System Design
After deciding to implement CAN nodes in the EEC, the structure of the communication
system needed to be designed. The controller is designed to fit into a domestic distribution
board which typically has a width of 0.6 meters. Since the individual CAN nodes are to
be placed closely to each other, the length of the cable used could be minimized. It is
estimated that the range of CAN bus cable could be from 1 to 2 meters.
According to Table 4.1 [17], the maximum CAN bus speed is 1Mbps, which can be achieved
with a bus length of up to 40 meters when using twisted wire pair, therefore, the system
is only ideal for smaller distribution boards. The transfer rate would have to be decreased
if longer cables are required.
Bus Length(m) Signalling Rate (Mbps)
40 1100 0.5200 0.25500 0.101000 0.05
Table 4.1 Suggested cable length versus signalling rate [17]

26 CHAPTER 4 ECO ENERGY CONTROLLER SYSTEM DESIGN
4.1 CAN IMPLEMENTATION METHOD
All systems that consist of CAN nodes have a common structure. It includes a host mi-
crocontroller, a CAN controller and a CAN transceiver. The microcontroller is a small
computer on a single integrated circuit containing a processor core, memory and pro-
grammable input/output peripherals.
A CAN controller handles all the transmission and reception of CAN messages via the
CAN bus. It contains acceptance masks and acceptance filters that are used to filter out
unwanted messages. The CAN controller interfaces with microcontrollers via an industry
standard Serial Peripheral Interface (SPI).
A CAN transceiver serves as the interface between a CAN protocol controller and the
physical bus. Typically, each node in a CAN system must have this device to convert the
digital signals generated by a CAN controller to signals suitable for transmission over the
cables.
There can be two kinds of implementations of the three devices mentioned above. One is
stand-alone where a CAN controller is used to interface to the microcontroller. The other
one is integrated, where the microcontroller has built-in CAN controller. In the EEC,
the integrated approach was implemented and the structure is shown in Figure 4.1. The
reason for favoring integrating over stand-alone is that shorter time is required to access
the CAN peripheral compared to stand-alone systems. There is also the advantage of
less space requirements. The disadvantage of integrated CAN system is that the software
developed for an integrated CAN peripheral of one microcontroller may not apply to a
second microcontroller from a different vendor. Therefore, the software developed for the
EEC would only apply to PIC18 ECAN series microcontrollers.
4.2 ECO ENERGY CONTROLLER SYSTEM STRUCTURE
The main features of the EEC are described in Chapter 2. This section explains how the
overall system is put together to provide features that make it unique.
The EEC resembles a master-slave type of communication system where one master in-
structs the other slaves what to do and the opposite is not allowed. The slaves are,
however, required to constantly send information to the master so the master can send
correct orders to the slaves depending on the information received. The control system

4.2 ECO ENERGY CONTROLLER SYSTEM STRUCTURE 27
Figure 4.1 Structure of the CAN node (designed by author)
would normally consist of master nodes and slave nodes acting as transmitters or receivers,
or both, depending on the user’s preference. The system block diagram for three controlled
switches is shown in Figure 4.2. The master is the main controller and the Eco Switches
are the slave nodes. In this chapter, the main controller and Eco Switch of the system are
described.
Figure 4.2 Eco energy controller block diagram(designed by author)
The overall system must provide robustness and accurate control over the communication
between master and slave nodes. In order to achieve this, a 120 ohm resistor has to be
placed at either end of the physical bus to suppress signal reflections along the bus. The
maximum achievable bus line length in a CAN network for a message bit rate of 1Mbps
is 30m [18]. The length of the cable will not exceed 30m in this application.
The detailed structure of the EEC is shown in Figure 4.3. All of the slave nodes have
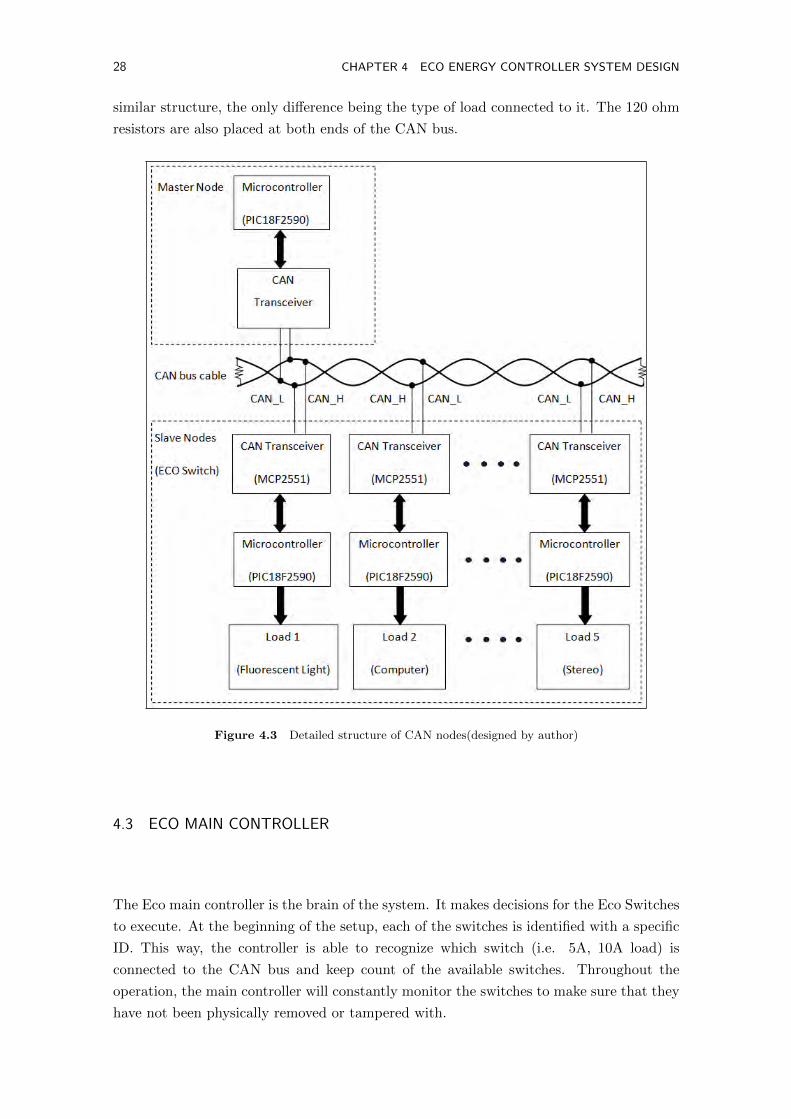
28 CHAPTER 4 ECO ENERGY CONTROLLER SYSTEM DESIGN
similar structure, the only difference being the type of load connected to it. The 120 ohm
resistors are also placed at both ends of the CAN bus.
Figure 4.3 Detailed structure of CAN nodes(designed by author)
4.3 ECO MAIN CONTROLLER
The Eco main controller is the brain of the system. It makes decisions for the Eco Switches
to execute. At the beginning of the setup, each of the switches is identified with a specific
ID. This way, the controller is able to recognize which switch (i.e. 5A, 10A load) is
connected to the CAN bus and keep count of the available switches. Throughout the
operation, the main controller will constantly monitor the switches to make sure that they
have not been physically removed or tampered with.
4.4 ECO SWITCH MODULE 29
4.3.1 Functionality of Main Controller
The controller will obtain information such as the grid voltage, renewable voltage and
the magnitude of the current from the individual Eco Switches. The controller will also
monitor the battery level of an alternative source and determine which Eco Switch should
be switched to the alternative supply. This is the main function of the controller, therefore
this is the priority task.
The other function of the main controller is monitoring the temperature of the individual
Eco Switch. Each of these modules has a temperature sensor which will send a message
to the controller if the temperature exceeds a certain limit. Once the controller receives
this warning, it will identify the switch ID and turns that particular switch off to avoid
overheating.
The following key points sum up the controller’s functions:
Monitoring the state of the Eco Switch, i.e. the temperature.
Determining which Eco Switch should be supplying alternative or grid voltage.
Monitoring the load current, in order to check that the loads are being energized by
one of the supplies and assess which loads can be connected to the renewable supply.
Monitoring the presence of all the existing Eco Switches, to make sure that they
have not been disconnected from the bus.
4.4 ECO SWITCH MODULE
The Eco Switch modules are individual circuits that control the supply to each household
circuit. Each of the modules has a different rating from 5A to 16A. The most important
role of the Eco switch module is to ensure that the electronics associated with switching
is reliable so that the right supply can be provided to the load at the right time. The
following section explains the functionality and specification of the module with circuit
diagrams.
30 CHAPTER 4 ECO ENERGY CONTROLLER SYSTEM DESIGN
4.4.1 Functionality of Eco Switch
The main function of the Eco Switch module is to be able to switch between mains voltage
and an alternative voltage to supply the load depending on the amount of alternative or
renewable energy that is available and the type of load. The other two functions are:
If the temperature inside the enclosure exceeds a limit, the switching module will
notify the controller.
Obtain magnitude of the load voltage and current, so that the main controller will
know the power consumed by each load and if the alternative supply has enough
energy to supply it.
In order to allow the switching to take place properly, both the mains voltage and alter-
native supply voltage waveforms are being monitored. The load voltage and load current
values are also being recorded by the microcontroller.
There are two safety conditions to ensure that grid voltage is removed from the load before
it is being supplied by the alternative voltage. This means that both sources will never
be connected together. The first condition is that load current must be zero before the
other supply is connected. This is achieved by using the microcontroller to monitor the
load current. When it indicates that the values are unchanged, the current is assumed to
be zero. The transition period between turning on the renewable supply is less than 40ms.
This is described in Chapter 7.
The second condition is that the load voltage must be zero before the other supply is
connected. Just like the current, if the load voltage is zero after disconnecting one source,
the other source can be connected. It is also used to indicate whether the load has been
successfully energized or not. The two safety checks might seem similar and that one can
be made redundant. However,if either the hardware or the software fails, the other one
can still do the job and switching actions can proceed.
4.4.2 Specification of Eco Switch
An interconnected power system under normal conditions will experience short duration
voltage sags and momentary interruptions. According to IEEE standard [19],voltage sag
is a reduction in RMS voltage at the power frequency for durations from 0.5 to 30 cycles
4.4 ECO SWITCH MODULE 31
and a momentary interruption is a complete loss of AC power which can be 30 cycles to 3
seconds in duration. These may occur naturally as a result of lightning strikes, salt spray
build up on power line insulators or animals.
All electronic devices have a voltage dip ride-through capability that prevents them from
losing power during the voltage sag period. For most household appliances, the duration
of voltage sag is assumed to be less than 50ms. This suggests that the transition period
between the two supplies should be less than 50ms. This period was later found to be
sufficient for the software to go through all the steps to successfully switch to the other
supply.
4.4.3 Type of Loads
The three main load types found in domestic appliances include resistive, inductive and
power electronic loads.
Resistive loads such as incandescent lights, heaters, toasters, ovens and electric
heating in the stove always draw a constant power from the power supply for a
constant voltage.
Inductive loads require a large rush of power (surge current) to start and then
usually draw a more constant power once running. The most common inductive
appliances are: fluorescent light, pumps, washing machine, vacuum cleaners and
refrigeration.
Power electronic loads (capacitive loads) such as LCD panels (computer screen,
television) require a large surge current to start only when they have not been used
for a while.
Since the relationship between load voltage and current is different for various loads, each
of them is explained in the next section. The resistive load is not taken into consideration
because the current flow synchronizes with the voltage, and peak currents are not affected
by the switch off and switch on instants.
32 CHAPTER 4 ECO ENERGY CONTROLLER SYSTEM DESIGN
4.4.3.1 Inductive Load
When an inductive load is initially connected to a source of AC voltage, there may be a
substantial surge of current at the start. This is referred to as the ’inrush current’. For
example, transformers may draw many times their normal current when first energized.
The cause of the inrush current is described in this section.
The rate of change of instantaneous flux in a transformer core is proportional to the
instantaneous voltage across the winding. Thus, the voltage waveform is the derivative of
the flux waveform as expressed in Equation 4.1 [20], or the flux waveform is the integral
of the voltage waveform as expressed in Equation 4.2.
V = NdØ
dt(4.1)
Ø =1
N
∫V dt+ constant (4.2)
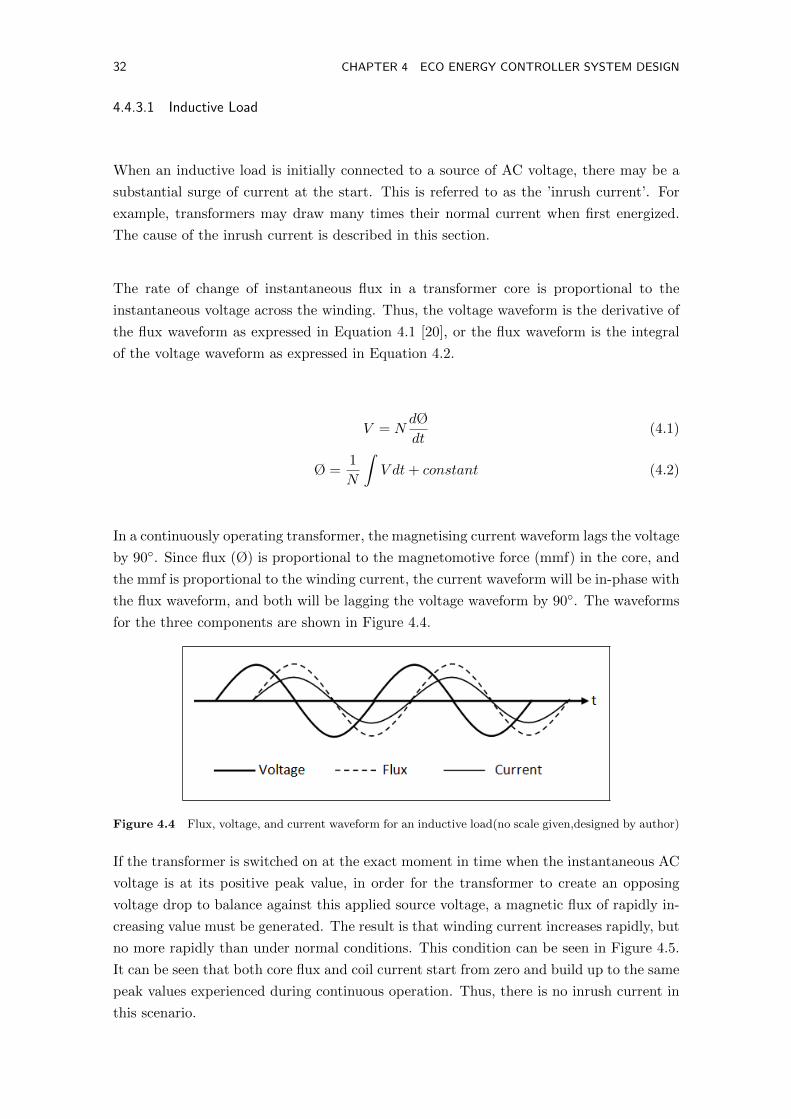
In a continuously operating transformer, the magnetising current waveform lags the voltage
by 90. Since flux (Ø) is proportional to the magnetomotive force (mmf) in the core, and
the mmf is proportional to the winding current, the current waveform will be in-phase with
the flux waveform, and both will be lagging the voltage waveform by 90. The waveforms
for the three components are shown in Figure 4.4.
Figure 4.4 Flux, voltage, and current waveform for an inductive load(no scale given,designed by author)
If the transformer is switched on at the exact moment in time when the instantaneous AC
voltage is at its positive peak value, in order for the transformer to create an opposing
voltage drop to balance against this applied source voltage, a magnetic flux of rapidly in-
creasing value must be generated. The result is that winding current increases rapidly, but
no more rapidly than under normal conditions. This condition can be seen in Figure 4.5.
It can be seen that both core flux and coil current start from zero and build up to the same
peak values experienced during continuous operation. Thus, there is no inrush current in
this scenario.

4.4 ECO SWITCH MODULE 33
Figure 4.5 Instant in time when transformer is connected to AC voltage source(no scale given,designedby author)
However, when the transformer is switched on when the AC voltage source is at zero, both
flux and winding current are at their negative peaks, experiencing zero rate-of-change
(dØ/dt = 0 and di/dt = 0). As the voltage builds to its positive peak, the flux and
current waveforms build to their maximum positive rates-of-change, and on upward to
their positive peaks as the voltage descends to a level of zero.
A significant difference exists between the two scenarios. For the second scenario, the
flux and current levels were at their negative peaks when voltage was at its zero point.
However, in a transformer that has been sitting idle, the winding current should start at
zero. When the magnetic flux increases in response to a rising voltage, it will increase
from zero upwards, not from a previously negative magnetized condition. Thus, in a
transformer that has just been turned on as shown in the second scenario, the flux will
reach approximately twice its normal peak magnitude as it integrates the area under the
voltage waveform’s first half-cycle. This is shown in Figure 4.6.
Figure 4.6 Instant in time when voltage is zero and flux is abnormally high (no scale given,designed byauthor)
In an ideal transformer, the magnetizing current would rise to approximately twice its
normal peak value as well, requiring the necessary mmf to create this higher-than-normal
flux. However, most transformers are not designed with enough margin between normal
flux peaks and the saturation limits to avoid saturating in a condition like this, and so the
core will almost certainly saturate during this first half-cycle of voltage. During saturation,
disproportionate amounts of mmf are needed to generate magnetic flux. This means that

34 CHAPTER 4 ECO ENERGY CONTROLLER SYSTEM DESIGN
winding current, which creates the mmf to cause flux in the core, will disproportionately
rise to a value easily exceeding twice its normal peak. For a steel core, which is normally
found in transformers and motors, the inrush current can be as high as 50 times the rated
current as shown in Figure 4.7.
Figure 4.7 The corresponding current waveform at zero voltage (not to scale,designed by author)
This is the mechanism causing inrush current in a transformer. It is obvious that the mag-
nitude of the inrush current strongly depends on the exact time that electrical connection
to the source is made. If the transformer happens to have some residual magnetism in its
core at the moment of connection to the voltage supply, the inrush could be even more
severe.
The transformer switch-on time needs to be carefully controlled to maintain magnetic flux
within reasonable limits. For this reason, a pure inductive load is turned on when AC
supply is at its peak, and the turning on of the renewable supply has to be the same
polarity according to the previous turn off for the grid supply. In real world appliances,
loads are usually a mix of more than one type of load. The switching-on time for all of
these loads is the same, and that is the load must be turned on when the point on wave
is the same as when it was first turned off.
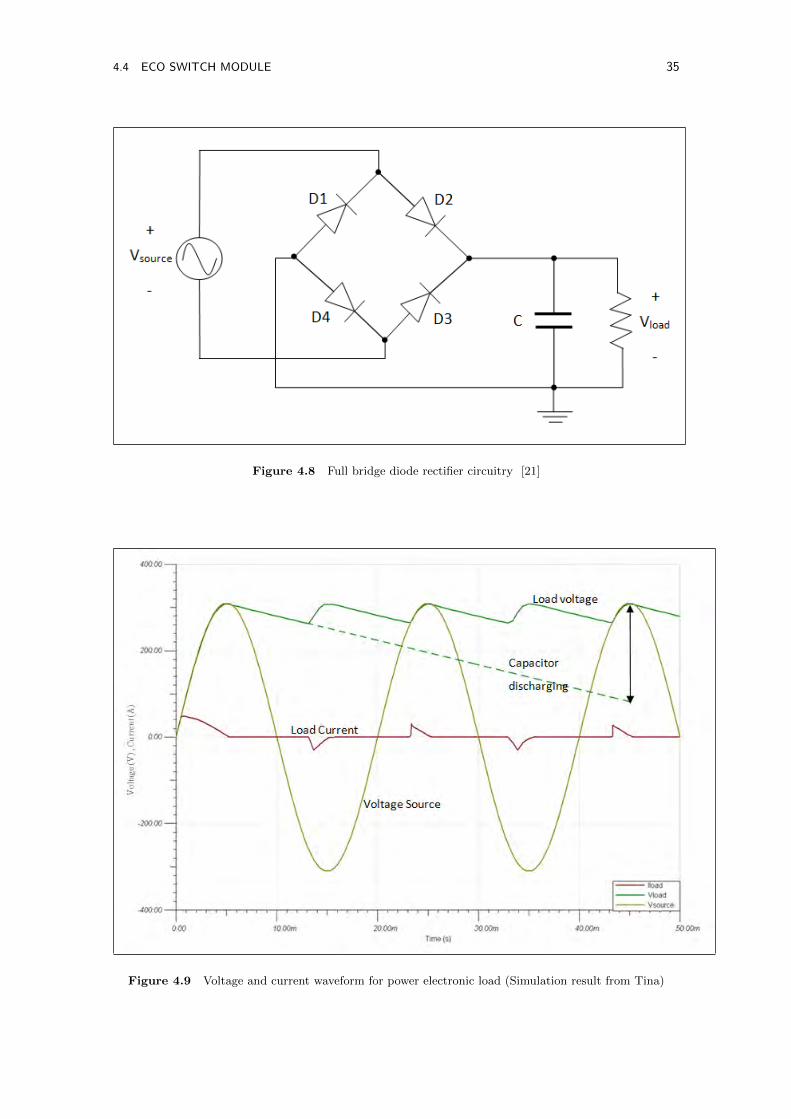
4.4.3.2 Power Electronic Load
A power electronic load typically has the full bridge diode rectifier circuitry as shown in
Figure 4.8 [21]. When this is simulated in Tina Design Suite, its voltage and current
waveform is shown in Figure 4.9.
4.4 ECO SWITCH MODULE 35
Figure 4.8 Full bridge diode rectifier circuitry [21]
Figure 4.9 Voltage and current waveform for power electronic load (Simulation result from Tina)
36 CHAPTER 4 ECO ENERGY CONTROLLER SYSTEM DESIGN
This load draws a large inrush current if it is turned on when the AC voltage (Vsource) is
significantly higher than the DC side smoothing capacitor voltage (Vload). This range is
indicated in Figure 4.9. The period between turn off and the next turn on should be small
enough so that the capacitor voltage does not discharge to zero volts. Normally, for power
electronic, or rectifying loads, there are inductors at either side of the switch to limit the
inrush current.
4.4.4 Components
An important part of the Eco Switch is the switching hardware. It involves three parts,
the power triac, triac driver and the relay.
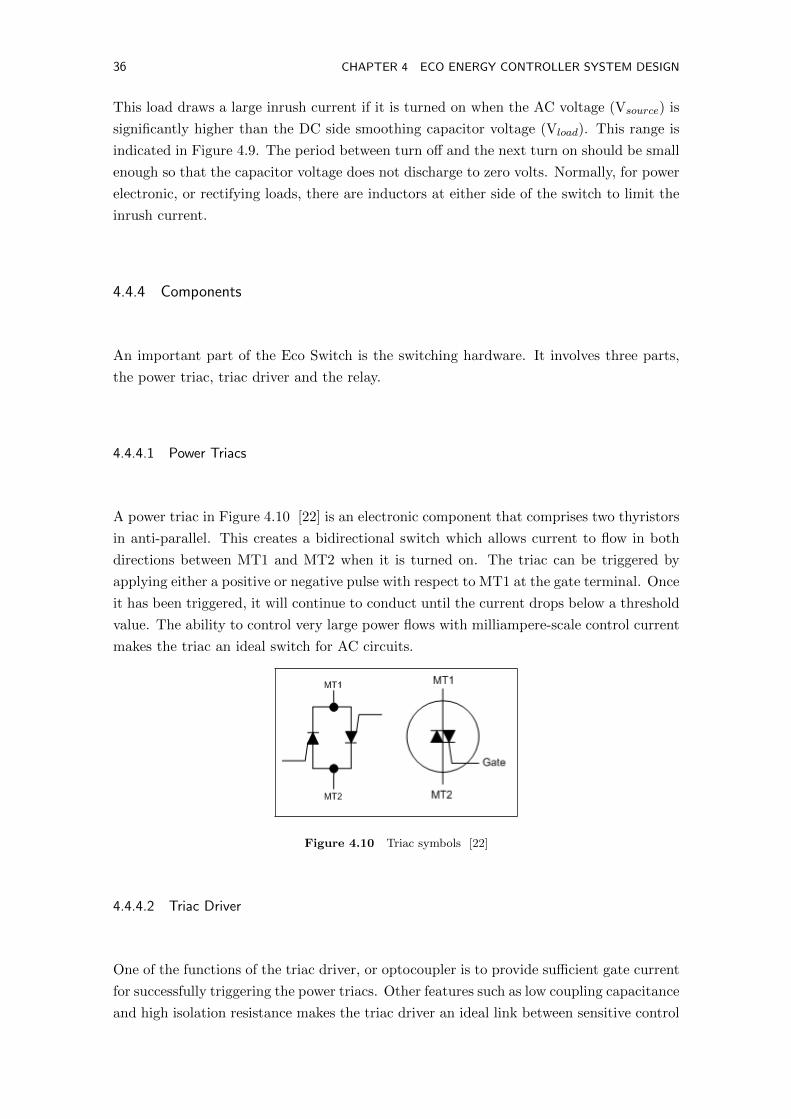
4.4.4.1 Power Triacs
A power triac in Figure 4.10 [22] is an electronic component that comprises two thyristors
in anti-parallel. This creates a bidirectional switch which allows current to flow in both
directions between MT1 and MT2 when it is turned on. The triac can be triggered by
applying either a positive or negative pulse with respect to MT1 at the gate terminal. Once
it has been triggered, it will continue to conduct until the current drops below a threshold
value. The ability to control very large power flows with milliampere-scale control current
makes the triac an ideal switch for AC circuits.
Figure 4.10 Triac symbols [22]
4.4.4.2 Triac Driver
One of the functions of the triac driver, or optocoupler is to provide sufficient gate current
for successfully triggering the power triacs. Other features such as low coupling capacitance
and high isolation resistance makes the triac driver an ideal link between sensitive control

4.4 ECO SWITCH MODULE 37
circuitry and the AC power system environment. A simplified diagram of the driver
obtained from the datasheet is shown in Figure 4.11 [23]. A forward current flowing
through the LED generates infrared radiation will trigger the triac inside the chip which
in turn triggers the high power triac.
Figure 4.11 Internal structure of optocoupler [23]
A triac can conduct current in both directions, therefore it only has a very short time
during which the sine wave current is passing through zero to recover to its blocking state.
The problem with inductive loads (motors, solenoids, etc.) is that the load current through
the triac lags behind the mains voltage. This means that at the time the current of the
power triac falls below the holding current and the triac ceases to conduct, there is a rapid
rise of voltage across the triac, which can force conduction to continue.
This rate of rise of voltage, dV/dt, must be reduced in order to achieve control over
inductive loads. This is done by adding a RC network, or snubber circuit, in parallel with
the power triac. The capacitor will limit the dV/dt across the triac and the resistor will
limit the surge current from the capacitor when the triac conducts. A snubber circuit is
included in all the triac switching hardware.
The initial proposal was to place the power triac at the upper part of the board so that
heatsinks can be situated near them. This way, the heat dissipated by the power triac
can be removed, instead of distributing throughout the rest of the board in a confined
enclosure. However, after testing, it was found that power dissipation is too high in steady
state, and an alternative path for current using electromechanical relay is provided.

38 CHAPTER 4 ECO ENERGY CONTROLLER SYSTEM DESIGN
4.4.4.3 Electromechanical Relay
A relay is an electrically operated switch. It is widely used in systems that require control
of high-voltage circuits with low-voltage signals. The relay provides a low voltage drop
connection, but is relatively slow to switch. The triac is used for high speed switching, and
the relay is used to bypass the triac during steady state operation. An internal structure of
a Single Pole Single Throw (SPST) relay is shown in Figure 4.12. A contact is connected
to this arm and the contact touches another contact to complete a circuit as shown in
Figure 4.13.
Figure 4.12 Internal structure of relay at opening and closing(designed by author)
Figure 4.13 Electromechanical relay circuit(designed by author)
The Single Pole Single Throw 5VDC relay requires a suppression diode connected in par-
allel with the relay coil as shown in Figure 4.13. When power is supplied to the relay,
a magnetic field is created and energy is stored inside the relay coil. The freewheeling
diode D1 is placed in a manner to provide a circulating current path when transistor T1
is turned off.
The coil within the relay requires up to 70mA which is more than an IO pin of the
4.4 ECO SWITCH MODULE 39
microcontroller can take, therefore a NPN transistor is used to drive the relay. It can take
up to a 200mA which is more than enough. When the control pin for the relay is high,
the NPN transistor connects to ground, sending current through the coil to activate the
relay.
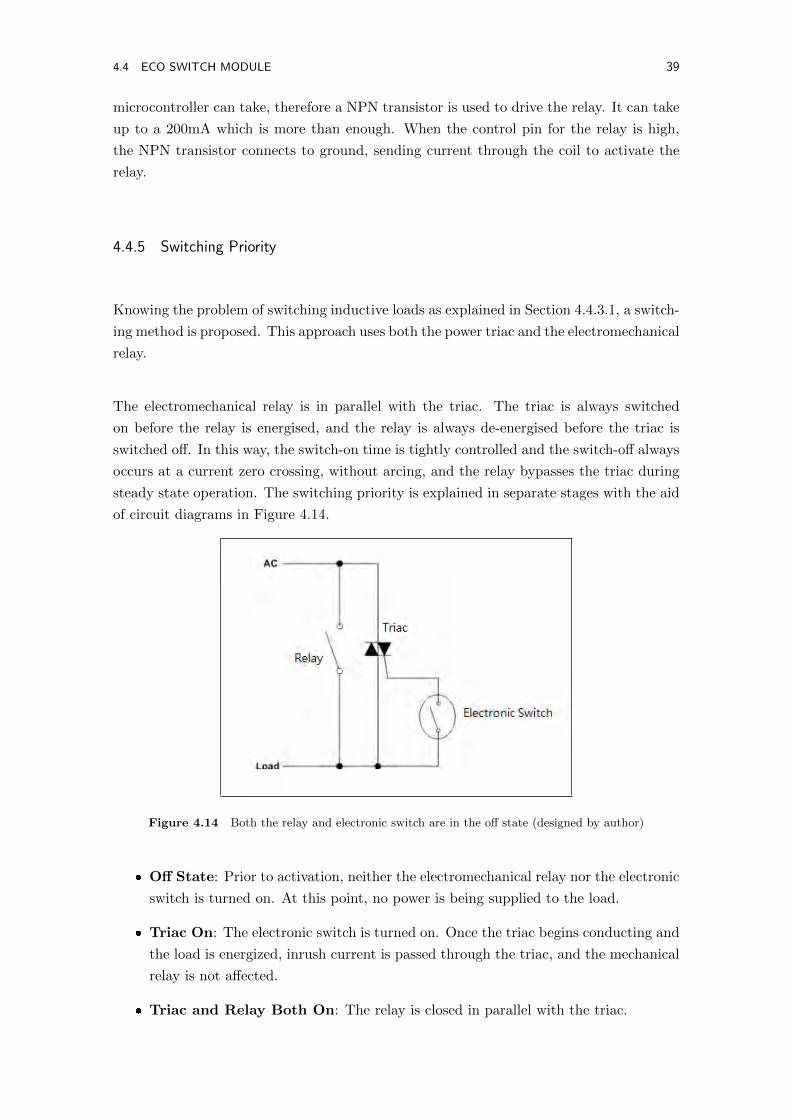
4.4.5 Switching Priority
Knowing the problem of switching inductive loads as explained in Section 4.4.3.1, a switch-
ing method is proposed. This approach uses both the power triac and the electromechanical
relay.
The electromechanical relay is in parallel with the triac. The triac is always switched
on before the relay is energised, and the relay is always de-energised before the triac is
switched off. In this way, the switch-on time is tightly controlled and the switch-off always
occurs at a current zero crossing, without arcing, and the relay bypasses the triac during
steady state operation. The switching priority is explained in separate stages with the aid
of circuit diagrams in Figure 4.14.
Figure 4.14 Both the relay and electronic switch are in the off state (designed by author)
Off State: Prior to activation, neither the electromechanical relay nor the electronic
switch is turned on. At this point, no power is being supplied to the load.
Triac On: The electronic switch is turned on. Once the triac begins conducting and
the load is energized, inrush current is passed through the triac, and the mechanical
relay is not affected.
Triac and Relay Both On: The relay is closed in parallel with the triac.

40 CHAPTER 4 ECO ENERGY CONTROLLER SYSTEM DESIGN
4.5 SUMMARY
The physical CAN bus is a twisted wire pair with 120Ω termination resistors on
either end.
On each of the Master Controller board and switch boards, a CAN microcontroller
(PIC18F2580) and a CAN transceiver (MCP2551) is included to allow communica-
tion between boards.
The EEC resembles a master-slave type of communication system where one Main
Controller instructs many switch nodes (slaves) what to do.
The function of the Main Controller is to monitor the state of all the available Eco
Switches on the bus, and to determine which switch should be supplying alternative
or grid voltage.
The function of the Eco Switch is to monitor the temperature, and process the
information received from the Main Controller. For example, turning on or off triacs
and relays.
The three types of common domestic loads are resistive, inductive and power elec-
tronic. The turning on and off for inductive and power electronic loads has to be
done so that the instantaneous current is reduced. It is found that for an inductive
load, it is turned on when the voltage is at its peak, that way the current is at zero
crossover.
Triacs are used for initial switching on and relays take over after the load has been
energized. When turning off, the relays are turned off before the triacs. The timing
of triac and relay switch on/off is explained more in Chapter 6, the software section.
Chapter 5 describes the hardware of the Main Controller and Eco Switches.
Chapter 5Hardware Construction of the Eco System
This chapter explains the hardware construction of the main controller and the individual
switches within the EEC system.
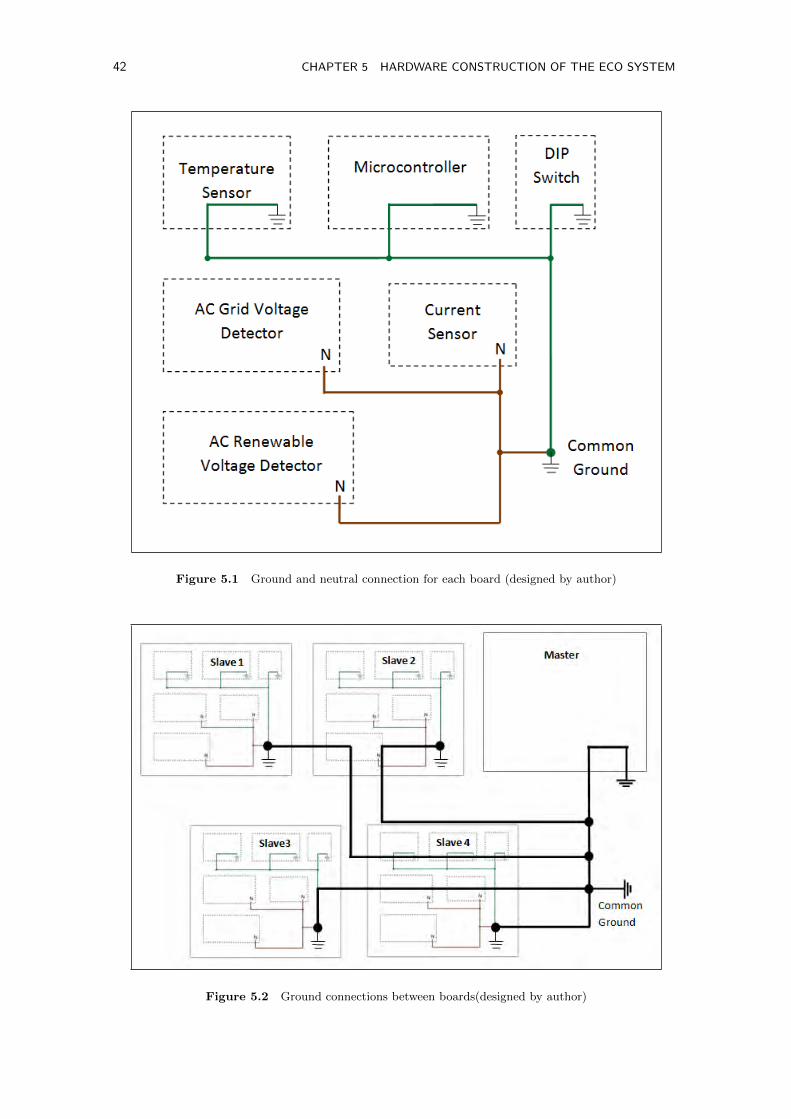
5.1 GROUNDING
In the main controller and Eco Switch printed circuit boards, the ground points are all
connected to one point within their own boards, and the neutrals are connected to another
point. Then, somewhere in the circuit, the ground and neutral point are connected to-
gether. This is illustrated in Figure 5.1. It should be noted that some boards has neutral
points, and some has ground points. Circuits with AC power inputs such as AC Grid
Voltage Detector, AC Renewable Voltage Detector and Current Detector each requires a
neutral point whereas the other boards that does not have AC power inputs only needs
ground points. This is described in the rest of the chapter where the boards are closely
examined.
This kind of layout avoids the problem of ground loops which occur when there is more
than one ground connection path between circuits within the board. The multiple ground
paths often form the equivalent antenna loop which easily picks up interference currents.
The consequence of ground-loop induced voltages is that the ground references in the
system are no longer at a stable potential. This results in having noise becoming part of
the measured signal. Therefore, in order to reduce noise, the ground points are connected
together in the fashion as shown in Figure 5.2.
42 CHAPTER 5 HARDWARE CONSTRUCTION OF THE ECO SYSTEM
Figure 5.1 Ground and neutral connection for each board (designed by author)
Figure 5.2 Ground connections between boards(designed by author)

5.2 ECO MAIN CONTROLLER 43
5.2 ECO MAIN CONTROLLER
The block diagram of the main controller hardware is shown in Figure 5.3. It consists
of a CAN transceiver, connecting the microcontroller and the CAN communication bus.
Monitoring of the battery that stores renewable energy is not included in this work, there-
fore, a potentiometer is used to provide a signal representing energy availability. The main
controller also includes a power LED and a reset button to manually reset the microcon-
troller. The MPLAB-ICD tool [24] is used during the software debugging process in the
microcontroller.
Figure 5.3 Block diagram of the Eco main controller(designed by author)
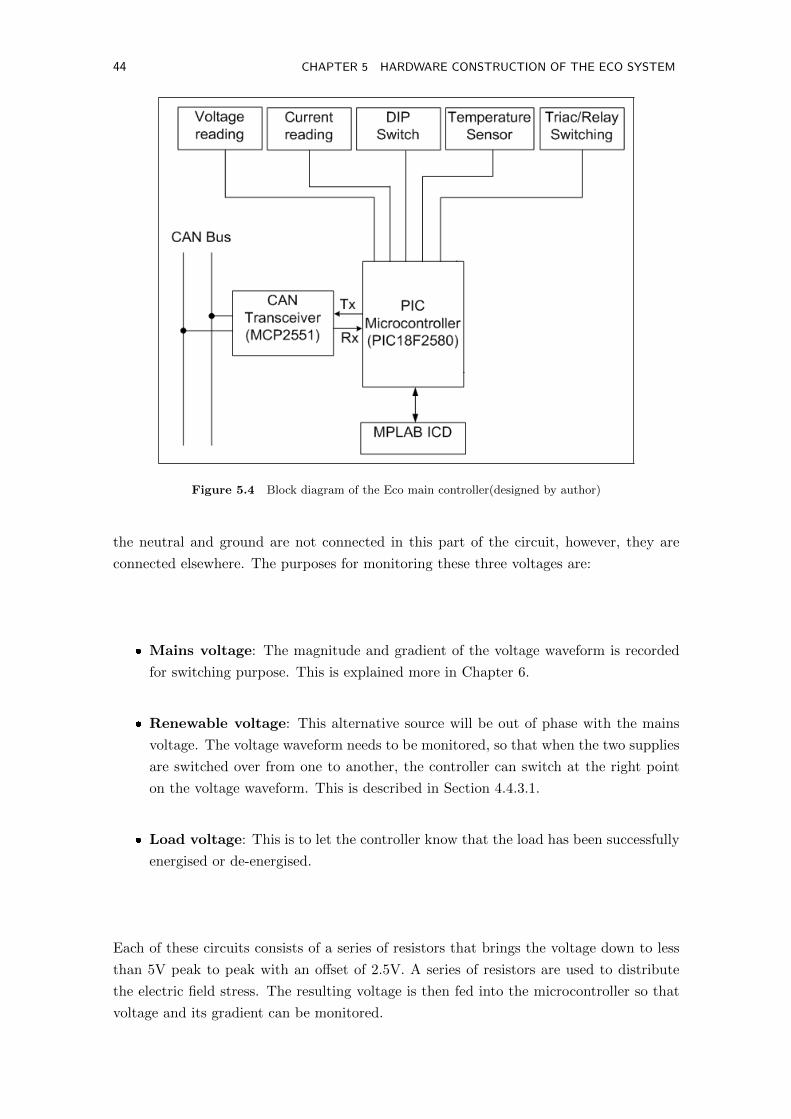
5.3 ECO SWITCH MODULE
In this section, the hardware construction of the Eco switch is explained. The block
diagram for the individual switch node is shown in Figure 5.4. The five blocks connected
to the microcontroller serve different purposes. Each of them is explained followed by a
circuit diagram in the following sections.
5.3.1 Voltage Reading
Three voltage reading circuits are used such as the one shown in Figure 5.5. They are for
the mains voltage, renewable voltage, and the load voltage. As mentioned in Section 5.1,
44 CHAPTER 5 HARDWARE CONSTRUCTION OF THE ECO SYSTEM
Figure 5.4 Block diagram of the Eco main controller(designed by author)
the neutral and ground are not connected in this part of the circuit, however, they are
connected elsewhere. The purposes for monitoring these three voltages are:
Mains voltage: The magnitude and gradient of the voltage waveform is recorded
for switching purpose. This is explained more in Chapter 6.
Renewable voltage: This alternative source will be out of phase with the mains
voltage. The voltage waveform needs to be monitored, so that when the two supplies
are switched over from one to another, the controller can switch at the right point
on the voltage waveform. This is described in Section 4.4.3.1.
Load voltage: This is to let the controller know that the load has been successfully
energised or de-energised.
Each of these circuits consists of a series of resistors that brings the voltage down to less
than 5V peak to peak with an offset of 2.5V. A series of resistors are used to distribute
the electric field stress. The resulting voltage is then fed into the microcontroller so that
voltage and its gradient can be monitored.
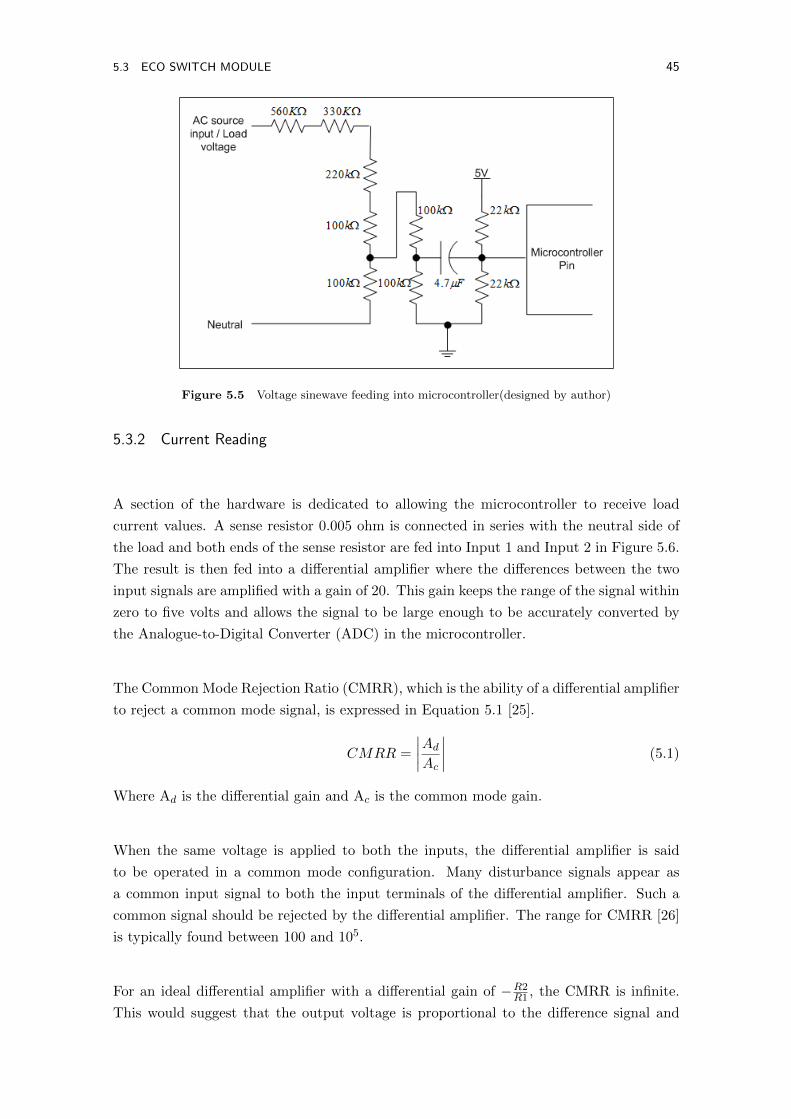
5.3 ECO SWITCH MODULE 45
Figure 5.5 Voltage sinewave feeding into microcontroller(designed by author)
5.3.2 Current Reading
A section of the hardware is dedicated to allowing the microcontroller to receive load
current values. A sense resistor 0.005 ohm is connected in series with the neutral side of
the load and both ends of the sense resistor are fed into Input 1 and Input 2 in Figure 5.6.
The result is then fed into a differential amplifier where the differences between the two
input signals are amplified with a gain of 20. This gain keeps the range of the signal within
zero to five volts and allows the signal to be large enough to be accurately converted by
the Analogue-to-Digital Converter (ADC) in the microcontroller.
The Common Mode Rejection Ratio (CMRR), which is the ability of a differential amplifier
to reject a common mode signal, is expressed in Equation 5.1 [25].
CMRR =
∣∣∣∣Ad
Ac
∣∣∣∣ (5.1)
Where Ad is the differential gain and Ac is the common mode gain.
When the same voltage is applied to both the inputs, the differential amplifier is said
to be operated in a common mode configuration. Many disturbance signals appear as
a common input signal to both the input terminals of the differential amplifier. Such a
common signal should be rejected by the differential amplifier. The range for CMRR [26]
is typically found between 100 and 105.
For an ideal differential amplifier with a differential gain of −R2R1 , the CMRR is infinite.
This would suggest that the output voltage is proportional to the difference signal and

46 CHAPTER 5 HARDWARE CONSTRUCTION OF THE ECO SYSTEM
common mode component is rejected. However, in practice, the condition of equal resis-
tances for R1, R3 and R2, R4 will never be filled. This results in a finite CMRR of 275
with 1% of tolerance resistors. The detailed calculation can be found in Appendix I [27].
The CMRR means the resulting voltage from the differential amplifier is a combination of
amplified voltage difference and noise signals. However, since the purpose of obtaining a
load current waveform for the PIC microcontroller to read was achieved, the amplifier did
not have to be modified.
Figure 5.6 Current reading circuit(designed by author)
5.3.3 DIP Switch
Figure 5.7 DIP switch for changing module ID(designed by author)
The DIP Switch allows the user to give each individual Eco Switch an ID so that they can
monitor the modules independently. The circuit associated with it is shown in Figure 5.7.
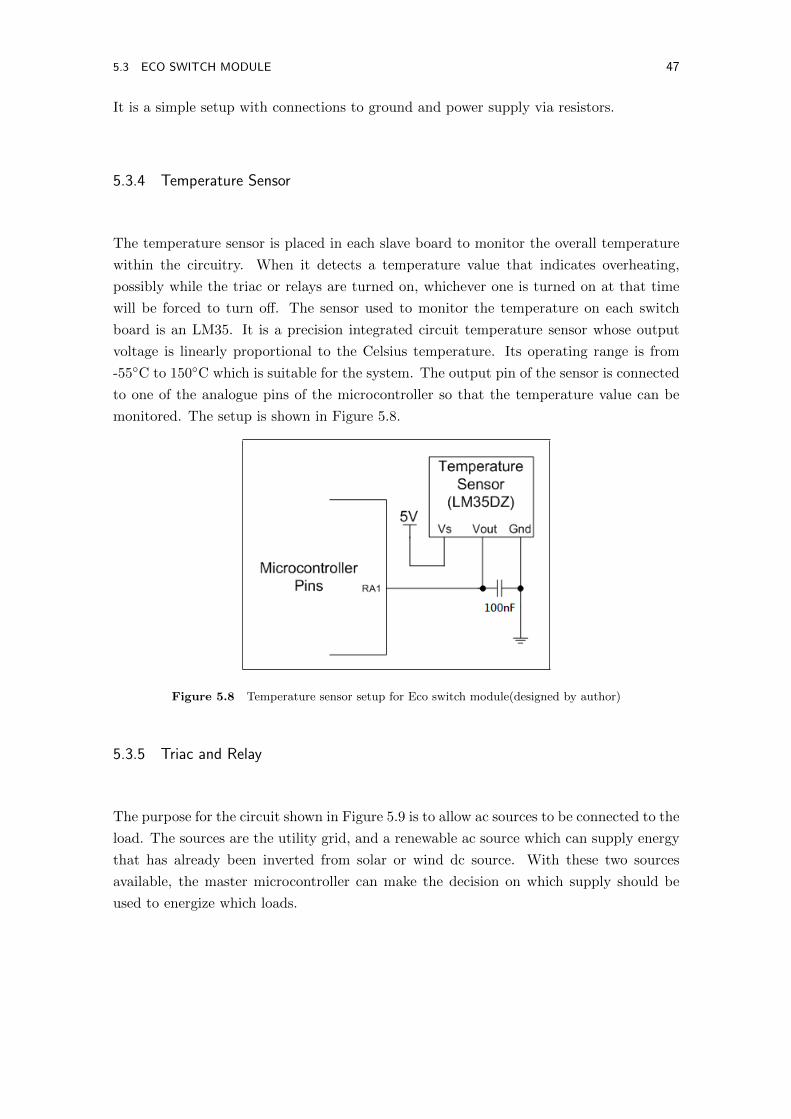
5.3 ECO SWITCH MODULE 47
It is a simple setup with connections to ground and power supply via resistors.
5.3.4 Temperature Sensor
The temperature sensor is placed in each slave board to monitor the overall temperature
within the circuitry. When it detects a temperature value that indicates overheating,
possibly while the triac or relays are turned on, whichever one is turned on at that time
will be forced to turn off. The sensor used to monitor the temperature on each switch
board is an LM35. It is a precision integrated circuit temperature sensor whose output
voltage is linearly proportional to the Celsius temperature. Its operating range is from
-55C to 150C which is suitable for the system. The output pin of the sensor is connected
to one of the analogue pins of the microcontroller so that the temperature value can be
monitored. The setup is shown in Figure 5.8.
Figure 5.8 Temperature sensor setup for Eco switch module(designed by author)
5.3.5 Triac and Relay
The purpose for the circuit shown in Figure 5.9 is to allow ac sources to be connected to the
load. The sources are the utility grid, and a renewable ac source which can supply energy
that has already been inverted from solar or wind dc source. With these two sources
available, the master microcontroller can make the decision on which supply should be
used to energize which loads.
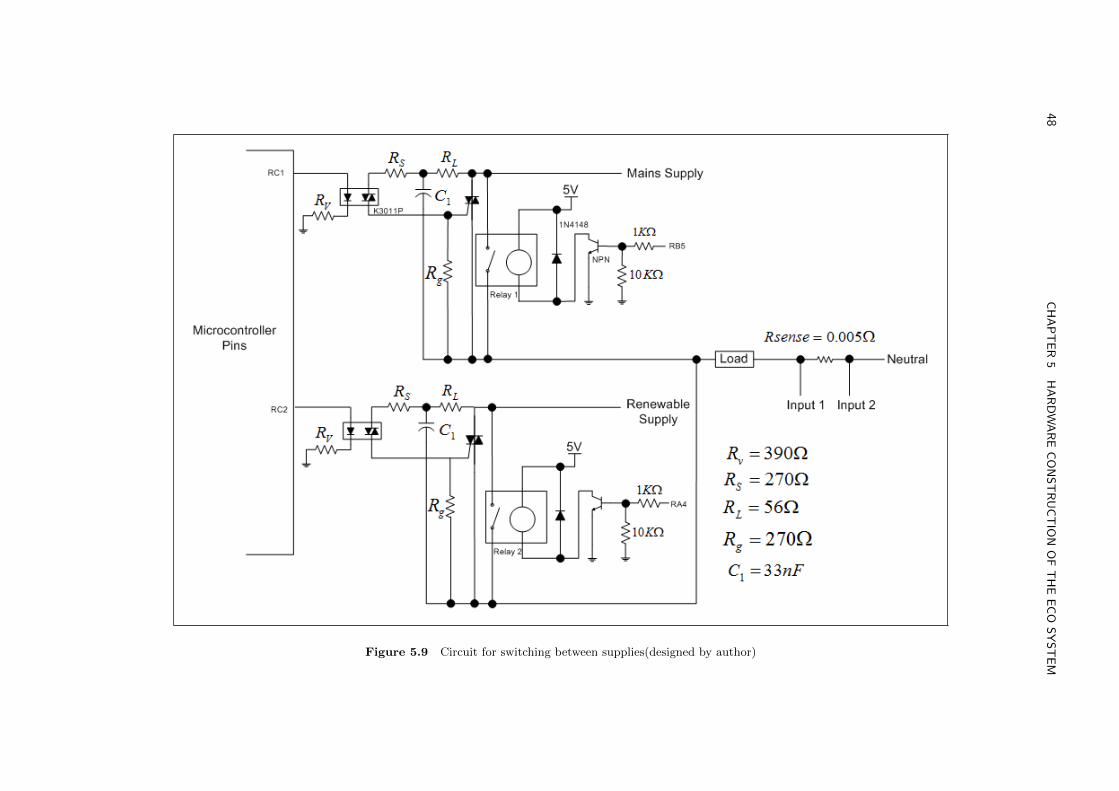
48CHAPTER
5HARDWARECONSTRUCTIO
NOFTHEECO
SYSTEM
Figure 5.9 Circuit for switching between supplies(designed by author)
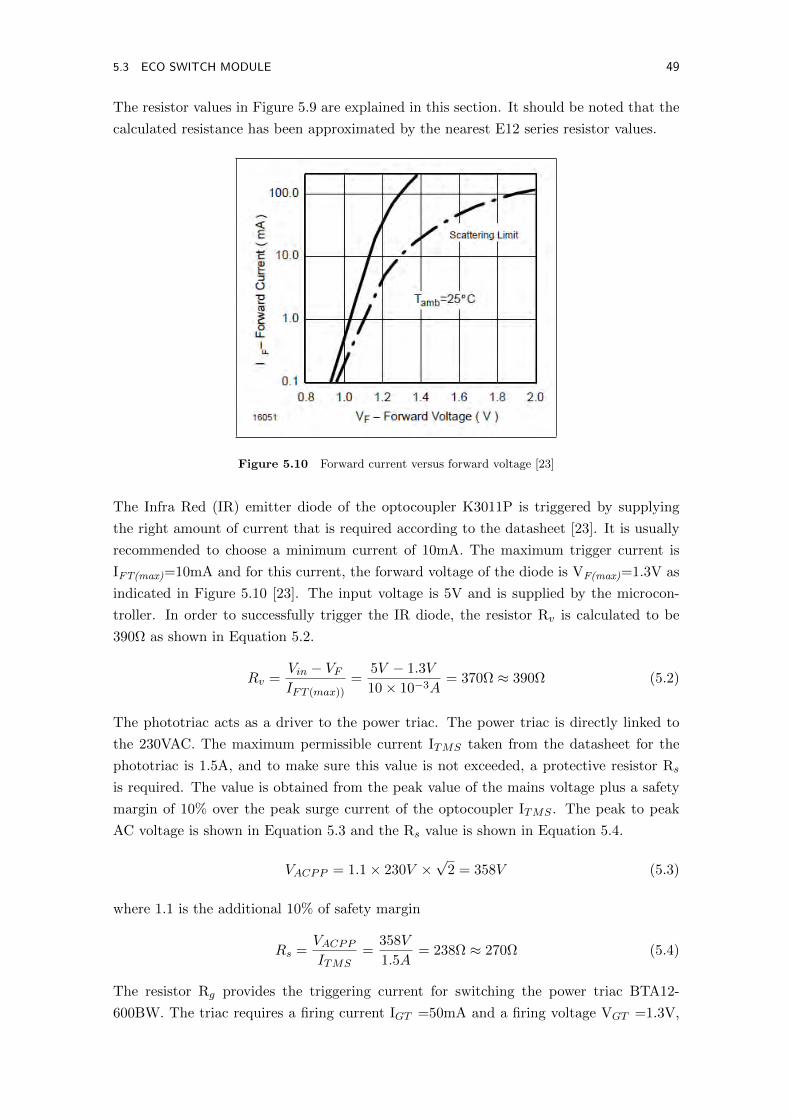
5.3 ECO SWITCH MODULE 49
The resistor values in Figure 5.9 are explained in this section. It should be noted that the
calculated resistance has been approximated by the nearest E12 series resistor values.
Figure 5.10 Forward current versus forward voltage [23]
The Infra Red (IR) emitter diode of the optocoupler K3011P is triggered by supplying
the right amount of current that is required according to the datasheet [23]. It is usually
recommended to choose a minimum current of 10mA. The maximum trigger current is
IFT(max)=10mA and for this current, the forward voltage of the diode is VF(max)=1.3V as
indicated in Figure 5.10 [23]. The input voltage is 5V and is supplied by the microcon-
troller. In order to successfully trigger the IR diode, the resistor Rv is calculated to be
390Ω as shown in Equation 5.2.
Rv =Vin − VFIFT (max))
=5V − 1.3V
10× 10−3A= 370Ω ≈ 390Ω (5.2)
The phototriac acts as a driver to the power triac. The power triac is directly linked to
the 230VAC. The maximum permissible current ITMS taken from the datasheet for the
phototriac is 1.5A, and to make sure this value is not exceeded, a protective resistor Rs
is required. The value is obtained from the peak value of the mains voltage plus a safety
margin of 10% over the peak surge current of the optocoupler ITMS . The peak to peak
AC voltage is shown in Equation 5.3 and the Rs value is shown in Equation 5.4.
VACPP = 1.1× 230V ×√
2 = 358V (5.3)
where 1.1 is the additional 10% of safety margin
Rs =VACPP
ITMS=
358V
1.5A= 238Ω ≈ 270Ω (5.4)
The resistor Rg provides the triggering current for switching the power triac BTA12-
600BW. The triac requires a firing current IGT =50mA and a firing voltage VGT =1.3V,

50 CHAPTER 5 HARDWARE CONSTRUCTION OF THE ECO SYSTEM
both from the datasheet. The voltage needed for triggering is therefore 14.7V, with cal-
culation shown in Equation 5.5.
VTR = IGTRS + VTM + VGT = (50× 10−3A× 270Ω) + 1.5V + 1.3V = 14.7V ) (5.5)
where VTM is the peak voltage of the optocoupler during the on-state.
Once the triggering voltage is found, the value of Rg can be calculated. This is shown in
Equation 5.6.
Rg =VTR
IGT=
14.7V
50× 10−3A= 294Ω ≈ 270Ω (5.6)
5.3.6 Other Details on the Board
In order to achieve accurate and robust switching, the system hardware must be able to
withstand the mains voltage environment. The temperature of the system during switching
must not exceed the hardware rating. In the design of all nodes, the following basic design
principles were applied.
Two layer PCBs were used for simplicity. The PCB design followed guidelines for
reduced EMI.
All ICs throughout the network have decoupling capacitors placed at their voltage
input rails to compensate for their power demand voltage sag and to filter out noise.
The decoupling capacitors were placed as close as possible to the ICs to minimize
stray inductance produced by the PCB tracks.
All of the components were placed as close as possible to each other, in order to
minimize the lengths of track used and thus, minimizing stray inductances.
5.4 SUMMARY
On each of the individual boards, the ground points are connected together at one
point, and the neutral are connected in the same manner. Then, the two points are
linked together within the board. This layout is to avoid looping which would cause
interference.
The Main Controller consists of a simple layout with CAN transceiver, microcon-
troller, error LED and reset button. The Eco Switch includes more functions such

5.4 SUMMARY 51
as voltage reading, current reading, temperature sensor, DIP switch, and triac/relay
switching circuits.
The CMRR for the current sensing circuit was found to be 275, taking into account
the 1% resistance uncertainty.
The following chapter, Chapter 6, describes the software structure for Main Con-
troller and the Eco Switch.


Chapter 6Software Structure of the Eco Energy
Controller
The software for programming the PIC microcontroller is written in C. The code is loaded
into the CAN main controller and CAN nodes(Eco Switches). As mentioned in sec-
tion 5.3.3, each of the switches is differentiated using IDs manually set via the 4 way
DIP Switch. This allows a maximum number of 16 Eco Switches to be connected to the
CAN bus. The user would be advised to set the IDs in the sequence from 0 to 16.
As described in Chapter 2, the main function of the main controller is to make decisions
on which load should be switched to grid supply, and which load should be switched to
renewable supply, depending on the amount of renewable energy available. The switching
action, however, is done by the individual Eco Switches that are connected to different
loads and not the main controller. Each switch triac T1 and relay R1 are responsible for
connecting grid voltage and triac T2 and relay R2 are for connecting the renewable supply.
It was mentioned in Chapter 4 that all CAN nodes have masks and filters which allow them
to receive specific messages destined for them and to ignore others. These masks and filters
are set specifically inside the master controller so that it can receive all kinds of messages.
For the individual switch nodes, it is set to only receive messages according to their ID,
and others are blocked out. For example, the master controller transmits messages to each
switch node by sending it to a specific address, and the message is received only by the
switch node that has the same address preset into its system. The Eco Switches are only
allowed to transmit messages or information to the master controller when it asks for it.
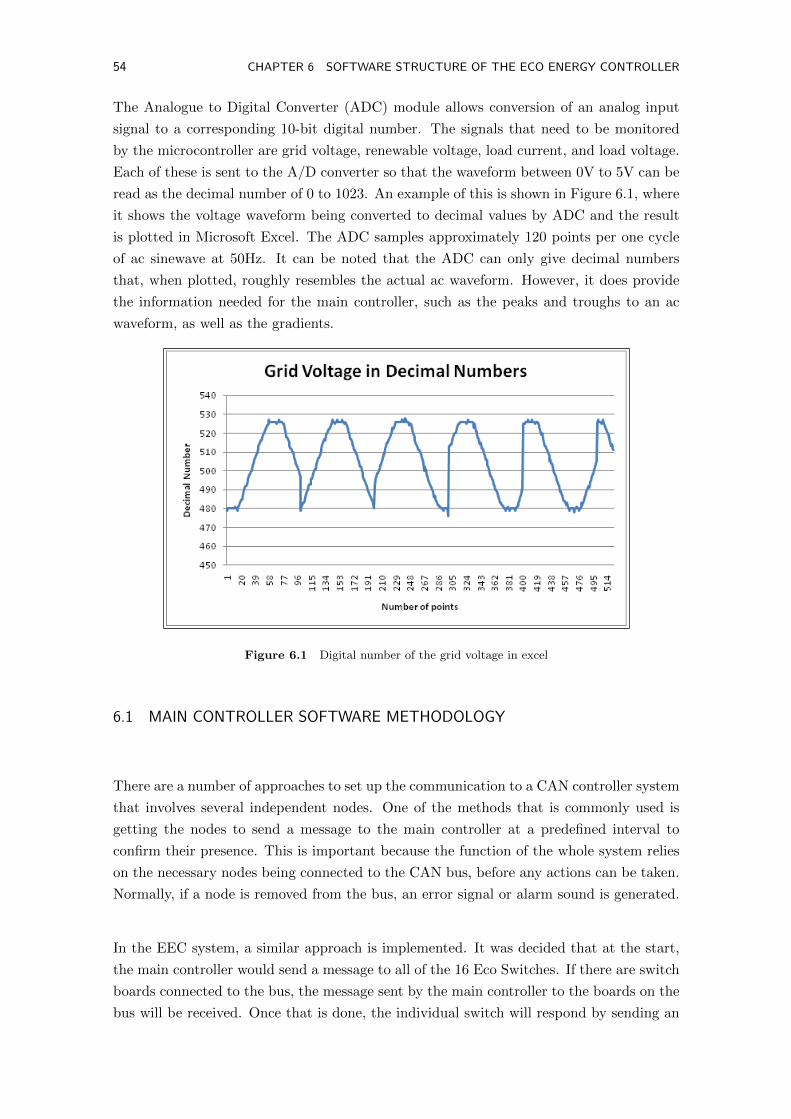
54 CHAPTER 6 SOFTWARE STRUCTURE OF THE ECO ENERGY CONTROLLER
The Analogue to Digital Converter (ADC) module allows conversion of an analog input
signal to a corresponding 10-bit digital number. The signals that need to be monitored
by the microcontroller are grid voltage, renewable voltage, load current, and load voltage.
Each of these is sent to the A/D converter so that the waveform between 0V to 5V can be
read as the decimal number of 0 to 1023. An example of this is shown in Figure 6.1, where
it shows the voltage waveform being converted to decimal values by ADC and the result
is plotted in Microsoft Excel. The ADC samples approximately 120 points per one cycle
of ac sinewave at 50Hz. It can be noted that the ADC can only give decimal numbers
that, when plotted, roughly resembles the actual ac waveform. However, it does provide
the information needed for the main controller, such as the peaks and troughs to an ac
waveform, as well as the gradients.
Figure 6.1 Digital number of the grid voltage in excel
6.1 MAIN CONTROLLER SOFTWARE METHODOLOGY
There are a number of approaches to set up the communication to a CAN controller system
that involves several independent nodes. One of the methods that is commonly used is
getting the nodes to send a message to the main controller at a predefined interval to
confirm their presence. This is important because the function of the whole system relies
on the necessary nodes being connected to the CAN bus, before any actions can be taken.
Normally, if a node is removed from the bus, an error signal or alarm sound is generated.
In the EEC system, a similar approach is implemented. It was decided that at the start,
the main controller would send a message to all of the 16 Eco Switches. If there are switch
boards connected to the bus, the message sent by the main controller to the boards on the
bus will be received. Once that is done, the individual switch will respond by sending an
6.1 MAIN CONTROLLER SOFTWARE METHODOLOGY 55
acknowledgment(ACK) message back to the main controller stating a message has been
successfully received. The master controller waits for 20ms and then checks whether there
are any messages that need to be received. A counter inside the master controller is used
to keep count of the number of times a message is received from the bus. As a result, the
controller would keep count of the number of switches on the bus, as well as the IDs of
the Eco Switches that are present at the start of operation.
If there are conflicting IDs on the bus, the controller sends an error message back to the
Eco Switches with the identical IDs. When that happens, the user would have to fix the
IDs manually, and power up the system again. The same process is implemented if a new
module is to be added half way through the operation.
Once the confirmation of switches has been done, from there onwards, the master controller
sends a message to each of the existing Eco Switch at a predefined interval. This, again,
is to ensure all the switches are physically connected to the communication bus. If the
Eco Switch is still connected, it will receive the message, and respond by sending an ACK
message, as described before. However, if the Eco Switch has been tampered with, and
does not respond when a message was sent to it, the master controller’s error LED will
turn on to indicate a node is missing.
After the main controller has checked for Eco Switch IDs, it transmits a STATUS message
to each individual switches on the bus. This particular message checks for the status of the
two triacs T1, T2, two relays R1, R2, temperature, and current data of the load connected
to the various Eco Switches. The main controller updates these details from time to time,
to confirm that all the switches are functioning and no components are overheating.The
block diagram in Figure 6.2 illustrates the software structure of the master controller. On
power-up, the registers within the microcontroller are initialized. It involves setting up all
the I/O pins as either input or output depending on their function.
In order to simulate the state of the battery charged by the renewable energy which is
monitored by the main controller, a potentiometer was used to represent the amount of
renewable energy available. It can be manually adjusted and given the current information
from each Eco Switches, the controller would decide which loads are to be supplied from
grid or renewable sources.
After the controller has made the decision to switch a load, the message will be sent to
that particular Eco Switch. For instance, if the amount of energy is only sufficient to
supply a 5A load and ID-0 Eco Switch is responsible for a 4A load, the main controller
will send an instruction message to tell ID-0 to disconnect the grid supply and connect
the renewable supply. When the main controller sends a STATUS message to ID-0, it will

56 CHAPTER 6 SOFTWARE STRUCTURE OF THE ECO ENERGY CONTROLLER
check whether the necessary action has been taken.

6.1
MAIN
CONTROLLER
SOFTWAREMETHODOLOGY
57Figure 6.2 Eco main controller software structure(designed by author)
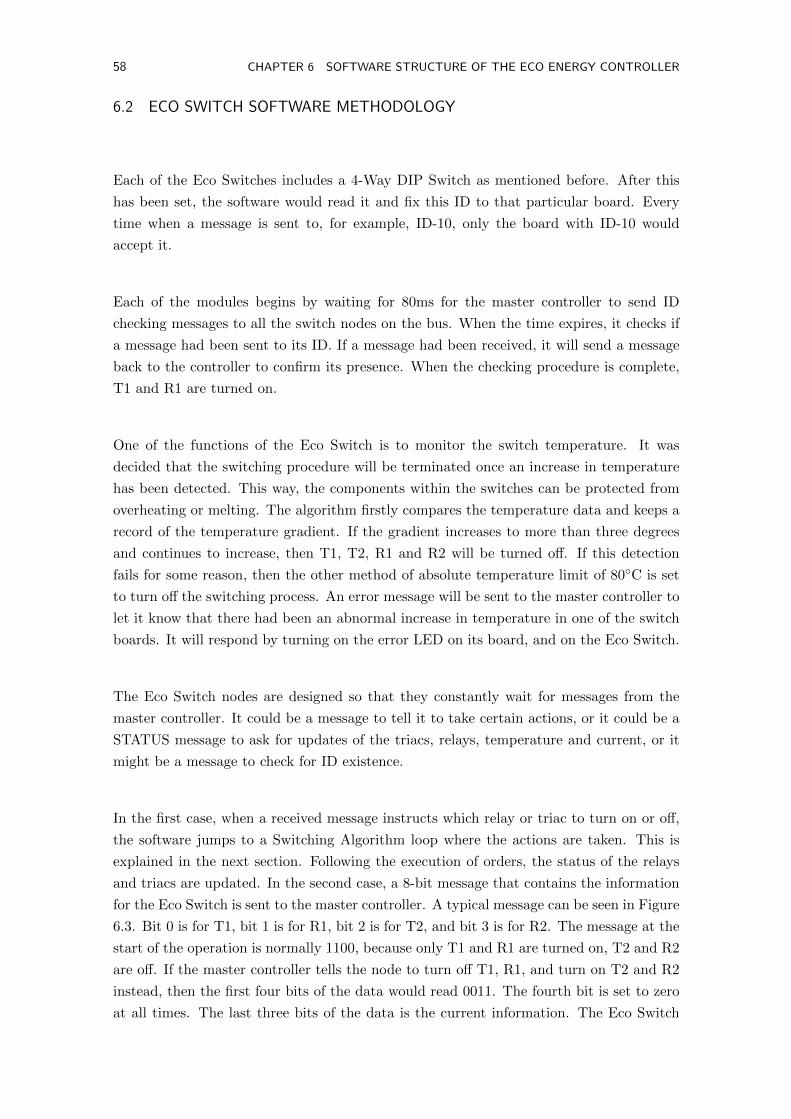
58 CHAPTER 6 SOFTWARE STRUCTURE OF THE ECO ENERGY CONTROLLER
6.2 ECO SWITCH SOFTWARE METHODOLOGY
Each of the Eco Switches includes a 4-Way DIP Switch as mentioned before. After this
has been set, the software would read it and fix this ID to that particular board. Every
time when a message is sent to, for example, ID-10, only the board with ID-10 would
accept it.
Each of the modules begins by waiting for 80ms for the master controller to send ID
checking messages to all the switch nodes on the bus. When the time expires, it checks if
a message had been sent to its ID. If a message had been received, it will send a message
back to the controller to confirm its presence. When the checking procedure is complete,
T1 and R1 are turned on.
One of the functions of the Eco Switch is to monitor the switch temperature. It was
decided that the switching procedure will be terminated once an increase in temperature
has been detected. This way, the components within the switches can be protected from
overheating or melting. The algorithm firstly compares the temperature data and keeps a
record of the temperature gradient. If the gradient increases to more than three degrees
and continues to increase, then T1, T2, R1 and R2 will be turned off. If this detection
fails for some reason, then the other method of absolute temperature limit of 80C is set
to turn off the switching process. An error message will be sent to the master controller to
let it know that there had been an abnormal increase in temperature in one of the switch
boards. It will respond by turning on the error LED on its board, and on the Eco Switch.
The Eco Switch nodes are designed so that they constantly wait for messages from the
master controller. It could be a message to tell it to take certain actions, or it could be a
STATUS message to ask for updates of the triacs, relays, temperature and current, or it
might be a message to check for ID existence.
In the first case, when a received message instructs which relay or triac to turn on or off,
the software jumps to a Switching Algorithm loop where the actions are taken. This is
explained in the next section. Following the execution of orders, the status of the relays
and triacs are updated. In the second case, a 8-bit message that contains the information
for the Eco Switch is sent to the master controller. A typical message can be seen in Figure
6.3. Bit 0 is for T1, bit 1 is for R1, bit 2 is for T2, and bit 3 is for R2. The message at the
start of the operation is normally 1100, because only T1 and R1 are turned on, T2 and R2
are off. If the master controller tells the node to turn off T1, R1, and turn on T2 and R2
instead, then the first four bits of the data would read 0011. The fourth bit is set to zero
at all times. The last three bits of the data is the current information. The Eco Switch

6.2 ECO SWITCH SOFTWARE METHODOLOGY 59
node reads the load current and finds the maximum value. The value is obtained by ADC
and is represented in hexadecimal numbers. Each of the digits from the hexadecimal value
is then extracted out and put into the last three places of the message. It is 785 in this
case, and note that the values are read from the last bit to the fifth bit.
Figure 6.3 Data bits description at the start of operation(designed by author)
An error message is sent from the master controller, if the information inside the data is
inaccurate. For example, the master controller had instructed ID-0 to turn on R1, but
the first four bits of the data reads 1000. This suggests that R1 has not been turned on
when being asked to do so and as a result, the triac will get hot. In that case, the master
controller will send an error message to the switch node. The error can be distinguished
by different speed of LED flashing. They can be categorized as:
Slow flash: triac fail
Medium flash: relay fail
Fast flash: temperature increase
Solid flash: clashing IDs
The software structure for the Eco Switch is shown in Figure 6.4.

60CHAPTER
6SOFTWARESTRUCTUREOFTHEECO
ENERGY
CONTROLLER
Figure 6.4 Eco Switch software structure(designed by author)
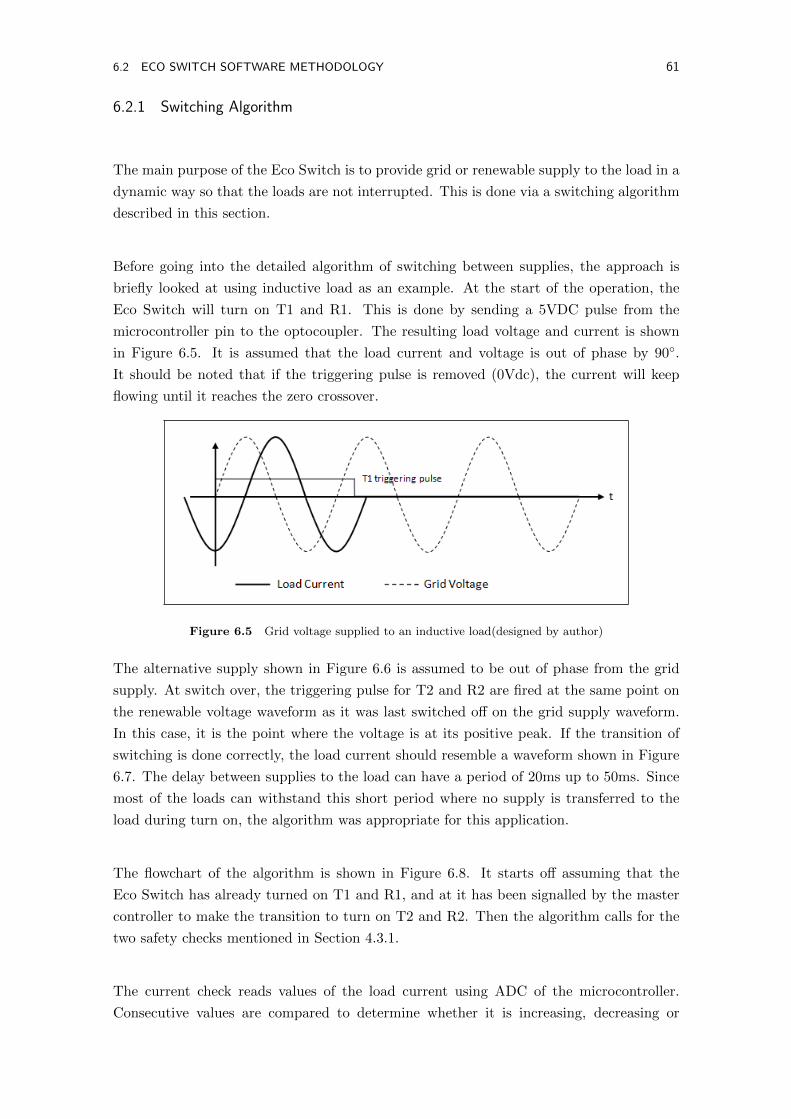
6.2 ECO SWITCH SOFTWARE METHODOLOGY 61
6.2.1 Switching Algorithm
The main purpose of the Eco Switch is to provide grid or renewable supply to the load in a
dynamic way so that the loads are not interrupted. This is done via a switching algorithm
described in this section.
Before going into the detailed algorithm of switching between supplies, the approach is
briefly looked at using inductive load as an example. At the start of the operation, the
Eco Switch will turn on T1 and R1. This is done by sending a 5VDC pulse from the
microcontroller pin to the optocoupler. The resulting load voltage and current is shown
in Figure 6.5. It is assumed that the load current and voltage is out of phase by 90.
It should be noted that if the triggering pulse is removed (0Vdc), the current will keep
flowing until it reaches the zero crossover.
Figure 6.5 Grid voltage supplied to an inductive load(designed by author)
The alternative supply shown in Figure 6.6 is assumed to be out of phase from the grid
supply. At switch over, the triggering pulse for T2 and R2 are fired at the same point on
the renewable voltage waveform as it was last switched off on the grid supply waveform.
In this case, it is the point where the voltage is at its positive peak. If the transition of
switching is done correctly, the load current should resemble a waveform shown in Figure
6.7. The delay between supplies to the load can have a period of 20ms up to 50ms. Since
most of the loads can withstand this short period where no supply is transferred to the
load during turn on, the algorithm was appropriate for this application.
The flowchart of the algorithm is shown in Figure 6.8. It starts off assuming that the
Eco Switch has already turned on T1 and R1, and at it has been signalled by the master
controller to make the transition to turn on T2 and R2. Then the algorithm calls for the
two safety checks mentioned in Section 4.3.1.
The current check reads values of the load current using ADC of the microcontroller.
Consecutive values are compared to determine whether it is increasing, decreasing or
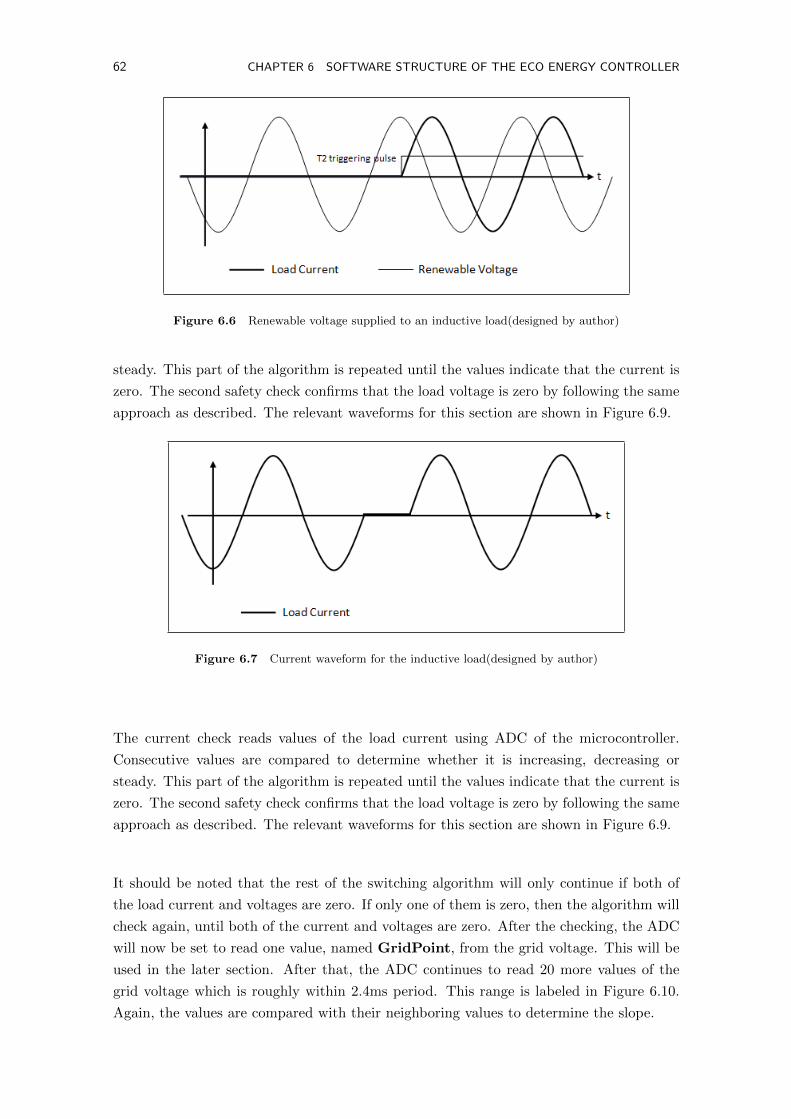
62 CHAPTER 6 SOFTWARE STRUCTURE OF THE ECO ENERGY CONTROLLER
Figure 6.6 Renewable voltage supplied to an inductive load(designed by author)
steady. This part of the algorithm is repeated until the values indicate that the current is
zero. The second safety check confirms that the load voltage is zero by following the same
approach as described. The relevant waveforms for this section are shown in Figure 6.9.
Figure 6.7 Current waveform for the inductive load(designed by author)
The current check reads values of the load current using ADC of the microcontroller.
Consecutive values are compared to determine whether it is increasing, decreasing or
steady. This part of the algorithm is repeated until the values indicate that the current is
zero. The second safety check confirms that the load voltage is zero by following the same
approach as described. The relevant waveforms for this section are shown in Figure 6.9.
It should be noted that the rest of the switching algorithm will only continue if both of
the load current and voltages are zero. If only one of them is zero, then the algorithm will
check again, until both of the current and voltages are zero. After the checking, the ADC
will now be set to read one value, named GridPoint, from the grid voltage. This will be
used in the later section. After that, the ADC continues to read 20 more values of the
grid voltage which is roughly within 2.4ms period. This range is labeled in Figure 6.10.
Again, the values are compared with their neighboring values to determine the slope.
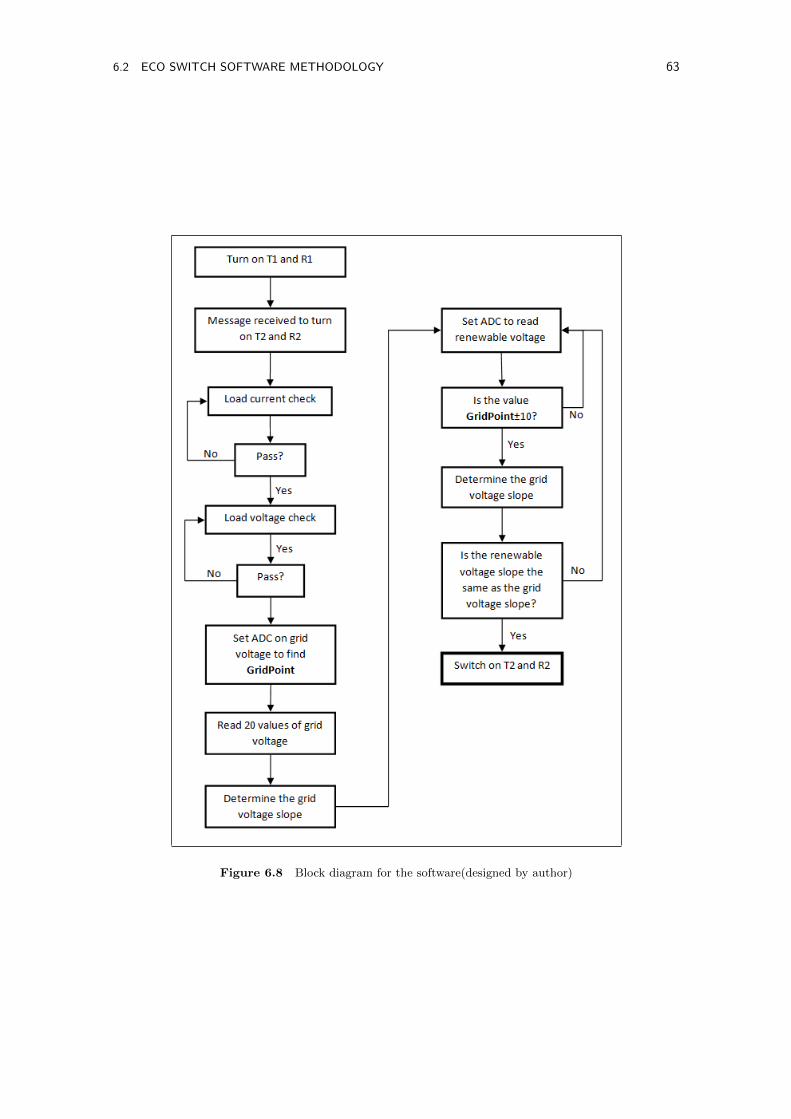
6.2 ECO SWITCH SOFTWARE METHODOLOGY 63
Figure 6.8 Block diagram for the software(designed by author)
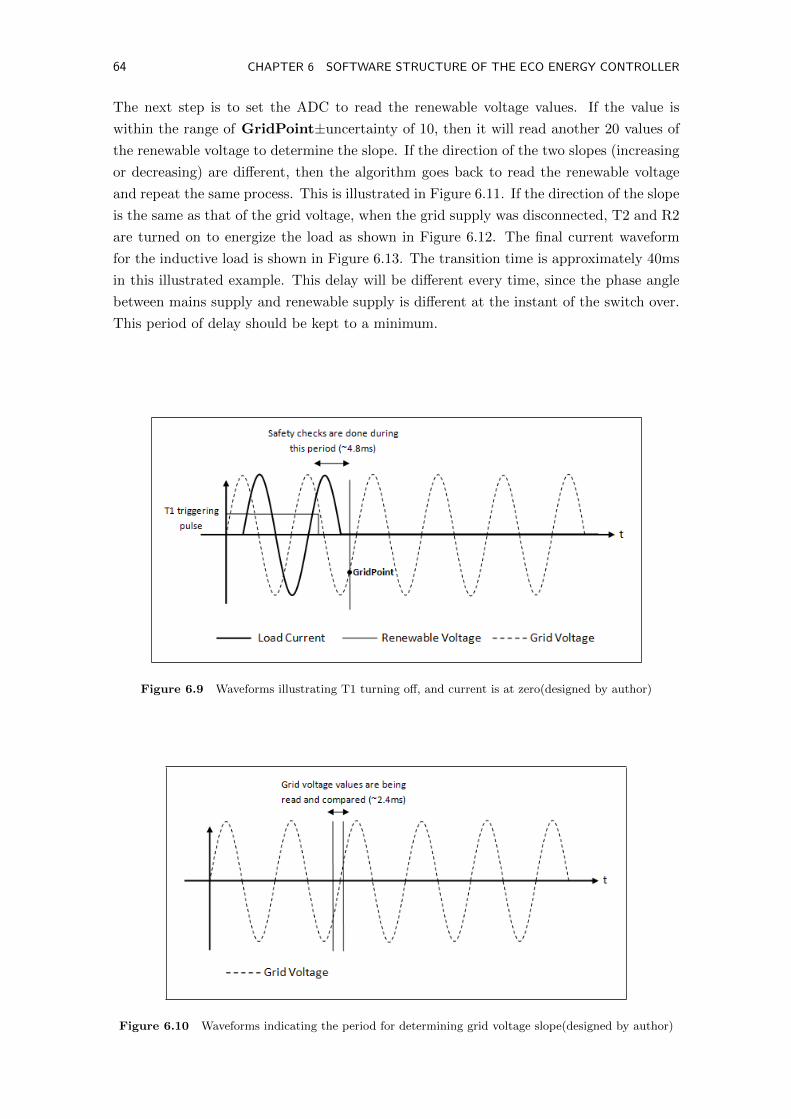
64 CHAPTER 6 SOFTWARE STRUCTURE OF THE ECO ENERGY CONTROLLER
The next step is to set the ADC to read the renewable voltage values. If the value is
within the range of GridPoint±uncertainty of 10, then it will read another 20 values of
the renewable voltage to determine the slope. If the direction of the two slopes (increasing
or decreasing) are different, then the algorithm goes back to read the renewable voltage
and repeat the same process. This is illustrated in Figure 6.11. If the direction of the slope
is the same as that of the grid voltage, when the grid supply was disconnected, T2 and R2
are turned on to energize the load as shown in Figure 6.12. The final current waveform
for the inductive load is shown in Figure 6.13. The transition time is approximately 40ms
in this illustrated example. This delay will be different every time, since the phase angle
between mains supply and renewable supply is different at the instant of the switch over.
This period of delay should be kept to a minimum.
Figure 6.9 Waveforms illustrating T1 turning off, and current is at zero(designed by author)
Figure 6.10 Waveforms indicating the period for determining grid voltage slope(designed by author)
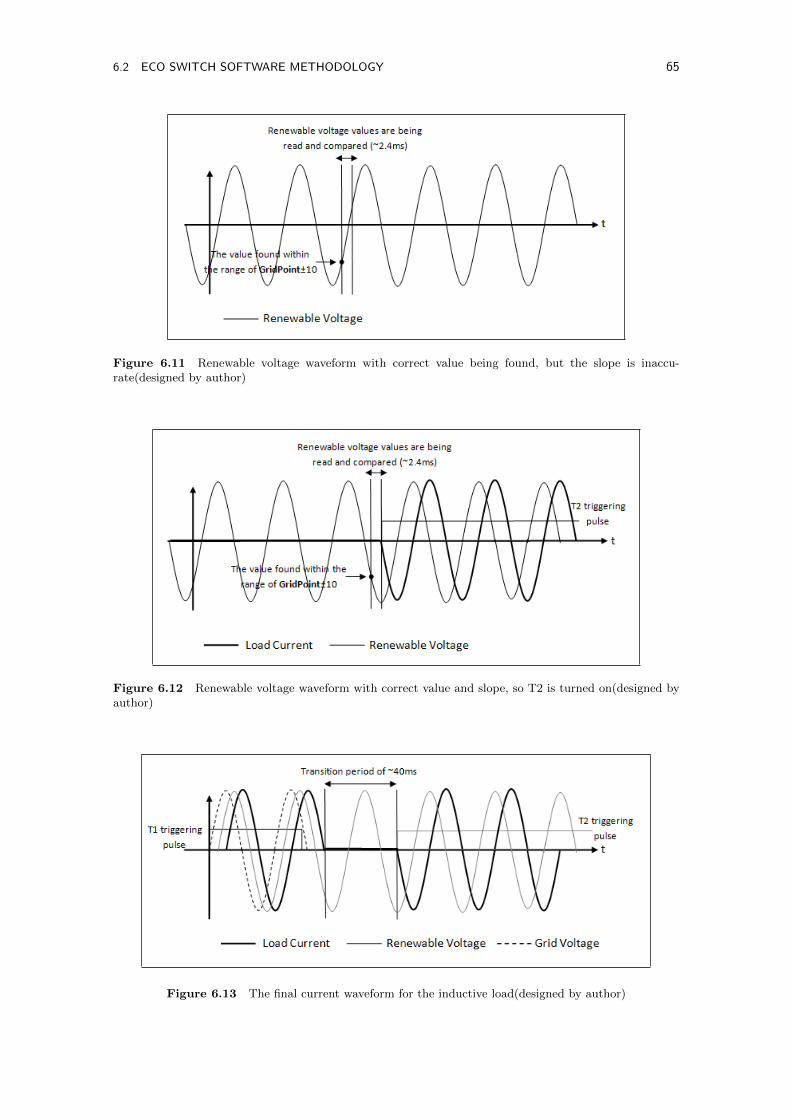
6.2 ECO SWITCH SOFTWARE METHODOLOGY 65
Figure 6.11 Renewable voltage waveform with correct value being found, but the slope is inaccu-rate(designed by author)
Figure 6.12 Renewable voltage waveform with correct value and slope, so T2 is turned on(designed byauthor)
Figure 6.13 The final current waveform for the inductive load(designed by author)
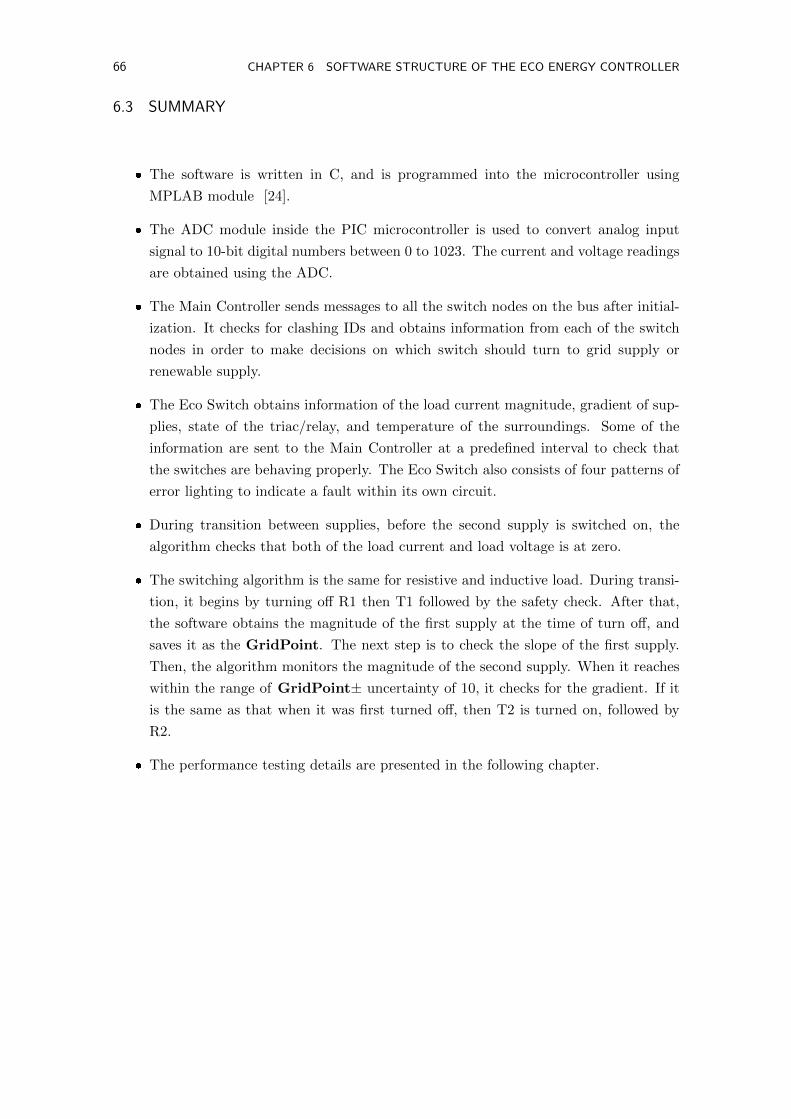
66 CHAPTER 6 SOFTWARE STRUCTURE OF THE ECO ENERGY CONTROLLER
6.3 SUMMARY
The software is written in C, and is programmed into the microcontroller using
MPLAB module [24].
The ADC module inside the PIC microcontroller is used to convert analog input
signal to 10-bit digital numbers between 0 to 1023. The current and voltage readings
are obtained using the ADC.
The Main Controller sends messages to all the switch nodes on the bus after initial-
ization. It checks for clashing IDs and obtains information from each of the switch
nodes in order to make decisions on which switch should turn to grid supply or
renewable supply.
The Eco Switch obtains information of the load current magnitude, gradient of sup-
plies, state of the triac/relay, and temperature of the surroundings. Some of the
information are sent to the Main Controller at a predefined interval to check that
the switches are behaving properly. The Eco Switch also consists of four patterns of
error lighting to indicate a fault within its own circuit.
During transition between supplies, before the second supply is switched on, the
algorithm checks that both of the load current and load voltage is at zero.
The switching algorithm is the same for resistive and inductive load. During transi-
tion, it begins by turning off R1 then T1 followed by the safety check. After that,
the software obtains the magnitude of the first supply at the time of turn off, and
saves it as the GridPoint. The next step is to check the slope of the first supply.
Then, the algorithm monitors the magnitude of the second supply. When it reaches
within the range of GridPoint± uncertainty of 10, it checks for the gradient. If it
is the same as that when it was first turned off, then T2 is turned on, followed by
R2.
The performance testing details are presented in the following chapter.

Chapter 7Prototype Performance
Tests were carried out to evaluate the communication and the switching system of the
EEC. This chapter represents the results of tests confirming the correct operation of the
prototype. Waveforms and timing measurements are presented in the following sections.
7.1 CAN COMMUNICATION SYSTEM TESTS
The correct operation of the prototype requires a master controller that is capable of
controlling the independent Eco Switch nodes. Figure 7.1 shows a photograph of the
completed model of EEC. All the Eco Switch nodes are connected to the CAN bus, while
loads have been connected to their specified switch nodes. The types of loads used during
testing are:
1 x 2A Inductive load (27mH)
1 x 4A Resistive load (6 ohm)
3 x 25W incandescent light bulbs
The total power all network nodes consume without operating any of the loads, on standby,
was measured to be 0.65W. Five connectors are used to connect the Eco Switch nodes onto
the CAN bus network, while the sixth one is connected to the Master controller. Five other
connectors are also connected to the switch nodes so that if the data from the independent

68 CHAPTER 7 PROTOTYPE PERFORMANCE
boards needs to be checked, it can be displayed on the Hyper Terminal screen on the
computer.
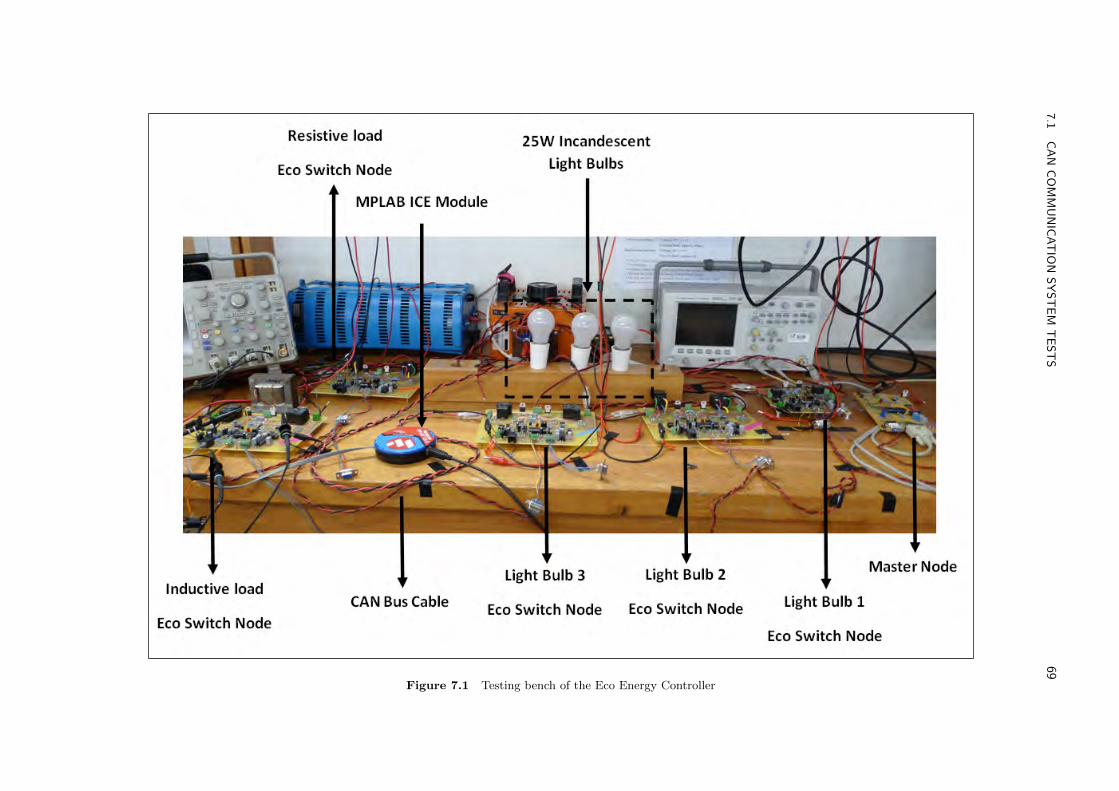
7.1
CAN
COMMUNICATIO
NSYSTEM
TESTS
69
Figure 7.1 Testing bench of the Eco Energy Controller

70 CHAPTER 7 PROTOTYPE PERFORMANCE
The master controller is placed at one end of the bus, followed by the 6Ω resistive load,
24mH inductive load and three light bulbs. The loads do not have to be placed in that
order since there are no restrictions on where the switch nodes are connected along the
bus.
The microcontroller can recognize the difference between light bulb loads and induc-
tive/resistive loads. This is done by obtaining the current magnitude and determines
whether the current is less than a certain limit. It is found that when current is zero at
2.5Vdc, the ADC hexadecimal value is around 652. A current of 1A has a peak higher
than 700, therefore, if ADC current value is less than 700, the individual Eco Switch will
recognize that it is light bulbs, since the other inductive/resistive loads has current higher
than 1A.
The network was powered by six independent bench power supplies. There are supposed to
be isolated power supplies to power each board, however, this is not included in the proto-
type. The CAN bus is placed around the system boards to resemble the noisy environment
inside the distribution board during the tests.
The remainder of this section examines the waveforms captured and timing measurements
illustrating the correct operation of the switching in Eco Switch boards.
7.2 SWITCHING INCANDESCENT LIGHT BULBS
A well understood problem with incandescent light is flicker. It is a sudden change in
light intensity due to a quick fluctuation in the AC supply voltage. The ideal situation
for switching between supplies for an incandescent light bulb is that the flickering effect
is minimized. In order to achieve that, when the Eco Switch is signaled to make the
transition between supplies, the master controller is programmed to switch off R1 then
T1, and after the safety checks as described in Section 4.3.1, it quickly switches on T2
then R2.
The switching algorithm for light bulbs is different to that of other loads, since it does
not go through the magnitude and slope checking process as described in Chapter 6. The
reason being the current for a 25W incandescent running on 230Vac is 0.1A, is too small
to be detected by the ADC in the microcontroller, therefore the point-on-wave method
described in Section 4.4.3.1 cannot be used. Also, since it does not matter where T2
and R2 is turned on at a certain point on the voltage supply waveform, the programmed
algorithm is suitable. The resulting waveform is shown in Figure 7.2. The transition

7.3 SWITCHING RESISTIVE LOAD 71
between supplies is about 7ms. The switching was successful, since this 7ms period is
barely noticeable to the human eye.
Figure 7.2 Triac trigger waveforms(Time Scale: 5ms/div)
7.3 SWITCHING RESISTIVE LOAD
The switching algorithm described in Section 4.4.3.1 is also applied to resistive loads.
Although it does not matter when T2 is turned on with respect to the renewable voltage
supply, the same algorithm is used for simplicity. Figure 7.3 illustrates a 5A current
waveform for switching a 6Ω resistive load. It shows R1 is first turned off, followed by T1
1ms later. The switching priority was explained in Section 4.4.5. In the rest of the section,
only triac triggering pulses are shown, since triacs are last switched off, and first switched
on.
Figure 7.3 Resistive load current and triggering pulses(Time Scale: 20ms/div)
Figure 7.4 shows similar waveforms. The second supply which represents the renewable
source, however, is 1V larger than the first supply. As a result, the current magnitude is
slightly larger. Here, only triac triggering pulses are shown. Note that when T1 is turned
off, the current flows until the next zero crossing.
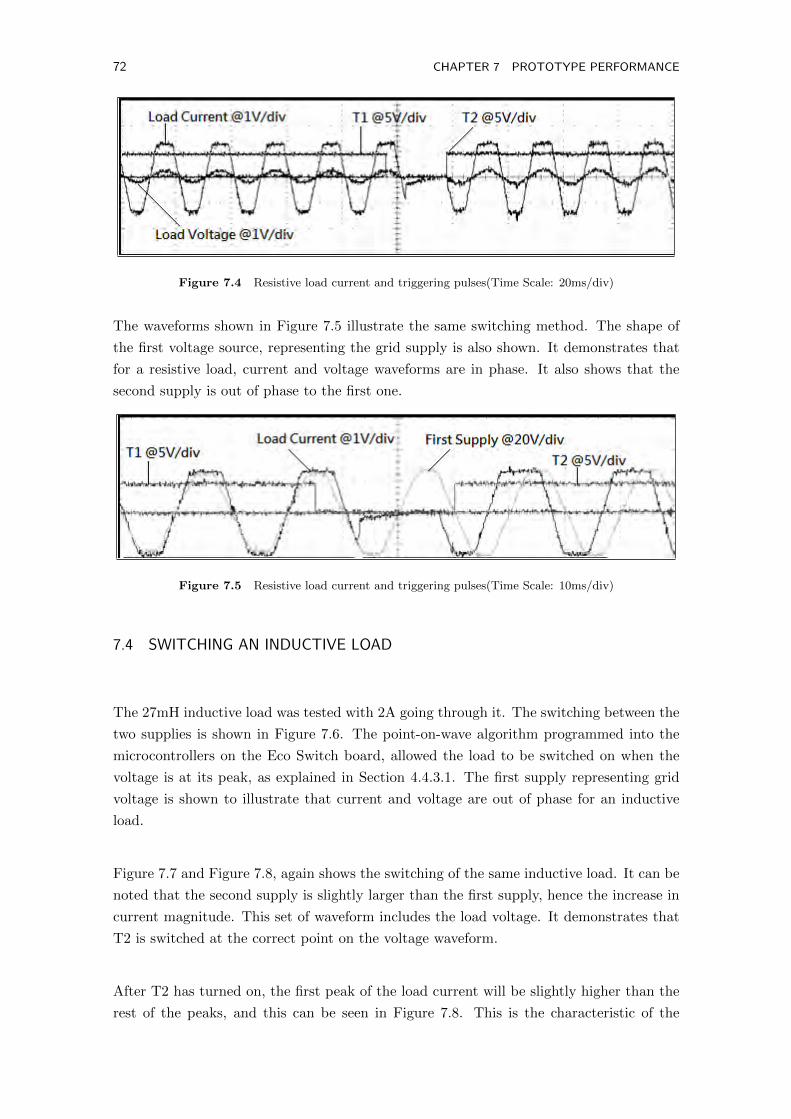
72 CHAPTER 7 PROTOTYPE PERFORMANCE
Figure 7.4 Resistive load current and triggering pulses(Time Scale: 20ms/div)
The waveforms shown in Figure 7.5 illustrate the same switching method. The shape of
the first voltage source, representing the grid supply is also shown. It demonstrates that
for a resistive load, current and voltage waveforms are in phase. It also shows that the
second supply is out of phase to the first one.
Figure 7.5 Resistive load current and triggering pulses(Time Scale: 10ms/div)
7.4 SWITCHING AN INDUCTIVE LOAD
The 27mH inductive load was tested with 2A going through it. The switching between the
two supplies is shown in Figure 7.6. The point-on-wave algorithm programmed into the
microcontrollers on the Eco Switch board, allowed the load to be switched on when the
voltage is at its peak, as explained in Section 4.4.3.1. The first supply representing grid
voltage is shown to illustrate that current and voltage are out of phase for an inductive
load.
Figure 7.7 and Figure 7.8, again shows the switching of the same inductive load. It can be
noted that the second supply is slightly larger than the first supply, hence the increase in
current magnitude. This set of waveform includes the load voltage. It demonstrates that
T2 is switched at the correct point on the voltage waveform.
After T2 has turned on, the first peak of the load current will be slightly higher than the
rest of the peaks, and this can be seen in Figure 7.8. This is the characteristic of the

7.5 CAN COMMUNICATION TEST 73
magnetizing current for a transformer when it is first turned on.
Figure 7.6 Inductive load current and triggering pulses(Time Scale: 20ms/div)
Figure 7.7 Inductive load current and triggering pulses(Time Scale: 20ms/div)
Figure 7.8 Inductive load current and triggering pulses(Time Scale: 20ms/div)
7.5 CAN COMMUNICATION TEST
The method of checking whether the communication system is correct is to send the
information to the Hyper Terminal screen via cable. An example of this is shown in
Figure 7.9. The left hand side shows the Hyper Terminal screen for the master board,
whereas the right hand side is for the Eco Switch. It should be noted that there is only
one screen for five Eco Switches, therefore only information from one switch can be seen
at a time.

74 CHAPTER 7 PROTOTYPE PERFORMANCE
The CAN module supports various data frame types. For the EEC system, the ’standard
data frame’ is used. This type allows a maximum of 16 nodes (42 = 16) connected to the
bus. The IDs for these switch nodes are set in two ways so that they can be physically
identified by the DIP switch, and recognized as hexadecimal address in the code. The
configuration on the DIP switch for each ID and the load connected to it is shown in Table
7.1. The DIP switches ID ranges from 0000 to 1111. The first hexadecimal ID is 0×00
and the last one is 0×F0. The ’extended data frame’ can be used if more switches need
to be connected to the bus. The limit for this type of data frame is 36 nodes (62 = 36).
DIP ID Hexadecimal Address Load Type
0000 0×0 Resistive (6Ω)0001 0×10 Inductive (24mH)0010 0×20 Light Bulb (25W)0011 0×30 Light Bulb (25W)0100 0×40 Light Bulb (25W)
Table 7.1 DIP switch ID and the hexadecimal values programmed in the microcontroller

7.5
CAN
COMMUNICATIO
NTEST
75
Figure 7.9 Hyper Terminal screen for Master Controller and Eco Switch at initialization
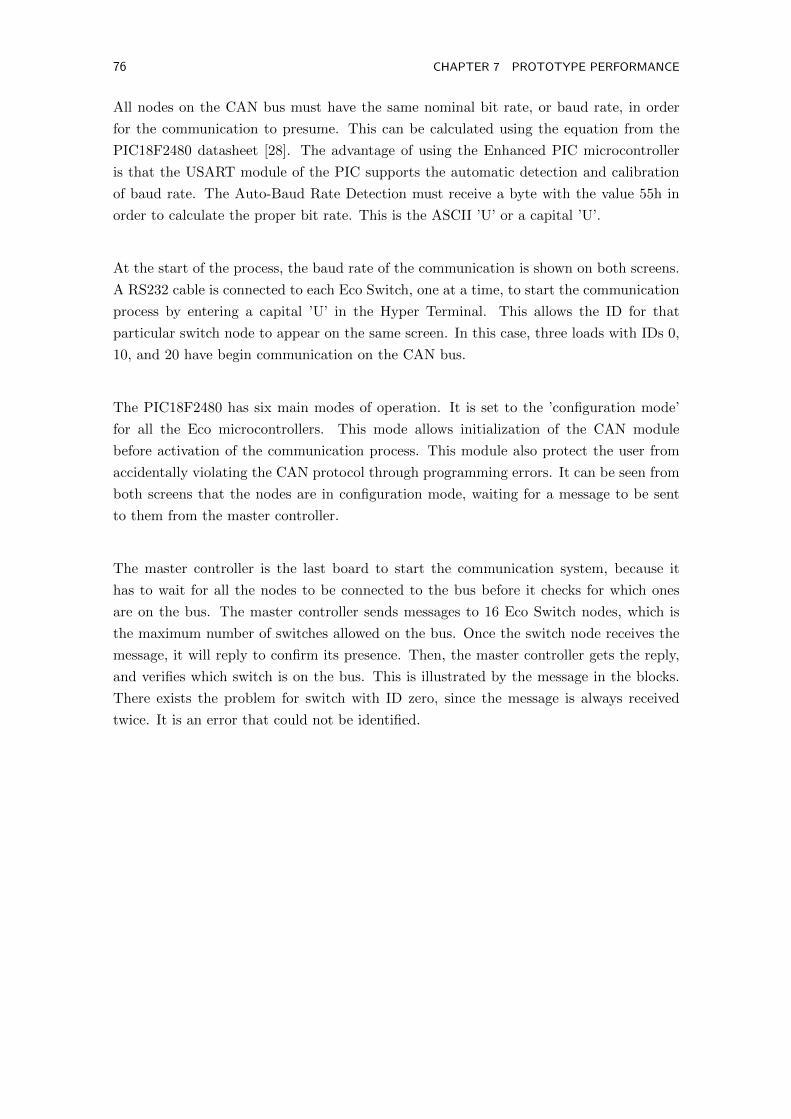
76 CHAPTER 7 PROTOTYPE PERFORMANCE
All nodes on the CAN bus must have the same nominal bit rate, or baud rate, in order
for the communication to presume. This can be calculated using the equation from the
PIC18F2480 datasheet [28]. The advantage of using the Enhanced PIC microcontroller
is that the USART module of the PIC supports the automatic detection and calibration
of baud rate. The Auto-Baud Rate Detection must receive a byte with the value 55h in
order to calculate the proper bit rate. This is the ASCII ’U’ or a capital ’U’.
At the start of the process, the baud rate of the communication is shown on both screens.
A RS232 cable is connected to each Eco Switch, one at a time, to start the communication
process by entering a capital ’U’ in the Hyper Terminal. This allows the ID for that
particular switch node to appear on the same screen. In this case, three loads with IDs 0,
10, and 20 have begin communication on the CAN bus.
The PIC18F2480 has six main modes of operation. It is set to the ’configuration mode’
for all the Eco microcontrollers. This mode allows initialization of the CAN module
before activation of the communication process. This module also protect the user from
accidentally violating the CAN protocol through programming errors. It can be seen from
both screens that the nodes are in configuration mode, waiting for a message to be sent
to them from the master controller.
The master controller is the last board to start the communication system, because it
has to wait for all the nodes to be connected to the bus before it checks for which ones
are on the bus. The master controller sends messages to 16 Eco Switch nodes, which is
the maximum number of switches allowed on the bus. Once the switch node receives the
message, it will reply to confirm its presence. Then, the master controller gets the reply,
and verifies which switch is on the bus. This is illustrated by the message in the blocks.
There exists the problem for switch with ID zero, since the message is always received
twice. It is an error that could not be identified.
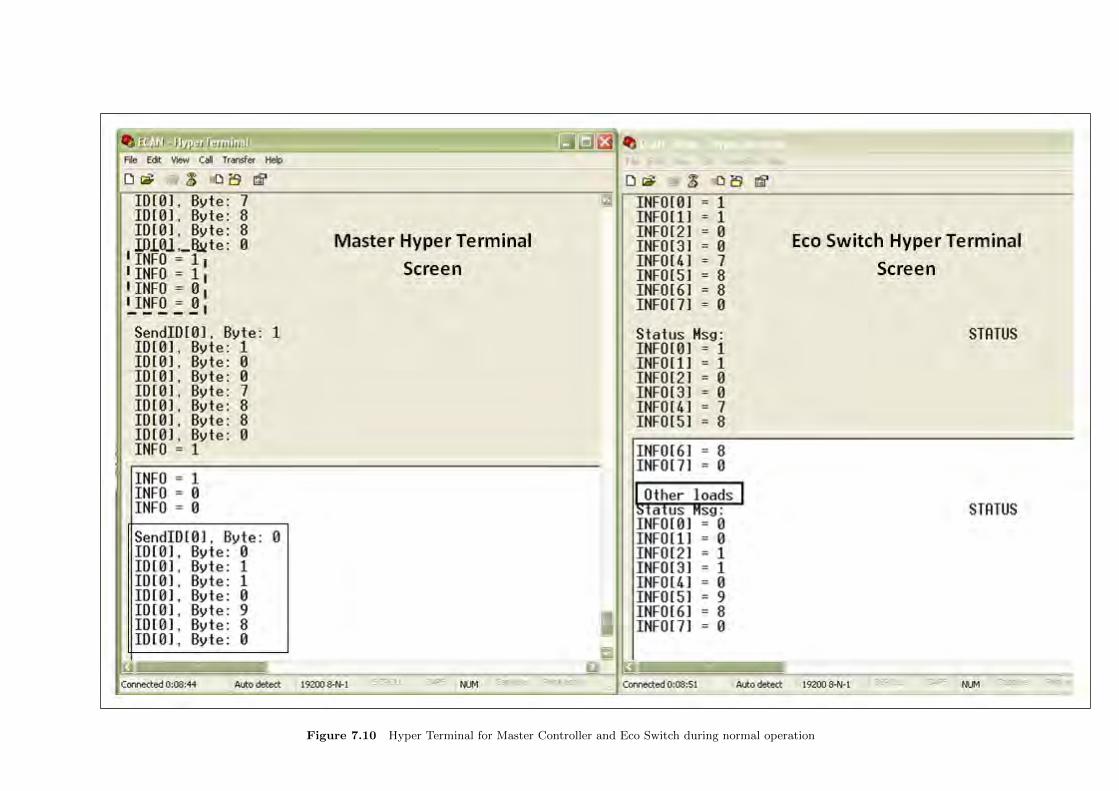
7.5
CAN
COMMUNICATIO
NTEST
77
Figure 7.10 Hyper Terminal for Master Controller and Eco Switch during normal operation
78 CHAPTER 7 PROTOTYPE PERFORMANCE
The ’Send’ on the left screen in Figure 7.10 indicates a STATUS message has been sent
to each of the Eco Switches. The rest of the message in the block, indicates the message
received from each Eco Switches. In this case, since the communication is just between the
master controller and the resistive load with ID zero, the information received has ID[0]
at the front, and the 8-bit message contains information of T1, T2, R1, R2 and maximum
current as described in Section 6.2. The INFO messages in the dashline block indicates
the status of the triacs and relays in which each of the Eco Switch is suppose to be. This
is checked with the first 4 bits of the STATUS message received from the Eco Switch to
make sure they are behaving properly.
On the Eco Switch screen, an indication that a STATUS message has been received. Again
the 8 bit information from the Eco Switch with resistor load is also shown. The ’Other
loads’ on the screen indicates that a current has been detected, and as mentioned before,
light bulb currents are too small to be detected, therefore the program on the Eco Switch
jumps to the point-on-wave switching algorithm. When the transition between supplies
was successful, the controller continues to send a STATUS message to the switch node. It
should be noted that the 8-bit message now indicates that T1, R1 are off, and T2, R2 are
on.
7.6 SUMMARY
Three loads are tested out during the prototype testing. They are 6Ω resistive load,
24mH inductive load, and three 25W incandescent light bulbs.
The switching algorithm is applied to all the loads. It is found that the transition
between supplies was successful and no instantaneous current was found at turn on.
The transition between supplies for light bulb was kept under 10ms. As for the
inductive and resistive load, the transition period was kept under 40ms.
The CAN communication between nodes was also successful. Information from both
Main Controller and Eco Switch nodes are displayed on the Hyper Terminal screen
via RS232 cable.
The following chapter sums up the development of the EEC, and describes the future
work associated with it.
Chapter 8Future Development and Conclusion
8.1 FUTURE DEVELOPMENT
The various designs of renewable energy controller on the market allow users to energize
their domestic loads using the energy generated locally. A prototype which allows the
energy controller to power the loads by dynamically switching between renewable and grid
supply, depending on the amount of renewable available at the instant was constructed and
tested. The prototype consists of a Main Controller(master board) and six Eco Switches
(slave boards). All the boards are connected to the CAN bus, which is a twisted pair of
wires, so that messages can be transmitted and received. The next stage of the system
development is to complete the following:
The Main Controller should contain functions such as battery state monitoring,
daylight saving start/finish options, and serial interface which allows the user to
monitor the state of the EEC on their computer.
Test power electronic loads to test whether the same switching algorithm can still
be applied.
Change the PIC to 40 pin microcontroller instead of 28 pins so that more I/O pins
can be made available for future usage.
Change the message frame to Extended Frame in the software so that more than 16
Eco Switches can be connected to the system if needed.
Build local power supplies into each Eco Switch.
Miniaturise circuit to fit into suitable enclosure.
80 CHAPTER 8 FUTURE DEVELOPMENT AND CONCLUSION
8.2 CONCLUSION
This thesis documents the design, implementation and test results of a EEC. It is a system
that allows renewable energy generated locally to be supplied to difference loads at various
times during the day, depending on the amount of renewable that is available. The loads
that can not be supplied by the renewable energy are powered by the grid supply. The
type of loads tested are 6Ω resistive load using 30Vac, 24mH inductive load using 30Vac
and three 25W incandescent light bulbs using 230Vac. The communication via CAN bus
between boards, the turning on and off of triacs and relays, the transition between two
supplies to the load and the error messages have been tested successfully.
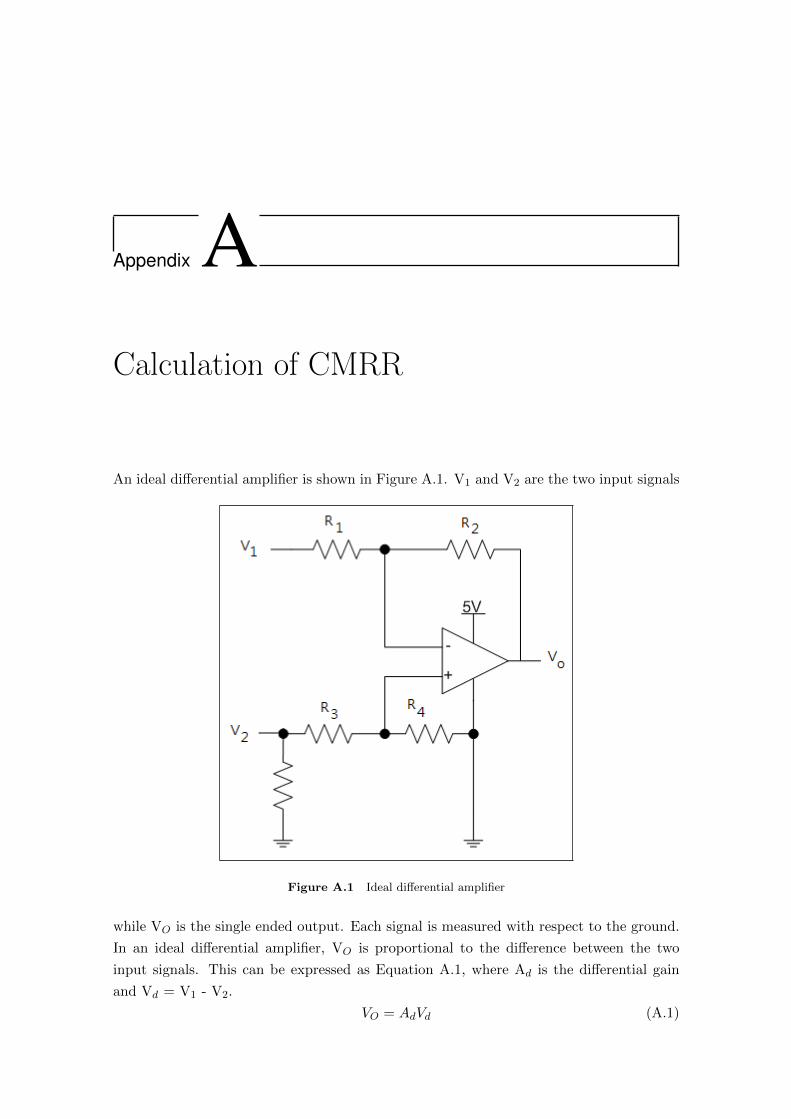
Appendix ACalculation of CMRR
An ideal differential amplifier is shown in Figure A.1. V1 and V2 are the two input signals
Figure A.1 Ideal differential amplifier
while VO is the single ended output. Each signal is measured with respect to the ground.
In an ideal differential amplifier, VO is proportional to the difference between the two
input signals. This can be expressed as Equation A.1, where Ad is the differential gain
and Vd = V1 - V2.
VO = AdVd (A.1)

82 APPENDIX A CALCULATION OF CMRR
Suppose the relative uncertainty in the resistance value Ri (i = 1· · · 4) is δi, so Ri =Rni(1+δi),
with Rni the nominal value of Ri. It can also be assumed Rn1 = Rn3, and Rn2 = Rn4, and .
Rearranging Equation 1 will give the differential gain. For a pure differential mode signal,
V1 = -V2 = 0.5Vd, the transfer can be written as Equation A.2 in terms of resistance.
Ad =VOVd≈ −Rn2
Rn1(A.2)
As mentioned in section 5.3.2, the practical differential amplifier not only depends on the
difference voltage but also depends on the average common level of the two inputs. Such
an average level of the two input signals is called common mode signal Vc.
Vc =V1V2
2(A.3)
The differential amplifier produces the output voltage proportional to Vc also. The gain
with which it amplifies the common mode signal to produce the output is called common
mode gain Ac. This expression is shown in Equation A.4.
VO = AcVc (A.4)
According to Equation A.3, for a common mode input signal, V1 = V2 = Vc, the transfer
for Ac can be shown in Equation A.5.
Ac =VOVc
=R1R4 −R2R3
R1(R3 +R4)≈ (δ1 + δ4 − δ2 − δ3) (A.5)
Since the sign of δi is not known, it is written as |δi| . The rejection ratio with resistance
uncertainty taking into account is shown in Equation A.6.
CMRR =1 + R2
R1
Σi |δi|=
1 + 39k3.9k
4× 0.01= 275 (A.6)
References
[1] I J Nagrath and M Gopal. Kyoto Protocol. Available at
http://en.wikipedia.org/wiki/kyoto protocol, 2010.
[2] Gerry Brownless. New Zealand Energy Data File 2010 Released. Available
at http://www.beehive.govt.nz/release/new+zealand+energy+data+file+2010+re-
leased, 2010.
[3] Assessment of the Future Costs and Performance of So-
lar Photovoltaic Technologies in New Zealand. Available at
http://www.med.govt.nz/upload/67238/PV%20in%20New%20Zealand.pdf, 2009.
[4] A.G.Williamson I.G.Mason, S.C.Page. A 100% Renewable Electricity Genera-
tion System for New Zealand Utilizing Hydro, Wind, Geothermal and Biomass
Resources. Available at http://www.sciencedirect.com/science/article/B6V2W-
4YW9DB0-1/2/5a94e8cc42bd68dcaf2ff543dc875d7a, 2010.
[5] Electricity Generation. Available at http://en.wikipedia.org/wiki/Electri-
city generation, 2010.
[6] Italy’s Energy Sector Finds the Right Mix. Available at http://www.power-
technology.com/features/feature76717/, 2010.
[7] Energy in Japan. Available at http://en.wikipedia.org/wiki/Energy in Japan, 2010.
[8] Energy in Germany. Available at http://en.wikipedia.org/wiki/Energy in Ger-many,
2010.
[9] Status and Prospects for PV in New Zealand. Available at
http://www.med.govt.nz/templates/MultipageDocumentPage40711.aspx
,2010.
[10] Grid-Tied Electrical System. Available at http://en.wikipedia.org/wiki/Grid-
tiedelectricalsystem, 2010.
84 REFERENCES
[11] NZECP 51:2004, ISSN 0114-0663. 2004.
[12] Amendment No. 1 to AS/NZS 3000:2007, Revised Text. Avail-
able at http://www.standards.co.nz/news/Media+archive/June+-
+Oct+09/Wiring+Rules+Standard+Amendment+1+published.htm, 2009.
[13] Controller Area Network. Available at http://en.wikipedia.org/wiki/Con-
troller area network, 2007.
[14] Keith Pazul. Controller Area Network (CAN) Basics. Available at
http://moderncontroltechnology.com/docs/Engineering Topics/CAN/AN-713%
Basics 00713a.pdf, 2002.
[15] The OSI Model. Available at http://www.tutorialsweb.comnetworkingosi-model-
application-layer.htm.
[16] ISO 11898. Available at http://en.wikipedia.org/wiki/ISO 11898, 2010.
[17] Steve Corrigan. Controller Area Network Physical Layer Requirements. Available at
http://www.ti.com/lit/an/slla270/slla270.pdf, 2008.
[18] CAN Bus Practical Bus Length. Available at
http://www.softing.com/home/en/industrial-automation/products/can-bus/more-
can-bus/bit-timing/practical-bus-length.php?navanchor=3010538, 2010.
[19] Roberto Chouhy Leborgne. Voltage Sags: Single event charac-
terisation, system performance and source location. Available at
http://webfiles.portal.chalmers.se/et/PhD/LeborgneRobertoPhD.PDF, 2007.
[20] Dr. Gary L. Johnson. Inductors and Transformers. Available at
http://www.eece.ksu.edu/ gjohnson/tcchap4.pdf, 2001.
[21] Wayne Storr. Full Wave Rectifier. Available at http://www.electronics-
tutorials.ws/diode/diode6.html, 2011.
[22] J.S.Chitode. Power Electronics. Technical Publications, 2009.
[23] Datasheet of K3010P(G) Series. Available at
http://www.datasheetarchive.com/DSA00173770-datasheet.html, 1999.
[24] MPLAB ICD 2. Available at http://www.microchip.com/stellent/idcplg?IdcService=SSGETPAGEnodeId =
1406dDocName = en010046, 2011.
[25] M.M.S.Anand. Electronic Instruments and Instrumentation Technology. PHI Learn-
ing Pvt. Ltd., 2004.
[26] A.P.Godse U.A.Bakshi. Linear Integrated Circuits. Technical Publications, 4th edi-
tion, 2009.

REFERENCES 85
[27] F. van der Heijden M.J. Korsten Paul Regtien, W Otthius. Measurement Science for
Engineers. Kogan Page Science, 2004.
[28] Datasheet of PIC18F2480. Available at http://www.microchip.com, 2004.