Colorado’s Energy Industry Today’s Impact, Tomorrow’s Opportunities

RENEWABLEENERGYMarket & Policy Trendsin IEA Countries
I N T E R N A T I O N A L E N E R G Y A G E N C Y


RENEWABLEENERGYMarket & Policy Trendsin IEA Countries
I N T E R N A T I O N A L E N E R G Y A G E N C Y

© OECD/IEA, 2004
Applications for permission to reproduce or translate all or part of this publication should be made to: Head of Publications Service, OECD
2, rue André-Pascal, 75775 Paris Cedex 16, France.
INTERNATIONAL ENERGY AGENCY9, rue de la Fédération,
75739 Paris Cedex 15, France
The International Energy Agency (IEA) is anautonomous body which was established in November1974 within the framework of the Organisation forEconomic Co-operation and Development (OECD) toimplement an international energy programme.
It carries out a comprehensive programme of energy co-operation among twenty-six* of the OECD’s thirtymember countries. The basic aims of the IEA are:
• to maintain and improve systems for coping with oilsupply disruptions;
• to promote rational energy policies in a global con-text through co-operative relations with non-mem-ber countries, industry and international organisa-tions;
• to operate a permanent information system on theinternational oil market;
• to improve the world’s energy supply and demandstructure by developing alternative energy sourcesand increasing the efficiency of energy use;
• to assist in the integration of environmental andenergy policies.
* IEA member countries: Australia, Austria, Belgium,Canada, the Czech Republic, Denmark, Finland, France,Germany, Greece, Hungary, Ireland, Italy, Japan, the Republicof Korea, Luxembourg, the Netherlands, New Zealand,Norway, Portugal, Spain, Sweden, Switzerland, Turkey, theUnited Kingdom, the United States. The EuropeanCommission also takes part in the work of the IEA.
ORGANISATION FOR ECONOMIC CO-OPERATION
AND DEVELOPMENT
Pursuant to Article 1 of the Convention signed in Parison 14th December 1960, and which came into forceon 30th September 1961, the Organisation forEconomic Co-operation and Development (OECD) shallpromote policies designed:
• to achieve the highest sustainable economic growthand employment and a rising standard of living inmember countries, while maintaining financial sta-bility, and thus to contribute to the development ofthe world economy;
• to contribute to sound economic expansion in mem-ber as well as non-member countries in the processof economic development; and
• to contribute to the expansion of world trade on amultilateral, non-discriminatory basis in accordancewith international obligations.
The original member countries of the OECD are Austria,Belgium, Canada, Denmark, France, Germany, Greece,Iceland, Ireland, Italy, Luxembourg, the Netherlands,Norway, Portugal, Spain, Sweden, Switzerland, Turkey, theUnited Kingdom and the United States. The followingcountries became members subsequently through acces-sion at the dates indicated hereafter: Japan (28th April 1964), Finland (28th January 1969), Australia(7th June 1971), New Zealand (29th May 1973), Mexico (18th May 1994), the Czech Republic (21st December 1995), Hungary (7th May 1996), Poland (22nd November 1996), the Republic of Korea(12th December 1996) and Slovakia (28th September2000). The Commission of the European Communitiestakes part in the work of the OECD (Article 13 of the OECDConvention).

foreword
3
Renewable energy receives a great deal of attention as a possible contributor to solving some of today’senergy challenges. Much of the debate has taken place without sufficient overview information aboutrenewable energy policies and markets. To help fill that gap, Renewable Energy Market and Policy Trendsin IEA Countries provides the best compilation yet of information on renewable energy over the lastthirty years. It includes statistical data on more than 100 specific markets and a collection of almost 400policies and measures that the IEA Member country governments have undertaken in research anddevelopment and to support the market deployment of renewable energy technologies.
The history presented here underscores that each renewable energy technology is unique, demonstratingquite different characteristics, levels of maturity and needs for market success. Hydropower, burning woodfor heat and geothermal energy are the most mature renewable technologies, and mostly compete intoday’s markets without special policy support. They can be cost-competitive where the resource base isstrong and where there is ready access to market the energy produced. Hydropower and geothermalenergy achieved their current market share through a development path that included a substantialgovernmental role, while wood burning has been a traditional energy resource for millennia. Less mature,“new” renewables, including wind power, solar technologies and newer forms of bioenergy, are only nowentering markets, and like other emerging energy technologies, have received governmental support forboth technological development and for market deployment.
RD&D funding has been a longstanding tool of governments to develop technologies with perceived futurebenefits, including renewables. Government-funded RD&D usually is based on the fact that the privatesector, particularly in competitive markets, typically will only invest in technology with foreseeablerevenues. This report clarifies the level of RD&D support provided to renewables by each of the IEAgovernments, in the context of RD&D support to all energy technologies.
To support the market entry of new renewables, many policies have been established in IEA countries tooffset their higher costs and to facilitate the market experience that will result in lower costs in the future.These approaches lead to “market learning”, which is not unique to renewables, but is particularly relevantas these technologies are still quite immature. This study finds that the number of countries that pursuedaggressive policies to encourage deployment of each renewable technology prior to 2000 was quitelimited and the momentum of wind, solar photovoltaics and solar thermal power technologies rests onsignificant investments in just a handful of countries. Nevertheless, these new renewables have shownstrong growth up to 2001 and have achieved substantial cost reductions as a result of their marketexperience, indicating the success of government intervention. The policy context is changing, however,as many new policies have been instituted between 2000 and 2003, increasing the number of countrieswith supportive policy conditions. These developments are too recent for the impacts to be seen in ourstatistics.
If these policies should prove to be successful in stimulating markets, new renewables present severalchallenges to integration into conventional markets and technical infrastructures. For example, theintertwined problems of intermittency and impacts on grid reliability present two of the strongestchallenges to wind energy’s future prospects. Because utilities must supply power in close balance todemand and within a narrow range of power quality, intermittency will limit the amount of wind that canbe integrated into the grid, although it is not yet clear at what level. Photovoltaic provides anotherexample, where highly dispersed generation poses new questions about distributed generation modalitiesin utilities. Finally, the incorporation of biofuels into the product stream of the fossil fuel industry and into
Foreword

4
Part 1: Overview
the systems that utilise fossil fuels also present challenges, due to the different chemistries of the fuels, aswell as the different industrial structure of fuel production. These challenges, and the national experienceof dealing with them, are reported in the country profiles contained in this study.
In some regards, renewable energy market deployment incentives are a substitute for the costs ofexternalities. IEA governments often cite future energy security and environmental benefits in theestablishment of renewable energy policies. This highlights the challenge for energy policy-makers whoare balancing today’s costs with tomorrow’s needs in more liberalised markets – how much support forrenewables is justified and for how long should it be provided? New renewables are not the only set oftechnologies on the pathway to the market; policy support afforded to them may be an indication ofappropriate support levels for other innovative technologies such as fuel cells, hydrogen, clean coaltechnologies, and many others that will need governmental support to gain entry and experience inenergy markets.
This study also underscores a major challenge to IEA governments: adequate data on early marketdevelopment, technology cost information and details of policy budgets are extremely difficult to obtain.Our ability to conduct analysis of the cost-effectiveness of market deployment policies rests on theavailability of accurate and detailed information. Such information is not yet available for renewables, andalthough we are well on the way to compiling it, this is why cost and budget details are not given in thisstudy. This same issue is pertinent to other emerging technologies, and we call on the Membergovernments to increase their efforts at recording and making this detailed information available. Greatertransparency will allow rational assessment of the cost-effectiveness of policies.
Renewable energy technologies are not the only options to be considered for solving today andtomorrow’s energy challenges. In the end, renewables must achieve cost-competitiveness with fossil fueland nuclear technologies and markets should work with minimal extraneous influence, yet taking intoaccount external costs. Like RD&D, market deployment incentives have been provided in the past foralmost all major energy technologies and are likely to be employed in the future. The challenge is todetermine what level and length of support is appropriate to ensure strategic options that are important tobuild a secure and sustainable energy system. This includes options for a host of energy challenges,including energy access for the world’s poor in developing countries, as well as providing secure, cleanenergy supply for more industrialised regions.
Renewable Energy Market and Policy Trends in IEA Countries details the policy and market histories ofrenewables over the past thirty years to record our efforts to develop alternative energy resources toimprove the world’s energy supply and demand structure. It is intended to inform the discussion aboutenergy options and the further improvement of policies to enhance the performance of the energy sectortoward the three pillars of energy policy – energy security, economic growth, and environmental quality.
This work is published under my authority as Executive Director of the IEA and does not necessarily reflectthe views of the IEA Member countries.
Claude MandilExecutive Director

acknowledgements
5
This study was prepared by the Renewable Energy Unit (REU) of the International Energy Agency (IEA) in co-operation with other divisions of the IEA. Members of the REU who were responsible for producing this studyare Teresa Malyshev, Debra Justus, Lily Panyacosit Alisse and Timur Gül. REU team members Piotr Tulej andJane Barbière made substantial and critical contributions. Rick Sellers supervised the project.
This report relied heavily on the work of the IEA Energy Statistics Division, headed by Jean-Yves Garnier.Special thanks to Larry Metzroth, Olivier Lavagne d'Ortigue, Ana Belen Padilla and Karen Treanton. Theproduction assistance from the Public Information Office, particularly Muriel Custodio, Corinne Hayworthand Bertrand Sadin added significantly to the material presented. Many thanks go to Jane Rubery, GillianBalitrand, Guyon Knight, Carrie Pottinger and Alison Sadin for assistance with manuscript preparation.
Guidance, as well as substantive input, was provided by Antonio Pflüger, Director of the Energy TechnologyCollaboration Division and Marianne Haug, Director of the Office of Energy Efficiency, Technology andResearch and Development.
The work of the Renewable Energy Unit was supported and guided by members of the Renewable EnergyWorking Party of the IEA, especially including: Morgan Bazilian (Ireland), Rita Biacs (Hungary), Gerhard Faninger (Austria), George Giannakidis (Greece),William Gillett (EC), Norbert Gorißen (Germany), Willen van der Heul (Netherlands), Andreas Indinger(Austria), Koichi Inoue (Japan), David Irving (UK), Antonio Joyce (Portugal), Christophe Jurczak (France),Jerri Laine (Finland), Joergen Lemming (Denmark), Gilles Mercier (Canada), Richard Moorer (US), BobPegler (Australia), Trygve Riis (Norway), Hans Ulrich Schärer (Switzerland), Ralph Sims (New Zealand),Fernando Sánchez Sudón (Spain).
Other government experts provided valuable assistance, including: Shimpei Ago (Japan), Félix Avia (Spain), Sam Baldwin (US), Jean-Louis Bal (France), Luciano Barra (Italy),Carlo Bartocci (Luxembourg), Antonin Beran (Czech Republic), Dieter Boehme (Germany), FerencBohóczky (Hungary), Kyung-Jin Boo (Korea), Stan Calvert (US), Umbero Ciorba (Italy), Roman Cizek(Czech Republic), Viktória Csorba (Hungary), Lisa Dignard (Canada), Bob Dixon (US), Claude Faucher(Canada), John Ferrell (US), Raymond Fortuna (US), Jean-Christophe Füeg (Switzerland), Mario Gamberale(Italy), Judith Gelbman (Canada), Peter Goldman (US), Chul-Hee Han (Korea), Nobuyuki Hara (Japan),Carlo Hastert (Luxembourg), Marco Hoffmann (Luxembourg), Mashiro Ito (Japan), Patrick Jung(Luxembourg), Ravi Khosla (UK), Shigura Kimura (Japan), Hiroki Kudo (Japan), Ole Langniss (Germany),Matteo Leonardi (Italy), Peter Lund (Finland), Elvira Lutter (Austria), Kazuhiro Matsuda (Japan),Gabriel Michaux (Belgium), Miroslav Stary (Czech Republic), Yasuhito Nagami (Japan), Yoshiaki Nakamura(Japan), Jean Offermann (Luxembourg), Tomoyuki Okumura (Japan), Esa Peltola (Finland), Don Richardson(US), Peter Rohlin (Sweden),Yuki Sadamitsu (Japan), Kai Sipilä (Finland), Frithjof Staiss (Germany),Raymond Sutula (US), Fumiyo Takahashi (Japan), Kazumi Takahashi (Japan), Michel Trauffler (Luxembourg),Andreas Veigl (Austria), Maria Virdis (Italy), Hidenori Yuguchi (Japan).
Renewable energy experts provided valuable input, including: Paolo Frankl (Italy), Reinhard Haas (Austria), Paul Komor (US), David Mooney (US), Blair Swezey (US).
This report was made possible by generous support from Member governments. Particular thanks to theGovernment of Germany and its Federal Ministry for the Environment, Nature Conservation and NuclearSafety including Norbert Gorißen, Martin Schöpe, Daniel Argyropoulos; the Government of Ireland andits Sustainable Energy Ireland including Morgan Bazilian; and the Government of the United Kingdom andits Department for Trade and Industry, particularly David Irving.
Acknowledgements


Table of contents
7
Foreword . . . . . . . . . . . . . . . . . . . . . . . . . . . . . . . . . . . . . . . . . . . . . . . . . . . . . . . . . . . . . . . . . . . . . . . . . . . . . . . . . . . 3
Acknowledgements . . . . . . . . . . . . . . . . . . . . . . . . . . . . . . . . . . . . . . . . . . . . . . . . . . . . . . . . . . . . . . . . . . . . . . 5
Table of Contents . . . . . . . . . . . . . . . . . . . . . . . . . . . . . . . . . . . . . . . . . . . . . . . . . . . . . . . . . . . . . . . . . . . . . . . . . 7
List of Figures and Tables . . . . . . . . . . . . . . . . . . . . . . . . . . . . . . . . . . . . . . . . . . . . . . . . . . . . . . . . . . . . . . . 19
Part 1 . . . . . . . . . . . . . . . . . . . . . . . . . . . . . . . . . . . . . . . . . . . . . . . . . . . . . . . . . . . . . . . . . . . . . . . . . . . . . . . . . . . . . 19
Part 2 . . . . . . . . . . . . . . . . . . . . . . . . . . . . . . . . . . . . . . . . . . . . . . . . . . . . . . . . . . . . . . . . . . . . . . . . . . . . . . . . . . . . . 20
Part 1 - Overview 35
Introduction . . . . . . . . . . . . . . . . . . . . . . . . . . . . . . . . . . . . . . . . . . . . . . . . . . . . . . . . . . . . . . . . . . . . . . . . . . . . . . . 37
Chapter 1: Renewables in IEA Energy Supply . . . . . . . . . . . . . . . . . . . . . . . . . . . . . . . . . . . . . . 41
Renewables in Total Primary Energy Supply . . . . . . . . . . . . . . . . . . . . . . . . . . . . . . . . . . . . . . . . . . . . . 42Renewable Energy Supply – Overall Trends . . . . . . . . . . . . . . . . . . . . . . . . . . . . . . . . . . . . . . . . . . . . . 44Renewable Energy Supply – Trends: 1990 to 2001 . . . . . . . . . . . . . . . . . . . . . . . . . . . . . . . . . . . . . . 45The Mix of Renewables in Primary Energy Supply . . . . . . . . . . . . . . . . . . . . . . . . . . . . . . . . . . . . . . 45Renewables in Electricity Supply . . . . . . . . . . . . . . . . . . . . . . . . . . . . . . . . . . . . . . . . . . . . . . . . . . . . . . . . 48
Chapter 2: Research, Development and Demonstration Trends . . . . . . . . . . . . . . . . 53
Government RD&D Expenditures in IEA Member Countries . . . . . . . . . . . . . . . . . . . . . . . . . . . 54Government Renewable Energy RD&D Budgets . . . . . . . . . . . . . . . . . . . . . . . . . . . . . . . . . . . . . . . . 55Renewables RD&D and the Private Sector . . . . . . . . . . . . . . . . . . . . . . . . . . . . . . . . . . . . . . . . . . . . . . 57
Chapter 3: Market and Policy Trends in Renewable Energy Technologies . . . 61
Market and Policy Trends: Hydropower . . . . . . . . . . . . . . . . . . . . . . . . . . . . . . . . . . . . . . . . . . . . . . . . . 62
Installed Capacity . . . . . . . . . . . . . . . . . . . . . . . . . . . . . . . . . . . . . . . . . . . . . . . . . . . . . . . . . . . . . . . . . . . . . 63
Hydropower Electricity Production . . . . . . . . . . . . . . . . . . . . . . . . . . . . . . . . . . . . . . . . . . . . . . . . . . . . . 63
Public Acceptance . . . . . . . . . . . . . . . . . . . . . . . . . . . . . . . . . . . . . . . . . . . . . . . . . . . . . . . . . . . . . . . . . . . . . 64
Policy Trends . . . . . . . . . . . . . . . . . . . . . . . . . . . . . . . . . . . . . . . . . . . . . . . . . . . . . . . . . . . . . . . . . . . . . . . . . . 64
Technology and Cost Developments . . . . . . . . . . . . . . . . . . . . . . . . . . . . . . . . . . . . . . . . . . . . . . . . . . . . 65
Market and Policy Trends: Bioenergy . . . . . . . . . . . . . . . . . . . . . . . . . . . . . . . . . . . . . . . . . . . . . . . . . . . . 65
Potential . . . . . . . . . . . . . . . . . . . . . . . . . . . . . . . . . . . . . . . . . . . . . . . . . . . . . . . . . . . . . . . . . . . . . . . . . . . . . . 65
Production . . . . . . . . . . . . . . . . . . . . . . . . . . . . . . . . . . . . . . . . . . . . . . . . . . . . . . . . . . . . . . . . . . . . . . . . . . . . 65
Solid Biomass Electricity Production . . . . . . . . . . . . . . . . . . . . . . . . . . . . . . . . . . . . . . . . . . . . . . . . . . . . 67
Biomass Heat Production . . . . . . . . . . . . . . . . . . . . . . . . . . . . . . . . . . . . . . . . . . . . . . . . . . . . . . . . . . . . . . 69
Table of Contents

8
Biogas Electricity Production . . . . . . . . . . . . . . . . . . . . . . . . . . . . . . . . . . . . . . . . . . . . . . . . . . . . . . . . . . . 70
Biofuels . . . . . . . . . . . . . . . . . . . . . . . . . . . . . . . . . . . . . . . . . . . . . . . . . . . . . . . . . . . . . . . . . . . . . . . . . . . . . . . 70
Technology and Cost Developments . . . . . . . . . . . . . . . . . . . . . . . . . . . . . . . . . . . . . . . . . . . . . . . . . . . . 70
Market and Policy Trends: Geothermal Energy . . . . . . . . . . . . . . . . . . . . . . . . . . . . . . . . . . . . . . . . . . 71
Installed Capacity . . . . . . . . . . . . . . . . . . . . . . . . . . . . . . . . . . . . . . . . . . . . . . . . . . . . . . . . . . . . . . . . . . . . . 72
Geothermal Electricity Production . . . . . . . . . . . . . . . . . . . . . . . . . . . . . . . . . . . . . . . . . . . . . . . . . . . . . . 72
Policy Trends . . . . . . . . . . . . . . . . . . . . . . . . . . . . . . . . . . . . . . . . . . . . . . . . . . . . . . . . . . . . . . . . . . . . . . . . . . 72
Technology and Cost Developments . . . . . . . . . . . . . . . . . . . . . . . . . . . . . . . . . . . . . . . . . . . . . . . . . . . . 73
Geothermal Direct Use . . . . . . . . . . . . . . . . . . . . . . . . . . . . . . . . . . . . . . . . . . . . . . . . . . . . . . . . . . . . . . . . 73
Market and Policy Trends: Solar Photovoltaic . . . . . . . . . . . . . . . . . . . . . . . . . . . . . . . . . . . . . . . . . . . 74
Installed Capacity . . . . . . . . . . . . . . . . . . . . . . . . . . . . . . . . . . . . . . . . . . . . . . . . . . . . . . . . . . . . . . . . . . . . . 74
PV Electricity Production . . . . . . . . . . . . . . . . . . . . . . . . . . . . . . . . . . . . . . . . . . . . . . . . . . . . . . . . . . . . . . . 75
Policy Trends . . . . . . . . . . . . . . . . . . . . . . . . . . . . . . . . . . . . . . . . . . . . . . . . . . . . . . . . . . . . . . . . . . . . . . . . . . 75
Technology and Cost Developments . . . . . . . . . . . . . . . . . . . . . . . . . . . . . . . . . . . . . . . . . . . . . . . . . . . . 76
Market and Policy Trends: Solar Thermal Energy . . . . . . . . . . . . . . . . . . . . . . . . . . . . . . . . . . . . . . . . 77
Solar Thermal Electricity . . . . . . . . . . . . . . . . . . . . . . . . . . . . . . . . . . . . . . . . . . . . . . . . . . . . . . . . . . . . . . . 77
Technology and Costs Development . . . . . . . . . . . . . . . . . . . . . . . . . . . . . . . . . . . . . . . . . . . . . . . . . . . . 78
Solar Thermal Heating and Cooling . . . . . . . . . . . . . . . . . . . . . . . . . . . . . . . . . . . . . . . . . . . . . . . . . . . . . 78
Technology and Costs Development . . . . . . . . . . . . . . . . . . . . . . . . . . . . . . . . . . . . . . . . . . . . . . . . . . . . 79
Market and Policy Trends: Wind . . . . . . . . . . . . . . . . . . . . . . . . . . . . . . . . . . . . . . . . . . . . . . . . . . . . . . . . 80
Installed Capacity . . . . . . . . . . . . . . . . . . . . . . . . . . . . . . . . . . . . . . . . . . . . . . . . . . . . . . . . . . . . . . . . . . . . . 80
Policy Trends . . . . . . . . . . . . . . . . . . . . . . . . . . . . . . . . . . . . . . . . . . . . . . . . . . . . . . . . . . . . . . . . . . . . . . . . . . 81
Technology and Cost Developments . . . . . . . . . . . . . . . . . . . . . . . . . . . . . . . . . . . . . . . . . . . . . . . . . . . . 81
Challenges to Future Growth . . . . . . . . . . . . . . . . . . . . . . . . . . . . . . . . . . . . . . . . . . . . . . . . . . . . . . . . . . . 84
Chapter 4: Market Deployment Policies . . . . . . . . . . . . . . . . . . . . . . . . . . . . . . . . . . . . . . . . . . . . 85
Policy Types . . . . . . . . . . . . . . . . . . . . . . . . . . . . . . . . . . . . . . . . . . . . . . . . . . . . . . . . . . . . . . . . . . . . . . . . . . . . . . 85
Policies Addressing Supply and Capacity . . . . . . . . . . . . . . . . . . . . . . . . . . . . . . . . . . . . . . . . . . . . . . 86
Investment Incentives . . . . . . . . . . . . . . . . . . . . . . . . . . . . . . . . . . . . . . . . . . . . . . . . . . . . . . . . . . . . . . . . . . 86
Tax Measures . . . . . . . . . . . . . . . . . . . . . . . . . . . . . . . . . . . . . . . . . . . . . . . . . . . . . . . . . . . . . . . . . . . . . . . . . . 86
Government Purchases . . . . . . . . . . . . . . . . . . . . . . . . . . . . . . . . . . . . . . . . . . . . . . . . . . . . . . . . . . . . . . . . . 86
Policies Addressing Supply and Generation . . . . . . . . . . . . . . . . . . . . . . . . . . . . . . . . . . . . . . . . . . . . . 86
Incentive Tariffs . . . . . . . . . . . . . . . . . . . . . . . . . . . . . . . . . . . . . . . . . . . . . . . . . . . . . . . . . . . . . . . . . . . . . . . . 86
Tax Measures . . . . . . . . . . . . . . . . . . . . . . . . . . . . . . . . . . . . . . . . . . . . . . . . . . . . . . . . . . . . . . . . . . . . . . . . . . 87
Obligations . . . . . . . . . . . . . . . . . . . . . . . . . . . . . . . . . . . . . . . . . . . . . . . . . . . . . . . . . . . . . . . . . . . . . . . . . . . . 88
Tradable Certificates . . . . . . . . . . . . . . . . . . . . . . . . . . . . . . . . . . . . . . . . . . . . . . . . . . . . . . . . . . . . . . . . . . . 88
Policies Addressing Demand and Generation . . . . . . . . . . . . . . . . . . . . . . . . . . . . . . . . . . . . . . . . . . . 89
Voluntary Programmes . . . . . . . . . . . . . . . . . . . . . . . . . . . . . . . . . . . . . . . . . . . . . . . . . . . . . . . . . . . . . . . . . 89
Tax Measures . . . . . . . . . . . . . . . . . . . . . . . . . . . . . . . . . . . . . . . . . . . . . . . . . . . . . . . . . . . . . . . . . . . . . . . . . . 89
Table of contents

Table of contents
9
Policies Addressing Demand and Capacity . . . . . . . . . . . . . . . . . . . . . . . . . . . . . . . . . . . . . . . . . . . . . . 89
Investment Incentives. . . . . . . . . . . . . . . . . . . . . . . . . . . . . . . . . . . . . . . . . . . . . . . . . . . . . . . . . . . . . . . . . . . 89
Tax Measures . . . . . . . . . . . . . . . . . . . . . . . . . . . . . . . . . . . . . . . . . . . . . . . . . . . . . . . . . . . . . . . . . . . . . . . . . . 90
Regulatory and Administrative Rules. . . . . . . . . . . . . . . . . . . . . . . . . . . . . . . . . . . . . . . . . . . . . . . . . . . . . 90
Public Awareness Programmes . . . . . . . . . . . . . . . . . . . . . . . . . . . . . . . . . . . . . . . . . . . . . . . . . . . . . . . . . . . 90
Trends in IEA Renewable Energy Policies . . . . . . . . . . . . . . . . . . . . . . . . . . . . . . . . . . . . . . . . . . . . . . . . 90
Annex 1: Total Primary Energy Supply and Share of Renewables . . . . . . . . . . . . . 97
Annex 2: Renewable Energy Statistics – Definitions and Issues . . . . . . . . . . . . . . . 99
Part 2 - Country Profiles 105
Australia . . . . . . . . . . . . . . . . . . . . . . . . . . . . . . . . . . . . . . . . . . . . . . . . . . . . . . . . . . . . . . . . . . . . . . . . . . . . . . . . . . . . 107
Total Primary Energy Supply . . . . . . . . . . . . . . . . . . . . . . . . . . . . . . . . . . . . . . . . . . . . . . . . . . . . . . . . . . . . . 108
Renewable Energy Supply. . . . . . . . . . . . . . . . . . . . . . . . . . . . . . . . . . . . . . . . . . . . . . . . . . . . . . . . . . . . . . . . 110
Research and Development Trends . . . . . . . . . . . . . . . . . . . . . . . . . . . . . . . . . . . . . . . . . . . . . . . . . . . . . . 111
Market Deployment Trends . . . . . . . . . . . . . . . . . . . . . . . . . . . . . . . . . . . . . . . . . . . . . . . . . . . . . . . . . . . . . 112
Renewable Energy Markets . . . . . . . . . . . . . . . . . . . . . . . . . . . . . . . . . . . . . . . . . . . . . . . . . . . . . . . . . . . . . . 115
Hydropower . . . . . . . . . . . . . . . . . . . . . . . . . . . . . . . . . . . . . . . . . . . . . . . . . . . . . . . . . . . . . . . . . . . . . . . . . . . 115
Biomass Production . . . . . . . . . . . . . . . . . . . . . . . . . . . . . . . . . . . . . . . . . . . . . . . . . . . . . . . . . . . . . . . . . . . . 115
Biogas Electricity Production. . . . . . . . . . . . . . . . . . . . . . . . . . . . . . . . . . . . . . . . . . . . . . . . . . . . . . . . . . . . 116
Wind Power . . . . . . . . . . . . . . . . . . . . . . . . . . . . . . . . . . . . . . . . . . . . . . . . . . . . . . . . . . . . . . . . . . . . . . . . . . . 117
Solar Thermal Electricity Production. . . . . . . . . . . . . . . . . . . . . . . . . . . . . . . . . . . . . . . . . . . . . . . . . . . . . 118
Solar Photovoltaic . . . . . . . . . . . . . . . . . . . . . . . . . . . . . . . . . . . . . . . . . . . . . . . . . . . . . . . . . . . . . . . . . . . . . . 119
Policy Chronology. . . . . . . . . . . . . . . . . . . . . . . . . . . . . . . . . . . . . . . . . . . . . . . . . . . . . . . . . . . . . . . . . . . . . . . . 121
Austria . . . . . . . . . . . . . . . . . . . . . . . . . . . . . . . . . . . . . . . . . . . . . . . . . . . . . . . . . . . . . . . . . . . . . . . . . . . . . . . . . . . . . . 129
Total Primary Energy Supply . . . . . . . . . . . . . . . . . . . . . . . . . . . . . . . . . . . . . . . . . . . . . . . . . . . . . . . . . . . . . 130
Renewable Energy Supply. . . . . . . . . . . . . . . . . . . . . . . . . . . . . . . . . . . . . . . . . . . . . . . . . . . . . . . . . . . . . . . . 132
Research and Development Trends . . . . . . . . . . . . . . . . . . . . . . . . . . . . . . . . . . . . . . . . . . . . . . . . . . . . . . 133
Market Deployment Trends . . . . . . . . . . . . . . . . . . . . . . . . . . . . . . . . . . . . . . . . . . . . . . . . . . . . . . . . . . . . . 134
Energy Policy Context . . . . . . . . . . . . . . . . . . . . . . . . . . . . . . . . . . . . . . . . . . . . . . . . . . . . . . . . . . . . . . . . . . 136
Renewable Energy Markets . . . . . . . . . . . . . . . . . . . . . . . . . . . . . . . . . . . . . . . . . . . . . . . . . . . . . . . . . . . . . . 137
Biomass Electricity Production . . . . . . . . . . . . . . . . . . . . . . . . . . . . . . . . . . . . . . . . . . . . . . . . . . . . . . . . . . 137
Biomass Heat Production . . . . . . . . . . . . . . . . . . . . . . . . . . . . . . . . . . . . . . . . . . . . . . . . . . . . . . . . . . . . . . . 138
Wind Power . . . . . . . . . . . . . . . . . . . . . . . . . . . . . . . . . . . . . . . . . . . . . . . . . . . . . . . . . . . . . . . . . . . . . . . . . . . 139

10
Solar Thermal Production . . . . . . . . . . . . . . . . . . . . . . . . . . . . . . . . . . . . . . . . . . . . . . . . . . . . . . . . . . . . . . . 140
Solar Photovoltaic . . . . . . . . . . . . . . . . . . . . . . . . . . . . . . . . . . . . . . . . . . . . . . . . . . . . . . . . . . . . . . . . . . . . . . 141
Policy Chronology. . . . . . . . . . . . . . . . . . . . . . . . . . . . . . . . . . . . . . . . . . . . . . . . . . . . . . . . . . . . . . . . . . . . . . . . 143
Belgium . . . . . . . . . . . . . . . . . . . . . . . . . . . . . . . . . . . . . . . . . . . . . . . . . . . . . . . . . . . . . . . . . . . . . . . . . . . . . . . . . . . . . 155
Total Primary Energy Supply . . . . . . . . . . . . . . . . . . . . . . . . . . . . . . . . . . . . . . . . . . . . . . . . . . . . . . . . . . . . . 156
Renewable Energy Supply. . . . . . . . . . . . . . . . . . . . . . . . . . . . . . . . . . . . . . . . . . . . . . . . . . . . . . . . . . . . . . . . 158
Research and Development Trends . . . . . . . . . . . . . . . . . . . . . . . . . . . . . . . . . . . . . . . . . . . . . . . . . . . . . . 159
Market Deployment Trends . . . . . . . . . . . . . . . . . . . . . . . . . . . . . . . . . . . . . . . . . . . . . . . . . . . . . . . . . . . . . 160
Renewable Energy Markets . . . . . . . . . . . . . . . . . . . . . . . . . . . . . . . . . . . . . . . . . . . . . . . . . . . . . . . . . . . . . . 165
Hydropower . . . . . . . . . . . . . . . . . . . . . . . . . . . . . . . . . . . . . . . . . . . . . . . . . . . . . . . . . . . . . . . . . . . . . . . . . . . 165
Biomass Production . . . . . . . . . . . . . . . . . . . . . . . . . . . . . . . . . . . . . . . . . . . . . . . . . . . . . . . . . . . . . . . . . . . . 166
Wind Power . . . . . . . . . . . . . . . . . . . . . . . . . . . . . . . . . . . . . . . . . . . . . . . . . . . . . . . . . . . . . . . . . . . . . . . . . . . 167
Solar Thermal Production . . . . . . . . . . . . . . . . . . . . . . . . . . . . . . . . . . . . . . . . . . . . . . . . . . . . . . . . . . . . . . . 168
Policy Chronology. . . . . . . . . . . . . . . . . . . . . . . . . . . . . . . . . . . . . . . . . . . . . . . . . . . . . . . . . . . . . . . . . . . . . . . . 170
Canada. . . . . . . . . . . . . . . . . . . . . . . . . . . . . . . . . . . . . . . . . . . . . . . . . . . . . . . . . . . . . . . . . . . . . . . . . . . . . . . . . . . . . . 179
Total Primary Energy Supply . . . . . . . . . . . . . . . . . . . . . . . . . . . . . . . . . . . . . . . . . . . . . . . . . . . . . . . . . . . . . 180
Renewable Energy Supply. . . . . . . . . . . . . . . . . . . . . . . . . . . . . . . . . . . . . . . . . . . . . . . . . . . . . . . . . . . . . . . . 181
Research and Development Trends . . . . . . . . . . . . . . . . . . . . . . . . . . . . . . . . . . . . . . . . . . . . . . . . . . . . . . 182
Market Deployment Trends . . . . . . . . . . . . . . . . . . . . . . . . . . . . . . . . . . . . . . . . . . . . . . . . . . . . . . . . . . . . . 184
Energy Policy Context . . . . . . . . . . . . . . . . . . . . . . . . . . . . . . . . . . . . . . . . . . . . . . . . . . . . . . . . . . . . . . . . . . 185
Renewable Energy Markets . . . . . . . . . . . . . . . . . . . . . . . . . . . . . . . . . . . . . . . . . . . . . . . . . . . . . . . . . . . . . . 188
Hydropower . . . . . . . . . . . . . . . . . . . . . . . . . . . . . . . . . . . . . . . . . . . . . . . . . . . . . . . . . . . . . . . . . . . . . . . . . . . 188
Biomass Production . . . . . . . . . . . . . . . . . . . . . . . . . . . . . . . . . . . . . . . . . . . . . . . . . . . . . . . . . . . . . . . . . . . . 189
Liquid Biofuels Production. . . . . . . . . . . . . . . . . . . . . . . . . . . . . . . . . . . . . . . . . . . . . . . . . . . . . . . . . . . . . . 190
Wind Power . . . . . . . . . . . . . . . . . . . . . . . . . . . . . . . . . . . . . . . . . . . . . . . . . . . . . . . . . . . . . . . . . . . . . . . . . . . 190
Solar Photovoltaic . . . . . . . . . . . . . . . . . . . . . . . . . . . . . . . . . . . . . . . . . . . . . . . . . . . . . . . . . . . . . . . . . . . . . . 191
Ocean Energy . . . . . . . . . . . . . . . . . . . . . . . . . . . . . . . . . . . . . . . . . . . . . . . . . . . . . . . . . . . . . . . . . . . . . . . . . . 192
Policy Chronology. . . . . . . . . . . . . . . . . . . . . . . . . . . . . . . . . . . . . . . . . . . . . . . . . . . . . . . . . . . . . . . . . . . . . . . . 193
Czech Republic . . . . . . . . . . . . . . . . . . . . . . . . . . . . . . . . . . . . . . . . . . . . . . . . . . . . . . . . . . . . . . . . . . . . . . . . . . . 203
Total Primary Energy Supply . . . . . . . . . . . . . . . . . . . . . . . . . . . . . . . . . . . . . . . . . . . . . . . . . . . . . . . . . . . . . 204
Renewable Energy Supply. . . . . . . . . . . . . . . . . . . . . . . . . . . . . . . . . . . . . . . . . . . . . . . . . . . . . . . . . . . . . . . . 206
Research and Development Trends . . . . . . . . . . . . . . . . . . . . . . . . . . . . . . . . . . . . . . . . . . . . . . . . . . . . . . 207
Market Deployment Trends . . . . . . . . . . . . . . . . . . . . . . . . . . . . . . . . . . . . . . . . . . . . . . . . . . . . . . . . . . . . . 207
Renewable Energy Markets . . . . . . . . . . . . . . . . . . . . . . . . . . . . . . . . . . . . . . . . . . . . . . . . . . . . . . . . . . . . . . 211
Hydropower . . . . . . . . . . . . . . . . . . . . . . . . . . . . . . . . . . . . . . . . . . . . . . . . . . . . . . . . . . . . . . . . . . . . . . . . . . . 211
Table of contents

Table of contents
11
Biomass Production . . . . . . . . . . . . . . . . . . . . . . . . . . . . . . . . . . . . . . . . . . . . . . . . . . . . . . . . . . . . . . . . . . . . 212
Wind Power . . . . . . . . . . . . . . . . . . . . . . . . . . . . . . . . . . . . . . . . . . . . . . . . . . . . . . . . . . . . . . . . . . . . . . . . . . . 213
Policy Chronology. . . . . . . . . . . . . . . . . . . . . . . . . . . . . . . . . . . . . . . . . . . . . . . . . . . . . . . . . . . . . . . . . . . . . . . . 214
Denmark . . . . . . . . . . . . . . . . . . . . . . . . . . . . . . . . . . . . . . . . . . . . . . . . . . . . . . . . . . . . . . . . . . . . . . . . . . . . . . . . . . . 219
Total Primary Energy Supply . . . . . . . . . . . . . . . . . . . . . . . . . . . . . . . . . . . . . . . . . . . . . . . . . . . . . . . . . . . . . 220
Renewable Energy Supply. . . . . . . . . . . . . . . . . . . . . . . . . . . . . . . . . . . . . . . . . . . . . . . . . . . . . . . . . . . . . . . . 222
Research and Development Trends . . . . . . . . . . . . . . . . . . . . . . . . . . . . . . . . . . . . . . . . . . . . . . . . . . . . . . 223
Market Deployment Trends . . . . . . . . . . . . . . . . . . . . . . . . . . . . . . . . . . . . . . . . . . . . . . . . . . . . . . . . . . . . . 224
Energy Policy Context . . . . . . . . . . . . . . . . . . . . . . . . . . . . . . . . . . . . . . . . . . . . . . . . . . . . . . . . . . . . . . . . . . 225
Renewable Energy Markets . . . . . . . . . . . . . . . . . . . . . . . . . . . . . . . . . . . . . . . . . . . . . . . . . . . . . . . . . . . . . . 226
Biomass Production . . . . . . . . . . . . . . . . . . . . . . . . . . . . . . . . . . . . . . . . . . . . . . . . . . . . . . . . . . . . . . . . . . . . 226
Biomass Electricity Production . . . . . . . . . . . . . . . . . . . . . . . . . . . . . . . . . . . . . . . . . . . . . . . . . . . . . . . . . . 227
Biomass Heat Production . . . . . . . . . . . . . . . . . . . . . . . . . . . . . . . . . . . . . . . . . . . . . . . . . . . . . . . . . . . . . . . 228
Biogas Electricity Production. . . . . . . . . . . . . . . . . . . . . . . . . . . . . . . . . . . . . . . . . . . . . . . . . . . . . . . . . . . . 229
Wind Power . . . . . . . . . . . . . . . . . . . . . . . . . . . . . . . . . . . . . . . . . . . . . . . . . . . . . . . . . . . . . . . . . . . . . . . . . . . 230
Solar Thermal Production . . . . . . . . . . . . . . . . . . . . . . . . . . . . . . . . . . . . . . . . . . . . . . . . . . . . . . . . . . . . . . . 233
Policy Chronology . . . . . . . . . . . . . . . . . . . . . . . . . . . . . . . . . . . . . . . . . . . . . . . . . . . . . . . . . . . . . . . . . . . . . . . 235
European Union . . . . . . . . . . . . . . . . . . . . . . . . . . . . . . . . . . . . . . . . . . . . . . . . . . . . . . . . . . . . . . . . . . . . . . . . . . 243
Renewable Energy Policy Context . . . . . . . . . . . . . . . . . . . . . . . . . . . . . . . . . . . . . . . . . . . . . . . . . . . . . . . 244
Background to Activities at a European Union Level . . . . . . . . . . . . . . . . . . . . . . . . . . . . . . . . . . . . . 244
EU Renewable Energy Programmes . . . . . . . . . . . . . . . . . . . . . . . . . . . . . . . . . . . . . . . . . . . . . . . . . . . . . 244
EU Renewable Energy Policies . . . . . . . . . . . . . . . . . . . . . . . . . . . . . . . . . . . . . . . . . . . . . . . . . . . . . . . . . . 245
Renewable Energy Legislation. . . . . . . . . . . . . . . . . . . . . . . . . . . . . . . . . . . . . . . . . . . . . . . . . . . . . . . . . . . 245
Finland . . . . . . . . . . . . . . . . . . . . . . . . . . . . . . . . . . . . . . . . . . . . . . . . . . . . . . . . . . . . . . . . . . . . . . . . . . . . . . . . . . . . . . 249
Total Primary Energy Supply . . . . . . . . . . . . . . . . . . . . . . . . . . . . . . . . . . . . . . . . . . . . . . . . . . . . . . . . . . . . . 250
Renewable Energy Supply. . . . . . . . . . . . . . . . . . . . . . . . . . . . . . . . . . . . . . . . . . . . . . . . . . . . . . . . . . . . . . . . 252
Research and Development Trends . . . . . . . . . . . . . . . . . . . . . . . . . . . . . . . . . . . . . . . . . . . . . . . . . . . . . . 252
Market Deployment Trends . . . . . . . . . . . . . . . . . . . . . . . . . . . . . . . . . . . . . . . . . . . . . . . . . . . . . . . . . . . . . 254
Energy Policy Context . . . . . . . . . . . . . . . . . . . . . . . . . . . . . . . . . . . . . . . . . . . . . . . . . . . . . . . . . . . . . . . . . . 254
Renewable Energy Markets . . . . . . . . . . . . . . . . . . . . . . . . . . . . . . . . . . . . . . . . . . . . . . . . . . . . . . . . . . . . . . 256
Hydropower . . . . . . . . . . . . . . . . . . . . . . . . . . . . . . . . . . . . . . . . . . . . . . . . . . . . . . . . . . . . . . . . . . . . . . . . . . . 256
Biomass Electricity Production . . . . . . . . . . . . . . . . . . . . . . . . . . . . . . . . . . . . . . . . . . . . . . . . . . . . . . . . . . 256
Wind Power . . . . . . . . . . . . . . . . . . . . . . . . . . . . . . . . . . . . . . . . . . . . . . . . . . . . . . . . . . . . . . . . . . . . . . . . . . . 257
Policy Chronology. . . . . . . . . . . . . . . . . . . . . . . . . . . . . . . . . . . . . . . . . . . . . . . . . . . . . . . . . . . . . . . . . . . . . . . . 259

12
France. . . . . . . . . . . . . . . . . . . . . . . . . . . . . . . . . . . . . . . . . . . . . . . . . . . . . . . . . . . . . . . . . . . . . . . . . . . . . . . . . . . . . . . 267
Total Primary Energy Supply . . . . . . . . . . . . . . . . . . . . . . . . . . . . . . . . . . . . . . . . . . . . . . . . . . . . . . . . . . . . . 268
Renewable Energy Supply. . . . . . . . . . . . . . . . . . . . . . . . . . . . . . . . . . . . . . . . . . . . . . . . . . . . . . . . . . . . . . . . 269
Research and Development Trends . . . . . . . . . . . . . . . . . . . . . . . . . . . . . . . . . . . . . . . . . . . . . . . . . . . . . . 270
Market Deployment Trends . . . . . . . . . . . . . . . . . . . . . . . . . . . . . . . . . . . . . . . . . . . . . . . . . . . . . . . . . . . . . 272
Energy Policy Context . . . . . . . . . . . . . . . . . . . . . . . . . . . . . . . . . . . . . . . . . . . . . . . . . . . . . . . . . . . . . . . . . . 273
Renewable Energy Markets . . . . . . . . . . . . . . . . . . . . . . . . . . . . . . . . . . . . . . . . . . . . . . . . . . . . . . . . . . . . . . 274
Hydropower . . . . . . . . . . . . . . . . . . . . . . . . . . . . . . . . . . . . . . . . . . . . . . . . . . . . . . . . . . . . . . . . . . . . . . . . . . . 274
Biomass Heat Production . . . . . . . . . . . . . . . . . . . . . . . . . . . . . . . . . . . . . . . . . . . . . . . . . . . . . . . . . . . . . . . 274
Wind Power . . . . . . . . . . . . . . . . . . . . . . . . . . . . . . . . . . . . . . . . . . . . . . . . . . . . . . . . . . . . . . . . . . . . . . . . . . . 275
Solar Thermal Production . . . . . . . . . . . . . . . . . . . . . . . . . . . . . . . . . . . . . . . . . . . . . . . . . . . . . . . . . . . . . . . 276
Solar Photovoltaic . . . . . . . . . . . . . . . . . . . . . . . . . . . . . . . . . . . . . . . . . . . . . . . . . . . . . . . . . . . . . . . . . . . . . . 277
Policy Chronology. . . . . . . . . . . . . . . . . . . . . . . . . . . . . . . . . . . . . . . . . . . . . . . . . . . . . . . . . . . . . . . . . . . . . . . . 279
Germany . . . . . . . . . . . . . . . . . . . . . . . . . . . . . . . . . . . . . . . . . . . . . . . . . . . . . . . . . . . . . . . . . . . . . . . . . . . . . . . . . . . 289
Total Primary Energy Supply . . . . . . . . . . . . . . . . . . . . . . . . . . . . . . . . . . . . . . . . . . . . . . . . . . . . . . . . . . . . . 290
Renewable Energy Supply. . . . . . . . . . . . . . . . . . . . . . . . . . . . . . . . . . . . . . . . . . . . . . . . . . . . . . . . . . . . . . . . 292
Research and Development Trends . . . . . . . . . . . . . . . . . . . . . . . . . . . . . . . . . . . . . . . . . . . . . . . . . . . . . . 294
Market Deployment Trends . . . . . . . . . . . . . . . . . . . . . . . . . . . . . . . . . . . . . . . . . . . . . . . . . . . . . . . . . . . . . 295
Renewable Energy Markets . . . . . . . . . . . . . . . . . . . . . . . . . . . . . . . . . . . . . . . . . . . . . . . . . . . . . . . . . . . . . . 300
Hydropower . . . . . . . . . . . . . . . . . . . . . . . . . . . . . . . . . . . . . . . . . . . . . . . . . . . . . . . . . . . . . . . . . . . . . . . . . . . 300
Biomass Electricity Production . . . . . . . . . . . . . . . . . . . . . . . . . . . . . . . . . . . . . . . . . . . . . . . . . . . . . . . . . . 301
Biomass Heat Production . . . . . . . . . . . . . . . . . . . . . . . . . . . . . . . . . . . . . . . . . . . . . . . . . . . . . . . . . . . . . . . 302
Wind Power . . . . . . . . . . . . . . . . . . . . . . . . . . . . . . . . . . . . . . . . . . . . . . . . . . . . . . . . . . . . . . . . . . . . . . . . . . . 303
Solar Thermal Production . . . . . . . . . . . . . . . . . . . . . . . . . . . . . . . . . . . . . . . . . . . . . . . . . . . . . . . . . . . . . . . 305
Solar Photovoltaic . . . . . . . . . . . . . . . . . . . . . . . . . . . . . . . . . . . . . . . . . . . . . . . . . . . . . . . . . . . . . . . . . . . . . . 306
Policy Chronology. . . . . . . . . . . . . . . . . . . . . . . . . . . . . . . . . . . . . . . . . . . . . . . . . . . . . . . . . . . . . . . . . . . . . . . . 308
Greece . . . . . . . . . . . . . . . . . . . . . . . . . . . . . . . . . . . . . . . . . . . . . . . . . . . . . . . . . . . . . . . . . . . . . . . . . . . . . . . . . . . . . . 321
Total Primary Energy Supply . . . . . . . . . . . . . . . . . . . . . . . . . . . . . . . . . . . . . . . . . . . . . . . . . . . . . . . . . . . . . 322
Renewable Energy Supply. . . . . . . . . . . . . . . . . . . . . . . . . . . . . . . . . . . . . . . . . . . . . . . . . . . . . . . . . . . . . . . . 323
Research and Development Trends . . . . . . . . . . . . . . . . . . . . . . . . . . . . . . . . . . . . . . . . . . . . . . . . . . . . . . 324
Market Deployment Trends . . . . . . . . . . . . . . . . . . . . . . . . . . . . . . . . . . . . . . . . . . . . . . . . . . . . . . . . . . . . . 325
Renewable Energy Markets . . . . . . . . . . . . . . . . . . . . . . . . . . . . . . . . . . . . . . . . . . . . . . . . . . . . . . . . . . . . . . 327
Hydropower . . . . . . . . . . . . . . . . . . . . . . . . . . . . . . . . . . . . . . . . . . . . . . . . . . . . . . . . . . . . . . . . . . . . . . . . . . . 327
Wind Power . . . . . . . . . . . . . . . . . . . . . . . . . . . . . . . . . . . . . . . . . . . . . . . . . . . . . . . . . . . . . . . . . . . . . . . . . . . 328
Solar Thermal Production . . . . . . . . . . . . . . . . . . . . . . . . . . . . . . . . . . . . . . . . . . . . . . . . . . . . . . . . . . . . . . . 329
Policy Chronology. . . . . . . . . . . . . . . . . . . . . . . . . . . . . . . . . . . . . . . . . . . . . . . . . . . . . . . . . . . . . . . . . . . . . . . . 331
Table of contents
Table of contents
13
Hungary . . . . . . . . . . . . . . . . . . . . . . . . . . . . . . . . . . . . . . . . . . . . . . . . . . . . . . . . . . . . . . . . . . . . . . . . . . . . . . . . . . . . 339
Total Primary Energy Supply . . . . . . . . . . . . . . . . . . . . . . . . . . . . . . . . . . . . . . . . . . . . . . . . . . . . . . . . . . . . . 340
Renewable Energy Supply. . . . . . . . . . . . . . . . . . . . . . . . . . . . . . . . . . . . . . . . . . . . . . . . . . . . . . . . . . . . . . . . 342
Research and Development Trends . . . . . . . . . . . . . . . . . . . . . . . . . . . . . . . . . . . . . . . . . . . . . . . . . . . . . . 343
Market Deployment Trends . . . . . . . . . . . . . . . . . . . . . . . . . . . . . . . . . . . . . . . . . . . . . . . . . . . . . . . . . . . . . 344
Energy Policy Context . . . . . . . . . . . . . . . . . . . . . . . . . . . . . . . . . . . . . . . . . . . . . . . . . . . . . . . . . . . . . . . . . . 346
Renewable Energy Markets . . . . . . . . . . . . . . . . . . . . . . . . . . . . . . . . . . . . . . . . . . . . . . . . . . . . . . . . . . . . . . 347
Hydropower . . . . . . . . . . . . . . . . . . . . . . . . . . . . . . . . . . . . . . . . . . . . . . . . . . . . . . . . . . . . . . . . . . . . . . . . . . . 347
Biomass Heat Production . . . . . . . . . . . . . . . . . . . . . . . . . . . . . . . . . . . . . . . . . . . . . . . . . . . . . . . . . . . . . . . 347
Biogas Electricity Production. . . . . . . . . . . . . . . . . . . . . . . . . . . . . . . . . . . . . . . . . . . . . . . . . . . . . . . . . . . . 349
Geothermal Production. . . . . . . . . . . . . . . . . . . . . . . . . . . . . . . . . . . . . . . . . . . . . . . . . . . . . . . . . . . . . . . . . 350
Wind Power . . . . . . . . . . . . . . . . . . . . . . . . . . . . . . . . . . . . . . . . . . . . . . . . . . . . . . . . . . . . . . . . . . . . . . . . . . . 351
Policy Chronology. . . . . . . . . . . . . . . . . . . . . . . . . . . . . . . . . . . . . . . . . . . . . . . . . . . . . . . . . . . . . . . . . . . . . . . . 352
Ireland . . . . . . . . . . . . . . . . . . . . . . . . . . . . . . . . . . . . . . . . . . . . . . . . . . . . . . . . . . . . . . . . . . . . . . . . . . . . . . . . . . . . . . 361
Total Primary Energy Supply . . . . . . . . . . . . . . . . . . . . . . . . . . . . . . . . . . . . . . . . . . . . . . . . . . . . . . . . . . . . . 362
Renewable Energy Supply. . . . . . . . . . . . . . . . . . . . . . . . . . . . . . . . . . . . . . . . . . . . . . . . . . . . . . . . . . . . . . . . 364
Research and Development Trends . . . . . . . . . . . . . . . . . . . . . . . . . . . . . . . . . . . . . . . . . . . . . . . . . . . . . . 365
Market Deployment Trends . . . . . . . . . . . . . . . . . . . . . . . . . . . . . . . . . . . . . . . . . . . . . . . . . . . . . . . . . . . . . 367
Energy Policy Context . . . . . . . . . . . . . . . . . . . . . . . . . . . . . . . . . . . . . . . . . . . . . . . . . . . . . . . . . . . . . . . . . . 368
Renewable Energy Markets . . . . . . . . . . . . . . . . . . . . . . . . . . . . . . . . . . . . . . . . . . . . . . . . . . . . . . . . . . . . . . 370
Hydropower . . . . . . . . . . . . . . . . . . . . . . . . . . . . . . . . . . . . . . . . . . . . . . . . . . . . . . . . . . . . . . . . . . . . . . . . . . . 370
Biogas Electricity Production. . . . . . . . . . . . . . . . . . . . . . . . . . . . . . . . . . . . . . . . . . . . . . . . . . . . . . . . . . . . 371
Wind Power . . . . . . . . . . . . . . . . . . . . . . . . . . . . . . . . . . . . . . . . . . . . . . . . . . . . . . . . . . . . . . . . . . . . . . . . . . . 372
Policy Chronology. . . . . . . . . . . . . . . . . . . . . . . . . . . . . . . . . . . . . . . . . . . . . . . . . . . . . . . . . . . . . . . . . . . . . . . . 374
Italy . . . . . . . . . . . . . . . . . . . . . . . . . . . . . . . . . . . . . . . . . . . . . . . . . . . . . . . . . . . . . . . . . . . . . . . . . . . . . . . . . . . . . . . . . 381
Total Primary Energy Supply . . . . . . . . . . . . . . . . . . . . . . . . . . . . . . . . . . . . . . . . . . . . . . . . . . . . . . . . . . . . . 382
Renewable Energy Supply. . . . . . . . . . . . . . . . . . . . . . . . . . . . . . . . . . . . . . . . . . . . . . . . . . . . . . . . . . . . . . . . 384
Research and Development Trends . . . . . . . . . . . . . . . . . . . . . . . . . . . . . . . . . . . . . . . . . . . . . . . . . . . . . . 385
Market Deployment Trends . . . . . . . . . . . . . . . . . . . . . . . . . . . . . . . . . . . . . . . . . . . . . . . . . . . . . . . . . . . . . 386
Energy Policy Context . . . . . . . . . . . . . . . . . . . . . . . . . . . . . . . . . . . . . . . . . . . . . . . . . . . . . . . . . . . . . . . . . . 390
Renewable Energy Markets . . . . . . . . . . . . . . . . . . . . . . . . . . . . . . . . . . . . . . . . . . . . . . . . . . . . . . . . . . . . . . 391
Hydropower . . . . . . . . . . . . . . . . . . . . . . . . . . . . . . . . . . . . . . . . . . . . . . . . . . . . . . . . . . . . . . . . . . . . . . . . . . . 391
Biomass Electricity Production . . . . . . . . . . . . . . . . . . . . . . . . . . . . . . . . . . . . . . . . . . . . . . . . . . . . . . . . . . 392
Liquid Biofuels Production. . . . . . . . . . . . . . . . . . . . . . . . . . . . . . . . . . . . . . . . . . . . . . . . . . . . . . . . . . . . . . 393
Geothermal Electricity Production . . . . . . . . . . . . . . . . . . . . . . . . . . . . . . . . . . . . . . . . . . . . . . . . . . . . . . 394

14
Wind Power . . . . . . . . . . . . . . . . . . . . . . . . . . . . . . . . . . . . . . . . . . . . . . . . . . . . . . . . . . . . . . . . . . . . . . . . . . . 395
Solar Photovoltaic . . . . . . . . . . . . . . . . . . . . . . . . . . . . . . . . . . . . . . . . . . . . . . . . . . . . . . . . . . . . . . . . . . . . . . 396
Policy Chronology. . . . . . . . . . . . . . . . . . . . . . . . . . . . . . . . . . . . . . . . . . . . . . . . . . . . . . . . . . . . . . . . . . . . . . . . 399
Japan . . . . . . . . . . . . . . . . . . . . . . . . . . . . . . . . . . . . . . . . . . . . . . . . . . . . . . . . . . . . . . . . . . . . . . . . . . . . . . . . . . . . . . . . 409
Total Primary Energy Supply . . . . . . . . . . . . . . . . . . . . . . . . . . . . . . . . . . . . . . . . . . . . . . . . . . . . . . . . . . . . . 410
Renewable Energy Supply. . . . . . . . . . . . . . . . . . . . . . . . . . . . . . . . . . . . . . . . . . . . . . . . . . . . . . . . . . . . . . . . 412
Research and Development Trends . . . . . . . . . . . . . . . . . . . . . . . . . . . . . . . . . . . . . . . . . . . . . . . . . . . . . . 413
Market Deployment Trends . . . . . . . . . . . . . . . . . . . . . . . . . . . . . . . . . . . . . . . . . . . . . . . . . . . . . . . . . . . . . 416
Renewable Energy Markets . . . . . . . . . . . . . . . . . . . . . . . . . . . . . . . . . . . . . . . . . . . . . . . . . . . . . . . . . . . . . . 417
Hydropower . . . . . . . . . . . . . . . . . . . . . . . . . . . . . . . . . . . . . . . . . . . . . . . . . . . . . . . . . . . . . . . . . . . . . . . . . . . 417
Geothermal Electricity Production . . . . . . . . . . . . . . . . . . . . . . . . . . . . . . . . . . . . . . . . . . . . . . . . . . . . . . 418
Wind Power . . . . . . . . . . . . . . . . . . . . . . . . . . . . . . . . . . . . . . . . . . . . . . . . . . . . . . . . . . . . . . . . . . . . . . . . . . . 419
Solar Photovoltaic . . . . . . . . . . . . . . . . . . . . . . . . . . . . . . . . . . . . . . . . . . . . . . . . . . . . . . . . . . . . . . . . . . . . . . 420
Policy Chronology. . . . . . . . . . . . . . . . . . . . . . . . . . . . . . . . . . . . . . . . . . . . . . . . . . . . . . . . . . . . . . . . . . . . . . . . 423
Korea . . . . . . . . . . . . . . . . . . . . . . . . . . . . . . . . . . . . . . . . . . . . . . . . . . . . . . . . . . . . . . . . . . . . . . . . . . . . . . . . . . . . . . . . 433
Total Primary Energy Supply . . . . . . . . . . . . . . . . . . . . . . . . . . . . . . . . . . . . . . . . . . . . . . . . . . . . . . . . . . . . . 434
Renewable Energy Supply. . . . . . . . . . . . . . . . . . . . . . . . . . . . . . . . . . . . . . . . . . . . . . . . . . . . . . . . . . . . . . . . 436
Research and Development Trends . . . . . . . . . . . . . . . . . . . . . . . . . . . . . . . . . . . . . . . . . . . . . . . . . . . . . . 437
Market Deployment Trends . . . . . . . . . . . . . . . . . . . . . . . . . . . . . . . . . . . . . . . . . . . . . . . . . . . . . . . . . . . . . 438
Renewable Energy Markets . . . . . . . . . . . . . . . . . . . . . . . . . . . . . . . . . . . . . . . . . . . . . . . . . . . . . . . . . . . . . . 440
Hydropower . . . . . . . . . . . . . . . . . . . . . . . . . . . . . . . . . . . . . . . . . . . . . . . . . . . . . . . . . . . . . . . . . . . . . . . . . . . 440
Biomass Production . . . . . . . . . . . . . . . . . . . . . . . . . . . . . . . . . . . . . . . . . . . . . . . . . . . . . . . . . . . . . . . . . . . . 441
Wind Power . . . . . . . . . . . . . . . . . . . . . . . . . . . . . . . . . . . . . . . . . . . . . . . . . . . . . . . . . . . . . . . . . . . . . . . . . . . 442
Solar Thermal Production . . . . . . . . . . . . . . . . . . . . . . . . . . . . . . . . . . . . . . . . . . . . . . . . . . . . . . . . . . . . . . . 444
Solar Photovoltaic . . . . . . . . . . . . . . . . . . . . . . . . . . . . . . . . . . . . . . . . . . . . . . . . . . . . . . . . . . . . . . . . . . . . . . 445
Policy Chronology. . . . . . . . . . . . . . . . . . . . . . . . . . . . . . . . . . . . . . . . . . . . . . . . . . . . . . . . . . . . . . . . . . . . . . . . 447
Luxembourg . . . . . . . . . . . . . . . . . . . . . . . . . . . . . . . . . . . . . . . . . . . . . . . . . . . . . . . . . . . . . . . . . . . . . . . . . . . . . . . 455
Total Primary Energy Supply . . . . . . . . . . . . . . . . . . . . . . . . . . . . . . . . . . . . . . . . . . . . . . . . . . . . . . . . . . . . . 456
Renewable Energy Supply. . . . . . . . . . . . . . . . . . . . . . . . . . . . . . . . . . . . . . . . . . . . . . . . . . . . . . . . . . . . . . . . 458
Research and Development Trends . . . . . . . . . . . . . . . . . . . . . . . . . . . . . . . . . . . . . . . . . . . . . . . . . . . . . . 459
Market Deployment Trends . . . . . . . . . . . . . . . . . . . . . . . . . . . . . . . . . . . . . . . . . . . . . . . . . . . . . . . . . . . . . 460
Renewable Energy Markets . . . . . . . . . . . . . . . . . . . . . . . . . . . . . . . . . . . . . . . . . . . . . . . . . . . . . . . . . . . . . . 462
Hydropower . . . . . . . . . . . . . . . . . . . . . . . . . . . . . . . . . . . . . . . . . . . . . . . . . . . . . . . . . . . . . . . . . . . . . . . . . . . 462
Wind Power . . . . . . . . . . . . . . . . . . . . . . . . . . . . . . . . . . . . . . . . . . . . . . . . . . . . . . . . . . . . . . . . . . . . . . . . . . . 463
Policy Chronology. . . . . . . . . . . . . . . . . . . . . . . . . . . . . . . . . . . . . . . . . . . . . . . . . . . . . . . . . . . . . . . . . . . . . . . . 464
Table of contents
Table of contents
15
Netherlands. . . . . . . . . . . . . . . . . . . . . . . . . . . . . . . . . . . . . . . . . . . . . . . . . . . . . . . . . . . . . . . . . . . . . . . . . . . . . . . . 469
Total Primary Energy Supply . . . . . . . . . . . . . . . . . . . . . . . . . . . . . . . . . . . . . . . . . . . . . . . . . . . . . . . . . . . . . 470
Renewable Energy Supply. . . . . . . . . . . . . . . . . . . . . . . . . . . . . . . . . . . . . . . . . . . . . . . . . . . . . . . . . . . . . . . . 472
Research and Development Trends . . . . . . . . . . . . . . . . . . . . . . . . . . . . . . . . . . . . . . . . . . . . . . . . . . . . . . 473
Market Deployment Trends . . . . . . . . . . . . . . . . . . . . . . . . . . . . . . . . . . . . . . . . . . . . . . . . . . . . . . . . . . . . . 474
Energy Policy Context . . . . . . . . . . . . . . . . . . . . . . . . . . . . . . . . . . . . . . . . . . . . . . . . . . . . . . . . . . . . . . . . . . 476
Renewable Energy Markets . . . . . . . . . . . . . . . . . . . . . . . . . . . . . . . . . . . . . . . . . . . . . . . . . . . . . . . . . . . . . . 477
Biomass Electricity Production . . . . . . . . . . . . . . . . . . . . . . . . . . . . . . . . . . . . . . . . . . . . . . . . . . . . . . . . . . 477
Wind Power . . . . . . . . . . . . . . . . . . . . . . . . . . . . . . . . . . . . . . . . . . . . . . . . . . . . . . . . . . . . . . . . . . . . . . . . . . . 478
Solar Thermal Production . . . . . . . . . . . . . . . . . . . . . . . . . . . . . . . . . . . . . . . . . . . . . . . . . . . . . . . . . . . . . . . 479
Solar Photovoltaic . . . . . . . . . . . . . . . . . . . . . . . . . . . . . . . . . . . . . . . . . . . . . . . . . . . . . . . . . . . . . . . . . . . . . . 480
Policy Chronology. . . . . . . . . . . . . . . . . . . . . . . . . . . . . . . . . . . . . . . . . . . . . . . . . . . . . . . . . . . . . . . . . . . . . . . . 482
New Zealand . . . . . . . . . . . . . . . . . . . . . . . . . . . . . . . . . . . . . . . . . . . . . . . . . . . . . . . . . . . . . . . . . . . . . . . . . . . . . . 487
Total Primary Energy Supply . . . . . . . . . . . . . . . . . . . . . . . . . . . . . . . . . . . . . . . . . . . . . . . . . . . . . . . . . . . . . 488
Renewable Energy Supply. . . . . . . . . . . . . . . . . . . . . . . . . . . . . . . . . . . . . . . . . . . . . . . . . . . . . . . . . . . . . . . . 490
Research and Development Trends . . . . . . . . . . . . . . . . . . . . . . . . . . . . . . . . . . . . . . . . . . . . . . . . . . . . . . 490
Market Deployment Trends . . . . . . . . . . . . . . . . . . . . . . . . . . . . . . . . . . . . . . . . . . . . . . . . . . . . . . . . . . . . . 491
Energy Policy Context . . . . . . . . . . . . . . . . . . . . . . . . . . . . . . . . . . . . . . . . . . . . . . . . . . . . . . . . . . . . . . . . . . 493
Renewable Energy Markets . . . . . . . . . . . . . . . . . . . . . . . . . . . . . . . . . . . . . . . . . . . . . . . . . . . . . . . . . . . . . . 494
Hydropower . . . . . . . . . . . . . . . . . . . . . . . . . . . . . . . . . . . . . . . . . . . . . . . . . . . . . . . . . . . . . . . . . . . . . . . . . . . 494
Biomass . . . . . . . . . . . . . . . . . . . . . . . . . . . . . . . . . . . . . . . . . . . . . . . . . . . . . . . . . . . . . . . . . . . . . . . . . . . . . . . 494
Geothermal Electricity Production . . . . . . . . . . . . . . . . . . . . . . . . . . . . . . . . . . . . . . . . . . . . . . . . . . . . . . 495
Wind Power . . . . . . . . . . . . . . . . . . . . . . . . . . . . . . . . . . . . . . . . . . . . . . . . . . . . . . . . . . . . . . . . . . . . . . . . . . . 496
Policy Chronology. . . . . . . . . . . . . . . . . . . . . . . . . . . . . . . . . . . . . . . . . . . . . . . . . . . . . . . . . . . . . . . . . . . . . . . . 498
Norway . . . . . . . . . . . . . . . . . . . . . . . . . . . . . . . . . . . . . . . . . . . . . . . . . . . . . . . . . . . . . . . . . . . . . . . . . . . . . . . . . . . . . 503
Total Primary Energy Supply . . . . . . . . . . . . . . . . . . . . . . . . . . . . . . . . . . . . . . . . . . . . . . . . . . . . . . . . . . . . . 504
Renewable Energy Supply. . . . . . . . . . . . . . . . . . . . . . . . . . . . . . . . . . . . . . . . . . . . . . . . . . . . . . . . . . . . . . . . 506
Research and Development Trends . . . . . . . . . . . . . . . . . . . . . . . . . . . . . . . . . . . . . . . . . . . . . . . . . . . . . . 507
Market Deployment Trends . . . . . . . . . . . . . . . . . . . . . . . . . . . . . . . . . . . . . . . . . . . . . . . . . . . . . . . . . . . . . 508
Energy Policy Context . . . . . . . . . . . . . . . . . . . . . . . . . . . . . . . . . . . . . . . . . . . . . . . . . . . . . . . . . . . . . . . . . . 509
Renewable Energy Markets . . . . . . . . . . . . . . . . . . . . . . . . . . . . . . . . . . . . . . . . . . . . . . . . . . . . . . . . . . . . . . 510
Hydropower . . . . . . . . . . . . . . . . . . . . . . . . . . . . . . . . . . . . . . . . . . . . . . . . . . . . . . . . . . . . . . . . . . . . . . . . . . . 510
Wind Power . . . . . . . . . . . . . . . . . . . . . . . . . . . . . . . . . . . . . . . . . . . . . . . . . . . . . . . . . . . . . . . . . . . . . . . . . . . 511
Solar Photovoltaic . . . . . . . . . . . . . . . . . . . . . . . . . . . . . . . . . . . . . . . . . . . . . . . . . . . . . . . . . . . . . . . . . . . . . . 512
Policy Chronology. . . . . . . . . . . . . . . . . . . . . . . . . . . . . . . . . . . . . . . . . . . . . . . . . . . . . . . . . . . . . . . . . . . . . . . . 514

16
Portugal. . . . . . . . . . . . . . . . . . . . . . . . . . . . . . . . . . . . . . . . . . . . . . . . . . . . . . . . . . . . . . . . . . . . . . . . . . . . . . . . . . . . . 521
Total Primary Energy Supply . . . . . . . . . . . . . . . . . . . . . . . . . . . . . . . . . . . . . . . . . . . . . . . . . . . . . . . . . . . . . 522
Renewable Energy Supply. . . . . . . . . . . . . . . . . . . . . . . . . . . . . . . . . . . . . . . . . . . . . . . . . . . . . . . . . . . . . . . . 524
Research and Development Trends . . . . . . . . . . . . . . . . . . . . . . . . . . . . . . . . . . . . . . . . . . . . . . . . . . . . . . 524
Market Deployment Trends . . . . . . . . . . . . . . . . . . . . . . . . . . . . . . . . . . . . . . . . . . . . . . . . . . . . . . . . . . . . . 526
Renewable Energy Markets . . . . . . . . . . . . . . . . . . . . . . . . . . . . . . . . . . . . . . . . . . . . . . . . . . . . . . . . . . . . . . 528
Hydropower . . . . . . . . . . . . . . . . . . . . . . . . . . . . . . . . . . . . . . . . . . . . . . . . . . . . . . . . . . . . . . . . . . . . . . . . . . . 528
Wind Power . . . . . . . . . . . . . . . . . . . . . . . . . . . . . . . . . . . . . . . . . . . . . . . . . . . . . . . . . . . . . . . . . . . . . . . . . . . 528
Solar Thermal Production . . . . . . . . . . . . . . . . . . . . . . . . . . . . . . . . . . . . . . . . . . . . . . . . . . . . . . . . . . . . . . . 530
Solar Photovoltaic . . . . . . . . . . . . . . . . . . . . . . . . . . . . . . . . . . . . . . . . . . . . . . . . . . . . . . . . . . . . . . . . . . . . . . 531
Policy Chronology. . . . . . . . . . . . . . . . . . . . . . . . . . . . . . . . . . . . . . . . . . . . . . . . . . . . . . . . . . . . . . . . . . . . . . . . 533
Spain . . . . . . . . . . . . . . . . . . . . . . . . . . . . . . . . . . . . . . . . . . . . . . . . . . . . . . . . . . . . . . . . . . . . . . . . . . . . . . . . . . . . . . . . 541
Total Primary Energy Supply . . . . . . . . . . . . . . . . . . . . . . . . . . . . . . . . . . . . . . . . . . . . . . . . . . . . . . . . . . . . . 542
Renewable Energy Supply. . . . . . . . . . . . . . . . . . . . . . . . . . . . . . . . . . . . . . . . . . . . . . . . . . . . . . . . . . . . . . . . 544
Research and Development Trends . . . . . . . . . . . . . . . . . . . . . . . . . . . . . . . . . . . . . . . . . . . . . . . . . . . . . . 545
Market Deployment Trends . . . . . . . . . . . . . . . . . . . . . . . . . . . . . . . . . . . . . . . . . . . . . . . . . . . . . . . . . . . . . 546
Renewable Energy Markets . . . . . . . . . . . . . . . . . . . . . . . . . . . . . . . . . . . . . . . . . . . . . . . . . . . . . . . . . . . . . . 549
Hydropower . . . . . . . . . . . . . . . . . . . . . . . . . . . . . . . . . . . . . . . . . . . . . . . . . . . . . . . . . . . . . . . . . . . . . . . . . . . 549
Biomass Electricity Production . . . . . . . . . . . . . . . . . . . . . . . . . . . . . . . . . . . . . . . . . . . . . . . . . . . . . . . . . . 550
Wind Power . . . . . . . . . . . . . . . . . . . . . . . . . . . . . . . . . . . . . . . . . . . . . . . . . . . . . . . . . . . . . . . . . . . . . . . . . . . 551
Solar Photovoltaic . . . . . . . . . . . . . . . . . . . . . . . . . . . . . . . . . . . . . . . . . . . . . . . . . . . . . . . . . . . . . . . . . . . . . . 552
Policy Chronology. . . . . . . . . . . . . . . . . . . . . . . . . . . . . . . . . . . . . . . . . . . . . . . . . . . . . . . . . . . . . . . . . . . . . . . . 554
Sweden . . . . . . . . . . . . . . . . . . . . . . . . . . . . . . . . . . . . . . . . . . . . . . . . . . . . . . . . . . . . . . . . . . . . . . . . . . . . . . . . . . . . . 563
Total Primary Energy Supply . . . . . . . . . . . . . . . . . . . . . . . . . . . . . . . . . . . . . . . . . . . . . . . . . . . . . . . . . . . . . 564
Renewable Energy Supply. . . . . . . . . . . . . . . . . . . . . . . . . . . . . . . . . . . . . . . . . . . . . . . . . . . . . . . . . . . . . . . . 566
Research and Development Trends . . . . . . . . . . . . . . . . . . . . . . . . . . . . . . . . . . . . . . . . . . . . . . . . . . . . . . 567
Market Deployment Trends . . . . . . . . . . . . . . . . . . . . . . . . . . . . . . . . . . . . . . . . . . . . . . . . . . . . . . . . . . . . . 569
Energy Policy Context . . . . . . . . . . . . . . . . . . . . . . . . . . . . . . . . . . . . . . . . . . . . . . . . . . . . . . . . . . . . . . . . . . 571
Renewable Energy Markets . . . . . . . . . . . . . . . . . . . . . . . . . . . . . . . . . . . . . . . . . . . . . . . . . . . . . . . . . . . . . . 572
Hydropower . . . . . . . . . . . . . . . . . . . . . . . . . . . . . . . . . . . . . . . . . . . . . . . . . . . . . . . . . . . . . . . . . . . . . . . . . . . 572
Biomass Production . . . . . . . . . . . . . . . . . . . . . . . . . . . . . . . . . . . . . . . . . . . . . . . . . . . . . . . . . . . . . . . . . . . . 573
Biomass Electricity Production . . . . . . . . . . . . . . . . . . . . . . . . . . . . . . . . . . . . . . . . . . . . . . . . . . . . . . . . . . 574
Biomass Heat Production . . . . . . . . . . . . . . . . . . . . . . . . . . . . . . . . . . . . . . . . . . . . . . . . . . . . . . . . . . . . . . . 574
Wind Power . . . . . . . . . . . . . . . . . . . . . . . . . . . . . . . . . . . . . . . . . . . . . . . . . . . . . . . . . . . . . . . . . . . . . . . . . . . 576
Policy Chronology. . . . . . . . . . . . . . . . . . . . . . . . . . . . . . . . . . . . . . . . . . . . . . . . . . . . . . . . . . . . . . . . . . . . . . . . 577
Table of contents

Table of contents
17
Switzerland . . . . . . . . . . . . . . . . . . . . . . . . . . . . . . . . . . . . . . . . . . . . . . . . . . . . . . . . . . . . . . . . . . . . . . . . . . . . . . . . 585
Total Primary Energy Supply . . . . . . . . . . . . . . . . . . . . . . . . . . . . . . . . . . . . . . . . . . . . . . . . . . . . . . . . . . . . . 586
Renewable Energy Supply. . . . . . . . . . . . . . . . . . . . . . . . . . . . . . . . . . . . . . . . . . . . . . . . . . . . . . . . . . . . . . . . 588
Research and Development Trends . . . . . . . . . . . . . . . . . . . . . . . . . . . . . . . . . . . . . . . . . . . . . . . . . . . . . . 589
Market Deployment Trends . . . . . . . . . . . . . . . . . . . . . . . . . . . . . . . . . . . . . . . . . . . . . . . . . . . . . . . . . . . . . 590
Energy Policy Context . . . . . . . . . . . . . . . . . . . . . . . . . . . . . . . . . . . . . . . . . . . . . . . . . . . . . . . . . . . . . . . . . . 593
Renewable Energy Markets . . . . . . . . . . . . . . . . . . . . . . . . . . . . . . . . . . . . . . . . . . . . . . . . . . . . . . . . . . . . . . 594
Hydropower . . . . . . . . . . . . . . . . . . . . . . . . . . . . . . . . . . . . . . . . . . . . . . . . . . . . . . . . . . . . . . . . . . . . . . . . . . . 594
Biomass Production . . . . . . . . . . . . . . . . . . . . . . . . . . . . . . . . . . . . . . . . . . . . . . . . . . . . . . . . . . . . . . . . . . . . 595
Wind Power . . . . . . . . . . . . . . . . . . . . . . . . . . . . . . . . . . . . . . . . . . . . . . . . . . . . . . . . . . . . . . . . . . . . . . . . . . . 596
Solar Thermal Production . . . . . . . . . . . . . . . . . . . . . . . . . . . . . . . . . . . . . . . . . . . . . . . . . . . . . . . . . . . . . . . 597
Solar Photovoltaic . . . . . . . . . . . . . . . . . . . . . . . . . . . . . . . . . . . . . . . . . . . . . . . . . . . . . . . . . . . . . . . . . . . . . . 598
Policy Chronology. . . . . . . . . . . . . . . . . . . . . . . . . . . . . . . . . . . . . . . . . . . . . . . . . . . . . . . . . . . . . . . . . . . . . . . . 599
Turkey. . . . . . . . . . . . . . . . . . . . . . . . . . . . . . . . . . . . . . . . . . . . . . . . . . . . . . . . . . . . . . . . . . . . . . . . . . . . . . . . . . . . . . . 605Total Primary Energy Supply . . . . . . . . . . . . . . . . . . . . . . . . . . . . . . . . . . . . . . . . . . . . . . . . . . . . . . . . . . . . . 606
Renewable Energy Supply. . . . . . . . . . . . . . . . . . . . . . . . . . . . . . . . . . . . . . . . . . . . . . . . . . . . . . . . . . . . . . . . 608
Research and Development Trends . . . . . . . . . . . . . . . . . . . . . . . . . . . . . . . . . . . . . . . . . . . . . . . . . . . . . . 608
Market Deployment Trends . . . . . . . . . . . . . . . . . . . . . . . . . . . . . . . . . . . . . . . . . . . . . . . . . . . . . . . . . . . . . 609
Renewable Energy Markets . . . . . . . . . . . . . . . . . . . . . . . . . . . . . . . . . . . . . . . . . . . . . . . . . . . . . . . . . . . . . . 612
Hydropower . . . . . . . . . . . . . . . . . . . . . . . . . . . . . . . . . . . . . . . . . . . . . . . . . . . . . . . . . . . . . . . . . . . . . . . . . . . 612
Geothermal Production. . . . . . . . . . . . . . . . . . . . . . . . . . . . . . . . . . . . . . . . . . . . . . . . . . . . . . . . . . . . . . . . . 613
Wind Power . . . . . . . . . . . . . . . . . . . . . . . . . . . . . . . . . . . . . . . . . . . . . . . . . . . . . . . . . . . . . . . . . . . . . . . . . . . 614
Policy Chronology. . . . . . . . . . . . . . . . . . . . . . . . . . . . . . . . . . . . . . . . . . . . . . . . . . . . . . . . . . . . . . . . . . . . . . . . 615
United Kingdom . . . . . . . . . . . . . . . . . . . . . . . . . . . . . . . . . . . . . . . . . . . . . . . . . . . . . . . . . . . . . . . . . . . . . . . . . . 617Total Primary Energy Supply . . . . . . . . . . . . . . . . . . . . . . . . . . . . . . . . . . . . . . . . . . . . . . . . . . . . . . . . . . . . . 618
Renewable Energy Supply. . . . . . . . . . . . . . . . . . . . . . . . . . . . . . . . . . . . . . . . . . . . . . . . . . . . . . . . . . . . . . . . 620
Research and Development Trends . . . . . . . . . . . . . . . . . . . . . . . . . . . . . . . . . . . . . . . . . . . . . . . . . . . . . . 620
Market Deployment Trends . . . . . . . . . . . . . . . . . . . . . . . . . . . . . . . . . . . . . . . . . . . . . . . . . . . . . . . . . . . . . 622
Energy Policy Context . . . . . . . . . . . . . . . . . . . . . . . . . . . . . . . . . . . . . . . . . . . . . . . . . . . . . . . . . . . . . . . . . . 623
Renewable Energy Markets . . . . . . . . . . . . . . . . . . . . . . . . . . . . . . . . . . . . . . . . . . . . . . . . . . . . . . . . . . . . . . 625
Hydropower . . . . . . . . . . . . . . . . . . . . . . . . . . . . . . . . . . . . . . . . . . . . . . . . . . . . . . . . . . . . . . . . . . . . . . . . . . . 625
Biomass Electricity Production . . . . . . . . . . . . . . . . . . . . . . . . . . . . . . . . . . . . . . . . . . . . . . . . . . . . . . . . . . 625
Biomass Heat Production . . . . . . . . . . . . . . . . . . . . . . . . . . . . . . . . . . . . . . . . . . . . . . . . . . . . . . . . . . . . . . . 626
Biogas Electricity Production. . . . . . . . . . . . . . . . . . . . . . . . . . . . . . . . . . . . . . . . . . . . . . . . . . . . . . . . . . . . 627
Wind Power . . . . . . . . . . . . . . . . . . . . . . . . . . . . . . . . . . . . . . . . . . . . . . . . . . . . . . . . . . . . . . . . . . . . . . . . . . . 628
Solar Photovoltaic . . . . . . . . . . . . . . . . . . . . . . . . . . . . . . . . . . . . . . . . . . . . . . . . . . . . . . . . . . . . . . . . . . . . . . 630
Policy Chronology. . . . . . . . . . . . . . . . . . . . . . . . . . . . . . . . . . . . . . . . . . . . . . . . . . . . . . . . . . . . . . . . . . . . . . . . 631

18
United States . . . . . . . . . . . . . . . . . . . . . . . . . . . . . . . . . . . . . . . . . . . . . . . . . . . . . . . . . . . . . . . . . . . . . . . . . . . . . . 641
Total Primary Energy Supply . . . . . . . . . . . . . . . . . . . . . . . . . . . . . . . . . . . . . . . . . . . . . . . . . . . . . . . . . . . . . 642
Renewable Energy Supply. . . . . . . . . . . . . . . . . . . . . . . . . . . . . . . . . . . . . . . . . . . . . . . . . . . . . . . . . . . . . . . . 644
Research and Development Trends . . . . . . . . . . . . . . . . . . . . . . . . . . . . . . . . . . . . . . . . . . . . . . . . . . . . . . 645
Market Deployment Trends . . . . . . . . . . . . . . . . . . . . . . . . . . . . . . . . . . . . . . . . . . . . . . . . . . . . . . . . . . . . . 647
Renewable Energy Markets . . . . . . . . . . . . . . . . . . . . . . . . . . . . . . . . . . . . . . . . . . . . . . . . . . . . . . . . . . . . . . 649
Hydropower . . . . . . . . . . . . . . . . . . . . . . . . . . . . . . . . . . . . . . . . . . . . . . . . . . . . . . . . . . . . . . . . . . . . . . . . . . . 649
Bioenergy Production . . . . . . . . . . . . . . . . . . . . . . . . . . . . . . . . . . . . . . . . . . . . . . . . . . . . . . . . . . . . . . . . . . 650
Liquid Biofuels Production. . . . . . . . . . . . . . . . . . . . . . . . . . . . . . . . . . . . . . . . . . . . . . . . . . . . . . . . . . . . . . 651
Geothermal Electricity Production . . . . . . . . . . . . . . . . . . . . . . . . . . . . . . . . . . . . . . . . . . . . . . . . . . . . . . 653
Wind Power . . . . . . . . . . . . . . . . . . . . . . . . . . . . . . . . . . . . . . . . . . . . . . . . . . . . . . . . . . . . . . . . . . . . . . . . . . . 655
Solar Thermal Production . . . . . . . . . . . . . . . . . . . . . . . . . . . . . . . . . . . . . . . . . . . . . . . . . . . . . . . . . . . . . . . 656
Solar Thermal Electricity Production. . . . . . . . . . . . . . . . . . . . . . . . . . . . . . . . . . . . . . . . . . . . . . . . . . . . . 658
Solar Photovoltaic . . . . . . . . . . . . . . . . . . . . . . . . . . . . . . . . . . . . . . . . . . . . . . . . . . . . . . . . . . . . . . . . . . . . . . 658
Policy Chronology. . . . . . . . . . . . . . . . . . . . . . . . . . . . . . . . . . . . . . . . . . . . . . . . . . . . . . . . . . . . . . . . . . . . . . . . 661
Table of contents

List of figures and tables
19
Part 1 - Overview 35
Chapter 1
Figures
Figure 1-1. IEA Total Primary Energy Supply, 1970-2001 . . . . . . . . . . . . . . . . . . . . . . . . . . . . . . 42Figure 1-2. Fuel Shares of IEA Total Primary Energy Supply, 2001. . . . . . . . . . . . . . . . . . . . . 43Figure 1-3. Renewables in Primary Energy Supply, 1970-2001 . . . . . . . . . . . . . . . . . . . . . . . . 45Figure 1-4. Mix of Renewables in Primary Energy Supply, 2001 . . . . . . . . . . . . . . . . . . . . . . 46Figure 1-5. Total Primary Energy Supply from Wind, Solar and Ocean, 1990-2001 . . 47Figure 1-6. Wind, Solar and Ocean Energy Supply in Key Producing Countries,
1990-2001 . . . . . . . . . . . . . . . . . . . . . . . . . . . . . . . . . . . . . . . . . . . . . . . . . . . . . . . . . . . . . . . . . 47Figure 1-7. IEA Electricity Production, 2001 . . . . . . . . . . . . . . . . . . . . . . . . . . . . . . . . . . . . . . . . . . 48Figure 1-8. IEA Electricity Production, 1971 – 2001 . . . . . . . . . . . . . . . . . . . . . . . . . . . . . . . . . . 49Figure 1-9. Fuel Shares in IEA Electricity Production, 1971-2001 . . . . . . . . . . . . . . . . . . . . . 49
Tables
Table 1-1. Average Annual Growth Rates of Renewable Energy Sources . . . . . . . . . . . . . 43Table 1-2. Share of Renewables in Total Primary Energy Supply by Country . . . . . . . . . 44Table 1-3: Average Annual Growth of Renewable Total Primary Energy Supply
by Country . . . . . . . . . . . . . . . . . . . . . . . . . . . . . . . . . . . . . . . . . . . . . . . . . . . . . . . . . . . . . . . . . 44Table 1-4. Wind, Solar and Ocean Energy in Renewable Energy Supply by Country 48Table 1-5. Share of Renewables in IEA Electricity Production by Country. . . . . . . . . . . . 50
Chapter 2
Figures
Figure 2-1. Government Energy RD&D Budgets . . . . . . . . . . . . . . . . . . . . . . . . . . . . . . . . . . . . . . . 55Figure 2-2. Government Renewable Energy RD&D Budgets. . . . . . . . . . . . . . . . . . . . . . . . . . . 55Figure 2-3. Average Annual Renewable RD&D Budgets in IEA Countries, 1990-2002 . . . 56Figure 2-4. Virtuous Cycle in a Supportive Policy Environment . . . . . . . . . . . . . . . . . . . . . . . 58
Table
Table 2-1. RD&D Budgets in IEA Countries by Technology . . . . . . . . . . . . . . . . . . . . . . . . . . . 54
Chapter 3
Figures
Figure 3-1. Cost Competitiveness of Selected Renewable Power Technologies. . . . . . . . 62Figure 3-2. Hydropower Installed Capacity in IEA Countries . . . . . . . . . . . . . . . . . . . . . . . . . . 63Figure 3-3. Hydro Share in IEA Electricity Production, 2001 . . . . . . . . . . . . . . . . . . . . . . . . . . 64
List of Figures and Tables
20
Figure 3-4. Breakdown of Combustible Renewables and Waste Productionand Targeted Technologies . . . . . . . . . . . . . . . . . . . . . . . . . . . . . . . . . . . . . . . . . . . . . . . . . 66
Figure 3-5. Solid Biomass Installed Capacity in IEA Countries . . . . . . . . . . . . . . . . . . . . . . . . 67Figure 3-6. Solid Biomass Share in Electricity Production, 2001 . . . . . . . . . . . . . . . . . . . . . . 68Figure 3-7. Solid Biomass Share in Heat Production, 2001. . . . . . . . . . . . . . . . . . . . . . . . . . . . 69Figure 3-8. Geothermal Installed Capacity in IEA Countries . . . . . . . . . . . . . . . . . . . . . . . . . . . 71Figure 3-9. Geothermal Share in Electricity Production, 2001. . . . . . . . . . . . . . . . . . . . . . . . . 72Figure 3-10. Solar PV - Installed Capacity in IEA Countries . . . . . . . . . . . . . . . . . . . . . . . . . . . . 74Figure 3-11. Annual World PV Module Production and Building-integrated PV System
Costs, 1983-2002 . . . . . . . . . . . . . . . . . . . . . . . . . . . . . . . . . . . . . . . . . . . . . . . . . . . . . . . . . . 77Figure 3-12. Solar Thermal Electricity – Installed Capacity in IEA Countries. . . . . . . . . . . . 78 Figure 3-13. Direct Use of Solar Heat, 2001 . . . . . . . . . . . . . . . . . . . . . . . . . . . . . . . . . . . . . . . . . . . . 79Figure 3-14. Installed Wind Power Capacity in IEA Countries, 1990-2001 . . . . . . . . . . . . . 80Figure 3-15. Wind Share in Electricity Production in IEA Countries, 2001 . . . . . . . . . . . . . 81Figure 3-16. Average Turbine Size at Market Introduction . . . . . . . . . . . . . . . . . . . . . . . . . . . . . . 82Figure 3-17. Market Share of Seven Generations of Wind Turbines in Denmark . . . . . . . 82Figure 3-18. Cost and Capacity Trends in Wind Power, 1980-2001 . . . . . . . . . . . . . . . . . . . . 83
Table
Table 3-1. Breakdown of Combustible Renewables and Waste Ranked by Production,2001 . . . . . . . . . . . . . . . . . . . . . . . . . . . . . . . . . . . . . . . . . . . . . . . . . . . . . . . . . . . . . . . . . . . . . . . 66
Chapter 4
Figures
Figure 4-1. Market Deployment Policy Instruments . . . . . . . . . . . . . . . . . . . . . . . . . . . . . . . . . . . . 85Figure 4-2. The Introduction of Renewable Energy Policies by Country . . . . . . . . . . . . . . . 92
Part 2 - Country Profiles 105
Australia
Figures
Figure 1. Total Primary Energy Supply by Source . . . . . . . . . . . . . . . . . . . . . . . . . . . . . . . . . . . . 108Figure 2. Shares of TPES 2001. . . . . . . . . . . . . . . . . . . . . . . . . . . . . . . . . . . . . . . . . . . . . . . . . . . . . . . . 108Figure 3. Total Renewable Energy Supply and Policy Timeline . . . . . . . . . . . . . . . . . . . . . . 110Figure 4. Net Generating Capacity of Renewable and Waste Products. . . . . . . . . . . . . . 111Figure 5. Australia – Government Energy RD&D Budgets . . . . . . . . . . . . . . . . . . . . . . . . . . . 112Figure 6. Australia – Government Renewable Energy RD&D Budgets. . . . . . . . . . . . . . . 112Figure 7. Hydropower Capacity and Electricity Production . . . . . . . . . . . . . . . . . . . . . . . . . 115Figure 8. Hydropower Capacity . . . . . . . . . . . . . . . . . . . . . . . . . . . . . . . . . . . . . . . . . . . . . . . . . . . . . . 115Figure 9. Solid Biomass Production . . . . . . . . . . . . . . . . . . . . . . . . . . . . . . . . . . . . . . . . . . . . . . . . . . 116
List of figures and tables
List of figures and tables
21
Figure 10. Solid Biomass Production . . . . . . . . . . . . . . . . . . . . . . . . . . . . . . . . . . . . . . . . . . . . . . . . . . 116Figure 11. Biogas Capacity and Electricity Production . . . . . . . . . . . . . . . . . . . . . . . . . . . . . . . . 117Figure 12. Wind Power Capacity and Electricity Production. . . . . . . . . . . . . . . . . . . . . . . . . . 118Figure 13. Wind Power Capacity . . . . . . . . . . . . . . . . . . . . . . . . . . . . . . . . . . . . . . . . . . . . . . . . . . . . . . 118Figure 14. Solar Thermal Capacity and Electricity Production . . . . . . . . . . . . . . . . . . . . . . . . 119Figure 15. Solar Photovoltaic Capacity . . . . . . . . . . . . . . . . . . . . . . . . . . . . . . . . . . . . . . . . . . . . . . . . 120Figure 16. Solar Photovoltaic Capacity . . . . . . . . . . . . . . . . . . . . . . . . . . . . . . . . . . . . . . . . . . . . . . . . 120
Table
Table 1. Total Primary Energy Supply by Source . . . . . . . . . . . . . . . . . . . . . . . . . . . . . . . . . . . . 108
Austria
Figures
Figure 1. Total Primary Energy Supply by Source . . . . . . . . . . . . . . . . . . . . . . . . . . . . . . . . . . . . 130Figure 2. Shares of TPES 2001. . . . . . . . . . . . . . . . . . . . . . . . . . . . . . . . . . . . . . . . . . . . . . . . . . . . . . . . 130Figure 3. Total Renewable Energy Supply and Policy Timeline . . . . . . . . . . . . . . . . . . . . . . 132Figure 4. Austria – Government Energy RD&D Budgets . . . . . . . . . . . . . . . . . . . . . . . . . . . . . 133Figure 5. Austria – Government Renewable Energy RD&D Budgets . . . . . . . . . . . . . . . . 134Figure 6. Solid Biomass Capacity and Electricity Production . . . . . . . . . . . . . . . . . . . . . . . . 137Figure 7. Solid Biomass Capacity . . . . . . . . . . . . . . . . . . . . . . . . . . . . . . . . . . . . . . . . . . . . . . . . . . . . 137Figure 8. Solid Biomass Heat Production . . . . . . . . . . . . . . . . . . . . . . . . . . . . . . . . . . . . . . . . . . . . 138Figure 9. Wind Power Capacity and Electricity Production. . . . . . . . . . . . . . . . . . . . . . . . . . 140Figure 10. Wind Power Capacity . . . . . . . . . . . . . . . . . . . . . . . . . . . . . . . . . . . . . . . . . . . . . . . . . . . . . 140Figure 11. Solar Thermal Production . . . . . . . . . . . . . . . . . . . . . . . . . . . . . . . . . . . . . . . . . . . . . . . . . . 141Figure 12. Solar Photovoltaic Capacity and Electricity Production . . . . . . . . . . . . . . . . . . . 142Figure 13. Solar Photovoltaic Capacity . . . . . . . . . . . . . . . . . . . . . . . . . . . . . . . . . . . . . . . . . . . . . . . . 142
Table
Table 1. Total Primary Energy Supply by Source . . . . . . . . . . . . . . . . . . . . . . . . . . . . . . . . . . . . 130
Belgium
Figures
Figure 1. Total Primary Energy Supply by Source . . . . . . . . . . . . . . . . . . . . . . . . . . . . . . . . . . . . 156Figure 2. Shares of TPES 2001. . . . . . . . . . . . . . . . . . . . . . . . . . . . . . . . . . . . . . . . . . . . . . . . . . . . . . . . 156Figure 3. Total Renewable Energy Supply and Policy Timeline . . . . . . . . . . . . . . . . . . . . . . 158Figure 4. Belgium – Government Energy RD&D Budgets. . . . . . . . . . . . . . . . . . . . . . . . . . . . 159Figure 5. Belgium – Government Renewable Energy RD&D Budgets . . . . . . . . . . . . . . . 160Figure 6. Hydropower Capacity and Electricity Production . . . . . . . . . . . . . . . . . . . . . . . . . 165Figure 7. Hydropower Capacity . . . . . . . . . . . . . . . . . . . . . . . . . . . . . . . . . . . . . . . . . . . . . . . . . . . . . . 165Figure 8. Solid Biomass Production . . . . . . . . . . . . . . . . . . . . . . . . . . . . . . . . . . . . . . . . . . . . . . . . . . 166Figure 9. Solid Biomass Production . . . . . . . . . . . . . . . . . . . . . . . . . . . . . . . . . . . . . . . . . . . . . . . . . 166Figure 10. Wind Power Capacity and Electricity Production. . . . . . . . . . . . . . . . . . . . . . . . . . 167

22
Figure 11. Wind Power Capacity . . . . . . . . . . . . . . . . . . . . . . . . . . . . . . . . . . . . . . . . . . . . . . . . . . . . . . 167Figure 12. Solar Thermal Production . . . . . . . . . . . . . . . . . . . . . . . . . . . . . . . . . . . . . . . . . . . . . . . . . . 169
Table
Table 1. Total Primary Energy Supply by Source . . . . . . . . . . . . . . . . . . . . . . . . . . . . . . . . . . . 156
Canada
Figures
Figure 1. Total Primary Energy Supply by Source . . . . . . . . . . . . . . . . . . . . . . . . . . . . . . . . . . . . 180Figure 2. Shares of TPES 2001. . . . . . . . . . . . . . . . . . . . . . . . . . . . . . . . . . . . . . . . . . . . . . . . . . . . . . . . 180Figure 3. Total Renewable Energy Supply and Policy Timeline . . . . . . . . . . . . . . . . . . . . . . 181Figure 4. Net Generating Capacity of Renewable and Waste Products. . . . . . . . . . . . . . 182Figure 5. Canada – Government Energy RD&D Budgets . . . . . . . . . . . . . . . . . . . . . . . . . . . . 183Figure 6. Canada – Government Renewable Energy RD&D Budgets. . . . . . . . . . . . . . . . 183Figure 7. Hydropower Capacity and Electricity Production . . . . . . . . . . . . . . . . . . . . . . . . . 188Figure 8. Hydropower Capacity . . . . . . . . . . . . . . . . . . . . . . . . . . . . . . . . . . . . . . . . . . . . . . . . . . . . . 188Figure 9. Solid Biomass Production . . . . . . . . . . . . . . . . . . . . . . . . . . . . . . . . . . . . . . . . . . . . . . . . . . 189Figure 10. Solid Biomass Production . . . . . . . . . . . . . . . . . . . . . . . . . . . . . . . . . . . . . . . . . . . . . . . . . 189Figure 11. Wind Power Capacity and Electricity Production . . . . . . . . . . . . . . . . . . . . . . . . . 190Figure 12. Wind Power Capacity . . . . . . . . . . . . . . . . . . . . . . . . . . . . . . . . . . . . . . . . . . . . . . . . . . . . . 190Figure 13. Solar Photovoltaic Capacity and Electricity Production . . . . . . . . . . . . . . . . . . . 191Figure 14. Solar Photovoltaic Capacity . . . . . . . . . . . . . . . . . . . . . . . . . . . . . . . . . . . . . . . . . . . . . . . 191
Table
Table 1. Total Primary Energy Supply by Source . . . . . . . . . . . . . . . . . . . . . . . . . . . . . . . . . . . 180
Czech Republic
Figures
Figure 1. Total Primary Energy Supply by Source . . . . . . . . . . . . . . . . . . . . . . . . . . . . . . . . . . . . 204Figure 2. Shares of TPES 2001. . . . . . . . . . . . . . . . . . . . . . . . . . . . . . . . . . . . . . . . . . . . . . . . . . . . . . . . 204Figure 3. Total Renewable Energy Supply and Policy Timeline . . . . . . . . . . . . . . . . . . . . . . 206Figure 4. Hydropower Capacity and Electricity Production . . . . . . . . . . . . . . . . . . . . . . . . . 211Figure 5. Hydropower Capacity . . . . . . . . . . . . . . . . . . . . . . . . . . . . . . . . . . . . . . . . . . . . . . . . . . . . . 211Figure 6. Solid Biomass Production . . . . . . . . . . . . . . . . . . . . . . . . . . . . . . . . . . . . . . . . . . . . . . . . . . 212Figure 7. Solid Biomass Production . . . . . . . . . . . . . . . . . . . . . . . . . . . . . . . . . . . . . . . . . . . . . . . . . 212Figure 8. Wind Power Capacity . . . . . . . . . . . . . . . . . . . . . . . . . . . . . . . . . . . . . . . . . . . . . . . . . . . . . . 213
Tables
Table 1. Total Primary Energy Supply by Source . . . . . . . . . . . . . . . . . . . . . . . . . . . . . . . . . . . . 204Table 2. Contribution of Renewables to Electricity Consumption, 2000 and 2010 209
List of figures and tables

List of figures and tables
23
Denmark
Figures
Figure 1. Total Primary Energy Supply by Source . . . . . . . . . . . . . . . . . . . . . . . . . . . . . . . . . . . . 220Figure 2. Shares of TPES 2001. . . . . . . . . . . . . . . . . . . . . . . . . . . . . . . . . . . . . . . . . . . . . . . . . . . . . . . . 220Figure 3. Total Renewable Energy Supply and Policy Timeline . . . . . . . . . . . . . . . . . . . . . . 222Figure 4. Net Generating Capacity of Renewable and Waste Products. . . . . . . . . . . . . . 223Figure 5. Denmark – Government Energy RD&D Budgets . . . . . . . . . . . . . . . . . . . . . . . . . . 223Figure 6. Denmark – Government Renewable Energy RD&D Budgets . . . . . . . . . . . . . . 224Figure 7. Solid Biomass Production . . . . . . . . . . . . . . . . . . . . . . . . . . . . . . . . . . . . . . . . . . . . . . . . . . 226Figure 8. Solid Biomass Production . . . . . . . . . . . . . . . . . . . . . . . . . . . . . . . . . . . . . . . . . . . . . . . . . 226Figure 9. Solid Biomass Capacity and Electricity Production . . . . . . . . . . . . . . . . . . . . . . . . 227Figure 10. Solid Biomass Capacity . . . . . . . . . . . . . . . . . . . . . . . . . . . . . . . . . . . . . . . . . . . . . . . . . . . . 227Figure 11. Solid Biomass Capacity and Heat Production . . . . . . . . . . . . . . . . . . . . . . . . . . . . . 228Figure 12. Solid Biomass Capacity . . . . . . . . . . . . . . . . . . . . . . . . . . . . . . . . . . . . . . . . . . . . . . . . . . . . 228Figure 13. Biogas Capacity and Electricity Production . . . . . . . . . . . . . . . . . . . . . . . . . . . . . . . 229Figure 14. Biogas Capacity . . . . . . . . . . . . . . . . . . . . . . . . . . . . . . . . . . . . . . . . . . . . . . . . . . . . . . . . . . . 229Figure 15. Wind Power Capacity and Electricity Production. . . . . . . . . . . . . . . . . . . . . . . . . . 231Figure 16. Wind Power Capacity . . . . . . . . . . . . . . . . . . . . . . . . . . . . . . . . . . . . . . . . . . . . . . . . . . . . . 231Figure 17. Onshore Wind Power Price Development, Denmark, 1981-2000 . . . . . . . . 232Figure 18. Solar Thermal Production . . . . . . . . . . . . . . . . . . . . . . . . . . . . . . . . . . . . . . . . . . . . . . . . . . 233
Table
Table 1. Total Primary Energy Supply by Source . . . . . . . . . . . . . . . . . . . . . . . . . . . . . . . . . . . . 220
Finland
Figures
Figure 1. Total Primary Energy Supply by Source . . . . . . . . . . . . . . . . . . . . . . . . . . . . . . . . . . . . 250Figure 2. Shares of TPES 2001. . . . . . . . . . . . . . . . . . . . . . . . . . . . . . . . . . . . . . . . . . . . . . . . . . . . . . . . 250Figure 3. Total Renewable Energy Supply and Policy Timeline . . . . . . . . . . . . . . . . . . . . . . 252Figure 4. Finland – Government Energy RD&D Budgets . . . . . . . . . . . . . . . . . . . . . . . . . . . . 253Figure 5. Finland – Government Renewable Energy RD&D Budgets . . . . . . . . . . . . . . . . 253Figure 6. Hydropower Capacity and Electricity Production . . . . . . . . . . . . . . . . . . . . . . . . . 256Figure 7. Hydropower Capacity . . . . . . . . . . . . . . . . . . . . . . . . . . . . . . . . . . . . . . . . . . . . . . . . . . . . . . 256Figure 8. Solid Biomass Capacity and Electricity Production . . . . . . . . . . . . . . . . . . . . . . . . 257Figure 9. Solid Biomass Capacity . . . . . . . . . . . . . . . . . . . . . . . . . . . . . . . . . . . . . . . . . . . . . . . . . . . . 257Figure 10. Wind Power Capacity and Electricity Production . . . . . . . . . . . . . . . . . . . . . . . . . 258Figure 11. Wind Power Capacity . . . . . . . . . . . . . . . . . . . . . . . . . . . . . . . . . . . . . . . . . . . . . . . . . . . . . . 258
Table
Table 1. Total Primary Energy Supply by Source . . . . . . . . . . . . . . . . . . . . . . . . . . . . . . . . . . . . 250

24
France
Figures
Figure 1. Total Primary Energy Supply by Source . . . . . . . . . . . . . . . . . . . . . . . . . . . . . . . . . . . . 268Figure 2. Shares of TPES 2001. . . . . . . . . . . . . . . . . . . . . . . . . . . . . . . . . . . . . . . . . . . . . . . . . . . . . . . . 268Figure 3. Total Renewable Energy Supply and Policy Timeline . . . . . . . . . . . . . . . . . . . . . . 269Figure 4. Net Generating Capacity of Renewable and Waste Products. . . . . . . . . . . . . . 270Figure 5. France – Government Energy RD&D Budgets . . . . . . . . . . . . . . . . . . . . . . . . . . . . . 271Figure 6. France – Government Renewable Energy RD&D Budgets . . . . . . . . . . . . . . . . . 271Figure 7. Hydropower Capacity and Electricity Production . . . . . . . . . . . . . . . . . . . . . . . . . 274Figure 8. Hydropower Capacity . . . . . . . . . . . . . . . . . . . . . . . . . . . . . . . . . . . . . . . . . . . . . . . . . . . . . . 274Figure 9. Solid Biomass Heat Production . . . . . . . . . . . . . . . . . . . . . . . . . . . . . . . . . . . . . . . . . . . . 275Figure 10. Wind Power Capacity and Electricity Production. . . . . . . . . . . . . . . . . . . . . . . . . . 276Figure 11. Wind Power Capacity . . . . . . . . . . . . . . . . . . . . . . . . . . . . . . . . . . . . . . . . . . . . . . . . . . . . . . 276Figure 12. Solar Thermal Production . . . . . . . . . . . . . . . . . . . . . . . . . . . . . . . . . . . . . . . . . . . . . . . . . . 277Figure 13. Solar Photovoltaic Capacity and Electricity Production . . . . . . . . . . . . . . . . . . . 278Figure 14. Solar Photovoltaic Capacity . . . . . . . . . . . . . . . . . . . . . . . . . . . . . . . . . . . . . . . . . . . . . . . 278
Table
Table 1. Total Primary Energy Supply by Source . . . . . . . . . . . . . . . . . . . . . . . . . . . . . . . . . . . 268
Germany
Figures
Figure 1. Total Primary Energy Supply by Source . . . . . . . . . . . . . . . . . . . . . . . . . . . . . . . . . . . . 290Figure 2. Shares of TPES 2001. . . . . . . . . . . . . . . . . . . . . . . . . . . . . . . . . . . . . . . . . . . . . . . . . . . . . . . . 290Figure 3. Total Renewable Energy Supply and Policy Timeline . . . . . . . . . . . . . . . . . . . . . . 292Figure 4. Net Generating Capacity of Renewable and Waste Products. . . . . . . . . . . . . . 293Figure 5. Germany – Government Energy RD&D Budgets . . . . . . . . . . . . . . . . . . . . . . . . . . 294Figure 6. Germany – Government Renewable Energy RD&D Budgets . . . . . . . . . . . . . . 295Figure 7. Cash Flows and Energy Flows in the 1991 Electricity Feed-in Law. . . . . . . . 297Figure 8. Cash Flows and Energy Flows in the Renewable Energy Sources Act . . . . . 298Figure 9. Hydropower Capacity and Electricity Production . . . . . . . . . . . . . . . . . . . . . . . . . 300Figure 10. Hydropower Capacity . . . . . . . . . . . . . . . . . . . . . . . . . . . . . . . . . . . . . . . . . . . . . . . . . . . . . 300Figure 11. Solid Biomass Capacity and Electricity Production . . . . . . . . . . . . . . . . . . . . . . . . 302Figure 12. Solid Biomass Capacity . . . . . . . . . . . . . . . . . . . . . . . . . . . . . . . . . . . . . . . . . . . . . . . . . . . . 302Figure 13. Solid Biomass Capacity and Heat Production . . . . . . . . . . . . . . . . . . . . . . . . . . . . . 303Figure 14. Wind Power Capacity and Electricity Production . . . . . . . . . . . . . . . . . . . . . . . . . 304Figure 15. Wind Power Capacity . . . . . . . . . . . . . . . . . . . . . . . . . . . . . . . . . . . . . . . . . . . . . . . . . . . . . 304Figure 16. Solar Thermal Production . . . . . . . . . . . . . . . . . . . . . . . . . . . . . . . . . . . . . . . . . . . . . . . . . . 305Figure 17. Solar Photovoltaic Capacity and Electricity Production . . . . . . . . . . . . . . . . . . . 307Figure 18. Solar Photovoltaic Capacity . . . . . . . . . . . . . . . . . . . . . . . . . . . . . . . . . . . . . . . . . . . . . . . 307
List of figures and tables

List of figures and tables
25
Tables
Table 1. Total Primary Energy Supply by Source . . . . . . . . . . . . . . . . . . . . . . . . . . . . . . . . . . . 290Table 2. Electricity Production and Remuneration under the EEG, 2001 . . . . . . . . . . . 299Table 3. Solar Collector Capacity in Germany, 1990 – 2003 . . . . . . . . . . . . . . . . . . . . . . . 306Table 4. Support for Renewables by Federal States . . . . . . . . . . . . . . . . . . . . . . . . . . . . . . . . . 308Table 5. Development of Premium Prices under the Electricity Feed-in Law. . . . . . . 310Table 6. Federal RD&D Expenditures on Renewable Energy Technologies . . . . . . . . . 312Table 7. Remuneration Paid under the Renewable Energy Sources Act . . . . . . . . . . . . 317Table 8. Evolution of Premiums for CHP Plants . . . . . . . . . . . . . . . . . . . . . . . . . . . . . . . . . . . . 319
Greece
Figures
Figure 1. Total Primary Energy Supply by Source . . . . . . . . . . . . . . . . . . . . . . . . . . . . . . . . . . . . 322Figure 2. Shares of TPES 2001. . . . . . . . . . . . . . . . . . . . . . . . . . . . . . . . . . . . . . . . . . . . . . . . . . . . . . . . 322Figure 3. Total Renewable Energy Supply and Policy Timeline . . . . . . . . . . . . . . . . . . . . . . 323Figure 4. Greece – Government Energy RD&D Budgets. . . . . . . . . . . . . . . . . . . . . . . . . . . . . 324Figure 5. Greece – Government Renewable Energy RD&D Budgets . . . . . . . . . . . . . . . . 324Figure 6. Hydropower Capacity and Electricity Production . . . . . . . . . . . . . . . . . . . . . . . . . 327Figure 7. Hydropower Capacity . . . . . . . . . . . . . . . . . . . . . . . . . . . . . . . . . . . . . . . . . . . . . . . . . . . . . 327Figure 8. Wind Power Capacity and Electricity Production. . . . . . . . . . . . . . . . . . . . . . . . . . 328Figure 9. Wind Power Capacity . . . . . . . . . . . . . . . . . . . . . . . . . . . . . . . . . . . . . . . . . . . . . . . . . . . . . 328
Tables
Table 1. Total Primary Energy Supply by Source . . . . . . . . . . . . . . . . . . . . . . . . . . . . . . . . . . . . 322Table 2. Solar Water Heating Systems (Installed Surface Area) . . . . . . . . . . . . . . . . . . . . . 330
Hungary
Figures
Figure 1. Total Primary Energy Supply by Source . . . . . . . . . . . . . . . . . . . . . . . . . . . . . . . . . . . . 340Figure 2. Shares of TPES 2001. . . . . . . . . . . . . . . . . . . . . . . . . . . . . . . . . . . . . . . . . . . . . . . . . . . . . . . . 340Figure 3. Total Renewable Energy Supply and Policy Timeline . . . . . . . . . . . . . . . . . . . . . . 342Figure 4. Hungary – Government Energy RD&D Budgets . . . . . . . . . . . . . . . . . . . . . . . . . . . 343Figure 5. Hungary – Government Renewable Energy RD&D Budgets. . . . . . . . . . . . . . . 344Figure 6. Hydropower Capacity and Electricity Production . . . . . . . . . . . . . . . . . . . . . . . . . 347Figure 7. Solid Biomass Capacity and Heat Production . . . . . . . . . . . . . . . . . . . . . . . . . . . . . 348Figure 8. Biogas Capacity and Electricity Production . . . . . . . . . . . . . . . . . . . . . . . . . . . . . . . . 349Figure 9. Wind Power Capacity and Electricity Production. . . . . . . . . . . . . . . . . . . . . . . . . . 351
Table
Table 1. Total Primary Energy Supply by Source . . . . . . . . . . . . . . . . . . . . . . . . . . . . . . . . . . . 340

26
Ireland
Figures
Figure 1. Total Primary Energy Supply by Source . . . . . . . . . . . . . . . . . . . . . . . . . . . . . . . . . . . . 362Figure 2. Shares of TPES 2001 . . . . . . . . . . . . . . . . . . . . . . . . . . . . . . . . . . . . . . . . . . . . . . . . . . . . . . . 362Figure 3. Total Renewable Energy Supply and Policy Timeline . . . . . . . . . . . . . . . . . . . . . . 364Figure 4. Net Generating Capacity of Renewable and Waste Products. . . . . . . . . . . . . . 365Figure 5. Ireland – Government Energy RD&D Budgets . . . . . . . . . . . . . . . . . . . . . . . . . . . . . 366Figure 6. Ireland – Government Renewable Energy RD&D Budgets . . . . . . . . . . . . . . . . 366Figure 7. Hydropower Capacity and Electricity Production . . . . . . . . . . . . . . . . . . . . . . . . . 370Figure 8. Hydropower Capacity . . . . . . . . . . . . . . . . . . . . . . . . . . . . . . . . . . . . . . . . . . . . . . . . . . . . . 370Figure 9. Biogas Capacity and Electricity Production . . . . . . . . . . . . . . . . . . . . . . . . . . . . . . . . 371Figure 10. Biogas Capacity . . . . . . . . . . . . . . . . . . . . . . . . . . . . . . . . . . . . . . . . . . . . . . . . . . . . . . . . . . . 371Figure 11. Wind Power Capacity and Electricity Production. . . . . . . . . . . . . . . . . . . . . . . . . . 372Figure 12. Wind Power Capacity . . . . . . . . . . . . . . . . . . . . . . . . . . . . . . . . . . . . . . . . . . . . . . . . . . . . . 372
Tables
Table 1. Total Primary Energy Supply by Source . . . . . . . . . . . . . . . . . . . . . . . . . . . . . . . . . . . 362Table 2. Wind Connections in the Republic of Ireland, November 2003 . . . . . . . . . . 373
Italy
Figures
Figure 1. Total Primary Energy Supply by Source . . . . . . . . . . . . . . . . . . . . . . . . . . . . . . . . . . . 382Figure 2. Shares of TPES 2001. . . . . . . . . . . . . . . . . . . . . . . . . . . . . . . . . . . . . . . . . . . . . . . . . . . . . . . . 382Figure 3. Total Renewable Energy Supply and Policy Timeline . . . . . . . . . . . . . . . . . . . . . . 384Figure 4. Net Generating Capacity of Renewable and Waste Products. . . . . . . . . . . . . . 385Figure 5. Italy – Government Energy RD&D Budgets . . . . . . . . . . . . . . . . . . . . . . . . . . . . . . . . 386Figure 6. Italy – Government Renewable Energy RD&D Budgets . . . . . . . . . . . . . . . . . . . 386Figure 7. Hydropower Capacity and Electricity Production . . . . . . . . . . . . . . . . . . . . . . . . . 391Figure 8. Hydropower Capacity . . . . . . . . . . . . . . . . . . . . . . . . . . . . . . . . . . . . . . . . . . . . . . . . . . . . . 391Figure 9. Solid Biomass Capacity and Electricity Production . . . . . . . . . . . . . . . . . . . . . . . 392Figure 10. Solid Biomass Capacity . . . . . . . . . . . . . . . . . . . . . . . . . . . . . . . . . . . . . . . . . . . . . . . . . . . . 392Figure 11. Percentage of Eligible Biodiesel Production Supplied to the Market . . . . . . 393Figure 12. Geothermal Capacity and Electricity Production . . . . . . . . . . . . . . . . . . . . . . . . . 395Figure 13. Geothermal Capacity. . . . . . . . . . . . . . . . . . . . . . . . . . . . . . . . . . . . . . . . . . . . . . . . . . . . . . . 395Figure 14. Wind Power Capacity and Electricity Production . . . . . . . . . . . . . . . . . . . . . . . . . 396Figure 15. Wind Power Capacity . . . . . . . . . . . . . . . . . . . . . . . . . . . . . . . . . . . . . . . . . . . . . . . . . . . . . 396Figure 16. Solar Photovoltaic Capacity and Electricity Production . . . . . . . . . . . . . . . . . . . 397Figure 17. Solar Photovoltaic Capacity . . . . . . . . . . . . . . . . . . . . . . . . . . . . . . . . . . . . . . . . . . . . . . . 397
Tables
Table 1. Total Primary Energy Supply by Source . . . . . . . . . . . . . . . . . . . . . . . . . . . . . . . . . . . . 382
List of figures and tables

List of figures and tables
27
Table 2. Plants Eligible for Green Certificates as of 31 May 2003 . . . . . . . . . . . . . . . . . . 389Table 3. Funding for Solar PV from 2001 to 2004 . . . . . . . . . . . . . . . . . . . . . . . . . . . . . . . . . . 398
Japan
Figures
Figure 1. Total Primary Energy Supply by Source . . . . . . . . . . . . . . . . . . . . . . . . . . . . . . . . . . . . 410Figure 2. Shares of TPES 2001. . . . . . . . . . . . . . . . . . . . . . . . . . . . . . . . . . . . . . . . . . . . . . . . . . . . . . . . 410Figure 3. Total Renewable Energy Supply and Policy Timeline . . . . . . . . . . . . . . . . . . . . . . 412Figure 4. Net Generating Capacity of Renewable and Waste Products. . . . . . . . . . . . . . 413Figure 5. Japan – Government Energy RD&D Budgets . . . . . . . . . . . . . . . . . . . . . . . . . . . . . . 414Figure 6. Japan – Government Renewable Energy RD&D Budgets . . . . . . . . . . . . . . . . . . 414Figure 7. Hydropower Capacity and Electricity Production . . . . . . . . . . . . . . . . . . . . . . . . . 417Figure 8. Hydropower Capacity . . . . . . . . . . . . . . . . . . . . . . . . . . . . . . . . . . . . . . . . . . . . . . . . . . . . . 417Figure 9. Geothermal Capacity and Electricity Production . . . . . . . . . . . . . . . . . . . . . . . . . . 418Figure 10. Geothermal Capacity . . . . . . . . . . . . . . . . . . . . . . . . . . . . . . . . . . . . . . . . . . . . . . . . . . . . . . 418Figure 11. Wind Power Capacity and Electricity Production. . . . . . . . . . . . . . . . . . . . . . . . . . 419Figure 12. Wind Power Capacity . . . . . . . . . . . . . . . . . . . . . . . . . . . . . . . . . . . . . . . . . . . . . . . . . . . . . 419Figure 13. Solar Photovoltaic Capacity . . . . . . . . . . . . . . . . . . . . . . . . . . . . . . . . . . . . . . . . . . . . . . . 421Figure 14. Solar Photovoltaic Capacity . . . . . . . . . . . . . . . . . . . . . . . . . . . . . . . . . . . . . . . . . . . . . . . 421Figure 15. Evolution of the PV Incentive Scheme and Total Capacity. . . . . . . . . . . . . . . . . 422
Tables
Table 1. Total Primary Energy Supply by Source . . . . . . . . . . . . . . . . . . . . . . . . . . . . . . . . . . . 410Table 2. Residential PV System Dissemination Project . . . . . . . . . . . . . . . . . . . . . . . . . . . . . 422
Korea
Figures
Figure 1. Total Primary Energy Supply by Source . . . . . . . . . . . . . . . . . . . . . . . . . . . . . . . . . . . 434Figure 2. Shares of TPES 2001. . . . . . . . . . . . . . . . . . . . . . . . . . . . . . . . . . . . . . . . . . . . . . . . . . . . . . . . 434Figure 3. Total Renewable Energy Supply and Policy Timeline . . . . . . . . . . . . . . . . . . . . . . 436Figure 4. Hydropower Capacity and Electricity Production . . . . . . . . . . . . . . . . . . . . . . . . . 440Figure 5. Hydropower Capacity . . . . . . . . . . . . . . . . . . . . . . . . . . . . . . . . . . . . . . . . . . . . . . . . . . . . . 440Figure 6. Solid Biomass Production . . . . . . . . . . . . . . . . . . . . . . . . . . . . . . . . . . . . . . . . . . . . . . . . . . 442Figure 7. Solid Biomass Production . . . . . . . . . . . . . . . . . . . . . . . . . . . . . . . . . . . . . . . . . . . . . . . . . 442Figure 8. Wind Power Capacity and Electricity Production. . . . . . . . . . . . . . . . . . . . . . . . . . 443Figure 9. Solar Thermal Production . . . . . . . . . . . . . . . . . . . . . . . . . . . . . . . . . . . . . . . . . . . . . . . . . . 444Figure 10. Solar Photovoltaic Capacity and Electricity Production . . . . . . . . . . . . . . . . . . . 445Figure 11. Solar Photovoltaic Capacity . . . . . . . . . . . . . . . . . . . . . . . . . . . . . . . . . . . . . . . . . . . . . . . . 445
Tables
Table 1. Total Primary Energy Supply by Source . . . . . . . . . . . . . . . . . . . . . . . . . . . . . . . . . . . 434
28
Table 2. Supply of New and Renewable Energy in Korea . . . . . . . . . . . . . . . . . . . . . . . . . . 437Table 3. Biomass Production . . . . . . . . . . . . . . . . . . . . . . . . . . . . . . . . . . . . . . . . . . . . . . . . . . . . . . . . 441
Luxembourg
Figures
Figure 1. Total Primary Energy Supply by Source . . . . . . . . . . . . . . . . . . . . . . . . . . . . . . . . . . . . 456Figure 2. Shares of TPES 2001. . . . . . . . . . . . . . . . . . . . . . . . . . . . . . . . . . . . . . . . . . . . . . . . . . . . . . . . 456Figure 3. Total Renewable Energy Supply and Policy Timeline . . . . . . . . . . . . . . . . . . . . . . 458Figure 4. Net Generating Capacity of Renewable and Waste Products. . . . . . . . . . . . . . 459Figure 5. Luxembourg – Government Renewable Energy RD&D Budgets . . . . . . . . . . 459Figure 6. Hydropower Capacity and Electricity Production . . . . . . . . . . . . . . . . . . . . . . . . . 462Figure 7. Hydropower Capacity . . . . . . . . . . . . . . . . . . . . . . . . . . . . . . . . . . . . . . . . . . . . . . . . . . . . . 462Figure 8. Wind Power Capacity and Electricity Production. . . . . . . . . . . . . . . . . . . . . . . . . . 463
Table
Table 1. Total Primary Energy Supply by Source . . . . . . . . . . . . . . . . . . . . . . . . . . . . . . . . . . . 456
Netherlands
Figures
Figure 1. Total Primary Energy Supply by Source . . . . . . . . . . . . . . . . . . . . . . . . . . . . . . . . . . . . 470Figure 2. Shares of TPES 2001 . . . . . . . . . . . . . . . . . . . . . . . . . . . . . . . . . . . . . . . . . . . . . . . . . . . . . . . 470Figure 3. Total Renewable Energy Supply and Policy Timeline . . . . . . . . . . . . . . . . . . . . . . 472Figure 4. Net Generating Capacity of Renewable and Waste Products. . . . . . . . . . . . . . 473Figure 5. Netherlands – Government Energy RD&D Budgets . . . . . . . . . . . . . . . . . . . . . . . 473Figure 6. Netherlands – Government Renewable Energy RD&D Budgets . . . . . . . . . . . 474Figure 7. Solid Biomass Electricity Production . . . . . . . . . . . . . . . . . . . . . . . . . . . . . . . . . . . . . . . 477Figure 8. Wind Power Capacity and Electricity Production. . . . . . . . . . . . . . . . . . . . . . . . . . 478Figure 9. Wind Power Capacity . . . . . . . . . . . . . . . . . . . . . . . . . . . . . . . . . . . . . . . . . . . . . . . . . . . . . 478Figure 10. Solar Thermal Production . . . . . . . . . . . . . . . . . . . . . . . . . . . . . . . . . . . . . . . . . . . . . . . . . . 479Figure 11. Solar Photovoltaic Capacity and Electricity Production . . . . . . . . . . . . . . . . . . . 480Figure 12. Solar Photovoltaic Capacity . . . . . . . . . . . . . . . . . . . . . . . . . . . . . . . . . . . . . . . . . . . . . . . 480
Table
Table 1. Total Primary Energy Supply by Source . . . . . . . . . . . . . . . . . . . . . . . . . . . . . . . . . . . 470
New Zealand
Figures
Figure 1. Total Primary Energy Supply by Source . . . . . . . . . . . . . . . . . . . . . . . . . . . . . . . . . . . . 488Figure 2. Shares of TPES 2001. . . . . . . . . . . . . . . . . . . . . . . . . . . . . . . . . . . . . . . . . . . . . . . . . . . . . . . . 488Figure 3. Total Renewable Energy Supply and Policy Timeline . . . . . . . . . . . . . . . . . . . . . . 490Figure 4. Net Generating Capacity of Renewable and Waste Products. . . . . . . . . . . . . . 491
List of figures and tables
List of figures and tables
29
Figure 5. New Zealand – Government Energy RD&D Budgets . . . . . . . . . . . . . . . . . . . . . . 492Figure 6. New Zealand – Government Renewable Energy RD&D Budgets . . . . . . . . . 492Figure 7. Hydropower Capacity and Electricity Production . . . . . . . . . . . . . . . . . . . . . . . . . 494Figure 8. Hydropower Capacity . . . . . . . . . . . . . . . . . . . . . . . . . . . . . . . . . . . . . . . . . . . . . . . . . . . . . 494Figure 9. Solid Biomass Capacity and Electricity Production . . . . . . . . . . . . . . . . . . . . . . . . 495Figure 10. Solid Biomass Production . . . . . . . . . . . . . . . . . . . . . . . . . . . . . . . . . . . . . . . . . . . . . . . . . . 495Figure 11. Geothermal Capacity and Electricity Production . . . . . . . . . . . . . . . . . . . . . . . . . . 496Figure 12. Geothermal Capacity . . . . . . . . . . . . . . . . . . . . . . . . . . . . . . . . . . . . . . . . . . . . . . . . . . . . . . 496Figure 13. Wind Power Capacity and Electricity Production. . . . . . . . . . . . . . . . . . . . . . . . . . 497Figure 14. Wind Power Capacity . . . . . . . . . . . . . . . . . . . . . . . . . . . . . . . . . . . . . . . . . . . . . . . . . . . . . 497
Table
Table 1. Total Primary Energy Supply by Source . . . . . . . . . . . . . . . . . . . . . . . . . . . . . . . . . . . 488
Norway
Figures
Figure 1. Total Primary Energy Supply by Source . . . . . . . . . . . . . . . . . . . . . . . . . . . . . . . . . . . . 504Figure 2. Shares of TPES 2001. . . . . . . . . . . . . . . . . . . . . . . . . . . . . . . . . . . . . . . . . . . . . . . . . . . . . . . . 504Figure 3. Total Renewable Energy Supply and Policy Timeline . . . . . . . . . . . . . . . . . . . . . . 506Figure 4. Norway – Government Energy RD&D Budgets . . . . . . . . . . . . . . . . . . . . . . . . . . . . 507Figure 5. Norway – Government Renewable Energy RD&D Budgets . . . . . . . . . . . . . . . 507Figure 6. Hydropower Capacity and Electricity Production . . . . . . . . . . . . . . . . . . . . . . . . . 510Figure 7. Wind Power Capacity and Electricity Production. . . . . . . . . . . . . . . . . . . . . . . . . . 511Figure 8. Wind Power Capacity . . . . . . . . . . . . . . . . . . . . . . . . . . . . . . . . . . . . . . . . . . . . . . . . . . . . . 511Figure 9. Solar Photovoltaic Capacity . . . . . . . . . . . . . . . . . . . . . . . . . . . . . . . . . . . . . . . . . . . . . . . . 512Figure 10. Solar Photovoltaic Capacity . . . . . . . . . . . . . . . . . . . . . . . . . . . . . . . . . . . . . . . . . . . . . . . 512
Tables
Table 1. Total Primary Energy Supply by Source . . . . . . . . . . . . . . . . . . . . . . . . . . . . . . . . . . . 504Table 2. Cumulative Installed PV Power in Four Sub-markets . . . . . . . . . . . . . . . . . . . . . . 513
Portugal
Figures
Figure 1. Total Primary Energy Supply by Source . . . . . . . . . . . . . . . . . . . . . . . . . . . . . . . . . . . 522Figure 2. Shares of TPES 2001. . . . . . . . . . . . . . . . . . . . . . . . . . . . . . . . . . . . . . . . . . . . . . . . . . . . . . . . 522Figure 3. Total Renewable Energy Supply and Policy Timeline . . . . . . . . . . . . . . . . . . . . . . 524Figure 4. Net Generating Capacity of Renewable and Waste Products. . . . . . . . . . . . . . 525Figure 5. Portugal – Government Energy RD&D Budgets. . . . . . . . . . . . . . . . . . . . . . . . . . . . 525Figure 6. Portugal – Government Renewable Energy RD&D Budgets . . . . . . . . . . . . . . . 526Figure 7. Hydropower Capacity and Electricity Production . . . . . . . . . . . . . . . . . . . . . . . . . 528Figure 8. Hydropower Capacity . . . . . . . . . . . . . . . . . . . . . . . . . . . . . . . . . . . . . . . . . . . . . . . . . . . . . 528

30
Figure 9. Wind Power Capacity and Electricity Production. . . . . . . . . . . . . . . . . . . . . . . . . . 529Figure 10. Wind Power Capacity . . . . . . . . . . . . . . . . . . . . . . . . . . . . . . . . . . . . . . . . . . . . . . . . . . . . . 529Figure 11. Solar Thermal Production . . . . . . . . . . . . . . . . . . . . . . . . . . . . . . . . . . . . . . . . . . . . . . . . . . 530Figure 12. Cumulative Installed Photovoltaic Power in Portugal . . . . . . . . . . . . . . . . . . . . . . 531
Tables
Table 1. Total Primary Energy Supply by Source . . . . . . . . . . . . . . . . . . . . . . . . . . . . . . . . . . . . 522Table 2. Targets for Renewables Generating Capacity in 2010 . . . . . . . . . . . . . . . . . . . . . 527Table 3. Wind Capacity in December 2003 . . . . . . . . . . . . . . . . . . . . . . . . . . . . . . . . . . . . . . . . 529
Spain
Figures
Figure 1. Total Primary Energy Supply by Source . . . . . . . . . . . . . . . . . . . . . . . . . . . . . . . . . . . . 542Figure 2. Shares of TPES 2001. . . . . . . . . . . . . . . . . . . . . . . . . . . . . . . . . . . . . . . . . . . . . . . . . . . . . . . . 542Figure 3. Total Renewable Energy Supply and Policy Timeline . . . . . . . . . . . . . . . . . . . . . . 544Figure 4. Net Generating Capacity of Renewable and Waste Products. . . . . . . . . . . . . . 545Figure 5. Spain – Government Energy RD&D Budgets . . . . . . . . . . . . . . . . . . . . . . . . . . . . . . 545Figure 6. Spain – Government Renewable Energy RD&D Budgets . . . . . . . . . . . . . . . . . . 546Figure 7. Hydropower Capacity and Electricity Production . . . . . . . . . . . . . . . . . . . . . . . . . 549Figure 8. Hydropower Capacity . . . . . . . . . . . . . . . . . . . . . . . . . . . . . . . . . . . . . . . . . . . . . . . . . . . . . 549Figure 9. Solid Biomass Capacity and Electricity Production . . . . . . . . . . . . . . . . . . . . . . . . 550Figure 10. Solid Biomass Capacity . . . . . . . . . . . . . . . . . . . . . . . . . . . . . . . . . . . . . . . . . . . . . . . . . . . . 550Figure 11. Wind Power Capacity and Electricity Production. . . . . . . . . . . . . . . . . . . . . . . . . . 551Figure 12. Wind Power Capacity . . . . . . . . . . . . . . . . . . . . . . . . . . . . . . . . . . . . . . . . . . . . . . . . . . . . . 551Figure 13. Solar Photovoltaic Capacity and Electricity Production . . . . . . . . . . . . . . . . . . . 553Figure 14. Solar Photovoltaic Capacity . . . . . . . . . . . . . . . . . . . . . . . . . . . . . . . . . . . . . . . . . . . . . . . 553
Table
Table 1. Total Primary Energy Supply by Source . . . . . . . . . . . . . . . . . . . . . . . . . . . . . . . . . . . 542
Sweden
Figures
Figure 1. Total Primary Energy Supply by Source . . . . . . . . . . . . . . . . . . . . . . . . . . . . . . . . . . . . 564Figure 2. Shares of TPES 2001. . . . . . . . . . . . . . . . . . . . . . . . . . . . . . . . . . . . . . . . . . . . . . . . . . . . . . . . 564Figure 3. Total Renewable Energy Supply and Policy Timeline . . . . . . . . . . . . . . . . . . . . . . 566Figure 4. Net Generating Capacity of Renewable and Waste Products. . . . . . . . . . . . . . 567Figure 5. Sweden – Government Energy RD&D Budgets . . . . . . . . . . . . . . . . . . . . . . . . . . . . 568Figure 6. Sweden – Government Renewable Energy RD&D Budgets . . . . . . . . . . . . . . . 569Figure 7. Hydropower Capacity and Electricity Production . . . . . . . . . . . . . . . . . . . . . . . . . 572Figure 8. Hydropower Capacity . . . . . . . . . . . . . . . . . . . . . . . . . . . . . . . . . . . . . . . . . . . . . . . . . . . . . . 572 Figure 9. Solid Biomass Production . . . . . . . . . . . . . . . . . . . . . . . . . . . . . . . . . . . . . . . . . . . . . . . . . . 573
List of figures and tables
List of figures and tables
31
Figure 10. Solid Biomass Production . . . . . . . . . . . . . . . . . . . . . . . . . . . . . . . . . . . . . . . . . . . . . . . . . 573Figure 11. Solid Biomass Capacity and Electricity Production . . . . . . . . . . . . . . . . . . . . . . . 574Figure 12. Solid Biomass Capacity . . . . . . . . . . . . . . . . . . . . . . . . . . . . . . . . . . . . . . . . . . . . . . . . . . . . 574Figure 13. Solid Biomass Capacity and Heat Production . . . . . . . . . . . . . . . . . . . . . . . . . . . . . 575Figure 14. Solid Biomass Capacity . . . . . . . . . . . . . . . . . . . . . . . . . . . . . . . . . . . . . . . . . . . . . . . . . . . . 575Figure 15. Wind Power Capacity and Electricity Production . . . . . . . . . . . . . . . . . . . . . . . . . 576Figure 16. Wind Power Capacity . . . . . . . . . . . . . . . . . . . . . . . . . . . . . . . . . . . . . . . . . . . . . . . . . . . . . 576
Table
Table 1. Total Primary Energy Supply by Source . . . . . . . . . . . . . . . . . . . . . . . . . . . . . . . . . . . 564
Switzerland
Figures
Figure 1. Total Primary Energy Supply by Source . . . . . . . . . . . . . . . . . . . . . . . . . . . . . . . . . . . . 586Figure 2. Shares of TPES 2001. . . . . . . . . . . . . . . . . . . . . . . . . . . . . . . . . . . . . . . . . . . . . . . . . . . . . . . . 586Figure 3. Total Renewable Energy Supply and Policy Timeline . . . . . . . . . . . . . . . . . . . . . . 588Figure 4. Switzerland – Government Energy RD&D Budgets . . . . . . . . . . . . . . . . . . . . . . . . 589Figure 5. Switzerland – Government Renewable Energy RD&D Budgets . . . . . . . . . . . 590Figure 6. Hydropower Capacity and Electricity Production . . . . . . . . . . . . . . . . . . . . . . . . . 594Figure 7. Hydropower Capacity . . . . . . . . . . . . . . . . . . . . . . . . . . . . . . . . . . . . . . . . . . . . . . . . . . . . . . 594Figure 8. Solid Biomass Production . . . . . . . . . . . . . . . . . . . . . . . . . . . . . . . . . . . . . . . . . . . . . . . . . . 595Figure 9. Solid Biomass Production . . . . . . . . . . . . . . . . . . . . . . . . . . . . . . . . . . . . . . . . . . . . . . . . . 595Figure 10. Wind Power Capacity and Electricity Production. . . . . . . . . . . . . . . . . . . . . . . . . . 596Figure 11. Wind Power Capacity . . . . . . . . . . . . . . . . . . . . . . . . . . . . . . . . . . . . . . . . . . . . . . . . . . . . . 596Figure 12. Solar Thermal Production . . . . . . . . . . . . . . . . . . . . . . . . . . . . . . . . . . . . . . . . . . . . . . . . . . 597Figure 13. Solar Photovoltaic Capacity and Electricity Production . . . . . . . . . . . . . . . . . . . 598Figure 14. Solar Photovoltaic Capacity . . . . . . . . . . . . . . . . . . . . . . . . . . . . . . . . . . . . . . . . . . . . . . . 598
Tables
Table 1. Total Primary Energy Supply by Source . . . . . . . . . . . . . . . . . . . . . . . . . . . . . . . . . . . 586Table 2. Potential Increases in Renewable Energy Use . . . . . . . . . . . . . . . . . . . . . . . . . . . . . 591Table 3. Cantonal Renewable Energy Programmes, 2003 . . . . . . . . . . . . . . . . . . . . . . . . . . 593
Turkey
Figures
Figure 1. Total Primary Energy Supply by Source . . . . . . . . . . . . . . . . . . . . . . . . . . . . . . . . . . . . 606Figure 2. Shares of TPES 2001. . . . . . . . . . . . . . . . . . . . . . . . . . . . . . . . . . . . . . . . . . . . . . . . . . . . . . . . 606Figure 3. Total Renewable Energy Supply and Policy Timeline . . . . . . . . . . . . . . . . . . . . . . 608Figure 4. Turkey – Government Energy RD&D Budgets . . . . . . . . . . . . . . . . . . . . . . . . . . . . . 609Figure 5. Turkey – Government Renewable Energy RD&D Budgets . . . . . . . . . . . . . . . . . 609Figure 6. Hydropower Capacity and Electricity Production . . . . . . . . . . . . . . . . . . . . . . . . . 612
32
Figure 7. Hydropower Capacity . . . . . . . . . . . . . . . . . . . . . . . . . . . . . . . . . . . . . . . . . . . . . . . . . . . . . 612Figure 8. Geothermal Capacity and Production . . . . . . . . . . . . . . . . . . . . . . . . . . . . . . . . . . . . . 613Figure 9. Wind Power Capacity and Electricity Production. . . . . . . . . . . . . . . . . . . . . . . . . . 614Figure 10. Wind Power Capacity . . . . . . . . . . . . . . . . . . . . . . . . . . . . . . . . . . . . . . . . . . . . . . . . . . . . . . 614
Table
Table 1. Total Primary Energy Supply by Source . . . . . . . . . . . . . . . . . . . . . . . . . . . . . . . . . . . 606
United Kingdom
Figures
Figure 1. Total Primary Energy Supply by Source . . . . . . . . . . . . . . . . . . . . . . . . . . . . . . . . . . . . 618Figure 2. Shares of TPES 2001. . . . . . . . . . . . . . . . . . . . . . . . . . . . . . . . . . . . . . . . . . . . . . . . . . . . . . . . 618Figure 3. Total Renewable Energy Supply and Policy Timeline . . . . . . . . . . . . . . . . . . . . . . 620Figure 4. Net Generating Capacity of Renewable and Waste Products. . . . . . . . . . . . . . 621Figure 5. United Kingdom – Government Energy RD&D Budgets. . . . . . . . . . . . . . . . . . . 621Figure 6. United Kingdom – Government Renewable Energy RD&D Budgets . . . . . . 622Figure 7. Hydropower Capacity and Electricity Production. . . . . . . . . . . . . . . . . . . . . . . . . 625Figure 8. Solid Biomass Capacity and Electricity Production . . . . . . . . . . . . . . . . . . . . . . . . 626Figure 9. Solid Biomass Capacity . . . . . . . . . . . . . . . . . . . . . . . . . . . . . . . . . . . . . . . . . . . . . . . . . . . . 626Figure 10. Solid Biomass Capacity and Heat Production . . . . . . . . . . . . . . . . . . . . . . . . . . . . 627Figure 11. Solid Biomass Capacity . . . . . . . . . . . . . . . . . . . . . . . . . . . . . . . . . . . . . . . . . . . . . . . . . . . . 627Figure 12. Biogas Capacity and Electricity Production . . . . . . . . . . . . . . . . . . . . . . . . . . . . . . . . 628Figure 13. Biogas Capacity . . . . . . . . . . . . . . . . . . . . . . . . . . . . . . . . . . . . . . . . . . . . . . . . . . . . . . . . . . . 628Figure 14. Wind Power Capacity and Electricity Production. . . . . . . . . . . . . . . . . . . . . . . . . . 629Figure 15. Wind Power Capacity . . . . . . . . . . . . . . . . . . . . . . . . . . . . . . . . . . . . . . . . . . . . . . . . . . . . . 629Figure 16. Solar Photovoltaic Capacity and Electricity Production . . . . . . . . . . . . . . . . . . . 630Figure 17. Solar Photovoltaic Capacity . . . . . . . . . . . . . . . . . . . . . . . . . . . . . . . . . . . . . . . . . . . . . . . 630
Tables
Table 1. Total Primary Energy Supply by Source . . . . . . . . . . . . . . . . . . . . . . . . . . . . . . . . . . . 618Table 2. Renewables Obligation Requirement to Supply . . . . . . . . . . . . . . . . . . . . . . . . . . . 624
United States
Figures
Figure 1. Total Primary Energy Supply by Source . . . . . . . . . . . . . . . . . . . . . . . . . . . . . . . . . . . . 642Figure 2. Shares of TPES 2001. . . . . . . . . . . . . . . . . . . . . . . . . . . . . . . . . . . . . . . . . . . . . . . . . . . . . . . . 642Figure 3. Total Renewable Energy Supply and Policy Timeline . . . . . . . . . . . . . . . . . . . . . . 643Figure 4. United States – Government Energy RD&D Budgets . . . . . . . . . . . . . . . . . . . . . . 646Figure 5. United States – Government Renewable Energy RD&D Budgets. . . . . . . . . . 646
List of figures and tables

List of figures and tables
33
Figure 6. Hydropower Capacity and Electricity Production . . . . . . . . . . . . . . . . . . . . . . . . . 649Figure 7. Hydropower Capacity . . . . . . . . . . . . . . . . . . . . . . . . . . . . . . . . . . . . . . . . . . . . . . . . . . . . . 649Figure 8. Biogas Capacity and Production . . . . . . . . . . . . . . . . . . . . . . . . . . . . . . . . . . . . . . . . . . 651Figure 9. Solid Biomass Capacity and Electricity Production . . . . . . . . . . . . . . . . . . . . . . . 651Figure 10. Liquid Biofuels Capacity and Production . . . . . . . . . . . . . . . . . . . . . . . . . . . . . . . . . 652Figure 11. Geothermal Capacity and Electricity Production . . . . . . . . . . . . . . . . . . . . . . . . . 654Figure 12. Geothermal Capacity . . . . . . . . . . . . . . . . . . . . . . . . . . . . . . . . . . . . . . . . . . . . . . . . . . . . . . 654Figure 13. Wind Power Capacity and Electricity Production . . . . . . . . . . . . . . . . . . . . . . . . . 655Figure 14. Wind Power Capacity . . . . . . . . . . . . . . . . . . . . . . . . . . . . . . . . . . . . . . . . . . . . . . . . . . . . . 655Figure 15. Solar Thermal Capacity . . . . . . . . . . . . . . . . . . . . . . . . . . . . . . . . . . . . . . . . . . . . . . . . . . . . 657Figure 16. Solar Thermal Electricity Generation . . . . . . . . . . . . . . . . . . . . . . . . . . . . . . . . . . . . . . . 658Figure 17. Solar Photovoltaic Capacity . . . . . . . . . . . . . . . . . . . . . . . . . . . . . . . . . . . . . . . . . . . . . . . 659Figure 18. Solar Photovoltaic Capacity . . . . . . . . . . . . . . . . . . . . . . . . . . . . . . . . . . . . . . . . . . . . . . . 659Figure 19. International Shipments and Cost per kWh of PV Systems . . . . . . . . . . . . . . . . 660Figure 20. Growth in PV Markets in the United States . . . . . . . . . . . . . . . . . . . . . . . . . . . . . . . . 660
Tables
Table 1. Total Primary Energy Supply by Source . . . . . . . . . . . . . . . . . . . . . . . . . . . . . . . . . . . 642Table 2. Net Generating Capacity of Renewables . . . . . . . . . . . . . . . . . . . . . . . . . . . . . . . . . . 645Table 3. Solar Water Heating Systems. . . . . . . . . . . . . . . . . . . . . . . . . . . . . . . . . . . . . . . . . . . . . . . 657


Part 1
Overview
Renewable Energy — Market and policy trends in IEA Countries


Introduction
37
Energy policy-makers in IEA Member countries are facing the daunting challenge of achieving energysecurity, environmental protection and economic efficiency (the three Es). Renewables are considered bymany policy-makers to contribute to improving energy security and protecting the environment. On anaverage cost basis, some renewables in the best locations are competitive with conventional energysources, however, in many cases renewables are still not competitive. Supportive policies are still neededto encourage the further development and deployment especially of “new” renewables in energy markets.
The development range of renewable energy technologies varies from relatively mature technologies, suchas hydropower, solar hot water, geothermal and some forms of biomass, to emerging technologies such aswind power, new biomass technologies, solar photovoltaic and concentrating solar power. There are alsoother forms of renewables, such as ocean energy and production of hydrogen from renewables that arenot yet past the demonstration stage of development and which are not covered in this study. Therenewables industry includes decentralised manufacturers and systems companies, electric utilities,independent power producers and retail equipment suppliers. Policy-makers need to account for the fullspectrum of highly diverse technology development, as well as the characteristics of the industry and therules by which the market operates.
In 2001, the most recent year for which complete official data are available, the share of renewable energyin total primary energy supply of IEA countries was 5.5%. The share of oil was 40.9%, gas 21.4%, coal20.5% and nuclear 11.6%.
An assessment of renewable energy policies needs to be based on their costs and effectiveness. It should alsoexamine how renewables mix with other energy alternatives, including energy efficiency, advanced nuclearpower, carbon sequestration and hydrogen. Therefore, efforts to deploy new energy technologies into themarketplace need to identify and address three groups of policies that affect technology development andmarket uptake:
● Research and Innovation Policies that support the development of new and improved technologies;
● Market Deployment Policies that underwrite the cost of introducing technologies into the market toimprove technical performance and to encourage development of an industry;
● Market-Based Energy Policies that provide a competitive market framework, and may internaliseexternalities in terms of energy security, environmental protection and economic efficiency.
Taken together, these policies constitute the energy policy context that governments need to establish withrespect to renewables.
Research and Innovation Policies support technology innovation through basic and applied research up tothe demonstration phase. Governments have traditionally played a decisive role in both framing andfunding RD&D policies at the national level and in international collaborations. Governments have alsobeen a catalyst in using research and innovation policy to motivate adequate private sector involvementin research, development and demonstration. In the context of the various types of renewables, twoquestions arise. Has public renewable RD&D in IEA countries been effective? Is the increasing importanceattached to renewables adequately reflected in the allocation of public RD&D budgets?
Market Deployment Policies are typically supported by governments to facilitate the market introductionof new technologies with perceived societal value. Such public policy support is generally for a limited
Introduction

38
time, taking into account the progress needed to make new technologies competitive. Market deploymentpolicies seek to:
● increase technical performance and differentiation of a product or service;
● improve technology cost-competitiveness;
● achieve a sustainable level of production and market share;
● enhance public awareness and social acceptance;
● move towards a sustainable energy system.
Governments have to choose policies with a view to which renewable technologies merit marketdeployment policy support and the extent and duration of such support. Have market deployment policiesfor renewables in IEA Member countries been effective based on the criteria above? Most governmentshave introduced incentives for market deployment of renewable energy technologies because generalenergy policies do not fully value energy security, economic development and environmental benefits. Tosome extent, direct funding of renewables is seen as by-passing the process of internalising the externalcosts of energy supply. Should this be the case in the future?
It is important that governments evaluate the direct and indirect costs of these policies. This will requiremore concerted efforts to record information on policy costs, market data and technology costimprovements. How long and to what extent should these market deployment policies be maintained fora given renewable type to avoid market distortions or the infant industry trap? How does the costs/benefitratio of these policies compare with that of other options? These are issues that the IEA intends to pursuethrough further analysis.
Market-Based Energy Policies ideally should give participants a policy framework that provides a basis toselect the best energy choice at the optimal price while internalising externalities related to energysecurity, environmental protection and economic development. How effective is the present energy policyframework from a three-Es policy perspective? Should governments consider the same policy instrumentsfor all renewable technologies and/or for all carbon reducing energy technologies? What are the economiccriteria to take into account, when analysing different local and national impacts? How can renewablespolicies be harmonised with environmental or energy security policies? How will grids deal withincreasingly distributed and intermittent electricity supply? The answers to these and other questions arebeyond the scope of this assessment, but their importance for the competitiveness of renewables isundeniable.
This study provides a comprehensive review of renewable energy markets in IEA countries, and renewableenergy policies related to research and innovation and to market deployment strategies. The informationis intended to provide a valuable resource for IEA Member governments to assess their renewables optionsin particular, and to pursue their energy strategies more generally.
Part 1 of this book provides overview information and statistics on renewable energy since 1970 andtrends in research and innovation policies in IEA countries. It also categorises and explains the largenumber of market deployment policies and measures in IEA countries.
Part 2 contains profiles for each IEA country with data on renewable energy supply and an examinationof market trends. The profiles take a historic look at RD&D and market deployment policies andmeasures.
Part 1: Overview

Introduction
39
Parts 1 and 2 draw on statistical data provided by official government sources and compiled in RenewablesInformation 2003.1 More recent data were provided by official and other national sources. Information isas current and complete as possible at the time of publication. It represents the IEA’s assessment ofrenewable energy markets, building on official submissions by national administrations.
An economic analysis of direct and indirect costs and benefits of renewable energy policies is not includedin this study. Such an analysis would provide policy-makers with additional information for consideringthe role of renewables in the broad policy portfolio and the choice of measures in promoting renewables.This issue will be addressed by the IEA in co-operation with the governments and industries of Membercountries in the future.
1. Renewables Information, IEA/OECD, Paris, 2003.


Chapter 1: Renewables in IEA Energy Supply
41
Chapter 1Renewables in IEA Energy Supply
Highlights
• The share of renewables in total primary energy supply in IEA countries increased from 141.5 Mtoe(4.6%) in 1970 to 280.9 Mtoe (5.5%) in 2001. Over the three decades, renewable energy supplyincreased at an annual average rate of 2.2% compared with 1.6% for TPES. Most of the increase inthe share of renewables occurred from 1970 to 1990, when renewables supply grew by 2.8% a year.The annual growth rate of renewables supply slowed to 1.2% from 1990 to 2001.
• More mature renewables such as hydro and geothermal power did not increase and even declined,in the 1990s in many IEA countries. Energy supply from “new” renewables, e.g., wind and solar,however, grew by 23% per year from 1980 to 2001. Thus some countries experienced growth ratesof between 4% and 16% in total renewable energy supply from 1990 to 2001, including the CzechRepublic, Denmark, Germany, Ireland, Korea, Netherlands and the United Kingdom.
• Combustible renewables and waste (CRW) supply grew by 3% per year on average from 1970. In2001 CRW accounted for the largest share at 55% (161 Mtoe) of renewables supply in IEA countries,although this figure also includes energy from some non-renewable waste. Hydropower accountedfor 35% (102.1 Mtoe), geothermal for 8% (22.5 Mtoe) and wind, solar and tide/ocean/wave for 2%(6.4 Mtoe) of the IEA renewable energy supply.
• Renewable energy sources fuelled 24% of total electricity production in 1970, but this share fell to15% by 2001.
• Not surprisingly, hydropower was the major source of renewable-based electricity generation at 86% in2001. Combustible renewables and waste accounted for 9% of electricity production from renewables,solar, wind and ocean energy for about 3% and 2% from geothermal. Because new renewablesrepresent such a small share of total electricity generation, their rapid growth over the past decade wasunable to compensate for limited growth of more mature technologies.
• Denmark dramatically increased its share of renewables in electricity generation from 0.1% in 1970to 16% in 2001, mostly due to growth in wind power. Belgium, the United Kingdom, theNetherlands, Hungary and the Czech Republic also significantly increased their share of renewablesin electricity generation.
• Solar and wind markets expanded by an average of almost 18% per year from 1970 to 2001. Growth rateshave further accelerated in 2002-2003 according to preliminary data. However, statistics for these “newrenewables” are still not completely reliable, particularly for solar PV and solar heating and cooling in the1970s and 1980s due to the small, modular nature of these technologies.
• Solar and wind for electricity generation have increased significantly, but these new renewables areconcentrated in just a few IEA countries. In 2001, 86% of the IEA total installed wind power capacity wasin four countries: Denmark, Germany, Spain and the United States. About 84% of the installed solarphotovoltaic capacity was in three countries: Germany, Japan and the United States. Solar thermalelectricity production in 2001 was 556 GWh, almost entirely generated in the United States.
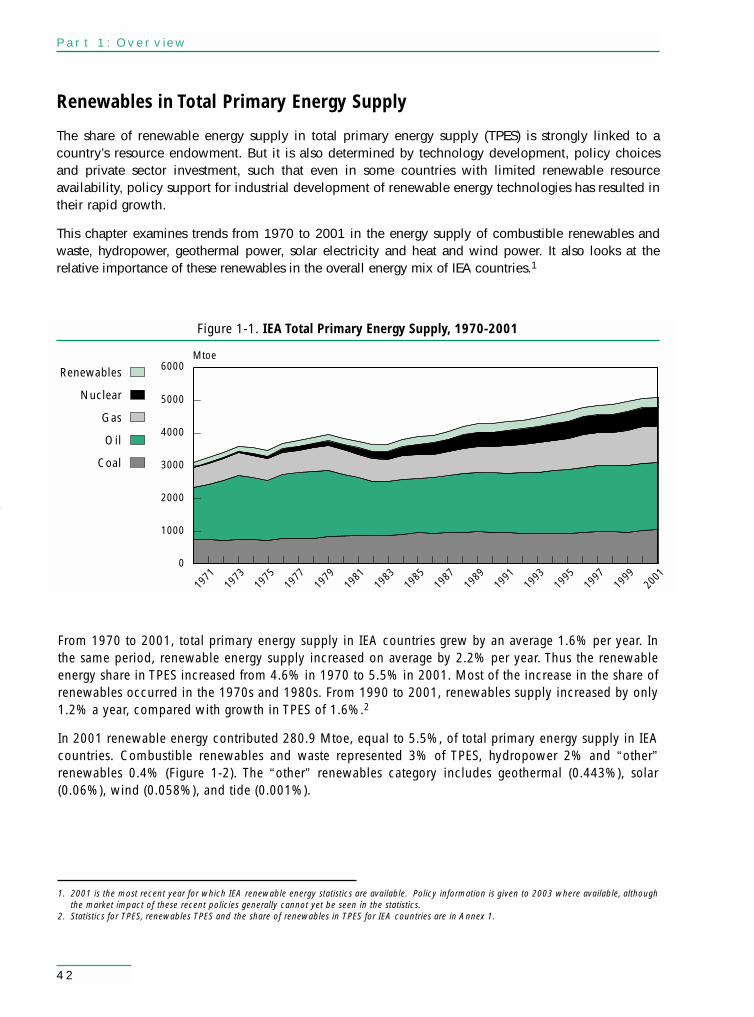
42
Renewables in Total Primary Energy Supply
The share of renewable energy supply in total primary energy supply (TPES) is strongly linked to acountry’s resource endowment. But it is also determined by technology development, policy choicesand private sector investment, such that even in some countries with limited renewable resourceavailability, policy support for industrial development of renewable energy technologies has resulted intheir rapid growth.
This chapter examines trends from 1970 to 2001 in the energy supply of combustible renewables andwaste, hydropower, geothermal power, solar electricity and heat and wind power. It also looks at therelative importance of these renewables in the overall energy mix of IEA countries.1
Part 1: Overview
Renewables
Nuclear
Gas
Oil
Coal
Mtoe
0
1000
6000
2000
3000
4000
5000
1971
1973
1975
1977
1979
1981
1983
1985
1987
1989
1991
1993
1995
1997
1999
2001
Figure 1-1. IEA Total Primary Energy Supply, 1970-2001
From 1970 to 2001, total primary energy supply in IEA countries grew by an average 1.6% per year. Inthe same period, renewable energy supply increased on average by 2.2% per year. Thus the renewableenergy share in TPES increased from 4.6% in 1970 to 5.5% in 2001. Most of the increase in the share ofrenewables occurred in the 1970s and 1980s. From 1990 to 2001, renewables supply increased by only1.2% a year, compared with growth in TPES of 1.6%.2
In 2001 renewable energy contributed 280.9 Mtoe, equal to 5.5%, of total primary energy supply in IEAcountries. Combustible renewables and waste represented 3% of TPES, hydropower 2% and “other”renewables 0.4% (Figure 1-2). The “other” renewables category includes geothermal (0.443%), solar(0.06%), wind (0.058%), and tide (0.001%).
1. 2001 is the most recent year for which IEA renewable energy statistics are available. Policy information is given to 2003 where available, althoughthe market impact of these recent policies generally cannot yet be seen in the statistics.
2. Statistics for TPES, renewables TPES and the share of renewables in TPES for IEA countries are in Annex 1.
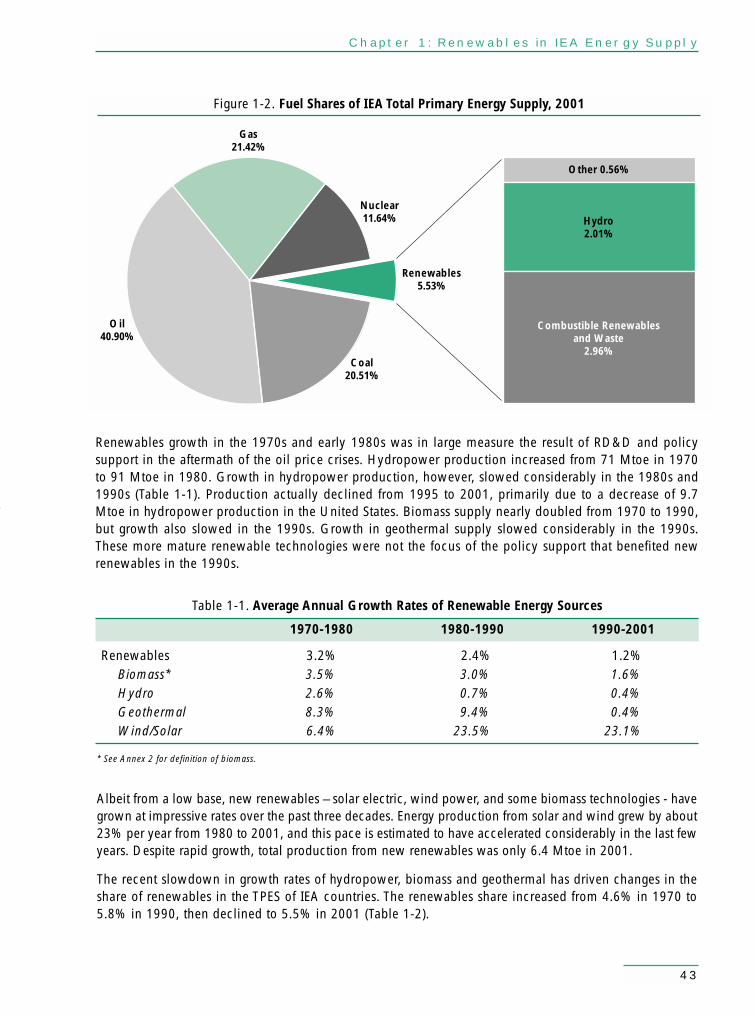
Chapter 1: Renewables in IEA Energy Supply
43
Renewables growth in the 1970s and early 1980s was in large measure the result of RD&D and policysupport in the aftermath of the oil price crises. Hydropower production increased from 71 Mtoe in 1970to 91 Mtoe in 1980. Growth in hydropower production, however, slowed considerably in the 1980s and1990s (Table 1-1). Production actually declined from 1995 to 2001, primarily due to a decrease of 9.7Mtoe in hydropower production in the United States. Biomass supply nearly doubled from 1970 to 1990,but growth also slowed in the 1990s. Growth in geothermal supply slowed considerably in the 1990s.These more mature renewable technologies were not the focus of the policy support that benefited newrenewables in the 1990s.
Gas21.42%
Nuclear11.64%
Renewables5.53%
Coal20.51%
Oil40.90%
Figure 1-2. Fuel Shares of IEA Total Primary Energy Supply, 2001
Other 0.56%
Hydro2.01%
Combustible Renewablesand Waste
2.96%
1970-1980 1980-1990 1990-2001
Renewables 3.2% 2.4% 1.2%Biomass* 3.5% 3.0% 1.6%Hydro 2.6% 0.7% 0.4%Geothermal 8.3% 9.4% 0.4%Wind/Solar 6.4% 23.5% 23.1%
Table 1-1. Average Annual Growth Rates of Renewable Energy Sources
Albeit from a low base, new renewables – solar electric, wind power, and some biomass technologies - havegrown at impressive rates over the past three decades. Energy production from solar and wind grew by about23% per year from 1980 to 2001, and this pace is estimated to have accelerated considerably in the last fewyears. Despite rapid growth, total production from new renewables was only 6.4 Mtoe in 2001.
The recent slowdown in growth rates of hydropower, biomass and geothermal has driven changes in theshare of renewables in the TPES of IEA countries. The renewables share increased from 4.6% in 1970 to5.8% in 1990, then declined to 5.5% in 2001 (Table 1-2).
* See Annex 2 for definition of biomass.

44
Renewable Energy Supply - Overall TrendsData aggregated across the IEA masks different patterns among the countries. Average annual growthbetween 1970 and 2001 was about 3% or higher, e.g., in Austria (3.3%), Denmark (6.3%), Norway (2.8%)and Sweden (2.8%).
The share of renewables in total energy supply in 2001 was significant in Austria at 21.5%, Norway at 45%and Sweden at 29.1%. Denmark experienced a notable increase in the renewable energy share of TPESfrom 1.6% in 1970 to 10.4% in 2001. In some countries the share of renewables in energy supply was lowin 2001 even though renewables had exhibited rapid growth: Belgium (1%), the Czech Republic (1.5%),Germany (2.6%), Ireland (1.7%), Korea (1.1%), the Netherlands (1.4%) and the United Kingdom (1.1%). InCanada, Italy, Spain, Japan and the United States, the share of renewables in TPES remained relativelyunchanged from 1970 to 2001.
Seven IEA countries had a decline in the share of renewables in TPES between 1970 and 2001. Therenewables share declined from 8.4% in 1970 to 5.7% in 2001 in Australia. The share in Finland decreased
Part 1: Overview
Table 1-2. Share of Renewables in Total PrimaryEnergy Supply by Country
Country 1970 1990 1995 2001
Australia 8.4% 5.8% 5.9% 5.7%Austria 13.2% 19.9% 21.3% 21.5%Belgium 0.1% 1.3% 1.3% 1.0%Canada 15.1% 16.1% 16.5% 15.6%Czech Republic 0.2%* 0.3% 1.4% 1.5%Denmark 1.6% 6.6% 7.1% 10.4%Finland 27.6% 19.5% 21.2% 23.0%France 4.5% 6.8% 7.2% 6.8%Germany 1.3% 1.6% 1.9% 2.6%Greece 8.4% 5.0% 5.5% 4.6%Hungary 2.8% 1.4% 2.1% 1.6%Ireland 1.1% 1.6% 2.0% 1.7%Italy 5.6% 4.3% 4.9% 5.7%Japan 2.5% 3.1% 2.9% 3.1%Korea 0.7%* 0.6% 0.6% 1.1%Luxembourg 0.2% 1.0% 1.6% 1.8%Netherlands 0.0% 1.0% 1.0% 1.4%New Zealand 28.7% 34.7% 32.6% 25.8%Norway 36.5% 50.1% 47.4% 45.0%Portugal 20.8% 15.7% 13.1% 13.7%Spain 6.2% 6.8% 5.4% 6.5%Sweden 17.2% 25.1% 26.2% 29.1%Switzerland 17.1% 13.1% 15.6% 16.2%Turkey 34.3% 18.2% 17.4% 13.0%United Kingdom 0.2% 0.5% 0.8% 1.1%United States 3.7% 5.2% 5.2% 4.4%IEA Total 4.6% 5.8% 5.9% 5.5%
* Data from 1971.
Table 1-3. Average Annual Growthof Renewable Total Primary Energy
Supply by Country
Country Average Growthper year 1990 - 2001
Australia 2.35%Austria 2.57%Belgium -0.62%Canada 1.38%Czech Republic 15.86%Denmark 5.99%Finland 2.96%France 1.57%Germany 4.20%Greece 1.62%Hungary 0.40%Ireland 4.08%Italy 3.71%Japan 1.47%Korea 13.30%Luxembourg 6.25%Netherlands 4.84%New Zealand -0.20%Norway 0.30%Portugal 2.14%Spain 2.58%Sweden 2.26%Switzerland 3.23%Turkey -0.29%United Kingdom 8.55%United States -0.09%IEA Total 1.17%

Chapter 1: Renewables in IEA Energy Supply
45
from 27.6% in 1970 to 23% to 2001; in Greece from 8.4% to 4.6%, in Hungary from 2.8% to 1.6%; inNew Zealand from 28.7% to 25.8%; in Portugal from 20.8% to 13.7%; and in Turkey from 34.3% to 13%.Of these countries, only Finland reversed this trend in the 1990s.
Renewable Energy Supply - Trends: 1990 to 2001Growth rates of renewable energy supply differed among IEA countries even more in the 1990 to 2001period. In Korea, average annual growth in renewable energy supply was 13.3% and in the United Kingdomit was 8.55%. Whereas in the United States the renewable energy supply declined by 0.12% per year from1990 to 2001 due to more stringent environmental regulations, uncertainties about policy continuity andregulatory issues. The renewable energy supply in Turkey declined by 0.29% per year over the periodpartly as a result of an overall economic decline.
From 1990 to 2001, growth in TPES outpaced growth in renewable energy supply in Belgium, Norway, Spain,Portugal, Japan, Canada, Greece and New Zealand. The share of renewables in TPES declined in these countriesdue to policies favouring nuclear and natural gas, declines in biomass use and high economic growth rates.3
Average annual growth in renewable energy supply was more than 2% in sixteen IEA countries: Australia(2.4%), Austria (2.6%), the Czech Republic (15.9%), Denmark (5.6 %), Finland (3.0%), Germany (4.2%),Ireland (4.1%), Italy (3.7%), Korea (13.3%), Luxembourg (6.3%), Netherlands (4.8%), Portugal (2.1%),Spain (2.6%), Sweden (2.3%), Switzerland (3.2%) and the United Kingdom (8.6%). Most of these countrieshave well-established and consistent support policies for renewables.
The Mix of Renewables in Primary Energy Supply In 1970, hydropower accounted for 50.1% (70.9 Mtoe) of renewable energy supply, followed bycombustible renewables and waste (CRW) with 47.1% (66.7 Mtoe) and geothermal with 2.8% (3.9 Mtoe).Over the next three decades the composition changed due to more rapid growth in CRW supply (2.9%)compared with hydropower (1.2%). In 2001, CRW accounted for 55.2% (161.1 Mtoe) of total renewablessupply, hydropower for 35% (102.1 Mtoe), geothermal for 7.7% (22.5 Mtoe) and solar and wind for2.2 % (6.4 Mtoe).
Mtoe
0
50
350
100
150
200
250
300
1971
1973
1975
1977
1979
1981
1983
1985
1987
1989
1991
1993
1995
1997
1999
2001
Figure 1-3. Renewables in Primary Energy Supply, 1970-2001
CombustibleRenewables
and Waste
Hydro
Solarand Wind
Geothermal
3. See country profiles for a more detailed discussion.

46
Growth in combustible renewables and waste supply between 1970 and 2001 in IEA countries reflects thedevelopment of advanced waste and biomass generation technologies and more stringent waste disposaland pollution regulations. Another factor was the economic and environmental benefits for industry andcitizens that derived from producing energy from industrial and municipal waste and solid biomass (fromwood chips to straw) whenever available.
Geothermal supply increased by 8.3% per year, from 3.9 Mtoe in 1970 to 21.5 Mtoe in 1990. Growthslowed dramatically to 0.4% per year from 1990 to 2001. RD&D and policy support for geothermal wassubstantial following the oil price crises of the 1970s, but most incentives had been phased out ordiminished by the 1990s.
Combined energy production from solar, wind, and ocean sources grew by 17.5% per year from 1970 to2001. Annual growth was even faster (23.1%) from 1990 to 2001, but still by 2001 these new renewablesaccounted for only 2.2% of IEA renewable energy supply.
Figure 1-4 shows the mix of renewable energy supply in IEA countries in 2001. The largest quantities arein the United States with 103.3 Mtoe and Canada with 39.1 Mtoe. Renewables contributed significantlyin France, Japan and Sweden with more than 15 Mtoe, while supply in Norway was 11.8 Mtoe and inGermany 11 Mtoe.
Part 1: Overview
Mtoe
0
120
20
40
60
80
100
Figure 1-4. Mix of Renewables in Primary Energy Supply, 2001
Austri
a
Austra
lia
Belgium
Canad
a
Czech
Rep
ublic
Denmark
Finlan
d
Franc
e
German
y
Greece
Hunga
ry
Irelan
dIta
lyJap
anKor
ea
Luxe
mbour
g
Netherl
ands
New Z
ealan
d
Norway
Portu
gal
Spain
Swed
en
Switz
erlan
d
Turke
y
United
King
dom
United
State
s
CombustibleRenewables
and Waste
Hydro
Geothermal
Solar and Wind
Combustible renewables and waste accounted for the highest share of renewable energy supplyin fifteen IEA countries in 2001. Those with a CRW share greater than 75% of renewables supply include:Australia, Belgium, Denmark, Finland, Germany, Hungary, Netherlands and Norway.
Figure 1-4 shows that hydropower was the largest share of renewables supply in eleven IEA countries:Austria (52%), Canada (73 %), Greece (72%), Czech Republic (77%), Ireland (60 %), Italy (417%),Korea (84%), Luxembourg (77%), New Zealand (43%), Switzerland (66%) and the United Kingdom(85%).
Note: Renewable energy supply in Figure 1-4 includes the non-renewable portion of MSW. See Annex 2 for details.

Chapter 1: Renewables in IEA Energy Supply
47
Geothermal resources were a major contributor to renewable energy supply in Italy (32%), New Zealand(22%), Japan (18%), the United States (13%), and Turkey (7%).
Figures 1-5 and 1-6 show growth in new renewables, i.e., solar, wind and ocean, from 1990 to 2001. Growthtrends of these new renewable sources for selected countries with major shares are shown in Table 1-4.Wind power in particular experienced rapid growth in Germany, Denmark, Turkey, Spain and Greece. Themarket deployment policies that have spurred this growth are outlined in Chapter 4.
Solar Thermal
Wind
US data available in 1999
Japan data available in 1998
SolarPhotovoltaics
Tide, Waveand Ocean
Mtoe
0
1
7
2
3
4
5
6
1990
1991
1992
1993
1994
1995
1996
1997
1998
1999
2000
2001
Figure 1-5. Total Primary Energy Supply from Wind, Solar and Ocean, 1990-20014
United States
Japan
Spain
Greece
Turkey
Australia
France
Germany
Denmark
Other IEA
Mtoe
0
1
7
2
3
4
5
6
1990
1991
1992
1993
1994
1995
1996
1997
1998
1999
2000
2001
Figure 1-6. Wind, Solar and Ocean Energy Supply in Key Producing Countries, 1990-2001
US data available in 1999
Japan data available in 1998
4. Statistics for wind, solar and ocean energy provided by IEA Member countries are incomplete. The data for European countries are relativelyreliable and consistent from 1990. Japanese data are considered to be reliable from 1998 and US data from 1999. Both Japan and the United Statesare reviewing and revising renewables data. All IEA countries are starting to compile separate statistics for solar, wind and ocean technologies. Currentdata do not provide a consistent time-series for off-grid solar photovoltaics or for roof-top solar hot water systems. This makes an analysis of markettrends in solar, wind and ocean energy based on IEA data very difficult. Chapter 3 gives a more complete overview of these technologies based onother sources.

48
Renewables in IEA Electricity Supply
Renewables accounted for 15.1% of electricity production in IEA countries in 2001, compared with coal(38%), nuclear (24.9%), natural gas (16.9%), and oil (5.1%).
Composition of the renewable share of electricity production in 2001 was hydropower at 86.3%,combustible renewables and waste at 9.1%, solar, wind and ocean energy at 2.7% and geothermalat 1.9%.
Part 1: Overview
Mtoe 1990 1998 1999 2000 2001 Growth Growth Growthrates rates rates
per year per year per year1990-2001 1998-2001 1999-2001
Australia 0.08 0.09 0.10 0.10 0.13 4.03% 11.24% 13.48%Denmark 0.05 0.25 0.27 0.37 0.38 19.18% 14.81% 18.72%France 0.06 0.07 0.07 0.08 0.08 2.81% 5.42% 8.34%Germany 0.01 0.48 0.55 0.90 1.06 47.61% 30.46% 38.53%Greece 0.06 0.10 0.11 0.14 0.17 10.24% 18.55% 22.31%Japan n.a 0.87 0.79 0.82 0.77 n.a -4.13% -1.47%Spain 0.00 0.14 0.27 0.44 0.64 71.19% 64.57% 54.86%Turkey 0.03 0.21 0.24 0.26 0.29 23.77% 11.58% 10.87%United States n.a. n.a. 1.98 1.97 1.91 n.a. n.a. -1.75%Other 0.07 0.39 0.44 0.53 0.62 22.58% 16.87% 19.28%
n.a. = not available
Table 1-4. Wind, Solar and Ocean Energy in Renewable Energy Supply by Country
Gas16.9%
Nuclear24.9%
Renewables15.1%
Coal38.0%
Oil5.1%
Figure 1-7. IEA Electricity Production, 2001
CombustibleRenewablesand Waste
1.4%
Solar and Wind0.4%
Geothermal0.3%
Hydro 13.0%
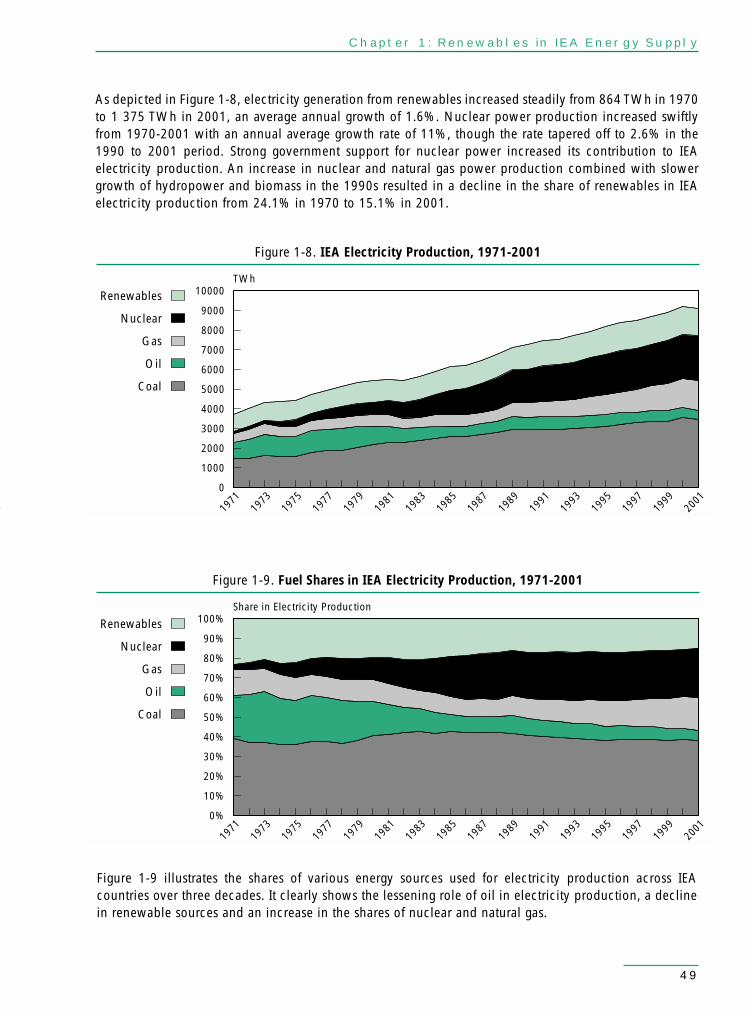
Chapter 1: Renewables in IEA Energy Supply
49
As depicted in Figure 1-8, electricity generation from renewables increased steadily from 864 TWh in 1970to 1 375 TWh in 2001, an average annual growth of 1.6%. Nuclear power production increased swiftlyfrom 1970-2001 with an annual average growth rate of 11%, though the rate tapered off to 2.6% in the1990 to 2001 period. Strong government support for nuclear power increased its contribution to IEAelectricity production. An increase in nuclear and natural gas power production combined with slowergrowth of hydropower and biomass in the 1990s resulted in a decline in the share of renewables in IEAelectricity production from 24.1% in 1970 to 15.1% in 2001.
Renewables
Nuclear
Gas
Oil
Coal
TWh
0
1000
10000
2000
3000
4000
5000
6000
7000
8000
9000
1971
1973
1975
1977
1979
1981
1983
1985
1987
1989
1991
1993
1995
1997
1999
2001
Figure 1-8. IEA Electricity Production, 1971-2001
Renewables
Nuclear
Gas
Oil
Coal
Share in Electricity Production
0%
10%
100%
20%
30%
40%
50%
60%
70%
80%
90%
1971
1973
1975
1977
1979
1981
1983
1985
1987
1989
1991
1993
1995
1997
1999
2001
Figure 1-9. Fuel Shares in IEA Electricity Production, 1971-2001
Figure 1-9 illustrates the shares of various energy sources used for electricity production across IEAcountries over three decades. It clearly shows the lessening role of oil in electricity production, a declinein renewable sources and an increase in the shares of nuclear and natural gas.
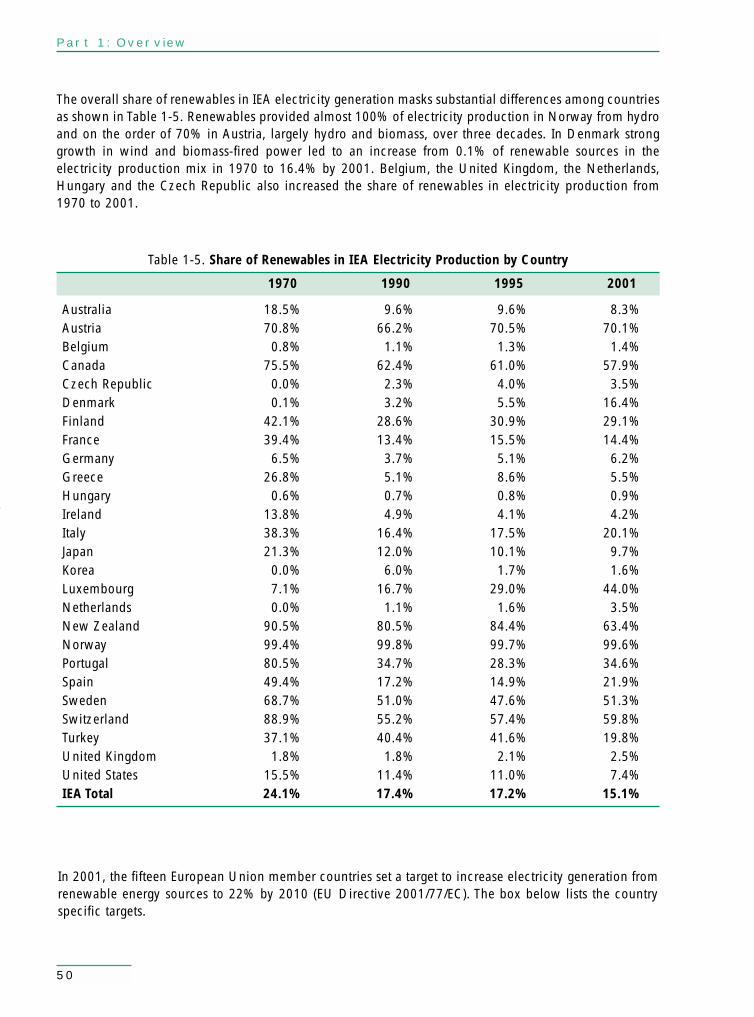
50
The overall share of renewables in IEA electricity generation masks substantial differences among countriesas shown in Table 1-5. Renewables provided almost 100% of electricity production in Norway from hydroand on the order of 70% in Austria, largely hydro and biomass, over three decades. In Denmark stronggrowth in wind and biomass-fired power led to an increase from 0.1% of renewable sources in theelectricity production mix in 1970 to 16.4% by 2001. Belgium, the United Kingdom, the Netherlands,Hungary and the Czech Republic also increased the share of renewables in electricity production from1970 to 2001.
Part 1: Overview
1970 1990 1995 2001
Australia 18.5% 9.6% 9.6% 8.3%Austria 70.8% 66.2% 70.5% 70.1%Belgium 0.8% 1.1% 1.3% 1.4%Canada 75.5% 62.4% 61.0% 57.9%Czech Republic 0.0% 2.3% 4.0% 3.5%Denmark 0.1% 3.2% 5.5% 16.4%Finland 42.1% 28.6% 30.9% 29.1%France 39.4% 13.4% 15.5% 14.4%Germany 6.5% 3.7% 5.1% 6.2%Greece 26.8% 5.1% 8.6% 5.5%Hungary 0.6% 0.7% 0.8% 0.9%Ireland 13.8% 4.9% 4.1% 4.2%Italy 38.3% 16.4% 17.5% 20.1%Japan 21.3% 12.0% 10.1% 9.7%Korea 0.0% 6.0% 1.7% 1.6%Luxembourg 7.1% 16.7% 29.0% 44.0%Netherlands 0.0% 1.1% 1.6% 3.5%New Zealand 90.5% 80.5% 84.4% 63.4%Norway 99.4% 99.8% 99.7% 99.6%Portugal 80.5% 34.7% 28.3% 34.6%Spain 49.4% 17.2% 14.9% 21.9%Sweden 68.7% 51.0% 47.6% 51.3%Switzerland 88.9% 55.2% 57.4% 59.8%Turkey 37.1% 40.4% 41.6% 19.8%United Kingdom 1.8% 1.8% 2.1% 2.5%United States 15.5% 11.4% 11.0% 7.4%IEA Total 24.1% 17.4% 17.2% 15.1%
Table 1-5. Share of Renewables in IEA Electricity Production by Country
In 2001, the fifteen European Union member countries set a target to increase electricity generation fromrenewable energy sources to 22% by 2010 (EU Directive 2001/77/EC). The box below lists the countryspecific targets.

Chapter 1: Renewables in IEA Energy Supply
51
European Union Member Country Target for 2010% Electricity Generation from Renewables
Austria 78.1Belgium 6Denmark 29Germany 12.5Finland 31.5France 21Greece 20.1Ireland 13.2Italy 22Luxembourg 5.7Netherlands 9Portugal 39Spain 29.4Sweden 60United Kingdom 10


Chapter 2: Research, Development and demonstration Trends
53
Chapter 2Research, Development and Demonstration Trends
Highlights
• Total government energy research, development and demonstration (RD&D) budgets increasedsharply after the oil price shocks in the 1970s. Budgets declined to about half of their peaklevels by 1987 and remained relatively stable to 2002. As a percentage of total RD&D funding,funding for renewables was higher from 1974 through 1986 than in the period since 1987.
• Renewable energy technologies accounted for just 7.7% of total government energy RD&Dfunding from 1987 to 2002. Over this period, the shares of renewable energy technologies outof total energy RD&D funding were:
Solar photovoltaic 2.7%Biomass 1.6%Wind energy 1.1%Geothermal 0.9%Solar heating and cooling 0.7%Solar thermal electric 0.5%Ocean energy 0.1%Large hydro 0.1%Small hydro 0.04%
• The United States, Japan and Germany accounted for 70.4% of IEA government renewableenergy RD&D funding in the 1974 – 2002 period.
• The decreasing share of public funding for energy RD&D allocated to renewable energyappears to be inconsistent with presumed political intentions in many IEA countries to increasethe share of renewables in TPES.
• Information on RD&D spending in the private sector generally is not in the public domain.Therefore, it is difficult to determine the impact of private sector spending on renewable energymarkets, but general patterns can be discerned. RD&D support for mature technologies such aslarge hydropower has been provided by utilities, turbine and generator manufacturers andother industries related to the electricity system infrastructure. Municipal authorities areincreasingly interested in extracting the energy component of waste “resources” such as refuseand landfills, and they often benefit from both public and private sector RD&D.
• Renewable technologies such as solar photovoltaic, solar heating and cooling and oceanenergy are heavily dependant on public RD&D budgets.

54
Government RD&D Expenditures in IEA Member Countries1
IEA governments allocated about US$ 291 billion (2002 prices and exchange rates) for energy RD&Dfrom 1974 to 2002. Figure 2-1 shows government budget outlays for energy RD&D in this period. Inresponse to the oil price crisis, total IEA government investment for energy RD&D was about US$7 billion in 1974. Budget outlays peaked in 1981 at US$ 16 billion, but then declined to about US$9 billion in 1987. From 1987 to 2002, funding was relatively stable, averaging about US$ 9 billion from1987 to 1991 and US$ 7.5 to 8 billion in the 1990s. Total energy RD&D expenditures in 2002 were justunder US$ 8 billion (49% of the 1980 value). Renewable energy RD&D expenditures in 2001, at US$696 million, were about 35% of the 1980 value.
Aggregate IEA energy RD&D budget outlays for nuclear fission, fossil fuels and renewables decreased inthe late 1980s and 1990s, while funding for nuclear fusion, conservation and power and storagetechnologies increased. RD&D investments in hydrogen and fuel cells (included in the “other technology”category) rose considerably in the 1990s and early 2000.
Part 1: Overview
1. IEA countries have not reported RD&D budgets for every year, so the IEA Secretariat has estimated the missing data in order to construct a completetime series for this analysis. The estimations are based on the overall IEA trend for each individual technology. The RD&D data in this section may differfrom the country profiles, since the profiles are based only on reported data.2. Data may not add up in some cases due to the estimations of the IEA Secretariat.
Budget Shares in Budget Shares in Budget Shares inby Technology Energy by Technology Energy by Technology Energy
1974-2002 RD&D 1974-1986 RD&D 1987-2002 RD&D(million US$) 1974-2002 (million US$) 1974-1986 (million US$) 1987-2002
Nuclear Fission 137 529 47.3% 84 866 53.6% 52 663 39.7%Fossil Fuels 36 842 12.7% 20 559 13.0% 16 284 12.3%Nuclear Fusion 30 562 10.5% 15 948 10.1% 14 615 11.0%“Other” Technologies 29 212 10.0% 10 599 6.7% 18 613 14.0%Renewable Energy 23 550 8.1% 13 317 8.4% 10 234 7.7%
Solar Heating & Cooling 3 024 1.0% 2 140 1.4% 885 0.7%Solar Photo-Electric 6 354 2.2% 2 717 1.7% 3 636 2.7%Solar Thermal-Electric 2 555 0.9% 1 889 1.2% 666 0.5%Wind 2 910 1.0% 1 445 0.9% 1 465 1.1%Ocean 754 0.3% 626 0.4% 128 0.1%Biomass 3 578 1.2% 1 495 0.9% 2 083 1.6%Geothermal 4 088 1.4% 2 867 1.8% 1 221 0.9%Large Hydro (>10 MW) 93 0.0% 0.00 0.0% 93 0.1%Small Hydro (<10 MW) 49 0.0% 0.18 0.0% 49 0.0%
Conservation 23 479 8.1% 8 607 5.4% 14 872 11.2%Power & Storage Technology 9 844 3.4% 4 344 2.7% 5 500 4.1%Total All Energy 291 020 100.0% 158 240 100.0% 132 781 100.0%
Table 2-1. RD&D Budgets in IEA Countries by Technology2

Chapter 2: Research, Development and demonstration Trends
55
1974
1976
1978
1980
1982
1984
1986
1988
1990
1992
1994
1996
1998
2000
2002
Million US$ (2002 prices and exchange rates)
0
18000
2000
4000
6000
8000
10000
12000
14000
16000
Figure 2-1. Government Energy RD&D Budgets3
Other Tech./Research
Conservation
Power & StorageTech.
Nuclear Fusion
Nuclear Fission
RenewableEnergy
Fossil Fuels
Million US$ (2002 prices and exchange rates)
0
2500
500
1000
1500
2000
Figure 2-2. Government Renewable Energy RD&D Budgets3
Large Hydro(>10 MW)
SolarThermal-Electric
SolarPhoto-ElectricSolar Heating
& Cooling
Small Hydro(<10 MW)
GeothermalBiomass
WindOcean
1974
1976
1978
1980
1982
1984
1986
1988
1990
1992
1994
1996
1998
2000
Government Renewable Energy RD&D Budgets
IEA countries’ renewable energy RD&D budgets totalled about US$ 23.55 billion, some 8% of totalenergy RD&D funding from 1974 to 2002. In 1974, renewable energy RD&D was US$ 65 million.Expenditures for renewables RD&D grew rapidly in the late 1970s and peaked in 1980 at just under US$2 billion. Expenditures declined by about two-thirds in the early 1980s but have been relatively stablesince the late 1980s, in the range of US$ 550 million to US$ 700 million. Annual expenditures onrenewables RD&D for all IEA countries averaged about US$ 650 million from 1990 to 2002, 7.7% of totalgovernment energy RD&D budgets.
3. Data are not available for the Czech Republic or Korea.

56
Germany, Japan and the United States accounted for about 66% of total renewables RD&D funding in theperiod 1990 to 2002. Italy, the Netherlands and Switzerland accounted for an additional 15%. Thesesix countries combined invested US$ 531 million per year on average for renewable energy RD&D. TheUnited States had the highest average renewables RD&D budget of US$ 236.9 million per year. The averageannual budget in Japan was US$ 110.9 million and in Germany US$ 82.8 million between 1990 and 2002.
Part 1: Overview
Million US$ (2002 prices and exchange rates)
0
250
50
100
150
200
Figure 2-3. Average Annual Renewable RD&D Budgets in IEA Countries, 1990-2002
Large Hydro(>10 MW)
SolarThermal-Electric
SolarPhoto-Electric
Solar Heating& Cooling
Geothermal
Biomass
Wind
Ocean
Austra
lia
Austri
a
Belgium
Canad
a
Czech
Rep
ublic
Denmark
Finlan
d
Franc
e
German
y
Greece
Hunga
ry
Irelan
dIta
lyJap
anKor
ea
Luxe
mbour
g
Netherl
ands
New Z
ealan
d
Norway
Portu
gal
Spain
Swed
en
Switz
erlan
d
Turke
y
United
King
dom
United
State
s
Renewable energy RD&D funding priorities usually reflect resource endowments. For example, NewZealand and Turkey have major geothermal resources, and 70% of RD&D funding in New Zealand and45% in Turkey was for geothermal in the 1990-2002 period. Norway allocated 35% of its renewablesRD&D to large hydropower. On average, biomass accounts for more than 40% of the renewables RD&Dbudgets in Austria, Canada, Finland, Hungary and Sweden. About 43% of renewables RD&D in Denmarkand 37% in the United Kingdom went to wind energy. Both countries have significant wind energypotential. Natural resource endowments, however, do not always dictate renewable energy RD&Dpriorities. Germany has limited solar resources, but its budget for PV represented 48% of its renewableenergy RD&D budget from 1990 to 2002.
RD&D budget priorities in the six IEA countries with the largest outlays for renewable energy from 1990to 2002 are outlined below.
Germany
Technology Share of National Share of National Average RenewablesEnergy R&D Budgets Renewables RD&D Budgets Budget 1990-2002
1990-2002 1990-2002 (Millions US $)
Photovoltaic 12.5% 48.4% 40.1Wind 5.9% 22.7% 18.8

Chapter 2: Research, Development and demonstration Trends
57
Italy
Technology Share of National Share of National Average RenewablesEnergy R&D Budgets Renewables RD&D Budgets Budget 1990-2002
1990-2002 1990-2002 (Millions US $)
Photovoltaic 5.0% 46.8% 15.9Wind 2.4% 23.0% 7.8
Japan
Technology Share of National Share of National Average RenewablesEnergy R&D Budgets Renewables RD&D Budgets Budget 1990-2002
1990-2002 1990-2002 (Millions US $)
Photovoltaic 2.1% 59.6% 66.1Geothermal 0.9% 26.0% 28.8
Netherlands
Technology Share of National Share of National Average RenewablesEnergy R&D Budgets Renewables RD&D Budgets Budget 1990-2002
1990-2002 1990-2002 (Millions US $)
Photovoltaic 7.7% 37.7% 12.3Wind 5.3% 26.0% 8.5Biomass 4.8% 23.4% 7.7
Switzerland
Technology Share of National Share of National Average RenewablesEnergy R&D Budgets Renewables RD&D Budgets Budget 1990-2002
1990-2002 1990-2002 (Millions US $)
Photovoltaic 8.0% 32.5% 10.8Solar Heating & Cooling 4.9% 20.1% 6.7
United States
Technology Share of National Share of National Average RenewablesEnergy R&D Budgets Renewables RD&D Budgets Budget 1990-2002
1990-2002 1990-2002 (Millions US $)
Photovoltaic 2.9% 32.6% 77.3Biomass 2.3% 25.5% 60.3Geothermal 1.2% 12.9% 30.6
Renewables RD&D and the Private SectorPrivate sector involvement in renewable energy RD&D is limited, with a few country and technologyexceptions, despite the fact that RD&D is the driving force for innovation, cost reduction and marketdeployment opportunities for renewable energy technologies. Private sector companies are well-suited tocarry out applied research, but they are often hesitant to invest in research projects from whichcompetitors could gain. On the other hand, if research is publicly funded, then technologicaladvancements become part of the public domain.
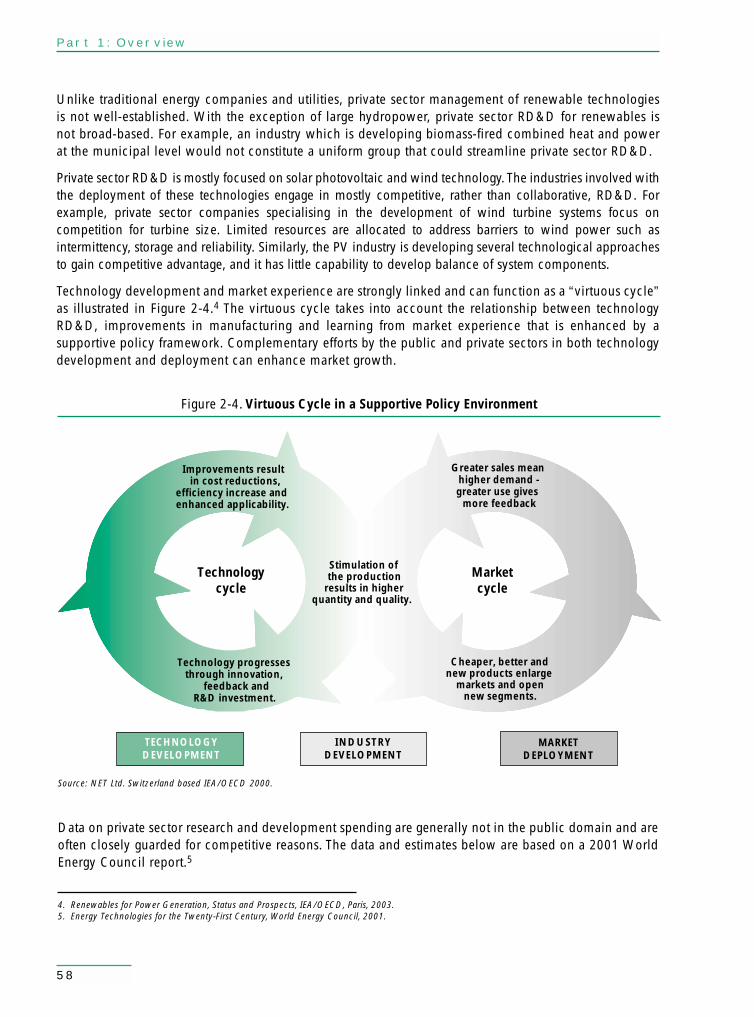
58
Unlike traditional energy companies and utilities, private sector management of renewable technologiesis not well-established. With the exception of large hydropower, private sector RD&D for renewables isnot broad-based. For example, an industry which is developing biomass-fired combined heat and powerat the municipal level would not constitute a uniform group that could streamline private sector RD&D.
Private sector RD&D is mostly focused on solar photovoltaic and wind technology. The industries involved withthe deployment of these technologies engage in mostly competitive, rather than collaborative, RD&D. Forexample, private sector companies specialising in the development of wind turbine systems focus oncompetition for turbine size. Limited resources are allocated to address barriers to wind power such asintermittency, storage and reliability. Similarly, the PV industry is developing several technological approachesto gain competitive advantage, and it has little capability to develop balance of system components.
Technology development and market experience are strongly linked and can function as a “virtuous cycle”as illustrated in Figure 2-4.4 The virtuous cycle takes into account the relationship between technologyRD&D, improvements in manufacturing and learning from market experience that is enhanced by asupportive policy framework. Complementary efforts by the public and private sectors in both technologydevelopment and deployment can enhance market growth.
Part 1: Overview
Figure 2-4. Virtuous Cycle in a Supportive Policy Environment
TECHNOLOGYDEVELOPMENT
MARKETDEPLOYMENT
INDUSTRYDEVELOPMENT
Cheaper, better andnew products enlarge
markets and opennew segments.
Greater sales meanhigher demand -greater use gives
more feedback
Technology progressesthrough innovation,
feedback andR&D investment.
Stimulation ofthe production
results in higherquantity and quality.
Improvements resultin cost reductions,
efficiency increase andenhanced applicability.
Technologycycle
Marketcycle
Source: NET Ltd. Switzerland based IEA/OECD 2000.
4. Renewables for Power Generation, Status and Prospects, IEA/OECD, Paris, 2003.5. Energy Technologies for the Twenty-First Century, World Energy Council, 2001.
Data on private sector research and development spending are generally not in the public domain and areoften closely guarded for competitive reasons. The data and estimates below are based on a 2001 WorldEnergy Council report.5
Chapter 2: Research, Development and demonstration Trends
59
For the United States, private sector spending on renewable energy RD&D is aggregated with data forconservation and end-use efficiency. The total for the three categories was US$ 429 million in 1985, butdeclined 48% by 1996 when spending was US$ 221 million.
In Japan, total spending on renewable energy RD&D has fluctuated within a fairly narrow band, exceptfor a period of low expenditures between 1988 and 1990 by both the government and private sector.Private sector spending on solar energy technologies nearly doubled between 1990 and 1997. Windenergy RD&D expenditures also experienced an increase in the 1990s. Government and private sectorRD&D spending patterns have been broadly similar over the period.
In Austria, private sector spending on renewable energy RD&D was about 31% to 37% of the governmentlevel between 1993 and 1998. Industry spending increased nearly 70% over the period and more than80% was allocated to biomass technologies.
In Denmark, private sector RD&D spending on renewable energy data is available for 1995, 1997 and1998. There was an 89% increase in spending by wind turbine manufacturers between 1995 and 1998.Total private sector renewable energy RD&D spending was US$100 million in 1998, nearly five timeshigher than public spending.
In Spain, the private sector has spent only modest amounts on renewable energy RD&D in recent years.Since 1995 the government has accounted for more than 90% of RD&D spending on renewable energy.
In Korea, private sector RD&D expenditure for renewable energy was about US$ 13.4 million in 1998. In1993, some companies directed their RD&D budgets to renewable waste technologies. Some privatecompanies have undertaken RD&D for hydropower and electricity generation technologies.
In the Netherlands, private sector energy RD&D investments are on par with government energy RD&Dbudgets. However, renewable energy RD&D is predominantly financed by the public sector.
In Germany, public and private funding for RD&D was US$ 42 billion in 1997. The private sectoraccounted for nearly 62% (US$ 24 billion) of the total. In the late 1970s, the public and private sectorseach funded roughly half of Germany's energy RD&D. More recently, the private sector has assumed alarger role.
In Canada, private sector investments in renewable energy RD&D were flat in real terms at C$ 22 millionbetween 1983 and 1995. With the restructuring of the electric utility industry, RD&D for renewable energymay decline as the private sector generally views renewable technologies as unlikely to achieve widemarket penetration in the near-term.

Chapter 3: Market and Policy Trends in Renewable Energy Technologies
61
Chapter 3Market and Policy Trends in Renewable Energy Technologies
This chapter provides an overview of market and policy trends for the following renewable energytechnologies:1
● Hydropower
● Bioenergy
● Geothermal
● Solar photovoltaic
● Solar thermal
● Wind power.
In this chapter solar thermal electric and solar thermal heating and cooling are both included in the solarthermal energy section. Biomass electricity generation, biomass heat production, biogas electricitygeneration and biofuels are covered in the section on bioenergy. Reference is made to commercialgeothermal heat, but most of the section on geothermal energy focuses on electricity generation. Installedcapacity, electricity and/or heat production, technology development and costs, and policy trends arepresented for each technology.
Except for large hydropower and combustible renewables and waste plants, the average costs ofrenewable electricity are not widely competitive with wholesale electricity prices. However, dependingon the technology, application and site, costs are competitive with grid electricity or commercial heatproduction. Figure 3-1 shows the cost range of electricity from renewable resources. To identify andexploit market opportunities, it is necessary to assess the competitiveness of specific applications andservices in distinct local circumstances, be it large-scale on-grid applications, niche markets on and off-grid, or other specific market situations.
Under best conditions – optimised system design, siting and resource availability – electricity frombiomass, small hydropower, wind and geothermal power plants can produce electricity at costs rangingfrom US$ 0.02 to 0.05/kWh. Some biomass applications are competitive as well as geothermal heatproduction in specific sites. Solar thermal heat and hot water applications are competitive in somecountries. Other solar technologies are not as competitive. Yet in some countries where supportivepolicy frameworks have been established, solar technologies can compete with retail electricity. Forexample, California and south-western states in the United States have viable markets for solartechnologies.
1. Other renewable energy technologies, such as ocean energy and the production of hydrogen from renewable resources, have not yet reached marketentry, or are just entering markets. They are not covered in this study. Ocean energy, including tidal power, wave energy, ocean current power and oceanthermal power, is in various stages of RD&D or deployed in niche markets. Similarly, production of hydrogen from renewable resources is not yet acommercially viable technology.
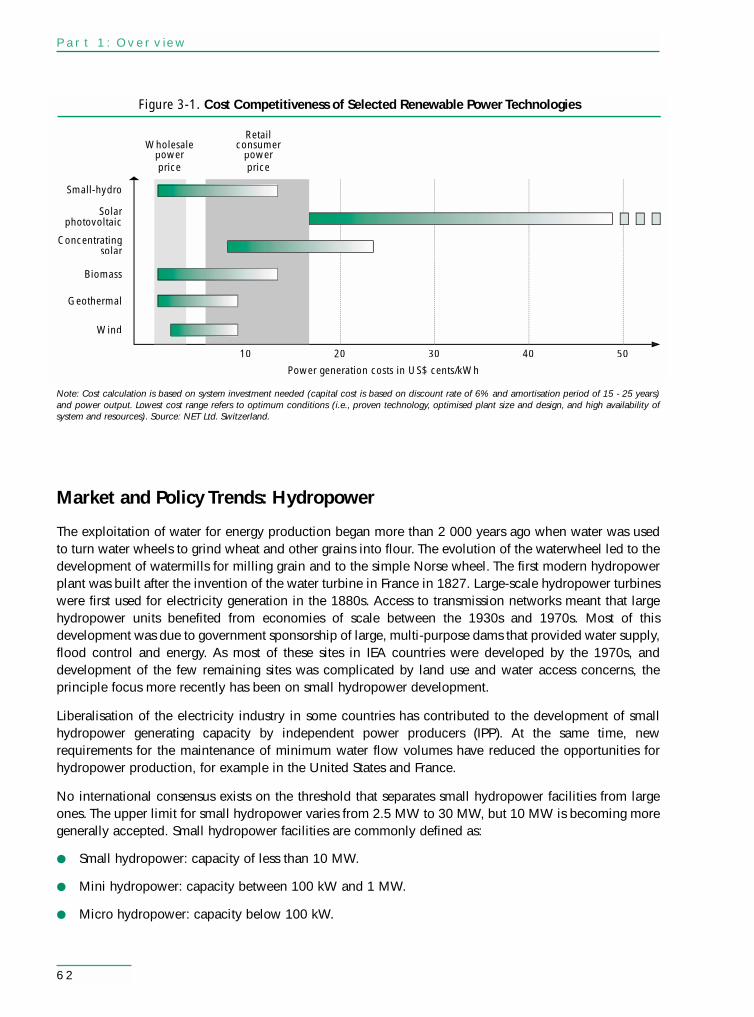
62
Market and Policy Trends: Hydropower
The exploitation of water for energy production began more than 2 000 years ago when water was usedto turn water wheels to grind wheat and other grains into flour. The evolution of the waterwheel led to thedevelopment of watermills for milling grain and to the simple Norse wheel. The first modern hydropowerplant was built after the invention of the water turbine in France in 1827. Large-scale hydropower turbineswere first used for electricity generation in the 1880s. Access to transmission networks meant that largehydropower units benefited from economies of scale between the 1930s and 1970s. Most of thisdevelopment was due to government sponsorship of large, multi-purpose dams that provided water supply,flood control and energy. As most of these sites in IEA countries were developed by the 1970s, anddevelopment of the few remaining sites was complicated by land use and water access concerns, theprinciple focus more recently has been on small hydropower development.
Liberalisation of the electricity industry in some countries has contributed to the development of smallhydropower generating capacity by independent power producers (IPP). At the same time, newrequirements for the maintenance of minimum water flow volumes have reduced the opportunities forhydropower production, for example in the United States and France.
No international consensus exists on the threshold that separates small hydropower facilities from largeones. The upper limit for small hydropower varies from 2.5 MW to 30 MW, but 10 MW is becoming moregenerally accepted. Small hydropower facilities are commonly defined as:
● Small hydropower: capacity of less than 10 MW.
● Mini hydropower: capacity between 100 kW and 1 MW.
● Micro hydropower: capacity below 100 kW.
Part 1: Overview
Figure 3-1. Cost Competitiveness of Selected Renewable Power Technologies
10 20 30 40 50
Power generation costs in US$ cents/kWh
Wholesalepowerprice
Retailconsumer
powerprice
Small-hydro
Solarphotovoltaic
Concentratingsolar
gsolar
Biomass
Geothermal
Wind
Note: Cost calculation is based on system investment needed (capital cost is based on discount rate of 6% and amortisation period of 15 - 25 years)and power output. Lowest cost range refers to optimum conditions (i.e., proven technology, optimised plant size and design, and high availability ofsystem and resources). Source: NET Ltd. Switzerland.
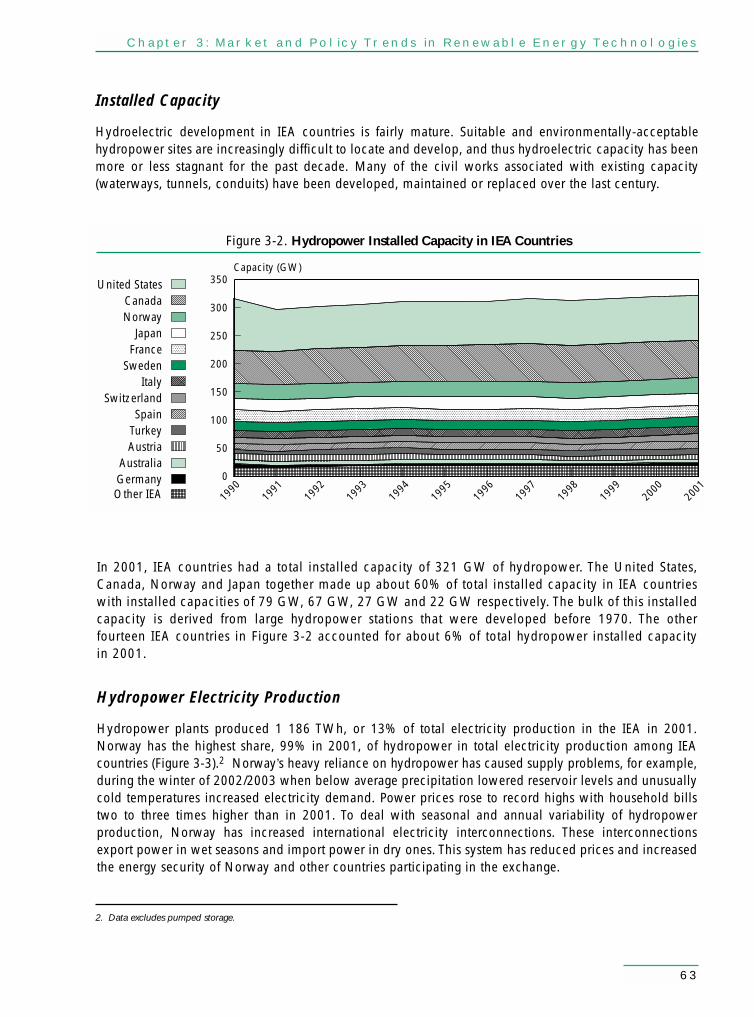
Chapter 3: Market and Policy Trends in Renewable Energy Technologies
63
Installed Capacity
Hydroelectric development in IEA countries is fairly mature. Suitable and environmentally-acceptablehydropower sites are increasingly difficult to locate and develop, and thus hydroelectric capacity has beenmore or less stagnant for the past decade. Many of the civil works associated with existing capacity(waterways, tunnels, conduits) have been developed, maintained or replaced over the last century.
United StatesCanadaNorway
JapanFrance
SwedenItaly
SwitzerlandSpain
TurkeyAustria
AustraliaGermanyOther IEA
Capacity (GW)
0
50
350
100
150
200
250
300
1990
1991
1992
1993
1994
1995
1996
1997
1998
1999
2000
2001
Figure 3-2. Hydropower Installed Capacity in IEA Countries
In 2001, IEA countries had a total installed capacity of 321 GW of hydropower. The United States,Canada, Norway and Japan together made up about 60% of total installed capacity in IEA countrieswith installed capacities of 79 GW, 67 GW, 27 GW and 22 GW respectively. The bulk of this installedcapacity is derived from large hydropower stations that were developed before 1970. The otherfourteen IEA countries in Figure 3-2 accounted for about 6% of total hydropower installed capacityin 2001.
Hydropower Electricity Production
Hydropower plants produced 1 186 TWh, or 13% of total electricity production in the IEA in 2001.Norway has the highest share, 99% in 2001, of hydropower in total electricity production among IEAcountries (Figure 3-3).2 Norway’s heavy reliance on hydropower has caused supply problems, for example,during the winter of 2002/2003 when below average precipitation lowered reservoir levels and unusuallycold temperatures increased electricity demand. Power prices rose to record highs with household billstwo to three times higher than in 2001. To deal with seasonal and annual variability of hydropowerproduction, Norway has increased international electricity interconnections. These interconnectionsexport power in wet seasons and import power in dry ones. This system has reduced prices and increasedthe energy security of Norway and other countries participating in the exchange.
2. Data excludes pumped storage.

64
In 1990, hydropower represented 91.4% of electricity produced from renewable sources. This sharedecreased to 86.3% in 2001. Seasonality and precipitation levels are important parameters for smallhydro. To some extent, the low growth rate of overall renewable electricity was a result of the plunge ofhydropower output in 2001 due to abnormally low global precipitation. Increases in hydro capacity inrecent years are mostly from the addition of small hydropower plants at dams built for flood control,irrigation and/or drinking water supplies and from the restoration or refurbishment of large hydropowerstations to improve efficiency.
Public Acceptance
Large hydropower projects have been increasingly associated with negative ecological and socio-economic impacts. Various techniques exist to minimise the ecological impacts: e.g., fish ladders, carefuloperation of reservoirs, and integration of powerhouses into the landscape and noise reduction. Since mostimpacts are site-specific, each plant design requires individually appropriate environmental safeguards.Generally small hydropower projects have a higher level of public acceptance, as these sites can frequentlybe adapted to meet local environmental concerns.
Policy Trends
As a relatively mature technology, most hydropower policies in IEA countries focus on upgrading existingfacilities to improve efficiency and supporting development of small hydropower systems. These policiesrarely target hydropower exclusively, but usually promote renewables as a group including small hydro.Policies in IEA countries that promote hydropower offer tax incentives, investment support and/or feed-intariffs. Australia offers investment support for the improvement and upgrading of existing hydropowerstations through their Mandatory Renewable Energy Target. A number of European countries, includingBelgium, Germany, Ireland, Spain and Switzerland, offer feed-in tariffs in the form of fixed buy-back rates.Japan has been providing capital grants to facilitate hydropower development for plants less than 30 MWsince 1980.
Part 1: Overview
% of Electricity Production
0
100
10
20
30
40
50
60
70
80
90
Figure 3-3. Hydro Share in IEA Electricity Production, 2001
IEA A
verag
e
Norway
Austri
a
Switz
erlan
d
Canad
a
New Z
ealan
d
Swed
en
Portu
gal
Korea
Turke
y
Finlan
dSp
ain Italy
Franc
e
Luxe
mbour
gJap
an
Austra
lia
United
State
s
Greece
German
y
Czech
Rep
ublic
Irelan
d
United
King
dom
Belgium
Hunga
ry
Denmark
Netherl
ands

Chapter 3: Market and Policy Trends in Renewable Energy Technologies
65
A recent development is the increasing competition for watershed rights. In France and the United States,hydropower generation has fallen in recent years due to new regulations for the maintenance of increasedminimum flow levels.
Technology and Cost Developments
Large hydropower provides one of the lowest cost options in today’s energy market, primarily becausemost plants were built many years ago and their facility costs have been fully amortised. Sites for new largeplants are scarce in IEA countries, but in the few cases where new sites could be developed, capital costswould be expected to be about US$ 2 400/MW and generating costs would be expected to be in the US$0.03 to 0.04/kWh range.
Under favourable circumstances small hydropower costs can be as low as US$ 0.02/kWh, although costsare generally in the range of US$ 0.04 to 0.06/kWh. Small hydropower can produce power at competitivecosts in the range of wholesale electricity prices in good resource areas such as mountainous regions forhigh-head plants, rivers for low-head plants and various combinations. Small hydropower plants have aparticularly long lifetime and relatively low operation and maintenance costs. Once the high up-frontcapital costs are written off (usually over fifteen to twenty years), the plant can provide power at even lowercost levels as such systems commonly operate without major replacement costs for fifty years or more.
Market and Policy Trends: Bioenergy
Bioenergy includes solid biomass (i.e., forest product wastes, agricultural residues and wastes, and energycrops), biogas, liquid biofuels, and the organic component of industrial waste and municipal solid waste.Biomass-derived fuels are by-products of industrial or agricultural processes or fuels made from biomassfeedstocks. In some instances, however, due to the existing system of data collection in some countries,bioenergy is combined with inorganic wastes in a reporting category termed combustible renewables and waste(CRW). Typically, the inorganic component of CRW is relatively small, but in a few cases it can be substantial.
In 2001, total bioenergy supply was 150.3 Mtoe, accounting for 3% of total primary energy supply in IEAcountries. The share of bioenergy in renewable energy supply was 55%, up from 48.5% in 1980.Bioenergy is the largest contributor to renewable energy supply in IEA countries.
Potential
Estimates of the economic potential of bioenergy resources in IEA countries vary between 70 exajoules (EJ)to more than 200 EJ per year. In 2001, the use of combustible renewables and waste was only about 7 EJ.
Estimating biomass potential is complex because of the interface between biomass-derived fuels and theagricultural and forestry sectors. In the United States, the forest products industry uses 85% of its woodwaste for energy. Most of this generated power is consumed on-site, but some manufacturers sell excesspower to the grid. In the agricultural sector, the use of crop residues and livestock manure to produceenergy can reduce waste management problems, as well as improve the economics of farming.
Production
Production of solid biomass in IEA countries was 5.2 EJ in 2001, representing about 80% of totalcombustible renewables and waste (CRW) production. The renewable portion of municipal solid wasteaccounted for 11%, industrial waste for 5% and gas from biomass for about 4%.

66
The fastest growing CRW market is gas from biomass, which grew by 16% per year from 1995 to 2001.Production of solid biomass is well-established in many IEA countries and average annual growth from1990 to 2001 was nearly 2%.
Figure 3-4 provides a graphic presentation of CRW production. CRW can be used to produce electricity andheat (transformation sector) or for various end uses (final energy consumption sector). In 2001, 48 Mtoe, or 30%of CRW production, was used in the production of electricity and heat in IEA countries. More than 110 Mtoewas consumed directly in the industry, residential and transport sectors. Net imports were only about 0.5 Mtoe.
In IEA countries, the industry sector is the largest end-use consumer of combustible renewables and waste,accounting for 57% of total final sector CRW consumption in 2001. The pulp and paper industry alone consumed42 Mtoe. CRW use in the residential sector is also substantial, representing 37% of final sector demand in 2001.Of the 48 Mtoe used in the transformation sector, 22 Mtoe went into the production of combined heat and power,20 Mtoe in electricity-only plants and the remainder in heat-only plants and other transformation.
Part 1: Overview
Figure 3-4. Breakdown of Combustible Renewables and Waste Production and Targeted Technologies(green boxes)
Production
Transformation Final Energy Net Imports
ElectricityGeneration
HeatGeneration
BiogasElectricity
Generation
Residentialand Other
Industry Transport
Production Transformation Sector Final Energy Consumption(TJ) Share (%) Share (%)
United States 2 216 811 22 78Canada 2,438 020 6 94France 2,401 646 2 98Sweden 2,319 429 35 65Finland 2,265 364 24 76Turkey 2,263 634 1 99Australia 2,200 729 12 88Germany 2,190 882 4 96
Table 3-1. Breakdown of Combustible Renewables and Waste Ranked by Production, 2001

Chapter 3: Market and Policy Trends in Renewable Energy Technologies
67
The largest producers of combustible renewables and waste in the IEA are the United States, Canada andFrance. In Canada and France, only a small portion of CRW is used to produce electricity and heat. Incontrast, electricity and heat production from CRW represent a large share of total production in Swedenand Finland. In Turkey, nearly all combustible renewables and waste are consumed in the residential sectorfor heating and cooking.
Until the 1970s, CRW use in the United States was dominated by wood burning for heat. Over the nexttwo decades, however, wood burning declined, and by 2001, nearly two-thirds of the biomasscontribution to TPES was waste residue used in the pulp and paper industry to produce steam andelectricity. Other important uses of biomass in the United States include electricity generation from wood,waste fuels and biogas and ethanol derived from corn.
The pulp and paper sector accounts for more than three quarters of total combustible renewables andwaste supply in Canada. In France, combustible renewables and waste contributes 64% to total renewableenergy supply, most of which is in the form of wood heating in rural regions.
The technology sections of the country profiles focus on those technologies where renewable energypolicies and measures have had the greatest impact on market development. The technologies that arehighlighted in the profiles are electricity generation from solid biomass, heat generation from solidbiomass, biogas electricity generation and biofuels, although this is only for countries with relevantmarkets.3 The remainder of this section focuses on these four technologies.
Solid Biomass Electricity Production
Electricity generation in IEA countries from solid biomass was 84 TWh in 2001, 6.1% of renewable energygeneration and 1% of total electricity generation. Generation from solid biomass was 60.5 TWh in 1990,and grew by 3% per year from 1990 to 2001. Installed capacity in 2001 was 12 GW.4
1990
1991
1992
1993
1994
1995
1996
1997
1998
1999
2000
2001
United States
France
Sweden
Finland
Austria
Other
Capacity (GW)
0
2
14
4
6
8
10
12
Figure 3-5. Solid Biomass Installed Capacity in IEA Countries
Data for United Statesnot available
before 1999
3. Municipal solid waste is not included because countries have only recently begun to report separate categories for renewable and non-renewablewaste. Renewable municipal solid waste, however, is estimated to have represented some 2.3% of renewable electricity generation in 2001. Theportion of CRW used for co-generation is included.
4. Official data for the United States begins in 1999 and for Japan in 1998. Japan’s total is included in Figure 3-5 under “Other”.

68
The countries with the largest share of biomass electricity generation among IEA countries, however, do not necessarily have a significant portion of total electricity generation based on biomass (see Figure 3-6). Finland uses solid biomass to meet 11% of its total electricity generation demand, while inthe United States, the largest producer of biomass, solid biomass accounts only for about 1.1% of totalelectricity generation.
In Sweden, Austria and Portugal, electricity generation based on solid biomass accounted for morethan 2% of total electricity generation in 2001. In Finland, the relatively high share is a result ofgovernment support to biomass technologies. From 1990 to 1997, solid biomass was exempt from acarbon tax on fossil fuels. In 1997, the carbon tax was replaced by taxation on electricity at thedistribution level, with a refund granted to solid biomass of € 0.042/kWh.
In Sweden, electricity generation from solid biomass increased steadily from 1 200 MW in 1990 to about1 800 MW by 2001, the result of a concerted government effort in the early 1990s to support biomassthrough taxation and other means. Taxes as a tool to increase biomass use are expected to continue to playan important role in the future.
In Austria, biomass contribution to electricity generation was 2.4% in 2001. The share has increasedgradually since the early 1990s. Most of the growth can be attributed to the introduction of a guaranteedmarket through a voluntary agreement between the Ministry for Economic Affairs and the Association ofElectric Utilities where 20% of the delivery price for biomass was provided by the government for threeyears. Further impetus was given by the tax on gas and electricity in 1996 and the implementation of thePromotion Instrument for Electricity from Renewables in 1997, which provided both a capital incentiveand a guaranteed tariff for renewable electricity fed into the grid.
In Portugal, the primary impetus to electricity generation based on solid biomass was theENERGIA Programme, established in 1994, which provided investment incentives for renewableenergy projects.
Part 1: Overview
IEA A
verag
e
% of Electricity Production
0
12
2
4
6
8
10
Figure 3-6. Solid Biomass Share in Electricity Production, 2001
Finlan
d
Austri
a
Portu
gal
Swed
en
Denmark
Canad
aJap
an
United
State
s
New Z
ealan
d
Netherl
ands
Czech
Rep
ublic
Spain
Austra
lia
Franc
e
Belgium
United
King
dom
German
yIta
ly
Norway
Turke
y

Chapter 3: Market and Policy Trends in Renewable Energy Technologies
69
Biomass Heat Production
Gross heat production in IEA countries from solid biomass was 148 332 TJ in 2001, 38% of renewableheat production.5 Data on heat in the IEA database are available in different years for different countriesand thus aggregated country data should be used with caution.
In 2001, the largest producer of heat from solid biomass in the IEA was Sweden with production of 82 640 TJ, or more than 50% of total IEA heat production from biomass. Other major producers wereFinland with 16 642 TJ, the United States with 11 662 TJ and Denmark with 11 337 TJ.
% of Total Heat Production
0
60
10
20
30
40
50
Figure 3-7. Solid Biomass Share in Heat Production, 2001
Swed
en
Austri
a
Finlan
d
Denmark
Norway
Netherl
ands
Franc
e
Czech
Rep
ublic
United
King
dom
United
State
s
Korea
German
y
Belgium
Hunga
ry
IEA A
verag
e
5. Heat production from municipal solid waste is not included, because countries have only recently begun to report separate categories for renewableand non-renewable waste. Heat production from MSW was about 40% of total renewable heat production in 2001. The portion of CRW used for co-generation is included.
In Sweden, biomass now meets more than 50% of the supply for district heating systems. This proportionrepresents a five-fold increase of supply since 1990. In Finland, gross heat production from solid biomassincreased from 6 118 TJ in 1995 to 16 642 in 2001, an average annual growth of more than 18% peryear. Heat generation is not taxed in Finland and plants are eligible for investment credits.
In 2001, heat production in Austria was 8 874 TJ, up from 1 404 TJ in 1990. Federal and state policieshave been instrumental in stimulating the market for biomass district heating plants for villages since themid-1980s. These policies have primarily taken the form of implementation management and investmentgrants, a type of financial incentive. Installation of biomass district heating plants has increased steadilysince the mid-1980s.
The share of heat in total final energy consumption is unusually high in Denmark at 16%. This is due toDenmark’s extensive use of district heating, which was promoted after 1979 through the National HeatSupply Act. It included a national heat plan and the possibility for local governments to mandateconnection to the district heat network for new and existing buildings. Regional subsidies for biomass-

70
fired heating plants were offered (until 2001) for up to 21% of costs of installations in households and 26%for installations in companies. As a result, in 2001 Denmark had 50 heating plants operating on woodchips, 25 on wood pellets and 75 straw-fired plants.
Biogas Electricity Production
Electricity generation from biogas grew from an estimated 5 TWh in 1990 to 13.6 TWh in 2001. In the early1990s, nearly all of the biogas electricity in IEA countries was produced in the United States. Over the pastfew years, most of the growth in IEA production of electricity from biogas has taken place in Europeancountries. The United Kingdom is the largest producer in Europe, with 2.9 TWh in 2001. Germany producednearly 2 TWh in 2001. The United States is still the largest IEA producer with 4.9 TWh in 2001.
Electricity generation from biogas sources in the United States, particularly landfill methane, wasstimulated by a combination of the Public Utilities Regulatory Policies Act (PURPA), a federal tax creditfor gas produced from non-conventional sources, known as the “Section 29” tax credit, as well as morerecent environmental regulations requiring landfill operators to control methane emissions. Landfillmethane generation also benefits from the evolving voluntary market for green power. The Section 29credit, which was set at US$ 0.52 per mmBtu in 1980, but adjusted for inflation, had reached a value ofmore than US$ 1.00 per mmBtu of gas produced by the time it was allowed to expire in 1998. Since theexpiration of the credit, the growth in new landfill methane facilities has slowed.
Biofuels
Production of liquid biofuels in IEA countries increased from 4.3 million tonnes in 1995 to 5.8 milliontonnes in 2001. The United States accounts for more than 80% of total IEA production of biofuels, mostlyethanol. Other major ethanol producers are Sweden and Spain. The largest biodiesel producers are Franceand Germany.
There have been many recent efforts to expand the use of biofuels in IEA countries. In early 2003, theEuropean Commission (EC) issued a Directive promoting the use of biofuels and other renewable fuels fortransport. This directive created two indicative targets for EU member states: 2% biofuels penetration byDecember 2005 and 5.75% by December 2010. The targets are not mandatory, but governments arerequired to develop plans to try to meet them.
In the United States and Canada, legislation is under consideration that could lead to large increases inethanol production over the next few years. Australia has recently implemented blending targets and Japanhas made clear its interest in biofuels blending, even though its biofuels must be imported.
Technology and Cost Developments
Solid Biomass Electricity Production
Generation costs can be given for a range of biomass applications based on the system investment neededand annual electrical output. Very low generation costs (slightly above US$ 0.02/kWh) occur with co-firing,where relatively little additional investment is needed. Higher generation costs in the range of (US$ 0.10 to US$ 0.15/kWh) apply to innovative gasification plants.
The cost of producing electricity from solid biomass depends on the technology, fuel cost and quality ofthe fuel. Power plants tend to be small, typically 20 MWe or less, although there are quite a few CHPplants, for example in Sweden, that are much larger.
Part 1: Overview

Chapter 3: Market and Policy Trends in Renewable Energy Technologies
71
Biofuels
Biofuels are transportation fuels derived from agriculture, forestry or other organic sources. Cereals, grains,sugar crops and other starches are fermented to produce alcohol (usually ethanol) which can be usedeither as a blending component in gasoline, as motor fuel in pure form, or as a gasoline additive after beingconverted to ethyl-tertiary-butyl-ether (ETBE). Oil-seed crops (e.g., rapeseed, soybean and sunflower) canbe converted into methyl esters, a liquid fuel which can either be blended with conventional diesel fuelor burned as pure biodiesel. Cellulosic materials, including grasses, trees, and various waste products fromcrops, wood processing facilities and municipal solid waste, can also be converted to alcohol. Theprocessing of these cellulosic materials is more complex than processing sugars and grains.
In IEA countries, the production cost of ethanol and biodiesel declined substantially over the past tenyears, but is still up to three times that of gasoline and diesel. However, in some developing countries it isequal to, or lower than, fossil fuel costs. It does not seem likely that biofuels produced in IEA countriesfrom grain and oil-seed feedstock using conventional conversion processes will compete with gasoline anddiesel, unless world oil prices rise considerably. Technologies are relatively mature and cost reductions areultimately limited by the fairly high feedstock costs. However, the use of low cost cellulosic feedstock withadvanced conversion technologies, including those using the whole plant, could eventually lead to theproduction of lower cost ethanol in IEA countries. Large-scale importing of biofuels from developingcountries could also expand IEA markets.
Market and Policy Trends: Geothermal Energy
Geothermal is energy available as heat emitted from within the earth, usually in the form of hot water orsteam. Geothermal as a recoverable energy resource is very site specific. High temperature geothermalresources can be used to generate electricity, though the identified high enthalpy resources are not widelydistributed in IEA countries. Low temperature geothermal resources are more wide spread and areemployed in various direct uses such as district heating, industrial and agricultural processing,balneology and in conjunction with ground water heat pumps. Electricity generation from geothermalresources is the focus of this section.
1990
1991
1992
1993
1994
1995
1996
1997
1998
1999
2000
2001
United States
Japan
Italy
Other IEA
New Zealand
Capacity (MW)
0
500
5000
1000
1500
2000
2500
3000
3500
4000
4500
Figure 3-8. Geothermal Installed Capacity in IEA Countries

72
Installed Capacity
The first successful commercial project for generating electricity from geothermal steam was in Larderello,Italy in 1904. Between 1970 and 2001, geothermal markets exhibited two very different growth patterns. The1970 to 1990 average annual growth was about 8.4%. In recent years, though, growth in installed capacityhas been marginal from 3 717 MW in 1990 to 4 348 MW in 2001, at 1.4% annually. Practically all of theIEA installed geothermal capacity is in the United States, Italy, Japan and New Zealand, as illustrated inFigure 3-8. By far, the United States has the highest absolute amount of installed capacity at 2 793 MW.
Geothermal Electricity Production
Geothermal electricity is an important contributor to renewable electricity production. In the UnitedStates, however, production declined from 16 TWh in 1990 to 14.3 TWh in 2000. The highest growth rateof geothermal electricity generation was achieved in Iceland, an OECD but not an IEA Member country,where production increased by 15.4% annually from 0.3 TWh to 1.5 TWh between 1990 and 2001.
Overall, geothermal accounted for 0.3% of electricity supply in IEA countries in 2001. Only in New Zealanddoes geothermal provide a notable share of electricity supply at 8.2%. Lacklustre growth for geothermalelectricity is projected in the next few years because few development schemes exist in IEA countries.
Part 1: Overview
% of Electricity Production
0
8
1
2
3
4
5
6
7
Figure 3-9. Geothermal Share in Electricity Production, 2001
New Z
ealan
dIta
ly
United
State
sJap
an
Portu
gal
Turke
y
IEA A
verag
e
Policy Trends
The US programme for geothermal energy began in the late 1970s and early 1980s when research anddevelopment related to geothermal received about US$ 100 million (1995 dollars) per year. In addition,the Public Utility Regulatory Policies Act (PURPA) mandated the purchase of electricity from qualifyingfacilities. In California, the Standard Offer Contract system for PURPA-qualifying facilities providedrenewable electric energy systems with a relatively firm and stable market, thereby facilitating thefinancing of capital-intensive geothermal energy facilities. When R&D funding decreased andprogrammes were changed or halted, geothermal progress slowed in the United States.

Chapter 3: Market and Policy Trends in Renewable Energy Technologies
73
Italy, with the second highest amount of geothermal electricity capacity, has provided government supportthrough research and development and feed-in tariffs. The high level of the tariff (€ 0.17/kWh for the first eightoperational years) under CIP6/92 led to significant capacity installation in the last decade, although older,less cost-effective plants were retired in the same period, limiting the resulting capacity increase.
In Japan, a 1980 law to promote alternative energy provided incentives to geothermal producers. From1993 to 2000, the New Sunshine Programme provided a major impetus to geothermal development bysupporting technology innovation, particularly for exploration and development, and funding resourceassessments to help lower development risks. Social acceptance is important to the maintenance andfurther development of geothermal power in Japan. The government has invested considerable efforts toincrease awareness of the benefits of geothermal power plants to local communities.
In New Zealand, where geothermal provides 8.2% of electricity production, government supportedresearch and development and resource assessment have helped to improve cost effectiveness, butgeothermal development has been more the result of private investment by utilities and their partners.
Technology and Cost Developments
The costs of geothermal energy have dropped substantially from the systems built in the 1970s. Costs areheavily weighted towards up-front investments. The resource type (steam or hot water) and temperature,as well as reservoir productivity, influence the number of wells that must be drilled for a given plantcapacity. Typical costs for a single well range from US$ 100 to US$ 400/kW. Power plant size (ratedcapacity) and type (single-flash, binary, etc.), as well as environmental regulations, determine the capitalcost of the energy conversion system. Because costs are closely related to the characteristics of the localresource system and reservoir, costs cannot be easily assessed on a general level.
Generation costs depend on a number of factors, but particularly on the temperature of the geothermalfluid, which influences the size of the turbine, heat exchangers and cooling system. US sources reportcurrent costs of producing power from as low as US$ 0.015 to 0.025/kWh at The Geysers, to US$ 0.02 to0.04/kWh for single-flash and US$ 0.03 to 0.05/kWh for binary systems. New construction can deliverpower at US$ 0.05 to 0.065 or 0.08/kWh, depending on the source. The latter figures are similar to thosereported in Europe. Generation costs per kWh are € 0.05 to 0.09 for traditional power plants (liquid-steamwater resources) and € 0.20 to 0.30/kWh for hot dry rock systems.
Geothermal power technology has been steadily improving. Although no clear trend toward lower energycosts can be shown for the plants producing electricity in the low-cost range, new approaches are helpingutilise resources that would have been uneconomic in the past. This is the case for both power generationplant and field development. Drawing an experience curve for the geothermal power sector is difficult, notonly because of the many site-specific features having an impact on the technology system, but alsobecause of poor data availability.
Geothermal Direct Use
In addition to power generation, geothermal energy is sometimes used as heat. For example, in the UnitedStates, more than 600 MWt of geothermal heat capacity is used for industrial and agricultural purposes,such as district heating, food processing, greenhouses and aquaculture. Most of these direct use applicationsoccur as a by-product of electricity generation and can be found in many of the countries producinggeothermal electricity. However, lower temperature resources are found in many regions and countrieswhere electricity production is not practical. In these places, geothermal heat can be commerciallycompetitive, although policy supports are not generally in place specifically for geothermal heat.

74
Market and Policy Trends: Solar Photovoltaic6
Solar PV technology was used primarily for satellites through the 1950s and into the 1960s. The price of PVsystems dropped in the 1970s and 1980s allowing the technology to be increasingly used in remote areaswhere refueling a generator, recharging a battery or running a connection to the utility grid was prohibitivelyexpensive. Grid-connected PV generated electricity has seen rapid growth since the late 1990s.
Installed Capacity
Solar PV experienced an annual average growth rate of 29% between 1992 and 2001. In 1992 installedcapacity was 101 MW in 1992, with the United States containing the majority of it at 44 MW. Japan had19 MW, Italy 8 MW, Australia 7 MW and Germany 6 MW. Japan, Germany and the United Statesaccounted for 85% of total installed capacity of about 1 000 MW in 2001.
Part 1: Overview
6. It is difficult to assess early PV market trends as data reported by the Member governments for the late 1980s and early 1990s are often incomplete.These deficiencies are due to the very small scale of PV modules and remote installations. Most IEA countries do not collect data for off-grid systems,and techniques for on-grid data collection are only now being developed. The following discussion is based primarily on the limited set of official IEAstatistics as reported by the Member governments. See Annex 2 for more detail.
1992
2001
United States
Japan
Germany
Other
Capacity (MW)
0
200
1200
400
600
800
1000
1994
1995
1996
1997
1998
1999
2000
Figure 3-10. Solar PV- Installed Capacity in IEA Countries
1993
In 2002, Japan, Germany and the United States accounted for 92% of new installations.
● Japan reached 637 MW, i.e., 48% of total installed capacity in 2002 up from 17% in 1992. Averageannual growth over the period 1998-2002 was 48%.
● Germany reached 277 MW, i.e., 21% of total installed capacity in 2002 up from 5% in 1992. Averageannual growth over the period 1998-2002 was 52%.
● The United States reached 212 MW, i.e., 16% of total installed capacity in 2002 compared with 40%in 1992. Average annual growth over the period 1998-2002 was 21%.
In 1990, PV was used mainly in stand-alone systems for rural electrification and small-scale applications.Since then, the number of grid-connected systems has increased significantly. Europe and Japan have thelargest number of distributed grid-connected PV systems, mostly building-integrated (BiPV). The market

Chapter 3: Market and Policy Trends in Renewable Energy Technologies
75
share of distributed grid-connected PV installations has been growing steadily and reached 63% ofcumulative capacity installed in countries collaborating in the IEA’s Photovoltaic Power SystemsImplementing Agreement by the end of 2001.
PV Electricity Production
Although solar PV markets are growing rapidly, the share of PV generated electricity is extremely small.Germany reports the largest proportion of electricity generated in 2001, accounting for approximately aquarter of a percent of domestic electricity generation. Despite its small overall proportion, electricityproduction from solar PV has been growing by nearly 60% per year.
Electricity production numbers for the United States and Japan would be expected to be higher thanGermany’s, as their installed capacity exceeds that of Germany’s and their solar regimes are superior. Dueto their net metering system, Japan does not gather electricity production data on a large part of their PVmarket, most notably the on-grid distributed portion, which is dominated by residential use and accountedfor 86% of the market in 2002.
In the United States, almost two-thirds of PV electricity production is off-grid. More than 80% of PV capacity inAustralia, Canada, Finland, France, Korea, Norway and Sweden is for off-grid applications. In Norway, Finlandand Sweden, most PV installations are related to applications in holiday homes and boats. In Australia andFrance, PV is used for rural electrification. In Korea, most systems are for industrial and commercial applicationsincluding telecommunications and remote monitoring.
Policy Trends
PV is unlikely to be a significant contributor to the overall energy balance in the short term, although itmay achieve significant penetration in remote areas. PV’s current market growth of 30% per year is largelydriven by government incentives. The resulting cost reductions are impressive, as every doubling of thevolume produced has brought about a cost decrease of about 20%.
The commitment of the United States, Japan and Germany to PV technology is reflected in RD&D budg-ets over the period 1990-2002:
– The US average annual budget from 1990 through 2002 was US$ 77.3 million, representing 32.6% ofits renewable energy RD&D budget, or roughly 2.9% of total energy RD&D expenditures.
– In Japan, the average annual budget from 1990 through 2002 was US$ 66.1, representing 59.6% of itsrenewable energy RD&D budget, or about 2.1% of total energy RD&D expenditures.
– In Germany, the average annual budget from 1990 through 2002 was US$ 40.1 million, representing48.6% of its renewable energy RD&D budget, or about 12.5% of total energy RD&D expenditures.
Other countries with significant annual budgets for PV RD&D were Italy (US$ 15.9 million), theNetherlands (US$ 12.3 million) and Switzerland (US$ 10.8 million).
RD&D contributes to reducing production costs of PV modules, which represent an average of about 60%of the total costs of grid-connected systems (50-80% depending on actual working conditions). RD&D iscapable of reducing module production costs by means of:
– Higher cell and module efficiency.
– More efficient use of semiconductor materials.
– Development of low-cost feedstock materials.
– Use of new materials (mostly thin films).

76
RD&D efforts, together with market deployment policies, have been efficient in helping reducePV module production costs. It is clear, though, that further investments by the private sector in PVare dependent on public financial support in order to proceed down the learning curve. Theweighted average price of modules in 2002 in the reporting countries with the seven largest marketswas US$ 3.5 per Watt.
Japan, the largest producer of PV cells in the world, has strongly supported the domestic PV industry.With an annual manufacturing capacity for PV systems of more than 250 MW, the cost of solar cells, PVmodules and PV systems have been steadily decreasing, largely due to financial support policies forRD&D and market deployment. Research and development in PV cell technology in Japan commencedunder the Moonlight and Sunshine Programmes in the 1970s and 1980s. The New Sunshine Programmevastly increased funding for RD&D and promoted technology development of PV systems. In addition toRD&D funding, the PV market has been supported through net metering and capital grants. SolarPV capacity increased from 19 MW in 1992 to 453 MW in 2001, an average annual growth rate of morethan 42%.
Germany has employed a combination of feed-in tariffs and production subsidies that resulted in growthof installed capacity of more than 47% per year between 1992 and 2001. Germany began with ademonstration project, the 1000 Roofs Programme in 1991, which succeeded in increasing installedcapacity by 5.3 MW. This programme was succeeded by the 100 000 Roofs Programme in 1999. Underthe Renewable Energy Sources Act of 2000, electricity suppliers pay at least € 0.51/kWh of solar generatedelectricity fed into the grid. Total installed capacity increased to 195 MW in 2001, an annual averagegrowth of more than 47% since 1992.
Significant programmes to encourage PV in the United Sates include the voluntary One Million Solar RoofsInitiative. One of the most successful policy supports has been the establishment of net metering rules,where PV systems can feed into, or draw out of, the utility distribution network for the same cost. Incombination with net metering initiatives, state programmes through cash rebates and renewable portfoliostandards have had a positive effect on the PV market. With 60% of the state of Arizona’s renewableportfolio standard to be met from solar resources, 6 MW of PV projects have been installed to date. Forthe United States overall, these market deployment activities have on average increased the installedcapacity of PV by nearly 20% per year between 1990 and 2001.
Technology and Cost Developments
Costs for PV systems vary widely and depend on system size, location, customer type, grid connectionand technical specifications. Average installation costs are about US$ 5-9 per Watt for building-integrated, grid-connected PV systems. Costs vary according to the maturity of the local market andspecific conditions. Furthermore, system costs vary significantly depending upon whether the system ispart of a retrofit or is integrated into a new building. In many cases, the added cost to the building ofthe PV system is less than the figures shown here, as in modern systems the PV often replaces otherbuilding materials, and thus those costs are saved. Stand-alone systems cost more, but can becompetitive with other autonomous small-scale electricity supply systems, particularly when traditionalfuels are costly or not easily accessible.
Cost reduction has been a key issue for PV, as costs are still relatively high compared to other electricityproduction technologies. But cost reductions of building integrated PV (BIPV) systems have beenconsiderable and average costs have been reduced by a factor of two in each of the last two decades, asdepicted in Figure 3-11.
Part 1: Overview
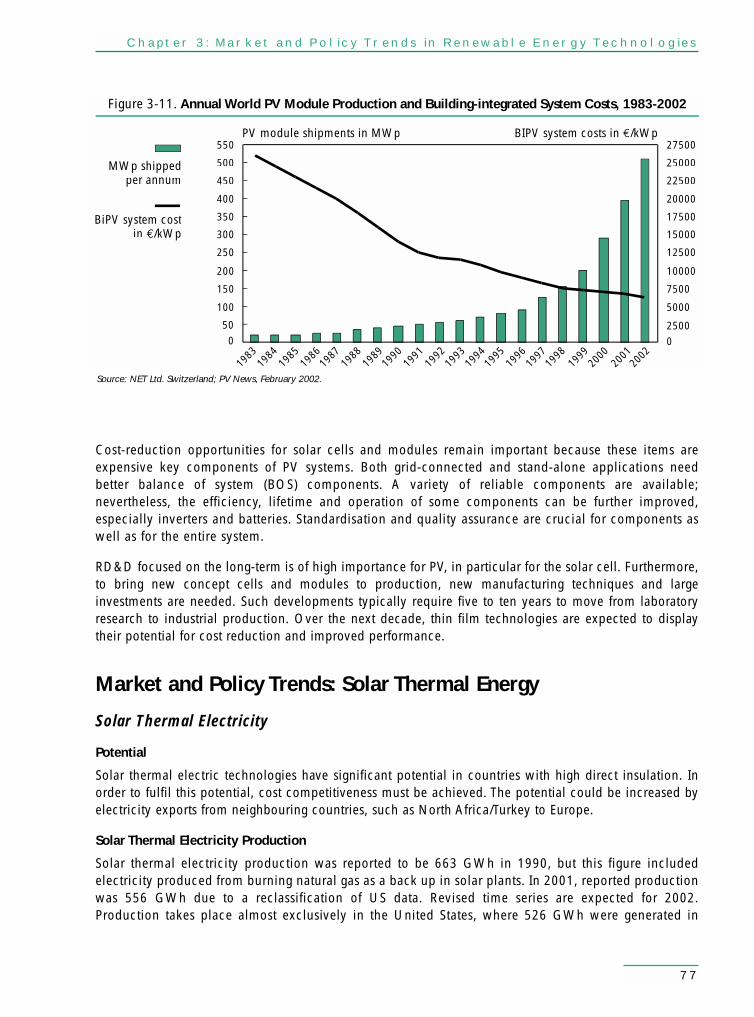
Chapter 3: Market and Policy Trends in Renewable Energy Technologies
77
Cost-reduction opportunities for solar cells and modules remain important because these items areexpensive key components of PV systems. Both grid-connected and stand-alone applications needbetter balance of system (BOS) components. A variety of reliable components are available;nevertheless, the efficiency, lifetime and operation of some components can be further improved,especially inverters and batteries. Standardisation and quality assurance are crucial for components aswell as for the entire system.
RD&D focused on the long-term is of high importance for PV, in particular for the solar cell. Furthermore,to bring new concept cells and modules to production, new manufacturing techniques and largeinvestments are needed. Such developments typically require five to ten years to move from laboratoryresearch to industrial production. Over the next decade, thin film technologies are expected to displaytheir potential for cost reduction and improved performance.
Market and Policy Trends: Solar Thermal Energy
Solar Thermal Electricity
Potential
Solar thermal electric technologies have significant potential in countries with high direct insulation. Inorder to fulfil this potential, cost competitiveness must be achieved. The potential could be increased byelectricity exports from neighbouring countries, such as North Africa/Turkey to Europe.
Solar Thermal Electricity Production
Solar thermal electricity production was reported to be 663 GWh in 1990, but this figure includedelectricity produced from burning natural gas as a back up in solar plants. In 2001, reported productionwas 556 GWh due to a reclassification of US data. Revised time series are expected for 2002.Production takes place almost exclusively in the United States, where 526 GWh were generated in
Figure 3-11. Annual World PV Module Production and Building-integrated System Costs, 1983-2002
500
100
150
200
250
300
350
400
450
500
550
02500
5000
7500
10000
12500
15000
17500
20000
22500
25000
27500
MWp shippedper annum
BiPV system costin €/kWp
BIPV system costs in €/kWpPV module shipments in MWp
1983
1984
1985
1986
1987
1988
1989
1990
1991
1992
1993
1994
1995
1996
1997
1998
1999
2000
2001
2002
Source: NET Ltd. Switzerland; PV News, February 2002.

78
2001. The only commercial-scale solar thermal electric projects were installed in California from 1984to 1990, employing parabolic trough technology. In total, 354 MW of solar trough plants wereconstructed by a single company taking advantage of the favourable PURPA implementation regulationsin California as well as federal and state tax incentives. Ultimately, both the company and thetechnology became casualties of the unpredictability and decline of these incentives during the late1980s and early 1990s as a result of falling prices for conventional generation fuels.
Australia also has small output of solar thermal electricity. In 2001, there was an estimated 397 MW ofinstalled solar thermal electricity capacity in IEA countries, less than 0.001% of total renewableelectricity capacity.
Part 1: Overview
United States
Other IEACapacity (MW)
0
50
450
100
150
200
250
300
350
400
1990
1991
1992
1993
1994
1995
1996
1997
1998
1999
2000
2001
Figure 3-12. Solar Thermal Electricity – Installed Capacity in IEA Countries
Technology and Cost Developments
There are three basic solar thermal electric technologies: towers, dishes and troughs. The systems operatewith a thermal phase, allowing either thermal storage or back-up fuels to offset intermittency and thusincrease the commercial value of the energy produced. Recent trends include direct steam generation,integration in larger combined cycle power plants, compact fresnel reflectors, heat storage (Italy, Spain)and reduction of operation and maintenance costs.
Forthcoming trough solar – only projects include a 50 MW plant in Nevada and two 50 MW plants inSpain. Both projects have benefited from favourable feed-in tariffs. Costs are in the range of US$ 0.12to 0.14/kWh for the Nevada plant and €0.15/kWh for the plant in Spain. Costs could be reduced byusing a few arrays of small troughs to combine electricity production with heating and cooling inbuildings.
Solar Thermal Heating and Cooling
The largest producers of solar hot water technologies in the IEA are the United States, Japan and Turkey.Together they account for more than 80% of direct use of solar heat in IEA countries. The United Statesproduces 58 872 TJ of heat from solar sources, Japan 31 287 TJ and Turkey 12 014 TJ. Other significantproducers are Germany, Australia, Greece and Austria.
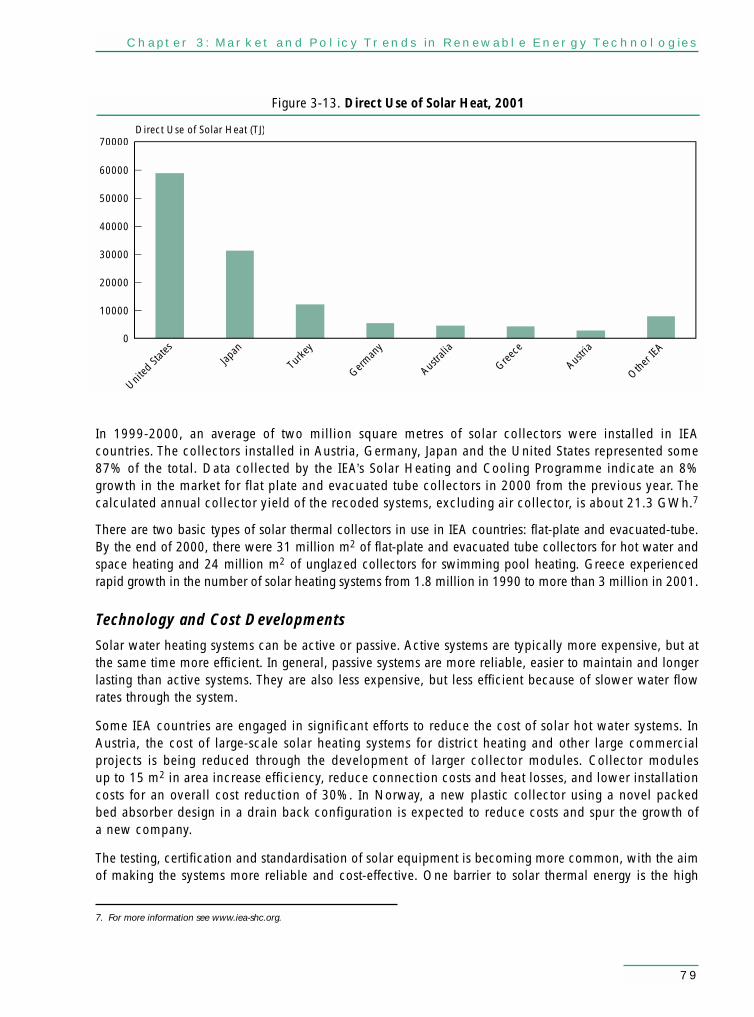
Chapter 3: Market and Policy Trends in Renewable Energy Technologies
79
In 1999-2000, an average of two million square metres of solar collectors were installed in IEAcountries. The collectors installed in Austria, Germany, Japan and the United States represented some87% of the total. Data collected by the IEA’s Solar Heating and Cooling Programme indicate an 8%growth in the market for flat plate and evacuated tube collectors in 2000 from the previous year. Thecalculated annual collector yield of the recoded systems, excluding air collector, is about 21.3 GWh.7
There are two basic types of solar thermal collectors in use in IEA countries: flat-plate and evacuated-tube.By the end of 2000, there were 31 million m2 of flat-plate and evacuated tube collectors for hot water andspace heating and 24 million m2 of unglazed collectors for swimming pool heating. Greece experiencedrapid growth in the number of solar heating systems from 1.8 million in 1990 to more than 3 million in 2001.
Technology and Cost Developments
Solar water heating systems can be active or passive. Active systems are typically more expensive, but atthe same time more efficient. In general, passive systems are more reliable, easier to maintain and longerlasting than active systems. They are also less expensive, but less efficient because of slower water flowrates through the system.
Some IEA countries are engaged in significant efforts to reduce the cost of solar hot water systems. InAustria, the cost of large-scale solar heating systems for district heating and other large commercialprojects is being reduced through the development of larger collector modules. Collector modulesup to 15 m2 in area increase efficiency, reduce connection costs and heat losses, and lower installationcosts for an overall cost reduction of 30%. In Norway, a new plastic collector using a novel packedbed absorber design in a drain back configuration is expected to reduce costs and spur the growth ofa new company.
The testing, certification and standardisation of solar equipment is becoming more common, with the aimof making the systems more reliable and cost-effective. One barrier to solar thermal energy is the high
Direct Use of Solar Heat (TJ)
0
70000
10000
20000
30000
40000
50000
60000
Figure 3-13. Direct Use of Solar Heat, 2001
United
State
sJap
an
Turke
y
German
y
Austra
lia
Greece
Austri
a
Other I
EA
7. For more information see www.iea-shc.org.

80
labour cost of installation. Companies are being formed in Portugal and the United States that sell solarheated water to commercial and residential consumers from systems that are owned and maintained bythe energy service company.
Market and Policy Trends: Wind
The commercial development of grid-connected wind generators started after the oil price crises in the1970s, building from mechanical wind machines used mostly for water pumping. In the early 1980s, mostcommercial wind turbines were assembled using a number of standard components. Only blades andcontrol systems were specially tailored for the wind turbine industry. With increased market volume, morespecialised suppliers, including larger companies, are providing tailored components.
Installed Capacity
As the costs of wind turbines have steadily declined, technical reliability has increased and the last decadehas seen an explosive growth in the development of wind power. In 1990, IEA countries had 2 395 MW ofinstalled wind power capacity and by 2001 it had expanded to 21 707 MW, a 22.2% annual average growthrate. While a number of IEA countries have significant potential based on wind resource assessments, in 2001about 86% of the installed capacity was in only four countries as depicted in Figure 3-14.
Part 1: Overview
United States
Spain
Germany
Other IEA
Denmark
Capacity (GW)
0
5
25
10
15
20
1990
1991
1992
1993
1994
1995
1996
1997
1998
1999
2000
2001
Figure 3-14. Installed Wind Power Capacity in IEA Countries, 1990-2001
Growth in installed capacity has been particularly notable since the mid-1990s. This is reflective oftechnical improvements and turbine size up-scaling as a result of research and development, marketdeployment policies and measures and the growth of the infrastructure necessary to support development,e.g., manufacturers, installers and operators.
On average, wind power supplied less than one-half of one percent of electricity supply in IEAcountries in 2001, as shown in Figure 3-15. Only in Denmark does wind power provide a notable shareof electricity supply at 11.4%, though the contribution has been increasing in recent years in Germanyand Spain.

Chapter 3: Market and Policy Trends in Renewable Energy Technologies
81
Policy Trends
There appears to be a strong link between RD&D in wind power technology and the development ofmarkets and a supporting industry. In Denmark, Germany and the United States, for example, significantfunds for RD&D were invested in the years preceding rapid market growth. RD&D investments in 1987-2001 by the seven countries with the most significant markets were 85% of the total invested in wind byall IEA countries. These seven countries represent 94% of the installed capacity in IEA countries.
The global installed capacity of wind energy technology at the end of 2002 was more than 30 GW. Yet itis distributed very unevenly around the world – about 83% of total installed capacity is in only fivecountries: Denmark, Germany, Italy, Spain and the United States. Although European countries representthe bulk of this capacity, other countries, including China, Brazil and India, have considerable wind energypotential and are taking steps to foster industries to exploit it.
Wind diffusion is strongly supported by attractive incentives of feed-in tariffs in Germany, Spain andDenmark, where annual capacity increases between 1990-2001 were respectively 60%, 75% and 20%.Also in Italy, about 700 MW, or 90% of total capacity installed by 2002 was built under the CIP6/92financing scheme. In the United States, the principal policy instrument has been the production tax credit,coupled with supportive policies in the states.
Technology and Cost Developments
Commercial and technological development has been closely related to turbine size (see Figure 3-16). From tenmetres in diameter (typically with 22 kW to 35 kW of installed capacity) in the mid-1970s, wind turbines havegrown to diameters of 80 metres and more (with multi-MW installed power). Technology development hasresulted, furthermore, in variable pitch (as opposed to fixed blades), direct drives, variable-speed conversionsystems, power electronics, better materials and better ratio of weight of materials to capacity installed. Animportant trend is toward increasing rotor diameter in order to develop turbines for offshore applications.
IEA A
verag
e
% of Electricity Production
0
12
2
4
6
8
10
Figure 3-15. Wind Share in Electricity Production in IEA Countries, 2001
Denmark
Spain
Luxe
mbour
g
German
y
Greece
Irelan
d
Netherl
ands
Portu
gal
Italy
Austri
a
New Z
ealan
d
Swed
en
United
King
dom
United
State
s
Austra
lia
Finlan
dKor
ea
Turke
y
Sources: NET Ltd., Switzerland. Raw data is from Durstewitz (1999) and Systèmes Solaires/EurObserv’ER (2003).

82
Part 1: Overview
Figure 3-17. Market Share of Seven Generations of Wind Turbines in Denmark
0%
20%
40%
60%
80%
100%Percentage of annual sales in numbers
1978
1979
1980
1981
1982
1983
1984
1985
1986
1987
1988
1989
1990
1991
1992
1993
1994
1995
1996
1997
1998
90 to 100 kW
55 to 75 kW
150 to 250 kW
300 to 400 kW
450 to 750 kW
> 1,000 kW
22 to 30 kW
Source: Danish Energy Agency.
Until the mid-1980s, wind turbine size was typically less than 100 kW, then in the range of a few hundredkilowatts up until the mid-1990s, when turbine sizes began to range from 0.5-1.5 MW (Figure 3-16). Suchlarge-scale turbines are often used by onshore wind farm operators and owners of individual, mostly grid-connected wind turbines. In countries with less developed transport and power transmission and distributioninfrastructure, this size class remains dominant. In Germany, average wind turbine size reached 1.4 MW in2002 and this large-scale turbine size class is becoming very competitive. Virtually all of the capacity is grid-connected. In Denmark, the history of technology development and the growth in wind machine classesdemonstrates the impact of technology progress on market up-take (Figure 3-17).
Figure 3-16. Average Turbine Size at Market Introduction
2002:1395 kW
1999:919 kW
1995:473 kW
1990:170 kW
1985:20 kW
Sources: NET Ltd., Switzerland. Raw data is from Durstewitz (1999) and Systèmes Solaires/EurObserv’ER (2003).

Chapter 3: Market and Policy Trends in Renewable Energy Technologies
83
As the best onshore locations are becoming more difficult to develop, coastal countries are beginning toinvestigate and exploit near-shore and offshore wind power resources. This process is starting in Europe,where Denmark, the Netherlands, Sweden and the United Kingdom have already amassed experiencewith near-shore wind farms. All new offshore wind farms are expected to have turbines exceeding 1.5 MW.New capacities totalling several GW may be installed in Germany, the United Kingdom, Ireland,Denmark, Canada, Belgium and other countries in coming years.
Capacity (GW)Cost of Energy (US cents/kWh)
0
100
10
20
30
40
50
60
70
80
90
0
25
5
10
15
20
Figure 3-18. Cost and Capacity Trends in Wind Power, 1980-2001
2000
1998
1996
1994
1992
1990
1988
1986
1984
1982
1980
Source: USDOE and IEA Statistics
8. There is some difference of opinion about the correct way to benchmark energy technologies. For wind turbines, for instance, both price per squaremetre of rotor area and price per kWh produced are used.
Figure 3-18 shows the growth of wind capacity in IEA countries and the progression of cost reductions ofdelivered energy. From a pre-market level of about US$ 0.70/kWh in 1980, wind power costs havedeclined steadily. Wind power crossed the US$ 0.10/kWh threshold in about 1991, and dropped to aboutUS$ 0.05/kWh in 1998. Since then, costs at the very best sites have dropped to about US$ 0.035 –0.04/kWh. This progress has moved forward with the evolution of national policies from RD&D throughmarket deployment.
Costs of wind turbines and plants depend on the system components and size, as well as the site.Generating capacity is primarily determined by the rotor-swept area and the local wind regime. Typicalturnkey installation costs are about US$ 400 per m2 of swept area or US$ 850 to 950/kW for onshore windturbines.8 Investment costs differ considerably between onshore and offshore applications in both relativeand absolute terms. For offshore installations, the foundation amounts to one-third (or more) of turbinecosts. Typical turnkey installation costs are now in the range of US$ 1 100 to 2 000/kW for offshore windturbines, i.e., 35% to 100% higher than for onshore installations.
Countries with significant installed wind capacity, e.g., Denmark, Germany and Spain, which account fortwo-thirds of installed global wind capacity, also have most of the world’s turbine manufacturers. Theseven biggest manufacturers had a market share of 86% in 2001 with revenue of €4.8 billion. Danish and

84
German wind turbine manufacturers export relatively high shares of their total output. In order to minimisetransport costs, more and more turbines are being manufactured by subsidiaries of European companiesin other countries. Most of the leading manufacturers of large wind turbines are developing systems foroffshore applications.
Challenges to Future Growth
The intertwined problems of intermittency and grid reliability present two of the strongest challenges towind energy’s future prospects. When wind is providing too much or too little power, the reliability of thegrid is affected. Because wind is based on natural forces, it cannot dispatch power on demand. Becauseutilities must supply power in close balance to demand, intermittency can limit the amount of capacity ofhighly intermittent technologies that can be integrated into the grid. Thus, as the share of wind energyincreases, integration of wind turbines into the electrical network will need both more attention andinvestment. To an extent, technical solutions, energy management and regulatory practices can extend thepenetration of wind, though these will require not only significant research and development, but alsoincur costs for consumers.
Yet another barrier is transmission availability. The best locations for new wind plants are often in distantareas without close access to a transmission line. This can be seen both in offshore areas of Europe and inrural areas in North America. Providing new transmission lines is often difficult due to planning barriersand land use rights.
Internationally accepted standards for power performance, safety, noise and other environment-relatedconditions should be developed in order to reduce trade barriers, as well as administrative and installationcosts. New locations, especially offshore and non-surveyed terrain, should be mapped and assessed toreduce the visual impact on populations.
Part 1: Overview

Chapter 4: Market Deployment Policies
85
Chapter 4Market Deployment Policies
Policy TypesIEA countries have introduced a variety of policies to support the market deployment of energytechnologies. Large-scale hydropower expanded as a result of government investment in multi-purposedams, mostly prior to 1970. Nuclear power was funded from military RD&D budgets and was supportedby government subsidies and tax reductions. More recently IEA countries have introduced policies tosupport the market deployment of renewable energy technologies, although in a challenging environmentas many countries are liberalising their energy markets.
The IEA’s World Energy Investment Outlook presents an Alternative Policy Scenario, in which renewableenergy sources account for 25% of electricity generation in OECD countries in 2030, assuming that currentand planned policies are effectively implemented.1 This scenario and the targets that many IEA countries haveestablished for increasing the share of renewables in TPES underscore the fact that market deployment policiesare critical to the increased performance and market penetration of renewable energy technologies.
Policy instruments can be categorised into four quadrants, based on the direction of their support (Figure 4-1).Policies can be directed towards consumers (demand-side) or producers (supply-side). They can also bedirected towards capacity (i.e., the facility and/or its capital costs) or generation (i.e., the product and/or theassociated price to the customer). In some cases, the same policy can appear in more than one quadrant.
Figure 4-1. Market Deployment Policy Instruments
Bidding systemsProduction tax creditsGuaranteed prices/feed-in tariffsObligationsTradable certificates
Investment tax creditsProperty tax exemptionsCapital grantsGovernment purchasesThird-party finance
Net meteringGreen pricingVoluntary programmesGovernment purchasesExcise tax exemption
Consumer grants/rebatesTax creditsSales tax rebatesThird-party finance
Generation
Capacity
DemandSupply
1. World Energy Investment Outlook, IEA/OECD, Paris, 2003.
In addition to the policy instruments in Figure 4-1, there are administrative or regulatory procedures thatare not financial in nature, but nevertheless contribute to the market deployment of renewables.Additionally, there are public awareness programmes that support market deployment. The followingsections describe the major types of policies that have been employed in IEA countries.

86
Policies Addressing Supply and Capacity
Investment Incentives
Investment incentives are used to reduce the capital cost of deploying renewable energy technologies.They can also reduce investor risk. For example, to stimulate photovoltaic (PV) power systemdevelopment, Japan instituted a capital grants programme in 1994, which has been the driving forcebehind the country’s rapid PV development. The grants programme also supported hydropower,geothermal and other new energy technologies.
Other types of incentives include third-party finance arrangements where the government assumes risk orprovides low interest loans. Favourable lending schemes, in which banks guarantee the cash flow of aproject thus reducing investor risk, have been very effective, as exemplified by the rapid growth of windcapacity in Spain.
Investment incentives are generally funded out of national and/or state budgets and thus competewith other public funding needs. As such, incentives are often subject to legislative review and changes,including recision. Incentives must be of adequate size and must be predictable and consistent overtime to be effective. Governments must balance the budgetary burden against other public policypriorities.
The success of financial incentives to impact investment decisions also depends on whether the level ofthe incentive is adequate to bridge the gap between the market price of energy and the cost of renewableenergy. Incentives should be gradually lowered and even phased out over time to ensure thatmanufacturers and developers continue to improve the technology and reduce costs. Governments needto monitor capital costs and incentive structures over time. This is challenging because capital costreductions tend to be driven by global market growth, as markets within a specific country generally arenot large enough to drive market learning.
Tax Measures
Tax policy is used to encourage production or to discourage consumption. On the production side,investment tax credits and property tax exemptions reduce tax payments for project owners.
Government Purchases
Government purchases of systems at above-market rates are a type of investment incentive to industry. Ina number of cases, governments have purchased large, on-site renewable systems such as solar thermalhot water systems or photovoltaic systems for schools or other public buildings.
Policies Addressing Supply and Generation
Incentive Tariffs
Guaranteed price systems, feed-in tariffs and preferential rates are all terms for tariffs at above-marketrates. Generally the government sets a premium price to be paid for power generated from renewableenergy sources. The price is usually differentiated by technology, and is paid by either consumers ortaxpayers through the utility.
Part 1: Overview

Chapter 4: Market Deployment Policies
87
Guaranteed price systems have been adopted in a number of IEA countries. The United States initiatedthe first system with passage of the Public Utility Regulatory Policies Act (PURPA) in 1978. PURPArequired utilities to purchase power from renewable energy developers and to pay the utility’s avoidedcost, i.e., the cost that the utility would have incurred by generating or otherwise supplying the poweritself. These prices were not established by the federal government but rather by utilities or stateregulatory commissions. At the time, avoided costs were high, due to high fossil fuel prices. As a resultof PURPA legislation, more than 12 000 MW of renewable energy projects were developed during the1980s and 1990s, including geothermal, wind and concentrating solar power plants. Although the lawremains in effect, the prices offered by utilities now are generally too low to support new projectdevelopment.
Germany, Italy and Spain have introduced feed-in tariff schemes based on avoided costs. A guaranteedprice system is often supported by complementary rules. For example, electric utilities may be requiredto provide interconnection and non-discriminatory backup power to qualifying facilities. Feed-in tariffs,combined with other policy support, are considered to be the main impetus behind the development of12 000 MW of wind energy capacity in Germany and of 4 830 MW in Spain.
Feed-in tariff schemes have several potential shortcomings. First, the tariffs are administrativelydetermined. While the rate is sometimes set as a function of avoided cost, it is the government, ratherthan the market, that determines the tariff level. Second, guaranteed prices may be a disincentive fortechnology innovation or cost reductions unless the tariffs decrease over time. The time period overwhich a producer receives a guaranteed price should be sufficient to recover costs. Anticipating andscheduling reductions in guaranteed prices is challenging, as costs are determined by factors externalto national markets. For example, market experience within a country can lead to reductions ininstallation costs, but equipment cost reductions are largely driven by the global market.
Furthermore, there is some controversy over whether feed-in tariffs can or should promote competitionbetween renewables. Most feed-in tariff schemes differentiate tariffs to reflect different levels of maturityof renewable energy technologies. But some administrations employ a single tariff for all renewables, a“one size fits all” policy framework, in order to stimulate competition. This can lock the relatively lessmature technologies out of the market at the RD&D stage.
Bidding systems such as the UK’s Non Fossil Fuel Obligation (NFFO) and Ireland’s Alternative EnergyRequirement (AER) scheme are based on competition for contracts to build projects with the lowestgeneration costs. The principal mechanism is a guaranteed price, with the rate set by competition forthe lowest bid. This is based on a function of the power pool wholesale price plus a technology-specificpremium that is paid by electricity consumers. Renewable technologies are separated into differenttechnology categories and competitive bidding rounds are organised for each category separately.
Tax Measures
The US production tax credit for wind energy established in 1992 has, in combination with other policies,spurred substantial new installations of wind power, but its piecemeal extension since 1999 has led to a“boom-and-bust” cycle of development in the US wind power industry. The success of tax policy inimpacting investment decisions depends on whether the level of incentive covers the additional costs ofthe renewable energy system compared to market alternatives. As an example, the US federal productiontax credit has aided the domestic wind industry, but has not been sufficient to spur the development of“closed-loop” biomass systems, which also qualify for the credit.

88
Obligations
Most obligations are based on the final product (kWh of electricity or litres of liquid fuel) although someare based on capacity. Renewable energy portfolio standards, also known as quota systems, place anobligation on suppliers to provide a set quantity or percentage of their supply from renewable energysources. Generally, quota systems do not distinguish between different renewable energy sources, i.e., aquota level is established and the market determines which resources are chosen. These systems encouragethe development of renewables at lowest cost. Renewable energy certificates (discussed below) may beused to facilitate compliance with quota systems and can also reduce the cost of compliance.
Targets are a form of obligation being used in the EU countries and Australia. Target systems determine differentlevels of obligation for each renewable technology, sometimes with a penalty for non-compliance.
A penalty for non-compliance that is set at least as high as the estimated cost of meeting the obligation iscrucial for the success of obligation systems because utilities and producers will be more inclined tocomply. For example, in the United Kingdom, suppliers unable to meet their requirements must buyrenewable obligation certificates at £30 per megawatt-hour (MWh). The revenue is distributed back toelectricity suppliers according to their success in meeting the targets. This provides an additional incentivefor companies to meet their requirements. In the US state of Texas, where suppliers must pay a non-compliance penalty of up to $50/MWh, far more capacity has been built than required to meet the state’srenewable portfolio standard. The policy is considered a success, as the cost of wind power declined tothe point that wind is the least-cost option in certain areas of the state.
An effective obligation system takes into account renewable resource availability, the ability of therenewable energy industries to respond with technology and systems and the lead times required to bringnew projects into operation. Obligations should also be in place long enough to ensure that investorsrecover their investments.
Tradable Certificates
Renewable energy certificates (RECs) provide a mechanism to track and register renewable electricityproduction. Certificates can be used to document compliance with quota systems or can be sold to end-use customers in a voluntary green power market. The creation of a certificate allows the renewable energyattribute to be sold or traded separately from the physical electricity product. The establishment of a RECssystem does not by itself constitute a supply requirement, but rather certificates provide greater marketflexibility in achieving the goals of other policy instruments.
RECs systems can be consistent with energy labelling. This type of system may be advanced by theEuropean Commission’s Directive on guarantee of origin of electricity produced by renewable energysources, which requires member states to establish appropriate mechanisms “to enable producers ofelectricity from renewable energy sources to demonstrate that the electricity they sell is produced fromrenewable energy sources”.
RECs systems are also not without potential drawbacks. In some instances, for example, the administrativeprocedures can be substantial and may prove to be costly. Furthermore, there is considerable confusionabout the distinction between “renewable energy attributes” and environmental benefits. For some,renewable energy attributes are greater than carbon value or environmental performance, but relate alsoto energy security and economic benefits. For others, the REC is a substitute for, and perhaps equal to, acarbon certificate, although such determinations have not yet been set by law. Clarifying these issues willbe important to the future use of RECs on a larger scale.
Part 1: Overview

Chapter 4: Market Deployment Policies
89
Policies Addressing Generation and Demand
Voluntary Programmes
Several IEA countries have employed voluntary programmes. One of the first voluntary programmes forrenewables was in Denmark in 1984 when utilities agreed to purchase 100 MW of wind power. In 1992,Japan established a similar programme when power companies developed agreements with renewableenergy generators. The primary method of implementation was through government “request” to energysuppliers to buy electricity generated by renewables. Suppliers had to pay the retail price of electricity tothe facility that generated the power. These voluntary purchase agreements in Japan made a largecontribution to the penetration of solar and wind technologies.
Green pricing is an optional utility service that gives customers an opportunity to support an increased levelof utility company investment in renewable energy technologies. Participating customers generally pay anadditional amount on their electric bill to cover the incremental cost of the renewable energy. Many utilitiesare offering green pricing to build customer loyalty and expand business lines and expertise in advance ofelectric market competition. Green pricing programs are prominent in the United States and Europe.
Net metering arrangements, for example in Denmark, Italy, the United States and Japan, also provide a formof guaranteed pricing as customer-generators are credited for their electricity generation at the prevailingretail rate. For consumer-owned systems, net metering is a practice that allows customers to “bank” at theutility any excess electricity generated from qualifying systems for later use. The customer pays only for theelectricity used “net” of the electricity generated over the entire billing cycle. Net metering allows customer-generators to maximise the value of their production because the generation is valued at retail prices. Usuallythe size of the system is capped to keep the policy focused on small-scale systems.
Tax Measures
Tax policy can be used to capture the externalities associated with energy production and consumptionsuch as environmental degradation and energy import dependence. For example, the Netherlands andGermany introduced a regulatory energy tax or “ecotax” on final energy consumption in the 1990s.Renewable electricity consumption is exempt from the tax in the Netherlands. Moreover, in theNetherlands, producers of renewable electricity also receive a production incentive from the ecotax fundscollected from consumers of non-renewable electricity.
A gasoline excise tax exemption allows liquid fuel refiners to offset the higher cost of including biofuelsin gasoline blends. The biodiesel tax exemption has been the driving force behind the evolution of thebiofuels market in Italy. Carbon taxes and taxes on other pollutants such as SOx and NOx are not, per se,renewables support mechanisms, but are part of the overall competitive energy policy framework. To theextent that they cause conventional energy prices to rise, and renewables are exempt from the tax, theydo have the effect of increasing renewables’ competitiveness.
Policies Addressing Demand and Capacity
Investment Incentives
In addition to supporting energy producers, investment incentives can also be used to reduce the capitalcost of renewable energy technologies to end-users. For distributed, modular technologies such as solarhot water and PV, incentives can be directed toward customer, not the supplier. With consumer grants,and third-party finance the government assumes risk by, for example, providing low interest loans, orbringing down the capital cost of renewable systems.

90
Tax Measures
For customer-owned systems, a tax credit or system rebate allows the owner to recover a portion ofthe up-front capital costs more quickly after the investment is made. Provisions are sometimes made forsales tax rebates.
Regulatory and Administrative Rules
In many IEA countries, market regulations have been introduced at the same time as market deploymentpolicies. When this is not the case, there are often problems with successful deployment. Examples ofmarket regulations include the Portuguese Independent Power Production Law of 1988, which requireselectric utilities to interconnect and sign power purchase contracts with qualifying renewable energyfacilities. Some market liberalisation schemes allow generators and independent marketers to wheel powerto retail customers although the costs for this access can sometimes be high. Similarly, purveyors of small-scale systems must have access to consumer retail outlets and end-users must be able to install andinterconnect systems to the distribution grid.
Planning and co-ordination is another area where government support can provide indirect assistance torenewables market deployment. For example, the Irish National Development Plan allocated € 67 millionfor renewable energy development from 2000 to 2006, including: reinforcement and upgrading of the gridto support increased use of renewables; support to the delivery of additional renewable energy supplies;and encouragement to new market participants through support for small-scale projects. In a similar vein,Australia, the United States, and a number of other countries support agencies that assist in renewables-related planning, resource assessment and industry development.
Public Awareness Programmes
IEA countries have promoted a number of public awareness programmes to encourage broad-basedsupport for renewable energy. In 1996, Portugal established an Action Plan for Municipalities thatpromoted renewables use and energy management. It included training, technical assistance, financialadvice activities targeted to local authorities and the creation of local energy teams or agencies. Energylabelling was established in Austria in 2000, which gave the public a clear understanding of the source oftheir electricity. Also in 2000, the Renewable Energy Action Agenda in Australia brought the governmenttogether with the renewable energy industry to implement actions that aim to increase communitycommitment to renewable energy, encourage exports, improve the reliability and quality of renewableenergy products and services, develop a renewable transport fuels industry, ensure that skilled people areavailable to support industry growth and encourage a culture of market-driven innovation.
Trends in IEA Renewable Energy Policies
In 1970, hydropower accounted for the largest share at 50.1% of renewables in TPES, followed by CRW(47.1%) and geothermal (2.8%). These shares reflect market developments and technologycompetitiveness in the years prior to the oil price crisis of 1973. For hydropower, growth during the firsthalf of the 20th century was largely driven by government investment in infrastructure projects, includingwater supply, flood control and economic development, along with public ownership or control ofgeneration facilities. Combustible renewables and waste supply was generally wood burning for heat inthe 1970s. For geothermal, the share reflected small installations in several resource-rich locations,principally The Geysers in the United States and Lardarello in Italy.
Part 1: Overview

Chapter 4: Market Deployment Policies
91
The market development of hydropower, bioenergy and geothermal technologies from 1970 to 2001 wasdriven largely by resource endowments and market conditions, including the generally high cost of fossilfuels up to the mid-1980s and lower costs thereafter. Another factor affecting all three technologies duringthe latter part of the period was increasing competition, particularly in electricity markets.
Sites for large hydro plants in Japan, the United States and Europe were mostly developed by 1970, andfurther development of small sites was affected by competing uses and by growing environmentalregulations. Geothermal for electricity generation grew substantially in the period of high fossil fuel costs,but growth slowed thereafter.
In the 1970s, biomass use shifted away from wood burning in the residential sector towards use in industry.By 2001, nearly two-thirds of biomass supply was waste residues used in the pulp and paper industry toproduce steam and electricity, a move that started during the oil crisis years and continued as companiessought to remain competitive. Additional important uses of biomass now include electricity generationfrom wood, waste fuels, biogas and biofuels.
In 2001, the share of renewable energy supply in TPES was 5.5%. Combustible renewables and waste(CRW) accounted for 55% of total renewable energy supply, followed by hydropower with 35%,geothermal with 8%, and solar and wind 2.2%.
Figure 4-2 provides an indication of the evolution of policies and measures in IEA countries over the pastthree decades. On the vertical axis, renewable energy policies and measures include RD&D policies andvarious market deployment policies that are categorised as investment incentives, tax measures, incentivetariffs, voluntary programmes, obligations and tradable certificates. The year that each country firstintroduced a specific renewable energy policy is indicated by country initials. For example, in 1978, theUnited States introduced a programme of tax credits for households and businesses purchasing renewableenergy equipment. This is shown in the Tax Measures row in Figure 4-2.
“New” renewables, including solar and wind technologies as well as new forms of bioenergy, wereintroduced into the market in the late 1970s. This development came after a period of research,development and demonstration that started in 1970 or before, and intensified as the impacts of the oilprice crises mounted. Denmark, Finland and Germany were the first countries to allocate RD&D fundingfor renewable technologies. The United States, the United Kingdom and Japan also funded renewableenergy RD&D programs in the early 1970s. Except for a few countries, RD&D spending on renewableenergy represented the first tier of support to the development of renewable energy markets.
In the late 1970s and early 1980s, the United States, Denmark, Spain, France and Italy instituted the firstmarket deployment policies in IEA countries. These began with the US PURPA guaranteed priceprogramme, coupled with an investment tax credit, both of which were established in 1978. In the followingyear, Denmark instituted a capital grants programme for wind turbines. In 1980, Spain established its EnergyConservation Law, which guaranteed network interconnection, power purchase contracts and prices set byan administrative body. In 1980, France established a risk guarantee fund for low temperature geothermalenergy, and the United States established a loan guarantee program for bioenergy and alcohol fuels. In1981, Denmark announced the Act for the Support for Utilisation of Renewable Energy Resources whichprovided for RD&D, capital grants, and guaranteed prices. In 1982, Italy, established a capital grantsprogramme. During the remainder of the 1980s, the pace at which policies were established remainedrelatively modest, at first due to a perception that the technologies were not yet ready for deployment, andlater by the decline in fossil fuel prices. The policies during this period were predominately investmentincentives, such as capital grants and low-interest loans for the uptake of renewable technologies, or taxmeasures, such as exemptions or credits to businesses and consumers.

92
Part 1: Overview
SEBE
HUAUNL IT
DKAT JP
DK ES
HU LU
AUAT
CH
DE
FIBE NL
IT
SE
LUJPCAAUDECH PTUS IT
HUFRATLUITGBPTUS
KR
NLDKES BE SEDE
GRCH NOIE CA
CZ
FRGBNO
NL
GRLUTRUSCA DK
SE ATIE IT PT ES
NZDK US IT HU AT
PT
NL
CAGB
TR KRGR
SEDE CH JP NOFRLUBE
CABE
DEKR TR HU
NZ GRIEFR LU
US
FIPT AT AU
ITDKGB
JP
NZ FRIE
NO
GB
EU
GR
CZ
JP
KR
NONLCH
SEES
CZKR BE
ESFI AUCZ
FI DE
FI KR
NOGB
1973 1976 1979 1982 1985 1988 1991 1994 1997 2000 2003
TradableCertificates
Obligations
IncentiveTariffs
Tax Measures
InvestmentIncentives
ResearchDevelopment
andDemonstration
VoluntaryProgrammes
AT=Austria - AU Australia BE Belgium CA Canada CH Switzerland CZ Czech Republic DE GermanyDK Denmark ES Spain FI Finland FR France GB United Kingdom GR Greece HU Hungary IE IrelandIT Italy JP Japan KR Korea, Republic of LU Luxembourg NL Netherlands NO Norway NZ New ZealandPT Portugal SE Sweden TR Turkey US United States.
= - = - = - = - = - = = - = - = - = - = - = - = - =
= - = - = - = - = - = - = = - = - = - =
Figure 4-2. The Introduction of Renewable Energy Policies by Country
From 1988 to 1994, eight IEA countries introduced feed-in tariffs, starting a new wave of intervention.Portugal established an independent power law that allowed private generators of renewable systems to sellto the grid with interconnection and price guarantees. In 1990, the United Kingdom launched its Non FossilFuel Obligation (NFFO), a guaranteed price scheme with the added dimension of competitive bidding forthe rate. Germany and Switzerland introduced their feed-in tariffs in 1991. Altogether, twenty IEA countrieshave had feed-in tariffs at one time or another, though not for every renewable energy technology.

Chapter 4: Market Deployment Policies
93
The first voluntary programmes started in the early 1990s. Switzerland launched its Energy2000programme in 1991. The US Climate Change Action Plan started in 1993 with the goal of co-operativeprogrammes between utilities and the US Department of Energy. Portugal initiated its Energia Programmein 1994, which reinforced voluntary actions with capital grants.
The 1980s to the mid-1990s represented a period of experimentation with market deployment strategiesamong IEA countries. Some countries employed a wide range of policies, including new variations ofguaranteed prices such as feed-in tariffs combined with investment incentives and tax measures. Renewableenergy policy in Korea is based on a combination of corporate loans, tax incentives and feed-in tariffs. TheUnited Kingdom, Portugal, the United States and Austria combined voluntary purchase agreements betweenpublic and private companies with other market deployment incentives. This period was followed by aperiod of rapid expansion in new renewable energy markets in IEA countries, particularly wind, bioenergy,solar energy and small hydropower. While a wave of IEA countries introduced investment incentives in themid-1990s, tax measures have been employed more sparingly. Except for the United States, IEA countriesdid not generally introduce incentive tariffs until the early to mid-1990s.
Switzerland established a target for hydroelectric and heat from renewable sources in 1991. Denmarkfollowed in 1993 with a Biomass Agreement to increase biomass use from about 50 PJ to 75 PJ by 2000.Finland established a 100 MW wind target in the same year. The Netherlands introduced renewable energyobligations in 1997 with a target of 3.2% renewables in electricity supply by 2000. The late 1990s saw anumber of additional countries institute obligations and quota-based renewable energy policies as theystrived to open and widen renewable energy markets. In 2001, the EU Directive for Electricity Producedfrom Renewable Energy Sources set indicative targets requiring member countries to implement relevantnational policies. The targets are for the percentage of renewable energy in electricity consumption of eachEU Member State by 2011. Thirteen states in the United States have similar strategies to expand the shareof renewables through obligations, with a binding portfolio standard in many states and a non-bindingquota in others.
The latest development of renewable energy deployment policies is the introduction of tradablecertificates. The Netherlands was the first to employ these certificates in 1997 as a mechanism to efficientlyachieve a target that was also set in 1997. Italy established its certificate system in 1999. Australialaunched its Mandatory Renewable Energy Target (MRET) in 2000, which uses tradable certificates as acompliance instrument. MRET is the first target/certificate system with substantial penalties to enforce theobligation. By early 2004, ten other IEA countries had also introduced them.
The evolution of energy policies for new renewables shows a discernible pattern over the past threedecades. Starting with RD&D in the early 1970s, government investments moved toward marketdeployment support with a variety of approaches. Beginning in 1978, but before 1985, countries wereemploying guaranteed prices, investment incentives, voluntary programmes, and tax measures. By the mid1980s, virtually all IEA countries had RD&D policies as a foundation for market aspirations. By the early1990s, many more countries had adopted the various market deployment policies and the first obligationswere introduced. Almost all countries have established guaranteed prices at one time or another, withvarying degrees of success. A few countries have moved to quotas and a number of countries have, or arein the process of establishing certificate systems. At the same time, several recent commitments have beenmade for guaranteed price systems.
While a clear evolution of overall policies and measures in IEA countries is evident from Figure 4-2, it doesnot necessarily denote a single trend. Each country has chosen policies and measures that best match theirresource endowments, economic structure and objectives for market development.

94
Part 1: Overview
Renewable Energy Market Deployment in IEA Countries Observations
• Large hydropower has had the largest share of renewable energy supply in IEA countries untilrecently. This is a mature technology and has received continuous support through itsdevelopment and deployment. Combustible renewables and waste has experienced steadygrowth over the last three decades. In addition to energy, this reflects policies related toenvironmental concerns, as well as technology development and deployment policies.Geothermal also has a long history and has been developed in specific locations.Considerable additional geothermal potential exists that can be developed as more advancedtechnologies become available and technology deployment policies are put into place.
• Starting in the 1970s and sometimes even before, governments have set up RD&Dprogrammes to develop renewable energy sources as an ‘alternative’ to fossil fuels. This wasfollowed by a series of technology deployment schemes including investment incentives, taxmeasures and incentive tariffs, particularly for new renewables. In the late 1990s, countriesstarted to experiment with tradable certificate systems.
• Significant market growth has always resulted from combinations of policies, rather thansingle policies. As an early example, in Japan, PV technology was supported by extensiveRD&D investments to increase the competitiveness of the technology, by demonstrationprojects, which increase public awareness and acceptance, through financial incentives toreduce the purchase price of PV systems and by requiring utilities through net metering toaccept excess power generated by PV systems at the retail price of electricity. In Spain, windtechnology is supported by feed-in tariffs, low-interest loans, capital grants, and local supportfor manufacturing of turbines. In no case is there evidence of strong market growth with onlyone policy in place. Those countries that have experienced strong growth in “new”renewables, such as wind and solar, including Germany, Spain, the United States andDenmark, have done so through a combination of financial incentives and guaranteed prices,underpinned by strong RD&D.
• Longevity and predictability of policy support is important to overall market success. In mostcases, feed-in tariffs for renewable energy sources typically have an eight- to twenty-year timeframe, e.g., Italy and Germany. The challenge is how to incorporate strong incentives for cost-reduction and competition while ensuring longevity and predictability of policy support. Thelong-term support offered to biomass district heating plants in Austria provides anotherexample. Conversely, a “stop and go” nature of incentives, such as the production tax creditsin the United States, has undermined private sector investment.
• National policies are also strengthened when local, state, or provincial governments have theauthority to act independently of the national government. For example, in Spain, the bulk ofwind power growth is occurring in those areas where regional governments have activelysupported development through administrative changes and financial support, and in somecases, becoming a development partner. In the United States, although the federal governmenthas established a renewable energy deployment programme, thirteen states have establishedtheir own renewable portfolio standards, and many more states offer their own set of financialincentives. These have met with varying degrees of success.

Chapter 4: Market Deployment Policies
95
• Market liberalisation offers new challenges for renewable technologies still in the technologydeployment stage. On the one hand, if energy prices fall, the price targets that renewablesmust meet become more challenging. On the other hand, policies and systems such as quotasand renewable energy certificates can be compatible with more competitive marketstructures. In fact, many current policies are being implemented within the backdrop of atransition to market liberalisation, e.g., Ireland, Sweden and the United Kingdom.
• Individual policy mechanisms are evolving as countries gain more experience. In Germany,for example, early feed-in tariffs were set as a function of the avoided cost of electricity, andthen modified to a level deemed necessary by the government to encourage industrialdevelopment. Later iterations included better measures for incorporating and driving costreductions. At the same time, policies in some cases have been evolving from one type toanother. In Denmark, for example, the feed-in tariff scheme is in transition as it wassuperceded by a certificate trading system that has not yet come into effect. When Japanestablished their portfolio standard in 2002, however, they retained the funding for RD&D andother incentives for market deployment. When a renewable portfolio standard does notspecify a preferred renewable energy technology, competition is expected to be enhancedamong technologies.
• It is too soon to fully assess the impacts of many renewable policies, as most have beenestablished since 2000. This is particularly true for most obligation systems, as well as the tradablecertificate systems. Nevertheless, experience with investment incentives, tax measures andincentive tariffs suggests that all these policies can be made effective. It is the design of the supportmechanism rather than the type that determines the success of policies. Over time, the array ofpolicy choices has become broader and the market learning experience richer. Strong marketgrowth of new renewables in the late 1990s indicates that the support schemes in place may havebeen effective. On the other hand, it also can be stated that without government support newrenewables would show low or no increase in market growth rates.


Annex 1: Total Primary Energy Supply and Share Renewables
97
Annex 1Total Primary Energy Supply and Share of Renewables
1970 1990 2000 2001
Australia TPES (Mtoe) 51.3 87.5 109.8 115.6Renewables TPES (Mtoe) 4.3 5.1 6.4 6.6% Renewables 8.4% 5.8% 5.8% 5.7%
Austria TPES (Mtoe) 18.2 25.0 28.8 30.7Renewables TPES (Mtoe) 2.5 5.0 6.4 6.6% Renewables 13.2% 19.9% 22.0% 21.5%
Belgium TPES (Mtoe) 40.2 48.7 59.3 59.0Renewables TPES (Mtoe) 0.0 0.6 0.6 0.6% Renewables 0.1% 1.3% 1.0% 1.0%
Canada TPES (Mtoe) 139.5 209.1 250.9 248.2Renewables TPES (Mtoe) 21.1 33.7 42.0 39.1% Renewables 15.1% 16.1% 16.5% 15.6%
Czech Republic TPES (Mtoe) 45.7* 47.4 40.4 41.4Renewables TPES (Mtoe) 0.1* 0.1 0.6 0.6% Renewables 0.2%* 0.3% 1.3% 1.5%
Denmark TPES (Mtoe) 20.3 17.6 19.4 19.8Renewables TPES (Mtoe) 0.3 1.1 1.9 2.1% Renewables 1.6% 6.6% 9.9% 10.4%
Finland TPES (Mtoe) 18.1 29.2 33.0 33.8Renewables TPES (Mtoe) 5.0 5.5 7.8 7.6% Renewables 27.6% 19.5% 24.4% 23.0%
France TPES (Mtoe) 147.0 227.1 257.4 266.0Renewables TPES (Mtoe) 6.6 15.7 17.5 18.6% Renewables 4.5% 6.8% 6.6% 6.8%
Germany TPES (Mtoe) 304.4 356.2 343.4 351.1Renewables TPES (Mtoe) 4.0 5.8 9.0 9.2% Renewables 1.3% 1.6% 2.6% 2.6%
Greece TPES (Mtoe) 8.1 22.2 27.8 28.7Renewables TPES (Mtoe) 0.7 1.1 1.4 1.3% Renewables 8.4% 5.0% 5.0% 4.6%
Hungary TPES (Mtoe) 17.9 28.5 24.9 25.3Renewables TPES (Mtoe) 0.5 0.4 0.4 0.4% Renewables 2.8% 1.4% 1.8% 1.6%
Ireland TPES (Mtoe) 6.3 10.6 14.3 15.0Renewables TPES (Mtoe) 0.1 0.2 0.3 0.3% Renewables 1.1% 1.6% 1.8% 1.7%
Italy TPES (Mtoe) 109.6 152.6 171.7 172.0Renewables TPES (Mtoe) 6.1 6.5 9.1 9.6% Renewables 5.6% 4.3% 5.4% 5.7%
Japan TPES (Mtoe) 257.2 436.5 524.2 520.7Renewables TPES (Mtoe) 6.5 13.6 16.7 15.9% Renewables 2.5% 3.1% 3.2% 3.1%

98
Part 1: Overview
1970 1990 2000 2001
Korea TPES (Mtoe) 17.0* 92.6 191.2 194.8Renewables TPES (Mtoe) 0.1* 0.5 2.1 2.2% Renewables 0.7%* 0.6% 1.1% 1.1%
Luxembourg TPES (Mtoe) 4.1 3.6 3.7 3.8Renewables TPES (Mtoe) 0.0 0.0 0.1 0.1% Renewables 0.2% 1.0% 1.8% 1.8%
Netherlands TPES (Mtoe) 49.3 66.5 75.5 77.2Renewables TPES (Mtoe) 0.0 0.6 1.0 1.1% Renewables 0.0% 1.0% 1.4% 1.4%
New Zealand TPES (Mtoe) 7.2 13.9 17.9 18.1Renewables TPES (Mtoe) 2.1 4.8 5.1 4.7% Renewables 28.7% 34.7% 28.0% 25.8%
Norway TPES (Mtoe) 13.6 21.5 25.8 26.6Renewables TPES (Mtoe) 5.0 11.4 13.3 11.8% Renewables 36.5% 50.1% 48.5% 45.0%
Portugal TPES (Mtoe) 6.0 17.2 24.6 24.7Renewables TPES (Mtoe) 1.2 2.7 3.1 3.4% Renewables 20.8% 15.7% 12.8% 13.7%
Spain TPES (Mtoe) 38.4 91.2 124.3 127.4Renewables TPES (Mtoe) 2.4 6.2 7.0 8.2% Renewables 6.2% 6.8% 5.7% 6.5%
Sweden TPES (Mtoe) 37.9 46.7 47.5 51.1Renewables TPES (Mtoe) 6.5 11.7 15.3 15.0% Renewables 17.2% 25.1% 32.4% 29.1%
Switzerland TPES (Mtoe) 16.5 25.1 26.5 28.0Renewables TPES (Mtoe) 2.9 3.3 4.2 4.7% Renewables 17.1% 13.1% 15.6% 16.2%
Turkey TPES (Mtoe) 18.2 53.0 77.5 72.5Renewables TPES (Mtoe) 6.3 9.7 10.1 9.4% Renewables 34.3% 18.2% 13.2% 13.0%
United Kingdom TPES (Mtoe) 207.3 212.2 231.2 235.2Renewables TPES (Mtoe) 0.4 1.0 2.4 2.5% Renewables 0.2% 0.5% 1.0% 1.1%
United States TPES (Mtoe) 1 557.4 1 927.6 2 303.8 2 281.4Renewables TPES (Mtoe) 57.1 100.5 105.9 99.1% Renewables 3.7% 5.2% 4.6% 4.4%
IEA Total TPES (Mtoe) 3 094.0 4 269.2 5 055.0 5 068.3Renewables TPES (Mtoe) 141.5 247.0 289.6 280.9% Renewables 4.6% 5.8% 5.7% 5.5%
* Data from 1971.

Annex 2: Renewable Energy Statistics – Definitions and issues
99
Annex 2Renewable Energy Statistics – Definitions and Issues
Background on Statistics Collection for the IEA’s Renewables Information1
Prior to 2000, statistics for renewable energy were reported to the IEA on three separate annual questionnaires:
1. Statistics on biomass and waste products (municipal solid waste, industrial waste, etc.) were reportedon the coal questionnaire.
2. Statistics on hydropower (all size units), wind and solar PV electricity and on geothermal and solarthermal heat and electricity were reported on the electricity and heat questionnaire.
3. Statistics on liquid biofuels were reported on the oil questionnaire.
The Energy Statistics Working Group (ESWG) advises the IEA Energy Statistics Division (ESD), Eurostat andthe United Nations Commission for Economic Cooperation in Europe (UNECE) on the format and contentof the Joint Annual Questionnaires. The ESWG met in November 1999 and recommended adoption of aseparate Annual Renewables and Wastes Questionnaire. The initiative was stimulated by actions of theEuropean Union to double the proportion of renewable energy from 6% to 12% of primary energy supplyby increasing the share of electricity generated from renewables from 14% to 22% of the total by 2010.In order to measure actual achievement versus targets, it became necessary to collect more detailedstatistics from national governments. Other non-EU member countries supported the initiative to createthe questionnaire.
Renewable statistics were collected for 1998 and 1999 in the Joint Annual Questionnaire cycle of 2000-2001. This questionnaire improved renewable statistics in two important ways. First, it incorporated amore extensive and thorough set of renewable and waste energy product definitions (see below). Second,responsibility for providing renewable and waste statistics was assigned to a specific contact – often in anoffice or division specialising in renewable energy – rather than spread among several contacts who oftenspecialise in non-renewable forms of energy.
However, despite major improvements in some aspects of renewable and waste statistics, some difficultieshave been experienced. Many national statistics agencies, which are the sole source for ‘official’ statisticscollected by the IEA, did not have formal data collection systems for many renewable products andtechnologies. While there was generally good data collection for mature renewables like hydropower andgeothermal, little if any historical data existed on “new” renewables like solar and wind. Further, monthly,quarterly and annual energy production, trade and consumption surveys (usually the basis of nationalenergy statistics) did not request information on renewables products and technologies. Finally, due to thediverse nature of renewable energy technologies, even if surveys are modified to accommodaterenewables, it is often difficult to find the right agents to survey. Thus, although all IEA countries now reportsome renewable and waste statistics, the creation of consistent time series is a work in progress, andthorough coverage of all renewables and technologies is an evolving effort at the national level.
The production of this study has stimulated considerable attention by national administrations on theirreported data and has led to new submissions by a number of countries. In some cases, this data has been
1. Renewables Information, IEA/OECD, Paris, 2003.

100
integrated into official IEA data, and thus is reported in IEA figures in this book. However, in a number ofcases, the data have been received too recently to be integrated. In a few such cases, the reported nationalstatistics are provided in a separate table or figure. This information will be integrated in future reportingof renewables statistics.
Definitions of Renewable Energy and Waste Sourcesand Associated Technologies
While there are a limited number of renewable energy and waste sources, there are a large number oftechnologies allowing their exploitation, many of which are still at the research and development stage orhave not yet reached commercial maturity. The renewable energy and waste sources and associatedtechnologies listed below are those that are considered to be economically viable or approachingeconomic viability.
1. Hydropower: Kinetic energy of water converted into electricity in hydroelectric plants. Pumpedstorage information is included in the data collection, but in a separate category as it is mostly derivedfrom non-renewable sources. Detailed plant sizes are reported net of pumped storage. The sum of< 1 MW, 1-10 MW, 10+ MW and production from pumped storage is included in ‘Hydro, all plants’.However, only hydro generation net of pumped storage is included in “Total Renewable EnergySupply”. In the technology sections in the country profiles, hydropower is net of pumped storage.
2. Geothermal energy: Energy available as heat emitted from the earth’s crust, usually in the form of hotwater or steam. It is exploited at suitable sites:● for electricity generation using dry steam or high enthalpy brine after flashing;● directly as heat for district heating, agriculture, etc.
3. Solar energy: Solar radiation exploited for hot water production and electricity generation, separatelydefined as:● flat plate heat collectors, mainly of the thermosyphon type, for domestic hot water or for the seasonal
heating of swimming pools;● photovoltaic cells;● solar thermal-electric plants.Note: Passive solar energy for the direct heating, cooling and lighting of dwellings or other buildings isnot included.
4. Ocean energy: Mechanical energy derived from ocean currents, tidal movement or wave motion andexploited for electricity generation. This data is collected as “Ocean/Tidal/Wave”.
5. Wind energy: Kinetic energy of wind exploited for electricity generation in wind turbines.Note: The kinetic wind energy that is harvested as mechanical force for such applications as waterpumps is not included.
6. Biomass: Due to its varied forms and uses, biomass is a highly challenging resource on which tocompile statistics. In this study, “Biomass” comprises solid, liquid and gaseous organic feedstocks asdefined below. “Biomass” also includes the organic component of industrial and municipal waste,but not inorganic waste. In some instances, however, due to the existing system of data collection insome countries, biomass is combined with these inorganic wastes in a reporting category termed“Combustible Renewables and Waste (CRW).” Typically, the inorganic component of CRW is relativelysmall, but in a few cases it is substantial. In the country profiles in this study, CRW is used inFigures 1 (TPES) and 3 (Total Renewable Energy Supply), but biomass is used in Figure 2 and Table 1.
Part 1: Overview

Annex 2: Renewable Energy Statistics – Definitions and issues
101
Solid Biomass: Organic, non-fossil material of biological origin that may be used as fuel for heatproduction or electricity generation. It comprises:● Charcoal: the solid residue of the distillation and pyrolysis of wood and other vegetal material.● Wood, wood wastes, other solid wastes: purpose-grown energy crops (poplar, willow etc.), a
multitude of woody materials generated by an industrial process (wood/paper industry in particular)or provided directly by forestry and agriculture (firewood, wood chips, bark, sawdust, shavings,chips, black liquor, etc.) as well as wastes such as straw, rice husks, nut shells, poultry litter, crushedgrape dregs, etc. Combustion is the preferred technology for these solid wastes. The quantity of fuelused is reported on a net calorific value basis.
Biogas: A gas composed principally of methane and carbon dioxide produced by anaerobic digestionof biomass, comprising:● Landfill gas, formed by the digestion of organic landfilled wastes;● Sewage sludge gas, produced from the anaerobic fermentation of sewage sludge;● Other biogas, such as biogas produced from the anaerobic fermentation of animal slurries and of
wastes in abattoirs, breweries and other agro-food industries.
Liquid biofuels: cover the fuels listed below:● Bioethanol: ethanol produced from biomass and/or biodegradable fraction of organic waste;● Biodiesel: a diesel quality liquid fuel produced from biomass or used frying oils;● Biomethanol: methanol produced from biomass and/or the biodegradable fraction of organic waste;● Biodimethylether: a diesel quality fuel produced from biomass and/or the biodegradable fraction of
organic waste;● Bio-oil: a pyrolysis oil fuel produced from biomass.
Wastes:● Industrial Wastes: Wastes of industrial, non-renewable origin (solids or liquids) combusted directly
for the production of electricity and/or heat. Renewable industrial waste is reported in the solidbiomass, biogas and/or liquid biofuels categories.
● Municipal solid waste (renewables): Waste produced by households, industry, hospitals and thetertiary sector that contains biodegradable materials that are incinerated at specific installations.
● Municipal solid waste (non-renewables): Waste produced by households, industry, hospitals andthe tertiary sector that contains non-biodegradable materials which are incinerated at specificinstallations.
Issues Regarding Data Reliability
As with many types of energy statistics, the reliability and consistency of the data are dependent upon theexperience that the collecting staff and the reporting agents have with the energy technologies and energyproducts. Often, surveys used to collect national statistics are variations of forms and collection systems thathave been in place for decades, and both the collection staff and reporting agents have extensive experiencewith the data. For renewable energy, this is true especially where electricity generation is involved, and wherethe generating units are connected to the transmission grid. The transmission system operator is able tomeasure and maintain statistics on capacity, production, outages and other important factors. This is generallythe case in IEA countries for hydropower, geothermal, large wind farms and large biomass facilities.
Statistics will also be more reliable for energy products and technologies in commercial markets whereexchanges are likely to be recorded for taxation, subsidisation, market research and/or other market-relatedactivities. Wood cut, dried and sold through a commercial outlet may be recorded in national statistics,
102
while wood wastes collected by rural residents from nearby forests, wind breaks or removed from streamsis not. Scrap wood collected by local residents from a construction site, or agricultural residues deliveredby farmers to local biomass facilities may or may not be recorded.
To some extent, these problems can be overcome by periodic surveys, where experts, for example in windand solar energy, forestry or agriculture, assist statisticians. In an effort to establish a reliable base periodfor the EU renewables initiative mentioned above, Eurostat commissioned detailed surveys of renewablesenergy production, trade and consumption in the fifteen EU member countries from 1990 to 2000. Thus,historical statistics in that time period for the fifteen EU member countries tend to be more consistent andmore complete than for many non-EU IEA countries. Several of the non-EU countries are in the process ofsurveying and revising historical renewables statistics, but so far the efforts are not as systematic as thesurveys commissioned by Eurostat proved to be.
Issues Related to Renewables Statistics
There are some specific issues that lead to inconsistencies and misreporting in renewables statistics.Recognition and discussion of these issues is essential to improve the collection and provision of accuratestatistics – especially as energy markets evolve.
One issue results from the rapid expansion of distributed generation from solar PV and small wind,hydropower and biomass installations, as well as the provision of hot water from on-site solar thermalinstallations. This issue has both an off-grid and on-grid dimension. Although it is sometimes possible to trackcapital expenditures and capacity of such facilities, there is often no systematic means of collecting energyproduction statistics. Rather, these must be estimated by means accepted by the providers and users of thetechnology and the government agencies that collect and process statistics. Currently, the statistics collectionapproach used by many national governments does not account for off-grid facilities, thus energy productionfrom new renewables like wind, solar PV and solar thermal often goes unreported. In some cases, capacitystatistics are collected through commercial sales data, but without accepted means of estimating production.This obscures the picture further, as capacity increases but production remains flat. There is a strong incentiveto solve this issue as distributed/dispersed generation is expected to expand rapidly, and new non-renewable,modular energy technologies such as fuel cells are expected to enter the market.
Combustion of municipal solid wastes for electricity and heat generation is a significant portion of energyprovided by renewables and waste in some countries. There is controversy involved in the definition ofmunicipal solid waste (MSW). Waste collected from households, commercial establishments, hospitalsand other institutions contains components that are both organic and inorganic. Both the IEA and theEuropean Union exclude inorganic municipal solid waste from their definition of renewables; however,some IEA Member countries count all MSW as renewable. In other Member countries, surveys areunderway to determine what fraction of MSW is renewable. The implementation of recycling programmes,the separation of waste at the point of combustion and other techniques are expected to reduce the fractionof inorganic MSW. At this time, the IEA advises Member countries to divide the total quantity of municipalsolid waste equally between the renewable and non-renewable categories if they cannot distinguishbetween the actual components. Thus, the renewable component of this resource may not fully reflect thevolume that is actually produced and used. This inconsistency can lead to discrepancies among some ofthe tables and figures in the study, where totals and percentages may not add up to the same amount. Forexample, in the country profiles the shares derived from Table 1 may not reflect those in Figure 2 becausenon-renewable waste is allocated to the major fossil fuel category in Figure 2. Moreover, the “Total” givenin Table 1 includes non-renewable waste as well as electricity trade, so that the individual numbers do notnecessarily add up to the “Total”.
Part 1: Overview

Annex 2: Renewable Energy Statistics – Definitions and issues
103
The most recent Annual Renewables and Wastes Questionnaire defined small, medium and largehydropower facilities (see definitions above for more detail). However, there has been some problemimplementing this definition as several countries do not use the same size categories as those defined inthe questionnaire. In these cases, the capacity and production of small, medium and large hydropowerfacilities may not reflect the categories listed on the questionnaire and in the IEA databases. It is importantto resolve the issue of definitions so that consistent data between countries is available.
Energy RD&D Budget Information
Information on energy RD&D expenditure budgets is collected in the Questionnaire for CountrySubmissions for the SLT/CERT Annual Review of Energy Policies. The budgets are requested for the latestyear and estimates for two forward years. These questionnaires are usually completed by the energyministry or the statistical bureau of Member countries. The data are collected annually and are publishedeach year in Annex B of Energy Policies of IEA Countries.
When the IEA was created in 1974, the Energy Coordinating Group recognised the significant role energyRD&D can play in helping to solve energy problems. The recommendations from this group gave initialdirection to the work on RD&D. In 1977, the IEA established a review procedure for national energyRD&D programmes and started annual statistical monitoring of IEA Members' RD&D budgets. An effortwas made in 1993 to improve the quality and the transparency of energy RD&D expenditure data.
Over the last several years, it became apparent that there were problems with the RD&D data reported tothe IEA. In some instances, unclear definitions made it difficult for countries to correctly report certainprojects. In other instances, the "other" category became quite large as new technology areas appeared(e.g., carbon storage, hydrogen, fuel cells, etc.) which were not accounted for separately. The IEA iscurrently working with the European Commission on a project to revise the RD&D questionnaire to makereporting easier and to be more useful for analysis. The new questionnaire should be available in 2005.
All IEA countries have not reported RD&D budgets for every year, so the IEA Secretariat has estimated themissing data in order to have complete time series for the analysis in Chapter 2 of Part 1. The estimates arebased on the overall IEA trend for each individual technology. Due to these approximations, some of thefigures in Part 1 for energy and renewable energy RD&D may differ from the figures in the country profiles.The country profiles only use official IEA data that have been reported by Member governments.


Part 2
Country Profiles
Renewable Energy — Market and policy trends in IEA Countries

Australia
107

Gas
Coal
Oil
Renewables
Mtoe
0
20
40
60
80
100
120
140
1971
1973
1975
1977
1979
1981
1983
1985
1987
1989
1991
1993
1995
1997
1999
2001
Oil 28.7%
Renewables 5.7%
Gas 17.6%
Coal 48.0%
Figure 1. Total Primary Energy Supply by Source Figure 2. Shares of TPES 2001
Shares in Figure 2 may differ from Table 1.See Annex 2 for more detail.
108
Total Primary Energy Supply
Total primary energy supply (TPES) increased on average by 2.6% per year from 1990 to 2001, from 88Mtoe to 116 Mtoe. Australia has vast reserves of low-cost energy resources and is a major energy exporter.It is the world’s largest hard coal exporter and holds nearly 30% of the world’s resources of uranium. Thereis no nuclear production in Australia, and all of its uranium production is for export. Australia is also theworld’s third largest exporter of LNG. Energy supply is dominated by fossil fuels. In 2001, coal accountedfor 48% of TPES, oil for 28.7% and gas for 17.6%.
Renewable energy sources accounted for less than 6% of TPES in 2001, consisting mostly of biomass andhydropower. This is substantially lower than the share in 1970 of more than 8%, and in 1980 of just below7%. Nevertheless, renewables supply in TPES has increased from 5.1 Mtoe in 1990 to 6.6 Mtoe in 2001.This increase was due largely to an increase in biomass of 1.2 Mtoe over the period and to a smallerincrease in hydropower of approximately 0.2 Mtoe.
PART 2: COUNTRY PROFILES
Source 1970 1980 1990 1995 2000 2001 Imports
Coal 21.4 27.3 35.0 37.5 47.4 55.4 •
Oil 24.4 30.8 32.5 34.4 36.5 33.2 -Gas 1.2 7.5 14.8 16.7 19.3 20.3 •
Nuclear 0.0 0.0 0.0 0.0 0.0 0.0 -Renewables 4.3 4.7 5.1 5.5 6.4 6.6 -
Biomass 3.5 3.6 3.8 4.1 4.9 5.0Hydro 0.8 1.1 1.2 1.4 1.4 1.4Geothermal 0.0 0.0 0.0 0.0 0.0 0.0Wind/Solar 0.0 0.0 0.1 0.1 0.1 0.1
Total 51.3 70.4 87.5 94.4 109.8 115.6 •
% Renewables 8.4% 6.7% 5.8% 5.9% 5.8% 5.7%
* See Annex 2 for explanation of components in total and definition of biomass.• Net Exporter
Table 1. Total Primary Energy Supply by Source (Mtoe)*

AUSTRALIA
109
Electricity generation increased by 3.1% per year from 1990 to 2001. Generation in Australia ispredominately coal-fired, which accounted for 78% of total generation in 2001, reflecting the abundantsupply and low price of coal. Gas (12%) and hydropower (7.7%) also contributed. The share of renewableenergy sources in total electricity generation experienced a slight decline over the past decade from 9.6%in 1990 to 8.3% in 2001.

110
The share of renewable energy sources in TPES in 2001 was 5.7%. Renewable energy supply is mainlycomprised of biomass and hydropower. Biomass is the most significant contributor at 76.6%of total renewable energy sources while hydropower makes up 21.5%. Wind and solar combinedcontribute 1.9%.
The share of renewables in electricity generation decreased from 9.6% in 1990 to 8.3% in 2001. In 2001,hydropower was the main renewables contributor to total electricity generation at 7.7%. Figure 4 showsnet generating capacity of renewables and waste products, excluding large hydropower in 2001. Net
PART 2: COUNTRY PROFILES
CombustibleRenewables
and Waste
Policy Timeline
Research and Development
. Renewable Energy Promotion
. Renewable Energy Initiative
. REIIF/REEF
Market Deployment
. Ethanol Production Bounty
. Energy Card
. PV Rebate Programme
. Renewable Remote PowerGeneration Programme
. Renewable Commercialisation
. MRET
. REID (2003)
Denotes a significant change to a policy, such as an extension, repeal or revision.
Hydro
Solarand Wind
Mtoe
0
1
8
2
3
4
5
6
7
1971 73
1975 77
1979 81
1983 85
1987 89
199 93
1995 97
1999 01
Figure 3. Total Renewable Energy Supply and Policy Timeline
Renewable Energy Supply

AUSTRALIA
111
generating capacity from solar thermal sources increased on average by 5.8% per year from 1990 to 2001.Solar PV installed capacity grew at an average annual rate of 19.2% over the period. The first 2 MW ofwind capacity came on-line in 1994. By 2001 installed wind capacity was 76 MW.
Capacity (MW)
0
1400
200
400
600
800
1000
1200
Figure 4. Net Generating Capacity of Renewable and Waste Products
1990
1995
1996
1997
1998
1999
2000
2001
Hydro (<1 MW)
Hydro (1–10 MW)
Solar all Plants
Wind
Landfill Gas
Industrial Wastes
Wood/Wood Wastes/
Other Solid Wastes
Note: A change in data collection methods at the IEA occurred in 1999 with the separation of net generating capacity between small and large hydro. Capacity data for small hydro are not available prior to 1999.
Research and Development Trends1
The government total budget for energy RD&D was US$ 687 (in 2002 prices and exchange rates) between1979 and 1997. In this period, 12% of the total RD&D budget was allocated to renewable energy RD&D.
Government RD&D expenditures for renewables peaked in the early 1980s and declined notably after1985 except for a slight boost in 1993. The government RD&D budget for renewables in 1997 wasapproximately US$ 5 million.
Among the renewable technologies, solar heating and cooling received the highest level of funding atUS$ 28.43 million, or 33%, in the 1979 to 1997 period. Biomass was funded at US$ 20.23 million,representing 24% of renewable energy RD&D. Solar PV was the third largest area with 22% of therenewable RD&D expenditures from 1979 to 1997.
Prior to 1978, the main form of government support for renewable energy in Australia was directinvestment by government-owned utilities, notably in hydropower. In 1978, the National EnergyResearch, Development and Demonstration Council (NERDDC) was established, beginning an era inwhich support for RD&D was the primary form of policy support for renewables in Australia. This phaselasted until 1997. Of the AUS$ 234 million committed under the NERDDC to 1990, 11% was devoted
1. RD&D data for Australia are not available for certain years.

112
to renewable energy, while the bulk of the funds supported various forms of coal research. Thisprogramme, renamed the Energy Research & Development Corporation (ERDC), continued until 1997,and partially funded RD&D and commercialisation efforts in the renewable energy field, including smallequity investments.
PART 2: COUNTRY PROFILES
Million US$ (2002 prices and exchange rates)
0
120
20
40
60
80
100
Figure 5. Australia – Government Energy RD&D Budgets*
Total OtherTech./Research
TotalConservation
Total Power& Storage Tech.
Total NuclearFission/Fusion
Total RenewableEnergy
Total FossilFuels
1979
1980
1981
1983
1985
1987
1989
1993
1995
1997
Million US$ (2002 prices and exchange rates)
0
20
2
4
6
8
10
12
14
16
18
Figure 6. Australia – Government Renewable Energy RD&D Budgets*
Large Hydro(>10 MW)
SolarThermal-Electric
SolarPhoto-Electric
Solar Heating& Cooling
Geothermal
Biomass
Wind
1979
1980
1981
1983
1985
1987
1989
1993
1995
1997
Market Deployment Trends
Competitive grants under the Renewable Energy Promotion Programme in 1992 were the first marketdeployment policies to promote renewable energy sources. Funding for the Programme was aboutAUS$ 10 million over the period to 1995. These were followed by low interest rate loans for individualcustomers in 1995 and a co-operative research centre in 1996. These policies were relatively short-lived.
* Data are not available for certain years.
* Data are not available for certain years.

AUSTRALIA
113
In 1995, the Energy Card programme made available low interest loans for customers to purchase solarwater heaters, heat pumps and other renewable energy technologies. Total funding for the programme wasAUS$ 6 million. In 1996, a new co-operative research centre for renewable energy, known as ACRE, wasestablished, and it successfully promoted small-scale renewable energy demonstration programmes until2002. Many sub-national measures, such as the promotion of solar hot water heaters, are maintained byAustralian states, and this effort has expanded noticeably in recent years.
National renewable energy policy in Australia took a major step in 1997 when the policy announcement,Safeguarding the Future: Australia’s Response to Climate Change, was released. Most importantly, thispolicy included a Mandatory Renewable Energy Target (MRET), which requires additional electricity to besourced from renewable energy. MRET is a non-technology specific broad market-based mechanismdesigned to stimulate competition between renewable energy suppliers and technologies, and hence todrive down costs over the medium term. (Although there is preferential treatment for solar hot waterheaters.) The renewable energy sources and technologies eligible under the MRET are hydropower, wind,solar and various biomass products. This policy was expanded in 1998 to include investment incentivesand grants targeting PV and off-grid power. The measure was implemented by fixing annual targets,ramping up from April 2001 to reach 9 500 GWh per year by 2010 and maintaining this requirement until2020. Compliance is demonstrated via tradable certificates – the first mandatory national tradablecertificate scheme for renewables in the world.
The renewable energy certificates (RECs) are created by generators accredited by the Office of RenewableEnergy Regulator (ORER) with each certificate being equivalent to one MWh of generation from renewablesources. RECs can be traded in financial markets that are separate from physical electricity markets. Theymay also be banked by eligible generators, liable parties and REC market participants. RECs expire uponsurrender by liable parties. All electricity from accredited renewable energy generators is consideredeligible if generators commenced operation on or after 1 January 1997. Pre-existing generators only earnRECs for an increase in output above agreed baselines. Should liable parties fail to meet their share of themeasure, they are responsible for a shortfall charge of AUS$ 40 per MWh. Shortfall charges are redeemableif shortfalls are made up within three years. Latitude of up to 10% is allowed in meeting targets.
The ORER reported that, as of September 2003, approximately AUS$ 900 million had been invested innew renewable energy projects with more than AUS$ 1 billion of investment money already committedor planned. Although the renewable energy industry seems to have been fairly responsive to the measuresput in place by the MRET, a recent stalling in investment has been observed. This is considered to be inpart attributable to regulatory uncertainty arising from the Parer Report, which recommended thedismantling of the MRET based on deficiencies within the Australian energy reform system. To date,growth in renewable energy generation has come primarily from hydro and solar hot water applications.Generation from biomass, including bagasse, has not been as significant as expected prior to theintroduction of the MRET and it has had only a marginal influence on generation from solar PV.
In addition, the Safeguarding the Future statement announced the introduction of a suite of renewableenergy commercialisation programmes including:
● Renewable Energy Innovation Investment Fund (AUS$ 21 million) operational since 2000 as theRenewable Energy Equity Fund, REEF;
● Renewable Energy Commercialisation Programme (RECP) (AUS$ 30 million) a competitive biddingprogramme, now fully committed, despite additional funding in 1999;
● Renewable Energy Showcase programme (AUS$ 10 million) a large-scale demonstration programme,also now fully committed.
114
In 1998, support for renewable energy was again expanded through the Measures for a BetterEnvironment package. It established incentives for alternative and renewable transport fuels, aPhotovoltaic Rebate Programme (under which up to 50% of system capital costs could be recovered), anda major grant scheme (up to AUS$ 264 million) for conversion of off-grid power schemes from diesel torenewables.
Recently, the government instituted the Renewable Energy Industry Development (REID) Programme,which provides grants to Australian companies who can demonstrate that their projects will assist thedevelopment of the Australian renewable energy industry. Industry development grants are typically onthe order of AUS$ 100,000 and are intended to help address renewable energy market barriers, renewableenergy resource assessment, best practice guidelines, training and standard setting.
PART 2: COUNTRY PROFILES

AUSTRALIA
115
993
199
199994
995
199
1996
1997
1998
1999
2000
2001
2002
200399
119
919
9992
199990
1993
1994
1995
1996
1997
1998
1999
2000
2001
–14%
–12%
–10%
–8%
–6%
–4%
–2%
0%
2%
4%
Capacity (MW) Gross Electricity Production (GWh)
–16%
Hydropower Policy Timeline
Market Deployment
. Mandatory Renewable Energy Target
Denotes a significant change to a policy, such as an extension, repeal or revision.
1991
1992
0
1000
2000
3000
4000
5000
6000
7000
8000
19901991
19921993
19941995
19961997
19981999
20002001
Capacity
12500
13000
13500
14000
14500
15000
15500
16000
16500
17000
17500Production
Figure 7. Hydropower Capacityand Electricity Production
Figure 8. Hydropower Capacity(Year to Year Change)
Hydropower was the main contributor (7.7%) from renewable sources to total electricity generationin 2001. Installed capacity from hydropower decreased from 7 381 MW in 1990 to 6 203 MW in 2001.
Hydropower has been developed in Australia throughout the twentieth century, but large-scale resourcesare concentrated in just two regions: the Snowy Mountains (Victoria/New South Wales (NSW) border) andTasmania. Hydropower is eligible for support under MRET, provided the power is “new and additional”.In fact, MRET has provided significant incentive for the hydropower market to improve and upgradeexisting hydropower stations. The majority of these projects are in relation to existing generators allowingthem to generate above their 1997 baselines. It is estimated that as a result of MRET, more than AUS$ 240million will be invested in upgrading existing hydropower systems. MRET is also triggering investment insmall-scale run-of-river and retrofit hydro systems.
Biomass ProductionBiomass production experienced a slight growth of 2.2% per year between 1990 and 2001, an increaseof 42 621 TJ. Biomass is the largest renewables contributor to TPES. In 2001, solid biomass contributed76.6% of total renewables, which represents 4.3% of TPES.
Biomass resources – primarily bagasse, a by-product of sugar production – have been used for commercialpower generation for at least fifty years, primarily in Queensland and Northern NSW, the sugar-growingdistricts. The economics are favourable economics and the plants have not received policy support.
Renewable Energy Markets
Hydropower

116
PART 2: COUNTRY PROFILES
More recently, new and innovative biomass-to-energy projects are being supported by the MRET and, atthe sub-national level, policies such as greenhouse gas targets for power generators in NSW. These projectsrange widely, from co-firing of wood waste with coal (at very low cost) to gasification projects, waste-to-energy and bio-gas digesters. Some projects have also received financial support from sub-nationalgovernments, and research inputs from different institutions.
Growth in generation from biomass, including bagasse, has not been as significant as expected prior tothe introduction of MRET. Approximately one-fourth of RECs created during the first two years of operationwere created from biomass wastes, although none of them from dedicated biomass sources. There havenot been any RECs sourced from native forests, due largely to public opposition to their harvesting. Aswell, within the MRET system, participants are unable to distinguish between wood waste RECs generatedfrom native forests and from eligible wood waste sources. This may have been a factor in the unexpectedlylow numbers of wood waste RECs created.
1993
1994
1995
1996
1997
1998
1999
2000
2001
–10%
–5%
0%
5%
10%
15%
20%
25%
Production (TJ)
–15%
1991
1992
0
50000
100000
150000
200000
250000
19911990
Production
19921993
19941995
19961997
19981999
20002001
Figure 9. Solid Biomass Production Figure 10. Solid Biomass Production(Year to Year Change)
1993
1994
1995
1996
1997
1998
1999
2000
2001
2002
2003
1991
1992
1990Biomass Policy Timeline
Market Deployment
. Mandatory Renewable Energy Target
Denotes a significant change to a policy, such as an extension, repeal or revision.
Biogas Electricity ProductionInstalled capacity for biogas was 458 MW in 2001. (IEA statistics for installed capacity for biogas onlybecame available in 2000). Electricity generation from biogas has increased considerably from 23 GWhin 1995 to 729 GWh in 2001, an average growth rate of 78% per year.
Biogas is produced primarily from waste from food processing plants, livestock manure and humansewage. Most of the installed capacity is at sewage treatment plants, which are considered highly cost-effective.

AUSTRALIA
117
ProductionCapacity
0
500
50
100
150
200
250
300
350
400
450
0
800
100
200
300
400
500
600
700
Figure 11. Biogas Capacity and Electricity Production
GrossElectricity
Production(GWh)
Capacity (MW)
1990
1991
1992
1993
1994
1995
1996
1997
1998
1999
2000
2001
993
199
199994
995
199
199996
997
199
199998
999
199
200000
001
200
200002
200399
119
919
9992
199990Biogas Electricity Policy Timeline
Market Deployment
. Mandatory Renewable Energy Target
Denotes a significant change to a policy, such as an extension, repeal or revision.
Within the context of the MRET, relevant state, territory and local government authorities are, to varyingdegrees, developing strategic waste management frameworks which prioritise actions for reducing andmanaging waste materials, including use of biogas for electricity generation. Construction of the plantshas to a certain extent been boosted by the guaranteed market for excess electricity from the MRET,however, the treatment plants are part of broader pollution control measures.
Wind Power
The Australian wind market increased considerably at the end of the 1990s. Between 1994 and 2001,installed wind capacity grew from 2 MW in 1995 to 76 MW in 2001. In 2001, wind comprised 14.2% ofenergy supply from new renewables.
Growth appears to have coincided with the implementation of the MRET. Previously, there were nonational premiums for wind power. However, some state-level green power schemes provided asignificant premium for wind. These were particularly important in the years before MRET, but it did leadto double dipping for certain projects when the MRET came into force.
According to the Australian Wind Energy Association (AusWEA), the MRET has stimulated a substantialnumber of wind developments in Australia, with installed capacity increasing to 104 MW in 2002.According to AusWEA, this notable increase in the wind market was strongly linked to stimuli providedby the MRET. The AusWEA has speculated that without the MRET, the wind industry would have eitherstalled or collapsed. Wind has clearly been one of the big winners under MRET, based on costcompetitiveness and strategic decisions made by large generators and their demonstrated confidence inwind technology. Wind was responsible for the creation of just over 10% of RECs within the MRET.

118
PART 2: COUNTRY PROFILES
Solar Thermal Electricity ProductionInstalled capacity for solar thermal increased from 1990 to 1995 and has levelled off since then at13 MW. Electricity generation from solar thermal sources increased from 23 GWh in 1995 andlevelled off to around 30 GWh in 1997. Solar thermal accounted for 86% of energy supply from newrenewables.
More than AUS$ 200 million has been committed to the Renewable Remote Power GenerationProgramme (RRPGP) which was introduced in 2000. The programme provides up to 50% of the capitalcost of installing new renewable power facilities in off-grid applications. Funds are allocated to statesand territories on the basis of the relevant diesel fuel excise paid in each region by public generatorsin the years 2000-2001 to 2003-2004. Solar thermal systems such as solar concentrators have benefitedfrom this programme.
Small generation units (SGUs) have benefited from MRET measures, where a renewable generator isdefined as an SGU if its energy source is hydro, solar or wind with a generation capacity of less than10 kW and it generates up to 25 MWh of electricity each year. Special provisions within the MRETfacilitate the up-front purchase of these SGUs. Although growth of the solar thermal market has coincidedwith the implementation of the MRET, there is uncertainty over whether the relationship is causal as thereis doubt over whether the MRET provided a sufficient incentive for owners or suppliers to createRenewable Energy Certificates (RECs). The majority of the projects stimulated by the MRET aredemonstration projects.
1993
1994
1995
1996
1997
1998
1999
2000
2001
50%
100%
150%
200%
250%
Capacity (MW) Gross Electricity Production (GWh)
0%
1991
1992
0
10
20
30
40
50
60
70
80
19901991
19921993
19941995
19961997
19981999
20002001
Capacity
0
50
100
150
200
250Production
Figure 12. Wind Power Capacityand Electricity Production
Figure 13. Wind Power Capacity(Year to Year Change)
993
199
199994
995
199
1996
1997
1998
1999
2000
2001
2002
200399
119
919
9992
199990Wind Power Policy Timeline
Market Deployment
. Mandatory Renewable Energy Target
Denotes a significant change to a policy, such as an extension, repeal or revision.
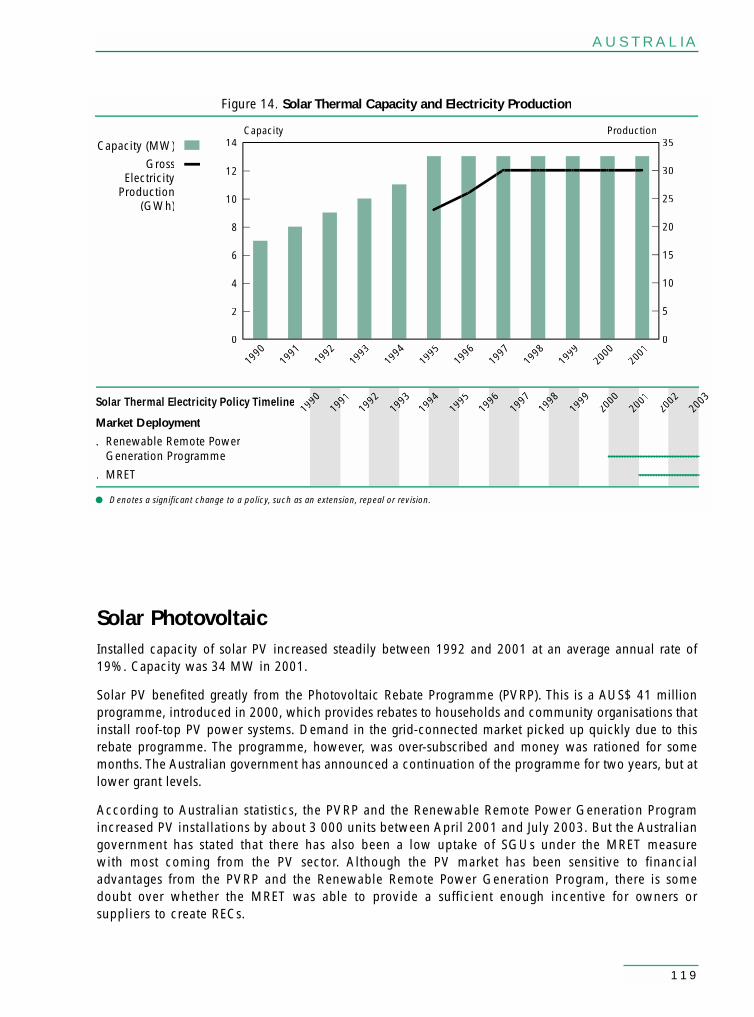
AUSTRALIA
119
ProductionCapacity
0
14
2
4
6
8
10
12
0
35
5
10
15
20
25
30
Figure 14. Solar Thermal Capacity and Electricity Production
GrossElectricity
Production(GWh)
Capacity (MW)
1990
1991
1992
1993
1994
1995
1996
1997
1998
1999
2000
2001
993
199
199994
995
199
199996
997
199
199998
999
199
200000
001
200
200002
200399
119
919
9992
199990Solar Thermal Electricity Policy Timeline
Market Deployment
. Renewable Remote Power Generation Programme
. MRET
Denotes a significant change to a policy, such as an extension, repeal or revision.
Solar PhotovoltaicInstalled capacity of solar PV increased steadily between 1992 and 2001 at an average annual rate of19%. Capacity was 34 MW in 2001.
Solar PV benefited greatly from the Photovoltaic Rebate Programme (PVRP). This is a AUS$ 41 millionprogramme, introduced in 2000, which provides rebates to households and community organisations thatinstall roof-top PV power systems. Demand in the grid-connected market picked up quickly due to thisrebate programme. The programme, however, was over-subscribed and money was rationed for somemonths. The Australian government has announced a continuation of the programme for two years, but atlower grant levels.
According to Australian statistics, the PVRP and the Renewable Remote Power Generation Programincreased PV installations by about 3 000 units between April 2001 and July 2003. But the Australiangovernment has stated that there has also been a low uptake of SGUs under the MRET measurewith most coming from the PV sector. Although the PV market has been sensitive to financialadvantages from the PVRP and the Renewable Remote Power Generation Program, there is somedoubt over whether the MRET was able to provide a sufficient enough incentive for owners orsuppliers to create RECs.
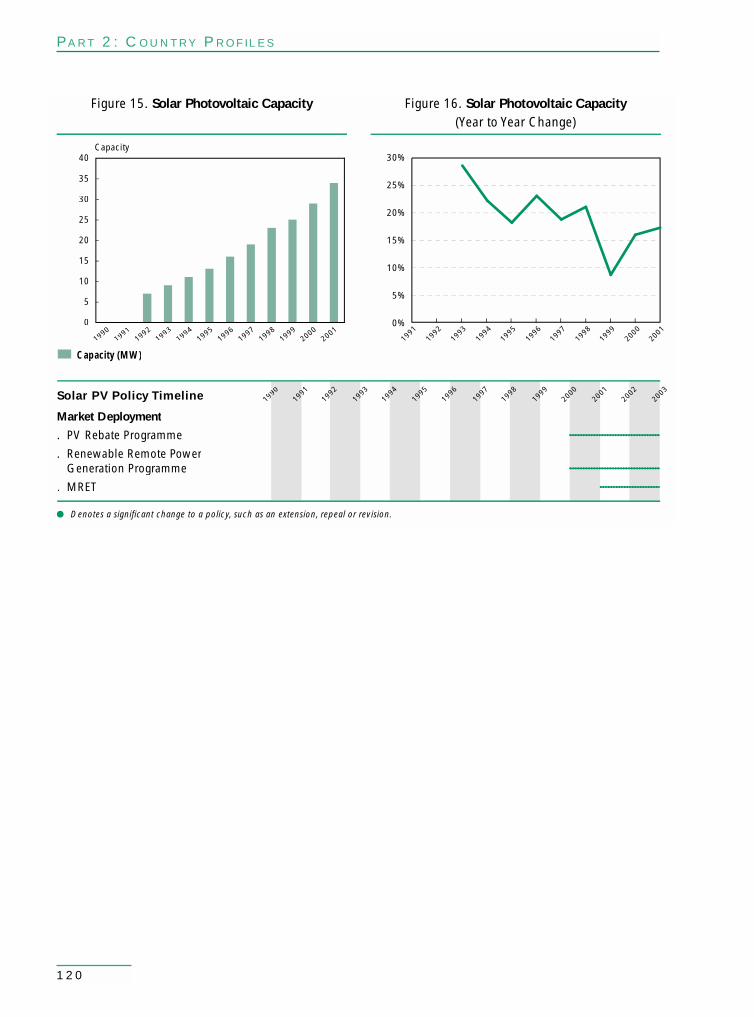
120
PART 2: COUNTRY PROFILES
1993
1994
1995
1996
1997
1998
1999
2000
2001
2002
2003
1991
1992
199990
1993
1994
1995
1996
1997
1998
1999
2000
2001
5%
10%
15%
20%
25%
30%
Capacity (MW)
0%
Solar PV Policy Timeline
Market Deployment
. PV Rebate Programme
. Renewable Remote Power Generation Programme
. MRET
Denotes a significant change to a policy, such as an extension, repeal or revision.
1991
1992
0
5
10
15
20
25
30
35
40
19921991
19901993
19941995
19961997
19981999
20002001
Capacity
Figure 15. Solar Photovoltaic Capacity Figure 16. Solar Photovoltaic Capacity(Year to Year Change)

AUSTRALIA
121
Australia Policy Chronology
Energy Research Development Corporation
Year 1990-1997
Policy Description Federal energy RD&D activities, including renewables, were carried out by theEnergy Research and Development Corporation (ERDC) with additionalindirect support from CSIRO (a government agency) and universities. However,severe budget constraints led the government to abolish ERDC in May 1997, asthe government considered that ERDC had established a good foundation forindustry to take on a greater role in funding its research.
Policy Type RD&D
RE Technology All renewables
National Greenhouse Response Strategy
Year 1992 – Present
Policy Description Progressive restructuring of the electricity and gas industries led to greatercompetition amongst generators, supply efficiency improvements, andinnovative promotion of renewable energy. Continued energy market reform isa key element of Australia’s greenhouse response and of the NGS. Furtherreforms outlined in the NGS include the delivery of consistent and compatiblenational frameworks for gas and electricity and removal of barriers to gridconnection of small-scale generation, such as cogeneration and renewablesources. Programmes under the NGS include the Renewable Energy PromotionProgramme, the Energy Card Programme, and the establishment of theAustralian Cooperative Research Centre for Renewable Energy (ACRE).
Policy Type Regulatory and administrative rules
RE Technology All renewables
Renewable Energy Promotion Programme
Year 1992-1995
Policy Description Part of the National Greenhouse Response Strategy, this information and grantprogramme encouraged the use of commercially viable renewable energytechnology by publicising and promoting stand-alone rural renewable energysystems.
Policy Type RD&D/Public awareness
RE Technology All renewables

122
PART 2: COUNTRY PROFILES
Ethanol Production Bounty Scheme
Year 1994-1996
Policy Description The Ethanol Production Bounty Scheme ran from July 1994 to August 1996 andprovided AUS$ 3 million to subsidise ethanol production. ApproximatelyAUS$ 4 million was additionally committed over two years towards an RD&Dprogramme.
Policy Type Capital grants
RE Technology Biofuel
Renewable Energy Initiative
Year 1994-1998
Policy Description This initiative supported the development of a robust renewable energytechnology industry. AUS$ 10 million of additional funds were made availableover seven years to support the establishment of a Co-operative ResearchCentre, with a primary objective to develop renewable energy.
Policy Type RD&D
RE Technology All renewables
Energy Card
Year 1995-1997
Policy Description The Energy Card was a low interest credit card available to customers for thepurchase of solar water heaters, heat pumps and other renewable energytechnologies. The AUS$ 6 million programme sought to demonstrate thefeasibility of innovative financing for solar water heaters and other renewableenergy and efficiency applications via low interest loans.
Policy Type Third-party finance
RE Technology All renewables
Purchase of Renewable Energy
Year 1995
Policy Description New South Wales (NSW) passed legislation in 1995 requiring electricitydistributors and retailers to develop one, three and five-year plans forpurchasing renewable energy as part of the procedure required to obtain anobligatory licence.

AUSTRALIA
123
Policy Type Obligations
RE Technology All renewables
Solar Cell Initiative
Year 1995-1999
Policy Description This R&D initiative in New South Wales involved Pacific Power and academia,and provided AUS$ 46 million from 1995 to 1999.
Policy Type RD&D
RE Technology Solar photovoltaic
Green Power Scheme
Year 1997 - Present
Policy Description The New South Wales Government’s Sustainable Energy DevelopmentAuthority (SEDA) regulates its green power schemes. Since inception in 1997,approximately 15 000 domestic customers and 800 businesses have joined andthere has been an investment of AUS$ 26 million in renewable energy projectsassociated with the schemes.
Policy Type Green pricing
RE Technology All renewables
Renewable Energy Innovation Investment Fund (REIIF)
Year 1997 - Present
Policy Description This programme provides funds to help with the commercialisation ofrenewable energy technologies that are in an early stage of development.
Policy Type RD&D
RE Technology All renewables
Renewable Energy Equity Fund
Year 1999 - Present
Policy Description The Renewable Energy Equity Fund (REEF) provides venture capital to small,innovative companies for the development of renewable technologies. The fundis managed by an independent company with supervision provided by theIndustry Research and Development board and the AGO. The Commonwealthis both the regulator and a major investor. It has allocated AUS$ 17.7 million,which is matched by private equity on a 2:1 basis, amounting to a total ofAUS$ 26.6 million over ten years. REEF targets the renewable energy industry
124
PART 2: COUNTRY PROFILES
sector and operates in the same way as other venture capital investment funds.The fund manager raises capital from investors and assesses small businesses inwhich to invest based on the expected rate of return. Eligible companies mayreceive a maximum investment of AUS$ 3 million or 10% of the initial capital(whichever is less).
Policy Type Capital grants
RE Technology All renewables
Cities for Climate Protection (CCP) Australia
Year 1999 - Present
Policy Description Cities for Climate Protection (CCP) Australia is an international trade-markedprogramme of the International Council for Local Environmental Initiatives(ICLEI) in collaboration with the Australian Greenhouse Office. By participatingin CCP Australia, councils commit to progress through five milestones to reducetheir greenhouse gas emissions:
• Assess the emissions produced by their own facilities (corporate emissions)and by the community.
• Establish an emissions reduction goal.• Develop a local action plan.• Implement the local action plan.• Monitor and report on the implementation of the local action plan.
Policy Type General energy policy
RE Technology All renewables
Renewable Energy Action Agenda
Year 2000 - Present
Policy Description Industry and government work in partnership to develop a Renewable EnergyAction Agenda (REAA), launched in 2000. The REAA Vision is “to achieve asustainable and internationally competitive renewable energy industry whichhas annual sales of AUS$ 4 billion”. Over the last three years, the governmenthas worked with the renewable energy industry to implement action agendainitiatives that aim to increase community commitment to renewable energy,encourage exports, improve the reliability and quality of renewable energyproducts and services, develop a renewable transport fuels industry, ensure thatskilled people are available to support industry growth, and encourage aculture of market-driven innovation.
Policy Type Public awareness
RE Technology All renewables

AUSTRALIA
125
Measures for a Better Environment Package
Year 2000 - 2004
Policy Description The federal budget adopted in 2000 allocated nearly AUS$ 800 million ofadditional funding to greenhouse gas reduction programmes over four years.These measures are known collectively as Measures For a Better Environment.They include:
• Greenhouse Gas Abatement Programme.• Photovoltaic Rebate Programme.• Remote Renewable Power Generation Programme.• Renewable Energy Commercialisation Programme.• Alternative Fuels Conversion Programme.
Policy Type Capital grants/Consumer grants/rebates
RE Technology All renewables
Greenhouse Gas Abatement Programme
Year 2000 - Present
Policy Description The Greenhouse Gas Abatement Programme (GGAP) is a major governmentinitiative to reduce Australia’s net greenhouse gas emissions by supportingactivities that are likely to result in substantial emission reductions orsubstantial carbon sink enhancement, particularly in the first commitmentperiod under the Kyoto Protocol (2008-2012). AUS$ 400 million has beenallocated to the programme.
This environmental initiative is a key part of the Measures for a BetterEnvironment package, announced in 1999 in association with the government’stax reforms.
GGAP targets opportunities for large-scale, cost-effective and sustainedabatement across the economy. GGAP only supports projects that are expectedto result in quantifiable and additional abatement not expected to occur in theabsence of GGAP funding. Priority is given to projects that will deliverabatement exceeding 250 000 tonnes of carbon dioxide equivalents (CO2-e)per annum. Projects that do not meet this threshold but meet other criteria at ahigh degree may be supported. GGAP employs a competitive selection process,with two key cost-effectiveness indicators deciding project selection:
• GGAP cost (AUS$) per metric ton of reasonably assured and additionalCO2-e estimated to be abated in 2008-2012.
• Net national cost (AUS$) per metric ton of reasonably assured andadditional CO2-e estimated to be abated in 2008-2012.
Policy Type Capital grants
RE Technology All renewables
126
PART 2: COUNTRY PROFILES
Photovoltaic Rebate Programme Year 2000 - Present
Policy Description The Photovoltaic Rebate Programme (PVRP) – (AUS$ 41 million funding)provides rebates to households and community organisations that install roof-top PV power systems. The level of rebate is based on peak PV output. Theminimum system size is 450-Watt peak output. There is no maximum size,although the rebate of AUS$ 4.00 per peak watt (ppW) for new systems iscapped at AUS$ 4 000 per residential system and AUS$ 8 000 per communitybuilding system. Extensions to existing PV systems can receive rebates ofAUS$ 2.50 ppW capped at AUS$ 2 500 (1.0 kW). The community buildingscomponent is similar in minimum size and rebates, but these are generallycapped at AUS$ 10 000 (2 kW) unless exceptional circumstances apply.
Policy Type Consumer grants/rebates
RE Technology Solar photovoltaic
Renewable Remote Power Generation Programme Year 2000 - Present
Policy Description The Measures For a Better Environment package includes a Renewable RemotePower Generation Programme. This programme provides up to 50% of thecapital cost for installing new renewable power facilities in off-gridapplications. Funds are allocated to states and territories on the basis of therelevant diesel fuel excise paid in each region by public generators in the years2000-2001 to 2003-2004. To be eligible, installations must be able todemonstrate that they displace diesel power with renewables. Qualifyingcapital costs include renewable energy generation equipment,enabling/ancillary equipment (inverters, etc.) and essential expenditures suchas installation costs. The programme does not fund solar hot water systems.
Policy Type Capital grants
RE Technology All renewables
Renewable Energy Commercialisation Programme Year 2000 - Present
Policy Description The Renewable Energy Commercialisation Programme (RECP) is aAUS$ 48 million competitive grants programme, launched under the“Measures for a Better Environment” package. It is designed to assist withtechnology commercialisation and to foster the development of a renewableenergy industry in Australia. Commercialisation grants vary betweenAUS$ 100 000 and 1 million. Projects are chosen for their strong commercialpotential, contribution to diversification of the renewable energy industry andreduction of greenhouse gas emissions. Applicants must fund at least 50% ofproject costs. Funds under this component have been fully committed.

AUSTRALIA
127
Policy Type Capital grants
RE Technology All renewables
Mandatory Renewable Energy Target Year 2000 - Present
Policy Description The Renewable Energy (Electricity) Act 2000 sets the framework for theMandatory Renewable Energy Target (MRET). The government’s renewableenergy target seeks to raise the contribution of renewable energy sources inAustralia’s electricity mix by 9 500 GWh per year by 2010 and maintain thisrequirement until 2020. Under this measure, tradable Renewable EnergyCertificates (RECs) are used to demonstrate compliance with the objective.
All wholesale electricity purchases on grids of more than 100 MW of installedcapacity have to apply mandatory renewable energy targets since 1 April 2001.In order to meet their obligation, liable parties (wholesale purchasers) surrenderRenewable Energy Certificates to the Renewable Energy Regulator. ARenewable Energy Certificate represents 1 MWh of electricity. The penaltypayment for non-compliance is AUS$ 40 per MWh (non-tax deductible). TheOffice of the Renewable Energy Regulator administers the MRET.
Policy Type Obligations / Tradable certificates
RE Technology All renewables
Study on Ethanol Year 2000 - Present
Policy Description Australia’s federal government funds a study of the commercial viability ofincreasing ethanol fuel production in the sugar industry. This study, estimatedto cost AUS$ 20 000, is co-ordinated by the Australian Bureau of Agriculturaland Resource Economics (ABARE). The initiative builds on an existingcommitment of AUS$ 2 million for a ligno-cellulosic ethanol pilot plant.
Policy Type RD&D
RE Technology Biofuel
Green Electricity Market Year 2001 - Present
Policy Description This programme supports the development of a voluntary, industry-ownedGreen Electricity Market (GEM) that trades in “green electricity rights” withgovernment funding under the Renewable Energy CommercialisationProgramme (RECP). This trading incorporates the Renewable Energy Certificatesunder the Mandatory Renewable Energy Target (MRET).
Policy Type Obligations / Tradable certificates
RE Technology All renewables

128
PART 2: COUNTRY PROFILES
Victorian Greenhouse Strategy
Year 2002 - Present
Policy Description Australia’s Victorian State government has allocated AUS$ 100 million toclimate change programmes over the period 2002 to 2004. The strategycontains 59 actions presented in ten “modules”, including energy.
Policy Type General energy policy
RE Technology All renewables
Renewable Energy Industry Development (REID)
Year 2003 - Present
Policy Description The Renewable Energy Industry Development (REID) programme is a AUS$ 6 million competitive grants programme that supports the renewableenergy industry by providing grants to Australian companies who candemonstrate that their projects will assist the development of the domesticrenewable energy industry.
Industry development grants are typically AUS$ 100 000. Project applicantsmust not obtain significant individual financial or commercial benefits andproject outcomes need to be disseminated to the wider Australian industry.Targeted at industry associations and community organisations, grants mayaddress renewable energy market barriers, renewable energy resourceassessment, best practice guidelines, training, standard setting and relatedtopics.
Policy Type Capital grants
RE Technology All renewables

Austria
129

Gas
Coal
Oil
Renewables
Mtoe
0
5
10
15
20
25
30
35
1971
1973
1975
1977
1979
1981
1983
1985
1987
1989
1991
1993
1995
1997
1999
2001
Gas 22.6%
Coal 12.2%Renewables 21.5%
Oil 43.7%
Figure 1. Total Primary Energy Supply by Source Figure 2. Shares of TPES 2001
Shares in Figure 2 may differ from Table 1.See Annex 2 for more detail.
130
Total Primary Energy Supply
Total primary energy supply (TPES) grew at an average annual rate of 1.9% from 1990 to 2001, from25 Mtoe to nearly 31 Mtoe. Oil supply accounts for the largest share of TPES, 43% in 2001, but its sharehas declined from 52% in 1980 (Table 1). Natural gas represented 23% of TPES in 2001. Coal supplydeclined from 4.1 Mtoe in 1990 to 3.7 Mtoe in 2001, when it accounted for 12% of TPES. Hydropowerrepresented some 12% of TPES in 2001 and biomass 9.4%. Wind and solar energy represented lessthan 1%.
The share of renewables in TPES increased substantially over the past two decades, from 15% in 1980 and21% in 1990 to almost 22% in 2001. This was largely due to Austria’s success in exploiting its majorbioenergy and hydropower resources. Renewable energy supply increased from 5 Mtoe in 1990 to6.6 Mtoe in 2001, an average annual growth of 2.6%. The use of large-scale hydropower and biomass inAustria is among the highest in Europe. From 1990 to 2001, biomass supply grew from 2.3 Mtoe to
PART 2: COUNTRY PROFILES
Source 1970 1980 1990 1995 2000 2001 Imports
Coal 4.5 3.7 4.1 3.5 3.6 3.7 88.8%Oil 9.2 12.2 10.6 11.5 12.2 13.1 89.0%Gas 2.5 4.2 5.2 6.4 6.5 6.9 72.4%Nuclear 0.0 0.0 0.0 0.0 0.0 0.0 -Renewables 2.5 3.6 5.0 5.8 6.4 6.6 -
Biomass 0.7 1.1 2.3 2.6 2.7 2.9Hydro 1.8 2.5 2.7 3.2 3.6 3.6Geothermal 0.0 0.0 0.0 0.0 0.0 0.0Wind/Solar 0.0 0.0 0.0 0.0 0.1 0.1
Total 18.2 23.3 25.0 27.1 28.8 30.7 65.1%% Renewables 13.2% 15.3% 19.9% 21.3% 22.0% 21.5%
* See Annex 2 for explanation of components in total and definition of biomass.
Table 1. Total Primary Energy Supply by Source (Mtoe)*
AUSTRIA
131
2.9 Mtoe, and hydropower production increased from 2.7 Mtoe to 3.6 Mtoe. Together, they comprisedmore than 98% of renewable energy supply in Austria in 2001. Solar thermal and wind power mademinor contributions to renewable energy supply. Geothermal energy is minimally exploited in Austria.
Electricity generation is dominated by hydropower, which accounted for 67% of total generation in 2001.Fossil fuels accounted for some 30%. Biomass contributed 2.8%, but its share is expected to increase.Electricity generation from solid biomass-fired plants increased by nearly 3% per year from 1990 to 2001.Wind and solar energy contributed less than 1% of total electricity generation in 2001.

132
PART 2: COUNTRY PROFILES
Policy Timeline
Research and Development
Market Deployment
. Kommunalkredit (grants)
. Voluntary Agreements
. Upper Austrian Energy Plan
. Ordinance (feed-in tariffs)
. Promotion Instrument for Electricity from RE
. EIWOG (feed-in tariffs)
. Renewable Energy Targets
. Housing Creation and Refurbishment (tax incentives)
Energy Policy
. Eco-Tax
. Electricity Act 2000
Denotes a significant change to a policy, such as an extension, repeal or revision.
CombustibleRenewables
and Waste
Hydro
Geothermal
Solarand Wind
Mtoe
0
1
8
2
3
4
5
6
7
1971 73
1975 77
1979 81
1983 85
1987 89
199 93
1995 97
1999 01
Figure 3. Total Renewable Energy Supply and Policy Timeline
Renewable Energy Supply
Renewable energy has historically played a prominent role in Austria’s energy supply, concentratedprimarily in large hydropower schemes and biomass use. Total renewable energy supply has increasedsteadily over the past few decades, largely due to policy support for indigenous resources and to highfossil fuel prices in the 1970s.
Renewable energy development has been a central theme of energy policy since the establishment of theAustrian energy guidelines in 1976. Renewables are particularly valued because of their role in reducing

AUSTRIA
133
CO2 emissions. Because of the large proportion of renewables in TPES, Austria has one of the lowest CO2emissions per capita among IEA Member countries. Policies targeted toward the development of biomassheating and solar thermal technologies have resulted in substantial market growth. While biomass andhydropower are significant contributors to energy supply in Austria, solar PV and wind energy haveexhibited little market growth until very recently due to ineffective policies.
Quotas and feed-in tariffs have been the main mechanisms to encourage electricity generation fromrenewables, although the introduction of a guaranteed market in conjunction with investment grantsthrough the federally administered Kommunalkredit also spurred market growth. National quotas,however, were put in place without regard for unequal geographic resource allocation, i.e., each statewas required to have a mix of renewable power systems regardless of its ability (climatic or geographic)to support it. Feed-in tariffs were established based more on each Länder’s specific political climate andnatural resources than on optimising the renewable energy technology with geographic location. Austriahas been working on streamlining the process through the Green Electricity Act 2002 with theestablishment of national feed-in tariffs. The goal is to increase the share of solar and wind energy intotal energy supply. The result has been dynamic market development since feed-in tariffs were enactedin 2003.
Austria’s target under the EU Directive for Electricity Produced from Renewable Energy Sources 2001 is toincrease the share of renewables in electricity generation from 70% in 1997 to 78.1% in 2010.
Research and Development Trends
Austria spent a total of US$ 785 million (2002 prices and exchange rates) on government energy RD&Dbetween 1977 and 2002. Energy research and development expenditures averaged US$ 40 million toUS$ 45 million from 1977 to 1985, after which they dropped to a low of about US$ 12 million in 1990.Funding rebounded to about US$ 25 million in 1994 where it has since remained relatively stable.In Austria, 20% of its total RD&D budget in the 1977 to 2002 period was allocated to renewableenergy RD&D.
Million US$ (2002 prices and exchange rates)
0
60
10
20
30
40
50
Figure 4. Austria – Government Energy RD&D Budgets
Total OtherTech./Research
TotalConservation
Total Power& Storage Tech.
Total NuclearFission/Fusion
Total RenewableEnergy
Total FossilFuels
1978
1980
1982
1984
1986
1988
1990
1992
1994
1996
1998
2000
2002

134
From 1977 to 2002, 56% of the total renewables RD&D budget was allocated to biomass technologies.Total funding was approximately US$ 95.2 million. Solar heating and cooling accounted for some 19%,followed by solar photovoltaics with 13%. Funding for hydropower and geothermal is minimal.
Austria participates in international collaborative RD&D in Bioenergy, Photovoltaic Power Systems, SolarHeating and Cooling and Wind Turbine Systems through the IEA Implementing Agreements.
Market Development Trends
Over the past decade, RD&D funding for advanced biomass, solar and heat pump technologies resultedin the market deployment of biomass heating systems, solar systems, heat pumps and solar PV for specialapplications. Austria has employed grants, tax incentives, feed-in tariffs and, more recently, portfoliostandards to support the market deployment of renewables. The markets which are highlighted in thisprofile are biomass electricity and heat generation, wind power, solar thermal and solar PV.
In 1994, the Upper Austrian Energy Plan established a target to increase the use of renewable energy inthe region. The target, which was met, included increasing the proportion of energy provided fromrenewable sources to 30% by 2000. The Upper Austrian Energy Plan was very successful through acombination of support measures from both national and local sources, combined with a high level ofinformation dissemination to raise awareness in the region. Similar initiatives are now being implementedin other Austrian regions, supported through local or regional energy plans.
Since 1994, federal grants and incentives have been administered primarily by the Kommunalkredit forrenewable energy producers, such as firms, associations and public entities. These federal grants typicallyconstitute 30% of eligible costs and are awarded to entrepreneurs investing in small hydro plants, modernbiomass-based heating systems which include small networks for district heating, biogas, sewage gas,geothermal systems, heat pumps, solar thermal above 10 m2, photovoltaic and wind installations. Thegrants can also be combined with financial support from the Länder to cover up to 66% of eligible costs.
Beginning in January 1994, voluntary agreements between the Ministry of Economic Affairs and theAssociation of Electricity Utilities provided incentives of 100% of the delivery price for PV and wind
PART 2: COUNTRY PROFILES
Million US$ (2002 prices and exchange rates)
0
12
2
4
6
8
10
Figure 5. Austria – Government Renewable Energy RD&D Budgets
Large Hydro(>10 MW)
SolarThermal-Electric
SolarPhoto-Electric
Solar Heating& Cooling
Small Hydro(<10 MW)
Geothermal
Biomass
Wind
1978
1980
1982
1984
1986
1988
1990
1992
1994
1996
1998
2000
2002

AUSTRIA
135
power, and 20% of the delivery price for biomass and biogas for renewable electricity systems installedbefore end-1996. The payment of higher buy-back rates at these levels ceased at the end of 1999.
Feed-in tariffs in Austria were first introduced under the August 1995 Ordinance. The Ordinanceestablished guaranteed minimum prices for electricity traded between provinces and produced from CHPstations and renewable electricity plants. For plants smaller than 2 MW, these prices ranged from 100%to 125% of the prices charged by the Verbundgesellschaft, the national electricity wholesale company,depending on the time of delivery. For plants larger than 2 MW, the rates were 100% of the prices chargedby the Verbundgesellschaft. The Ordinance was refined in 1997 under the Promotion Instrument forElectricity from Renewables (PIER), which provided both a capital cost grant and a guaranteed tariff forrenewable electricity fed into the grid. Projects were selected through a public competitive tenderprocedure where grants were awarded based on lowest capital cost for each technology type. The capitalcost grants were capped at a 7% rate of return for fifteen years. In addition, electricity from these systemsbenefited from a guaranteed market and buy-back rates of fifteen years.
The PIER also provided capital investment subsidies for biomass, which were disbursed through theDistrict Heating Promotion Act. Incentives under this Act ceased in 1996. Capital subsidies of 8% are stillavailable for the construction, restoration or enlargement of small (0.5-10 MW) hydropower systems,and subsidies of up to 25% are available for micro (< 0.5 MW) systems that are both remote andenvironmentally friendly. In addition to federal promotional measures, provincial authorities may alsoprovide subsidies or favourable loans for biomass heating plants.
The Electricity Act 1998 (EIWOG) adjusted feed-in tariffs to further stimulate electricity production fromrenewable energy producers. The EIWOG obliged system operators to purchase renewable electricityoffered by independent power producers and to pay minimum feed-in tariffs. The tariffs were defined byeach of the nine provinces and thus differed according to province. In addition to the tariff levels,provinces were also responsible for setting quota levels and conditions. The feed-in tariffs differedaccording to technology, type and duration of contract, and daily and seasonal demand.
In July 2000, the Austrian Parliament approved an amendment to the Electricity Act 1998, establishingthe Electricity Liberalisation Act 2000. Under this Act, renewable energy obligations were put into forcein December 2000. Distribution system operators are now required to purchase electricity fromrecognised renewables plants up to a certain share of their electricity sales to final consumers. In 2001,the share was at least 1% and in 2003 at least 2%. The share in 2005 will be at least 3% and in 2007 at least 4%. Purchase prices are regulated. The grid operators can resell the electricity to final consumersor to electricity traders. If the minimum percentage amount is exceeded, the grid operator can sell theexcess amount to other operators of distribution grids. Qualifying plants include wind, PV, geothermal,biomass, biogas, digester and sewage gas, as well as co-firing and multi-fuelled plants using a highproportion of renewable fuels, and combustion of wastes containing a high percentage of renewablematerials.
Personal tax incentives for the purchase of biomass and solar technologies were introduced in 2001 underthe Housing Creation and Refurbishment Law. This support was redesigned and improved in 2003 underthe Dwelling Improvement and Housing Promotion Subsidy. This recent policy is considered one of themost important in promoting the use of renewable energy sources in the residential sector.
In July 2002, the National Council and Federal Council passed the Green Electricity Act, amending theEIWOG and implementing the EU Directive 2001/77/EU Generation of Electricity from RenewableSources of Energy. This Act replaced the legislation concerning renewable power within the scope ofEIWOG and abolished the system based on provincial legislation. The Act governs public support for

136
green energy and combined heat and power generation throughout the country. Through this Act, fees forrenewables-based power, which varied from state to state, will be replaced with a uniform fee for powergenerated by combined heat and power plants, renewable sources and small hydropower plants. The totalcost of support at the federal level is much lower than it would have been to achieve the same objectiveindividually in each state. This is because the renewable potential can now be exploited according togeographical resource allocation (i.e., wind power in eastern Austria and hydroelectric power in westernAustria). The supply tariffs for the renewable plant operators are the same throughout Austria.
The objectives outlined in the Green Electricity Act are to generate 9% of renewables-based electricityfrom small-scale hydroelectric plants and 4% from other renewable plants. These targets are to beachieved by providing favourable supply tariffs until 2008. Large hydropower generation will be expectedto generate enough electricity so that the overall objective of 78.1% of electricity from renewable sourcescan be reached by 2010.
The Act guarantees payment of feed-in tariffs for thirteen years at the following rates (per kWh):
● Small hydro power, depending upon the amount of electricity fed into the grid: from € 0.0315 to€ 0.0568 for existing plants, from € 0.0331 to € 0.0596 for refurbished plants, from € 0.0378 to€ 0.0625 for new plants.
● PV: € 0.47 for plants > 20 kWpeak € 0.60 for plants < 20 kWpeak.
● Wind: € 0.078 for new plants.
● Geothermal: € 0.07.
● Wood chips: € 0.102 to € 0.16.
● Waste with high bio-share: € 0.027 to € 0.128.
● Co-firing in fossil fuel plants: € 0.03 to € 0.065.
● Biofuels: € 0.10 for plants > 200 kW, € 0.13 for plants < 200 kW.
● Biogas: € 0.0725 to € 0.165.
● Landfill gas: € 0.03 for plants > 1 MW, € 0.06 for plants < 1 MW.
Energy Policy Context
An Eco-tax on oil products was introduced in 1995, and a tax on gas and electricity in 1996. The goal ofthe tax was to raise revenue, not to affect patterns of energy consumption. In 2000, the tax on gas andelectricity was doubled. The competitiveness of biomass improved relative to alternative fuels due to thetax. Biodiesel was largely exempt from the mineral oil tax in the 1990s and received a total exemptionstarting in 2000.
PART 2: COUNTRY PROFILES

AUSTRIA
137
993
199
1994
1995
1996
1997
1998
1999
2000
2001
2002
200399
119
919
9992
199990
1993
1994
1995
1996
1997
1998
1999
2000
2001
0%
5%
10%
15%
20%
25%
30%
35%
Capacity (MW) Gross Electricity Production (GWh)
–5%
Biomass Electricity Policy Timeline
Research and Development
Market Deployment
. Kommunalkredit (grants)
. Voluntary Agreements
. Promotion Instrument for Elecricity from RE
. EIWOG (feed-in tariffs)
. Renewable Energy Targets
. Housing Creation and Refurbishment (tax incentives)
. Green Electricity Act
. Dwelling Improvement and Housing Promotion Subsidy
Energy Policy
. Eco-Tax
Denotes a significant change to a policy, such as an extension, repeal or revision.
1991
1992
0
100
200
300
400
500
600
700
800
900
19901991
19921993
19941995
19961997
19981999
20002001
Capacity
0
200
400
600
800
1000
1200
1400
1600
1800
2000Production
Figure 6. Solid Biomass Capacity and Electricity Production
Figure 7. Solid Biomass Capacity(Year to Year Change)
Biomass Electricity Production
Solid biomass accounted for some 3.5% of total electricity generation from renewables in 2001. Netgenerating capacity of solid biomass increased from 400 MW in 1990 to 766 MW in 2001. Generationgrew from 1 116 GWh in 1990 to 1 552 GWh in 2001, an average annual growth of more than 3%.
Electricity generation from biomass has experienced two market spurts in the last decade, in 1994and 1998. The 1994 increase coincided with the introduction of a guaranteed market through a voluntary
Renewable Energy Markets

138
PART 2: COUNTRY PROFILES
agreement between the Ministry of Economic Affairs and the Association of Electric Utilities. Under thisagreement, 20% of the delivery price for biomass was supplied for a period of three years. The 1998increase is ascribed to the combination of a tax on gas and electricity in 1996 and the implementation ofthe Promotion Instrument for Electricity from Renewables in 1997 which provided both a capital incentiveand a guaranteed tariff for renewable electricity fed into the grid.
The Green Electricity Act of 2002 was very effective in stimulating a significant number of major biomassco-generation plants, especially in the wood products industry.
Biomass Heat Production
Production
0
10000
1000
2000
3000
4000
5000
6000
7000
8000
9000
Figure 8. Solid Biomass Heat Production
Gross HeatProduction (TJ)
1990
993
199
199994
995
199
199996
997
199
199998
999
199
200000
001
200
200002
003
20099
119
919
9992
199990Biomass Heat Policy Timeline
Research and Development
Market Deployment
. Kommunalkredit (grants)
. Promotion Instrument for Elecricity from Renewables
. Housing Creation and Refurbishment (tax incentives)
. Dwelling Improvement and Housing Promotion Subsidy
Energy Policy
. Eco-Tax
Denotes a significant change to a policy, such as an extension, repeal or revision.
1991
1992
1993
1994
1995
1996
1997
1998
1999
2000
2001
Heat production from solid biomass increased from 1 404 TJ in 1990 to 8 874 TJ in 2001, an averageannual growth of 18.3%. The widespread use of biomass for heat in Austria has traditionally taken theform of heating using traditional wood stoves. Although the use of traditional wood stoves has declinedand continues to do so, and the use of biomass has diversified, approximately 60% of heat consumption

from biomass is still used for rural space heating. The remainder is used in the pulp and paper industry,particularly black liquor, process heat applications in the sawmill industry (wood drying), district heatingfacilities and, to a lesser extent, waste incineration plants.
During the 1980s, biomass received an important stimulus through federal, state and local support ofBiomass District Heating Plants (BMDH), a heating scheme for rural villages. State support has beenprovided through financial incentives and the establishment of organisations dedicated to the managementof BMDH. In 2001, there were 694 biomass district heating plants with 822 MW of installed capacity.
Through significant RD&D efforts, new fully automatic pellet-fired boilers have been developed andintroduced into the market, reviving the use of biomass for domestic space heating. This successful marketintroduction was based on very attractive products, high consumer interest and grants of 20% to 30%of investment costs. New heating systems entering the market are subject to a licensing procedure byauthorised testing institutions. These institutions publish the test results, which has created a competitivemarket for high-quality boilers resulting in considerable progress in combustion and control technology.
In the early 1990s, the federal governments of Upper Austria, Salzburg, Lower Austria and Styria, in co-operation with the authorised testing institution put forth a competition “Small Scale Wood HeatingSystems”. Austrian developers and producers of small-scale biomass heating systems were challenged todevelop marketable biomass heating systems of less than 15 kW.
A tax introduced on oil products in 1995 and on electricity and gas in 1996 has also spurred the biomassmarket by increasing the competitiveness of biofuels relative to oil. The 1997 Promotion Instrument forElectricity from Renewables included incentives for biomass heating plants.
In 2001, the Housing Creation and Refurbishment Law provided tax incentives for the purchase ofbiomass systems for heating. This incentive scheme was redesigned in the Dwelling Improvement andHousing Promotion Subsidy in 2003. The new incentives were significantly more effective and proved tobe extremely efficient in the province of Salzburg, where more than 50% of all newly constructed houseswere heated with biomass and solar energy in 2003. In most other provinces the level of subsidy is basedon homeowners’ efforts to improve energy efficiency and to use renewable energy for heating and hotwater demand. Styria, in principle, has excluded subsidies for new houses that use fossil fuels for heating.
Wind Power
Wind power plants produced 0.3% of total electricity generation in Austria in 2001, and 0.4% ofgeneration from renewables. Generation capacity was 69 MW in 2001 and electricity generationwas 172 GWh. Growth in wind power accelerated in the late 1990s, with average annual growth of56% from 1998 to 2001. According to Austrian statistics, at the end of 2002, 422 grid-connectedwind turbines with an installed capacity of 139 MW and annual electricity production of 179 GWhwere in operation.
Wind power has been the target of recent policies to stimulate electricity production from renewableenergy sources. A voluntary agreement between the Ministry of Economic Affairs and the Association ofElectric Utilities provided 100% of the delivered price of wind power for a period of three years. Thevoluntary agreement was followed by the establishment of minimum quotas facilitated by feed-in tariffsthrough EIWOG in 1998, replaced in 2002 by the Green Electricity Act. These policies appear to behaving a positive impact, as wind growth has been consistent over the past couple of years.
AUSTRIA
139

140
PART 2: COUNTRY PROFILES
Solar Thermal ProductionSolar thermal production increased from 621 TJ in 1990 to 2 785 TJ in 2001. In 2002, there were2 535 million m2 of installed solar collectors in Austria, of which 2 500 were in operation: 24% for swimmingpool heating; 75% for water and space heating and 1% for drying biomass products. The development oflarge-scale collectors with up to 15 m2 absorber areas has greatly reduced the cost of collectors in Austria.
The successful deployment of solar thermal technologies in Austria is illustrated by its high panel surfaceper capita levels, the highest in the EU. New installations between 1987 and 1997 totalled 100 000 units.A combination of policies and financial incentives has been the basis for this rapid growth.
In 1994, the Upper Austrian Energy Plan established a target to increase the use of renewable energy inthe region. As a result, by 2000 more than 500 000 m2 of thermal solar collectors had been installed forspace and water heating, mainly in residences. The region also had about 0.4 m2 of installed solar
1993
1994
1995
1996
1997
1998
1999
2000
2001
10%
20%
30%
40%
50%
60%
70%
80%
90%
100%
Capacity (MW) Gross Electricity Production (GWh)
0%
1991
1992
0
10
20
30
40
50
60
70
80
19901991
19921993
19941995
19961997
19981999
20002001
Capacity
0
20
40
60
80
100
120
140
160
180
200Production
Figure 9. Wind Power Capacityand Electricity Production
Figure 10. Wind Power Capacity(Year to Year Change)
993
199
1994
1995
1996
1997
1998
1999
2000
2001
2002
200399
119
919
9992
199990Wind Power Policy Timeline
Research and Development
Market Deployment
. Kommunalkredit (grants)
. Voluntary Agreements
. Ordinance (feed-in tariffs)
. Promotion Instrument for Elecricity from Renewables
. EIWOG (feed-in tariffs)
. Renewable Energy Targets
. Green Electricity Act
Energy Policy
. Electricity Act 2000
Denotes a significant change to a policy, such as an extension, repeal or revision.

AUSTRIA
141
collectors per inhabitant, one of the highest densities of solar collectors per capita in Europe. Taxdeductions are offered under the Housing Creation and Refurbishment Act.
The rapid market deployment of solar thermal production is also a result of continuous and intensiveRD&D efforts.
1.Growth in the capacity of grid-connected PV systems over the past decade was dramatic, from 348 kW in 1993 to 8.8 MW in 2002, an average annualrate of 43%. (Source: Gerhard Faninger, IFF-Universität Klagenfurt and Bundesverband Photovoltaik Österreich).
Production
0
3000
500
1000
1500
2000
2500
Figure 11. Solar Thermal Production
Production (TJ)
1990
1991
1992
1993
1994
1995
1996
1997
1998
1999
2000
2001
993
199
199994
995
199
199996
997
199
199998
999
199
200000
001
200
200002
003
20099
119
919
9992
199990Solar Thermal Policy Timeline
Research and Development
Market Deployment
. Kommunalkredit (grants)
. Upper Austrian Energy Plan
. Housing Creation and Refurbishment (tax incentives)
. Dwelling Improvement and Housing Promotion Subsidy
Denotes a significant change to a policy, such as an extension, repeal or revision.
Solar PhotovoltaicSolar PV capacity in 2001 was 7 MW. The first systems were introduced in the early 1990s and marketgrowth was slow. Substantial recent support for PV has spurred rapid growth over the past couple of years.According to Austrian statistics, at the end of 2002, photovoltaic systems with a total capacity of about10.8 MW were in operation, producing an annual output of about 7 634 MWh. Most PV systems (82%)were connected to the grid and 18% were stand-alone systems for different applications.1
Support for solar PV started in 1992 when the Austrian Ministry of Economic Affairs (MEA) launched theSolar Energy Programme for electric vehicles and for decentralised PV systems. The programme subsidisedapproximately 100 small residential grid-connected systems with funding from utilities and government

142
PART 2: COUNTRY PROFILES
that covered about 58% of the investment costs. The total installed capacity was 203.6 kW and the averagecapacity was 2.28 kW. Average system costs were approximately € 17 800.
The Solar Energy Programme also provided capital subsidies for electric vehicles. The combination of both policies resulted in the installation of about 400 kW of PV by the end of 1994 and put in operation200 electric cars by the end of 1995.
The photovoltaic market experienced annual growth of 26% between 1996 and 2000 attributable togeneral renewable energy policies such as the MEA voluntary agreement with the utilities. This agreementprovided 100% of the delivered price of PV power for a period of three years. EIWOG establishedminimum quotas facilitated by feed-in tariffs in 1998, replaced in 2002 by the Green Electricity Act. Themaximum capacity covered by the feed-in tariffs is 15 MW. This capacity limit and the feed-in tariff arebelieved to be responsible for the surge in PV installations in 2002. The number of installations in 2003 isestimated to have been even greater. The latest tariff was introduced on 1 January 2003 and by the middleof the month all of the eligible systems were recognised by the authorities as “eco-energy plants”. Thesystems must be installed by mid-2006.
1993
1994
1995
1996
1997
1998
1999
2000
2001
20%
40%
60%
80%
100%
120%
Capacity (MW) Gross Electricity Production (GWh)
0%
1991
1992
0
1
2
3
4
5
6
7
8
19901991
19921993
19941995
19961997
19981999
20002001
Capacity
0
0.5
1
1.5
2
2.5
3
3.5
4
4.5Production
Figure 12. Solar Photovoltaic Capacityand Electricity Production
Figure 13. Solar Photovoltaic Capacity(Year to Year Change)
993
199
1994
1995
1996
1997
1998
1999
2000
2001
2002
200399
119
919
9992
199990Solar PV Policy Timeline
Research and Development
Market Deployment
. 200 kW Rooftop Programme (grants)
. Solar Energy Programme (grants)
. Kommunalkredit (grants)
. Voluntary Agreements
. EIWOG (feed-in tariffs)
. Renewable Energy Targets
. Housing Creation and Refurbishment (tax incentives)
. Green Electricity Act
Denotes a significant change to a policy, such as an extension, repeal or revision.

AUSTRIA
143
Austria Policy Chronology
Solar Energy Programme
Year 1992-1995
Policy Description The Solar Energy Programme provided capital subsidies for PV systems andelectric vehicles. The programme was financed by utilities, federal andprovincial governments. Of the total subsidies disbursed under this program, itis estimated that ATS 2 million were used for electric vehicles. 200 were inoperation by the end of 1995. The programme subsidised approximately 100small residential grid-connected systems with funding from the utilities andgovernment. The total installed capacity was 203.6 kW and the averagecapacity 2.28 kW. Average system costs were approximately € 17 800.Approximately 58% of investment costs were subsidised by authorities andelectric utilities. Only around 400 kW of PV had been installed by the end of1994.
Policy Type Capital grants
RE Technology Solar photovoltaic
Environmental Protection Law
Year 1993 - Present
Policy Description As the EIWOG scheme of feed-in-tariffs only affected production of electricity,this policy provided investment incentives to the heat producing part of a plant.Incentives for electricity production are granted only if a plant exceeds state ofthe art technology.
Incentives are granted at between 10% and 30% of eligible costs depending onthe type of investment with the objective of stimulating innovative technology.
Policy Type Capital grants
RE Technology All renewables
Upper Austrian Energy Plan
Year 1994-2000
Policy Description In 1994, the Upper Austrian Energy Plan established targets to reduce fossil fuelconsumption, improve energy efficiency and increase the use of renewableenergy in the region. These targets, which were met, included reducingdomestic energy use by 20% and increasing the proportion of energy providedfrom renewable sources to 30% by 2000. The Upper Austrian Energy Agencyhas been one of the main promoters of actions to achieve these targets, and has

144
PART 2: COUNTRY PROFILES
been very successful through a combination of support measures from bothnational and local sources, combined with a high level of informationdissemination activities to raise awareness in the region.
More than 500 000 m2 of thermal solar collectors had been installed in UpperAustria by 2000 as a result of the energy plan. They are used for space andwater heating, mainly in residences. By 2000, the region had about 0.4 m2 ofinstalled solar collectors per inhabitant, one of the highest densities of solarcollectors per capita in Europe. Similar initiatives are being implemented inother Austrian regions, supported through local or regional energy plans.
Policy Type Obligations
RE Technology Solar thermal
Kommunalkredit
Year 1994 - Present
Policy Description Federal grants and incentives for renewable energy producers such as firms,associations and public entities are administered primarily by theKommunalkredit. These federal grants typically constitute 30% of eligible costsand are granted to entrepreneurs investing in small hydro plants, modernbiomass-based heating systems which include small networks for districtheating, biogas, sewage gas, geothermal systems, heat pumps, solar thermalabove 10 m2, photovoltaic and wind installations. These grants can also becombined with financial support from the Länder to cover 66% of costs.
Policy Type Capital grants
RE Technology All renewables
Voluntary Agreement between Ministry of EconomicAffairs and Association of Electricity Utilities
Year 1994-1996
Policy Description This voluntary agreement provided subsidies of 100% of the delivered price forPV and wind power, and 20% of the delivered price for biomass and biogas fora period of three years for renewable electricity systems installed before the endof 1996. Since the programme ended in 1996, the payment of higher buy-backrates at these levels ceased at the end of 1999.
Policy Type Guaranteed prices/feed-in tariff
RE Technology Onshore windSolar photovoltaicBiomassBiofuel
AUSTRIA
145
Eco-Tax
Year 1995 - Present
Policy Description A modest tax on oil products was introduced in 1995 and a similar tax on gasand electricity in 1996. The goal of these taxes was to raise revenue, not toaffect patterns of energy consumption. In 2000, the tax on gas and electricitywas doubled for budgetary reasons, without exemption for renewable energysourced electricity.
The competitiveness of biomass improved due to higher oil prices, so the taxmade an economic difference for the biomass sector. Biodiesel differed slightlyas it was largely exempt from the mineral oil tax for some time and received atotal exemption starting in 2000.
Policy Type Fossil fuel taxes / Excise tax exemption
RE Technology BiofuelBiomass
Ordinance of the Federal Minister for Foreign Affairs
Year 1995 - Present
Policy Description This Ordinance guarantees minimum prices for electricity that is tradedbetween provinces and has been produced from autoproducer CHP stationsand renewable electricity plants. For plants up to 2 MW these prices range fromATS 0.421/kWh to ATS 0.90/kWh (100-125% of the prices charged by theVerbundgesellschaft), depending on the time of delivery. For plants over 2 MW,the rates are 100% of the prices charged by the Verbundgesellschaft, or ATS0.421-0.72/kWh.
Policy Type Guaranteed prices/feed-in tariff
RE Technology All renewables
RD&D Budget
Year 1995-1996
Policy Description Approximately 25% of Austria's federal energy R&D budget in 1996 wasallocated specifically to renewable sources (down from 32% in 1995, but abouttriple the IEA average). This funding was split 52% for biomass and 27% forsolar, with the remainder spent on wind, geothermal and hydro. Biomassfunding in 1996 was ATS 50 million and included projects on the direct use ofbiomass (e.g., by improving wood-burning stoves), as well as the production ofliquid biofuels. Solar research was directed predominantly towards heating andcooling, and photovoltaics.
Policy Type RD&D
RE Technology All renewables

146
PART 2: COUNTRY PROFILES
Promotion Instrument for Electricity from Renewables
Year 1997 - Present
Policy Description The Promotion Instrument for Electricity from Renewables (PIER) provides botha capital subsidy and a guaranteed tariff for renewable electricity fed into thegrid and RD&D measures as incentives for renewable electricity generation.Projects are selected through a public competitive tender procedure wheresubsidies are awarded based on lowest capital cost for each technology type.The capital subsidies are capped at 7% rate of return for fifteen years. Inaddition, electricity from these systems benefits from a guaranteed market at aguaranteed buy-back rate for fifteen years.
Capital investment subsidies for biomass, for example, were disbursed throughthe District Heating Promotion Act (ended in 1996). Biomass subsidies totalledATS 192.4 million (in 1997, 1 US$ = 12.2 ATS) in 1996 and ATS 142.8 millionin 1995. These funds were disbursed via two programmes including incentivesfor biofuel production and the District Heating Promotion Act.
Capital subsidies of 8% are available for the construction, restoration orenlargement of small (0.5-10 MW) hydro systems, and subsidies of up to 25%are available for micro hydro (< 0.5 MW) systems that are both remote andenvironmentally friendly. In addition to federal promotional measures,provincial authorities may also provide subsidies or favourable loans forbiomass heating plants.
Policy Type Guaranteed prices/feed-in tariff / Capital grants
RE Technology All renewables
Electricity Act 1998
Year 1998-2002
Policy Description The Electricity Act 1988 (EIWOG) put into place feed-in tariffs to stimulateelectricity production from green power producers. The EIWOG obliged systemoperators to purchase renewable electricity offered by independent powerproducers and to pay minimum feed-in tariffs. These tariffs were defined byeach of the nine provinces and thus differed. The feed-in tariffs differedaccording to technology, type and duration of contract, time of feeding in theelectricity by season and time of day. Provinces set tariff levels, quota levels andconditions.
Policy Type Guaranteed prices/feed-in tariff
RE Technology BiomassGeothermalOnshore windSolar photovoltaic

AUSTRIA
147
Renewable Energy Targets
Year 2000 - Present
Policy Description One of the measures introduced by the Energy Liberalisation Act in July 2000(Electricity Act 2000) is the obligation to purchase green power and to reachminimum “eco-targets.”
Distribution system operators are required to purchase electricity fromrecognised eco-plants up to a certain share of their electricity sales to finalconsumers (shares are to be at least 1% in 2001; 2% in 2003; 3% in 2005 and4% in 2007). Purchase prices are regulated. The grid operators can resell theseamounts of electricity to final consumers or to electricity traders. If theminimum percentage amount is exceeded, the grid operator can sell the excessamount to other operators of distribution grids.
Qualifying eco-plants include wind, PV, geothermal, biomass, biogas, digesterand sewage gas, as well as co-firing and multi-fuelled plants using a highproportion of biofuels, and combustion of wastes containing a high percentageof bio materials. The final decision on qualification is made by the provincialgovernments.
The eco-electricity market is monitored by Elektrizitats-Control GmbH. Anequalisation levy is imposed on the grid operators unable to prove the requiredshare of eco-electricity.
Policy Type Obligations
RE Technology BiofuelBiomassGeothermalOffshore windOnshore windSolar photovoltaicWaste
National Climate Strategy
Year 2000 - Present
Policy Description The Austrian government is elaborating the National Climate Strategy based on a 1999 study, which is in the last stage of consultation with relevantstakeholders. The Climate Strategy consists of seven packages of measures(space heating/private consumption, electricity and heat production, transport,industry, waste management, agriculture and forestry, and other greenhousegases).
Policy Type Regulatory and administrative rules
RE Technology All renewables

148
PART 2: COUNTRY PROFILES
Labelling of Electricity Bills
Year 2000 - Present
Policy Description According to the Energy Liberalisation/Electricity Act 2000, electricity suppliersin Austria are required to show the primary energy mix used to generate theelectricity they supply on their customers' electricity bills. Provincialgovernments are responsible for ensuring that this information is correct. Incase of incorrect specifications, administrative fines are implemented; in caseof repeated infractions the party will lose its right to supply. However, electricitysuppliers have the option to show the average European energy mix used on thebills instead of the actual domestic energy mix.
Policy Type Public awareness
RE Technology All renewables
Federal Environment Fund
Year 2000 - Present
Policy Description The Federal Environment Fund is enabled to fund environment projects with atotal budget frame of more than € 40 million annually. Over the past years,increasing priority has been given to projects related to climate change. In2000, 70% of the funding was dedicated to projects with direct implications forGHG emissions, and that share will be extended. For the budget periods 2001and 2002, the total budgetary frame has been increased to reach € 40 millionand € 47 million, respectively, after an average of € 36 million during pastyears. All additional funding (€ 15 million for both years) will be channelled toclimate change purposes. Over the past years, funding focused on biomass andbiogas district heating, entrepreneurial biomass central heating systems, solarpanels and energy efficiency measures, small hydro and wind power stationsand thermal renovation of entrepreneurial buildings. Since the AustrianElectricity Law stipulates that feed-in tariffs have to be set at figures that makethe production of electricity from renewable sources competitive, the FederalMinistry of Environment is planning to phase out subsidies for thosetechnologies.
Policy Type Tradable certificates
RE Technology Hydro
Eco-Plants Feed-In Tariffs
Year 2001 - Present
Policy Description According to the Electricity Act 2000, the provincial governments set minimumprices (feed-in tariffs) for energy purchased by grid operators from plantsrecognised as eco-plants. These prices are based on the average cost of

AUSTRIA
149
generating electricity from these plants, including the value of electricity used,as well as past or on-going subsidies.
If the expenses from purchasing the electricity at fixed tariffs exceed therevenue from sales, the grid operator will be reimbursed for the balancebetween the minimum of purchase price and the proceeds achieved. Therequired sums are raised by a surcharge on the network tariff (paid by theconsumer) which is set by the provincial government. This surcharge is setannually on the basis of the additional expenses incurred in the previous year.
Only the Province of Vorarlberg introduced new feed-in tariffs. Valid from1 October 2001 the tariffs in ATS per kWh were:
• Solid biomass: from 1.3 to 1.8 for existing plants; 1.3 - 2.2 for new plants.• Liquid biomass: 1.7 for existing plants, 2 for new plants.• Biogas: 1.2 -1.55 for existing plants, 1.71 -2.2 for new plants.• Wind: 1.5 for new plants.• PV: 7 for existing plants, 5 -10 for new plants, depending on capacity.
The equalisation levy for eco-electricity is ATS 1.59/kWh. The surcharge on thenetwork tariff is Gr 1.11/kWh (ATS 0.008/kWh)
Policy Type Guaranteed prices/feed-in tariff
RE Technology BiomassOnshore windOffshore windSolar photovoltaic
Trading of Small Hydropower Certificates
Year 2001 - Present
Policy Description Green certificate trading was introduced by the Electricity Act 2000. Electricitysuppliers based in Austria have to include 8% of electricity generated bydomestic small-scale hydropower plants in the energy sold to final customers.Final customers purchasing electricity directly from foreign suppliers arerequired to prove that 8% of the electricity they consume is generated bydomestic small-scale hydropower plants.
“Small-scale hydropower certificates” are used as proof. Hydropower plantswith a maximum capacity of up to 10 MW are designated by the provincialgovernment, entitling their operators to issue such certificates. The designationsare notified to Electrizitats-Control GmbH. Small-scale hydropower certificatesare in units of 100 kWh. They have to be authenticated by the grid operator ofthe respective plant. The system is electronic and is monitored by Elektrizitats-Control GmbH. Certificates can be banked for up to two years. In the case ofnon-compliance, an equalisation levy is imposed upon electricity suppliers andfinal customers by the provinces.

150
PART 2: COUNTRY PROFILES
Policy Type Tradable certificates
RE Technology Hydro
Climate Strategy 2010
Year 2001 - Present
Policy Description The burden-sharing agreement within the EU to meet Kyoto commitmentsrequires Austria to reduce its greenhouse gas emissions by 13% below 1990figures by the 2008-2012 period. Against this background the Federal Ministryof Agriculture, Forestry, Environment and Water Management in co-operationwith the relevant ministries, unions and the Länder developed a strategy tomeet the target. “Climate Strategy 2010” contains packages of measures forseven areas (room heating and other small consumers; electricity and heatproduction; waste management; mobility; industry, agriculture and forestry andother gases) and aims to achieve an annual reduction of more than 17 milliontonnes of CO2-equivalents.
Policy Type Regulatory and administrative rules
RE Technology All renewables
Third-Party Financing for Public Buildings
Year 2001 - Present
Policy Description The federal government launched this Programme on Third-Party Financing(contracting) in energy-saving investments for federal public buildings in 2001.It is assumed that around 20% of federal buildings (representing 50% of heatedspace in federal buildings) are eligible for typical energy-saving contracting, inwhich measures and investments with relatively short payback periods can beundertaken by a third party (a “contractor”).
Public high schools have been most affected by this measure. In a pilotprogramme in Vienna, energy standards for 46 schools have been substantiallyimproved. There are plans for the general renovation of 20% of federalbuildings within the next ten years, although through a differentiated model of“guaranteed energy savings” rather than a typical third-party financing. Theinitiative may have the potential to accelerate growth in the contracting marketto also effect municipal and private service-sector buildings. This initiative isexpected to result in an annual total reduction in CO2 emissions of 70 000-100 000 tons by 2012.
Policy Type Third-party finance
RE Technology All renewables

AUSTRIA
151
Pact on Tax Revenue Sharing
Year 2001 - Present
Policy Description This new pact on tax revenue sharing between the Federation, the Länder andthe municipalities, allows more flexibility for housing support schemes. TheFederal Act on Revenue Sharing now explicitly suggests spending part of thefunds for greenhouse gas (GHG) mitigation measures. The Länder receive atotal of € 1.78 billion annually from the Federation under the title of “housingsupport.” Although that money can also be spent for purposes other thanhousing (on improving infrastructure, for example). The GHG mitigation effectfrom housing support schemes therefore largely depends on specific politicalintentions followed by the individual Länder. The conferences of theenvironment and finance ministers of the Länder governments have declaredtheir political willingness to spend a relevant part of the money for climatechange purposes in order to achieve the targets indicated in the AustrianClimate Strategy 2010.
Policy Type Obligations
RE Technology All renewables
Housing Creation and Refurbishment
Year 2001 - Present
Policy Description The personal income tax law specifies a variety of special expenses, for examplethe purchase of solar and biomass technologies for residences, that can bededucted from income. This is capped at € 2 920 per year for ordinary taxpayers. An additional deduction of € 2 920 for single income households, and€ 1 460 is granted if there are at least three children. Only 25% of the amountmay be deducted from the income.
Policy Type Tax exemptions
RE Technology BiomassSolar photovoltaicSolar thermal
Green Electricity Act
Year 2002 - Present
Policy Description In 2002, the National Council and Federal Council passed the new GreenElectricity Act. The main content of the EU Directive from October 2001 hasbeen implemented and the proportion of energy generated from renewableenergy sources increased. The Green Electricity Act governs the aid for greenenergy and combined heat and power generation throughout the country.Through this act, fees for eco-power, which vary from state to state, will bereplaced with a uniform fee for power generated by combined heat and power

152
PART 2: COUNTRY PROFILES
plants, renewable sources and small hydro power plants. The total cost of aid
for green energy, following a nation-wide attainment of the goal, is much lower
than it would have been for attaining the objective individually in each federal
state. The supply tariffs for the green plant operators are the same throughout
Austria. The government support renewable generation plants with a maximum
€ 275 million per year, down from € 400 million per year.
The objectives set out in the Green Electricity Act are to generate 9% of
electricity from small-scale hydroelectric plants and 4% from eco plants. This is
to be achieved by providing aid in the form of supply tariffs until 2008 so that
the overall objective of 78.1% of electricity from renewable sources can be
reached (the rest being generated from large-scale hydro).
Other changes include:
• The certificate system for small-scale hydroelectric power stations expired
at the end of 2002.
• As of 1 January 2003, there was no longer a quota obligation for the
network operators and no compensation payments.
• All operators of green plants have the right to a listing of the certification of
origin by the network operators.
• The electricity identification system, which specifies the source of energy
used for electricity generation on consumer bills, will be standardised after
a transitional period up to 1 July 2004 and then all electricity suppliers must
identify a standard composition on consumer bills (“standard dealer mix”).
The Act guarantees payment of feed-in tariffs for thirteen years at the following
rates (per kWh):
• Small hydro power, depending upon the amount of electricity fed into
the grid: from € 0.0315 to € 0.0568 for existing plants, from € 0.0331 to
€ 0.0596 for refurbished plants, from € 0.0378 to € 0.0625 for new plants.
• PV: € 0.47 for plants > 20 kWpeak, € 0.60 for plants < 20 kWpeak.
• Wind: € 0.078 for new plants.
• Geothermal: € 0.07.
• Wood chips: € 0.102 to € 0.16.
• Waste with high bio-share: € 0.027 to € 0.128.
• Co-firing in fossil fuel plants: € 0.03 to € 0.065.
- • Biofuels: € 0.1 for plants > 200 kW, € 0.13 for plants < 200 kW.
• Biogas: € 0.0725 to € 0.165.
• Landfill gas: € 0.03 for plants > 1 MW, € 0.06 for plants < 1 MW.
Policy Type Obligations / Tradable certificates / Guaranteed prices/feed-in tariff
RE Technology All renewables

AUSTRIA
153
Dwelling Improvement and Housing PromotionSubsidy
Year 2003 - Present
Policy Description The redesign of existing subsidy schemes for construction of housing(responsibility of provinces) has been one of the most successful policymeasures to promote renewable energy use by households. In the province ofSalzburg in 2003 more than 50% of newly constructed dwellings were heatedwith biomass and solar. Some have excluded new houses from subsidies thatdo not use renewable energy for heating.
Policy Type Consumer grants/rebates
RE Technology Biomass heatingSolar thermal


Belgium
155

Gas
Coal
Oil
Nuclear
Renewables
Mtoe
0
10
20
30
40
50
60
70
1971
1973
1975
1977
1979
1981
1983
1985
1987
1989
1991
1993
1995
1997
1999
2001
Gas 22.6%
Coal 13.2%Renewables 1.0%
Nuclear 20.7%
Oil 42.4%
Figure 1. Total Primary Energy Supply by Source Figure 2. Shares of TPES 2001
Shares in Figure 2 may differ from Table 1.See Annex 2 for more detail.
156
Total Primary Energy Supply
Table 1. Total Primary Energy Supply by Source (Mtoe)*
In 2001, TPES was 59 Mtoe, a 21% increase over its 1990 level. TPES increased on average by 1.6% peryear from 1990 to 2001. Energy supply in Belgium in 2001 was mainly oil (41%), followed by natural gas(22%) and nuclear (20%). Coal (13%) and renewable energy sources (1%) also contributed (Table 1). Theshare of oil in TPES decreased significantly from 61% in 1970 to 38% in 1990. An increase inconsumption in the transport sector in the 1990s, however, reversed this trend, and the share of oil in TPESwas 41% in 2001. With few indigenous energy resources, more than 88% of Belgium’s total energysupply is imported. Nuclear has progressively replaced domestic coal supply, and the use of indigenouscoal was phased out by 1993. Prompted by the first oil price shock, nuclear power was introduced in1975, but, it is scheduled to be phased out from 2014, when the first plants will be 40 years old.
Renewables supply was relatively constant at 0.6 Mtoe during the 1990s. However, its share in TPESdecreased from 1.3 in 1990 to 1.0% in 2001. The composition of renewables has not varied much
PART 2: COUNTRY PROFILES
Source 1970 1980 1990 1995 2000 2001 Imports
Coal 12.3 10.5 10.2 9.1 8.4 7.7 100.0%Oil 24.4 23.6 18.7 21.0 23.8 24.3 100.0%Gas 3.4 8.9 8.2 10.6 13.4 13.2 99.6%Nuclear 0.0 3.3 11.1 10.8 12.6 12.1 -Renewables 0.0 0.1 0.6 0.7 0.6 0.6 -
Biomass 0.0 0.1 0.6 0.7 0.5 0.6Hydro 0.0 0.0 0.0 0.0 0.0 0.0Geothermal 0.0 0.0 0.0 0.0 0.0 0.0Wind/Solar 0.0 0.0 0.0 0.0 0.0 0.0
Total 40.2 46.1 48.7 52.6 59.3 59.0 88.2%% Renewables 0.1% 0.2% 1.3% 1.3% 1.0% 1.0%
* See Annex 2 for explanation of components in total and definition of biomass.

BELGIUM
157
between 1990 and 2001. In 1990, biomass was by far the most important renewable source, and, in 2001,it accounted for 92.8% of total renewable energy supply, followed by hydropower with 6.3%. Theremaining 0.9% was primarily wind and solar energy.
In 2001, electricity consumption was 78.6 TWh, up 13.5% from its 1990 level. Nuclear power dominatedtotal gross electricity generation, accounting for 58%, followed by gas (20%), coal (16%) and oil (2%),combustible renewables and waste (2%) and hydropower to 0.6%. The rapid increase of natural gassupply between 1970 and 2001 caused a major change in the generation fuel mix.
In addition to the environmental and local development benefits of renewables, they also have thepotential to improve the trade balance, as Belgium imports the majority of its energy supply. Butrenewable energy is expected to encounter obstacles in this small densely populated country. Oppositionhas already manifested itself through the proposed CO2 levy, which was proposed ten years ago and hasnot yet become a reality. The Federal government expects the regulatory framework for renewables toevolve in accordance with the proposed framework at the European level.

158
Government support spurred rapid growth in the new renewables market, with annual averagegrowth of 16% in wind power capacity and 4% in solar thermal production between 1990 and 2001.Figure 3 indicates that biomass and waste accounted for 93% of total renewable energy supplyin 2001, mostly wood and wood waste (~48%), and the biodegradable portion of MSW (~16%).Hydropower (excluding pumped storage) represented almost 4% of total renewable energy supplyin 2001. According to Belgian energy experts, renewable waste energy sources contributed a totalof 0.6 Mtoe or 1% of TPES, when non-renewable waste incineration is excluded. Small hydrorepresented 4.7% of total renewable energy generation in 2002, wind 0.7% and solar thermal0.2%.
Electricity generation from renewables (excluding pumped storage and non-renewable waste) totalled1.135 TWh in 2002, equalling 1.4% of total electricity generation, according to Belgian authorities.
PART 2: COUNTRY PROFILES
Policy Timeline
Research and Development
. VLIET Programme
Market Deployment
. Investment Tax Reduction (Industry)
. Green Frank System
. Transmission Grid Priority
. Distribution Grid Connection (Wallonia)
. Investment Tax Reduction- Households
Denotes a significant change to a policy, such as an extension, repeal or revision.
Hydro
CombustibleRenewables
and Waste
Mtoe
0
0.2
1.2
0.4
0.6
0.8
1
1971 73
1975 77
1979 81
1983 85
1987 89
199 93
1995 97
1999 01
Figure 3. Total Renewable Energy Supply and Policy Timeline
Renewable Energy Supply

BELGIUM
159
Small hydro represented 32% of electricity generation from renewables and wind accounted for 5.0%.Belgium’s national target as an EU member country is for 6% of electricity output to be based onrenewable sources by 2010.
Research and Development Trends
Government energy RD&D budgets in Belgium totalled US$ 2.6 billion (in 2002 prices and exchangerates) between 1974 and 1999. In this period, US$ 135.8 million was allocated to renewable energyRD&D. While overall energy RD&D budgets decreased as a result of general budget cuts, the bulk of thedecrease between 1990 and 1993 is attributed to data deficiencies and to a lack of reconciliation betweenregional and federal RD&D budgets, which occurred during the regionalisation process.
The regionalisation process of 1988 transferred responsibility of Belgian renewable energy policy to thethree regional administrations (Flanders, Wallonia, and Brussels). Regional investments in RD&D arepartly made through research centres. Together with market deployment policies, regional renewableenergy RD&D constitutes the main policy to increase renewable electricity generation.
No RD&D expenditure data are available for Belgium in 1990. Additionally, government energyRD&D expenditures for nuclear research are unavailable between 1990 and 1994. According toBelgian authorities, RD&D budgets actually increased by an additional US$ 8.19 million between 1991 and1994, with a subsequent increase of US$ 2.02 million between 1991 and 1994 for renewable energy RD&D.
Million US$ (2002 prices and exchange rates)
0
250
50
100
150
200
Figure 4. Belgium – Government Energy RD&D Budgets*
Total OtherTech./Research
TotalConservation
Total Power& Storage Tech.
Total NuclearFission/Fusion
Total RenewableEnergy
Total FossilFuels
1975
1977
1979
1981
1983
1985
1987
1989
1991
1993
1995
1997
1999
Government RD&D expenditures for renewables peaked in the early and mid-1980s and then declined inthe late 1980s, coinciding with the expansion of nuclear power. Government renewable RD&Dexpenditures averaged some US$ 2 million throughout the 1990s.
Among the renewable technologies, solar heating and cooling and PV received the highest level offunding. Geothermal was a priority in the early 1980s, but funding decreased significantly in 1985. Solarthermal and PV followed a similar trend although renewed interest, particularly in the Flemish region,brought about new funding, albeit at lower levels. Increased funding was also made available for biomassstarting in 1994. Budget outlays for solar heating and cooling were steady over the period.
* Data are not available for 1990.

160
Government energy RD&D expenditures increased after the oil price shocks of the 1970s and focusedprimarily on nuclear energy and natural gas as substitutes for oil. Federal expenditures specifically targetednuclear fission (fuels, materials, reactors, waste, safety) and fusion while university laboratories andresearch centres concentrated RD&D efforts on wind, biomass and solar technologies. Belgiumparticipates in international collaborative RD&D through the Bioenergy and Solar Heating and CoolingIEA Implementing Agreements.
Regional Government Research and Development Trends
The renewables that receive policy attention and the measures implemented vary among regionsaccording to natural resource endowments. Throughout the 1990s, the Flemish region focused themajority of their renewable RD&D activities on solar PV. Flemish RD&D funding for renewable energy,characterized by the VLIET and VLIET bis programmes, provided grants for research projects totalling50-100% of total costs, although the primary aim was energy efficiency. Development projects wereentitled to a refundable loan of 50% of investment costs. Loans were partially converted to grants, withthe level depending on the success of the project.
The Walloon region funds research on solar thermal technology, through the Soltherm Programme whichcommenced in 2000. Biomass also received sustained attention from the RD&D institutions in the Flemishand, especially, in the Walloon region.
Market Deployment Trends
Major policy support for renewables followed the Rio Summit in 1992. The first market deploymentstrategy was preferential deduction rates for industry. In 2000, market deployment policies were expandedto include the use of economic incentives, regulations, green certificates schemes, and other indirectmeasures such as information dissemination and training. Federal market deployment activities arecurrently limited to electricity buy-back, the general structure of electricity tariffs, licences for offshore
PART 2: COUNTRY PROFILES
Million US$ (2002 prices and exchange rates)
0
25
5
10
15
20
Figure 5. Belgium – Government Renewable Energy RD&D Budgets*
SolarThermal-Electric
SolarPhoto-Electric
Solar Heating& Cooling
Small Hydro(<10 MW)
Geothermal
Biomass
Wind
1975
1977
1979
1981
1983
1985
1987
1989
1991
1993
1995
1997
1999
* Data are not available for 1990.

BELGIUM
161
wind, fiscal deduction rates and minimal guarantees for the regional certificates scheme. All otheractivities fall under the jurisdiction of the regions.
The preferential deduction rates of 13.5% for industry targeted the use of equipment related to energyefficiency or environmental protection, including the use of renewables. These deduction rates, however,were used only on a very limited scale. The inadequacy of the programmed deduction rates can beexplained by both the programmes broad aims and their inability to render renewables attractive relativeto other energy sources, which were available at lower costs. Additionally, no effort was made tocommunicate the fiscal advantages of the preferential deduction rates to industry, even if they were lowand provided non-specific renewable support. The Federal Law of 10/08/2001 gave similar support tohouseholds but has been used mainly to achieve energy efficiency goals.
In 1995, the Belgian government introduced premium buy-back prices for green electricity to the grid onthe recommendation of the Control Committee of Gas and Electricity (CCEG). The 1995 recommendationlacked legal/regulatory support with respect to the conditions applying to electricity producers connectedto the grid in cases of (emergency) purchases or sales to and from the grid, so it did not stimulate therenewable energy market. Modified in 1998, the Green Frank System doubled the buy-back prices from€ 25 per MWh to € 50 per MWh for wind and small hydro electricity. It has been surmised that thisdoubling might have been the trigger in the increase in both the wind and small hydro markets, whichhave still remained far below the market for biomass generated power. Liberalisation of the market,however, led to the dissolution of the CCEG in 2003 and marked the end of the Green Frank, althoughbuy-back prices expire only after a ten-year period. This programme was subsequently replaced by greencertificate schemes.
Interest in the renewable energy sector has been revitalised in recent years with the development of theregulatory framework at the European level. A more comprehensive approach has been taken to increasethe share of renewable energy in the electricity market, which includes priority grid access, mandatorybuy-back of renewable electricity, and direct eligibility of renewable electricity to customers and supplierson the market.
A 1999 federal law on electricity regulation granted renewable energy generated electricity priority toconnect to the transmission grid. A regulatory framework was established to secure the operations ofplants using renewables with respect to the electricity grid in an open market. Similar regulations wereestablished for the distribution grids at the regional level. More specifically, the suppression of certain(albeit already low) fees at the federal level has helped to minimise transport and distribution fees. Since1999, the federal government has ensured that all generators of electricity from renewables areprogressively “eligible”, i.e., free to choose their electricity supplier if they need more electricity thanthey can generate.
The federal authorities also issued a decree in July 2002 (entered into force in July 2003), to facilitatethe application of the regional green certificate systems. This decree obliges the national transportgrid manager to buy green certificates at a minimum price (equivalent to € 0.02/kWh for biomass, €0.05/kWh for wind energy and hydro and up to €0.15/kWh for solar energy) at the request of renewablesproducers in Belgium. At the federal level, the decree also put in place the delivery of green certificatesfor electricity from offshore wind.
The 2002 policy instruments aim to make up for deficiencies in past measures by providing electricityproducers with more financial security. As a net energy importer, improving and diversifying its energysupply mix remains a high priority for Belgium. The government perceives three main barriers to thepenetration of renewables:

162
● Limited renewable energy endowments and land-use constraints.
● The existence of large centralised energy production systems or networks with good grid connections,which enable consumers to benefit from economies of scale.
● The low relative price of conventional energy.
Although intermittency has posed barriers to the development of renewables in other countries, it is notexpected to do so in Belgium as electricity generated from intermittent sources of renewable energy isminor compared to overall electricity supply. This issue has thus been addressed at neither the federal northe regional level.
Federal/Regional
While the federal government manages and determines the regulations related to the transmission grid,the general structure of tariffs, the nature and amount of the fiscal instruments, and the promotion of andresponsibility for the use of renewables belongs to the regional authorities. Promotion of the use ofrenewables can differ by market deployment strategy and even more so by technology according to theregion.
The Flemish region primarily promotes the use of solar energy and electricity through capital grants, gridpriority for renewable sources, public awareness and education campaigns. The 1993 Decree(15.12.1993) grants companies investing in renewables incentives ranging from 10% to 20% dependingon the size of the company. Solar PV has been singled out by this decree, where Flemish authoritiesprovide an additional 65% of the installation cost of PV panels and electricity producers Electrabel andSPE provide 25%.
Complementary to the federal green certification system, the Flanders region implemented a greencertificate system in its 2001 Decree in order to achieve, by 2010, 6% total electricity supply fromrenewables. A guarantee of origin system for electricity generated from renewables (EU Directive2001/77/EC) has been put in place to further develop the green electricity market. Fines, on the order of€ 100 per MWh are imposed for failure to comply with quotas.
In 2004, the Flemish region approved its Electricity Distribution Law, which stipulates the obligation ofgrid managers, in accordance with the 2001 Decree, to promote renewables generated electricity throughthe offer of free low voltage distribution. Grid access for suppliers of electricity from renewables is alsoset at a certain level. In conjunction with the suppression of fees at the federal level, the distribution lawis expected to help minimise transport and distribution fees.
The Walloon region primarily promotes the use of solar water-heating and biomass, through capitalconsumer grants and public awareness and education campaigns. The Walloon Region fosters the useof wood and wood waste to generate electricity, with the aim of producing 5 500 GWh from biomassby 2010. Other targets are 370 GWh of generation from wind power, 225 GWh from biomethanisationof renewable waste and 440 GWh from hydro. These targets are based on the general green certificatescheme, priority access to the grid and eligibility acknowledgement given to green electricity producers.Concerning heat, the Walloon region plans to increase the share of renewables in the supply of lowtemperature heat from 6% (2000) to 9% by 2010.
The Walloon region’s Soltherm Programme was set up to develop a sustainable solar water heatingindustry in the region over ten years, with the goal of installing 200 000 m2 of solar panels by 2010.
PART 2: COUNTRY PROFILES

BELGIUM
163
Grants are provided to encourage the installation of solar panels and can be supplemented by localinstitutions and gas and electricity distribution companies. In addition to the incentive, otherpromotional measures include efforts to increase the quality of the systems, training activities andawareness campaigns.
The Walloon Region has been the most active in initiating information dissemination activities, offeringinterested entrepreneurs the support of specialised consultants, who have been appointed as facilitatorsto elaborate integrated renewable energy dossiers. The Region also regularly organises workshops dealingwith energy policy and is supporting an NGO aimed at the valorisation of biomass (VALBIOM). There isalso an effort to provide certain NGO’s with information to disseminate on sustainable energy, particularlyrenewables, and related local, regional and federal level incentives.
Wallonia has also implemented a green certificate system with quotas put in place for the gridmanagers. The target is to have 12% of total electricity generation from renewables, including efficientCHP plants, by 2010. A guarantee of origin system for electricity generated from renewables(EU Directive 2001/77/EC) is intended to further develop the green electricity market. Similar tothe Flemish region, failure to comply with quotas will result in fines, on the order of € 100 per MWh.The Walloon government will pay a price of € 65 for green certificates arising from new installations.This complements the federal decree by imposing on transmission grid managers the obligation to buygreen certificates at minimum prices from any producer in Belgium. Biomass receives minimal aidat the federal level, compared to wind and PV. Appropriate waste management and progress inthe deployment of CHP units burning biomass is expected to stimulate the market for heat generatedfrom renewables.
The Brussels-Capital region is fairly small compared to Flanders and Wallonia. Brussels-Capital hasintroduced grants of 35% towards the purchase and installation of solar water-heating systems (subjectto a maximum limit of € 992 per household) to encourage the use of renewables in residentialbuildings. Brussels is also planning a law that would establish green electricity consumption quotas:2% in 2004, 2.25% in 2005 and 2.5% in 2006. To meet these quotas, suppliers will be obliged to buythe necessary amount of green certificates from green electricity producers. These quotas includeefficient CHP plants.
As the responsibility for achieving the targeted renewables share lies with the grid manager mainly at thedistribution (regional) and transmission (federal) levels, some time will be needed to instil confidence inpotential investors. This will depend largely on the behaviour of the electricity market, futureachievements in the security of supply and public service obligations, which include renewables andenergy efficiency targets. Appropriate adjustments over time with respect to targets imposed on the gridmanagers and a guarantee to the solvability of the green certificates market will be required. The 2002federal decree on green certificates as well as regional certificate programmes have brought somereassurance.
Past fiscal measures and incentives (including those coming from the local authorities) were favourableenough to induce some growth of renewables technologies. They were not, however, advantageousenough financially to induce continuous and steady growth of the renewable energy market nor didthey specifically target the right players. It is too early to assess how the latest policies, with respect toconnection to the grid, transport and distribution of green electricity and implementation of greencertificates will accelerate the penetration of renewables within the competitive conditions of thecurrent liberalised market. Although expected to increase the use of the renewable energy sources inBelgium, a weak point of the system is the lack of involvement on the part of consumers, although

164
PART 2: COUNTRY PROFILES
electricity bills in the country now display the technology used in the purchased electricity mix.Presenting consumers with the knowledge of origin of electricity can influence future technologychoices. Public service obligations such as prioritising the connection to the distribution andtransmission grids for renewables and market deployment activities like the green certificates schemesare important as it is understood that renewables are to contribute to the diversification of the energymix of Belgium.

BELGIUM
165
993
199
1994
1995
1996
1997
1998
1999
2000
2001
2002
200399
119
919
9992
199990
1993
1994
1995
1996
1997
1998
1999
2000
2001
1%
2%
3%
4%
5%
6%
7%
8%
9%
Capacity (MW) Gross Electricity Production (GWh)
0%
Hydropower Policy Timeline
Market Deployment
. Green Frank System
. Distribution Grid Connection – Wallonia
. Green Certificate – Federal
. Green Certificate – Wallonia
. Green Certificate – Flanders
Denotes a significant change to a policy, such as an extension, repeal or revision.
1991
1992
85
90
95
100
105
110
115
19901991
19921993
19941995
19961997
19981999
20002001
Capacity
0
50
100
150
200
250
300
350
400
450
500Production
Figure 6. Hydropower Capacityand Electricity Production
Figure 7. Hydropower Capacity(Year to Year Change)
Hydropower
Hydropower is the second most important form of renewable energy in Belgium. Excluding pumpedstorage and all forms of waste in the energy supply, the share of hydropower accounted for 48% ofrenewables in 2001. Hydropower installed capacity increased by 1.5% per year between 1990 and 2001.Capacity increased by only 3 MW between 1990 and 1998, but by 14 MW between 1998 and 2001.Belgium’s hydropower capacity is made up primarily of small hydropower plants and the potential forfurther expansion is limited. More than 99% of hydropower production is in the Walloon region, with theremainder in the Flemish region.
The Green Frank System was instituted in 1995 and established buy-back rates (€ 25/MWh) for electricitygenerated from all renewable energy sources. This policy measure was reinforced in 1998, subsequentlydoubling the buy-back rates for hydro facilities with an installed capacity of less than 10 MW to € 50/MWh.These higher buy-back rates drove the increase in new small hydro (micro) units after 1998.
Renewable Energy Markets

166
PART 2: COUNTRY PROFILES
The Green Frank System has been replaced by the regional Green Certificates system, which containmandatory targets for grid managers. The federal decree on certification created a guarantee that is atleast as favourable as the previous Green Frank System with regards to hydropower. Construction of newsmall hydropower plants are expected in the Flemish region, although potential is limited due to theflatness of the region.
Biomass Production
1993
1994
1995
1996
1997
1998
1999
2000
2001
–40%
–20%
0%
20%
40%
60%
Production (TJ)
–60%
1991
1992
0
2000
4000
6000
8000
10000
12000
14000
16000
19911990
Production
19921993
19941995
19961997
19981999
20002001
Figure 8. Solid Biomass Production Figure 9. Solid Biomass Production(Year to Year Change)
1993
1994
1995
1996
1997
1998
1999
2000
2001
2002
2003
1991
1992
1990Biomass Policy Timeline
Market Deployment
. Green Frank System
. Distribution Grid Connection – Wallonia
. Green Certificate – Federal
. Green Certificate – Wallonia
. Green Certificate – Flanders
Denotes a significant change to a policy, such as an extension, repeal or revision.
In 2001, solid biomass accounted for some 80% of total renewable energy supply (excluding waste).Biomass production decreased slightly from 1990 to 2001, with very little annual variation. Imports havecompensated for the decrease in production. Total wood and wood waste amounted to approximately15 500 TJ in 2001, which, according to Belgian authorities, has been aggregated from various disparatedata sources. Biomass statistics, however, are expected to be revised.
Although the biomass market has exhibited little dynamism between 1990 and 2001, many policymeasures have been recently implemented. Thus, the biomass market may exhibit enough growth in thenear future to be considered a mature market:

BELGIUM
167
● Green certificates systems are currently operating in the Wallonia and Flanders regions. The regulatorsof the electricity markets in these regions are monitoring the market for green certificates and areinteracting with policy-makers in order to adapt the mandatory targets for the grid managers atmanageable levels.
● CHP certificates in Flanders aim to support high-efficiency CHP burning wood waste.
● The Walloon government has instituted a decree providing aid targeted at stimulating production ofbiomass in addition to its existing green certificates scheme.
● Active platforms and networks have been created in both Flanders and Wallonia on the topic ofbiomass addressing the issue of security of supply.
Biogas is one of few bioenergy technologies that have experienced some market growth in the 1990s.Growth accelerated after 1997, coinciding with the implementation of the Green Frank System.Furthermore, the federal government has taken the lead from the European Directive and adopted thedeployment of the biofuels market as a high priority. The Clean Technologies Initiative, recently adoptedby the federal government, is expected to set the framework to support industrial projects dealing withalternative fuels without imposing mandatory targets.
Wind Power
1993
1994
1995
1996
1997
1998
1999
2000
2001
10%
20%
30%
40%
50%
60%
70%
80%
90%
Capacity (MW) Gross Electricity Production (GWh)
0%
1991
1992
0
5
10
15
20
25
30
19901991
19921993
19941995
19961997
19981999
20002001
Capacity
0
5
10
15
20
25
30
35
40Production
Figure 10. Wind Power Capacityand Electricity Production
Figure 11. Wind Power Capacity(Year to Year Change)
993
199
1994
1995
1996
1997
1998
1999
2000
2001
2002
200399
119
919
9992
199990Wind Power Policy Timeline
Market Deployment
. Green Frank System
. Distribution Grid Connection – Wallonia
. Green Certificate – Federal
. Green Certificate – Wallonia
. Green Certificate – Flanders
Denotes a significant change to a policy, such as an extension, repeal or revision.

168
PART 2: COUNTRY PROFILES
Wind is the largest new renewables market in Belgium. In 2001, wind power contributed a little morethan half a percent to total renewable energy supply. Wind capacity experienced an annual averagegrowth of 16.2% between 1990 and 2001, albeit from very low levels. There was little growth in theBelgian wind market in the first half of the 1990s, while from 1997 through 2002, 31 MW of installedcapacity was added for a total of 36 MW, according to Belgian data.
The first and primary wind farm in Belgium was built in 1986 and is located in the North Sea,approximately 2 km offshore in the outer harbour of Zeebrugge, a project planned and co-ordinated bythe Belgian Ministry of Public Works. The Zeebrugge wind farm has a total installed capacity ofapproximately 5 MW connected to the electricity grid.
Belgium’s wind market essentially started in 1997. The majority of wind installations are located in theFlemish region although two new wind farms have recently been built in the Walloon region and furtherprojects are under study. The first wind farm project has, however, recently been suspended by the StateJuridical Court due to public opposition. The second wind farm project, on the order of 300 MW, has beenapproved although procurement of its environmental licence is not yet complete. Eurostat estimates thatBelgium has another 2.5 to 40 MW of installed capacity from small wind turbines that are not connectedto the grid. Although difficulties in obtaining environmental permits are recognised, the Walloon Regionhas tentatively set an objective to install 200 MW of onshore wind capacity by 2010. The AMPERECommission estimates that there is potential for 1 500 MW of wind capacity in Belgium by 2020.1
The Green Frank System was implemented in 1995 and was deemed fairly ineffective in promoting windpower. The doubling of buy-back rates, however, for wind turbines within the Green Frank System wascredited with the increase in installed capacity in 1998. The effectiveness of this particular legislation wasnot long-lasting and the market needed further stimulation to continue to grow, which it received throughthe Green Certificate System. The federal decree on Green Certification, instituted in 2002, specified theconditions for issuing green certificates by the federal regulator (CREG) for offshore wind energyproduction. This system is expected to further stimulate the wind energy market.
Solar Thermal ProductionSolar thermal production increased from 35 TJ in 1990 to 56 TJ, an annual average growth of 4.4%. Solarthermal production was relatively constant until 1998 and then increased steadily to 2001. Production issplit between the regions with 50% in the Flemish region, 45% in the Walloon region and the remaining5% in the Brussels region.
The Belgian government has only recently started to target the solar thermal market. The growth in the latterpart of the 1990s was a result of the Green Frank System. This system, however, did not target the solarthermal market as specifically as it did the wind and hydropower market, so the effect was less dramatic.
Promotional programmes for the solar thermal market have come about more recently and more as aninitiative of the regions. The main programme is the Walloon Soltherm programme, established in May2000. Its objective is to develop a sustainable solar water heating industry in the region over ten years. Atpresent, 4 400 m2 have been installed. The target is for 200 000 m2 of panels to be installed in the regionby 2010, with 75% of the capacity to be installed through building renovations, and 25% from new
1. AMPÈRE Commission: Analysis of the Means of Production of Electricity and the Restructuring of the Electricity Sector Commission established bythe Belgian government.

BELGIUM
169
construction through grants to communities and households ranging from € 1 500 to € 3 000. In theFlemish region, in addition to the support from energy distributors, grants are offered by one province andby most municipal authorities of € 625 minimum and € 250 to € 1 000, respectively. A similar supportscheme is offered by the Brussels-Capital region.
Production
0
60
10
20
30
40
50
Figure 12. Solar Thermal Production
Production (TJ)
1990
993
199
199994
995
199
199996
997
199
199998
999
199
200000
001
200
200002
003
20099
119
919
9992
199990Solar Thermal Policy Timeline
Market Deployment
. Soltherm – Wallonia Government and Municipal Support
1991
1992
1993
1994
1995
1996
1997
1998
1999
2000
2001

170
PART 2: COUNTRY PROFILES
Belgium Policy Chronology
Tax Deduction for Environment-Friendly Investments(Federal)
Year 1992 - Present
Policy Description This policy makes incentives available for environmentally sound investmentsby industry. It provides capital grants of up to 13.5% of investment costs.Investments are considered eligible if they deal either with energy efficiency, orenergy resulting from non-polluting treatment of industrial and urban waste.The policy covers projects dealing with solar, wind, hydro energy, biomass(including biofuels) and geothermal energy technologies as well as RD&Dactivities that promote environmentally sound technologies.
Tax payers are allowed to spread the deductions out over several years. Thepolicy also offers grants totalling 20.5% of the investment and 25.5% forespecially innovative companies.
Policy Type Investment tax credits / Capital grants / RD&D
RE Technology All renewables
VLIET Programme
Year 1992-1995
Policy Description The VLIET programme put in place :
• Grants for research projects (50-100%).• Development projects (50% refundable loans, which are converted
to grants of 25% of investment cost for successful projects and 40% in caseof failure).
This programme was replaced by VLIET bis (1997-1999), which was basedon the same principles as the previous programme, but with a lower budget(BEF 67.5 million). The budget for the first phase (1992-1995) wasBEF 132.5 million.
Policy Type RD&D / Capital grants
RE Technology All renewables
Decree 15.12.1993(Flemish Region)
Year 1993 - Present
Policy Description The objective of the decree is to increase energy saving from fossil sources andto foster economic expansion.
BELGIUM
171
Companies investing in energy efficiency and renewable energy are eligible toreceive subsidies ranging from 10% for medium-sized and large organisationsto 20% for small enterprises. The utility sector is excluded from this subsidy.
To aid in the further development of the PV market, the Flemish authoritiesprovide an additional subsidy of 65% for the installation of photovoltaic panels,25% of which is provided by the electricity producers Electrabel and SPE.
Policy Type Capital grants
RE Technology All renewables
Pilot Programme for Biofuels in Cars
Year 1995 - Present
Policy Description This pilot programme promotes biofuels for transport in public transportvehicles in the Wallonia region and in Brussels. In 1995, the Flemishgovernment co-financed, with the partnership of the EU project ALTENER, alarge-scale demonstration and test programme for biofuels in cars (total fundingBEF 8.6 million).
Policy Type RD&D
RE Technology Biofuel
Wallonia’s 1995 Environment Plan for SustainableDevelopment
Year 1995-2010
Policy Description Wallonia’s 1995 Environment Plan for Sustainable Development, which wasdeveloped as a plan to reduce CO2 emissions, includes an aim to increaserenewable energy use to 3% of energy consumption by 2000 and 5% by 2010
Policy Type Obligations
RE Technology All renewables
Green Frank System
Year 1995-2003
Policy Description In January 1995, the Electricity and Gas Control Committee (CCEG)recommended the establishment of an additional incentive of 1 BEF per kWh(0.025 € per kWh) on top of the wholesale electricity production buy-back ratefor renewable energy. Starting in 1998, electricity generated by wind and hydrofacilities with an installed capacity of less than 10 MW received an extra 0.025 €per kWh. The total buy-back rate for PV was € 0.15 per kWh (includingwholesale electricity cost).
172
PART 2: COUNTRY PROFILES
In 2000, the total average buy-back rates were:
• Wind and hydro: € 0.0769-0.0850/kWh.• Other renewable including biomass: € 0.0521-0.0602/kWh.• PV: € 0.15/kWh.• The average auto-producer buy back rate was between € 0.0273 and
€ 0.0354/kWh over the same period.
These buy-back rates were applicable to existing and new auto-producers, andwere guaranteed over the first ten years of operation. For PV installations lessthan 3 kW, this guarantee covers the lifetime of the system installed.
The CCEG was dissolved in July 2003 and the Green Frank was suppressed asa system; although, the producers who were previously entitled to use thissystem can continue to do so for the total period not exceeding 10 years.
Policy Type Guaranteed prices/feed-in tariffs
RE Technology All renewables
Electricity Market Regulation (Federal)
Year 1999 - Present
Policy Description The electricity market law of 1999 was modified in 2001 to stipulate theimplementation of public service obligations. It gave rise to technicalregulations for connection to the transmission grid and the purchase ofelectricity, which prioritised green electricity.
Policy Type Regulatory and administrative rules
RE Technology All renewables
Offshore Wind Farm Authorisation Procedures
Year 2000 - Present
Policy Description This royal decree, promulgated in December 2000, determined the ad hocconditions and procedures to deliver the required authorisations for theinstallation and operation of wind parks in offshore areas.
Policy Type Regulatory and administrative rules
RE Technology Offshore wind
Access to the Grid
Year 2000 - Present
Policy Description In April 2000, the federal government decided that all generators of electricityfrom renewable sources will become progressively free to choose their own

BELGIUM
173
electricity supplier if they use more electricity than they are able to generate.Consumers who buy a significant amount of their electricity from renewablesources are also eligible to choose their electricity supplier.
The Flemish Parliament approved the decree regarding the liberalisation of theelectricity market and marked the following categories as eligible:
• Producers using quality CHP installations or renewables for electricitygeneration (up to a certain ceiling).
• Consumers of renewables-generated electricity by means of a CHP unit(for a certain amount of electricity) or consumers using heat from CHP unitsor renewables.
• Consumers using heat from a supplier who generates this heat by meansof CHP units or renewables (for a maximum of 500 kWh electricity per GJheat).
In Wallonia, a corresponding decree was approved and aims to gradually openthe market for producers using CHP and/or renewables for electricitygeneration, as well as consumers using renewable electricity and/or electricitygenerated by means of a CHP unit, or using heat from CHP units or renewables.
Policy Type Regulatory and administrative rules
RE Technology All renewables
Soltherm Wallonia
Year 2000-2010
Policy Description The Walloon Soltherm programme was established in May 2000. The objectiveis to develop a sustainable solar water heating industry in the region over a ten-year timeframe. The target is for 200 000 m2 of panels to be installed in theregion by 2010. 75% of the capacity should be installed through buildingrenovations and the remaining 25% from new construction.
Goals for the first year of the action plan (2000) included the installation of150 pilot systems to create sufficient experience and enable the emergence ofa viable private sector. The next phase included the training of new technicians,architects and public sector staff in charge of promoting these technologies.Once this has been completed, a promotional campaign will target allstakeholders from households, as well as private and public sector decisionmakers. The residential market will be targeted first, to be followed by the largercommunity-use projects.
Individual grants currently start from € 1 500 (for up to 4 m2 of panels) andcan be supplemented by local institutions (the communes and provinces)as well as gas and electricity distribution companies. Grants offered tohouseholds are between € 1 875 and € 3 000. The Walloon Region providesadditional support to the municipalities active in using solar thermal energy. In2003, most of the mixed “intercommunales” of gas and electricity distribution

174
PART 2: COUNTRY PROFILES
offered a € 1 250 grant to individuals and small and medium enterprises (SMEs).The Walloon Region also pays for solar auditing for communities.
Policy Type RD&D
RE Technology Solar thermal
Tax Reductions for Home ImprovementsYear 2001 – FY2003
Policy Description A federal law (2001) provided tax reductions for fiscal year 2003 with a budgetof € 37 million. The deduction rate is 15% for the replacement of old boilers(more than twenty years old) by new condensation boilers and for solar energy;40% for the installation of double glazing, roof insulation, the installation of acentral heating regulator, plus energy audits. The tax reduction is limited to€ 600 per household per year.
Policy Type Tax exemptions
RE Technology Solar thermalSolar photovoltaicConcentrating solar
Green Certificates Scheme (Flanders)
Year 2001 - Present
Policy Description This decree both fosters the production of electricity from renewable energyand implements the Electricity Decree of July 2000. From the 1st of January2002, every electricity supplier has the obligation to buy a certain amount ofgreen certificates from green electricity producers. This amount is 0.8% fromtotal electricity supply in 2002, 1.2% in 2003, 2% in 2004, to reach 6%in 2010.
The suppliers are obligated to surrender their certificates on an annual basis tothe Flemish regulator (the VREG). If the supplier does not comply with thisobligation, they are fined € 75 per missing certificate in 2003, € 100 in 2004and € 125 in 2005. The fines go into a Renewable Energy Fund. VREG providesa list of suppliers and green electricity producers, prices of green certificatesand a green certificate relational database on its website.
Policy Type Obligations / Tradable certificates
RE Technology All renewables
Green Certificates Scheme (Wallonia)
Year 2002 - Present

BELGIUM
175
Policy Description The decree from July 2002 fosters green electricity, implementing the ElectricityDecree from April 2001. This green certificates scheme aims to abate CO2emissions and obliges each supplier to meet a quota of green electricity withinits total supply of electricity.
The Walloon government established a target of 3% at the start of the system(July 2003). Further targets have been established of 7% by 2007 and 12% by2010. The objective of 12% is to be achieved by producing 8% fromrenewables and 20% from CHP. In the event of non-compliance with the quotaobligation, the supplier will be fined € 100; which goes into an energy fund.The Walloon regulator checks the quota obligation every three months andpublishes information about green certificates. Additionally, the Walloongovernment may soon allow green electricity producers the choice ofparticipating in the green certificates system or benefit from a governmentsupport system at € 65/MWh.
Policy Type Obligations / Tradable certificates
RE Technology All renewables
Green Certificate Scheme(Federal)
Year 2002 - Present
Policy Description The Royal Decree on the promotion of electricity produced from renewableenergy sources was adopted in July 2002 and came into force 1 July 2003.It addresses two fundamental issues: first, it sets the conditions for issuing greencertificates by the federal regulator (CREG) for offshore wind energyproduction, and second, it states that the grid operator is obliged to buy greencertificates issued anywhere in Belgium at minimum prices of € 90/MWh foroffshore wind energy, € 50/MWh for onshore wind energy, € 50/MWh forhydro, € 150/MWh for solar energy and € 20/MWh for biomass. The monitoredgreen certificates are valid for five years and are not associated to fixed quotas.
Policy Type Obligations / Tradable certificates
RE Technology All renewables
Support for Solar (Flanders)
Year 2002 - Present
Policy Description Grants for PV panels amounted to 65% of the total investment cost. Thisprogramme had a budget of € 1 million in 2002, which has been exhausted.Additionally, most of the communes provide grants of between € 250 and€ 750.

176
PART 2: COUNTRY PROFILES
For solar heating systems, a grant of € 625 was available and most of thecommunes provided between €250 and €750.
Policy Type Capital grants
RE Technology Solar photovoltaicSolar thermal
Support for Solar(Brussels Region)
Year 2003 - Present
Policy Description The Brussels Region gave grants totalling 35% of investment cost for thepurchase and installation of solar water heating systems with a maximum grantnot to exceed € 991.59 per household.
Policy Type Capital grants
RE Technology Solar thermal
Support for Pre-feasibility Studies(Wallonia)
Year 1990 – Present (updated in 1994)
Policy Description The Walloon Region supports part of the costs of pre-feasibility studies carriedout in the private sector to evaluate potential energy efficiency or renewableenergy investments within a company. This incentive also applies to costsrelated to technical certification. The maximum available allowance amountsto:
• 75% of total feasibility study costs calculated on the basis of quotesprovided by ministry-approved independent companies.
• 60% of total certification costs.
Policy Type Third-party finance
RE Technology All renewables
Investment Subsidy (Wallonia)
Year 1992 – Present (updated in 2002)
Policy Description The Walloon Region subsidises 15% of the investments of any company aimingto increase either their renewable energy production or energy efficiency.

BELGIUM
177
Policy Type Capital grants
RE Technology All renewables
Financial Support for Demonstration Projects(Flanders)
Year 1992 - Present
Policy Description Industry and the tertiary sector can benefit from these grants of 50% of the costof investment promoting the rational use of energy or use of renewable energysources, primarily biomass.
Policy Type RD&D / Capital grants
RE Technology Biomass
Electricity Distribution(Flemish Region)
Year 2004 - Present
Policy Description Since February 2004, grid managers (low voltage) are obliged, according to theapplication of the 2001 decree on the promotion of renewables-generatedelectricity, to offer free distribution of electricity from renewables sources.Additionally, grid access for the suppliers of electricity from renewable sourcesis fixed at a certain minimum level.
Policy Type Net metering
RE Technology All renewables
UREBA(Walloon Region)
Year 2003 - Present
Policy Description This regional scheme focuses on investment support with a subsidy of 30% to50% for investments in public buildings.
Policy Type Consumer grants/rebates
RE Technology All renewables

Canada
179
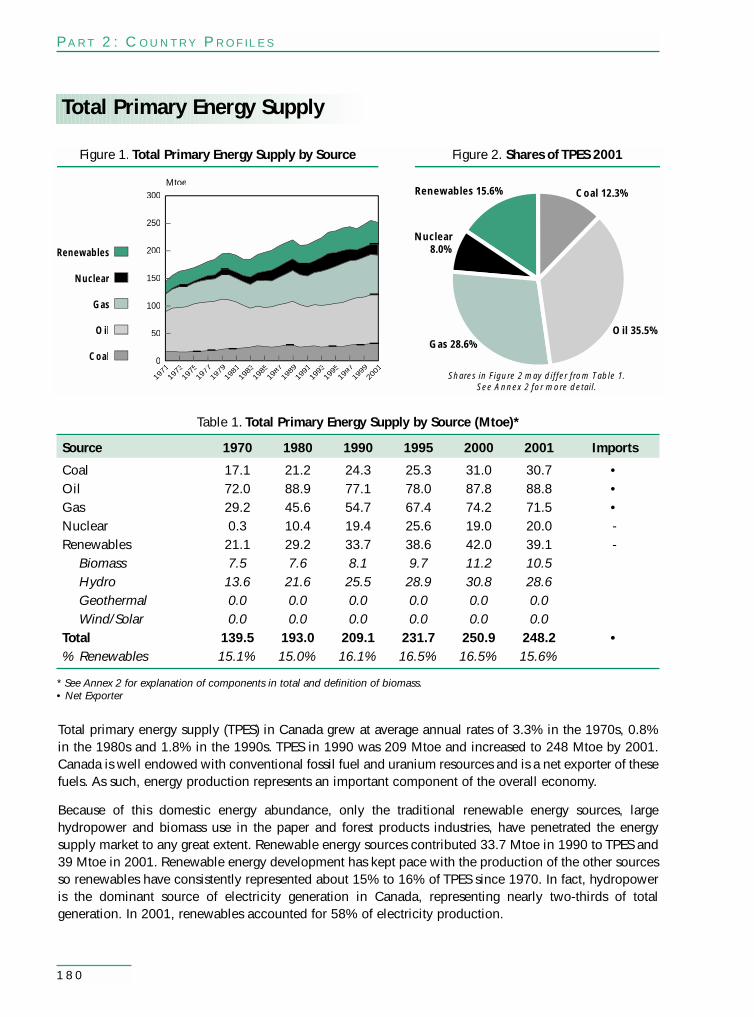
Gas
Coal
Oil
Nuclear
Renewables
Mtoe
0
50
100
150
200
250
300
1971
1973
1975
1977
1979
1981
1983
1985
1987
1989
1991
1993
1995
1997
1999
2001
Gas 28.6%
Coal 12.3%Renewables 15.6%
Nuclear8.0%
Oil 35.5%
Figure 1. Total Primary Energy Supply by Source Figure 2. Shares of TPES 2001
Shares in Figure 2 may differ from Table 1.See Annex 2 for more detail.
180
Total Primary Energy Supply
Table 1. Total Primary Energy Supply by Source (Mtoe)*
Total primary energy supply (TPES) in Canada grew at average annual rates of 3.3% in the 1970s, 0.8%in the 1980s and 1.8% in the 1990s. TPES in 1990 was 209 Mtoe and increased to 248 Mtoe by 2001.Canada is well endowed with conventional fossil fuel and uranium resources and is a net exporter of thesefuels. As such, energy production represents an important component of the overall economy.
Because of this domestic energy abundance, only the traditional renewable energy sources, largehydropower and biomass use in the paper and forest products industries, have penetrated the energysupply market to any great extent. Renewable energy sources contributed 33.7 Mtoe in 1990 to TPES and39 Mtoe in 2001. Renewable energy development has kept pace with the production of the other sourcesso renewables have consistently represented about 15% to 16% of TPES since 1970. In fact, hydropoweris the dominant source of electricity generation in Canada, representing nearly two-thirds of totalgeneration. In 2001, renewables accounted for 58% of electricity production.
PART 2: COUNTRY PROFILES
Source 1970 1980 1990 1995 2000 2001 Imports
Coal 17.1 21.2 24.3 25.3 31.0 30.7 •Oil 72.0 88.9 77.1 78.0 87.8 88.8 •Gas 29.2 45.6 54.7 67.4 74.2 71.5 •Nuclear 0.3 10.4 19.4 25.6 19.0 20.0 -Renewables 21.1 29.2 33.7 38.6 42.0 39.1 -
Biomass 7.5 7.6 8.1 9.7 11.2 10.5Hydro 13.6 21.6 25.5 28.9 30.8 28.6Geothermal 0.0 0.0 0.0 0.0 0.0 0.0Wind/Solar 0.0 0.0 0.0 0.0 0.0 0.0
Total 139.5 193.0 209.1 231.7 250.9 248.2 •% Renewables 15.1% 15.0% 16.1% 16.5% 16.5% 15.6%
* See Annex 2 for explanation of components in total and definition of biomass.• Net Exporter

CANADA
181
Policy Timeline
Research and Development
. PERD
. TEAM
. Sustainable Development Technology
Market Deployment
. Government Electricity Purchases
. Renewable Energy Deployment Initiative
. Financial Incentives
. Market Incentive Program
Energy Policy Context
. Tax Incentives
Denotes a significant change to a policy, such as an extension, repeal or revision.
Hydro
CombustibleRenewables
and Waste
Mtoe
0
5
45
10
15
20
25
30
35
40
1971 73
1975 77
1979 81
1983 85
1987 89
199 93
1995 97
1999 01
Figure 3. Total Renewable Energy Supply and Policy Timeline
Renewable Energy Supply
Hydropower and combustible renewables and waste account for the largest shares in renewable energysupply in Canada. In 2001, hydropower was 73% and combustible renewables and waste was 27% oftotal renewable energy supply. Hydropower generation capacity was 67.2 GW, combustiblerenewables was 1.2 GW and wind power capacity was 78 MW. Solid biomass production hasincreased from 340 703 TJ in 1990 to 438 020 TJ in 2001. The wood products and pulp andpaper industries account for the majority of solid biomass use, primarily in the forms of wood wasteand black liquor.

182
PART 2: COUNTRY PROFILES
Canada has one of the world’s few tidal power facilities at the Bay of Fundy (18 MW capacity). There have beenno specific policies or measures aimed at tidal power in Canada and there have been no new tidal projects sincethe commissioning of the Bay of Fundy plant. There are some objections to tidal power development includingecological objections to building more tidal plants along the coast because of potential impacts on aquatic life.These concerns, coupled with the high capital costs associated with tidal facilities mean that the likelihood oftidal energy contributing significantly to Canada’s power in the near future is low.
However, there is growing interest to exploit the potential wave and tidal resources in British Columbia.Encouraged by the rising electricity demand on Vancouver Island and as part of the initiatives on green energytechnologies, BC Hydro examined the feasibility of exploiting wave and tidal current energy in the provinceand developed relevant resource maps. In 2002, BC Hydro signed a memorandum of understanding (MOU)with two technology owners to build two wave demonstration plants. Though these MOUs were cancelledin 2003 because of the implementation of a new provincial energy policy restricting BC Hydro’s directinvolvement in new energy generation, efforts by private companies to enable development of ocean energyin British Columbia are continuing. Presently there are five different companies who are in the process ofdeveloping wave and tidal technology and/or projects in the province.
Research and Development TrendsCanada spent a total of US$ 8.79 billion (2002 prices and exchange rates) on government energy RD&Dbetween 1974 and 2002. In this period, 7.4% of its total RD&D budget was allocated to renewable energy.
The overall trend of government RD&D expenditures for renewables peaked in the early 1980s and declinednotably after 1985. Government RD&D budgets for renewables have been considerably reduced since 1985.
Among the renewable technologies, biomass received the highest level of funding at US$ 254 million, or40%, in the 1974 to 2002 period. Solar heating and cooling was funded at US$ 178 million, representing28% of renewable energy RD&D. Wind was the third largest recipient with 13% of the renewable RD&Dexpenditures from 1974 to 2002.
Assistance programmes for research and development in renewable energy have been in place for morethan twenty-five years. The main funding organisation is Natural Resources Canada through the federal
Capacity (MW)
0
180
20
40
60
80
100
120
140
160
Figure 4. Net Generating Capacity of Renewable and Waste Products
Solar all Plants
Tide, Waveand Ocean
Wind
1990
1995
1996
1997
1998
1999
2000
2001
Note: A change in data collection methods at the IEA occurred in 1999 with the separation of net generating capacity between small and large hydro.Capacity data for small hydro are not available prior to 1999.

CANADA
183
Programme of Energy Research and Development (PERD). The main component of this RD&D effort isthe Renewable Energy Technologies Programme (RETP). It supports efforts by Canadian industry todevelop and commercialise advanced renewable energy technologies such as active solar, wind power,bioenergy and small hydro that can serve as cost-effective and environmentally responsible alternativesto conventional energy generation. In the mid-1980s, at the peak of energy RD&D expenditures, thefederal government’s total budget for renewable energy was in excess of US$ 60 million per year. Currentfederal support for RD&D is on the order of US$ 23 million annually.
Under its climate change initiatives, the federal government has announced a number of programmes insupport of renewable energy technologies. In 2000, the federal government invested about CAN$5 million dollars over five years to help develop technologies which would help reduce GHG emissions,including renewable energy technologies such as biogas production.
The main support programme for demonstration is Technology Early Action Measures (TEAM). Itsobjective is to help accelerate the demonstration and commercial deployment of new technologies.
Million US$ (2002 prices and exchange rates)
0
600
100
200
300
400
500
Figure 5. Canada – Government Energy RD&D Budgets
Total OtherTech./Research
TotalConservation
Total Power& Storage Tech.
Total NuclearFission/Fusion
Total RenewableEnergy
Total FossilFuels
1974
1976
1978
1980
1982
1984
1986
1988
1990
1992
1994
1996
1998
2000
2002
Million US$ (2002 prices and exchange rates)
0
70
10
20
30
40
50
60
Figure 6. Canada – Government Renewable Energy RD&D Budgets
Large Hydro(>10 MW)
SolarThermal-Electric
SolarPhoto-Electric
Solar Heating& Cooling
Small Hydro(<10 MW)
Geothermal
Biomass
Wind
1974
1976
1978
1980
1982
1984
1986
1988
1990
1992
1994
1996
1998
2000
2002

184
PART 2: COUNTRY PROFILES
Sustainable Development Technology Canada was founded in 2000. This arm’s length organisation aimsto stimulate the development and demonstration of Canadian technologies related to climate change andair quality.
The Industrial Research Assistance Programme (IRAP) is a generic technology development programmeadministered by the National Research Council. It provides assistance to small- and medium-sizedcompanies to advance their technologies.
Another major generic technology development programme that often provides assistance to renewableenergy projects is Technology Partnerships Canada (TPC) administered by Industry Canada. It providesrepayable financial assistance for the development of technologies directly associated with improvedindustrial processes. Support for environmental and sustainable alternatives is a programme priority.
Announced in 2003, the Climate Change Technology and Innovation Initiative will support the longterm development of greenhouse gas reduction technologies in five areas with a total budget ofCAN$ 250 million over five years. Three of these five areas will address renewable energy: decentralisedenergy production, biotechnology and hydrogen economy.
In addition, Canada participates in international collaborative RD&D in Bioenergy, District Heating andCooling, Hydropower, Ocean Energy Systems, Photovoltaic Power Systems, Pulp and Paper, SolarHeating and Cooling and Wind Turbine Systems through the IEA Implementing Agreements.
Market Deployment Trends
Because Canada is a country rich in energy resources, the primary impetus for renewable energydevelopment has been market economics. Thus, development of large hydropower projects has beenpursued and the paper and forest products industries have used biomass waste facilities for process heatand in combined heat and power systems. Although energy security is not a domestic concern, Canadais a signatory of the Kyoto Protocol and thus has committed to reduce its emissions of greenhouse gases,which has provided impetus for the adoption of policies for promoting renewable energy production.
Among the most prominent policies adopted for renewables are: The Renewables Energy DeploymentInitiative (REDI) (1997), which provides incentives for the adoption of solar thermal systems and high-efficiency and low-emitting biomass combustion systems; a Wind Power Production Incentive (2002),the programme also established minimum (1 MW to 10 MW) and maximum (300 MW) wind energyquotas to be met by each province; and government purchases of electricity from renewables.
REDI provides incentives for solar low thermal applications (e.g., solar water heating and pre-heatingof ventilation air in commercial buildings) and bioenergy. Between 1998 and 2002, REDI supported35 biomass projects translating into an increased capacity of about 66 MW and energy savings of around480 TJ per year; 59 solar water and air heating projects totalling 840 m2 of collector systems and leadingto estimated annual energy savings of 2.5 TJ per year.
After the negotiation of the Kyoto Protocol in 1997, federal, provincial and territorial energy andenvironment ministers set up multi-stakeholder Issue Tables to develop options to reduce greenhouse gasemissions. Of particular interest are the reports by the Electricity, Buildings and Municipalities Tables,which outlined several measures to encourage market-emerging renewable energy sources. The work ofthe Issue Tables paved the way for CAN$ 1.5 billion worth of federal climate change initiatives,announced in 2000 and 2001. Several of these initiatives, described below, are designed to developmarkets for emerging renewable energy sources.

CANADA
185
● Extension of REDI(See Policy Chronology for further information.)
● Government PurchasingThe objective of this initiative is to purchase electricity from emerging renewable energy sources forfederal facilities across Canada. About 20% of the electricity that the government purchases will begenerated from emerging renewable energy sources. This is expected to amount to 450 gigawatthours (GWh) per year.
● Market IncentiveAn incentive will be offered to electricity distributors interested in stimulating sales of electricity fromemerging renewable sources in the residential and small business markets. The federal incentive,combined with the efforts of other stakeholders, is expected to produce green electricity sales of3 200 GWh a year by 2010. This estimate assumes that 5% of residential customers will switch toelectricity that is from new renewable sources for a portion of their electricity needs. It also assumesthat all other levels of government and large industrial customers will follow the same lead.
● On-site Generation in Federal FacilitiesThe government will install a small number of on-site generation systems in its facilities. Thesesystems will use such technologies as solar photovoltaic panels, small-scale wind turbines andmicro-hydro turbines. They will be installed in off-grid situations where economics are favourableand in grid-connected situations where they will raise public awareness of such systems. About100 kilowatts (kW) of capacity is expected to be installed.
● Interconnection GuidelinesThe government will work with interested jurisdictions to help provide access to the electricity grid for generating low- and non-greenhouse gas emissions systems. For on-site generation, the government will help develop technical guidelines on interconnecting such systems with the grid.Distributed power proponents identified a key barrier to the wider use of on-site generationsystems:not understanding the proper interconnection needs.
● Wind Power Production IncentiveThis is a renewable electricity production incentive to encourage the construction of 1 000 megawatts(MW) of new wind energy capacity in the 2002 to 2007 period. The incentive amounts to about one centfor each kilowatt hour (kWh) produced by new wind energy facilities in their first ten years of operation.It should provide for about half of the current cost gap for wind power produced under good resource andeconomic conditions.
● Canadian Renewable Energy Network (CanREN)Created through the efforts of Natural Resources Canada and its stakeholders, the purpose of this net-work is to increase the understanding of renewable energy to accelerate the development and commercialisation of renewable energy technologies. CanREN offers general information on renewable energy sources, highlights the technologies and applications being developed to harnessthese sources, and presents Canadians with the knowledge and support they need to make renewable energy part of their everyday lives.
Energy Policy ContextFrom an energy policy point of view, public interest in renewable resources emerged and grew duringthe oil price crises of the 1970s and early 1980s. Canadians, like citizens of other International EnergyAgency (IEA) Member countries, have been keenly interested in renewable energy for a long time. Eventhough many Canadian provinces had been deriving most of their electricity from hydroelectric power,the first crises of the 1970s ignited a strong interest in all forms of renewable energy. In the late 1970s

186
the federal government and most provincial governments responded to the strong public interest for thesubstitution of oil and other fossil fuels with renewable energy sources. It was recognised at the time,through resource assessment surveys, that Canada had large physical reserves of biomass as well asample potential for solar, wind, geothermal and other forms of sustainable energy to develop andcommercialise. A number of initiatives were started then to research, develop, demonstrate andcommercialise renewable energy technologies. The federal government expenditures in support ofrenewable energy in the early 1980s allocated about CAN$ 100 million per year to expedite thedevelopment of technologies and encourage their market penetration.
Under the evolving policy objectives of “energy self-reliance”, “security of energy supplies”, “energydiversity”, “sustainable development”, “clean air” and “climate change” initiatives, the Canadiangovernment introduced many programmes over the last decades in support of renewable energy. Theseprogrammes took the form of cost-sharing research, development and demonstration for new energytechnologies and, in some cases, fiscal measures that provided tax incentives to encourage the broadmarket penetration of renewable energy. Other related activities included informing the public aboutthe merits of renewable energy, facilitating the development of standards and training tools andstreamlining regulations.
In addition to federal government resources, Canada’s ten provincial and three territorial governments playa key role in the development and commercialisation of renewable energy. While federal jurisdiction onthe energy market refers to international and inter-provincial trade and facilities, provincial governmentsare responsible for energy production and distribution within the province. Any regulatory initiatives toincrease production must be undertaken at the provincial level. In the case of hydropower, the provincialgovernments, through their hydro utilities, are the main players in developing and managing theseresources. In the past, provincial programmes for emerging renewable energy technologies usuallycomplemented federal government efforts. They were aimed primarily at demonstration projects and/orconsumer information initiatives. Although many provincial programmes related to emerging renewableenergy technologies have, for the most part, been eliminated, a few provinces maintain some coreexpertise and programmes. Being close to the local scene where projects are taking place, they continueto provide valuable assistance in terms of project selection, monitoring and dissemination of results.
Initial objectives for market share of emerging renewable energy in Canada were optimistic andsuccesses were not always commensurate with expectations. The lack of quick breakthroughs intechnology improvements, as well as the expanding availability of natural gas and low oil pricesmoderated expectations for quick market acceptance of new products, especially those based onemerging technologies. On the positive side, renewable energy in Canada has constantly grown inapplications where it made economic sense, such as the use of biomass residues in thermal andelectrical applications, solar heating of swimming pools and innovative hydro projects (> than 20 MW).
Current overall impressions are that renewables are viable energy sources in a growing number ofapplications and offer many environmental benefits as well as increased local economic opportunities.As in many IEA Member countries, Canada looks at renewable energy development andcommercialisation as one of the key drivers to help address Kyoto and other global environmentalobjectives. Many of the current programmes in support of renewable energy in Canada are driven byrealistic expectations and the stakeholders involved have a better understanding of the timeframerequired to perfect new technologies and compete in the marketplace.
The Conference Board of Canada published an overview of renewable energy in Canada in 2003. Itprovides an excellent description of existing federal and provincial measures to promote the deployment
PART 2: COUNTRY PROFILES

CANADA
187
of renewable energy, including details on provincial feed-in tariffs and green power purchases bygovernmental organisations. An alternative to feed-in tariffs is used by utilities in British Columbia andQuebec. Utilities decide on a desired volume of power to be sourced from renewables, then acquire thison contracts of varying lengths from renewable energy suppliers.
Provinces also have their own support mechanism to promote renewables. British Columbia, Alberta andNewfoundland and Labrador have green electricity procurement policies for government uses. Severalprovinces are considering implementing renewable portfolio obligations (e.g., Ontario, New Brunswick).Quebec is supporting the addition of 1 000 MW of wind electricity capacity by 2012.

188
PART 2: COUNTRY PROFILES
1993
1994
1995
1996
1997
1998
1999
2000
2001
2002
2003
1991
1992
1990
1993
1994
1995
1996
1997
1998
1999
2000
2001
–0.5%
0%
0.5%
1%
1.5%
2%
2.5%
3%
Capacity (MW) Gross Electricity Production (GWh)
–1%
Hydropower Policy Timeline
. Market Incentive Programme
Denotes a significant change to a policy, such as an extension, repeal or revision.
1991
1992
54000
56000
58000
60000
62000
64000
66000
68000
19901991
19921993
19941995
19961997
19981999
20002001
Capacity
0
50000
100000
150000
200000
250000
300000
350000
400000Production
Figure 7. Hydropower Capacityand Electricity Production
Figure 8. Hydropower Capacity(Year to Year Change)
Renewable Energy Markets
Hydropower
Hydropower from large-scale projects is already the leading form of electricity generation in Canada.Being successful and well established, large hydro producers are well positioned to make a contributionto climate change concerns without direct financial support from the federal government. On average,about 600 MW of large hydro is being developed each year.
Small hydro includes plants with a generating capacity of 50 MW or less. Small hydro opportunities usinginnovative technologies exist in Canada. Most of these opportunities have been disregarded by electric utilitiesduring the second part of the twentieth century in favour of large-scale projects. Recently there has beeninterest in alternative applications for small hydro such as water supply and waste-water treatment plants anddevelopment of small hydro at remote non-grid connected areas currently using expensive diesel fuel.
On average, more than 150 MW of small hydro is being developed each year, which representsabout CAN$ 300 million in annual business and a reduction in greenhouse gas emissions of more than700 000 tonnes of CO2 annually.
Provincial and Territorial governments are showing an interest in developing their small hydro potentialand Natural Resources Canada (NRCan) is actively working with them to support this development. Forexample, BC Hydro is actively promoting green power; Nunavut is investigating its small hydro potential;and NRCan is participating in hydro policy development with provincial governments such as Ontario’sMinistry of Natural Resources as it examines small hydro potential.

CANADA
189
NRCan has also developed a CAN$ 25 million Market Incentive Programme (MIP) for Distributors of EmergingRenewable Electricity Sources as part of the government’s Action Plan 2000 on Climate Change. The goal ofthis measure is to encourage electricity distributors to experiment with measures to stimulate sales of electricityfrom renewable energy sources, including small hydro. Funding is available through the MIP until 2006.
As part of the strategy for the electricity sector, the Action Plan 2000 on Climate Change expanded theRenewable Energy Deployment Initiative (REDI) for federal facilities to include on-site electricitygeneration that uses emerging renewable energy systems, including micro-hydro.
Biomass Production
1993
1994
1995
1996
1997
1998
1999
2000
2001
2002
2003
1991
1992
199990
1993
1994
1995
1996
1997
1998
1999
2000
2001
–5%
0%
5%
10%
15%
20%
Production (TJ)
–10%
Biomass Policy Timeline
Research and Development
. TEAM
Market Deployment
. REDI
Denotes a significant change to a policy, such as an extension, repeal or revision.
1991
1992
0
50000
100000
150000
200000
250000
300000
350000
400000
450000
500000
1990
Production
19911992
19931994
19951996
19971998
19992000
2001
Figure 9. Solid Biomass Production Figure 10. Solid Biomass Production(Year to Year Change)
Canadian manufacturers, particularly those in the pulp and paper industry, use industrial wood waste,such as wood chips, sawdust, bark and pulping liquor, to produce about 400 petajoules (PJ) of biomassenergy per year – 5% of primary energy demand in Canada. Second, wood is used for residential spaceheating, which has long been part of the Canadian way of life. About three million Canadian householdsuse wood as a primary or second source of home heat, which translates into about 90 to 100 PJ of energyproduction annually.
The REDI programme has helped promote the development of biomass for heating purposes. It hassupported 35 projects, which from 1998 to 2002 developed 66 MW of capacity. The value of the facilitiesis CAN$ 7.2 million and the incentive paid by REDI was CAN$ 1.21 million.

190
Energy from WastesBioenergy derived from wastes is gaining momentum in Canada. Energy recovery from landfill sites, biogasgenerated by various sources and combustion of municipal solid wastes is proving to be a sensible way ofdealing with an environmental problem. According to Canadian officials, total electricity generation fromwastes is currently about 750 GWh with a potential to double over the next decade. Demonstrationprojects have been supported by the Technology Early Action Measures (TEAM) Programme.
Liquid Biofuels ProductionEthanolSupport for ethanol dates back to the mid-1990s when the government removed the excise tax (main fiscalmeasure) on the ethanol portion of blended gasoline and established a programme to protect producersfrom any future change in this policy. The current production capacity totals about 200 million litres peryear. The federal government will support the construction of new fuel ethanol facilities as part of acompetitive process under the Ethanol Expansion Programme announced in 2003.
BiodieselBefore biodiesel can become commercially viable in Canada, more research and development must bedone to find cost-effective ways to produce it and to make sure it works in cold weather. Thecommissioning of a commercial-scale biodiesel production facility, with an annual capacity of 60 millionlitres, is planned in 2004. The plant will produce biodiesel from vegetable oils and waste animal fat.Biodiesel has been tested in buses in Montréal and in Saskatoon.
Wind Power
PART 2: COUNTRY PROFILES
1993
1994
1995
1996
1997
1998
1999
2000
2001
2002
2003
1991
1992
1990
1993
1994
1995
1996
1997
1998
1999
2000
2001
50%
100%
150%
200%
250%
300%
Capacity (MW) Gross Electricity Production (GWh)
0%
Wind Power Policy Timeline
. Wind Power Production Incentive
Denotes a significant change to a policy, such as an extension, repeal or revision.
1991
1992
0
20
40
60
80
100
120
140
19901991
19921993
19941995
19961997
19981999
20002001
Capacity
0
50
100
150
200
250
300
350
400Production
Figure 11. Wind Power Capacityand Electricity Production
Figure 12. Wind Power Capacity(Year to Year Change)
Installed wind power capacity has increased from 1 MW in 1990 to 131 MW in 2001.

CANADA
191
The Wind Power Production Incentive (WPPI) is the most important policy measure to support wind powerdevelopment. Started in 2002, WPPI is a grant programme to support the installation of 1 000 MW of windcapacity over five years. One year after the launch of the programme, it appears that the 1 000 MW target willbe achieved earlier than planned. A number of proposals have been submitted from various regions ofCanada. One example of a wind power scheme is the SaskPower Cypress Wind Project in Saskatchewan.
Natural Resources Canada led a national consultation process on wind energy in 2003 in order to identifyR&D needs, opportunities and priorities, and seek opportunities for Canadian industrial development. Theconsultation involved federal and provincial organisations, the Canadian Wind Energy Association andprivate sector representatives. The endpoint of the consultation process was an inter-departmental meetingto present and discuss national priorities and build support across federal departments for a WindInnovation Strategy for Canada. This strategy is under development.
Solar Photovoltaic
In 1995 installed solar photovoltaic (PV) capacity was 2 MW and gradually increased to 9 MW in 2001.
The CANMET Energy Technology Center supports the development and use of photovoltaic technology.Two strategic approaches are used. The first aims to advance technology deployment in Canada. The second involves exploiting PV technology potential nationally and internationally. All efforts are directedtoward facilitating user’s understanding of the technology.
The main activities include:
● RD&D on PV technology and systems.
● Modelling and optimisation of PV – generator set hybrid systems in cold climates.
993
199
199994
995
199
1996
1997
1998
1999
2000
2001
2002
200399
119
919
9992
199990
1993
1994
1995
1996
1997
1998
1999
2000
2001
20%
40%
60%
80%
100%
120%
Capacity (MW) Gross Electricity Production (GWh)
0%
Solar PV Policy Timeline
Research and Development
. Market Incentive Programme
Denotes a significant change to a policy, such as an extension, repeal or revision.
1991
1992
0
1
2
3
4
5
6
7
8
9
10
19901991
19921993
19941995
19961997
19981999
20002001
Capacity
0
2
4
6
8
10
12
14
16
18
20Production
Figure 13. Solar Photovoltaic Capacityand Electricity Production
Figure 14. Solar Photovoltaic Capacity(Year to Year Change)

192
● Development of certification and installation standards for PV systems.
● Development of national guidelines for interconnection to the grid of distributed power sources.
● Assessment of opportunities for PV in building applications.
● Promotion of the use of PV, wind and micro-hydro in federal facilities.
● Follow-up of Canadian activities and market status.
● Information dissemination to the Canadian PV industry.
Ocean Energy
Canadian coasts and offshore areas contain enormous, exploitable renewable primary energy resources.Relevant forms of ocean energy are tide, wave, tidal (marine current) and salinity. In Canada, an 18 MWtidal plant was built at the Bay of Fundy in 1984. Though the conversion technology is the most developeddue to its similarity to conventional hydro power, this type of energy conversion may cause significantchanges to the estuarine ecosystem and there are few suitable locations on the Canadian coasts.
Both Canada’s coast lines and offshore areas have favourable wave energy resources. For example,average near-shore wave power for the west coast of Vancouver Island is 33-kW/metre width of wavefront. The total incidental wave power for Vancouver Island is estimated at 6-8 GW.
With respect to tidal currents, a recent resource assessment for Vancouver Island and the British Columbiamainland has identified 55 sites with a current speed of > 2 m/s. The estimated energy potential from thesesites is more than 2 GW. Twelve specific sites, each having more than 10 MW potential, have been identified.
The other form of available ocean power for Canada is salinity power. Osmotic pressure differencebetween fresh water and seawater is equivalent to 240 m of hydraulic head. Thus a stream flowing at1 m3/s into ocean could produce 1 MW of electricity. Conversion technologies (membrane or turbine) areat an early stage of development.
There is significant interest in the west coast of Canada for harnessing wave and tidal current resources togenerate electricity and for other applications, such as integration with wind and solar, for desalinationand for aquaculture, and for hydrogen production. Recently, a British Columbia ocean energy system coregroup was formed to drive this interest. Technologies for wave and tidal current energy conversion processare at pre-commercial stage and various technological, market and policy barriers exist at present forharnessing these primary renewable energy sources.
PART 2: COUNTRY PROFILES
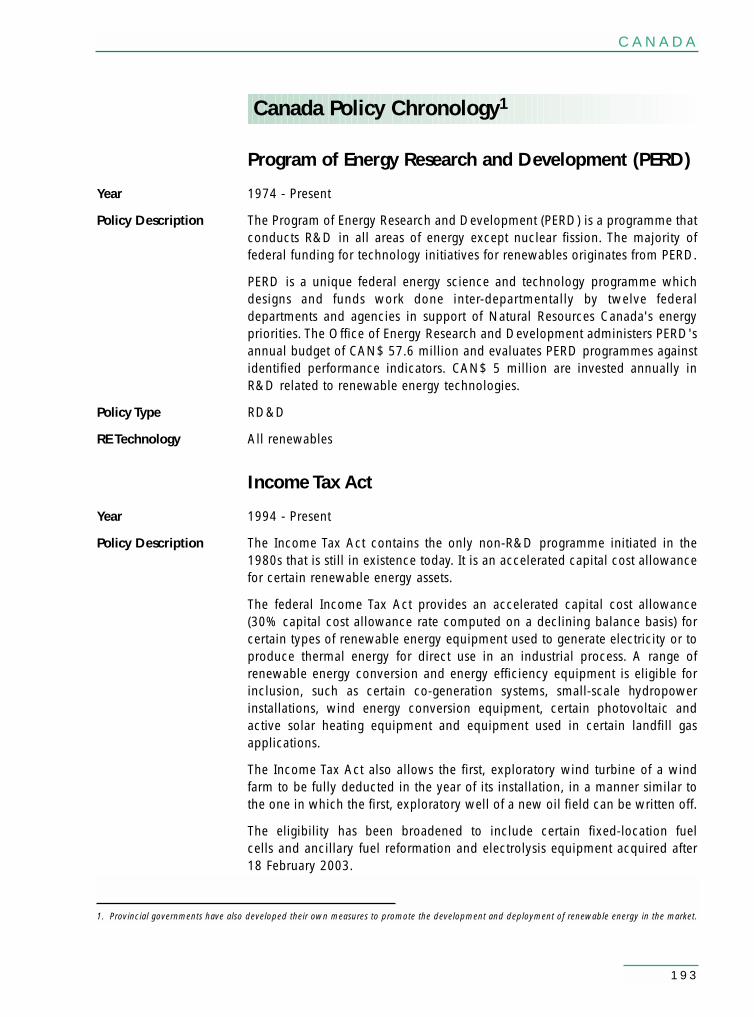
CANADA
193
Canada Policy Chronology1
Program of Energy Research and Development (PERD)
Year 1974 - Present
Policy Description The Program of Energy Research and Development (PERD) is a programme thatconducts R&D in all areas of energy except nuclear fission. The majority offederal funding for technology initiatives for renewables originates from PERD.
PERD is a unique federal energy science and technology programme whichdesigns and funds work done inter-departmentally by twelve federaldepartments and agencies in support of Natural Resources Canada's energypriorities. The Office of Energy Research and Development administers PERD'sannual budget of CAN$ 57.6 million and evaluates PERD programmes againstidentified performance indicators. CAN$ 5 million are invested annually inR&D related to renewable energy technologies.
Policy Type RD&D
RE Technology All renewables
Income Tax Act
Year 1994 - Present
Policy Description The Income Tax Act contains the only non-R&D programme initiated in the1980s that is still in existence today. It is an accelerated capital cost allowancefor certain renewable energy assets.
The federal Income Tax Act provides an accelerated capital cost allowance(30% capital cost allowance rate computed on a declining balance basis) forcertain types of renewable energy equipment used to generate electricity or toproduce thermal energy for direct use in an industrial process. A range ofrenewable energy conversion and energy efficiency equipment is eligible forinclusion, such as certain co-generation systems, small-scale hydropowerinstallations, wind energy conversion equipment, certain photovoltaic andactive solar heating equipment and equipment used in certain landfill gasapplications.
The Income Tax Act also allows the first, exploratory wind turbine of a windfarm to be fully deducted in the year of its installation, in a manner similar tothe one in which the first, exploratory well of a new oil field can be written off.
The eligibility has been broadened to include certain fixed-location fuelcells and ancillary fuel reformation and electrolysis equipment acquired after18 February 2003.
1. Provincial governments have also developed their own measures to promote the development and deployment of renewable energy in the market.

194
PART 2: COUNTRY PROFILES
Policy Type Investment tax credits
RE Technology Hydropower Offshore windOnshore wind Solar photovoltaic
Government Purchases of Electricityfrom Renewable Sources
Year 1997
Policy Description Following a recommendation in 1994 by the Task Force on EconomicInstruments and Disincentives to Sound Environmental Practices, NaturalResources Canada (NRCan) studied the feasibility of having the federalgovernment buy some of its electricity from emerging renewable energysources (ERES). After consulting with electrical utilities and the renewableenergy industry, NRCan announced its intention to start pilot projects topurchase electricity from renewable sources. ERES include wind, solar, water,biomass and geothermal where the electricity is generated from emerging andinnovative applications.
In 1997, NRCan began purchasing electricity from ERES from ENMAX,Calgary’s electric system. The ten-year agreement with ENMAX is for theproduction of 10 000 megawatt hours of electricity from renewable sources forNRCan´s Alberta facilities. Environment Canada also signed an agreement withENMAX for 2 000 megawatt hours of green electricity for their electricityrequirements in Alberta. Together, NRCan and Environment Canadaagreements will displace more than 10 000 tonnes of CO2 annually.
In 2000, NRCan signed a ten-year agreement with SaskPower, Saskatchewan’selectric utility and is receiving about 32 000 megawatt hours annually of windpower for its facilities in Saskatchewan.
Early in 2001, NRCan signed an agreement with Maritime Electric from PrinceEdward Island to purchase electricity from ERES. This ten-year agreement is for theproduction of 13 000 megawatt hours annually of wind power. The pilot projectsin Saskatchewan and Prince Edward Island will deliver about 40 000 tonnes ofgreenhouse gas emissions reductions annually.
Under Action Plan 2000 on Climate Change, it is expected that the federalgovernment will purchase an additional 400 000 megawatt hours or so ofelectricity from ERES. Assuming a continued focus on the displacement of high-carbon electricity, these 400 000 megawatt hours will come from severalprovinces, particularly Nova Scotia, Ontario and New Brunswick, withadditional purchases in Alberta. These purchases will result in a furtherreduction in greenhouse gas emissions of about 200 000 tonnes annually.

CANADA
195
The goal of the Government purchases of electricity from ERES is to:
• Provide a "first customer" to help interested utilities gain experience withdifferent electricity products.
• Achieve emissions reductions in federal operations.
• Leverage first purchases to create viable green power markets.
Policy Type Government purchases
RE Technology All renewables
Renewable Energy Deployment Initiative
Year 1998-2007
Policy Description The Renewable Energy Deployment Initiative (REDI) was announced in 1997,and came into effect in 1998. It is a six-year, CAN$ 24 million programmedesigned to stimulate the demand for renewable energy systems for space andwater heating and cooling.
Under REDI, NRCan undertakes market development activities, in co-operationwith renewable energy industry associations and other partners, and provides anincentive for specific renewable energy systems. To encourage the private sectorto gain experience with active solar and large biomass combustion systems,businesses are eligible for a refund of 25% of the purchase and installation costsof a qualifying system, up to a maximum refund of CAN$ 80 000. NRCanprovides a similar incentive to federal departments and to public institutions.Some incentives are also provided to the residential sector for pilot projectsdelivered by partners.
In remote communities, businesses, institutions and other organisations may beeligible for a refund of 40% of the purchase and installation of a qualifyingsystem, up to a maximum refund of CAN$ 80 000.
In 2001, the government, through its Action Plan 2000 on Climate Change,announced an investment of CAN$ 2 million over five years to extend the voluntaryRenewable Energy Deployment Initiative (REDI) to industrial organisations.
CAN$ 25 million was earmarked in 2003 for the continuation of the REDI until2007. REDI has played an important part in developing the growing market forreliable and cost-effective renewable energy technologies, including solar waterand space heating systems, ground source heat pumps, and high-efficiency/low-emission biomass combustion systems. Funding details for future years willdepend upon the results of an independent review, the results of which areexpected in March 2004.
Policy Type Consumer grants/rebates/Voluntary programmes
RE Technology All renewables

196
PART 2: COUNTRY PROFILES
National Fuel Cell Research and Innovation Initiative
Year 1999
Policy Description In 1999, the government launched the National Fuel Cell Research andInnovation Initiative, announcing a CAN$ 30 million investment to furtherstrengthen industry’s R&D. As part of the initiative, a new National Fuel CellResearch Facility at the National Research Council’s Innovation Centre at theUniversity of British Columbia was inaugurated. Funding for the project isprovided from existing programmes.
Policy Type RD&D
RE Technology Hydrogen
Support to Geothermal Energy
Year 2000-2003
Policy Description In 2000, the government signed a three-year agreement with the GeothermalHeat Pump Consortium for the promotion of the use of geothermal energy forheating and cooling. The consortium is to develop a package of marketingservices to accelerate take-up of geothermal energy systems.
Policy Type Voluntary programmes
RE Technology Geothermal
Sustainable Development Technology Canada
Year 2000 - Present
Policy Description Sustainable Development Technology Canada (SDTC) is an arm's-lengthfoundation created under the Canada Foundation for Sustainable DevelopmentTechnology Act.
The objective of the Foundation is to stimulate the development anddemonstration of Canadian technologies related to climate change and airquality. The Foundation also acts as a catalyst for creative and collaborativesolutions designed to deliver positive environmental and economic benefits toCanadians.
Eligible recipients are partnerships that include the private sector and academicand non-governmental organisations. Eligible projects are aimed at advancingthe development and demonstration of new technologies.
Policy Type RD&D
RE Technology All renewables

CANADA
197
Green Municipal Funds
Year 2000 - Present
Policy Description In the 2000 federal budget, the government established two complementaryfunds to stimulate investment in innovative municipal infrastructure projectsand environmental practices for Canadian municipal governments and theirpublic and private sector partners. The government is providing CAN$ 250 millionto encourage projects and studies in communities. The funds leverage investmentsfrom municipal, provincial and territorial governments, and stimulate public andprivate partnerships. There are two funds: the Green Municipal Enabling Fund(GMEF) – CAN$ 50 million; and the Green Municipal Investment Fund (GMIF) –CAN$ 200 million.
GMEF provides grants for cost-shared feasibility studies to improve the qualityof air, water and soil through greater energy efficiency, the sustainable use ofrenewable and non-renewable resources and more efficient water, waste andwaste-water management.
GMIF supports the implementation of innovative environmental projects.Through GMIF, a municipal government can borrow at preferred interest rates of1.5% below the Bank of Canada bond rate. Partners are also eligible for loans atattractive rates. The Fund also provides grant funding for pilot projects withsignificant environmental impact and replication on a regional or national basis.
Policy Type Capital grants / Third-party finance
RE Technology All renewables
Market Incentive Program
Year 2001 - Present
Policy Description The purpose of this programme is to provide incentives to electricity retailers topurchase or produce electricity based on emerging renewable electricity sourcesfrom new or expanded generating capacity, or to promote the sales of electricityfrom emerging renewable energy sources. By offering financial incentives toelectricity retailers to purchase or produce electricity from emerging renewableenergy sources (ERES) from new generating capacity, this initiative aims toincrease the competitiveness of ERES to residential and small business customersunder green power programmes. The objective is to provide a short-termfinancial incentive up to 40% of the eligible costs of an approved project.
Policy Type Capital grants
RE Technology Offshore wind Onshore windSolar photovoltaicBiofuelHydro

198
PART 2: COUNTRY PROFILES
Future Fuels Initiative
Year 2001 - Present
Policy Description The Future Fuels Initiative is part of the government’s Action Plan 2000 onClimate Change. It aims to increase Canada's annual ethanol production anduse four-fold (by 750 million litres). That could mean 35% of Canada's totalgasoline supply would contain 10% ethanol. The programme is jointly deliveredby Natural Resources Canada and Agriculture and Agri-Food Canada.
The Future Fuels Initiative renews the National Biomass Ethanol Program(NBEP) to help overcome lender resistance to investing in ethanol plantsbecause of uncertainty about excise tax policy. Currently, there is an excise taxexemption on the ethanol portion of blended gasoline. The NBEP provides forCAN$ 140 million in contingent loan guarantees to encourage financing fornew plants that produce ethanol from biomass such as plant fibre, corn andother grains.
The Future Fuels Initiative also adds CAN$ 3 million over five years to providemarket information to retail consumers. It provides for activities such as publiceducation on fuel ethanol, analysis of fuel ethanol markets and producereconomics and provides a liaison with provinces/territories and industries thatare interested in ethanol plant expansion.
In 2003, the federal government announced that CAN$ 11.9 million would beinvested to support research and provide incentives for industrial-scale bio-diesel pilot plants, and support demonstrations of its effectiveness to encouragebroader use of this cleaner-burning alternative to conventional diesel.
Policy Type Excise tax exemption / Third-party finance / RD&D
RE Technology Biofuels
Federal House in Order Programme
Year 2001-2006
The government will invest a further CAN$ 50 million over five years to expandthe Federal House in Order programme, launched with an initial investment ofCAN$ 44 million in 2001. The eleven departments involved in this initiativehave already reduced emissions by 24%.
The government will take up some of the specific measures related to renewableenergy to put its own house in order include the following:
• Increasing the use of lower-emitting vehicles in the federal fleet andreducing GHG emissions from fleet operations.
• Continuing to work toward fulfilling a commitment to meet 20% of federalelectricity requirements from emerging low- or non-emitting sources.
Policy Type Government purchases

CANADA
199
RE Technology All renewables
Wind Power Production Incentive (WPPI)
Year 2002-2007
Policy Description The Canadian government launched the Wind Power Production Incentive(WPPI) in 2002. It is expected to boost the country's installed wind capacity by500% over five years. The fifteen-year, CAN$ 260 million (US$ 170 million)programme is designed to support the installation of 1 000 MW of new windpower. The WPPI is expected to leverage about CAN$ 1.5 billion (US$ 1 billion)of capital investments across the country.
The WPPI only covers about half the cost premium for wind power in Canada,which reflects a decision by the federal government to try to spur complementaryactions in the provinces. Projects commissioned between 1 April 2002 and31 March 2003 received CAN$ 0.012/kWh (US$ 0.008/kWh) for the first ten years of their operation. The incentive payment drops to CAN$ 0.010/kWh (US$ 0.0065/kWh) for projects commissioned between 1 April 2003 and31 March 2006, and then to CAN$ 0.008/kWh (US$ 0.005/kWh) for wind farmsthat begin operation during the last year of the programme, which ends31 March 2007. The programme sets aside a minimum capacity of 10 MW for eachprovince and 1 MW for each of Canada's three northern territories. To avoid thepossibility that rapid take-up in a few provinces will reduce opportunities in others,a maximum of 300 MW of qualifying capacity per province has also been set.
The WPPI rules set out a number of other criteria for qualifying projects andproducers. The minimum capacity for eligible wind projects is 500 kW, exceptin northern and remote locations, where projects as small as 20 kW are eligible.The maximum amount payable to any one producer over the course of theprogramme is CAN$ 64 million (US$ 42 million).
Policy Type Guaranteed prices/feed-in tariff
RE Technology Onshore wind
Aboriginal and Northern Communities
Year 2003-2007
Policy Description The government supports efforts by aboriginal and northern communities toimprove their energy efficiency and use alternative energy sources. The CAN$30.7 million Aboriginal and Northern Community Action Program (ANCAP) willexpand partnerships over the next four years with Aboriginal peoples andCanadians in northern regions to build an effective response to climate change,at the same time enhancing quality of life by reducing energy costs andimproving local air quality.
Through the ANCAP, the government will work with all aboriginal and northerncommunities, with particular emphasis on supporting the approximately 130

200
PART 2: COUNTRY PROFILES
remote aboriginal and northern communities that rely on diesel generation asthey work to improve their energy efficiency and adopt alternative energysources to reduce their dependence on diesel fuel.
This initiative will focus on four key areas to address climate change challengesfacing northern and aboriginal communities with action in:
• Community energy planning and management.
• Renewable energy and improved technology applications (e.g., smallhydro, wind, solar, variable generators).
• Enhanced energy efficiency of existing and new aboriginal facilities.
• Capacity building, training and tools.
The original CAN$ 3.7 million Aboriginal and Northern Climate ChangeProgramme was a successful pilot project initiated under the government’sAction Plan 2000 on Climate Change that helped aboriginal and northerncommunities participate in climate change activities.
Policy Type Consumer grants/rebates
RE Technology All renewables
Climate Change Technology and Innovation
Year 2003 - Present
Policy Description The government wants to help industry meet climate change targets, as well aslay the foundation for new, cleaner technologies and economic opportunities.The government will invest in technology and innovation with a focus on fiveareas critical to achieving climate change goals. Those areas related torenewable energy technologies include:
Hydrogen Economy: to build knowledge and accelerate the development andcommercialisation of fuel cells and other technologies that will form the basis ofthe emerging hydrogen economy, including technologies to produce hydrogenfrom renewable energy sources. Investments will be available to support publicand private sector partnerships to develop and demonstrate hydrogentechnologies and infrastructure in integrated, real-world settings. Taken together,these investments will build on Canada’s first-mover advantage internationallyand ensure it remains at the forefront of the transition to the hydrogen economy.
Decentralised Energy: development and demonstration of decentralised energyproduction systems. These systems make more efficient use of locally availableenergy resources and renewable sources such as wind, solar and landfill gas.They can be used in residential, commercial and industrial applications and incombined heat and power applications.
Biotechnology: to support the development and demonstration of bio-basedenergy systems and technologies. This covers a broad range of technologies,including biomass and waste conversions; cellulosic ethanol from biomass

CANADA
201
and other biofuels; bio-processes; biomass production, harvesting andtransportation; and energy from biomass. This investment is complemented byinvestment in biodiesel technologies.
Policy Type RD&D
RE Technology All renewables
Climate Change Action Fund –Technology Early Action Measures (TEAM)
Year 2003 - Present
Policy Description Under its climate change initiatives, the government announced severalprogrammes in support of renewable energy technology development anddemonstration. The main programme for R&D is Technology Early ActionMeasures, under the Climate Change Action Fund. The programme fundstechnology projects that promise to reduce GHG emissions, nationally orinternationally, while sustaining economic and social development. Theprogramme aims to help accelerate the demonstration and commercialdeployment of new technologies. Proposed projects must be sponsored and co-funded by government R&D programmes.
www.climatechange.gc.ca
Policy Type RD&D
RE Technology All renewables
Canadian Renewable Energy Network
Year 2003 - Present
Policy Description The Canadian Renewable Energy Network (CanREN) was created through theefforts of Natural Resources Canada and its stakeholders. Its purpose is toincrease the understanding of renewable energy to accelerate the developmentand commercialisation of renewable energy technologies.
CanREN promotes what NRCan and its partners are doing to advance the roleof renewable energy in Canadian society. It offers general information onrenewable energy sources, highlights the technologies and applications beingdeveloped to harness these sources, and presents Canadians with theknowledge and support they need to make renewable energy part of theireveryday lives.
www.canren.gc.ca
Policy Type Public awareness
RE Technology All renewables


The CzechRepublic
203

Gas
Coal
Oil
Nuclear
Renewables
Mtoe
0
10
20
30
40
50
60
1971
1973
1975
1977
1979
1981
1983
1985
1987
1989
1991
1993
1995
1997
1999
2001
Oil 19.9%
Renewables 1.5%Nuclear 9.1%
Gas 19.0%
Coal 50.5%
Figure 1. Total Primary Energy Supply by Source Figure 2. Shares of TPES 2001
Shares in Figure 2 may differ from Table 1.See Annex 2 for more detail.
204
Total Primary Energy Supply
Table 1. Total Primary Energy Supply by Source (Mtoe)*
In 2001, total primary energy supply (TPES) was 41 Mtoe, down from 47 Mtoe in 1990, an average declineof 1.1% per year. A decade of transition has modified both the energy supply and the fuel mix. Between1990 and 2001, energy production, mainly coal, decreased by 20% while energy imports increased by25%. The Czech Republic has limited domestic energy resources, mainly solid fuels, which make up halfof TPES. Coal accounts for the majority of domestic energy production. The share of coal in TPES in 2001was 51% while oil represented 20% of TPES, followed by natural gas at 19% and nuclear power at 9%.This remained largely the same in 2002, according to Czech energy officials.
In 2001, renewable energy represented 1.5% of TPES, mostly from biomass and hydropower. Data for2002 from the Czech Republic indicate that renewables accounted for 2.7% of TPES. Czech energyauthorities confirm that the renewable energy market remained static between 1990 and 1993 and
PART 2: COUNTRY PROFILES
Source 1971 1980 1990 1995 2000 2001 Imports
Coal 37.3 33.4 29.8 22.6 21.5 21.1 •
Oil 7.4 11.1 9.0 8.0 7.9 8.4 97.7%Gas 0.8 2.6 5.3 6.5 7.5 8.0 96.3%Nuclear 0.0 0.0 3.3 3.2 3.5 3.8 -Renewables 0.1 0.2 0.1 0.6 0.6 0.6 -
Biomass 0.0 0.0 0.0 0.4 0.4 0.5Hydro 0.1 0.2 0.1 0.2 0.2 0.2Geothermal 0.0 0.0 0.0 0.0 0.0 0.0Wind/Solar 0.0 0.0 0.0 0.0 0.0 0.0
Total 45.6 47.3 47.4 41.0 40.4 41.4 25.8%% Renewables 0.2% 0.4% 0.3% 1.4% 1.3% 1.5%
* See Annex 2 for explanation of components in total and definition of biomass.• Net Exporter

CZECH REPUBLIC
205
experienced little growth between 1994 and 2002. The composition of renewables in the supply mix hasremained relatively unchanged.
Electricity generation has traditionally been dominated by fossil fuels, though their share declined from82% in 1990 to 71% in 2001. Nuclear power increased its share from 7% in 1990 to 9% in 2001 and hascontinued to grow. According to Czech data for 2003, fossil fuels accounted for 67% of electricityproduction. Total production of electricity grew from 62.6 TWh in 1990 to 74.2 TWh in 2001 and hasgrown more steeply to 83.2 TWh in 2003. The renewable energy contribution to electricity generationaccounted for 3.5% of electricity production in 2001. In 2003, the renewables contribution decreased to3.1% of electricity production with 2.2% from hydropower and 0.9% from biomass.

206
In 2001, renewables represented 1.5% of TPES, mostly biomass at 72% and hydropower at 28%. Thecontribution of hydropower has remained relatively constant. Data indicate market growth for biomassand waste of about 3.4% per year between 1992 and 2001 (data not available before 1992). Primaryenergy supply from new renewables, mostly wind power, increased about 22% per year between 1998and 2003. These growing markets may be attributable to the new renewable energy programmesintroduced in 1991. The government aims to increase the share of renewable energy sources to at least5-6% of TPES and 8% of the electricity production by 2010 in an effort to converge with EU renewableenergy targets and policies.
Renewable generated electricity accounted for 3.4% of gross electricity production in 2001. Hydropowerand biomass were and continue to be the main contributors of renewable generated electricity.Hydropower accounted for almost 80% of the renewable energy contribution to electricity while biomasscomprised the remaining 20% in 2001.
Renewable Energy Supply
PART 2: COUNTRY PROFILES
Policy Timeline
Market Deployment
. Yearly State Programme
. Energy Act
. New Energy Act
. Act on Energy Management
Denotes a significant change to a policy, such as an extension, repeal or revision.
Data are not availablebefore this date.
Hydro
CombustibleRenewables
and Waste
Mtoe
0
0.1
1
0.2
0.3
0.4
0.5
0.6
0.7
0.8
0.9
1971 73
1975 77
1979 81
1983 85
1987 89
199 93
1995 97
1999 01
Figure 3. Total Renewable Energy Supply and Policy Timeline

CZECH REPUBLIC
207
Research and Development TrendsThe National Research & Development Programme provides funding for projects selected from all sectorsof the national economy. Although there is no special budget for energy projects, the programme’spriorities include nuclear safety, the use of coal and renewable energy sources and energy efficiency. Thetotal amount spent on research and development in the area of renewable energy is not known, but it isestimated to have been used largely for demonstration projects.
Market Deployment TrendsThe Czech government’s market deployment efforts to promote the use of renewable energy rely on theState Programme to Support Energy Saving and Use of Renewable Sources of 1991, which offersinvestment incentives and excise and sales tax exemptions. In 2001, in the context of the Kyoto protocoland EU accession, the Czech Republic expanded their market deployment efforts to include technology-differentiated feed-in tariffs, tax incentives and direct investment incentives.
A number of factors have restricted the growth of the renewable energy market in the Czech Republic,which, if not addressed, may impede the achievement of the renewable energy objectives. Insufficientfinancial and human resources at the Czech Energy Agency have limited the effective implementation ofrenewable energy programmes. The current over-capacity of some 15 500 GWh in electricity supplyprovides little or no incentive for either energy conservation or new generation from renewables. Themarket dominance of Ceské Energeticke Zavody (CEZ), the primary power utility, impedes growth of therenewable electricity and heat market and hinders the entrance of new power producers. In 2001 CEZowned almost two-thirds of the total installed capacity in Hungary.
The State Programme to Support Energy Saving and Use was the first and only programme during the1990s to promote renewable energy production. The programme is renewed annually and currentlysupports the following incentives:
● Obligation for distribution companies to purchase electricity and heat generated from renewablesbased on regulated buy-back tariffs.
● Exemption from excise taxes for biodiesel fuel (methanol from rape seed).
● Reduced import duties on renewable energy equipment.
● Five-year tax relief (income and property) for investment in renewables (including small hydro< 1 MW).
● Reduced VAT rate (5% instead of 22%) for small facilities (hydropower: 0.1 MW, wind: 0.075 MW,and all solar and biomass units).
● Exemption from property tax for five years for the conversion of building heating systems from solidfuel to renewable energy.
● Reduced VAT rate of 5% paid by final consumers of biomass heat from a district heating system.
● Direct investment incentives for non-profit organisations, municipalities and individual end-users.
Support for renewable energy projects was provided as grants. Between 1991 and 2001, CZK 365 millionsupported 603 renewable energy projects, most of which were small hydropower projects.
Although data suggest that the biomass market was favourably influenced by the incentives and buy-backtariffs set out in the State Programme and the Energy Act, the overall renewable energy market exhibited

208
little growth in the 1990s. The annual renewal and adjustment of the incentive levels created uncertaintyat a time when predictability was vital for the growth of renewables in the energy market.
To strengthen efforts to promote renewables, the Energy Act of 1994 made purchases of electricity fromrenewable and secondary sources of energy technically feasible. Growth of the biomass market occurredafter the passage of both the Annual State Programme and the 1994 Energy Act.
Little activity in the renewables market and the intent to converge with EU policies, brought forth a morecomprehensive and integrated approach to encourage the use of renewables. The New Energy Act (2001)defined a framework for the liberalisation of the electricity and gas markets based on EU principles. It setout as goals, energy efficiency and the reduction of negative impacts of energy production on theenvironment in conjunction with a reorganisation of the energy sector via deregulation of prices,privatisation and liberalisation. Full liberalisation of the market is scheduled for 2006 and is expected tosignificantly change the policy framework for renewable energy.
The New Energy Act also stipulated the creation of the Energy Regulation Office (ERO), which defines theconditions for the obligatory purchase of electricity and heat from renewables and CHP. The EROestablishes feed-in tariffs for renewables, which are renewed annually and adjusted for inflation andrenewable technology development. These feed-in tariffs are a reflection of the Czech Republic’s efforts toact in accordance with EU discussions on the future of fixed feed-in tariffs as the primary instrument forthe promotion of renewable electricity production. Feed-in tariffs in January 2004 were: biomass - CZK2.40/kWh (if co-fired CZK 2.00); wind - CZK 2.70/kWh; small hydro - CZK 1.50/kWh; and solar PV - CZK6.00/kWh.
The Act on Energy Management (2001) was responsible for the creation of energy efficiency standards forheat and electricity production. This was done through the elaboration of the National Programme forEnergy Efficiency and the Use of Renewable and Secondary Energy Sources, the formulation of a StateEnergy Policy and regional policies for renewables. The National Programme document definesgovernment objectives for energy conservation and the use of renewable and secondary energy sourcesand is reassessed every two years.
This State Energy Policy, a strategic document with a long-term outlook, was approved in March 2004. Itsets out future scenarios of energy sector development to 2030 to include:
● The share of imports in TPES will grow from 30% to a maximum of 60%.
● A reduction of energy intensity of GDP by 3% - 3.5% annually.
● The share of renewable energy is to be 5-6% in 2010 and 15-16% in 2020.
Regional energy plans for all fourteen regions and towns, as mandated by the 2001 Act on EnergyManagement, are to include provisions for voluntary regional energy plans for smaller regions and towns.These regional plans are required to incorporate the goals and actions of the State Energy Policy. The Actalso obliged regional energy plans to evaluate the use of renewables in each respective area. The contentof and methodology for the preparation of regional energy plans are described in the governmentregulation.
Within the context of the Kyoto Protocol and accession to the EU, the Czech government committed toexpand the use of renewable energy. The Czech Republic ratified the Protocol and adopted a new climatechange strategy in October 2001. In 2002, a new Clean Air Act was adopted to harmonise and transposethe relevant acquis communautaire prior to EU accession into Czech legislation. The government set up
PART 2: COUNTRY PROFILES

CZECH REPUBLIC
209
the necessary conditions for the implementation of the flexibility mechanisms of the Kyoto Protocol. It hasapproved several projects, including a Joint Implementation (JI) project with the Netherlands on districtheating systems using biomass and four projects with the Prototype Carbon Fund (PCF). (JI projects offeremission reduction credits to the donor country for financing projects in other countries under the KyotoProtocol.)
In November 2003, the Czech Government approved the Act on the Promotion of Electricity and HeatEnergy Produced from Renewable Energy Sources, which is in the Parliamentary approval process. The Actcurrently sets a target of 8% of electricity consumption by 2010 from renewables, to be achieved primarilythrough increases in biomass, hydropower and wind energy as indicated in Table 2.
Support for renewables from this Act is based on higher feed-in tariffs to be paid by distributors and CEPS(the national transmission company) for electricity and heat generated from renewables. These tariffs areto continue until 2006 to coincide with the full opening of the Czech electricity market.
Starting in 2006, only small producers with a capacity less than 200 kW and photovoltaic installationswill be able to benefit from feed-in tariffs and guaranteed sales. Electricity from other renewable sourceswill be sold at market price, but will also have the right to sell green certificates issued at regulated prices.ERO will set an annual quota for the purchase of green certificates for selected suppliers of electricity.Green certificate prices will differ according to the type of renewable sources used for generation.Suppliers who fail to meet the quota from their own purchases can buy certificates on the market or facepenalties equal to three times the amount of the yearly unfulfilled quota. The draft of the new lawguarantees investors in renewables to recover initial costs and make a basic profit within fifteen years.
Intermittency
Intermittency is not a current issue for the Czech power system as there is a negligible amount ofintermittent generated electricity. Some problems could arise as potential wind farms reach capacity ofseveral hundreds of MWs. The Czech government expects the individual investor to negotiate with theappropriate provider of reserve capacity and other auxiliary services to provide back-up for theintermittent conditions. The 2004 Act on the Support for Electricity and Heat (passed in 2003) includes aprovision obliging the ERO to estimate and include the cost of intermittency in the feed-in tariff and greencertificate prices within the framework of the obligatory purchase of electricity from renewables.
Type of renewable 2000 (GWh) 2010 (GWh)
Wind 1 160.6 930Small Hydro (> 10 MW) 1 826.6 1 120Hydro (< 10 MW) 1 165.6 1 165Biomass 1 165.9 2 200Geothermal 1 160.6 15Photovoltaic 1 160.6 15Total 1 998.6 5 445
Source: Ministry of Industry and Trade-Czech Republic (2004).
Table 2. Contribution of Renewables to Electricity Consumption, 2000 and 2010

210
Distributed Generation
Czech energy legislation has a provision for priority grid connection for electricity generated fromrenewables. No special provisions have been made to counter the high cost of connection, whichis uniform for generators of all types. The ERO is required to include the cost of connection within thefeed-in tariff and green certificate prices.
Public Awareness
Public awareness of renewable energy issues is low. Consumers have little involvement in choosingenergy suppliers and energy sources. The increase of electricity tariffs for consumers related to renewableenergy sources at present is negligible (less than one percent). So far, the plan for wider use of greenelectricity has encountered no public opposition. If increased use of renewables for electricity drives upconsumer prices by 10%, which is expected to occur within the next five years, some authorities areconcerned that it could cause financial difficulties for low-income families. The Czech governmentanticipates that serious analysis and perhaps some type of social compensation will be needed.
PART 2: COUNTRY PROFILES
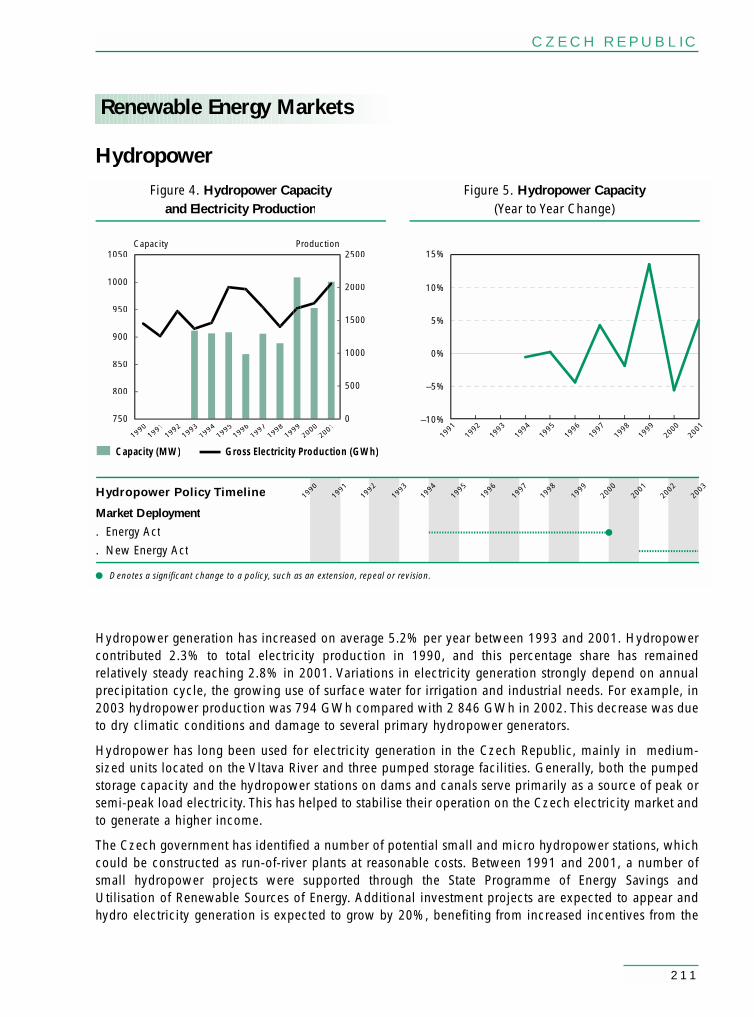
CZECH REPUBLIC
211
993
199
1994
1995
1996
1997
1998
1999
2000
2001
2002
200399
119
919
9992
199990
1993
1994
1995
1996
1997
1998
1999
2000
2001
–5%
0%
5%
10%
15%
Capacity (MW) Gross Electricity Production (GWh)
–10%
Hydropower Policy Timeline
Market Deployment
. Energy Act
. New Energy Act
Denotes a significant change to a policy, such as an extension, repeal or revision.
1991
1992
750
800
850
900
950
1000
1050
19901991
19921993
19941995
19961997
19981999
20002001
Capacity
0
500
1000
1500
2000
2500Production
Figure 4. Hydropower Capacityand Electricity Production
Figure 5. Hydropower Capacity(Year to Year Change)
Hydropower
Hydropower generation has increased on average 5.2% per year between 1993 and 2001. Hydropowercontributed 2.3% to total electricity production in 1990, and this percentage share has remainedrelatively steady reaching 2.8% in 2001. Variations in electricity generation strongly depend on annualprecipitation cycle, the growing use of surface water for irrigation and industrial needs. For example, in2003 hydropower production was 794 GWh compared with 2 846 GWh in 2002. This decrease was dueto dry climatic conditions and damage to several primary hydropower generators.
Hydropower has long been used for electricity generation in the Czech Republic, mainly in medium-sized units located on the Vltava River and three pumped storage facilities. Generally, both the pumpedstorage capacity and the hydropower stations on dams and canals serve primarily as a source of peak orsemi-peak load electricity. This has helped to stabilise their operation on the Czech electricity market andto generate a higher income.
The Czech government has identified a number of potential small and micro hydropower stations, whichcould be constructed as run-of-river plants at reasonable costs. Between 1991 and 2001, a number ofsmall hydropower projects were supported through the State Programme of Energy Savings andUtilisation of Renewable Sources of Energy. Additional investment projects are expected to appear andhydro electricity generation is expected to grow by 20%, benefiting from increased incentives from the
Renewable Energy Markets
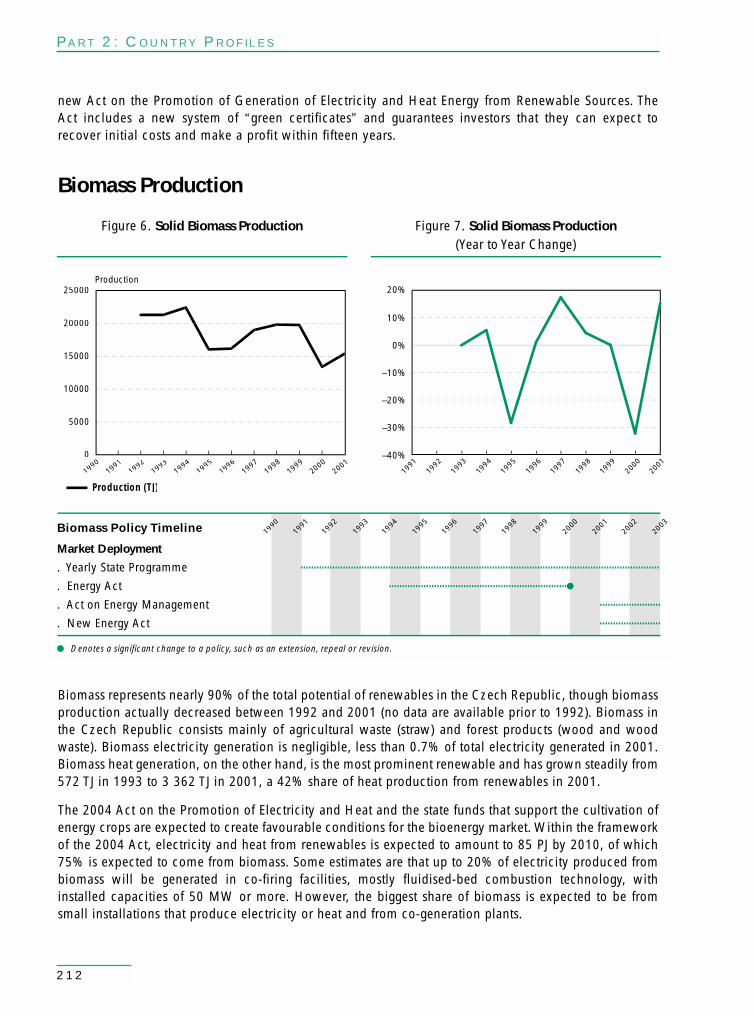
212
new Act on the Promotion of Generation of Electricity and Heat Energy from Renewable Sources. TheAct includes a new system of “green certificates” and guarantees investors that they can expect torecover initial costs and make a profit within fifteen years.
Biomass Production
Biomass represents nearly 90% of the total potential of renewables in the Czech Republic, though biomassproduction actually decreased between 1992 and 2001 (no data are available prior to 1992). Biomass inthe Czech Republic consists mainly of agricultural waste (straw) and forest products (wood and woodwaste). Biomass electricity generation is negligible, less than 0.7% of total electricity generated in 2001.Biomass heat generation, on the other hand, is the most prominent renewable and has grown steadily from572 TJ in 1993 to 3 362 TJ in 2001, a 42% share of heat production from renewables in 2001.
The 2004 Act on the Promotion of Electricity and Heat and the state funds that support the cultivation ofenergy crops are expected to create favourable conditions for the bioenergy market. Within the frameworkof the 2004 Act, electricity and heat from renewables is expected to amount to 85 PJ by 2010, of which75% is expected to come from biomass. Some estimates are that up to 20% of electricity produced frombiomass will be generated in co-firing facilities, mostly fluidised-bed combustion technology, withinstalled capacities of 50 MW or more. However, the biggest share of biomass is expected to be fromsmall installations that produce electricity or heat and from co-generation plants.
PART 2: COUNTRY PROFILES
1993
1994
1995
1996
1997
1998
1999
2000
2001
2002
2003
1991
1992
199990
1993
1994
1995
1996
1997
1998
1999
2000
2001
–30%
–20%
–10%
0%
10%
20%
Production (TJ)
–40%
Biomass Policy Timeline
Market Deployment
. Yearly State Programme
. Energy Act
. Act on Energy Management
. New Energy Act
Denotes a significant change to a policy, such as an extension, repeal or revision.
1991
1992
0
5000
10000
15000
20000
25000
19911990
Production
19921993
19941995
19961997
19981999
20002001
Figure 6. Solid Biomass Production Figure 7. Solid Biomass Production(Year to Year Change)

CZECH REPUBLIC
213
Solid biomass and biogas are expected to be used primarily for electricity and heat generation while mostliquid bio-fuels are to be used as automotive fuel. Relatively good conditions exist for the cultivation ofquick growing “energy” crops in the Czech Republic especially on fields that are not well-suited to thecultivation of corn relative to other EU countries with more favourable agricultural conditions. An increasein bioenergy farming is viewed as offering energy and environmental advantages and opportunities toameliorate unemployment problems in the agricultural sector.
Wind Power
Wind power installed capacity in 1998 was 1.2 MW. IEA data for wind power electricity generation in theCzech Republic is incomplete. According to Czech authorities, wind power had a total installed capacityof 5.6 MW in 2002 and 10.63 MW in 2003, and electricity generation from wind increased from 0.1 GWhin 1998 to 3.9 GWh in 2003.
The Czech Republic does not have particularly favourable conditions for wind power generating facilities.Only individual wind turbines have been and are likely to be installed. Potential exists for the constructionof wind farms in mountainous areas, such as Krusne hory, Jeseniky a Zdárské vrchy. Grid connectioncosts for these sites would be high. As well, these mountainous areas have been subject to much publicopposition against development from local inhabitants and environmental protection legislation.
The new Act on the Promotion of Electricity and Heat Energy from Renewable Energy Sources addresses mostof the barriers to wind power development and is expected to create a favourable environment for investors. Inenergy balance scenarios used for the preparation of new State Energy Policy, it is estimated that wind powercapacity could reach 1 000 MW with an economic potential of 1 200 MW. The State Energy Policy (2004)targets the wind power market and expects electricity production from wind power to reach 1.44 TWh in 2030.
Capacity
0
1.2
0.2
0.4
0.6
0.8
1
Figure 8. Wind Power Capacity
Capacity (MW)
2001
2000
1999
1998
1997
1996
1995
1994
1993
1992
1991
1990
993
199
199994
995
199
199996
997
199
199998
999
199
200000
001
200
200002
003
20099
119
919
9992
199990Wind Power Policy Timeline
Market Deployment
. Act on Energy Management
. Energy Act
Denotes a significant change to a policy, such as an extension, repeal or revision.

214
PART 2: COUNTRY PROFILES
Czech Republic Policy Chronology
State Programme to Support Energy Savings and Useof Renewable and Secondary Sources
Year 1991 – Present
Policy Description The State Programme to Support Energy Saving and Use of Renewable andSecondary Sources set up by the Ministry of Industry and Trade in co-operationwith other ministries was established in 1991. It is revised each year. Theprogramme for 2000 included energy-saving measures in production,distribution and consumption of energy; wider use of renewable and secondarysources of energy; development of co-generation of heat and electricity;counselling; implementation of low-energy technologies; and educational andpromotional activities. The programme is executed by the Czech Energy Agency(CEA) and other ministries. The State Environment Fund is an importantparticipant.
Currently it provides the following incentives for renewables:
• Obligation for distribution companies to purchase electricity and heatgenerated from renewables based on regulated buy-back tariffs.
• Exemption from excise taxes for biodiesel fuel (methanol from rape seed).• Reduced import duties on renewable energy equipment.• Five-year tax relief (income and property) for investment in renewables
(small hydropower plants restricted to capacities > 1 MW).• Reduced VAT rate (5% instead of 22%) for small facilities (hydropower:
0.1 MW; wind: 0.075 MW; and all solar and biomass units).• Exemption from property tax for five years for the conversion of building
heating systems from solid fuel to renewable energy.• Reduced VAT rate of 5% paid by final consumers of biomass heat, provided
that it is a part of district heating system.• Direct investment incentives for non-profits, municipalities and individual
end-users.
Policy Type Obligations / Guaranteed prices/feed-in tariffs / Excise tax exemption / Taxexemptions / Sales taxes / Property tax exemptions / Consumer grants/rebates
RE Technology All renewables
Energy Act
Year 1994-2000
Policy Description According to the Energy Act (222/1994 Coll.), the supplier (distributioncompany) was obliged, if possible from a technical point of view, to purchaseelectrical energy produced from renewable and secondary sources of energy.
Policy Type Net metering

CZECH REPUBLIC
215
RE Technology All renewables
Energy Management Act Year 2001 - Present
Policy Description The Energy Management Act (Act No. 406/2000), which entered into force inJanuary 2001, established standards for energy efficiency of heat and electricityproduction, transmission, distribution and use, energy planning requirements,and energy auditing obligations.
It also set out the obligation to formulate a “National Energy Policy,” a strategicdocument with a twenty-year outlook to express the goals of the state in energymanagement in accordance with economic and social development needs andprotection of the environment. It stipulates the preparation of a “NationalProgramme for Energy Efficiency and Use of Renewable and Waste EnergySources”. Amendments are expected in 2005.
The Act also stipulates mandatory regional energy plans for all fourteen regionsand for fourteen towns.
Policy Type General energy policy
RE Technology All renewables
Energy Management Act - AuditsYear 2001
Policy Description The Energy Management Act aims to introduce obligatory energy audits inbuildings and production sites. The secondary legislation on audits is morespecifically the Decree of the Ministry of Industry and Trade N°. 213/2001/Sb.,which contains details related to energy auditing. All private facilities with anannual energy consumption of 35 TJ or more are obliged to hire a state-approved auditor to prepare the facility’s energy audit every eight years. Thesame holds for public facilities with an annual energy consumption of 1.5 TJper year or more.
Policy Type Regulatory and administrative rules
RE Technology All renewables
New Energy ActYear 2001
Policy Description The Energy Act, which came into force in January 2001, sets out conditionsfor business activities and state administration and regulations in energy sub-sectors, such as electricity, gas and heat, as well as the rights and obligationsof individuals. It defines a framework for the liberalisation of the electricity andgas markets and supports the use of renewable energy sources and CHP. Itdefines conditions for the obligatory purchase of electricity and heat produced
216
PART 2: COUNTRY PROFILES
from renewables and from CHP. The Energy Act also includes the creation ofthe Energy Regulation Office.
Since 2003 electricity consumers with an annual consumption of more than9 GWh have the right to choose their supplier. This threshold will gradually belowered. Full liberalisation of the market is scheduled for 2006. Access to thenetworks by generators was liberalised in 2003. Generators of electricity fromCHP and from renewable sources have the right to sell their electricity to thelocal distributor. The introduction of competition to the natural gas market willstart in 2005. Substantial amendments of the Energy Act are expected in 2004.
Policy Type Obligations
RE Technology All renewables
Secondary Legislation on the Methodology for the Purchase of Electricity from Renewables and CHP
Year 2001
Policy Description This Ministerial Decree (No. 252/2001 Coll.) pertains to the purchase ofelectricity produced from renewable energy sources and combined heat andpower (CHP) generation. The decree provides the framework for theadministration of power and pricing and tariffs for electricity from renewableand CHP sources.
Policy Type Guaranteed prices/feed-in tariffs
RE Technology All renewables
National Programme for Economical EnergyManagement and Use of Renewable and SecondaryEnergy Resources
Year 2002-2005
Policy Description The “National Programme” defines objectives for energy conservation and theuse of renewable and secondary energy sources. It complies with economicand social requirements according to the principle of sustainable developmentand the protection of the environment, and is based on national energy andenvironmental policies. The most important objectives include a target forrenewable energies of 2.9% of energy consumption by 2005, and a reductionin energy intensity. The priority is to promote renewable energy sources andenergy-saving projects. Instruments to achieve targets include subsidies fromthe state budget. The next programme is being prepared and will be valid for2006 to 2009.
Policy Type Obligations
RE Technology All renewables

CZECH REPUBLIC
217
Act on the Promotion of Electricity and Heat EnergyProduced from Renewable Energy Sources
Year 2004
Policy Description In November 2003, the Czech Government approved the Act on the Promotionfor Electricity and Heat Energy Produced from Renewable Energy Sources,which is currently in the Parliamentary approval process. The Act includes anindicative target of an 8% share from renewables in electricity consumption by2010. Support for renewables is based on higher and differentiated feed-intariffs paid by distributors and CEPS (transmission company) for electricity andheat generated from renewables. It will continue until the full opening of theCzech electricity market in 2006.
Starting in 2006, only small producers with capacity less than 200 kW andphotovoltaic installations will have the right to benefit from feed-in tariffs and theobligatory purchase of their electricity. Electricity from other renewable sourceswill be sold at market price, but will have the right to sell the green certificates.Selected electricity suppliers will be given a yearly quota for purchases of greencertificates with regulated prices set by the Energy Regulation Office (ERO). EROwill also set differentiated prices for the certificates according to the type ofrenewable used for generation. Suppliers who fail to meet the quota from theirown purchases can buy certificates on the open market or face penalties whichare equal to three times the amount of the yearly unfulfilled quota. The draft ofthe new law guarantees that after the law comes into effect, all investors inrenewables will recover their initial costs and make a basic profit within fifteenyears. This policy is expected to be promulgated in mid-2004.
Policy Type Obligations / Guaranteed prices/feed-in tariffs / Tradable certificates
RE Technology All renewables
State Energy Policy
Year 2004
Policy Description The new State Energy Policy approved by the Government in March 2004 hasas one of its highest priorities the increased use of renewables and it setsmeasures to promote this aim. The State Energy Policy set targets of 15-16%contribution to TPES from renewables sources to be achieved by 2030 and 17%for the share of renewables in electricity consumption. The Policy envisions thatbiomass will play the most important role in the growth of renewables.It contains incentives and measures to be used for the promotion of renewablesas described in the legal and policy acts above.
Policy Type Obligations
RE Technology All renewables

Denmark
219

Gas
Coal
Oil
Renewables
Mtoe
0
5
10
15
20
25
30
1971
1973
1975
1977
1979
1981
1983
1985
1987
1989
1991
1993
1995
1997
1999
2001
Gas23.3%
Coal 21.2%
Renewables 10.4%
Oil 45.1%
Figure 1. Total Primary Energy Supply by Source Figure 2. Shares of TPES 2001
Shares in Figure 2 may differ from Table 1.See Annex 2 for more detail.
220
Total Primary Energy Supply
Table 1. Total Primary Energy Supply by Source (Mtoe)*
With the exception of imported coal supplies, Denmark has been self-sufficient in its overall energysupply since 1997, primarily due to production of oil and gas in the North Sea. Danish production of oil,natural gas and renewable energy in 2001 was about 37% higher than its total energy consumption,making it a net energy exporter. It is expected that total Danish energy production will be up to 50% morethan consumption in the years to come.
Oil accounted for 44% of TPES in 2001 (Table 1), more than half of which was used for transport. Naturalgas was 23% of primary energy demand in 2001, its share having more than doubled over the pastdecade. Coal is the only major energy resource that is imported. The share of heat in total finalconsumption is high and district heating networks cover most of the densely populated areas. About2.4 Mtoe of district heat was delivered to Danish households and businesses in 2001, one of the highest
PART 2: COUNTRY PROFILES
Source 1970 1980 1990 1995 2000 2001 Imports
Coal 2.2 5.9 6.1 6.5 4.0 4.2 96.7%Oil 18.1 13.4 7.9 8.9 8.7 8.7 •Gas 0.0 0.0 1.8 3.2 4.4 4.6 •Nuclear 0.0 0.0 0.0 0.0 0.0 0.0Renewables 0.3 0.6 1.1 1.5 2.0 2.1
Biomass 0.3 0.6 1.1 1.3 1.5 1.7Hydro 0.0 0.0 0.0 0.0 0.0 0.0Geothermal 0.0 0.0 0.0 0.0 0.0 0.0Wind/Solar 0.0 0.0 0.1 0.2 0.5 0.5
Total 20.3 19.8 17.6 20.1 19.4 19.8 •% Renewables 1.6% 3.0% 6.6% 7.1% 9.9% 10.4%
* See Annex 2 for explanation of components in total and definition of biomass.• Net Exporter

DENMARK
221
amounts in the world. A large and increasing portion of the district heat is produced throughCHP production, with some 20% of it based on biomass and waste.
Renewable energy sources increased from 1.1 Mtoe in 1990 to 2.1 Mtoe in 2001. As a share of TPES thisrepresents an increase from 6.6% to 10.4% of Denmark’s primary energy supply. Biomass and wind powermake the largest contribution to total renewable supply.
Electricity generation in Denmark is mainly based on coal and gas, which together accounted for 72% oftotal generation in 2001. Denmark opted in 1983 not to use nuclear power for electricity generation.Renewable energy represented 16% of total electricity generation in 2001, mostly from wind andbiomass.

222
PART 2: COUNTRY PROFILES
Policy Timeline
Research and Development
. Energy Research Programme
Market Deployment
. Investment Grants
. Feed-in Tariffs
. Grid Access
. Capital Grants
. Demonstration Offshore Wind
. Biomass Agreement
Energy Policy Context
. Electricity Supply Act & Reform Agreement (obligation)
. Energy and Environment Taxation
Denotes a significant change to a policy, such as an extension, repeal or revision.
Mtoe
0
0.5
2.5
1
1.5
2
1971 73
1975 77
1979 81
1983 85
1987 89
199 93
1995 97
1999 01
Figure 3. Total Renewable Energy Supply and Policy Timeline
CombustibleRenewables
and Waste
Solarand Wind
Renewable Energy Supply
Biomass makes the largest contribution to total renewable supply, about 78.1%. In 2001, biomassproduction was 40 579 TJ and gross electricity generation from biomass was 571 GWh. Denmark hadnearly 2.6 GW of wind turbine capacity installed by 2001, and wind generation corresponded to 66.7%of total electricity generation based on renewables. Municipal solid waste capacity was 242 MW and solidbiomass capacity was 133 MW in 2001.

DENMARK
223
Research and Development Trends
The Danish Government spent a total of US$ 890 million (2002 prices and exchange rates) on energy RD&Dbetween 1975 and 2002. In this period, 33.3% of its total RD&D budget was allocated to renewable energyRD&D. The overall trend of government RD&D expenditures for renewables increased significantly from1989 and retained a fairly stable level from 1991 to 2002 when RD&D spending declined notably reflectingthe priority changes of the new government. However, government funds for RD&D increased again in 2004.In addition, funds from the Public Service Obligation, which are not considered government funds, recentlyhave been applied to renewables RD&D, for example in several large biomass demonstration projects.
Capacity (MW)
0
3500
500
1000
1500
2000
2500
3000
Figure 4. Net Generating Capacity of Renewable and Waste Products
Wind
Other Biogas
MunicipalSolid Wastes
Wood/Wood Wastes/
Other Solid Wastes
1990
1995
1996
1997
1998
1999
2000
2001
Note: A change in data collection methods at the IEA occurred in 1999 with the separation of net generating capacity between small and large hydro.Capacity data for small hydro are not available prior to 1999.
Million US$ (2002 prices and exchange rates)
0
70
10
20
30
40
50
60
Figure 5. Denmark – Government Energy RD&D Budgets*
1976
1978
1980
1982
1984
1986
1988
1990
1992
1994
1996
1998
2000
2002
Total OtherTech./Research
TotalConservation
Total Power& Storage Tech.
Total NuclearFission/Fusion
Total RenewableEnergy
Total FossilFuels
* Data not available for 1988.
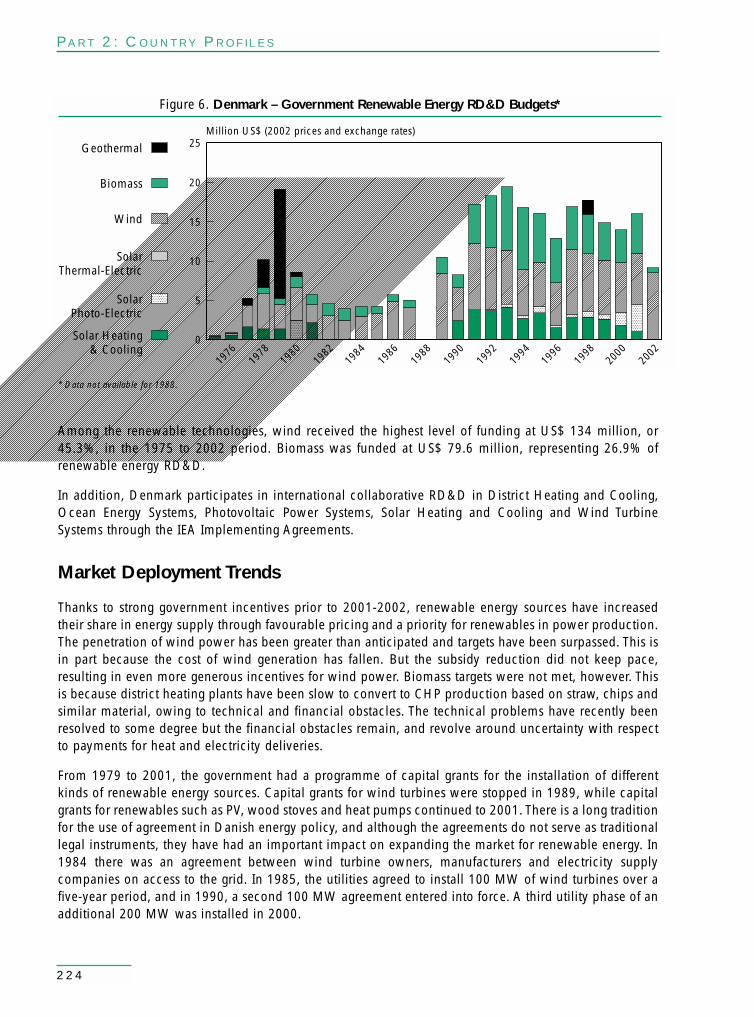
224
Among the renewable technologies, wind received the highest level of funding at US$ 134 million, or45.3%, in the 1975 to 2002 period. Biomass was funded at US$ 79.6 million, representing 26.9% ofrenewable energy RD&D.
In addition, Denmark participates in international collaborative RD&D in District Heating and Cooling,Ocean Energy Systems, Photovoltaic Power Systems, Solar Heating and Cooling and Wind TurbineSystems through the IEA Implementing Agreements.
Market Deployment Trends
Thanks to strong government incentives prior to 2001-2002, renewable energy sources have increasedtheir share in energy supply through favourable pricing and a priority for renewables in power production.The penetration of wind power has been greater than anticipated and targets have been surpassed. This isin part because the cost of wind generation has fallen. But the subsidy reduction did not keep pace,resulting in even more generous incentives for wind power. Biomass targets were not met, however. Thisis because district heating plants have been slow to convert to CHP production based on straw, chips andsimilar material, owing to technical and financial obstacles. The technical problems have recently beenresolved to some degree but the financial obstacles remain, and revolve around uncertainty with respectto payments for heat and electricity deliveries.
From 1979 to 2001, the government had a programme of capital grants for the installation of differentkinds of renewable energy sources. Capital grants for wind turbines were stopped in 1989, while capitalgrants for renewables such as PV, wood stoves and heat pumps continued to 2001. There is a long traditionfor the use of agreement in Danish energy policy, and although the agreements do not serve as traditionallegal instruments, they have had an important impact on expanding the market for renewable energy. In1984 there was an agreement between wind turbine owners, manufacturers and electricity supplycompanies on access to the grid. In 1985, the utilities agreed to install 100 MW of wind turbines over afive-year period, and in 1990, a second 100 MW agreement entered into force. A third utility phase of anadditional 200 MW was installed in 2000.
PART 2: COUNTRY PROFILES
Million US$ (2002 prices and exchange rates)
0
25
5
10
15
20
Figure 6. Denmark – Government Renewable Energy RD&D Budgets*
SolarThermal-Electric
SolarPhoto-Electric
Solar Heating& Cooling
Geothermal
Biomass
Wind
1976
1978
1980
1982
1984
1986
1988
1990
1992
1994
1996
1998
2000
2002
* Data not available for 1988.

DENMARK
225
Investment incentives for some renewable energy technologies followed from the Act on Utilisation ofRenewable Energy Sources. The incentives varied between 15% and 30% of the construction costs forstandardised renewable energy equipment and up to 50% for development projects. For standardequipment, subsidies were up to 30% of eligible costs for biomass gas plants and 16% for biomassinstallations. The maximum grant was DKK 1 million. All investment subsidies were terminated in 2002.
In 1992 the purchasing agreements were cancelled and since then, the utilities have been obliged by lawto pay wind turbine owners a kWh price of 85% of the electricity price for household consumers,excluding charges and with a deduction for administrative costs. In addition, there was a public subsidyfor electricity production from private wind turbines of DKK 0.17 + 0.10/kWh. As a result, in 1998, theaverage selling price of electricity from private wind turbines was about DKK 0.58/kWh.
The Electricity Act 1996 broadened the tariffs to cover geothermal, tidal, biogas, hydro, biomass and solarPV technologies. Utilities had to give priority access to renewable sources and to pay a favourable buy-back rate. This system was changed in 2001 and new tariffs were adopted.
Energy Policy Context
The Electricity Reform Act 1999 established the role of renewable energy sources under the liberalisedelectricity market. It was agreed that a market-based mechanism would be introduced for trade inrenewable energy and a market would be developed for green certificates. The reform changed theexisting fixed tariff scheme. Under the new system, a minimum fixed price of DKK 0.33 was guaranteedfor renewable electricity. Green certificates were planned to be issued to producers of electricity andconsumers would be required to buy 20% of their electricity from renewable energy suppliers. The marketprice for certificates was to be fixed between DKK 0.10 and 0.27/kWh. If consumers did not fulfil theirpurchase commitments, they would have to pay DKK 0.27 for each kWh for which they did not purchaserenewable energy certificates. These funds were to be placed in a renewable energy fund, the purpose ofwhich was to buy renewable energy certificates from producers.
In 2001, a new government was elected, and overall priorities for energy policy have changed. The energyand environmental ministries were separated. Energy policy now focuses more on economic efficiency,market-based solutions and international approaches to environmental issues. Under the new politicalsystem, the green certificate market and its future will be reconsidered in the context of electricity reform.The market for green electricity was scheduled to start in 2003, but is now on hold, perhaps until aEuropean trading scheme is in place. Until a decision is taken on the green certificate market, the pricefor electricity from renewables is the market price plus an environmental bonus.
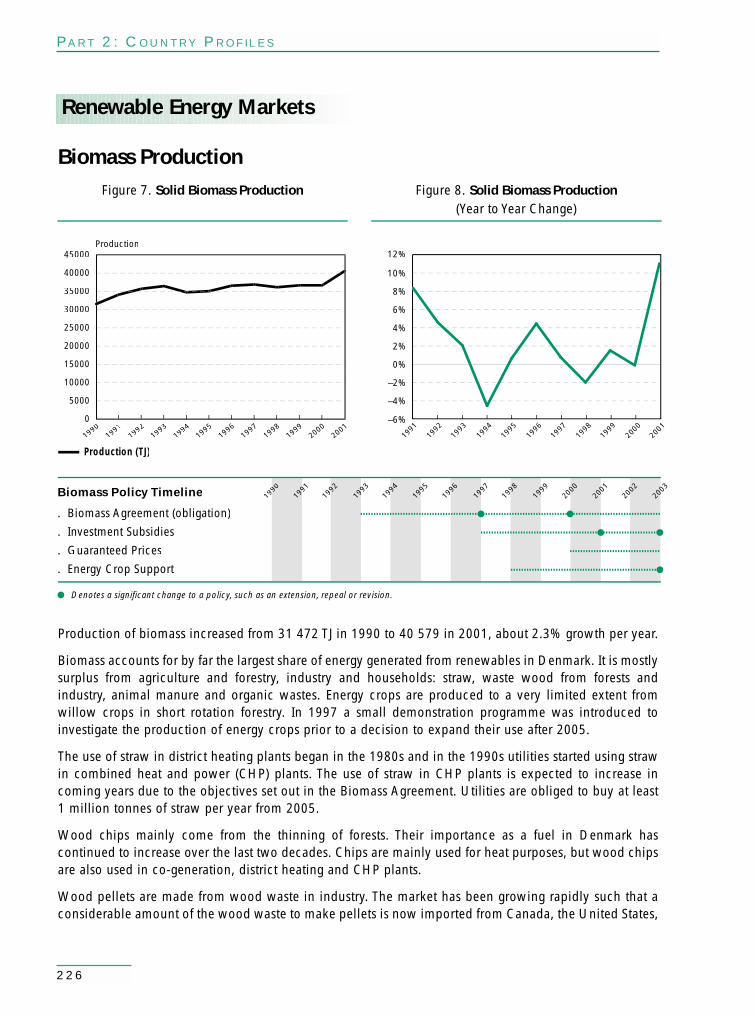
226
PART 2: COUNTRY PROFILES
1993
1994
1995
1996
1997
1998
1999
2000
2001
2002
2003
1991
1992
199990
1994
1995
1996
1997
1998
1999
2000
2001
–4%
–2%
0%
2%
4%
6%
8%
10%
12%
Production (TJ)
–6%
Biomass Policy Timeline
. Biomass Agreement (obligation)
. Investment Subsidies
. Guaranteed Prices
. Energy Crop Support
Denotes a significant change to a policy, such as an extension, repeal or revision.
1991
1992
1993
0
5000
10000
15000
20000
25000
30000
35000
40000
45000
1990
Production
19911992
19931994
19951996
19971998
19992000
2001
Figure 7. Solid Biomass Production Figure 8. Solid Biomass Production(Year to Year Change)
Renewable Energy Markets
Biomass Production
Production of biomass increased from 31 472 TJ in 1990 to 40 579 in 2001, about 2.3% growth per year.
Biomass accounts for by far the largest share of energy generated from renewables in Denmark. It is mostlysurplus from agriculture and forestry, industry and households: straw, waste wood from forests andindustry, animal manure and organic wastes. Energy crops are produced to a very limited extent fromwillow crops in short rotation forestry. In 1997 a small demonstration programme was introduced toinvestigate the production of energy crops prior to a decision to expand their use after 2005.
The use of straw in district heating plants began in the 1980s and in the 1990s utilities started using strawin combined heat and power (CHP) plants. The use of straw in CHP plants is expected to increase incoming years due to the objectives set out in the Biomass Agreement. Utilities are obliged to buy at least1 million tonnes of straw per year from 2005.
Wood chips mainly come from the thinning of forests. Their importance as a fuel in Denmark hascontinued to increase over the last two decades. Chips are mainly used for heat purposes, but wood chipsare also used in co-generation, district heating and CHP plants.
Wood pellets are made from wood waste in industry. The market has been growing rapidly such that aconsiderable amount of the wood waste to make pellets is now imported from Canada, the United States,

DENMARK
227
Sweden and the Baltics. Incentives have been offered since 1995 with a decline in the subsidy amountas objectives were achieved. Pellets are burned in small boilers, small district heating systems and a fewCHP plants.
Biomass Electricity Production
993
199
1994
1995
1996
1997
1998
1999
2000
2001
2002
200399
119
919
9992
199990
1993
1994
1995
1996
1997
1998
1999
2000
2001
–20%
–10%
0%
10%
20%
30%
40%
50%
60%
Capacity (MW) Gross Electricity Production (GWh)
–30%
Biomass Electricity Policy Timeline
Research and Development
Market Deployment
. Biomass Agreement (obligation)
. Investment Grants
. Feed-in Tariffs
. Electricity Supply Act & Reform Agreement (obligation)
Denotes a significant change to a policy, such as an extension, repeal or revision.
1991
1992
0
20
40
60
80
100
120
140
160
19901991
19921993
19941995
19961997
19981999
20002001
Capacity
0
100
200
300
400
500
600Production
Figure 9. Solid Biomass Capacityand Electricity Production
Figure 10. Solid Biomass Capacity(Year to Year Change)
About half of Denmark’s electricity generation is from combined heat and power (CHP) plants, the highestCHP share in power generation in the world. The use of CHP combined with district heating has long beenDenmark’s main instrument to limit primary energy use and its environmental effects, and has benefitedfrom strong government support. A large and increasing portion of Denmark’s district heat is producedthrough large combined heat and power production. In 1980, 55% of the district heating systems wereheat-only plants; by 1998 this portion had declined to 13%.
The use of biomass for the co-production of power and district heating grew rapidly in Denmark whenthe electricity companies were ordered by the government to use biomass – straw and to a lesser extentwood – in centralised CHP plants. The Biomass Agreement (1993) aimed to increase electricity generationfrom biomass so that by 2000, electric utilities would incorporate the use of 1.2 million tonnes of strawand 0.2 million tonnes of wood (total about 20 000 TJ) annually. The target was not met: total production

228
PART 2: COUNTRY PROFILES
of solid biomass in 2000 was 35 714 TJ, of which about 14 634 TJ was used for electricity generation(41%). The time limit to meet this obligation was extended to 2005.
A new Biomass Agreement in 2000 (along with the Electricity Reform Agreement) provides the frameworkfor future electricity supply from biomass. On the basis of the agreement, the target is to be reached by2004 and two or three large biomass plants are to be established by 2005. Over a ten-year productionperiod, a minimum price of DKK 0.33/kWh is to be established as well as a minimum price ofDKK 0.10 for green certificates. Individual plants will receive a further negotiated permanent supplement.A tendering process is to be used to ensure that more than the initial two to three plants are constructed.Electricity from biomass-based plant currently sells at a price of about DKK 0.60/kWh.
Biomass, straw in particular, is a more difficult fuel to burn than coal, oil and natural gas due to lowercalorific value and contents that react aggressively and corrosively in typical plant operations. Denmark’stwo big electricity producers have been conducting comprehensive RD&D programmes to address thechallenge. One company experiments with supplemental firing with straw in coal-fired boilers. The othercompany works with a biomass-only plant. Over the last decade the average efficiency in straw-firedsteam turbine plants has increased from 20-25% to 25-32% in small plants, while more modern, largeboiler plants can reach efficiencies of 42-50%.
Biomass Heat Production
993
199
1994
1995
1996
1997
1998
1999
2000
2001
2002
200399
119
919
9992
199990
1993
1994
1995
1996
1997
1998
1999
2000
2001
–20%
–10%
0%
10%
20%
30%
40%
50%
60%
Capacity (MW) Gross Heat Production (TJ)
–30%
Biomass Heat Policy Timeline
Research and Development
Market Deployment
. Heat Supply Act
. Biomass Agreement (obligation)
. Investment Grants
. Guaranteed Prices
Denotes a significant change to a policy, such as an extension, repeal or revision.
1991
1992
0
20
40
60
80
100
120
140
160
19901991
19921993
19941995
19961997
19981999
20002001
Capacity
0
2000
4000
6000
8000
10000
12000Production
Figure 11. Solid Biomass Capacityand Heat Production
Figure 12. Solid Biomass Capacity(Year to Year Change)

DENMARK
229
The share of heat in total final energy consumption is unusually high in Denmark at 16%. This is due toDenmark’s vast use of district heating, which was promoted through the National Heat Supply Act (1988).It included a national heat plan and the possibility for local governments to mandate connection to thedistrict heating network for new and existing buildings. Most of the densely populated areas of the countryare served by district heating networks. There has been a significant change in the fuels used in theproduction of district heat in the period since 1980. According to Danish statistics, the composition in 2002was: 38% renewable energy, of which 23% was waste combustion; 30% natural gas; 24% coal and 7% oil.
In addition to the use of biomass in large-scale CHP plants (discussed in previous section), other programmeshave been established to support private investment in biomass-fired heating plants. These programmessupport the extension of biomass to district heating areas and areas not served by the collective supplysystem. Regional subsidies were offered (until 2001) for up to 21% of costs of installations in households and26% for installations in companies, for a total cost of about DKK 25 million per year. In 2001, Denmark had50 heating plants operating on wood chips, 25 on wood pellets, and 75 straw-fired plants.
Incentives for investment in biomass follow from the Act on Utilisation of Renewable Energy Sources (1997and 1999 executive orders). These subsidies for standardised renewable energy technologies vary from 15%to 30% of the construction costs and up to 50% for development projects. For biomass equipment the subsidywas to up to 16% with a maximum grant of € 132 450. Many investment subsidies were cut in 2002.
Biogas Electricity Production
993
199
1994
1995
1996
1997
1998
1999
2000
2001
2002
200399
119
919
9992
199990
1993
1994
1995
1996
1997
1998
1999
2000
2001
–5%
0%
5%
10%
15%
20%
25%
30%
35%
Capacity (MW) Gross Electricity Production (GWh)
–10%
Biogas Electricity Policy Timeline
Research and Development
Market Deployment
. Biomass Agreement (obligation)
. Investment Grants
. Feed-in Tariffs
. Electricity Supply Act & Reform Agreement (obligation)
Denotes a significant change to a policy, such as an extension, repeal or revision.
1991
1992
0
5
10
15
20
25
30
35
40
45
50
19901991
19921993
19941995
19961997
19981999
20002001
Capacity
0
50
100
150
200
250Production
Figure 13. Biogas Capacityand Electricity Production
Figure 14. Biogas Capacity(Year to Year Change)

230
PART 2: COUNTRY PROFILES
Biogas production increased from 752 TJ in 1990 to 3 047 in 2001, an average annual growth of more than13.6%. About 85% of this gas is used for electricity generation and installed capacity was 47 MW in 2001.
Large-scale joint biogas plants, which convert animal manure and organic industrial waste into biogas andfertilizer, have been undergoing swift technological development since the mid-1980s. Denmark has twentyjoint biogas plants that were built with 20-40% investment subsidy between 1984 and 1998. A co-ordinatedfollow-up programme has collected experience, provided economic analysis, harmonised research activities,launched demonstration programmes and disseminated knowledge among key players and manufacturers,resulting in a marked improvement of the biogas process. These activities were financed by the EnergyResearch Programme and the Development Programme for Renewable Energy.
There are more than 60 small farm biogas plants in addition to the large-scale biogas plants.
There was concern that the uncertainty about the corporate framework conditions in the liberalisedelectricity market could prevent potential players such as farmers and other investors from developingbiogas plants, which in addition to the energy and fertilizer benefits help to deal with the specialenvironmental problems associated with intensive animal husbandry in a densely built-up community. Toestablish market-based conditions that create cohesion between the advantages to society and thecorporate economic operating conditions, the government introduced a fixed price system for electricitysold to the public grid from biogas plants in 2003.
Wind PowerIn 2001 the total installed capacity of wind turbines in Denmark was 2 556 MW and wind generationcorresponded to 11.4% of electricity production. This is the highest share in any IEA Member country.According to Danish statistics, wind turbine capacity was 2 886 MW in 2002 which represents 21.8% ofelectricity capacity. In 2002 offshore wind capacity was 214 MW, up from 50 MW in 2001.
Denmark’s development of wind energy has been an energy policy and a commercial success story. Sincethe first wind turbines were industrially constructed around 1980, there has been tremendous growth,particularly since 1990. Modern Danish wind turbines produce about 100 times as much electricity as thefirst industrial wind turbines from 1980, and over the last decade the global sales of Danish wind turbineshave grown from about 200 MW per year to 3 600 MW. Danish wind manufacturers and their internationalsubsidiaries have 50% of the global wind market with a turnover of € 1.5 million in 2000. Danish windturbines have become a major export commodity with currency earnings of about DKK 12 billion in 2001.
The Danish Government has employed numerous policy instruments to achieve its wind energy targets. Ithas used successfully and flexibly both demand pull and technology push instruments. For more than25 years, RD&D provided continuity for technology improvements and a stimulus for innovations. Forexample, Risø National Laboratory, the centre of Danish technological development, established a TestStation in 1978 for wind turbines that was responsible for type approvals that were a precondition forobtaining plant and production subsidies. (Now, certification is required for connection to the Danishgrid, and the process has evolved into a commercial activity for test station and certification institutes.)Risø’s wind know-how was combined with its traditional front-line competencies in the fields ofmeteorology and materials technology with the expertise of technical universities in fluid mechanics. Risøfunctioned as a technological service centre for the nascent Danish wind turbine industry, whoseindividual companies at that point did not have the resources to undertake technological development.Risø and Danish turbine producers have co-operated on a large number of RD&D projects co-financedby the Energy Research Programme. RD&D has been directed towards basic research rather than actualturbine or component development and has enjoyed a relatively stable level of support.

DENMARK
231
993
199
1994
1995
1996
1997
1998
1999
2000
2001
2002
200399
119
919
9992
199990
1993
1994
1995
1996
1997
1998
1999
2000
2001
5%
10%
15%
20%
25%
30%
35%
40%
Capacity (MW) Gross Electricity Production (GWh)
0%
Wind Power Policy Timeline
Research and Development
. Resource Assessment
Market Deployment
. Tax Incentives Co-ops
. Direct Production Subsidies
. Feed-in Tariffs
. Fiscal Incentives
. Turbine Replacement Incentives
. Offshore Wind Demonstration
Denotes a significant change to a policy, such as an extension, repeal or revision.
1991
1992
0
500
1000
1500
2000
2500
3000
19901991
19921993
19941995
19961997
19981999
20002001
Capacity
0
500
1000
1500
2000
2500
3000
3500
4000
4500
5000Production
Figure 15. Wind Power Capacityand Electricity Production
Figure 16. Wind Power Capacity(Year to Year Change)
The technological development of Danish wind turbines led to explosive growth in demand in the 1990sin both domestic and export markets. Within Denmark, the technical developments were coupled withmarket deployment strategies that ensured investors guaranteed sales and a premium price. Utilitiesagreed to buy wind power from privately-owned wind turbines at a purchase price equivalent to about85% of the retail price of electricity. The feed-in tariffs were adjusted in 1996 and 1998. From 1979 to1989, the government also offered an installation subsidy of 30% of total project costs, which resulted inabout 2 567 turbines receiving subsidies of DKK 275.72 million (in 2002 prices). Direct productionsubsidies have continued: existing turbines are paid DKK 0.60/kWh for a specified number of 12 000 to 25 000 full-load hours depending on turbine size. Utilities are now required by law to connect privatewind turbines to the grid and to receive and pay for wind-generated electricity.
Throughout these development years, the Danish state financed the additional costs involved. Followingthe liberalisation of the electricity market and reflecting the maturing of the wind turbine technology, theeconomic commitment shifted to electricity consumers. The support scheme is undergoing reorganisationso that, following a transition period, wind turbines will have to produce on market terms, but with anenvironmental bonus that capitalises on the societal benefits of wind energy.

232
In 2001 the total installed capacity amounted to more than 6 000 units with a capacity of 2 556 MW.However, many of them were small and inappropriately located. This led to a scheme to encouragereplacement of the smaller turbines by larger, more modern ones. In 2002, this led to 1 300 turbines withan overall capacity of about 100 MW being replaced by about 300 turbines with an overall capacity of300 MW.
PART 2: COUNTRY PROFILES
DKK/kWh
0
1.4
0.2
0.4
0.6
0.8
1
1.2
Figure 17. Onshore Wind Power Price Development, Denmark, 1981-2000
1981
1983
1985
1987
1989
1991
1993
1995
1997
1999
2001
Source: Danish Energy Authority
The price of electricity production from newly developed Danish onshore wind turbines has fallensubstantially from about € 0.16/kWh (DKK 1.2/kWh) in 1981 to under € 0.04/kWh in 2000. As well,efficiency continues to grow in step with the turbines’ increasing size.
Demand pull instruments Technology push instruments
Incentives Incentives• Direct subsidies • R&D programmes• Taxation • Programme for household turbines• Replacement of small and old turbines • Test station for wind turbines• Aid programmes • International co-operation
Other regulation Other regulation• Resource assessment • Approval scheme• Local ownership • Standardisation• Agreements with utilities• Regulation of grid connection• Electricity purchase arrangements/green certificates• Information programmes• Spatial planning procedures
Policy Instruments Used to Promote Wind Turbine Technology and Installations

DENMARK
233
Offshore Wind
Interest in the potential for offshore wind development has grown more or less in step with the up-scalingof turbines. MW-size turbines can dominate the landscape so offshore development appeared to be aprecondition to continued large-scale development of wind energy in Denmark. Onshore winddevelopment seems to be close to saturation in terms of sites and the problems of siting large turbines indensely populated areas.
During the 1990s, Denmark undertook two pilot projects that provided important knowledge about theeconomic and environmental conditions for developing offshore wind farms. Mapping of potential majorsites for offshore wind farms in 1997 identified an immediate potential of about 4 000 MW. Since 2001the pilot projects have been followed with two large-scale demonstration projects using 2 – 2.3 MW-sizedturbines. Turbines of up to 3 MW are to be tested in near-shore areas in the coming years.
In 1998 the government set a target of 750 MW to be supplied by offshore wind farms by 2008. Followingorders from the government to the power suppliers, two demonstration projects were completed in 2002and 2003 with a total capacity of 320 MW. But in relation to the liberalisation of the electricity market,the government annulled the obligation on power suppliers to construct all 750 MW and decided toemploy a tendering process for further offshore wind farms.
Solar Thermal Production
993
199
199994
995
199
199996
997
199
199998
999
199
200000
001
200
200002
003
20099
119
919
9992
199990Solar Thermal Policy Timeline
. Research and Development
. Subsidies
Denotes a significant change to a policy, such as an extension, repeal or revision.
Production
0
400
50
100
150
200
250
300
350
Figure 18. Solar Thermal Production
Production (TJ)
1990
1991
1992
1993
1994
1995
1996
1997
1998
1999
2000
2001
Solar thermal production increased from 100 TJ in 1990 to 341 TJ in 2001. There are about 30 000 solarthermal installations that provide domestic water heating and about one-third are used for both hot water

234
and space heating. About DKK 57 million per year was set out in the 1995-1997 energy plan to supportsolar thermal installations in the form of basic grants, a standard subsidy and funds from the DevelopmentProgramme for Renewable Energy. Standard grants were cancelled in 2002.
To increase the number of large solar heating systems, for example in public buildings, and in connectionwith biomass-fired district heating systems, Denmark provided subsidies in the 1979 to 2002 period. Thecost of this initiative was about DKK 6 million annually between 1998 and 2000. In addition, from 1979to 2002 Denmark provided subsidies for up to 30% of the cost of investment for solar heating systems forhousehold heating in areas not served with district heating. This amounted to about DKK 20 to 25 millionfrom 1998 to 2000, plus subsidies of some DKK 2 million per year for information campaigns.
PART 2: COUNTRY PROFILES

DENMARK
235
Japan Policy Chronology
The Energy Research Programme (ERP)
Year 1976 - Present
Policy Description The Energy Research Programme supports the implementation of Danishenergy policy. It supports energy projects with strategic/practical perspectivesover a two- to three-year time frame. Areas of focus include: oil and natural gas,environmentally benign heat and power production, wind, buildings and solarenergy, energy and society, and energy efficiency in products and industrialprocesses. Financial support of up to 100% is available, though the averagesupport level is about 50% of eligible costs.
Policy Type RD&D
RE Technology All renewables
Electricity Supply Act
Year 1976 (see reforms of 1996, 1999 and 2001)
Policy Description The 1976 Electricity Supply Act provided the framework for the control of theelectricity sector, where only licensed companies were allowed to produce,transmit and distribute electricity through the public grids. The Minister ofEnergy was authorised to use security of supply justifications to obligeelectricity supply companies to include specific energy types in their supplymix and to take measures to improve the energy efficiency of supply.
Major changes to the Act in 1989 introduced the obligations for powersuppliers to purchase power from renewables generation and CHP. Power fromwind turbines was excluded as it was already regulated in detail through theAct on Utilisation of Renewable Energy Sources.
In 1994, environmentally sound development of electricity supply wasincluded as the main objective of the Act. The Minister was able to imposeobligations on utilities to take measures pertaining to fuel use, energy efficiencyand renewable energy development.
In 1996, the EU directive to liberalise the electricity market was adopted andDenmark modified its legislation accordingly.
Policy Type RD&D
RE Technology Onshore wind Biomass Now, all renewables
Capital Grants for the Installation of Wind Turbines
Year 1979-1989
Denmark Policy Chronology

236
PART 2: COUNTRY PROFILES
Policy Description This programme administered capital grants for 15-30% of the installation ofwind turbines.
Policy Type Capital grants
RE Technology Onshore wind
Heat Supply Act
Year 1988
Policy Description Measures first introduced in the 1988 Heat Supply Act encourage districtheating using renewables by prohibiting installation of electric heating inspecified residential areas. The prohibition is still in force.
Policy Type Regulatory and administrative rules
RE Technology All renewables
The Biomass Agreement
Year 1993-2005
Policy Description In 1993, the government set an objective to increase biomass use from 50 PJ to75 PJ by 2000 (10% of total fuel consumption) and to establish two to three largebiomass plants before 2003. The two main electricity suppliers (Elsam and Elkraft)were to incorporate the use of 1.2 million tonnes of straw and 0.2 million tonnesof wood in large-scale power plants. These objectives were not met.
Modifications to the Biomass Agreement in 1997 and 2000 provided moreflexibility in the choice of biomass procured. The targets were maintained butthe time for fulfilment was prolonged until 2005.
With the modification in 2000, the costs to the utilities for fulfilment of theBiomass Agreement were transferred to electricity consumers as an extra charge.
A feed-in tariff provides a ten-year guarantee of DKK 0.30/kWh settlement priceand an additional DKK 0.10/kWh until the green certificates market is establishedand green certificates replace this portion.
Policy Type Obligations / Guaranteed prices/feed-in tariffs
RE Technology Biomass
Replacement of Small Obsolete Wind Turbines
Year 1994-1996
Policy Description This programme offers grants for 15% of the costs or DKK 200 000, whicheveris lower, to subsidise the replacement of obsolete wind turbines with moreadvanced turbines.
Policy Type Capital grants
RE Technology Onshore wind

DENMARK
237
Act on Support for Utilisation of RenewableEnergy Sources
Year 1981-2001
Policy Description This framework legislation aims to support the establishment of renewableenergy technologies and systems. The act contains specific conditions forobtaining grants to establish renewable energy installations. The subsidy level isadjusted periodically to correspond with the economics of each technology. TheAct sets out conditions for capital grants, technology development, analysis,evaluations, test facilities and information dissemination.
The 2001 budget was directed to:
• Standard grants for renewable installations that provide up to 30% ofapproved expenses for solar thermal installations; 16% for biomass; 15% forheat pumps; and 30% for biogas plants. The maximum grant is € 132 450.
• R&D projects (about 34% of the total budget).
• Grants for renewable energy knowledge centres, and test and certificationcentres (about 34% of the total budget).
Feed-in tariffs were:
Wind: existing onshore plants (before January 2000) were paid a total fixedprice of DKK 0.60/kWh (market price plus supplement); new plants wereguaranteed a total of DKK 0.33/kWh for the first 22 000 full load hours. Inaddition, producers receive DKK 0.10/kWh until the green certificate market isinitiated.
Offshore wind was guaranteed DKK 0.353/kWh for the first 22 000 full loadhours; in addition, producers also received DKK 0.10/kWh until the greencertificate market is established.
Offshore plants financed under previous rules only receive DKK 0.10/kWh untilthe green certificate market is in place.
Biomass: electricity from biomass is paid about DKK 0.30/kWh, in addition to theDKK 0.10/kWh until the green certificate market is implemented. In addition, aDKK 30 million per year programme to support Danish biomass plants has beenset up. The average payment to producers is about DKK 0.60/kWh. The pricesettlement for biomass plants will be further clarified in future legislation.
The Act established renewable energy supply as a Public Service Obligation andallowed the expenses to be passed on to consumers as an extra charge, whichis integrated in the price.
The entire scheme was terminated in 2002.
Policy Type Capital Grants / Guaranteed prices/feed-in tariffs / RD&D
RE Technology Solar thermalBiomassOffshore windOnshore wind

238
PART 2: COUNTRY PROFILES
Electricity Supply Act
Year 1996 (see reforms of 1999 and 2001)
Policy Description The Electricity Act in 1996 took the first step towards introducing a morecompetitive market, while at the same time providing for prioritisation ofrenewables and environmentally sound energy in the electricity supply. The Actprovided that utilities had to give priority access to renewable energyproduction and pay a favourable buy-back rate of 85% of the consumer priceof electricity in the area. (This formalised renewable electricity grid access thathad been in practice since the 1980s.) The Act came into force in 1998.
Policy Type Guaranteed prices/feed-in tariffs
RE Technology All renewables
Wind Energy Co-operative Tax Incentive
Year 1997
Policy Description Under this legislation, individuals who participate in wind energy co-operatives(Bürgerwind) are exempt from tax for the first € 400 per year of income and theremainder is taxed at 60% of regular tax rate.
Policy Type Tax exemptions
RE Technology Offshore windOnshore wind
SOL-300 Project
Year 1998-2000
Policy Description The SOL-300 project met its objective to deploy 300 rooftop photovoltaicsystems on existing residences. It provided education and training in PVtechnology and system mounting and testing.
Policy Type RD&D/Public awareness
RE Technology Solar photovoltaic
Agreement on Offshore Wind Turbines
Year 1998-2002
Policy Description This framework was a binding agreement among the government and the twomain electricity providers to install 750 MW of offshore wind by 2008 as thefirst phase of a planned installation of 4 000 MW of offshore wind turbinesbefore 2030. Two demonstration projects have been completed with a totalcapacity of 320 MW. In 2002 the government annulled the obligation toconstruct all 750 MW and instead will employ a tendering process.
DENMARK
239
Policy Type Obligations/RD&D
RE Technology Offshore wind
Energy Taxes
Year Energy taxes have been levied for decades.
Policy Description Taxation of energy products has a long history in Denmark, dating back to thefirst tax on petrol introduced in 1917. As of 1980, taxation of a large number ofproducts through the economy was motivated in part by environmentalconsiderations and to save resources, especially energy. Energy taxes comprisetaxes and duties on carbon dioxide, sulphur, electricity, natural gas, petrol andspecific petroleum products.
In 1991, energy taxes were reformed into an energy and carbon tax to reflectDenmark’s environmental concerns. A large share of the tax revenues was usedfor energy efficiency measures and since the tax system came into effect in 1992it has been expanded.
Denmark embarked on a “green” tax reform to shift the tax burden away fromincome and towards resource use. This system was put into place between 1994and 1998. Energy taxes were raised progressively, particularly on coal andelectricity consumption, leading to an average increase in taxation on heatingand power of 30% from 1994 to 1998. The main effect was that householdspaid lower income taxes and higher environmental taxes.
Based on the Green Tax Package 1995, another reform of the tax system wasundertaken between 1996 and 2000 which aimed to increase energyconservation in businesses and industry. The main features were higher CO2taxes, introduction of a substantial tax on natural gas, differentiation of theenergy and carbon taxes according to energy use and phase-in of a sulphur tax.This tax structure has remained, but the tax rates have increased.
Tax Rates in 2002:
• Energy tax: about € 6.8/GJ.
• Standard CO2 rate: € 13.3/tonne.
• Sulphur tax: € 2.66/kg of sulphur or € 1.33/kg of SO2.
Taxation of electricity is calculated on the basis of the fuel used in production.
A large part of the additional revenues from the Green Tax Package aretransferred back to companies through reduced taxation on labour, specialsubsidies for SMEs and subsidies for energy efficiency measures. The CO2 tax isdifferentiated according to two principles: the process for which the energy isused and whether or not the company has entered into a voluntary agreementto apply energy efficiency measures. The difference between the tax rate withand without voluntary agreements grew significantly between 1996 and 2001.
The largest share of tax revenue transfers occurs through reduced taxation onlabour. A smaller share is redirected to the industry and service sectors to
240
PART 2: COUNTRY PROFILES
provide subsidies for energy efficiency measures. About DKK 1.8 billion(€ 242 million) was set aside for these subsidies for 1996-2000. The DanishEnergy Agency (now the Danish Energy Authority) established a list of 40standard solutions for energy efficiency improvements and determined whichprojects qualify. Eligible projects must increase energy efficiency, reduce CO2or SO2 emissions or be of a developmental character. Companies can alsosuggest individual solutions. Applications for support rose from 2 800 in 1996to 7 000 in 2000.
In an evaluation carried out in 1999, the government estimated that the GreenTax Package 1995 resulted in a net decrease of the overall tax burden by DKK 335 million and that CO2 emissions from industry in 2005 would bereduced by 3.8%, corresponding to 2.3 million tonnes1. Half of this is due tothe taxes and the rest to the subsidy and voluntary agreement schemes.
According to a parliamentary decision (Whitsun package) in 1998, energy taxescontinued to rise after the phase-in period of the Green Tax Package 1995. Forexample, households’ energy taxes on stationary fuel use rose by 15% to 25%between 1998 and 2000.
In 2002, the new government established a general freeze on all taxes. This is afreeze in nominal terms and will therefore lead to reductions in CO2 and energytaxes in real terms.
In 2003 the Ministry of Taxation launched an overhaul to reduce the complexityof the Danish tax system. A group has been established with a view to reduceadministrative burdens and to improve transparency in relation to energy, CO2and sulphur taxes. A proposal for simplification is expected in early 2004.
Policy Type Fossil fuel taxes
RE Technology Offshore wind
Electricity Act Reform: Energy Supply Act
Year 1999-2001
Policy Description This agreement established the framework for the manner in which consumerprotection, environmental considerations and security of supply are to besafeguarded in the liberalised electricity market. It transformed the subsidy schemefor renewables from fixed payments to a type of renewables portfolio standard tobe phased in. The legislation introduced CO2 quotas, tradable emissionsallowances and renewable energy certificates for a “green” electricity market. Tomeet their quotas, electricity distributors may develop renewable supply optionsor purchase renewable generation credits as proxies. Price premiums forrenewables are passed down to electricity consumers. It was assumed that a greencertificate market would be functioning by 2003.
1. Danish Energy Authority: Green Taxes for Trade and Industry – Description and Evaluation, Copenhagen, June 2000.
DENMARK
241
In 2001 a Parliamentary hearing concluded that the renewable certificatescheme was impracticable and it has not been implemented. Until a finaldecision is taken, transitional regulations on power purchase rates and premiumpayments for renewables are set out in Executive Orders.
Policy Type Obligations / Guaranteed prices/feed-in tariffs
RE Technology All renewables
Adaptation of the Electricity Act Reform
Year 2001-2003
Policy Description In anticipation of the green certificates market and EU approval of the rules forpayment of green electricity, new tariffs were adopted in 2001. The support isgenerally lower than in previous periods. For example, the tariff for new onshorewind electricity production is about 30% lower than for existing turbines.
Electricity production subsidies were to be replaced by renewable certificateswith a minimum value of DKK 0.10 and a maximum of DKK 0.27/kWh.However, the renewable energy certificate system has not been implemented.
Policy Type Guaranteed prices/feed-in tariffs
RE Technology All renewables
SOL-1 000 Project
Year 2001-2005
Policy Description The SOL-1 000 is a successor demonstration project to SOL-300 with anobjective of 1 000 new PV roof-top system installations. An important elementis the development of solar architecture and building integrated systems.
Policy Type RD&D
RE Technology Solar photovoltaic
Replacement of Wind Turbines
Year 2001-2003
Policy Description Rapid development of wind turbine technology led to a need for replacementof turbines from previous generations of technology. In 2001 a grant scheme forthe replacement of old and badly placed wind turbines was introduced. Anowner who replaced an old small turbine was granted an additional surchargeof DKK 0.17/kWh for 12 000 full-load hours for a new wind turbine connectedto the grid between April 2001 and January 2004. The surcharge was given fora proportion of the capacity of the new turbine corresponding to two-threetimes the installed capacity of the decommissioned turbine.
Further more, the regulation set out that, pursuant of the Electricity Supply Act,the wind turbines would not be guaranteed fixed feed-in tariffs or pricesurcharges after ten years of operation.

242
PART 2: COUNTRY PROFILES
Policy Type Consumer grants/rebates/Guaranteed prices/feed-in tariffs
RE Technology Onshore wind
National Strategy for Sustainable Development
Year 2002
Policy Description The Danish National Strategy for Sustainable Development aims to establish aframework for societal development that secures economic and social developmentalong with a high level of environmental protection. It takes into account thatsustainable development is a common international goal and that Denmark has astrong obligation to promote this development at the international level.
In 2002, the Danish government presented a set of indicators coupled with thesustainable development strategy.
Policy Type Public awareness
RE Technology All renewables
Net Metering for Small-scale PV
Year 1999-2003 + 2003-2007
Policy Description Under this programme, self-generated private electricity is purchased at thesame price as the utility company sells its standard electricity. This effectivelyallows the consumer to run the meter backwards when generating moreelectricity than is used. No payment for net production per year.
Policy Type Net metering
RE Technology Solar photovoltaic
National RD&D Strategies for RenewableEnergy Technologies
Year 2003-2004
Policy Description The Danish Energy Authority, in collaboration with the two main utilities (PublicService Obligation – funded) has elaborated RD&D strategies for fuel cells,biomass, wind energy and photovoltaics. Strategies for bio-fuels, wave energy,hydrogen and the interplay of different renewable energy sources in integratedsystems are planned to be developed.
Policy Type RD&D
RE Technology All renewables

EuropeanUnion
243

244
Renewable Energy Policy Context
Background to Activities at a European Union Level At the time of writing the European Union (EU) consisted of 15 Member States, to be joined on 1 May 2004by 10 accession countries. These countries work together at many levels, with administrative support fromthe European Commission (EC), which reports both to the Council of Ministers, representing the MemberStates, and to an elected European Parliament.
The European Commission is responsible for proposing policies and legislation, which are then formallyadopted (after negotiation) by the Council and the Parliament. Once adopted at the EU level, each MemberState is required to implement policies and to transpose EU Directives into national legislation, within theirown systems and structures.
The European Commission is also responsible for managing a number of community programmes, which arefunded from a budget to which all Member States contribute. Such programmes support activities of commoninterest, for example research, co-operation with developing countries and aid to regions of the EU whichare lagging behind.
EU Renewable Energy ProgrammesConcerning renewable energy, the Commission has supported research and technological development(RTD) since the 1970s. It continues today to give a high priority to both long- term and short-term researchfor renewable energy and energy efficiency technologies. This research is managed by the Commissionthrough a series of four-year framework programmes. The current RTD programme runs from 2003 to 2006,with a budget of € 810 million for Sustainable Energy Systems, within which an important part is allocatedto renewable energy.1 In addition, support is given to research for small and medium enterprises (SMEs) andfor international co-operation (INCO), both of which include work on renewable energy.
In addition to R&D for renewable energy technologies, since the early 1990s the Commission has supportedactivities aimed at tackling non-technological barriers to the growth of renewable energy markets. This workis managed through the ALTENER programme, which for the period 2003-2006 forms an integral part of theEnergy Intelligent Europe (EIE) programme.2
In the context of the regional support within the EU, the Commission has encouraged those responsible togive priority to the renewable energy sector, recognising its importance for local job creation, theenvironment and the security of energy supply.
Similarly, it has been recognised by the EU that sustainable energy services are essential to achieving theMillennium Development Goals in co-operation with developing countries, for example through theCotonou agreement and the European Development Fund. An important commitment by the EU tosustainable energy services for poverty alleviation was made at the Johannesburg summit in 2002, where theEU Energy Initiative for Poverty Eradication was launched, as well as the Johannesburg Renewable EnergyCoalition (JREC). Programmes are currently being developed and implemented to fund these commitments,including COOPENER, which forms an integral part of the EIE programme.
PART 2: COUNTRY PROFILES
1. http://fp6.cordis.lu/fp6/home.cfm 2. http://europa.eu.int/comm/energy/intelligent/index_en.html

EUROPEAN UNION POLICY CHRONOLOGY
245
EU Renewable Energy PoliciesBuilding on its early work of supporting RTD on renewable energies, the EU began working towards a policyframework for renewable energy in the early 1990s, which culminated in the publication of the White Paperand Action Plan for Renewable Energy Sources in 1997.3 This document, which was adopted by the Counciland Parliament, forms the basic policy framework within which much of the recent work on renewableenergy at an EU level has been based. The main component of the White Paper was an overall goal ofdoubling the contribution of renewable energy in final EU energy consumption (from 6% to 12%) by 2010.It also established an Action Plan for achieving this goal, including the Campaign for Take-Off, which ranfrom 1997 until the end of 2003. This White Paper also set targets for each renewable energy technology.Progress against these targets was reported to the Council and the Parliament in a CommissionCommunication in February 2001.4
Following important developments in the energy sector in the late 1990s, the Commission published forconsultation a Green Paper on the Security of Energy Supplies in December 2000, resulting in aCommunication in 2001 summarising the results.5 These documents both confirmed the important role ofrenewable energy in the future EU energy economy and the need to accelerate the growth of renewableenergy markets in order to diversify EU energy supplies and improve energy security.
Based on this policy framework, the Commission began work in 1999 to put in place legislation designed toachieve the agreed policy goals.
Renewable Energy LegislationThe first pioneering EU legislation in the renewable energy sector was the EU Directive for ElectricityProduced from Renewable Energy Sources, adopted in September 2001.6 It includes indicative targets for thepercentage of renewable energy in gross electricity production of each EU Member State by 2010 (Table 1).The legislation also establishes requirements concerning:
● Guarantee of origin of renewable electricity.
● Simplification of administrative procedures for approving the construction of renewable electricitygenerators.
● Transparency of pricing for connections to the electricity grid.
● Reporting on progress towards the agreed targets.
● Requirement that the Commission make recommendations by October 2005 concerning whether or notnational support schemes for renewable energies should be harmonised across all EU member states.
3. White Paper for Community Strategy and Action Plan COM (97) 599 Final.4. Communication from the Commission on the Implementation of the Community Strategy and Action Plan COM (2001)69(01).5. Green Paper towards a European Strategy for the Security of Energy Supply COM (2000)769.6. Directive 2001/77/EC on the Promotion of the Electricity Produced from Renewable Energy Sources in the Internal Electricity Market.

246
The second Directive which addresses the use of renewable energies in the EU is the Directive on Biofuels,which was adopted in 2003.7 This Directive requires all EU suppliers of transport fuels to include 2% ofbiofuels by 2005 and 5.75% by 2010 in their delivered fuels to final users. This Directive was complemented
PART 2: COUNTRY PROFILES
RES-E 1997** RES-E 1997*** RES-E 2010***(TWh) (%) (%)
Belgium 0.86 1.1 6.0Czech Republic 2.36 3.8 8.0Denmark 3.21 8.7 29.0Germany 24.91 4.5 12.5Estonia 0.02 0.2 5.1Greece 3.94 8.6 20.1Spain 37.15 19.9 29.4France 66.00 15.0 21.0Ireland 0.84 3.6 13.2Italy 46.46 16.0 25.0Cyprus 0.002 0.05 6.0Latvia 2.76 42.4 49.3Lithuania 0.33 3.3 7.0Luxembourg 0.14 2.1 5.7Hungary 0.22 0.7 3.6Malta 0 0 5.0Netherlands 3.45 3.5 9.0Austria 39.05 70.0 78.1Poland 2.35 1.6 7.5Portugal 14.30 38.5 39.0Slovenia 3.66 29.9 33.6Slovakia 5.09 17.9 31.0Finland 19.03 24.7 31.5Sweden 72.03 49.1 60.0United Kingdom 7.04 1.7 10.0Community 355.20 12.9 21.0
(*) In taking into account the reference values, Member States make the necessary assumption that the State aid guidelines forenvironmental protection allow for the existence of national support schemes for the promotion of electricity produced fromrenewable energy sources.(**) Data refer to the national electricity production from renewables in 1997.(***) The percentage contributions of renewables to gross electricity production in 1997 and 2010 are based on the nationalrenewables-based production divided by gross national electricity consumption. In the case of internal trade (with recognisedcertification or origin registered), the calculation of these percentages will influence 2010 figures by Member State but not theCommunity total.
Table 1. Reference Values* for EU 25 Member States' National Indicative Targets(Electricity Production from Renewable Energy Sources = RES-E)
7. Directive 2003/30/EC of the European Parliament and Council of 8 May 2003 on the Promotion of the Use of Biofuels and Other Renewable Fuelsfor Transport.

EUROPEAN UNION POLICY CHRONOLOGY
247
later in 2003, by an important revision to the existing Directive on the Taxation of Transport Fuels, whichallowed member states to reduce the levels of excise tax on biofuels.8 These directives were foreseen in 2002by a Communication which set out a strategy for biofuels in the transport sector.9
Renewable energy also has an important role to play in the buildings sector. This was recognised in theDirective on the Energy Performance of Buildings which was subsequently adopted in May 2003.10 ThisDirective requires the certification of buildings and renewable energy systems to be included in themethodology, which must be used in each Member State to produce such certificates.
It is clearly recognised that all of the EU legislation concerning the use of renewable energy sources shouldbe implemented together with the efficient management of energy demand. Hence the use of renewableenergy sources is also encouraged in the Directive on Cogeneration which was adopted in February 2004.11
Work is continuing on the development of the EU policy and legislative framework, which will encouragethe use of sustainable energy and the next Directive is expected to address the provision of energy services.Discussions are also underway concerning how to bring forward policies and legislation to accelerate themarkets for renewable heating and cooling.
8. Council Directive 2003/96/EC of October 2003 on Restructuring the Community Framework for the Taxation of Energy Products and Electricity.9. Communication of the European Commission of 7 October 2001 on an action plan and two proposals for Directives to foster the use of alternative
fuels for transport, starting with the regulatory and fiscal promotion of biofuels COM2001 547 Final.10. Directive on the Energy Performance of Buildings COM 2002/91/EC.11. Directive on Co-generation 2004/8/EC.


Finland
249

Gas
Coal
Oil
Nuclear
Renewables
Mtoe
0
5
10
15
20
25
30
35
1971
1973
1975
1977
1979
1981
1983
1985
1987
1989
1991
1993
1995
1997
1999
2001 Gas 11.2%
Coal 18.5%Renewables 23.0%
Nuclear18.0% Oil 29.2%
Figure 1. Total Primary Energy Supply by Source Figure 2. Shares of TPES 2001
Shares in Figure 2 may differ from Table 1.See Annex 2 for more detail.
250
Total Primary Energy Supply
Table 1. Total Primary Energy Supply by Source (Mtoe)*
Total primary energy supply (TPES) in Finland increased from 29 Mtoe in 1990 to 34 Mtoe in 2001, anaverage annual growth of 1.3%. Its energy mix is quite diversified compared with many other IEA membercountries. Oil, mostly for transport, represented 28% of TPES in 2001 (Table 1). Renewable energy hadthe second highest share at 22%, while coal (and peat) accounted for 18% and nuclear for 17%. Naturalgas demand is growing, mostly for power generation. In 2001, natural gas accounted for 11% of totalenergy demand. Finland imports all of its oil, coal, and gas, but because of its high share of renewables,import dependence was 57% in 2001. Finland has the highest share of biomass in TPES among theEuropean Union countries.
Renewable energy supply is a major contributor to TPES, 7.6 Mtoe in 2001, and its share grew from 19%in 1990 to 22% in 2001. The increase in share is almost entirely due to strong growth in the supply of
PART 2: COUNTRY PROFILES
Source 1970 1980 1990 1995 2000 2001 Imports
Coal 2.3 4.9 5.3 6.1 5.1 6.1 68.9%Oil 10.7 13.4 10.3 8.9 9.6 9.4 100.0%Gas 0.0 0.8 2.2 2.8 3.4 3.7 100.0%Nuclear 0.0 1.8 5.0 5.0 5.9 5.9 -Renewables 5.0 4.4 5.5 6.1 7.8 7.6 -
Biomass 4.2 3.5 4.6 5.0 6.5 6.4Hydro 0.8 0.9 0.9 1.1 1.3 1.1Geothermal 0.0 0.0 0.0 0.0 0.0 0.0Wind/Solar 0.0 0.0 0.0 0.0 0.0 0.0
Total 18.1 25.4 29.2 29.6 33.0 33.8 56.7%% Renewables 27.6% 17.2% 19.5% 21.2% 24.4% 23.0%
* See Annex 2 for explanation of components in total and definition of biomass.

FINLAND
251
biomass, although there was also a steady increase in hydropower generation. Biomass accounted for84.9% of renewable supply in 2001. The industrial and residential sectors represented three-quarters ofbiomass use. Electricity generation from solid biomass, however, has grown considerably over the pastdecade. Capacity increased from 983 MW in 1990 to 1.5 GW in 2001.
Electricity generation in Finland was 74.5 TWh in 2001. Nuclear power represented 31%. The share ofrenewables was 30%, mostly biomass-fired and hydropower. Coal, gas and peat also contribute. TheFinnish electricity market was opened to competition in 1994. Electricity prices are low in comparisonwith many other European countries. Thus, only hydropower and, to a lesser extent, biomass-firedelectricity generation, are competitive with conventional fuels.

252
Renewable energy represents almost a quarter of TPES. Biomass accounts for nearly 85% of renewable use,mostly in the pulp and paper industry where half of total industrial energy is consumed. Hydropower contributesanother 15%. Wind power and solar energy play a minor role in renewables supply. In 2001, Finland had2.9 GW of hydropower, 1.5 GW of biomass-based power, 39 MW of wind power and 3 MW of solar PV.
Research and Development Trends
Finland spent a total of US$ 777 million (in 2002 prices and exchange rates) on government energy RD&Dbetween 1990 and 2002. In that period, 10.7% of the total energy RD&D budget was allocated torenewable energy.
PART 2: COUNTRY PROFILES
Policy Timeline
Research and Development
. Bioenergy
. Wood Energy
. Streams
. Densy (2003)
Market Deployment
. Energy Investment Aid
. Action Plan for Renewable Energy Sources (grants)
Energy Policy
. CO2 Tax
. Taxation on Electricity at the Distribution Level (refund)
Denotes a significant change to a policy, such as an extension, repeal or revision.
Mtoe
0
1
9
2
3
4
5
6
7
8
1971
1973
1975
1977
1979
1981
1983
1985
1987
1989
1991
1993
1995
1997
1999
2001
Figure 3. Total Renewable Energy Supply and Policy Timeline
Hydro
CombustibleRenewables
and Waste
Renewable Energy Supply

FINLAND
253
Government energy RD&D expenditures peaked in the late 1990s and declined after 1999. The RD&Dbudget for renewables gradually increased in the 1990s with a peak in 1997.
Among the renewable technologies, biomass received the highest level of funding at US$ 65.4 million, or78%, in the 1990 to 2002 period. Wind was funded at US$ 6.6 million, representing 10% of renewableenergy RD&D. Solar heating and cooling was the third largest recipient with 8% of the renewable RD&Dexpenditures from 1990 to 2001. A relatively smaller portion of RD&D spending was allocated for thedeployment of small hydropower plants.
RD&D funding for renewable energy is focused primarily on developing competitive renewable energytechnologies through technology development. In the past, funding was aimed at improving the efficiencyof boilers and biomass systems, and today biomass technologies in Finland are highly efficient. Theobjective of current funding is to lower the costs of harvesting of wood and wood wastes and to improve
Million US$ (2002 prices and exchange rates)
0
90
10
20
30
40
50
60
70
80
Figure 4. Finland – Government Energy RD&D Budgets
Total OtherTech./Research
TotalConservation
Total Power& Storage Tech.
Total NuclearFission/Fusion
Total RenewableEnergy
Total FossilFuels
1990
1991
1992
1993
1994
1995
1996
1997
1998
1999
2000
2001
2002
Million US$ (2002 prices and exchange rates)
0
12
2
4
6
8
10
Figure 5. Finland – Government Renewable Energy RD&D Budgets
1990
1991
1992
1993
1994
1995
1996
1997
1998
1999
2000
2001
2002
Large Hydro(>10 MW)
SolarThermal-Electric
Solar Heating& Cooling
Small Hydro(<10 MW)
Geothermal
Biomass
Wind

254
the logistics of transporting biomass. There is also considerable work being done on lowering the costs ofcombustion and gasification technologies for both large and small-scale heat and co-generation facilities.Current RD&D programmes involved with renewable energy sources are Wood Energy (1999-2003),concentrating on small-scale production and use of wood fuels, Streams (2001-2004), on recyclingtechnologies and waste management, and Densy (2003-2007), on distributed energy systems.
Market Deployment Trends
Since the 1980s, renewable energy policies in Finland have mainly been in the form of tax exemptionsand capital grants or investment assistance. In the early 1990s, two national policy programmes werecreated to promote renewable energy, the Bioenergy Promotion Programme and the Wind PowerProgramme. The Bioenergy programme aimed to increase biomass use by 25% by 2005 from the 1992level. By 2001, wood and wood waste consumption was already 58.2% higher than the 1992 level. Thewind programme aimed to construct 100 MW of wind power capacity by 2005. Finland had an estimated44 MW of wind capacity in 2003.
The Finnish Action Plan for Renewable Energy Sources was launched in 1999 and revised in 2002. Theplan was integrated into the National Climate Strategy of 2001. It aims to increase the use of renewableenergy by 50% from the 1995 level by 2010. The cornerstone of this plan is to enhance the use of biomass,which accounts for 90% of the proposed increase. To expedite the Action Plan, the following measureshave been implemented:
● Development and commercialisation of renewable energy technology.
● Energy taxation favourable to renewables.
● Investment aid of initial capital costs.
The Energy Investment Aid was implemented in the beginning of the 1990s to provide public aid fortechnological development within the energy sector. Through this programme, the Finnish governmentaims to reduce the risk of investing in new technologies through public funding support for the buildingof new renewable energy plants. Government grants of up to 40% of the investment costs are available forrenewable energy sources depending on the maturity level of the technology.
A number of programmes have been instituted to promote heat generation from renewables. Wood fuels,recycled fuels and biogas used for heat generation are not taxed. The Energy Investment Aid also targetsand promotes heat generation investments.
The government is currently considering renewable energy purchase obligations, whereby sellers ofelectricity would be obliged to source a certain percentage of the electricity sold from renewable plants.
Energy Policy Context
From 1990 to 1997, a CO2 tax based on the carbon and energy content of the fuel was instituted by theFinnish government. Renewables were exempt from the tax. In 1997, the carbon tax was replaced by a taxon electricity at the distribution level, with a refund being granted to electricity from renewable sources(€ 0.042 per kWh for biomass and small hydro, and € 0.069 per kWh for wind). An amendment was madeto the tax exemption system in 2002 with the refund for logging chips increasing to the higher end of therefund system (€ 0.069 per kWh). The refund system was further expanded to include electricity producedfrom recycled fuels and biogas.
PART 2: COUNTRY PROFILES

FINLAND
255
Finland’s first national climate strategy was published in March 2001. In addition to the policies andmeasures related to climate change objectives, the strategy contains an Action Plan for Renewable EnergySources. Energy conservation measures and the use of renewable energy sources are expected to accountfor 50% of the emissions reductions by 2010.

256
PART 2: COUNTRY PROFILES
993
199
1994
1995
1996
1997
1998
1999
2000
2001
2002
200399
119
919
9992
199990
1993
1994
1995
1996
1997
1998
1999
2000
2001
0.5%
1%
1.5%
2%
2.5%
3%
Capacity (MW) Gross Electricity Production (GWh)
0%
Hydropower Policy Timeline
Market Deployment
. Action Plan for Renewable Energy Sources (grants)
Denotes a significant change to a policy, such as an extension, repeal or revision.
1991
1992
2450
2500
2550
2600
2650
2700
2750
2800
2850
2900
2950
19901991
19921993
19941995
19961997
19981999
20002001
Capacity
0
2000
4000
6000
8000
10000
12000
14000
16000Production
Figure 6. Hydropower Capacityand Electricity Production
Figure 7. Hydropower Capacity(Year to Year Change)
Hydropower
Hydropower accounted for 17.7% of electricity generation from renewables in 2001. Capacity increasedfrom 2.6 GW in 1990 to 2.9 GW in 2001. Electricity generation increased from 10 859 GWh in 1990 to13 205 GWh in 2001, an average annual growth of 1.8%. Generation, however, is estimated to have fallento 10 792 in 2002. There is considerable annual fluctuation in hydropower generation in Finland.
Hydropower capacity in Finland in 2003 is estimated to have been about 3 GW, with small-scalehydropower (<1 MW) accounting for some 10%, or 300 MW. Small-scale hydropower is subject to the samepromotional activities (energy refunds and investment incentives) as other renewable energy sources.
The national target for small-scale hydropower is specified in the revised Action Plan for RenewableEnergy Sources. The target for 2010 is 570 MW of installed capacity with a subsequent 2.2 TWh ofelectricity generation.
Strong environmental concerns limit the extent of new hydropower capacity in Finland. Some additionalproduction, however, will be attained by renovation or repowering of existing plants.
Biomass Electricity ProductionElectricity generation from biomass is a major contributor to overall generation in Finland. In 2001, solidbiomass-fired generation was 8 189 GWh, exhibiting a growth of more than 5.2% per year since 1990.
Renewable Energy Markets

FINLAND
257
In 1997, biomass electricity generation became eligible for a refund of € 0.042 per kWh on the electricitytax at the distribution level. The refund system was amended in 2002 and the refund for logging chips wasincreased to € 0.069 per kWh. The refund system was also further expanded to include electricityproduced from recycled fuels and biogas. There was a sharp increase in the biomass-electric market post-1998, after the refund was put in place.
The Finnish Action Plan for Renewable Energy Sources was launched in 1999 and revised in 2002. The ActionPlan was integrated into the National Climate Strategy of 2001. It aims to increase the use of renewable energyby 50% from the level of 1995 by 2010. The cornerstone of the plan is to enhance the use of biomass, whichaccounts for 90% of the proposed increase. Investment subsidies are provided under the Action Plan for wood-fired plants. Energy generation from biomass receives over half of all energy subsidies.
Wind PowerElectricity generation from wind power was 70 GWh in 2001, less than 1% of total electricity generationfrom renewables. Wind capacity was 39 MW in 2001. There was some growth in wind power capacity in
993
199
1994
1995
1996
1997
1998
1999
2000
2001
2002
200399
119
919
9992
199990
1993
1994
1995
1996
1997
1998
1999
2000
2001
0%
5%
10%
15%
20%
Capacity (MW) Gross Electricity Production (GWh)
-5%
Biomass Electricity Policy Timeline
Research and Development
. Bioenergy
. Wood Energy
. Streams
. Densy (2003)
Market Deployment
. Energy Investment Aid
. Action Plan for Renewable Energy Sources (grants)
Denotes a significant change to a policy, such as an extension, repeal or revision.
1991
1992
0
200
400
600
800
1000
1200
1400
1600
19901991
19921993
19941995
19961997
19981999
20002001
Capacity
0
1000
2000
3000
4000
5000
6000
7000
8000
9000
10000Production
Figure 8. Solid Biomass Capacityand Electricity Production
Figure 9. Solid Biomass Capacity(Year to Year Change)

258
PART 2: COUNTRY PROFILES
the 1990s, but since 1999 growth has slowed. In 2003, estimated generation was about 86 GWh andestimated capacity was 44 MW.
Figure 10 suggests that the wind market may have benefited from a number of RD&D and marketdeployment policies throughout the 1990s. The NEMO 2 programme focussed on the technological andeconomic potential of using new energy systems, specifically wind and solar PV, in northern conditions.This programme promoted wind energy primarily through R&D and demonstration projects. The EnergyInvestment Aid, instituted in the early 1990s, aimed to promote the take-up of new technologies byreducing the risk to investors through government support. A tax incentive for electricity production byrenewable energy sources was introduced in 1997. This incentive works by taxing electricity at thedistribution level which is subsequently refunded for electricity generation from renewable sources. Therefund is technology specific, with wind power receiving on the order of € 0.069 per kWh, on the highend of the refund scale.
The Finnish Action Plan for Renewable Energy Sources was launched in 1999 and revised in 2002. Thetarget for wind energy deployment is set at 500 MW by 2010.
1993
1994
1995
1996
1997
1998
1999
2000
2001
2002
2003
1991
1992
199990
1993
1994
1995
1996
1997
1998
1999
2000
2001
50%
100%
150%
200%
250%
300%
350%
400%
450%
Capacity (MW) Gross Electricity Production (GWh)
0%
Wind Power Policy Timeline
Research and Development
. NEMO 2
Market Deployment
. Energy Investment Aid
. Action Plan for Renewable Energy Sources (grants)
Denotes a significant change to a policy, such as an extension, repeal or revision.
1991
1992
0
5
10
15
20
25
30
35
40
45
19901991
19921993
19941995
19961997
19981999
20002001
Capacity
0
10
20
30
40
50
60
70
80
90Production
Figure 10. Wind Power Capacityand Electricity Production
Figure 11. Wind Power Capacity(Year to Year Change)
FINLAND
259
CO2 Tax on Fossil Fuels
Year 1990-1997
Policy Description In 1990, Finland introduced the world’s first carbon tax on fossil fuels at a rateof US$ 6.10 per tonne of carbon emissions.
Policy Type Fossil fuel taxes
RE Technology All renewables
Wind Power Programme
Year 1993-2005
Policy Description This programme aims to construct 100 MW of wind power capacity in Finlandbefore 2005.
Policy Type Obligations
RE Technology Offshore windOnshore wind
Bioenergy Promotion Programme
Year 1994-2005
Policy Description This programme aims to increase the use of bioenergy by 25% between 1992and 2005.
Policy Type Obligations
RE Technology BiofuelBiomass
Combined CO2 and Energy Tax
Year 1994-1997
Policy Description This combined CO2 and energy tax was based upon the carbon and energycontent of fuel. Renewable energy was exempt from this tax.
Policy Type Fossil fuel taxes
RE Technology All renewables
Finland Policy Chronology

260
PART 2: COUNTRY PROFILES
Taxation on Electricity at the Distribution Level(amendments 1/98 and 9/98)
Year 1997 - Present
Policy Description The revised tax replaced the 1994 combined CO2 and energy tax. It is levied atthe distribution level with a refund granted to electricity from renewable sources(€ 0.042 per kWh for biomass and small hydro, and € 0.069 per kWh for wind).
Policy Type Fossil fuel taxes
RE Technology All renewables
Finnish Energy Strategy
Year 1997 - Present
Policy Description The energy strategy laid out the following role for renewable energy:• Guiding energy production structure towards an energy balance with a
lower carbon content.• Promotion of the use of bioenergy and other indigenous energy.• Maintaining a high standard of energy technology.• Ensuring the security of supply in the energy sector.
Policy Type General energy policy
RE Technology All renewables
Energy Investment Aid
Year 1990’s - Present (several amendments)
Policy Description Energy aid is discretionary state aid, intended to develop less CO2-intensiveenergy production and consumption.
It can be granted for energy savings measures, the take-up of new technologyor to increase the security and versatility of energy supply. The aid focuses onnew technologies and is used to reduce risks associated with them. Aid can begranted within the limits of the parliamentary authorisation included in the statebudget.
Only enterprises and corporations are eligible for aid. Subsidies are up to amaximum of 40% of investment costs. Projects involving innovative technologyhave priority.
In 1998, investment aid for renewable technologies was FIM 110 million(€ 17 million). The 1999 Action Plan for Renewable Energy Sources planned forFIM 200 million (€ 33 million) per year of government investment aid.
Public funding is also made available to renewable energy plants throughregional and local incentives.

FINLAND
261
A new financial instrument is to award a €15-30 million demonstration grantevery three years for a project using innovative technologies. This is to allowprojects to adapt new large-scale technologies to Finnish conditions and tocommercialise them.
Policy Type Capital grants/RD&D
RE Technology All renewables
Action Plan for Renewable Energy Sources
Year 1999 - Present (revised 2002)
Policy Description This programme aims to increase the market competitiveness of renewableenergy sources as part of the National Climate Strategy of 2001. The target is toincrease the use of renewable energy by 50% from the 1995 level (20% ofTPES) by 2010.
Grants for renewable energy applications account for FIM 200 million(€ 33 million) and subsidies in energy taxation account for FIM 300 million(€ 50 million) annually. The cornerstone of the programme is to enhance use of biomass, which accounts for 90% of the target. Installations using heatpumps cover 4% of the planned extra capacity and both wind farms andhydropower plants each account for 3% of the target. It is expected that solarcell technology will provide 0.5% of the future increase.
Policy Type Obligations/Capital grants/Investment tax credits
RE Technology All renewables
National Climate Strategy
Year 2001-2004
Policy Description Finland’s first national climate strategy was published in 2001. According to thebusiness-as-usual scenario of the strategy, Finland’s GHG emissions in 2010would be 14 Mt CO2 above the 1990 Kyoto target (+0% increase on 1990levels). The strategy contains the policies and measures to reach the Kyototarget. Increases in energy conservation and the use of renewable energysources are expected to account for 50% of the emissions reductions by 2010.Programmes for promoting these measures are already in place. The other halfof reductions would come from measures related to electricity production. Thestrategy includes two options: switching from coal to gas or increasing thecapacity of nuclear power.
The strategy will be revised in 2004.
Policy Type Obligations
RE Technology All renewables
262
Pilot Project on Renewable Energy Certificate Systems
Year 2001-2002
Policy Description Finnish market players have participated in a European-wide pilot project onrenewable energy certificates, and have successfully set up a national system andproceeded to actual certificate trading. The pilot phase lasted until the end of 2002.The Ministry of Trade and Industry and the National Technology Agency haveparticipated in the funding of the project.
Policy Type Tradable certificates
RE Technology All renewables
Energy Tax Subsidy for Renewable Electricity
Year 2002 - Present
Policy Description Parliament decided to raise all energy taxes by approximately 5% as of1 January 2003. In keeping with the National Climate Strategy, the scope ofenergy tax subsidies in electricity generation was expanded to includeelectricity produced from recycled fuels and biogas. The subsidy for electricityproduced from logging chips was also increased (€ 0.069 per kWh). Thecalculation of taxable fuels in combined heat and power production waschanged to provide an additional incentive for CHP.
Policy Type Tax exemptions
RE Technology All renewables
Finnish RD&D Programmes
Bioenergy - RD&D Programme
Year 1993-1998
Policy Description The main objective of the BIOENERGY programme was to develop newtechnology solutions for biomass fuels.
The BIOENERGY research programme resulted in three new final harvestmethods already in commercial usage: the MOHA chipper lorry, CHIPSETchipharvester and EVOLUTION multi-purpose chipharvester. The equipmentfulfils the cost objective of the programme in short-distance transportation: fuelnow costs FIM 45/MWh.
Thanks to the techniques developed in the programme, and lower taxation, thecompetitiveness of wood for energy has improved substantially. Theexperiences gained and technological developments, which have loweredproduction costs and improved profitability, have also improved the operationsof heating entrepreneurs. As a result of development work, the investment costsof district heating have also been cut.
PART 2: COUNTRY PROFILES

FINLAND
263
The BIONENERGY programme developed a new technique in which oil boilerscan be used with biofuel in 0.2-5 megawatt sized plants and district heating.The programme developed a new oil product, pyrolysis oil, which expands theuse of biofuels in large properties. The programme also developed Tarkkaturve("efficient peat") methods by which the utilisation of peatland and swamps canbe conducted more efficiently and in an environmentally-friendly way.
Policy Type RD&D
RE Technology Biomass
NEMO 2 - RD&D Programme
Year 1993-1998
Policy Description The NEMO 2 programme explored the technological and economic potentialof using new energy systems in arctic conditions. In addition to R&D, thedemonstration of new applications is an essential part of the programme'scontent.
Policy Type RD&D
RE Technology Offshore windOnshore windSolar photovoltaic
LIEKKI 2 - RD&D Programme
Year 1993-1998
Policy Description Finland has an excellent international standing within many branches ofcombustion engineering. LIEKKI 2 has been developing energy conversiontechnology which is based on combustion and gasification and employs energyconversion technology that places a minimal load on the environment.
Policy Type RD&D
RE Technology Biomass
Waste to REF & Energy - RD&D Programme
Year 1998-2001
Policy Description The National Technology Agency (Tekes) technology programme Waste to REFand Energy performed RD&D on technologies that could lead to new businessopportunities. The programme was operated between 1998 and 2001 toconsider solutions to waste management that included the use of waste for energypurposes. Goals for the programme were partly guided by the national wastemanagement plan. The plan’s objective was to raise the use of municipal wastefrom slightly under 40% to 70% by 2005. This meant that € 300 to 500 million

264
in investment would be needed to use the energy recovered from waste. Inaddition, the EU landfill directive called for a reduction in landfill waste andmeasures to reduce wastes.
The annual turnover of waste management in Finland totals approximately€ 1 billion. A total of € 16 million was granted as funding to fifty RD&Dprojects under the Waste to REF and Energy technology programme. Finlandhas the world’s leading expertise on bio-energy technologies.
Policy Type RD&D
RE Technology Waste
Wood Energy - RD&D Programme
Year 1999-2003
Policy Description The National Wood Energy Technology Programme focused on developing theproduction technology and improving the quality of forest chips from loggingresidues and small-sized trees.
In 1998, energy use of forest chips in Finland amounted to 0.5 million solid-m3.The target of the programme was to reach 2.5 million m3 by 2003. Thus, theannual use of forest chips was to increase five-fold in five years. The target was tobe achieved primarily by increasing the production of chips from logging residuesfrom regeneration areas because of their better cost competitiveness. In addition,technology was also developed to promote the energy use of small-sized treesfrom early thinning because of the great silvicultural benefits involved.
Increasing the use of forest chips required further reduction of costs. The cost ofchips made from logging residues was competitive against peat and fossil fuelsin favourable conditions, but large-scale use presupposed recovery of forestfuels from more difficult stand conditions and over longer distances as well.
The programme also aimed to develop quality control and storage of woodfuels. The quality of chips can be seen as a cost factor, since the energyobtained from the chips, emissions and reliability of delivery all depend uponfuel properties. Quality improvement was not confined solely to forest chips. Itis just as important for the process residues from the forest industry. For thisreason the scope of the programme also included bark, sawdust and other solidwood residues from the forest industry that are suitable for fuel.
Policy Type RD&D
RE Technology Biomass
Small-scale Production and Use of Wood fuels -RD&D Programme
Year 2002-2004
PART 2: COUNTRY PROFILES

FINLAND
265
Policy Description The Finnish Wood Energy Technology Programme is paying increased attentionto the small-scale production and use of wood fuels. An important aim is todevelop solutions which are economically competitive, reliable and acceptablein terms of emissions for small-scale (usually under 1 MW) wood fuelproduction, storage, processing, distribution and heat production.
Companies' RD&D needs are surveyed to foster research and productdevelopment activities and to develop national and international businessoperations. Problems and development needs are studied and companies areencouraged to implement product development projects, which can be carriedout by a single company or jointly by company integrates. Productdevelopment projects can be the companies' own projects or joint projectswith other companies in their field. The total budget for 2002-2004 is about€ 5.2 million, Tekes's share amounts to € 2.9 million.
Policy Type RD&D
RE Technology Biomass
Climtech - RD&D Programme
Year 1999-2002
Policy Description This programme conducted RD&D for new technologies related to climatechange goals. The programme was carried out from 1999 to 2002. Fundingfrom the National Technology Agency (Tekes) was € 4 million out of the totalbudget of € 5 million.
Policy Type RD&D
RE Technology All renewables
Streams - Recycling Technologiesand Waste Management
Year 2001-2004
Policy Description STREAMS is a technology programme initiated by Tekes to develop new,internationally competitive technology and business opportunities related tomunicipal waste streams. STREAMS is partly financed by Tekes and partly bythe participating enterprises.
Several different technology areas are part of the STREAMS programme,including biotechnology, information technology, material technology as wellas technologies for monitoring and analysing. In addition to pure technologyprojects, STREAMS will cover the development of new service and consultingconcepts and products.
The sorting and reuse of different waste types, such as paper, metals, glass,plastics and textiles are an essential part of the programme.

266
The total value of the programme is planned to amount to € 26 million, Tekes’share is approximately half.
Policy Type RD&D
RE Technology Waste
Densy - RD&D Programme
Year 2003-2007
Policy Description DENSY is the Finnish national technology programme for distributed energysystems. It comprises local small-sized units for producing power, heat orcooling. A wide selection of fuels and production technology are covered. Thetotal budget is estimated to exceed € 50 million.
The programme focuses on system integration and commercial services ofdistributed generation of power, heating and cooling. The focal areas of theprogramme are: system solutions, integration, industrial production, businessconcepts, using ICT-technologies and demonstrations.
The main objectives of the programme are to assist Finnish industry, especiallySMEs in developing products and services for a global market to make Finnishtechnology known, to build a world-class innovation environment and toproduce commercial products for several niche-markets by 2010.
Policy Type RD&D
RE Technology All renewables
PART 2: COUNTRY PROFILES

France
267

Gas
Coal
Oil
Nuclear
Renewables
Mtoe
0
50
100
150
200
250
300
1971
1973
1975
1977
1979
1981
1983
1985
1987
1989
1991
1993
1995
1997
1999
2001
Renewables 6.8%
Gas 13.6%
Oil 34.5%
Coal 4.7%
Nuclear 40.4%
Figure 1. Total Primary Energy Supply by Source Figure 2. Shares of TPES 2001
Shares in Figure 2 may differ from Table 1.See Annex 2 for more detail.
268
Total Primary Energy Supply
Table 1. Total Primary Energy Supply by Source (Mtoe)*
Total primary energy supply (TPES) increased from 147 Mtoe in 1970 to 266 Mtoe in 2001, an averageannual growth of 1.9%. Nuclear accounts for 40% of France’s TPES, the largest percentage of nuclearpower of any country. France undertook its nuclear programme in the 1970s, partly as a response to theoil price crises and to energy security concerns. The programme began to expand rapidly in about 1980,so that by the early 1990s nuclear had become the principal source of primary energy, eclipsing oil. Coal’sshare of TPES dropped from 25% in 1970 to less than 5% in 2001. The share of natural gas increased from5.6% in 1970 to almost 14% in 2001. France’s fossil fuel supply is almost entirely imported.
Renewables have increased from 15.7 Mtoe in 1990 to 18.6 Mtoe in 2001, maintaining a share of TPESat 6.8%. The renewables contribution is primarily from biomass and hydro sources.
In 2001, nuclear accounted for more than 75% of electricity generation. Coal accounted for about 4.5%and oil for 1%. Hydropower provided about 13.5% of electricity production.
PART 2: COUNTRY PROFILES
Source 1970 1980 1990 1995 2000 2001 Imports
Coal 37.1 32.9 20.2 16.0 15.0 12.7 88.2%Oil 93.6 108.1 87.3 85.0 87.2 93.8 100.0%Gas 8.2 21.6 26.0 29.6 35.4 37.1 92.9%Nuclear 1.5 16.0 81.9 98.3 108.2 109.7 -Renewables 6.6 8.9 15.7 17.9 17.5 18.6 -
Biomass 1.7 2.8 10.9 11.4 11.5 12.0Hydro 4.9 6.0 4.6 6.3 5.8 6.4Geothermal 0.0 0.0 0.1 0.1 0.1 0.1Wind/Solar 0.0 0.0 0.1 0.1 0.1 0.1
Total 147.0 187.7 227.1 240.8 257.4 266.0 50.3%% Renewables 4.5% 4.7% 6.8% 7.2% 6.6% 6.8%
* See Annex 2 for explanation of components in total and definition of biomass.

FRANCE
269
Policy Timeline
Research and Development
Market Deployment
. Fiscal Scheme – French Islands
. Grants Rural System
. Geothermal Risk Coverage
. Biofuel Programme
. Rural Renewables Electricity
. Wind Power Tender
. Wood Energy
. Biogas Tender
. Plan Soleil
. Feed-in Tariffs
Energy Policy Context
. Fiscal and Tax Incentives
. Multi-year ADEME Renewables Contrat d‘État
Denotes a significant change to a policy, such as an extension, repeal or revision.
Mtoe
0
2
20
4
6
8
10
12
14
16
18
1971
1973
1975
1977
1979
1981
1983
1985
1987
1989
1991
1993
1995
1997
1999
2001
Figure 3. Total Renewable Energy Supply and Policy Timeline
Geothermal
Solarand Wind
Hydro
CombustibleRenewables
and Waste
Renewable Energy Supply
Biomass and hydropower account for the largest shares in renewable energy supply in France. In 2001,biomass was 64% and hydro power was 35% of total renewable energy supply. Renewables for electricityproduction in 2001 included: hydropower generation capacity at 21 GW (excluding pumped storage),and municipal solid waste at 272 MW. Municipal solid waste production increased on average by 4.7%per year from 1990 to reach 79 869 TJ in 2001.
France is well endowed with renewable resources, and has had some success in developing them, e.g.,off-grid PV applications on la Reunion and the biomass programme for biofuels and wood energy. In

270
recent years, solar thermal applications were boosted through a national initiative called “Plan Soleil” andelectricity generation from renewables was promoted on the overseas islands as well as in mainlandFrance. Electricity generation from biomass is essentially in the overseas territories where sugar residuesare burned in three plants. As well, there is on-site production in the pulp and paper industry in mainlandFrance. France is the largest producer of biodiesel, a methyl ester from vegetable oil. France has adopteda national target as an EU member country to reach 22.1% of electricity output from renewable sourcesby 2010.
Hydropower is considered a mature technology in France, and continues to make a significantcontribution. Installed capacity was about 21 000 MW in 2001. The only other renewable making asignificant contribution to primary energy supply is combustible renewables and waste; most of which isin the form of wood heating in rural regions, as well as about 272 MW of electricity generation.
PART 2: COUNTRY PROFILES
Capacity (MW)
0
3000
500
1000
1500
2000
2500
Figure 4. Net Generating Capacity of Renewable and Waste Products
Hydro (<1 MW)
Hydro (1–10 MW)
Solar all Plants
Tide, Waveand Ocean
Wind
MunicipalSolid Wastes
Wood/Wood Wastes/
Other Solid Wastes
1990
1995
1996
1997
1998
1999
2000
2001
Research and Development Trends
France reports having spent a total of US$ 9.8 billion (2002 prices and exchange rates) on governmentenergy RD&D between 1985 and 2002 (data not available before 1985). The share of renewable energyRD&D in total energy RD&D was less than 2% over the period. Government RD&D expenditures forrenewables declined steadily from 1985 until 1998, but increased to 2002.
Among the renewable technologies, biomass received the highest level of funding at US$ 65.2 million, or34.4%. Solar photo-electric was funded at US$ 63.8 million, representing 33.6% of renewable energyRD&D funding. Geothermal was the third largest recipient with 16.9% of the renewable RD&Dexpenditures.
The main research institutions include the laboratories at the French Atomic Energy Commission (CEA),French National Center for Scientific Research (CNRS), universities, L'Institut Français du Pétrole (IFP),Bureau de Recherches Géologiques et Minières (BRGM), and the Agency for Environment and EnergyManagement’s (ADEME). Renewable energy research and development is focused on solar energy, wind,
Note: A change in data collection methods at the IEA occurred in 1999 with the separation of net generating capacity between small and large hydro.Capacity data for small hydro are not available prior to 1999.

FRANCE
271
biomass, hydrogen and fuel cells, and geothermal (hot dry rock at Soultz site in Alsace). The research onrenewables is often structured in networks.
In 2002, research institutions had an overall budget for energy of € 940 million (including governmentbudgets and industrial contracts). The budget was allocated: € 580 million for nuclear, € 230 million forfossil fuels, € 50 million for renewables, € 40 million for energy efficiency and € 40 million for hydrogenand fuel cells. The government contribution to this budget was about € 600 million.
In addition, France participates in international collaborative RD&D in Bioenergy, Hydropower,Photovoltaic Power Systems, Solar Heating and Cooling and SolarPACES through the IEA ImplementingAgreements. Much of France’s research on renewables is conducted in the context of the Europeanframework programmes.
Million US$ (2002 prices and exchange rates)
0
900
100
200
300
400
500
600
700
800
Figure 5. France – Government Energy RD&D Budgets
Total OtherTech./Research
TotalConservation
Total Power& Storage Tech.
Total NuclearFission/Fusion
Total RenewableEnergy
Total FossilFuels
1985
1987
1989
1991
1993
1995
1997
1999
2001
Million US$ (2002 prices and exchange rates)
0
30
5
10
15
20
25
Figure 6. France – Government Renewable Energy RD&D Budgets
SolarPhoto-Electric
Solar Heating& Cooling
Small Hydro(<10 MW)
Geothermal
Biomass
Wind
1985
1987
1989
1991
1993
1995
1997
1999
2001

272
Market Deployment Trends
Much of France’s renewable energy market deployment efforts have been directed to the overseasdepartments. France has been promulgating policies to support renewables since the 1980s, when a riskfund for geothermal went into effect and fiscal schemes were designed to promote renewables in theoverseas French departments.
Lower taxation for biofuels has been in place since 1992 and a programme to stimulate biofuels technologyhas operated since 1994. Beginning in 1995, investment grants were available for rural electrificationprojects based on renewable energy. The first competitive tender for wind power was launched in 1996.ADEME’s budget for renewables was considerably increased in 1999, and a series of policies wereestablished to address specific technologies, including biomass, solar thermal energy and biogas.
These early deployment policies had a limited effect on renewable energy markets. Since the late 1990s,market deployment policies for renewables appear to have been more effective. A programme for ruralelectrification from renewables resulted in an increase in installed capacity from 700 kW to 1.1 MW peryear from 1999 to 2002. A solar thermal initiative in 2000 called Plan Soleil and another initiative for wooduse in small-scale district heating systems were also implemented. The most recent renewables deploymentactivities concern electricity generation from wind, hydropower and geothermal energy on the island ofGuadeloupe. It is, however, too soon to measure clear trends from these deployment efforts.
The Electricity Law in 2000 confirmed non-discriminatory access to the grid for electricity productionfrom renewables and set the stage for higher feed-in tariffs. Standardised rules concerning the cost sharingof the grid connection and reinforcement between the producer and the grid operator were published in2001-2002.
In addition, the Electricity Law of 2000 provided for guaranteed purchases and feed-in tariffs for projects upto 12 MW. These tariffs were put in place in 2001 and revised in 2002. The tariffs are based on the cost ofproduction, including investment and operation that Electricité de France (EdF) would incur to provideequivalent power and may be subject to a bonus when the plant contributes to objectives of the ElectricityLaw. Network operators (EdF and other distribution network operators) are obliged to purchase electricityat the defined tariffs. The Law also established the principle of competitive tenders for any power class.Other recent policies include tax credits or reductions for the purchase of renewable equipment and apublic/private investment fund.
Currently, there are feed-in tariffs for all renewables except large hydro. Tariffs range from € 0.045/kWhfor municipal waste to € 0.0310/kWh for PV. Purchase contracts given by EdF last for a minimum of 10-15 years, with a maximum of 20 years for PV or small hydro. For example, wind power starts at € 0.0838/kWh for the first five years, after which it drops to between € 0.03 and € 0.083/kWh, dependingon the quality of the sites and turbine productivity. There are also national incentives related to investmentcosts (i.e., for PV, small hydro and biogas), which can be supplemented by local authorities (regions ordepartments).
Competitive tenders were launched in 2003 for: onshore wind (500 MW); offshore wind (500 MW);biomass (200 MW) and biogas (50 MW) for projects to be built before 2007. Calls for tender are notlimited to French energy producers, but can include any person established in an EU member state orcountry that is party to an international energy treaty with France.
Incentives to promote wind power are in place, but there are public acceptance difficulties which slowthe construction of new plants and require careful consideration and information for the public. The
PART 2: COUNTRY PROFILES

FRANCE
273
legislative conditions for building wind power facilities were completed in 2003 and a ministerial circularto local authorities has clarified the administrative procedures.
Most of the incentives for wind power have been established too recently to measure impacts. By 2003, onlyabout 239 MW of wind power had been installed, though there were many projects in the planning stages.
A recently launched call for tender, a feed-in tariff and the Loi Paul/Girardin in the overseas territories areexpected to spur growth in biomass electricity generation. The Loi Paul/Girardin provides personal incomereduction for private investments in the overseas territories, limited to 60% of the income paid byindividuals. This fiscal instrument is primarily used by renewable energy operators to attract individualinvestment.
There was a recent increase of solar thermal applications in mainland France in the 2000-2003 period.About 83 000 m2 of solar collectors were installed in 2003 both on the continent and in overseasdepartments. Thermal renewables are promoted through grants, particularly in two multi-year programmesmanaged by ADEME on wood and solar thermal, and regulatory and fiscal measures.
Energy Policy Context
General policy issues are dealt with in the context of European directives (renewable energy in theelectricity system, biofuels and energy efficiency in the building sector). The directives are the maindriving force for France’s renewable energy policy.
A multi-year programme (ADEME) in 2003 established capacity target increases for each renewable electricitytechnology by 2007: biogas 50-100 MW; biomass 200-400 MW; wind onshore 2 000-5 000 MW, geothermal10-60 MW; hydropower 200-1 000 MW; solar PV 1-50 MW. Clearly wind energy is the priority technology,followed by biomass.
A national debate organised in 2003 concerning a new energy strategy – options for the long term – isexpected to lead to the adoption of a new framework energy law which will give a key place to energyefficiency and the promotion of renewable energy.

274
PART 2: COUNTRY PROFILES
Renewable Energy Markets
Hydropower
Hydropower
Hydropower capacity increased slightly from 24 987 MW in 1990 to 25 638 MW in 2001. Generationfrom hydropower accounted for 13.5% of total electricity generation and for 95% of generation fromrenewables.
From 1970 to 2001, large hydro plants (> 10 MW) represented, on average, 90% of hydropowerproduction. Hydro facilities between 1 and 10 MW accounted for about 7% of the production. The Ranceis the only installation in the world generating electricity from tidal waves, and is counted as hydropower.
There is no perspective of additional capacities for hydropower >100 MW in continental France. Thereremains potential for mid-size hydropower development equalling about 2 000 MW, but projectimplementation faces strong local opposition. In the French overseas territories (Guyana, Guadeloupe,Corsica and la Reunion), new projects in the 0.5 to 10 MW range show potential.
Biomass Heat ProductionHeat production from solid biomass was 1 465 in 2001. Heat production has increased by 22% per yearsince 1990.
1993
1994
1995
1996
1997
1998
1999
2000
2001
2002
2003
1991
1992
1990
1993
1994
1995
1996
1997
1998
1999
2000
2001
–0.2%
0%
0.2%
0.4%
0.6%
0.8%
1%
1.2%
Capacity (MW) Gross Electricity Production (GWh)
–0.4%
Hydropower Policy Timeline
. Target
. Feed-in Tariffs
Denotes a significant change to a policy, such as an extension, repeal or revision.
1991
1992
20100
20200
20300
20400
20500
20600
20700
20800
20900
21000
21100
19901991
19921993
19941995
19961997
19981999
20002001
Capacity
0
10000
20000
30000
40000
50000
60000
70000
80000
90000Production
Figure 7. Hydropower Capacityand Electricity Production
Figure 8. Hydropower Capacity(Year to Year Change)

FRANCE
275
To complement a 1994-1998 plan for wood energy and local development, a new action plan waslaunched in 1999 for a six-year period to develop thermal uses of biomass (wood waste, forest residues)on domestic, collective and industrial fields.
For district and industrial heating, the programme foresees the installation of 1 000 new wood-basedheating systems by 2006. This is estimated to deliver savings of 300 000 toe per year and an annualreduction in CO2 emissions of 700 000 tonnes. It offers assistance in the form of technical adviceand investment subsidies. In addition, an experimental action titled “Call for Tender - Carbon Energy”has been launched for the wood drying industry for selected biomass projects based on the price ofCO2 tonne.
For domestic heating, the programme seeks to maintain the same national wood consumption by 2006and to improve the energy and environmental efficiency of wood combustion. It includes acommunication plan by supporting best practices for wood combustion for public/privates operators.Quality labels have been established with manufacturers for wood devices.
Wind Power Electricity production from wind was 2 GWh in 1993 and increased steadily to reach 125 GWh in2001. Wind energy has a high potential in France both onshore (50-60 TWh of potential) and offshore(90 TWh).
1993
1994
1995
1996
1997
1998
1999
2000
2001
2002
2003
1991
1992
1990Biomass Heat Policy Timeline
. Wood Energy Action Plan
. Tax Credit
. Target
Denotes a significant change to a policy, such as an extension, repeal or revision.
Production
0
1600
200
400
600
800
1000
1200
1400
Figure 9. Solid Biomass Heat Production
Gross HeatProduction (TJ)
1990
1991
1992
1993
1994
1995
1996
1997
1998
1999
2000
2001

276
A call for tender in 1996 through the Eole 2005 Programme stimulated development of onshorewind power capacity. The goal of the Eole 2005 Programme was to increase the supply of large-scale grid-connected wind electricity to 250 MW by 2005 with projects being selected basedon electricity price criteria. The data suggest that the increase in installed capacity from 4 MW in 1995to 81 MW in 2001 may have been attributable in part to the benefits provided by the Eole 2005Programme.
According to French authorities, by 2003 239 MW of wind power had been installed. Competitive tendersfor 500 MW of onshore and 500 MW of offshore wind developments were launched in 2003.
The Eole 2005 Programme came to an end with the new regime put in place by the Electricity Law of2000. The policy approach is based on feed-in tariffs for projects up to 12 MW and on calls for tendersabove this size for both onshore and offshore wind power developments.
Solar Thermal Production Solar thermal production decreased slightly from 894 TJ in 1990 to 765 TJ in 2001. In the French overseasdepartments (DOM), the Chauffe-eau Solaires Programme was implemented in 1999 with an objective of13 000 installations by 2003 for solar collector surface of 45 000 m2. The programme operates byproviding investment grants in support of solar thermal installations. The programme’s initial objectiveswere met in 2000.
PART 2: COUNTRY PROFILES
993
199
1994
1995
1996
1997
1998
1999
2000
2001
2002
200399
119
919
9992
199990
1993
1994
1995
1996
1997
1998
1999
2000
2001
50%
100%
150%
200%
250%
Capacity (MW) Gross Electricity Production (GWh)
0%
Wind Power Policy Timeline
. Eole Tender
. Feed-in Tariffs
. Target
. Competitive Tender
Denotes a significant change to a policy, such as an extension, repeal or revision.
1991
1992
0
10
20
30
40
50
60
70
80
90
19901991
19921993
19941995
19961997
19981999
20002001
Capacity
0
20
40
60
80
100
120
140Production
Figure 10. Wind Power Capacityand Electricity Production
Figure 11. Wind Power Capacity(Year to Year Change)

FRANCE
277
The French targeted their mainland market, which expanded rapidly following the launch of a nationalinitiative, called Plan Soleil, in 2000 that provides grants for the purchase of individual and collective solarthermal systems on the mainland. The programme has the following objectives: 112 000 m2 of solarcollectors installed by 2006 (per year) and a cumulative objective of 330 000 m2 (from 2000 to 2006).This is expected to lead to an installed capacity of 1 000 000 m2 of solar collectors by 2006.
Solar PhotovoltaicPhotovoltaic capacity increased from 3 MW in 1995 to 14 MW in 2001. The government expects the grid-connected market to grow by 10 MW per year by 2010.
The solar PV market has been targeted by a number of market deployment policies including capitalgrants, feed-in tariffs, reduced VAT tax for equipment and investment tax credits. France instituted a ruralelectrification scheme in 1995 which is currently on-going to provide grants supporting up to 65% ofeligible investment costs. Rural electrification developments that employ renewable energy sourcesreceive funding from the FACE (Fonds d'Amortissement des Charges d'Electrification) specific fund.
Most other deployment policies came into effect after 1999, which may have worked in concert with therural electrification scheme. The other policies consist of tax credits in the form of reduced sales tax andtax exemptions for equipment for renewable energy production and the Electricity Law of 2000 thatprovides feed-in tariffs benefiting the PV market. Feed-in tariffs were revised in 2001 to € 0.305/kWh in overseas departments and Corsica, € 0.0155/kWh for mainland France accompanied by a grant of € 4.60/watt for direct grid-connected installations.
993
199
199994
995
199
199996
997
199
199998
999
199
200000
001
200
200002
003
20099
119
919
9992
199990Solar Thermal Policy Timeline
. Plan Soleil (grants)
. Tax Credit
Denotes a significant change to a policy, such as an extension, repeal or revision.
Production
0
1000
100
200
300
400
500
600
700
800
900
Figure 12. Solar Thermal Production
Production (TJ)
1990
1991
1992
1993
1994
1995
1996
1997
1998
1999
2000
2001

278
PART 2: COUNTRY PROFILES
1993
1994
1995
1996
1997
1998
1999
2000
2001
2002
2003
1991
1992
1990
1993
1994
1995
1996
1997
1998
1999
2000
2001
10%
20%
30%
40%
50%
60%
Capacity (MW) Gross Electricity Production (GWh)
0%
Solar PV Policy Timeline
. Grants – Rural Electricity
. Feed-in Tariffs
. Tax Credit
. Targets
Denotes a significant change to a policy, such as an extension, repeal or revision.
1991
1992
0
2
4
6
8
10
12
14
16
19901991
19921993
19941995
19961997
19981999
20002001
Capacity
0
1
2
3
4
5
6Production
Figure 13. Solar Photovoltaic Capacityand Electricity Production
Figure 14. Solar Photovoltaic Capacity(Year to Year Change)

279
Japan Policy Chronology
FRANCE
Renewable Energy Development in OverseasFrench Islands
Year 1980s - Present
Policy Description This fiscal scheme was designed for financial, institutional or industrialcompanies to develop investments for renewable energy in French islands. Thisscheme has been operating since the 1980s and is still in place today
Policy Type Investment tax credits
RE Technology All renewables
Risk Coverage Fund
Year 1980s -2012
Policy Description The risk coverage fund is dedicated to low enthalpy geothermal plants (withheat distribution networks). It was designed in the early 1980s to cover the risksassociated with the long-term exploitation of geothermal sources. The riskcoverage scheme was extended in 2000 for 10 years until 2012.
Policy Type Third-party finance
RE Technology Geothermal
Biofuel Production Programme
Year 1990s - Present
Policy Description This national financial programme aims to develop investments for biofuelproduction (diester and ethanol). Biofuel production progressed significantlyfrom 1994 to 2000. Consumption of ethanol derived from beets and wheat rosefrom 38 500 to 90 437 tonnes and consumption of rapeseed and sunflower oilesters rose from 64 400 to 308 870 tonnes.
Policy Type Capital grants
RE Technology Biofuel
Rural Electrification Using Renewables
Year 1995 - Present
Policy Description Rural electrification bodies using renewables (PV, hydro or wind) receivefunding from the FACE specific fund (decision taken at national level). Thegrants support up to 65% of investment cost.
France Policy Chronology

280
PART 2: COUNTRY PROFILES
Policy Type Capital grants
RE Technology HydroSolar photovoltaicOnshore wind
Wind Energy Programme
Year 1996-2000
Policy Description In 1996 the government launched the “EOLE” Programme, which aimed toincrease the supply of large-scale grid-connected wind electricity to at least250 MW by 2005. Projects were selected based on electricity price criteria. Thelength of the contracts is often 25 years. The EOLE tender contracts resulted inprices of about € 0.45/kWh. As of 2002, a feed-in tariff was put in place tosupport projects under 12 MW. In 2003, it was decided to also launch calls fortenders (onshore and offshore) for larger projects.
Policy Type Bidding systems/Guaranteed prices/feed-in tariffs
RE Technology Offshore windOnshore wind
TIPP (Tax on Petroleum products)
Year 1998 - Present
Policy Description TIPP (tax on petroleum products) is the main tax on petroleum products usedas fuel (diesel, petrol, LPG; heavy and light oil) or heating fuel. The tax on fossilfuels was modified in 1998 and provides funds to ADEME to supportprogrammes for energy conservation and renewable energy deployment.
Policy Type Fossil fuel taxes
RE Technology All renewables
Wood Energy Programme
Year 1999 - Present
Policy Description To complement a 1994-1998 plan for wood energy and local development, arevised action plan was launched in 1999 for a six-year period to developthermal uses of biomass (wood waste, forest residues).
• For district and industrial heating, the programme foresees the installation of1 000 new wood-based heating systems by 2006. This is estimated to deliversavings of 300 000 toe per year and an annual reduction in CO2 emissions of700 000 tonnes. It offers assistance in the form of advice/decision tools andinvestment subsidies. In addition, an experimental action titled “Call forTender - Carbon Energy” has been launched for the wood drying industrysector to select biomass projects based on the price of CO2 per tonne.

FRANCE
281
• For domestic heating, the programme seeks to maintain the same nationalwood consumption by 2006 and to improve the energy and environmentalefficiency of wood combustion. It includes a communication plan forsupporting best practices in wood combustion for public/privates operators.Quality labels have been established with manufacturers for wood devices.
Policy Type Capital grants
RE Technology Biomass
Chauffe-eau Solaires dans les DOM
Year 1999 - Present
Policy Description This programme grants investment support for solar thermal installations in France’soverseas departments (DOM). By 2003, the volume of solar water heatersinstalled was 13 000 representing a surface of solar collectors of 45 000 m2. Theprogramme’s initial objective had already been met in 2000.
Policy Type Consumer grants/rebates
RE Technology Solar thermal
Reduced VAT for Residential RenewableEnergy Equipment
Year 1999
Policy Description Reduced rates of VAT are applied to equipment for renewable energyproduction and use that is installed in primary or secondary residencies. TheVAT rate is 5.5% in France and Corsica, and 2.1% in Guadeloupe, Martiniqueand Reunion.
Policy Type Sales taxes
RE Technology All renewables
Biogas Programme
Year 1999
Policy Description • The Agency for Environment and Energy Management (ADEME) andElectricité de France (EdF) launched a biogas from landfill call for tender fornew power capacity of 15 MW.
• ADEME and Gaz de France (GdF) agreement: co-operation on survey onanaerobic digestion (technical, marketing, R&D aspects).
• Support for biogas plants: advice/decision tools for implementation,subsidies for investment costs resulted in four anaerobic digestion units of20 000 to 110 000 tonnes from biowaste (MSW, agricultural wastes) with

282
PART 2: COUNTRY PROFILES
additional support from the European Commission, local authorities andpublic agency water treatment funds.
Policy Type Bidding systems/Capital grants
RE Technology Waste
Renewable Energy Purchasing Conditions
Year 1999
Policy Description This policy provided the enabling conditions for EdF to purchase electricityproduced from renewable sources such as hydro, co-generation, wasteincineration and photovoltaics.
Policy Type Regulatory and administrative rules
RE Technology All renewables
Solar Water Heaters: “Plan Soleil”
Year 2000
Policy Description In 1999, approval was given by the government to the French Agency forEnvironment and Energy Management (ADEME) to launch Plan Soleil. This planis designed to support the development of solar hot water heaters. The firstphase of this programme, specific to individual solar hot water heaters, wasextended to collective applications of solar water heating. The objective is toreach 112 000 m2 per year of collector surfaces installed and 330 000 m2
between 2000 and 2006.
Policy Type Capital grants
RE Technology Solar thermal
Biogas Agreement
Year 1999 - Present
Policy Description A waste management company and the state-owned utility, Electricité de France(EdF), signed an agreement to develop renewable energy from landfill methane.The "biogas project" operating during 1999 was centred near the town of PlessisGassot, home to France's largest municipal waste landfill. The waste managementcompany, which operates the landfill, invested FRF 200 million in theinfrastructure to capture the methane gas and burn it to produce 10 MW ofelectricity. EdF agreed to buy all the electricity production for a term of 12 yearsat a guaranteed price. A second facility at the same site is expected in 2004.
Policy Type Guaranteed prices
RE Technology Waste
FRANCE
283
Electricity Law 2000
Year 2000 - Present
Policy Description Part of this law concerns renewable electricity installations for which thenetwork operators (EdF and other distribution network operators) are obliged topurchase electricity at fixed feed-in tariffs. Among other things, it regulates thefree access of independent energy producers to the grid and laid the foundationfor higher feed-in tariffs for electricity production from renewables and a newtender scheme for renewable energy production capacity.
Policy Type Guaranteed prices/feed-in tariff
RE Technology All renewables
Lois (Laws) Paul and Girardin
Year 2000 and 2003
Policy Description The laws Loi Paul (2001) and Girardin (2003) provide a personal incomereduction for private investments in the overseas territories. The income taxreduction is limited to 60% of the income paid by the individuals. This fiscalinstrument is largely used by renewable energy operators to attract individualinvestment.
Policy Type Tax exemptions
RE Technology All renewables
Contrat de Plan Etat-ADEME
Year 2000-2006
Policy Description This multi-year contract provides incentives to foster investments in renewableenergy projects (under ADEME). Several renewable energy schemes have beendefined and implemented, and a general agreement has been reached onobjectives to be met and funds to be raised and employed in the 2000-2006period.
Policy Type Capital grants
RE Technology All renewables
Crediting System in Favour of Energy Management –FOGIME
Year 2001 - Present
Policy Description The FOGIME was created in 2000 in co-operation with the French developmentbank for small and medium size enterprises (SMEs) and ADEME. The guarantee

284
PART 2: COUNTRY PROFILES
fund for investments in energy sustainability (efficiency and renewables) has abudget of approximately € 17.8 million, of which € 7.62 million comes fromADEME and € 10.21 million come from a branch of the development bank forSMEs (BDPME). This fund guarantees up to € 242 million for loans to the privatesector. Its goal is to provide SMEs with the option to obtain loans for energyefficiency and renewable energy investments.
This guarantee is only available for SMEs created more than three years ago.Eligible investments include: high performance production, use, recovery andenergy storage equipment; energy efficient modifications of productionprocesses and renewables.
The guarantee covers medium and long-term risks (2-15 years) and insures therisk taken by the financial institution providing the loan. The guarantee covers70% of the loan in comparison to 40% average coverage rates for other SMEprojects covered by BDPME.
Policy Type Third-party finance
RE Technology All renewables
Renewable Energy Feed-in Tariffs
Year 2001 - Present
Policy Description All sites qualifying for the mandatory buy-back rates must be under 12 MW ofnominal capacity and have been built after the law was adopted. The followingfeed-in tariffs have been established:
• Wind Energy: production sites can obtain a 15-year contract whichguarantees a € 0.0838/kWh rate for the first five years. The tariff for the nextten years depends on wind conditions. Plants working at full capacity forless then 2 000 hours will continue to get € 0.0838/kWh, while those at fullcapacity for 3 600 hours per year will receive € 0.0541/kWh. These tariffsapply for the first 1 500 MW of nationally installed capacity, thereafter alltariffs decrease by 10% (only for new projects). These tariffs were applicableuntil December 2002. The rates decrease 3.3% per year to reflecttechnology learning.
• Small Hydro: production sites built after publication of the law or for themarginal production from retrofits increasing production by more than 10%can obtain a 20-year contract which guarantees € 0.0610/kWh for sites witha capacity under 500 kW and € 0.0549/kWh for larger ones. An incentivefor regularity of production of up to € 0.0152/kWh is available in winter.
• Combustible Waste: production sites are guaranteed rates of up to € 0.0456/kWh for medium voltage connections and € 0.0418/kWh for highvoltage connections.
• Biogas from waste: production sites can obtain a 15-year contract whichguarantees a € 0.046/kWh rate (without thermal valorisation) or € 0.058/kWh(engine, turbine).

FRANCE
285
• Biomass: production sites can obtain a 15-year contract which guaranteesa rate of € 0.049/kWh to € 0.0647/kWh (bonus for 70% heat valorisation).
• Solar (PV or any radiative technology): The rate is € 0.305/kWh in theoverseas departments and Corsica, and € 0.0155/kWh in mainland France.It also provides a grant of € 4.6/watt for direct grid-connected installations.
Policy Type Guaranteed prices/feed-in tariff
RE Technology All renewables
Campaign SOS Climat
Year 2001 - Present
Policy Description This campaign aims to raise public awareness of climate protection issues andto inform them of the positive impact that renewable energy utilisation can haveon the climate.
Policy Type Public awareness
RE Technology All renewables
Fonds d’Intervention pour l’Environnementet la Maîtrise de l’Energie (FIDEME)
Year 2001 - Present
Policy Description FIDEME is a fund for environment and energy efficiency, and a specific financialscheme to support private investors (maximum financial share of 25% of the totalproject costs). Its goal is to promote investments in environment and energyefficiency projects according to classic financial appraisal techniques but with ahigher level of risk acceptance, which is balanced by higher commissions andinterest rate. In 2001 this mix of private and public funds amounted to€ 45 million with € 15 million coming from ADEME, and € 30 million fromtwo partner financiers.
Policy Type Consumer grants/rebates
RE Technology All renewables
Extension of the Law on Reduced VATfor Residential Renewable Energy Equipment
Year 2002-2003
Policy Description The finance law of 2003 reduced VAT rates applied to equipment for renewableenergy production, and use in residences was extended until 31 Dec 2003. TheVAT rate is 5.5% in France and Corsica and 2.1% in Guadeloupe, Martiniqueand Reunion.

286
PART 2: COUNTRY PROFILES
Policy Type Sales taxes
RE Technology All renewables
Extension of Tax Credit in Favour of RenewableEnergy Equipment in New Housing
Year 2002
Policy Description The finance law of 2003 extended the tax credit for renewable energyequipment in new residences that covers 15% of eligible expenses.
Policy Type Tax exemptions
RE Technology All renewables
Extension of Tax Credit for Large Collective Equipment,Renewable Energy Equipment, Thermal Insulationand Heating Regulation Equipment
Year 2002-2005
Policy Description The finance law of 2003 extended the tax credit for the acquisition of largecollective equipment, renewable energy equipment and thermal insulation andheating-regulation material to 31 December 2005.
Policy Type Investment tax credits
RE Technology All renewables
Bioproducts R&D Programme
Year 2002 - Present
Policy Description Agriculture for Chemical and Energy (AGRICE), a scientific interest group madeup of public and private sector members, supports research on new uses forrenewable plant-based products other than foodstuffs. The scope of AGRICE’sactivity covers primarily the industrial conversion of crop production tochemical (lubricants, surfactants, solvents), energy products (liquid and solidbiofuels) and materials (agrimaterials, biopolymers).
AGRICE’s brief is to stimulate applied technological research. The consortiumfirst tackled work aimed at substituting plant-based products derived from fossilsresources. This strategy has been progressively widened to take into account theinherent characteristics of plant-based products. AGRICE’s action spans thestudy of agronomic improvements, project economics, markets and energy andenvironmental assessments.
Policy Type RD&D

FRANCE
287
RE Technology BiofuelBiomass
Call for Tender for Renewable Electricity
Year 2003
Policy Description A call for tender for renewable energy plants larger than 12 MW. Projects lessthan 12 MW qualify for feed-in tariffs. Responses are expected in mid 2004 andprojects are to be completed by 2007.
Onshore wind (2 × 500 MW)Offshore wind (500 MW)Biomass (200 MW)Biogas (50 MW)
Policy Type Bidding systems/Guaranteed prices/feed-in tariff
RE Technology Onshore wind Offshore wind Biomass Waste


Germany
289

Gas
Coal
Oil
Nuclear
Renewables
Mtoe
0
50
100
150
200
250
300
350
400
1971
1973
1975
1977
1979
1981
1983
1985
1987
1989
1991
1993
1995
1997
1999
2001
Gas 21.5%
Coal 24.2%
Renewables 2.6%
Nuclear 12.7%
Oil 38.9%
Figure 1. Total Primary Energy Supply by Source Figure 2. Shares of TPES 2001
Shares in Figure 2 may differ from Table 1.See Annex 2 for more detail.
290
Total Primary Energy Supply
Table 1. Total Primary Energy Supply by Source (Mtoe)*
Total primary energy supply (TPES) in Germany was 356 Mtoe in 1990 and 351 Mtoe in 2001. Indigenousresources include renewable energy sources, hard coal, lignite and some natural gas, but Germany is anet energy importer (Table 1). Oil dominated TPES with 38% share in 2001. Natural gas accounted for22%. Coal represented nearly a quarter of primary energy demand, down from a 36% share in 1990. Thisis due to the rapidly decreasing use of lignite, which had dominated energy supply in former EastGermany. Nuclear power accounted for 13% of TPES in 2001. Renewables’ share of TPES increased from1.6% in 1990 to 2.6% in 2001.
Renewable energy supply grew from 5.8 Mtoe in 1990 to 9.2 Mtoe in 2001, due to substantial growth inbiomass use and the very rapid growth of wind power. Biomass represented 69% of renewable energysupply, mainly used for heating purposes in the residential sector, followed by hydropower (19%) andsolar and wind power (12%).
PART 2: COUNTRY PROFILES
Source 1970 1980 1990 1995 2000 2001 Imports
Coal 147.8 141.0 128.5 91.6 84.8 85.0 30.3%Oil 137.9 147.1 126.5 135.6 131.7 134.5 98.8%Gas 12.3 51.2 55.0 67.3 71.8 75.6 77.0%Nuclear 1.7 14.5 39.8 39.9 44.2 44.6 -Renewables 4.0 5.4 5.8 6.5 9.0 9.2 -
Biomass 2.5 3.8 4.3 4.4 6.2 6.3Hydro 1.5 1.6 1.5 1.9 1.9 1.8Geothermal 0.0 0.0 0.0 0.0 0.0 0.0Wind/Solar 0.0 0.0 0.0 0.2 0.9 1.1
Total 304.4 360.4 356.2 342.3 343.4 351.1 61.9%% Renewables 1.3% 1.5% 1.6% 1.9% 2.6% 2.6%
* See Annex 2 for explanation of components in total and definition of biomass.
GERMANY
291
Coal is the main fuel used for electricity generation (52%), followed by nuclear at 29% and natural gasat 10% of total electricity generation in 2001. The electricity market was fully liberalised in 1998. Anagreement between the government and the electricity supply industry limits the remaining generation ofnuclear power plants leading to a total phase-out of nuclear power by 2021.
Due to a combination of different policy instruments, there has been rapid and continuous growth in thecontribution of renewables to electricity supply in Germany. The share of renewables almost doubled from1990 to 2001, when they represented 6% of total electricity supply. According to German statistics, windcapacity grew on average by more than 50% per year between 1990 and 2003. More than a third ofglobally installed wind power capacity is in Germany. Two-thirds of the total photovoltaic capacityinstalled in the European Union is in Germany. The German government has committed itself under theEU Directive for Electricity Produced from Renewable Energy Sources 2001 to increase the share ofrenewable energy in electricity supply to 12.5% by 2010 and to 20% by 2020.

292
PART 2: COUNTRY PROFILES
Policy Timeline
Research and Development
. 4th Energy Research Programme
. Investing in the Future Programme
Market Deployment
. Support to Länder
. 250 MW Wind Programme (grants)
. ERP Programme (loans)
. “Roofs” Programme
. Electricity Feed-in Law
. Full Cost Rates
. 100 Million Programme
. Solarthermie 2000
. Green Electricity
. Federal Building Codes
. DtA/KfW Soft LoanProgrammes
. Market Simulation Programme
. Renewable Energy Sources Act (obligation)
Energy Policy Context
. Eco-tax Reform
Denotes a significant change to a policy, such as an extension, repeal or revision.
Mtoe
0
2
12
4
6
8
10
1971 73
1975 77
1979 81
1983 85
1987 89
199 93
1995 97
1999 01
Figure 3. Total Renewable Energy Supply and Policy Timeline
CombustibleRenewables
and Waste
Hydro
Solarand Wind
Renewable Energy Supply

GERMANY
293
Renewable energy supply was 9.2 Mtoe in 2001. Supply increased at an average annual rate of 4.2% from1990 to 2001. Electricity generation from renewables grew by 5.3% per year over the period. Much of thegrowth in renewables in the 1990s is attributed to the 1991 Electricity Feed-In Law. The Feed-In Law andits successor, the Renewable Energy Sources Act 2000, have been the major drivers behind growth inrenewable energy for electricity generation. Renewables were also supported through soft loans forwind, hydropower and biomass-fired power plants and through grants and soft loans for photovoltaicinstallations, i.e., the “1 000 Roofs Programme” and “100 000 Roofs Programme”.
Figure 4 shows installed capacity for renewables, excluding large hydropower, from 1990 to 2001. Windpower capacity increased from 48 MW in 1990 to 8.7 GW in 2001. There was 534 MW of micro-hydrocapacity (> 1 MW) and 887 MW of small-hydro capacity (1-10 MW) in Germany in 2001. Municipal solidwaste (MSW) capacity was 585 MW, largely unchanged from its 1990 level of 550 MW. Solid biomasscapacity was 150 MW, landfill gas 209 MW, sludge gas 78 MW and other biogas 200 MW in 2001. Solarcapacity from all plants was 195 MW.
Capacity (MW)
0
14000
2000
4000
6000
8000
10000
12000
Figure 4. Net Generating Capacity of Renewable and Waste Products
Hydro (<1 MW)
Hydro (1–10 MW)
Solar all Plants
Wind
Landfill Gas
Sludge Gas
Other Biogas
MunicipalSolid Wastes
Wood/Wood Wastes/
Other Solid Wastes
1990
1995
1996
1997
1998
1999
2000
2001
Note: A change in data collection methods at the IEA occurred in 1999 with the separation of net generating capacity between small and large hydro.Capacity data for small hydro are not available prior to 1999.
According to German statistics, renewable energy accounted for 7.9% of total gross electricity generationin 2003.1 Hydropower represented 3.5%. Wind power has been the fastest growing renewable energysource in Germany, representing 3.1% of total electricity generation in 2003. The share of wind power inrenewable-based electricity generation is expected to surpass hydropower in the very near future. Biomassaccounted for 1.2% of electricity generation in 2003. Germany had the largest installed photovoltaiccapacity in Europe, some 400 MW in 2003, generating 332 GWh. In 2003, the total installed capacity ofhydropower was 4.6 GW (excluding pumped storage), wind power 14.6 GW and biomass 1.9 GW. Thefirst geothermal power plant came on-line in November 2003.
1. The 2003 data in this section are German renewable energy statistics.

294
Production of solid biomass grew from 123 259 TJ in 1990 to 190 882 TJ in 2001, steady growth of 4%per year. Solid biomass comprises mainly wood, residues from forestry, wood residues from industry andwood wastes. Solid agricultural residues, e.g., straw, have only recently been used for energy production.About 95% of solid biomass is used for heating purposes. Some one-half of total biomass production isconsumed in the residential sector.
In 2003, heat generation from renewable energy sources was 66.4 TWh, some 4% of final energy demandfor heating purposes. Biomass dominates the heat market, with a share of 84%, but growth in the marketfor solar thermal collectors has been rapid. In 2003, the total installed area was 5.6 million m2 andproduction was 2.5 TWh. Geothermal resources, including near surface use, contributed with 1.5 TWh,0.1% of final energy demand for heating purposes.
Prior to 2003, geothermal energy was used entirely for heat production. Large deployment of geothermalpower generation is envisaged in the near future mainly sponsored by the enhanced remuneration of theRenewable Energy Sources Act 2000. This Act marks the first time that assistance was offered togeothermal producers. Under the Act, producers operating generation plants with capacity of 20 MW orless receive € 0.089/kWh. Operators of larger plants receive € 0.072/kWh.
There are thirty large geothermal heating plants using deep hydrothermal resources in Germany. A largenumber of heat pumps using the energy close to the surface were deployed in the early and mid 1980s.But low heating oil prices in the late 1980s and unreliable heat pump systems on the market resulted inmore systems being decommissioned than installed until the mid 1990s. The market for heat pumps wasrevived through the “100 million programme” in 1995 and through advertising campaigns by theelectricity supply industry.
Research and Development Trends
Germany spent a total of US$ 22.6 billion (2002 prices and exchange rates) on government energy RD&Dbetween 1974 and 2002. About 10% of the total German RD&D budget over this period was allocated torenewable energy RD&D.
PART 2: COUNTRY PROFILES
Million US$ (2002 prices and exchange rates)
0
2500
500
1000
1500
2000
Figure 5. Germany – Government Energy RD&D Budgets
1974
1976
1978
1980
1982
1984
1986
1988
1990
1992
1994
1996
1998
2000
2002
Total OtherTech./Research
TotalConservation
Total Power& Storage Tech.
Total NuclearFission/Fusion
Total RenewableEnergy
Total FossilFuels

GERMANY
295
Government RD&D expenditures for renewables peaked in the early 1980s and declined notably in the1980s and 1990s. The government RD&D budget for renewables, however, did not exhibit such a rapiddecline. Budget outlays for renewable energy RD&D averaged US$ 82 million from 1990 to 2002.
Among the renewable technologies, solar PV received the highest level of funding at US$ 1.1 billion, or49%, from 1974 to 2002. Wind was funded at US$ 446 million, representing 20% of renewable energyRD&D. Solar heating and cooling was the third largest recipient with 13% of the renewable RD&Dexpenditures from 1974 to 2002. Funding peaked in 1982 with outlays of US$ 166 million, half of whichwent to RD&D for solar PV.
Market Deployment Trends
Since the oil price crises in the 1970s, a great deal of effort has been devoted to research anddevelopment of renewable energy in Germany, and by the mid-1980s, many different technologieswere ready for market deployment. But as energy prices declined in the late 1980s, these technologieswere not competitive. Surplus capacity in electricity production exacerbated the ability of renewablesto compete with conventional fuels. Policy support in the form of investment incentives was offeredto renewable energy technologies. In 1989, a subsidy (€ 0.031/kWh) was made available for the first100 MW of installed wind power in Germany within the "100 MW field test programme". In 1991 theprogramme was extended to 250 MW. Improved rules for access to the public grid also supporteddevelopment.
Programmes to support the application of renewables in the heating sector have been in place from theearly 1990s, but the level of support increased substantially in the late 1990s. Support took the form ofgrants within the “Marktanreizprogramm” and within the general housing support as well as soft loanswithin the “ERP-Umwelt- und Energiesparprogramm” and the “DtA-Umweltprogramm”. In addition,almost all federal states (“Länder”) and many local municipalities launched support programmes forrenewable energy technologies. The total public support for these technologies was € 1 517 million in2002, of which € 1 031 stemmed from the Renewable Energy Sources Act.
Million US$ (2002 prices and exchange rates)
0
180
20
40
60
80
100
120
140
160
Figure 6. Germany – Government Renewable Energy RD&D Budgets
SolarThermal-Electric
SolarPhoto-Electric
Solar Heating& Cooling
Geothermal
Biomass
Wind
1974
1976
1978
1980
1982
1984
1986
1988
1990
1992
1994
1996
1998
2000
2002

296
The central policy to promote the deployment of electricity from renewable energy has been a feed-intariff fixing a minimum price for electricity from renewable energy sources. The Parliament introduced theElectricity Feed-In Law (EFL) in 1991 with the support of a broad coalition of political parties. It wasamended in 1998 and revised in the Renewable Energy Sources Act (EEG) in 2000, although the originalsupport mechanism remained the same. The EFL aimed to increase the use of renewables in the nationalelectricity supply system and to deploy renewable energy technologies on the market, thereby creating anew industry.
The EEG expanded the reasons for supporting renewable energy to include sustainable developmentof the electricity supply system. This regulation ensured grid access for electricity generated fromhydropower, biomass, biogas, wind power or solar radiation. Moreover, it obliged the electricitysupply company operating the public grid to pay premium prices for the electricity supplied fromthese renewable energy facilities. The premiums in the EFL were calculated annually as a percentageof the mean specific revenues for all electricity sold via the public electricity grid in the previousyear. The percentage ranged between 65% and 90% depending on the technology. The financialburden imposed by the Law was exclusively borne by electricity suppliers and their customers(Figure 7).
A number of issues arose after the Law was introduced in 1991. Growth in wind power led to a situationwhere under the law, electricity customers in northern Germany, where the majority of wind powerinstallations are located, had to pay a considerably higher share of the total costs than electricitycustomers in the southern part of the country.
As an intermediate solution, a “double cap” was introduced in the EFL in 1998, limiting the amount ofrenewable energy electricity that had to be remunerated according to the Law. Regional electricitysuppliers only had to purchase a maximum share of 5% of their total electricity supply from renewableenergy electricity producers. The same cap applied to preliminary suppliers, leading to a total cap of 10%.With the liberalisation of the electricity market in 1998, the question of equal distribution of burdens alsobecame more important.
PART 2: COUNTRY PROFILES
Production of Liquid Biofuels
Germany produced 500 000 tonnes of liquid biofuels in 2001, doubling its 2000 production level.According to German statistics, production was 550 000 tonnes in 2002 and 650 000 tonnes in2003, when it represented almost 1% of total final energy demand for transport fuels.
Historically, Germany has strongly promoted biodiesel. Both pure and blended biodiesel isincreasingly available at petrol stations. German Volkswagen was the first European car manufacturerto approve the use of biodiesel in its vehicles. The German government promotes the use of liquidbiofuels for use in motor vehicles through tax exemptions amounting to € 0.77/litre for rapeseedmethyl ester. Biodiesel is sold in some 250 filling stations. In November 2003, the governmentproposed changes to the tax law in accordance with a new EU Directive. The change would entaila 100% tax exemption for biofuels from petrol taxes for a period of six years. The exemption wouldbe granted to blends of up to 5% bio-ethanol, and exclusively for undenatured alcohol.

GERMANY
297
The regulated electricity prices had maintained constant remuneration levels over the years, and thus hadprovided investors with stable and certain revenue streams. However, the introduction of competition ledto a decline in the mean electricity prices, which were the basis of the remuneration. Renewable energyremuneration levels therefore declined. Since renewable energy generators based their investmentcalculations on stable remuneration over the lifetime of the power plants, which was reasonable under amonopoly situation, the decline of renewable energy remuneration caused severe financial problems forsome generators. Another problem with the EFL was specific to wind power. Since the generation cost ofwind power depends to a great extent on the wind speed at the specific sites, the remuneration was ofteninsufficient for turbines on inland sites, whereas some plants on coastal sites made extra profits.
To accommodate these issues, the EFL was revamped and broadened to the Renewable Energy SourcesAct (Erneuerbare Energien Gesetz - EEG) in 2000. Reflecting the new structure of electricity markets, theobligation to purchase renewable energy electricity is now imposed on grid operators and electricitysuppliers (Figure 8). This leads to a mechanism where the renewable energy generator delivers electricityto the grid operator, who then passes the renewable energy electricity on to electricity suppliers.
The scope of the regulation was broadened to include geothermal power plants and large biomass plants.Cost-based tariffs were introduced, which means that the level of the remuneration is calculated on thebasis of the electricity generation costs of the individual technology. All renewable energy generators,except wind power, get the same specific remuneration over a twenty-year period. A high remunerationis paid for a fixed total production of electricity. After reaching the limit the remuneration is decreased andthe lower remuneration is paid until 20 years after the commissioning of the plant.
The level of remuneration in the EEG is higher for some technologies compared to the levels in the EFL.Photovoltaic equipment built in 2004 receive € 0.434/kWh, small hydro € 0.0767/kWh, geothermalpower between € 0.0716/kWh and € 0.0895/kWh, and electricity generated from biomass between€ 0.084/kWh and € 0.101/kWh. For an individual plant, the remuneration level stays fixed for twentyyears.
Figure 7. Cash Flows and Energy Flows in the 1991 Electricity Feed-in Law
REGenerator
RegionalSupplier
Electricity Cash flow
Obligation by law to purchase and to pay
SuperordinatedSupplier
Customer Customer

298
This principle does not apply to wind power. The specific wind speed at the individual plant site is usedto determine the duration of remuneration paid for wind power. On average across sites, wind powerreceives € 0.084/kWh over a twenty-year lifetime.
Since 2002, the remuneration paid for newly commissioned plants has been reduced annually by acertain factor to provide stronger incentives for cost reductions. This factor is 5% for photovoltaicinstallations, 1.5% for wind power plants and 1% for biomass-fuelled plants. A board consisting of theElectricity Supply Industry, renewable energy generators, public officials and researchers periodicallyreviews the remuneration level and related issues.
The EEG also stipulates obligations concerning grid connection and reinforcement. Plant operators haveto pay for the grid connection, but the grid operator has to bear the cost of grid reinforcement if necessary.
The EFL was mainly intended to help independent power producers. However, plants operated by theelectricity supply company could obtain the premium prices if they were situated outside the supply areaof the individual company. The EEG does not distinguish on the basis of plant ownership, meaning thatany plant technically eligible for the remuneration will be remunerated under the Law.
In addition to the EFL and EEG, other policies were introduced to promote the market deployment ofrenewable energies in the electricity sector, to support further research and development and to establishrenewable energy technologies in a political framework. The 1 000 Roofs Programme in 1991 offeredinvestment grants for around 2 000 photovoltaic installations. After several years of minimal federal supportfor PV and low deployment of PV technology, the 100 000 Roofs Programme was established in 1999. Itaimed to support the installation of an additional 300 MW of PV by 2003. It provided soft loans with aninterest rate reduction of up to 4.5%, 100% coverage, ten-year loan term, and first two years withoutdischarge. These loans were equivalent to a subsidy of 23% of the investment. Together with the favourableremuneration under the EEG, this support led to rapid growth of PV installations, with some 388 MW installedby end of 2003.
Two federal banks award soft loans with low interest rates (2 percentage points below market level) andfavourable payment conditions. Access to capital is very important for deploying renewable energies,
PART 2: COUNTRY PROFILES
Figure 8. Cash Flows and Energy Flows in the Renewable Energy Sources Act
REGenerator
Cash flow
TransmissionGrid Operator
GridOperator Retailer
Electricity
Regulated by law
TransmissionGrid Operator
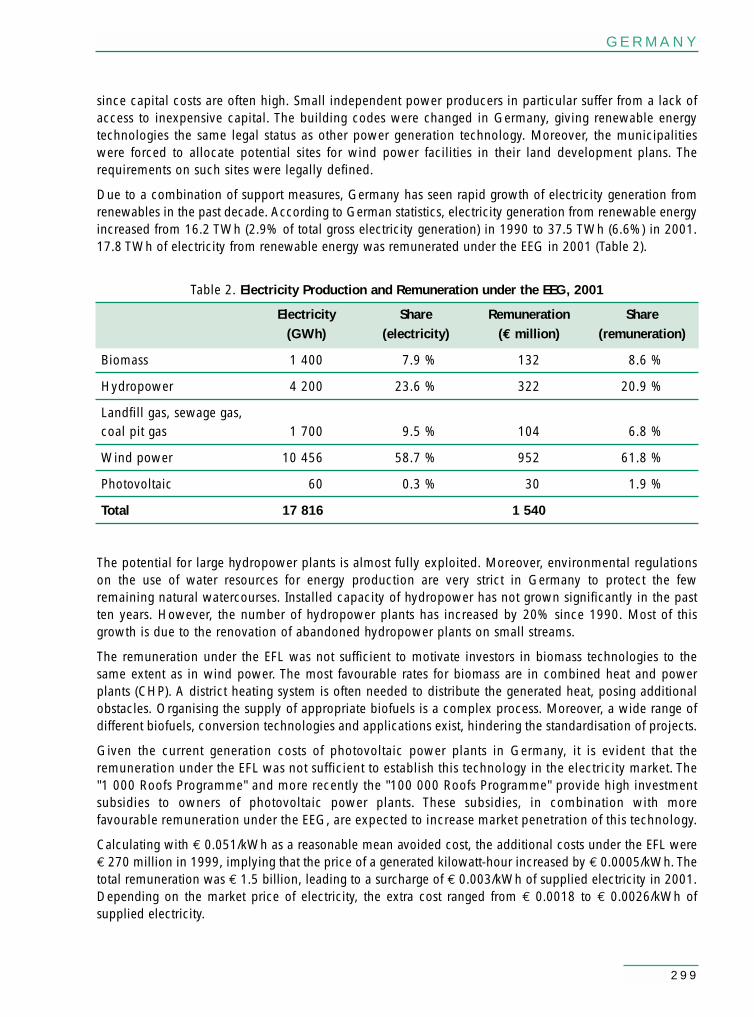
GERMANY
299
since capital costs are often high. Small independent power producers in particular suffer from a lack ofaccess to inexpensive capital. The building codes were changed in Germany, giving renewable energytechnologies the same legal status as other power generation technology. Moreover, the municipalitieswere forced to allocate potential sites for wind power facilities in their land development plans. Therequirements on such sites were legally defined.
Due to a combination of support measures, Germany has seen rapid growth of electricity generation fromrenewables in the past decade. According to German statistics, electricity generation from renewable energyincreased from 16.2 TWh (2.9% of total gross electricity generation) in 1990 to 37.5 TWh (6.6%) in 2001.17.8 TWh of electricity from renewable energy was remunerated under the EEG in 2001 (Table 2).
Electricity Share Remuneration Share(GWh) (electricity) (€ million) (remuneration)
Biomass 1 400 7.9 % 132 8.6 %
Hydropower 4 200 23.6 % 322 20.9 %
Landfill gas, sewage gas,coal pit gas 1 700 9.5 % 104 6.8 %
Wind power 10 456 58.7 % 952 61.8 %
Photovoltaic 60 0.3 % 30 1.9 %
Total 17 816 1 540
Table 2. Electricity Production and Remuneration under the EEG, 2001
The potential for large hydropower plants is almost fully exploited. Moreover, environmental regulationson the use of water resources for energy production are very strict in Germany to protect the fewremaining natural watercourses. Installed capacity of hydropower has not grown significantly in the pastten years. However, the number of hydropower plants has increased by 20% since 1990. Most of thisgrowth is due to the renovation of abandoned hydropower plants on small streams.
The remuneration under the EFL was not sufficient to motivate investors in biomass technologies to thesame extent as in wind power. The most favourable rates for biomass are in combined heat and powerplants (CHP). A district heating system is often needed to distribute the generated heat, posing additionalobstacles. Organising the supply of appropriate biofuels is a complex process. Moreover, a wide range ofdifferent biofuels, conversion technologies and applications exist, hindering the standardisation of projects.
Given the current generation costs of photovoltaic power plants in Germany, it is evident that theremuneration under the EFL was not sufficient to establish this technology in the electricity market. The"1 000 Roofs Programme" and more recently the "100 000 Roofs Programme" provide high investmentsubsidies to owners of photovoltaic power plants. These subsidies, in combination with morefavourable remuneration under the EEG, are expected to increase market penetration of this technology.
Calculating with € 0.051/kWh as a reasonable mean avoided cost, the additional costs under the EFL were€ 270 million in 1999, implying that the price of a generated kilowatt-hour increased by € 0.0005/kWh. Thetotal remuneration was € 1.5 billion, leading to a surcharge of € 0.003/kWh of supplied electricity in 2001.Depending on the market price of electricity, the extra cost ranged from € 0.0018 to € 0.0026/kWh ofsupplied electricity.

300
PART 2: COUNTRY PROFILES
Renewable Energy Markets
Hydropower
Total capacity of hydropower (excluding pumped storage) was 4.3 GW in 2001. Hydropower representssome two-thirds of total electricity generated from renewable energy sources.
Run-of-river power plants represent 80% of total generation from hydropower plants followed by storage(14%) and pumped storage power plants (6%, only natural inflow accounted). The bulk of production comesfrom 403 hydropower plants with a capacity larger than 1 MW. Energy supply companies operate most ofthese plants. In addition, there are approximately 5 500 hydropower plants with a capacity less than 1 MW.Most hydropower plants are located in southern Germany.
Most hydropower sites have been fully exploited, but there is some potential for small plants that havebeen abandoned. In the former German Democratic Republic, around 3 500 small hydropower plantsin operation before World War II were no longer operating at the time of reunification. Since then, some
1993
1994
1995
1996
1997
1998
1999
2000
2001
2002
2003
1991
1992
1990
1993
1994
1995
1996
1997
1998
1999
2000
2001
–40%
–30%
–20%
–10%
0%
10%
20%
30%
40%
50%
Capacity (MW) Gross Electricity Production (GWh)
–50%
Hydropower Policy Timeline
Market Deployment
. ERP Programme (loans)
. Electricity Feed-in Law
. Länder programmes (demonstration, grants, soft loans)
. Green Electricity
. Federal Building Codes
. Renewable Energy Sources Act
Denotes a significant change to a policy, such as an extension, repeal or revision.
1991
1992
0
1000
2000
3000
4000
5000
6000
7000
8000
19901991
19921993
19941995
19961997
19981999
20002001
Capacity
0
5000
10000
15000
20000
25000Production
Figure 9. Hydropower Capacityand Electricity Production
Figure 10. Hydropower Capacity(Year to Year Change)

GERMANY
301
300 plants have been reactivated. There is also some potential for upgrading hydropower plants largerthan 1 MW that are operating with outdated technology.
Before the introduction of the Electricity Feed-In Law, access to the grid was a major barrier for smallhydropower plants. Obtaining access is still costly and time consuming. Investors are also required tosubmit environmental assessment plans.
Under the Renewable Energy Sources Act of 2000, generation from hydropower is remunerated at thefollowing rates: € 0.0767/kWh for plants less than 500 kW, € 0.0665/kWh for plants in the range of500 kW to 5 MW. This represents a substantial increase in the remuneration under the ElectricityFeed-In Law. The Renewable Energy Sources Act has particularly provided stimulus for modernisation andreactivation of small hydropower plants. A planned amendment to the Renewable Energy Sources Actcould also give favourable remuneration to plants larger than 5 MW, but only to the share of totalgeneration that is added due to a modernisation of the power plant. Thus, incentives for the modernisationof existing large hydropower will be provided.
Soft loans are provided for installation and upgrading of hydropower plants within different programmes.Within the “ERP-Umwelt- und Energie-sparprogramm”, 281 installations with a total credit volume of€ 142 million have been supported between 1990 and 2001. The “DtA-Umweltprogramm” provided159 projects with € 84 million credit at the same time. The support of these two programmes can becumulated. The Market Stimulation Programme “Marktanreizprogramm” of October 1999 providessupport for hydropower plants smaller than 500 kW. Until May 2001, grants were provided forhydropower plants within this programme. After May 2001, only soft loans were provided. By the end of2001, 112 applications for support had been accepted.
The Lander supported hydropower development with a total of € 50 million between 1991 and 2001, butthis support has declined in recent years.
Biomass Electricity Production
Electricity generation from solid biomass increased from 129 GWh in 1990 to 804 GWh in 2000, thendeclined to 639 GWh in 2001. Biomass capacity in 2001 was about 150 MW.
According to German statistics, in 2002 electricity generation from solid biomass was 1.2 TWh,representing 0.2% of total electricity production. The government estimates that there was 300 to 350 MWof installed capacity in 2002.
Support for biomass (both heat and electricity generation) from the Lander was € 235 million between1991 and 2001. Under the Renewable Energy Sources Act, power plants based on solid biomass (mostlywood) receive up to € 0.10/kWh of generation, a considerable increase compared to the Electricity Feed-In Law. The Market Stimulation Programme set up in 1999 provides soft loans and grants for biomassplants. Grants are provided up to € 61/kWe. Soft loans may finance the entire investment. This Programmetogether with the Renewable Energy Sources Act has led to a major increase in biomass-fired power plantssince 1999. Market growth has also been driven by clear definitions on eligible biomass technologieswithin the EEG, which stipulated an additional ordinance on biomass.
Research on electricity from biomass is focussed primarily on gasification technologies.

302
PART 2: COUNTRY PROFILES
Biomass Heat ProductionHeat production from solid biomass increased from 388 TJ in 1995 to an estimated 634 TJ in 2001.According to German statistics, in 2002 solid biomass contributed 187 PJ to heat generation, representing3.4% of total heat production. Approximately seven million fireplaces and woodstoves are installed inprivate households in Germany. Annual sales of these products are between 200 000 and 300 000 units.Many of these installations, however, are used irregularly. The market for biomass boilers with automaticfeeders has grown recently. Some 9 000 pellet boilers less than 35 kW are estimated to have been installedbetween 1998 and 2001. Moreover, some 80 large CHP plants were installed between 1998 and 2001.
The Market Stimulation Programme provides grants between € 42/kWth and € 61/kWth for biomass-fuelledheaters, depending on technology and plant size. Biomass-fired CHP plants may receive up to € 185/kWe.In total, 15 700 biomass-fired heating systems have been supported between 1999 and 2002. This
1993
1994
1995
1996
1997
1998
1999
2000
2001
2002
2003
1991
1992
1990
1993
1994
1995
1996
1997
1998
1999
2000
2001
5%
10%
15%
20%
25%
Capacity (MW) Gross Electricity Production (GWh)
0%
Biomass Electricity Policy Timeline
Research and Development
Market Deployment
. ERP Programme (loans)
. Electricity Feed-in Law
. Länder Programmes (demonstration, information, grants, soft loans)
. 100 Million Programme (grants)
. Market Stimulation Programme grants, soft loans)
. DtA/KfW Soft Loan Programmes
. Renewable Energy Sources Act
Denotes a significant change to a policy, such as an extension, repeal or revision.
1991
1992
0
20
40
60
80
100
120
140
160
19901991
19921993
19941995
19961997
19981999
20002001
Capacity
0
100
200
300
400
500
600
700
800
900Production
Figure 11. Solid Biomass Capacityand Electricity Production
Figure 12. Solid Biomass Capacity(Year to Year Change)

GERMANY
303
programme has been the main driver behind the recent improvement in modern biomass boilertechnology. Biomass CHP plants under 20 MW also benefit from the Renewable Energy Sources Act.Support for biomass (both heat and electricity generation) from the federal states was € 235 millionbetween 1991 and 2001. A code on the quality of pellets and wood chips is being created by the GermanAssociations of Engineers (VDI), among others.
ProductionCapacity
0
160
20
40
60
80
100
120
140
0
700
100
200
300
400
500
600
Figure 13. Solid Biomass Capacity and Heat Production
Gross HeatProduction (TJ)
Capacity (MW)
1990
1991
1992
1993
1994
1995
1996
1997
1998
1999
2000
2001
1993
1994
1995
1996
1997
1998
1999
2000
2001
2002
2003
1991
1992
1990Biomass Heat Policy Timeline
Research and Development
Market Deployment
. ERP Programme (loans)
. Electricity Feed-in Law
. Länder Programmes (demonstration, information, grants, soft loans)
. 100 Million Programme (grants)
. Market Stimulation Programme (grants, soft loans)
. DtA/KfW Soft Loan Programmes
. Renewable Energy Sources Act
Denotes a significant change to a policy, such as an extension, repeal or revision.
Wind PowerWind capacity increased on average by 60.5% per year from 1990 to 2001, from 48 MW to 8.7 GW. Thegovernment estimates that in 2002 total installed capacity was 11.9 GW and that wind power plantsgenerated 3% of total electricity generation. One-third of globally installed wind power capacity is inGermany.

304
The rapid growth has triggered technological development of wind power in Germany. The average sizeof new power plants increased from 170 kW in 1992 to almost 1.2 MW in 2001. Development of theGerman wind power market has also contributed to global technical development. Independent powerproducers have entered the power market, fostering further development. Around 40 000 new jobs werecreated in the German wind power industry by 2002. Annual turnover was € 5 billion in 2002. Almost20% of the wind turbines manufactured in Germany are exported.
The 250 MW Wind Programme provided the initial impetus for Germany’s wind energy market. Theprogramme was established in 1989 as a 100 MW Wind Programme but was extended to the 250 MWWind Programme in 1991. It provided grants for the installation and operation of wind turbines at suitablesites. The last grants were approved by the end of 1996 for turbines that had to be connected to the gridby mid-1998. The grants could be combined with remuneration under the Electricity Feed-in Law.
Because of its favourable rates, the 1991 Electricity Feed-in Law is considered the driving force behind therapid increase in wind power in Germany. The Renewable Energy Sources Act 2000 further strengthened
PART 2: COUNTRY PROFILES
1993
1994
1995
1996
1997
1998
1999
2000
2001
2002
2003
1991
1992
1990
1993
1994
1995
1996
1997
1998
1999
2000
2001
20%
40%
60%
80%
100%
120%
140%
Capacity (MW) Gross Electricity Production (GWh)
0%
Wind Power Policy Timeline
Research and Development
Market Deployment
. Länder Programmes (demonstration, information, grants, soft loans)
. 250 MW Wind Programme (operation grants)
. ERP Programme (loans)
. Electricity Feed-in Law
. Market Stimulation Programme (grants, soft loans)
. DtA/KfW Soft Loan Programmes
. Renewable Energy Sources Act
Denotes a significant change to a policy, such as an extension, repeal or revision.
1991
1992
0
1000
2000
3000
4000
5000
6000
7000
8000
9000
10000
19901991
19921993
19941995
19961997
19981999
20002001
Capacity
0
2000
4000
6000
8000
10000
12000Production
Figure 14. Wind Power Capacityand Electricity Production
Figure 15. Wind Power Capacity(Year to Year Change)
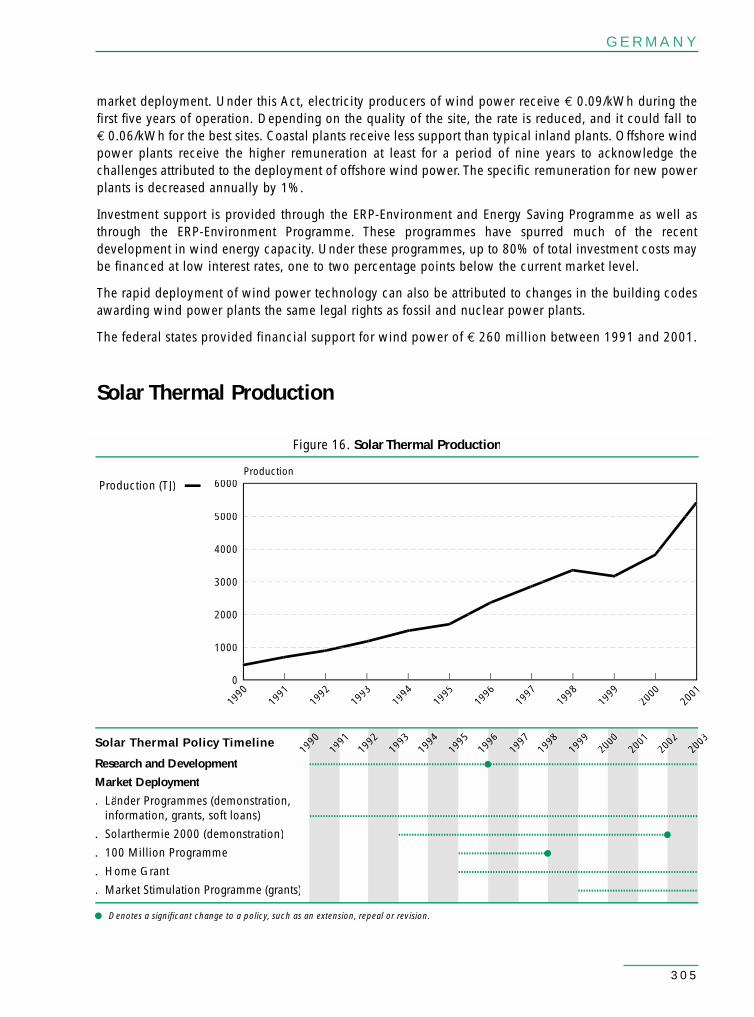
GERMANY
305
market deployment. Under this Act, electricity producers of wind power receive € 0.09/kWh during thefirst five years of operation. Depending on the quality of the site, the rate is reduced, and it could fall to€ 0.06/kWh for the best sites. Coastal plants receive less support than typical inland plants. Offshore windpower plants receive the higher remuneration at least for a period of nine years to acknowledge thechallenges attributed to the deployment of offshore wind power. The specific remuneration for new powerplants is decreased annually by 1%.
Investment support is provided through the ERP-Environment and Energy Saving Programme as well asthrough the ERP-Environment Programme. These programmes have spurred much of the recentdevelopment in wind energy capacity. Under these programmes, up to 80% of total investment costs maybe financed at low interest rates, one to two percentage points below the current market level.
The rapid deployment of wind power technology can also be attributed to changes in the building codesawarding wind power plants the same legal rights as fossil and nuclear power plants.
The federal states provided financial support for wind power of € 260 million between 1991 and 2001.
Solar Thermal Production
993
199
199994
995
199
199996
997
199
199998
999
199
200000
001
200
200002
003
20099
119
919
9992
199990Solar Thermal Policy Timeline
Research and Development
Market Deployment
. Länder Programmes (demonstration, information, grants, soft loans)
. Solarthermie 2000 (demonstration)
. 100 Million Programme
. Home Grant
. Market Stimulation Programme (grants)
Denotes a significant change to a policy, such as an extension, repeal or revision.
Production
0
6000
1000
2000
3000
4000
5000
Figure 16. Solar Thermal Production
Production (TJ)
1990
1991
1992
1993
1994
1995
1996
1997
1998
1999
2000
2001

306
Solar thermal production grew by 25% per year from 1990 to 2001. Total production in 2001 was5 400 TJ. Government incentives since the early 1990s have resulted in accelerated growth. Productionof collectors has doubled since 1996.
"Solarthermie 2000" was launched in 1993 by the Federal Ministry for Research and Technology as partof its large-scale demonstration programme for the development of low temperature heat from activesystems, especially in the eastern federal states. Tax incentives support the building of private homes. Themain target of "Solarthermie 2000" is to improve the economic viability of solar thermal systems.
PART 2: COUNTRY PROFILES
Table 3. Solar Collector Capacity in Germany, 1990 – 2003 (1 000 m2)
1990 1991 1992 1993 1994 1995 1996 1997 1998 1999 2000 2001 2002 2003
338 466 582 749 940 1 156 1 453 1 817 2 191 2 638 3 283 4 207 4 754 5 600
In 1995, the 100 Million Programme encouraged the purchase of solar collectors and heat pumps byproviding capital grants of up to 30% of the investment costs. Since 1999, the Market Stimulationprogramme has provided € 92/m2 for the purchase of solar collectors. The programme was revised severaltimes over the past five years.
The federal states have also provided considerable financial support for solar thermal collectorsamounting to a total of € 234 million between 1991 and 2001.
Solar PhotovoltaicFrom 1990 to 2001, solar PV capacity grew by more than 50% per year, and electricity production fromsolar PV grew by nearly 60% per year. Total capacity was 195 MW in 2001. While the share of solar PVin total renewable use is still quite small compared to biomass and wind, growth has been spectacularsince 1990. A combination of feed-in tariffs and production subsidies has spurred this growth.
In 1991, the large scale PV demonstration programme, the 1 000 Roofs Programme, offered subsidies forproduction costs of 60% in the east federal states and 50% in the western federal states. When theprogramme was completed in 1995, 2 100 units with total peak generating power of 5.3 MW had beeninstalled. The 100 000 Roofs Programme commenced in 1999 with the goal of increasing capacity by300 MW by the end of 2003. The objective was to install 100 000 solar PV projects with average capacityof 3 kWp. When the programme ended in July 2003, 55 000 installations with a total capacity of 261 MWhad been supported.
The Electricity Feed-In Law of 1991 granted approximately € 0.09/kWh to photovoltaic power fed into thegrid. On its own, this feed-in tariff was insufficient to adequately foster PV deployment. The Renewable EnergySources Act 2000 increased the remuneration to € 0.51/kWh in 2000. This rate decreases annually by 5% fornewly built systems. This remuneration together with grants and soft loans provided within the 100 000 RoofsProgramme has resulted in rapid growth of PV systems since 1999. Slight increases in the remuneration underthe Renewable Energy Sources Act are expected to promote further deployment.
PV technology has been a focus of public promotion of RD&D in the renewable energy field. Voluntaryprogrammes such as the Green Electricity Programme and Full Cost Rates were very important in the1990s in bridging time gaps in public support and in providing independent funds. However, since theintroduction of the EEG, the importance of these programmes has diminished.

GERMANY
307
1993
1994
1995
1996
1997
1998
1999
2000
2001
2002
2003
1991
1992
1990
1993
1994
1995
1996
1997
1998
1999
2000
2001
50%
100%
150%
200%
250%
Capacity (MW) Gross Electricity Production (GWh)
0%
Solar PV Policy Timeline
Research and Development
Market Deployment
. Länder Programmes (demonstration, information, grants, soft loans)
. “Roofs” Programmes (grants, soft loans)
. Electricity Feed-in Law
. Full Cost Rates
. Green Electricity
. Renewable Energy Sources Act
Denotes a significant change to a policy, such as an extension, repeal or revision.
1991
1992
0
50
100
150
200
250
19901991
19921993
19941995
19961997
19981999
20002001
Capacity
0
20
40
60
80
100
120
140
160Production
Figure 17. Solar Photovoltaic Capacityand Electricity Production
Figure 18. Solar Photovoltaic Capacity(Year to Year Change)

308
PART 2: COUNTRY PROFILES
Germany Policy Chronology
Support of the Federal States (“ Länder” )
Year 1985 - Present
Policy Description While funds available at the federal level or due to federal law have been themain driver for the deployment of renewable energy technologies, the federalstates (Länder) have also provided considerable support. Some states have beenmore active than others. Table 4 shows combined support for renewable energytechnologies by all federal states.
Policy Type RD&D / Third-party finance / Capital grants
RE Technology All renewables
250 MW Wind Programme
Year 1989-2006
Policy Description This programme was initiated in June 1989 as a "100 MW Wind Programme"and was extended to the 250 MW Wind Programme in February 1991. Theprogramme provided grants for the installation and operation of wind turbinesat suitable sites. The last grants were approved at the end of 1996 for turbinesthat had to be commissioned by mid-1998. A "Scientific Measurement andEvaluation Programme" (WMEP) is part of the support scheme. All turbines thatreceive financial support will be monitored for ten years.
The programme provided grants of DEM 200 (€ 102)/kW, up to a ceiling ofDEM 100 000 (€ 51 300) for facilities larger than 1 MW. Grants up to 60% ofthe total investment to a maximum of DEM 90 000 (€ 46 000) were provided.
Table 4. Support for Renewables by Federal States (€ million)
1991 1992 1993 1994 1995 1996 1997 1998 1999 2000 2001 1991-2001
Wind power 13.2 16.4 40.0 46.7 39.9 27.1 31.0 20.4 14.9 7.7 2.4 259.6Hydro power 4.9 4.7 8.2 5.8 5.4 3.7 3.8 4.7 3.9 2.6 2.2 49.8Solarthermal 5.7 17.6 22.6 20.4 25.5 31.2 25.4 31.6 23.2 18.8 12.6 234.6Photovoltaic 5.4 10.5 9.0 9.9 9.0 14.6 19.6 15.6 19.4 22.8 27.9 163.7Biomass 2.8 7.0 18.0 17.6 38.9 30.6 38.6 37.8 28.2 38.4 37.1 295.0Heat pumps 1.0 2.8 2.4 2.6 2.4 4.2 2.3 4.2 3.6 6.6 9.0 41.1Geothermal 0.5 1.7 2.1 2.8 2.3 3.8 0.2 0.3 0.7 0.4 1.8 23.6Education 1.5 1.7 1.4 1.6 3.2 4.3 6.8 5.1 3.9 6.2 6.2 41.9R&D 12.5 20.5 28.1 27.1 27.1 21.8 30.0 53.2 53.0 38.0 23.1 334.4Others 49.5 48.4 48.7 46.5 28.0 23.3 26.8 15.7 8.8 23.6 29.7 349.0
Total 96.9 131.4 180.5 181.0 181.6 164.6 184.4 188.4 159.6 165.2 151.9 1 785.5
GERMANY
309
Alternatively, the programme provided operating subsidies of DEM 0.06 (€ 0.031)(DEM 0.08 [€ 0.041] until 1991) for every kWh fed into the public grid.
This programme promoted 1 560 wind turbines with a total capacity of 362 MW.
Policy Type Capital grants
RE Technology Onshore wind
ERP-Environment and Energy-Saving Programme
Year 1990 - Present
Policy Description The public bank Deutsche Ausgleichsbank (DtA) (Kreditanstalt für WiederaufbauKfW from 2003) provides low-interest loans to specified renewable energyprojects. Only private companies may apply. The credit term for these loans rangesbetween ten and twenty years with a two to five year redemption holiday. Theinterest rate is 2% below market level and there is a 50% lending limit. These loansmay be combined with the ERP-Environment Programme.
Policy Type Third-party finance
RE Technology Onshore windOffshore windHydroBiomassSolar thermalSolar photovoltaic
1 000 Roofs Programme
Year 1991-1993
Policy Description This large-scale demonstration programme for photovoltaics provided subsidiesfor production costs of 60% in the former GDR and 50% in western Germany.When the programme ended in 1993, about 2 250 units with a total peakcapacity of 5.8 MW had been installed. All installations were monitored.
Policy Type RD&D
RE Technology Solar photovoltaic
Electricity Feed-In Law (EFL) (Stromeinspeisungsgesetz)
Year 1991-2000
Policy Description This regulation ensured grid access for electricity generated with renewables.Moreover, it obliged utilities operating the public grid to pay premium prices forthe electricity supplied from these renewable energy power plants. No moniesfrom public budgets were involved, as the burden imposed by the law wasexclusively borne by electricity suppliers and their customers. The premiums in

310
PART 2: COUNTRY PROFILES
the EFL were calculated annually as a percentage of the mean specific revenuesfor all electricity sold via the public electricity grid in the previous year, i.e., theaverage electricity price for all customers. In this way, the remuneration changedevery year. Wind power plants and solar power plants received the highestremuneration with 90% of the mean specific revenues, followed by small hydro,biomass and biogas power plants smaller than 500 kW with 75%, (remunerationrose to 80% some years later). Hydro, biomass and biogas power plants largerthan 500 kW, but smaller than 5 MW, received 65% of the mean specificrevenues. Table 5 shows the evolution of premium prices from 1991 to 2000.
Table 5. Development of Premium Prices under the Electricity Feed-in Law
(a) 1991 1992 1993 1994 1995 1996 1997 1998 1999 2000Technology % €cents/kWh
Hydro & Biomass < 500 kW 75/80 7.08 7.05 7.06 7.21 7.85 7.82 7.80 7.63 7.51 7.33
Hydro & Biomass 500 - 5 MW 65 6.13 6.10 6.12 6.25 6.38 6.36 6.33 6.20 6.10 5.96
Wind & Solar 90 8.49 8.45 8.47 8.66 8.84 8.80 8.77 8.58 8.45 8.25
(a) Percentage of specific mean annual revenues for all electricity supplied in the previous year.
Premium prices decreased after 1996. This was because electricity prices haddeclined due to the phasing out of the coal levy (“Kohlepfennig”), and later dueto the liberalisation of power markets. This law did not cover plants larger than5 MW. Thus, most generation facilities based on renewable energy sources thatexisted at the time of introduction of the Electricity Feed-In Law were excluded.Thus, it was ensured that mainly new facilities would benefit from the law. Theduration of the remuneration for an individual plant was not fixed; however, theconstitutional protection of legitimate expectations provided some certainty torenewable energy generators.
The law was amended in 1998, as the EFL had placed a significant, althoughunequal, financial burden on some utilities (especially those near the coastwhere the majority of wind turbines were situated). A “double cap” wasintroduced in the EFL, limiting the amount of renewable energy electricity thathad to be remunerated according to the law. Regional electricity suppliers onlyhad to purchase a maximum share of 5% of renewable energy electricity oftheir total electricity supply. The same cap applied to preliminary suppliers,leading to a total cap of 10%. This way, the total burden from the law waslimited for individual utilities and their customers. The 10% threshold wasalmost reached in certain areas in northern Germany in 2000, which wouldhave created a barrier for the further deployment of wind power technology.
The law was the driving force behind the rapid expansion of wind powertechnology in Germany.
The Renewable Energy Sources Act based on the same general principles (butwithout the cap) replaced the EFL in 2000.

GERMANY
311
Policy Type Guaranteed prices/feed-in tariff
RE Technology All renewables
Solarthermie 2000
Year 1993-2002
Policy Description This programme aimed to demonstrate the feasibility of large-scale solar thermalheating systems in residential and public buildings, as well as the feasibility ofsolar driven small district heating systems. It also analysed the long-termbehaviour of solar thermal collectors. Sixty-three large installations and sevendistrict heating systems, some of them with seasonal thermal storage, werepromoted. All projects are scientifically monitored. The targeted cost level is€ 13/kWh heat for future installations.
Grants of up to 50% of the investment costs were provided.
The successor programme “Solarthermie2000plus” was launched February 2004.
Policy Type RD&D / Capital grants
RE Technology Solar thermalSolar photovoltaicConcentrating solar
Full Cost Rates (Kostendeckende Vergütung)
Year 1993-2000
Policy Description Under this legislation a tariff was granted to electricity from photovoltaicinstallations. The remuneration level was approximately € 1/kWh. Twenty-fivemunicipal utilities had introduced such schemes by the end of 1999. Often theywere forced by the local parliaments to do so. Approximately 1 000 photovoltaicinstallations with a total capacity of 4.5 MW were installed as a result of theseprogrammes.
The programmes became obsolete after the introduction of the 100 000 RoofsProgramme and the enhanced remuneration according to the RenewableEnergy Sources Law.
Policy Type Guaranteed prices/feed-in tariff
RE Technology Solar photovoltaic
Home Grant (“ Eigenheimzulage” )
Year 1995 - Present
Policy Description Under this programme households may receive federal grants for purchasinghouses and flats. The grant is up to € 256 per year over eight years if solar

312
PART 2: COUNTRY PROFILES
thermal collectors or heat pumps are installed. Heat pumps need to supply atleast four times the energy they require as electrical input. The grant is paid outannually by reducing personal tax payments.
Policy Type Consumer grants/rebates
RE Technology Solar thermal
100 Million Programme
Year 1995-1998
Policy Description This federal program, administrated by the Ministry of Economics, encouragedincreased use of renewable energy via capital subsidies (up to a limit whichvaried by technology). Particular emphasis was given to solar collectors andheat pumps, small hydropower installations, large wind turbines (450 kW to2 MW), PV installations greater than 1 kW, and biomass installations. Solarwater heaters for swimming pools and geothermal applications were excluded.
Policy Type Capital grants
RE Technology All renewables
Fourth Energy Research Programme
Year 1996-2004
Policy Description This programme, established in 1996, set the framework for public RD&Dsupport for energy technologies. A successor is planned for mid-2004.
Table 6 gives an overview of the development of federal RD&D fundingfor renewable energy technologies. It includes funding for hydrogen and fuelcells. These figures contain some support described for other programmes, e.g.,250 MW Wind Programme, Solarthermie2000, 1 000 Roofs Programme.
Table 6. Federal RD&D Expenditures on Renewable Energy Technologies
1989 1990 1991 1992 1993 1994 1995 1996 1997 1998 1999 2000 2001 Total
Photovoltaic 42.2 47.0 53.2 56.8 57.6 33.9 29.6 30.3 25.3 34.5 28.8 37.0 29.1 505.2
Wind RD&D 6.3 9.3 5.0 4.8 3.8 5.6 3.5 2.8 2.8 2.3 2.3 3.1 4.8 56.4
Wind 250 MWprogramme 0.1 1.9 4.1 8.4 12.7 14.0 16.4 22.7 18.0 17.9 16.4 11.9 7.6 152.0
Solar thermalcollectors 0.5 1.8 2.7 2.0 2.4 1.8 1.2 1.5 13.9
Bioenergy 0.7 4.3 8.2 12.8 3.1 2.7 – – – – – – – 31.8
Geothermal 1.4 2.9 3.4 2.6 2.4 2.9 1.9 2.1 1.9 1.7 1.6 2.3 3.5 30.4
Other 56.3 59.7 67.3 61.2 62.6 60.3 56.5 58.0 46.1 41.5 38.0 44.2 56.4 708.2
Total 107.0 125.1 141.1 146.4 142.1 119.9 109.7 118.6 96.2 100.2 88.9 99.8 102.9 1 497.9

GERMANY
313
Policy Type RD&D
RE Technology All renewables
Green Electricity
Year 1996 - Present
Policy Description Under this programme electricity from renewable energy sources is marketed asgreen electricity at premium prices. This is an additional offer by utilities andelectricity suppliers. Such programmes do not necessarily lead to new capacityof renewable energy plants since electricity may be also marketed from existingplants. There have been two phases in the dissemination of these offers inGermany, prior to and after the liberalisation of the electricity market in 1998.
In the initial phase, utilities marketed green electricity with green tariffs. Theyoffered the electricity with a surcharge and the funds from the surcharge weresupplemented by the utility and used for installing new renewable energycapacity, mostly photovoltaic. The utility could pass the burden on to electricitycustomers.
After deregulation, independent electricity suppliers also started to marketgreen electricity. In 2000, 132 different companies offered green electricity. Themarket share, however, was less than 1% of total electricity supply.
Several independent certification schemes exist to ensure independentmonitoring of the origin of the electricity. Moreover, some of these certificationschemes monitor whether the funds are invested in new plants.
Although not a government programme, the state has supported greenelectricity in two respects. Before liberalisation, regulatory authorities acceptedextra costs from green tariffs. After liberalisation, state agencies started topurchase green electricity.
Policy Type Green pricing
RE Technology All renewables
Federal Building Codes
Year 1998 - Present
Policy Description The 1998 amendment of the federal building codes (Baugesetzbuch) excludedwind power plants and hydropower plants from the general ban on buildingin the undeveloped outskirts (“Außenbereich”). Thereby, both of thesetechnologies achieved the same legal status as nuclear power plants. Biogasplants may attain the same privilege if they are mainly fuelled with substratefrom the surrounding areas.
Municipalities may overrule these privileges by disclosing suitable areas forrenewable energy installations in their land use planning. Wind powerinstallations cannot be contested as long as no such municipal plans are in place.
314
PART 2: COUNTRY PROFILES
Policy Type Regulatory and administrative rules
RE Technology Onshore windHydroBiomass
100 000 Roofs Programme
Year 1999-2003
Policy Description The 100 000 Roofs Programme expanded the 1 000 Roofs Programme of 1991.The programme supported the installation or extension of PV systems largerthan 1 kW. Loans with interest rates of 4.5% below market conditions wereoffered, with a repayment period of ten years and a two-year repayment holiday.The possible share of financing was up to 100% to a maximum sum of€ 500 000. Furthermore, the costs eligible for the loan were limited to€ 6 750/kW for installations smaller than 5 kW, and to € 3 375/kW forinstallations larger than 5 kW. This limit was reduced by 5% every year startingin 2001. Initially, the tenth instalment need not have been paid but thisstipulation was abandoned in 2001. The programme was targeted to support300 MW of additional capacity.
When the programme ended in July 2003, 55 000 installations with a totalcapacity of 261 MW had been supported.
This support could be combined with other programmes, particularly with thefavourable conditions in the Renewable Energy Sources Act. This programmeled to a boom in the photovoltaic market in Germany.
Policy Type Third-party finance
RE Technology Solar photovoltaic
Diverse Soft Loan Schemes
Year 1999 - Present
Policy Description Beyond the two ERP soft loan schemes and the CO2 Building RestructuringProgramme, several other soft loans schemes exist which indirectly supportrenewable energy technologies. Among these are the “DtA Umweltschutz-Bürgschaftsprogramm,” the KfW-Mittelstandsprogramm, the KfW-Umweltprogramm,which applies to enterprises, and the KfW-Infrastrukturprogramm, which applies tomunicipalities. Investments in environmentally-sound technologies includingrenewable energy technologies are supported with soft loans and loan guarantees.
Credit terms range from ten to twenty years and interest rates are 1 to 2% belowmarket interest levels. The Kreditanstalt für Wiederaufbau (KfW), DeutscheAusgleichsbank (DtA) operates the programmes.
Policy Type Third-party finance
RE Technology All renewables

GERMANY
315
Eco-Tax Reform
Year 1999 - Present
Policy Description With the passage of the eco-tax reform, taxes (“Mineralölsteuer”) on gasoline,diesel, natural gas and liquid gas were increased. At the same time, a special taxon electricity (“Stromsteuer”) was introduced. The first stage of the reform increasedthe tax on diesel and gasoline by € 0.0307/litre, for heating oil by € 0.0205/litre,natural gas € 0.00164/kWh, and for liquid gas € 0.01278/kg. The electricity tax was€ 0.0102/kWh. In late 1999, the second stage of the eco tax reform was adopted,increasing the tax rate annually by € 0.0307/litre, € 0.0026/kWh in the followingfour years. On 1 January 2004, the tax was € 0.006698/litre for gasoline and€ 0.004857/litre for diesel. The tax on electricity was € 0.0205/kWh on the samedate. Heating oil is taxed € 0.06125/litre and natural gas € 0.55/kWh. Someexemptions, reduced tax levels, and compensations for energy intensive industry,commuters and low-income households apply.
In 2002, biofuels were exempt from the oil tax until the end of 2008. The lawrequires that the federal finance ministry draw up a report with the help of otherrelevant ministries every two years to chart progress in the market introductionof biofuels, and to examine price developments of biomass, crude oil andautomobile fuels. The first report was due March 2004. If deemed necessary, theministry may recommend adjusting the size of the tax break for biofuels.
Since the law increases the price of fossil energy, it enhances the competitiveposition of renewable energy technologies in the heating and transport markets.Biodiesel particularly benefits since taxes on transport fuels are high. Electricitygeneration from renewable energy does not benefit directly from the taxbecause all electricity is taxed irrespective of the fuel used for generation.However, eco-tax revenues from electricity generated with renewable energiesare used to finance the “Marktanreizprogramm”.
Policy Type Fossil fuel taxes
RE Technology All renewables
Market Stimulation Programme(“ Marktanreizprogramm” )
Year 1999 - Present
Policy Description As a successor of the “100 Million Programme,” the Market StimulationProgramme (Marktanreizprogramm), under the auspices of the Ministry ofEconomics and Technology, was introduced in 1999. Initially an annual budgetof € 100 million was allocated over 5 years.
For several reasons it was not possible to exempt renewable energy powerplants from the eco tax. Nevertheless it was felt that this additional incomeshould be used to the benefit of renewable energy technologies. Thus the

316
PART 2: COUNTRY PROFILES
annual € 100 million represents the estimated additional tax revenue fromrenewable energy power plants due to the tax reform.
Under this scheme, individuals and small and medium-sized businesses mayapply for grants and soft loans for solar collectors, biomass boilers, biogasplants, heat pumps driven with renewable electricity and geothermal heatingsystems. In addition, schools may apply for grants to install photovoltaic plants.Grants are administrated by the Bundesamt für Wirtschaft and loans by theKreditanstalt für Wiederaufbau.
Originally grants were awarded as follows: flatplate solar collectors< 100 m2 € 128/m2; > 100 m2 € 64/m2; vacuum solar collectors < 75 m2
€ 167/m2; > 75 m2 € 82/m2; electrical heat pumps < 13 kW € 102/kW; > 13 kW€ 51/kW; manual biomass boiler < 50 kW € 41/kW; automatic biomass boiler< 100 kW € 62/kW; > 100 kW € 61/kW; biomass driven combined heat powerplants > 100 kW € 185/kW; biogas plants up to 30% of the investment costs.Additionally, larger installations were awarded with soft loans with interest rates1% below market level. As a result the level of support ranges between 10% and40% of the investment.
Almost 80 000 installations were supported by end of 2001, almost entirelysolar thermal collectors.
The programme has been amended several times since its introduction, alteringthe eligible technologies and the level of support.
Policy Type Third-party finance / Capital grants / Consumer grants/rebates
RE Technology BiomassSolar photovoltaicSolar thermalGeothermal
CO2 Building Restructuring Programme
(CO2 Gebäude Sanierungsprogramm)
Year 2000 - Present
Policy Description The CO2 Reduction Programme primarily targets energy saving measures inbuildings. Renewable energy technologies for heating purposes also maybenefit, however, the credit volume for renewable energy installation was only2% of the total credit volume awarded. The Kreditanstalt für Wiederaufbauoperates the programme.
Loans are provided with an interest rate 2% below market interest level.
Policy Type Third-party finance
RE Technology All renewables

GERMANY
317
Renewable Energy Sources Act(Erneuerbare-Energien-Gesetz EEG)
Year 2000 - Present
Policy Description This Act targets a 12% share for electricity produced from renewable energy by2010. The Act replaces the Electricity Feed-In Law of 1991. The obligation togive grid access to renewable energy plants and purchase the electricity atpremium prices is shifted from the utilities to the grid operators. The tariffs areset for each individual technology, based on its actual generation cost (Table 7).For an individual plant, the remuneration level stays fixed over twenty years,with the exception of wind power. A high remuneration is paid for a fixed totalproduction of wind electricity. After reaching the limit the remuneration isdecreased. The lower remuneration will be paid up to twenty 20 years aftercommissioning the plant. The remuneration paid for wind power on an averagesite is € 0.084/kWh over a twenty-year lifetime. Since the remuneration for anindividual plant is not adjusted for the inflation rate this means a decrease ofremuneration in real terms. From 2002 on, the remuneration paid for newlycommissioned plants has been reduced annually to provide stronger incentivesfor cost reductions. This factor is 5% for photovoltaic installations, 1.5% forwind power plants and 1% for biomass-fuelled plants. Since inflation is notconsidered, the real price decrease is higher than depicted by these rates.
Technology Size Remuneration in 2004 Annual reduction factorfor newly commissioned plants
Hydro, sewage gas, < 0.5 MW € 0.0767 /kWh–
landfill gas, marsh gas 0.5 – 5 MW € 0.0665 /kWh
< 0.5 MW € 0.101 /kWhBiomass 0.5 – 5 MW € 0.089 /kWh 1 % p.a.
> 5 MW € 0.084 /kWh
Solar < 5 MW € 0.457 /kWh 5 % p.a.
Wind No limits € 0.059 to € 0.087 /kWh1 1.5 % p.a.
Geothermal< 20 MW € 0.0895 /kWh
–> 20 MW € 0.0716 /kWh
1 Depending on specific wind conditions on site.
Table 7. Remuneration Paid under the Renewable Energy Sources Act
The Act also stipulates obligations concerning costs of grid connection andreinforcement. Plant operators have to pay for the grid connection, but the gridoperator has to bear the cost of grid reinforcement if necessary.
No public budgets are involved. The Act solves the problem of unequaldistribution of burdens (as in the EFL) by requiring all electricity suppliers to

318
PART 2: COUNTRY PROFILES
have the same share of electricity from renewable energy in their fuel mix. Forthis purpose, grid operators need to balance amounts of electricity remuneratedaccording to the Act in such a way that the share of the EEG electricity is equalon all grids on a three-month basis. Then all electricity suppliers using thepublic electricity grid are obliged to purchase an equal share of EEG electricityat a price equal to the average remuneration paid for all EEG electricity. Thissystem has the effect that, not only the costs, but also the benefits, in the formof the generated electricity, are shared equally. This distribution mechanism canbe characterised as an ex-post quota, where electricity suppliers know only ex-post the share of renewable energy electricity they are obliged to purchase.With this design, there is no need to calculate the "real" value of the electricityfed-in. On the other hand, the physical distribution of the renewable energyelectricity among all suppliers gives rise to additional costs. The extra costs ofregulation are not explicitly known.
An additional ordinance issued in 2001 specifies which biogenic substancesand which technical processes are eligible for remuneration according to theRenewable Energy Sources Act.
Originally, the remuneration to photovoltaic plants was limited to total capacityof 350 MW. In 2002, this cap was increased to 1 000 MW. In November 2003,remuneration for photovoltaic installations was further differentiated dependingon site specifics.
Every two years, the parliament re-evaluates the Act on the basis of a report thatis prepared by the Ministries of Economics and Technology, in closeconsultation with the Ministry of Environment and the Ministry of Agriculture.
Policy Type Obligations / Guaranteed prices/feed-in tariff
RE Technology All renewables
Investing in the Future Programme(Zukunfts-Investitions-Programm, ZIP)
Year 2001-2003
Policy Description This programme offered special funding from 2001 to 2003 for energy researchin different fields. This funding is in addition to energy R&D financed throughthe scheduled federal budget. The following technologies benefited from thisprogramme: geothermal electricity generation, solar thermal electricitygeneration, offshore wind power and photovoltaic. The environmental impactof renewable energy technologies was investigated. Hydrogen technology andfuel cells were also investigated.
Policy Type RD&D
RE Technology GeothermalOffshore windSolar thermalSolar photovoltaic

GERMANY
319
Combined Heat Power Law(KWK Modernisierungsgesetz)
Year 2002 – Present
Policy Description This law replaces the 2000 law on combined heat power (CHP) (“KWK-Vorschaltgesetz”). Both laws are primarily intended to promote large CHPplants that were affected by decreasing electricity prices as a consequence ofliberalisation. At the same time the share of CHP-produced electricity is to beincreased, aiming at lowering CO2 emissions by 23 million tonnes by 2010.Half of this target is to be achieved by the CHP law, the other half by a voluntaryagreement with industry.
The importance of this law for renewable energy technologies is minor since theRenewable Energy Sources Act (EEG) provides more favourable conditions forthese technologies. Only renewable energy technologies not covered by theEEG may benefit. This includes co-firing of biomass in fossil-fuelled powerplants and biomass-fired CHP larger than 20 MW.
The law requires grid operators to purchase electricity from CHP plants and paya premium on top of the market price. Premiums depend on technology and theage of the plant (Table 8). The premium cannot be combined with other support,particularly not with the EEG.
The burden from paying the premium is spread equally over all grid operatorswith the same principle as with the EEG.
Policy Type Guaranteed prices/feed-in tariff, premiums
RE Technology Biomass
Solarthermie 2000plus
Year 2004
2002 2003 2004 2005 2006 2007 2008 2009 2010
Plants erected before 31 Dec 89 1.53 1.53 1.38 1.38 0.97 – – – –
Plants erected after 31 Dec 1989 1.53 1.53 1.38 1.38 1.23 1.23 0.82 0.56 -
Modernised plants 1.74 1.74 1.74 1.69 1.69 1.64 1.64 1.59 1.59
Plants erected after 1 April 2002 2.56 2.56 2.4 2.4 2.25 2.25 2.10 2.10 1.94
Plants < 50 kWel erected between 1 April 02 and 31 Dec 2005
5.11 for 10 years after commissioning
Fuel cell plants 5.11 for 10 years after commissioning
Table 8. Evolution of Premiums for CHP Plants (€cents/kWh)

320
PART 2: COUNTRY PROFILES
Policy Description This programme is a successor of the “Solarthermie2000” programme. It aims to increase the annual solar contribution to heat and hot water demandwith individual solar thermal installations from the current 10-30% to 60%. Inparticular, seasonal storage is sponsored.
Grants up to 50% of the investment costs are provided.
Policy Type RD&D / Capital grants
RE Technology Solar thermalSolar photovoltaicConcentrating solar

Greece
321

Gas
Coal
Oil
Renewables
Mtoe
0
5
10
15
20
25
30
1971
1973
1975
1977
1979
1981
1983
1985
1987
1989
1991
1993
1995
1997
1999
2001
Gas 5.9%Coal 32.7%
Renewables 4.6%
Oil 56.8%
Figure 1. Total Primary Energy Supply by Source Figure 2. Shares of TPES 2001
Shares in Figure 2 may differ from Table 1.See Annex 2 for more detail.
322
Total Primary Energy Supply
Table 1. Total Primary Energy Supply by Source (Mtoe)*
Total primary energy supply (TPES) nearly doubled from 1980 to 2001, from 15.7 Mtoe to almost 29 Mtoe,an average annual growth of 2.9%. Greece depends heavily on imported energy, especially oil, whichaccounts for more than half of TPES. Coal accounted for about 32% of TPES in 2001 (Table 1) downfrom 37% in 1990. In the late 1990s, Greece introduced natural gas into its energy mix, and in 2001it accounted for 5.9% of primary energy supply.
Renewable energy supply increased from 1.1 Mtoe in 1990 to 1.3 Mtoe in 2001, but its share in TPES declinedslightly. The fall in share was due to a decline in hydropower generation and a levelling off of biomass supply.The recent emergence of natural gas for power generation was also a contributing factor. Biomass made thelargest contribution to total renewable energy supply in Greece, at 1 Mtoe in 2001. Nearly all biomass isconsumed in the industrial and residential sectors. Recent policies promoting wind and solar power boostedwind capacity to 270 MW in 2001, from 27 MW in 1995, and solar thermal production to 4 201 TJ in 2001,from 2 363 TJ in 1990. Wind power accounted for 26% of total electricity generation from renewables in 2001.
PART 2: COUNTRY PROFILES
Source 1970 1980 1990 1995 2000 2001 Imports
Coal 1.3 3.3 8.1 8.4 9.0 9.3 9.2%Oil 6.1 11.6 12.8 13.7 15.6 16.1 100%Gas 0.0 0.0 0.1 0.0 1.7 1.7 99.4%Nuclear 0.0 0.0 0.0 0.0 0.0 0.0 -Renewables 0.7 0.7 1.1 1.3 1.4 1.3 -
Biomass 0.4 0.4 0.9 0.9 0.9 1.0Hydro 0.2 0.3 0.2 0.3 0.3 0.2Geothermal 0.0 0.0 0.0 0.0 0.0 0.0Wind/Solar 0.0 0.0 0.1 0.1 0.1 0.2
Total 8.1 15.7 22.2 23.5 27.8 28.7 76.9%% Renewables 8.4% 4.8% 5.0% 5.5% 5.0% 4.6%
* See Annex 2 for explanation of components in total and definition of biomass.

GREECE
323
Renewable energy provided less than 5% of TPES in 2001. Biomass and hydroelectricity accountedfor most of the renewable energy produced, with biomass (mainly in the form of wood used forheating in the household sector) accounting for two-thirds of the total. Excluding biomass and largehydropower, the contribution of other sources was 12.5% of the total power generation fromrenewables in 2001.
Policy Timeline
Research and Development
Market Deployment Policy
. Economic Development Law
. 1st Operational Programme for Energy
. Law 2364/95 (tax exemptions)
. Development Law 2601/98
. Operational Programmefor Energy and Competitiveness
. Law 2773/99 (feed-in tariffs)
. National Operational Programme for Energy and Competitiveness
Energy Policy Context
. Climate Action Plan
Denotes a significant change to a policy, such as an extension, repeal or revision.
Mtoe
0
0.2
1.6
0.4
0.6
0.8
1
1.2
1.4
1971 73
1975 77
1979 81
1983 85
1987 89
199 93
1995 97
1999 01
Figure 3. Total Renewable Energy Supply* and Policy Timeline
Solarand Wind
Hydro
CombustibleRenewables
and Waste
Renewable Energy Supply
* Note: The break in the biomass data in Figure 3 in 1990 is mainly due to a statistical revision. Following a survey by Eurostat in 1995, the volume ofdomestically used biomass was revised. This volume was used to calculate data from 1990 to 1994. Data prior to 1990 were not revised.

324
PART 2: COUNTRY PROFILES
Greece’s target under the EU Directive for Electricity Produced from Renewable Energy Sources 2001is 20.1% of total electricity generation from renewables by 2010. The share of renewables in electricitygeneration in 2001 was 5.5%, but it is estimated to have risen to 7.3% in 2002. Achieving the targetwill require a considerable increase in renewable energy supply over the next decade.
Prior to the EU target, Greece’s 1995 Climate Action Plan established a target for increasing the share ofrenewable energy (including large-scale hydro) in TPES to 10% by 2000. The share of renewables in TPES,however, was less than 5% in 2001.
Research and Development TrendsGreece spent a total of US$ 373 million (in 2002 prices and exchange rates) on government energyRD&D between 1977 and 2002. In this period 41.1% of its total RD&D budget was allocated torenewable energy.
Million US$ (2002 prices and exchange rates)
0
80
10
20
30
40
50
60
70
Figure 4. Greece – Government Energy RD&D Budgets*
1978
1980
1982
1984
1986
1988
1990
1992
1994
1996
1998
2000
2002
Total OtherTech./Research
TotalConservation
Total Power& Storage Tech.
Total NuclearFission/Fusion
Total RenewableEnergy
Total FossilFuels
Million US$ (2002 prices and exchange rates)
0
20
2
4
6
8
10
12
14
16
18
Figure 5. Greece – Government Renewable Energy RD&D Budgets
Large Hydro(>10 MW)
SolarThermal-Electric
SolarPhoto-Electric
Solar Heating& Cooling
Small Hydro(<10 MW)
Geothermal
Biomass
Wind
1977
1979
1981
1983
1985
1987
1989
1991
1993
1995
1997
* Data for 1998 and 1999 are not available.

GREECE
325
Government RD&D expenditures for renewables peaked in the early 1980s and declined notably in the1990s. Among the renewable technologies, geothermal received the highest level of funding at 33% in the1977 to 2002 period. Solar heating and cooling was funded at US$ 32 million, representing 22% ofrenewable energy RD&D. Solar PV and wind each accounted for about 16% of the renewable RD&Dexpenditures from 1977 to 2002.
Funding for research and development has not played a significant role in developing and deployingrenewable energy technologies in Greece.
Market Deployment TrendsThe government has focused on market-based mechanisms to promote wind, solar thermal and smallhydropower technologies. Large hydropower production and residential biomass use account for some87% of total renewable energy supply in Greece. These technologies do not receive policy support.National policies and measures target those technologies that account for the remaining 13% of totalrenewable energy supply. Today, these renewables are mainly promoted through financial incentives, suchas tax breaks, direct subsidies, priority dispatching, RD&D and an attractive feed-in tariff system. The twomain financial-support instruments that provide public incentives for renewable investment projects arethe National Development Law of 1994 and the National Operational Programme for Competitiveness(NOPC) of 2000.
The Centre for Renewable Energy Sources (CRES) was set up in 1987 to promote renewable energyapplications (solar, wind, hydro, geothermal, biomass) and energy efficiency. The CRES acts as the officialco-ordinating body for the promotion of renewables in Greece.
The Economic Development Law of 1990 provided the framework for the provision of incentives forinvestments in renewable energy technologies. The main incentives were a tax exemption for investmentsand low interest rate loans for the installation of solar systems. The incentive rate depended on the levelof regional development, varying between 40% and 55% of the total cost of the project. This lawsignificantly affected the development of wind energy in Greece. Twelve wind parks with a total installedcapacity of approximately 90 MW were approved with an average funding of 40% of total project costs.The installation of central solar systems (especially in hotels) was also promoted by this law.
The first Operational Programme for Energy (OPE) of 1994-1998 (Law 2244/94) constitutes the cornerstoneof Greek national policy for the stimulation of renewable energy sources. It was the main regulatory toolfor the production of electricity by independent producers. It provided incentives to encourageinvestments in renewables generated electricity by defining tariff rates. The law also opened up theelectricity market to the private sector, even though the Public Power Corporation (PPC) remains theexclusive electricity buyer and retailer. Under this law, production by both auto-producers andindependent producers of up to 50 MW was liberalised. Auto-producers were allowed to counterbalance80% of the electrical energy produced using renewables (90% for local authorities, governmentorganisations and farm co-operatives) with their electricity consumption from the PPC network.
Since 1995, Law 2364 has provided tax exemptions to households for the purchase of renewableequipment, such as solar water heaters. Three-quarters of the purchase value of renewable equipment canbe deducted from taxable income. The deduction corresponds to the proportion of ownership for legalentities, where 75% or 100% is amortised from profits over a period of years. The deduction is estimatedto reduce installation costs by up to 30%. In 1998, two incentive systems were implemented to increasemarket penetration of renewables and co-generation: the Development Law 2601/98 (which replaced
326
PART 2: COUNTRY PROFILES
Law 1892/90), and the Operational Programmes for Energy and Competitiveness. These mechanismsprovide a maximum 35% grant for investments in power generation and a maximum 75% deduction fromtaxable income for the residential and service sectors for solar heating systems.
Law 2773/99 established buy-back systems for electricity generated from renewables, both on-grid andoff-grid. For on-grid generation, the Public Power Corporation (PPC) pays the generator a price composedof an energy charge and a capacity charge. The energy charge is equal to 90% of the energy part of themedium-voltage domestic end-use tariff. The capacity charge is 50% of the capacity part of the same tariff.In the non-interconnected islands PPC pays only the energy portion. The price paid by PPC is 70% ofthe low-voltage end-use tariff, except for co-generators using renewable energy who receive 90%compensation. In 2001, the average buy-back tariff was € 0.0616/kWh in the interconnected system and€ 0.0731 on the islands.
The National Operational Programme for Competitiveness (NOPC) of 2000 provides grants to privateinvestments for renewable energy technologies and for co-generation plants of less than 50 MW, withgrant levels differing according to technology. Wind parks and conventional solar thermal units areeligible for public grants of 30% on total investment costs. Small hydro, biomass, geothermal, high-techsolar thermal units and passive solar systems are eligible for grants of 40%. Photovoltaic systems areeligible for grants of 50%. The level of the incentive is independent of the geographical region of thecountry. The total budget for renewable energy applications under this programme is € 505 million.
After market liberalisation, there was an increase in the number of licensing applications for powergeneration from renewable sources. This suggests that current policies will ultimately lead to an increasein electricity generated from renewables. The Greek government recognises that current licensingprocedures for renewables are still too complex. They plan to shorten the procedure and establish a “one-stop shop” for permits and licences. Law 2941/2001 has simplified the licensing procedure, but a numberof licences and permits are still required before renewable power generation facilities can be installed.
There is a concerted effort in Greece to identify the potential of new energy sources. The Centre forRenewable Energy Sources is responsible for investigating the technical and economic aspects of thispotential. Since 1999, the CRES has carried out studies and pilot projects concerning the exploitation ofrenewable energy sources. Because of its geography, Greece has considerable wind and solar energyresource potential.

GREECE
327
993
199
1994
1995
1996
1997
1998
1999
2000
2001
2002
200399
119
919
9992
199990
1993
1994
1995
1996
1997
1998
1999
2000
2001
–6%
–4%
–2%
0%
2%
4%
6%
8%
10%
12%
Capacity (MW) Gross Electricity Production (GWh)
–8%
Hydropower Policy Timeline
Market Deployment
. Operational Programme for Energy
. Law 2773/99 (feed-in tariffs)
. National Operational Programme for Competitiveness
Denotes a significant change to a policy, such as an extension, repeal or revision.
1991
1992
1900
2000
2100
2200
2300
2400
2500
19901991
19921993
19941995
19961997
19981999
20002001
Capacity
0
500
1000
1500
2000
2500
3000
3500
4000
4500
5000Production
Figure 6. Hydropower Capacityand Electricity Production
Figure 7. Hydropower Capacity(Year to Year Change)
Hydropower
Electricity generation from hydroelectric plants was 2 097 GWh in 2001. Most of the plants belong to thePublic Power Corporation. Capacity increased from 2 093 MW in 1990 to 2 377 in 2001. Hydropowerrepresents only some 4% of total electricity generation in Greece, but it accounts for about three-quartersof electricity generation from renewables. Small hydropower plants (< 10 MW) accounted for only 2.5%of total hydropower capacity in 2001.
The main policy instruments that affect small hydropower installations are investment incentives and feed-in tariffs. Law 2773/99 fixed feed-in tariffs for electricity generation from renewables. Hydropower plantshave priority in network dispatching if their installed capacity is less than 10 MW. The Public PowerCorporation pays the generator a price which is composed of an energy charge and a capacity charge. Theprice paid by PPC is 70% of the low-voltage end-use tariff. In 2001, the average buy-back tariff was€ 0.0616/kWh in the interconnected system and € 0.0731 on the islands.
Investment incentives were established under the Operational Programme for Energy (1994-1998) and theNational Operational Programme for Competitiveness (2000-2006). These were in the form of grantstotalling up to 40% of project costs for private investments in small hydropower plants.
Renewable Energy Markets

328
PART 2: COUNTRY PROFILES
Wind Power
Wind capacity increased to 270 MW in 2001 from 27 MW in 1995. Generation from wind power was756 GWh in 2001. There were two main reasons for the sharp increase in the installed capacity of windenergy in the late 1990s: funding from the Operational Programme for Energy of 1994-1998 and feed-intariffs. It is expected that the Operational Programme for Competitiveness (2000) will also have a strongimpact on wind energy development. Current wind capacity represents only a small proportion of thepotential energy resource. According to the Public Power Corporation, wind power plants could generateup to 30% of the Aegean islands' energy requirements, a ten-fold increase on current capacity.
The Development Law (Law 1892/1990) was of great importance to the early development of wind energy.In the framework of this law, twelve wind parks of approximately 90 MW were approved with an averagefunding of 40% of total project costs. These parks are currently in the phase of completion or commissioning.
By March 2000, seven wind parks of about 50 MW had been included in the New Development Law2601/98. The main funding mechanism was provided by the Operational Programme for Energy. Funding
993
199
1994
1995
1996
1997
1998
1999
2000
2001
2002
200399
119
919
9992
199990
1993
1994
1995
1996
1997
1998
1999
2000
2001
20%
40%
60%
80%
100%
120%
140%
160%
180%
200%
Capacity (MW) Gross Electricity Production (GWh)
0%
Wind Power Policy Timeline
Market Deployment
. Economic Development Law
. 1st Operational Programme for Energy
. Development Law 2601/98
. Law 2773/99 (feed-in tariffs)
. National Operational Programme for Competitiveness
Denotes a significant change to a policy, such as an extension, repeal or revision.
1991
1992
0
50
100
150
200
250
300
19901991
19921993
19941995
19961997
19981999
20002001
Capacity
0
100
200
300
400
500
600
700
800Production
Figure 8. Wind Power Capacityand Electricity Production
Figure 9. Wind Power Capacity(Year to Year Change)

GREECE
329
was offered in the form of capital grants averaging 35% of investment costs. The National OperationalProgramme for Competitiveness will continue to be the main funding tool in the immediate future for windenergy installations.
Private investors are beginning to take advantage of financial incentives, provided by the Greekgovernment and the EU, to develop wind power. While, in the past, PPCs owned the majority of windfacilities, private investors now predominate. Production of turbine equipment is developing at a rapidpace in Greece.
While wind power has considerable potential in Greece, there are many environmental and otherconstraints that block its deployment. Given the strong public opposition towards wind powerinstallations in some regions, the government introduced a 2% tax on electricity production fromrenewables under the Law 2773/99. The effects of this ’compensation’ tax are not yet visible. But aslocal governments tax the generators and use the revenue for community projects, the tax may lead togreater public acceptance of wind power.
Solar Thermal Production
The use of solar thermal applications is considerable in Greece, due to its favourable climaticconditions. Solar thermal production increased from 2 363 TJ in 1990 to 4 201 TJ in 2001, an averageannual growth of 5.4%. The main policy that had a dramatic impact on the market for domestic solarwater heating equipment was a tax exemption on the installation cost. This was introduced by law inthe 1980s and has contributed significantly (in combination with high solar potential) to the installationof solar water heating systems.
Solar energy is principally used for hot water production, with 20% of Greek households using solar water-heaters. The use of solar water heating systems started in 1974 and Greece had an installed surface of2.98 million m2 in 2001 (Table 2). This amounts to 29% of the total installed surface in the fifteen EUmember states and 28% of total heat production.
The Old Development Law (Law 1892/1990) also made an important contribution to the promotion ofcentral solar systems, especially in hotels. The main incentives were a tax exemption on investmentsand low interest rate loans made available for the installation of solar systems. It is expected that thenew Development Law 2601/98 will contribute towards further increases in large solar heatingapplications.
1993
1994
1995
1996
1997
1998
1999
2000
2001
2002
2003
1991
1992
1990Solar Thermal Policy Timeline
Market Deployment
. 1980 Law
. Economic Development Law
. 1st Operational Programme for Energy
. Development Law 2601/98
. National Operational Programme for Competitiveness
Denotes a significant change to a policy, such as an extension, repeal or revision.

330
PART 2: COUNTRY PROFILES
The Operational Programme for Energy (1994-1998) also funded a number of central solar systemsmainly in hotels and in industrial applications. Investment incentives are also offered in the NationalOperational Programme for Competitiveness (2000). Although the domestic solar water heater marketis very active, the central solar system market is still reliant on these incentives for market developmentand growth.
Table 2. Solar Water Heating Systems (Installed Surface Area)
Total Area (m2) Active Area
1990 1 758 755 1 664 1521991 1 963 957 1 861 3561992 2 143 826 2 053 8921993 2 270 108 2 206 9671994 2 379 618 2 324 8631995 2 482 690 2 431 1541996 2 589 152 2 535 9211997 2 696 270 2 642 7111998 2 827 871 2 762 0701999 2 900 897 2 864 3842000 2 961 038 2 930 9682001 3 001 388 2 981 213
Source: Centre for Renewable Energy Sources.

GREECE
331
Exploitation of Geothermal Potential(Law 1475/84)
Year 1984 - Present
Policy Description This law asserts that the exclusive right of exploitation of geothermal energybelongs to the state, which, in turn, reserves the right to assign this to otherpublic sector entities. In such cases, these entities have to prove the benefits ofsuch investments. It must be assured that water quality will not be affected andrights cannot be undertaken for less than 15 years.
Policy Type Regulatory and administrative rules
RE Technology Geothermal
Law 1559/85
Year 1985 - Present
Policy Description This law regulates matters concerning alternative forms of energy and specialmatters concerning the production of electricity from conventional fuels,among other things. It allows third parties to produce a limited amount ofelectrical power from renewables energy sources. Production is essentiallylimited to the satisfaction of producers’ needs and any surplus energy can onlybe sold to the Public Power Corporation (PPC), not to third parties.
The capacity of grid-connected renewable energy power plants of autoproducers cannot exceed three times the total installed capacity of theproducer’s equipment/energy needs when the resource is wind, solar or hydro;for geothermal energy the limit is twice the installed capacity and for co-generation to the same capacity. In accordance with Law 1416/84 localgovernments can produce with the aim of selling all production to the PPC.
Policy Type Net metering
RE Technology GeothermalHydroOffshore windSolar photovoltaicConcentrating solarOnshore windSolar thermal
Siting of Wind Turbines (Law 2689/87)
Year 1987 - Present
Greece Policy Chronology

332
PART 2: COUNTRY PROFILES
Policy Description This legislative measure defines criteria for the siting of wind turbines withinthe boundaries of inhabited areas, in uninhabited, rural areas and in industrialareas.
Policy Type Regulatory and administrative rules
RE Technology Onshore wind
Founding Decree of the Centre for Renewable EnergySources (CRES)
Year 1987 - Present
Policy Description The CRES is a legal entity whose primary aim is to promote renewableapplications (solar, wind, hydro, geothermal, biomass) and energy efficiency.
Policy Type Regulatory and administrative rules
RE Technology BiomassGeothermalHydroOffshore windOnshore windConcentrating solarSolar photovoltaicSolar thermal
Old Development Law(Law 1892/1990)
Year 1990-1998
Policy Description The Economic Development Law (“Modernisation, Development and OtherRegulations”) provided the framework for the provision of subsidies for productiveinvestments. Subsidy rates depended on the level of development of the regionconcerned, and were between 40% and 55% of the total budget of the project. Thelaw’s principal objective was to modernise, develop and regulate investments forrenewable energy production and electricity generation. It provided investmentsubsidies and tax deductions of up to 40% and 100% respectively.
This law was significant to the development of wind energy in Greece. In theframework of this law, twelve wind parks of approximately 90 MW have beenapproved with an average funding of 40%. Moreover, the installation of centralsolar systems (especially in hotels) was also promoted by this law. The mainincentive was the tax exemption for the investments and the low interest rateloans for the installation of solar systems.
Policy Type Capital grants/Investment tax credits
RE Technology All renewables

GREECE
333
The Public Power Corporation’s Programmefor the Development of Renewable Energy Sources
Year 1994-2003
Policy Description This programme formed part of the electricity utility’s ten-year DevelopmentPlan for 1994-2003. The programme for renewables concerned wind energy,PV, geothermal energy and hydro power. According to the plan, a total of306 MW installed capacity of large hydro, 17 MW small hydro and 37 MWof wind parks were in operation by 2003. These installations added about85 ktoe to the amount of energy produced by renewables in Greece.
Policy Type Regulatory and administrative rules
RE Technology Onshore windOffshore windSolar photovoltaicGeothermalHydro
Law 2244/94
Year 1994 - Present
Policy Description “Law 2244/94 constitutes the cornerstone of Greek national policy for thestimulation of renewable energy sources and it can be said to be the first stepin the development of a systematic framework of action.” It was the mainregulatory tool for the production of electricity by independent producers.
The law aimed to provide incentives to motivate investments in renewableenergy electricity generation (tariff rates are defined at pragmatic values) and itopened up the electricity market to the private sector even though the PublicPower Corporation (PPC) remains the exclusive electricity buyer and retailer.
Through this law, production by both auto-producers and independentproducers was liberalised up to 50 MW. Auto-producers may counterbalance80% of the electrical energy produced using renewables (90% for localauthorities, government organisations and farm co-operatives) with theirelectricity consumption from the PPC network. Other provisions of the lawincluded the removal of restrictions for the exploitation of small water falls, thesimplification of bureaucracy involved in the permitting of renewable energyinstallations and the setting up of an improved pricing system.
Policy Type Guaranteed prices/feed-in tariffs
RE Technology All renewables
Operational Programme for Energy (OPE): FiscalIncentives for Renewables and Energy Conservation
Year 1994-1998

334
PART 2: COUNTRY PROFILES
Policy Description The Operational Programme for Energy (OPE) established within the frameworkof the 2nd Community Support Framework, provided capital cost grants for thepromotion of renewable energy and energy conservation.
Up to 1999, 125 renewable energy projects were approved (130 MW wind,72 MW small-hydro, 46 MWh biomass district heating, 42 MW CHP withbiomass, 5 MWh other biomass projects, 42 solar central active systems,8 projects for PV systems and 5 projects for passive solar systems). In addition,approximately 300 projects for energy conservation and substitution of fossilfuels and electricity by natural gas in the industrial and tertiary sectors wereapproved.
Policy Type Capital grants
RE Technology Offshore windOnshore windHydroBiomassSolar photovoltaic
Law 2364/95
Year 1995 - Present
Policy Description This law establishes the Board for Energy Planning and Control (BEPC). Since1995, Law 2364 has provided tax exemptions to households buying renewableequipment such as solar water heaters; 75% of the purchase value of renewableequipment can be deducted from taxable income.
This legislation incorporates one of the most direct incentives for thedevelopment of renewable energy technologies to date. Article 7, paragraph 17of Chapter B states, “the costs of the purchase and installation of domesticappliances for the use of natural gas and renewable energy sources can bededucted (up to 75%) from the individual’s taxable income. This includesinstallations for common use and the percentage of deduction corresponds tothe proportion of ownership for legal entities, 75% or 100% is amortized fromprofits over a period of years.” It has been estimated that this benefit can yielda real reduction in installation costs of up to 30%.
Policy Type Tax exemptions
RE Technology All renewables
Aid to Market Penetration of Renewables –New Development Law 1998
Year 1998 - Present
Policy Description Incentive systems have been implemented by the Development Law 2601/98to increase the market penetration of renewables and co-generation. This law

GREECE
335
replaced the previous one (Law 1892/90), and the Operational Programmes forEnergy and Competitiveness. These mechanisms provide a maximum 35%grant for investments in power generation and a maximum 75% deductionfrom taxable income for the residential and service sectors for solar heatingsystems.
Greece does not intend to establish a green certificate system in the near futurebut considers it a viable option in the long term.
Policy Type Capital grants/Tax exemptions
RE Technology All renewables
Plan for Domestic Actions
Year 1999 - Present
Policy Description Greece has put into place the necessary directives for streamlining theprocedures for renewable energy penetration, and is in the process of financinga new comprehensive national plan for domestic actions to reduce greenhousegas emissions by almost 25 Mtoe of CO2 by 2012.
Policy Type Regulatory and administrative rules
RE Technology All renewables
Renewable Energy Pilot Projects
Year 1999 - Present
Policy Description Several studies and pilot applications regarding the exploitation of renewableenergies have been carried out by the Centre for Renewable Energy Sources(CRES), which is the official coordinating body for the promotion of renewableenergies in Greece.
Policy Type RD&D
RE Technology All renewables
Law 2773/99
Year 1999 - Present
Policy Description This law, enacted in 1999:
(1) Gives renewables priority in network dispatching if the installed capacitydoes not exceed 50 MW, or in the case of hydropower 10 MW. The priorityright also covers the power surplus of auto-producers within these samecapacity limits. The law obliges the Transmission System Operator and thePublic Power Company to provide connection to new generators but, inpractice, the development of wind power in some mountain and island areas isslowed down by the need to simultaneously extend transmission networks.

336
PART 2: COUNTRY PROFILES
(2) Established buy-back systems for electricity generated from renewables in theinterconnected and non-interconnected networks. In the interconnected networkthe Public Power Corporation (PPC) pays the generator a price which is composedof an energy and a capacity charge. The energy charge is 90% of the energy partof the medium-voltage domestic end-use tariff and the capacity charge is 50% ofthe capacity part of same tariff. In the non-interconnected islands, PPC pays onlyfor energy, not capacity. The price paid by PPC is 70% of the low-voltage end-usetariff, except for co-generators using renewable energy who receive 90%compensation. In 2001, the average buy-back tariff was € 0.0616/kWh in theinterconnected system and € 0.0731/kWh on the islands.
(3) Introduced a 2% tax on electricity production from renewables at the local level.The revenues are used for projects to increase public acceptance of wind power.
Policy Type Net metering/Guaranteed prices/feed-in tariff
RE Technology All renewables
National Operational Programme for Competitiveness
Year 2000-2006
Policy Description Measure 2.1 of the Subprogramme of the NOPC/CSF III (2000-2006) is devotedto providing grants to private investments in renewables, the rational use ofenergy and small-scale (< 50 MW) co-generation. The total budget of theprogramme is approximately € 3 445 million; € 505 million for renewableapplications, € 340 million for rational use of energy and € 343 million forCHP, mainly with natural gas.
The main provisions concerning renewable energy investments include: • Wind parks, conventional solar thermal units: 30%.• Small hydro, biomass, geothermal, high-tech solar thermal units, passive
solar: 40%.• Photovoltaics: 50%.
(eligible investment costs vary by technology)
The level of the subsidy is independent of the geographical region.• Own capital required: 30% (minimum) of the total investment cost.• Minimum investment cost required: € 44 000.• Maximum investment cost subsidised: € 44 million.
Compared to the first Operational Programme for Energy (OPE 1994-1999), thenew programme gives more support to geothermal, PV and passive solar systems.As in the first OPE its objective is to stimulate renewable energy technologyinvestment.
Policy Type Consumer grants/rebates
RE Technology All renewables

GREECE
337
Law 2941/2001
Year 2001 - Present
Policy Description This law supplemented Law 2773/99 with certain provisions concerningrenewables, including:• The definition of general terms and conditions, for which it may be allowed
to install renewable energy facilities on forestry lands.• The characterisation of all renewable energy projects as public utility status,
which gives them the same rights and privileges in land expropriationprocedures as those given to public works, independent of the legal statusof the project owner (private or public).
Policy Type Regulatory and administrative rules
RE Technology All renewables
New Law on the Exploitation of Geothermal Potential(Law 3175/2003)
Year 2003 - Present
Policy Description The exclusive right of the state for the exploitation of geothermal energy isasserted again in this law; however, the state can assign this role to privateinvestors.
Policy Type Regulatory and administrative rules
RE Technology Geothermal


Hungary
339

Gas
Coal
Oil
Nuclear
Renewables
Mtoe
0
5
10
15
20
25
30
35
1971
1973
1975
1977
1979
1981
1983
1985
1987
1989
1991
1993
1995
1997
1999
2001
Gas 42.8%
Coal 14.4%Renewables 1.6%
Nuclear 14.7%
Oil 26.4%
Figure 1. Total Primary Energy Supply by Source Figure 2. Shares of TPES 2001
Shares in Figure 2 may differ from Table 1.See Annex 2 for more detail.
340
Total Primary Energy Supply
Table 1. Total Primary Energy Supply by Source (Mtoe)*
Total primary energy supply (TPES) in Hungary, which is mostly derived from fossil fuels, decreasedby 1.1% per year between 1990 and 2001. Coal and oil represented large but decreasing shares, at14% and 26% in 2001 respectively (Table 1). The increasing natural gas share accounted for 42% ofTPES in 2001 and nuclear accounted for 15%. The majority of Hungary’s oil and gas demand is metby imports although Hungarian authorities believe that the percentage of energy imports may beunderestimated by almost 20% and actually account for as much as 73% of TPES.
In a scenario implementing policies to mitigate CO2 emissions and promote energy diversification, thegovernment projects primary energy supply to grow at an annual rate of approximately 1% to 2020 toreach 27 Mtoe in 2010 and 29 Mtoe in 2020.
PART 2: COUNTRY PROFILES
Source 1970 1980 1990 1995 2000 2001 Imports
Coal 8.0 8.4 6.1 4.5 4.0 3.6 27.6%Oil 6.0 10.9 8.5 7.5 6.9 6.6 71.5%Gas 3.1 8.0 8.9 9.2 9.7 10.7 72.6%Nuclear 0.0 0.0 3.6 3.7 3.7 3.7 -Renewables 0.5 0.5 0.4 0.5 0.4 0.4 -
Biomass 0.5 0.5 0.4 0.5 0.4 0.4Hydro 0.0 0.0 0.0 0.0 0.0 0.0Geothermal 0.0 0.0 0.0 0.0 0.0 0.0Wind/Solar 0.0 0.0 0.0 0.0 0.0 0.0
Total 17.9 28.5 28.5 25.6 24.9 25.3 54.4%% Renewables 2.8% 1.9% 1.4% 2.1% 1.8% 1.6%
* See Annex 2 for explanation of components in total and definition of biomass.

HUNGARY
341
In 2001, renewable energy represented 1.6% of TPES. Renewables in Mtoe grew at a rate of 0.4% peryear between 1990 and 2001. According to Hungarian authorities, the 1.6% share represents onlycommercially-traded renewable energy sources. The renewables share is estimated to be about 3% ofTPES if non-commercially traded renewable energy, such as agricultural or forest waste products, and fuelwood used by the residential sector in small boilers are taken into account.
A total of 36 418 GWh of electricity was generated in 2001. Nuclear dominated, accounting for 39% ofthe electricity produced, 25% by coal, 24% by natural gas and 12% by oil. The contribution of renewablesto total electricity generation amounted to 0.9% in 2001, primarily through small run-of-the-riverhydroelectricity plants. The share of renewables in electricity has remained relatively steady between 1990and 2001.

Between 1970 and 2001, energy supply from renewables has exhibited a downward trend, decreasing by0.6% per year. According to IEA statistics, solid biomass and industrial waste constituted 95% of therenewable share in TPES, hydropower 3.8%, geothermal 1.4%, and new renewables 0.4%. Renewablesources contributed 1.6% to TPES in Hungary in 2001, though, if non-commercially traded sources ofrenewables were taken into account the contribution would be about 3% according to Hungarianauthorities. Accurate calculations of the renewables contribution to TPES are difficult. First, reportingmethods in Hungary do not separate out renewable from non-renewable waste within the combustible
342
PART 2: COUNTRY PROFILES
Policy Timeline
Research and Development
. Energy Saving Action Plan
. Energy Saving and Energy Efficiency Improvement Action Programme
Market Deployment
. National Energy Saving and Energy Efficiency Improvement Programme
. Energy Saving Credit Programme
. Energy Saving and Energy Efficiency Improvement Action Programme
. Széchenyi Plan
. Electricity Act
Denotes a significant change to a policy, such as an extension, repeal or revision.
Mtoe
0
0.1
0.8
0.2
0.3
0.4
0.5
0.6
0.7
1971 73
1975 77
1979 81
1983 85
1987 89
199 93
1995 97
1999 01
Figure 3. Total Renewable Energy Supply and Policy Timeline
CombustibleRenewables
and Waste
Hydro
Geothermal
Renewable Energy Supply

HUNGARY
343
Million US$ (2002 prices and exchange rates)3.5
0.5
1
1.5
2
2.5
3
Figure 4. Hungary – Government Energy RD&D Budgets*
1995
1996
1997
1998
1999
2000
2001
2002
Total OtherTech./Research
TotalConservation
Total Power& Storage Tech.
Total NuclearFission/Fusion
Total RenewableEnergy
Total FossilFuels
renewables and waste category. Second, IEA statistics do not take into account non-commercially tradedsources of renewables.
Electricity generation from renewable sources totalled 313 GWh in 2001, 0.9% of total electricitygeneration. Electricity generation from renewables in Hungary is dominated by small run-of-riverhydroelectric plants (capacity < 5MW). Hydropower amounted to approximately 0.5% of gross electricityproduction, i.e., 186 GWh. Of the renewables share in electricity generation, hydropower represented66%, incineration 112 GWh (30%), sewage gas 7 GWh (2.47%) and the other renewable technologies atless than one percent. Hungary, as an EU Accession Country, has agreed to a national indicative target forelectricity production from renewable energy sources at 3.6% by 2010 from the current 0.5%. This isexpected to result in a 1% increase per year over a ten-year period.
Research and Development Trends
In 1995, Hungary initiated efforts to develop and promote renewable energy sources with the adoption ofofficial energy policies. Government energy RD&D budgets in Hungary amounted to US$ 7.7 million (in2002 prices and exchange rates) between 1995 and 2002. Renewable energy has received the bulk of thegovernment energy RD&D budget almost every year since 1995, with notable exceptions from 1997 to1999. Additional RD&D funding for conservation and fossil fuels was provided in 2000. Renewablesretained the largest share of government RD&D funding in 2002 with more than 50% of the total funding.
Government RD&D expenditures for renewables followed the same overall trend as for total energybudgets. Government RD&D budgets for renewables started in 1995, and then dropped to very low levelsuntil 2000 and increased significantly in 2001 and 2002.
Approximately 46% of the total government energy RD&D budget (US$ 3.57 million) was allocated torenewables RD&D. Biomass retained the largest share almost every year, except between 1996 and 1999when overall government budgets decreased and government RD&D funding was redistributed. SolarHeating and Cooling also commanded consistent funding over this period. Geothermal received someRD&D funding in 1996. Wind energy was allotted 14% of the total renewable RD&D budget in 2002.
* Data are not available for 1997.

344
Historically, RD&D activities received little financial or institutional support from the government. Those earlyefforts in renewable RD&D were hampered by other competing national priorities. Until recently, no coherentor comprehensive RD&D plan existed to develop renewable energy technology and market priorities.
The government responded to this need and emphasised a new commitment to RD&D as a policymeasure to define clear technology and market priorities to promote the use of renewables. The NationalEnergy Saving and Energy Efficiency Improvement Programme was established in 1995 in the frameworkof the Energy Policy Concept, the Energy Saving Credit Programme and the Energy Saving Action Plan.This programme offered support to RD&D activities in the form of interest free loans. This was followedby the 1999 Energy Saving and Energy Efficiency Improvement Action Programme that specificallyprescribed the involvement of renewable energies in RD&D programmes to ultimately facilitate thedissemination of renewable energy facilities.
Market Deployment Trends
The bulk of Hungarian renewable energy policies have been instituted within the last eight years. They arecharacterised by grants to the renewable energy industry, low interest rate loans, tax incentives and feed-in tariffs. As a result of these programmes and policies, several investments in renewable energy projectshave been carried out since 2000.
The Energy Saving Credit Programme (ESCP) of 1996 offers low interest rate loans for energy efficiencyprojects, which have been used mostly for investment in reconstruction of heating systems andmodernisation of lighting systems. The main clients of the ESCP have been municipalities, and results havebeen satisfactory, although the upper limit of the fund (HUF 25 million) was considered to be on the lowside. With the replacement of the ESCP by the government’s Energy Saving and Energy EfficiencyImprovement Action Programme, adopted in 1999, the number of applications increased dramatically,which posed a challenge to the funding and evaluation process.
The Energy Saving and Energy Efficiency Improvement Action Programme defined targets to be achievedby 2010, which include increasing renewable energy production from the current 28 PJ to 50 PJ per year.Funding was provided by the Ministry of Economy and Transport with an initial budget allocation of
PART 2: COUNTRY PROFILES
Million US$ (2002 prices and exchange rates)
0
1.8
0.2
0.4
0.6
0.8
1
1.2
1.4
1.6
Figure 5. Hungary – Government Renewable Energy RD&D Budgets*
SolarPhoto-Electric
Solar Heating& Cooling
Geothermal
Biomass
Wind
1995
1996
1997
1998
1999
2000
2001
2002
* Data are not available for 1997.
HUNGARY
345
HUF 1 billion for 2000. The budget increased to HUF 2 billion. The main actions for renewables are toincrease heat production from biomass, geothermal energy, wastes and solar energy. The Roofs SolarCollector Programme aims to install 20 000 solar collectors on rooftops by 2010.
The energy portion of the Széchenyi Plan managed by the Ministry of Economy and Transport providedsupport for renewable energy projects through a one-time grant. This plan supported 30% of investmentcosts for renewable energy projects, with the ceiling differing according to type and purpose of project.In 2000, HUF 350 million (about US$ 1.5 million) was available for projects with the aim of increasingthe use of any renewable source of energy. This plan was replaced by the lower funded National EnergySaving Programme (NEP) in 2003. Within this programme, the NEP-6 and NEP-7 sub-programmes offerinvestment incentives to municipalities, individuals and businesses. These sub-programmes receivedfunding on the order of HUF 140 million for NEP-6 and HUF 180 million for NEP-7. The structurechanged in 2004. The NEP-5 sub-programme targets municipalities and individuals, while NEP-6 targetsentrepreneurs. Budgets amount to HUF 100 million for each sub-programme.
The Ministry of Environment and Water provides similar support for renewables. To avoid duplication ofpublic funding, the total amount of public financial support may not exceed 50% of the total costsof development, excluding any reclaimable VAT, or 65% in the case of small and medium-sizedundertakings. Applicants must have their own financial sources amounting to at least 25% of the totalproject cost.
The 2001 Electricity Act offers independent electricity producers using renewables with a capacity above100 kW the possibility to benefit from a technology specific feed-in tariff, which will expire in 2010.Adjusted annually for inflation, the tariff is paid by the main electricity producer (MVM) when a powerplant is connected to the transmission network or by the local service provider if the independentproducer is connected to the distribution network. The purchase of renewable electricity is mandatory.
Given the current cost of renewable energy projects, however, the tariff is not sufficient to render themfully independent of other support mechanisms. Nor has the feed-in tariff been deemed very effective, asa level of uncertainty is associated with the Ministry of Economy and Transport decree that regulates thetariff. The Ministry has the power to change the prices as well as the period of guarantee at any time.Although favourable grants and loans for investors exist, banks are less reluctant to provide loans forprojects whose returns cannot be safely calculated. Additional barriers to the deployment of renewableenergy in Hungary include the high cost associated with renewable energy compared with lower costimports, land use and land ownership questions, high extra costs associated with some renewable energysources such as geothermal (mining and water extraction taxes, etc.).
Public Awareness
Educating the public on the benefits of renewable energy was a goal spelled out in 1995 in the EnergySavings Action Plan. Little has come from this initiative and awareness among the Hungarian populationon the benefits of renewable energy is weak. Nuclear energy is considered the “green” source of energyand is thus favoured over renewable energy.
Intermittency
Intermittency is not currently considered a problem although it is envisaged that it could become achallenge when wind becomes a more commonly used source of renewable energy. No steps arecurrently being taken to address this issue though some experts feel that this may influence thegovernment’s choice of which renewable energy technologies to pursue.

346
Distributed Generation
Grid connection of renewables is not currently an issue in Hungary. The primary use of renewables isbiomass, generally used in association with coal combustion, which has direct access to the grid.
Energy Policy Context
The EU Directive 2001/77/EC sets out Hungary’s target to double its renewable energy proportion fromthe current 3.6% to 7.2% by 2010. Also, by 2010, the government has developed their own aim toincrease the share of renewables in TPES to at least 5%. This target has been integrated as part of thegovernment’s Energy Conservation and Energy Efficiency Improvement Action Programme. Thegovernment has established market priorities to meet their obligations by first concentrating on growth ofthe biomass market, second on the increased use of hydropower and the development of wind energy.
EU accession has changed the renewable energy outlook in Hungary. The transposition of the acquiscommunautaire and the unification of Hungarian markets with EU markets, including conformity with theEU renewable energy source directive, are acting as the main drivers for renewable energy developmentin Hungary.
Renewables have been further supported by a reorganisation of the government structure. The governmentoperates within a clearly defined National Development Plan. Within the hierarchical structure of the Planthere are seven Operational Programmes (OPs). Prior to 2000, renewable energy was classified as acomponent under the Natural Resources OP. Now renewable energy has a higher classification under theEnvironment and Infrastructure OP, signalling a rise in importance in how renewable energy is viewedwithin the government.
It is expected that EU accession will offer Hungary the opportunity to reform energy prices through theelimination of direct subsidies to better reflect the real cost of energy. To this end, the Ministry ofEnvironment and Water introduced a New Environment Burden Tariff in 2004. Regulated by the 2003/89decree, this tariff applies to air, water and soil pollution and is levied on NOx, CO2 emissions and solidsubstances. This tariff is ramped up each year to reach 100% by 2008. The majority of costs, however,remain externalised and will continue to remain so long as certain energy carriers retain political sensitivity.
PART 2: COUNTRY PROFILES

HUNGARY
347
Renewable Energy Markets
Hydropower
Installed hydropower capacity was unchanged at 48 MW between 1990 and 2001. Hydropoweraccounted for 3.9% of the renewable share in TPES and 66% of the renewable share in overall electricityproduction. Installed capacity at the most important hydro facilities at Tiszalök, Kisköre and Kesznyét is27.5 MW, of which effective capacity is 20 MW annually and they produce on average about 186 MWhper year of electricity. The average capacity of small hydro plants is 1.8 MW.
Results from the PHARE-Twinning Project of the Energy Centre in Hungary indicate that the theoreticalhydropower potential in Hungary is about 1 000 MW of capacity and 7 500 GWh per year of production. Itis estimated that only 5-6% of the potential hydro energy can be exploited. Hungary’s geographical conditionsare such that new hydropower projects consist primarily of small plants, with the possibility of re-use of waterfrom existing hydropower plants. It is estimated that hydropower can be increased by approximately 30%, i.e.,56 GWh through retrofitting existing plants and wide penetration of mini hydro plants.
Hydropower is considered a mature technology and generally does not receive support. Small hydro (> 5 MW)can compete for investment support for the funds that are available for all renewable technologies.
Biomass Heat ProductionFigure 7 shows installed capacity for biomass at 5 MW from 1995, when capacity data first becameavailable. Heat production from biomass has been declining on average 12% per year between 1990 and2001. This reflects the wider availability of gas in rural areas. In villages where gas is available, almost90% of homes are connected to the pipeline.
993
199
199994
995
199
199996
997
199
199998
999
199
200000
001
200
200002
200399
119
919
9992
199990Hydropower Policy Timeline
. No Major Policies
ProductionCapacity
0
60
10
20
30
40
50
0
250
50
100
150
200
Figure 6. Hydropower Capacity and Electricity Production
GrossElectricity
Production(GWh)
Capacity (MW)
1990
1991
1992
1993
1994
1995
1996
1997
1998
1999
2000
2001

348
Energy from biomass accounts for the major share of renewable energy consumption and is principallyderived from wood processing for heat generation. Biomass used for energy purposes in Hungary alsoincludes firewood, energy crops, agricultural and forestry by-products and wastes. According to theEnergy Centre in Hungary (Interreg 3a), only a small portion of the biomass potential for heat generationis being used. Biomass potential is good enough to significantly benefit agriculture by the cultivation ofset-aside lands and increased employment.
Wood waste is increasingly being used with coal combustion in power plants to increase the lifetimeof old power plants and reduce fuel cost. Hungary is experimenting with three projects that involve fuel-switching:
● Borsod power plant (Kazincbarcika) retrofit of a 30 MW unit to use fuel wood.
● Pécs power plant plans to invest in a 50 MW unit using firewood, for which trial operations areexpected to begin in mid-2004.
● Bakony power plant (Ajka) plans to switch from coal to wood chips in a 30 MW unit.
Fuel wood is also used in some district heating plants totalling about 30 MW of capacity. Renewables areconsidered as a possible substitute for natural gas, where gas could serve as a complementarysupplemental resource for peak consumption. Solid waste comprised the largest share of heat productionat 90%, although selective collection remains an issue.
PART 2: COUNTRY PROFILES
993
199
199994
995
199
199996
997
199
199998
999
199
200000
001
200
200002
200399
119
919
9992
199990Biomass Heat Policy Timeline
Research and Development
. Energy Saving and Energy Efficiency Improvement Action Programme
Market Deployment
. Energy Saving and Energy Efficiency Improvement Action Programme
. Széchenyi Plan
Denotes a significant change to a policy, such as an extension, repeal or revision.
ProductionCapacity
0
6
1
2
3
4
5
0
600
100
200
300
400
500
Figure 7. Solid Biomass Capacity and Heat Production
Gross HeatProduction (TJ)
Capacity (MW)
1990
1991
1992
1993
1994
1995
1996
1997
1998
1999
2000
2001

HUNGARY
349
The use of biomass from wood processing is expected to increase with investments in modern wood-firedboilers and small power plants, although at present Hungary’s energy policies are too recent to see results.The Energy Saving and Energy Efficiency Improvement Action Programme includes a target to increase heatproduction from biomass, in addition to geothermal, waste and solar energy.
Biogas Electricity Production
ProductionCapacity
0
2
1
0
8
1
2
3
4
5
6
7
Figure 8. Biogas Capacity and Electricity Production
GrossElectricity
Production(GWh)
Capacity (MW)
1990
1991
1992
1993
1994
1995
1996
1997
1998
1999
2000
2001
993
199
199994
995
199
199996
997
199
199998
999
199
200000
001
200
200002
200399
119
919
9992
199990Biogas Electricity Policy Timeline
Research and Development
. Energy Saving and Energy Efficiency Improvement Action Programme
Market Deployment
. Energy Saving and Energy Efficiency Improvement Action Programme
. Instrument for Structural Policies for Pre-Accession
. Electricity Act
. Environmental Target Fund (KAC)
The biogas industry started in 2000 with an installed capacity of 1 MW, which increased to 2 MW in2002. Electricity generation from biogas was 7 GWh in 2001 and 9 GWh in 2002.
Approximately fifteen to twenty companies produce biogas, usually for conversion to electricity. Otherthan chemical industry products, biogas is produced from a wide variety of organic materials includingmanure, by-products, wastes and sewage. The raw material for liquid biogas production is generally liquidmanure or food industry liquid with organic content, whose dry material level is between 2 and 8%, and
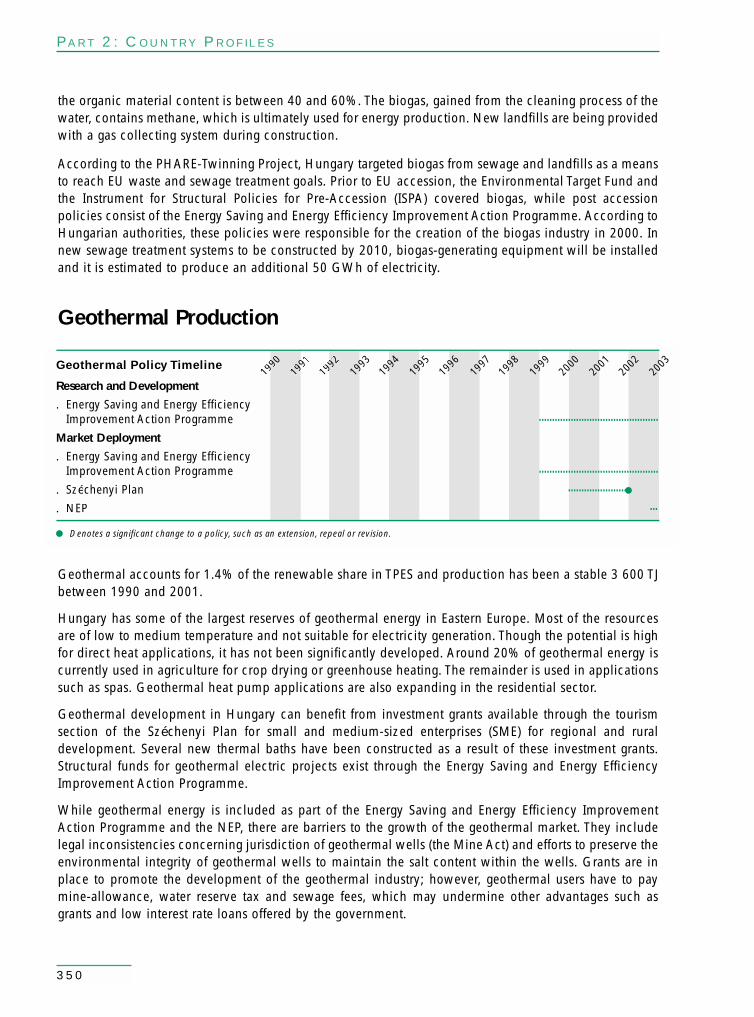
350
the organic material content is between 40 and 60%. The biogas, gained from the cleaning process of thewater, contains methane, which is ultimately used for energy production. New landfills are being providedwith a gas collecting system during construction.
According to the PHARE-Twinning Project, Hungary targeted biogas from sewage and landfills as a meansto reach EU waste and sewage treatment goals. Prior to EU accession, the Environmental Target Fund andthe Instrument for Structural Policies for Pre-Accession (ISPA) covered biogas, while post accessionpolicies consist of the Energy Saving and Energy Efficiency Improvement Action Programme. According toHungarian authorities, these policies were responsible for the creation of the biogas industry in 2000. Innew sewage treatment systems to be constructed by 2010, biogas-generating equipment will be installedand it is estimated to produce an additional 50 GWh of electricity.
Geothermal Production
PART 2: COUNTRY PROFILES
1993
1994
1995
1996
1997
1998
1999
2000
2001
2002
200399
119
919
9992
199990Geothermal Policy Timeline
Research and Development
. Energy Saving and Energy Efficiency Improvement Action Programme
Market Deployment
. Energy Saving and Energy Efficiency Improvement Action Programme
. Széchenyi Plan
. NEP
Denotes a significant change to a policy, such as an extension, repeal or revision.
Geothermal accounts for 1.4% of the renewable share in TPES and production has been a stable 3 600 TJbetween 1990 and 2001.
Hungary has some of the largest reserves of geothermal energy in Eastern Europe. Most of the resourcesare of low to medium temperature and not suitable for electricity generation. Though the potential is highfor direct heat applications, it has not been significantly developed. Around 20% of geothermal energy iscurrently used in agriculture for crop drying or greenhouse heating. The remainder is used in applicationssuch as spas. Geothermal heat pump applications are also expanding in the residential sector.
Geothermal development in Hungary can benefit from investment grants available through the tourismsection of the Széchenyi Plan for small and medium-sized enterprises (SME) for regional and ruraldevelopment. Several new thermal baths have been constructed as a result of these investment grants.Structural funds for geothermal electric projects exist through the Energy Saving and Energy EfficiencyImprovement Action Programme.
While geothermal energy is included as part of the Energy Saving and Energy Efficiency ImprovementAction Programme and the NEP, there are barriers to the growth of the geothermal market. They includelegal inconsistencies concerning jurisdiction of geothermal wells (the Mine Act) and efforts to preserve theenvironmental integrity of geothermal wells to maintain the salt content within the wells. Grants are inplace to promote the development of the geothermal industry; however, geothermal users have to paymine-allowance, water reserve tax and sewage fees, which may undermine other advantages such asgrants and low interest rate loans offered by the government.

HUNGARY
351
ProductionCapacity
0
2
1
0
1.2
0.2
0.4
0.6
0.8
1
Figure 9. Wind Power Capacity and Electricity Production
GrossElectricity
Production(GWh)
Capacity (MW)
1990
1991
1992
1993
1994
1995
1996
1997
1998
1999
2000
2001
993
199
199994
995
199
199996
997
199
199998
999
199
200000
001
200
200002
200399
119
919
9992
199990Wind Power Policy Timeline
Market Deployment
. Széchenyi Plan
. Electricity Act
. NEP
Denotes a significant change to a policy, such as an extension, repeal or revision.
Wind Power
In 2001 wind power capacity was 1 MW with 1 GWh of electricity generation. There has not been acountrywide comprehensive assessment of Hungary’s wind potential, and measurements have been madeonly at the height of 30-50 metres. The calculated potential is 70 W per m2 year on the Great Plains, and160-180 W per m2 year in north-western Hungary. It is reported that by 2003 there were six operatingwind turbines with a total installed capacity of 3.2 MW, located in Kulcs (600 kW), Inota (200 kW),Mosonszolnok (2 × 600 kW) and Mosonmagyaróvár (2 × 600 kW).
Incentives for wind energy projects are available through the National Energy Saving Programme (NEP)and Structural Funds within the Environment and Infrastructure Operative Programme. The Ministry ofEnvironment and Water has approved the establishment of 200 wind turbines in Hungary, although actualconstruction and installation is entirely dependent on investment from companies. According to theEnergy Centre, a significant barrier to investment lies in the difficulty in obtaining approval fromenvironmental inspectors, who tend to view wind power developments as environmentally destructive.The Hungarian government has undertaken informational and educational activities to facilitate windpower development.

352
PART 2: COUNTRY PROFILES
Japan Policy ChronologyHungary Policy Chronology
German Coal Aid Revolving Fund
Year 1991 - Present
Policy Description This energy saving programme started in 1991 with an original target to providefinancing for the private sector to support energy efficiency investments andreduce environmental pollution. The German Coal Aid Revolving Fund(GCARF) is administered by the Hungarian Credit Bank. Its scope has beenexpanded to include municipalities. The main objectives are to replacetraditional energy sources with renewable or waste-related energy sources, toinduce energy saving in businesses and to reduce energy waste at the lowestpossible cost. The preferential interest is one-third of the central bank’s base ratewith an additional 2.5% interest. From 1991 to 2002 the total amount ofinvestments approved for “live projects” was HUF 14.4 billion, of which HUF11.9 billion was made up of preferential credits.
In 2000, the GCARF allocated more than HUF 1 billion in preferential creditfor SMEs, which resulted in energy savings of 325 TJ per year and totalinvestment of HUF 1.6 billion. In 2001, a total of HUF 0.89 billion was spenton renewable investments from preferential credit. In 2002, the amount of thepreferential credit was increased to HUF 1.51 billion. A total investment ofHUF 3.53 billion resulted in 1.04 PJ energy savings.
Policy Type Third-party finance
RE Technology All renewables
The National Energy Saving and Energy EfficiencyImprovement Programme
Year 1995-1999
Policy Description Established in the framework of the Energy Policy Concept (Resolution2399/1995) the major objectives include: least-cost planning and demand-sidemanagement; cost-based energy pricing to motivate energy efficiency;development of a new energy statistics and information system; introduction ofindividual metering and regulation in new apartment blocks with district heatingsupply; implementation of minimum standards for the insulation of newbuildings; energy efficiency labelling of household appliances; energy savingsawareness raising and education; improving energy efficiency in municipalitiesvia the Energy Saving Credit Programme; increasing the use of renewable energy;and prioritising energy efficiency in state financed R&D programmes.
Policy Type General energy policy, RD&D
RE Technology All renewables

HUNGARY
353
Energy Saving Action Plan
Year 1996 - Present
Policy Description The Energy Saving Action Plan focuses on the penetration of renewables, energyefficiency improvements, energy efficiency labelling and education,information, and technology innovation.
It is unclear to what extent the objectives of the Programme have beenachieved. According to critics, in general performance has been poor, attributedto a lack of co-ordination among the institutions involved, limitations to theapplication of DSM by utilities, problems with enforcing building standards, alack of awareness campaigns to accompany the introduction of labels, and alack of substantial incentives for renewable energy.
Policy Type Public awareness
RE Technology All renewables
Energy Saving Credit Programme
Year 1996 - Present
Policy Description In the framework of the Energy Saving Credit Programme (ESCP) programme, thetotal investment spent on energy efficiency projects has been HUF4.692 billion (€ 17.6 million), of which HUF 3.554 billion was for preferentialcredit. So far, the ESCP has focused on funding energy savings programmes at themunicipal level, modernisation of district heating systems and the developmentof energy service company (ESCO) financing. The funds are provided by a localbank – winner of an annual tender through which the interest rate of the loan (thelowest offer) is set. Part of the subsidy is a grant provided by the EconomicDevelopment Fund of the Ministry of Economic Affairs. Applications areevaluated by the bank and by an Inter-Ministerial Committee which analyses thetechnical feasibility and the level of energy saving.
Policy Type Third-party finance
RE Technology All renewables
Pilot Panel Programme
Year 1996-2000
Policy Description This policy made low-interest funding available for the energy-efficientrefurbishment of buildings constructed from pre-fabricated panels, includinginsulation and heating system modernisation. The interest rate was set below10%. The budget was approximately US$ 10 million.
Policy Type Third-party finance
RE Technology All renewables

354
PART 2: COUNTRY PROFILES
Hungarian Energy Efficiency Co-finance Programme
Year 1997 - Present
Policy Description The HEECP programme was launched by the International Finance Corporation(IFC) Environmental Projects Unit with a total of US$ 5 million funding for thepilot phase from the Global Environmental Facility (GEF). The funds areallocated: US$ 4.25 million for guarantee reserves, US$ 300 000 for technicalassistance and US$ 450 000 for programme administration and operations overa four-year period.
After successful termination of the pilot phase, the guarantee facility has beenexpanded to US$ 16 million. Under the guarantee programme, participatinglocal financial institutions execute Guarantee Facility Agreements with the IFC.HEECP provides partial guarantee support to credit provided by the financialinstitutions for energy efficiency projects (50% in the pilot phase and 35%under HEECP-2). The rationale is to overcome barriers to energy efficiencyproject financing, which are due to credit risk barriers. These include weak oruncertain end-user credit, the gap between perceived and real credit riskand lack of properly structured and credit-worthy projects, coupled with therelatively high transaction costs and risks associated with energy efficiencyprojects. The guarantee programme addresses the problems associated withcredit risk. The technical assistance component aims to provide expertise and tomake small grants available for marketing of services by participating financialinstitutions, project identification, development and investment preparation,general energy efficiency market promotion activities, and programmeevaluation activities. Technical assistance funds are also provided to ESCOs.HEECP also seeks ways to promote expanded energy efficiency markets inHungary in co-operation with other commercial, governmental and NGOagencies. Other GEF-financed programmes include the UNDP/GEF Public SectorEnergy Efficiency Programme and the IFC/GEF.
Policy Type RD&D / Third-party finance / Capital grants
RE Technology All renewables
Hungarian Energy Policy Principlesand the Business Model of the Energy Sector
Year 1999 - Present
Policy Description In 1999, the government adopted an energy policy following domestic and EUdevelopments (e.g., privatisation of the Hungarian energy sector, the EUliberalisation Directives, the Kyoto commitments). The core objective is to preparethe Hungarian energy sector for EU accession. Consequently, major emphasis hasbeen given to guidelines for establishing competitive markets and price regulationfor electricity and natural gas. Energy conservation, renewable energy, districtheating and environmental protection are also a part of the policy.

HUNGARY
355
Policy Type Regulatory and administrative rules
RE Technology All renewables
Energy Saving and Energy Efficiency ImprovementAction Programme
Year 1999-2010
Policy Description This programme was established in the framework of government resolution1107/1999 following the National Energy Saving and Energy EfficiencyImprovement Programme of 1995. The new programme defines the followingtargets by 2010:
• Reduce energy intensity by 3.5% per year, assuming an annual growth of GDPof 5% and a growth rate of energy consumption of 1.5% per year.
• Save 75 PJ per year (1.8 Mtoe) of primary energy.
• Reduce emissions by 50 kt per year of SO2 and 5 Mt per year of CO2.
• Increase renewable energy production from 28 PJ to 50 PJ per year(1.2 Mtoe per year).
Initial funding for the Action Programme was provided by the EconomicDevelopment Fund of the Ministry of Economy and Transport. The initial budgetallocation was HUF 1 billion per year in 2000. The budget for 2001 increasedto HUF 2 billion, and was supplemented by an additional HUF 3 billion fromthe Housing Programme of the Széchenyi Plan, which was earmarked forfunding of energy efficiency measures in the housing sector.
The Housing Programme is managed by the Building Department of theMinistry of Economy and Transport. The decree also establishes the possibilityof using part of the planned Environmental Emission Fee for the Programme. TheEnergy Saving and Energy Efficiency Action Programme includes fifteen actions.The main highlights of the actions relating to the promotion of renewables are:
• Increased heat production from biomass, geothermal, wastes and solar energy.
• “20 000 roofs with solar collectors” by 2010 programme.
Policy Type RD&D / Capital grants
RE Technology BiomassGeothermalWasteSolar thermalSolar photovoltaic
Funding under the Energy Saving Strategy and Action Plan
Year 2000 - Present
Policy Description In 2000, the Hungarian government allocated HUF 1 billion (US$ 4 million)from the state budget to support energy efficiency and renewables as planned

356
PART 2: COUNTRY PROFILES
in the Energy-Saving Strategy programme adopted in 1999. The programmeaims to increase energy efficiency by 3.5% a year, reduce CO2 emissions by5 Mt per year and increase renewables from 28 PJ in 1999 to 50 PJ in 2010. Anaction plan adopted in 2000 includes grants to perform energy audits, improvethe energy management of local governments and increase energy efficiency.
The Hungarian government plans to allocate HUF 5 billion a year (US$ 20 millionper year) from 2002 to 2010 to finance the programme.
Policy Type Consumer grants/rebates
RE Technology All renewables
Széchenyi Plan
Year 2000-2002
Policy Description The Széchenyi Plan was an economic development plan in which thegovernment indicated the areas where it considered development mostessential to become economically competitive with the rest of Europe.
It provided support for renewable energy projects through application for a one-time grant aid programme. This plan supported up to 30% of investment costsin renewable energy, with the upper limit differing depending on the type andpurpose of the project.
In 2000, HUF 350 million (approximately US$ 1.5 million) was available forcompetitive applications, to increase the use of any renewable sources of energy.The grant could not exceed HUF 35 million (approximately US$ 160 000), unlessjustified.
Policy Type Capital grants
RE Technology All renewables
ISPA: Instrument for Structural Policies for Pre-Accession
Year 2000-2006
Policy Description This policy finances major environmental and transport infrastructure projects.With an annual budget of € 1.040 billion, ISPA comes under the responsibilityof the Regional Policy Directorate General.
Together with PHARE and aid for agricultural development, Agenda 2000proposed structural aid for EU applicant countries amounting to some€ 1 billion per year for the period 2000-2006. This aid is mainly directed toalign the applicant countries with community infrastructure standards,particularly – and by analogy with the Cohesion Fund – in the transport andenvironmental spheres. Following on from the European Council’s conclusions,the European Commission proposed a regulation on an instrument for structuralpolicies for pre-accession (ISPA), based on Article 235 of the Treaty. Given its

HUNGARY
357
similar objectives, it was considered appropriate for ISPA to broadly follow theapproach of the revised Cohesion Fund.
Policy Type Capital grants
RE Technology All renewables
Electricity Act – Green Certificates Scheme
Year 2001 - Present
Policy Description The Hungarian Parliament approved the new Act on Electricity in 2001. The Actentered into force on 1 January 2003 and allows the gradual introduction ofcompetition. The first step was opening up 35% of the market. The Act includesthe possible use of a green certificates system, which will be regulated by asecondary legislative process.
Policy Type Tradable certificates
RE Technology All renewables
Electricity Act
Year 2001 - Present
Policy Description The 2001 Electricity Act offers the possibility for independent electricityproducers using renewables with a capacity above 100 kW to benefit from afeed-in tariff. The tariff is the same for all renewable energy sources and isadjusted annually for inflation. It is paid by the main electricity producer (MVM)when a power plant is connected to the transmission network, or by the localservice provider if the independent producer is connected to the distributionnetwork. The purchase of renewable electricity is mandatory. The tariff isregulated by the Ministry of Economy and Transport.
The 2001 Electricity Act also includes a reference to the intent to move towardsa portfolio-based system, met by a renewable energy obligations and tradablegreen certificates. The details have not yet been set out.
Policy Type Guaranteed prices/feed-in tariffs
RE Technology All renewables
UNDP/GEF Public Sector Energy Efficiency Programme
Year 2001 - Present
Policy Description This programme runs in parallel to the National Energy Saving and EnergyEfficiency Action Programme. It aims to help Hungary improve energyefficiency in the public sector by removing barriers to improved energyefficiency in municipal and public buildings, including schools and hospitals.The main objectives are to improve the development of an energy efficiency

358
PART 2: COUNTRY PROFILES
policy; increase awareness and improve co-ordination of the energy efficiencypolicy; the identification, development and financing of energy efficiencyprojects in municipalities; and to improve the knowledge base on energymanagement and energy efficient technologies. The Energy Centre is theimplementing agency for the project, under the auspice of the Ministry ofEconomy and Transport. The programme also intends to reach out tomunicipalities and local advice centres and networks. The budget isapproximately US$ 4.6 million.
Policy Type Public awareness
RE Technology All renewables
KAC-Environmental Target Fund
Year 2003 - Present
Policy Description In 2003 the fund became part of the “Green Source” environmental programmeof the Ministry of Environment and Water. It subsidises the KAC and the WaterManagement Target Fund (VICE).
In 2003, in the framework of the KAC, there were calls for applications undersix topic areas, which were financed by HUF 4.11 billion:
• Green Village, green city.
• Waste management.
• Healthy environment.
• Nature protection.
• Social programmes.
• Landscape settlement.
In 2003, in the framework of the VICE, there were calls for applications underfour topic areas, which were financed by HUF 4 332 billion:
• Investments to improve water supply.
• Establish sewage systems.
• Placing and cleaning sewage.
• Investments for water protection.
Policy Type Capital grants
RE Technology All renewables
National Energy Saving Programme
Year 2003 - Present
Policy Description The programme was established to replace the energy portion of the SzéchenyiPlan. The National Energy Savings Programme (NEP) NEP-2003-6 targets

HUNGARY
359
municipalities and individuals and NEP-2003-7 targets entrepreneurs andprovides subsidies for renewable energy investments to replace conventionalenergy sources, reduce environmental pollution and adapt to the energy policyof the European Union. The budget for NEP-6 was HUF 140 million and HUF180 million for NEP-7. In 2004, NEP 2004-5 (municipalities and individuals)and NEP 2004-6 (for entrepreneurs) offers grants for renewable energyinvestments, with budgets of 100 million HUF per sub-programme.
Policy Type Consumer grants/rebates / Capital grants
RE Technology All renewables
New Environmental Tariff in Hungary
Year 2004 - Present
Policy Description The New Environmental Burden Tariff was introduced in 2004. This tariff appliesto air, water and soil pollution and is regulated by the 2003/89 decree. Anestablished percentage of the tariff rate is to be paid in 2004 and is to plannedto reach 100% by 2008. The tariff is to be paid every three months by registeredpolluting sources (e.g., industrial facilities) for Nox and CO2 emissions and solidsubstances.
Policy Type Fossil fuel taxes
RE Technology All renewables

Ireland
361
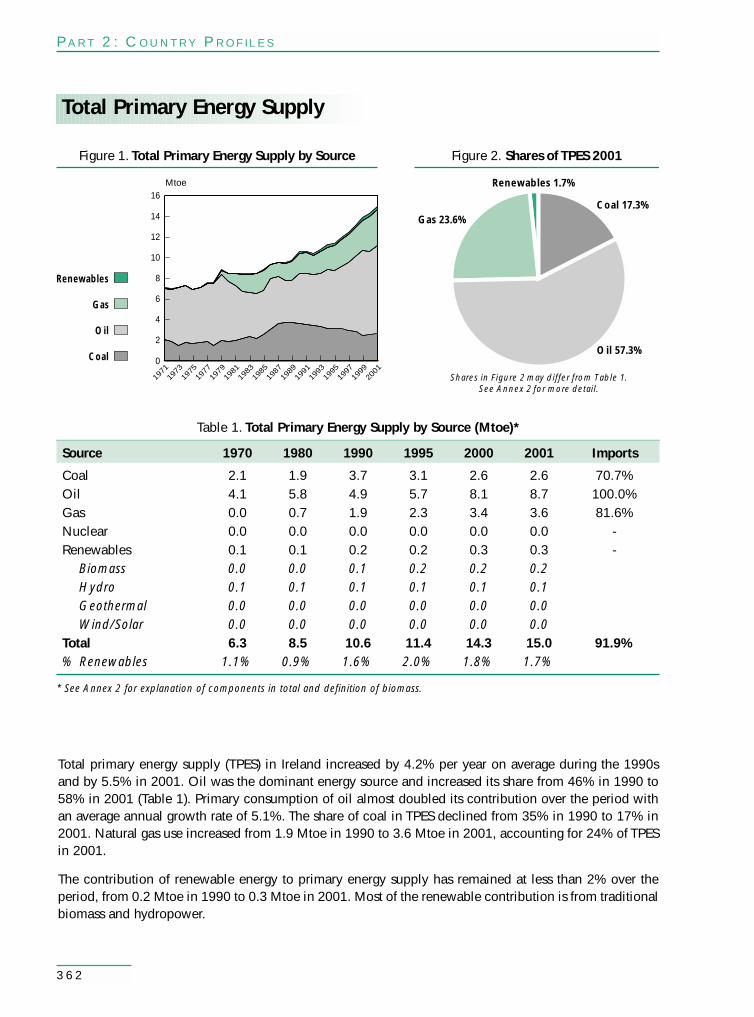
Gas
Coal
Oil
Renewables
Mtoe
0
2
4
6
8
10
12
14
16
1971
1973
1975
1977
1979
1981
1983
1985
1987
1989
1991
1993
1995
1997
1999
2001
Gas 23.6%Coal 17.3%
Renewables 1.7%
Oil 57.3%
Figure 1. Total Primary Energy Supply by Source Figure 2. Shares of TPES 2001
Shares in Figure 2 may differ from Table 1.See Annex 2 for more detail.
362
Total Primary Energy Supply
Table 1. Total Primary Energy Supply by Source (Mtoe)*
Total primary energy supply (TPES) in Ireland increased by 4.2% per year on average during the 1990sand by 5.5% in 2001. Oil was the dominant energy source and increased its share from 46% in 1990 to58% in 2001 (Table 1). Primary consumption of oil almost doubled its contribution over the period withan average annual growth rate of 5.1%. The share of coal in TPES declined from 35% in 1990 to 17% in2001. Natural gas use increased from 1.9 Mtoe in 1990 to 3.6 Mtoe in 2001, accounting for 24% of TPESin 2001.
The contribution of renewable energy to primary energy supply has remained at less than 2% over theperiod, from 0.2 Mtoe in 1990 to 0.3 Mtoe in 2001. Most of the renewable contribution is from traditionalbiomass and hydropower.
PART 2: COUNTRY PROFILES
Source 1970 1980 1990 1995 2000 2001 Imports
Coal 2.1 1.9 3.7 3.1 2.6 2.6 70.7%Oil 4.1 5.8 4.9 5.7 8.1 8.7 100.0%Gas 0.0 0.7 1.9 2.3 3.4 3.6 81.6%Nuclear 0.0 0.0 0.0 0.0 0.0 0.0 -Renewables 0.1 0.1 0.2 0.2 0.3 0.3 -
Biomass 0.0 0.0 0.1 0.2 0.2 0.2Hydro 0.1 0.1 0.1 0.1 0.1 0.1Geothermal 0.0 0.0 0.0 0.0 0.0 0.0Wind/Solar 0.0 0.0 0.0 0.0 0.0 0.0
Total 6.3 8.5 10.6 11.4 14.3 15.0 91.9%% Renewables 1.1% 0.9% 1.6% 2.0% 1.8% 1.7%
* See Annex 2 for explanation of components in total and definition of biomass.

IRELAND
363
In 2001, coal was the largest fuel source for electricity generation, accounting for 38% of the powerproduced. Natural gas was second at 37% and oil products third with 21%. Generation from both naturalgas and oil has increased rapidly in recent years. Renewable energy’s contribution to electricityproduction ranged from 4.1 to 5.6% in the 1990 to 2000 period reflecting fluctuations in hydropower.Wind power and landfill gas generation have increased considerably since 1998, but only accounted forabout 1.8% of electricity production in 2001.

Hydropower and biomass account for the largest shares in renewable energy supply in Ireland. In 2001,hydropower was 20% and biomass was 69% of total renewable energy supply. Hydropower generationcapacity was 236 MW (excluding pumped storage), gas from biomass, largely landfills, was 15 MW andwind power capacity was 135 MW. Production of solid biomass has increased from 4 416 TJ in 1990 to6 365 TJ in 2001. Solid biomass use is for process heat in the wood processing industry and residentialspace heating in open fires.
The contribution from renewables is projected to rise, under the influence of government policies andsupport measures, to about 3.4% of primary energy and 10.6% of electricity consumption by 2005 tomeet established EU and national government targets.
364
PART 2: COUNTRY PROFILES
Policy Timeline
Research and Development
Market Deployment
. Investment Tax Relief
. Alternate Energy Requirement (AER)
. Third Party Access
Energy Policy Context
. Electricity Regulation Act
. Strategy for Future
Denotes a significant change to a policy, such as an extension, repeal or revision.
Data are not available before this date
Mtoe
0
0.05
0.30
0.10
0.15
0.20
0.25
1971
1973
1975
1977
1979
1981
1983
1985
1987
1989
1991
1993
1995
1997
1999
2001
Figure 3. Total Renewable Energy Supply and Policy Timeline
Solarand Wind
Hydro
CombustibleRenewables
and Waste
Renewable Energy Supply

IRELAND
365
Capacity (MW)
0
200
20
40
60
80
100
120
140
160
180
Figure 4. Net Generating Capacity of Renewable and Waste Products
Hydro (<1 MW)
Hydro (1–10 MW)
Wind
Landfill Gas
1995
1990
1996
1997
1998
1999
2000
2001
Research and Development Trends
Ireland spent a total of US$ 94.5 million (in 2002 prices and exchange rates) on government energyRD&D between 1974 and 2002. About 32% of the total RD&D budget in this period was allocated torenewable energy RD&D. The overall trend of government RD&D expenditures for renewables peakedin the early 1980s and declined notably after 1983. There was no significant funding between 1990and 2001.
Among the various renewable technologies, biomass received the highest level of funding at US$ 13.6 million,or 46%, in the 1974 to 2002 period. Wind was funded at US$ 8.4 million, representing 28% of renewableenergy RD&D.
The Sustainable Energy Act of 2002 gave Sustainable Energy Ireland (SEI), formerly the Irish EnergyCentre, the remit to promote and assist renewable energy RD&D activities in Ireland. The governmentnoted that the historically low rate of provision for RD&D in Ireland had contributed to a relative failureto exploit the full range of sustainable energy opportunities, on both the demand and supply sides. Thenew RD&D programmes administered by SEI aim to address this failure by assisting in the expositionand development of a least-cost path to achieving CO2 emissions reduction in a more sustainableenergy economy.
The main aims of the Renewable Energy Research, Development and Demonstration Programme are tostimulate deployment of renewable energies that are close to market and to assess and develop technologieswhich have prospects for the future. Strategies for this programme were developed in 2001 and were thesubject of public consultation prior to its launch in July 2002. The strategies are to be refined in 2004.
The Programme was allotted an indicative budget of € 16.25 million up to 2006 and is expected tosupport projects in wind, biomass, solar, ocean, small hydro, ambient heat (heat pumps) and geothermalenergy. It includes provisions for hybrid or cross-sector RD&D actions and for community renewableenergy schemes.

366
Priority is given to supporting:
● Research aimed at developing policy options for enhanced deployment.
● Research to define the market structure for renewable energy technologies with high penetration potential.
● Research aimed at cost reduction, improved reliability and/or opening new markets.
● Demonstration of non-technical innovation.
● Feasibility studies for renewable energy projects.
● Demonstration aimed at high risk, high reward projects.
In addition, Ireland participates in international collaborative R&D in Wind Turbine Systems, Biomass andOcean Energy Systems through the IEA Implementing Agreements.
PART 2: COUNTRY PROFILES
Million US$ (2002 prices and exchange rates)
0
7
1
2
3
4
5
6
Figure 6. Ireland – Government Renewable Energy RD&D Budgets*
SolarPhoto-Electric
Solar Heating& Cooling
Geothermal
Biomass
Wind
1974
1976
1978
1980
1982
1984
1986
1988
1990
1992
1994
1996
1998
2000
2002
Million US$ (2002 prices and exchange rates)
0
14
2
4
6
8
10
12
Figure 5. Ireland – Government Energy RD&D Budgets*
1974
1976
1978
1980
1982
1984
1986
1988
1990
1992
1994
1996
1998
2000
2002
Total OtherTech./Research
TotalConservation
Total Power& Storage Tech.
Total NuclearFission/Fusion
Total RenewableEnergy
Total FossilFuels
* Data are not available for 1989 and 1991-2001.
* Data are not available for 1989 and 1991-2001.

IRELAND
367
Market Deployment Trends
The primary fiscal instrument used to support renewable energy technologies is the competitive tenderingapproach of the Alternative Energy Requirement Programme (AER). It is funded through a Public ServiceObligation (PSO) payment made by all electricity consumers. The current policy (2004) requirement is forfuture support mechanisms for renewables after the AER. There is a Ministerial consultation process(www.dcmnr.gov.ie) underway which will help move forward the Renewable Energy Sources-EUDirective.
AER I was launched in 1995 and aimed to secure an additional 75 MW of electricity generation capacityby 1997. A total of 22 projects were commissioned under the scheme, with a combined total installedcapacity of 70.62 MW, of which 60 MW was associated with renewable energy projects and theremainder were CHP. AER II sought to achieve an additional 30 MW from a single biomass power plant,but was unsuccessful.
The AER III target was to secure a further 100 MW of new installed capacity from renewable energysources by the end of 1999. A number of projects were delayed and some failed to secure planningpermission. By the end of 2001, AER III renewable energy projects with a combined installed capacityof 42 MW were commissioned. The AER scheme delivered an additional 102 MW by the end of 2001.A further competition, AER IV focused on CHP plants and delivered 18 MW, thus increasing the CHPdelivered by AER to 29 MW.
The Green Paper on Sustainable Energy (1999) sought inter alia to secure an additional 500 MW ofelectricity generating capacity in the period 2000-2005 by means of AER competitions, direct sales to finalcustomers and successful EU Fifth framework projects. In addition, the Green Paper called for anexploration of novel CHP uses and testing the offshore wind energy potential. These targets are supportedthrough the AER V and VI competitive tender rounds.
The AER V call for tenders for 255 MW of new renewable generating capacity was launched in May 2001and results were announced in February 2002. AER V offered 15-year power purchase agreements withthe Electricity Supply Board Public Electricity Supply (ESB PES) at the successful applicants’ bid price, with25% of the output attracting an annual inflation adjustment based on the consumer price index (CPI). ESBPES was the monopoly supplier to the portion of the market that had remained closed to competition,called the franchise market. ESB has renamed this supply group ESB Customer Supply (ESB CS). Allapplicants to this call were required to hold planning permits for proposed developments. This was a newrequirement in AER V in order to improve on the success rate of AER III. Contracts were awarded for365 MW, allowing the 255 MW target to be comfortably reached and even surpassed.
AER VI, announced in April 2003, called for a total capacity of 578 MW including the 365 MW fromAER V. Successful bidders from AER V were allowed to submit a new bid under AER VI for the sameproject. The new offer was also for a 15-year power purchase agreement with ESB CS; however the full bidprice would attract CPI, and in addition, the bidder could chose a front weighting price provision thatincreased the price by 35% for the first 7.5 years of the contract and decreased the price by 35% for theremaining 7.5 years. This was to improve investor confidence that affected a number of AER V projectsfollowing the removal of a tax incentive, which had not been designed to support renewable energyprojects specifically but was being incorporated into some AER V project financing arrangements. The AERVI results were announced in July 2003. In total, contracts for 365 MW were awarded, 152 MW of whichwere from bidders holding AER V contracts. Thus currently there are a total of 578 MW under contract fromthe two rounds: 213 MW in contracts remaining under AER V and 365 MW in contracts under AER VI.

368
In July 2003 an additional offer of 140 MW to AER VI bidders in the large wind, small-scale wind, and biomasscategories was announced. This would bring the total MW under contract in AER V and VI to 718 MW.
Energy Policy Context
Ireland launched a national programme to intensify its promotion of renewable energy in electricityproduction technologies in the mid-1990s with the publication of “Renewable Energy - A Strategy for theFuture”. Since then there have been progressive developments of policies and programmes, primarily inthe electricity market. Key steps have been the policies and targets set out in successive national andinternational documents on energy and climate change policy, legislation, and European Directives.
Ireland’s policy to promote the development of renewable energy contributes to a number of mutually-rein-forcing policy commitments including:
● Increasing the percentage of total primary energy requirement (TPER) to be derived from renewablesources from 2% in 2000 to 3.75% by 2005.
● Increasing the installed renewable energy electricity generating capacity by an additional 500 MWbetween 2000 and 2005.
● Limiting greenhouse gases emissions to a 13% increase over 1990 levels by 2008-2012.
● Reducing annual CO2 emissions by 1 million tonnes from the business as usual case throughincreased deployment of renewable energy.
● An indicative target to contribute a minimum of 13.2% of green electricity to total electricityconsumption by 2010.
● Exploring the offshore wind resource.
● Regional sustainability and environmental protection.
The introduction of a policy targeting the construction of new renewable energy-based electricity generating stations commenced in the mid-1990s. The current support measure, the Alternative EnergyRequirement Programme (AER) (1995–2003), aims to:
● Strengthen security of supply.
● Obtain supplies of energy from indigenous sources.
● Further diversify energy sources.
● Reduce environmental damage.
● Contribute to the objectives of the national CO2 abatement strategy.
● Contribute to EU targets set out in the Altener programme.
● Ensure that the added-value of these indigenous resources is maximised for the country.
A review of the effectiveness of the AER programme to deliver wind energy targets in particular was carriedout by the Renewable Energy Strategy Group in 2000. The full remit of this ministerial appointed group wasto develop an integrated strategy addressing the significant technical and non-technical barriers that facedwind power development. The focus was on wind power due to the expectation that wind farms woulddeliver the bulk of the Green Paper’s additional 500 MW target for renewable energy by 2005.
The principal conclusion of the Group was that three key elements, Electricity Market, Electricity Networkand Spatial Planning, need to be integrated into a planned approach for wind energy deployment. Thisapproach sees spatial planning considerations as crucial in determining suitable areas where wind farms
PART 2: COUNTRY PROFILES

IRELAND
369
may be accommodated. These decisions should be taken according to the availability of the resource(wind), the strength of the electricity networks, landscape and other planning considerations. Thelocations thus identified should then determine the appropriate grid infrastructure required. Within thecontext of the agreed planning framework, the market mechanisms chosen should aim to minimise thecost of achieving the target deployment of wind energy.
A number of key recommendations outlined in the Group’s report Strategy for Intensifying Wind EnergyDeployment have been incorporated into energy policy and addressed a number of key barriers:
● Obtaining planning permission became a prerequisite for entering the AER V and AER VI competition,to address the mismatch in AER III between projects with planning approval and those withguaranteed market access.
● The project and ownership cap sizes of previous rounds that restricted large-scale wind farms wereremoved from AER V and VI.
● A Grid Upgrade Programme for Renewable Energy is to facilitate wind farm grid connection wherebottlenecks exist. The programme establishes a mechanism to address the challenge that existed fordevelopers where they must raise the entire capital expenditure for any upgrade forming part of apotentially shared connection with money subsequently remitted as others connect to the facility.
● Areas deemed strategic, preferred, open for consideration and no-go have been identified by a numberof local authorities, thus providing clarity and removing a level of uncertainty associated with the spatial planning system.
The net result of these policies has been an accelerated level of wind energy activity in Ireland. Wind farmswith a combined installed capacity of more than 2 000 MW have secured planning permission. Planning isno longer a barrier to wind energy deployment in Ireland. However, the challenge of designing an appropriateand effective market support mechanism remains significant, as does integration into the electricity grid.
Current Considerations
The Commission for Energy Regulation is undertaking the formation of a new electricity market, whichwill be an energy only gross pool market with locational marginal pricing and co-optimised reserve. Aspecial group to investigate the interaction between renewable energy technologies and market ruleshas been convened to develop detailed market rules.
There are numerous technical obstacles to additional wind implementation with what is essentially anisland network. These issues range from concerns about low voltage fault ride-through and frequencycontrol to voltage and power factor control. Robust solutions for these concerns are required in order tomitigate decreased system security and reliability.
Within this context, the Commission for Energy Regulation (CER) recently placed a moratorium on furthergrid connection agreements for wind farms. The moratorium was founded on stability and reliabilityconcerns voiced by the transmission system operator, ESBNG. This moratorium was put in place for athree-month period ending on 31/3/04.1 The requirement for dynamic models that can be used in softwaresimulations at the ESBNG has become the issue of primary concern. In a parallel process, the ESBNG hasundertaken a rigorous process to formulate a new grid code for wind, which specifies technicalrequirements. These specifications, scheduled for completion in April 2004, will impact on wind turbinedevelopment and implementation.
1. Information on the moratorium can be found at www.cer.ie, www.eirgrid.com.

370
PART 2: COUNTRY PROFILES
Renewable Energy Markets
Hydropower
Small hydropower was first developed in Ireland in 1907 when two Kaplan turbines were installed atCahir Mills in County Tipperary. These early plants were used for industrial applications, especiallygrain milling and wood processing. By 1990, more than 220 MW of generation capacity, mostly large-scale, had been installed (excluding a 292 MW pumped storage facility). These installations grew onlyslightly during the 1990s, reaching 236 MW in 2001. Of the total installed capacity, 200 MW are fromhydropower facilities with capacities larger than 10 MW.
The share of electricity generated by hydropower has gone from 4.9% in 1990 to 3.6% in 2000 and 2.4%in 2001, reflecting the static level of hydropower in a growing electricity sector.
Under the six phases of the AER, ten hydro projects were constructed with an installed capacity of 4 MW. However, the price cap of hydropower has risen to € 0.7018/kWh in the most recent round(2003-2005), which is hoped to be high enough to spur new development. It is estimated that there isabout 70 MW of additional “practicable” hydropower resource.
993
199
1994
1995
1996
1997
1998
1999
2000
2001
2002
200399
119
919
9992
199990
1993
1994
1995
1996
1997
1998
1999
2000
2001
0.5%
1%
1.5%
2%
2.5%
Capacity (MW) Gross Electricity Production (GWh)
0%
Hydropower Policy Timeline
Research and Development
Market Deployment
. Alternative Energy Requirements (AER)
. Investment Tax Relief
. Irish National Development Plan
Denotes a significant change to a policy, such as an extension, repeal or revision.
1991
1992
215
220
225
230
235
240
19901991
19921993
19941995
19961997
19981999
20002001
Capacity
0
100
200
300
400
500
600
700
800
900
1000Production
Figure 7. Hydropower Capacityand Electricity Production
Figure 8. Hydropower Capacity(Year to Year Change)

IRELAND
371
Biogas Electricity Production
993
199
1994
1995
1996
1997
1998
1999
2000
2001
2002
200399
119
919
9992
199990
1993
1994
1995
1996
1997
1998
1999
2000
2001
5%
10%
15%
20%
25%
30%
Capacity (MW) Gross Electricity Production (GWh)
0%
Biogas Electricity Policy Timeline
Research and Development
Market Deployment
. Alternative Energy Requirements (AER)
. Investment Tax Relief
. Irish National Development Plan
Denotes a significant change to a policy, such as an extension, repeal or revision.
1991
1992
0
2
4
6
8
10
12
14
16
19901991
19921993
19941995
19961997
19981999
20002001
Capacity
0
20
40
60
80
100
120Production
Figure 9. Biogas Capacityand Electricity Production
Figure 10. Biogas Capacity(Year to Year Change)
The main bioenergy development for electricity generation has been the exploitation of landfill gas. Since1996 and through the AER programme (AER I-III), 15 MW of landfill gas fuelled capacity has beeninstalled. An additional 5.5 MW is expected to be added as a result of the AER VI round.
There has been very limited development of electricity from anaerobic digestion systems in Ireland with atotal installed capacity of about 6 MW. It is hoped that development can be stimulated given the benefits inboth renewable energy and environmental terms (avoided methane emissions). To this end AER VI, includeda specific category of Biomass Anaerobic Digestion and set a relatively high price cap of € 0.07/kWh.
While there is currently no electricity generation from solid biomass, the AER VI round also included abiomass category, which sought the development of CHP from biomass such as forest industry residuesand dry agricultural residues (e.g., straw). The price cap was set at € 0.07/kWh and the capacity to besupported is 28 MW. It is expected that almost 27 MW of this allocation will be developed.
Solid biomass for energy in Ireland to date has been limited to the production of useful heat. This hasbeen almost exclusively in the wood processing industry, although with some domestic heating. In2001, the most recent year for which data is available, almost 6.4 PJ of solid biomass was used toprovide useful heat.

372
PART 2: COUNTRY PROFILES
Wind Power
993
199
1994
1995
1996
1997
1998
1999
2000
2001
2002
200399
119
919
9992
199990
1993
1994
1995
1996
1997
1998
1999
2000
2001
100%
200%
300%
400%
500%
600%
700%
800%
900%
Capacity (MW) Gross Electricity Production (GWh)
0%
Wind Power Policy Timeline
Research and Development
Market Deployment
. Alternative Energy Requirements (AER)
. Investment Tax Relief
. Irish National Development Plan
Denotes a significant change to a policy, such as an extension, repeal or revision.
1991
1992
0
20
40
60
80
100
120
140
160
19901991
19921993
19941995
19961997
19981999
20002001
Capacity
0
50
100
150
200
250
300
350
400Production
Figure 11. Wind Power Capacityand Electricity Production
Figure 12. Wind Power Capacity(Year to Year Change)
Ireland benefits from having one of the most favourable wind regimes in Europe for electricity generation.Several successful pilot-scale projects and a limited national demonstration programme in the 1980s gavepromising results but were not followed by large-scale developments. From the late 1980s an obligationwas placed upon the then state monopoly electricity company, ESB, to purchase renewable electricity,which effectively amounted to a feed-in tariff.
AER contracts have been the primary source of funding power purchase agreements in the Irish context(detailed in the Energy Policy Context section). AER I in 1994 had an initial aim of securing contracts forwind generation capacity totalling 30 MW. Due to demand, this was increased and wind projectsrepresenting 46 MW of capacity were built. AER III in 1999 authorised contracts totalling 90 MW for windpower projects but only 38 MW were developed. AER I-III delivered 84 MW of wind capacity. In addition,wind farms totalling 23 MW have been constructed with European Union third, fourth and fifthFramework support and guaranteed market access provided by the Irish Government. A number of windfarms have also been commissioned, totalling 59 MW, the electricity from which is sold to a greenelectricity supplier, who sells it to final customers under the liberalised electricity market structure.
Under AER V, projects totalling 353 MW of generating capacity from wind power were awarded contractsand 84 MW have been built or are under construction. A total of 191 MW of grid-connected wind powercapacity had been installed at the end of 2003.

IRELAND
373
Contracts for wind generation capacity totalling 334 MW were awarded in the AER VI tender round in2003. This tender round was the first to include a category for offshore wind power for which two projectsof 25 MW each were approved for award of contracts.
The estimated contribution from wind power to national electricity demand in 2003 was 465 GWh. Thisrepresents a 20% increase from 2002 production levels and accounted for 1.8% of electricity demand in2003.
Recent Trends in Deployment
Grid connection agreements committed to by wind farm developers, if acted upon, will result in 326 MWof wind generation capacity being connected in 2004. As connection agreements include financialpenalties for non-performance, it is expected that a majority will be developed. Onshore wind farmstotalling 75 MW in capacity are currently under construction. The largest wind farm in Ireland, the 60 MWDerrybrien project, is among these. This project received a setback late in 2003 when a significant peat-slide occurred on the site, infiltrating a local water course and giving rise to serious local disquiet. As asignificant number of wind projects in Ireland are being developed on upland blanket bog sites, thisincident may have repercussions for future permitting of wind farms within the planning system.
Construction of phase 1 the Arklow Bank 25 MW wind farm was completed in 2003 and in April 2004was in the final stages of commissioning. This is the first such development in Ireland and it is also the firstoffshore deployment of a 3.6 MW wind turbine. The ultimate capacity for this wind farm under the termsof its lease is 520 MW. The 60 MW phase 2 has a scheduled grid connection date of 2005. Two otheroffshore wind farms, the Kish Bank and the Bray Bank, both being developed on the east coast, each wonprice support contracts at an indicative price of € 0.08/kWh for 25 MW capacity apiece under the AER VIcompetitive tendering round in July 2003. These will have to be commissioned by 2006 in order to availthemselves of the AER VI power purchase agreement.
Transmission Distribution Total Cumulative Total(MW) (MW) (MW) (MW)
Connected 39 127 166 166Signed Agreements 305 228 534 700Live Offers 32 43 75 775Applications in process 144 279 422 1 197Applications being checked 83 15 98 1 295
Source: ESBNG
Table 2. Wind Connections in the Republic of Ireland, November 2003

374
PART 2: COUNTRY PROFILES
Ireland Policy Chronology
Business Expansion Scheme Tax Relief
Year 1984-2006
Policy Description The Business Expansion Scheme (BES) was introduced in 1984 as an incentiveto private investors to invest long-term equity capital in companies (particularlynew and smaller ones) operating in certain sectors of the economy that wouldotherwise find it difficult to raise such funding and would instead have to relyon loan finance. The scheme was initially set to operate for three years and hasbeen renewed on a regular basis since then. Investments in renewable energycompanies qualify for BES relief. Individual investors holding a BES equityinvestment for a minimum period of five years can benefit from tax relief, attheir marginal tax rate, in respect of investments up to € 31 750 per year. Theaggregate amount that a company can raise under the BES was increased underthe Finance Act 2004 from € 750 000 to € 1 000 000.
Policy Type Investment tax credits
RE Technology All renewables
Alternative Energy Requirement (AER) Programme
Year 1995-2003; 2003-2005
Policy Description Six Alternative Energy Requirement (AER) competitions were held between 1995and 2003. Under the AER scheme, winning bidders are entitled to a 15-yearpower purchase agreement whereby the ESB buys the electricity output of thewinning facility at the bid price. The additional cost of electricity procuredunder the AER schemes is spread across all electricity consumers. The pricespaid by the ESB are increased annually in line with the Consumer Price Index.For each competition a quota is set for the amount of electricity to be sourcedfrom each technology, e.g., wind, hydro, biomass/waste.
In AER I, the unit price was fixed and applicants were entitled to bid for capitalgrants. In subsequent competitions, a price cap for each renewable technologywas set instead of a fixed price.
Winning bidders in AER III were also entitled to apply for a capital grant underthe ERDF Economic Infrastructure Operational Programme 1994-1999.
Under AER V, the securing of planning permission as a precondition for enteringthe competition was introduced.
Under AER VI (2003-2005), front weighting of the bid price was provided for,allowing a price increase of 35% for the first 7.5 years of the contract followedby an associated decrease of 35% for the remaining 7.5 years. AER VI aims toensure that the 500 MW target for renewables based electricity-generatingcapacity is reached by 2005. (www.dcmnr.gov.ie/energy)

IRELAND
375
Policy Type Bidding system
RE Technology All renewables
Third-Party Access
Year 1996-Present
Policy Description A decision was made by the Irish Government in 1996 to make third-partyaccess for new renewable energy projects legally possible (i.e., electricity canbe sold at a premium price to a customer other than the national grid).
Policy Type Regulatory and administrative rules
RE Technology All renewables
Tax Relief
Year 1998-2002 (extended to 2006)
Policy Description The tax relief scheme, part of Finance Act 1998, came into effect in 1999. Corporateequity investments in certain renewable energy projects, namely hydro, solar, windpower and biomass, are eligible for tax relief in the form of a deduction from acompany's profits for an investment in new ordinary shares in a qualifying company.The relief is capped at 50% of all capital expenditure (excluding land), net of grants,on a single project up to I£ 7.5 million. Investment by a company or group ofcompanies in more than one qualifying energy project is capped at I£10 million peryear. The Department of Public Enterprise certifies qualifying renewable energyprojects and thereafter the Revenue Commissioners administer the tax relief.
With the reduction in corporation tax over the last number of years, the benefitsassociated with this scheme have diminished.
The tax relief scheme was extended in 2002 until December 2004.
Policy Type Investment tax credits
RE Technology HydroOffshore windOnshore windSolar photovoltaicBiomass
Electricity Regulation Act 1999
Year 1999 - Present
Policy Description The Electricity Regulation Act benefits renewable energy in the following ways:
• Full deregulation of the electricity market for renewable electricity inadvance of full liberalisation of the overall electricity market.

376
PART 2: COUNTRY PROFILES
• Priority dispatch given to electricity generated from renewables.
• The establishment of the Commission for Energy Regulation (CER) with aremit to encourage R&D in renewables.
In the liberalisation of the electricity market in Ireland, special considerationwas given to renewable electricity suppliers in granting them access to allconsumers in advance of full market opening. Renewable electricity generatorsand suppliers are also advantaged in that they only have to balance aggregatedannual renewable electricity supply and demand to qualify as a “green”electricity supplier, rather than that for each half hour metering and tradingperiod. One renewable electricity supplier has been successful in developing arenewable electricity market and is also involved with the development andoperation of wind farms. However, few other wind farm owners have opted tosell generated electricity within the deregulated electricity market, as theguaranteed term of the government price support scheme is the best vehicle forattracting financing. Also, the base level price, or “spill price,” which non-dispatchable electricity generators can command when selling their electricitywithin the electricity market without a supply contract is currently consideredtoo low to be viable. The independent electricity supply market is in theearly stages of development with few relationships formed between renewableelectricity generators and independent suppliers.
Policy Type Regulatory and administrative rules
RE Technology All renewables
Irish National Development Plan Elements
Year 1999
Policy Description The National Development Plan allocated a total investment of € 67 million forrenewable energy sources from 2000 to 2006. The main items supported by thisfund are:
• Reinforcement and upgrade of grid to support increased use of renewables.
• Support the delivery of additional renewable energy supplies.
• Encourage new participants in renewable energy market by supportingsmall-scale projects.
Policy Type Regulatory and administrative rules
RE Technology All renewables
Green Paper on Sustainable Energy
Year 1999 - Present
Policy Description A Green Paper on Sustainable Energy published by the Department of PublicEnterprise proposed the introduction of a carbon or energy tax scheme alongwith a tradable permit system to provide an incentive for industry to reduce

IRELAND
377
emissions. One possibility discussed in the paper is to use revenue generatedfrom a carbon tax or permit scheme to fund grants for energy audits andinvestments in energy equipment.
The Green Paper set some targets for renewable energy sources in Ireland,which include:
• Increasing the percentage of total primary energy requirement (TPER) to bederived from renewable energy sources to 3.75% by 2005 from 2% in 2000.
• Increasing the percentage of electricity generated from renewable sourcesfrom 6.3% in 2000 to 12.39% by 2005. This includes installing an extra500 MW of renewable electricity capacity by 2005.
Policy Type Obligations
RE Technology All renewables
Promotion of European Programmes
Year On-going
Policy Description Sustainable Energy Ireland (SEI) is the statutory authority responsible for thepromotion of the Sustainable Energy Systems element of the European sixthframework programme (FP6) in Ireland.
SEI has made various efforts to create awareness of the FP6, and to encouragehigh quality Irish participation, including:
• Information dissemination on recent developments/new calls for proposals.
• Hosting a number of national information days for new calls for proposals.
• Initiating a competitive feasibility study process to enable the Irish energyresearch community to prepare high quality proposals.
• Targeted e-mails to specific technology groups, containing information onparticular conferences, publications, etc.
• National contact point service – provides continuing support to allprospective proposers in terms of advice and help in preparing proposals,via telephone, e-mail and face-to-face meetings.
• Networking/partner search – facilitates partner search by advisingprospective proposers of potential partners and by attending variousbrokerage sessions organised by the Commission.
• National delegate role – representation at the Energy ProgrammeCommittee meeting;
SEI is also responsible for the promotion of the recently launched energyframework programme, Intelligent Energy for Europe (EIE).
Policy Type Public awareness
RE Technology All renewables
378
PART 2: COUNTRY PROFILES
Strategy for Intensifying Wind EnergyDevelopment Report
Year 2000 - Present
Policy Description In July 2000, the Renewable Energy Strategy Group published a report "Strategyfor Intensifying Wind Energy Deployment" examining the aspects of, andconstraints to, further development of wind energy in Ireland. The strategyrecommended is designed to meet the targets set for the deployment of renewableenergy at least cost, and focuses on three key elements: electricity markets,electricity networks and spatial planning. The aim is to secure an additional500 MW of renewable-energy-based electricity-generating capacity by 2005.
Policy Type Regulatory and administrative rules
RE Technology Offshore windOnshore wind
House of Tomorrow Programme
Year 2001-2006
Policy Description The House of Tomorrow Programme offers support for research, developmentand demonstration projects aimed at generating and applying technologies,products, systems, practices and information leading to more use of sustainableenergy in Irish housing. The main focus of the programme, which has aproposed five-year budget of € 21.1 million, is on stimulating widespreaduptake of superior energy planning, design, specification and constructionpractices in both the new-home-building and home-improvement markets.
Policy Type RD&D
RE Technology All renewables
Sustainable Energy Ireland
Year 2002 - Present
Policy Description The Sustainable Energy Act established a new government body: SustainableEnergy Ireland (SEI) (formerly the Irish Energy Centre). SEI’s functions are to:
• Promote and assist environmentally and economically sustainableproduction, supply and use of energy.
• Promote and assist energy efficiency and renewable sources of energy.
• Promote and assist the reduction of greenhouse gas emissions andtransboundary air pollutants associated with the production, supply and useof energy.
• Promote and assist the minimising of the impact on the environment of theproduction, supply and use of energy.

IRELAND
379
• Promote and assist research, development and demonstration of newenergy technologies.
• Provide advice, information and guidance to government officials and toenergy suppliers and users.
Policy Type Public awareness
RE Technology All renewables
Renewable Energy Research,Development & Demonstration
Year 2002 - Present
Policy Description Under the National Development Plan, € 16.25 million has been madeavailable for an RD&D programme for renewable sources of energy and relatedtopics.
The main aim of this programme is to stimulate the deployment of renewablesthat are close to the market and to assess and develop technologies that havesignificant prospects for the future.
Partial funding is available for two types of projects:
• Projects demonstrating particular renewable energy technologies orapplications which, although at or near commercial viability and havingpotential for replication, currently face market barriers due to lack ofexpertise, knowledge or market confidence.
• Research and development into innovative technologies, systems ormarketing approaches which support the commercial exploitation ofrenewables, including applied research and development, technologytransfer and adaptation and market research/feasibility studies.
Full funding is available for the following two types of project:
• Public good research studies and investigations that contribute to thedevelopment and delivery of strategies, policies, standards and practicesencouraging the deployment of renewable energy (mainly commissionedby separate Invitations for Tender).
• Commissioned public good research activities directed at increasing thevalue and impact of the programme results, which will ultimately be usedto inform policy (commissioned by separate Invitations for Tender).
Policy Type RD&D
RE Technology All renewables