
Renewable Energy in Alaska - nrel.gov · Cover Photos: (left to right) PIX 16416, PIX 17423, PIX...
56
NREL is a national laboratory of the U.S. Department of Energy, Office of Energy Efficiency & Renewable Energy, operated by the Alliance for Sustainable Energy, LLC. Contract No. DE-AC36-08GO28308 Renewable Energy in Alaska WH Pacific, Inc. Anchorage, Alaska NREL Technical Monitor: Brian Hirsch Subcontract Report NREL/SR-7A40-47176 March 2013
Transcript of Renewable Energy in Alaska - nrel.gov · Cover Photos: (left to right) PIX 16416, PIX 17423, PIX...

NREL is a national laboratory of the U.S. Department of Energy, Office of Energy Efficiency & Renewable Energy, operated by the Alliance for Sustainable Energy, LLC.
Contract No. DE-AC36-08GO28308
Renewable Energy in Alaska WH Pacific, Inc. Anchorage, Alaska
NREL Technical Monitor: Brian Hirsch
Subcontract Report NREL/SR-7A40-47176 March 2013

NREL is a national laboratory of the U.S. Department of Energy, Office of Energy Efficiency & Renewable Energy, operated by the Alliance for Sustainable Energy, LLC.
National Renewable Energy Laboratory 15013 Denver West Parkway Golden, Colorado 80401 303-275-3000 • www.nrel.gov
Contract No. DE-AC36-08GO28308
Renewable Energy in Alaska WH Pacific, Inc. Anchorage, Alaska
NREL Technical Monitor: Brian Hirsch Prepared under Subcontract No. AEU-9-99278-01
Subcontract Report NREL/SR-7A40-47176 March 2013
This publication was reproduced from the best available copy submitted by the subcontractor and received minimal editorial review at NREL.
NOTICE
This report was prepared as an account of work sponsored by an agency of the United States government. Neither the United States government nor any agency thereof, nor any of their employees, makes any warranty, express or implied, or assumes any legal liability or responsibility for the accuracy, completeness, or usefulness of any information, apparatus, product, or process disclosed, or represents that its use would not infringe privately owned rights. Reference herein to any specific commercial product, process, or service by trade name, trademark, manufacturer, or otherwise does not necessarily constitute or imply its endorsement, recommendation, or favoring by the United States government or any agency thereof. The views and opinions of authors expressed herein do not necessarily state or reflect those of the United States government or any agency thereof.
Available electronically at http://www.osti.gov/bridge
Available for a processing fee to U.S. Department of Energy and its contractors, in paper, from:
U.S. Department of Energy Office of Scientific and Technical Information P.O. Box 62 Oak Ridge, TN 37831-0062 phone: 865.576.8401 fax: 865.576.5728 email: mailto:[email protected]
Available for sale to the public, in paper, from:
U.S. Department of Commerce National Technical Information Service 5285 Port Royal Road Springfield, VA 22161 phone: 800.553.6847 fax: 703.605.6900 email: [email protected] online ordering: http://www.ntis.gov/help/ordermethods.aspx
Cover Photos: (left to right) PIX 16416, PIX 17423, PIX 16560, PIX 17613, PIX 17436, PIX 17721
Printed on paper containing at least 50% wastepaper, including 10% post consumer waste.

Table of Contents
Sections Page #
1.0 Executive Summary – Opportunities for Renewable Energy Resources in Alaska 1
2.0 Introduction……………………………………………………………………………………………………………………….. 3
3.0 Alaska Energy Market Overview………………………………………………………………………………………….. 5
4.0 Fossil Fuel Energy Price Projections……………………………………………………………………………………... 24
5.0 Energy Efficiency Opportunities………………………………………………………………………………………….. 29
6.0 Renewable Energy Opportunities………………………………………………………………………………………… 32
7.0 Stranded RE Resource Opportunities………………………………………………………………………………….. 39
8.0 Market Evolution and Transformation…………………………………………………………………………………. 47
References ……………………………………………………………………………………………………………………….. 51
Figures Page #
Figure 1: Alaska’s Energy Future: Incremental Efficiency and Renewable Energy…………………………. 6
Figure 2: Economics of Renewable Energy Projects in Alaska (MAFA Analysis, 2009) ………………………….. 8
Figure 3: Alaska Total Energy Consumption by Source………………………………………………………………. 13
Figure 4: Alaska Residential Energy Consumption by Source……………………………………………………… 14
Figure 5: Median Household End-Use Energy Consumption.……………………………………………………… 15
Figure 6: Residential Electric Consumption per capita, by region……………………………………………….. 16
Figure 7: Alaska Commercial Energy Consumption by Source……………………………………………………. 17
Figure 8: Alaska Industrial Energy Consumption by Source………………………………………………………… 18
Figure 9: Alaska Transportation Energy Consumption by Source………………………………………………… 19
Figure 10: Alaska Electric Energy Consumption by Source…………………………………………………………. 20
Figure 11: Natural Gas Price Projection – CONUS (2009$ / mmbtu)………………………………………… 24
Figure 12: CONUS Crude Oil Import Price (2009$ / bbl)………………………………………………………… 25

Figure 13: CONUS Emissions Cost Projections (2009$ / tonne)………………………………………………… 25
Figure 14: Natural Gas Wellhead Price = State: U.S. Ratios………………………………………………………. 26
Figure 15: Natural Gas Residential Price = State: U.S. Ratio…………………………………………………….. 27
Figure 16: Alaska to U.S. Price Ratios – No. 2 Distillate (a.k.a. diesel fuel oil)……………………………… 28
Figure 17: Alaska System Peak Demand Forecasts by Scenario……………………………………………………. 30
Figure 18: Projected Railbelt Electrical Energy Requirements (GWh)………………………………………….. 31
Figure 19: Supply Curve for Rural Alaska Wind Energy – estimated bus-bar energy costs………………. 33
Figure 20: Yukon River Region Hydroelectric Supply Curve……………………………………………………………… 35
Figure 21: Southwest Alaska Hydro Supply Curve…………………………………………………………………………… 35
Figure 22: Southeast Alaska Hydro Supply Curve…………………………………………………………………………….. 36
Figure 23: Southcentral Alaska Hydro Supply Curve………………………………………………………………………… 36
Figure 24: Alaska Biomass Supply Curve…………………………………………………………………………………………. 37
Figure 25: Supply Curve for Geothermal Energy in Alaska – Energy Costs including Connection to Local Alaska Markets…………………………………………………………………………………………………………………………
38
Figure 26: Alaska Hydropower Resources – Availability of Resource for Development…………………. 42
Figure 27: Probability of Development of Alaska Hydro Resources…………………………………………….. 43
Figure 28: EIA AEO 09: Sales of Unconventional Light-Duty Vehicles by Fuel Type, 2030…………. 45

1
1. Executive Summary − Opportunities for Renewable Energy Resources in Alaska
Alaska’s abundant renewable energy (RE) resources can be leveraged into an export opportunity by building upon the foundation of experienced human institutions and vast natural resources, creating a unique opportunity for RE technology deployment and development and new enterprise creation.
Alaska has a complex layer of human institutions, including indigenous cultures and tribal communities, non-profit non-governmental organizations, sophisticated regional native corporations, and other private sector enterprises operating within the context of local, regional, state, and federal government agencies.
Not unlike much of the developing world, many of Alaska’s rural communities lack running water and sewer systems, and have only replaced kerosene lamps with electric lights made practical by diesel-fired generators over the last forty years.
As a resource-rich state, Alaska continues to enjoy a vigorous democratic debate over the balance between pursuing development opportunities and protecting local cultures and unique environments.
Alaska has been a leader in successfully balancing resource preservation and development, and preserving a portion of the state’s resource base while developing targeted high-yield opportunities. This approach has enabled the distribution of resource income to Alaska residents, while investing in future sustainability through pursuit of RE projects. Alaska’s resource wealth has also attracted a vibrant oil and gas industry; the resulting technology deployments are implemented locally and the resources exported throughout the world.
Alaska’s RE resources exist in a complex natural and socio-economic environment. Alaska’s RE resources must be accessed within vast challenging environments with severe seasonal transportation obstacles associated with limited road access. Alaska has a long tradition of supporting its remote rural areas with lifeline support for essential services, including telecommunications, fuel, and electricity. Alaska is managing the transition toward reduced support as circumstances allow. Many of Alaska’s RE resources can be developed by the indigenous villages and communities to reduce their dependence on fossil fuels and fossil fuel subsidies, and help sustain Alaska Native communities.
Alaska is uniquely endowed with a full range of RE opportunities, including extensive and diverse biomass; hydropower that ranges from run-of–river and low-impact high-head to traditional massive dams; wind energy that ranges from micro, wind-hybrid turbines in small
So, we have a choice to make.
We can remain one of the
world’s leading importers of
foreign oil, or we can make
investments that would allow us
to become the world’s leading
exporter of renewable energy.
We can let the jobs of tomorrow
be created abroad, or we can
create those jobs right here in
America and lay the foundation
for lasting prosperity.
–President Obama, March 19, 2009

2
coastal villages to large wind farms; world class tides; and huge geothermal potential on the northern edge of the Pacific rim of fire.
Finally, Alaska’s strategic location, well positioned between Europe, Asia and North America, has enabled the Anchorage airport to become the busiest airfreight hub in the United States, and provides RE and commodity export industries with a strategic advantage.
For all of these reasons, Alaska presents a unique opportunity to develop practical, exportable RE solutions for a wide range of circumstances that have been tested by a challenging physical environment under a complex institutional backdrop. Alaska presents a unique, competitive advantage and opportunity to build and staff a RE development and commercialization cluster to support developing regions of the 21st century.

3
2. Introduction
2.1 Scope
Under the leadership of Brian Hirsch with the Alaska office of the National Renewable Energy Laboratory, (NREL), WHPacific, and Mark Foster and Associates (MAFA) was retained to conduct an analysis of the potential for energy efficiency and renewable energy (EE/RE) development opportunities in Alaska. The information found herein is derived under sub-contract agreement #AEU-9-99278-01 from the Alliance for Sustainable Energy, LLC Management and Operations contractor for NREL. The team was lead by Brian Hirsch, PhD., Alaskan office of NREL.
This report examines the opportunities, challenges, and costs associated with EE/RE implementation in Alaska and provides strategies that position Alaska’s accumulating knowledge in EE/RE development for export to the rapidly growing energy/electric markets of the developing world.
Modeling estimates EE/RE opportunities across Alaska’s many regions including: the Railbelt (Fairbanks-MatSu-Anchorage-Kenai-Homer-Seward), Southeast, Southwest, Western, Northwest, North Slope, and the remote rural Interior.
Increasing the market adoption of EE will require improved customer education, EE program promotion to improve EE technology diffusion, and changes in pricing policies so prices more closely reflect the full cost. Many fossil fuel energy sources remain significantly under-priced relative to their future cost, especially at peak. This “false security” pricing of energy presents particular concerns for natural gas supply in the Cook Inlet where peak winter demand has begun to challenge the local peak supply.
Increasing the market adoption of RE will require: 1) expansion of the transmission infrastructure; 2) expansion of technical and market opportunities for converting remote stranded RE resources into fuels that can be used locally and exported to larger markets; and 3) clarification of schedule and scope to reduce the uncertainty associated with renewable resource permitting.
This report presents the results of an analysis of three energy price scenarios to test the sensitivity of the market to both short term and long term trends in fossil fuel energy prices. The report is not intended to offer a risk adjusted forecast of future energy prices, but rather to provide an illustration of the economic attractiveness of EE/RE in relation to future energy price expectations.
2.2 Contributors
Report contributors include: Mark A. Foster, Brian Yanity, Barry Holt, and Jay Hermanson. Brian Hirsch provided guidance and programmatic perspective on the scope of work.
Key references include: EIA AEO 2009 and EIA AEO Technical Documentation, IEA World Energy Outlook 2008; EIA, EPA, and CRA estimates of future C02 emissions costs (May-August, 2009); AEA EE/RE reports and databases, UAA ISER Energy Reports, Energy Alaska by Neil Davis, ANGDA Natural Gas Development Reports, Lake and Peninsula Borough Energy Plan (2008).

4
2.3 Assumptions and Method
To establish a technical and economic foundation for the report, Mark A. Foster and Associates (MAFA) analyzed the economic potential for energy efficiency and RE opportunities across Alaska and developed cost supply curves for the energy efficiency and RE opportunities. Similar projections for conventional generation technologies were developed based on MAFA data and experience with fossil fuel energy sources and power plant design, construction, and operational performance.
The boundaries between market adoption of energy efficiency, RE and fossil fuel energy sources were identified and analyzed in order to estimate the future market potential for energy efficiency and renewables. The data analysis and market model runs for this report were concluded in August 2009. The data and information in this report are based on publicly market reconnaissance data available through August 2009.
The Energy Information Administration Annual Energy Outlook 2009, reference high and low and the International Energy Agency World Energy Outlook 2008 reference case were used as baselines for future energy prices. These baselines were then adjusted to take into account differences between national/international markets and Alaska markets consistent with the methodology that has been used by the Alaska Energy Authority.1
Carbon emissions cost projections from Charles River Associates, EPA and EIA analysis of HR 2454 were added to the fossil fuel cost estimates to establish a range of fossil fuel energy costs.
At the time this report was written (August 2009), the Renewable Energy Fund projects were in their beginning stages and the AHFC weatherization/energy grants program was entering its second year with thousands of households poised to receive their first energy audit for baseline energy consumption. In addition, the AEA had initiated a study of natural gas supply issues, electrical generation and transmission system resource options for the Railbelt region. This study identified electrical generation scenarios designed to reach 50% renewable penetration by 2020 and natural gas supply options to meet a large assumed increase in gas market demand.
1 See for example, Colt, Crimp. Foster “Renewable Energy Opportunities in Alaska” (2008).

5
3. Alaska Energy Market Overview 3.1. The Alaska Market Overview Alaska sits at the apex of the Pacific Rim and remains actively involved in developing international trade opportunities. The International Airport in Anchorage has been the busiest airport in the United States by total landed weight for at least a decade. Alaskan foreign trade ranks 4th among states on a per capita basis. Alaska ranks 8th among states when measuring foreign exports as a percentage of gross state product.2 Alaska hosts a large number of private, and public-private partnerships, and public organizations dedicated to supporting international trade.3 Building upon these foundations, an effort to develop renewable technologies and implementation expertise in challenging developing world conditions presents a unique opportunity for those interested in promoting the development and export of clean technology expertise around the Pacific Rim.
Because of the relatively small size of energy markets in Alaska, Alaskan enterprises have frequently developed energy technology in and for Alaska, and then exported the technology and business models to other markets. Examples include the development and export of 4-D seismic, directional drilling and long-reach heavy-capacity drilling rigs in the oil and gas sector, as well as Alaska Power Company’s exportation of its hydropower project development expertise to small-scale (<50 MW) high-head (>300 m) low-impact Clean Development Mechanism projects in Central America (Guatemala, El Salvador). In short, Alaskan enterprises, ranging from large multi-national oil and gas industries to locally grown power companies, have found Alaska to be an excellent proving ground for technology and project development teams, and have successfully exported their expertise. When considering Alaska’s EE and RE opportunities, is useful to note that the addressable market has proven to be international, not just domestic in scope.
As a leading petroleum producing state, Alaska’s total energy use is dominated by oil and gas production and export related activities. This sector also presents a large EE opportunity with spillover effects down market in adjacent industrial and commercial sectors.4
Alaska’s wealth of renewable resources, including large undeveloped hydropower, biomass, geothermal, tidal, and wind opportunities presents development opportunities to serve export industries (oil and gas, mining, Internet Pacific network hub, fertilizer), local industrial, commercial, and residential markets.
2 It is important to note that the vast majority of Alaska’s crude oil is dedicated to domestic, not international markets, and domestic trade is not counted in the rankings cited. 3 Organizations supporting the development of international trade include World Trade Center Alaska, Alaska Industrial Development and Export Authority, and the Alaska Office of Economic Development. 4 A prominent example of the down-market spillover effect from the oil and gas industry in Alaska is the development of local Internet enterprises in the 1990s. A number of entrepreneurial efforts, originating with information and communications technology employees and subcontractors serving the oil and gas sector in Alaska, blossomed into successful enterprises, including Internet Alaska, a pioneering Internet access company that led efforts to deploy Internet services around the state.

6
Figure 1: Alaska’s Energy Future: Incremental Efficiency and Renewable Energy
3.2. Findings – Energy Efficiency and RE Opportunities in Alaska
Figure 1 represents the estimated incremental contribution of end-use efficiency and RE development associated with investment by public and private enterprises beyond historic market adoption trends. Contributions have been relatively modest, with the notable exception of the reconfiguration of the Trans-Alaska Pipeline System (TAPS) to more efficiently accommodate lower throughput.
Industrial export sectors in Alaska (including oil and gas and mining) have an estimated 40,000 billion Btu of additional potential efficiency gains through 2030, or roughly a 10% energy efficiency gain over the next 20 years. These gains are anticipated based on a renewed emphasis on addressing aging infrastructure systems, as well as capacity reconfigurations and expansions associated with new developments. The sheer size of the industrial export sector is illustrated by noting that a 10% efficiency improvement in this sector amounts to roughly half of the incremental total energy efficiency/RE opportunity in Alaska (see Figure 1 above).
End-use efficiency improvements in building heat and electrical use include the recently expanded Alaska Housing Finance Corporation (AHFC) weatherization and energy grant programs, along with emerging electric sector initiatives (e.g., Alaska Energy Authority/AEO, Golden Valley Electric, Chugach Electric, and Anchorage Municipal Light & Power). Benefits start to accrue in 2010, with a 20% efficiency improvement anticipated over the next 20 years.
Combined heat and power (CHP) and distributed generation (DG) include utility gas-fired cogeneration in commercial/institutional sectors (e.g., University of Alaska Anchorage/Providence Hospital district in Anchorage, large office buildings and schools across the state). With rising fossil fuel prices (including natural gas and diesel), CHP/DG opportunities appear increasingly competitive over the next ten years.
In the event of the development of Alaska North Slope natural gas, this gas appears likely to displace coal-fired electricity in the Interior (Aurora, UAF, Ft. Wainwright, Eielson AFB).

7
Run-of-river, low impact, and lake-tap hydropower and wind power are expected to continue to grow throughout the state; as diesel and natural gas energy prices increase, carbon emissions costs become internalized, and environmental permitting processes for renewables become more streamlined.
Geothermal energy from Mt. Spurr and along the Aleutians could provide a competitive energy alternative as fossil fuel prices increase, assuming that it can be found in and around existing demand centers. This energy source is expected to make a noticeable contribution by 2020.
Biomass appears to be a competitive heating option in locations with a sustainable fuel supply. Biomass for CHP appears competitive in communities that currently rely on diesel fuel.
Tidal energy resources remain an intriguing possibility given Alaska’s world-class tides. Our analysis assumed the development of small-scale demonstration projects showing the technology development and export potential.
The analysis does not include any longer term potential market opportunities associated with developing Alaska’s large renewable resources for export markets (e.g., large hydropower for energy intensive export industries, or for the development of “stranded” renewables like wind and geothermal along the Aleutians that could be used to produce renewable fuels such as hydrogen or ammonia for export).5
5 An overview of those opportunities is presented in Section 6 of this report.

8
3.3. EE/RE Opportunities in Alaska – Regional Overview Within Alaska, there are several distinct regions where energy challenges reflect the underlying geography, climate, geotechnical, transportation and logistical characteristics of each area. The following map attempts to capture the regional diversity of RE projects. The map reflects the estimated cost of energy from a panel of RE projects, including wind, hydro, geothermal, and biomass; projects are scaled by size and color coded by the relative cost of energy.
Figure 2: Economics of RE Projects in Alaska (MAFA Analysis, 2009)
3.3.1. North Slope
Alaska’s North Slope faces severe arctic climate conditions and remote logistical challenges. The area includes major oil and gas industrial development complexes at Prudhoe Bay, Kuparak, and out into the National Petroleum Reserve in the West. Barrow, the area’s regional hub, sits on top of a very slowly declining natural gas field which some speculate may reflect the presence of methane hydrates. The most prominent renewable opportunity in this area appears to be wind energy; this resource could be used to supplement local diesel and gas fired electrical generation, while providing high-value heat using dump- load energy.
3.3.2. Northwest
Facing extreme climate conditions and remote logistical challenges, Alaska’s Northwestern Region, anchored by Nome and Kotzebue, currently relies heavily on diesel fuel oil imported by ocean barge. The coastal and upland communities near hills have started to develop wind resources. Additional

9
wind development would likely reduce local dependence on increasingly expensive fossil fuels. A few hydropower opportunities have been identified that would easily surpass local needs; however, local support of these opportunities remains questionable due to the risk of disturbing rivers that provide vital fish and game habitat to support local subsistence needs. Hydropower opportunities face the additional challenge of highly seasonal hydrology.6
3.3.3. Western
Western Alaska’s climate and remote logistics are slightly less challenging than those of the Arctic/Northwest. The region’s historic abundance of fish and game has contributed to a high number of small indigenous villages on the coast and along the rivers with a regional hub in Bethel on the Kuskokwim River. The coastal winds and upland hills provide significant opportunities for wind to supplement local diesel generation and to provide high-value dump-load energy. As in the Northwest, a few hydropower opportunities have been identified that would easily surpass local needs; however, local support of these opportunities remains questionable due to the risk of disturbing rivers that provide vital fish and game habitat to support local subsistence needs. Hydropower opportunities face the additional challenge of highly seasonal hydrology.7
3.3.4. Southwest
Southwestern Alaska’s remote logistics and climate are slightly less challenging than those of Western Alaska. Again, wind development to supplement local diesel generation presents a number of opportunities along the coast and out along the Aleutian chain. While the cost of wind development in many remote rural coastal communities may appear high in absolute terms, exceeding 40c/kWh, the wind energy is frequently less expensive than the diesel it displaces, which may approach 80c/kWh. A few hydropower opportunities have been identified that would surpass local needs. These opportunities would face scale considerations and challenges associated with local support due to potential disruption of rivers that provide vital fish and game habitat that support local subsistence needs. Additionally, hydropower opportunities face the challenge of seasonal hydrology.8 With slightly less challenging seasonal hydrology, a few small hydropower resources have been developed in Southwest Alaska to meet local needs and supplement the summer fishing export industry. The Southwest region potentially includes considerable geothermal resources, suggested by the presence of locally active volcanoes and confirmed in part by temperature logs from oil and gas exploration drilling. A production-capable drill rig has been mobilized in the region to explore and develop geothermal resources.
3.3.5. Kodiak
Kodiak Electric Association (KEA) installed three 1.5-MW GE SLE wind turbines in August 2009 for roughly $3000/kW at its Pillar Mountain site.9 The new wind power complements the nearby 22.5-
6 Just as many developing countries face high seasonal rain, the rivers in the Northwest have highly seasonal stream flow associated with the rain and freeze/thaw cycles. 7 Ibid. 8 Ibid. 9 For the Pillar Mountain Wind Project (3X1.5-MW), KEA was the recipient of a $1 million grant from the State of Alaska and was also successful in receiving a second Clean Renewable Energy Bond (CREB) loan for $5 million from the IRS. The CREB funds give KEA a near zero interest loan for the project. A total of $12 million in CREB funds are allocated for this project.
While the cost of wind development in many remote rural coastal communities may appear high in absolute terms, exceeding 40c/kWh, the wind energy is frequently less expensive than the diesel it displaces, which may approach 80c/kWh.

10
MW Terror Lake Hydroelectric Project. KEA’s recently acquired ownership of Terror Lake for $1700/kW from the Four Dam Pool Joint Action Agency.10
3.3.6. Yukon River into the Interior
Dozens of remote rural villages reside along the Yukon River, a 2,300 mile river with a drainage area 25% larger than the state of Texas. Approximately one-third of the Yukon’s drainage area falls within Canada and two-thirds falls within Alaska. Far upriver in Canada, the Whitehorse Rapids Hydropower facility is the only permanent hydroelectric dam on the Yukon with a capacity of 40 MW summer/25 MW winter. Downstream along the Alaska portion of the Yukon and its tributaries, renewable opportunities include: 1) local biomass, predominantly located on South facing slopes; 2) upland wind; and 3) in-stream hydro. While many of the renewable sites on the recon map are costly, these sites appear to offer RE that is less expensive than imported diesel fuel oil.
3.3.7. Railbelt
Roughly 500,000 people reside among the Railbelt region, which includes Fairbanks, Mat-Su, Anchorage, and the Kenai Peninsula. Many Railbelt communities utilize locally distributed generation resources that are linked by government-subsidized electric transmission facilities, providing shared access to a wide variety of electric generation resources, including naphtha, heavy atmospheric gas oil (HAGO), and coal-fired generation around Fairbanks in the North to hydropower and natural gas generation around Anchorage down to the Bradley Lake hydropower project (126 MW) across from Homer. The region also includes four (4) military bases, mining, refineries, and other oil and gas related industrial developments.
Current prospects for RE include: 1) wind resources, most notably in the mountain-funnel geographic area around the Cook Inlet and in the Alaska Range; 2) local biomass for heat; 3) Mt. Spurr geothermal; and 4) tidal, and run of river, lake tap and various hydropower dam projects ranging from high head/small footprint in the mountains to large downstream dam sites.
3.3.8. Interior Roads
Several communities adjacent to the Railbelt rely primarily on imported diesel fuel as their primary energy source. These communities are connected by roads (improving logistical access), but not interconnected by electrical transmission facilities. Rising diesel fuel costs have caused a shift toward biomass for heating. Biomass for CHP systems appears competitive along with small hydropower.
3.3.9. Southeast
The early gold rush of 1898 was followed by larger gold mining operations after the turn of the 19th century. These ventures were eventually supplied with power by hydroelectric facilities that took advantage of local high-head hydropower with natural seasonal storage features. Many fishing and timber communities expanded during the decades of low-cost diesel fuel oil. As diesel fuel oil prices spiked over the past 30 years, both the State of Alaska and private sector interests have re-invested in hydropower ranging in size from 500 kW up to 20 MW. Investigations continue into the possibility of exporting SE hydropower via to-be-constructed transmission facilities into British Columbia.11 Local biomass and upland wind resources appear as competitive renewable opportunities in areas that are
10 Terror Lake was originally constructed by the State of Alaska for over $230 million in 1985, or $20,895 per kW (2009$). 11 For an excellent discussion of the SE Hydroelectric export opportunity, see Brian Yanity, “Transmitting Development Strategies”, International Water Power and Dam Construction, August 2009. Available at www.waterpowermagazine.com.

11
beyond the reach of affordable transmission facilities, tying local demand centers to regional hydropower developments.
3.4. EE/RE Opportunities in Alaska – The Challenges of “Stranded Resources”
In addition to numerous undeveloped RE resource opportunities that are adjacent to existing communities, Alaska may have large RE resources that, by virtue of not being adjacent to a large rich market opportunity or appearing to be unproven or expensive relative to fossil fuel alternatives, are not on the high profile list of commercial development opportunities of the renewable industry in the near term.
Nonetheless, these RE resources hold significant promise for future energy developments to serve growing local markets along with local development of export industries. These large, currently “stranded” renewable resources present significant opportunity:
The next five years −
As local innovations and learning-by-doing reduce costs and increase the competitive frontier of renewables;
As roads and electrical transmission facilities are extended into areas with RE resources.
The next 15 years, as local research and commercial development continues to push the cost/performance frontier for renewables and renewable electricity/storage and renewable fuel technologies.
Technologies to help develop Alaska’s vast stranded renewables potential include wind, tidal, geothermal and hydropower combined with renewable fuels production, switching from fossil fuel to electric transportation systems supported by renewables, and energy storage systems that enable higher utilization rates of renewable resources.
Alaska is well positioned to develop applied research in support of pushing the commercial frontiers to enable development of stranded renewables based on key research collaborations between National Energy Labs and State of Alaska and University of Alaska institutions. Two prominent collaborations include:
Alaska Center for Energy and Power/Sandia National Laboratories/National Renewable Energy Laboratory;
Alaska Energy Authority/National Renewable Energy Laboratory.
3.5. Alaska Energy Historic Backdrop
It is not unusual for the unit cost of developed energy resources in Alaska to be on the order of two to ten times the cost of similar resources in the Continental U.S.
The relatively high cost of energy resource development in Alaska has led to a variety of local and regional adaptations of fossil fuels and renewables, depending upon local resources and the extent to which the market demand being addressed is local or export. There is a long history of hydroelectric development in Southeast Alaska - from the small projects that supported gold mining in Juneau and Skagway shortly after the turn of the century, continuing up to the present day completion of the

12
Kasidaya hydroelectric project outside Skagway to support local tourism. In addition to wood and coal burning for general space heating, biomass in the form of wood boilers for heating and electricity was used in the early mining developments in Fairbanks and in McCarthy/Kennicott12. Natural gas was used for heating and electricity in South-central Alaska after the discovery of oil and gas in the Cook Inlet in the 1950s that led to a refinery and LNG export facility. Coal and oil became prominent in the Interior after World War II to meet the needs of the Department of Defense, the university, local markets, and export opportunities. Where local hydropower and biomass were not readily available and natural gas was not adjacent to the local market, liquid fossil fuels (gasoline, diesel, AV gas, jet fuel) were commonly used in large resource development projects during and following World War II. These resources became more locally affordable after the development of relatively small-scale local refineries – the Nikiski refinery, which followed Cook Inlet oil discoveries in the 1950s, and the North Pole and Valdez refineries associated with the TAPS in 1977.
During the early 1980s, the State of Alaska’s oil revenue surplus enabled a rapid expansion of state funded energy programs including the Alaska Housing Finance Corporation’s energy efficiency/weatherization programs, the Four Dam Pool, Railbelt electric transmission interties, Bradley Lake Hydroelectric Project and the Power Cost Equalization (PCE) program for rural, predominately diesel-fired electrical generation.
Even with the PCE subsidy program, which is primarily designed as a lifeline program, the average residential customer in rural Alaska only uses around 400 kWh/month – reflecting the confluence of low incomes and high energy prices resulting in a high “natural rate” of energy conservation.
Most recently, during the fossil fuel energy-price spike in the summer of 2008, the State of Alaska Administration and Legislature moved quickly to address high energy prices and the desire to accelerate the transition toward clean RE with:
Approximately $750 million “resource rebate” to residents in the form of a supplement to the Permanent Fund Dividend in the fall of 2008,
$360 million to residential weatherization and energy efficiency programs,
$100 million for the RE grant fund (+another $25 million in 2009)13,
$60 million in supplemental loan support for fuel purchases, and
$1.8 million in supplemental payments to the PCE endowment and program.
As fossil fuel energy prices and capital construction costs have moderated into 2009, many Alaskans have been asking, what is the future potential for EE/RE to help avoid fossil fuel price shocks and higher prices? How can we advance EE/RE opportunities in Alaska? Where should we focus our attention to help develop EE/RE opportunities? How should we monitor and evaluate EE/RE programs in Alaska in order to package local adaptation expertise for export to the developing word?
12 See Neil Davis, Energy Alaska (1984) 13 Please note that Alaska’s Renewable Energy Fund is the largest state-funded renewable energy effort in the United States, $125 million in two years, which, on a per capita basis, is equivalent to a $55 billion Renewable Energy Stimulus Fund in the United States Even in these challenging economic times, the State of Alaska continues to be supportive of additional spending on critical transmission infrastructure and smart grid demonstration projects to reduce the barriers for renewable energy development. The State of Alaska recently appropriated $25 million for transmission infrastructure for wind power development and is reviewing how to leverage another $49 million in energy fund grants in the upcoming legislative session. If the State follows through and invests $49 million in smart grid and efficient electrical transmission infrastructure, it would be the equivalent to a $21.7 billion investment in the United States on a per capita basis.

13
3
Fortunately, not unlike Norway, Alaska is blessed with abundant resources and has saved a significant portion of its fossil fuel-generated wealth in the form of financial reserves, and appears poised to continue to use its financial reserves to invest in the next generation of clean energy opportunities. A number of energy related bills have been introduced in the Alaska Legislature to support further investment in energy efficiency and renewable energy.
3.6. Alaska Historic Energy Consumption
Over the past 50 years, the total energy consumption in Alaska has grown by a factor of 15 with two dominant expansions: 1) the development of oil resources on Alaska’s North Slope; and 2) the sales of jet fuel associated with the development of the Anchorage Airport as the leading international cargo hub in the United States.
Prior to the development of the oil and gas industry, export industries and the federal government were the primary developers of renewables, including biomass and hydropower for mining, and federal hydropower projects.
During the 1980s, the state invested surplus revenue from oil and gas resources in a number of hydropower projects.
In the 2004-2007 period, as fossil fuel prices rose around the world, a portion of those increases were felt in Alaska.
Figure 3: Alaska Total Energy Consumption by Source.
A prominent industrial use of natural gas, the Agrium Nikiski fertilizer plant, phased down and eventually shut down in 2007. The phase down of the Agrium fertilizer plant, with a natural gas demand of approximately 40-50 billion cubic feet (Bcf)/year (40,000 to 50,000 billion Btu per year), or roughly 15% of the total consumption of natural gas across Alaska, including field operations, is a prominent contributor to the decline in natural gas and total energy consumption in the historic record.
Figure __: Alaska Total Energy Consumption by SourceSource: EIA Historic Energy Consumption, Alaska, Table 7
0
100,000
200,000
300,000
400,000
500,000
600,000
700,000
800,000
900,000
1960
1962
1964
1966
1968
1970
1972
1974
1976
1978
1980
1982
1984
1986
1988
1990
1992
1994
1996
1998
2000
2002
2004
2006
Bill
ion
BTU
s pe
r yea
r
BiomassHydroOther PetroResidMotor GasolineLubricantsLPGKeroseneJet FuelDFOAv GasAsphalt Road OilNatural GasCoal

14
Figure 4
Subsequent events which have also contributed to a reduction in total energy use include:
• The Phillips LNG export facility has been reducing exports to allow limited Cook Inlet supply of gas to be diverted to gas for local heating and electrical generation;
• Flint Hills refinery periodically shuts down one out of three process trains over the past 12 months;
• BP has announced the closure of its Gas-to-Liquids industrial facility on the Kenai Peninsula, reducing natural gas and electrical demand on the Kenai Peninsula.
On the RE front, the Alaska Energy Authority, Alaska Village Electrical Cooperative, TDX, and AP&T, among others, have been developing wind and hydropower opportunities. AP&T completed Kasidaya hydroelectric project (approx. 3 MW near Skagway) in late fall of 2008.
3.7. Alaska Energy Consumption by Market Segment
3.7.1 Residential Diesel fuel oil remains a significant source of heating fuel for Alaska. The discovery of natural gas in the Cook Inlet allowed Anchorage and surrounding communities to convert to gas-fired generation as the transmission and distribution system expanded to meet the growing demand.
As households increased in number and size, electric consumption has increased, magnifying energy losses associated with electrical generation. Most electricity is generated from an energy conversion
Alaska Residential Energy Consumption by Source
0
10,000
20,000
30,000
40,000
50,000
60,000
70,000
1960
1962
1964
1966
1968
1970
1972
1974
1976
1978
1980
1982
1984
1986
1988
1990
1992
1994
1996
1998
2000
2002
2004
2006
Bill
ion
BTU
s
Electric System LossesRetail ElectricityWoodLPGKeroseneDFONatural GasCoal

15
process that converts roughly a third of the primary energy to electricity − the remaining two-thirds is “wasted” as heat. Combined heat and power plants may capture another 20%+ of the heat to offset heating requirements. Modern fossil fueled turbines in combined cycle may increase system efficiencies to the high 50% - low 60% range. After that, the local power plant typically uses a few percent for “station use.” An additional 8-10% of the energy is lost in the transmission and distribution lines due to inefficient transfer of electrons.
Over the past 20 years, residential energy consumption on an MMBtu per square foot basis has declined.14
Alaska’s residential heating and transportation fuel consumption is relatively high due to the state’s long and extreme winters, dispersed populations, and remote distances. In addition, the high energy costs and relatively low income of rural areas results in lower end-use energy consumption per household than in urban Alaska. See Figure 5 below.
14 MAFA Presentation to the Railbelt Integrated Resource Plan Technical Conference, July 2009.
Figure xx: Median Household End-Use Energy ConsumptionSource: MAFA Analysis 2009
0
50
100
150
200
250
300
350
Rural AK Urban AK
MM
Btu/
year Transport
ElectricHeat
Figure 5:

16
The electrical use per capita in rural Alaska is under 2000 kWh/year, placing it closer to the profile of a recently developing country. As a result of its relatively new exposure to electricity and its remote rural character, rural Alaska is well positioned to share lessons learned with other developing regions that appear poised to climb the development ladder through rapid expansion of electrical energy, especially with the rapid diffusion of information and communications technology (see Figure 6).
Figure 1: Residential Electric Consumptions per capita, by regionSource: EIA IEO 2009, MAFA 2009
0
1,000
2,000
3,000
4,000
5,000
6,000
7,000
C
anad
a
U
nite
d St
ates
A
ustra
lia/N
ew Z
eala
nd
J
apan
OEC
D E
urop
e
R
ussi
a
S
outh
Kor
ea
R
ural
Ala
ska
Mid
dle
East
O
ther
Eur
o/Eu
rasi
a
M
exic
o
B
razi
l
C
hina
O
ther
Cen
tral a
ndSo
uth
Amer
ica
O
ther
Non
-OEC
D A
sia
In
dia
Afri
ca
EIA IEO Region
kWh/
year
per
cap
ita (2
030
Proj
ectio
n)
Rural Alaska is well situated to act as a bridge between the developed anddeveloping world on the transition to renewables - based on its strategiclocation on the energy development ladder and accumulated experiencebuilding bridges among indigineous populations and complext institutionsunder challenging circumstances
Figure 6:
17
3.7.2 Commercial
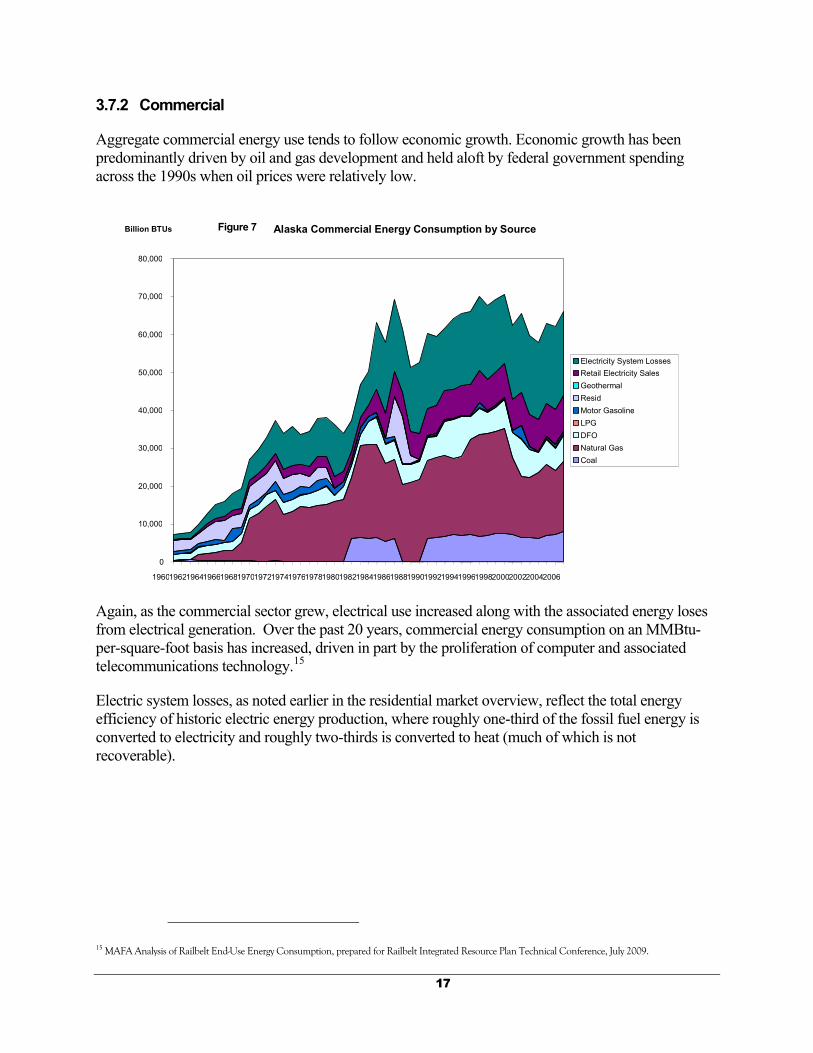
Aggregate commercial energy use tends to follow economic growth. Economic growth has been predominantly driven by oil and gas development and held aloft by federal government spending across the 1990s when oil prices were relatively low.
Again, as the commercial sector grew, electrical use increased along with the associated energy loses from electrical generation. Over the past 20 years, commercial energy consumption on an MMBtu-per-square-foot basis has increased, driven in part by the proliferation of computer and associated telecommunications technology.15
Electric system losses, as noted earlier in the residential market overview, reflect the total energy efficiency of historic electric energy production, where roughly one-third of the fossil fuel energy is converted to electricity and roughly two-thirds is converted to heat (much of which is not recoverable).
15 MAFA Analysis of Railbelt End-Use Energy Consumption, prepared for Railbelt Integrated Resource Plan Technical Conference, July 2009.
Figure 7 Alaska Commercial Energy Consumption by Source
0
10,000
20,000
30,000
40,000
50,000
60,000
70,000
80,000
1960 1962 1964 1966 1968 1970 1972 1974 1976 1978 1980 1982 1984 1986 1988 1990 1992 1994 1996 1998 2000 2002 2004 2006
Billion BTUs
Electricity System Losses Retail Electricity Sales Geothermal Resid Motor Gasoline LPG DFO Natural Gas Coal

18
3.7.3 Industrial
Industrial energy consumption is primarily driven by gas reinjection to support enhanced oil recovery and, up until 2007, the Unocal/Agrium Nikiski fertilizer plant, discussed previously.
All things being equal, with the closure of the Unocal/Agrium Nikiski fertilizer plant, natural gas used for fertilizer production is expected to decrease on the order of 50,000 billion Btu per year.
Depending upon how quickly the use of natural gas is converted from use to enhance oil recovery to commercial export opportunities, either as a heating fuel, fuel for electrical generation, or as liquefied natural gas feedstock, its use seems likely to continue whether in domestic or export markets.
The big opportunity in the industrial sector, including both oil and gas and mining, is the replacement of aging energy infrastructure with efficient modern equipment as old fields are reworked and new throughput capacity is developed to meet new market opportunities (e.g., transportation of natural gas to non-local markets).
Figure 8 Alaska Industrial Energy Consumption by Source
0
50,000
100,000
150,000
200,000
250,000
300,000
350,000
400,000
450,000
500,000 Billion Btus
Electricity System Loses Retail Electricity Sales Biomass Hydro Other Resid Motor Gasoline Lubricants LPG Kerosene DFO Asphalt Road Oil Natural Gas Coal

19
3.7.4 Transportation
Historically, transportation fuel consumption is dominated by jet fuel to serve two U.S. Air Force bases and the expansion of the Anchorage International Airport into the busiest cargo airport in the United States.
With the recent national and international economic downturn, jet fuel consumption has declined.
Going forward, the transportation sectors in Alaska are likely candidates for increased efficiency, as transportation equipment (e.g., trains, planes, boats, automobiles, and off-road recreational vehicles) continues to evolve. Due to its relative distance from markets, goods and services in Alaska tend to have a higher proportion of their cost associated with transportation. As energy costs escalate, the relative burden of transportation requires efficiency adjustments to stay competitive.
Given the relative magnitude of the fishing industry in Alaska, the conversion of the existing fleet of boats and ships to more efficient designs will likely be necessary for the industry to stay competitive in larger domestic and international markets.
Finally, despite some concerns with the performance of hybrid vehicles at low ambient temperatures, we expect efficient land transportation vehicles to become more prevalent in Alaska. High fossil fuel prices may lead to the exploration of new alternatives for fleet vehicles, including hybrids and other renewable fuels.
Figure 9 Alaska Transportation Energy Consumption by Source
0
50,000
100,000
150,000
200,000
250,000
300,000
1960
1962
1964
1966
1968
1970
1972
1974
1976
1978
1980
1982
1984
1986
1988
1990
1992
1994
1996
1998
2000
2002
2004
2006
Bill
ion
BTU
s
Fuel EthanolResidMotor GasolineLubricantsLPGJet FuelDFOAv GasNatural GasCoal

20
3.7.5 Energy for Electrical Production
Cook Inlet natural gas dominates the historic picture due to its proximity to the population centers in South-central Alaska and the associated military bases and industrial developments on the Kenai Peninsula, including the Tesoro refinery and Unocal/Agrium fertilizer plant. The construction of the Alaska Intertie connecting Anchorage and Fairbanks has allowed the export of Cook Inlet gas-fired electrical generation to Fairbanks. This exportation enabled additional growth in natural gas for electrical consumption as industrial mining loads expanded in Fairbanks, drawing upon the less costly gas-fired electricity.
In addition, Fort Richardson converted from generating its own power to purchasing power from Municipal Light and Power in 2007, resulting in a jump in natural gas consumption for electrical production.
The Bradley Lake Hydroelectric Project (126 MW) and Four Dam Pool Projects (Tyee Lake, Solomon Gulch, Swan Lake, Terror Lake, total of 74 MW) were commissioned in 1980s and 1990s, and are the major contributors to the growth in the dark blue top line.
In addition, a number of smaller hydroelectric projects constructed in the 1980s and 1990s (including Black Bear, Goat Lake, Power Creek, and Tazimina for a total of 15.3 MW) have also contributed to the growth in hydroelectric output.
The increase in hydroelectric production has reduced the need for natural gas and diesel fuel oil used in electric production.
Alaska Electric Energy Consumption by Source
0
10,000
20,000
30,000
40,000
50,000
60,000
70,000
80,000
1960
1962
1964
1966
1968
1970
1972
1974
1976
1978
1980
1982
1984
1986
1988
1990
1992
1994
1996
1998
2000
2002
2004
2006
Bill
ion
BTU
s
ImportsWindSolar PVGeothermalBiomassHydroNaphthaDFOResidNatural GasCoal
Figure 10

21
More recently, peak winter gas consumption in the Cook Inlet associated with heating and gas for electrical generation has exceeded available peak supplies; the LNG export facility has curtailed natural gas consumption in deference to the high-priority local heat and electric winter demand. Peak pricing of gas supply and associated efforts to make more efficient use of gas and electricity are under way in the winter of 2009.
3.8. Lessons Learned
3.8.1 Alaska is a Tough Incubator
Alaska’s energy needs and resources are spread across a vast and diverse landscape with limited road access, severe seasonal transportation and logistical challenges, and a high cost to deploy imported energy solutions.
Vigorous competition and cooperation between and among local, state, and federal government agencies, village, and regional native corporations and enterprises, non-profit and for-profit enterprises has produced a rich mix of practical skills on how to navigate complex institutional settings.
In addition, the dramatic seasonality of the climate and of many resource development activities is matched by a highly migratory population with the attendant challenges of attracting and retaining a skilled workforce each season – not unlike the sharp seasonality associated with activities and logistics around the rainy season in developing countries in addition to the more obvious analogues with the extreme arctic/sub-arctic and mountainous regions of the world.
The accumulation of practical experience in a frontier environment makes Alaska an ideal location to continue to develop new RE enterprises.
3.8.2 Alaska as Innovation Hub to Develop Renewable Export Opportunities
3.8.2.1 Alaska’s Challenges are Challenges of the Developing World
Going forward, one of the biggest challenges facing the worldwide development of RE is how to effectively develop technologies that will work under the severe stress of the developing world. As many commentators have repeatedly noted, success in the developing world is not just a matter of dropping United States, European or Australian technology into a developing community. Locally appropriate adaptations and local institutional support are absolutely critical for success.16
While Alaska has its own litany of stories of ineffective adaptations, it also has a growing list of success stories of energy projects, institutions, and narrowly targeted subsidies that have transformed energy markets leading toward higher efficiency and higher penetration of renewables under rather challenging remote conditions. Alaska’s history and accumulated experience with EE and RE provide a rich foundation upon which to build practical, robust energy solutions for many emerging economies in the developing world.
Alaskan enterprises have already begun to share their RE expertise around the world, including hydroelectric development in Central America and RE and information and telecommunications
16 See for example Building Institutions for Markets, World Development Report 2002, World Bank and Stephen A. Marglin, “Development as Poison: Rethinking the Western Model of Modernity”, Harvard International Review, Spring 2003.

22
technology integrations in India and Ghana.17 Technical, institutional, and economic knowledge in RE/EE present both import and export opportunities. In the summer of 2009, an Alaska electric utility owned and operated by a former Peace Corps volunteer imported slow-speed electric generators from China to integrate into an Alaska fish wheel system designed to provide supplemental summer/fall refrigeration for fish and game harvest seasons. If the fish wheel system integration is successful, it may be suitable for export to regions where subsistence activities are prevalent around rivers and streams. The integration of simple, robust, electrical production systems with on-going subsistence activities provide reliable electrical production to support valuable health interventions for remote rural communities, such as water, sanitation, and refrigeration of medical supplies.
3.8.2.2 Alaska has Broad Experience in Enterprise Development
Alaska is a developing state with a high density of business development enterprises devoted to creating new business and export opportunities.18
Over the past 40 years, Alaska’s leading public/private partnership development bank, Alaska Industrial Development and Export Authority (AIDEA), has issued roughly $2 billion (>$2900/capita) in loans and conduit revenue bonds.19 In addition, AIDEA, in recognition of the strategic value of energy and industrial and export development, has been closely associated with AEA, a public/private partnership organization.
3.8.2.3 Alaska as International Transportation Hub
Anchorage’s airport is the busiest airport in the United States as measured by freight tonnage. Anchorage presents a unique international hub opportunity for RE enterprises that are looking to build a bridge from North America across the Pacific Rim and over the pole to Europe.
3.8.3 Alaska as Showcase for the Transition from Fossil Fuels to Renewables
3.8.3.1 World Class Oil and Gas Development
Alaska’s oil industry has a long track record of development that demonstrates sensitivity and respect for Native culture, tradition, and a subsistence lifestyle, along with local employment needs.
Alaska hosts some of the leading oil and gas companies in the world, including Exxon, BP, Conoco-Phillips − these corporations have built considerable expertise in new technology development and project management in challenging frontier environments. These advances present opportunities for cross-fertilization with RE projects, especially as both fossil fuel and RE industries head offshore in search of new resources.
17 Alaska Power and Telephone’s subsidiary, Hydrowest International, continues to develop low impact hydroelectric projects in Central America. The ATandT Industrial Ecology foundation nominated Alaskan subject matter experts to serve on the United Nations Committee on Renewable Energy and Telecommunications Technology to help identify policies to enhance the deployment of both in developing countries. 18 Among others, Alaska InvestNET, Alaska Federation of Natives Alaska Marketplace, Anchorage Economic Development Council, TriBorough Commission, Alaska Department of Commerce, Alaska Department of Commerce and Economic Development, USDA, Rural Development), and the Alaska Small Business Development Center 19 See http://www.aidea.org/
23
3.8.3.2 Saving and Reinvesting Fossil Fuel Wealth in Future Generations
Alaska is a world leader in investing financial gains from fossil fuel resource development for future generations - the Alaska Permanent Fund, with a market capitalization of $30 billion ($43,700/per capita)20 in June 30, 2009, which is expected to pay a dividend to all Alaska residents on the order of $1305. From 1982 through 2009, the accumulated total per resident dividend will be over $30,000.
3.8.3.3. Building the Bridge to Clean Energy
Alaska continues to lead the United States in state-level investments in energy efficiency and renewable energy, having recently invested a portion of its surplus from the recent oil price spike in 2008 as follows:21
$360 million for weatherization and residential building envelope improvements;
$125 million for a RE project fund. Matching funding has been encumbered for projects that include wind power, geothermal, biomass, combined heat and power, and hydro. The total RE project value associated with the RE matching funds is estimated at $1.25 billion for an aggregate average project value to match ratio of 10:1. Committees of the Alaska Legislature are working on a state energy policy that emphasizes energy efficiency and RE along with an Emerging Energy Technology Grant Program.
3.8.3.4 Federal Agency Presence and Department of Defense
The Denali Commission is releasing up to $4 million towards alternative and emerging RE technology and demonstration projects. The Emerging Energy Technology Grant (EETG) seeks to develop emerging alternative and RE technology that has the potential of widespread deployment in Alaska, and that has the potential to reduce energy costs for Alaskans. Alaska’s large federal agency presence enables the rapid development of several energy efficiency and renewable enterprises as federal agencies such as the Department of Defense mobilize efforts to reduce their greenhouse gas footprint as a result of high-level directives to lead by example.
20 The Alaska Permanent Fund is roughly half the size of Norway’s Sovereign-Wealth Fund on a per capita basis. 21 On a per capita basis, the total of $485 million is roughly five times as large as the total 2009 Recovery Act investments directed through the U.S. Department of Energy, and 12 times as large as the 2009 Recovery Act DOE EE/RE allocation.

PAGE 24
4. Fossil Fuel Energy Price Projections
4.1. Introduction
This section describes the basis of the future energy price projections used to illustrate the market potential of energy efficiency and RE in Alaska.
4.2. Fossil Fuels Price Projections
4.2.1 Natural Gas Price Projection – The natural gas price projections range from $8 per MMBtu (2009$, EIA Low) to $17 per MMBtu (2009$, IEA Reference) in 2030.
4.2.2 Crude Oil – The crude oil price projections range from $50 per barrel (EIA Low, 2009$) to $200 per barrel (EIA High, 2009$) in 2030.
Figure __: Natural Gas Price Projection - CONUS (2009$ / mmbtu)Sources: EIA AEO 09 Reference, Low, High; IEA WEO 08
$0.00
$5.00
$10.00
$15.00
$20.00
$25.00
2006
2008
2010
2012
2014
2016
2018
2020
2022
2024
2026
2028
2030
2032
2034
2036
2038
2040
2042
2044
2046
2048
2050
2052
2054
2056
2058
2060
2009
$ /
mm
btu
BaseHighLowIEA Reference
11

25
4.2.3 Carbon dioxide emissions cost estimates range from $30 per carbon dioxideeq tonne (EPA, Waxman-Markey Reference Case, 2009$) to $65 per carbon dioxideeq tonne (EIA, Waxman-Markey Reference Case, 2009$) in 2030.22
22 The presentation of the EIA projection ends at 2030 in part as a reminder of the advice offered by the Congressional Research Service review of carbon dioxide emissions cost projections – anything projected out beyond the 20-year time horizon is so highly speculative that it may not be anything more than illustrative.
Figure __: CONUS Crude Oil Import Price (2009$ / bbl)Sources: EIA AEO 09 Reference, Low, High; IEA WEO 08
$0.00
$50.00
$100.00
$150.00
$200.00
$250.00
$300.00
2006
2008
2010
2012
2014
2016
2018
2020
2022
2024
2026
2028
2030
2032
2034
2036
2038
2040
2042
2044
2046
2048
2050
2052
2054
2056
2058
2060
2009
$ / b
bl BaseHighLowIEA Reference
Figure ___: US CO2 Emissions Cost Projections (2009 $ / tonne)Sources: EPA (July 2009), CRA (May 2009), EIA (August 2009)
$0.00
$50.00
$100.00
$150.00
$200.00
$250.00
2012
2014
2016
2018
2020
2022
2024
2026
2028
2030
2032
2034
2036
2038
2040
2042
2044
2046
2048
2050
2052
2054
2056
2058
2060
2009
$ / t
onne
EPA WM EstCRA WM EstEIA Basic
12
13

26
4.3 Fossil Fuel Price Projections In Alaska
4.3.1 Natural Gas Wellhead
Historically, Alaska has been blessed with a low wellhead price for natural gas compared to other gas producing states.
Going forward, the wellhead price for natural gas in Alaska will substantially depend upon the extent to which Alaska can export its large natural gas and additional resources. The successful development of natural gas exports on the order of 4 billion cubic feet (bcf)/day should enable Alaska’s wellhead price of natural gas to remain below most North American wellhead price ratios (in the Alaska to Colorado range of 0.7 to 0.9 of U.S. average – see figure above) which appear likely to be dominated by shale gas at the margin.
For the purpose of this long-run analysis, we have assumed that Alaska is able to develop and export significant natural gas resources. To the extent that Alaska is unable to develop a large natural gas export opportunity, the wellhead price is likely to increase toward the marginal forward looking cost to develop gas for smaller scale markets. Under this scenario, it seems likely that the wellhead price will exceed the price ratios of other gas producing states due to small relative scale (upper blue arrow in the figure above).
Please note that difference in the future gas market price projections by EIA and IEA, roughly $10/MMBtu and $17/MMBtu respectively in 2030, suggest considerable uncertainty over the future price of natural gas. This turn presents considerable uncertainty with respect to the
Figure __: Natural Gas Wellhead Price => State:U.S. RatiosSource: EIA Natural Gas Wellhead Price Annual Data (2009)
0.00
0.20
0.40
0.60
0.80
1.00
1.20
1.40
1.60
1.80
1967
1969
1971
1973
1975
1977
1979
1981
1983
1985
1987
1989
1991
1993
1995
1997
1999
2001
2003
2005
2007
AlaskaColoradoTexasWyoming5 per. Mov. Avg. (Alaska)5 per. Mov. Avg. (Colorado)
Alaska
Colorado
?
?
14

27
economic attractiveness of many EE and RE alternatives. At the lower price projection, several energy efficiency and renewable opportunities from the hydropower, wind, and geothermal sectors appear commercially viable. Additional energy EE/RE market penetration is highly dependent on learning curve improvements in the technology development and integration and the project team experience. Conversely, at the high price projection, a wide range of energy efficiency and RE projects are very competitive with fossil fuels; existing commercial technologies could be expected to displace fossil fuels with only modest reliance on experienced project teams. In short, high prices allow otherwise less competitive projects to attract capital and teams to build them. Please see the supply curves developed below for quantitative information on the long-run cost of renewables.
4.3.2 Natural Gas Residential Heating
Historically, the residential price for natural gas in those areas adjacent to natural gas resources has tracked the wellhead price plus transmission, distribution, and taxes.
Over the study horizon, we assumed that residential prices will continue to track the wellhead price and the overall average Alaska wellhead price will be set largely as a netback from large-scale export markets. This is expected to result in an a favorable residential gas price relative to other gas producing states whose future prices appear likely to be set by shale gas and LNG imports at the margin.
Figure __: Natural Gas Residential Price = State:U.S. RatioSource: EIA Natural Gas Price Residential Annual Data (2009)
0.00
0.20
0.40
0.60
0.80
1.00
1.20
1.40
1.60
1967
1969
1971
1973
1975
1977
1979
1981
1983
1985
1987
1989
1991
1993
1995
1997
1999
2001
2003
2005
2007
AlaskaColoradoTexasWyoming
15

28
4.3.3 Diesel Fuel Oil
Historically, Alaska’s residential price for home heating oil (No. 2 distillate or an “arctic blend” of No. 1/No. 2 for arctic winter conditions) has tended to track the U.S. price since the opening of the refinery complex in North Pole, currently owned by Flint Hills.
Assuming the successful development of Alaska North Slope natural gas resources, there will likely be additional adjacent development in oil exploration yielding additional oil for transport down the TAPS and feedstock for the in-state refineries.
It is important to note that older small-scale in-state refineries may struggle to compete with imported diesel fuel, especially in light of the Waxman-Markey Climate Change legislation which appears to levy a high emissions cost on U.S. refineries, putting the in-state refinery at a competitive disadvantage relative to diesel imports from the Pacific Rim.23 Given the relatively small incremental diesel fuel supply requirements in Alaska compared to other markets on the Pacific Rim, this uncertainty may result in higher diesel fuel prices in the Alaska market compared to historic trends. If these risks materialize, energy efficiency and RE should experience additional growth.
23 See Oil and Gas Journal, “Study lists House clean air bill's possible refining impacts,” September 7, 2009.
Figure __: Alaska to U.S. Price Ratios - No. 2 Distillate (a.k.a. diesel fuel oil)Source: EIA Annual No. 2 Distillate Fuel Oil Prices (2009)
0
0.5
1
1.5
2
1978
1980
1982
1984
1986
1988
1990
1992
1994
1996
1998
2000
2002
2004
2006
2008
Ala
ska:
U.S
. Pric
e R
atio Retail Sales
Residential PriceCommercial PriceIndustrial Price5 per. Mov. Avg. (Residential Price)5 per. Mov. Avg. (Industrial Price)5 per. Mov. Avg. (Commercial Price)
Recent Moving Average:Residential = 1.00Industrial = 1.16Commercial = 1.23
16

PAGE 29
5. Energy Efficiency Opportunities
5.1 Historic Trends
In rural Alaska, high energy prices have created considerable incentive for energy efficiency and conservation in the heating and electrical demand for buildings, industrial processes, and transportation end-use markets. Nonetheless, due to limited technical and marketing expertise, substantial opportunities for energy efficiency remain.24
In urban Alaska, moderate energy prices have provided the backdrop for residential energy efficiency programs (e.g., Alaska Housing Finance Corporation), resulting in energy efficiency savings for new construction and a weatherization program for existing housing. The net effect has been an increase in residential heating efficiency over the past 25 years.
Commercial markets, without financial, technical, and marketing support, may be lagging behind the United States in the development of energy service companies. Large institutions have recently begun to procure energy efficiency resources.25
5.2 Current Developments
The Legislature appropriated a total of $360 million ($525/capita) for residential weatherization and energy grant programs in 2008, and the program is well underway, reporting on the order of $130 million plus in encumbered funds in September 2009.26
Nascent Railbelt electric utility end-use initiatives, led by Golden Valley Electric Association GVEA, have recently expanded. Chugach Electric and Anchorage Municipal Light and Power (ML&P) recently re-invigorated a lighting program and ML&P has designated $250,000 for end-use efficiency/conservation to match other funds in 2010.27 Railbelt electric utilities have begun to include smart meter demonstration projects in their capital improvement program.28
The Alaska Energy Authority’s rural village electric efficiency program expects to continue its school lighting and other upgrades as it works its way around over 200 rural communities.29
The Alaska Legislature has promoted efforts to capture Alaska’s share of energy efficiency related stimulus funds in the summer of 2009.
24 The weatherization, energy grant, and village efficiency programs continue to find large untapped potential. 25 State of Alaska Department of Transportation is contracting for energy efficiency services in its facilities. 26 Personal conversation with Scott Waterman, AHFC 27 This represents roughly $4.20 per capita in the ML&P service territory, which, when combined with existing end-use efficiency/conservation program expenditures, places it near the national average, roughly $5.40 per capita, reported in The State Energy Efficiency Scorecard for 2006, Eldridge, Prindle, York and Nadel, June 2007, Report No. E075, ACEEE, Figure A.1, p. 63. 28 Chugach and ML&P, 2010 Budgets. 29 See http://www.aidea.org/AEA/programsalternativeenduse.html for more detail.

30
5.3 Future Opportunities
5.3.1 Electric Peak Demand
A recent analysis from the Federal Energy Regulatory Commission (FERC) suggests that Alaska could bend the curve of electrical peak demand if it fully participated in the opportunities presented with demand side and distributed resources which include improved peak pricing, interruptible rates, smart metering and associated enabling technology.
Figure 17: Alaska System Peak Demand Forecasts by Scenario
• Source: FERC National Demand Side/Distributed Resource Assessment, 2009
Given the heightened level of concern over the availability of adequate natural gas in the Cook Inlet at winter peak demand, efforts are underway to help manage winter peak demand, including improving peak pricing so that it more closely resembles the future cost to acquire peak resources, energy efficiency/conservation initiatives, and a public information campaign to encourage conservation at peak.
5.3.2 Electric Energy
Similar to the demand reduction estimate in the FERC National Demand Side/Distributed Resource Assessment (2009), Alaska consultants have estimated that an invigorated pursuit of end-use efficiency and conservation efforts can bend the curve of electric energy demand in Alaska at a level comparable to the Electric Power Research Institute’s estimate of “realistic savings” of 22% by 2030 (EPRI, January 2009) if market structure, pricing, enabling technology, and subject matter experts are organized around demand side services. As illustrated in the figure below, an estimated 21% reduction in Railbelt region’s energy requirements through 2030 may result from an aggressive restructuring of the market to emphasize forward-looking peak pricing and technical support for initiatives to transform the market and increase the demand for energy efficiency.
Alaska System Peak Demand Forecasts by Scenario
1,300
1,350
1,400
1,450
1,500
1,550
1,600
1,650
1,700
2009 2010 2011 2012 2013 2014 2015 2016 2017 2018 2019
Peak
Dem
and
(MW
)
System Peak(without DR)
BAU
Expanded BAU
AchievableParticipation
Full Participation

31
While Alaska does not have the summer peak shaving potential of continental U.S. air conditioning demand, the region does experience high winter peaks with coincident winter peaks associated with lighting and refrigeration inside well-heated buildings. A combination of more efficient lighting, refrigeration, and water heating (including fuel switching) presents a number of promising areas to reduce electrical demand both at peak and year round.
Figure 18: Projected Railbelt Electrical Energy Requirements (GWh)
Source: MAFA Analysis of Railbelt EE Opportunities (2009)
Projected Railbelt Electrical Energy Requirements (GWh)
0
1000
2000
3000
4000
5000
6000
7000
8000
2007
2009
2011
2013
2015
2017
2019
2021
2023
2025
2027
2029
2031
2033
2035
2037
2039
GW
h/ye
ar
BAU Conservation Achievable Potential

PAGE 32
6. Renewable Energy Opportunities 6.1 Introduction
As energy prices peaked in the summer of 2008, the Alaska State Legislature appropriated $100 million for Renewable Energy Projects in 2008 and another $25 million in 2009. As a result, project development work is underway on over $1.2 billion in RE projects across Alaska.30
Further commercial development of projects receiving funding under the Renewable Energy Fund and other renewable opportunities around the state will depend upon the ability of project developers to raise sufficient funds and organize project development teams to successfully execute the projects.
RE resource supply curves were developed to estimate potential renewables, based on levelized cost estimates of electricity (LCOE) for various renewable technologies in different regions of the state.
Wind, hydropower, biomass and geothermal supply curves illustrate the local Alaska potential for each basic technology, while highlighting the sensitivity of the supply curves to price. Many of the supply curves represent a few lower cost, easily exploited resources, followed by higher cost large-scale opportunities or smaller costly resources. Please note the basic shape of the supply curves resemble a supply curve developed recently for a hydropower evaluation study in British Columbia.
6.2 Future Opportunities
6.2.1 Wind – Rural
In rural Alaska, diesel fuel based electrical generation ranges in price from $0.20/kWh on up toward $1.00/kWh in remote rural villages where fuel has to be flown in. As a result, the “cost umbrella” presented by diesel in rural Alaska creates opportunities for many small- scale renewable project deployments that might not be competitive in larger markets where the fossil fuel alternatives may appear to cluster down around $0.10 per kWh.
In those communities where wind appears likely to yield a net economic benefit relative to diesel (benefit/cost >1.0), we’ve estimated the wind supply curve for rural Alaska (PCE communities) in Figure 19 below.
30 See http://www.aidea.org/AEA/RE_Fund.html for detail.

33
19
19
6.2.2 Wind – Railbelt
Within the Cook Inlet and Alaska Range, mountain funnels create high wind zones with Class 3 and above winds with capacity factors of 0.30 and above. The ports, rail, and road system that serve the Railbelt region enable total project cost on 24 to 50-MW scale wind projects to be estimated at around $3000 to 3400/kW (2009$), including an allowance for transmission and interconnection facilities to connect to the transmission grid. Preliminary wind integration studies have pointed toward the use of hydropower facilities as the most appropriate balancing resource for wind. Unfortunately, the largest modern hydropower facility with robust control is Bradley Lake, located at the southern end of the transmission system which may require additional balancing resources to make optimal use of the wind while maintaining robust voltage support across the network. Fire Island and Eva Creek wind projects are included on Figure 2, the Alaska map of competitive RE projects.
In addition, renewable resource potential maps for the Railbelt region have identified a renewable cluster that includes wind on the west side of Cook Inlet, Mt. Spurr geothermal, and Chakachamna hydropower. High level analyses suggests this cluster may present a competitive package of renewables that takes advantage of the relatively close proximity of the cluster to the existing Beluga Power Plant, thereby reducing the total cost of transmission infrastructure required for any one project. In addition, the close proximity of the wind, hydropower, and geothermal resources to each other may reduce the total cost of integration of the intermittent wind resource into the grid.
6.2.3 Hydropower – Analysis of AEA Alaska Hydropower Project Database
The Alaska Energy Authority hydroelectric reference database was combed to develop a list of roughly 1000 mutually exclusive projects where cost estimates or actual
Figure __: Supply Curve for Rural Alaska Wind Energy - estimated bus-bar energy costsSource: MAFA Wind Model of PCE Communities, Updated to 2009
$0.000
$0.100
$0.200
$0.300
$0.400
$0.500
$0.600
$0.700
0 5,000 10,000 15,000 20,000 25,000 30,000 35,000 40,000
Cumulative Quantity Available for Local Use (kW)
Leve
lized
Cos
t of E
lect
ricity
($/k
Wh)

34
information was either in the database or readily available. The cost information was then adjusted to a common 2009 basis using U.S. Corps of Engineers cost escalation factors for hydroelectric projects. Using a small sample of roughly a dozen projects completed since 1980, estimated costs were compared to actual costs of completed projects (where available and discovered). The analysis revealed a systematic bias of underestimates on larger public projects and overestimates on smaller private projects. To avoid the apparent bias in the project cost estimates − many dating back to the 1970s and 1980s − the cost estimates were adjusted to reflect the historic pattern of underestimating large projects and over-estimating small projects.31
The results of the hydropower screening study are presented below by region. In communities where hydroelectric development appears within the range to yield a net benefit relative to fossil fuels within the 50-year study period, a hydropower supply curve is provided.
Notably, the general pattern reveals a few very large hydropower projects with modest capital cost, measured on a $/kW basis, followed by a variety of medium to small projects with increasing capital cost typically associated with projects that are 1) farther away from demand centers which require additional transmission facilities to interconnect; and 2) farther “upstream” in both the river/hydrology sense and in logistical challenges to develop the project.
It is also useful to note that there are a number of smaller projects, typically high head, low-impact sites of under 5 MW, that are relatively close to an existing substation (e.g., hydropower around Girdwood and in Southeast, whose unit costs are relatively modest compared to larger dam projects) that show up as low cost in the Southeast and South-central regional supply curve presentations.
Few small projects with long-term levelized cost of electricity appear to be down around $30/MWh. We appreciate the skepticism expressed by a reviewer of the draft report about this low-cost hydropower. Verification revealed that estimates appear reasonable based on the particulars of the sites, which typically include previous civil engineering work from an earlier era to provide access to the site and enhance the storage volumes available, effectively reducing the overall need for civil engineering work and increasing annual flow volumes and capacity factors available on relatively high head projects. In short, there appear to be a few cost effective opportunities for redevelopment of previously developed sites across the Southern mountainous regions of the state typically associated with the mining and fishing industries from earlier in the 20th century.
On the opposite end of the cost curve, the screened project list includes small projects that appear to be around $300-400/MWh. These projects are included in the presentation because many of the small remote projects are competitive with other basic local options − such as remote off-grid diesel-fired generation.
31 Analysis of hydropower cost estimates vs. actuals available upon request.

35
Figure 20: Yukon River Region Hydroelectric Supply Curve
Figure 21: Southwest Alaska Hydropower Supply Curve
Yukon River Region Hydro Supply Curve - $/MWh vs. Cumulative Capacity (MW)
$0
$200
$400
$600
$800
$1,000
$1,200
$1,400
0.0 1,000.0 2,000.0 3,000.0 4,000.0 5,000.0 6,000.0 7,000.0 8,000.0
Capacity (MW)
Leve
lized
Cos
t (20
09$/
MW
h)
Rampart ($55/MWh)Woodchopper ($125/MWh)
Crooked Creek - Circle Hot Springs ($84/MWh)
Gerstle - Tanana River ($257/MWh)
Southwest Alaska Hydro Supply Curve - $/MWh vs. Cumulative Capacity (MW)
$0.00
$200.00
$400.00
$600.00
$800.00
$1,000.00
$1,200.00
$1,400.00
$1,600.00
0.00 100.00 200.00 300.00 400.00 500.00 600.00 700.00 800.00
Cum. Capacity (MW)
Leve
lized
Cos
t $/M
Wh
(200
9$)

36
Figure 22: Southeast Alaska Hydropower Supply Curve
Figure 23: South-central Alaska Hydropower Supply Curve
SE Alaska Hydro Supply Curve - $/MWh vs. Cumulative Capacity (MW)
$0.00
$100.00
$200.00
$300.00
$400.00
$500.00
$600.00
0.00 200.00 400.00 600.00 800.00 1000.00 1200.00
Cumulative Capacity
$/M
Wh
(200
9$)
Southcentral Hydro Supply Curve - $/MWh vs. Cumulative Capacity (MW)
$0.00
$50.00
$100.00
$150.00
$200.00
$250.00
$300.00
$350.00
$400.00
$450.00
0.00 500.00 1000.00 1500.00 2000.00 2500.00 3000.00 3500.00
Cumulative Capacity (MW)
Leve
lized
$/M
Wh
(200
9$)

37
6.2.4 Biomass The cost/performance data in the Crimp Biomass database was updated and calibrated against steam engine 2009 vendor quotes. It was assumed that biomass electrical generation plants would be used in combined heat and power applications where, in aggregate, 50% of the “waste” heat would be used to offset fossil-fuel heating, typically diesel fuel oil. The analysis did not include an independent assessment of biomass gasification technology.
Figure 24: Alaska Biomass Supply Curve
*MAFA Cost/Performance Update of Crimp Biomass Database

38
6.2.5 Geothermal The cost/performance data outlined in the April 2009 HDL memo to David Lockard, AEA was updated, illustrating the cost of geothermal developments in Alaska and added current estimates for fixed and variable operations and maintenance (O&M) costs. Within this analysis, the Chena Hot Springs project was estimated at $200/MWh (2009$) – roughly at the inflection point in the supply curve. As with prior supply curves, a few high-cost projects are included; these projects appear competitive with the basic remote diesel-fired alternative due to their remote location.
Figure 25: Supply Curve for Geothermal Energy in Alaska – Energy Costs including Connection to Local Alaska Markets
Supply Curve for Geothermal Energy in Alaska - Energy Costs Including Connection to Local Alaska Markets
$0.00
$100.00
$200.00
$300.00
$400.00
$500.00
$600.00
$700.00
0 50 100 150 200 250
Quantity Available, MW
Leve
lized
Cos
t of E
lect
rici
ty, $
/MW
h (2
009$
)
Mt. SpurrMakushin
Naknek
PAGE 39
7. Stranded Renewable Energy Resource Opportunities
7.1 Introduction
In addition to numerous undeveloped RE resource opportunities that are adjacent to existing communities, Alaska may have large RE resources that, by virtue of not being adjacent to a large, rich market opportunity or appearing to be unproven or expensive relative to fossil fuel alternatives, are not on the high profile list of commercial development opportunities of the renewable industry in the near term.
Nonetheless, these renewable resources hold significant promise for future energy developments to serve growing local markets along with local development of export industries. These large, currently “stranded” renewable resources present significant opportunities:
The next five years −
o As local innovations and learning-by-doing reduce costs and increase the competitive frontier of renewables (e.g., wind-diesel-dump load integrations, wind-Railbelt grid integrations, geothermal exploration and development).
o As roads and electrical transmission facilities are extended into areas with RE resources (e.g., wind-hydro-geothermal cluster around Mt. Spurr/Chakachamna).
The next 15 years as local research and commercial development continues to push the cost/performance frontier for renewables and renewable electricity/storage and renewable fuel technologies.
Alaska is well positioned to develop applied research in support of pushing the commercial frontiers to enable development of stranded renewables based on key research collaborations between national energy labs and State of Alaska and University of Alaska institutions. Two prominent collaborations include:
Alaska Center for Energy and Power/Sandia National Laboratories/National Renewable Energy Laboratory
Alaska Energy Authority/National Renewable Energy Laboratory
7.2 The Big Renewable Stranded Resources – Wind, Geothermal, Tidal, Hydro
7.2.1 Shoreline and Offshore Wind
Not unlike the offshore wind potential of the continental U.S., Alaska has tremendous offshore wind potential.32In the short term, shoreline and near-shore winds present opportunities for
32 See for example NREL high resolutions wind maps of Alaska available at: http://www.akenergyauthority.org/programwindmap.html which
indicate an abundance of class seven wind resources along the vast Alaska coastline.
40
wind power to displace expensive diesel fuel for commercial export (e.g., seafood) and local village power system. As innovation in diesel-wind-energy storage systems advances, additional wind power opportunities will become competitive. Some progress has been made on improving the cost/performance of energy storage systems. Additionally, wind-storage systems appear likely beneficiaries of research into batteries for electric cars.33
Potential wind resource opportunities may be unduly constrained by current practices which require individual project independent assessments of bird migration conflicts and local environmental and view-shed concerns. Systematic, regional bird migration and mitigation assessments may be a more efficient and effective way to help wind project development.
7.2.2 Geothermal
Alaska sits on the top of the Pacific Ring of Fire where the North Pacific Plate runs under Alaska, resulting in an extraordinary geothermal resource potential along the South-central/South-western volcano range and down along the Aleutian Chain.34
Due to relatively small local markets, 95% of geothermal projects under public review in Alaska are under 30 MW in size, while 86% are 10 MW and smaller.35
A few larger projects have recently received private sector attention. Ormat paid the State of Alaska $3.5 million for a subsurface lease to develop geothermal resources around Mt. Spurr near Anchorage. Ormat has estimated the Mt. Spurr project size at 100 MWe.36
In the short term, the geothermal potential in Alaska appears constrained by a very small number of experienced geothermal developers, lack of a proven utility-scale development and associated support services, and a subsurface resource lease regime on State of Alaska land that includes a 10% State of Alaska royalty on gross revenues derived from the geothermal resources.37 The potential geothermal resource opportunity may also be constrained by local environmental concerns.38
7.2.3 Tidal
Several of Alaska’s southern coastal regions (e.g., Cook Inlet, Southwest/Aleutians, and Southeast) contain world-scale tides with daily variation averaging 30 feet and approaching as much as 40 feet in the Cook Inlet.
The estimated costs to develop these large tidal resources remain highly uncertain; projected costs range from a yet-to-be-constructed 1-MW pilot project estimate of $6346/kW (EPRI,
33 See for example WHP Report on Energy Storage [Brian Yanity to provide cite] 34 See for example, http://geotherm.inel.gov/maps/ak.pdf 35 See Dilley, HDL, Memo to Lockard, AEA, April 2009. The 100MW Mt. Spurr geothermal project sponsored by Ormat is the exception to the tendency for Alaska geothermal projects to be small scale, even when they are slated to serve a fish processing energy demand. 36 Ormat applied for, but did not receive, any funding from the State of Alaska Renewable Energy Fund, for assistance with geothermal exploration around Mt. Spurr. 37 See the summary of the results of the State of Alaska Mt. Spurr Geothermal Lease Sale, http://www.dog.dnr.state.ak.us/oil/products/publications/geothermal/spurr/sale_docs/final_SaleResultsSummary.pdf 38 We note the presence in the historic public record of concerns by local indigenous populations on the Hawaiian Islands over geothermal development.

41
2006), an estimated commercial 50 MW development of $2200/kW (EPRI, 2006), to $1136/kW (Petroleum News, Little Susitna Construction Company, Turnagain Arm Project, 2009).
Ocean Renewable Power Co. has subsequently proposed installing a single tidal-power turbine-module pilot project in the Cook Inlet in 2010 to test the technology and commercial potential. The National Marine Fisheries Service (NMFS) sent a letter to the Federal Energy Regulatory Commission (FERC) questioning the adequacy of proposed environmental studies for the pilot project based on concerns with the Cook Inlet beluga whale, an endangered species, and salmon runs.39
Little Susitna Construction Company filed a preliminary permit application, dated July 28, 2009, with the FERC for the $2.5 billion Turnagain Arm Project – estimated at 2200 MW ($1136/kW) and a 54% capacity factor, which suggests a total cost on the order of $0.04/kWh.40
If these tidal power configurations achieve the commercial break-through purported in their preliminary permit applications with FERC and successfully navigate the permitting process, they may have the potential to be “game changing” renewable opportunities that substantially displace fossil fuels, position Alaska as a world leader in tidal power technology, provide extremely competitive electric rates for the northern Pacific Rim which could significantly enhance export industry opportunities, and encourage renewable market transformation in electrification of end-use energy demand and conversion from fossil fuel to renewable fuels for transportation. In the meantime, the development of these tidal projects appears to remain in the pre-commercial demonstration project phase.
The local office of NREL has been approached to facilitate a discussion among federal permitting agencies to explore the potential for streamlining the permit process for tidal energy projects in the Cook Inlet.
7.2.4 Large Hydroelectric Resources
7.2.4.1 Overview
At first blush, Alaska appears to have a tremendous amount of undeveloped hydroelectric potential. Some reports suggest Alaska may have as much as 45,000 MW of undeveloped hydropower potential.41
However, an analysis of the Idaho National Labs IHRED database (2003) suggests that a significant portion of the undeveloped hydroelectric potential is not likely to be accessible for a variety of reasons. See Figure 26.
39 See Petroleum News, 7 June 2009, http://www.petroleumnews.com/pnads/545706866.shtml 40 Assuming 20 years, 5% real discount rate on a reported capital cost of $2.5 billion, and all of estimated output is sold. Assume fixed O&M at $100/kW/yr. See http://www.petroleumnews.com/pnads/641916781.shtml for additional information. We note that Blue Energy Canada does not yet appear to have built a 1-MW pilot project to prove the concept at a moderate scale, let alone scale up to 2200 MW, so the cost/performance projections remain highly uncertain. 41 US DOE Wind and Hydropower U.S. Hydropower Potential Study (2003).
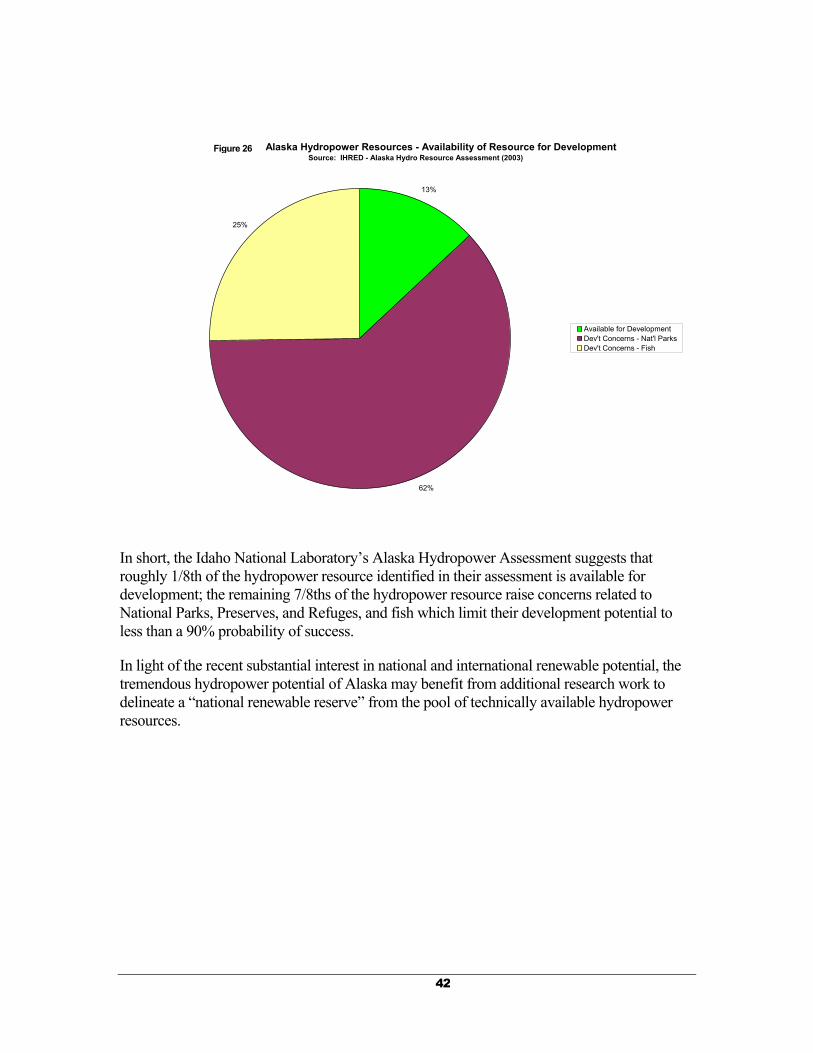
42
In short, the Idaho National Laboratory’s Alaska Hydropower Assessment suggests that roughly 1/8th of the hydropower resource identified in their assessment is available for development; the remaining 7/8ths of the hydropower resource raise concerns related to National Parks, Preserves, and Refuges, and fish which limit their development potential to less than a 90% probability of success.
In light of the recent substantial interest in national and international renewable potential, the tremendous hydropower potential of Alaska may benefit from additional research work to delineate a “national renewable reserve” from the pool of technically available hydropower resources.
Figure xx: Alaska Hydropower Resources - Availability of Resource for DevelopmentSource: IHRED - Alaska Hydro Resource Assessment (2003)
13%
62%
25%
Available for DevelopmentDev't Concerns - Nat'l ParksDev't Concerns - Fish
Figure 26

43
Figure 27: Probability of Development of Alaska Hydropower Resources
7.2.4.2 Potential Measures to Improve the Prospects for Hydropower Development
Research into local fisheries, wildlife habitats, and local indigenous uses could help reduce the uncertainties associated with hydroelectric development by identifying low impact hydroelectric opportunities; this in turn could reduce development timelines and permit uncertainty.42
Research on effective techniques for engaging local indigenous populations and addressing local, regional, national, and international environmental and habitat concerns could be shared in international forum for renewable resource advocates. This would allow advocates to share “lessons learned” on working with local populations to solve the practical challenges associated with renewable development in developing countries. Prominent Alaskan examples of local engagement with indigenous populations in the development of RE include the Yukon River Inter-tribal Watershed Council (YRITWC) – the first ever U.S. application of hydrokinetic turbines in addition to installations of wind turbines, solar, and energy efficiency measures in Ruby, Alaska.
42 A similar effort is underway in wind. The Alaska Energy Authority and the U.S. Fish and Wildlife Service have been working to delineate those regions with minimal potential conflict between bird migration and wind turbines. Email with Martina Dabo, Alaska Energy Authority, Wind Program Director.
Probability of Development of Alaska Hydro ResourcesSource: IHRED Alaska Hydro Resource Database (2003)
296
355
1,792
533
438
0
500
1,000
1,500
2,000
2,500
3,000
3,500
4,000
1
MW
90% Dev't Probability75% Dev't Probability50% Dev't Probability25% Dev't Probability10% Dev't Probability
72% of MW = 50% or lessprobability of development

44
One way to distill practical learning in the Alaska renewables development arena is to provide experienced indigenous culture business-development resources for local entrepreneurs to compile lessons learned into practical models for export to developing countries.
7.2.5 Potential Break-Through Technologies to Unlock Alaska’s Vast Renewable Resources that Appear “Stranded” Today
7.2.5.1 Electric Vehicles43
Hybrid electric vehicles (HEVs) combine the benefits of high fuel economy and low emissions with the power, range, and convenience of conventional diesel and gasoline fueling. HEV technologies also have potential to be combined with alternative fuels and fuel cells to provide additional benefits. Future offerings might also include plug-in hybrid electric vehicles (PHEVs).
The EIA Annual Energy Outlook 2009 forecast includes:
Concerns about oil supply, fuel prices, and emissions have driven the market penetration of unconventional vehicles (vehicles that can use alternative fuels, electric motors and advanced electricity storage, advanced
engine controls, or other new technologies). Unconventional vehicle technologies are expected to play a greater role in meeting the new NHTSA CAFE standards for LDVs (light-duty vehicles). Unconventional
vehicles account for 63 percent of total new LDV sales in 2030 in the AEO2009 reference case.
Hybrid vehicles (including both standard hybrids and PHEVs) represent the largest share of the unconventional LDV market in 2030 (see figure below), at 63 percent of all new unconventional LDV sales and 40 percent of all new LDV sales. Micro hybrids, which allow the vehicle’s gasoline engine to turn off by switching to battery power when the vehicle is idling, have the second-largest share, at 25 percent of unconventional LDV sales. Turbo diesel direct-injection engines, which can improve fuel economy significantly, capture a 16-percent share of unconventional LDV sales. The availability of ultra-low-sulfur diesel and biodiesel fuels, along with advances in emission control technologies that reduce criteria pollutants, supports the increase in diesel LDV sales.
Currently, manufacturers receive incentives for selling FFVs (flex-fuel vehicles) through fuel economy credits that count toward CAFE compliance. Although those credits are assumed to be phased out by 2020, FFVs make up 13 percent of all new LDV sales in 2030 in the reference case, in part because of the increased availability and lower cost of E85.
43 See for example, http://www.nrel.gov/vehiclesandfuels/hev/ and for the latest news, and also see electric vehicle world at http://www.evworld.com/index.cfm.

45
Alaska Hybrid and Electric Vehicle Challenges While the opportunity for hybrid and electric vehicles remains promising at the international and national level, the remote nature and extreme climate of Alaska may present some challenges for the development of cost effective hybrids. Battery performance typically degrades during cold weather and can effectively preclude reliable performance of conventional automobiles during the extreme winter conditions of the Interior and Northern regions where winter temperatures are frequently below –20°F and often reach –40°F.
Additional applied research into battery technologies under the extreme climactic conditions of Alaska’s winters may enable broader deployment of hybrid and electric vehicles to regions with cold temperature extremes, including mountainous regions of the world, as well as the far North and far South.
7.2.5.2 Wind Hydrogen.44
The development of commercial technology that links renewable power (e.g., wind turbines) to electrolyzers would serve as a technical breakthrough that could expand the addressable market for renewable electricity. Hydrogen could then be stored for later use to generate electricity from an internal combustion engine or a fuel cell – a configuration that may be of particular interest to isolated off-grid systems like those in Alaska and the developing world. The goal of this technology would be to improve hydrogen production efficiency from renewable resources to compete with traditional energy sources such as coal, oil, and natural gas.45 In the future, as the price of fossil fuels rise and the price of hydrogen production from renewable power falls, there is a potential for wind-hydrogen to provide local hydrogen fuel that is competitive with gasoline and diesel used for transportation.
44 See a system study in Alaska, Colt and Gilbert, “Economic Analysis of an Integrated Wind-Hydrogen Energy System for a Small Alaska Community,” Final Technical Report, DOE, December 2008. 45 For more details, see the NREL Wind-Hydrogen Demonstration project at http://www.nrel.gov/hydrogen/proj_wind_hydrogen.html.
Figure __: EIA AEO 09: Sales of Unconventional Light-Duty Vehicles by Fuel Type, 2030
0
2,000
4,000
6,000
8,000
10,000
12,000
14,000
Total Electrichybrid
Micros Flex-fuel Diesel Other
Thou
sand
Veh
icle
s So
ld P
er Y
ear
28

46
7.2.5.3 Ammonia Fuels.46
Another potential renewable fuel on the horizon is ammonia. The Iowa Energy Center in Iowa State University has been researching the viability of NH3 as “the other hydrogenTM” in light of its potential benefits:47
Ammonia is widely produced and distributed today for fertilizer around the world; the technology and incremental cost of storage and delivery systems is modest.
The cost of ammonia has been competitive with gasoline on a dollar-per-MMBtu basis for several years. While the price of ammonia peaked more sharply during the natural gas price run-in in the 2004-2008 period, the cost of NH3 for fertilizer and NH3 for fuel may both decrease if they are produced as a joint product because of improvements in capital infrastructure utilization.
The incremental cost to convert diesel and spark-ignition engines to run on ammonia is purported to be modest.
Direct ammonia fuel cells are under development at Natural Resources Canada and at Howard University.
The Hydrogen Engine Center (HEC) and the NH3 car have both produced spark ignition engines that have demonstrated the use of ammonia fuel for hundreds of hours.
46 See for example, http://www.ammoniafuelnetwork.org/projects.html and the associated research published by the Iowa State University, Iowa Energy Center. 47 See Olson and Holbrook, “NH3−The Other HydrogrenTM”, March 30, 2009, for a summary of key considerations.

PAGE 47
8. Market Evolution and Transformation
8.1 Alaska Market Evolution Opportunity
Alaska is in the process of investing $125 million in RE projects and $360 million in end-use efficiency/conservation programs, or roughly $524 per capita, from 2008/2009 legislative appropriations – placing it in the forefront of U.S. efforts to finance RE projects and help develop RE enterprises, including wind, geothermal, biomass, and hydropower.
The Regulatory Commission of Alaska, the state utility regulator, is examining how to enhance energy efficiency, conservation, peak demand shaving, and RE opportunities.
The Alaska Energy Authority (AEA) is developing an energy plan that features consideration of demand side and RE opportunities.
The public and private sector and associated enterprises are working together across the state to increase the availability of reliable, cost-effective energy efficiency and renewable energy.
If these collective efforts continue, a sharp focus on key market transformation issues may include:
Pricing energy resources to reflect their full incremental cost, especially at peak;
Development of subject matter expertise in management, marketing, technology and integration of energy efficiency/renewable energy, especially robust rural-scale wind, geothermal, biomass, and hydropower that can be exported;
Wide dissemination of technical, managerial, and marketing lessons learned −
o Alaska is well positioned to take a leadership role in the rapid development of EE/RE opportunities for developing markets around the world.
8.2 Package Alaska Market Transformation Expertise for Export
As a leading trade state with significant public and private sector support for export enterprises, Alaska is well positioned to support national goals of developing a vigorous RE export industry.
8.3 Alaska/NREL International Developing Country Energy Ambassador
Opportunities
Forty years ago, most of rural Alaska was without reliable electricity, frequently relying on kerosene lamps or a few small household-scale gasoline generators that were used to generate light for a few hours a day. Watering points were still being installed and most villages used “honey buckets” for waste. Over the past forty years, rural Alaska has been in transition −

48
building schools and clinics, village-scale power plants, piped water and sewer systems, and modern mobile and Internet telecommunications systems. Much has been accomplished, yet much remains to be done. A tremendous number of rural development lessons have become part of the fabric of successful rural enterprises – including rural utilities and health care facilities. International development agencies have sought the expertise of Alaskan subject matter experts in rural development.
As energy prices have risen dramatically over the past few years, the private sector, State of Alaska, and the federal government have increasingly invested in RE technology and enterprise development. As the State of Alaska’s RE fund is being leveraged to develop over $1 billion in new wind, biomass, geothermal, and hydropower resources, new innovative enterprises are working to address the needs of many remote rural communities attempting to move from fossil fuels toward a low carbon future.
If the United States is to move forward on the promise of becoming “the world’s leading exporter of renewable energy” to the vast developing world that is poised for continued growth, it may find Alaska presents a unique investment opportunity.
8.4 Recommendations to Enable Further Development and Export of Alaska EE/RE Knowledge
Market Transformation −
Assist efforts to eliminate fossil fuel subsidies48 and ensure that any remaining life-line subsidies for energy and electricity are “technology neutral” and apply to both energy efficiency and renewable technologies;
Explore opportunities, e.g., build, own, transfer, build, own, operate, to leverage private-sector federal tax credits for RE into Alaska market dominated by municipal, cooperative, and village non-profit utilities;
Facilitate exploration of combined heat and power opportunities by encouraging appropriate pricing of fossil fuels, especially at peak demand.
Permit Streamlining −
Facilitate state and federal agency exploration of ways to streamline the permitting of renewable energy resources.
Monitoring and Evaluation −
Develop program monitoring and evaluation capacity, especially with respect to the current slate of projects being funded by the State Renewable Energy Fund and federal stimulus funds, to identify most promising EE/RE technologies and business models for further development.
48 See for example, Financial Times, “An idea whose time has come” (24 Sept 09), “As addictions go, the world’s addiction to fossil fuels is a killer. President Obama has a big idea on how to help the world kick the habit: the elimination of fossil fuel subsidies globally.”

49
Marketing and Education −
Support local technology collaborations, including EE/RE conferences;
Support the development of national and international collaborations, especially among indigenous peoples.
Technology Development and Deployment −
Facilitate exploration of combined heat and power opportunities, e.g., wind-dump loads to heat bricks and other storage media;
Facilitate exploration of new emerging renewable and enabling technologies (e.g., batteries, ammonia fuels, in extreme climatic conditions);
Identify and support the most promising demonstration projects in emerging renewables, including tidal and hydrokinetic technologies.
Workforce Development −
Provide support for efforts to attract and retain local expertise in the development of RE and RE enterprises.

PAGE 50
References
Alaska Energy Authority Hydroelectric Project Study Database, 2007.
Black and Veatch, Alaska Energy Authority Railbelt Integrated Resource Plan, Advisory Committee Presentation, 26 August, 2009.
California Energy Commission, “Distributed Generation and Cogeneration Policy Roadmap for California”, March 2007.
Charles River Associates, “Impact on the Economy of the American Clean Energy and Security Act of 2009 (HR 2454)”, May 2009.
Colt, Gilbert, Economic Analysis of an Integrated Wind-Hydrogen Energy System for a Small Alaska Community, Final Technical Report, DOE, December 2008.
Colt, Crimp, Foster, Renewable Report
DOE, Wind Resource Potential, Continental U.S. (2008).
DOE, Energy Efficiency and Renewable Energy, Hydropower: Setting a Course for Our Energy Future (2003).
Devine, Mia, Analysis of Loads and Wind Energy Potential in Rural Alaska, Alaska Energy Authority, 2004.
Dzioubinski and Chipman, Trends in Consumption and Production: Household Energy Consumption, United Nations Division for Sustainable Development, Department of Economic and Social Affairs, Discussion Paper No. 6, April 1999.
Easterly, William, The White Man's Burden: Why the West's Efforts to Aid the Rest Have Done So Much Ill and So Little Good (Penguin, 2006).
EIA Annual Energy Outlook 2009, Low, Reference and High Energy Price Forecast
EIA Annual Energy Outlook 2009, Assumptions
EIA Annual Energy Outlook 2009, Appendix, IHRED Hydroelectric Resource database (2003), Alaska.
EIA Electric Power Annual, 2007, Table A3: Carbon Dioxide Uncontrolled Emission Factors.
EIA Historic Energy Consumption, Tables 7-12, Alaska, 1960-2006.
EIA, Energy Market and Economic Impacts of HR 2454, the American Clean Energy and Security Act of 2009, SR/OIAF/2009-05, (August 2009).
EIA Energy Price Data Series, Downloads from August 2009: Regular Gasoline, Distillate Fuel Oil, Natural Gas (wellhead, city gate, residential).

51
EPA, eGRID emissions database, Alaska, 2007.
EPRI, Hydropower Life Extension Modernization Guide, 2001.
EPRI, Environmental Assessment of Plug-In Hybrids, July 2007.
EPRI, The Potential To Reduce CO2 Emissions by Expanding End-Use Applications of Electricity, March 2009.
EPRI, Assessment of Achievable Potential from Energy Efficiency and Demand Response Programs in the U.S., January 2009.
EPRI, System Level Design Performance Cost and Economic Assessment – Knik Arm Alaska Tidal In-Stream Power Plant, June 2006.
FERC National DR Potential Assessment, Alaska, 2009.
Heltbert, Household Fuel and Energy Use in Developing Countries – A Multi-country Study, Oil and Gas Policy Division, World Bank, May 2003.
HDL, Memo from Ms. Dilley to Mr. Lockard, Alaska Energy Authority, Alaska Geothermal Cost Estimates, April 2009.
HR 2454, “American Clean Energy and Security Act of 2009.”
IEA World Energy Outlook 2008, Electrical Energy Information 2009.
Idaho National Lab, http://hydropower.inel.gov/resourceassessment/index.shtml.
Joint Drilling Survey 2007.
MAFA, Alaska Household Carbon Calculator, 2007.
McKinsey Quarterly, Enkvist, et al., “A Cost Curve for Greenhouse Gas Reduction”, pps. 35-45; 2007, Volume 1.
NREL, Denholm and Short, “An Evaluation of Utility System Impacts and Benefits of Optimally Dispatched Plug-In Hybrid Vehicles,” October 2006.
NREL, Short and Denholm, “A Preliminary Assessment of Plug-In Hybrid Electric Vehicles on Wind Energy Markets,” April 2006.
Renewable Energy Alaska Project/Alaska Energy Authority, Renewable Energy Atlas
Stern, Nicholas, The Global Deal: Climate Change and the Creation of a New Era of Progress and Prosperity (Public Affairs/Perseus Books Group, NY, 2009).
Stiglitz, Joseph, Making Globalization Work (WW Norton, 2007).