Renewable Energies versus Nuclear Power – Comparing...
115
Renewable Energies versus Nuclear Power – Comparing Financial Support
Transcript of Renewable Energies versus Nuclear Power – Comparing...

Renewable Energies versus Nuclear Power – Comparing Financial Support

Renewable Energies versus Nuclear Power – Comparing Financial Support
Imprint
Authors
Austrian Institute of Ecology
Maga. Gabriele Mraz, MA
Maga. Andrea Wallner (concept)
e-think
DI Dr. Gustav Resch
DI Dr. Demet Suna
Translation
Maga. Patricia Lorenz
Study commissioned by
Wiener Umweltanwaltschaft / Vienna Ombuds-Office for Environmental Protection
Download
http://www.ecology.at/wua_erneuerbarevskernenergie.htm
Vienna, November 2014

Renewable Energies versus Nuclear Power – Comparing Financial Support
Foreword
Discussion about nuclear energy has changed a lot during the last decade. In the last century the focus
was mainly concentrated on safety issues. With the dawning of the renewable energies the focus in
the whole energy sector shifted to costs. Today the cost structure of renewable energies is well
understood and known. As predicted for emerging technologies costs are decreasing with the time.
The real costs of nuclear energy as well as for fossil electricity production are not well known as these
technologies stem from a time when states made decisions not mainly driven by economical reasoning.
First new building projects in the nuclear sector in Europe after the liberalisation of the electricity
market give a first impression of the real costs of new nuclear. What started with the calculation of the
external costs of a running nuclear plant can now be amended with the costs for new power reactors.
This paper is simply about the question “How much electricity can we get out of different energy
sources on the current market for a given sum of money?”
The Vienna Ombuds-Office for Environmental Protection hopes to provide with this paper a strong
basis for the discussion of the future of nuclear power. The paper is aimed to close a gap in our
knowledge to make a well based decision. This paper is to be seen in a series of papers financed by the
Vienna Ombuds-Office for Environmental Protection dealing with environmental as well as with
economical questions in the field of nuclear power generation.
Andrea Schnattinger, Ph.D.
Head of the Ombuds-Office for Environmental Protection

Renewable Energies versus Nuclear Power – Comparing Financial Support
Content
SUMMARY .................................................................................................................................... I
ZUSAMMENFASSUNG ................................................................................................................... V
1 INTRODUCTION ..................................................................................................................... 1
2 RENEWABLES VERSUS NUCLEAR POWER IN EUROPE: STATUS QUO AND OUTLOOK ................. 2
2.1 NUCLEAR POWER .......................................................................................................................... 2
2.1.1 Nuclear power support scheme for Hinkley Point C, UK .................................................... 6
2.2 RENEWABLES ................................................................................................................................ 8
3 METHODS ............................................................................................................................ 11
3.1 STATIC APPROACH: COMPARISON OF PLANNED SUPPORT FOR NUCLEAR WITH EXISTING RE SUPPORT ......... 11
3.2 DYNAMIC APPROACH: COMPARISON OF PLANNED SUPPORT FOR NUCLEAR WITH FUTURE RE SUPPORT
ACCORDING TO A MODEL-BASED ANALYSIS (GREEN-X) .................................................................................. 12
4 COUNTRY SPECIFIC ANALYSIS ............................................................................................... 16
4.1 UNITED KINGDOM ....................................................................................................................... 17
4.1.1 Status Quo: Role of Nuclear Power and RE in the energy mix ......................................... 17
4.1.2 Outlook: Role of Nuclear Power and RE in the energy mix .............................................. 18
4.1.3 Existing support schemes for RE ...................................................................................... 20
4.1.4 Future requirements concerning support schemes for RE ............................................... 22
4.1.5 Comparison on costs and quantities of nuclear power vs. RE ......................................... 23
4.2 GERMANY .................................................................................................................................. 29
4.2.1 Status Quo: Role of Nuclear Power and RE in the energy mix ......................................... 29
4.2.2 Outlook: Role of Nuclear Power and RE in the energy mix .............................................. 30
4.2.3 Existing support schemes for RE ...................................................................................... 32
4.2.4 Future requirements concerning support schemes for RE ............................................... 33
4.2.5 Comparison on costs and quantities of nuclear energy vs. RE ........................................ 34
4.3 FRANCE ..................................................................................................................................... 40
4.3.1 Status Quo: Role of Nuclear Power and RE in the energy mix ......................................... 40
4.3.2 Outlook: Role of Nuclear Power and RE in the energy mix .............................................. 40
4.3.3 Existing support schemes for RE ...................................................................................... 42
4.3.4 Future requirements concerning support schemes for RE ............................................... 43
4.3.5 Comparison on costs and quantities of nuclear energy vs. RE ........................................ 45
4.4 POLAND ..................................................................................................................................... 51
4.4.1 Status Quo: Role of Nuclear Power and RE in the energy mix ......................................... 51
4.4.2 Outlook: Role of Nuclear Power and RE in the energy mix .............................................. 51
4.4.3 Existing support schemes for RE ...................................................................................... 53
4.4.4 Future requirements concerning support schemes of RE ................................................ 55
4.4.5 Comparison on costs and quantities of nuclear energy vs. RE ........................................ 56
4.5 CZECH REPUBLIC ......................................................................................................................... 61
4.5.1 Status Quo: Role of Nuclear Power and RE in the energy mix ......................................... 61
4.5.2 Outlook: Role of Nuclear Power and RE in the energy mix .............................................. 62
4.5.3 Existing support schemes for RE ...................................................................................... 64
4.5.4 Future requirements concerning support schemes of RE ................................................ 65
4.5.5 Comparison on costs and quantities of nuclear energy vs. RE ........................................ 66

Renewable Energies versus Nuclear Power – Comparing Financial Support
5 COMPARISON AT A EUROPEAN LEVEL .................................................................................. 72
5.1 STATUS QUO: ROLE OF NUCLEAR POWER AND RE IN THE ENERGY MIX ................................................. 72
5.2 OUTLOOK: ROLE OF NUCLEAR POWER AND RE IN THE ENERGY MIX...................................................... 72
5.2.1 Comparison on costs and quantities of nuclear energy vs. RE ........................................ 74
5.3 CROSS-COUNTRY COMPARISON: SUMMARY OF KEY RESULTS ............................................................... 77
6 MAIN CONCLUSIONS ........................................................................................................... 82
7 DIRECTORIES ....................................................................................................................... 85
7.1 ABBREVIATIONS .......................................................................................................................... 85
7.2 LIST OF FIGURES .......................................................................................................................... 86
7.3 LIST OF TABLES ............................................................................................................................ 91
7.4 REFERENCES ............................................................................................................................... 92
8 ANNEX A – BACKGROUND INFORMATION ON THE MODEL-BASED ASSESSMENT OF FUTURE RE
DEPLOYMENT IN EU MEMBER STATE .......................................................................................... 95
8.1 GREEN-X MODEL ........................................................................................................................ 95
8.2 KEY ASSUMPTIONS / BACKGROUND DATA ........................................................................................ 96


Renewable Energies versus Nuclear Power – Comparing Financial Support
i
Summary
The European Union is divided on the issue of electricity production. While there is consensus that
generation technologies need to be low on greenhouse gas- emissions, the question of whether to use
renewables or nuclear to meet this power demand is highly controversial. Both options still require
financial support and this is not going to change in the near future. This raises the question of where
our money should be invested in order to achieve greater economic efficiency: into support for
renewable energies (RE) or support for nuclear power plants?
This paper sets out to answer this question. The detailed model-based prospective scenario
assessment performed in this study provides the basis for estimating future cost developments. After
discussing the existing support schemes for renewables, the paper compares these with a nuclear
model. The recent state aid case for the construction of the nuclear power plant Hinkley Point in United
Kingdom serves as the model for the nuclear option.
New milestone in nuclear state aid: Hinkley Point
It is planned to construct two additional reactors at Hinkley Point. The EU estimates the total capital
needed for construction at € 43 billion. The UK government intends to grant state aid for this project;
in accordance with EU state aid rules, the suggested state aid scheme was submitted to the EU
Commission for approval as public funds would be used for a company. A central part of the state aid
scheme is the Contract for Difference which runs for 35 years. According to this contract, the state
commits to compensating any difference between the electricity market price (reference price) and
the negotiated Strike Price. Consequently, the plant operator, NNB Generation Company Limited
(NNBG), has received a long term price guarantee which, in principle, is analogous to the feed-in tariffs
commonly used to support renewable energies. The Strike Price for the first unit to be constructed has
been set at € 108 per MWh (with each subsequent unit receiving € 104 per MWh), plus an index
adjustment. Calculated over 35 years, the duration of the Contract for Difference, this adds up to a
Strike Price in 2058 of approximately € 329 per MWh (in nominal terms). On top of this, NNBG will be
granted a state loan guarantee for all loans the company takes out on the financial markets to
construct the nuclear power plant.
After revising the state aid scheme, this contract was declared compatible with EU regulations and
approved in October 2014. This decision is highly controversial within the EU. It led Austria to announce
that nuclear power should be excluded from state subsidies.
EU support for renewable energies
While building nuclear power plants is increasingly facing problems with public acceptance,
construction cost overruns and the non-existence of final repositories, over the past years renewable
energies have been gaining ground. National policies for supporting renewables have been established
in accordance with relevant regulations at EU level, such as the directive 2009/28/EC.
Analogous to the planned support for nuclear power in UK, renewable energies usually receive support
through feed-in tariffs1. Quota systems with tradable green certificates are also common.
1 Guaranteed remuneration (or tariff) for electricity fed into the public grid; usually the rate of remuneration does not correspond with the
electricity market price.

Renewable Energies versus Nuclear Power – Comparing Financial Support
ii
Comparing costs of renewable and nuclear power generation
Method
Renewable energies were compared with the nuclear option by looking at the quantities of power they
can both generate and the level of financial support this requires. This mirrors the extra costs which
must be borne by the end consumer or society. Five different renewable technologies were analysed:
biomass, onshore and offshore wind, small-scale hydropower plants and photovoltaics.
The static approach compares the current (as of2013) level of incentives for renewables with the state
support mechanism for Hinkley Point. The dynamic approach, in contrast, also considers additional
factors including future cost reductions achieved through increasing technological experience and
aspects of market integration of variable renewables like solar and wind power. The dynamic approach
has been calculated up to 2050; the nuclear option is added from 2023 onwards (planned start-up for
Hinkley Point C). The dynamic calculation applies a detailed model-based analysis using the Green-X-
model (www.green-x.at). This model takes into account a multitude of factors including costs,
potentials, regulatory frameworks, diffusion constraints like non-cost barriers, electricity prices and
energy demand, all of which have a strong impact on the economics of power generation.
Results
The static and dynamic calculations were conducted for five different EU Member states (United
Kingdom, Poland, Germany, France and the Czech Republic) and the EU 28 overall. The countries were
selected to reflect different starting points with regards to the current and potential use of nuclear
power and renewable energies. First we provide an overview of the current status and foreseeable
development of renewables and nuclear power in each country.
The static approach showed that, in the five countries examined, under the same budgetary
conditions it is almost always possible to generate more electricity from renewable sources than
from nuclear power.
Currently, among the assessed technologies small hydropower plants and onshore wind are the least
expensive methods of generating electricity. With the help of public support (as the Polish example
illustrates), the co-firing of biomass in fossil-fuel fired power plants is another method of generating
electricity cost-effectively. Electricity production in offshore wind farms and photovoltaics, however,
are the least economic options under current circumstances within the assessed countries (as of 2013).
Potential savings achieved by generating a set quantity of electricity from renewables rather than
nuclear power range from 2% (Great Britain) to 63% (France) for onshore wind parks, and from 31%
(Poland) to 51% (France) for small hydro power plants.
The dynamic approach dares to take a broader look into the future. It calculates, amongst others, the
future cost of generating electricity (€ per MWh) and the extra costs (i.e. support expenditures) which
society and the end consumers must bear. Figure 1 illustrates the expected market value of the
electricity supplied (broken line) and the remuneration required for renewables and for nuclear power
(solid line) at EU level. The resulting differences are the costs which must be borne by the public.
The remuneration needed for renewables is less than for nuclear power. The expected market value
of electricity generated by nuclear power is, however, greater than that of renewables, and this
difference will continue to increase through to 2050.
While the UK’s feed-in tariff for nuclear power is planned to remain constant, the deviation from the
electricity market price will continuously decrease because the market price for electricity can be
expected to rise; this also causes the originally high burden on the public to shrink over the decades.

Renewable Energies versus Nuclear Power – Comparing Financial Support
iii
For renewable energies, the average remuneration level first decreases strongly and later less so. The
gap between market value and required remuneration will continue to decrease; the remaining
difference will be mainly caused by offshore wind. Two conflicting trends have an impact on the
necessary support for renewables. On the one hand, costs will fall due to technological learning (e.g.
the falling costs of photovoltaics in Germany and worldwide), and on the other, the greater
deployment of renewables leads to a decrease in their market value.
This is especially the case for wind energy and solar electricity, sources in which production is
determined by natural supply and therefore cannot react flexibly to decreasing demand. Furthermore,
the share of necessary financial support depends upon the particular characteristics of each country
and technology.
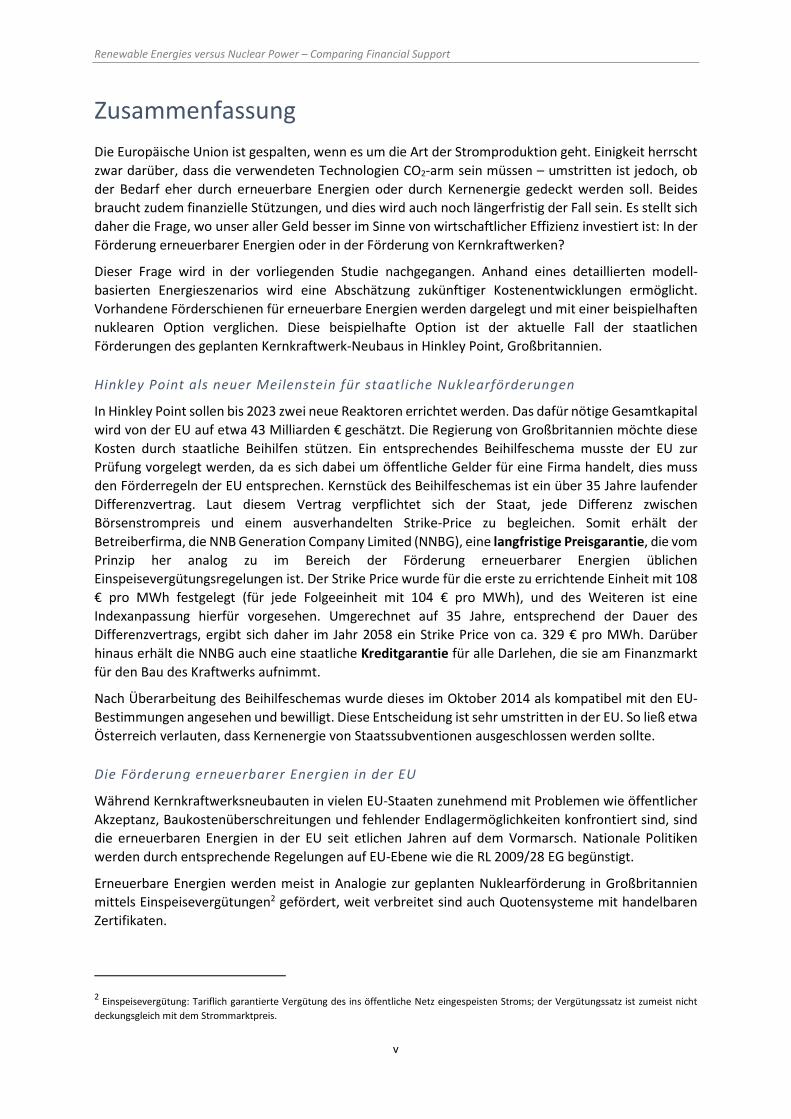
Figure Summary 1: Future development of remuneration levels and corresponding market values of
the assessed RE technologies (as aggregate) and of nuclear power across assessed
countries and at EU28 level according to the Green-X scenario of dedicated RE support
(Source: Own assessment (Green-X))
The next step was to estimate the average costs which will arise for electricity consumers for the period
2023 to 2050. Figure Summary 2 shows the results.
For each of the countries analysed and for the EU as a whole (EU28), generating electricity using
nuclear power requires more public support than renewables. The level of support required varies
and mainly depends on the future electricity price; the future UK electricity price is predicted to be
especially high.
Or expressed differently, as shown by Figure Summary 3, the analysed countries and the EU-28 could
achieve the following % cost reductions through the increased use of renewables compared to nuclear
power.

Renewable Energies versus Nuclear Power – Comparing Financial Support
iv
Figure Summary 2: Comparison of overall cost-effectiveness: Specific net support for assessed RE
technologies and nuclear power by assessed countries and at EU28 level according to the
Green-X scenario of dedicated RE support (Source: Own assessment (Green-X))
Figure Summary 3 Comparison of overall cost-effectiveness: Cost savings due to RE compared to nuclear
power by assessed country and at EU28 level according to the Green-X scenario of
dedicated RE support (Source: Own assessment (Green-X))
Conclusions
Generating electricity from a variety of renewable sources is more economical than using nuclear
power; this is clearly shown by the model-based assessment of future developments up to 2050.
Across the EU end consumers can save up to 37% on their electricity costs – in some Member States
even up to 74% – when plans to build nuclear power plants are shelved in favour of renewables. In
order to achieve these goals it is vital that we act quickly, but with care, to create the infrastructure
and regulatory framework this requires, or to adapt that which already exists.
15.3 15.3
16.7 16.7 17.1 17.1
14.0
9.3
12.5
4.3
8.3
10.8
0
2
4
6
8
10
12
14
16
18
United Kingdom Germany France Poland Czech Republic EU28
€/M
Wh
Specific net support for Nuclear (Hinkley Point C) Specific net support for selected RES-E
-8.4%
-39.1%
-24.8%
-74.5%
-51.6%
-37.1%
-80%
-70%
-60%
-50%
-40%
-30%
-20%
-10%
0%
UnitedKingdom Germany France Poland
CzechRepublic EU28
% -
cost
sa
vin
gs
com
pa
red
to
nu
cle
ar
po
we
r
Cost savings due to RE
Renewable Energies versus Nuclear Power – Comparing Financial Support
v
Zusammenfassung
Die Europäische Union ist gespalten, wenn es um die Art der Stromproduktion geht. Einigkeit herrscht
zwar darüber, dass die verwendeten Technologien CO2-arm sein müssen – umstritten ist jedoch, ob
der Bedarf eher durch erneuerbare Energien oder durch Kernenergie gedeckt werden soll. Beides
braucht zudem finanzielle Stützungen, und dies wird auch noch längerfristig der Fall sein. Es stellt sich
daher die Frage, wo unser aller Geld besser im Sinne von wirtschaftlicher Effizienz investiert ist: In der
Förderung erneuerbarer Energien oder in der Förderung von Kernkraftwerken?
Dieser Frage wird in der vorliegenden Studie nachgegangen. Anhand eines detaillierten modell-
basierten Energieszenarios wird eine Abschätzung zukünftiger Kostenentwicklungen ermöglicht.
Vorhandene Förderschienen für erneuerbare Energien werden dargelegt und mit einer beispielhaften
nuklearen Option verglichen. Diese beispielhafte Option ist der aktuelle Fall der staatlichen
Förderungen des geplanten Kernkraftwerk-Neubaus in Hinkley Point, Großbritannien.
Hinkley Point als neuer Meilenstein für staatliche Nuklearförderungen
In Hinkley Point sollen bis 2023 zwei neue Reaktoren errichtet werden. Das dafür nötige Gesamtkapital
wird von der EU auf etwa 43 Milliarden € geschätzt. Die Regierung von Großbritannien möchte diese
Kosten durch staatliche Beihilfen stützen. Ein entsprechendes Beihilfeschema musste der EU zur
Prüfung vorgelegt werden, da es sich dabei um öffentliche Gelder für eine Firma handelt, dies muss
den Förderregeln der EU entsprechen. Kernstück des Beihilfeschemas ist ein über 35 Jahre laufender
Differenzvertrag. Laut diesem Vertrag verpflichtet sich der Staat, jede Differenz zwischen
Börsenstrompreis und einem ausverhandelten Strike-Price zu begleichen. Somit erhält der
Betreiberfirma, die NNB Generation Company Limited (NNBG), eine langfristige Preisgarantie, die vom
Prinzip her analog zu im Bereich der Förderung erneuerbarer Energien üblichen
Einspeisevergütungsregelungen ist. Der Strike Price wurde für die erste zu errichtende Einheit mit 108
€ pro MWh festgelegt (für jede Folgeeinheit mit 104 € pro MWh), und des Weiteren ist eine
Indexanpassung hierfür vorgesehen. Umgerechnet auf 35 Jahre, entsprechend der Dauer des
Differenzvertrags, ergibt sich daher im Jahr 2058 ein Strike Price von ca. 329 € pro MWh. Darüber
hinaus erhält die NNBG auch eine staatliche Kreditgarantie für alle Darlehen, die sie am Finanzmarkt
für den Bau des Kraftwerks aufnimmt.
Nach Überarbeitung des Beihilfeschemas wurde dieses im Oktober 2014 als kompatibel mit den EU-
Bestimmungen angesehen und bewilligt. Diese Entscheidung ist sehr umstritten in der EU. So ließ etwa
Österreich verlauten, dass Kernenergie von Staatssubventionen ausgeschlossen werden sollte.
Die Förderung erneuerbarer Energien in der EU
Während Kernkraftwerksneubauten in vielen EU-Staaten zunehmend mit Problemen wie öffentlicher
Akzeptanz, Baukostenüberschreitungen und fehlender Endlagermöglichkeiten konfrontiert sind, sind
die erneuerbaren Energien in der EU seit etlichen Jahren auf dem Vormarsch. Nationale Politiken
werden durch entsprechende Regelungen auf EU-Ebene wie die RL 2009/28 EG begünstigt.
Erneuerbare Energien werden meist in Analogie zur geplanten Nuklearförderung in Großbritannien
mittels Einspeisevergütungen2 gefördert, weit verbreitet sind auch Quotensysteme mit handelbaren
Zertifikaten.
2 Einspeisevergütung: Tariflich garantierte Vergütung des ins öffentliche Netz eingespeisten Stroms; der Vergütungssatz ist zumeist nicht
deckungsgleich mit dem Strommarktpreis.

Renewable Energies versus Nuclear Power – Comparing Financial Support
vi
Kostenvergleich Erneuerbare versus nukleare Option
Methode
Der Vergleich von erneuerbaren Energien und der nuklearen Option erfolgt über die Menge an
erzeugbarem Strom und der hierfür aufzuwendenden Förderbeträge, die aus gesellschaftlicher Sicht
bzw. Sicht der EndkundInnen die Mehrkosten widerspiegeln. Untersucht werden fünf verschiedene
erneuerbare Technologien, und zwar Biomasse, Windenergie am Festland und Offshore, kleine
Wasserkraftwerke und Photovoltaik.
In einem statischen Ansatz werden die heutigen (Stand 2013) Förderanreize für Erneuerbare mit der
Beihilfe für Hinkley Point in Beziehung gesetzt. In einem dynamischen Ansatz werden im Unterschied
dazu weitere Faktoren berücksichtigt, wie etwa zukünftige Kostenreduktionen durch technologisches
Lernen. Der dynamische Ansatz wird bis 2050 berechnet, wobei die nukleare Vergleichsoption ab 2023
dazu genommen wird (Betriebsbeginn Hinkley Point C). Die dynamische Berechnung fußt auf einer
detaillierten modellbasierten Analyse unter Anwendung des Green-X-Modells (www.green-x.at).
Dieses Modell ermöglicht die Berücksichtigung einer Vielzahl von Faktoren wie Kosten, Potenziale,
energiepolitische Rahmenbedingungen, Ausbauhemmnisse nicht-ökonomischer Natur (z.B.
Netzanbindung, administrative Barrieren), Strompreise und Energiebedarfe, die die Stromproduktion
und ihre Wirtschaftlichkeit wesentlich beeinflussen.
Ergebnisse
Die statischen und dynamischen Berechnungen wurden jeweils für fünf verschiedene EU-Staaten
(Großbritannien, Polen, Deutschland, Frankreich und die Tschechische Republik) und für die EU28 in
Summe durchgeführt. Die Länderauswahl erfolgte hierbei unter der Prämisse, unterschiedliche
Ausgangslagen bzgl. der derzeitigen und der angedachten künftigen Nutzung der Kernenergie als auch
erneuerbarer Energien widerzuspiegeln. Für jedes Land erfolgt zunächst ein Überblick über Status und
absehbare Entwicklungen von Erneuerbaren und Kernenergie.
Der statische Ansatz ergab, dass in den fünf untersuchten Ländern unter gleichen budgetären
Bedingungen fast immer mehr Strom aus erneuerbaren Quellen produziert werden kann als aus
Kernkraft.
Dabei haben vor allem Kleinwasserkraftwerke und Windanlagen am Festland aus heutiger Sicht die
geringsten Kosten. Durch entsprechende staatliche Förderungen (wie am Beispiel Polen gezeigt wird)
kann auch durch die Mitverbrennung von Biomasse in mit fossilen Brennstoffen betriebenen
Kraftwerken kostengünstig Strom erzeugt werden. Stromerzeugung aus Offshore-Windanlagen und
Photovoltaik hingegen sind die am wenigsten wirtschaftlichen Optionen unter heutigen (Stand 2013)
Bedingungen. Mögliche Kostenersparnisse gegenüber Kernenergie für dieselbe Strommenge reichen
von 2% (Großbritannien) über 63% (Frankreich) für Windanlagen am Festland, und von 31% (Polen)
bis 51% (Frankreich) für Kleinwasserkraftwerke.
Mit dem dynamischen Ansatz wird ein umfassender Blick in die Zukunft gewagt. So wird unter
anderem berechnet, wie viel der produzierte Strom künftig kosten wird (Euro pro MWh) und welche
Mehrkosten für die Gesellschaft bzw. die EndkundInnen resultieren. Die folgende Abbildung zeigt
beispielhaft auf EU-Ebene jeweils den erwarteten Marktwert des eingespeisten Stroms (strichlierte
Linie) und die (für Erneuerbare) erforderliche bzw. (für Kernenergie) geplante Einspeisevergütung
(durchgehende Linie) für Erneuerbare und Kernenergie. Die Differenz sind Kosten, die von der
Öffentlichkeit zu tragen wären.

Renewable Energies versus Nuclear Power – Comparing Financial Support
vii
Die erforderlichen Einspeisevergütungen für Erneuerbare liegen unter denjenigen für Kernenergie.
Der erwartete Marktwert des eingespeisten Stroms hingegen liegt für Kernenergie über dem für
Erneuerbare und diese Differenz wird bis 2050 zunehmend größer.
Während die in Großbritannien vorgesehene Einspeisevergütung für Kernenergie wie geplant konstant
erfolgen soll, wird die Differenz zum Strommarktpreis zunehmend geringer, da von einem Anstieg der
Strommarktpreise auszugehen ist. Dadurch sinkt auch die ursprünglich hohe Belastung für die
Öffentlichkeit über die Jahrzehnte.
Für die erneuerbaren Energieträger sinkt die Einspeisevergütung zunächst stark und dann schwächer
ab. Strommarktpreis und Einspeisevergütung nähern sich zunehmend an, die verbleibende Differenz
wird hauptsächlich durch Offshore-Windanlagen verursacht. Zwei entgegengesetzte Trends
beeinflussen die Notwendigkeit der Unterstützung für Erneuerbare. Einerseits erfolgt über die Jahre
eine Kostenreduktion aufgrund der technologischen Lernprozesse (siehe etwa die Kostenreduktion für
Photovoltaik in Deutschland bzw. weltweit), andererseits bewirkt eine größere Verbreitung der
Erneuerbaren eine Reduktion ihres Marktwertes. Dies betrifft insbesondere die Windenergie und
Solarstrom, also jene Quellen, deren Erzeugung durch das natürliche Dargebot bestimmt und die in
Folge nicht auf sinkende Nachfrage flexibel reagieren können. Weiters hängt der Anteil der nötigen
Fördergelder von länder- und technologiespezifischen Charakteristika ab.
Abbildung 1: Zukünftige Entwicklung von Einspeisevergütungen und Strommarktpreisen der
untersuchten erneuerbaren Energieträger in Summe im Vergleich zur nuklearen Option
auf EU-Ebene und über alle fünf analysierten Länder (grüne Bandbreite); eigene
Berechnung gemäß dem Green-X Szenario „dedicated RE support“
In einem nächsten Schritt wird nun abgeschätzt, welche Kosten den StromkundInnen daraus im
Zeitraum 2023 bis 2050 durchschnittlich erwachsen werden. Die Ergebnisse hierzu werden in
Abbildung 2 veranschaulicht.
In jedem untersuchtem Staat wie auch in der EU im Mittel (EU28) erfordert der Einsatz von
Kernenergie eine höhere finanzielle Unterstützung seitens der Gesellschaft als erneuerbare
Energien. Die Höhe dieser nötigen Unterstützung ist unterschiedlich und hängt vor allem vom
zukünftigen Strompreis ab. V.a. der zukünftige Strompreis in Großbritannien wird als besonders hoch
eingeschätzt.

Renewable Energies versus Nuclear Power – Comparing Financial Support
viii
Oder, anders ausgedrückt, wie in Abbildung 3 dargestellt, könnte den untersuchten Ländern und der
EU28 die folgende Kostenersparnis in % durch den vermehrten Einsatz Erneuerbarer im Vergleich zur
Kernenergie erwachsen.
Abbildung 2 Vergleich der Wirtschaftlichkeit: Nettoförderbedarf im Zeitraum 2023 bis 2050 der
untersuchten erneuerbaren Energieträger und der Kernenergie in den betrachteten
Ländern und auf EU-Ebene; eigene Berechnung gemäß dem Green-X Szenario „dedicated
RE support“
Abbildung 3 Kostenersparnis durch Einsatz von erneuerbaren Energieträgern zur Stromerzeugung
gegenüber Kernenergie im Zeitraum 2023 bis 2050 in den betrachteten Ländern und auf
EU-Ebene; eigene Berechnung gemäß dem Green-X Szenario „dedicated RE support“
Schlussfolgerung
Stromerzeugung aus einem Portfolio an verschiedenen erneuerbaren Energien ist wirtschaftlicher als
aus Kernenergie. Dies zeigen verschiedene Szenarien bis zum Jahr 2050 klar und deutlich auf. Aus
StromendkundInnensicht können EU-weit Kosten von 37% eingespart werden, in einzelnen EU-Staaten
sogar bis zu 74% wenn auf Kernkraftwerke verzichtet wird und dafür die Erneuerbaren ausgebaut
werden. Um dies zu erreichen, gilt es rasch, aber mit Bedacht zu handeln, also insbesondere
entsprechende infrastrukturelle und regulatorische Rahmenbedingungen zu schaffen bzw.
vorhandene adäquat anzupassen.
15.3 15.3
16.7 16.7 17.1 17.1
14.0
9.3
12.5
4.3
8.3
10.8
0
2
4
6
8
10
12
14
16
18
Großbritannien Deutschland Frankreich Polen Tschechische Republik EU28
€/M
Wh
Nettoförderbedarf für Kernenergie (Hinkley Point C) Nettoförderbedarf für betrachtete erneuerbare Energien
-8.4%
-39.1%
-24.8%
-74.5%
-51.6%
-37.1%
-80%
-70%
-60%
-50%
-40%
-30%
-20%
-10%
0%Großbritannien Deutschland Frankreich Polen
TschechischeRepublik EU28
% -
Ko
ste
ne
insp
aru
ng
im
Ve
rgle
ich
zur
Ke
rne
ne
rgie
Kosteneinsparung durcherneuerbare Energien

Renewables versus Nuclear Power - Comparing Financial Support
1
1 Introduction
The energy policy debate in Europe has set (industrial) competitiveness high on the agenda throughout
2014. Support for renewable energies was in debate and, overshadowed by the economic and financial
crisis, was partly suspended in certain countries. The recent discussion on supporting nuclear power
in the UK has, however, demonstrated that renewables are not the only (EU-defined) low-carbon
option that requires financial incentives under the current framework conditions.
The Vienna Ombuds Office for Environmental Protection (Wiener Umweltanwaltschaft) has
commissioned a study with the aim to compare the costs of necessary state aids for the construction
of new nuclear capacity on the example of the planned Nuclear Power Plant (NPP) Hinkley Point
C/UK with necessary support incentives for renewable energies. The Austrian Institute of Ecology and
e-think conducted the study.
This report presents the final outcomes, indicating and contrasting the two options nuclear power and
renewables. More precisely, the results of the comparative assessment show the effectiveness, that is
the amount of electricity generation achieved, and the economic efficiency, that is the corresponding
financial support required, of both options. A static and a dynamic approach are followed: The static
approach compares today’s support incentives for renewable energy with the state aid for Hinkley
Point C, whereas the dynamic approach examines scenarios until 2050 also considering the impact of
technological learning (future cost reductions) and aspects of market integration of variable
renewables like solar and wind power.
The assessment is conducted at a country and at EU-level, and outcomes are presented in country case
studies. Five countries have been chosen (United Kingdom, Poland, Germany, France and Czech
Republic), their selection reflecting the variety of status quo and future prospects concerning the use
of nuclear power and of renewables across the EU in an adequate manner. The following topics
concerning renewable energies and nuclear power are covered: current situation/future development,
current policies for financial support and expected future requirements (in accordance with future cost
reductions), comparison of effectiveness (i.e. amount of electricity generation stipulated) and of
economic efficiency of renewable energies and nuclear power support for today and for the future (up
to 2050).
The dynamic approach builds on a model-based assessment of future renewable energies (RE)
deployment in the European Union. For doing so, the Green-X-model is used. Green-X is a dynamic
simulation tool for assessing the impact of energy policy instruments on future RE deployment and
related costs, expenditures and benefits at technology-, sector- and country-level, that has been widely
used in various studies at a national and European level, e.g. for the European Commission to assess
the feasibility and impacts of “20% RE by 2020” (cf. Ragwitz et al., 2005, Ragwitz et al., 2009 or De
Jager et al., 2011), and to explore policy options post 2020 (cf. Duscha et al., 2014).

Renewable Energies versus Nuclear Power – Comparing Financial Support
2
2 Renewables versus Nuclear Power in Europe: Status Quo and Outlook
2.1 Nuclear Power
When nuclear power was first used for energy production it was accompanied by many
expectations: the hope was for a cheap, clean and safe technology which would produce enough
energy for economic growth and avoid the need for smog-producing coal plants. When climate
change became an accepted phenomenon at the end of the last century, nuclear energy was
promoted as a possible solution because of its alleged low greenhouse gas emissions. Nowadays,
however, in most of the world nuclear power is in decline. Major accidents such as Three Mile Island
in 1978, Chernobyl in 1986 and particularly Fukushima in 2011, led to a slowing down of new-build
programs, phase-out policies and several reactor shutdowns. The unsolved question of what to do
with radioactive waste becomes pressing. Construction periods and costs for new-build plants are
constantly increasing, in part due to the international legal procedures required for new-builds3. In
addition to waste disposal and safety concerns, today the public spotlight is being shone on the
economic aspects of nuclear reactors.
The first nuclear power reactor was put into operation in 1954 (Obninsk in the former Soviet Union).
This heralded a period of extensive new-builds worldwide, resulting in a steady increase in the number
of reactors. This development is illustrated in Figure 1. This growth started to slow in the late 1980s,
and in 1990 the numbers of reactors in the world fell for the first time. After two decades of little
change in the number of reactors in operation, in 2011 – the year of the Fukushima accident – a sharp
decrease started. As of July 2014, 388 reactors are in operation, with a total operable capacity of 332.5
Gigawatt (GWe). This is comparable to the level twenty years ago.
Figure 1: Number of nuclear reactors worldwide from 1954 to 2014 and operable capacity in GWe
(Schneider et al., 2014)
3 Such procedures are Environmental Impact Assessments, Strategic Environmental Assessments and the ESPOO-Convention. They are
conducted to minimize adverse effects caused by projects such as nuclear power plants. They also regulate public participation at a national and cross-border level.

Renewable Energies versus Nuclear Power – Comparing Financial Support
3
In the EU, the decrease in the number of operating reactors is even sharper (see figure 2). In 1956, the
first western European reactor was put into operation in Calder Hall, UK. By 1988 the number of
reactors in the (enlarged) European Union had grown to 177. In 1990 the number of reactors started
to decrease – the year after the German reunification when Eastern German NPPs were shutdown. In
2014 the total number of EU reactors had fallen to 131 and, at 121.7 GWe, the operable electric
capacity is at the 1988 level. Of these 131 reactors, 112 are located in older EU member states and 19
in countries that joined the EU in later years.
Figure 2: Number of nuclear reactors in the European Union (EU28) from 1954 to 2014 and
operating capacity in GWe (Schneider et al., 2014)
If Europe is defined as to include the EU, Switzerland, Ukraine and the European part of Russia, then
an extra 5, 15 and 28 reactors must be added, totalling 179 reactors in operation in Europe as of 2014.
However, not every country in Europe has nuclear power plants: of the 46 countries (excluding
Russia), only 16 use NPPs to generate electricity (35%). Conversely, we can say that two third of
European countries do not operate NPPs.
Of the 16 countries with NPPs, France operates more than one third of all reactors.
Table 1: European countries with nuclear power plants (IAEA PRIS, 2014)
Belgium 7
Bulgaria 2
Czech Republic 6
Finland 4
France 58
Germany 9
Hungary 4
Netherlands 1
Romania 2
Russia (European part) 28
Slovakia 4
Slovenia 1
Spain 7
Sweden 10
Switzerland 5
Ukraine 15
United Kingdom 16
Total 179 reactors

Renewables versus Nuclear Power - Comparing Financial Support
4
For more than two decades the rate of reactor start-ups has been decreasing, and shutdowns are
increasing in the EU28 (see Figure 3).
Figure 3: Reactor start-ups and shutdowns in the European Union (Schneider et al., 2014)
The reactor fleet is ageing. More and more countries are focusing on extending the lifespans of their plants. In the EU 28, the average reactor age (arithmetic means and median) is already 30 years (Schneider et al. 2014). Most reactors are licensed for a lifetime of 30 to 40 years, to reflect material ageing caused by the impact of neutron irradiation, high temperatures and pressure to the components. The ageing of the nuclear fleet leaves operators with two alternatives for: decommissioning and the option of nuclear new-builds, or plant lifetime extensions of up to 60 years. The latter option is usually cheaper but involves more risks, because some critical components cannot be exchanged and are technically obsolete.
Problems of nuclear power production
Since the beginning of nuclear energy production, severe accidents have occurred in several plants
worldwide. A severe accident resulting in widespread contamination is defined as level 5, 6 or 7 on the
International Nuclear Event Scale (INES)4. The first severe accident occurred 1957 in the Mayak nuclear
facility in Kyshtym in the former Soviet Union (INES level 6 or 7). Two INES level 7 accidents shocked
the world: Chernobyl, in the former Soviet Union, in 1986, and Fukushima, Japan, in 2011. Several INES
level 5 accidents have also taken place since 1957, as well as countless incidents with lower INES levels.
The consequences of a major accident are huge. The accident in Chernobyl led to high levels of
contamination across large areas in Belarus, Ukraine and Russia. A large part of the radioactive
materials released by the accident also contaminated other European countries. A variety of health
effects are discernible in exposed populations, not only thyroid cancer and leukemia but also a wide
range of other cancers, heart diseases, cataracts, diseases of the endocrine system and the digestive
system, genetic and teratogenic effects, etc. All in all several million people were, and still are, affected
by the catastrophe. They have been evacuated and relocated, lost their homes, communities and
4 http://www-ns.iaea.org/tech-areas/emergency/ines.asp

Renewable Energies versus Nuclear Power – Comparing Financial Support
5
places of work, become sick and have had to live on contaminated soil. The 2011 accident in Fukushima
had similar consequences for hundreds of thousands of people.
Nuclear power production produces radioactive waste. Spent fuel and other long-term, high-level
waste has to be stored in final disposal sites to keep it from leaking into the environment. Safe storage
has to be guaranteed for more than hundred thousand years. Developing final disposal sites is still a
huge problem for the nuclear industry: although many countries are working on a strategy for final
disposal, and even where some countries have chosen sites, no final disposal has yet been completed.
The first final disposal in operation in a European country is expected to start in 2020 (Switzerland and
Finland). EU legislation forces all member countries to involve the public in their waste management
strategies by means of a Strategic Environmental Assessment Program – these waste management
strategies must be completed by August 2015. In many countries the public is opposed to plans and
sites for final disposals (see discussions about the Gorleben site in Germany or the recent discussion
about final disposal sites in the Czech Republic).
Besides spent fuel, low and intermediate radioactive waste must also be disposed of. These
repositories can cause negative effects for health and the environment if they leak radioactive and
toxic substances into the groundwater or if they are in danger of collapse (see f. e. repositories in Asse
or Morsleben in Germany).
Uranium is used as fuel for nuclear power plants. Conventional uranium mining results in huge tailings
full of radioactive fission products and toxic chemicals and metals. Conversion and fuel fabrication also
produce waste. Producing one ton of uranium oxide results in 18,750 tons of waste rock, 3,700 tons of
solid tailings and of liquid tailings, 5 tons of solid and 46 m³ of liquid waste from conversion (WISE
2009). The uranium ore grade has a significant impact on the amount of energy necessary for fuel
production. With worldwide uranium resources already very much depleted, even reserves with very
low uranium ore grades will have to be exploited. (Wallner et al. 2011)
Uranium mining leads to massive health risks, especially for miners and people living in the vicinity of
the mines. Uranium dust and radon can be inhaled and result in a high risk of bronchial and lung cancer.
Uranium and its radioactive daughter nuclides can cause leukemia, cancer of the bone marrow,
stomach, liver, intestine, gall bladder, kidneys and skin, other blood diseases, psychological disorders
and birth defects (IPPNW 2010).
In EU climate policy, nuclear power is regarded as low-carbon, comparable to renewables. But nuclear
power’s contribution to climate protection must be put into perspective: only where uranium ore has
a grade of 0.1% or higher can the term “low-carbon” be justified. Where the uranium ore’s grade is
about 0.01%, CO2 emissions rise to 210 g CO2/kWhel. This is lower than emissions from coal or oil (600–
1200 g/kWhel), but far higher than those of wind energy (2.8–7.4 g/kWhel), hydropower (17–22
g/kWhel) and photovoltaics (19–59 g/kWhel). (Wallner et al. 2011)
Another danger of nuclear power results from the use of radioactive material for nuclear weapons.
The civil use of nuclear energy has always gone hand in hand with its military use, starting before the
Second World War and resulting in the destruction of Hiroshima and Nagasaki. Controlling fissionable
material became more difficult once civil nuclear energy use started to spread globally. In 1970, the
United Nations Nuclear Non-Proliferation Treaty entered into force. 190 parties have joined the Treaty,
including the five states with official nuclear weapons (USA, Russia, UK, France, and China). All non-
nuclear weapons states are not allowed to engage in nuclear weapons building. A safeguard regime
was installed.
Although nuclear war is not the main focus today, there is a clear worry that material for smaller
nuclear bombs will fall into the hands of terrorists. International Physicians for the Prevention of

Renewable Energies versus Nuclear Power – Comparing Financial Support
6
Nuclear War (IPPNW) have outlined a scenario for a densely populated city such as New York (IPPNW
2004a). In this scenario, more than 60,000 deaths can be expected. Another risk is posed by “dirty
bombs” - small explosive weapons containing radioactive fission products such as Cs-137 or plutonium.
These bombs could also be produced by terrorists: according to IPPNW it is not impossible to obtain
the necessary amount of radioactive material. In a scenario for London it is estimated that 2,000-
10,000 people would suffer from the long-term consequences of a crude plutonium dispersion bomb
containing 35 kg of radiological material (IPPNW 2004b).
Surface nuclear weapons testing has also led to global contamination (especially in the Northern
hemisphere) with fission products. These surface tests were conducted up until the 1980s. In order to
stop nuclear testing, the United Nations introduced the Comprehensive Nuclear-Test-Ban Treaty in the
1990s5. Today it has been signed by 183 member states – but it has not yet been ratified by important
nuclear states including the USA or China.
Costs of nuclear power
Construction costs are estimated to represent 56-72% of the overall costs of nuclear power (Rogner,
2012). Each delay in construction leads to higher costs. For example: Two NPPs under construction in
the EU (Flamanville in France and Olkiluoto in Finland) are suffering from delays of several years each,
and construction costs in Olkiluoto are now 280% over budget (Schneider et al., 2014).
The costs of nuclear energy include not only the costs of NPP construction and licensing, and other
facilities necessary for fuel production, but also the costs of operation, decommissioning of shutdown
plants and for waste disposal. Furthermore, the external costs of the nuclear fuel chain have to be
considered, i.e. environmental and health damage costs caused by uranium mining.
Severe accidents (beyond design basis) are costing huge amounts in damage – different sources
estimate costs of between US$71 and 5,800 billion (Wallner and Mraz, 2013). NPP operators and states
must be insured against such accidents. Since the 1960s, these liabilities have been regulated by
several international Conventions. Not every nuclear state is member of such a Convention: important
nuclear states including the USA, Canada, China, India and Japan have not signed any of these
agreements. Moreover, where the insurance coverage is inadequate, the shortage also will have to be
made up. Calculations show that, as of today, only a few percent of possible accident costs are covered
(Wallner and Mraz, 2013). This question of covering shortages will also arise when it is clear that
funding for decommissioning and waste disposal is insufficient.
State aid for nuclear new-builds in the form of loans, guarantees or tax relief (e.g. UK state aid for
Hinkley Point in chapter 2.1.1) all adds to the costs of nuclear energy. Institutional framework
organizations such as the IAEA, or research funds provided for example by EURATOM, also have to be
financed.
If all these factors were taken into account, the electricity price would rise significantly.
2.1.1 Nuclear power support scheme for Hinkley Point C, UK
Of special interest is a new political development, the new state aid scheme for a nuclear new-build –
the Hinkley Point C power plant project in the United Kingdom.
The NNB Generation Company Limited (NNBG), part of EDF Energy, plans to construct and operate a
new nuclear power plant (NPP) at the Hinkley Point NPP site (Hinkley Point C 1&2). The NPP would
comprise two European Pressurized Water Reactors (EPR) with an electrical capacity of around
5 Comprehensive Nuclear-Test-Ban Treaty Organization CTBTO: http://www.ctbto.org

Renewable Energies versus Nuclear Power – Comparing Financial Support
7
1,630 MWe per unit, producing a total of 26 TWh per year during its 60 years of operational lifetime. If
constructed, Hinkley Point C would be the UK’s first new reactor since 1989.
The construction costs of Hinkley Point C were first estimated to be close to € 19 billion (EDF, 2013),
but were corrected by the EC to € 31.2 billion, and overall capital costs are assumed to be € 43 billion
(EC, 2014a). To cover such enormous investments, EDF has undergone time-consuming negotiations
with the UK government.
European regulations allow member States to determine their energy mix within their national
competence. However, when public money is spent to support companies, the European Commission
must verify that this is done in accordance EU rules on state aid. Therefore the UK’s support scheme
was investigated in 2013. During this investigation, the UK was required to modify the terms of the
project financing. In October 2014, the European Commission concluded that “the modified UK
measures for Hinkley Point nuclear power plant are compatible with EU rules” (EC, 2014a).
The key terms of the final agreement contain the following provisions:
1. Investment contract including contract for difference
The agreement took the form of a so-called “Contract for Difference” (CfD): if the wholesale prices for
electricity fall below an agreed strike price, then the Secretary of State will pay the difference between
the strike price and the wholesale price, ensuring that NNBG will ultimately receive a fixed level of
revenues. When the wholesale price is higher than the strike price, NNBG will be obliged to pay the
difference to the Secretary of State. The duration of the contract is 35 years for each of the two
reactors.
The strike price is set at € 108 per MWh (expressed in real terms, as of 2012). If EDF constructs a second
nuclear power plant at Sizewell C using the same design, the strike price would become €104 per MWh.
The strike price will be fully indexed to the Consumer Price Index: based on current assumptions, this
would translate into a nominal strike price of € 329 per MWh in 2058, the last year in which the CfD
scheme applies.
After the modifications urged by the European Commission, a gain-share-mechanism for the overall
profits will be in place for the entire project’s lifetime, namely 60 years. If the construction costs are
lower than expected, these gains will also be shared (EC, 2014a).
2. Credit guarantee
The NNBG will also benefit from a credit guarantee issued by the UK Treasury. This guarantee would
significantly reduce EDF’s risk exposure and therefore the cost of capital. After the modification in
2013, the guaranteed fee that the operator must pay the UK Treasury was significantly raised, resulting
in an effective reduction of the subsidy by more than € 1.3 billion. (EC, 2014a)

Renewable Energies versus Nuclear Power – Comparing Financial Support
8
Table 2: Main characteristics of Hinkley Point C
Capacity per unit MWe 1,630
Number of units 2
Total capacity (two units) MWe 3,260
Electricity generation TWh/a 26
Estimated start of operation Year 2023
Financial support via Contract for Difference / Feed-in Tariff
(for two NPPs)
€2012/MWh 108
(104)
Duration of support Years 35
The October 2014 decision of the European Commission has led to massive protests. The protesters
include the Republic of Austria. Based on a legal study, Austria regards subsidies for nuclear power
reactors as inacceptable according to EU legislation (BMWFW, 2014).
2.2 Renewables
As outlined in detail in the Re-Shaping study (see Ragwitz et al., 2012), the first decade of the new
millennium was characterized by the successful deployment of RE across EU Member States – total RE
deployment increased by more than 40%. More precisely:
• Renewable electricity generation grew by approximately 40%, RE in heating & cooling by 30%
and biofuels by a factor of 27 during the period 2001 to 2010,
• New renewables in the electricity sector (all technologies except hydropower) increased
fivefold during the same period,
• Total investments in RE technologies increased to about € 40 billion annually in 2009, and more
than 80% of all RE investments in 2009 were in wind and PV.
• With respect to PV, an ongoing trend of achieving impressive cost reductions from year to year
has started in the final period close to 2010.
These impressive structural changes in Europe’s energy supply are the result of a combination of strong
national policies and the general focus on RE created by the EU Renewable Energy Directives in the
electricity and transport sectors towards 2010 (2001/77/EC and 2003/30/EC).
Despite the challenges posed by the financial and economic crisis, RE investments were generally less
affected than other energy technologies and partly increased even further over the last couple of
years. The European Energy and Climate Package is one of the key factors that contributed to this
development. The EU Emissions Trading System (EU ETS) Directive has introduced full auctioning post
2012, thus exposing fossil power generation to the full cost of carbon allowances, at least in theory. In
practice, however, an oversupply of allowances has led to a deterioration of prices on the carbon
market.

Renewable Energies versus Nuclear Power – Comparing Financial Support
9
Box 1: Historic deployment of RE in the European Union
The pathway for renewables to 2020 was set and accepted by all the European Council, the European
Commission and the European Parliament in April 2009. The related policy package, in particular the
EU Directive on the support of energy from renewable sources (2009/28/EC), subsequently named as
RE Directive, comprises the establishment of binding RE targets for each Member State. Implementing
the 2020 RE Directive has taken another step forward with the formulation of the National Renewable
Energy Action Plans (NREAPs), which outline the national strategies concerning support schemes,
cooperation mechanisms and (non-cost) barrier mitigation, in particular with respect to grid-related
and administrative issues. In addition, a detailed reporting framework for the European Commission
and Member States has been drawn up to ensure that these strategies are well established and
coordinated.
Despite the successful development of the RE sector over the last decade, substantial challenges still
lie ahead. For the renewable energy electricity and heating & cooling sectors (RES-E and RES-H&C), the
growth rate of total generation has to continue in line with the trend observed over the last five years.
Compared to the period 2001 to 2010, yearly growth in renewable electricity needs to almost double
from 3.4% (2001 to 2010) to 6.7% in order to meet 2020 RE targets. There also needs to be a substantial
The use of renewable energies within the European Union increased substantially over the last decades. As
shown in Figure 4 the RE share in gross final energy demand increased from 5.9% in 1990 to 14.1% as of
today (2012). In the electricity sector the past deployment of renewables is even more impressive, cf. Figure
4. Hydropower is still the dominant RE technology but there has been a strong development in emerging RE
technologies including wind and biomass. Whereas hydropower accounted for 94% of RES-E generation in
1990, the overall share of hydro power in total RES-E generation decreased to below 60% by 2012. Figure 4
(left) indicates the varying electricity output from hydropower due to annual changes in precipitation.
Hydropower production figures reveal that there have been strong variations from 2001 to 2002 and from
2010 to 2011. Figure 4 (right) shows the development of “new” RE technologies (i.e. including all RE
technologies with the exception of hydropower), amounting to 423 TWh in 2012. Compared to RES-E
generation in 1990 of 19 TWh electricity generation from new RE has increased by a factor of more than
twenty over the last 10 to 15 years as a consequence of policy efforts undertaken at European and at a
national level. In particular it is onshore wind with 192 TWh generated in 2012, followed by solid biomass
with 92 TWh, and in recent years also photovoltaics with 68 TWh, which have contributed significantly to
this development.
Figure 4: Past deployment of RE technologies in the electricity sector (EU28), including (left)
and excluding (right) hydropower
(Source: Held et al. (2014), based on Eurostat (2014))
0
100
200
300
400
500
600
700
800
900
19
90
19
92
19
94
19
96
19
98
20
00
20
02
20
04
20
06
20
08
20
10
20
12
Ele
ctri
city
ge
ner
atio
n [
TWh
/a]
'New' RES-E excl. hydro
Small-scale hydro
Large-scale hydro
0
100
200
300
400
19
90
19
92
19
94
19
96
19
98
20
00
20
02
20
04
20
06
20
08
20
10
20
12
Elec
tric
ity
gen
era
tio
n [
TWh
/a]
Bioliquids
Wind off-shore
Geothermal electricity
Photovoltaics
Biowaste
Biogas
Solid biomass
Wind on-shore

Renewable Energies versus Nuclear Power – Comparing Financial Support
10
increase in growth in the RES-H&C sector from the 2.7% per year achieved over the past decade to
3.9% per year until 2020. Therefore the EU as a whole should continue to uphold the past level of
achievement and the most successful countries could even over-achieve the 2020 targets if they
continue to follow their present trend.
In order to create the investment climate for reaching the 2020 targets, the longer term commitment
for renewable energy in Europe is an important condition. The more confidence investors have in the
market growth for RE technologies beyond 2020, the better they will develop the supply chain and
align structures within utilities and other companies.
The EU Energy Roadmap 2050 provided the first signals of renewable energy development pathways
beyond the year 2020 and identified renewables as a “no-regrets” option. In a next step, Europe’s way
forward towards 2030 has been intensively discussed. Thus at the Council meeting this October (2014)
the next step was taken: a binding EU-wide RE target of at least 27% as RE share in gross final energy
demand was adopted. This should be seen as an important first step in defining the framework for RE
post 2020. Other steps, such as a clear concept for, and agreement on, sharing efforts across Member
States needs to follow.
We also observe that binding national RE targets at Member State level have created strong
commitment for renewable energy throughout the EU, and are currently the key driver for RE policies.
They are a key element in setting up administrative procedures, regulatory frameworks, regional
planning and national infrastructure development. As these elements will also be crucial for the RE
deployment after 2020 binding national targets appear a crucial element up to 2030, in order to give
confidence to the investors.
Box 2: Support schemes for electricity from renewable sources
Globally as well as within the European Union (EU), a feed-in tariff (FIT) system is the most common policy
instrument for promoting electricity generation from renewable energy sources (RES-E).A quota obligation
with tradable green certificates (TGCs) is another widely implemented support scheme. These main
instruments for RES-E are often accompanied by complementary instruments like grants offering investment
support, fiscal incentives (e.g. tax reductions) or (cheap) loans.
The two main support instruments can be characterised as follows:
• Feed-in tariffs offer financial support per kWh generated, paid in the form of guaranteed (premium)
prices and combined with a purchase obligation by the utilities. The most relevant distinction is between
fixed FIT and fixed premium systems. The former provides total payments per kWh of electricity of
renewable origin while the latter provides a payment per kWh on top of the electricity wholesale-market
price (Sijm 2002). Note that the planned CfD scheme in the UK falls also under the category of a FIT
scheme.
• In a quota obligation with Tradable Green Certificates the government defines targets for RES-E
deployment and obliges a particular party of the electricity supply-chain (e. g. generator, wholesaler or
consumer) with their fulfillment. Once defined, a parallel market for renewable energy certificates is
established and their price is set following demand and supply conditions (forced by the obligation).
Hence, for RES-E producers, financial support may arise from selling certificates in addition to the
revenues from selling electricity on the power market.

Renewable Energies versus Nuclear Power – Comparing Financial Support
11
3 Methods
This study aims to conduct a comparative assessment of two distinct low-carbon options; namely
nuclear power and renewables. A comparison is undertaken to indicate the effectiveness, that is the
amount of electricity generation achieved, and the economic efficiency, that is the corresponding
support required, of both options. A static and a dynamic approach are followed: The static approach
compares today’s support incentives for renewable energy with the state aid for Hinkley Point C,
whereas the dynamic approach examines scenarios until 2050 also considering the impact of
technological learning (future cost reductions) and aspects of market integration of variable
renewables like solar and wind power.
The assessment is conducted at a country and at a European level, and outcomes are presented in
country case studies (United Kingdom, Poland, Germany, France and Czech Republic) covering the
following topics concerning renewable energies and nuclear power: current situation/future
development, current policies for financial support and expected future requirements (in accordance
with future cost reductions), comparison of effectiveness (i.e. amount of electricity generation
stipulated) and of economic efficiency of RE and nuclear power support for today and for the future
(up to 2050).
3.1 Static approach: comparison of planned support for nuclear with existing
RE support
The level of financial support paid to the supplier of nuclear as well as of RES-E is a core characteristic
of a support policy. Actual support levels are, however, often not directly comparable, and details of
the support policy applied, including main instrument like FIT or quotas as well as complementary
incentives, need to be taken into account. The schemes may differ from each other with respect to the
type of instrument or its detailed design, incl. duration of support, changes in support levels over time
(e.g. reduction after a certain period), etc.
As stated in a detailed assessment report of
the performance of RE support policies in EU
Member States derived within the RE-
Shaping study (see Steinhilber et al., 2011),
for a comparative assessment of support
incentives the available remuneration level
during the whole lifetime of a (RE) power
plant has to be taken into account. To make
the remuneration levels comparable,
following the methodology applied in
Steinhilber et al. (2011), time series of the
expected support payments per unit of
electricity generated are created for each of
the assessed options (i.e. biomass, small
hydro, photovoltaic (PV) and wind (on- and
offshore) as well as nuclear power by
country) and the net present value (NPV),
representing the current value of overall
support payments, is calculated. After that
the annualised remuneration level is
Support incentives may provide total payments per kWh
of electricity (e.g. fixed feed-in tariffs) or offer payments
on top of the electricity wholesale-market price (e.g.
quotas with TGCs or feed-in premiums). In both cases
support payments are often limited to a certain period of
time, i.e. the guaranteed duration of support.
Remuneration represents the total income of a power
producer, i.e. from selling electricity on the wholesale
electricity market and/or from support incentives. For
example the remuneration level contains the electricity
wholesale-market price if the support payments expire
after their guaranteed duration, but the power plant
continues in operation.
The difference between total remuneration level and
wholesale-market prices determines the required net
support, i.e. the amount of money that finally has to be
borne by the consumer / the society.
Box 3: A short introduction: Support
and Remuneration

Renewable Energies versus Nuclear Power – Comparing Financial Support
12
calculated from the NPV using a discount rate of 6.5% and following under each type of instrument a
normalisation to a common duration of 20 years. In addition, expected future wholesale electricity
prices are normalised over the same time period. In the case of a quota scheme with TGCs, it is
assumed that the total remuneration level is composed of the conventional electricity price (wholesale
electricity prices) and the average value of TGCs. Note that results on remuneration levels, wholesale
electricity prices or net support expenditures are expressed subsequently in real terms, using €2013.
3.2 Dynamic approach: comparison of planned support for nuclear with
future RE support according to a model-based analysis (Green-X)
The dynamic assessment follows the principles sketched above, assessing effectiveness and economic
efficiency (i.e. cost effectiveness) of RE and nuclear power support from a future perspective. The
approach taken builds on a model-based assessment of future RE deployment in the European Union
and at country level up to 2050.
A scenario of dedicated RE support is assessed that follows the policy decisions taken, i.e. the binding
2020 RE target (of reaching a share of 20% RE in gross final energy demand), and that reflects the
European policy agenda for tomorrow where mitigation of climate change and the built-up of a
sustainable energy system are expected to remain as top priorities in the period post 2020.6 The
scenario proclaims the prolongation of establishing enhancing framework conditions at EU level while
national (or in future European) RE support instruments aim for setting the corresponding incentives
to assure the achievement of European RE targets by 2030 and beyond. Complementary to fine-tuned
financial incentives for RE this requires enabling framework conditions and a mitigation of currently
prevailing non-economic barriers (i.e. administrative barriers and grid constraints that hinder the
upscaling of RE deployment across Europe at present).
The RE policy assessment tool: the Green-X model
For doing so, the Green-X-model comes into play. Green-X is a dynamic simulation tool for assessing
the impact of energy policy instruments on future RE deployment and related costs, expenditures and
benefits at technology-, sector- and country-level, that has been widely used in various studies at a
national and European level, e.g. for the European Commission to assess the feasibility and impacts of
“20% RE by 2020”, and to explore policy options post 2020. Please note that a short characterization
of the model is given in Annex A to this report, whilst for a detailed description we refer to www.green-
x.at.
Criteria for the assessment of RE support schemes
Support instruments have to be effective in order to increase the penetration of RE and efficient with
respect to minimising the resulting public costs – i.e. the transfer cost for consumer (society),
subsequently named support expenditures – over time. The criteria used for evaluating the various
policy instruments are based on two conditions:
• Minimise generation costs: This objective is fulfilled if total RES-E generation costs (GC) are
minimised. In other words, the system should provide incentives for investors to select
technologies, scales and sites such that generation costs are minimised.
6 The derived scenario of dedicated RE support follows an ambitious deployment of renewables within the EU. 2030 RE deployment at EU
level is for example in accordance with an overall target of 30% RE by 2030 which is above the minimum target as agreed recently at the Council meeting of this October (2014).

Renewable Energies versus Nuclear Power – Comparing Financial Support
13
• Reduce producer profits to an adequate level: Once such cost-efficient systems have been
identified, the next step is to evaluate various implementation options with the aim of
minimising the transfer costs for consumer / society.7 This means that feed-in tariffs,
investment incentives or RES-E trading systems should be designed in such a way that public
transfer payments are also minimised. This implies lowering generation costs as well as
producer surplus (PS)8.
In some cases it may not be possible to reach both objectives simultaneously – minimise generation
costs and producer surplus – so that compromises have to be made. For a better illustration of the cost
definitions used, the various cost elements are illustrated in Figure 5.
Figure 5: Basic definitions of the cost elements (illustrated for a RE quota scheme with certificate
trading)
Future requirements concerning support schemes for RE
Generally, the need to incentivise the deployment decreases for RE technologies thanks to
technological learning. Technological progress and related cost reductions go hand in hand with the
ongoing market deployment of a certain technology. This has been impressively demonstrated for
example by the uptake of PV in Germany and other countries and the achieved significant decline of
capital cost. But what has been observed for PV is by far not an exceptional case, it is rather an
affirmation of a general empirical observation – i.e. the technological learning theory.
On the contrary, with ongoing market deployment of variable renewables like solar and wind we see
however also an opposing tendency that ultimately may cause an increase in the need for financial
support. This concerns the market value of the produced electricity that is fed into the grid. As
7 Support expenditures - i.e. the transfer costs for consumers (society) – due to RE support are defined as the financial transfer payments
from the consumer to the RE producer compared to the reference case of consumers purchasing conventional electricity on the power market. This means that these costs do not consider any indirect costs or externalities (environmental benefits, change of employment, etc.). Within this report support expenditures (due to RE support) are either expressed in absolute terms (e.g. billion €), related to the stimulated RE generation, or put in relation to the total electricity / energy consumption. In the latter case, the premium costs refer to each MWh of electricity / energy consumed.
8 The producer surplus is defined as the profit of green electricity generators. If, for example, a green producer receives a feed-in tariff of
60 € for each MWh of electricity sold and generation costs are 40 €/MWh, the resulting profit would be 20 € for each MWh. The sum of the profits of all green generators equals the producer surplus.
quantity[GWh/year]
price, costs [€/MWh]
Market clearingprice = price for certificate
MC
Quota Q
pC
MC ... marginalgeneration costs
pC ... market price for(conventional)electricity
p MC ... marginal price for RES-E (due toquota obligation)
pMC
Generation Costs (GC)
Producer surplus (PS)
Support expenditures(transfer costs for consumer/ society)
= PS + GC – pC * Q = ( pMC – pC ) * Q

Renewable Energies versus Nuclear Power – Comparing Financial Support
14
explained in further detail in Box 4, for these technologies it is becoming apparent that in future years
(with ongoing deployment) a unit of electricity produced is less valuable than of a dispatchable RE
technology like biomass where the plant may interrupt operation during periods of oversupply (thanks
to massive wind and solar power inflow) and correspondingly low wholesale power prices. Thus, the
difference between remuneration and market value determines the required net support.
Whether the cost decrease thanks to technological learning or the increase in support requirements
due to a decreasing market value will be of dominance depends on the country- and technology-
specific circumstances. This will be analysed in further detail for all assessed energy technologies at
country level within the dynamic assessment.
Box 4: A short introduction: Merit-order-effect and market values (for variable RES-E)
Overview on key parameters
In order to ensure maximum consistency with existing EU scenarios and projections the key input
parameters of the scenarios presented in this report are derived from PRIMES modelling and from the
Green-X database with respect to the potentials and cost of RE technologies (see for example Resch et
Figure 6 Conceptual classification of the merit-order effect
and the market values of RES-E generation.
(Source: Own elaboration based on Sensfuss et al.
(2008))
According to Sensfuss et al. (2008)
it is assumed that the electricity
demand is inelastic in the short-
term perspective of a day-ahead
market. If more electricity
generated by RE enters the
common electricity market, at
least in a first approximation, the
expected impact on the power
system should be a decrease of
total generation costs. Due to the
fact that variable RE are
characterized through a variable
cost of production which is
basically zero, the direct
marketing of those technologies
leads to a temporary shift of the
supply curve to the right and thus
displaces more expensive
generation technologies. As this
effect shifts market prices along
the merit-order of power plants it
is generally called merit-order-
effect.
The electricity generated by RE also has a value which has to be taken into account in the public debate on
costs caused by the RE policy intervention: The market value of renewables represents the income that
renewables can generate from the regular electricity market. It depends on the average electricity price as
well as the relative value of renewable electricity compared to this average price (market value factor). Most
renewable energies (except for biomass) have very low variable electricity generation costs. Thus, due to the
merit order effect, electricity prices in the market are lower at times with a high infeed of variable
renewables. As the weather dependent and variable renewables (e.g. wind and solar PV generation) can only
influence generation by investing in certain sides of curtailing generation, their market value factor is
supposed to decrease with increasing share of renewables.
A stylized overview of the discussed effects of RES-E generation for a single hour is given in Figure 6.

Renewable Energies versus Nuclear Power – Comparing Financial Support
15
al. (2014) for details on that). Table 3 shows which parameters are based on PRIMES, on the Green-X
database and which have been defined for this assessment.
More precisely, the PRIMES scenario used is the reference scenario as of 2013 (EC, 2013b). Note
however that demand projections have been contrasted with recent statistics (Eurostat) and corrected
where adequate (in order to assure an appropriate incorporation of impacts related to the recent
financial and economic crisis). Moreover, mid- to long-term trends have been further modified to
reflect an adequate representation of energy efficiency, assuming a proactive implementation of
energy efficiency measures in order to reduce overall demand growth.9
For details on the underlying demand trends and other key assumptions we refer to the Annex A to
this report.
Table 3: Main input sources for scenario parameters
Based on PRIMES Based on Green-X database Defined for this assessment
Primary energy prices RE cost (investment, fuel, O&M) RE policy framework
Conventional supply portfolio and conversion efficiencies
RE potential Reference electricity prices
(CO2 intensity of sectors) Biomass trade specification Energy demand by sector*
Technology diffusion / Non-economic barriers
Learning rates
Market values for variable RES-E
Note: *Reference demand data is originally taken from PRIMES (reference case) but modified (see previous explanations on energy demand).
9 The assessment of energy efficiency policy options is based on detailed modelling of the final energy demand in the different demand
sectors. More precisely, the Low Policy Initiative (LPI) scenario as used in this assessment has been conducted in the frame of a study evaluating the current energy efficiency policy framework in the EU and providing orientation on policy options for realising the cost-effective energy-efficiency/saving potential until 2020 and beyond, conducted on behalf of DG ENER by a consortium led by Fraunhofer ISI (Braungardt et al., 2014).

Renewable Energies versus Nuclear Power – Comparing Financial Support
16
4 Country specific analysis
Aim of this chapter is to answer the question how much electricity could be generated by renewable
sources in each country if the amount of the public funds for the planned UK NPP Hinkley Point C would
be available. The countries that will be analysed are Czech Republic (CZ), Germany (DE), France (FR),
Poland (PL) and United Kingdom (UK).
Each chapter starts with the country’s electricity production by nuclear energy and renewable source,
providing data on the status quo and on future developments until 2050. These outlooks combine
political strategies in the respective country and assessments with the Green-X-model (see chapter 3).
A core element of the country-specific analysis conducted is the comparison of the amount of public
funds that will be available for Hinkley Point C with currently implemented renewable energy support
schemes as well as with required future incentives that appear necessary for letting renewables play
a key role in the ongoing energy transition. Results will be presented in terms of cost (€ per MWh) and
amount of electricity generation following a static and a dynamic approach, respectively.

Renewable Energies versus Nuclear Power – Comparing Financial Support
17
4.1 United Kingdom
4.1.1 Status Quo: Role of Nuclear Power and RE in the energy mix
The first NPP in the UK went into operation in 1956, two years after the first NPP worldwide in the
former Soviet Union. As of today, the UK operates 16 units located at nine sites. The oldest of the
operating reactors was put into operation in 1971 (with a planned shutdown at the end of 2015). The
other fifteen NPP units were originally planned for shutdown in the next ten years, but lifetime
extension will possibly keep most of them in operation for 5-10 more years. For the newest reactor of
the UK fleet, Sizewell B (1995), a lifetime extension of even 20 years is planned (WNA, 2014c).
Also reprocessing facilities, fuel fabrication and enrichment facilities are in operation in Sellafield
(formerly called Windscale, famous for a severe accident in 1957 and for heavy pollution of the Sea).
The Magnox reprocessing plant has started operation in 1964 and is planned to be closed in 2016. The
THORP plant (Thermal Oxide Reprocessing Plant) will operate to 2018, and close after completing its
existing reprocessing contracts. (WNA, 2014c) Decommissioning of the Sellafield site is an expensive
undertaking with an estimation of GBP 70 billion.
The contribution of NPPs to electricity production in the UK has decreased: In 1997, 26.9% of electricity
has been provided by nuclear (Schneider et al., 2014). In 2014, this percentage has decreased to 18%
due to shutdowns and ageing-related problems – four reactors are operating only at 70% capacity.
(WNA, 2014c)
Figure 7: Breakdown of total electricity generation in 2012 for the UK (left), with details for
assessed selected RE technologies (right) (Source: Eurostat, KoT-project (Resch et al.,
2014))
Currently the major share of electricity generated in the UK stems from fossil fuel-fired power plants
– as applicable in Figure 7 more than two thirds of total power supply in 2012 were produced in gas-
or coal-fired thermal power plants. Nuclear power is the second largest contributor, holding a share
around 18% in power supply today. Renewables still play a minor role but the recent tendency appears
promising: thanks to dedicated support the RE share in gross electricity demand grew from 7.4% in
2010 to 10.8% (2012) within two years. Wind energy, both on- and offshore, is of dominance in the
UK’s RE electricity mix – i.e. they have delivered in 2012 more than two thirds of all electricity produced
Nuclear,
18.5%
Fossil, 70.7%
Selected
RES-E, 7.3%
Other RES-E,
3.5%
Breakdown of total electricity generation in 2012
Biomass,
24.5%
Hydro small-
scale, 2.8%
Photovoltaics,
4.3%Wind
onshore,
42.9%
Wind
offshore,
25.4%
Breakdown of electricity generationfrom selected RES-E
in 2012

Renewable Energies versus Nuclear Power – Comparing Financial Support
18
by renewables and, moreover, their potential is far from being exhausted as discussed in the
forthcoming subsection.
4.1.2 Outlook: Role of Nuclear Power and RE in the energy mix
For replacement of the old NPP-fleet, eleven new-builds are planned. For two of the planned reactors
(Hinkley Point C 1&2), the Environmental Impact Assessment procedure is already completed and state
aids have been concluded by the European Commission (see chapter 2.1.1.)
The capacity for all eleven planned units is 15.6 GWe (gross), while the now operating fleet has a
capacity of 10 GWe (net).
For all new-builds, in 2006 a new licensing regime was introduced by the UK government, the Generic
Design Assessment, resulting in generic design authorisations for several reactor types. Also in 2008, a
new system for site selection was put into force, the so-called Nuclear National Policy Statement (NPS).
In the NPS, future sites for nuclear new-build starting in 2025 were evaluated, eight sites were
accepted (WNA, 2014c). The government is promoting nuclear energy with this new policy and also
with financial support (see chapter 2.1.1).
The future role of nuclear power and renewables is depending on the political and societal will as well
as actual policy implementations and general (global) energy market developments. The UK
government is proactive in stating their intention to follow the route taken towards combating climate
change but the technological preferences for doing so appear unclear. Both nuclear and RE deserve
key attention, and the recent statements to support the build-up of a new nuclear power plant (Hinkley
Point C) leave room for uncertainty concerning future RE support.
A more general and independent comparison of different assessments of the possible role of nuclear
power and RE by means of scenarios is done next. Thus, the expected future deployment in relative
terms (i.e. share in gross electricity demand) of both RES-E and nuclear power in the UK is shown in
Figure 8 according to selected scenarios. More precisely, the EC’s (PRIMES) reference scenario of
future energy and transport trends in the EU (EC, 2013b) is used, providing a projection of both
renewables and nuclear power deployment up to 2050. Surprisingly, this conservative scenario
(reflecting only taken and already well planned policy decisions) projects a tremendously strong uptake
of RE in UK’s electricity sector in the period up to 2020 while later on only a slow and steady increase
is becoming apparent, indicating some sort of stagnation. This scenario is then further contrasted with
an alternative (short-term) assessment of RE progress: two scenarios of the European Keep-on-Track!
(KoT) project (see Resch et al. (2014)), assessing how well Member States are on track with respect to
their 2020 RE targets, are depicted, indicating a large gap between the expected (baseline case) and
the required (policy recommendations case) short-term RE progress. Finally, the Green-X scenario of
dedicated RE support as elaborated within this study is shown, reflecting in the short-term a
compromise between both KoT pathways while in the long-term up to 2050 a strong uptake of
renewables is proclaimed for the UK. With respect to nuclear only one trend scenario is applicable (i.e.
the EC’s PRIMES reference case), indicating a short-term decline followed by a mid-term uplift that
leads to similar deployment levels by 2050 as of today.

Renewable Energies versus Nuclear Power – Comparing Financial Support
19
Figure 8: Expected future deployment in relative terms (i.e. share in gross electricity demand) of
RES-E and nuclear power in the UK according to selected scenarios (Source: EC (2013b),
KoT-project (Resch et al., 2014) and own assessment (Green-X))
A closer look on the Green-X scenario of dedicated RE support that has been elaborated within this
study and that takes a central part in the dynamic assessment (see second part of section 4.1.5) is
taken below. Figure 9 provides a detailed overview on future RE deployment according to the assessed
policy pathway, offering a breakdown of the expected future RES-E deployment up to 2050 in the UK
in absolute terms (i.e. electricity generation) by technology (left) and by age cluster (right). The
technology breakdown indicates the dominant role of wind energy today and in the future – i.e. both
on- and offshore are expected to deliver almost two thirds of electricity supply, requiring a well-
tailored power system integration and an extension of grid capabilities and interconnections. Other RE
options like solar or biomass provide comparatively smaller contributions. Of relevance for the
forthcoming comparative assessment of nuclear and RE is also the breakdown by age structure as
provided on the right hand-side of Figure 9: New RES-E plant installed during the period 2011 to 2050
are in focus within the subsequent analysis, in particular the selected RE technologies biomass, small
hydro, PV and wind (on- and offshore). As applicable from this graph, these technologies are expected
to deliver by far the majority of (RE) power supply in the long-term.
Figure 9: Breakdown of the expected future RES-E deployment in the UK in absolute terms (i.e.
electricity generation) by technology (left) and by age cluster (right) according to the
Green-X scenario of dedicated RE support (Source: Own assessment (Green-X))
23.9%
47.0%
93.2%
8.1%
9.1%
16.5%
0%
10%
20%
30%
40%
50%
60%
70%
80%
90%
100%
201
0
201
5
202
0
202
5
203
0
203
5
204
0
204
5
205
0
%
Green-X dedicated RE support
scenario
KoT baseline scenario
KoT policy recommendations scenario
PRIMES reference scenario (RES-Eshare)
PRIMES reference scenario
(nuclear share)
RE
sh
are
in
gro
ss e
lect
rici
tyd
em
an
d
10.8%23.9%
47.0%
79.3%
93.2%
0%
10%
20%
30%
40%
50%
60%
70%
80%
90%
100%
0
50
100
150
200
250
300
350
400
201
2
202
0
203
0
204
0
205
0
TW
h/a
Biomass Hydro small-scale Photovoltaics
Wind onshore Wind offshore Other RES-E
RES-E demand share
0
50
100
150
200
250
300
350
400
20
10
20
20
20
30
20
40
20
50
TW
h/a
Existing RES-Eplant
Selected RES-E
Other RES-ENe
wR
ES
-E
(in
sta
lle
d 2
01
1 t
o 2
05
0)

Renewable Energies versus Nuclear Power – Comparing Financial Support
20
4.1.3 Existing support schemes for RE
In the United Kingdom, the generation of electricity from renewable sources is regulated through a
combination of a Renewable Obligation (RO), i.e. a quota system with tradable green certificates, and
a FIT system (for small-scale plants). Under the FIT, accredited producers whose plants have a capacity
of less than 5 MW can sell their electricity at fixed tariff rates established by the Gas and Electricity
Market Authority (Ofgem). However plants between 50 kW and 5 MW are entitled to choose between
the FIT system and the RO.
Under the RO, electricity suppliers of more than 5 MW capacities are obliged under the Renewables
Obligation Orders to supply a certain proportion of electricity from renewable sources ("quota") to
their customers. A supplier's quota is deemed satisfied if he presents a certain number of green
certificates, i.e. the Renewable Obligation Certificates (ROCs).
The RO was originally set up on a technology neutral basis in order to raise competition between the
various RE technologies applicable, whereby 1 ROC was issued for every 1 MWh of eligible renewable
electricity. From April 2009, the RO has been ‘banded’; the number of ROCs awarded per MWh is
dependent on the technology type in order to provide sufficient incentives for the development of
emerging new RE technology options while at the same time avoiding excess support for mature
technologies like wind shore and biomass cofiring. Thus, support to emerging technologies has been
‘banded-up’ and support to established technologies has been ‘banded down’ (Winkel et al., 2012).
The technologies covered by the RO include: Wind (onshore and offshore), bioenergy (landfill gas,
sewage gas, biomass combustion and cofiring, anaerobic digestion), advanced biomass and waste
conversion technologies (gasification, pyrolysis), solar photovoltaic (PV), hydro, tidal (stream and
impoundment), wave, geothermal and geopressure.
The persons obligated to satisfy a quota according to the Renewables Obligation Orders are those
electricity suppliers that supply electricity to final consumers within the UK. If a supplier fails to satisfy
his quota obligation, he shall make a “late payment”. The late payment is the sum of the buy-out price
plus interest of 5 percentage points above the base rate of the Bank of England. The costs of the quota
system are borne by the consumers through the electricity price (RES LEGAL, n.d.).
The FIT Scheme does not specify a cap. A project will receive the FIT for 20 years (25 years for solar)
and will be guaranteed to remain at the same generation tariff level for the whole support period,
subject to an annual inflationary linked adjustment. Tariffs for new projects for specific technologies
will be reduced annually to reflect expected decreases in technology costs (fixed “degression” rates)
(Winkel et al., 2012).
In the UK commercial and industrial final consumers and the public sector of traditional energy sources
are subject to a Climate Change Levy (CCL), a tax on the consumption of fossil energy. The CCL aims at
reducing greenhouse gases and promoting energy-efficiency in final consumers. The levy for the
obligation period 1 April 2013 – onwards is set at 5.24 £/MWh (6.55 €/MWh) and typically rises
annually according to the retail prices index. The CCL is collected from the electricity suppliers, who
pass it on to their consumers through the electricity price. Furthermore, electricity from renewable
sources is also exempt from the “Carbon Price Floor”, a tax levied on fossil fuels; gas, solid fuels and
liquefied petroleum gas (LPG), that are used for electricity generation.
A RES-E project can be supported by the RO or FIT in addition to other support measures (for example
the Climate Change Levy exemption) but projects cannot receive support under both the RO and the
FIT however (Winkel et al., 2012).
Furthermore, since January 2013 the energy-efficiency scheme “the Green Deal” has been
implementing in the UK. Under this scheme home and business owners may obtain a loan for 45
energy-efficiency measures specified where PV systems are also eligible among others. The loan is paid

Renewable Energies versus Nuclear Power – Comparing Financial Support
21
back through energy bills. According to the Department of Energy and Climate Change (DECC), payback
period may be the lifetime of the measure or a specific period specified in the Green Deal Plan and can
last up to 25 years.
Table 4: Details on current RE support in the UK by assessed RE technology (based on RES LEGAL
(n.d.) and Held et al. (2014))
Biomass FIT: Solid biomass is not eligible under FIT.
RO: As solid biomass, dedicated energy crops and dedicated biomass are eligible. Furthermore cofiring
technologies receive support from RO scheme. Amount of electricity generated using 2013/14 capacity is
set at 0.5 MWh from the dedicated energy crops and 0.67 MWh from the dedicated biomass.
Levels of banded support for the cofiring of biomass, i.e. full or partial conversion of coal-fired power
stations to generate biomass-based electricity, is depending on the range of cofiring. Accordingly, amount
of electricity generated using 2013/14 capacity, to receive one ROC is 2 MWh from low-range cofiring (less
than 50% biomass co-fired in a unit), 1.11 MWh from mid-range cofiring (50% to less than 85% biomass co-
fired in a unit) and 1.66 MWh high-range cofiring systems (85% to less than 100% biomass co-fired in a
unit).
Hydro-
power
RO: Both, small and large hydro generating stations are eligible under the RO. The amount of electricity
generated using 2013/14 capacity is set at about 1.43 MWh to receive one ROC regardless the size of the
hydropower plant.
FIT: Up to 50 MW hydropower is eligible under FIT. FIT level is determined based on system size. From 1
December 2012 to 31 March 2014, total installed capacity of 15 kW or less is supported by 21.65 £p /kWh
(approx. 25.5 €c/kWh), while hydro stations with capacity greater than 2 MW receive 3.23 £p /kWh (approx.
3.8 5 €c/kWh) (Ofgem, 2013a).
PV RO: Building mounted and ground mounted solar PV are both eligible under RO scheme. Using 2013/14
capacity, the amount of electricity (MWh) to be stated in ROCs issued is 0.5882 MWh for building mounted
solar PV systems; while ground mounted solar PV systems have to generate 0.625 MWh to receive one
ROC.
FIT: Up to 50 MW, PV is eligible for the FIT scheme. Payment rate is defined depending on efficiency
parameters (three rates “higher” - H, “middle” - M and “lower” - L) as well as installed capacity size. Tariff
rates for solar PV installations are degressed every quarter (“contingent degression” mechanism) starting
from 1 November, 2012. The payment rates between the period 1 February 2013 and 1 May 2013, for the
high efficient small systems (up to 4kWp) was set at 15.44 £p/kWh (approx. 18.05 €c/kWh), whereas
systems greater than 250 kW received 7.10 £p /kWh (approx. 8.3 €c/kWh) (Ofgem, 2013b) .
Wind RO: Both onshore and offshore wind energy stations are eligible under RO scheme. Offshore wind turbines
expire to be eligible for ROCs after 20 years from their accreditation date. Using 2013/14 capacity, the
amount of electricity (MWh) to be stated in ROCs issued is 1.11 MWh for onshore wind while offshore wind
have to generate a significantly lower amount of electricity (0.5 MWh) to receive one ROC
FIT: Up to 50 MW, wind energy is eligible for the FIT scheme. FIT payment changes i.e. support decreases
with technology size and, from 1 December 2012 to 31 March 2014 the range lay between 21.65 £p/kWh
– 4.62 £p/kWh (Ofgem, 2013a) (approx. 25.5 €c/kWh- 5 €c/kWh). While the former is given to systems
with total installed capacity of 1.5 kW or less the latter is set for the system capacity greater than 1.5 MW.

Renewable Energies versus Nuclear Power – Comparing Financial Support
22
4.1.4 Future requirements concerning support schemes for RE
Figure 10: Future development of remuneration levels and corresponding market values of the
assessed RE technologies in the UK: biomass and small hydropower (left, up), PV (right,
up), wind onshore (left, down) and wind offshore (right, down) according to the Green-X
scenario of dedicated RE support (Source: Own assessment (Green-X))
As applicable in Figure 10, the need to incentivise the deployment decreases for all assessed RE
technologies thanks to technological learning. Thus, within the UK a partly strong decline of cost is
observable for several of the assessed RE technologies, compare e.g. the development of
remuneration levels for offshore wind, and during early years also for onshore wind.
On the contrary, with ongoing market deployment of variable renewables like solar and wind we see
however also an opposing tendency that ultimately may cause an increase in the need for financial
support. This concerns the market value of the produced electricity that is fed into the grid. For these
technologies it is becoming apparent that in future years (with ongoing deployment) a unit of
electricity produced is less valuable than of a dispatchable RE technology like biomass where the plant
may interrupt operation during periods of oversupply (thanks to massive wind and solar power inflow)
and correspondingly low wholesale power prices.
0
25
50
75
100
125
150
20
15
20
20
20
25
20
30
20
35
20
40
20
45
20
50
€/M
Wh
Average remuneration for Photovoltaics
Market value for Photovoltaics
Wholesale electricity price (Market value for other RES-E and Nuclear)
Ne
tsu
pp
ort
in
th
e
case
of
Ph
oto
vo
lta
ics
0
25
50
75
100
125
150
20
15
20
20
20
25
20
30
20
35
20
40
20
45
20
50
€/M
Wh
Average remuneration for Wind onshore
Market value for Wind onshore
Wholesale electricity price (Market value for other RES-E and Nuclear)
Ne
tsu
pp
ort
in
th
e
case
of
Win
d o
nsh
ore
0
25
50
75
100
125
150
20
15
20
20
20
25
20
30
20
35
20
40
20
45
20
50
€/M
Wh
Average remuneration for Wind offshore
Market value for Wind offshore
Wholesale electricity price (Market value for other RES-E and Nuclear)
Ne
tsu
pp
ort
in
th
e
case
of
Win
d o
ffsh
ore

Renewable Energies versus Nuclear Power – Comparing Financial Support
23
Thus, the difference between remuneration and market value determines the required net support.
Figure 10 shows that wind onshore is the first candidate among the assessed technologies to achieve
cost competiveness. Under UK wind conditions it can be expected that this appears likely shortly after
2020. Small hydro and biomass show also a clearly declining gap and follow next. Thanks to the
decreasing market value wind offshore may however still require financial incentives in order to deploy
on the market during the whole assessment period (up to 2050).
4.1.5 Comparison on costs and quantities of nuclear power vs. RE
Static approach: comparison of planned support for nuclear with existing RE support
Figure 11 provides first outcomes of the assessment, offering a comparison of the expected
remuneration levels for Hinkley Point C with those for a new RE power plant (as of 2013) in the UK.
This graph shows also the expected future wholesale electricity prices (on average, normalised over
20 years), representing default earnings for a power producer in the absence of dedicated support.
Note that the difference between total remuneration and wholesale prices determines the required
net support.
Figure 11: Comparison of remuneration levels (and of wholesale electricity prices) for nuclear
power and for assessed RE technologies in the UK (Source: Own calculations, based on
Steinhilber et al. (2011) and Held et al. (2014))
In UK, the average total remuneration is highest in the case of PV (150.2 €/MWh), followed by the wind
offshore (135.6). While average remuneration for wind onshore lies in similar range of planned aid
scheme for nuclear power at Hinkley Point C (105.6 €/MWh), this is lower for biomass cofiring and
small scale hydro- power.
In the case of net support, the difference between total remuneration and wholes prices, is lowest for
small scale hydro-power (18 €/MWh) and highest for PV (81 €/MWh). Net support for nuclear power
and wind onshore comes close; former is about 36 €/MWh, the latter is 35 €/MWh.
Figure 12 indicates the range of possible annual electricity generation from RES-E that could be
promoted in the UK with currently implemented support schemes, taking average remuneration and
net support levels as given, in comparison to planned nuclear power.
105.6
132.5
102.3
87.7
150.2
105.0
135.6
0
20
40
60
80
100
120
140
160
180
Hin
kley
Poi
nt C
(UK)
Bio
ma
ss
(ded
icat
ed
pla
nt)
Bio
ma
ss c
ofi
rin
g
Hyd
ro s
mal
l-sc
ale
Phot
ovo
lta
ik
Win
d on
shor
e
Win
d o
ffsh
ore
€/M
Wh
range of remuneration
average remuneration
average wholesale electricity price
Ne
tsu
pp
ort

Renewable Energies versus Nuclear Power – Comparing Financial Support
24
Possible volumes of annual electricity generation from RE technologies answers the question how
much renewable electricity could be promoted in the UK, if annual net support expenditures as
expected for Hinkley Point C are used for the assessed RE technologies.
Accordingly, it is becoming apparent that with the support level planned for Hinkley Point C a higher
amount of electricity generation could be achieved with small scale hydro-power, biomass cofiring,
and also wind onshore shows a slightly positive outcome. Less competitive from today’s perspective
appear offshore wind power, dedicated (small-scale) biomass plant and, no surprise for a Northern
country like the UK also PV.
Figure 12: Comparison of expected annual electricity generation of Hinkley Point C with feasible
volumes from assessed RE technologies in the UK (Source: Own calculations)
Figure 13: Comparison of required annual net support for nuclear power and for assessed RE
technologies in the UK (Source: Own calculations)
Finally, Figure 13 allows for a different interpretation: taking Hinkley Point C’s targeted volume of
26 TWh annual electricity generations as given; this graph offers a comparison of the required net
support for a new nuclear power plant and for all new RES-E assessed, whereas for RE power plants
technology-specific support schemes as currently implemented in the UK are considered.
It is apparent that, supporting small-scale hydropower is significantly cheaper than nuclear power,
followed by biomass cofiring power plants. Related cost savings range from 50% in the case of small-
hydro to 9% in the case of biomass-cofiring. Furthermore, required annual net support for wind-
0
10
20
30
40
50
60
Bio
mas
s(d
edic
ate
d p
lan
t)
Bio
mas
s co
firi
ng
Hyd
ro s
mal
l-sc
ale
Ph
oto
volt
aik
Win
d o
nsh
ore
Win
d o
ffsh
ore
TW
h/a
Range ofpossible annualelectricitygenerationfrom RES-E
Expectedannualelectricitygeneration ofHinkley Point C(UK)
1634
847
468
2095
918
1713
934
0
500
1,000
1,500
2,000
2,500
Bio
mas
s(d
edic
ated
pla
nt)
Bio
mas
s co
firi
ng
Hyd
ro s
mal
l-sc
ale
Ph
oto
volt
aik
Win
d o
nsh
ore
Win
d o
ffsh
ore
M€
/a
Requiredannual netsupport in thecase of RES-E*
Requiredannual netsupport in thecase of nuclearpower*
Note:*for producing the same amount of electricity as expected to be generated in Hinkley Point C

Renewable Energies versus Nuclear Power – Comparing Financial Support
25
onshore is also slightly lower (2%) than support required for nuclear power to achieve the targeted
electricity generation. Similar to above, offshore wind, dedicated biomass and PV require higher
expenditures to achieve the targeted generation volume.
Dynamic approach: comparison of planned support for nuclear with future RE support
according to a model-based analysis (Green-X)
Building on the Green-X scenario of dedicated RE support and the therein sketched deployment of
renewables in the UK, a comparative assessment of RE support with the planned subsidy for Hinkley
Point C is undertaken below in a dynamic context. More precisely, the years from 2023 to 2050 form
the assessment period whereby 2023 is chosen since this is the year when Hinkley Point is expected to
start full operation. As a first step the amount of expected electricity generation from assessed RE
technologies and from the nuclear power plant at Hinkley Point C is collated. Next to that, related
support expenditures for RES-E and nuclear power are contrasted and, finally, the cost-effectiveness
of the two distinct pathways is derived.
Figure 14 compares the expected future electricity generation from assessed RE technologies and
nuclear power in the UK, indicating deployment over time (left) and cumulative volumes (i.e. 2023 to
2050) (right) with details expressed by RE technology. Note that for renewables only electricity
generation that stems from new biomass, small hydro, wind or photovoltaic plants (installed between
2011 and 2050) is considered. As discussed in section 4.1.2 a strong uptake of the assessed RE
technologies is expected for the focal period, leading to a seven times higher cumulative electricity
generation than at Hinkley Point C. Wind onshore is expected to provide about half of the total RE
volumes, followed by offshore wind and biomass.
Figure 14: Comparison of expected future electricity generation from assessed RE technologies and
nuclear power in the UK according to the Green-X scenario of dedicated RE support:
development over time (left) and cumulative volumes (2023 to 2050) (right) by RE
technology (Source: Own assessment (Green-X))
Complementary to above, Figure 15 shows the development over time of remuneration levels and the
corresponding reference price for the assessed technology options, using weighted average figures to
determine market value and the remuneration level for the aggregated RE technology cluster that
comprises the basket of assessed individual RE technologies. The need for net support for a new
installation in a given year can then be derived by subtracting the market value from overall
0
50
100
150
200
250
300
202
1
202
3
202
5
202
7
202
9
203
1
203
3
203
5
203
7
203
9
204
1
204
3
204
5
204
7
204
9
TW
h/a
Electricity generation from selected new RES-E (installed 2011 to 2050)
Electricity generation from Nuclear (Hinkley Point C)
Electricity generation in the period 2023 to 2050

Renewable Energies versus Nuclear Power – Comparing Financial Support
26
remuneration. This allows for a first interpretation of cost efficiency. For nuclear it can be observed
that during early years of operation a significant gap between remuneration and market value, in this
case determined by the yearly average wholesale electricity price, occurs. This is however getting
smaller in later years thanks to the expected increase in wholesale electricity prices (that goes hand in
hand with an increase of fossil fuel and carbon prices over time). For renewables an interpretation
appears more difficult since outcomes reflect the over shading impacts of a basket of technologies that
come into play: In early years a strong decline of remuneration levels is apparent, reflecting expected
technological progress across all technologies but, thanks to their dominance driven by cost trends for
on- and offshore wind. In later years, with increasing deployment the merit-order-effect and the
related decrease in market values of variable renewables shows effect. Offshore wind is then
responsible for the remuneration being higher than the market value but similar to nuclear the need
for net support shows a decreasing tendency in the final years up to 2050.
Figure 15: Future development of remuneration levels and corresponding market values of the
assessed RE technologies (as aggregate) and of nuclear power in the UK according to the
Green-X scenario of dedicated RE support (Source: Own assessment (Green-X))
In accordance with above, Figure 16 provides a comparison of support expenditures for assessed RE
technologies and nuclear power in the UK, illustrating the development over time (left) and in
cumulative volumes (2023 to 2050) (right) with details for the assessed RE technologies. A closer look
at the dynamic development reveals the declining trend for nuclear power as discussed above and the
strong increase of support expenditures for the selected RE technologies in the period up to 2035 that
goes hand in hand with the uptake of deployment. In later years also for renewables a strong decline
of support expenditures thanks to the phase out of support for installations after their guaranteed
duration but mainly as a consequence of technological progress and the replacement of previously
strongly supported renewables by new installations that do no longer require incentives (e.g. wind
onshore). In cumulative terms a factor is 6.3 between RE and nuclear support can be deducted,
meaning that the seven times higher volumes of cumulative electricity generation that stem from
renewable sources require only more slightly than about six times higher support in total. Offshore
wind is generally responsible for the major part of related support requirements. Thus, if a lower
offshore deployment than the one sketched here would be anticipated a significant decrease in the
need for support for renewables would occur.
0
25
50
75
100
125
201
5
202
0
202
5
203
0
203
5
204
0
204
5
205
0
€/M
Wh
Average remuneration forselected RES-E
Average market value for
selected RES-E
Average remuneration forNuclear (Hinkley Point C)
Wholesale electricity price
(Market value for other RES-E
and Nuclear)
Ne
tsu
pp
ort
in
th
e
case
of
RE
Ne
tsu
pp
ort
in
th
e
case
of
Nu
cle
ar

Renewable Energies versus Nuclear Power – Comparing Financial Support
27
Figure 16: Comparison of expected support expenditures for assessed RE technologies and nuclear
power in the UK according to the Green-X scenario of dedicated RE support:
development over time (left) and cumulative volumes (2023 to 2050) (right) by RE
technology (Source: Own assessment (Green-X))
Figure 17: Comparison of overall cost-effectiveness: Specific net support for assessed RE
technologies and nuclear power in the UK according to the Green-X scenario of
dedicated RE support (Source: Own assessment (Green-X))
Comparing both the cumulative amount of electricity generated and the corresponding support
expenditures that would arise throughout the assessment period (2023 to 2050) finally an overall
concluding assessment of the cost effectiveness can be derived: As indicated by the results on specific
net support shown in Figure 17 the conclusion can be drawn that supporting a basket of RE
technologies as analyzed in this assessment shows a 9.5% higher cost-effectiveness than the planned
support for Hinkley Point C that served as nuclear comparator throughout this exercise. Offshore wind
energy is here the key determinant on the renewables side – i.e. a lower deployment than the one
anticipated here would lead to a further increase of the cost effectiveness from a renewable
0.0
0.5
1.0
1.5
2.0
2.5
3.0
3.5
4.0
202
1
202
3
202
5
202
7
202
9
203
1
203
3
203
5
203
7
203
9
204
1
204
3
204
5
204
7
204
9
bil
lio
n €
/ a
Net support for selected RES-E
Net support for Nuclear (Hinkley Point C)
Net support in the period 2023 to 2050
10.7
0
10
20
30
40
50
60
70
80
Nuclear RES-E(selected)
bil
lio
n €
/ a
Nuclear (Hinkley Point C)
Wind offshore
Wind onshore
Photovoltaics
Hydro small-scale
Biomass
69.3
547% higher
support
expenditures
Cu
mm
ula
tive
(202
3 t
o 2
050
)
sup
po
rt e
xpe
nd
itu
res
14.0
15.3
0
2
4
6
8
10
12
14
16
18
Nuclear RES-E (selected)
€/M
Wh
Specific net support for Nuclear(Hinkley Point C)
Specific net support for selected RES-E
8.5% higher
cost effectiveness

Renewable Energies versus Nuclear Power – Comparing Financial Support
28
perspective. The UK has the potential to compensate a lack of deployment in offshore by onshore wind
– however this would require further progress in spatial planning, in grid developments, and a clear
commitment among the whole society to mitigate prevailing societal constraints towards this cheap
way of providing electricity supply in a sustainable manner.

Renewable Energies versus Nuclear Power – Comparing Financial Support
29
4.2 Germany
4.2.1 Status Quo: Role of Nuclear Power and RE in the energy mix
In Germany, the first NPP went into operation in 1966. In the 1970ies and 80ies, 31 units were built in
Western and Eastern Germany.
Four units have been shut-down between 1974 and 1988, seven reactors followed in 1990 after the
German reunification.
Germany’s energy policy has changed quite often in the last decades. In 2000, after the Green Party
has joined a coalition government with the Socialist Party, a nuclear phase-out started with a change
of the Atomic Law. The so-called “nuclear consensus” included the prohibition of nuclear new-build,
the limitation of the lifetime of operating NPPs and the amount of electric energy they were allowed
to produce. In this period, three units were shutdown permanently until 2005.
In 2010, after political changes, lifetime extensions of several years for the German NPPs were decided
upon. Shortly after that, in 2011, the severe accident in Fukushima happened and forced the German
Government to another change in its nuclear policy. Of the remaining 17 reactors, the oldest and most
unsafe eight reactor units were shut-down Also the Atomic Law was changed again: For the remaining
nine reactors, shutdown dates until 2022 were fixed.
In 2014, nine units in eight sites are in operation with a capacity of 20.3 GWe (net).
Figure 18: Breakdown of total electricity generation in 2012 for Germany (left), with details for
assessed selected RE technologies (right) (Source: Eurostat, KoT-project (Resch et al.,
2014))
As shown in Figure 18 in 2012 the major share of electricity generated in Germany stems from fossil
fuel-fired power plants: more than half of total power supply was produced in gas-, coal-fired power
plants. Next to fossil fuels, the aggregate of RES-E technologies is the second largest contributor
followed by nuclear, holding a share around 18.5% in power supply. In comparison to other analysed
countries, in Germany renewables play a decisive role in total electricity generation thanks to strong
policy initiatives taken in prior. The share of RE in gross electricity demand grew from 18.1% in 2010
Nuclear,
18.5%
Fossil, 57.9%
Selected
RES-E, 15.9%
Other RES-E,
7.7%
Breakdown of total electricity generation in 2012
Biomass,
9.7%
Hydro small-
scale, 8.1%
Photovoltaics,
28.4%
Wind
onshore,
53.0%
Wind
offshore, 0.8%
Breakdown of electricity generationfrom selected RES-E
in 2012

Renewable Energies versus Nuclear Power – Comparing Financial Support
30
to 23.6% (2012) within two years. Onshore wind and PV are dominating in the German RE electricity
mix. They both have delivered more than 80% of all renewable electricity produced in 2012.
4.2.2 Outlook: Role of Nuclear Power and RE in the energy mix
Until 2022, all remaining reactors will be shutdown permanently, starting in 2015. According to the
last changes in Atomic Law, no new builds are planned. Moreover, Germany decided to stop funding
export credit insurance for foreign NPPs (BMWI, 2014). However, environmental NGOs suspect that
the issue of lifetime extensions could be raised again at the 2017 election (BUND, 2014).
Germany is in the middle of a massive transition of its energy system. Nuclear power is being phased
out whereas renewables are gradually increasing their deployment. Some of the key objectives of the
German Energy Transition can be summarized as follows (co2online, n.d.):
• Phasing-out nuclear power plant by end of 2022
• Increasing the RE share in gross final energy consumption to 18% by 2020, 30% by 2030, 45%
by 2040 and 60 % by 2050.
• Increasing the RE share in gross electricity consumption to 35% by 2020, 50% by 2030, 65% by
2040 and 80% by 2050.
• Reduction of greenhouse gas (GHG) emissions by 40% in 2020, 55% in 2030, 70% in 2040 and
80-95 % in 2050 compared with1990 levels.
• Reduction of primary energy consumption by 20% in 2020 and by 50% in 2050
Below we undertake a more general and independent comparison of different assessments of the
possible role of nuclear power and RE by means of scenarios. Thus, Figure 19 shows the expected
future deployment in relative terms (i.e. share in gross electricity demand) of both RES-E and nuclear
power in Germany according to selected scenarios10, namely the EC’s latest PRIMES reference scenario
(RE and nuclear share), KoT baseline and KoT policy recommendation scenarios and the Green-X
scenario of “dedicated RE support” as developed within this study.
The reference scenario from PRIMES on nuclear and RE consider only already planned policy decisions.
In this respect, in Germany the share of nuclear power in gross electricity demand is declining gradually
within the period up to around 2025 when nuclear power is phased-out completely. The ambitious RE
targets and country’s strong policies to achieve these, have been reflected in the PRIMES reference
scenario. Accordingly, this scenario foresees 36.4% RE share by 2020 in gross electricity demand, which
exceeds countries target of 35% for the given period. The KoT baseline scenario indicates that Germany
is well on track with respect of its 2020 RE targets, and it is expected that the RE share in gross
electricity demand will be about 38%. However, The KoT policy recommendation scenario points out
that the short-term RE deployment could be considerably higher. The long-term Green-X and PRIMES
reference scenarios on RE up to 2050 proclaim a similar deployment of renewables. However both
scenarios show that under the specific assumptions taken on future RE support the domestically
achievable RE share by 2050 remains under the targeted level of 80% by 2050 as declared in the
“German energy transition”. This is however not surprisingly since Germany aims for renewable
electricity imports e.g. from North Africa to complement domestic generation in the long-term.
10 For more details on scenarios, please see session 4.1.2 where the scenarios are introduced in further detail exemplarily for the UK.

Renewable Energies versus Nuclear Power – Comparing Financial Support
31
Figure 19: Expected future deployment in relative terms (i.e. share in gross electricity demand) of
RES-E and nuclear power in Germany according to selected scenarios (Source: EC
(2013b), KoT-project (Resch et al., 2014) and own assessment (Green-X))
Next we analyse in further detail the Green-X scenario of dedicated RE support as elaborated within
this study and that forms a central part in the dynamic assessment (see second part of section 4.2.5).
A detailed overview on future RE deployment according to the assessed policy pathway is given by
Figure 20. This graph shows the expected future RES-E deployment in Germany up to 2050 in absolute
terms (i.e. electricity generation) by technology (left) and by age cluster (right). The technology
breakdown indicates the dominance of wind and solar energy today and in the future, requiring an
efficient integration of RE into the power system and an extension of grid capabilities and
interconnections with German’s neighbours. Other RE options like biomass or hydro contribute to a
smaller extent. Of relevance for the forthcoming comparative assessment of nuclear and RE is also the
breakdown by age structure as shown on the right hand-side of Figure 20: New RES-E installations in
the period 2011 to 2050 are in focus within the subsequent assessment, in particular the selected RE
technologies biomass, small hydro, PV and wind (on- and offshore). As applicable from this graph,
these technologies are expected to deliver by far the majority of (RE) power supply in the long-term.
Figure 20: Breakdown of the expected future RES-E deployment in Germany in absolute terms (i.e.
electricity generation) by technology (left) and by age cluster (right) according to the
Green-X scenario of dedicated RE support (Source: Own assessment (Green-X))
40.3%
49.6%
65.0%
5.3% 0.0% 0.0%0%
10%
20%
30%
40%
50%
60%
70%
201
0
201
5
202
0
202
5
203
0
203
5
204
0
204
5
205
0
%
Green-X dedicated RE support
scenario
KoT baseline scenario
KoT policy recommendations scenario
PRIMES reference scenario (RES-Eshare)
PRIMES reference scenario
(nuclear share)
RE
sh
are
in
gro
ss e
lect
rici
tyd
em
an
d
23.6%
40.3%
49.6%
55.0%
65.0%
0%
10%
20%
30%
40%
50%
60%
70%
0
50
100
150
200
250
300
350
400
201
2
202
0
203
0
204
0
205
0
TW
h/a
Biomass Hydro small-scale Photovoltaics
Wind onshore Wind offshore Other RES-E
RES-E demand share
0
50
100
150
200
250
300
350
400
20
10
20
20
20
30
20
40
20
50
TW
h/a
Existing RES-Eplant
Selected RES-E
Other RES-ENe
wR
ES
-E
(in
sta
lle
d 2
01
1 t
o 2
05
0)

Renewable Energies versus Nuclear Power – Comparing Financial Support
32
4.2.3 Existing support schemes for RE
In Germany, electricity from renewable sources is supported through a feed-in tariff. The criteria for
eligibility and the tariff levels are set out in the Act on Granting Priority to Renewable Energy Sources
(EEG). According to this Act, operators of RE plants are statutorily entitled against the grid operator to
payments for electricity exported to the grid.
Tariff levels are differentiated by technology, project size, locations and used raw materials. The
amount of tariff for a given plant is the tariff level as defined by law for the year 2012 minus the
predefined degression rate, which depends on the technology and the year in which the plant was put
into operation. However, tariff levels for solar energy are defined by a more complex procedure that
takes into account recent progress. Thus, actual tariffs for PV are published by the Federal Network
Agency (Bundesnetzagentur) every three months (RES LEGAL, n.d.).
Except solar energy, there is no cap on the volume of new installations. For solar energy, an overall
legal cap of 52,000 MW is introduced and a yearly margin of 2,500 to 3,500 MW newly installed
capacity is envisaged. Eligibility payment period is usually 20 years (RES LEGAL, n.d.). The costs of
supporting RE, i.e. the support expenditures, are allocated to the final electricity consumers.
The EEG also introduced the so-called market premium and the flexibility premium (only for biogas
plant) for plant operators. RES-E plant operators may choose to sell their electricity directly to a third
party by a supply agreement or at the stock market, and claim the so-called market premium from the
grid operator (RES LEGAL, n.d.).
Moreover, state owned development Bank KfW (Kreditanstalt für Wiederaufbau, meaning
Reconstruction Credit Institute) provides different long-term and low interest loans for investment in
new RE plants. A project can profit from the feed-in tariff scheme in combination with low interest
loans (Steinhilber et al., 2011). The standard KfW Renewable Energy Programme gives credit up to € 25
million with a fixed interest period of 5 or 10 years including a repayment-free start-up period.
Effective interest rates per year vary between 1.31% and 7.56% depending on the credit period, the
repayment-free start-up period and the duration of fixed interest rate. Except offshore wind, all RE
technologies assessed within this study are eligible under this programme.
Table 5: Details on current RE support in Germany by assessed RE technology (based on RES
LEGAL (n.d.) and Held et al. (2014))
Biomass FIT: The amount of tariff set for solid biomass in 2013 is 6 (up to 20 MW) and 14.3 (up to 150kW) €c/kWh
plus (if applicable) a bonus of 2.5 – 8 €c/kWh for use of special substances. Yearly degression rate is 2%
from 2013 onwards.
Biomass cofiring is not eligible under the FIT scheme.
Hydro-
power
FIT: Both small and large hydropower power plants are eligible under FIT. The amount of FIT for power
plants commissioned in 2013 is changing between 12.57 €c/kWh (up to 500 kW) and 5.45 €c/kWh (up to
10 MW) for small hydropower plants. As of 2013, FIT for large hydropower plants lie between 5.25 €c/kWh
(up to 20 MW) and 3.37 €c/kWh (over 50 MW). Yearly degression rate for hydropower is from 2013 onwards
1%.
PV FIT: The amount of tariff depends on the site of production and the installed capacity. There is also a
difference between building-mounted systems (roofs, facades, noise barriers) and ground-mounted
systems. Yearly average of FIT in 2013 is 15.58 €c/kWh for systems up to 10 kW and 10.58 €c/kWh for
larger systems (up to 10 MW).
Wind FIT: Both onshore and offshore wind energy stations are eligible under FIT scheme if they fulfill technical
requirements. Electricity from Offshore wind plants if they are located in protected areas.

Renewable Energies versus Nuclear Power – Comparing Financial Support
33
Amount of tariff in 2013 for onshore wind is 5.27 – 9.76 €c/kWh (according to duration of payment) plus
repowering bonus of about 0.49 €c/kWh (if applicable) and plant service bonus of 0.47 €c/kWh.
For offshore wind, initial tariff is 15 €c/kWh for the first 12 years. Then plants receive the base tariff of
3.5 €c/kWh. The plant operator may choose an acceleration model and receive a tariff of 19 €c/kWh for the
first 8 years.
The degression rate for onshore wind is 1.5% from 2013 onwards, till 2007, currently there is no degression
for offshore wind but from 2018 onwards it is set at 7%.
4.2.4 Future requirements concerning support schemes for RE
Figure 21: Future development of remuneration levels and corresponding market values of the
assessed RE technologies in Germany: biomass and small hydropower (left, up), PV
(right, up), wind onshore (left, down) and wind offshore (right, down) according to the
Green-X scenario of dedicated RE support (Source: Own assessment (Green-X))
As explained principally in section 3.2 and discussed with further detail for the case of the UK, the
difference between remuneration and market value determines the required net support for a certain
RE technology. Figure 21 shows that, similar to the UK, wind onshore is the first candidate among the
0
25
50
75
100
125
150
20
15
20
20
20
25
20
30
20
35
20
40
20
45
20
50
€/M
Wh
Average remuneration for Photovoltaics
Market value for Photovoltaics
Wholesale electricity price (Market value for other RES-E and Nuclear)
Ne
tsu
pp
ort
in
th
e
case
of
Ph
oto
vo
lta
ics
0
25
50
75
100
125
150
20
15
20
20
20
25
20
30
20
35
20
40
20
45
20
50
€/M
Wh
Average remuneration for Wind onshore
Market value for Wind onshore
Wholesale electricity price (Market value for other RES-E and Nuclear)
Ne
tsu
pp
ort
in
th
e
case
of
Win
d o
nsh
ore
0
25
50
75
100
125
150
20
15
20
20
20
25
20
30
20
35
20
40
20
45
20
50
€/M
Wh
Average remuneration for Wind offshore
Market value for Wind offshore
Wholesale electricity price (Market value for other RES-E and Nuclear)
Ne
tsu
pp
ort
in
th
e
case
of
Win
d o
ffsh
ore
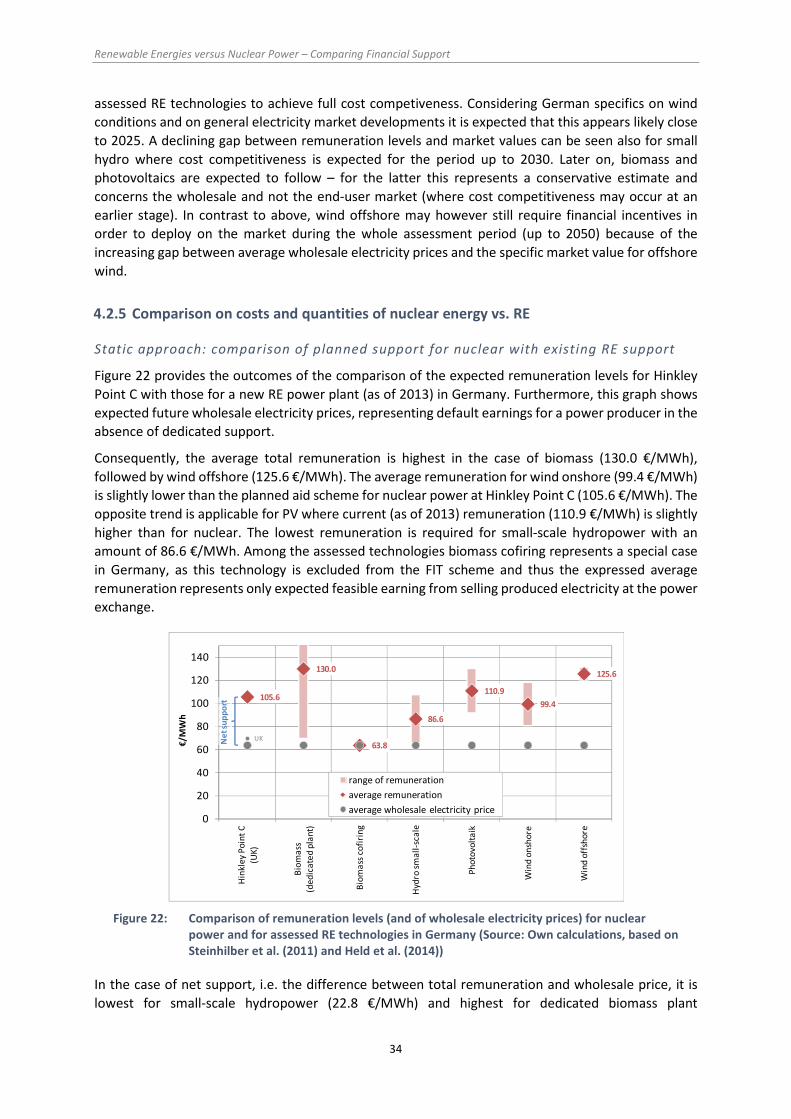
Renewable Energies versus Nuclear Power – Comparing Financial Support
34
assessed RE technologies to achieve full cost competiveness. Considering German specifics on wind
conditions and on general electricity market developments it is expected that this appears likely close
to 2025. A declining gap between remuneration levels and market values can be seen also for small
hydro where cost competitiveness is expected for the period up to 2030. Later on, biomass and
photovoltaics are expected to follow – for the latter this represents a conservative estimate and
concerns the wholesale and not the end-user market (where cost competitiveness may occur at an
earlier stage). In contrast to above, wind offshore may however still require financial incentives in
order to deploy on the market during the whole assessment period (up to 2050) because of the
increasing gap between average wholesale electricity prices and the specific market value for offshore
wind.
4.2.5 Comparison on costs and quantities of nuclear energy vs. RE
Static approach: comparison of planned support for nuclear with existing RE support
Figure 22 provides the outcomes of the comparison of the expected remuneration levels for Hinkley
Point C with those for a new RE power plant (as of 2013) in Germany. Furthermore, this graph shows
expected future wholesale electricity prices, representing default earnings for a power producer in the
absence of dedicated support.
Consequently, the average total remuneration is highest in the case of biomass (130.0 €/MWh),
followed by wind offshore (125.6 €/MWh). The average remuneration for wind onshore (99.4 €/MWh)
is slightly lower than the planned aid scheme for nuclear power at Hinkley Point C (105.6 €/MWh). The
opposite trend is applicable for PV where current (as of 2013) remuneration (110.9 €/MWh) is slightly
higher than for nuclear. The lowest remuneration is required for small-scale hydropower with an
amount of 86.6 €/MWh. Among the assessed technologies biomass cofiring represents a special case
in Germany, as this technology is excluded from the FIT scheme and thus the expressed average
remuneration represents only expected feasible earning from selling produced electricity at the power
exchange.
Figure 22: Comparison of remuneration levels (and of wholesale electricity prices) for nuclear
power and for assessed RE technologies in Germany (Source: Own calculations, based on
Steinhilber et al. (2011) and Held et al. (2014))
In the case of net support, i.e. the difference between total remuneration and wholesale price, it is
lowest for small-scale hydropower (22.8 €/MWh) and highest for dedicated biomass plant
105.6
130.0
63.8
86.6
110.9
99.4
125.6
UK
0
20
40
60
80
100
120
140
Hin
kley
Poi
nt C
(UK)
Bio
ma
ss
(ded
icat
ed
pla
nt)
Bio
ma
ss c
ofi
rin
g
Hyd
ro s
mal
l-sc
ale
Phot
ovo
lta
ik
Win
d on
shor
e
Win
d o
ffsh
ore
€/M
Wh
range of remuneration
average remuneration
average wholesale electricity price
Ne
tsu
pp
ort

Renewable Energies versus Nuclear Power – Comparing Financial Support
35
(66.2 €/MWh) followed by wind offshore (61.8 €/MWh). Net support for nuclear power, wind onshore
and PV come close: considering German wholesale prices a new nuclear power plant as the one
planned at Hinkley Point C would receive 41.8 €/MWh while in the case of wind onshore net support
is 35.6 €/MWh, and for PV net support amounts to 47.1 €/MWh at present.
Figure 23 indicates the range of possible annual electricity generation from RES-E that could be
promoted in Germany with currently implemented support schemes, taking average remuneration
and net support levels as given, in comparison to planned nuclear power in the UK. Possible volumes
of annual electricity generation from RE technologies indicate how much RE electricity could be
promoted in Germany, if annual net support expenditures as expected for Hinkley Point C are used for
the assessed RE technologies in this country.
More precisely, the lower boundary of possible volumes answers the question how much renewable
electricity could be promoted by different technologies, if annual net support expenditures as
expected for Hinkley Point C in the UK, are used in Germany. If a new nuclear power plant like the one
planned for Hinkley Point C is constructed in assessed countries under similar support conditions as
planned for the UK (i.e. same FIT level as set in the UK), the net support level would differ from country
to country because of different electricity wholesale prices. The upper range in Figure 23 is
consequently taking into account this difference, using German wholesale prices and corresponding
annual net support expenditures, and showing how much electricity generation could be achieved with
that for the assessed RE technologies.
Accordingly, with the support level planned for Hinkley Point C a higher amount of electricity
generation could be achieved with small-scale hydropower and onshore wind. Among other
technologies, PV comes closest to nuclear generation with about 20-23 TWh/a (compared to 26 TWh/a
in the case of Hinkley Point C). Less competitive from today’s perspective appear offshore wind power
and dedicated (small-scale) biomass plant.
Figure 23: Comparison of expected annual electricity generation of Hinkley Point C with feasible
volumes from assessed RE technologies in Germany (Source: Own calculations)
Taking into account Hinkley Point C’s targeted annual electricity generation of 26 TWh/a, Figure 24
offers a comparison of the required net support for a new nuclear power plant and for assessed RE
technologies. For the RE power plants technology-specific support schemes currently implemented in
Germany as well as German wholesale electricity prices are considered. Required annual net support
for nuclear power is shown through two options, i.e. considering UK or German wholesale electricity
prices.
0
5
10
15
20
25
30
35
40
45
50
Bio
mas
s(d
edic
ate
d p
lan
t)
Bio
mas
s co
firi
ng
Hyd
ro s
mal
l-sc
ale
Ph
oto
volt
aik
Win
d o
nsh
ore
Win
d o
ffsh
ore
TW
h/a
Range ofpossible annualelectricitygenerationfrom RES-E
Expectedannualelectricitygeneration ofHinkley Point C(UK)

Renewable Energies versus Nuclear Power – Comparing Financial Support
36
Figure 24: Comparison of required annual net support for nuclear power and for assessed RE
technologies in Germany (Source: Own calculations)
Consequently, required annual net support for nuclear power would be higher in Germany since
wholesale electricity prices are lower than in the UK. It is apparent that, supporting small-scale
hydropower is significantly cheaper and related cost saving range up to 45% (compared to nuclear
power), followed by onshore wind with savings up to 15%. Similar to the case of RE technologies in the
UK, offshore wind, dedicated biomass and PV require higher expenditures to achieve the targeted
generation volume of 26 TWh/a in Germany.
Dynamic approach: comparison of planned support for nuclear with future RE support
according to a model-based analysis (Green-X)
Building on the Green-X scenario of dedicated RE support and the accordingly derived future
developments of renewables in Germany, a comparative assessment of RE support with the planned
subsidy for a nuclear power plant (at the example of Hinkley Point C) is undertaken below in a dynamic
context. More precisely, the years from 2023 to 2050 form the assessment period whereby 2023 is
chosen since this is the year when Hinkley Point C is expected to start full operation. To start with, first
the amount of expected electricity generation from assessed RE technologies and from the nuclear
power plant at Hinkley Point C is compared. Later on related support expenditures for RES-E and
nuclear power are contrasted considering German circumstances and, finally, the cost-effectiveness
of the two distinct pathways is derived.
For the case of Germany Figure 25 offers a comparison of the expected future electricity generation
from assessed RE technologies with nuclear power, indicating deployment over time (left) and
cumulative volumes (i.e. 2023 to 2050) (right) with details expressed by RE technology.11 In Germany
a strong uptake of the assessed RE technologies is expected for the focal period, leading to nearly nine
times higher cumulative electricity generation than at Hinkley Point C. The lion’s share of that is
expected to come from wind onshore, followed by PV, biomass and wind offshore.
11 Note that for renewables only electricity generation from new biomass, small hydro, wind or photovoltaic plants (installed between 2011
and 2050) is considered.
1721
0
593
1225
926
1608
934
1087
0
200
400
600
800
1,000
1,200
1,400
1,600
1,800
2,000
Bio
mas
s(d
edic
ated
pla
nt)
Bio
mas
s co
firi
ng
Hyd
ro s
mal
l-sc
ale
Ph
oto
volt
aik
Win
d o
nsh
ore
Win
d o
ffsh
ore
M€
/a
Requiredannual netsupport in thecase of RES-E*
… considering UK wholesale electricity prices
… considering country-specific wholesale electricity prices
Note:*for producing the same amount of electricity as expected to be generated in Hinkley Point C
Re
qu
ire
d a
nn
ual
ne
t su
pp
ort
in
th
e c
ase
of
nu
cele
ar*

Renewable Energies versus Nuclear Power – Comparing Financial Support
37
Figure 25: Comparison of expected future electricity generation from assessed RE technologies and
nuclear power in Germany according to the Green-X scenario of dedicated RE support:
development over time (left) and cumulative volumes (2023 to 2050) (right) by RE
technology (Source: Own assessment (Green-X))
Complementary to above, the future development of remuneration levels and the corresponding
reference market values is shown in Figure 26 for the assessed technology, using weighted average
figures to determine market value and remuneration level for the aggregated RE technology cluster
that comprises the basket of assessed individual RE technologies. For determining the need for net
support for a new installation in a given year the market value can then be subtracted from overall
remuneration. This allows for a first interpretation of cost efficiency.
Figure 26: Future development of remuneration levels and corresponding market values of the
assessed RE technologies (as aggregate) and of nuclear power in Germany according to
the Green-X scenario of dedicated RE support (Source: Own assessment (Green-X))
For nuclear power it can be seen that during early years of operation a significant gap between
remuneration and market value, in this case determined by the yearly average wholesale electricity
price, occurs. This is however getting smaller in later years thanks to the expected increase in
0
50
100
150
200
250
300
350
202
1
202
3
202
5
202
7
202
9
203
1
203
3
203
5
203
7
203
9
204
1
204
3
204
5
204
7
204
9
TW
h/a
Electricity generation from selected new RES-E (installed 2011 to 2050)
Electricity generation from Nuclear (Hinkley Point C)
Electricity generation in the period 2023 to 2050
0
25
50
75
100
125
201
5
202
0
202
5
203
0
203
5
204
0
204
5
205
0
€/M
Wh
Average remuneration forselected RES-E
Average market value for
selected RES-E
Average remuneration forNuclear (Hinkley Point C)
Wholesale electricity price
(Market value for other RES-E
and Nuclear)
Ne
tsu
pp
ort
in
th
e
case
of
RE
Ne
tsu
pp
ort
in
th
e
case
of
Nu
cle
ar

Renewable Energies versus Nuclear Power – Comparing Financial Support
38
wholesale electricity prices (that goes hand in hand with an increase of fossil fuel and carbon prices
over time). For renewables an interpretation appears more difficult since outcomes reflect the over
shading impacts of a basket of technologies that come into play: In the period between 2020 and 2040
remuneration levels decline comparatively strong, reflecting expected technological progress across
all technologies, and in particular of offshore wind and PV. With increasing deployment of variable RE
technologies, specifically from 2025 onwards, the merit-order-effect and the related decrease in
market values shows a significant effect. In later years close to 2050 in particular offshore wind is then
responsible for the small remaining gap between remuneration and the market value for renewables.
In accordance with above, Figure 27 shows a comparison of support expenditures for assessed RE
technologies and nuclear power for the case of Germany, illustrating the development over time (left)
and in cumulative volumes (2023 to 2050) (right) with details for the assessed RE technologies. For
nuclear power a steady decline of net support can be identified but until 2050 a gap between
remuneration and earnings from selling electricity on the wholesale market remains. Such a gap is also
apparent for renewables and, thanks to the stronger deployment of RES-E, even larger in magnitude.
The overall cost decline is however much more tremendous in the case of renewables: net support
expenditures for assessed RE technologies decrease from more than € 5 billion per year to less € 0.6
billion in the period 2025 to 2040. This strong decline is caused by the phase out of support for
installations after their guaranteed duration, by technological progress and, probably most significant
in magnitude, by the replacement of previously strongly supported renewables by new installations
that do no longer require (significant) incentives (e.g. PV and wind onshore). In cumulative terms a
factor of 5.4 between RE and nuclear support can be deducted, meaning that the nine times higher
volumes of cumulative electricity generation from renewables require only about 5.4 times higher
support in total. A closer look at technology level indicates that photovoltaics and offshore wind are
generally responsible for the major part of related support expenditures.
Figure 27: Comparison of expected support expenditures for assessed RE technologies and nuclear
power in Germany according to the Green-X scenario of dedicated RE support:
development over time (left) and cumulative volumes (2023 to 2050) (right) by RE
technology (Source: Own assessment (Green-X))
Finally we can undertake a concluding assessment of the cost effectiveness of supporting renewables
versus nuclear power: comparing both the cumulative amount of electricity generated and the
corresponding support expenditures that would arise throughout the assessment period (2023 to
0.0
1.0
2.0
3.0
4.0
5.0
6.0
202
1
202
3
202
5
202
7
202
9
203
1
203
3
203
5
203
7
203
9
204
1
204
3
204
5
204
7
204
9
bil
lio
n €
/ a
Net support for selected RES-E
Net support for Nuclear (Hinkley Point C)
Net support in the period 2023 to 2050

Renewable Energies versus Nuclear Power – Comparing Financial Support
39
2050) the specific net support for both options can be calculated. Thus, Figure 27 shows the specific
net support for nuclear power and assessed RE technologies for the case of Germany. The conclusion
can be drawn that supporting a basket of RE technologies as analyzed in this assessment shows a 39%
higher cost-effectiveness than the planned support at Hinkley Point C that served as nuclear
comparator throughout this exercise. This strongly support the German’s position to bring forward the
“Energy Transition” building to a large extent on a strong uptake of renewables and increase of energy
efficiency while neglecting nuclear power as alternative low carbon technology option.
Figure 28: Comparison of overall cost-effectiveness: Specific net support for assessed RE
technologies and nuclear power in Germany according to the Green-X scenario of
dedicated RE support (Source: Own assessment (Green-X))
9.3
15.3
0
2
4
6
8
10
12
14
16
18
Nuclear RES-E (selected)
€/M
Wh
Specific net support for Nuclear(Hinkley Point C)
Specific net support for selected RES-E
39.1% higher
cost effectiveness

Renewable Energies versus Nuclear Power – Comparing Financial Support
40
4.3 France
4.3.1 Status Quo: Role of Nuclear Power and RE in the energy mix
France has by far the most NPPs in the EU (see also table 1). 58 reactors in 19 sites are in operation,
12 have been shut down permanently. Also the reprocessing facility in La Hague is in operation, as are
facilities for uranium conversion and enrichment, fuel fabrication, and plutonium facilities. The
average age of the reactors is nearly 30 years (Schneider et al., 2014).
France is the worldwide largest net exporter of electricity produced by nuclear (in parallel it is an
important importer of power from Germany) (Schneider et al., 2014). France is also very active in
exporting nuclear technology.
Figure 29: Breakdown of total electricity generation in 2012 for France (left), with details for
assessed selected RE technologies (right) (Source: Eurostat, KoT-project (Resch et al.,
2014))
In France the majority of electricity is generated from nuclear power plants, holding a share around
74.8% in total electricity generation in 2012. Currently, renewables are the second largest contributor
in power supply. Among the assessed selected RE technologies, onshore wind energy produced more
than half of all electricity, followed by small hydro that added a quarter to the total. Despite nuclear
dominance, the share of RE in the electricity mix has been increasing in France too; e.g. implemented
support schemes allowed for a growth of share of RE in gross electricity demand from 14.9% in 2010
to 16.6% in 2012.
4.3.2 Outlook: Role of Nuclear Power and RE in the energy mix
Only one NPP (Flamanville-3) with a planned capacity of 1,750 MW (gross) is currently under
construction, operation start is planned in 2016. A second project (Penly-3) has been cancelled.
In October 2014, an energy transition bill was passed by the National Assembly and so went on to the
Senate. This set a target of 50% for nuclear contribution to electricity supply by 2025, with a nuclear
power capacity ceiling at the present level of 63.2 GW, meaning that EDF must shut at least 1,650 GW
of nuclear capacity at the end of 2016 when its Flamanville-3 EPR is scheduled to start commercial
Nuclear,
74.8%
Fossil, 9.2%
Selected
RES-E, 5.2%
Other RES-E,
10.8%
Breakdown of total electricity generation in 2012
Biomass,
7.7% Hydro small-
scale, 26.1%
Photovoltaics,
15.8%
Wind
onshore,
50.4%
Breakdown of electricity generationfrom selected RES-E
in 2012
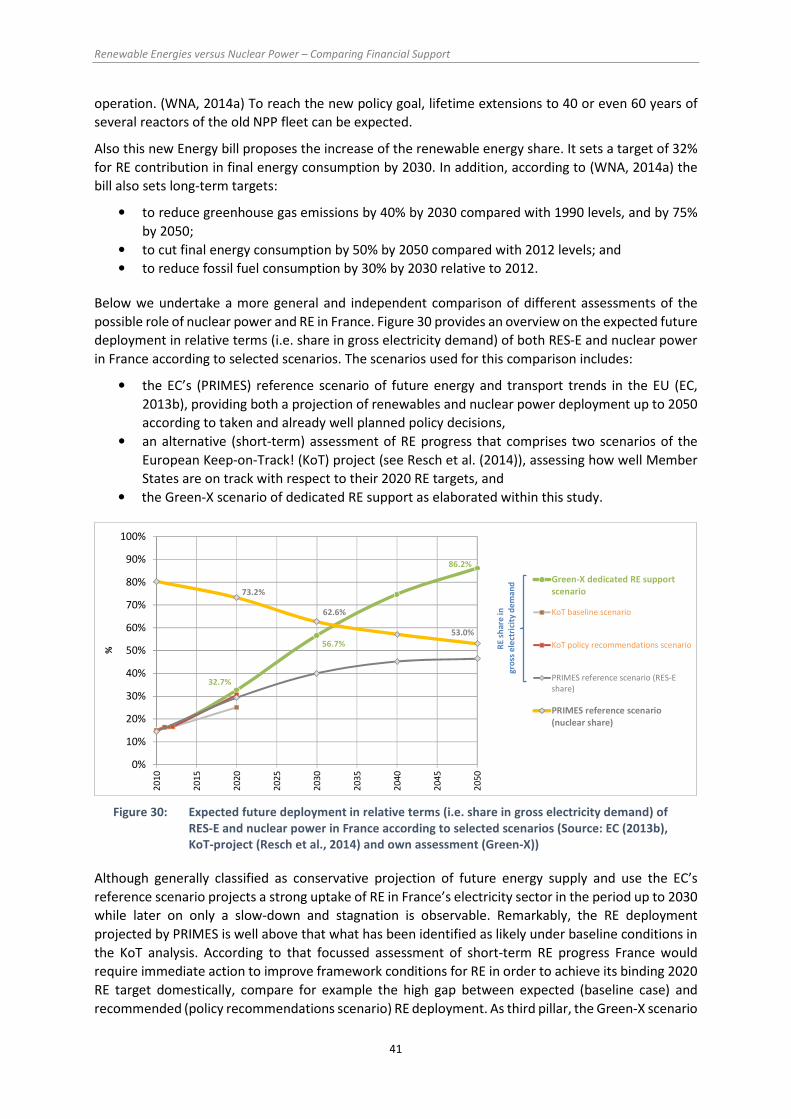
Renewable Energies versus Nuclear Power – Comparing Financial Support
41
operation. (WNA, 2014a) To reach the new policy goal, lifetime extensions to 40 or even 60 years of
several reactors of the old NPP fleet can be expected.
Also this new Energy bill proposes the increase of the renewable energy share. It sets a target of 32%
for RE contribution in final energy consumption by 2030. In addition, according to (WNA, 2014a) the
bill also sets long-term targets:
• to reduce greenhouse gas emissions by 40% by 2030 compared with 1990 levels, and by 75%
by 2050;
• to cut final energy consumption by 50% by 2050 compared with 2012 levels; and
• to reduce fossil fuel consumption by 30% by 2030 relative to 2012.
Below we undertake a more general and independent comparison of different assessments of the
possible role of nuclear power and RE in France. Figure 30 provides an overview on the expected future
deployment in relative terms (i.e. share in gross electricity demand) of both RES-E and nuclear power
in France according to selected scenarios. The scenarios used for this comparison includes:
• the EC’s (PRIMES) reference scenario of future energy and transport trends in the EU (EC,
2013b), providing both a projection of renewables and nuclear power deployment up to 2050
according to taken and already well planned policy decisions,
• an alternative (short-term) assessment of RE progress that comprises two scenarios of the
European Keep-on-Track! (KoT) project (see Resch et al. (2014)), assessing how well Member
States are on track with respect to their 2020 RE targets, and
• the Green-X scenario of dedicated RE support as elaborated within this study.
Figure 30: Expected future deployment in relative terms (i.e. share in gross electricity demand) of
RES-E and nuclear power in France according to selected scenarios (Source: EC (2013b),
KoT-project (Resch et al., 2014) and own assessment (Green-X))
Although generally classified as conservative projection of future energy supply and use the EC’s
reference scenario projects a strong uptake of RE in France’s electricity sector in the period up to 2030
while later on only a slow-down and stagnation is observable. Remarkably, the RE deployment
projected by PRIMES is well above that what has been identified as likely under baseline conditions in
the KoT analysis. According to that focussed assessment of short-term RE progress France would
require immediate action to improve framework conditions for RE in order to achieve its binding 2020
RE target domestically, compare for example the high gap between expected (baseline case) and
recommended (policy recommendations scenario) RE deployment. As third pillar, the Green-X scenario
32.7%
56.7%
86.2%
73.2%
62.6%
53.0%
0%
10%
20%
30%
40%
50%
60%
70%
80%
90%
100%
201
0
201
5
202
0
202
5
203
0
203
5
204
0
204
5
205
0
%
Green-X dedicated RE support
scenario
KoT baseline scenario
KoT policy recommendations scenario
PRIMES reference scenario (RES-Eshare)
PRIMES reference scenario
(nuclear share)
RE
sh
are
in
gro
ss e
lect
rici
tyd
em
an
d

Renewable Energies versus Nuclear Power – Comparing Financial Support
42
of dedicated RE support as elaborated within this study comes into play: it can be classified as
ambitious with respect to projected short-term RE progress but also in the long-term (up to 2050) a
strong RE uptake is proclaimed in that scenario for France. With respect to nuclear only one trend
scenario is applicable (i.e. the EC’s PRIMES reference case), indicating a steady but not tremendous
decline of nuclear power until 2050, when nuclear power is expected to still provide slightly more than
half of France’s electricity needs at that point of time.
Next we focus on the Green-X scenario of dedicated RE support since it forms a central part in the
dynamic assessment later on (see second part of section 4.3.5). Figure 31 shows a breakdown of the
expected RES-E deployment in France up to 2050 by technology (left) and by age cluster (right). The
technology breakdown indicates the dominant role of wind energy, in particular of onshore wind, in
the future – i.e. by 2050 almost half of all electricity consumed in France will stem from wind power
plants. This stresses the need for a tailored approach to enhance power system integration and to
accelerate the increase of grid capabilities and interconnectors with neighbouring countries. Other RE
options like solar or biomass are expected to provide comparatively smaller contributions. Of
relevance for the forthcoming comparative assessment of nuclear and RE is also the breakdown by age
structure as provided on the right hand-side of Figure 31: New RES-E plant installed during the period
2011 to 2050 are in focus within the subsequent analysis, in particular the selected RE technologies
biomass, small hydro, PV and wind (on- and offshore). As applicable from this graph, these
technologies are expected to provide the largest part of (RE) power supply in the long-term.
Figure 31: Breakdown of the expected future RES-E deployment in France in absolute terms (i.e.
electricity generation) by technology (left) and by age cluster (right) according to the
Green-X scenario of dedicated RE support (Source: Own assessment (Green-X))
4.3.3 Existing support schemes for RE
In France, electricity from renewable sources is promoted through three schemes: fixed feed-in tariffs,
tax benefits and a public competitive bidding scheme (tenders) for selected renewables. In addition
there are different regional incentives for small-scale RE technologies (mainly integrated solar PV)
(Steinhilber et al., 2011).
Under the FIT scheme, electricity suppliers (EDF –Électricité de France – and private suppliers) and
distribution grid operators are obliged to conclude agreements on the purchase of and payment for
electricity, at a fixed price, with the operators of renewable electricity plants (RES LEGAL, n.d.).
16.6%
32.7%
56.7%
74.7%
86.2%
0%
10%
20%
30%
40%
50%
60%
70%
80%
90%
100%
0
100
200
300
400
500
600
20
12
20
20
20
30
20
40
20
50
TW
h/a
Biomass Hydro small-scale Photovoltaics
Wind onshore Wind offshore Other RES-E
RES-E demand share
0
100
200
300
400
500
600
20
10
20
20
20
30
20
40
20
50
TW
h/a
Existing RES-Eplant
Selected RES-E
Other RES-ENe
wR
ES
-E
(in
sta
lle
d 2
01
1 t
o 2
05
0)

Renewable Energies versus Nuclear Power – Comparing Financial Support
43
The FIT covers all major RES-E technologies. The maximum plant size that is eligible for support under
the FIT is 12 MW, whereas there is a special regulation for wind energy. Another exception occurs for
biomass-fired combined heat and power plants (CHP) that shall have a capacity of more than 2 MW.
Tariffs are differentiated by technology and size of installation. Duration of payment for onshore wind,
geothermal and biogas is 15 years whereas FIT is guaranteed for 20 years for biomass, offshore wind,
solar PV and hydropower. Once a RE plant is commissioned, tariffs are adjusted to inflation. Only for
solar PV there is a degression which is adopted every quarter of a year. The costs of the FIT scheme to
the suppliers are borne by the final consumers of electricity.
Complementary to above, renewable electricity is promoted through several tax incentives. Persons
that invest in RE plants may deduce their investment in RE technologies such as solar, wind, hydro and
biomass from income tax. Furthermore, persons that install building integrated PV, wind energy plants,
hydro-power plants and biomass plants are eligible for a reduced Value Added Tax (VAT) rate (RES
LEGAL, n.d.).
Moreover, the French government invites to participate in tenders for achieving RE targets. The
winners of tenders may receive a promotional tariff for the construction of RE plants. This tariff is
calculated in accordance with the successful tenderer's finance plan. In general tenders cover all RE
technologies, in practice they are however only used for small-scale PV plants and offshore wind.
Table 6: Details on current RE support in France by assessed RE technology (based on RES LEGAL
(n.d.) and Held et al. (2014))
Biomass FIT: The amount of FIT for biomass equals at least 12.05 €c/kWh (4.34 €c/kWh + premium of at least
7.7€c/kWh), depending on energy efficiency, the system capacity and the resources used.
FIT scheme doesn’t cover biomass cofiring power plants.
Hydro-
power
FIT: The default FIT for hydropower is 6.07 €c/kWh. Furthermore, more sophisticated tariff models
including two to five elements are available at choice; these models account for summer and winter
production differences and maximum and main load times) + premium for small hydropower stations of
0.5 to 2.5 €c/kWh + quality premium of max. 1.68 €c/kWh.
PV FIT: The FITs depend on the type and the total capacity of the installations and reduced quarterly. The high
of degression depends on the amount of capacity applied under FIT in the previous three months. The
decrease rate is limited to max. 20% per year.
Accordingly average tariff in 2013 is about 7.8 €c/kWh for the systems up to 12 MW whereas it accounts
about 30.28 €c/kWh for the building integrated PV systems larger than up to 9 kW capacity (MEEDDM, n.d.)
.
Wind FIT: Both onshore and offshore wind energy stations are eligible under FIT scheme. A stepped FIT design is
implemented for wind on and offshore. Based on the purchase tariff for the electricity dated 28 May 2014,
for wind onshore, 8.2 €c/kWh are paid during the first 10 years of operation and then 2.8 to 8.2 €c/kWh for
the next 5 years. For off-shore tariff is set as 13 €c/kWh during the first 10 years and then €ct 3 – 13 €c/kWh
for the next five years depending on site quality and on time of operation per year.
4.3.4 Future requirements concerning support schemes for RE
Net support for a certain RE technology is generally defined as the difference between remuneration
and market value, compare for example the corresponding explanations provided in section 3.2. For
identifying the future requirements concerning RE support Figure 21 provides a detailed overview on
the future development of remuneration levels and corresponding market values at technology level
for the case of France. This graph shows that wind onshore and small hydropower are the first

Renewable Energies versus Nuclear Power – Comparing Financial Support
44
candidates among the assessed RE technologies to achieve full cost competiveness – i.e. when
remuneration matches with market values. Considering French specifics it can be expected that this
takes place from 2030 onwards. A declining gap between remuneration levels and market values can
be identified also for biomass where cost competitiveness is expected for the period post 2040. Later
on, at the end of this assessment period (2050) PV is expected to follow.12 In contrast to the above,
wind offshore may however still require financial incentives beyond 2050 in order to deploy on the
market because of the increasing gap between average wholesale electricity prices and the specific
market value for offshore wind.
Figure 32: Future development of remuneration levels and corresponding market values of the
assessed RE technologies in France: biomass and small hydropower (left, up), PV (right,
up), wind onshore (left, down) and wind offshore (right, down) according to the Green-X
scenario of dedicated RE support (Source: Own assessment (Green-X))
12 This represents a conservative estimate for PV and concerns only the wholesale and not the end-user market (where cost competitiveness
may occur at a significantly earlier stage).
0
25
50
75
100
125
150
20
15
20
20
20
25
20
30
20
35
20
40
20
45
20
50
€/M
Wh
Average remuneration for Photovoltaics
Market value for Photovoltaics
Wholesale electricity price (Market value for other RES-E and Nuclear)
Ne
tsu
pp
ort
in
th
e
case
of
Ph
oto
vo
lta
ics
0
25
50
75
100
125
150
20
15
20
20
20
25
20
30
20
35
20
40
20
45
20
50
€/M
Wh
Average remuneration for Wind onshore
Market value for Wind onshore
Wholesale electricity price (Market value for other RES-E and Nuclear)
Ne
tsu
pp
ort
in
th
e
case
of
Win
d o
nsh
ore
0
25
50
75
100
125
150
20
15
20
20
20
25
20
30
20
35
20
40
20
45
20
50
€/M
Wh
Average remuneration for Wind offshore
Market value for Wind offshore
Wholesale electricity price (Market value for other RES-E and Nuclear)
Ne
tsu
pp
ort
in
th
e
case
of
Win
d o
ffsh
ore

Renewable Energies versus Nuclear Power – Comparing Financial Support
45
4.3.5 Comparison on costs and quantities of nuclear energy vs. RE
Static approach: comparison of planned support for nuclear with existing RE support
Figure 33 provides the comparison of expected remuneration levels for Hinkley Point C with those for
a new RE power plant (as of 2013) in France. This graph shows also the expected future wholesale
electricity prices in this country, representing default earnings for a power producer in the absence of
dedicated support.
Similar to UK, in France the average total remuneration is highest in the case of PV (209.9 €/MWh)
followed by wind offshore (128.7 €/MWh). The average remuneration level for three RES-E
technologies, namely, biomass cofiring13, small scale hydro-power and wind onshore lie under the level
of the planned aid scheme for nuclear power at Hinkley Point C. In the case of dedicated biomass, in
comparison to UK and Germany, the remuneration level in France is lower, however still higher than
the planned remuneration level for nuclear power.
In France, net support for onshore wind (15 €/MWh) and small scale hydro (20 €/MWh) are below the
support level offered to nuclear power in the UK (36-41 €/MWh). In accordance with above, PV needs
the highest net support (145 €/MWh) followed by wind offshore (64 €/MWh) and dedicated biomass
(54 €/MWh).
Figure 33: Comparison of remuneration levels (and of wholesale electricity prices) for nuclear
power and for assessed RE technologies in France (Source: Own calculations, based on
Steinhilber et al. (2011) and Held et al. (2014))
Figure 34 indicates the possible annual electricity generation from RES-E that could be promoted in
France with currently implemented support schemes (i.e. taking average remuneration and net
support levels as given) in comparison to the planned aid scheme for nuclear power in the UK. As
applicable in Figure 34, a range of feasible generation volumes is indicated for the assessed RE
technologies:
• The lower boundary of possible volumes answers the question how much renewable
electricity could be promoted by different technologies, if annual net support expenditures as
expected for Hinkley Point C in the UK, are used in France.
13 Please note that similar to Germany biomass cofiring is not eligible under the currently implemented support schemes in France. Thus,
the remuneration level expressed equals to the earning from selling the produced electricity on the wholesale electricity market.
105.6119.3
64.9
84.8
209.9
79.9
128.7
UK
0
50
100
150
200
250
Hin
kley
Poi
nt C
(UK)
Bio
ma
ss
(ded
icat
ed
pla
nt)
Bio
ma
ss c
ofi
rin
g
Hyd
ro s
mal
l-sc
ale
Phot
ovo
lta
ik
Win
d on
shor
e
Win
d o
ffsh
ore
€/M
Wh
range of remuneration
average remuneration
average wholesale electricity price
Ne
tsu
pp
ort

Renewable Energies versus Nuclear Power – Comparing Financial Support
46
• If a new nuclear power plant like the one planned for Hinkley Point C is constructed in France
under similar support conditions as planned for the UK (i.e. same FIT level as set in the UK),
the net support level would differ because of different electricity wholesale prices. The upper
range in Figure 34 is consequently taking into account this difference, using French wholesale
prices and corresponding annual net support expenditures, and showing how much electricity
generation could be achieved with that for the assessed RE technologies.
Considering the expected annual net support expenditures for Hinkley Point C, in France a higher range
of electricity can be generated from onshore wind and small-scale hydropower. Less competitive
seems to be dedicated biomass and offshore wind. Finally, as PV support is comparatively higher than
for other technologies, the range of electricity that could be generated from PV system is the lowest
and accounts nearly to one fourth of expected annual nuclear electricity generation (at Hinkley Point
C).
Figure 34: Comparison of expected annual electricity generation of Hinkley Point C with feasible
volumes from assessed RE technologies in France (Source: Own calculations)
Figure 35: Comparison of required annual net support for nuclear power and for assessed RE
technologies in France (Source: Own calculations)
Complementary to Figure 34, Figure 35 shows the required support in France for a new nuclear power
plant and for all assessed RE technologies considering an annual production volume of 26 TWh as
expected to be generated from a nuclear power plant similar to the one planned at Hinkley Point C. In
0
10
20
30
40
50
60
70
80
Bio
mas
s(d
edic
ate
d p
lan
t)
Bio
mas
s co
firi
ng
Hyd
ro s
mal
l-sc
ale
Ph
oto
volt
aik
Win
d o
nsh
ore
Win
d o
ffsh
ore
TW
h/a
Range ofpossible annualelectricitygenerationfrom RES-E
Expectedannualelectricitygeneration ofHinkley Point C(UK)
1415
0
519
3769
390
1659
934
1059
0
500
1,000
1,500
2,000
2,500
3,000
3,500
4,000
Bio
mas
s(d
edic
ated
pla
nt)
Bio
mas
s co
firi
ng
Hyd
ro s
mal
l-sc
ale
Ph
oto
volt
aik
Win
d o
nsh
ore
Win
d o
ffsh
ore
M€
/a
Requiredannual netsupport in thecase of RES-E*
… considering UK wholesale electricity prices
… considering country-specific wholesale electricity prices
Note:*for producing the same amount of electricity as expected to be generated in Hinkley Point C
Re
qu
ire
d a
nn
ual
ne
t su
pp
ort
in
th
e c
ase
of
nu
cele
ar*

Renewable Energies versus Nuclear Power – Comparing Financial Support
47
accordance with above, required annual net support for nuclear power is depicted in Figure 35 through
two lines, i.e. considering either UK or French wholesale electricity prices. Consequently, required
annual net support for nuclear power would be higher in France since wholesale electricity prices are
lower than in the UK.
Generally, it is apparent that, supporting onshore wind is significantly cheaper with cost savings up to
63% (compared to nuclear), followed by small-scale hydropower (with cost savings up to 51%). Finally,
the required net support for PV is about 2.5 times higher than required annual net support for the
nuclear.
Dynamic approach: comparison of planned support for nuclear with future RE support
according to a model-based analysis (Green-X)
Building on the Green-X scenario of dedicated RE support and the sketched future deployment of
renewables in France, a comparative assessment of RE support with the planned subsidy for Hinkley
Point C is undertaken below in a dynamic context. More precisely, the years from 2023 to 2050 form
the assessment period whereby 2023 is chosen since this is the year when Hinkley Point is expected to
start full operation. As a first step the amount of expected electricity generation from assessed RE
technologies and from a new nuclear power plant (similar to the one planned at Hinkley Point C) is
collated. Next to that, related support expenditures for RES-E and nuclear power are contrasted and,
finally, the cost-effectiveness of the two distinct pathways is derived considering French
circumstances.
Figure 36: Comparison of expected future electricity generation from assessed RE technologies and
nuclear power in France according to the Green-X scenario of dedicated RE support:
development over time (left) and cumulative volumes (2023 to 2050) (right) by RE
technology (Source: Own assessment (Green-X))
Figure 36 shows a comparison of the expected future electricity generation from assessed RE
technologies and from a new nuclear power plant (similar to Hinkley Point C) in France, indicating
deployment over time (left) and cumulative volumes (i.e. 2023 to 2050) (right) with details expressed
by RE technology. Note that for renewables only electricity generation that stems from new biomass,
small hydro, wind or photovoltaic plants (installed between 2011 and 2050) is considered. As discussed
in section 4.3.2 a strong uptake of the assessed RE technologies is expected for the focal period, leading
to a ten times higher cumulative electricity generation than at a new nuclear power plant (similar to
0
50
100
150
200
250
300
350
400
450
202
1
202
3
202
5
202
7
202
9
203
1
203
3
203
5
203
7
203
9
204
1
204
3
204
5
204
7
204
9
TW
h/a
Electricity generation from selected new RES-E (installed 2011 to 2050)
Electricity generation from Nuclear (Hinkley Point C)
Electricity generation in the period 2023 to 2050

Renewable Energies versus Nuclear Power – Comparing Financial Support
48
Hinkley Point C). Wind onshore is expected to provide about two thirds of the total RE volumes,
followed by photovoltaics and biomass.
Complementary to above, Figure 37 indicates how remuneration levels and the corresponding
reference prices for the assessed technology options are expected to develop in the period up to 2050,
using weighted average figures to determine the market value and the remuneration level for the
aggregated RE technology cluster that comprises the basket of assessed individual RE technologies.
The need for net support for a new installation in a given year can then be derived by subtracting the
market value from overall remuneration. This allows for a first interpretation of cost-effectiveness. For
nuclear it can be seen that during early years of operation a significant gap between remuneration and
market value occurs, in this case determined by the yearly average wholesale electricity price, occurs.
This gap is however expected to get smaller in later years due to increases in wholesale electricity
prices (that go hand in hand with rising fossil fuel and carbon prices). For renewables an interpretation
appears more difficult since outcomes reflect the over shading impacts of a basket of technologies that
come into play: In the period up to 2030 a strong decline of remuneration levels is apparent, reflecting
expected technological progress across all technologies. For the case of France the strong decline of
PV cost has here probably the most determining impact. Later on, the downwards trend for
remuneration slows down and beyond 2040 the average remuneration level stagnates. Contrarily, with
increasing deployment the merit-order-effect and the related decrease in market values of variable
renewables shows effect. The gap between remuneration and market values is however declining and
by 2050 almost vanished.
Figure 37: Future development of remuneration levels and corresponding market values of the
assessed RE technologies (as aggregate) and of nuclear power in France according to the
Green-X scenario of dedicated RE support (Source: Own assessment (Green-X))
Similar to deployment as shown in Figure 36, Figure 38 compares support expenditures for assessed
RE technologies and nuclear power in France, expressing the development over time (left) and in
cumulative volumes (2023 to 2050) (right) with details for the assessed RE technologies. For nuclear
power the steady decline of support expenditures as discussed above is observable. For the selected
RE technologies a strong increase of support expenditures is becoming apparent in the period up to
2030 that goes hand in hand with the uptake of deployment. In later years, for renewables a strong
decline of support expenditures can be seen thanks to the phase out of support for installations after
their guaranteed duration but mainly as a consequence of technological progress and the replacement
of previously strongly supported renewables by new installations that do no longer require incentives
(e.g. wind onshore). In cumulative terms a factor is 7.5 between RE and nuclear support can be
0
25
50
75
100
125
201
5
202
0
202
5
203
0
203
5
204
0
204
5
205
0
€/M
Wh
Average remuneration forselected RES-E
Average market value for
selected RES-E
Average remuneration forNuclear (Hinkley Point C)
Wholesale electricity price
(Market value for other RES-E
and Nuclear)
Ne
tsu
pp
ort
in
th
e
case
of
RE
Ne
tsu
pp
ort
in
th
e
case
of
Nu
cle
ar
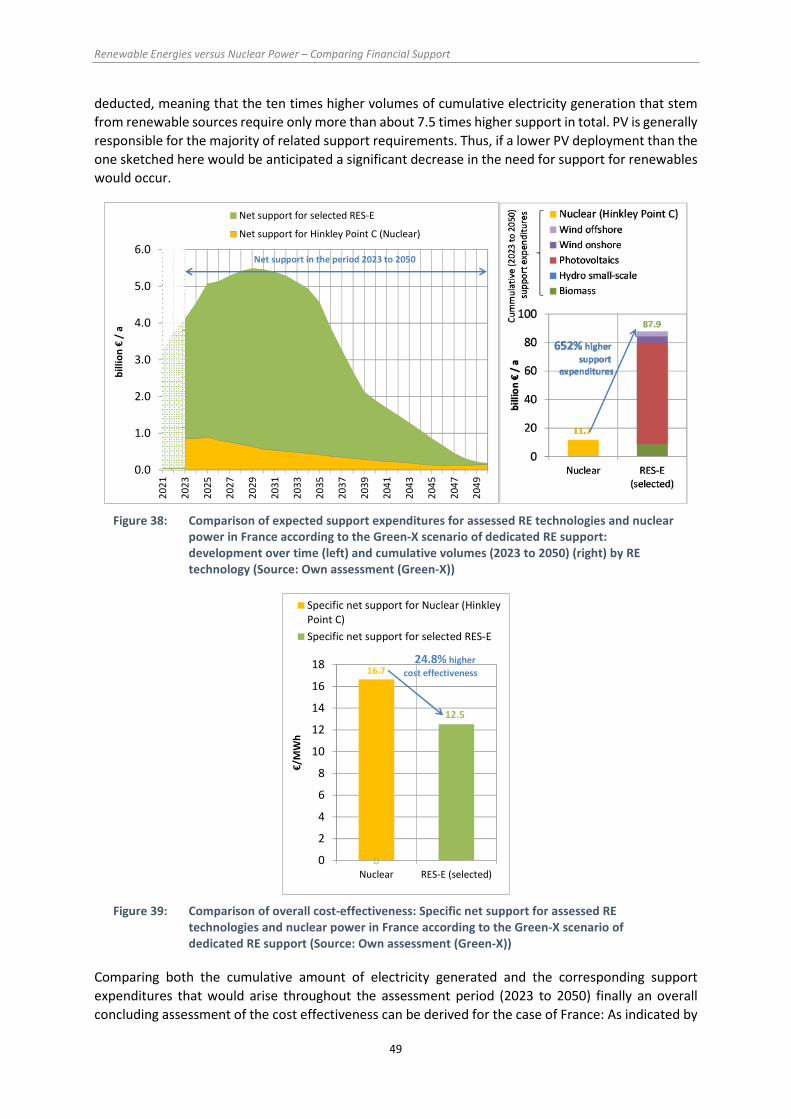
Renewable Energies versus Nuclear Power – Comparing Financial Support
49
deducted, meaning that the ten times higher volumes of cumulative electricity generation that stem
from renewable sources require only more than about 7.5 times higher support in total. PV is generally
responsible for the majority of related support requirements. Thus, if a lower PV deployment than the
one sketched here would be anticipated a significant decrease in the need for support for renewables
would occur.
Figure 38: Comparison of expected support expenditures for assessed RE technologies and nuclear
power in France according to the Green-X scenario of dedicated RE support:
development over time (left) and cumulative volumes (2023 to 2050) (right) by RE
technology (Source: Own assessment (Green-X))
Figure 39: Comparison of overall cost-effectiveness: Specific net support for assessed RE
technologies and nuclear power in France according to the Green-X scenario of
dedicated RE support (Source: Own assessment (Green-X))
Comparing both the cumulative amount of electricity generated and the corresponding support
expenditures that would arise throughout the assessment period (2023 to 2050) finally an overall
concluding assessment of the cost effectiveness can be derived for the case of France: As indicated by
0.0
1.0
2.0
3.0
4.0
5.0
6.0
202
1
202
3
202
5
202
7
202
9
203
1
203
3
203
5
203
7
203
9
204
1
204
3
204
5
204
7
204
9
bil
lio
n €
/ a
Net support for selected RES-E
Net support for Hinkley Point C (Nuclear)
Net support in the period 2023 to 2050
0
12.5
16.7
0
2
4
6
8
10
12
14
16
18
Nuclear RES-E (selected)
€/M
Wh
Specific net support for Nuclear (HinkleyPoint C)
Specific net support for selected RES-E
24.8% higher
cost effectiveness

Renewable Energies versus Nuclear Power – Comparing Financial Support
50
the results on specific net support shown in Figure 39 the conclusion can be drawn that supporting a
basket of RE technologies as analyzed in this assessment shows a ca. 25% higher cost-effectiveness
than supporting a new nuclear power plant (as planned for Hinkley Point C in the UK). PV is here the
key determinant on the renewables side – i.e. a lower deployment than the one anticipated here would
lead to a further increase of the cost effectiveness from a renewable perspective but may have other
drawbacks.
Generally, France has the potential to compensate a lack of deployment in nuclear power by
renewables if one considers the large potentials applicable for various RE options at French territory.
In addition to dedicated RE support this would require a clear commitment among the whole society
to mitigate prevailing societal constraints towards this comparatively cheap way of providing electricity
supply in a sustainable manner.

Renewable Energies versus Nuclear Power – Comparing Financial Support
51
4.4 Poland
4.4.1 Status Quo: Role of Nuclear Power and RE in the energy mix
Poland has traditionally been a net electricity exporter, mostly to Czech Republic and Slovakia, but
recent years have seen a reduction in export levels as domestic demand continues to grow, and the
country is likely to become a net importer unless capacity additions are made. (WNA, 2014b)
Until now, Poland has no NPP under construction or in operation. Due to an expected increase in
electricity demand from 141 TWh in 2010 to 217 TWh in 2030, Poland wants to start a nuclear energy
program. The installed nuclear power should reach at least 1,000 MW in 2020 and in 2030 over 4,500
MW according to this program (Renner et al. 2011). In 2011, the program has been subjected to a
transboundary Strategic Environmental Assessment.
Poland's nuclear power program was approved by the Council of Ministers on 28 January 2014.
Figure 40: Breakdown of total electricity generation in 2012 for Poland (left), with details for
assessed selected RE technologies (right) (Source: Eurostat, KoT-project (Resch et al.,
2014))
Considering overall energy supply and use Poland is heavily dependent on own coal and imported gas.
The country has the largest coal reserves in the EU and country's gas supply comes mainly from Russia.
Currently domestic electricity generation in Poland relies heavily on fossil fuels. As shown in Figure 40
almost 90% of Polish total electricity supply in 2012 was produced in gas-, oil and coal-fired power
plants. The remaining part comes from renewables since no nuclear power plant has been built or is
currently under construction. Among the assessed RE technologies, biomass is of dominance in the
Polish RE electricity mix – i.e. (mainly cofiring of) biomass has delivered in 2012 58.6% of all electricity
produced among the assessed RES-E technology portfolio. A comparatively strong uptake was also
observable for wind onshore in recent years. Thanks to implemented policy incentives, the share of RE
in gross electricity demand grew from 6.6% in 2010 to 10.7% in 2012.
4.4.2 Outlook: Role of Nuclear Power and RE in the energy mix
If Poland wants to construct its first NPP, at first it has to be subjected to a transboundary
Environmental Impact Assessment. Such an EIA is planned to be announced between January 2017
Fossil, 89.3%
Selected
RES-E, 9.8%
Other RES-E,
0.9%
Breakdown of total electricity generation in 2012
Biomass,
58.6%
Hydro small-
scale, 12.4%
Wind
onshore,
29.0%
Breakdown of electricity generationfrom selected RES-E
in 2012

Renewable Energies versus Nuclear Power – Comparing Financial Support
52
and December 201814. According to WNA (2014b) the construction of first unit should start in 2020
and it is expected to be operational in 2024.
The future role of nuclear power and renewables is apparently uncertain, depending on the political
and societal preferences and actual policy implementations as well as general (global) energy market
developments. Poland’s electricity consumption is still growing strongly compared to other EU
Member States and for meeting the EU’s climate policy targets, Poland plans to have nuclear power.
“In August 2014 a draft energy policy for Poland had two scenarios, both with nuclear power playing a
key role. One had nuclear power supplying 50 TWh/yr by 2035, with renewables [at] 60 TWh. The other
had stronger growth in nuclear to 74 TWh/yr, and 49 TWh [from] renewables. Both involve a major
shift from lignite and black coal which currently provide about 84% of electricity, and most of the air
pollution” (WNA, 2014b).
Below we undertake a more general and independent comparison of different assessments of the
possible role of nuclear power and RE by means of scenarios. Thus, the expected future deployment
in relative terms (i.e. share in gross electricity demand) of both RES-E and nuclear power in Poland is
shown in Figure 41 according to selected scenarios. As starting point, the EC’s (PRIMES) reference
scenario of future energy and transport trends in the EU (EC, 2013b) is used, providing both a
projection of renewables and nuclear power deployment up to 2050. This conservative scenario
(reflecting only taken and already well planned policy decisions) projects only a moderate increase of
RE supply in the Polish electricity sector in the period up to 2030 and some sort of stagnation is
apparent. This scenario is then further contrasted with an alternative (short-term) assessment of RE
progress: two scenarios of the European Keep-on-Track! (KoT) project (see Resch et al. (2014)),
assessing how well Member States are on track with respect to their 2020 RE targets, are included in
the comparison, indicating a large gap between the expected (baseline case) and the required (policy
recommendations case) short-term RE progress. Finally, we include the Green-X scenario of dedicated
RE support as elaborated within this study in our brief comparison: this scenario can be classified as
ambitious – i.e. for RES-E a stronger uptake than in all other assessed scenarios is becoming apparent.
According to this scenario RE would be the dominant climate mitigation option for Poland, and in the
power sector RE would be delivering more than half of all electricity beyond 2035. This upward trend
is expected to continue throughout the whole assessment period, and RES-E would account for 76%
of all electricity consumed in Poland by 2050.
With respect to nuclear only one trend scenario is applicable (i.e. the EC’s PRIMES reference case),
indicating a phase-in of nuclear power beyond 2020 with peak levels of around 30% (as share in
electricity demand) by 2030.
Figure 42 provides further insights on the technology-specific RES-E deployment for the Green-X
scenario of dedicated RE support15. More precisely, this graph offers a breakdown of the expected
future RES-E deployment up to 2050 in Poland in absolute terms (i.e. electricity generation) by
technology (left) and by age cluster (right). The technology breakdown underpins the dominant role of
wind energy in the future, complemented by biomass. In order to let this vision become reality,
currently prevailing barriers for RE need to be mitigated. This comprises in addition to the provision of
stable financing conditions for RE to tackle deficits related to (a fair) grid access and system integration
and, more generally, the extension of the weak electricity grid. Please note that Figure 42 (right) offers
also the breakdown of RES-E generation by age structure: New RES-E plant installed during the period
2011 to 2050 are in focus within the subsequent analysis, in particular the selected RE technologies
14 Personal communication with M. Harembski, Joint Project, July 2014
15 We focus on this scenario since it takes a central part in the dynamic assessment undertaken within this study (see second part of section
4.4.5)

Renewable Energies versus Nuclear Power – Comparing Financial Support
53
biomass, small hydro, PV and wind (on- and offshore). As applicable from this graph, these
technologies will deliver the major part of (RE) power supply in the long-term.
Figure 41: Expected future deployment in relative terms (i.e. share in gross electricity demand) of
RES-E and nuclear power in Poland according to selected scenarios (Source: EC (2013b),
KoT-project (Resch et al., 2014) and own assessment (Green-X))
Figure 42: Breakdown of the expected future RES-E deployment in Poland in absolute terms (i.e.
electricity generation) by technology (left) and by age cluster (right) according to the
Green-X scenario of dedicated RE support (Source: Own assessment (Green-X))
4.4.3 Existing support schemes for RE
In the Republic of Poland, electricity from renewable sources is promoted mainly through a quota
system. Electricity suppliers are obliged to acquire a certain number of so-called "certificates of origin
(green certificates)" which are issued to the RES-E producers. Thus, plant operators that generate
electricity from RE receive 1 Green certificate of origin per 1 MWh of generated electricity independent
from the type of technology. Complementary to the income from selling green certificates to obliged
parties, RES-E producers may sell their core product, i.e the produced electricity. In order to safeguard
income streams there are two possibilities for doing so – i.e. they may either sell the electricity at the
stock market or offer it to other suppliers at last year's market price (RES LEGAL, n.d.). The RES-E quota
22.1%
40.9%
75.8%
0.0%
22.4%
26.5%
0%
10%
20%
30%
40%
50%
60%
70%
80%2
010
201
5
202
0
202
5
203
0
203
5
204
0
204
5
205
0
%
Green-X dedicated RE support
scenario
KoT baseline scenario
KoT policy recommendations scenario
PRIMES reference scenario (RES-Eshare)
PRIMES reference scenario
(nuclear share)
RE
sh
are
in
gro
ss e
lect
rici
tyd
em
an
d
10.7%22.1%
40.9%
60.5%
75.8%
0%
10%
20%
30%
40%
50%
60%
70%
80%
0
20
40
60
80
100
120
140
160
180
200
20
12
20
20
20
30
20
40
20
50
TW
h/a
Biomass Hydro small-scale Photovoltaics
Wind onshore Wind offshore Other RES-E
RES-E demand share
0
20
40
60
80
100
120
140
160
180
200
20
10
20
20
20
30
20
40
20
50
TW
h/a
Existing RES-Eplant
Selected RES-E
Other RES-ENe
wR
ES
-E
(in
sta
lle
d 2
01
1 t
o 2
05
0)

Renewable Energies versus Nuclear Power – Comparing Financial Support
54
is a percentage of the total annual amount of electricity sold by the obligated party and current and
future targets (currently defined until 2021) are shown in Table 7.
Table 7: Quota targets for RES-E in Poland (RES LEGAL, n.d.)
Year 2014 2015 2016 2017 2018 2019 2020 2021
Quota 13% 14% 15% 16% 17% 18% 19% 20%
The quota obligation may also be fulfilled by paying a substitution fee or penalty. The substitution fee
(i.e. 297.35 PLN/MWh (approx. 70.4 €/MWh) in 2013) defines the reference value (maximum fee) of
the green certificates and increases each year in line with the national inflation rate and published
every year by the national Energy Regulatory Office (ERO). The costs of the quota system are borne by
the consumers through paying of electricity prices that includes the cost of green certificates purchase
and fees of suppliers.
Furthermore, RES-E is supported through other schemes such as tax relief, subsidy and loan schemes
(RES LEGAL, n.d.). Electricity from renewable sources is exempt from the tax on the sale to end-users
and their consumption. Hence, the amount of this fiscal subsidy is equal to the relief from this tax. As
of 2013/2014, the amount of consumption tax on electricity amounts to 20 PLN/MWh (approx.
0.5 €c/kWh)
Another support that renewable energies receive comprises low interest loans from the National Fund
for Environmental Protection and Water Management (NFOSiGW), where all RE except geothermal
energy are eligible. This program grants low interests loans together with subsidies to support the
purchase and installation of small and micro-RE installations for the needs of residential single-family
or multi-family houses. The budget of the program for the timeframe 2014 to 2020 is: for subsidies:
PLN 150 million (€ 36.4 million); for loans: PLN 450 million (€ 109.2 million).
Table 8: Details on current RE support in Poland by assessed RE technology (based on RES LEGAL
(n.d.) and Held et al. (2014))
Biomass Quota: Biomass is eligible under following requirements i) In cofiring plants larger than 5 MW and smaller
than 20 MW, biomass substance should exceed a predefined percentage. ii) In biomass plants larger than
20 MW, a predefined percentage of the biomass should be of a certain origin.
The reference green certificate price (substitution fee) as of 2013: approx. 7.4 €c/kWh
Tax relief: approx. 0.5 €c/kWh
Loan: Eligible is high efficient cogeneration with a max. capacity of 5 MWe and the loan shall cover max.
75% of eligible investment cost.
Subsidy: Micro co-generation installations fired with biomass with a capacity of up to 40 kWe are eligible.
Biomass has to constitute waste from forestry or be of agricultural origin.
Hydro-
power
Quota: eligible. The reference green certificate price (substitution fee) as of 2013: approx. 7.4 €c/kWh
Tax relief: approx. 0.5 €c/kWh
Loan: Eligible with a max. capacity of 5 MW and the loan shall cover max. 50% of eligible investment cost
PV Quota: eligible. The reference green certificate price (substitution fee) as of 2013: approx. 7.4 €c/kWh
Tax relief: approx. 0.5 €c/kWh
Loan: Eligible with a max. capacity of 200 kWp -1 MWp and the loan shall cover max. 75% of eligible
investment cost
Subsidy: PV installations with a capacity of up to 40 kWp are eligible

Renewable Energies versus Nuclear Power – Comparing Financial Support
55
Wind Quota: Both onshore and offshore wind energy plants are eligible under the quota scheme. The reference
green certificate price (substitution fee) as of 2013: approx. 7.4 €c/kWh
Tax relief: approx. 0.5 €c/kWh
Loan: Eligible with a max. capacity of 3 MWe and the loan shall cover max. 30% of eligible investment cost
Subsidy: Small wind energy installations with a capacity of up to 40 kWe are eligible
4.4.4 Future requirements concerning support schemes of RE
Figure 43: Future development of remuneration levels and corresponding market values of the
assessed RE technologies in Poland: biomass and small hydropower (left, up), PV (right,
up), wind onshore (left, down) and wind offshore (right, down) according to the Green-X
scenario of dedicated RE support (Source: Own assessment (Green-X))
As explained in principle in section 3.2 and discussed with further detail for the case of the UK, the
difference between remuneration and market value determines the required net support for a certain
RE technology. Remarkably, Figure 43 indicates that offshore wind is the first candidate achieving a
match between expressed remuneration and market values. Care need to be taken in interpreting this:
For the case Poland this does not mean that offshore wind achieves full cost competitiveness by 2023
0
25
50
75
100
125
150
20
15
20
20
20
25
20
30
20
35
20
40
20
45
20
50
€/M
Wh
Average remuneration for Photovoltaics
Market value for Photovoltaics
Wholesale electricity price (Market value for other RES-E and Nuclear)
Ne
tsu
pp
ort
in
th
e
case
of
Ph
oto
vo
lta
ics
0
25
50
75
100
125
150
20
15
20
20
20
25
20
30
20
35
20
40
20
45
20
50
€/M
Wh
Average remuneration for Wind onshore
Market value for Wind onshore
Wholesale electricity price (Market value for other RES-E and Nuclear)
Ne
tsu
pp
ort
in
th
e
case
of
Win
d o
nsh
ore
0
25
50
75
100
125
150
20
15
20
20
20
25
20
30
20
35
20
40
20
45
20
50
€/M
Wh
Average remuneration for Wind offshore
Market value for Wind offshore
Wholesale electricity price (Market value for other RES-E and Nuclear)
Ne
tsu
pp
ort
in
th
e
case
of
Win
d o
ffsh
ore

Renewable Energies versus Nuclear Power – Comparing Financial Support
56
– it rather points out that according to the derived Green-X scenario offshore is not required in the
mid- to long-term for achieving a strong uptake of renewables in the electricity sector. Similar to other
countries, small hydropower and wind onshore are the first actual candidates to achieve cost
competitiveness in Poland. Considering Polish specifics on wind and hydro conditions as well as on
general electricity market developments it is expected that this happens by 2030. A declining gap
between remuneration levels and market values can be seen also for PV in later years. Full cost
competitiveness is then expected from 2040 onwards. Note that this represents however a
conservative estimate for PV and concerns the wholesale and not the end-user market (where cost
competitiveness may occur at an earlier stage).
4.4.5 Comparison on costs and quantities of nuclear energy vs. RE
Static approach: comparison of planned support for nuclear with existing RE support
Figure 44 provides a comparison of the expected remuneration levels for a new nuclear power plant
(at the example of Hinkley Point C) with those for a new RE power plant (as of 2013) in Poland.
Figure 44: Comparison of remuneration levels (and of wholesale electricity prices) for nuclear
power and for assessed RE technologies in Poland (Source: Own calculations, based on
Steinhilber et al. (2011) and Held et al. (2014))
As described in section 4.4.3, in Poland the main support scheme is the quota system offering uniform
support via green certificates to all applicable RES-E technologies. For this comparative assessment,
quota-based support and the tax relief have been considered while other types of potential support
such as loan and investment grants have been neglected. Thus, remuneration levels (and also net
support) are identical for all RES-E technologies (89.9 €/MWh) and remain under the level of planned
nuclear power (105.6 €/MWh).
While net support for nuclear power in the UK is 35.9 €/MWh (by considering UK wholesale electricity
prices) it would amount to 50.7 €/MWh under Polish circumstances (by considering Polish wholesale
electricity prices). In comparison to above, net support for RE in Poland is in size of 35 €/MWh for the
assessed technologies.
Figure 45 shows the range of possible annual electricity generation from RE technologies that could be
promoted in Poland by using the same amount of support as planned for the new nuclear power plant
105.6
89.9 89.9 89.9 89.9 89.9 89.9
UK
0
20
40
60
80
100
120
Hin
kley
Poi
nt C
(UK)
Bio
ma
ss
(ded
icat
ed
pla
nt)
Bio
ma
ss c
ofi
rin
g
Hyd
ro s
mal
l-sc
ale
Phot
ovo
lta
ik
Win
d on
shor
e
Win
d o
ffsh
ore
€/M
Wh
range of remuneration
average remuneration
average wholesale electricity price
Ne
tsu
pp
ort

Renewable Energies versus Nuclear Power – Comparing Financial Support
57
in UK.16 It can be seen that the range of electricity generation from assessed RE technologies is higher
in Poland than for a new nuclear power plant.
Complementary to above, Figure 46 indicates the required net support in Poland for a new nuclear
power plant and for all RE technologies assessed with an annual production volume of 26 TWh/a (as
expected to be generated annually at Hinkley Point C). For RE plants the technology-neutral support
as currently implemented in Poland is considered.
It is apparent that, supporting all assessed RE technologies in Poland would be cheaper than nuclear
power – i.e. related cost savings range up to 31%.
Figure 45: Comparison of expected annual electricity generation of Hinkley Point C with feasible
volumes from assessed RE technologies in Poland (Source: Own calculations)
Figure 46: Comparison of required annual net support for nuclear power and for assessed RE
technologies in Poland (Source: Own calculations)
Dynamic approach: comparison of planned support for nuclear with future RE support
according to a model-based analysis (Green-X)
A comparative assessment of RE support with the planned subsidy for a new nuclear power plant at
Hinkley Point C is undertaken below in a dynamic context. The model-based analysis builds on the
16 For more details on the related assessment please follow the explanations in chapter 4.2.5.
0
5
10
15
20
25
30
35
40
45
50
Bio
mas
s(d
edic
ate
d p
lan
t)
Bio
mas
s co
firi
ng
Hyd
ro s
mal
l-sc
ale
Ph
oto
volt
aik
Win
d o
nsh
ore
Win
d o
ffsh
ore
TW
h/a
Range ofpossible annualelectricitygenerationfrom RES-E
Expectedannualelectricitygeneration ofHinkley Point C(UK)
897 897 897 897 897 897
934
1087
0
200
400
600
800
1,000
1,200
Bio
mas
s(d
edic
ated
pla
nt)
Bio
mas
s co
firi
ng
Hyd
ro s
mal
l-sc
ale
Ph
oto
volt
aik
Win
d o
nsh
ore
Win
d o
ffsh
ore
M€
/a
Requiredannual netsupport in thecase of RES-E*
… considering UK wholesale electricity prices
… considering country-specific wholesale electricity prices
Note:*for producing the same amount of electricity as expected to be generated in Hinkley Point C
Re
qu
ire
d a
nn
ual
ne
t su
pp
ort
in
th
e c
ase
of
nu
cele
ar*

Renewable Energies versus Nuclear Power – Comparing Financial Support
58
Green-X scenario of dedicated RE support and the therein sketched deployment of renewables in
Poland. More precisely, the years from 2023 to 2050 form the assessment period whereby 2023 is
chosen since this is the year when Hinkley Point is expected to start full operation. As a first step the
amount of expected electricity generation from assessed RE technologies and from the nuclear power
plant at Hinkley Point C is compared. Next to that, related support expenditures for RES-E and nuclear
power are taken into consideration and, finally, the cost-effectiveness of the two distinct pathways is
derived for the case of Poland.
The expected future electricity generation from assessed RE technologies and from a new nuclear
power plant (similar to Hinkley Point C) is shown in Figure 46 for Poland. More precisely, this graph
indicates deployment over time (left) and in cumulative volumes (i.e. 2023 to 2050) (right) with details
expressed by RE technology. Note that for renewables only electricity generation that stems from new
biomass, small hydro, wind or photovoltaic plants (installed between 2011 and 2050) is considered. As
discussed in section 4.4.2 a strong uptake of the assessed RE technologies is expected for the focal
period in Poland, leading to a 3.7 times higher cumulative electricity generation than from a new
nuclear power plant similar to Hinkley Point C. Wind onshore is expected to provide about two thirds
of the total RE volumes, and the remainder comes mainly from biomass.
Figure 47: Comparison of expected future electricity generation from assessed RE technologies and
nuclear power in Poland according to the Green-X scenario of dedicated RE support:
development over time (left) and cumulative volumes (2023 to 2050) (right) by RE
technology (Source: Own assessment (Green-X))
Complementary to above, the future development of remuneration levels and the corresponding
reference market values is illustrated in Figure 48 for nuclear power and for renewables, using
weighted average figures to determine market value and remuneration level for the aggregated RE
technology cluster that comprises the basket of assessed individual RE technologies. For determining
the need for net support for a new installation in a given year the market value can then be subtracted
from overall remuneration in order to gain first insights on the cost-effectiveness of the policy
approaches.
For nuclear power it can be seen that during early years of operation a significant gap between
remuneration and market value, in this case determined by the yearly average wholesale electricity
price, is applicable. In later years this is getting smaller because of an increase in wholesale electricity
prices (that goes hand in hand with an increase of fossil fuel and carbon prices over time). For
0
20
40
60
80
100
120
140
160
180
202
1
202
3
202
5
202
7
202
9
203
1
203
3
203
5
203
7
203
9
204
1
204
3
204
5
204
7
204
9
TW
h/a
Electricity generation from selected new RES-E (installed 2011 to 2050)
Electricity generation from Nuclear (Hinkley Point C)
Electricity generation in the period 2023 to 2050

Renewable Energies versus Nuclear Power – Comparing Financial Support
59
renewables an interpretation appears more challenging since outcomes reflect the over shading
impacts of a basket of technologies that come into play: In the period between 2015 and 2030
remuneration levels decline, reflecting expected technological progress across all technologies, and in
particular of biomass and onshore wind. With increasing deployment of variable RE technologies,
specifically from 2025 onwards, the merit-order-effect and the related decrease in market values
shows a significant effect. From about 2035 onwards the need to support RE technologies in Poland
vanishes – as long as wholesale electricity price rise as expected.
Figure 48: Future development of remuneration levels and corresponding market values of the
assessed RE technologies (as aggregate) and of nuclear power in Poland according to the
Green-X scenario of dedicated RE support (Source: Own assessment (Green-X))
In accordance with Figure 45, Figure 49 provides a comparison of support expenditures for assessed
RE technologies and nuclear power in Poland, indicating the development over time (left) and in
cumulative volumes (2023 to 2050) (right) with details for the assessed RE technologies. A closer look
at the dynamic development reveals the declining trend for nuclear power as discussed above. For the
assessed RE technologies in the period up to 2025 an increase in support expenditure is observable
that goes hand in hand with the strong uptake of deployment. In later years also for renewables a
strong decline of support expenditures is expected. Responsible for this development are the phase
out of support for installations after their guaranteed duration, the expected technological progress
and the replacement of previously strongly supported renewables by new installations that do no
longer require incentives (e.g. wind onshore). In cumulative terms savings of about 6% (compared to
nuclear) can be deducted for assessed renewables in Poland.
0
25
50
75
100
125
201
5
202
0
202
5
203
0
203
5
204
0
204
5
205
0
€/M
Wh
Average remuneration forselected RES-E
Average market value for
selected RES-E
Average remuneration forNuclear (Hinkley Point C)
Wholesale electricity price
(Market value for other RES-E
and Nuclear)
Ne
tsu
pp
ort
in
th
e
case
of
RE
Ne
tsu
pp
ort
in
th
e
case
of
Nu
cle
ar

Renewable Energies versus Nuclear Power – Comparing Financial Support
60
Figure 49: Comparison of expected support expenditures for assessed RE technologies and nuclear
power in Poland according to the Green-X scenario of dedicated RE support:
development over time (left) and cumulative volumes (2023 to 2050) (right) by RE
technology (Source: Own assessment (Green-X))
Figure 50: Comparison of overall cost-effectiveness: Specific net support for assessed RE
technologies and nuclear power in Poland according to the Green-X scenario of
dedicated RE support (Source: Own assessment (Green-X))
Comparing cumulative electricity generation and corresponding support expenditures that would arise
throughout the assessment period (2023 to 2050) an overall conclusion related to the cost
effectiveness can be drawn: Results on specific net support as shown in Figure 50 point out that
supporting a basket of RE technologies as analyzed in this assessment shows a 74.5% higher cost-
effectiveness than the planned support for Hinkley Point C that served as nuclear comparator
throughout this exercise. Poland possesses all opportunities to increase the deployment of renewables
significantly in the mid- to long-term. Of highlight, this turns out to be significantly more cost effective
than the nuclear alternative.
0.0
0.2
0.4
0.6
0.8
1.0
1.2
1.4
202
1
202
3
202
5
202
7
202
9
203
1
203
3
203
5
203
7
203
9
204
1
204
3
204
5
204
7
204
9
bil
lio
n €
/ a
Net support for Hinkley Point C (Nuclear)
Net support for selected RES-E
Net support in the period 2023 to 2050
4.3
16.7
0
2
4
6
8
10
12
14
16
18
Nuclear RES-E (selected)
€/M
Wh
Specific net support for Nuclear(Hinkley Point C)
Specific net support for selected RES-E
74.5% higher
cost effectiveness

Renewable Energies versus Nuclear Power – Comparing Financial Support
61
4.5 Czech Republic
4.5.1 Status Quo: Role of Nuclear Power and RE in the energy mix
In the Czech Republic, six reactors at two sites are in operation, the oldest one (Dukovany-1) started
in 1985. They produce 29 TWh, this is about one third of the country’s electricity production. In 2013,
the Czech Republic was a net exporter of 17 TWh of electricity, equivalent to close to 60 percent of the
nuclear output (Schneider et al., 2014).
The four reactors at the Dukovany site started operation between 1985 and 1987. They have
undergone a life extension engineering program under the expectation to operate until 2025, though
they require still a restart permission from the nuclear regulator after a periodic safety review
(Schneider et al., 2014). In autumn 2014, a NGO campaign started in Austria promoting an EIA
procedure for the future liftetime extension of Dukovany-1. Such a procedure has not been compulsory
before, but is now possible due to a recent change in the ESPOO Convention of the United Nations.
At the Temelin site, four reactors were under construction since 1987, in 1990 it was decided that only
two of them would be finished. The original planned units were Soviet design but were finished with
Western technology. The two reactors started operation in 2000 and 2002.
In 2004, the Czech government proposed the construction of at least two more reactors at Temelin. A
transboundary Environmental Impact Assessment started in 2008.17. In April 2014, the operator CEZ
cancelled its tender for the new plant due to economic reasons – the Czech government was not willing
to guarantee for electricity prices.
Figure 51: Breakdown of total electricity generation in 2012 for the Czech Republic (left), with
details for assessed selected RE technologies (right) (Source: Eurostat, KoT-project
(Resch et al., 2014))
As of 2012, the major part of electricity generated in the Czech Republic stems from fossil fuels and
nuclear power.
Renewables still play a minor role but the recent tendency appears promising: the RE share in gross
electricity demand grew from 7.5% in 2010 to 11.6% (2012) within two years. Thanks to the
17 http://www.umweltbundesamt.at/umweltsituation/uvpsup/espooverfahren/espoo_cz/uvptemelin34/
Nuclear,
40.6%
Fossil, 47.8%
Selected
RES-E, 7.7%
Other RES-E,
3.9%
Breakdown of total electricity generation in 2012
Biomass,
34.9%
Hydro small-
scale, 17.4%
Photovoltaics,
39.9%
Wind
onshore, 7.7%
Breakdown of electricity generationfrom selected RES-E
in 2012

Renewable Energies versus Nuclear Power – Comparing Financial Support
62
implemented support schemes (see Table 9) over the years, PV is of dominance among the assessed
RE technologies, holding a share of about 40% on aggregated generation (from selected RE).
4.5.2 Outlook: Role of Nuclear Power and RE in the energy mix
In 2013, the Czech Republic published an up-date of its State Energy Policy. This strategic paper was
was subjected to a transboundary Strategic Environmental Assessment. The Energy Policy expressed
the following goals: Dominant is the planned long-term reduction of the coal share in energy supply.
The expansion of nuclear energy should make the largest contribution towards this goal with an
increase of the nuclear share until 2040 to 49%–58%. Nuclear power would reach a primary energy
share of 28% to 33%. For the complete period from 2010 to 2040 the Czech Republic will stay a net
electricity exporter. Until 2040 also a moderate expansion of renewable energy use is planned.
Renewable energies should contribute with 16.3% to the primary energy used (Baumann et al. 2013).
Below we undertake a more general and independent comparison of different assessments of the
possible role of nuclear power and RE in the Czech Republic. An overview on the expected future
deployment of RES-E and nuclear power in relative terms (i.e. share in gross electricity demand) is
given in Figure 52 in accordance with selected scenarios. The scenarios used for this comparison
comprise:
• the EC’s (PRIMES) reference scenario of future energy and transport trends in the EU (EC,
2013b), providing both a projection of renewables and nuclear power deployment up to 2050
according to taken and already well planned policy decisions,
• an alternative (short-term) assessment of RE progress that comprises two scenarios of the
European Keep-on-Track! (KoT) project (see Resch et al. (2014)), assessing how well Member
States are on track with respect to their 2020 RE targets, and
• the Green-X scenario of dedicated RE support as elaborated within this study.
Figure 52: Expected future deployment in relative terms (i.e. share in gross electricity demand) of
RES-E and nuclear power in the Czech Republic according to selected scenarios (Source:
EC (2013b), KoT-project (Resch et al., 2014) and own assessment (Green-X))
As starting point we take a closer look at the EC’s reference scenario providing a conservative
projection of future energy supply and use. According to this scenario only a modest increase in
renewables is expected in the period up to 2030. Later on, even a decline of the RE share is expected.
Noticeably, the RE deployment projected by PRIMES is even below that what has been identified as
15.8%
23.9%
35.5%44.2%
61.1%
66.8%
0%
10%
20%
30%
40%
50%
60%
70%
80%
201
0
201
5
202
0
202
5
203
0
203
5
204
0
204
5
205
0
%
Green-X dedicated RE support
scenario
KoT baseline scenario
KoT policy recommendations scenario
PRIMES reference scenario (RES-Eshare)
PRIMES reference scenario
(nuclear share)
RE
sh
are
in
gro
ss e
lect
rici
tyd
em
an
d

Renewable Energies versus Nuclear Power – Comparing Financial Support
63
likely under baseline conditions in the KoT analysis. According to that focussed assessment of short-
term RE progress the Czech Republic would require immediate action to improve framework
conditions for RE in order to achieve its binding 2020 RE target domestically, compare for example the
high gap between expected (baseline case) and recommended (policy recommendations scenario) RE
deployment up to 2020. As third pillar, the Green-X scenario of dedicated RE support as elaborated
within this study is introduced for the Czech assessment: it can be classified as moderate with respect
to projected short-term RE progress and also in the long-term (up to 2050) only a modest increase of
RES-E is proclaimed in that scenario for the Czech Republic, achieving a RE share in gross electricity
demand of only about 35% by 2050. One of the key limiting factors for renewables in the Czech
Republic is probably the inflexible conventional power system, thanks to the dominant role of nuclear
power today and in the future.
With respect to nuclear only one trend scenario is applicable (i.e. the EC’s PRIMES reference case),
projecting a strong uptake of nuclear power in the period 2020 to 2040, with peaks in the nuclear share
at around 70% by 2040. Later on, a moderate decline of the nuclear share in overall electricity supply
is expected.
A closer look on the Green-X scenario of dedicated RE support that has been elaborated within this
study and that takes a central part in the dynamic assessment (see second part of section 4.5.5) is
taken below. Figure 53 offers a detailed overview on future RE deployment according to the assessed
policy pathway, indicating a breakdown of the expected future RES-E deployment up to 2050 in the
Czech Republic in absolute terms (i.e. electricity generation) by technology (left) and by age cluster
(right).
Figure 53: Breakdown of the expected future RES-E deployment in the Czech Republic in absolute
terms (i.e. electricity generation) by technology (left) and by age cluster (right) according
to the Green-X scenario of dedicated RE support (Source: Own assessment (Green-X))
The technology breakdown points out a comparatively well balanced mix of biomass, wind onshore
and PV by 2050, and minor contributions from small-scale hydropower. Compared to today this
requires a strong uptake of wind energy. Of relevance for the forthcoming comparative assessment of
nuclear and RE is also the breakdown by age structure as provided on the right hand-side of Figure 53:
The contribution of new RES-E plant installed during the period 2011 to 2050 is assessed within the
subsequent analysis, in particular the role of selected RE technologies biomass, small hydro, PV and
wind. As applicable from this graph, these technologies are expected to deliver the lion’s share of (RE)
power supply in the long-term.
11.6% 15.8%
23.9%
25.7%
35.5%
0%
5%
10%
15%
20%
25%
30%
35%
40%
0
5
10
15
20
25
30
20
12
20
20
20
30
20
40
20
50
TW
h/a
Biomass Hydro small-scale Photovoltaics
Wind onshore Wind offshore Other RES-E
RES-E demand share
0
5
10
15
20
25
30
20
10
20
20
20
30
20
40
20
50
TW
h/a
Existing RES-Eplant
Selected RES-E
Other RES-ENe
wR
ES
-E
(in
sta
lle
d 2
01
1 t
o 2
05
0)

Renewable Energies versus Nuclear Power – Comparing Financial Support
64
4.5.3 Existing support schemes for RE
In the Czech Republic, renewable electricity is promoted through either a guaranteed fixed feed-in
tariff or a green bonus (premium tariff) paid on top of the market price of electricity. Plant operators
are free to choose between these two options. Thus, a change from the premium to the feed-in tariffs
and vice versa is possible annually (Steinhilber et al., 2011).
In principle, all RES-E technologies are eligible under the FIT scheme. The tariff is statutorily guaranteed
for 20 years except for hydropower plants, where a supporting period of 30 years comes into effect.
The height of tariff differs by technology and is defined by the Energy Regulatory Office (ERO) for the
calendar year to come.
For the payment of FIT or green bonus, the “mandatory purchasers” are responsible. As of 2013 and
2014, these are distribution grid operators. Although, the grid operators are obliged to bear the costs
arising from FIT, they pass them on to the end users.
Operators generating renewable electricity to cover their own requirements only are also entitled to
the payment of a bonus. PV and biogas plants are only eligible if put into operation before 31 December
2013. Wind, hydro or biomass plants are eligible only if the building permit was issued before 2 October
2013 (RES LEGAL, n.d.).
For the assessed RE technologies, in the year in which the plant was put into operation, the green
bonus shall not exceed 4,500 CZK/MWh (approx. 16.4 €c/kWh) (RES LEGAL, n.d.).
Table 9: Details on current RE support in the Czech Republic by assessed RE technology (based on
RES LEGAL (n.d.) , Held et al. (2014)), (ERO, 2013)
Biomass FIT: Eligible for the plants up to 100 kW. In addition the following conditions should be met. i) The
electricity has to be generated in a CHP plant ii) Only pure biomass firing in new electricity generating
plants is eligible. The amount of the tariff varies according to the technology used:
The amount of FIT from 1 January to 31 December 2013 for the pure biomass in new generations
changes between 2.060 CZK/kWh - 3.730 CZK/kWh (approx. 8 €c/kWh - 14.4 €c/kWh).
Green Bonus: The amount of green bonus from 1 January to 31 December 2013 for the pure biomass
in new generations varies between 1.210 CZK/kWh – 2.880 CZK/kWh (approx. 4.6 €c/kWh - 11 €c/kWh).
Hydro-power FIT: Eligible up to a maximum capacity of 10 MW.
The single FIT (for non-peak hours) for small and reconstructed hydropower plants from till
31.December 2013: 2.549 CZK/kWh (approx. 9.8 €c/kWh)
The single FIT for small hydropower plants at new locations between 1 January 2013 - 31.December
2013: 3.295 CZK/kWh (approx. 12.8 €c/kWh)
Green Bonus: The single green bonus (FIT for non-peak hours) for small and reconstructed hydro power
plants from till 31.December 2013: 1.729 CZK/kWh (approx. 6.7 €c/kWh)
The single green bonus for small hydro power plants at new locations between 1 January 2013 -
31.December 2013: 2.475 CZK/kWh (approx. 9.6 €c/kWh)
PV The systems roof and facade integrate are eligible either under FIT or green bonus scheme. From 1
January 2014, the FIT and green bonus for new PV installations has been abolished. New PV installations
are only being supported if put into operation before 31 December 2013.
FIT: The FIT from 1 January to 30 June 2013 is as follows:
• Installed capacity up to 5 kW: 3.478 CZK/kWh (approx. 13.5 €c/kWh)
• Installed capacity up to 30 kW:2.887 CZK/kWh (approx.. 11.2 €c/kWh)
Green Bonus: The green bonus from 1 January to 30 June 2013 is as follows:
• Installed capacity up to 5 kW: 2.878 CZK/kWh (approx. 11.1 €c/kWh)

Renewable Energies versus Nuclear Power – Comparing Financial Support
65
• Installed capacity up to 30 kW:2.2287 CZK/kWh (approx.. 8.9 €c/kWh)
Wind For FIT and Green Bonus wind power plants are eligible if their building permit has been issued before
2 October 2013.
FIT: Eligible for the plants up to 100 kW maximum capacity. The FIT (for wind onshore) amounts to
2.162 CZK/kWh (approx. 8.4 €c/kWh)
Green Bonus: The green bonus in 2013 amounts to 1.682 CZK/kWh (6.5 €c/kWh)
4.5.4 Future requirements concerning support schemes of RE
Figure 54: Future development of remuneration levels and corresponding market values of the
assessed RE technologies in Czech Republic: biomass and small hydropower (left, up) PV
(right, up) and wind onshore (left, down) according to the Green-X scenario of dedicated
RE support (Source: Own assessment (Green-X))
As explained principally in section 3.2 and discussed with further detail for the case of the UK, the
difference between remuneration and market value determines the required net support for a specific
RE technology. Figure 54 points out that wind onshore and small hydropower are the first candidates
among the assessed RE technologies to achieve full cost competiveness in the Czech Republic.
0
25
50
75
100
125
150
20
15
20
20
20
25
20
30
20
35
20
40
20
45
20
50
€/M
Wh
Average remuneration for Photovoltaics
Market value for Photovoltaics
Wholesale electricity price (Market value for other RES-E and Nuclear)
Ne
tsu
pp
ort
in
th
e
case
of
Ph
oto
vo
lta
ics
0
25
50
75
100
125
150
20
15
20
20
20
25
20
30
20
35
20
40
20
45
20
50
€/M
Wh
Average remuneration for Wind onshore
Market value for Wind onshore
Wholesale electricity price (Market value for other RES-E and Nuclear)
Ne
tsu
pp
ort
in
th
e
case
of
Win
d o
nsh
ore

Renewable Energies versus Nuclear Power – Comparing Financial Support
66
Considering Czech specifics on wind and hydro conditions as well as on general electricity market
developments this is expected by 2030. A declining gap between remuneration levels and market
values can also be seen for biomass and PV where cost competitiveness is expected for the period
beyond 2040 – note however that for PV this represents a conservative estimate and concerns the
wholesale and not the end-user market (where cost competitiveness may occur at an earlier stage).
4.5.5 Comparison on costs and quantities of nuclear energy vs. RE
Static approach: comparison of planned support for nuclear with existing RE support
Figure 55 provides a comparison of expected remuneration levels for Hinkley Point C with those for a
new RE power plant as well as expected future wholesale electricity prices in the Czech Republic.
Apparently, among all assed RE technologies, the remuneration level is only for wind energy lower
than the planned state aid for nuclear in the UK. Similar to UK and France, the average total
remuneration for PV is the highest among all assessed options in the Czech Republic (122.5 €/MWh)
followed by small-scale hydropower (116.4 €/MWh) and dedicated biomass (107.9 €/MWh). As it is
the case in Germany and France, biomass cofiring is except from the support schemes, thus expressed
remuneration contains only expected earnings from selling the produced electricity on the power
exchange.
Concerning net support, the comparison shows that net support for onshore wind (35.5 €/MWh) is
lower than expected net support for a new nuclear power plant (similar to the one planned for Hinkley
PointC) (35.9-50.9 €/MWh, depending on whether UK or Czech wholesale electricity prices are used to
calculate net support). PV needs the highest support (67.1 €/MWh) followed by the small scale hydro
(61.1 €/MWh) and dedicated biomass (52.5 €/MWh).
Figure 55: Comparison of remuneration levels (and of wholesale electricity prices) for nuclear
power and for assessed RE technologies in the Czech Republic (Source: Own calculations,
based on Steinhilber et al. (2011) and Held et al. (2014))
Figure 56 indicates the possible annual electricity generation from RES-E that could be promoted in
the Czech Republic with currently implemented support schemes (i.e. taking average remuneration
and net support levels as given) in comparison to the planned aid scheme for nuclear power in the UK.
As observable in this graph, a range of feasible generation volumes is depicted for the assessed RE
technologies:
105.6 107.9
55.3
116.4122.5
90.8
UK
0
20
40
60
80
100
120
140
160
Hin
kley
Po
int
C
(UK)
Bio
ma
ss
(ded
icat
ed
pla
nt)
Bio
ma
ss c
ofir
ing
Hyd
ro s
ma
ll-sc
ale
Phot
ovol
taik
Win
d on
sho
re
€/M
Wh
range of remuneration
average remuneration
average wholesale electricity price
Ne
tsu
pp
ort

Renewable Energies versus Nuclear Power – Comparing Financial Support
67
• The lower boundary of possible volumes answers the question how much renewable
electricity (from different technologies) could be supported in the Czech Republic, if annual
net support expenditures as expected for Hinkley Point C under UK circumstances are taken
as given.
• If a new nuclear power plant like the one planned for Hinkley Point C is constructed in the
Czech Republic under similar support conditions as planned for the UK (i.e. same FIT level as
set in the UK), the net support level would differ because of different electricity wholesale
prices. The upper range in Figure 56 is consequently taking into account this difference, using
Czech wholesale prices and corresponding annual net support expenditures, and showing how
much electricity generation could be achieved with that for the assessed RE technologies.
Considering the expected net support expenditures for Hinkley Point C, in the Czech Republic a
considerably higher range of electricity could be generated from onshore wind. The amount of
electricity generation from other RE technologies such as dedicated biomass, small-scale hydropower
and PV are below the expected annual electricity generation from a new nuclear power plant (similar
to Hinkley Point C).
Figure 56: Comparison of expected annual electricity generation of Hinkley Point C with feasible
volumes from assessed RE technologies in the Czech Republic (Source: Own calculations)
Finally, Figure 57 compares the required yearly net support for a new nuclear power plant (similar to
Hinkley Point C) with the ones needed for assessed RE technologies with a similar annual electricity
production volume (i.e. 26 TWh/a). In accordance with above, net support for nuclear power is
depicted in Figure 57 through two lines, i.e. considering either UK or Czech wholesale electricity
prices.18
Remarkably, supporting onshore wind is significantly cheaper with cost savings up to 29% (compared
to nuclear). All other assessed RE technologies require higher expenditures at present to achieve the
targeted annual electricity generation of 26 TWh/a.
18 Thus, required annual net support for nuclear power would be higher in the Czech Republic since wholesale electricity prices are lower
than in the UK.
0
10
20
30
40
50
60
70
Bio
mas
s(d
edic
ate
d p
lan
t)
Bio
mas
s co
firi
ng
Hyd
ro s
mal
l-sc
ale
Ph
oto
volt
aik
Win
d o
nsh
ore
TW
h/a
Range ofpossible annualelectricitygenerationfrom RES-E
Expectedannualelectricitygeneration ofHinkley Point C(UK)

Renewable Energies versus Nuclear Power – Comparing Financial Support
68
Figure 57: Comparison of required annual net support for nuclear power and in the case of RE
technologies in Czech Republic (Source: Own calculations)
Dynamic approach: comparison of planned support for nuclear with future RE support
according to a model-based analysis (Green-X)
Figure 58: Comparison of expected future electricity generation from assessed RE technologies and
nuclear power in Czech Republic according to the Green-X scenario of dedicated RE
support: development over time (left) and cumulative volumes (2023 to 2050) (right) by
RE technology (Source: Own assessment (Green-X))
Building on the Green-X scenario of dedicated RE support and the derived deployment of renewables
in the Czech Republic, a comparative assessment of RE support with the planned subsidy for Hinkley
Point C is undertaken below in a dynamic context. More precisely, the years from 2023 to 2050 form
the assessment period whereby 2023 is chosen since this is the year when Hinkley Point is expected to
start full operation. As a first step the amount of expected electricity generation from assessed RE
technologies and from a new nuclear power plant (similar to the one planned for Hinkley Point C) is
collated. Next to that, related support expenditures for RES-E and nuclear power are contrasted and,
finally, the cost-effectiveness of the two distinct options is compared.
Figure 58 undertakes a comparison of the expected future electricity generation from assessed RE
1365
1588
1745
923
934
1307
0
200
400
600
800
1,000
1,200
1,400
1,600
1,800
2,000
Bio
mas
s(d
edic
ated
pla
nt)
Bio
mas
s co
firi
ng
Hyd
ro s
mal
l-sc
ale
Ph
oto
volt
aik
Win
d o
nsh
ore
M€
/a
Requiredannual netsupport in thecase of RES-E*
… considering UK wholesale electricity prices
… considering country-specific wholesale electricity prices
Note:*for producing the same amount of electricity as expected to be generated in Hinkley Point C
Re
qu
ire
d a
nn
ual
ne
t su
pp
ort
in t
he
case
of
0
5
10
15
20
25
30
202
1
202
3
202
5
202
7
202
9
203
1
203
3
203
5
203
7
203
9
204
1
204
3
204
5
204
7
204
9
TW
h/a
Electricity generation from Nuclear (Hinkley Point C)
Electricity generation from selected new RES-E (installed 2011 to 2050)
Electricity generation in the period 2023 to 2050

Renewable Energies versus Nuclear Power – Comparing Financial Support
69
technologies and from a new nuclear power (similar to Hinkley Point C), indicating deployment over
time (left) and cumulative volumes (i.e. 2023 to 2050) (right) with details expressed by RE technology.
Note that for renewables only electricity generation stemming from new biomass, small hydro, wind
or photovoltaic plants (installed between 2011 and 2050) is considered. As discussed in section 4.5.2
only a moderate expansion of assessed RE technologies is expected for the focal period, leading to an
about 50% lower cumulative electricity generation than at Hinkley Point C. Biomass is expected to
provide roughly half of the total RE volumes, followed by onshore wind and PV.
Complementary to above, Figure 59 shows the development over time of remuneration levels and of
the corresponding reference price for the assessed technology options, using weighted average figures
to determine market value and the remuneration level for the aggregated RE technology cluster that
comprises the basket of assessed individual RE technologies. The need for net support for a new
installation in a given year can then be derived by subtracting the market value from overall
remuneration. This allows for a first interpretation of cost efficiency.
For nuclear it is apparent that during early years of operation a significant gap between remuneration
and market value, in this case determined by the yearly average wholesale electricity price, arises. In
later years this gap diminishes because wholesale electricity prices increase over time. For the
aggregate of assessed RE technologies on the one hand in early years a small increase of remuneration
is apparent, followed by a moderate decline thanks to technological progress. On the other hand, the
average market value increases driven by the increase in expected wholesale prices. From 2040
onwards the gap between remuneration and market value vanishes, indicating full cost
competitiveness of assessed RE technologies.
Figure 59: Future development of remuneration levels and corresponding market values of the
assessed RE technologies (as aggregate) and of nuclear power in Czech Republic
according to the Green-X scenario of dedicated RE support (Source: Own assessment
(Green-X))
Next, Figure 60 compares support expenditures for assessed RE technologies and nuclear power in the
Czech Republic, illustrating the development over time (left) and in cumulative volumes (2023 to 2050)
(right) with details for the assessed RE technologies. The dynamic development reveals the declining
trend for nuclear power as discussed above. For renewables support expenditures remain constant
until 2030 and later on a strong decline can be seen. This decrease is caused by technological progress
and by the replacement of previously strongly supported renewables through new installations that
0
25
50
75
100
125
201
5
202
0
202
5
203
0
203
5
204
0
204
5
205
0
€/M
Wh
Average remuneration forselected RES-E
Average market value for
selected RES-E
Average remuneration forNuclear (Hinkley Point C)
Wholesale electricity price
(Market value for other RES-E
and Nuclear)
Ne
tsu
pp
ort
in
th
e
case
of
RE
Ne
tsu
pp
ort
in
th
e
case
of
Nu
cle
ar

Renewable Energies versus Nuclear Power – Comparing Financial Support
70
do no longer require incentives. In cumulative terms RE installations require 77% less support than the
nuclear comparator.
Figure 60: Comparison of expected support expenditures for assessed RE technologies and nuclear
power in the Czech Republic according to the Green-X scenario of dedicated RE support:
development over time (left) and cumulative volumes (2023 to 2050) (right) by RE
technology (Source: Own assessment (Green-X))
Figure 61: Comparison of overall cost-effectiveness: Specific net support for assessed RE
technologies and nuclear power in the Czech Republic according to the Green-X scenario
of dedicated RE support (Source: Own assessment (Green-X))
Comparing both the cumulative amount of electricity generated and the corresponding support
expenditures that would arise throughout the assessment period (2023 to 2050) finally a concluding
assessment of the cost effectiveness can be derived: Figure 61 expresses the specific net support for
both nuclear power and renewables. Thus, the conclusion can be drawn that supporting a basket of
RE technologies as analyzed in this assessment shows a 52% higher cost-effectiveness than the planned
support for a new nuclear power plant (similar to the aid scheme foreseen for Hinkley Point C). Thus,
0.0
0.2
0.4
0.6
0.8
1.0
1.2
1.4
202
1
202
3
202
5
202
7
202
9
203
1
203
3
203
5
203
7
203
9
204
1
204
3
204
5
204
7
204
9
bil
lio
n €
/ a
Net support for Hinkley Point C (Nuclear)
Net support for selected RES-E
Net support in the period 2023 to 2050
0
8.3
17.1
0
2
4
6
8
10
12
14
16
18
Nuclear RES-E (selected)
€/M
Wh
Specific net support for Nuclear(Hinkley Point C)
Specific net support for selected RES-E
52% higher
cost effectiveness

Renewable Energies versus Nuclear Power – Comparing Financial Support
71
the Czech Republic has the potential to increase the deployment of renewables and this turns out to
be significantly more cost effective than the nuclear alternative.
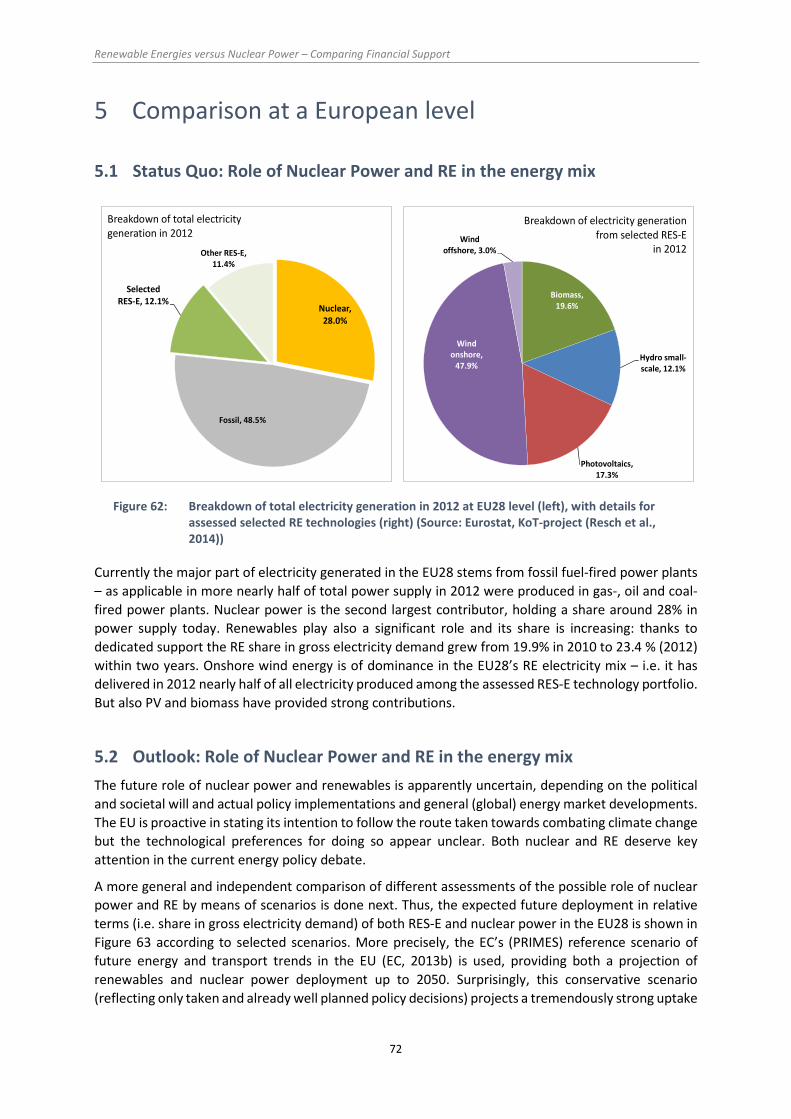
Renewable Energies versus Nuclear Power – Comparing Financial Support
72
5 Comparison at a European level
5.1 Status Quo: Role of Nuclear Power and RE in the energy mix
Figure 62: Breakdown of total electricity generation in 2012 at EU28 level (left), with details for
assessed selected RE technologies (right) (Source: Eurostat, KoT-project (Resch et al.,
2014))
Currently the major part of electricity generated in the EU28 stems from fossil fuel-fired power plants
– as applicable in more nearly half of total power supply in 2012 were produced in gas-, oil and coal-
fired power plants. Nuclear power is the second largest contributor, holding a share around 28% in
power supply today. Renewables play also a significant role and its share is increasing: thanks to
dedicated support the RE share in gross electricity demand grew from 19.9% in 2010 to 23.4 % (2012)
within two years. Onshore wind energy is of dominance in the EU28’s RE electricity mix – i.e. it has
delivered in 2012 nearly half of all electricity produced among the assessed RES-E technology portfolio.
But also PV and biomass have provided strong contributions.
5.2 Outlook: Role of Nuclear Power and RE in the energy mix
The future role of nuclear power and renewables is apparently uncertain, depending on the political
and societal will and actual policy implementations and general (global) energy market developments.
The EU is proactive in stating its intention to follow the route taken towards combating climate change
but the technological preferences for doing so appear unclear. Both nuclear and RE deserve key
attention in the current energy policy debate.
A more general and independent comparison of different assessments of the possible role of nuclear
power and RE by means of scenarios is done next. Thus, the expected future deployment in relative
terms (i.e. share in gross electricity demand) of both RES-E and nuclear power in the EU28 is shown in
Figure 63 according to selected scenarios. More precisely, the EC’s (PRIMES) reference scenario of
future energy and transport trends in the EU (EC, 2013b) is used, providing both a projection of
renewables and nuclear power deployment up to 2050. Surprisingly, this conservative scenario
(reflecting only taken and already well planned policy decisions) projects a tremendously strong uptake
Nuclear,
28.0%
Fossil, 48.5%
Selected
RES-E, 12.1%
Other RES-E,
11.4%
Breakdown of total electricity generation in 2012
Biomass,
19.6%
Hydro small-
scale, 12.1%
Photovoltaics,
17.3%
Wind
onshore,
47.9%
Wind
offshore, 3.0%
Breakdown of electricity generationfrom selected RES-E
in 2012

Renewable Energies versus Nuclear Power – Comparing Financial Support
73
of RE in the EU28’s electricity sector in the period up to 2020 while later on only a slow and steady
increase is becoming apparent, indicating some sort of stagnation. This scenario is then further
contrasted with an alternative (short-term) assessment of RE progress: two scenarios of the European
Keep-on-Track! (KoT) project (see Resch et al. (2014)), assessing how well Member States are on track
with respect to their 2020 RE targets, are depicted, indicating a large gap between the expected
(baseline case) and the required (policy recommendations case) short-term RE progress. Finally, the
Green-X scenario of dedicated RE support as elaborated within this study is shown, reflecting in the
short-term a compromise between both KoT pathways that can however be classified as ambitious
(i.e. where RE deployment follows rather the “policy recommendations” path than a baseline trend).
In the long-term up to 2050 our Green-X scenario proclaims a steady and strong uptake of renewables
at EU28 level, achieving a RE share of about 78% in gross electricity demand by 2050. This is at the
upper boundary of what the EC foresees in their impact assessment related to the establishment of
2030 climate and energy targets as published in January 2014.19
With respect to nuclear only one trend scenario is applicable (i.e. the EC’s PRIMES reference case),
indicating a short-term decline up to 2020. In subsequent years the nuclear share in gross electricity
generation remains constant.
Figure 63: Expected future deployment in relative terms (i.e. share in gross electricity demand) of
RES-E and nuclear power at EU28 level according to selected scenarios (Source: EC
(2013b), KoT-project (Resch et al., 2014) and own assessment (Green-X))
Next we take a closer look at the Green-X scenario of dedicated RE support and the therein sketched
deployment of RE technologies. Figure 64 gives a detailed overview on future RE deployment according
to the assessed policy pathway, offering a breakdown of the expected future RES-E deployment up to
2050 at EU28 level in absolute terms (i.e. electricity generation) by technology (left) and by age cluster
(right). The technology breakdown points out the dominant role of wind energy today and in the future
– i.e. both on- and offshore are expected to deliver almost half of electricity supply by 2050, requiring
a suitable and functioning power system integration and an extension of grid capabilities and
interconnectors across Europe. Also other RE options like solar or biomass provide substantial shares,
each contributing about 10% of total electricity supply by 2050. Of relevance for the forthcoming
19 In January 2014 the EC published its communication “A policy framework for climate and energy in the period from 2020 to 2030”
(COM(2014) 15 final) (EC, 2014b), proposing targets for 2030 of reducing greenhouse gas emissions by 40% and achieving a 27% share of renewable energy in final consumption. The accompanying impact assessment (SWD(2014) 15) (EC, 2014c) contains a broader range of climate mitigation scenarios that differ in the contribution of RE and energy efficiency as well as of other low carbon options.
36.2%
52.1%
78.4%
22.0%
21.9% 21.4%
0%
10%
20%
30%
40%
50%
60%
70%
80%
90%
201
0
201
5
202
0
202
5
203
0
203
5
204
0
204
5
205
0
%
Green-X dedicated RE support
scenario
KoT baseline scenario
KoT policy recommendations scenario
PRIMES reference scenario (RES-Eshare)
PRIMES reference scenario
(nuclear share)
RE
sh
are
in
gro
ss e
lect
rici
tyd
em
an
d

Renewable Energies versus Nuclear Power – Comparing Financial Support
74
comparative assessment of nuclear and RE is also the breakdown by age structure as provided on the
right hand-side of Figure 64: New RES-E plant installed during the period 2011 to 2050 are in focus
within the subsequent analysis, in particular the selected RE technologies biomass, small hydro, PV
and wind (on- and offshore). As applicable from this graph, these technologies are expected to deliver
the lion’s share of (RE) power supply in the long-term.
Figure 64: Breakdown of the expected future RES-E deployment in EU28 in absolute terms (i.e.
electricity generation) by technology (left) and by age cluster (right) according to the
Green-X scenario of dedicated RE support (Source: Own assessment (Green-X))
5.2.1 Comparison on costs and quantities of nuclear energy vs. RE
Dynamic approach: comparison of planned support for nuclear with future RE support
according to a model-based analysis (Green-X)
Building on the Green-X scenario of dedicated RE support, a comparative assessment of RE support
with the planned subsidy for a new nuclear power plant (at the example of Hinkley Point C) is
undertaken below in a dynamic context. More precisely, the years from 2023 to 2050 form the
assessment period whereby 2023 is chosen since this is the year when Hinkley Point is expected to
start full operation. As a first step the amount of expected electricity generation from assessed RE
technologies and from the nuclear power plant at Hinkley Point C is collated. Next to that, related
support expenditures for RES-E and nuclear power are contrasted and, finally, the cost-effectiveness
of the two distinct pathways is derived.
Figure 65 compares the expected future electricity generation from assessed RE technologies and
nuclear power at EU28 level, indicating deployment over time (left) and in cumulative terms (i.e.
summing up expected electricity generation in the period 2023 to 2050) (right) with details expressed
by RE technology. Note that for renewables only electricity generation that stems from new biomass,
small hydro, wind or photovoltaic plants (installed between 2011 and 2050) is considered. As discussed
above a strong uptake of the assessed RE technologies is expected for the focal period within the EU28,
leading to an almost 54 times higher cumulative electricity generation than from our nuclear
comparator – i.e. a new nuclear power plant at Hinkley Point C. Wind onshore is expected to provide
about half of the total RE volumes, followed by biomass, PV and offshore wind.
23.4%36.2%
52.1%
66.0%
78.4%
0%
10%
20%
30%
40%
50%
60%
70%
80%
90%
0
500
1000
1500
2000
2500
3000
20
12
20
20
20
30
20
40
20
50
TW
h/a
Biomass Hydro small-scale Photovoltaics
Wind onshore Wind offshore Other RES-E
RES-E demand share
0
500
1000
1500
2000
2500
3000
20
10
20
20
20
30
20
40
20
50
TW
h/a
Existing RES-Eplant
Selected RES-E
Other RES-ENe
wR
ES
-E
(in
sta
lle
d 2
01
1 t
o 2
05
0)

Renewable Energies versus Nuclear Power – Comparing Financial Support
75
Figure 65: Comparison of expected future electricity generation from assessed RE technologies and
nuclear power in the EU28 according to the Green-X scenario of dedicated RE support:
development over time (left) and cumulative volumes (2023 to 2050) (right) by RE
technology (Source: Own assessment (Green-X))
Complementary to above, Figure 65 shows the development over time of remuneration levels on
average at EU28 level and the corresponding (average) reference price for the assessed technology
options, using weighted average figures to determine market value and the remuneration level for the
aggregated RE technology cluster that comprises the basket of assessed individual RE technologies by
Member State. The need for net support for a new installation in a given year can then be derived by
subtracting the market value from overall remuneration. This allows for a first interpretation of cost
efficiency.
Figure 66: Future development of remuneration levels and corresponding market values of the
assessed RE technologies (as aggregate) and of nuclear power at EU28 level according to
the Green-X scenario of dedicated RE support (Source: Own assessment (Green-X))
For nuclear it can be seen that during early years of operation a significant gap between remuneration
and market value, in this case determined by the yearly average wholesale electricity price, occurs.
0
500
1000
1500
2000
25002
021
202
3
202
5
202
7
202
9
203
1
203
3
203
5
203
7
203
9
204
1
204
3
204
5
204
7
204
9
TW
h/a
Electricity generation from selected new RES-E (installed 2011 to 2050)
Electricity generation from Nuclear (Hinkley Point C)
Electricity generation in the period 2023 to 2050
0
25
50
75
100
125
201
5
202
0
202
5
203
0
203
5
204
0
204
5
205
0
€/M
Wh
Average remuneration forselected RES-E
Average market value for
selected RES-E
Average remuneration forNuclear (Hinkley Point C)
Wholesale electricity price
(Market value for other RES-E
and Nuclear)
Ne
tsu
pp
ort
in
th
e
case
of
RE
Ne
tsu
pp
ort
in
th
e
case
of
Nu
cle
ar

Renewable Energies versus Nuclear Power – Comparing Financial Support
76
The gap is however getting smaller in later years thanks to the expected increase in wholesale
electricity prices (that goes hand in hand with an increase of fossil fuel and carbon prices over time).
For renewables an interpretation appears more difficult since outcomes reflect the over shading
impacts of a basket of technologies in 28 Member States that come into play: In the period up to 2030
a strong decline of remuneration levels is apparent, reflecting expected technological progress across
all technologies. In later years, remuneration remains rather constant. On the contrary, with increasing
deployment the merit-order-effect and the related decrease in market values of variable renewables
shows effect. This decouples the market value from the average wholesale electricity price, causing a
slower but steady increase of the reference price that finally determines the need for (net) support.
Beyond 2040 remuneration levels and market values align but a small gap remains mainly due to
offshore wind as used in several Northern EU countries, and that fails to achieve full cost
competitiveness within the assessment period.
In a similar way as shown for electricity generation in Figure 65, Figure 67 allows for a comparison of
support expenditures for assessed RE technologies and nuclear power in the EU28, showing the
development over time (left) and cumulative volumes (2023 to 2050) (right) with details for the
assessed RE technologies. A closer look at the dynamic development reveals the declining trend for
nuclear power as discussed above. For renewables in early years a strong increase of support
expenditures is applicable that goes hand in hand with the uptake of deployment. After 2025 a first
moderate and later on strong decline of RE support expenditures can be seen. Several factors play here
a decisive role: the decline is partly caused by a phase out of support for RE installations after their
guaranteed support duration, partly a consequence of technological progress, and partly because of
the replacement of previously strongly supported renewables by new installations that do no longer
require financial incentives.
Figure 67: Comparison of expected support expenditures for assessed RE technologies and nuclear
power at EU28 level according to the Green-X scenario of dedicated RE support:
development over time (left) and cumulative volumes (2023 to 2050) (right) by RE
technology (Source: Own assessment (Green-X))
Comparing both the cumulative amount of electricity generated and the corresponding support
expenditures that would arise throughout the assessment period (2023 to 2050) a concluding
assessment of the cost effectiveness can be derived: As indicated by the results on specific net support
shown in Figure 68 the conclusion can be drawn that supporting a basket of RE technologies as
0.0
5.0
10.0
15.0
20.0
25.0
30.0
202
1
202
3
202
5
202
7
202
9
203
1
203
3
203
5
203
7
203
9
204
1
204
3
204
5
204
7
204
9
bil
lio
n €
/ a
Net support for selected RES-E
Net support for Hinkley Point C (Nuclear)
Net support in the period 2023 to 2050

Renewable Energies versus Nuclear Power – Comparing Financial Support
77
analyzed in this assessment shows a 37% higher cost-effectiveness than the planned support for a new
nuclear power plant as exemplified for the case of Hinkley Point C in the UK, serving as nuclear
comparator throughout this exercise.
Figure 68: Comparison of overall cost-effectiveness: Specific net support for assessed RE
technologies and nuclear power at EU28 level according to the Green-X scenario of
dedicated RE support (Source: Own assessment (Green-X))
5.3 Cross-country comparison: Summary of key results
The static approach undertaken at country level provides a comparison of planned support for nuclear
power at Hinkley Point C in the UK with existing RE support, that is, as implemented in 2013. Key
outcomes of that are summarised in Figure 69, indicating by RE technology the possible annual
electricity generation that could be supported with currently implemented RE policies in analysed
countries. For doing so, average remuneration and net support levels are taken as given. Note that
generally a range of feasible generation volumes is depicted for the assessed RE technologies by
country:
• The lower boundary of possible volumes answers the question how much renewable
electricity (from different technologies) could be supported in the assessed country, if annual
net support expenditures as expected for Hinkley Point C under UK circumstances are taken
as given.
• If a new nuclear power plant like the one planned for Hinkley Point C is constructed in another
country under similar support conditions as planned for the UK (i.e. same FIT level as set in the
UK), the net support level would differ because of different electricity wholesale prices. Thus,
the upper range in Figure 69 is consequently taking into account this difference, using country-
specific wholesale prices and corresponding annual net support expenditures, and showing
how much electricity generation could be achieved with that for the assessed RE technologies.
0
10.8
17.1
0
2
4
6
8
10
12
14
16
18
Nuclear RES-E (selected)
€/M
Wh
Specific net support for Nuclear(Hinkley Point C)
Specific net support for selected RES-E
37.1% higher
cost effectiveness

Renewable Energies versus Nuclear Power – Comparing Financial Support
78
Figure 69: Comparison of expected annual electricity generation of Hinkley Point C with feasible
volumes from assessed RE technologies by assessed country (Source: Own calculations)
In accordance with Figure 69, key results of the static assessment can be summarised as follows:
• Under similar budgetary constraints, a higher amount of electricity generation appears
feasible with wind onshore and small-scale hydropower plants compared to nuclear in all
analysed countries (with the exception of hydro in the Czech Republic). This means, in turn,
that small hydro and wind onshore represent “least cost” options from today’s perspective
across all assessed countries. In those countries where support is offered to that option, i.e.
the UK and Poland, co-firing of biomass in fossil-fuel based power plants represents another
cost-effective generation option.
• A cross-country comparison indicates a comparatively small benefit for wind onshore in the
UK. While in all other countries remuneration levels and net support are significantly lower
and, in turn, feasible generation volumes are higher for wind onshore compared to nuclear
power. This is the result of an unequal risk perception of two distinct policy instruments that
come into play for the UK: Today’s support for wind onshore in the UK via a certificate trading
regime can be classified as significantly more risky than safe revenues stemming from a
“Contract for Difference” scheme as planned for Hinkley Point C.
• Both PV and wind offshore represent the most costly options from today’s perspective in the
majority of countries.
The static assessment as discussed above compares today’s incentives for RE with a planned aid
scheme for nuclear power that may become effective ten years ahead. Since partly significant cost
reductions have been achieved throughout the last decade for several RE technologies it can be
expected that ongoing technological learning will trigger additional cost decreases and, consequently,
reduce the need for RES-E support in forthcoming years. Thus, complementary to the above, a dynamic
approach is followed within this study: Building on the Green-X scenario of dedicated RE support and
the therein sketched deployment of renewables in the EU28, a comparative assessment of future RE
support with the planned subsidy for Hinkley Point C is undertaken for all assessed countries. More
precisely, the years from 2023 to 2050 form the assessment period whereby 2023 is chosen since this
is the year when Hinkley Point C is expected to start full operation. Within that assessment support
0
10
20
30
40
50
60
70
United Kingdom France Germany Poland Czech Republic
TW
h/a
Expected annualelectricity generation ofHinkley Point C (UK) Expected annual electricity generation from RE technologies
Biomass (dedicated plant)
Biomass (cofiring)
Small-scale hydropower
Photovoltaics
Wind onshore
Wind offshore

Renewable Energies versus Nuclear Power – Comparing Financial Support
79
expenditures for RES-E and nuclear power are contrasted and, finally, the cost-effectiveness of the two
distinct pathways is derived.
Figure 70: Future development of remuneration levels and corresponding market values of the
assessed RE technologies (as aggregate) and of nuclear power across assessed countries
and at EU28 level according to the Green-X scenario of dedicated RE support (Source:
Own assessment (Green-X))
Figure 70 shows the development over time of remuneration levels and the corresponding reference
price for the assessed technology options, using weighted average figures to determine market value
and the remuneration level for the aggregated RE technology cluster that comprises the basket of
assessed individual RE technologies. This graph shows these developments at EU 28 level (i.e. via
dotted or solid lines) while shaded areas indicate the ranges of expressed items occurring across
assessed countries. Generally, the need for net support for a new installation in a given year can then
be derived by subtracting the market value from overall remuneration. Thus, this allows for a first
interpretation of cost efficiency:
• For nuclear power it can be observed that during early years of operation a significant gap
between remuneration and market value, in this case determined by the yearly average
wholesale electricity price, occurs. This is however getting smaller in later years thanks to the
expected increase in wholesale electricity prices (that goes hand in hand with an increase of
fossil fuel and carbon prices over time).
• For renewables an interpretation appears more difficult since outcomes reflect the over
shading impacts of a basket of technologies that come into play: In early years a strong decline
of remuneration levels is apparent, reflecting expected technological progress across all
considered RE technologies but, thanks to their dominance driven by cost trends for on- and
offshore wind as well as photovoltaics. In later years, with increasing deployment the merit-
order-effect and the related decrease in market values of variable renewables is applicable.
Offshore wind is then mainly responsible for the small gap remaining, where average RE
remuneration is higher than the market value at EU28 level as well as in some of the assessed
countries. In general, similar to nuclear the need for net support shows a decreasing tendency
in the final years up to 2050.
Comparing cumulative electricity generation and corresponding support expenditures that would arise
throughout the assessment period (2023 to 2050) an overall conclusion related to the cost
effectiveness of the two distinct pathways (i.e. nuclear versus RE) can be drawn next. Results on

Renewable Energies versus Nuclear Power – Comparing Financial Support
80
specific net support as derived by dividing cumulative support expenditures by cumulative electricity
generation are shown in Figure 71. Complementary to that, resulting cost savings at country as well as
at EU28 level that would arise if the preferred option is followed are shown in Figure 72.
Figure 71: Comparison of overall cost-effectiveness: Specific net support for assessed RE
technologies and nuclear power by assessed countries and at EU28 level according to
the Green-X scenario of dedicated RE support (Source: Own assessment (Green-X))
Figure 72: Comparison of overall cost-effectiveness: Cost savings due to RE compared to nuclear
power by assessed country and at EU28 level according to the Green-X scenario of
dedicated RE support (Source: Own assessment (Green-X))
Of highlight are the following observations:
• As discussed above, net support is generally defined as the difference between total
remuneration and the market value of the fed in electricity. If a new nuclear power plant like
the one planned for Hinkley Point C is built in another country under similar support conditions
as planned for the UK (i.e. same FIT level as set in the UK), the net support level would differ
because of different electricity wholesale prices that in the case of nuclear power serve as
determinant for its market value. In future years lower electricity prices than in the UK are
expected for countries like France, Poland, the Czech Republic and the whole EU28 on average.
Thus, a new nuclear power would consequently require significantly higher net support in
these countries than in the UK. This would strongly increase the burden for consumer and/or
the society, respectively.
15.3 15.3
16.7 16.7 17.1 17.1
14.0
9.3
12.5
4.3
8.3
10.8
0
2
4
6
8
10
12
14
16
18
United Kingdom Germany France Poland Czech Republic EU28
€/M
Wh
Specific net support for Nuclear (Hinkley Point C) Specific net support for selected RES-E
-8.4%
-39.1%
-24.8%
-74.5%
-51.6%
-37.1%
-80%
-70%
-60%
-50%
-40%
-30%
-20%
-10%
0%
UnitedKingdom Germany France Poland
CzechRepublic EU28
% -
cost
sa
vin
gs
com
pa
red
to
nu
cle
ar
po
we
r
Cost savings due to RE

Renewable Energies versus Nuclear Power – Comparing Financial Support
81
• Results on specific net support as shown in Figure 71 point out that supporting a basket of RE
technologies as analyzed in this assessment leads to a higher cost-effectiveness than the
planned support for the nuclear power plant at Hinkley Point C that served as nuclear
comparator throughout this exercise. This statement is valid for all assessed countries as well
as for the EU28:
o Highest cost savings due to RE can be observed for Poland where following a RE
pathway instead of nuclear would lead to savings in support expenditures of 74.5%.
o On second place follows the Czech Republic where savings due to RE are in size of
51.6%.
o Germany ranks as third among the assessed countries with respect to feasible cost
savings that come along with following the renewable pathway. Support expenditures
can be reduced by 39.1% through targeting support to RE technologies compared to
the nuclear alternative.
o At EU28 level on average savings in support expenditures are in range of 37.1%.
o A slightly lower figure can be observed for France where savings are in magnitude of
about 25%.
o Last on the list of assessed countries is the UK. However also in that country following
a RE pathway instead of a nuclear appears beneficial – i.e. cost savings of 8.4% are
identified for the UK.

Renewable Energies versus Nuclear Power – Comparing Financial Support
82
6 Main conclusions
The level of financial support paid to a nuclear or a RE power plant is a core characteristic of the related
policy intervention. Support instruments need to be effective in order to increase the penetration of
energy sources (in this case RE and/or nuclear) and efficient with respect to minimising the resulting
public cost, i.e. the transfer cost for consumers (society) over time.
This study assesses the effectiveness and efficiency of support schemes in selected European countries
for nuclear and specific renewables (wind, hydro, PV and biomass) using two distinct approaches; a
static and a dynamic comparative assessment.
The static comparative assessment of the envisaged state aid scheme for the UK’s planned nuclear
power plant at Hinkley Point C contrasted with today’s support incentives for renewables leads to the
following conclusions:
• Onshore wind and small hydropower plants (with the exception of the Czech Republic) represent
the “least cost” option from today’s perspective in all the countries analyzed. Consequently, if the
planned annual support expenditures for Hinkley Point C were channeled into these RE options,
then more carbon-free electricity could be generated.
Small-scale hydropower and onshore wind appear significantly cheaper than nuclear power for generating a set volume of electricity. Related cost savings range from 2% (the UK) to 63% (France) for onshore wind, and from 31% (Poland) to 51% (France) for small-scale hydropower.
A cross-country comparison indicates comparatively high levels of remuneration for onshore wind in the UK. While in all the other analysed countries remuneration levels and net support are significantly lower for onshore wind compared to nuclear power, in the UK this difference is much less pronounced. A core reason for this is the unequal risk perception of two distinct policy instruments that come into play for the UK: today’s support for onshore wind in the UK via a certificate trading regime can be classified as significantly riskier than secure revenues stemming from a “Contract for Difference” scheme as planned for Hinkley Point C. Therefore implementing such a “low-risk” form of support for all types of low-carbon technologies (as is planned in the UK for the near future) would also significantly decrease the level of support required for onshore wind in the UK.
• PV and offshore wind are the most costly options from today’s perspective (with the exception of
Poland).
This static assessment compares current incentives for RE with a planned aid scheme for nuclear power that may come into effective in ten years time. As some significant cost reductions in RE technologies have been achieved over the past decade, it can be expected that growing technological experience in this field will trigger additional cost decreases and, consequently, will reduce the need for support in coming years.
• If Hinkley Point C were to be built in the assessed countries and under similar support conditions as
those planned for the UK (i.e. same feed-in tariff level), then the net level of support would differ
from country to country because of varying electricity wholesale prices.
Wholesale electricity prices in the UK are currently among the highest in Europe. Prices in the Czech Republic and Poland are lower. Consequently, under the same feed-in tariff level as set in the UK, a new nuclear power plant would require significantly more net support (i.e. defined as the difference between remuneration and wholesale electricity prices for nuclear) in Poland or the Czech Republic than in the UK. In turn, this would strongly increase the burden for consumer and/or society.

Renewable Energies versus Nuclear Power – Comparing Financial Support
83
• Poland represents a special case amongst the analysed countries with respect to its RE support
scheme which offers uniform incentives to all RE technologies in the electricity sector.
If we look at the status of electricity generation in these countries as of 2012, we see that Poland’s technology-neutral support for RES-E has encouraged the deployment of more mature technologies such as biomass co-firing, onshore wind and small-scale hydropower. Biomass enjoys the largest share because of the country’s huge biomass resources and the vast potential for co-firing biomass in the coal-fired power plants which dominate Poland’s electricity supply market today. Co-firing is a viable solution over a short to mid-term perspective, but with ongoing decarbonisation, opportunities will probably become more limited. Therefore, this option is not included in the RE support schemes implemented in Germany, France or the Czech Republic.
The static assessment, as discussed above, compares today’s incentives for RE with a planned aid
scheme for nuclear power that may become effective in ten years. As some significant cost reductions
in RE technologies have been achieved over the past decade, we can expect that growing technological
experience in this field will trigger more cost reductions and, consequently, will reduce the need for
RES-E support in coming years. Therefore this study also takes a dynamic approach: building on the
Green-X scenario of dedicated RE support and its outline for the deployment of renewables in the
EU28, future RE support has been compared with the planned subsidy for Hinkley Point C for all the
assessed countries. This analysis leads us to the following conclusions:
• A constant level of remuneration, as guaranteed for nuclear power at Hinkley Point C in the UK,
may lead to a high consumer burden in the early years, but thanks to expected increases in fossil
fuel and carbon prices, net support will decrease over time.
During the early years of operation at Hinkley Point there will be a significant gap between remuneration level and market value, in this case determined by the yearly average wholesale electricity price. However, this gap will reduce with time thanks to the expected increase in wholesale electricity prices (which goes hand in hand with an increase in fossil fuel and carbon prices over time).
• Two opposing trends determine the need to support renewables: cost reductions resulting from
technological progress lead to decreasing remuneration, whilst increasing deployment of variable
RE technologies cause reductions in their market value. The need for net support depends on the
country and technology-specific circumstances.
Generally, the need to incentivise deployment of renewables falls thanks to technological learning.
Technological progress and related cost reductions go hand-in-hand with ongoing market
deployment of a technology. This has been impressively demonstrated, for example, by the uptake
of PV in Germany and other countries, and the corresponding, significant decline in capital costs.
But the massive cost decline for PV is certainly not exceptional; it affirms a general empirical
observation, i.e. technological learning theory.
In contrast, the ongoing market deployment of various renewables including solar and wind
demonstrates an opposing tendency that may ultimately cause an increase in the need for financial
support: the market value of the generated electricity that is fed into the grid. For these
technologies it is becoming apparent that in future years (with ongoing deployment) a unit of
electricity will be less valuable than that produced by a dispatchable RE technology such as biomass
where the plant may interrupt operation during periods of oversupply and wholesale power prices
are correspondingly low.
Thus the net level of required support is determined by the difference between remuneration and
market value. Whether the cost decreases resulting from technological learning outweigh the need

Renewable Energies versus Nuclear Power – Comparing Financial Support
84
for increased support as a result of the decreasing market value, or vice versa, depends on the
country and technology-specific circumstances.
• The assessment at country and at EU levels confirms that remuneration for renewables is expected
to decline over time. This decrease is strong in the early years, followed by a slowdown and
stagnation in later years. Contrarily, market values for variable renewables are expected to more
strongly decouple from average wholesale electricity prices.
The analysis, which considers selected EU Member States as well as the EU28 as a whole, indicates
a strong decline in remuneration levels for renewables in the early years as a result of expected
technological progress across all the RE technologies considered. Thanks to their dominance, this
positive trend is driven by cost trends for onshore and offshore wind and photovoltaics. With
increasing deployment in later years, the merit order effect and the related decrease in market
value of variable renewables applies. Offshore wind is then mainly responsible for the small
remaining gap, where average RE remuneration is higher than the market value, both at EU-28
level as well as in some of the assessed countries.
• If we compare cumulative electricity generation and corresponding support expenditures we can
draw an overall conclusion regarding the cost effectiveness of the two distinct pathways (i.e.
nuclear vs. RE). Results for specific net support clearly indicate that supporting a basket of RE
technologies is more cost-effective than the planned support for the nuclear power plant at Hinkley
Point C that has served as the nuclear comparator throughout this exercise. This statement is valid
for all the assessed countries as well as for the EU28.
The highest cost savings achieved through RE can be observed in Poland where following a RE
pathway instead of nuclear would lead to savings in support expenditures of 74.5%. Poland
possesses all the conditions to significantly increase the deployment of renewables over the mid
to long-term; onshore wind and biomass are specifically identified as key options in this respect.
In second place follows the Czech Republic where achievable savings through the use of RE are in
the magnitude of 51.6%. The Czech Republic has the potential to increase the deployment of
renewables; onshore wind, biomass and PV in particular are promising options here.
Germany ranks third among the assessed countries with respect to feasible cost savings achievable
by following the renewable pathway. Support expenditures can be reduced by 39.1% via targeting
support to RE technologies rather than the nuclear alternative. If we look at the available RE
technologies in Germany, there exists a broad range of RE options for doing so.
Average savings in support expenditures for the EU28 as a whole are in the range of 37.1%. A
slightly lower figure is observed for France, with savings of around 25%. The UK comes last in the
potential savings ranking, yet even in the UK it is economically beneficial to follow a RE pathway
rather than the nuclear option, with cost savings of 8.4%.

Renewable Energies versus Nuclear Power – Comparing Financial Support
85
7 Directories
7.1 Abbreviations
CCL Climate Change Levy
CfD Contract for Difference
EDF Electricité de France
EIA Environmental Impact Assessment
ESPOO Convention Convention on Environmental Impact Assessment in a Transboundary
Context, by the United Nations Economic Commission for Europe
ETS Emission Trading System
FIT Feed-in tariff
GBP British Pound £
GC Generation costs
GWe, GWth Gigawatt electric power, Gigawatt thermal power
Giga = E09
INES International Nuclear Events Scale
IPPNW International Physicians for the Prevention of Nuclear War
KoT European Keep-On-Track! project
kWh Kilowatt-hour, kilo = E3
LPG Liquified petroleum gas
LPI Low Policy Initiative
MWe, MWth Megawatt electric power, Megawatt thermal power
Mega = E06
MWh Megawatt-hour, Mega = E9
NNBG Nuclear Industry Association New Build Group, part of EDF Energy
NPP Nuclear Power Plant
NREAP National Renewable Energy Action Plan
O&M Operation & Maintenance
PS Producer surplus
PV Photovoltaic
RE, RES Renewable energies, renewable energy sources
RES-E Renewable energy sources for electricity production
RES-H&C Renewable energy sources for heating and cooling
RO Renewable Obligation
ROC Renewable Obligation Certificates
SEA Strategic Environmental Assessment
TGC Tradable Green Certificates
TWh Terawatt-hour, Tera = E12

Renewable Energies versus Nuclear Power – Comparing Financial Support
86
7.2 List of Figures
FIGURE 1: NUMBER OF NUCLEAR REACTORS WORLDWIDE FROM 1954 TO 2014 AND OPERABLE CAPACITY IN GWE
(SCHNEIDER ET AL., 2014) ..................................................................................................................... 2
FIGURE 2: NUMBER OF NUCLEAR REACTORS IN THE EUROPEAN UNION (EU28) FROM 1954 TO 2014 AND
OPERATING CAPACITY IN GWE (SCHNEIDER ET AL., 2014) ........................................................................... 3
FIGURE 3: REACTOR START-UPS AND SHUTDOWNS IN THE EUROPEAN UNION (SCHNEIDER ET AL., 2014) ............ 4
FIGURE 4: PAST DEPLOYMENT OF RE TECHNOLOGIES IN THE ELECTRICITY SECTOR (EU28), INCLUDING (LEFT) AND
EXCLUDING (RIGHT) HYDROPOWER (SOURCE: HELD ET AL. (2014), BASED ON EUROSTAT (2014)) .................... 9
FIGURE 5: BASIC DEFINITIONS OF THE COST ELEMENTS (ILLUSTRATED FOR A RE QUOTA SCHEME WITH CERTIFICATE
TRADING) .......................................................................................................................................... 13
FIGURE 6 CONCEPTUAL CLASSIFICATION OF THE MERIT-ORDER EFFECT AND THE MARKET VALUES OF RES-E
GENERATION. (SOURCE: OWN ELABORATION BASED ON SENSFUSS ET AL. (2008)) ........................................ 14
FIGURE 7: BREAKDOWN OF TOTAL ELECTRICITY GENERATION IN 2012 FOR THE UK (LEFT), WITH DETAILS FOR
ASSESSED SELECTED RE TECHNOLOGIES (RIGHT) (SOURCE: EUROSTAT, KOT-PROJECT (RESCH ET AL., 2014)) ..... 17
FIGURE 8: EXPECTED FUTURE DEPLOYMENT IN RELATIVE TERMS (I.E. SHARE IN GROSS ELECTRICITY DEMAND) OF RES-E
AND NUCLEAR POWER IN THE UK ACCORDING TO SELECTED SCENARIOS (SOURCE: EC (2013B), KOT-PROJECT
(RESCH ET AL., 2014) AND OWN ASSESSMENT (GREEN-X)) ....................................................................... 19
FIGURE 9: BREAKDOWN OF THE EXPECTED FUTURE RES-E DEPLOYMENT IN THE UK IN ABSOLUTE TERMS (I.E.
ELECTRICITY GENERATION) BY TECHNOLOGY (LEFT) AND BY AGE CLUSTER (RIGHT) ACCORDING TO THE GREEN-X
SCENARIO OF DEDICATED RE SUPPORT (SOURCE: OWN ASSESSMENT (GREEN-X)) ......................................... 19
FIGURE 10: FUTURE DEVELOPMENT OF REMUNERATION LEVELS AND CORRESPONDING MARKET VALUES OF THE
ASSESSED RE TECHNOLOGIES IN THE UK: BIOMASS AND SMALL HYDROPOWER (LEFT, UP), PV (RIGHT, UP), WIND
ONSHORE (LEFT, DOWN) AND WIND OFFSHORE (RIGHT, DOWN) ACCORDING TO THE GREEN-X SCENARIO OF
DEDICATED RE SUPPORT (SOURCE: OWN ASSESSMENT (GREEN-X)) ............................................................ 22
FIGURE 11: COMPARISON OF REMUNERATION LEVELS (AND OF WHOLESALE ELECTRICITY PRICES) FOR NUCLEAR
POWER AND FOR ASSESSED RE TECHNOLOGIES IN THE UK (SOURCE: OWN CALCULATIONS, BASED ON STEINHILBER
ET AL. (2011) AND HELD ET AL. (2014)) ................................................................................................ 23
FIGURE 12: COMPARISON OF EXPECTED ANNUAL ELECTRICITY GENERATION OF HINKLEY POINT C WITH FEASIBLE
VOLUMES FROM ASSESSED RE TECHNOLOGIES IN THE UK (SOURCE: OWN CALCULATIONS) ............................. 24
FIGURE 13: COMPARISON OF REQUIRED ANNUAL NET SUPPORT FOR NUCLEAR POWER AND FOR ASSESSED RE
TECHNOLOGIES IN THE UK (SOURCE: OWN CALCULATIONS) ....................................................................... 24
FIGURE 14: COMPARISON OF EXPECTED FUTURE ELECTRICITY GENERATION FROM ASSESSED RE TECHNOLOGIES AND
NUCLEAR POWER IN THE UK ACCORDING TO THE GREEN-X SCENARIO OF DEDICATED RE SUPPORT: DEVELOPMENT
OVER TIME (LEFT) AND CUMULATIVE VOLUMES (2023 TO 2050) (RIGHT) BY RE TECHNOLOGY (SOURCE: OWN
ASSESSMENT (GREEN-X)) ..................................................................................................................... 25
FIGURE 15: FUTURE DEVELOPMENT OF REMUNERATION LEVELS AND CORRESPONDING MARKET VALUES OF THE
ASSESSED RE TECHNOLOGIES (AS AGGREGATE) AND OF NUCLEAR POWER IN THE UK ACCORDING TO THE GREEN-X
SCENARIO OF DEDICATED RE SUPPORT (SOURCE: OWN ASSESSMENT (GREEN-X)) ......................................... 26
FIGURE 16: COMPARISON OF EXPECTED SUPPORT EXPENDITURES FOR ASSESSED RE TECHNOLOGIES AND NUCLEAR
POWER IN THE UK ACCORDING TO THE GREEN-X SCENARIO OF DEDICATED RE SUPPORT: DEVELOPMENT OVER TIME
(LEFT) AND CUMULATIVE VOLUMES (2023 TO 2050) (RIGHT) BY RE TECHNOLOGY (SOURCE: OWN ASSESSMENT
(GREEN-X)) ....................................................................................................................................... 27
FIGURE 17: COMPARISON OF OVERALL COST-EFFECTIVENESS: SPECIFIC NET SUPPORT FOR ASSESSED RE
TECHNOLOGIES AND NUCLEAR POWER IN THE UK ACCORDING TO THE GREEN-X SCENARIO OF DEDICATED RE
SUPPORT (SOURCE: OWN ASSESSMENT (GREEN-X)) ................................................................................. 27
FIGURE 18: BREAKDOWN OF TOTAL ELECTRICITY GENERATION IN 2012 FOR GERMANY (LEFT), WITH DETAILS FOR
ASSESSED SELECTED RE TECHNOLOGIES (RIGHT) (SOURCE: EUROSTAT, KOT-PROJECT (RESCH ET AL., 2014)) ..... 29
Renewable Energies versus Nuclear Power – Comparing Financial Support
87
FIGURE 19: EXPECTED FUTURE DEPLOYMENT IN RELATIVE TERMS (I.E. SHARE IN GROSS ELECTRICITY DEMAND) OF
RES-E AND NUCLEAR POWER IN GERMANY ACCORDING TO SELECTED SCENARIOS (SOURCE: EC (2013B), KOT-
PROJECT (RESCH ET AL., 2014) AND OWN ASSESSMENT (GREEN-X)) ........................................................... 31
FIGURE 20: BREAKDOWN OF THE EXPECTED FUTURE RES-E DEPLOYMENT IN GERMANY IN ABSOLUTE TERMS (I.E.
ELECTRICITY GENERATION) BY TECHNOLOGY (LEFT) AND BY AGE CLUSTER (RIGHT) ACCORDING TO THE GREEN-X
SCENARIO OF DEDICATED RE SUPPORT (SOURCE: OWN ASSESSMENT (GREEN-X)) ......................................... 31
FIGURE 21: FUTURE DEVELOPMENT OF REMUNERATION LEVELS AND CORRESPONDING MARKET VALUES OF THE
ASSESSED RE TECHNOLOGIES IN GERMANY: BIOMASS AND SMALL HYDROPOWER (LEFT, UP), PV (RIGHT, UP), WIND
ONSHORE (LEFT, DOWN) AND WIND OFFSHORE (RIGHT, DOWN) ACCORDING TO THE GREEN-X SCENARIO OF
DEDICATED RE SUPPORT (SOURCE: OWN ASSESSMENT (GREEN-X)) ............................................................ 33
FIGURE 22: COMPARISON OF REMUNERATION LEVELS (AND OF WHOLESALE ELECTRICITY PRICES) FOR NUCLEAR
POWER AND FOR ASSESSED RE TECHNOLOGIES IN GERMANY (SOURCE: OWN CALCULATIONS, BASED ON
STEINHILBER ET AL. (2011) AND HELD ET AL. (2014)) .............................................................................. 34
FIGURE 23: COMPARISON OF EXPECTED ANNUAL ELECTRICITY GENERATION OF HINKLEY POINT C WITH FEASIBLE
VOLUMES FROM ASSESSED RE TECHNOLOGIES IN GERMANY (SOURCE: OWN CALCULATIONS) .......................... 35
FIGURE 24: COMPARISON OF REQUIRED ANNUAL NET SUPPORT FOR NUCLEAR POWER AND FOR ASSESSED RE
TECHNOLOGIES IN GERMANY (SOURCE: OWN CALCULATIONS) ................................................................... 36
FIGURE 25: COMPARISON OF EXPECTED FUTURE ELECTRICITY GENERATION FROM ASSESSED RE TECHNOLOGIES AND
NUCLEAR POWER IN GERMANY ACCORDING TO THE GREEN-X SCENARIO OF DEDICATED RE SUPPORT:
DEVELOPMENT OVER TIME (LEFT) AND CUMULATIVE VOLUMES (2023 TO 2050) (RIGHT) BY RE TECHNOLOGY
(SOURCE: OWN ASSESSMENT (GREEN-X)) .............................................................................................. 37
FIGURE 26: FUTURE DEVELOPMENT OF REMUNERATION LEVELS AND CORRESPONDING MARKET VALUES OF THE
ASSESSED RE TECHNOLOGIES (AS AGGREGATE) AND OF NUCLEAR POWER IN GERMANY ACCORDING TO THE GREEN-
X SCENARIO OF DEDICATED RE SUPPORT (SOURCE: OWN ASSESSMENT (GREEN-X)) ....................................... 37
FIGURE 27: COMPARISON OF EXPECTED SUPPORT EXPENDITURES FOR ASSESSED RE TECHNOLOGIES AND NUCLEAR
POWER IN GERMANY ACCORDING TO THE GREEN-X SCENARIO OF DEDICATED RE SUPPORT: DEVELOPMENT OVER
TIME (LEFT) AND CUMULATIVE VOLUMES (2023 TO 2050) (RIGHT) BY RE TECHNOLOGY (SOURCE: OWN
ASSESSMENT (GREEN-X)) ..................................................................................................................... 38
FIGURE 28: COMPARISON OF OVERALL COST-EFFECTIVENESS: SPECIFIC NET SUPPORT FOR ASSESSED RE
TECHNOLOGIES AND NUCLEAR POWER IN GERMANY ACCORDING TO THE GREEN-X SCENARIO OF DEDICATED RE
SUPPORT (SOURCE: OWN ASSESSMENT (GREEN-X)) ................................................................................. 39
FIGURE 29: BREAKDOWN OF TOTAL ELECTRICITY GENERATION IN 2012 FOR FRANCE (LEFT), WITH DETAILS FOR
ASSESSED SELECTED RE TECHNOLOGIES (RIGHT) (SOURCE: EUROSTAT, KOT-PROJECT (RESCH ET AL., 2014)) ..... 40
FIGURE 30: EXPECTED FUTURE DEPLOYMENT IN RELATIVE TERMS (I.E. SHARE IN GROSS ELECTRICITY DEMAND) OF
RES-E AND NUCLEAR POWER IN FRANCE ACCORDING TO SELECTED SCENARIOS (SOURCE: EC (2013B), KOT-
PROJECT (RESCH ET AL., 2014) AND OWN ASSESSMENT (GREEN-X)) ........................................................... 41
FIGURE 31: BREAKDOWN OF THE EXPECTED FUTURE RES-E DEPLOYMENT IN FRANCE IN ABSOLUTE TERMS (I.E.
ELECTRICITY GENERATION) BY TECHNOLOGY (LEFT) AND BY AGE CLUSTER (RIGHT) ACCORDING TO THE GREEN-X
SCENARIO OF DEDICATED RE SUPPORT (SOURCE: OWN ASSESSMENT (GREEN-X)) ......................................... 42
FIGURE 32: FUTURE DEVELOPMENT OF REMUNERATION LEVELS AND CORRESPONDING MARKET VALUES OF THE
ASSESSED RE TECHNOLOGIES IN FRANCE: BIOMASS AND SMALL HYDROPOWER (LEFT, UP), PV (RIGHT, UP), WIND
ONSHORE (LEFT, DOWN) AND WIND OFFSHORE (RIGHT, DOWN) ACCORDING TO THE GREEN-X SCENARIO OF
DEDICATED RE SUPPORT (SOURCE: OWN ASSESSMENT (GREEN-X)) ............................................................ 44
FIGURE 33: COMPARISON OF REMUNERATION LEVELS (AND OF WHOLESALE ELECTRICITY PRICES) FOR NUCLEAR
POWER AND FOR ASSESSED RE TECHNOLOGIES IN FRANCE (SOURCE: OWN CALCULATIONS, BASED ON STEINHILBER
ET AL. (2011) AND HELD ET AL. (2014)) ................................................................................................ 45
FIGURE 34: COMPARISON OF EXPECTED ANNUAL ELECTRICITY GENERATION OF HINKLEY POINT C WITH FEASIBLE
VOLUMES FROM ASSESSED RE TECHNOLOGIES IN FRANCE (SOURCE: OWN CALCULATIONS) ............................. 46
FIGURE 35: COMPARISON OF REQUIRED ANNUAL NET SUPPORT FOR NUCLEAR POWER AND FOR ASSESSED RE
TECHNOLOGIES IN FRANCE (SOURCE: OWN CALCULATIONS) ....................................................................... 46

Renewable Energies versus Nuclear Power – Comparing Financial Support
88
FIGURE 36: COMPARISON OF EXPECTED FUTURE ELECTRICITY GENERATION FROM ASSESSED RE TECHNOLOGIES AND
NUCLEAR POWER IN FRANCE ACCORDING TO THE GREEN-X SCENARIO OF DEDICATED RE SUPPORT: DEVELOPMENT
OVER TIME (LEFT) AND CUMULATIVE VOLUMES (2023 TO 2050) (RIGHT) BY RE TECHNOLOGY (SOURCE: OWN
ASSESSMENT (GREEN-X)) ..................................................................................................................... 47
FIGURE 37: FUTURE DEVELOPMENT OF REMUNERATION LEVELS AND CORRESPONDING MARKET VALUES OF THE
ASSESSED RE TECHNOLOGIES (AS AGGREGATE) AND OF NUCLEAR POWER IN FRANCE ACCORDING TO THE GREEN-X
SCENARIO OF DEDICATED RE SUPPORT (SOURCE: OWN ASSESSMENT (GREEN-X)) ......................................... 48
FIGURE 38: COMPARISON OF EXPECTED SUPPORT EXPENDITURES FOR ASSESSED RE TECHNOLOGIES AND NUCLEAR
POWER IN FRANCE ACCORDING TO THE GREEN-X SCENARIO OF DEDICATED RE SUPPORT: DEVELOPMENT OVER TIME
(LEFT) AND CUMULATIVE VOLUMES (2023 TO 2050) (RIGHT) BY RE TECHNOLOGY (SOURCE: OWN ASSESSMENT
(GREEN-X)) ....................................................................................................................................... 49
FIGURE 39: COMPARISON OF OVERALL COST-EFFECTIVENESS: SPECIFIC NET SUPPORT FOR ASSESSED RE
TECHNOLOGIES AND NUCLEAR POWER IN FRANCE ACCORDING TO THE GREEN-X SCENARIO OF DEDICATED RE
SUPPORT (SOURCE: OWN ASSESSMENT (GREEN-X)) ................................................................................. 49
FIGURE 40: BREAKDOWN OF TOTAL ELECTRICITY GENERATION IN 2012 FOR POLAND (LEFT), WITH DETAILS FOR
ASSESSED SELECTED RE TECHNOLOGIES (RIGHT) (SOURCE: EUROSTAT, KOT-PROJECT (RESCH ET AL., 2014)) ..... 51
FIGURE 41: EXPECTED FUTURE DEPLOYMENT IN RELATIVE TERMS (I.E. SHARE IN GROSS ELECTRICITY DEMAND) OF
RES-E AND NUCLEAR POWER IN POLAND ACCORDING TO SELECTED SCENARIOS (SOURCE: EC (2013B), KOT-
PROJECT (RESCH ET AL., 2014) AND OWN ASSESSMENT (GREEN-X)) ........................................................... 53
FIGURE 42: BREAKDOWN OF THE EXPECTED FUTURE RES-E DEPLOYMENT IN POLAND IN ABSOLUTE TERMS (I.E.
ELECTRICITY GENERATION) BY TECHNOLOGY (LEFT) AND BY AGE CLUSTER (RIGHT) ACCORDING TO THE GREEN-X
SCENARIO OF DEDICATED RE SUPPORT (SOURCE: OWN ASSESSMENT (GREEN-X)) ......................................... 53
FIGURE 43: FUTURE DEVELOPMENT OF REMUNERATION LEVELS AND CORRESPONDING MARKET VALUES OF THE
ASSESSED RE TECHNOLOGIES IN POLAND: BIOMASS AND SMALL HYDROPOWER (LEFT, UP), PV (RIGHT, UP), WIND
ONSHORE (LEFT, DOWN) AND WIND OFFSHORE (RIGHT, DOWN) ACCORDING TO THE GREEN-X SCENARIO OF
DEDICATED RE SUPPORT (SOURCE: OWN ASSESSMENT (GREEN-X)) ............................................................ 55
FIGURE 44: COMPARISON OF REMUNERATION LEVELS (AND OF WHOLESALE ELECTRICITY PRICES) FOR NUCLEAR
POWER AND FOR ASSESSED RE TECHNOLOGIES IN POLAND (SOURCE: OWN CALCULATIONS, BASED ON STEINHILBER
ET AL. (2011) AND HELD ET AL. (2014)) ................................................................................................ 56
FIGURE 45: COMPARISON OF EXPECTED ANNUAL ELECTRICITY GENERATION OF HINKLEY POINT C WITH FEASIBLE
VOLUMES FROM ASSESSED RE TECHNOLOGIES IN POLAND (SOURCE: OWN CALCULATIONS) ............................ 57
FIGURE 46: COMPARISON OF REQUIRED ANNUAL NET SUPPORT FOR NUCLEAR POWER AND FOR ASSESSED RE
TECHNOLOGIES IN POLAND (SOURCE: OWN CALCULATIONS) ...................................................................... 57
FIGURE 47: COMPARISON OF EXPECTED FUTURE ELECTRICITY GENERATION FROM ASSESSED RE TECHNOLOGIES AND
NUCLEAR POWER IN POLAND ACCORDING TO THE GREEN-X SCENARIO OF DEDICATED RE SUPPORT: DEVELOPMENT
OVER TIME (LEFT) AND CUMULATIVE VOLUMES (2023 TO 2050) (RIGHT) BY RE TECHNOLOGY (SOURCE: OWN
ASSESSMENT (GREEN-X)) ..................................................................................................................... 58
FIGURE 48: FUTURE DEVELOPMENT OF REMUNERATION LEVELS AND CORRESPONDING MARKET VALUES OF THE
ASSESSED RE TECHNOLOGIES (AS AGGREGATE) AND OF NUCLEAR POWER IN POLAND ACCORDING TO THE GREEN-X
SCENARIO OF DEDICATED RE SUPPORT (SOURCE: OWN ASSESSMENT (GREEN-X)) ......................................... 59
FIGURE 49: COMPARISON OF EXPECTED SUPPORT EXPENDITURES FOR ASSESSED RE TECHNOLOGIES AND NUCLEAR
POWER IN POLAND ACCORDING TO THE GREEN-X SCENARIO OF DEDICATED RE SUPPORT: DEVELOPMENT OVER
TIME (LEFT) AND CUMULATIVE VOLUMES (2023 TO 2050) (RIGHT) BY RE TECHNOLOGY (SOURCE: OWN
ASSESSMENT (GREEN-X)) ..................................................................................................................... 60
FIGURE 50: COMPARISON OF OVERALL COST-EFFECTIVENESS: SPECIFIC NET SUPPORT FOR ASSESSED RE
TECHNOLOGIES AND NUCLEAR POWER IN POLAND ACCORDING TO THE GREEN-X SCENARIO OF DEDICATED RE
SUPPORT (SOURCE: OWN ASSESSMENT (GREEN-X)) ................................................................................. 60
FIGURE 51: BREAKDOWN OF TOTAL ELECTRICITY GENERATION IN 2012 FOR THE CZECH REPUBLIC (LEFT), WITH
DETAILS FOR ASSESSED SELECTED RE TECHNOLOGIES (RIGHT) (SOURCE: EUROSTAT, KOT-PROJECT (RESCH ET AL.,
2014)) 61

Renewable Energies versus Nuclear Power – Comparing Financial Support
89
FIGURE 52: EXPECTED FUTURE DEPLOYMENT IN RELATIVE TERMS (I.E. SHARE IN GROSS ELECTRICITY DEMAND) OF
RES-E AND NUCLEAR POWER IN THE CZECH REPUBLIC ACCORDING TO SELECTED SCENARIOS (SOURCE: EC
(2013B), KOT-PROJECT (RESCH ET AL., 2014) AND OWN ASSESSMENT (GREEN-X))...................................... 62
FIGURE 53: BREAKDOWN OF THE EXPECTED FUTURE RES-E DEPLOYMENT IN THE CZECH REPUBLIC IN ABSOLUTE
TERMS (I.E. ELECTRICITY GENERATION) BY TECHNOLOGY (LEFT) AND BY AGE CLUSTER (RIGHT) ACCORDING TO THE
GREEN-X SCENARIO OF DEDICATED RE SUPPORT (SOURCE: OWN ASSESSMENT (GREEN-X)) ............................ 63
FIGURE 54: FUTURE DEVELOPMENT OF REMUNERATION LEVELS AND CORRESPONDING MARKET VALUES OF THE
ASSESSED RE TECHNOLOGIES IN CZECH REPUBLIC: BIOMASS AND SMALL HYDROPOWER (LEFT, UP) PV (RIGHT, UP)
AND WIND ONSHORE (LEFT, DOWN) ACCORDING TO THE GREEN-X SCENARIO OF DEDICATED RE SUPPORT (SOURCE:
OWN ASSESSMENT (GREEN-X)) ............................................................................................................ 65
FIGURE 55: COMPARISON OF REMUNERATION LEVELS (AND OF WHOLESALE ELECTRICITY PRICES) FOR NUCLEAR
POWER AND FOR ASSESSED RE TECHNOLOGIES IN THE CZECH REPUBLIC (SOURCE: OWN CALCULATIONS, BASED ON
STEINHILBER ET AL. (2011) AND HELD ET AL. (2014)) .............................................................................. 66
FIGURE 56: COMPARISON OF EXPECTED ANNUAL ELECTRICITY GENERATION OF HINKLEY POINT C WITH FEASIBLE
VOLUMES FROM ASSESSED RE TECHNOLOGIES IN THE CZECH REPUBLIC (SOURCE: OWN CALCULATIONS) ........... 67
FIGURE 57: COMPARISON OF REQUIRED ANNUAL NET SUPPORT FOR NUCLEAR POWER AND IN THE CASE OF RE
TECHNOLOGIES IN CZECH REPUBLIC (SOURCE: OWN CALCULATIONS) ........................................................... 68
FIGURE 58: COMPARISON OF EXPECTED FUTURE ELECTRICITY GENERATION FROM ASSESSED RE TECHNOLOGIES AND
NUCLEAR POWER IN CZECH REPUBLIC ACCORDING TO THE GREEN-X SCENARIO OF DEDICATED RE SUPPORT:
DEVELOPMENT OVER TIME (LEFT) AND CUMULATIVE VOLUMES (2023 TO 2050) (RIGHT) BY RE TECHNOLOGY
(SOURCE: OWN ASSESSMENT (GREEN-X)) .............................................................................................. 68
FIGURE 59: FUTURE DEVELOPMENT OF REMUNERATION LEVELS AND CORRESPONDING MARKET VALUES OF THE
ASSESSED RE TECHNOLOGIES (AS AGGREGATE) AND OF NUCLEAR POWER IN CZECH REPUBLIC ACCORDING TO THE
GREEN-X SCENARIO OF DEDICATED RE SUPPORT (SOURCE: OWN ASSESSMENT (GREEN-X)) ............................ 69
FIGURE 60: COMPARISON OF EXPECTED SUPPORT EXPENDITURES FOR ASSESSED RE TECHNOLOGIES AND NUCLEAR
POWER IN THE CZECH REPUBLIC ACCORDING TO THE GREEN-X SCENARIO OF DEDICATED RE SUPPORT:
DEVELOPMENT OVER TIME (LEFT) AND CUMULATIVE VOLUMES (2023 TO 2050) (RIGHT) BY RE TECHNOLOGY
(SOURCE: OWN ASSESSMENT (GREEN-X)) .............................................................................................. 70
FIGURE 61: COMPARISON OF OVERALL COST-EFFECTIVENESS: SPECIFIC NET SUPPORT FOR ASSESSED RE
TECHNOLOGIES AND NUCLEAR POWER IN THE CZECH REPUBLIC ACCORDING TO THE GREEN-X SCENARIO OF
DEDICATED RE SUPPORT (SOURCE: OWN ASSESSMENT (GREEN-X)) ............................................................ 70
FIGURE 62: BREAKDOWN OF TOTAL ELECTRICITY GENERATION IN 2012 AT EU28 LEVEL (LEFT), WITH DETAILS FOR
ASSESSED SELECTED RE TECHNOLOGIES (RIGHT) (SOURCE: EUROSTAT, KOT-PROJECT (RESCH ET AL., 2014)) ..... 72
FIGURE 63: EXPECTED FUTURE DEPLOYMENT IN RELATIVE TERMS (I.E. SHARE IN GROSS ELECTRICITY DEMAND) OF
RES-E AND NUCLEAR POWER AT EU28 LEVEL ACCORDING TO SELECTED SCENARIOS (SOURCE: EC (2013B), KOT-
PROJECT (RESCH ET AL., 2014) AND OWN ASSESSMENT (GREEN-X)) ........................................................... 73
FIGURE 64: BREAKDOWN OF THE EXPECTED FUTURE RES-E DEPLOYMENT IN EU28 IN ABSOLUTE TERMS (I.E.
ELECTRICITY GENERATION) BY TECHNOLOGY (LEFT) AND BY AGE CLUSTER (RIGHT) ACCORDING TO THE GREEN-X
SCENARIO OF DEDICATED RE SUPPORT (SOURCE: OWN ASSESSMENT (GREEN-X)) ......................................... 74
FIGURE 65: COMPARISON OF EXPECTED FUTURE ELECTRICITY GENERATION FROM ASSESSED RE TECHNOLOGIES AND
NUCLEAR POWER IN THE EU28 ACCORDING TO THE GREEN-X SCENARIO OF DEDICATED RE SUPPORT:
DEVELOPMENT OVER TIME (LEFT) AND CUMULATIVE VOLUMES (2023 TO 2050) (RIGHT) BY RE TECHNOLOGY
(SOURCE: OWN ASSESSMENT (GREEN-X)) .............................................................................................. 75
FIGURE 66: FUTURE DEVELOPMENT OF REMUNERATION LEVELS AND CORRESPONDING MARKET VALUES OF THE
ASSESSED RE TECHNOLOGIES (AS AGGREGATE) AND OF NUCLEAR POWER AT EU28 LEVEL ACCORDING TO THE
GREEN-X SCENARIO OF DEDICATED RE SUPPORT (SOURCE: OWN ASSESSMENT (GREEN-X)) ............................ 75
FIGURE 67: COMPARISON OF EXPECTED SUPPORT EXPENDITURES FOR ASSESSED RE TECHNOLOGIES AND NUCLEAR
POWER AT EU28 LEVEL ACCORDING TO THE GREEN-X SCENARIO OF DEDICATED RE SUPPORT: DEVELOPMENT OVER
TIME (LEFT) AND CUMULATIVE VOLUMES (2023 TO 2050) (RIGHT) BY RE TECHNOLOGY (SOURCE: OWN
ASSESSMENT (GREEN-X)) ..................................................................................................................... 76

Renewable Energies versus Nuclear Power – Comparing Financial Support
90
FIGURE 68: COMPARISON OF OVERALL COST-EFFECTIVENESS: SPECIFIC NET SUPPORT FOR ASSESSED RE
TECHNOLOGIES AND NUCLEAR POWER AT EU28 LEVEL ACCORDING TO THE GREEN-X SCENARIO OF DEDICATED RE
SUPPORT (SOURCE: OWN ASSESSMENT (GREEN-X)) ................................................................................. 77
FIGURE 69: COMPARISON OF EXPECTED ANNUAL ELECTRICITY GENERATION OF HINKLEY POINT C WITH FEASIBLE
VOLUMES FROM ASSESSED RE TECHNOLOGIES BY ASSESSED COUNTRY (SOURCE: OWN CALCULATIONS) ............. 78
FIGURE 70: FUTURE DEVELOPMENT OF REMUNERATION LEVELS AND CORRESPONDING MARKET VALUES OF THE
ASSESSED RE TECHNOLOGIES (AS AGGREGATE) AND OF NUCLEAR POWER ACROSS ASSESSED COUNTRIES AND AT
EU28 LEVEL ACCORDING TO THE GREEN-X SCENARIO OF DEDICATED RE SUPPORT (SOURCE: OWN ASSESSMENT
(GREEN-X)) ....................................................................................................................................... 79
FIGURE 71: COMPARISON OF OVERALL COST-EFFECTIVENESS: SPECIFIC NET SUPPORT FOR ASSESSED RE
TECHNOLOGIES AND NUCLEAR POWER BY ASSESSED COUNTRIES AND AT EU28 LEVEL ACCORDING TO THE GREEN-X
SCENARIO OF DEDICATED RE SUPPORT (SOURCE: OWN ASSESSMENT (GREEN-X)) ......................................... 80
FIGURE 72: COMPARISON OF OVERALL COST-EFFECTIVENESS: COST SAVINGS DUE TO RE COMPARED TO NUCLEAR
POWER BY ASSESSED COUNTRY AND AT EU28 LEVEL ACCORDING TO THE GREEN-X SCENARIO OF DEDICATED RE
SUPPORT (SOURCE: OWN ASSESSMENT (GREEN-X)) ................................................................................. 80
FIGURE 73: COMPARISON OF PROJECTED ENERGY DEMAND DEVELOPMENT AT EUROPEAN (EU28) LEVEL – GROSS
ELECTRICITY DEMAND (LEFT) AND GROSS FINAL ENERGY DEMAND (RIGHT). (SOURCE: BASED ON PRIMES
REFERENCE SCENARIO (EC, 2013B), COMPLEMENTED BY BRAUNGARDT ET AL. (2014)) ................................. 97
FIGURE 74: PRIMARY ENERGY PRICE ASSUMPTIONS IN €/MWH (SOURCE: PRIMES REFERENCE SCENARIO (EC,
2013B)) 98
FIGURE 75: CO2 PRICE ASSUMPTIONS IN €2010/TON (SOURCE: PRIMES REFERENCE SCENARIO (EC, 2013B)) ...... 98
FIGURE 76: DEVELOPMENT OF MARKET VALUE FACTORS (AS FRACTION OF AVERAGE WHOLESALE ELECTRICITY PRICES)
IN EU MEMBER STATES FOR WIND ONSHORE (LEFT) AND PV (RIGHT) FROM 2015 TO 2050 ACCORDING TO A
SCENARIO OF HIGH RE DEPLOYMENT (BASED ON STRENGTHENED NATIONAL POLICIES) (SOURCE: BEYOND2020
PROJECT (CF. LINARES ET AL. (2013)). ................................................................................................... 99
Renewable Energies versus Nuclear Power – Comparing Financial Support
91
7.3 List of Tables
TABLE 1: EUROPEAN COUNTRIES WITH NUCLEAR POWER PLANTS (IAEA PRIS, 2014) ........................................ 3
TABLE 2: MAIN CHARACTERISTICS OF HINKLEY POINT C ................................................................................. 8
TABLE 3: MAIN INPUT SOURCES FOR SCENARIO PARAMETERS ....................................................................... 15
TABLE 4: DETAILS ON CURRENT RE SUPPORT IN THE UK BY ASSESSED RE TECHNOLOGY
(BASED ON RES LEGAL (N.D.) AND HELD ET AL. (2014)).......................................................................... 21
TABLE 5: DETAILS ON CURRENT RE SUPPORT IN GERMANY BY ASSESSED RE TECHNOLOGY
(BASED ON RES LEGAL (N.D.) AND HELD ET AL. (2014)).......................................................................... 32
TABLE 6: DETAILS ON CURRENT RE SUPPORT IN FRANCE BY ASSESSED RE TECHNOLOGY
(BASED ON RES LEGAL (N.D.) AND HELD ET AL. (2014)).......................................................................... 43
TABLE 7: QUOTA TARGETS FOR RES-E IN POLAND (RES LEGAL, N.D.) .......................................................... 54
TABLE 8: DETAILS ON CURRENT RE SUPPORT IN POLAND BY ASSESSED RE TECHNOLOGY
(BASED ON RES LEGAL (N.D.) AND HELD ET AL. (2014)).......................................................................... 54
TABLE 9: DETAILS ON CURRENT RE SUPPORT IN THE CZECH REPUBLIC BY ASSESSED RE TECHNOLOGY
(BASED ON RES LEGAL (N.D.) , HELD ET AL. (2014)), (ERO, 2013) .......................................................... 64
TABLE 10: MAIN INPUT SOURCES FOR SCENARIO PARAMETERS ................................................................... 96

Renewable Energies versus Nuclear Power – Comparing Financial Support
92
7.4 References
Baumann, M.; Becker, O.; Hietler, P.; Pauritsch, G.; Pladerer, C.; Schenk, C.; Schmidl, J.; Schuch, A. (2014): Fachstellungnahme zum Energiekonzept der Tschechischen Republik im Rahmen der grenzüberschreitenden strategischen Umweltprüfung. Im Auftrag des BMLFUW, Abt. V/6 Nuklearkoordination sowie der Länder Wien, NÖ und Salzburg. Umweltbundesamt REP- 0453, Wien.
BMWI (2014): Gabriel: Keine Hermesdeckungen mehr für Nuklearanlagen im Ausland. 12.6.2014, http://www.bmwi.de/DE/Presse/pressemitteilungen,did=642020.html, accessed 31 Oct 2014.
Braungardt, S., Eichhammer, W., Elsland, R., Fleiter, T., Klobasa, M., Krail, M., Pfluger, Ben, Reuter, M., Schlomann, B., Sensfuss, F., Tariq, S., Kranzl, L., Dovidio, S., Gentili, P., 2014. Study evaluating the current energy efficiency policy framework in the EU and providing orientation on policy options for realising the cost-effective energy-efficiency/saving potential until 2020 and beyond. Report for the European Commission, Directorate-General for Energy.
BMWFW (2014): Österreichische Stellungnahme zur Eröffnung des EU-beihilferechtlichen Prüfverfahrens nach Artikel 108 Absatz 2 AEUV: SA.34947 (2013/C) (ex 2013/N), "Contract for Difference" für das neue Kernkraftwerk, Hinkley Point C, UK, 4.4. 2014.
BUND (2014): http://www.bund.net/themen_und_projekte/atomkraft/atomkraft_in_deutschland/ akw_in_deutschland/, accessed 31 Oct 2014.
co2online, n.d. Energiewende: Definition & Ziele – die Übersicht [WWW Document]. co2online. URL http://www.co2online.de/klima-schuetzen/energiewende/energiewende-definition-ziele-uebersicht/ (accessed 10.27.14).
De Jager, D. et al. (2011): Financing Renewable Energy in the European Energy Market. Report for the European Commission, Directorate-General for Energy.
Duscha V. et al. (2014): EmployRES II: Employment and growth effects of sustainable energies in the European Union. Report for the European Commission, Directorate General for Energy.
EDF (2013) [WWW Document]: http://newsroom.edfenergy.com/News-Releases/Agreement-reached-on-commercial-terms-for-the-planned-Hinkley-Point-C-nuclear-power-station-82.aspx; Article from 21 October, 2013; Access: 10 June, 2014.
European Commission (2013a): State aid SA. 34947 (2013/C) (ex 2013/N) – United Kingdom Investment Contract (early Contract for Difference) for the Hinkley Point C New Nuclear Power Station; Brussels, 18.12.2013.
European Commission (2013b): EU energy, transport and GHG emissions trends to 2050: Reference Scenario 2013. DG Energy, DG Climate Action and DG Mobility and Transport, December 2013.
European Commission (2014a): State aid: Commission concludes modified UK measures for Hinkley Point nuclear power plant are compatible with EU rules. Press Release, Brussels, 8 Oct 2014.
European Commission (2014b): A policy framework for climate and energy in the period from 2020 to 2030. Communication from the EC, COM(2014) 15 final), Brussels, 22 January 2014.
European Commission (2014c): Impact Assessment to the Communication from the EC on “A policy framework for climate and energy in the period from 2020 to 2030”. Commission Staff Working Document, SWD(2014) 15, Brussels, 22 January 2014.
ERO (2013): The Energy Regulatory Office’s Price Decision No. 4/2013 of 27 November 2013 Laying down aid for promoted energy sources.
Held, A. et al. (2014): Indicators on RES support in Europe. Intelligent Energy Europe Project DIACORE (Policy Dialogue on the assessment and convergence of RES policy in EU Member States), Fraunhofer ISI, Karlsruhe, Germany.
IAEA PRIS (2014): Operational & Long-Term Shutdown Reactors. http://www.iaea.org/PRIS/WorldStatistics/OperationalReactorsByCountry.aspx, last updated 18 Sept 2014, accessed on 19 Sept 2014.
IPPNW (2010): Factsheet Uranium Mining 4: Health Effects of Uranium Mining. http://www.nuclear-risks.org/fileadmin/user_upload/pdfs/factsheet_E_4.pDF (accessed 20 November 2014).

Renewable Energies versus Nuclear Power – Comparing Financial Support
93
IPPNW (2004a): Nuclear Terrorism. Effects of a Nuclear Explosion in a Populated Area: New York City, New York.
A Briefing Paper from Internationals Physicians for the Prevention for Nuclear War.
http://www.ippnw.org/pdf/nuclear-terrorism-nyc.pdf.
IPPNW (2004b): Radiological Dispersion Weapons: Health, Social, and Environmental Effects. A Briefing Paper
from Internationals Physicians for the Prevention for Nuclear War.
http://www.ippnw.de/commonFiles/pdfs/Atomwaffen/RadiologicalWeapon.pdf.
Knopf, B., Pahle, M., Kondziella, H., Joas, F., Edenhofer, O., Bruckner, T., n.d. Germany’s nuclear phase-out: Impacts on electricity prices, CO2 emissions and on Europe.
Linares et al. (2013): Assessment report on the impacts of RES policy design options on future electricity markets. A report compiled within the Intelligent Energy Europe project beyond2020. Accessible at www.res-policy-beyond2020.eu.
MEEDDM, n.d. French feed-in tariff rates in 2013 for solar PV [WWW Document]. Minist. Ecol. Sustain. Dev. Energy Fr. Ministère Lécologie Dév. Durable Lénergie. URL http://www.developpement-durable.gouv.fr/IMG/pdf/Tarifs_PV_2013.pdf.
Ofgem (2013a): Feed-in Tariff Payment Rate Table for Non-Photovoltaic Eligible Installations for FIT Year 4 (1 April 2013 to 31 March 2014) [WWW Document]. URL https://www.ofgem.gov.uk/ofgem-publications/58940/fit-tariff-table-1-april-2013-non-pv-only.pdf.
Ofgem (2013b): Feed-in Tariff Payment Rate Table for Photovoltaic Eligible Installations for FIT (1 February 2013 – 31 December 2013) [WWW Document]. URL https://www.ofgem.gov.uk/ofgem-publications/82343/fit-tariff-table-1-october-2013-pv-only.pdf.
Ragwitz, M. et al. (2005): FORRES 2020: Analysis of the renewable energy sources‘ evo-lution up to 2020. Report for the European Commission, Directorate General for Enterprise and Industry..
Ragwitz, M. et al. (2009): EmployRES: The impact of renewable energy policy on economic growth and employment in the European Union. Report for the European Commission, Directorate General for Energy and Transport.
Ragwitz, M., Steinhilber, S., Breitschopf, B., Resch, G., Panzer, C., Ortner, A., Busch, S., Rathmann, M., Klessmann, C., Nabe, C., De Lovinfosse, I., Neuhoff, K., Boyd, R., Junginger, M., Hoefnagels, R., Cusumano, N., Lorenzoni, A., Burgers, J., Boots, M., Konstantinaviciute, I. and Weöres, B. (2012), RE-Shaping: Shaping an effective and efficient European renewable energy market. Report compiled within the European project RE-Shaping, supported by Intelligent Energy - Europe, ALTENER, Grant Agreement no. EIE/08/517/SI2.529243. Fraunhofer ISI, Karlsruhe, Germany.
Renner, S.; Baumann, M.; Hirsch, H.; UIndradiningrat, A.Y.; MNraz, G.; Pauritsch, G.; Schmnidl, JK.; Wallner, A.; Wenisch A. (2011): Fachstellungnahme zum Programm für die Polnische Kernenergie Erstellt im Auftrag des BMLFUW, Abt. V/6 Nuklearkoordination, REP-0356, Umweltbundesamt, Wien.
Resch, G., Liebmann, L., Ortner, A., Busch, S. (2014): 2020 RES scenarios for Europe - - are Member States well on track for achieving 2020 RES targets? A report compiled within the Intelligent Energy Europe project Keep-on-Track!, accessible at www.keepontrack.eu. TU Wien / Energy Economics Group, Vienna, Austria.
RES LEGAL, n.d. RES LEGAL [WWW Document]. Leg. Sources Renew. Energy. URL http://www.res-legal.eu/ (accessed 6.4.14).
RES LEGAL, n.d. RES LEGAL [WWW Document]. Leg. Sources Renew. Energy. URL http://www.res-legal.eu/ (accessed 6.4.14).
Rogner, H. (2012): The Economics of Nuclear Power. Planning & Economic Studies Section (PESS), Department of Nuclear Energy, IAEA. Powerpoint Presentation from 2012-03-15.
Schneider, M.; Froggatt, A.; with Ayukawa, Y.; Burnie, S.; Piria, R.; Thomas, S.; Hazemann, J. (2014): The World Nuclear Industry Status Report 2014. Paris/London/Washington, D.C.
Sensfuss, F.; Ragwitz, M.; Genoese, M. (2008): The Merit-order effect: A detailed analysis of the price effect of renewable electricity generation on spot market prices in Germany. Energy Policy, Volume 36, Issue 8, August 2008, p. 3076-3084.

Renewable Energies versus Nuclear Power – Comparing Financial Support
94
Sijm, J. (2002): The Performance of Feed-in Tariffs to Promote Renewable Electricity in European Countries. The Energy Centre of the Netherlands, ECN-C-02-083, ECN: Petten, The Netherlands.
Steinhilber, S., Ragwitz, M., Rathmann, M., Klessmann, C., Noothout, P. (2011): Indicators assessing the performance of renewable energy support policies in 27 Member States (Intelligent Energy Europe Project RE-Shaping (Shaping an effective and efficient European renewable energy market), Fraunhofer ISI, Karlsruhe, Germany.
Wallner, A.; Mraz, G. (2013): The True Costs of Nuclear Power. Study commissioned by the Vienna Environmental Ombudsman, Vienna.
Wallner, A.; Wenisch, A.; Mraz, G.; Baumann, M.; Renner, S. (2011): Energiebilanz der Nuklearindustrie. Analyse von Energiebilanz und CO2-Emissionen der Nuklearindustrie über den Lebenszyklus. Gefördert aus den Mitteln des Klima- und Energiefonds im Rahmen des Programms „Neue Energien 2020“ und der Wiener Umweltanwaltschaft (Thema Uranressourcen).
Winkel, T., Rathmann, M., Ragwitz, M., Steinhilber, S., Winkler, J., Resch, G., Panzer, C., Busch, S., Konstantinaviciute, I. (2012): Renewable Energy Policy Country Profiles-2011 version (Intelligent Energy Europe Project, RE-Shaping: Shaping an effective and efficient European renewable energy market).
WISE (2009): Nuclear Fuel Energy and CO2 Balance Calculator. http://www.wise-uranium.org/nfce.html, (accessed 20. November 2014).
WNA (2014a): Nuclear Power in France [WWW Document]. World Nuclear Association URL http://www.world-nuclear.org/info/Country-Profiles/Countries-A-F/France/ (accessed 30 October 2014).
WNA (2014b): Nuclear Power in Poland [WWW Document]. World Nuclear Association URL http://www.world-nuclear.org/info/Country-Profiles/Countries-O-S/Poland/ (accessed 30 October 14).
WNA (2014c): Nuclear Power in Poland [WWW Document]. World Nuclear Association URL http://www.world-nuclear.org/info/Country-Profiles/Countries-T-Z/United-Kingdom/ (accessed 31 Oct 2014).
Wolf Theiss (2014): Generating Electricity from Renewable Sources in Central, Eastern & Southeastern Europe - 2014 Edition. Vienna.

Renewable Energies versus Nuclear Power – Comparing Financial Support
95
8 Annex A – Background information on the model-based
assessment of future RE deployment in EU Member State
8.1 Green-X Model
The model Green-X has been developed by the Energy Economics Group (EEG) at the Vienna University
of Technology under the EU research project “Green-X–Deriving optimal promotion strategies for
increasing the share of RES-E in a dynamic European electricity market" (Contract No. ENG2-CT-2002-
00607). Initially focussed on the electricity sector, this modelling tool, and its database on renewable
energy (RE) potentials and costs, has been extended in collaboration with e-think to incorporate
renewable energy technologies within all energy sectors.
Green-X covers the EU28, and can be extended to other countries, such as Turkey or Norway. It allows
the investigation of the future deployment of RE as well as the accompanying cost (including capital
expenditures, additional generation cost of RE compared to conventional options, consumer
expenditures due to applied supporting policies) and benefits (for instance, avoidance of fossil fuels
and corresponding carbon emission savings). Results are calculated at both a country- and technology-
level on a yearly basis. The time-horizon allows for in-depth assessments up to 2030. The Green-X
model develops nationally specific dynamic cost-resource curves for all key RE technologies, including
for renewable electricity, biogas, biomass, biowaste, wind on- and offshore, hydropower large- and
small-scale, solar thermal electricity, photovoltaic, tidal stream and wave power, geothermal
electricity; for renewable heat, biomass, sub-divided into log wood, wood chips, pellets, grid-
connected heat, geothermal grid-connected heat, heat pumps and solar thermal heat; and, for
renewable transport fuels, first generation biofuels (biodiesel and bioethanol), second generation
biofuels (lignocellulosic bioethanol, biomass to liquid), as well as the impact of biofuel imports. Besides
the formal description of RE potentials and costs, Green-X provides a detailed representation of
dynamic aspects such as technological learning and technology diffusion.
Through its in-depth energy policy representation, the Green-X model allows an assessment of the
impact of applying (combinations of) different energy policy instruments (for instance, quota
obligations based on tradable green certificates / guarantees of origin, (premium) feed-in tariffs, tax
incentives, investment incentives, impact of emission trading on reference energy prices) at both
country or European level in a dynamic framework. Sensitivity investigations on key input parameters
such as non-economic barriers (influencing the technology diffusion), conventional energy prices,
energy demand developments or technological progress (technological learning) typically complement
a policy assessment.
Within the Green-X model, the allocation of biomass feedstock to feasible technologies and sectors is
fully internalised into the overall calculation procedure. For each feedstock category, technology
options (and their corresponding demands) are ranked based on the feasible revenue streams as
available to a possible investor under the conditioned, scenario-specific energy policy framework that
may change on a yearly basis. Recently, a module for intra-European trade of biomass feedstock has
been added to Green-X that operates on the same principle as outlined above but at a European rather
than at a purely national level. Thus, associated transport costs and GHG emissions reflect the
outcomes of a detailed logistic model. Consequently, competition on biomass supply and demand
arising within a country from the conditioned support incentives for heat and electricity as well as
between countries can be reflected. In other words, the supporting framework at MS level may have
a significant impact on the resulting biomass allocation and use as well as associated trade.

Renewable Energies versus Nuclear Power – Comparing Financial Support
96
Moreover, Green-X was recently extended to allow an endogenous modelling of sustainability
regulations for the energetic use of biomass. This comprises specifically the application of GHG
constraints that exclude technology/feedstock combinations not complying with conditioned
thresholds. The model allows flexibility in applying such limitations, that is to say, the user can select
which technology clusters and feedstock categories are affected by the regulation both at national and
EU level, and, additionally, applied parameters may change over time.
8.2 Key assumptions / Background data
In order to ensure maximum consistency with existing EU scenarios and projections the key input
parameters of the scenarios presented in this report are derived from PRIMES modelling20 and from
the Green-X database with respect to the potentials and cost of RE technologies (see for example Resch
et al. (2014) for details on that). Table 10 shows which parameters are based on PRIMES, on the Green-
X database and which have been defined for this assessment.
Table 10: Main input sources for scenario parameters
Based on PRIMES Based on Green-X database Defined for this assessment
Primary energy prices RE cost (investment, fuel, O&M) RE policy framework
Conventional supply portfolio and conversion efficiencies
RE potential Reference electricity prices
(CO2 intensity of sectors) Biomass trade specification Energy demand by sector*
Technology diffusion / Non-economic barriers
Learning rates
Market values for variable RES-E
Note: *Reference demand data is originally taken from PRIMES (reference case) but modified (see previous explanations on energy demand).
Energy demand
As key external source for assumptions related to general energy demand and price trends the EC’s
default forecast on energy demand and supply in Europe is used in this analysis, i.e. the PRIMES
reference scenario as of 2013 (EC, 2013b). Note however that demand projections have been
contrasted with recent statistics (Eurostat) and corrected where adequate in order to assure an
appropriate incorporation of impacts related to the recent financial and economic crisis. Moreover,
mid- to long-term trends have been further modified to reflect an adequate representation of energy
efficiency, assuming a proactive implementation of energy efficiency measures in order to reduce
overall demand growth.
Thus, the assessment of energy efficiency policy options and impacts is based on detailed modelling of
the final energy demand in the different demand sectors. More precisely, the Low Policy Initiative (LPI)
scenario is used in this assessment. It builds on all energy efficiency policy measures that are currently
implemented as well as their upcoming revisions, complemented by a limited selection of new policy
measures. This scenario has been developed in the frame of a study evaluating the current energy
efficiency policy framework in the EU and providing orientation on policy options for realising the cost-
effective energy-efficiency/saving potential until 2020 and beyond, conducted on behalf of DG ENER
by a consortium led by Fraunhofer ISI (Braungardt et al., 2014).
20 Note that the PRIMES scenario used is the reference scenario as of 2013 (EC, 2013b).

Renewable Energies versus Nuclear Power – Comparing Financial Support
97
Figure 73 depicts the projected energy demand development at EU 28 level according to the LPI
scenario (as used in this analysis) with regard to gross final energy demand (right) as well as gross
electricity demand (left). These graphs also allow for a comparison to default demand projections, i.e.
the PRIMES reference case.
Figure 73: Comparison of projected energy demand development at European (EU28) level – gross
electricity demand (left) and gross final energy demand (right). (Source: based on
PRIMES reference scenario (EC, 2013b), complemented by Braungardt et al. (2014))
A comparison to alternative PRIMES demand projections at EU28 level shows the following trends: The
PRIMES reference case as of 2013 (EC, 2013b) draws a modified picture of future demand patterns
compared to previous baseline and reference cases. The impacts of the global financial crisis are partly
reflected, leading to a reduction of overall gross final energy demand in the short term, and moderate
growth in later years towards 2020. Beyond 2020, according to the PRIMES reference case gross final
energy demand is expected to stagnate and later on moderately increase again, achieving similar
consumption levels by 2050 as of today.
The LPI scenario draws a modified picture, reflecting proactive use of moderate energy efficiency
policies in the long-term and short-term corrections, incorporating the impact of the
financial/economic crisis that was significant in magnitude in parts of Europe. Thus, demand data at
sector level by country that originally stemmed from PRIMES scenario was replaced by actual data for
the years 2011 and 2012. The overall reduction of demand amounts to about 11% between 2012 and
2030. In the mid- to long-term the strongest savings can be realized in the residential building sector
and in the tertiary sector. Similar to PRIMES there is an increase of energy demand in the sub sector
“electricity for transport” assumed which comes from a switch from fuel based transport to electricity
based transport. Nevertheless the total energy demand of the transport sector is expected to decrease
as well.
For the electricity sector, demand growth is generally more pronounced, in particular in the mid- to
long-term. The PRIMES reference case expects electricity consumption to increase strongly in later
years mainly because of cross-sector substitutions: electricity is expected to make a stronger
contribution to meeting the demand for heating and cooling in the future, and similar substitution
effects are assumed for the transport sector as well. Thus, similar patterns can be observed in the LPI
scenario in the long-term, after a short-term decline in the period up to 2030 (reflecting the impacts
of the financial/economic crisis and of more proactive energy efficiency policies).
0
2,000
4,000
6,000
8,000
10,000
12,000
14,000
16,0002
010
201
5
202
0
202
5
203
0
203
5
204
0
204
5
205
0
Gro
ss f
inal
en
ergy
dem
and
(w
ith
avi
atio
n r
edu
ctio
n)
[TW
h]
PRIMESreference case
LPI scenario
0
500
1,000
1,500
2,000
2,500
3,000
3,500
4,000
4,500
5,000
201
0
201
5
202
0
202
5
203
0
203
5
204
0
204
5
205
0
Gro
ss e
lect
rici
ty d
eman
d [
TWh
]

Renewable Energies versus Nuclear Power – Comparing Financial Support
98
Fossil fuel and carbon prices
The country- and sector-specific reference energy prices used in this analysis are based on the primary
energy price assumptions applied in the latest PRIMES reference scenario that has also served as basis
for the Impact Assessment accompanying the Communication from the European Commission “A
policy framework for climate and energy in the period from 2020 to 2030” (COM(2014) 15 final) (EC,
2014b). As shown in Figure 74 generally only one price trend is considered – i.e. a default case of
moderate energy prices that reflects the price trends of the PRIMES reference case. Compared to the
energy prices as observed in 2011, all the price assumptions appear comparatively low, even for the
later years up to 2050.
Figure 74: Primary energy price assumptions in €/MWh (Source: PRIMES reference scenario (EC,
2013b))
The CO2 price in the scenario presented in this report is also based on recent PRIMES modelling, see
Figure 75. Actual market prices for EU Allowances have fluctuated between 6 and 30 €/t since 2005
but remained on a low level with averages around 7 €/t in the first quarter of 2012. In the model, it is
assumed that CO2 prices are directly passed through to electricity prices as well as to prices for grid-
connected heat supply.
Figure 75: CO2 price assumptions in €2010/ton (Source: PRIMES reference scenario (EC, 2013b))
0
10
20
30
40
50
60
70
80
201
0
201
5
202
0
202
5
203
0
203
5
204
0
204
5
205
0
Foss
il e
ne
rgy
pri
ces
[€/M
Wh
]
Coal
Oil
Gas
0
10
20
30
40
50
60
70
80
90
100
201
0
201
5
202
0
202
5
203
0
203
5
204
0
204
5
205
0
Car
bo
n p
rice
s (E
TS (
& N
on
-ETS
po
st 2
02
0))
[€
/t C
O2]
PRIMES referencecase

Renewable Energies versus Nuclear Power – Comparing Financial Support
99
Market values for variable RES-E
As outlined in section 3.2 the market value of renewables represents the income that renewables can
generate from the regular electricity market. It depends on the average electricity price as well as the
relative value of renewable electricity compared to this average price (market value factor). Most
renewable energies (except for biomass) have very low variable electricity generation costs. Thus, due
to the merit order effect, electricity prices in the market are lower at times with a high infeed of
variable renewables. As the weather dependent and variable renewables (e.g. wind and solar PV
generation) can only influence generation by investing in certain sides of curtailing generation, their
market value factor is supposed to decrease with increasing share of renewables. The RES-E market
value is used to derive the net support expenditures of RES-E, which are calculated by subtracting for
each RES-E technology the market value from the overall remuneration levels.
Figure 76: Development of market value factors (as fraction of average wholesale electricity prices)
in EU Member States for wind onshore (left) and PV (right) from 2015 to 2050 according
to a scenario of high RE deployment (based on strengthened national policies) (Source:
beyond2020 project (cf. Linares et al. (2013)).
Market values used within this assessment are based on a detailed analysis conducted within the
Intelligent Energy Europe project beyond2020 (see www.res-policy-beyond2020.eu, and in particular
Linares et al. (2013)). For modelling the market value factors within that project, only day-ahead
market prices have been considered and furthermore a floor price of zero was assumed. Figure 76
shows the development of the market value factors for PV and wind onshore for various EU Member
States according to a scenario of strong RE deployment (and strengthened national RE policies that
trigger that deployment), serving as basis for the cost assessment undertaken within this study and
the corresponding RE policy modelling. As expected, increasing shares of renewables lead to
decreasing market value factors for all technologies. This effect can be dampened by more grid
extension as demonstrated within that analysis. Other factors apart from grid extensions that can
contribute to higher market value factors such as increased demand or supply side flexibility were
however largely neglected within that assessment.
0.40
0.50
0.60
0.70
0.80
0.90
1.00
1.10
1.20
20
05
20
10
20
15
20
20
20
25
20
30
20
35
20
40
20
45
20
50
ATBEBGCYCZDEDKEEESFIFRGRHUIEITLTLULAMTNLPLPTROSESISKUK
0.40
0.50
0.60
0.70
0.80
0.90
1.00
1.10
1.20
200
5
201
0
201
5
202
0
202
5
203
0
203
5
204
0
204
5
205
0
ATBEBGCYCZDEDKEEESFIFRGRHUIEITLTLULAMTNLPLPTSESISKUK

Renewable Energies versus Nuclear Power – Comparing Financial Support
100
The Austrian Institute for Ecology is a well-established research institution, active in the field of ecology and sustainability since 1985. We work for, and with, politics and administration, business and interest groups, as well as those directly affected by social change. Our experts offer a broad range of subject content and methodologies. We respond to the ambitious challenge of achieving sustainable development in its ecological, social, economic and political dimensions. One of the issues covered in our Society-Science-Technology field of competence is to research and evaluate the sustainable potential of various technologies to solve global problems. We assess the chances and risks for environment, society and health offered by technologies during their lifecycle. We have been working on the issue of nuclear power, the impact of the fuel cycle on people and the environment, from uranium mining to final disposal, the safety and risks of nuclear facilities, consequences of severe accidents and issues of radiation protection, for more than 25 years.
e-think is a private non-profit research institution based in Vienna. Its aim is to advance research in the
field of energy economics at its interface with environment and human society. Through technical,
economic and environmental assessments e-think contributes to the transition towards sustainable
energy systems.
e-think‘s main areas of competence are to analyse socio-economic aspects of energy use, to model
energy systems and develop scenarios, to assess impacts of energy policies, to develop effective and
efficient deployment strategies for RES in electricity, heat and transport, and to promote energy
efficiency in buildings, mobility, electrical and industrial applications
e-think’s activities encompass (i) research in interdisciplinary cooperation, (ii) implementation and (iii)
communication of research results. e-think is a spin-off of the Energy Economics Group of Vienna
University of Technology and, thus, practises strong cooperation in energy economics and modelling.
The Vienna Ombuds Office for Environmental Protection (Wiener Umweltanwaltschaft - WUA) was established in 1993 under the Vienna Environmental Protection Act, as an independent, authoritative body of the Federal Province of Vienna. Its primary aim consists in upholding the interests of environmental protection on behalf of the local population, thus contributing towards improving Vienna’s environment.
The Ombuds Office uses its expert know-how to respond to requests and complaints from Viennese citizens. It is also in constant cooperation with all other institutions engaged in environmental issues in Vienna, working closely with them to find solutions to Vienna’s environmental challenges. In 2002 the Ombuds Office for Environmental Protection also took over responsibility for Nuclear Protection and the Nuclear Policy Coordination of the City of Vienna.

Renewable Energies versus Nuclear Power – Comparing Financial Support
101