Renal Parenchymal Disease and Hypertension - Atlas of Diseases
15
2 Renal Parenchymal Disease and Hypertension H ypertension and parenchymal disease of the kidney are closely interrelated. Most primary renal diseases eventually disturb sodium and volume control sufficiently to produce clinical hypertension. Both on theoretical and practical grounds, many authors argue that any sustained elevation of blood pressure depends ultimately on disturbed renal sodium excretion, ie, altered pressure natriuresis. Hence, some investigators argue that a clinical state of hypertension represents de facto evidence of disturbed (or “reset”) renal function even before changes in glomerular filtration can be measured. Many renal insults further induce inappropriate activation of vasoactive systems such as the renin-angiotensin system, adrenergic sympathetic nerve traffic, and endothelin. These mechanisms may both enhance vasoconstriction and act as mediators of additional tissue injury by altering the activity of inflammatory cytokines and promoters of inter- stitial fibrosis. Arterial hypertension itself accelerates many forms of renal disease and hastens the progression to advanced renal failure. Recent studies have firmly established the importance of blood pressure reduction as a means to slow the progression of many forms of renal parenchymal injury, particularly those characterized by massive proteinuria. Over the long term, damage to the heart and cardiovascular system resulting from hypertension represents the major causes of morbidity and mor- tality for patients with end-stage renal disease. Here are illustrated the roles of renal parenchymal disease in sustaining hypertension and of arterial pressure reduction in slowing the progression of renal injury. As discussed, parenchymal renal disease may refer to either unilateral (uncommon) or bilateral conditions. Stephen C. Textor CHAPTER
Transcript of Renal Parenchymal Disease and Hypertension - Atlas of Diseases

2
Renal Parenchymal Diseaseand Hypertension
Hypertension and parenchymal disease of the kidney are closelyinterrelated. Most primary renal diseases eventually disturbsodium and volume control sufficiently to produce clinical
hypertension. Both on theoretical and practical grounds, many authorsargue that any sustained elevation of blood pressure depends ultimatelyon disturbed renal sodium excretion, ie, altered pressure natriuresis.Hence, some investigators argue that a clinical state of hypertensionrepresents de facto evidence of disturbed (or “reset”) renal functioneven before changes in glomerular filtration can be measured.
Many renal insults further induce inappropriate activation of vasoactivesystems such as the renin-angiotensin system, adrenergic sympatheticnerve traffic, and endothelin. These mechanisms may both enhancevasoconstriction and act as mediators of additional tissue injury byaltering the activity of inflammatory cytokines and promoters of inter-stitial fibrosis.
Arterial hypertension itself accelerates many forms of renal diseaseand hastens the progression to advanced renal failure. Recent studieshave firmly established the importance of blood pressure reduction asa means to slow the progression of many forms of renal parenchymalinjury, particularly those characterized by massive proteinuria. Overthe long term, damage to the heart and cardiovascular system resultingfrom hypertension represents the major causes of morbidity and mor-tality for patients with end-stage renal disease.
Here are illustrated the roles of renal parenchymal disease in sustaininghypertension and of arterial pressure reduction in slowing the progressionof renal injury. As discussed, parenchymal renal disease may refer toeither unilateral (uncommon) or bilateral conditions.
Stephen C. Textor
C H A P T E R

2.2 Hypertension and the Kidney
FORMS OF UNILATERAL RENALPARENCHYMAL DISEASE RELATEDTO HYPERTENSION
Renal artery stenosisAtherosclerosis and fibromuscular lesions (Chapter X)
Small vessel diseaseVasculitisAtheroembolic renal infarctionThrombosis and infarction
Traumatic injury Renal fracturePerirenal fibrosis (“Page” kidney) Radiation injury
Arteriovenous malformation or fistulasOther diseases
Renal carcinomaEnlarging renal cystMultiple renal cysts
Renin-secreting tumors (rare)
FIGURE 2-1
Forms of unilateral renal parenchymal diseases related to hypertension. Many unilateralabnormalities, such as congenital malformations, renal agenesis, reflux nephropathy, andstone disease, do not commonly produce hypertension. However, some unilateral lesionscan produce blood pressure elevation. Data for each of these are based primarily ondemonstrating unilateral secretion of renin and resolution with unilateral nephrectomy. Itshould be emphasized that unilateral renal disease does not reduce the overall glomerularfiltration rate beyond that expected in patients with a solitary kidney. It follows that addi-tional reductions in the glomerular filtration rate must reflect bilateral renal injury.
FIGURE 2-2
Angiogram and nephrogram of a persistent fractured kidney. The kidney damage shown hereproduced hypertension in a young woman 2 years after a motor vehicle accident. Measurementof renal vein renins confirmed unilateral production of renin from the affected side. Bloodpressure control was achieved with blockade of the renin-angiotensin system using anangiotensin II receptor antagonist (losartan). Many traumatic injuries to the kidney producetemporary hypertension when a border of viable but underperfused renal tissue remains.
20
50
60
70
80
40
0
Pre
vale
nce
of h
yper
ten
sio
n, %
APKDCIN IgAMCN DN MPGN FSGNMGN
10
30
Prevalence of Hypertension in Chronic Renal Disease
FIGURE 2-3
Prevalence of hypertension in chronic renal parenchymal disease.Most forms of renal disease are associated with hypertension. Thisassociation is most evident with glomerular diseases, including diabeticnephropathy (DN) and membranoproliferative glomerulonephritis(MPGN), in which 70% to 80% of patients are affected. Minimalchange nephropathy (MCN) is a notable exception. Tubulointerstitialdisorders such as analgesic nephropathy, medullary cystic diseases,and chronic reflux nephropathies are less commonly affected.APKD—adult-onset polycystic kidney disease; CIN—chronic intersti-tial nephritis; FSGN—focal segmental glomerulonephritis; MGN—membranous glomerulonephritis. (Data from Smith and Dunn [1].)

2.3Renal Parenchymal Disease and Hypertension
20
50
60
70
80
90
100
40
0
%
MDRD: Study A
Mea
n G
FR=
18.5
mL/
min
/1.7
3 m
2
Mea
n G
FR=
39 m
L/m
in/1
.73
m2
NH
AN
ES e
stim
ates
*n=255 patients
10
30
US Population
MDRD: Study B*
20
50
60
70
80
40
0
Pre
vale
nce
of h
yper
ten
sio
n, %
Acute GN
10
30
Acute IN
EarlyLate
FIGURE 2-4
Prevalence of hypertension requiring therapy as a function of the degree of chronic renalfailure in the Modification of Diet in Renal Disease (MDRD) trial on progressive renalfailure. The mean age of these patients was 52 years, with glomerular disease (25%) andpolycystic disease (24%) being the most common renal diagnoses in this trial. In Study B,more than 90% of patients were treated with antihypertensive agents, including diuretics,to achieve an overall average blood pressure of 133/81 mm Hg. In general, the moresevere the level of renal dysfunction, the more antihypertensive therapy is required toachieve acceptable blood pressures. Patients with glomerular filtration rates (GRFs) below10 mL/min were hypertensive in 95% of cases. NHANES—National Health and NutritionExamination Survey. (Data from Klahr and coworkers [2].)
FIGURE 2-5
Hypertension in acute renal disease. Acute renal failure is defined as transient increases inserum creatinine above 5.0 mg/dL. During the course of acute renal failure, worsening ofpreexisting levels or newly detected hypertension (>140/90 mm Hg) is common and almostuniversally observed in patients with acute glomerulonephritis (GN). Many of thesepatients have lower pressures as the course of acute renal injury subsides, although resid-ual abnormalities in renal function and sediment may remain. Blood pressure returns tonormal in some but not all of these patients. Overall, 39% of patients with acute renalfailure develop new hypertension. IN—interstitial nephritis. (Adapted from Rodriguez-Iturbe and coworkers [3]; with permission.)
FIGURE 2-6 (see Color Plate)
Micrograph of an onion skin lesion from a patient with malignanthypertension.

2.4 Hypertension and the Kidney
Pathophysiology of Hypertension in Renal Disease
Increased extracellular fluid volumeDecreased glomerular filtration rateImpaired sodium excretionIncreased renal nerve activityIneffective natriuresis, eg, atrial natriuretic peptide resistance
Increased contractionIncreased adrenergic activation
Increased vasoconstrictionIncreased adrenergic stimuliInappropriate renin-endothelin releaseIncreased endothelin-derived contracting factorIncreased thromboxane
Decreased vasodilationDecreased prostacyclinDecreased nitric oxide
Blood pressure = xCardiac output Systemic vascular resistance
FIGURE 2-7
Pathophysiologic mechanisms related tohypertension in parenchymal renal disease:schematic view of candidate mechanisms. Thebalance between cardiac output and systemicvascular resistance determines blood pressure.Numerous studies suggest that cardiac outputis normal or elevated, whereas overall extra-cellular fluid volume is expanded in mostpatients with chronic renal failure. Systemicvascular resistance is inappropriately elevatedrelative to cardiac output, reflecting a net shiftin vascular control toward vasoconstrictingmechanisms. Several mechanisms affectingvascular tone are disturbed in patients withchronic renal failure, including increasedadrenergic tone and activation of the renin-angiotensin system, endothelin, and vasoac-tive prostaglandins. An additional feature insome disorders appears to depend on reducedvasodilation, such as in impaired productionof nitric oxide.
2
5
6
7
4
0
Inta
ke a
nd
ou
tpu
t o
f wat
er a
nd
sal
t (x
no
rmal
)
500
A100 200150
Arterial pressure, mm Hg
High intake
Normal intake
Low intake
No
rmal
Esse
ntia
l hy
per
tens
ion
A B
C
D
1
3
2
5
6
7
4
0
Inta
ke a
nd
ou
tpu
t o
f wat
er a
nd
sal
t (x
no
rmal
)
500
B100 200150
Arterial pressure, mm Hg
High intake
Normal intake
Low intake
No
rmal
Gol
dbla
tt
A B
C
D
H
E
F
G
1
3
Loss of re
nal mass
Ald
oste
rone
-stim
ulat
ed k
idne
ys
FIGURE 2-8
A, The relationship between renal artery perfusion pressure andsodium excretion (which defines “pressure natriuresis”) has beenthe subject of extensive research. Essential hypertension is charac-terized by higher renal perfusion pressures required to achievedaily sodium balance. B, Distortion of this relationship routinelyoccurs in patients with parenchymal renal disease, illustrated here
as “loss of renal mass.” Similar effects are observed in conditionswith disturbed hormonal effects on sodium excretion (aldos-terone-stimulated kidneys) or reduced renal blood flow as a result of an arterial stenosis (“Goldblatt” kidneys). In all of theseinstances, higher arterial pressures are required to maintain sodium balance.

2.5Renal Parenchymal Disease and Hypertension
122
130
Perc
enta
ge o
f bo
dy
wei
ght,
kg
Tota
l blo
od
vo
lum
e, m
L/cm
F S S M T W TH F S S M
A
Days
118
126
30
40
35
10.0
Plas
ma
ren
in
acti
vity
, mg/
mL/
hB
loo
d p
ress
ure
, mm
Hg
5.0
180
140
100
Uremiccontrolsubjects
Captopril, 25 mg
Hemodialysis
–800
200
0
–1600
Sod
ium
, mEq
F S
Net sodium loss
Total net loss ofsodium=1741 mEq
Sodium losses duringhemodialysis or ultrafiltration
Cumulative urinary sodium loss
Cumulative dailysodium intake
S M T W TH F S S M TB Days
–1200
–400
FIGURE 2-9
Sodium expansion in chronic renal failure. The degree of sodiumexpansion in patients with chronic renal failure can be difficult toascertain. A, Shown are data regarding body weight, plasma renin
activity, and blood pressure (before and after administration of anACE inhibitor) over 11 days of vigorous fluid ultrafiltration.Sequential steps were undertaken to achieve net negative sodiumand volume losses by means of restricting sodium intake (10 mEq/d)and initiating ultrafiltration to achieve several liters of negativebalance with each treatment. A negative balance of nearly 1700 mEqwas required before evidence of achieving dry weight was observed,specifically a reduction of blood pressure. Measured levels of plasmarenin activity gradually increased during sodium removal, and bloodpressure became dependent on the renin-angiotensin system, asdefined by a reduction in blood pressure after administration of theangiotensin-converting enzyme inhibitor captopril. Achieving adequatereduction of both extracellular fluid volume and sodium is essentialto satisfactory control of blood pressure in patients with renal failure.B, Daily and cumulative sodium balance.
100
0
Blo
od
p
ress
ure
, mm
Hg
Cu
mu
lati
ve s
od
ium
b
alan
ce, m
EqPl
asm
a re
nin
acti
vity
, ng/
mL/
hr
0 1 11 35 38Hours
41 65 67
50
200
0
100
200
100
150
L40Saline infusion
Angiotensin II inhibitor, µg/kg/min5 10 50 100 10 10
FIGURE 2-10
Interaction between sodium balance and angiotensin-dependence in malignant hypertension.Studies in a patient with renal dysfunction and accelerated hypertension during blockadeof the renin-angiotensin system using Sar-1-ala-8-angiotensin II demonstrate the interactionbetween angiotensin and sodium. Reduction of blood pressure induced by the angiotensinII antagonist was reversed during saline infusion with a positive sodium balance and reductionin circulating plasma renin activity. Administration of a loop diuretic (L40 [furosemide],40 mg intravenously) induced net sodium losses, restimulated plasma renin activity, andrestored sensitivity to the angiotensin II antagonist. Such observations further establish thereciprocal relationship between the sodium status and activation of the renin-angiotensinsystem [5]. (From Brunner and coworkers [5]; with permission.)
2.6 Hypertension and the Kidney
A
Normalperson
Hemodialysis,bilateral
nephrectomy
Hemodialysis, nonephrectomy
Neurogram
Electrocardiogram
15 s
3 s
130
160
170
180
190
200
150
110
Syst
olic
blo
od
pre
ssu
re, m
m H
g
50
B1510 25 30 3520
NSNS <0.001<0.01 <0.01 <0.05 <0.05 <0.05 NS<0.001
Deoxycorticosterone acetate–salt administration, d
ShamRenal denervated
120
140
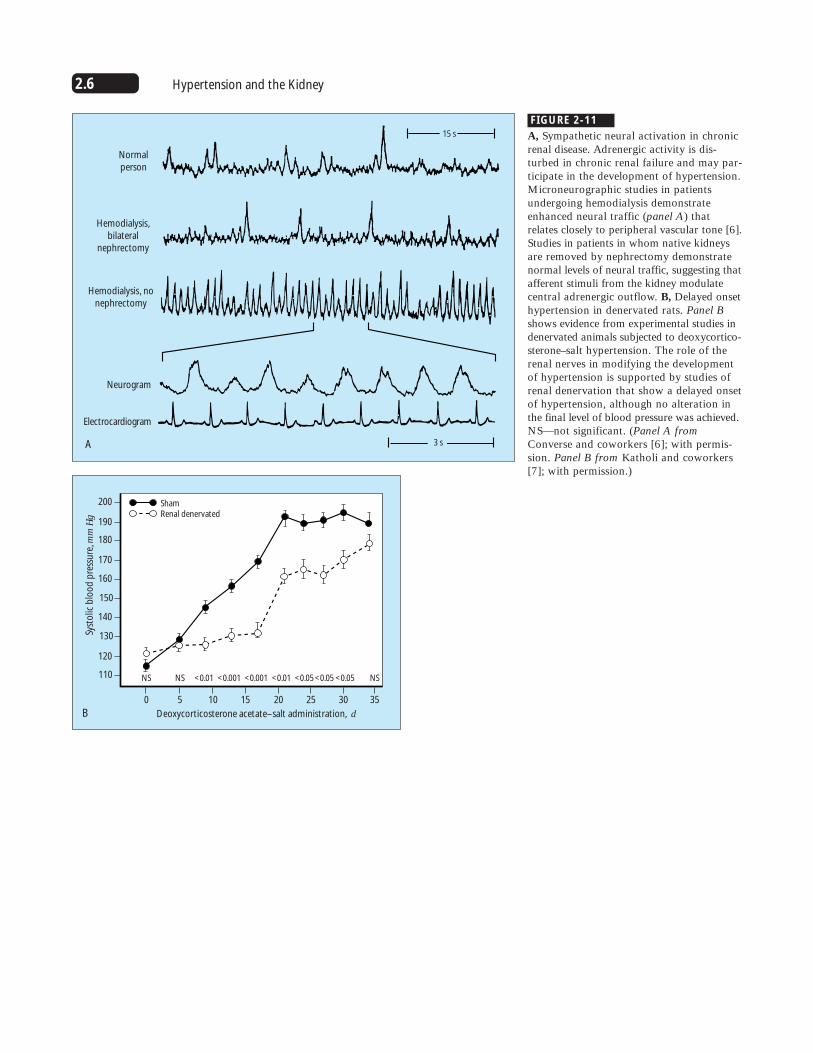
FIGURE 2-11
A, Sympathetic neural activation in chronicrenal disease. Adrenergic activity is dis-turbed in chronic renal failure and may par-ticipate in the development of hypertension.Microneurographic studies in patientsundergoing hemodialysis demonstrateenhanced neural traffic (panel A) thatrelates closely to peripheral vascular tone [6].Studies in patients in whom native kidneysare removed by nephrectomy demonstratenormal levels of neural traffic, suggesting thatafferent stimuli from the kidney modulatecentral adrenergic outflow. B, Delayed onsethypertension in denervated rats. Panel Bshows evidence from experimental studies indenervated animals subjected to deoxycortico-sterone–salt hypertension. The role of therenal nerves in modifying the developmentof hypertension is supported by studies ofrenal denervation that show a delayed onsetof hypertension, although no alteration inthe final level of blood pressure was achieved.NS—not significant. (Panel A fromConverse and coworkers [6]; with permis-sion. Panel B from Katholi and coworkers[7]; with permission.)

2.7Renal Parenchymal Disease and Hypertension
FIGURE 2-12
Major candidate mechanisms that may elevate peripheral vascularresistance in renal parenchymal disease. Some data support each ofthese pathways, although rarely does one mechanism predominate.Experimental studies suggest that endothelin-1 may magnify interstitialfibrosis and contribute to hypertension in some models; however,rarely is the effect major [8,9]. Most levels of vasodilators, includingnitric oxide, prostacyclin, and atrial natriuretic peptide, are normalor elevated in patients with renal disease. The vasodilators appearto buffer the vasoconstrictive actions of angiotensin II, which maybe increased abruptly if the vasodilator is removed, as occurs withinhibition of cyclo-oxygenase with the use of nonsteroidal anti-inflammatory drugs.
MAJOR CANDIDATE MECHANISMS THAT MAY ELEVATE PERIPHERAL VASCULAR RESISTANCE IN RENAL PARENCHYMAL DISEASE
Increased vasoconstrictors
Renin-angiotensin system
Endothelin
Prostanoids: thromboxane
Arginine vasopressin
Endogenous digitalis-like substance: ouabain (?)
Impaired or relatively inadequate vasodilators
Nitric oxide: inadequate compensation
Vasodilator prostaglandins: prostacyclin 2
Natriuretic peptides: atrial natriuretic peptide
Kallikrein-kinin system
40
80
0
Uri
nar
y en
do
thel
in, n
g/d
12 moPretransplantation 24 moA
Mean ±SEM*P<0.01 vs pretransplantation†P<0.01 vs normal subjects
Normal
†
*† *†
20
60
80
200
160
0
Uri
nar
y en
do
thel
in e
xcre
tio
n, p
g/d
Day 45Basal Day 45BasalB
Horizontal bars=mean valuesP<0.01 vs basal
Sham-operated rats Rats with renal mass reduction
40
120
*
FIGURE 2-13
Urinary endothelin in renal disease. A, Urinary endothelin levels inpatients with cyclosporine-induced renal dysfunction and hypertensionbefore and after liver transplantation. These patients had near-normalkidney function before liver transplantation, after which their glomeru-lar filtration rates decreased from 85 to 55 mL/min, on average. Thesedata underscore the observation that the kidney itself is a rich sourceof vasoactive materials and that renal excretion of substances such asendothelin is independent of circulating blood levels [10]. Endothelin hasproperties that both facilitate vasoconstriction and enhance mitogenicand fibrogenic responses, perhaps accelerating interstitial fibrosis inthe kidney. Early withdrawal of cyclosporine leads to reversal of a
diminished glomerular filtration rate. With time, however, thesechanges lose the feature of reversibility [11]. B, Renal ablation.Urinary endothelin levels in rats exposed to reduced renal massachieved by 5/6 nephrectomy. As in humans, plasma levels ofendothelin were dissociated from urinary levels, and injectedendothelin was not excreted. These results suggest that urinary levelswere of renal origin. These studies further support the concept that thediminished nephron number elicits production of potent vasoactiveand inflammatory materials that may accelerate irreversible parenchy-mal injury. (Panel A from Textor and coworkers [10]; with permis-sion. Data in panel B from Benigni and coworkers [12].)
2.8 Hypertension and the Kidney
Systemic hypertension
Increased glomerular pressure
Increased glomerular pressure
Increased glomerular volume
Impaired autoregulation
Cellular proliferation
Renal parenchymal disease
Increased angiotensinIncreased norepinephrineIncreased endothelin
Increased cytokineIncreased growth factors
Decreased afferent resistanceDecreased efferent resistance
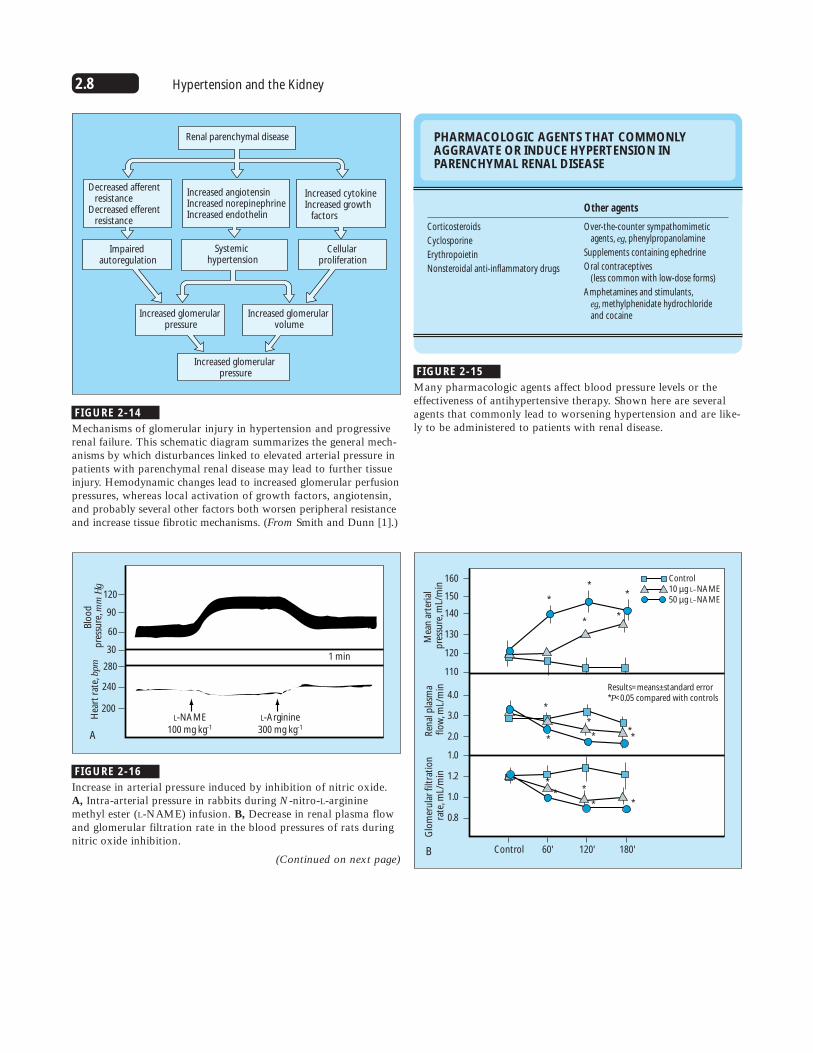
FIGURE 2-14
Mechanisms of glomerular injury in hypertension and progressiverenal failure. This schematic diagram summarizes the general mech-anisms by which disturbances linked to elevated arterial pressure inpatients with parenchymal renal disease may lead to further tissueinjury. Hemodynamic changes lead to increased glomerular perfusionpressures, whereas local activation of growth factors, angiotensin,and probably several other factors both worsen peripheral resistanceand increase tissue fibrotic mechanisms. (From Smith and Dunn [1].)
PHARMACOLOGIC AGENTS THAT COMMONLYAGGRAVATE OR INDUCE HYPERTENSION INPARENCHYMAL RENAL DISEASE
Other agents
Over-the-counter sympathomimeticagents, eg, phenylpropanolamine
Supplements containing ephedrine
Oral contraceptives (less common with low-dose forms)
Amphetamines and stimulants, eg, methylphenidate hydrochloride and cocaine
Corticosteroids
Cyclosporine
Erythropoietin
Nonsteroidal anti-inflammatory drugs
FIGURE 2-15
Many pharmacologic agents affect blood pressure levels or theeffectiveness of antihypertensive therapy. Shown here are severalagents that commonly lead to worsening hypertension and are like-ly to be administered to patients with renal disease.
280
90
120
60
200L-NAME
100 mg kg-1
L-Arginine300 mg kg-1
1 min
A
Hea
rt r
ate,
bpm
Blo
od
p
ress
ure
, mm
Hg
240
30
0.8
1.0
1.2
1.0
2.0
3.0
4.0
120
130
140
150
160
110
B
Glo
mer
ula
r fi
ltra
tio
n
rate
, mL/
min
Ren
al p
lasm
a fl
ow
, mL/
min
Mea
n a
rter
ial
pre
ssu
re, m
L/m
in
Control
Control10 µg L–NAME50 µg L–NAME
60' 120' 180'
*
**
**
*
*
*
* **
*
*
*
**
Results=means±standard error*P<0.05 compared with controls
FIGURE 2-16
Increase in arterial pressure induced by inhibition of nitric oxide.A, Intra-arterial pressure in rabbits during N-nitro-L-argininemethyl ester (L-NAME) infusion. B, Decrease in renal plasma flowand glomerular filtration rate in the blood pressures of rats duringnitric oxide inhibition.
(Continued on next page)

2.9Renal Parenchymal Disease and Hypertension
60
80
100
120
140
9
13
15
17
19
21
11
C
Uri
nar
y fl
ow
rate
, mL/
min
Uri
nar
y so
diu
m
excr
etio
n, µ
Eq/m
in
Control
Control10 µg/kg/min L–NAME50 µg/kg/min L–NAME
Results=means±standard error*P<0.05 compared with controls
60' 120' 180'
*
*
*
*
*
FIGURE 2-16 (Continued)
C, Urine flow rate and urinary sodium excretion over time. Inhibitionof nitric oxide synthesis from L-arginine by a competitive substratesuch as L-NAME produces dose-dependent and widespread vaso-constriction, leading to an increase in blood pressure [13]. Withinspecific regional beds such as the kidney, inhibition of nitric oxideproduces a decrease in renal plasma flow, diminished glomerularfiltration, and sodium retention [14]. The magnitude of these changesin normal animals and humans suggests that tonic nitric oxide produc-tion is a major endothelial buffering mechanism preserving vasculartone. The degree to which renal parenchymal disease alters the pro-duction of nitric oxide is not known precisely. In some situations,such as nephrotoxicity associated with cyclosporine administration,endothelial production of nitric oxide appears to be substantiallyimpaired [15]. (Panel A from Rees and coworkers [13]; with per-mission. Panel B from Lahera and coworkers [14]; with permission.)
Clinical Features of Hypertension in Renal Disease
A. HYPERTENSION IN PARENCHYMAL RENAL DISEASE: CLINICAL MANIFESTATIONS OF HYPERTENSIVE DISEASE
Central nervous system
Stroke
Intracerebral hemorrhage
Cardiovascular disease
Myocardial infarction
Congestive heart failure
Atherosclerotic vascular disease
Claudication and limb ischemia
Aneurysm
Progressive renal injury
End-stage renal disease
Increased proteinuria
FIGURE 2-17
A and B, Major target organ manifestations of hypertension producing cardiovascularmorbidity and mortality in patients with renal disease. More than half of deaths are relatedto cardiovascular disease in both patients on dialysis and transplantation recipients. Theseobservations underscore the major risk for cardiovascular morbidity and mortality associatedwith hypertension in the population with chronic renal failure. (From Whitworth [16];with permission.)
20
50
60
70
80
90
100
40
0
B
Perc
enta
ge o
f to
tal
Dialysis
CardiacVascularInfectionOther
10
30
Transplantation

2.10 Hypertension and the Kidney
FIGURE 2-18
Based on average blood pressure values, a strong direct relationshipwas found between arterial pressure and left ventricular hypertrophy,left ventricular chamber dilation (by echocardiography), and systolicdysfunction in patients undergoing dialysis for end-stage renal disease.After prolonged follow-up, blood pressures fell with the onset ofcongestive heart failure and manifest coronary artery disease. Withthe onset of cardiac failure, there appeared to be an inverse rela-tionship between arterial pressure and mortality. From the outset,the strongest predictor of congestive heart failure was elevatedblood pressure. (Adapted from Foley and coworkers [17].)
10
25
30
35
40
20
0
B
Perc
enta
ge o
f to
tal
Left ventricularhypertrophy
5
15
Systolicdysfunction
Left ventricularchamber dilation
0.0 10a 12n 2p 4p 6p 8p
Awake: 156/101 mm Hg
Blood pressure valuesHeart rate
Nocturnal: 167/100 mm Hg
10p 12m 2a 4a 6a 8a
Real time data
Blo
od
pre
ssu
re, m
m H
g
50
0
90100
150140
200
250
MMMMMMMM
MMMMRxFd Fd ZZZZZ ZZZZZZZZZZZZZZZZZZ ZZZRx Rx
FIGURE 2-19
Around-the-clock ambulatory blood pressuremonitoring in a patient with renal disease.Loss of diurnal blood pressure patternshave been implicated in increased rates oftarget organ injury in patients with hyper-tension. In normal persons with essentialhypertension, nocturnal pressures decreasedby at least 10% and were associated with adecrease in heart rate. Several conditions havebeen associated with a loss of the nocturnaldecrease in pressure, particularly chronicsteroid administration and chronic renalfailure. Such a loss in normal circadianrhythm, in particular loss of the nocturnaldecrease in blood pressure is more commonlyassociated with left ventricular hypertrophyand lacunar strokes (manifested as enhancedT-2 signals in magnetic resonance images)and increased rates of microalbuminuria.Data from a single subject with end-stagerenal disease studied with are depicted here.
A
Blood pressureLeft ventricular
hypertrophy
Blood pressureDeath: Congestive heart failure
Overall mortality
Congestiveheart failure

2.11Renal Parenchymal Disease and Hypertension
FIGURE 2-20 (see Color Plate)
Hypertension accelerates the rate of progressive renal failure inpatients with parenchymal renal disease. A, Photomicrograph ofmalignant phase hypertension. Regardless of the cause of renal disease,untreated hypertension leads to more rapid loss of remaining nephronsand decline in glomerular filtration rates. A striking example ofpressure-related injury may be observed in patients with malignantphase hypertension. This image is an open biopsy specimen obtainedfrom a patient with papilledema, an expanding aortic aneurysm, and
A
blood pressure level at approximately 240/130 mm Hg. The biopsyspecimen shows the following features of malignant nephrosclerosis:these patients develop vascular and glomerular injury, which canprogress to irreversible renal failure. Before the introduction of antihy-pertensive drug therapy, patients with malignant phase hypertensionroutinely proceeded to uremia. Effective antihypertensive therapy canslow or reverse this trend in some but not all patients. B, Progressiverenal failure in malignant hypertension over 8 years.
0.04
0.10
0.12
0.08
0.00
Pro
po
rtio
n w
ith
ESR
D
10 32 54 76 98 1110 1312 1514 1716
A Years from beginning therapy to ESRD
SBP>180n=11,912 menP<0.001
165<SBP≤180
SBP≤1650.02
0.06
40
100
80
0
Inci
den
ce p
er 1
00,0
00 p
erso
n-y
ears
, %
<117 117–123 124–130 131–140 >140B Systolic blood pressure, mm Hg
5.43
15.83
5.41
27.34
9.1
26.18
14.22
37.2132.37
83.1
White=300,645Black=20,222
N=332,544 men
20
60
FIGURE 2-21
Blood pressure levels and rates of end-stage renal disease (ESRD). A,Line graph showing Kaplan-Meier estimates of ESRD rates; 15-yearfollow-up. B, Age-adjusted 16-year incidence of all-cause ESRD inmen in the Multiple Risk Factor Intervention Trial (MRFIT). Large-scale epidemiologic studies indicate a progressive increase in the riskfor developing ESRD as a function of systolic blood pressure levels.Follow-up of nearly 12,000 male veterans in the United Statesestablished that systolic blood pressure above 165 mm Hg at the initialvisit was predictive of progressively higher risk of ESRD over a 15-year
follow-up period [18]. Similarly, follow-up studies after 16 years ofmore than 300,000 men in MRFIT demonstrated a progressive increasein the risk for ESRD, most pronounced in blacks [19]. These datasuggest that blood pressure levels predict future renal disease. However,it remains uncertain whether benign essential hypertension itselfinduces a primary renal lesion (hypertensive renal disease nephroscle-rosis) or acts as a catalyst in patients with other primary renal disease,otherwise not detected at initial screening. SBP—systolic bloodpressure. (Panel A from Perry and coworkers [18]; with permission.)
0.0
0.1
0.2
0.3
0.4
0.5
0.6
0.7
0.8
0.9
1.0
1/C
reat
inin
e
May1979
Feb1982
Nov1984
Aug1987
May1990
Jan1993
Oct1995
Jul1998
B Date

2.12 Hypertension and the Kidney
3
20
30
40
50
1
Cr-
1/s, m
L/m
mol
-1C
cr, m
L/m
in
–400 –200 0 +200 +400
Chronic glomerulonephritis:
Rates of progression over time decreaseafter reduction of BP from 149/102 mm Hgto treated level, 136/90 mm Hg.
Days
2
4 –12
–6
–18
Dec
reas
e in
glo
mer
ula
r fi
ltra
tio
n r
ate,
mL/
min
/y
86 92
Study A: mean GFR: 39 mL/min/1.73 m2
N=585: range: 25–55 mL/min
Protein excretion, g/d0–0.250.25–1
1.0–3.0≥3.0
98 107Mean follow-up MAP, mm Hg
–15
–9
0
–3
–12
–6
–18
–15
–9
0
–3
FIGURE 2-22
Rates of progression in glomeruloneophritis. The decrease in glomeru-lar filtration rate is illustrated. The rates of decline decreased con-siderably with administration of antihypertensive drug therapy.Among other mechanisms, the decrease in arterial pressure lowerstranscapillary filtration pressures at the level of the glomerulus [20].This effect is correlated with a reduction in proteinuria and slowerdevelopment of both glomerulosclerosis and interstitial fibrosis. Adistinctive feature of many glomerular diseases is the massive pro-teinuria and nephron loss associated with high single-nephronglomerular filtration, partially attributable to afferent arteriolarvasodilation. The appearance of worsening proteinuria (>3 g/d) isrelated to progressive renal injury and development of renal failure.Reduction of arterial pressure can decrease urinary protein excre-tion and slow the progression of renal injury. Ccr—creatinine clear-ance rate; Cr
-1/s—reciprocal creatinine, expressed as 1/creatinine.(From Bergstrom and coworkers [20]; with permission.)
FIGURE 2-23
Blood pressure, proteinuria, and the rate of renal disease progression:results from the Modification of Diet in Renal Disease (MDRD)trial. Shown are rates of decrease of glomerular filtration rate(GFR) for patients enrolled in the MDRD trial, depending on levelof achieved treated blood pressure during the trial [21]. A componentof this trial included strict versus conventional blood pressure control.The term strict was defined as target mean arterial pressure (MAP)of under 92 mm Hg. The term conventional was defined as MAPof under 107 mm Hg. The rate of decline in GFR increased at higherlevels of achieved MAP in patients with significant proteinuria(>3.0 g/d). No such relationship was evident over the duration ofthis trial (mean, 2.2 years) for patients with less severe proteinuria.These data emphasize the importance of blood pressure in deter-mining disease progression in patients with proteinuric nondiabeticrenal disease. No distinction was made in this study regarding therelative benefits of specific antihypertensive agents. (From Petersonand coworkers [21]; with permission.)
FIGURE 2-24
Blood pressure and rate of progressive renal failure. Rates of diseaseprogression (defined as the slope of 1/creatinine) were determined in86 patients who reached end-stage renal disease and dialytic therapy.The rates of progression were defined between mean creatinine levelsof 3.8 mg/dL (start) and 11.4 mg/dL (end) over a mean duration of33 months [22]. Brazy and coworkers [22] demonstrated that theslope of disease progression appeared to be related to the range ofachieved diastolic blood pressure during this interval. Hence, theseauthors argue that more intensive antihypertensive therapy maydelay the need for replacement therapy in patients with end-stagerenal disease. As noted in the Modification of Diet in Renal Diseasetrial, such benefits are most apparent in patients with proteinuriaover a shorter follow-up period. (From Brazy and coworkers [22];with permission.)
Effects of Antihypertensive Therapy on Renal Disease Progression
–0.010
–0.006
0Slo
pe
of 1
/cre
atin
ine
vs t
ime,
dL/
mg
mo
Range of diastolic blood pressure (mm Hg) foreach quartile of the population
85–9070–85 90–96
–0.012
–0.008
96–113
2.13Renal Parenchymal Disease and Hypertension
CLASSES OF ANTIHYPERTENSIVE AGENTS USED IN TREATMENT OF CHRONIC RENAL DISEASE
Diuretics:
Thiazide class
Loop diuretics
Potassium-sparing agents
Adrenergic inhibitors
Peripheral agents, eg, guanethidine
Central �-agonists, eg, clonidine, methyldopa, and guanfacine
�-Blocking agents, eg, doxazosin
�-Blocking agents
Combined �-� blocking agents, eg, labetalol
Vasodilators
Hydralazine
Minoxidil
Classes of calcium-channel blocking agents
Verapamil
Diltiazem
Dihydropyridine
Angiotensin-converting enzyme inhibitors
Angiotensin receptor blockers
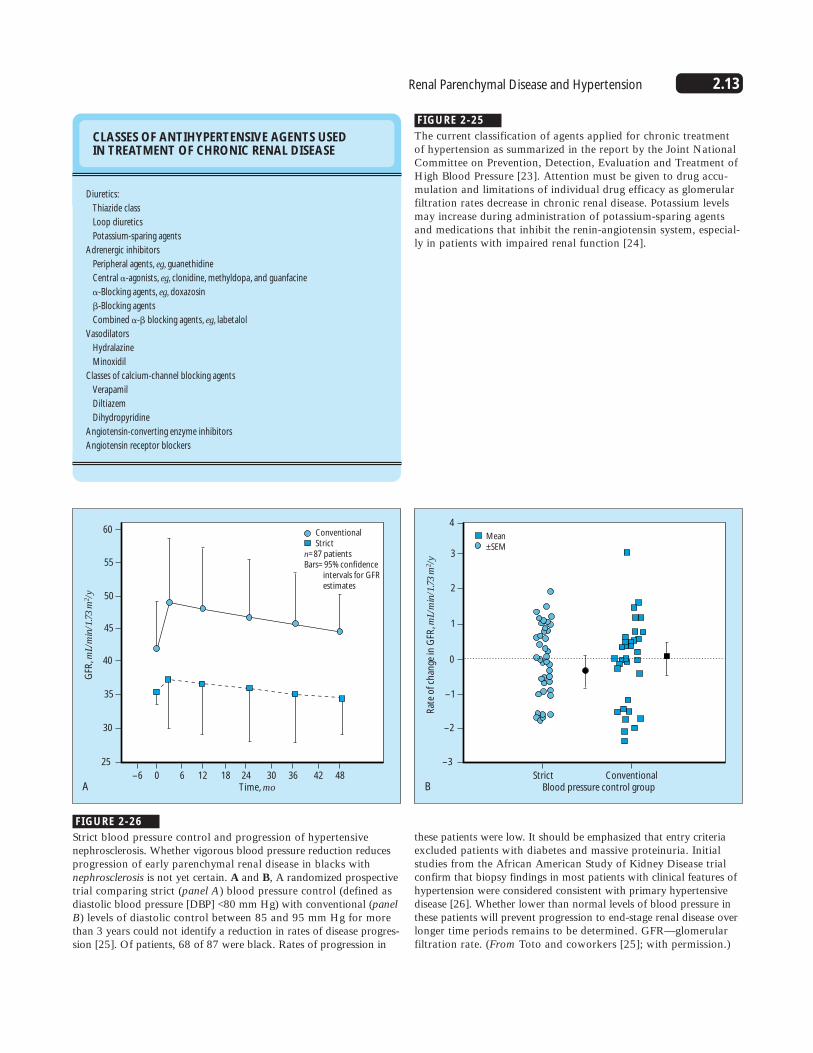
FIGURE 2-25
The current classification of agents applied for chronic treatmentof hypertension as summarized in the report by the Joint NationalCommittee on Prevention, Detection, Evaluation and Treatment ofHigh Blood Pressure [23]. Attention must be given to drug accu-mulation and limitations of individual drug efficacy as glomerularfiltration rates decrease in chronic renal disease. Potassium levelsmay increase during administration of potassium-sparing agentsand medications that inhibit the renin-angiotensin system, especial-ly in patients with impaired renal function [24].
35
60
45
50
55
25
GFR
, mL/
min
/1.7
3 m
2 /y
–6 0 6 12 18 24 30 36 42 48A Time, mo
Conventional Strictn=87 patientsBars=95% confidence intervals for GFR estimates
30
40
–1
4
1
2
3
–3
Rat
e o
f ch
ange
in G
FR, m
L/m
in/1
.73
m2 /y
Strict ConventionalB Blood pressure control group
Mean ±SEM
–2
0
FIGURE 2-26
Strict blood pressure control and progression of hypertensivenephrosclerosis. Whether vigorous blood pressure reduction reducesprogression of early parenchymal renal disease in blacks withnephrosclerosis is not yet certain. A and B, A randomized prospectivetrial comparing strict (panel A) blood pressure control (defined asdiastolic blood pressure [DBP] <80 mm Hg) with conventional (panelB) levels of diastolic control between 85 and 95 mm Hg for morethan 3 years could not identify a reduction in rates of disease progres-sion [25]. Of patients, 68 of 87 were black. Rates of progression in
these patients were low. It should be emphasized that entry criteriaexcluded patients with diabetes and massive proteinuria. Initialstudies from the African American Study of Kidney Disease trial confirm that biopsy findings in most patients with clinical features ofhypertension were considered consistent with primary hypertensivedisease [26]. Whether lower than normal levels of blood pressure inthese patients will prevent progression to end-stage renal disease overlonger time periods remains to be determined. GFR—glomerular filtration rate. (From Toto and coworkers [25]; with permission.)

2.14 Hypertension and the Kidney
100
0.0 0.5 1.0 1.5 2.0 2.5 3.0 3.5 4.0
49
Creatinine ≥1.5 mg/dL Placebo Captopril
48 44 40 33 23 16 7 153 53 52 51 48 36 25 17 8
Years of follow-up
Pati
ents
wh
o d
ied
or
nee
ded
d
ialy
sis
or
tran
spla
nta
tio
n, %
P=0.002
P=0.14
10
0
20
30
50
40
60
70
80
90
153
Creatinine <1.5 mg/dL Placebo Captopril
150 148 146 138 98 84 52 25154 154 152 150 147 104 78 47 29
FIGURE 2-27
Angiotensin-converting enzyme (ACE)inhibitors and chronic renal disease.Progression of type I diabetic nephropathy to renal failure was reduced in the ACEinhibitor arm of a trial comparing conven-tional antihypertensive therapy with a regimen containing the ACE inhibitor captopril. All patients in this trial had significant proteinuria (>500 mg/d). Themost striking effect of the ACE inhibitorregimen was seen in patients with higherserum creatinine levels (>1.5 mg/dL) asshown in the top two lines. It should benoted that calcium channel blocking drugswere excluded from this trial and the ACEinhibitor arm had somewhat lower arterialpressures during treatment. These data offersupport to the concept that ACE inhibitionlowers intraglomerular pressures, reducesproteinuria, and delays the progression ofdiabetic nephropathy by more mechanismsthan can be explained by pressure reductionalone. (Data from Lewis and coworkers [27].)
2.6
2.4
0 1 2 3A Years
Benazepril: n=583 patients; creatinine=1.5–4.0Placebo
239
262
2.0
2.2
2.6
2.4
0 1 2 3B Years
Benazepril: n=583 patients; creatinine=1.5–4.0Placebo
117
137
2.0
2.2
FIGURE 2-28
Angiotensin-converting enzyme (ACE) inhibition in nondiabetic renaldisease. A and B, Shown here are serum creatinine levels from the12-month (panel A) and 36-month (panel B) cohorts followed in thebenazepril trial. In this trial, 583 patients were randomized to therapywith or without benazepril [28]. Slight reductions in the rates ofincrease in creatinine and of stop points in the ACE inhibitor groupoccurred; however, these reductions were modest. Whereas these
data support a role for ACE inhibition, the results are considerablyless convincing than are those for diabetic nephropathy. These resultsargue that some groups may not experience major benefit from ACEinhibition over the short term. Preliminary reports from recent studieslimited to patients with proteinuria suggest that rates of progressionwere substantially reduced by treatment with ramipril [29]. (FromMaschio and coworkers [28]; with permission.)

2.15Renal Parenchymal Disease and Hypertension
CONCLUSIONS AND RECOMMENDATIONS OF THE SIXTH REPORT OF THE JOINT NATIONAL COMMITTEE ON PREVENTION, DETECTION,EVALUATION AND TREATMENT OF HIGH BLOOD PRESSURE, 1997
1. Hypertension may result from renal disease that reduces functioning nephrons.
2. Evidence shows a clear relationship between high blood pressure and end-stage renal disease.
3. Blood pressure should be controlled to ≤130/85 mm Hg (<125/75 mm Hg) in patients with proteinuria in excess of 1 g/24 h.
4. Angiotensin-converting enzyme inhibitors work well to lower blood pressure and slow progression of renal failure.
FIGURE 2-29
Conclusions and Recommendations of theSixth Report of the Joint NationalCommittee (JNC) on Prevention, Detection,Evaluation and Treatment of High Blood,1997 [23]. The JNC Committee has empha-sized the importance of vigorous bloodpressure control with any agents needed,rather than specific classes of medication.Angiotensin-converting enzyme inhibitors in proteinuric disease are the exception.
References
1. Smith MC, Dunn MJ: Hypertension in renal parenchymal disease. InHypertension: Pathophysiology, Diagnosis and Management. Edited byLaragh JH, Brenner BM. New York: Raven Press; 1995:2081–2102.
2. Klahr S, Levey AS, Beck GJ, et al.: The effects of dietary proteinrestriction and blood-pressure control on the progression of chronicrenal disease. N Engl J Med 1994, 330:877–884.
3 Rodriguez-Iturbe B, Baggio B, Colina-Chouriao J, et al.: Studies on therenin-aldosterone system in the acute nephritic syndrome. Kidnet Int1981, 445–453
4. Curtiss JJ, Luke RG, Dustan HP, et al.: Remission of essential hyperten-sion after renal transplantation. N Engl J Med 1983, 309:1009–1015.
5. Brunner HR, Gavras H, Laragh JH: Specific inhibition of the renin-angiotensin system: a key to understanding blood pressure regulation.Prog Cardiovasc Dis 1974; 17:87–98.
6. Converse RL, Jacobsen TN, Toto RD, et al.: Sympathetic overactivity inpatients with chronic renal failure. N Engl J Med1992, 327:1912–1918.
7. Katholi RE, Nafilan AJ, Oparil S: Importance of renal sympathetictone in the development of DOCA-salt hypertension in the rat.Hypertension 1980, 2:266–273.
8. Benigni A, Zoja C, Cornay D, et al.: A specific endothelin subtype Areceptor antagonist protects against injury in renal disease progression.Kidney Int 1993, 44:440–444.
9. Levin ER: Mechanisms of disease: endothelins. N Engl J Med 1995,333:356–363.
10. Textor SC, Burnett JC, Romero JC, et al.: Urinary endothelin and renalvasoconstriction with cyclosporine or FK506 after liver transplantation.Kidney Int 1995, 47:1426–1433.
11. Sandborn WJ, Hay JE, Porayko MK, et al.: Cyclosporine withdrawal fornephrotoxicity in liver transplant recipients does not result in sustainedimprovement in kidney function and causes cellular and ductopenicrejection. Hepatology 1994, 19:925–932.
12. Benigni A, Perico N, Gaspari F, et al.: Increased renal endothelin pro-duction in rats with renal mass reduction. Am J Physiol 1991,260:F331–F339.
13. Rees DD, Palmer RMJ, Moncada S: Role of endothelium-derived nitricoxide in the regulation of blood pressure. Proc Natl Acad Sci U S A1989, 86:3375–3378.
14. Lahera V, Salom MG, Miranda-Guardiola F, et al.: Effects of N-nitro-L-arginine methyl ester on renal function and blood pressure. Am JPhysiol 1991, 261:F1033–F1037.
15. Gaston RS, Schlessinger SD, Sanders PW, et al.: Cyclosporine inhibitsthe renal response to L-arginine in human kidney transplant recipients.J Am Soc Nephrol 1995, 5:1426–1433.
16. Whitworth JA: Renal parenchymal disease and hypertension. InClinical Hypertension. Edited by Robertson JIS. Amsterdam: Elsevier,1992:326–350.
17. Foley RN, Parfrey PS, Harnett JD, et al.: Impact of hypertension oncardiomyopathy, morbidity and mortality in end-stage renal disease.Kidney Int 1996, 49:1379–1385.
18. Perry HM, Miller JP, Fornoff JR, et al.: Early predictors of 15-yearend-stage renal disease in hypertensive patients. Hypertension 1995,25(part 1):587–594.
19. Klag MJ, Whelton PK, Randall BL, et al.: End-stage renal disease inAfrican-American and White men. JAMA 1997, 277:1293–1298.
20. Bergstrom J, Alvestrand A, Bucht H, Guttierrez A: Progression of chronicrenal failure in man is retarded with more frequent clinical follow-upsand better blood pressure control. Clin Nephrol 1986, 25:1–6.
21. Peterson JC, Adler S, Burkart JM, et al.: Blood pressure control, pro-teinuria and the progression of renal disease. Ann Intern Med 1995;123:754–762.
22. Brazy PC, Stead WW, Fitzwilliam JF: Progression of renal insufficiency:role of blood pressure. Kidney Int 1989, 35:670–674.
23. JNC Committee: Sixth Report of the Joint National Committee onPrevention, Detection, Evaluation and Treatment of High Blood Pressure.Bethesda, MD: National Institutes of Health Publication; 1997.
24. Textor SC: Renal failure related to ACE inhibitors. Semin Nephrol1997, 17:67–76.
25. Toto RD, Mitchell HC, Smith RD, et al.: “Strict” blood pressure controland progression of renal disease in hypertensive nephrosclerosis.Kidney Int 1995, 48:851–859.
26. Fogo A, Breyer JA, Smith MC, et al.: Accuracy of the diagnosis ofhypertensive nephrosclerosis in African-Americans: a report from theAfrican American Study of Kidney Disease (ASSK) trial. Kidney Int1997; 51:244–252.
27. Lewis EJ, Hunsicker LG, Bain RP, Rohde RD: The effect of angiotensin-converting-enzyme inhibition on diabetic nephropathy. N Engl J Med1993, 329:1456–1462.
28. Maschio G, Alberti D, Janin G, et al.: Effect of the angiotensin-convertingenzyme inhibitor benazepril on the progression of chronic renal insuf-ficiency. N Engl J Med 1996, 334:939–945.
29. Ruggenenti P, Perna A, Mosconi M, et al.: The angiotensin convertingenzyme inhibitor ramipril slows the rate of GFR decline and the pro-gression to end-stage renal failure in proteinuric, non-diabetic chronicrenal diseases [abstract]. J Am Soc Nephrol 1997, 8:147A.
30. Giatras I, Lau J, Levey AS: Effect of angiotensin-converting enzymeinhibitors on the progression of non-diabetic renal disease: a meta-analysis of randomized trials. Ann Intern Med 1997, 127:345.