Renaissance U.S. Equity Private Pool · Eli Lilly and Co., ... pharmaceutical stocks, ......
39
Renaissance U.S. Equity Private Pool Interim Management Report of Fund Performance for the period ended February 28, 2018 All figures are reported in Canadian dollars unless otherwise noted. This interim management report of fund performance contains financial highlights but does not contain either the complete interim or annual financial statements of the investment fund. If you have not received a copy of the interim financial reports with this interim management report of fund performance, you can get a copy of the interim financial reports or annual financial statements at your request, and at no cost, by calling us toll-free at 1-888-888-3863, by writing to us at Renaissance Investments, 1500 Robert-Bourassa Boulevard, Suite 800, Montreal, QC, H3A 3S6, by visiting the SEDAR website at sedar.com, or by visiting renaissanceinvestments.ca. Unitholders may also contact us using one of these methods to request a copy of the investment fund’s proxy voting policies and procedures, proxy voting disclosure record, or quarterly portfolio disclosure. . Management Discussion of Fund Performance . . Results of Operations INTECH Investment Management LLC (INTECH), Rothschild Asset Management Inc. (Rothschild), Sustainable Growth Advisers, LP (SGA), Morgan Stanley Investment Management Inc. (Morgan Stanley) and Pzena Investment Management, LLC (Pzena) provide investment advice and investment management services to Renaissance U.S. Equity Private Pool (the Pool). These portfolio sub-advisors use different investment styles and the percentage of the Pool allocated to each portfolio sub-advisor may change from time to time. l INTECH: Large Cap, Core, approximately 30% l Rothschild: Large Cap, Traditional Value, approximately 25% l SGA: Large Cap, Sustainable Growth, approximately 20% l Morgan Stanley: Opportunistic Growth, approximately 15% l Pzena: Large Cap, Deep Value, approximately 10% The commentary that follows provides a summary of the results of operations for the six-month period ended February 28, 2018. All dollar figures are expressed in thousands, unless otherwise indicated. The Pool's net asset value increased by 2% during the period, from $205,644 as at August 31, 2017 to $210,001 as at February 28, 2018. Positive investment performance was partially offset by rebalancing and net redemptions of $24,011 in the period, resulting in an overall increase in net asset value. Class A units of the Pool posted a return of 13.4% for the period. The Pool’s benchmark, the S&P 500 Index (the benchmark), returned 13.3% for the same period. The Pool’s return is after the deduction of fees and expenses, unlike the benchmark’s return. See Past Performance for the returns of other classes of units offered by the Pool. After a lengthy period of stability, market volatility returned early in 2018, as equity markets experienced their first decline of more than 10% since early 2016. Following the market correction, equities rebounded, gaining back most of the losses. Despite the sell-off, U.S. equity markets recorded strong gains for the period. The financials and information technology sectors were the strongest performers, with utilities, real estate and consumer staples the only sectors to record negative returns. In the Pool’s Large Cap, Core component, a moderate underweight allocation to the consumer staples sector contributed to performance. Stock selection in the industrials, health care and information technology sectors also contributed. Individual contributors to the component’s performance included Micron Technology Inc., The Boeing Co. and Applied Materials Inc., all of which posted strong returns. The component’s average underweight allocation to mega-capitalization stocks and overweight exposure to small-cap stocks detracted from performance. On average, larger-cap stocks outperformed smaller-cap stocks. A moderate overweight allocation to the real estate and utilities sectors, which were the two weakest performers during the period, detracted from relative performance. Individual detractors included underweight allocations to Amazon.com Inc., Microsoft Corp. and JPMorgan Chase & Co., which all posted strong returns. In the Pool’s Large Cap, Traditional Value component, stock selection and sector allocation contributed to performance. An underweight allocation to General Electric Co. contributed to performance as the company’s stock declined sharply after the announcement of significant downward earnings revisions and a dividend cut. Other individual contributors included Northrop Grumman Corp., which benefited from its acquisition of Orbital ATK, and Bank of America Corp., which reported better-than expected earnings. Stock selection in the consumer discretionary and health care sectors detracted from the component’s performance. A moderate overweight exposure to the industrials sector and a slight underweight allocation to the financials sector detracted from performance. Individual detractors included Celgene Corp. and Edison International. Celgene announced a failure in the development of its ulcerative colitis drug.
-
Upload
phungthien -
Category
Documents
-
view
220 -
download
1
Transcript of Renaissance U.S. Equity Private Pool · Eli Lilly and Co., ... pharmaceutical stocks, ......

Renaissance U.S. Equity Private Pool
Interim Management Report of Fund Performance
for the period ended February 28, 2018
All figures are reported in Canadian dollars unless otherwise noted.
This interim management report of fund performance contains financial highlights but does not contain either the complete interim or annual
financial statements of the investment fund. If you have not received a copy of the interim financial reports with this interim management report of
fund performance, you can get a copy of the interim financial reports or annual financial statements at your request, and at no cost, by calling us
toll-free at 1-888-888-3863, by writing to us at Renaissance Investments, 1500 Robert-Bourassa Boulevard, Suite 800, Montreal, QC, H3A 3S6, by
visiting the SEDAR website at sedar.com, or by visiting renaissanceinvestments.ca.
Unitholders may also contact us using one of these methods to request a copy of the investment fund’s proxy voting policies and procedures, proxy
voting disclosure record, or quarterly portfolio disclosure.
.
Management Discussion of Fund Performance.
.
Results of Operations
INTECH Investment Management LLC (INTECH), Rothschild Asset
Management Inc. (Rothschild), Sustainable Growth Advisers, LP
(SGA), Morgan Stanley Investment Management Inc. (Morgan
Stanley) and Pzena Investment Management, LLC (Pzena) provide
investment advice and investment management services to
Renaissance U.S. Equity Private Pool (the Pool). These portfolio
sub-advisors use different investment styles and the percentage of the
Pool allocated to each portfolio sub-advisor may change from time to
time.
l INTECH: Large Cap, Core, approximately 30%
l Rothschild: Large Cap, Traditional Value, approximately 25%
l SGA: Large Cap, Sustainable Growth, approximately 20%
l Morgan Stanley: Opportunistic Growth, approximately 15%
l Pzena: Large Cap, Deep Value, approximately 10%
The commentary that follows provides a summary of the results of
operations for the six-month period ended February 28, 2018. All
dollar figures are expressed in thousands, unless otherwise indicated.
The Pool's net asset value increased by 2% during the period, from
$205,644 as at August 31, 2017 to $210,001 as at February 28, 2018.
Positive investment performance was partially offset by rebalancing
and net redemptions of $24,011 in the period, resulting in an overall
increase in net asset value.
Class A units of the Pool posted a return of 13.4% for the period. The
Pool’s benchmark, the S&P 500 Index (the benchmark), returned
13.3% for the same period. The Pool’s return is after the deduction of
fees and expenses, unlike the benchmark’s return. See Past
Performance for the returns of other classes of units offered by the
Pool.
After a lengthy period of stability, market volatility returned early in
2018, as equity markets experienced their first decline of more than
10% since early 2016. Following the market correction, equities
rebounded, gaining back most of the losses. Despite the sell-off, U.S.
equity markets recorded strong gains for the period. The financials and
information technology sectors were the strongest performers, with
utilities, real estate and consumer staples the only sectors to record
negative returns.
In the Pool’s Large Cap, Core component, a moderate underweight
allocation to the consumer staples sector contributed to performance.
Stock selection in the industrials, health care and information
technology sectors also contributed. Individual contributors to the
component’s performance included Micron Technology Inc., The
Boeing Co. and Applied Materials Inc., all of which posted strong
returns.
The component’s average underweight allocation to
mega-capitalization stocks and overweight exposure to small-cap
stocks detracted from performance. On average, larger-cap stocks
outperformed smaller-cap stocks. A moderate overweight allocation to
the real estate and utilities sectors, which were the two weakest
performers during the period, detracted from relative performance.
Individual detractors included underweight allocations to Amazon.com
Inc., Microsoft Corp. and JPMorgan Chase & Co., which all posted
strong returns.
In the Pool’s Large Cap, Traditional Value component, stock selection
and sector allocation contributed to performance. An underweight
allocation to General Electric Co. contributed to performance as the
company’s stock declined sharply after the announcement of
significant downward earnings revisions and a dividend cut. Other
individual contributors included Northrop Grumman Corp., which
benefited from its acquisition of Orbital ATK, and Bank of America
Corp., which reported better-than expected earnings.
Stock selection in the consumer discretionary and health care sectors
detracted from the component’s performance. A moderate overweight
exposure to the industrials sector and a slight underweight allocation
to the financials sector detracted from performance. Individual
detractors included Celgene Corp. and Edison International. Celgene
announced a failure in the development of its ulcerative colitis drug.

2
Renaissance U.S. Equity Private Pool
The stock has been eliminated from the component. Edison
International saw its shares decline as a unique legal doctrine in
California could potentially create a significant liability for the company
in the wake of wildfires.
Rothschild added several new holdings to the component. Verizon
Communications Inc. had underperformed during the year, in part
because of wireless competition. The stock was re-purchased in
November based on the presumption that it has ample room to pay its
dividend, invest in growth and pursue its 5G strategy. Air Products and
Chemicals Inc. was purchased based on improved industrial
production and capital expenditure in the industrial gas sub-sector.
eBay Inc. was added for its stable and improving fundamentals.
The component’s Cisco Systems Inc. holding was increased as
Rothschild believes its prospects have improved. The Procter &
Gamble Co. was increased after the company restructured, and The
Walt Disney Co. was increased as its valuation significantly improved.
WestRock Co. was eliminated from the component following strong
performance. Cummins Inc. was exited in favour of Deere & Co. and
Caterpillar Inc., which have more growth potential. Hewlett Packard
Enterprise Co. (HP) was sold in favour of ON Semiconductor Corp.
DowDuPont Inc. was trimmed to reduce the component’s overweight
exposure to chemical companies. Parker Hannifin Corp. was reduced
to take profits. A large overweight allocation to Bank of America was
slightly trimmed after good performance.
In the Pool’s Large Cap, Sustainable Growth component, overweight
exposures to the consumer discretionary and information technology
sectors contributed to performance. A slight underweight allocation to
the consumer staples sector also contributed, as did stock selection in
the industrials, energy and consumer staples sectors.
Individual contributors included FleetCor Technologies Inc., Red Hat
Inc. and Nike Inc. FleetCor reported attractive growth across its
lodging, toll and payment portfolios. Red Hat announced the
acquisition of CoreOS. Nike’s stock rose after it announced its
long-term growth projections at its analyst day.
The component’s stock selection detracted from performance,
particularly in the health care, consumer discretionary and information
technology sectors. A large underweight allocation to the financials
sector also detracted from performance.
Individual detractors included Regeneron Pharmaceuticals Inc.,
Chipotle Mexican Grill Inc. and Equinix Inc. Regeneron’s stock was
weak as data from its Eylea follow-on compound disappointed in its
second-phase results. Chipotle was impacted by lower customer traffic
trends and continued allegations of food quality issues. Equinix came
under pressure from rising interest rates.
SGA purchased Yum! Brands Inc. for its global reach and franchise
structure. Walt Disney was added after it announced the acquisition of
certain Fox assets. Praxair Inc. was purchased for its potential growth
following its merger with Linde AG. The component’s holdings in
Amazon.com, Autodesk Inc. and Novo Nordisk AS were increased on
recent share price weakness.
State Street Corp. was eliminated from the component after strong
performance following the 2016 presidential election. Chipotle was
sold in favour of other opportunities. Core Laboratories NV was exited
following weaker-than-expected 2018 forecasts. Facebook Inc. and
UnitedHealth Group Inc. were trimmed on share price strength, while
Mondelez International Inc. was reduced amid concerns regarding its
growth prospects.
In the Pool’s Opportunistic Growth component, stock selection in the
information technology, consumer discretionary and health care
sectors contributed to performance. Individual contributors included
Amazon.com, Twitter Inc. and salesforce.com inc. Amazon.com
reported accelerating growth in its e-commerce, web services,
advertising and subscription businesses. Twitter posted improved
profitability and daily average user growth metrics, while
salesforce.com reported stronger-than-expected billings growth and
margin expansion.
A significant underweight allocation to the financials sector detracted
from the component’s performance. Stock selection in the materials
and financials sector also detracted from performance. Individual
detractors included Dexcom Inc., amid increased competition,
athenahealth Inc., because of fears over declining customers in the
hospital market, and Intrexon Corp., which was impacted by lower
market optimism for its mosquito solution to combat the Zika virus.
Morgan Stanley made several trades based on their assessment of
the relative risk/reward profile of each holding. New holdings in Adobe
Systems Inc., TransDigm Group Inc. and Union Pacific Corp. were
added, while Twitter, Dexcom and United Technologies Corp. were
increased. Tesla Motors Inc., Alibaba Group Holding Inc. and Juno
Therapeutics Inc. were eliminated. The component’s holdings in
Amazon.com, Facebook and NVIDIA Corp. were reduced.
In the Pool’s Large Cap, Deep Value component, stock selection in
the health care sector added the most value. A significant underweight
exposure to the utilities sector also contributed to performance. Top
individual contributors to performance included HP, which reported
good growth, Mylan NV, which benefited from the approval of several
key products, and Voya Financial Inc., which improved its risk profile
by announcing the sale of its variable annuity book.
Stock selection in the information technology sector detracted from the
component’s performance. Individual detractors included Franklin
Resources Inc., Axis Capital Holdings Ltd. and American International
Group Inc. (AIG). Franklin Resources was impacted by higher
expenses and weak investment performance across its funds. Axis
Capital Holdings experienced losses from hurricanes Harvey, Irma and
Maria, and two earthquakes in Mexico. AIG was also affected by
hurricane losses.
Pzena purchased Wells Fargo & Co. amid stock price weakness,
believing there will be little impact on the company from recent
regulatory scrutiny. Edison International was added as its share price
declined on fears of liability from fires in Southern California. The
component’s existing holdings in Ford Motor Co. and The Interpublic
Group of Cos. Inc. were increased on relative share price weakness.
Hilton Worldwide Holdings Inc., Cigna Corp. and Parker Hannifin were

3
Renaissance U.S. Equity Private Pool
eliminated as they approached fair value. Walmart Inc. and Bank of
America were trimmed as their share prices rose.
.
Recent Developments
Effective September 1, 2017, the minimum investment amount in
respect of Premium Class, Premium-T4 Class, Premium-T6 Class,
Class H-Premium, Class H-Premium T4, Class H-Premium T6, Class
F-Premium, Class F-Premium T4, Class F-Premium T6, Class
FH-Premium, Class FH-Premium T4, Class FH-Premium T6, Class
N-Premium, Class N-Premium T4, Class N-Premium T6, Class
NH-Premium, Class NH-Premium T4, and Class NH-Premium T6
units of the Pool was reduced from $150,000 to $100,000.
.
Related Party Transactions
CIBC and its affiliates have the following roles and responsibilities
with respect to the Pool, and receive the fees described below in
connection with their roles and responsibilities.
Manager, Trustee, and Portfolio Advisor of the Pool
CAMI, a wholly-owned subsidiary of CIBC, is the Pool's Manager,
Trustee, and Portfolio Advisor. CAMI receives management fees with
respect to the Pool's day-to-day business and operations, calculated
based on the net asset value of each respective class of units of the
Pool as described in Management Fees. As Trustee, CAMI holds title
to the Pool's property (cash and securities) on behalf of its unitholders.
As Portfolio Advisor, CAMI provides, or arranges to provide,
investment advice and portfolio management services to the Pool.
CAMI also compensates dealers in connection with their marketing
activities regarding the Pool. From time to time, CAMI may invest in
units of the Pool.
Distributor
Class A, C and I units of the Pool may be purchased only through
CIBC Wood Gundy, a division of CIBC World Markets Inc. (CIBC
WM). Other classes of units of the Pool may be purchased through
dealers and other firms, including CAMI's related dealers such as the
CIBC Investor's Edge discount brokerage division of CIBC Investor
Services Inc. (CIBC ISI), the CIBC Imperial Service division of CIBC
ISI, and CIBC WM. CIBC ISI and CIBC WM are wholly-owned
subsidiaries of CIBC. CAMI may pay sales commissions and trailing
commissions to the dealers in connection with the sale of units of the
Pool. These dealers and other firms may pay a portion of these sales
commissions and trailing commissions to their advisors who sell units
of the Pool to investors.
Brokerage Arrangements and Soft Dollars
Portfolio Advisor and any portfolio sub-advisors make decisions,
including the selection of markets and dealers and the negotiation of
commissions, with respect to the purchase and sale of portfolio
securities, certain derivative products and the execution of portfolio
transactions. Brokerage business may be allocated by the Portfolio
Advisor and any portfolio sub-advisors, to CIBC WM and CIBC World
Markets Corp., each a subsidiary of CIBC. CIBC WM and CIBC World
Markets Corp. may also earn spreads on the sale of fixed income
securities, other securities and certain derivative products to the Pool.
A spread is the difference between the bid and ask prices for a
security in the applicable marketplace, with respect to the execution of
portfolio transactions. The spread will differ based upon various
factors such as the nature and liquidity of the security.
CIBC WM and CIBC World Markets Corp. may furnish goods and
services, other than order execution, to portfolio sub-advisors when
they process trades through them (referred to in the industry as “soft
dollar” arrangements). These goods and services assist portfolio
sub-advisors with their investment decision-making services for the
Pool or relate directly to the execution of portfolio transactions on
behalf of the Pool. In accordance with the terms of the sub-advisory
agreements, such soft-dollar arrangements are in compliance with
applicable laws.
In addition, CAMI may enter into commission recapture arrangements
with certain dealers with respect to the Pool. Any commission
recaptured will be paid to the Pool.
During the period, the Pool did not pay any brokerage commissions or
other fees to CIBC WM or CIBC World Markets Corp. Spreads
associated with fixed income and other securities are not
ascertainable and, for that reason, cannot be included when
determining these amounts.
Pool Transactions
The Pool may enter into one or more of the following transactions (the
Related Party Transactions) in reliance on the standing instructions
issued by the Independent Review Committee (IRC):
l invest in or hold equity securities of CIBC or issuers related to a
portfolio sub-advisor;
l invest in or hold non-exchange-traded debt securities of CIBC or an
issuer related to CIBC in a primary offering and in the secondary
market;
l make an investment in the securities of an issuer for which CIBC
WM, CIBC World Markets Corp., or any affiliate of CIBC (a Related
Dealer) acts as an underwriter during the offering of the securities
at any time during the 60-day period following the completion of the
offering of such securities (in the case of a “private placement”
offering, in accordance with the exemptive relief order granted by
the Canadian securities regulatory authorities and in accordance
with the policies and procedures relating to such investment);
l purchase equity or debt securities from or sell them to a Related
Dealer, where it is acting as principal;
l undertake currency and currency derivative transactions where a
Related Dealer is the counterparty; and
l purchase securities from or sell securities to another investment
fund or a managed account managed by the Manager or an affiliate
of the Manager.
At least annually, the IRC reviews the Related Party Transactions for
which they have issued standing instructions. The IRC is required to
advise the Canadian securities regulatory authorities, after a matter
has been referred to or reported to it by the Manager, if it determines
that an investment decision was not made in accordance with

4
Renaissance U.S. Equity Private Pool
conditions imposed by securities legislation or the IRC in any Related
Party Transactions requiring its approval.
Custodian
CIBC Mellon Trust Company is the custodian of the Pool (the
Custodian). The Custodian holds all cash and securities for the Pool
and ensures that those assets are kept separate from any other cash
or securities that the custodian might be holding. The Custodian also
provides other services to the Pool including record-keeping and
processing foreign exchange transactions. The fees and spreads for
the services of the Custodian directly related to the execution of
portfolio transactions by the Pool are paid by CAMI and/or dealer(s)
directed by CAMI, up to the amount of the credits generated under
soft dollar arrangements from trading on behalf of the Pool during that
month. All other fees and spreads for the services of the
Custodian are paid by the Manager and charged to the Pool on a
recoverable basis. CIBC owns a 50% interest in the Custodian.
Service Provider
CIBC Mellon Global Securities Services Company (CIBC GSS)
provides certain services to the Pool, including securities lending, fund
accounting and reporting, and portfolio valuation. Such servicing fees
are paid by the Manager and charged to the Pool on a recoverable
basis. CIBC indirectly owns a 50% interest in CIBC GSS.

5
Renaissance U.S. Equity Private Pool
.
.
.
.
.
.
Financial Highlights
The following tables show selected key financial information about the Pool and are intended to help you understand the Pool’s financial
performance for the period ended February 28, 2018 and August 31 of any other period(s) shown.
The Pool's Net Assets per Unit¹ - Class A Units
2018 2017 2016 2015 2014 2013
Net Assets, beginning of period $ 13.48 $ 12.19 $ 11.65 $ 9.70 $ 7.88 $ 6.35
Increase (decrease) from operations:
Total revenue $ 0.06 $ 0.28 $ 0.21 $ 0.23 $ 0.16 $ 0.12
Total expenses (0.18) (0.34) (0.37) (0.34) (0.28) (0.20)
Realized gains (losses) for the period 0.94 2.32 1.49 2.37 1.31 0.83
Unrealized gains (losses) for the period 0.99 (0.88) (0.83) (0.21) 0.71 0.77
Total increase (decrease) from operations2
$ 1.81 $ 1.38 $ 0.50 $ 2.05 $ 1.90 $ 1.52
Distributions:
From income (excluding dividends) $ – $ – $ – $ – $ – $ –
Fromdividends – – – – – –
From capital gains – – – – – –
Return of capital – – – – – –
Total Distributions3
$ – $ – $ – $ – $ – $ –
Net Assets, end of period $ 15.28 $ 13.48 $ 12.19 $ 11.65 $ 9.70 $ 7.88
1This information is derived from the Pool's audited annual and unaudited interim financial statements. The Pool adopted IFRS on September 1, 2014. Previously, the Pool prepared its financial
statements in accordance with Canadian Generally Accepted Accounting Principles (GAAP) as defined in Part V of the CPA Canada Handbook. Under Canadian GAAP, the Pool measured fair
values of its investments in accordance with CICA Handbook Section 3855 which required the use of bid prices for long positions and ask prices for short positions. As such, the net assets per
unit figure presented in the financial statements differs from the net asset value calculated for fund pricing purposes. An explanation of these differences can be found in the notes to the
financial statements prior to September 1, 2014. Upon adoption of IFRS, the Pool measures the fair value of its investments by using the close market prices, where the close market price falls
within the bid-ask spread. As such, the Pool's accounting policies for measuring the fair value of investments in the financial statements are consistent with those used in measuring the net asset
value for transactions with unitholders. Accordingly, the opening net asset figure as at September 1, 2013 reflects the adjusted amount in accordance with IFRS. All figures presented for periods
prior to September 1, 2013 were prepared in accordance with Canadian GAAP.
2Net assets and distributions are based on the actual number of units outstanding at the relevant time. The total increase (decrease) from operations is based on the weighted average number of
units outstanding during the period.
3Distributions were paid in cash, reinvested in additional units of the Pool, or both.
Ratios and Supplemental Data - Class A Units
2018 2017 2016 2015 2014 2013
Total Net Asset Value (000s)4
$ 54,206 $ 54,348 $ 70,483 $ 77,447 $ 80,443 $ 84,033
Number of Units Outstanding4
3,546,957 4,032,319 5,779,723 6,645,263 8,294,421 10,661,567
Management Expense Ratio5
2.26%* 2.26% 2.82% 2.81% 2.80% 2.81%
Management Expense Ratio before waivers or
absorptions6
2.42%* 2.49% 3.02% 2.98% 3.01% 2.81%
Trading Expense Ratio7
0.06%* 0.06% 0.06% 0.06% 0.05% 0.11%
Portfolio Turnover Rate8
28.23% 85.13% 54.01% 56.31% 44.90% 82.46%
Net Asset Value per Unit $ 15.28 $ 13.48 $ 12.19 $ 11.65 $ 9.70 $ 7.88
*Ratio has been annualized.
4This information is presented as at February 28, 2018 and August 31 of the period(s) shown.
5Management expense ratio is based on the total expenses of the fund (excluding commissions and other portfolio transaction costs), incurred by or allocated to a class of units for the period
shown, expressed as an annualized percentage of the daily average net asset value of that class during the period.
6The decision to waive and/or absorb management fees and operating expenses is at the discretion of the Manager. The practice of waiving and/or absorbing management fees and operating
expenses may continue indefinitely or may be terminated at any time without notice to unitholders.
7The trading expense ratio represents total commissions and other portfolio transaction costs before income taxes expressed as an annualized percentage of the daily average net asset value
during the period. Spreads associated with fixed income securities trading are not ascertainable and, for that reason, are not included in the trading expense ratio calculation.
8The portfolio turnover rate indicates how actively the portfolio advisor and/or portfolio sub-advisor manages the portfolio investments. A portfolio turnover rate of 100% is equivalent to a fund
buying and selling all of the securities in its portfolio once in the course of the period. The higher a portfolio turnover rate in a period, the greater the trading costs payable by a fund in the period,
and the greater the chance of an investor receiving taxable capital gains in the year. There is not necessarily a relationship between a high turnover rate and the performance of a fund.

6
Renaissance U.S. Equity Private Pool
The Pool's Net Assets per Unit¹ - Premium Class Units
2018 2017 2016a
Net Assets, beginning of period $ 11.33 $ 10.28 $ 10.00b
Increase (decrease) from operations:
Total revenue $ 0.06 $ 0.23 $ 0.05
Total expenses (0.13) (0.24) (0.06)
Realized gains (losses) for the period 0.80 1.93 0.48
Unrealized gains (losses) for the period 0.32 (0.80) (0.19)
Total increase (decrease) from operations2
$ 1.05 $ 1.12 $ 0.28
Distributions:
From income (excluding dividends) $ – $ 0.05 $ –
Fromdividends – – –
From capital gains – – –
Return of capital – – –
Total Distributions3
$ – $ 0.05 $ –
Net Assets, end of period $ 12.88 $ 11.33 $ 10.28
aInformation presented is for the period from May 31, 2016 to August 31, 2016.
bInitial offering price.
1This information is derived from the Pool's audited annual and unaudited interim financial statements.
2Net assets and distributions are based on the actual number of units outstanding at the relevant time. The total increase (decrease) from operations is based on the weighted average number of
units outstanding during the period.
3Distributions were paid in cash, reinvested in additional units of the Pool, or both.
Ratios and Supplemental Data - Premium Class Units
2018 2017 2016a
Total Net Asset Value (000s)4
$ 1,948 $ 113 $ 101
Number of Units Outstanding4
151,301 9,915 9,851
Management Expense Ratio5
1.87%* 1.99% 2.20%*
Management Expense Ratio before waivers or
absorptions6
2.15%* 2.31% 2.29%*
Trading Expense Ratio7
0.06%* 0.06% 0.06%
Portfolio Turnover Rate8
28.23% 85.13% 54.01%
Net Asset Value per Unit $ 12.88 $ 11.33 $ 10.28
aInformation presented is for the period from May 31, 2016 to August 31, 2016.
*Ratio has been annualized.
4This information is presented as at February 28, 2018 and August 31 of the period(s) shown.
5Management expense ratio is based on the total expenses of the fund (excluding commissions and other portfolio transaction costs), incurred by or allocated to a class of units for the period
shown, expressed as an annualized percentage of the daily average net asset value of that class during the period.
6The decision to waive and/or absorb management fees and operating expenses is at the discretion of the Manager. The practice of waiving and/or absorbing management fees and operating
expenses may continue indefinitely or may be terminated at any time without notice to unitholders.
7The trading expense ratio represents total commissions and other portfolio transaction costs before income taxes expressed as an annualized percentage of the daily average net asset value
during the period. Spreads associated with fixed income securities trading are not ascertainable and, for that reason, are not included in the trading expense ratio calculation.
8The portfolio turnover rate indicates how actively the portfolio advisor and/or portfolio sub-advisor manages the portfolio investments. A portfolio turnover rate of 100% is equivalent to a fund
buying and selling all of the securities in its portfolio once in the course of the period. The higher a portfolio turnover rate in a period, the greater the trading costs payable by a fund in the period,
and the greater the chance of an investor receiving taxable capital gains in the year. There is not necessarily a relationship between a high turnover rate and the performance of a fund.

7
Renaissance U.S. Equity Private Pool
The Pool's Net Assets per Unit¹ - Premium-T4 Class Units
2018 2017 2016a
Net Assets, beginning of period $ 10.68 $ 10.15 $ 10.00b
Increase (decrease) from operations:
Total revenue $ (0.01) $ 0.14 $ –
Total expenses (0.10) (0.23) (0.05)
Realized gains (losses) for the period 0.73 1.89 0.41
Unrealized gains (losses) for the period 0.74 (0.83) (0.12)
Total increase (decrease) from operations2
$ 1.36 $ 0.97 $ 0.24
Distributions:
From income (excluding dividends) $ 0.08 $ 0.43 $ 0.10
Fromdividends – – –
From capital gains – – –
Return of capital 0.14 – –
Total Distributions3
$ 0.22 $ 0.43 $ 0.10
Net Assets, end of period $ 11.82 $ 10.68 $ 10.15
aInformation presented is for the period from May 31, 2016 to August 31, 2016.
bInitial offering price.
1This information is derived from the Pool's audited annual and unaudited interim financial statements.
2Net assets and distributions are based on the actual number of units outstanding at the relevant time. The total increase (decrease) from operations is based on the weighted average number of
units outstanding during the period.
3Distributions were paid in cash, reinvested in additional units of the Pool, or both.
Ratios and Supplemental Data - Premium-T4 Class Units
2018 2017 2016a
Total Net Asset Value (000s)4
$ – $ – $ –
Number of Units Outstanding4
2 2 2
Management Expense Ratio5
1.90%* 2.00% 2.20%*
Management Expense Ratio before waivers or
absorptions6
2.03%* 2.03% 2.20%*
Trading Expense Ratio7
0.06%* 0.06% 0.06%
Portfolio Turnover Rate8
28.23% 85.13% 54.01%
Net Asset Value per Unit $ 11.82 $ 10.68 $ 10.15
aInformation presented is for the period from May 31, 2016 to August 31, 2016.
*Ratio has been annualized.
4This information is presented as at February 28, 2018 and August 31 of the period(s) shown.
5Management expense ratio is based on the total expenses of the fund (excluding commissions and other portfolio transaction costs), incurred by or allocated to a class of units for the period
shown, expressed as an annualized percentage of the daily average net asset value of that class during the period.
6The decision to waive and/or absorb management fees and operating expenses is at the discretion of the Manager. The practice of waiving and/or absorbing management fees and operating
expenses may continue indefinitely or may be terminated at any time without notice to unitholders.
7The trading expense ratio represents total commissions and other portfolio transaction costs before income taxes expressed as an annualized percentage of the daily average net asset value
during the period. Spreads associated with fixed income securities trading are not ascertainable and, for that reason, are not included in the trading expense ratio calculation.
8The portfolio turnover rate indicates how actively the portfolio advisor and/or portfolio sub-advisor manages the portfolio investments. A portfolio turnover rate of 100% is equivalent to a fund
buying and selling all of the securities in its portfolio once in the course of the period. The higher a portfolio turnover rate in a period, the greater the trading costs payable by a fund in the period,
and the greater the chance of an investor receiving taxable capital gains in the year. There is not necessarily a relationship between a high turnover rate and the performance of a fund.

8
Renaissance U.S. Equity Private Pool
The Pool's Net Assets per Unit¹ - Premium-T6 Class Units
2018 2017 2016a
Net Assets, beginning of period $ 10.47 $ 10.09 $ 10.00b
Increase (decrease) from operations:
Total revenue $ (0.01) $ 0.14 $ –
Total expenses (0.10) (0.23) (0.05)
Realized gains (losses) for the period 0.71 1.87 0.41
Unrealized gains (losses) for the period 0.73 (0.82) (0.12)
Total increase (decrease) from operations2
$ 1.33 $ 0.96 $ 0.24
Distributions:
From income (excluding dividends) $ 0.11 $ 0.56 $ 0.15
Fromdividends – – –
From capital gains – – –
Return of capital 0.21 0.06 –
Total Distributions3
$ 0.32 $ 0.62 $ 0.15
Net Assets, end of period $ 11.48 $ 10.47 $ 10.09
aInformation presented is for the period from May 31, 2016 to August 31, 2016.
bInitial offering price.
1This information is derived from the Pool's audited annual and unaudited interim financial statements.
2Net assets and distributions are based on the actual number of units outstanding at the relevant time. The total increase (decrease) from operations is based on the weighted average number of
units outstanding during the period.
3Distributions were paid in cash, reinvested in additional units of the Pool, or both.
Ratios and Supplemental Data - Premium-T6 Class Units
2018 2017 2016a
Total Net Asset Value (000s)4
$ – $ – $ –
Number of Units Outstanding4
3 2 2
Management Expense Ratio5
1.90%* 2.00% 2.20%*
Management Expense Ratio before waivers or
absorptions6
2.03%* 2.03% 2.20%*
Trading Expense Ratio7
0.06%* 0.06% 0.06%
Portfolio Turnover Rate8
28.23% 85.13% 54.01%
Net Asset Value per Unit $ 11.48 $ 10.47 $ 10.09
aInformation presented is for the period from May 31, 2016 to August 31, 2016.
*Ratio has been annualized.
4This information is presented as at February 28, 2018 and August 31 of the period(s) shown.
5Management expense ratio is based on the total expenses of the fund (excluding commissions and other portfolio transaction costs), incurred by or allocated to a class of units for the period
shown, expressed as an annualized percentage of the daily average net asset value of that class during the period.
6The decision to waive and/or absorb management fees and operating expenses is at the discretion of the Manager. The practice of waiving and/or absorbing management fees and operating
expenses may continue indefinitely or may be terminated at any time without notice to unitholders.
7The trading expense ratio represents total commissions and other portfolio transaction costs before income taxes expressed as an annualized percentage of the daily average net asset value
during the period. Spreads associated with fixed income securities trading are not ascertainable and, for that reason, are not included in the trading expense ratio calculation.
8The portfolio turnover rate indicates how actively the portfolio advisor and/or portfolio sub-advisor manages the portfolio investments. A portfolio turnover rate of 100% is equivalent to a fund
buying and selling all of the securities in its portfolio once in the course of the period. The higher a portfolio turnover rate in a period, the greater the trading costs payable by a fund in the period,
and the greater the chance of an investor receiving taxable capital gains in the year. There is not necessarily a relationship between a high turnover rate and the performance of a fund.

9
Renaissance U.S. Equity Private Pool
The Pool's Net Assets per Unit¹ - Class H-Premium Units
2018 2017 2016a
Net Assets, beginning of period $ 11.31 $ 10.21 $ 10.00b
Increase (decrease) from operations:
Total revenue $ 0.16 $ 0.30 $ 0.03
Total expenses (0.16) (0.26) (0.05)
Realized gains (losses) for the period 0.78 1.73 0.38
Unrealized gains (losses) for the period 0.29 (0.57) (0.16)
Total increase (decrease) from operations2
$ 1.07 $ 1.20 $ 0.20
Distributions:
From income (excluding dividends) $ – $ 0.09 $ –
Fromdividends – – –
From capital gains – – –
Return of capital – – –
Total Distributions3
$ – $ 0.09 $ –
Net Assets, end of period $ 12.38 $ 11.31 $ 10.21
aInformation presented is for the period from May 31, 2016 to August 31, 2016.
bInitial offering price.
1This information is derived from the Pool's audited annual and unaudited interim financial statements.
2Net assets and distributions are based on the actual number of units outstanding at the relevant time. The total increase (decrease) from operations is based on the weighted average number of
units outstanding during the period.
3Distributions were paid in cash, reinvested in additional units of the Pool, or both.
Ratios and Supplemental Data - Class H-Premium Units
2018 2017 2016a
Total Net Asset Value (000s)4
$ – $ – $ –
Number of Units Outstanding4
1 1 1
Management Expense Ratio5
1.90%* 2.00% 2.20%*
Management Expense Ratio before waivers or
absorptions6
2.03%* 2.03% 2.20%*
Trading Expense Ratio7
0.06%* 0.06% 0.06%
Portfolio Turnover Rate8
28.23% 85.13% 54.01%
Net Asset Value per Unit $ 12.38 $ 11.31 $ 10.21
aInformation presented is for the period from May 31, 2016 to August 31, 2016.
*Ratio has been annualized.
4This information is presented as at February 28, 2018 and August 31 of the period(s) shown.
5Management expense ratio is based on the total expenses of the fund (excluding commissions and other portfolio transaction costs), incurred by or allocated to a class of units for the period
shown, expressed as an annualized percentage of the daily average net asset value of that class during the period.
6The decision to waive and/or absorb management fees and operating expenses is at the discretion of the Manager. The practice of waiving and/or absorbing management fees and operating
expenses may continue indefinitely or may be terminated at any time without notice to unitholders.
7The trading expense ratio represents total commissions and other portfolio transaction costs before income taxes expressed as an annualized percentage of the daily average net asset value
during the period. Spreads associated with fixed income securities trading are not ascertainable and, for that reason, are not included in the trading expense ratio calculation.
8The portfolio turnover rate indicates how actively the portfolio advisor and/or portfolio sub-advisor manages the portfolio investments. A portfolio turnover rate of 100% is equivalent to a fund
buying and selling all of the securities in its portfolio once in the course of the period. The higher a portfolio turnover rate in a period, the greater the trading costs payable by a fund in the period,
and the greater the chance of an investor receiving taxable capital gains in the year. There is not necessarily a relationship between a high turnover rate and the performance of a fund.

10
Renaissance U.S. Equity Private Pool
The Pool's Net Assets per Unit¹ - Class H-Premium T4 Units
2018 2017 2016a
Net Assets, beginning of period $ 10.82 $ 10.12 $ 10.00b
Increase (decrease) from operations:
Total revenue $ 0.06 $ 0.36 $ 0.03
Total expenses (0.12) (0.26) (0.05)
Realized gains (losses) for the period 0.71 1.68 0.38
Unrealized gains (losses) for the period 0.28 (0.58) (0.16)
Total increase (decrease) from operations2
$ 0.93 $ 1.20 $ 0.20
Distributions:
From income (excluding dividends) $ 0.08 $ 0.47 $ 0.10
Fromdividends – – –
From capital gains – – –
Return of capital 0.13 – –
Total Distributions3
$ 0.21 $ 0.47 $ 0.10
Net Assets, end of period $ 11.52 $ 10.82 $ 10.12
aInformation presented is for the period from May 31, 2016 to August 31, 2016.
bInitial offering price.
1This information is derived from the Pool's audited annual and unaudited interim financial statements.
2Net assets and distributions are based on the actual number of units outstanding at the relevant time. The total increase (decrease) from operations is based on the weighted average number of
units outstanding during the period.
3Distributions were paid in cash, reinvested in additional units of the Pool, or both.
Ratios and Supplemental Data - Class H-Premium T4 Units
2018 2017 2016a
Total Net Asset Value (000s)4
$ – $ – $ –
Number of Units Outstanding4
1 1 1
Management Expense Ratio5
1.90%* 2.00% 2.20%*
Management Expense Ratio before waivers or
absorptions6
2.03%* 2.03% 2.20%*
Trading Expense Ratio7
0.06%* 0.06% 0.06%
Portfolio Turnover Rate8
28.23% 85.13% 54.01%
Net Asset Value per Unit $ 11.52 $ 10.82 $ 10.12
aInformation presented is for the period from May 31, 2016 to August 31, 2016.
*Ratio has been annualized.
4This information is presented as at February 28, 2018 and August 31 of the period(s) shown.
5Management expense ratio is based on the total expenses of the fund (excluding commissions and other portfolio transaction costs), incurred by or allocated to a class of units for the period
shown, expressed as an annualized percentage of the daily average net asset value of that class during the period.
6The decision to waive and/or absorb management fees and operating expenses is at the discretion of the Manager. The practice of waiving and/or absorbing management fees and operating
expenses may continue indefinitely or may be terminated at any time without notice to unitholders.
7The trading expense ratio represents total commissions and other portfolio transaction costs before income taxes expressed as an annualized percentage of the daily average net asset value
during the period. Spreads associated with fixed income securities trading are not ascertainable and, for that reason, are not included in the trading expense ratio calculation.
8The portfolio turnover rate indicates how actively the portfolio advisor and/or portfolio sub-advisor manages the portfolio investments. A portfolio turnover rate of 100% is equivalent to a fund
buying and selling all of the securities in its portfolio once in the course of the period. The higher a portfolio turnover rate in a period, the greater the trading costs payable by a fund in the period,
and the greater the chance of an investor receiving taxable capital gains in the year. There is not necessarily a relationship between a high turnover rate and the performance of a fund.

11
Renaissance U.S. Equity Private Pool
The Pool's Net Assets per Unit¹ - Class H-Premium T6 Units
2018 2017 2016a
Net Assets, beginning of period $ 10.61 $ 10.06 $ 10.00b
Increase (decrease) from operations:
Total revenue $ 0.12 $ 0.28 $ 0.03
Total expenses (0.14) (0.25) (0.05)
Realized gains (losses) for the period 0.71 1.67 0.38
Unrealized gains (losses) for the period 0.27 (0.55) (0.16)
Total increase (decrease) from operations2
$ 0.96 $ 1.15 $ 0.20
Distributions:
From income (excluding dividends) $ 0.11 $ 0.56 $ 0.15
Fromdividends – – –
From capital gains – – –
Return of capital 0.20 0.04 –
Total Distributions3
$ 0.31 $ 0.60 $ 0.15
Net Assets, end of period $ 11.28 $ 10.61 $ 10.06
aInformation presented is for the period from May 31, 2016 to August 31, 2016.
bInitial offering price.
1This information is derived from the Pool's audited annual and unaudited interim financial statements.
2Net assets and distributions are based on the actual number of units outstanding at the relevant time. The total increase (decrease) from operations is based on the weighted average number of
units outstanding during the period.
3Distributions were paid in cash, reinvested in additional units of the Pool, or both.
Ratios and Supplemental Data - Class H-Premium T6 Units
2018 2017 2016a
Total Net Asset Value (000s)4
$ – $ – $ –
Number of Units Outstanding4
1 1 1
Management Expense Ratio5
1.90%* 2.00% 2.20%*
Management Expense Ratio before waivers or
absorptions6
2.03%* 2.03% 2.20%*
Trading Expense Ratio7
0.06%* 0.06% 0.06%
Portfolio Turnover Rate8
28.23% 85.13% 54.01%
Net Asset Value per Unit $ 11.28 $ 10.61 $ 10.06
aInformation presented is for the period from May 31, 2016 to August 31, 2016.
*Ratio has been annualized.
4This information is presented as at February 28, 2018 and August 31 of the period(s) shown.
5Management expense ratio is based on the total expenses of the fund (excluding commissions and other portfolio transaction costs), incurred by or allocated to a class of units for the period
shown, expressed as an annualized percentage of the daily average net asset value of that class during the period.
6The decision to waive and/or absorb management fees and operating expenses is at the discretion of the Manager. The practice of waiving and/or absorbing management fees and operating
expenses may continue indefinitely or may be terminated at any time without notice to unitholders.
7The trading expense ratio represents total commissions and other portfolio transaction costs before income taxes expressed as an annualized percentage of the daily average net asset value
during the period. Spreads associated with fixed income securities trading are not ascertainable and, for that reason, are not included in the trading expense ratio calculation.
8The portfolio turnover rate indicates how actively the portfolio advisor and/or portfolio sub-advisor manages the portfolio investments. A portfolio turnover rate of 100% is equivalent to a fund
buying and selling all of the securities in its portfolio once in the course of the period. The higher a portfolio turnover rate in a period, the greater the trading costs payable by a fund in the period,
and the greater the chance of an investor receiving taxable capital gains in the year. There is not necessarily a relationship between a high turnover rate and the performance of a fund.

12
Renaissance U.S. Equity Private Pool
The Pool's Net Assets per Unit¹ - Class C Units
2018 2017 2016 2015 2014 2013
Net Assets, beginning of period $ 17.92 $ 16.19 $ 15.36 $ 12.69 $ 10.24 $ 8.18
Increase (decrease) from operations:
Total revenue $ 0.08 $ 0.37 $ 0.28 $ 0.31 $ 0.21 $ 0.14
Total expenses (0.22) (0.42) (0.37) (0.35) (0.27) (0.19)
Realized gains (losses) for the period 1.25 3.09 1.99 3.08 1.69 1.23
Unrealized gains (losses) for the period 1.33 (1.14) (1.09) (0.35) 0.81 0.94
Total increase (decrease) from operations2
$ 2.44 $ 1.90 $ 0.81 $ 2.69 $ 2.44 $ 2.12
Distributions:
From income (excluding dividends) $ – $ – $ – $ – $ – $ –
Fromdividends – – – – – –
From capital gains – – – – – –
Return of capital – – – – – –
Total Distributions3
$ – $ – $ – $ – $ – $ –
Net Assets, end of period $ 20.34 $ 17.92 $ 16.19 $ 15.36 $ 12.69 $ 10.23
1This information is derived from the Pool's audited annual and unaudited interim financial statements. The Pool adopted IFRS on September 1, 2014. Previously, the Pool prepared its financial
statements in accordance with Canadian Generally Accepted Accounting Principles (GAAP) as defined in Part V of the CPA Canada Handbook. Under Canadian GAAP, the Pool measured fair
values of its investments in accordance with CICA Handbook Section 3855 which required the use of bid prices for long positions and ask prices for short positions. As such, the net assets per
unit figure presented in the financial statements differs from the net asset value calculated for fund pricing purposes. An explanation of these differences can be found in the notes to the
financial statements prior to September 1, 2014. Upon adoption of IFRS, the Pool measures the fair value of its investments by using the close market prices, where the close market price falls
within the bid-ask spread. As such, the Pool's accounting policies for measuring the fair value of investments in the financial statements are consistent with those used in measuring the net asset
value for transactions with unitholders. Accordingly, the opening net asset figure as at September 1, 2013 reflects the adjusted amount in accordance with IFRS. All figures presented for periods
prior to September 1, 2013 were prepared in accordance with Canadian GAAP.
2Net assets and distributions are based on the actual number of units outstanding at the relevant time. The total increase (decrease) from operations is based on the weighted average number of
units outstanding during the period.
3Distributions were paid in cash, reinvested in additional units of the Pool, or both.
Ratios and Supplemental Data - Class C Units
2018 2017 2016 2015 2014 2013
Total Net Asset Value (000s)4
$ 4,746 $ 5,193 $ 6,291 $ 7,341 $ 6,076 $ 4,555
Number of Units Outstanding4
233,319 289,728 388,596 477,920 478,812 444,935
Management Expense Ratio5
2.08%* 2.08% 2.09% 2.09% 2.07% 2.05%
Management Expense Ratio before waivers or
absorptions6
2.28%* 2.32% 2.32% 2.31% 2.34% 2.21%
Trading Expense Ratio7
0.06%* 0.06% 0.06% 0.06% 0.05% 0.11%
Portfolio Turnover Rate8
28.23% 85.13% 54.01% 56.31% 44.90% 82.46%
Net Asset Value per Unit $ 20.34 $ 17.92 $ 16.19 $ 15.36 $ 12.69 $ 10.24
*Ratio has been annualized.
4This information is presented as at February 28, 2018 and August 31 of the period(s) shown.
5Management expense ratio is based on the total expenses of the fund (excluding commissions and other portfolio transaction costs), incurred by or allocated to a class of units for the period
shown, expressed as an annualized percentage of the daily average net asset value of that class during the period.
6The decision to waive and/or absorb management fees and operating expenses is at the discretion of the Manager. The practice of waiving and/or absorbing management fees and operating
expenses may continue indefinitely or may be terminated at any time without notice to unitholders.
7The trading expense ratio represents total commissions and other portfolio transaction costs before income taxes expressed as an annualized percentage of the daily average net asset value
during the period. Spreads associated with fixed income securities trading are not ascertainable and, for that reason, are not included in the trading expense ratio calculation.
8The portfolio turnover rate indicates how actively the portfolio advisor and/or portfolio sub-advisor manages the portfolio investments. A portfolio turnover rate of 100% is equivalent to a fund
buying and selling all of the securities in its portfolio once in the course of the period. The higher a portfolio turnover rate in a period, the greater the trading costs payable by a fund in the period,
and the greater the chance of an investor receiving taxable capital gains in the year. There is not necessarily a relationship between a high turnover rate and the performance of a fund.

13
Renaissance U.S. Equity Private Pool
The Pool's Net Assets per Unit¹ - Class I Units
2018 2017 2016 2015 2014 2013
Net Assets, beginning of period $ 19.96 $ 17.92 $ 16.90 $ 13.88 $ 11.12 $ 8.79
Increase (decrease) from operations:
Total revenue $ 0.10 $ 0.42 $ 0.31 $ 0.34 $ 0.23 $ 0.15
Total expenses (0.13) (0.24) (0.21) (0.20) (0.16) (0.07)
Realized gains (losses) for the period 1.38 3.45 2.18 3.39 1.85 0.83
Unrealized gains (losses) for the period 1.53 (1.18) (1.07) (0.40) 0.76 0.48
Total increase (decrease) from operations2
$ 2.88 $ 2.45 $ 1.21 $ 3.13 $ 2.68 $ 1.39
Distributions:
From income (excluding dividends) $ 0.13 $ 0.11 $ 0.11 $ 0.08 $ 0.06 $ –
Fromdividends – – – – – –
From capital gains – – – – – –
Return of capital – – – – – –
Total Distributions3
$ 0.13 $ 0.11 $ 0.11 $ 0.08 $ 0.06 $ –
Net Assets, end of period $ 22.64 $ 19.96 $ 17.92 $ 16.90 $ 13.88 $ 11.12
1This information is derived from the Pool's audited annual and unaudited interim financial statements. The Pool adopted IFRS on September 1, 2014. Previously, the Pool prepared its financial
statements in accordance with Canadian Generally Accepted Accounting Principles (GAAP) as defined in Part V of the CPA Canada Handbook. Under Canadian GAAP, the Pool measured fair
values of its investments in accordance with CICA Handbook Section 3855 which required the use of bid prices for long positions and ask prices for short positions. As such, the net assets per
unit figure presented in the financial statements differs from the net asset value calculated for fund pricing purposes. An explanation of these differences can be found in the notes to the
financial statements prior to September 1, 2014. Upon adoption of IFRS, the Pool measures the fair value of its investments by using the close market prices, where the close market price falls
within the bid-ask spread. As such, the Pool's accounting policies for measuring the fair value of investments in the financial statements are consistent with those used in measuring the net asset
value for transactions with unitholders. Accordingly, the opening net asset figure as at September 1, 2013 reflects the adjusted amount in accordance with IFRS. All figures presented for periods
prior to September 1, 2013 were prepared in accordance with Canadian GAAP.
2Net assets and distributions are based on the actual number of units outstanding at the relevant time. The total increase (decrease) from operations is based on the weighted average number of
units outstanding during the period.
3Distributions were paid in cash, reinvested in additional units of the Pool, or both.
Ratios and Supplemental Data - Class I Units
2018 2017 2016 2015 2014 2013
Total Net Asset Value (000s)4
$ 1,196 $ 1,577 $ 1,260 $ 1,398 $ 1,136 $ 899
Number of Units Outstanding4
52,829 79,029 70,288 82,710 81,852 80,811
Management Expense Ratio5
0.94%* 0.94% 0.93% 0.92% 0.96% 0.94%
Management Expense Ratio before waivers or
absorptions6
1.14%* 1.18% 1.14% 1.13% 1.17% 1.02%
Trading Expense Ratio7
0.06%* 0.06% 0.06% 0.06% 0.05% 0.11%
Portfolio Turnover Rate8
28.23% 85.13% 54.01% 56.31% 44.90% 82.46%
Net Asset Value per Unit $ 22.64 $ 19.96 $ 17.92 $ 16.90 $ 13.88 $ 11.12
*Ratio has been annualized.
4This information is presented as at February 28, 2018 and August 31 of the period(s) shown.
5Management expense ratio is based on the total expenses of the fund (excluding commissions and other portfolio transaction costs), incurred by or allocated to a class of units for the period
shown, expressed as an annualized percentage of the daily average net asset value of that class during the period.
6The decision to waive and/or absorb management fees and operating expenses is at the discretion of the Manager. The practice of waiving and/or absorbing management fees and operating
expenses may continue indefinitely or may be terminated at any time without notice to unitholders.
7The trading expense ratio represents total commissions and other portfolio transaction costs before income taxes expressed as an annualized percentage of the daily average net asset value
during the period. Spreads associated with fixed income securities trading are not ascertainable and, for that reason, are not included in the trading expense ratio calculation.
8The portfolio turnover rate indicates how actively the portfolio advisor and/or portfolio sub-advisor manages the portfolio investments. A portfolio turnover rate of 100% is equivalent to a fund
buying and selling all of the securities in its portfolio once in the course of the period. The higher a portfolio turnover rate in a period, the greater the trading costs payable by a fund in the period,
and the greater the chance of an investor receiving taxable capital gains in the year. There is not necessarily a relationship between a high turnover rate and the performance of a fund.

14
Renaissance U.S. Equity Private Pool
The Pool's Net Assets per Unit¹ - Class F-Premium Units
2018 2017 2016a
Net Assets, beginning of period $ 11.42 $ 10.29 $ 10.00b
Increase (decrease) from operations:
Total revenue $ 0.05 $ 0.24 $ 0.04
Total expenses (0.06) (0.13) (0.04)
Realized gains (losses) for the period 0.80 2.09 0.40
Unrealized gains (losses) for the period 0.83 (0.82) 0.36
Total increase (decrease) from operations2
$ 1.62 $ 1.38 $ 0.76
Distributions:
From income (excluding dividends) $ 0.03 $ 0.10 $ –
Fromdividends – – –
From capital gains – – –
Return of capital – – –
Total Distributions3
$ 0.03 $ 0.10 $ –
Net Assets, end of period $ 13.00 $ 11.42 $ 10.29
aInformation presented is for the period from May 31, 2016 to August 31, 2016.
bInitial offering price.
1This information is derived from the Pool's audited annual and unaudited interim financial statements.
2Net assets and distributions are based on the actual number of units outstanding at the relevant time. The total increase (decrease) from operations is based on the weighted average number of
units outstanding during the period.
3Distributions were paid in cash, reinvested in additional units of the Pool, or both.
Ratios and Supplemental Data - Class F-Premium Units
2018 2017 2016a
Total Net Asset Value (000s)4
$ 595 $ 532 $ 92
Number of Units Outstanding4
45,716 46,575 8,949
Management Expense Ratio5
0.84%* 1.00% 1.22%*
Management Expense Ratio before waivers or
absorptions6
0.98%* 1.08% 1.22%*
Trading Expense Ratio7
0.06%* 0.06% 0.06%
Portfolio Turnover Rate8
28.23% 85.13% 54.01%
Net Asset Value per Unit $ 13.00 $ 11.42 $ 10.29
aInformation presented is for the period from May 31, 2016 to August 31, 2016.
*Ratio has been annualized.
4This information is presented as at February 28, 2018 and August 31 of the period(s) shown.
5Management expense ratio is based on the total expenses of the fund (excluding commissions and other portfolio transaction costs), incurred by or allocated to a class of units for the period
shown, expressed as an annualized percentage of the daily average net asset value of that class during the period.
6The decision to waive and/or absorb management fees and operating expenses is at the discretion of the Manager. The practice of waiving and/or absorbing management fees and operating
expenses may continue indefinitely or may be terminated at any time without notice to unitholders.
7The trading expense ratio represents total commissions and other portfolio transaction costs before income taxes expressed as an annualized percentage of the daily average net asset value
during the period. Spreads associated with fixed income securities trading are not ascertainable and, for that reason, are not included in the trading expense ratio calculation.
8The portfolio turnover rate indicates how actively the portfolio advisor and/or portfolio sub-advisor manages the portfolio investments. A portfolio turnover rate of 100% is equivalent to a fund
buying and selling all of the securities in its portfolio once in the course of the period. The higher a portfolio turnover rate in a period, the greater the trading costs payable by a fund in the period,
and the greater the chance of an investor receiving taxable capital gains in the year. There is not necessarily a relationship between a high turnover rate and the performance of a fund.

15
Renaissance U.S. Equity Private Pool
The Pool's Net Assets per Unit¹ - Class F-Premium T4 Units
2018 2017 2016a
Net Assets, beginning of period $ 10.77 $ 10.17 $ 10.00b
Increase (decrease) from operations:
Total revenue $ (0.01) $ 0.14 $ –
Total expenses (0.05) (0.13) (0.03)
Realized gains (losses) for the period 0.74 1.91 0.41
Unrealized gains (losses) for the period 0.78 (0.85) (0.12)
Total increase (decrease) from operations2
$ 1.46 $ 1.07 $ 0.26
Distributions:
From income (excluding dividends) $ 0.09 $ 0.47 $ 0.10
Fromdividends – – –
From capital gains – – –
Return of capital 0.13 – –
Total Distributions3
$ 0.22 $ 0.47 $ 0.10
Net Assets, end of period $ 12.01 $ 10.77 $ 10.17
aInformation presented is for the period from May 31, 2016 to August 31, 2016.
bInitial offering price.
1This information is derived from the Pool's audited annual and unaudited interim financial statements.
2Net assets and distributions are based on the actual number of units outstanding at the relevant time. The total increase (decrease) from operations is based on the weighted average number of
units outstanding during the period.
3Distributions were paid in cash, reinvested in additional units of the Pool, or both.
Ratios and Supplemental Data - Class F-Premium T4 Units
2018 2017 2016a
Total Net Asset Value (000s)4
$ – $ – $ –
Number of Units Outstanding4
2 2 2
Management Expense Ratio5
0.90%* 1.00% 1.20%*
Management Expense Ratio before waivers or
absorptions6
1.03%* 1.03% 1.20%*
Trading Expense Ratio7
0.06%* 0.06% 0.06%
Portfolio Turnover Rate8
28.23% 85.13% 54.01%
Net Asset Value per Unit $ 12.01 $ 10.77 $ 10.17
aInformation presented is for the period from May 31, 2016 to August 31, 2016.
*Ratio has been annualized.
4This information is presented as at February 28, 2018 and August 31 of the period(s) shown.
5Management expense ratio is based on the total expenses of the fund (excluding commissions and other portfolio transaction costs), incurred by or allocated to a class of units for the period
shown, expressed as an annualized percentage of the daily average net asset value of that class during the period.
6The decision to waive and/or absorb management fees and operating expenses is at the discretion of the Manager. The practice of waiving and/or absorbing management fees and operating
expenses may continue indefinitely or may be terminated at any time without notice to unitholders.
7The trading expense ratio represents total commissions and other portfolio transaction costs before income taxes expressed as an annualized percentage of the daily average net asset value
during the period. Spreads associated with fixed income securities trading are not ascertainable and, for that reason, are not included in the trading expense ratio calculation.
8The portfolio turnover rate indicates how actively the portfolio advisor and/or portfolio sub-advisor manages the portfolio investments. A portfolio turnover rate of 100% is equivalent to a fund
buying and selling all of the securities in its portfolio once in the course of the period. The higher a portfolio turnover rate in a period, the greater the trading costs payable by a fund in the period,
and the greater the chance of an investor receiving taxable capital gains in the year. There is not necessarily a relationship between a high turnover rate and the performance of a fund.

16
Renaissance U.S. Equity Private Pool
The Pool's Net Assets per Unit¹ - Class F-Premium T6 Units
2018 2017 2016a
Net Assets, beginning of period $ 10.62 $ 10.12 $ 10.00b
Increase (decrease) from operations:
Total revenue $ 0.27 $ 0.14 $ –
Total expenses (0.15) (0.13) (0.03)
Realized gains (losses) for the period 0.52 1.89 0.41
Unrealized gains (losses) for the period 3.64 (0.82) (0.12)
Total increase (decrease) from operations2
$ 4.28 $ 1.08 $ 0.26
Distributions:
From income (excluding dividends) $ 0.12 $ 0.58 $ 0.15
Fromdividends – – –
From capital gains – – –
Return of capital 0.20 0.04 –
Total Distributions3
$ 0.32 $ 0.62 $ 0.15
Net Assets, end of period $ 11.61 $ 10.62 $ 10.12
aInformation presented is for the period from May 31, 2016 to August 31, 2016.
bInitial offering price.
1This information is derived from the Pool's audited annual and unaudited interim financial statements.
2Net assets and distributions are based on the actual number of units outstanding at the relevant time. The total increase (decrease) from operations is based on the weighted average number of
units outstanding during the period.
3Distributions were paid in cash, reinvested in additional units of the Pool, or both.
Ratios and Supplemental Data - Class F-Premium T6 Units
2018 2017 2016a
Total Net Asset Value (000s)4
$ – $ – $ –
Number of Units Outstanding4
3 2 2
Management Expense Ratio5
0.90%* 1.00% 1.20%*
Management Expense Ratio before waivers or
absorptions6
1.03%* 1.03% 1.20%*
Trading Expense Ratio7
0.06%* 0.06% 0.06%
Portfolio Turnover Rate8
28.23% 85.13% 54.01%
Net Asset Value per Unit $ 11.61 $ 10.62 $ 10.12
aInformation presented is for the period from May 31, 2016 to August 31, 2016.
*Ratio has been annualized.
4This information is presented as at February 28, 2018 and August 31 of the period(s) shown.
5Management expense ratio is based on the total expenses of the fund (excluding commissions and other portfolio transaction costs), incurred by or allocated to a class of units for the period
shown, expressed as an annualized percentage of the daily average net asset value of that class during the period.
6The decision to waive and/or absorb management fees and operating expenses is at the discretion of the Manager. The practice of waiving and/or absorbing management fees and operating
expenses may continue indefinitely or may be terminated at any time without notice to unitholders.
7The trading expense ratio represents total commissions and other portfolio transaction costs before income taxes expressed as an annualized percentage of the daily average net asset value
during the period. Spreads associated with fixed income securities trading are not ascertainable and, for that reason, are not included in the trading expense ratio calculation.
8The portfolio turnover rate indicates how actively the portfolio advisor and/or portfolio sub-advisor manages the portfolio investments. A portfolio turnover rate of 100% is equivalent to a fund
buying and selling all of the securities in its portfolio once in the course of the period. The higher a portfolio turnover rate in a period, the greater the trading costs payable by a fund in the period,
and the greater the chance of an investor receiving taxable capital gains in the year. There is not necessarily a relationship between a high turnover rate and the performance of a fund.

17
Renaissance U.S. Equity Private Pool
The Pool's Net Assets per Unit¹ - Class FH-Premium Units
2018 2017 2016a
Net Assets, beginning of period $ 11.57 $ 10.23 $ 10.00b
Increase (decrease) from operations:
Total revenue $ 0.20 $ 3.10 $ 0.03
Total expenses (0.11) (0.55) (0.03)
Realized gains (losses) for the period 0.82 1.32 0.38
Unrealized gains (losses) for the period 0.34 (2.42) (0.16)
Total increase (decrease) from operations2
$ 1.25 $ 1.45 $ 0.22
Distributions:
From income (excluding dividends) $ 0.04 $ 0.10 $ –
Fromdividends – – –
From capital gains – – –
Return of capital – – –
Total Distributions3
$ 0.04 $ 0.10 $ –
Net Assets, end of period $ 12.77 $ 11.57 $ 10.23
aInformation presented is for the period from May 31, 2016 to August 31, 2016.
bInitial offering price.
1This information is derived from the Pool's audited annual and unaudited interim financial statements.
2Net assets and distributions are based on the actual number of units outstanding at the relevant time. The total increase (decrease) from operations is based on the weighted average number of
units outstanding during the period.
3Distributions were paid in cash, reinvested in additional units of the Pool, or both.
Ratios and Supplemental Data - Class FH-Premium Units
2018 2017 2016a
Total Net Asset Value (000s)4
$ 87 $ 99 $ –
Number of Units Outstanding4
6,820 8,568 1
Management Expense Ratio5
0.90%* 0.99% 1.20%*
Management Expense Ratio before waivers or
absorptions6
1.10%* 1.21% 1.20%*
Trading Expense Ratio7
0.06%* 0.06% 0.06%
Portfolio Turnover Rate8
28.23% 85.13% 54.01%
Net Asset Value per Unit $ 12.77 $ 11.57 $ 10.23
aInformation presented is for the period from May 31, 2016 to August 31, 2016.
*Ratio has been annualized.
4This information is presented as at February 28, 2018 and August 31 of the period(s) shown.
5Management expense ratio is based on the total expenses of the fund (excluding commissions and other portfolio transaction costs), incurred by or allocated to a class of units for the period
shown, expressed as an annualized percentage of the daily average net asset value of that class during the period.
6The decision to waive and/or absorb management fees and operating expenses is at the discretion of the Manager. The practice of waiving and/or absorbing management fees and operating
expenses may continue indefinitely or may be terminated at any time without notice to unitholders.
7The trading expense ratio represents total commissions and other portfolio transaction costs before income taxes expressed as an annualized percentage of the daily average net asset value
during the period. Spreads associated with fixed income securities trading are not ascertainable and, for that reason, are not included in the trading expense ratio calculation.
8The portfolio turnover rate indicates how actively the portfolio advisor and/or portfolio sub-advisor manages the portfolio investments. A portfolio turnover rate of 100% is equivalent to a fund
buying and selling all of the securities in its portfolio once in the course of the period. The higher a portfolio turnover rate in a period, the greater the trading costs payable by a fund in the period,
and the greater the chance of an investor receiving taxable capital gains in the year. There is not necessarily a relationship between a high turnover rate and the performance of a fund.

18
Renaissance U.S. Equity Private Pool
The Pool's Net Assets per Unit¹ - Class FH-Premium T4 Units
2018 2017 2016a
Net Assets, beginning of period $ 10.85 $ 10.14 $ 10.00b
Increase (decrease) from operations:
Total revenue $ 0.06 $ 0.30 $ 0.03
Total expenses (0.07) (0.15) (0.03)
Realized gains (losses) for the period 0.71 1.68 0.38
Unrealized gains (losses) for the period 0.35 (0.59) (0.16)
Total increase (decrease) from operations2
$ 1.05 $ 1.24 $ 0.22
Distributions:
From income (excluding dividends) $ 0.09 $ 0.49 $ 0.10
Fromdividends – – –
From capital gains – – –
Return of capital 0.12 – –
Total Distributions3
$ 0.21 $ 0.49 $ 0.10
Net Assets, end of period $ 11.68 $ 10.85 $ 10.14
aInformation presented is for the period from May 31, 2016 to August 31, 2016.
bInitial offering price.
1This information is derived from the Pool's audited annual and unaudited interim financial statements.
2Net assets and distributions are based on the actual number of units outstanding at the relevant time. The total increase (decrease) from operations is based on the weighted average number of
units outstanding during the period.
3Distributions were paid in cash, reinvested in additional units of the Pool, or both.
Ratios and Supplemental Data - Class FH-Premium T4 Units
2018 2017 2016a
Total Net Asset Value (000s)4
$ – $ – $ –
Number of Units Outstanding4
1 1 1
Management Expense Ratio5
0.90%* 1.00% 1.20%*
Management Expense Ratio before waivers or
absorptions6
1.03%* 1.03% 1.20%*
Trading Expense Ratio7
0.06%* 0.06% 0.06%
Portfolio Turnover Rate8
28.23% 85.13% 54.01%
Net Asset Value per Unit $ 11.68 $ 10.85 $ 10.14
aInformation presented is for the period from May 31, 2016 to August 31, 2016.
*Ratio has been annualized.
4This information is presented as at February 28, 2018 and August 31 of the period(s) shown.
5Management expense ratio is based on the total expenses of the fund (excluding commissions and other portfolio transaction costs), incurred by or allocated to a class of units for the period
shown, expressed as an annualized percentage of the daily average net asset value of that class during the period.
6The decision to waive and/or absorb management fees and operating expenses is at the discretion of the Manager. The practice of waiving and/or absorbing management fees and operating
expenses may continue indefinitely or may be terminated at any time without notice to unitholders.
7The trading expense ratio represents total commissions and other portfolio transaction costs before income taxes expressed as an annualized percentage of the daily average net asset value
during the period. Spreads associated with fixed income securities trading are not ascertainable and, for that reason, are not included in the trading expense ratio calculation.
8The portfolio turnover rate indicates how actively the portfolio advisor and/or portfolio sub-advisor manages the portfolio investments. A portfolio turnover rate of 100% is equivalent to a fund
buying and selling all of the securities in its portfolio once in the course of the period. The higher a portfolio turnover rate in a period, the greater the trading costs payable by a fund in the period,
and the greater the chance of an investor receiving taxable capital gains in the year. There is not necessarily a relationship between a high turnover rate and the performance of a fund.

19
Renaissance U.S. Equity Private Pool
The Pool's Net Assets per Unit¹ - Class FH-Premium T6 Units
2018 2017 2016a
Net Assets, beginning of period $ 10.66 $ 10.03 $ 10.00b
Increase (decrease) from operations:
Total revenue $ 0.08 $ 0.26 $ (0.02)
Total expenses (0.08) (0.14) (0.02)
Realized gains (losses) for the period 0.71 1.66 0.38
Unrealized gains (losses) for the period 0.29 (0.54) (0.16)
Total increase (decrease) from operations2
$ 1.00 $ 1.24 $ 0.18
Distributions:
From income (excluding dividends) $ 0.13 $ 0.57 $ 0.15
Fromdividends – – –
From capital gains – – –
Return of capital 0.18 0.03 –
Total Distributions3
$ 0.31 $ 0.60 $ 0.15
Net Assets, end of period $ 11.37 $ 10.66 $ 10.03
aInformation presented is for the period from May 31, 2016 to August 31, 2016.
bInitial offering price.
1This information is derived from the Pool's audited annual and unaudited interim financial statements.
2Net assets and distributions are based on the actual number of units outstanding at the relevant time. The total increase (decrease) from operations is based on the weighted average number of
units outstanding during the period.
3Distributions were paid in cash, reinvested in additional units of the Pool, or both.
Ratios and Supplemental Data - Class FH-Premium T6 Units
2018 2017 2016a
Total Net Asset Value (000s)4
$ – $ – $ –
Number of Units Outstanding4
1 1 1
Management Expense Ratio5
0.90%* 1.00% 1.20%*
Management Expense Ratio before waivers or
absorptions6
1.03%* 1.03% 1.20%*
Trading Expense Ratio7
0.06%* 0.06% 0.06%
Portfolio Turnover Rate8
28.23% 85.13% 54.01%
Net Asset Value per Unit $ 11.37 $ 10.66 $ 10.03
aInformation presented is for the period from May 31, 2016 to August 31, 2016.
*Ratio has been annualized.
4This information is presented as at February 28, 2018 and August 31 of the period(s) shown.
5Management expense ratio is based on the total expenses of the fund (excluding commissions and other portfolio transaction costs), incurred by or allocated to a class of units for the period
shown, expressed as an annualized percentage of the daily average net asset value of that class during the period.
6The decision to waive and/or absorb management fees and operating expenses is at the discretion of the Manager. The practice of waiving and/or absorbing management fees and operating
expenses may continue indefinitely or may be terminated at any time without notice to unitholders.
7The trading expense ratio represents total commissions and other portfolio transaction costs before income taxes expressed as an annualized percentage of the daily average net asset value
during the period. Spreads associated with fixed income securities trading are not ascertainable and, for that reason, are not included in the trading expense ratio calculation.
8The portfolio turnover rate indicates how actively the portfolio advisor and/or portfolio sub-advisor manages the portfolio investments. A portfolio turnover rate of 100% is equivalent to a fund
buying and selling all of the securities in its portfolio once in the course of the period. The higher a portfolio turnover rate in a period, the greater the trading costs payable by a fund in the period,
and the greater the chance of an investor receiving taxable capital gains in the year. There is not necessarily a relationship between a high turnover rate and the performance of a fund.

20
Renaissance U.S. Equity Private Pool
The Pool's Net Assets per Unit¹ - Class N-Premium Units
2018 2017 2016a
Net Assets, beginning of period $ 11.32 $ 10.27 $ 10.00b
Increase (decrease) from operations:
Total revenue $ (0.01) $ 0.15 $ –
Total expenses (0.05) (0.13) (0.03)
Realized gains (losses) for the period 0.78 1.96 0.41
Unrealized gains (losses) for the period 0.84 (0.83) (0.12)
Total increase (decrease) from operations2
$ 1.56 $ 1.15 $ 0.26
Distributions:
From income (excluding dividends) $ 0.05 $ 0.10 $ –
Fromdividends – – –
From capital gains – – –
Return of capital – – –
Total Distributions3
$ 0.05 $ 0.10 $ –
Net Assets, end of period $ 12.83 $ 11.32 $ 10.27
aInformation presented is for the period from May 31, 2016 to August 31, 2016.
bInitial offering price.
1This information is derived from the Pool's audited annual and unaudited interim financial statements.
2Net assets and distributions are based on the actual number of units outstanding at the relevant time. The total increase (decrease) from operations is based on the weighted average number of
units outstanding during the period.
3Distributions were paid in cash, reinvested in additional units of the Pool, or both.
Ratios and Supplemental Data - Class N-Premium Units
2018 2017 2016a
Total Net Asset Value (000s)4
$ – $ – $ –
Number of Units Outstanding4
2 2 2
Management Expense Ratio5
0.90%* 1.00% 1.20%*
Management Expense Ratio before waivers or
absorptions6
1.03%* 1.03% 1.20%*
Trading Expense Ratio7
0.06%* 0.06% 0.06%
Portfolio Turnover Rate8
28.23% 85.13% 54.01%
Net Asset Value per Unit $ 12.83 $ 11.32 $ 10.27
aInformation presented is for the period from May 31, 2016 to August 31, 2016.
*Ratio has been annualized.
4This information is presented as at February 28, 2018 and August 31 of the period(s) shown.
5Management expense ratio is based on the total expenses of the fund (excluding commissions and other portfolio transaction costs), incurred by or allocated to a class of units for the period
shown, expressed as an annualized percentage of the daily average net asset value of that class during the period.
6The decision to waive and/or absorb management fees and operating expenses is at the discretion of the Manager. The practice of waiving and/or absorbing management fees and operating
expenses may continue indefinitely or may be terminated at any time without notice to unitholders.
7The trading expense ratio represents total commissions and other portfolio transaction costs before income taxes expressed as an annualized percentage of the daily average net asset value
during the period. Spreads associated with fixed income securities trading are not ascertainable and, for that reason, are not included in the trading expense ratio calculation.
8The portfolio turnover rate indicates how actively the portfolio advisor and/or portfolio sub-advisor manages the portfolio investments. A portfolio turnover rate of 100% is equivalent to a fund
buying and selling all of the securities in its portfolio once in the course of the period. The higher a portfolio turnover rate in a period, the greater the trading costs payable by a fund in the period,
and the greater the chance of an investor receiving taxable capital gains in the year. There is not necessarily a relationship between a high turnover rate and the performance of a fund.

21
Renaissance U.S. Equity Private Pool
The Pool's Net Assets per Unit¹ - Class N-Premium T4 Units
2018 2017 2016a
Net Assets, beginning of period $ 10.77 $ 10.17 $ 10.00b
Increase (decrease) from operations:
Total revenue $ (0.01) $ 0.14 $ –
Total expenses (0.05) (0.13) (0.03)
Realized gains (losses) for the period 0.74 1.91 0.41
Unrealized gains (losses) for the period 0.78 (0.85) (0.12)
Total increase (decrease) from operations2
$ 1.46 $ 1.07 $ 0.26
Distributions:
From income (excluding dividends) $ 0.09 $ 0.47 $ 0.10
Fromdividends – – –
From capital gains – – –
Return of capital 0.13 – –
Total Distributions3
$ 0.22 $ 0.47 $ 0.10
Net Assets, end of period $ 12.01 $ 10.77 $ 10.17
aInformation presented is for the period from May 31, 2016 to August 31, 2016.
bInitial offering price.
1This information is derived from the Pool's audited annual and unaudited interim financial statements.
2Net assets and distributions are based on the actual number of units outstanding at the relevant time. The total increase (decrease) from operations is based on the weighted average number of
units outstanding during the period.
3Distributions were paid in cash, reinvested in additional units of the Pool, or both.
Ratios and Supplemental Data - Class N-Premium T4 Units
2018 2017 2016a
Total Net Asset Value (000s)4
$ – $ – $ –
Number of Units Outstanding4
2 2 2
Management Expense Ratio5
0.90%* 1.00% 1.20%*
Management Expense Ratio before waivers or
absorptions6
1.03%* 1.03% 1.20%*
Trading Expense Ratio7
0.06%* 0.06% 0.06%
Portfolio Turnover Rate8
28.23% 85.13% 54.01%
Net Asset Value per Unit $ 12.01 $ 10.77 $ 10.17
aInformation presented is for the period from May 31, 2016 to August 31, 2016.
*Ratio has been annualized.
4This information is presented as at February 28, 2018 and August 31 of the period(s) shown.
5Management expense ratio is based on the total expenses of the fund (excluding commissions and other portfolio transaction costs), incurred by or allocated to a class of units for the period
shown, expressed as an annualized percentage of the daily average net asset value of that class during the period.
6The decision to waive and/or absorb management fees and operating expenses is at the discretion of the Manager. The practice of waiving and/or absorbing management fees and operating
expenses may continue indefinitely or may be terminated at any time without notice to unitholders.
7The trading expense ratio represents total commissions and other portfolio transaction costs before income taxes expressed as an annualized percentage of the daily average net asset value
during the period. Spreads associated with fixed income securities trading are not ascertainable and, for that reason, are not included in the trading expense ratio calculation.
8The portfolio turnover rate indicates how actively the portfolio advisor and/or portfolio sub-advisor manages the portfolio investments. A portfolio turnover rate of 100% is equivalent to a fund
buying and selling all of the securities in its portfolio once in the course of the period. The higher a portfolio turnover rate in a period, the greater the trading costs payable by a fund in the period,
and the greater the chance of an investor receiving taxable capital gains in the year. There is not necessarily a relationship between a high turnover rate and the performance of a fund.
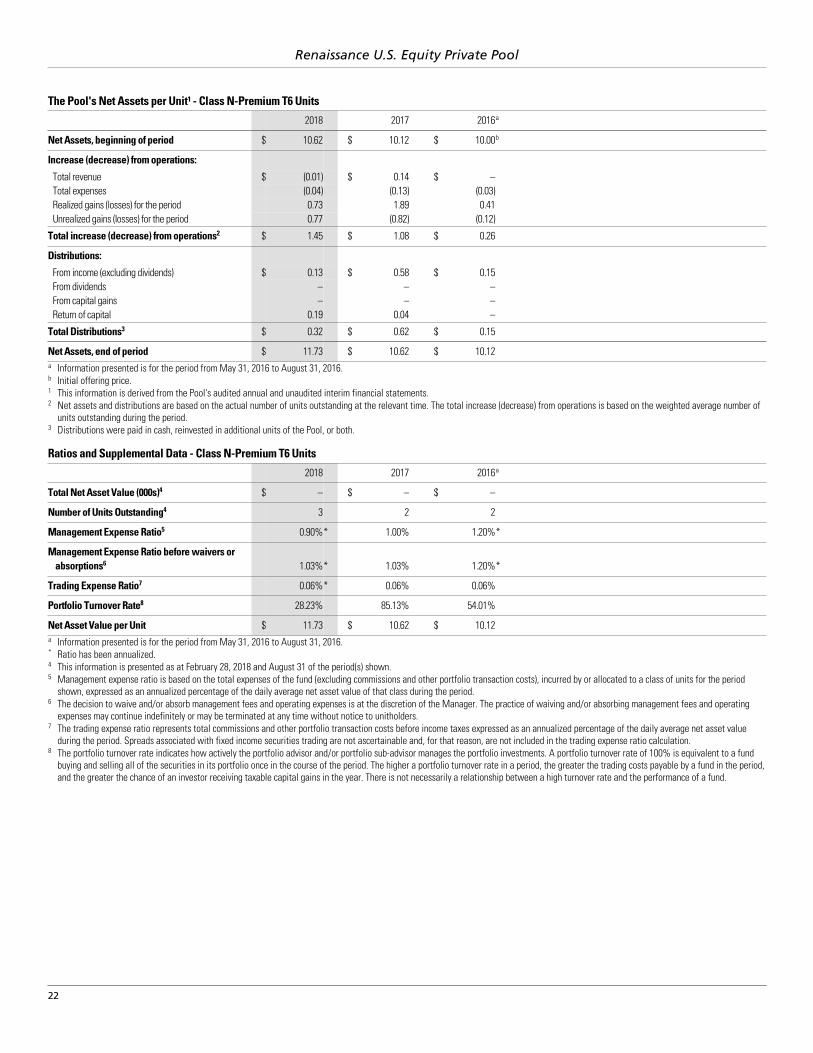
22
Renaissance U.S. Equity Private Pool
The Pool's Net Assets per Unit¹ - Class N-Premium T6 Units
2018 2017 2016a
Net Assets, beginning of period $ 10.62 $ 10.12 $ 10.00b
Increase (decrease) from operations:
Total revenue $ (0.01) $ 0.14 $ –
Total expenses (0.04) (0.13) (0.03)
Realized gains (losses) for the period 0.73 1.89 0.41
Unrealized gains (losses) for the period 0.77 (0.82) (0.12)
Total increase (decrease) from operations2
$ 1.45 $ 1.08 $ 0.26
Distributions:
From income (excluding dividends) $ 0.13 $ 0.58 $ 0.15
Fromdividends – – –
From capital gains – – –
Return of capital 0.19 0.04 –
Total Distributions3
$ 0.32 $ 0.62 $ 0.15
Net Assets, end of period $ 11.73 $ 10.62 $ 10.12
aInformation presented is for the period from May 31, 2016 to August 31, 2016.
bInitial offering price.
1This information is derived from the Pool's audited annual and unaudited interim financial statements.
2Net assets and distributions are based on the actual number of units outstanding at the relevant time. The total increase (decrease) from operations is based on the weighted average number of
units outstanding during the period.
3Distributions were paid in cash, reinvested in additional units of the Pool, or both.
Ratios and Supplemental Data - Class N-Premium T6 Units
2018 2017 2016a
Total Net Asset Value (000s)4
$ – $ – $ –
Number of Units Outstanding4
3 2 2
Management Expense Ratio5
0.90%* 1.00% 1.20%*
Management Expense Ratio before waivers or
absorptions6
1.03%* 1.03% 1.20%*
Trading Expense Ratio7
0.06%* 0.06% 0.06%
Portfolio Turnover Rate8
28.23% 85.13% 54.01%
Net Asset Value per Unit $ 11.73 $ 10.62 $ 10.12
aInformation presented is for the period from May 31, 2016 to August 31, 2016.
*Ratio has been annualized.
4This information is presented as at February 28, 2018 and August 31 of the period(s) shown.
5Management expense ratio is based on the total expenses of the fund (excluding commissions and other portfolio transaction costs), incurred by or allocated to a class of units for the period
shown, expressed as an annualized percentage of the daily average net asset value of that class during the period.
6The decision to waive and/or absorb management fees and operating expenses is at the discretion of the Manager. The practice of waiving and/or absorbing management fees and operating
expenses may continue indefinitely or may be terminated at any time without notice to unitholders.
7The trading expense ratio represents total commissions and other portfolio transaction costs before income taxes expressed as an annualized percentage of the daily average net asset value
during the period. Spreads associated with fixed income securities trading are not ascertainable and, for that reason, are not included in the trading expense ratio calculation.
8The portfolio turnover rate indicates how actively the portfolio advisor and/or portfolio sub-advisor manages the portfolio investments. A portfolio turnover rate of 100% is equivalent to a fund
buying and selling all of the securities in its portfolio once in the course of the period. The higher a portfolio turnover rate in a period, the greater the trading costs payable by a fund in the period,
and the greater the chance of an investor receiving taxable capital gains in the year. There is not necessarily a relationship between a high turnover rate and the performance of a fund.

23
Renaissance U.S. Equity Private Pool
The Pool's Net Assets per Unit¹ - Class NH-Premium Units
2018 2017 2016a
Net Assets, beginning of period $ 11.41 $ 10.23 $ 10.00b
Increase (decrease) from operations:
Total revenue $ 0.11 $ 0.31 $ 0.03
Total expenses (0.10) (0.15) (0.03)
Realized gains (losses) for the period 0.76 1.72 0.38
Unrealized gains (losses) for the period 0.35 (0.60) (0.16)
Total increase (decrease) from operations2
$ 1.12 $ 1.28 $ 0.22
Distributions:
From income (excluding dividends) $ 0.05 $ 0.10 $ –
Fromdividends – – –
From capital gains – – –
Return of capital – – –
Total Distributions3
$ 0.05 $ 0.10 $ –
Net Assets, end of period $ 12.49 $ 11.41 $ 10.23
aInformation presented is for the period from May 31, 2016 to August 31, 2016.
bInitial offering price.
1This information is derived from the Pool's audited annual and unaudited interim financial statements.
2Net assets and distributions are based on the actual number of units outstanding at the relevant time. The total increase (decrease) from operations is based on the weighted average number of
units outstanding during the period.
3Distributions were paid in cash, reinvested in additional units of the Pool, or both.
Ratios and Supplemental Data - Class NH-Premium Units
2018 2017 2016a
Total Net Asset Value (000s)4
$ – $ – $ –
Number of Units Outstanding4
1 1 1
Management Expense Ratio5
0.90%* 1.00% 1.20%*
Management Expense Ratio before waivers or
absorptions6
1.03%* 1.03% 1.20%*
Trading Expense Ratio7
0.06%* 0.06% 0.06%
Portfolio Turnover Rate8
28.23% 85.13% 54.01%
Net Asset Value per Unit $ 12.49 $ 11.41 $ 10.23
aInformation presented is for the period from May 31, 2016 to August 31, 2016.
*Ratio has been annualized.
4This information is presented as at February 28, 2018 and August 31 of the period(s) shown.
5Management expense ratio is based on the total expenses of the fund (excluding commissions and other portfolio transaction costs), incurred by or allocated to a class of units for the period
shown, expressed as an annualized percentage of the daily average net asset value of that class during the period.
6The decision to waive and/or absorb management fees and operating expenses is at the discretion of the Manager. The practice of waiving and/or absorbing management fees and operating
expenses may continue indefinitely or may be terminated at any time without notice to unitholders.
7The trading expense ratio represents total commissions and other portfolio transaction costs before income taxes expressed as an annualized percentage of the daily average net asset value
during the period. Spreads associated with fixed income securities trading are not ascertainable and, for that reason, are not included in the trading expense ratio calculation.
8The portfolio turnover rate indicates how actively the portfolio advisor and/or portfolio sub-advisor manages the portfolio investments. A portfolio turnover rate of 100% is equivalent to a fund
buying and selling all of the securities in its portfolio once in the course of the period. The higher a portfolio turnover rate in a period, the greater the trading costs payable by a fund in the period,
and the greater the chance of an investor receiving taxable capital gains in the year. There is not necessarily a relationship between a high turnover rate and the performance of a fund.

24
Renaissance U.S. Equity Private Pool
The Pool's Net Assets per Unit¹ - Class NH-Premium T4 Units
2018 2017 2016a
Net Assets, beginning of period $ 10.85 $ 10.14 $ 10.00b
Increase (decrease) from operations:
Total revenue $ 0.06 $ 0.30 $ 0.03
Total expenses (0.07) (0.15) (0.03)
Realized gains (losses) for the period 0.71 1.68 0.38
Unrealized gains (losses) for the period 0.35 (0.59) (0.16)
Total increase (decrease) from operations2
$ 1.05 $ 1.24 $ 0.22
Distributions:
From income (excluding dividends) $ 0.09 $ 0.49 $ 0.10
Fromdividends – – –
From capital gains – – –
Return of capital 0.12 – –
Total Distributions3
$ 0.21 $ 0.49 $ 0.10
Net Assets, end of period $ 11.68 $ 10.85 $ 10.14
aInformation presented is for the period from May 31, 2016 to August 31, 2016.
bInitial offering price.
1This information is derived from the Pool's audited annual and unaudited interim financial statements.
2Net assets and distributions are based on the actual number of units outstanding at the relevant time. The total increase (decrease) from operations is based on the weighted average number of
units outstanding during the period.
3Distributions were paid in cash, reinvested in additional units of the Pool, or both.
Ratios and Supplemental Data - Class NH-Premium T4 Units
2018 2017 2016a
Total Net Asset Value (000s)4
$ – $ – $ –
Number of Units Outstanding4
1 1 1
Management Expense Ratio5
0.90%* 1.00% 1.20%*
Management Expense Ratio before waivers or
absorptions6
1.03%* 1.03% 1.20%*
Trading Expense Ratio7
0.06%* 0.06% 0.06%
Portfolio Turnover Rate8
28.23% 85.13% 54.01%
Net Asset Value per Unit $ 11.68 $ 10.85 $ 10.14
aInformation presented is for the period from May 31, 2016 to August 31, 2016.
*Ratio has been annualized.
4This information is presented as at February 28, 2018 and August 31 of the period(s) shown.
5Management expense ratio is based on the total expenses of the fund (excluding commissions and other portfolio transaction costs), incurred by or allocated to a class of units for the period
shown, expressed as an annualized percentage of the daily average net asset value of that class during the period.
6The decision to waive and/or absorb management fees and operating expenses is at the discretion of the Manager. The practice of waiving and/or absorbing management fees and operating
expenses may continue indefinitely or may be terminated at any time without notice to unitholders.
7The trading expense ratio represents total commissions and other portfolio transaction costs before income taxes expressed as an annualized percentage of the daily average net asset value
during the period. Spreads associated with fixed income securities trading are not ascertainable and, for that reason, are not included in the trading expense ratio calculation.
8The portfolio turnover rate indicates how actively the portfolio advisor and/or portfolio sub-advisor manages the portfolio investments. A portfolio turnover rate of 100% is equivalent to a fund
buying and selling all of the securities in its portfolio once in the course of the period. The higher a portfolio turnover rate in a period, the greater the trading costs payable by a fund in the period,
and the greater the chance of an investor receiving taxable capital gains in the year. There is not necessarily a relationship between a high turnover rate and the performance of a fund.

25
Renaissance U.S. Equity Private Pool
The Pool's Net Assets per Unit¹ - Class NH-Premium T6 Units
2018 2017 2016a
Net Assets, beginning of period $ 10.74 $ 10.08 $ 10.00b
Increase (decrease) from operations:
Total revenue $ 0.09 $ 0.31 $ 0.03
Total expenses (0.08) (0.15) (0.03)
Realized gains (losses) for the period 0.71 1.66 0.38
Unrealized gains (losses) for the period 0.31 (0.57) (0.16)
Total increase (decrease) from operations2
$ 1.03 $ 1.25 $ 0.22
Distributions:
From income (excluding dividends) $ 0.13 $ 0.57 $ 0.15
Fromdividends – – –
From capital gains – – –
Return of capital 0.18 0.03 –
Total Distributions3
$ 0.31 $ 0.60 $ 0.15
Net Assets, end of period $ 11.48 $ 10.74 $ 10.08
aInformation presented is for the period from May 31, 2016 to August 31, 2016.
bInitial offering price.
1This information is derived from the Pool's audited annual and unaudited interim financial statements.
2Net assets and distributions are based on the actual number of units outstanding at the relevant time. The total increase (decrease) from operations is based on the weighted average number of
units outstanding during the period.
3Distributions were paid in cash, reinvested in additional units of the Pool, or both.
Ratios and Supplemental Data - Class NH-Premium T6 Units
2018 2017 2016a
Total Net Asset Value (000s)4
$ – $ – $ –
Number of Units Outstanding4
1 1 1
Management Expense Ratio5
0.90%* 1.00% 1.20%*
Management Expense Ratio before waivers or
absorptions6
1.03%* 1.03% 1.20%*
Trading Expense Ratio7
0.06%* 0.06% 0.06%
Portfolio Turnover Rate8
28.23% 85.13% 54.01%
Net Asset Value per Unit $ 11.48 $ 10.74 $ 10.08
aInformation presented is for the period from May 31, 2016 to August 31, 2016.
*Ratio has been annualized.
4This information is presented as at February 28, 2018 and August 31 of the period(s) shown.
5Management expense ratio is based on the total expenses of the fund (excluding commissions and other portfolio transaction costs), incurred by or allocated to a class of units for the period
shown, expressed as an annualized percentage of the daily average net asset value of that class during the period.
6The decision to waive and/or absorb management fees and operating expenses is at the discretion of the Manager. The practice of waiving and/or absorbing management fees and operating
expenses may continue indefinitely or may be terminated at any time without notice to unitholders.
7The trading expense ratio represents total commissions and other portfolio transaction costs before income taxes expressed as an annualized percentage of the daily average net asset value
during the period. Spreads associated with fixed income securities trading are not ascertainable and, for that reason, are not included in the trading expense ratio calculation.
8The portfolio turnover rate indicates how actively the portfolio advisor and/or portfolio sub-advisor manages the portfolio investments. A portfolio turnover rate of 100% is equivalent to a fund
buying and selling all of the securities in its portfolio once in the course of the period. The higher a portfolio turnover rate in a period, the greater the trading costs payable by a fund in the period,
and the greater the chance of an investor receiving taxable capital gains in the year. There is not necessarily a relationship between a high turnover rate and the performance of a fund.

26
Renaissance U.S. Equity Private Pool
The Pool's Net Assets per Unit¹ - Class O Units
2018 2017 2016 2015 2014 2013
Net Assets, beginning of period $ 22.47 $ 20.10 $ 18.90 $ 15.47 $ 12.33 $ 9.75
Increase (decrease) from operations:
Total revenue $ 0.10 $ 0.46 $ 0.35 $ 0.37 $ 0.25 $ 0.19
Total expenses (0.03) (0.06) (0.06) (0.05) (0.04) –
Realized gains (losses) for the period 1.57 3.81 2.42 3.79 2.04 1.28
Unrealized gains (losses) for the period 1.70 (1.50) (1.19) (0.32) 1.06 1.22
Total increase (decrease) from operations2
$ 3.34 $ 2.71 $ 1.52 $ 3.79 $ 3.31 $ 2.69
Distributions:
From income (excluding dividends) $ 0.29 $ 0.23 $ 0.24 $ 0.20 $ 0.12 $ 0.10
Fromdividends – – – – – 0.01
From capital gains – – – – – –
Return of capital – – – – – –
Total Distributions3
$ 0.29 $ 0.23 $ 0.24 $ 0.20 $ 0.12 $ 0.11
Net Assets, end of period $ 25.47 $ 22.47 $ 20.10 $ 18.90 $ 15.47 $ 12.32
1This information is derived from the Pool's audited annual and unaudited interim financial statements. The Pool adopted IFRS on September 1, 2014. Previously, the Pool prepared its financial
statements in accordance with Canadian Generally Accepted Accounting Principles (GAAP) as defined in Part V of the CPA Canada Handbook. Under Canadian GAAP, the Pool measured fair
values of its investments in accordance with CICA Handbook Section 3855 which required the use of bid prices for long positions and ask prices for short positions. As such, the net assets per
unit figure presented in the financial statements differs from the net asset value calculated for fund pricing purposes. An explanation of these differences can be found in the notes to the
financial statements prior to September 1, 2014. Upon adoption of IFRS, the Pool measures the fair value of its investments by using the close market prices, where the close market price falls
within the bid-ask spread. As such, the Pool's accounting policies for measuring the fair value of investments in the financial statements are consistent with those used in measuring the net asset
value for transactions with unitholders. Accordingly, the opening net asset figure as at September 1, 2013 reflects the adjusted amount in accordance with IFRS. All figures presented for periods
prior to September 1, 2013 were prepared in accordance with Canadian GAAP.
2Net assets and distributions are based on the actual number of units outstanding at the relevant time. The total increase (decrease) from operations is based on the weighted average number of
units outstanding during the period.
3Distributions were paid in cash, reinvested in additional units of the Pool, or both.
Ratios and Supplemental Data - Class O Units
2018 2017 2016 2015 2014 2013
Total Net Asset Value (000s)4
$ 147,223 $ 143,782 $ 148,742 $ 154,721 $ 155,081 $ 136,005
Number of Units Outstanding4
5,780,017 6,397,981 7,400,188 8,186,592 10,025,349 11,032,915
Management Expense Ratio5
0.00%* 0.00% 0.00% 0.00% 0.00% 0.00%
Management Expense Ratio before waivers or
absorptions6
0.05%* 0.06% 0.03% 0.03% 0.02% 0.02%
Trading Expense Ratio7
0.06%* 0.06% 0.06% 0.06% 0.05% 0.11%
Portfolio Turnover Rate8
28.23% 85.13% 54.01% 56.31% 44.90% 82.46%
Net Asset Value per Unit $ 25.47 $ 22.47 $ 20.10 $ 18.90 $ 15.47 $ 12.33
*Ratio has been annualized.
4This information is presented as at February 28, 2018 and August 31 of the period(s) shown.
5Management expense ratio is based on the total expenses of the fund (excluding commissions and other portfolio transaction costs), incurred by or allocated to a class of units for the period
shown, expressed as an annualized percentage of the daily average net asset value of that class during the period.
6The decision to waive and/or absorb management fees and operating expenses is at the discretion of the Manager. The practice of waiving and/or absorbing management fees and operating
expenses may continue indefinitely or may be terminated at any time without notice to unitholders.
7The trading expense ratio represents total commissions and other portfolio transaction costs before income taxes expressed as an annualized percentage of the daily average net asset value
during the period. Spreads associated with fixed income securities trading are not ascertainable and, for that reason, are not included in the trading expense ratio calculation.
8The portfolio turnover rate indicates how actively the portfolio advisor and/or portfolio sub-advisor manages the portfolio investments. A portfolio turnover rate of 100% is equivalent to a fund
buying and selling all of the securities in its portfolio once in the course of the period. The higher a portfolio turnover rate in a period, the greater the trading costs payable by a fund in the period,
and the greater the chance of an investor receiving taxable capital gains in the year. There is not necessarily a relationship between a high turnover rate and the performance of a fund.

27
Renaissance U.S. Equity Private Pool
The Pool's Net Assets per Unit¹ - Class OH Units
2018 2017 2016a
Net Assets, beginning of period $ 11.58 $ 10.25 $ 10.00b
Increase (decrease) from operations:
Total revenue $ 0.10 $ 0.35 $ 0.03
Total expenses (0.03) (0.05) (0.01)
Realized gains (losses) for the period 0.80 1.74 0.38
Unrealized gains (losses) for the period 0.39 (0.59) (0.16)
Total increase (decrease) from operations2
$ 1.26 $ 1.45 $ 0.24
Distributions:
From income (excluding dividends) $ 0.13 $ 0.11 $ –
Fromdividends – – –
From capital gains – – –
Return of capital – – –
Total Distributions3
$ 0.13 $ 0.11 $ –
Net Assets, end of period $ 12.72 $ 11.58 $ 10.25
aInformation presented is for the period from May 31, 2016 to August 31, 2016.
bInitial offering price.
1This information is derived from the Pool's audited annual and unaudited interim financial statements.
2Net assets and distributions are based on the actual number of units outstanding at the relevant time. The total increase (decrease) from operations is based on the weighted average number of
units outstanding during the period.
3Distributions were paid in cash, reinvested in additional units of the Pool, or both.
Ratios and Supplemental Data - Class OH Units
2018 2017 2016a
Total Net Asset Value (000s)4
$ – $ – $ –
Number of Units Outstanding4
1 1 1
Management Expense Ratio5
0.00%* 0.00% 0.00%*
Management Expense Ratio before waivers or
absorptions6
0.00%* 0.00% 0.00%*
Trading Expense Ratio7
0.06%* 0.06% 0.06%
Portfolio Turnover Rate8
28.23% 85.13% 54.01%
Net Asset Value per Unit $ 12.72 $ 11.58 $ 10.25
aInformation presented is for the period from May 31, 2016 to August 31, 2016.
*Ratio has been annualized.
4This information is presented as at February 28, 2018 and August 31 of the period(s) shown.
5Management expense ratio is based on the total expenses of the fund (excluding commissions and other portfolio transaction costs), incurred by or allocated to a class of units for the period
shown, expressed as an annualized percentage of the daily average net asset value of that class during the period.
6The decision to waive and/or absorb management fees and operating expenses is at the discretion of the Manager. The practice of waiving and/or absorbing management fees and operating
expenses may continue indefinitely or may be terminated at any time without notice to unitholders.
7The trading expense ratio represents total commissions and other portfolio transaction costs before income taxes expressed as an annualized percentage of the daily average net asset value
during the period. Spreads associated with fixed income securities trading are not ascertainable and, for that reason, are not included in the trading expense ratio calculation.
8The portfolio turnover rate indicates how actively the portfolio advisor and/or portfolio sub-advisor manages the portfolio investments. A portfolio turnover rate of 100% is equivalent to a fund
buying and selling all of the securities in its portfolio once in the course of the period. The higher a portfolio turnover rate in a period, the greater the trading costs payable by a fund in the period,
and the greater the chance of an investor receiving taxable capital gains in the year. There is not necessarily a relationship between a high turnover rate and the performance of a fund..

28
Renaissance U.S. Equity Private Pool
Management Fees
The Pool pays CAMI an annual management fee to cover the costs of managing the Pool. Management fees are based on the net asset value of
the Pool and are calculated daily and paid monthly. Management fees are paid to CAMI in consideration for providing, or arranging for the provision
of, management, distribution, and portfolio advisory services. Advertising and promotional expenses, office overhead expenses, trailing
commissions, and the fees of the sub-advisors are paid by CAMI out of the management fees received from the Pool. The Pool is required to pay
applicable taxes on the management fees paid to CAMI. Refer to the simplified prospectus for the annual management fee rate.
For Class O units, the management fee is negotiated with and paid by, or as directed by, unitholders or dealers and discretionary managers on
behalf of unitholders. Such Class O management fee will not exceed the Class F-Premium unit management fee rate.
The following table shows a breakdown of the services received in consideration of the management fees, as a percentage of the management
fees collected from the Pool for the period ended February 28, 2018. These amounts do not include waived fees or absorbed expenses.
Class A Units Premium Class Units
Premium-T4 Class
Units
Premium-T6 Class
Units
Class H-Premium
Units
Class H-Premium T4
Units
Class H-Premium T6
Units
Sales and trailing commissions
paid to dealers 51.83% 54.42% 0.00% 0.00% 0.00% 0.00% 0.00%
General administration,
investment advice, and profit 48.17% 45.58% 100.00% 100.00% 100.00% 100.00% 100.00%
.
Class C Units Class I Units
Class F-Premium
Units
Class F-Premium T4
Units
Class F-Premium T6
Units
Class FH-Premium
Units
Class FH-Premium
T4 Units
Sales and trailing commissions
paid to dealers 50.86% 0.00% 0.00% 0.00% 0.00% 0.00% 0.00%
General administration,
investment advice, and profit 49.14% 100.00% 100.00% 100.00% 100.00% 100.00% 100.00%
.
Class FH-Premium
T6 Units
Class N-Premium
Units
Class N-Premium
T4 Units
Class N-Premium T6
Units
Class NH-Premium
Units
Class NH-Premium
T4 Units
Class NH-Premium
T6 Units
Sales and trailing commissions
paid to dealers 0.00% 0.00% 0.00% 0.00% 0.00% 0.00% 0.00%
General administration,
investment advice, and profit 100.00% 100.00% 100.00% 100.00% 100.00% 100.00% 100.00%
.
.
Past Performance
The performance data provided assumes reinvestment of distributions only and does not take into account sales, redemption, distribution, or other
optional charges payable by any unitholder that would have reduced returns. Past performance does not necessarily indicate how a fund will
perform in the future.
The Pool’s returns are after the deduction of fees and expenses, and the difference in returns between classes of units is primarily due to
differences in the management expense ratio. See Financial Highlights for the management expense ratio.
.
Year-by-Year Returns
These bar charts show the annual performance of each class of units of the Pool for each of the periods shown, and illustrate how the performance
has changed from period to period. The bar charts show, in percentage terms, how much an investment made on September 1 would have
increased or decreased by August 31, unless otherwise indicated.

29
Renaissance U.S. Equity Private Pool
Class A Units
-15.5%
-19.8%
0.9%
5.8% 6.3%
24.2% 23.1%20.2%
4.6%
10.5%13.4%
08 09 10 11 12 13 14 15 16 17 18a
40%
20%
0%
-20%
-40%
a2018 return is for the period from September 1, 2017 to February 28, 2018.
Premium Class Units
2.8%
10.8%
13.6%
16a
17 18b
20%
15%
10%
5%
0%
a2016 return is for the period from May 31, 2016 to August 31, 2016.
b2018 return is for the period from September 1, 2017 to February 28, 2018.
Premium-T4 Class Units
2.5%
9.6%
12.8%
16a
17 18b
20%
15%
10%
5%
0%
a2016 return is for the period from May 31, 2016 to August 31, 2016.
b2018 return is for the period from September 1, 2017 to February 28, 2018.

30
Renaissance U.S. Equity Private Pool
Premium-T6 Class Units
2.5%
9.9%
12.8%
16a
17 18b
20%
15%
10%
5%
0%
a2016 return is for the period from May 31, 2016 to August 31, 2016.
b2018 return is for the period from September 1, 2017 to February 28, 2018.
Class H-Premium Units
2.1%
11.7%
9.5%
16a
17 18b
20%
15%
10%
5%
0%
a2016 return is for the period from May 31, 2016 to August 31, 2016.
b2018 return is for the period from September 1, 2017 to February 28, 2018.
Class H-Premium T4 Units
2.2%
11.7%
8.5%
16a
17 18b
20%
15%
10%
5%
0%
a2016 return is for the period from May 31, 2016 to August 31, 2016.
b2018 return is for the period from September 1, 2017 to February 28, 2018.

31
Renaissance U.S. Equity Private Pool
Class H-Premium T6 Units
2.1%
11.7%
9.3%
16a
17 18b
20%
15%
10%
5%
0%
a2016 return is for the period from May 31, 2016 to August 31, 2016.
b2018 return is for the period from September 1, 2017 to February 28, 2018.
Class C Units
-15.0%
-19.3%
1.6%
6.6% 7.1%
25.1% 24.0%21.0%
5.4%
10.7%13.5%
08 09 10 11 12 13 14 15 16 17 18a
40%
20%
0%
-20%
-40%
a2018 return is for the period from September 1, 2017 to February 28, 2018.
Class I Units
-14.1%
-18.3%
2.7%
7.8% 8.4%
26.5% 25.4%22.4%
6.7%
12.0%14.1%
08 09 10 11 12 13 14 15 16 17 18a
40%
20%
0%
-20%
-40%
a2018 return is for the period from September 1, 2017 to February 28, 2018.

32
Renaissance U.S. Equity Private Pool
Class F-Premium Units
2.9%
11.9%
14.2%
16a
17 18b
20%
15%
10%
5%
0%
a2016 return is for the period from May 31, 2016 to August 31, 2016.
b2018 return is for the period from September 1, 2017 to February 28, 2018.
Class F-Premium T4 Units
2.7%
10.6%
13.7%
16a
17 18b
20%
15%
10%
5%
0%
a2016 return is for the period from May 31, 2016 to August 31, 2016.
b2018 return is for the period from September 1, 2017 to February 28, 2018.
Class F-Premium T6 Units
2.7%
11.2%
12.5%
16a
17 18b
20%
15%
10%
5%
0%
a2016 return is for the period from May 31, 2016 to August 31, 2016.
b2018 return is for the period from September 1, 2017 to February 28, 2018.

33
Renaissance U.S. Equity Private Pool
Class FH-Premium Units
2.3%
14.2%
10.7%
16a
17 18b
20%
15%
10%
5%
0%
a2016 return is for the period from May 31, 2016 to August 31, 2016.
b2018 return is for the period from September 1, 2017 to February 28, 2018.
Class FH-Premium T4 Units
2.4%
12.1%
9.6%
16a
17 18b
20%
15%
10%
5%
0%
a2016 return is for the period from May 31, 2016 to August 31, 2016.
b2018 return is for the period from September 1, 2017 to February 28, 2018.
Class FH-Premium T6 Units
1.8%
12.7%
9.6%
16a
17 18b
20%
15%
10%
5%
0%
a2016 return is for the period from May 31, 2016 to August 31, 2016.
b2018 return is for the period from September 1, 2017 to February 28, 2018.

34
Renaissance U.S. Equity Private Pool
Class N-Premium Units
2.7%
11.2%
13.8%
16a
17 18b
20%
15%
10%
5%
0%
a2016 return is for the period from May 31, 2016 to August 31, 2016.
b2018 return is for the period from September 1, 2017 to February 28, 2018.
Class N-Premium T4 Units
2.7%
10.6%
13.7%
16a
17 18b
20%
15%
10%
5%
0%
a2016 return is for the period from May 31, 2016 to August 31, 2016.
b2018 return is for the period from September 1, 2017 to February 28, 2018.
Class N-Premium T6 Units
2.7%
11.2%
13.7%
16a
17 18b
20%
15%
10%
5%
0%
a2016 return is for the period from May 31, 2016 to August 31, 2016.
b2018 return is for the period from September 1, 2017 to February 28, 2018.
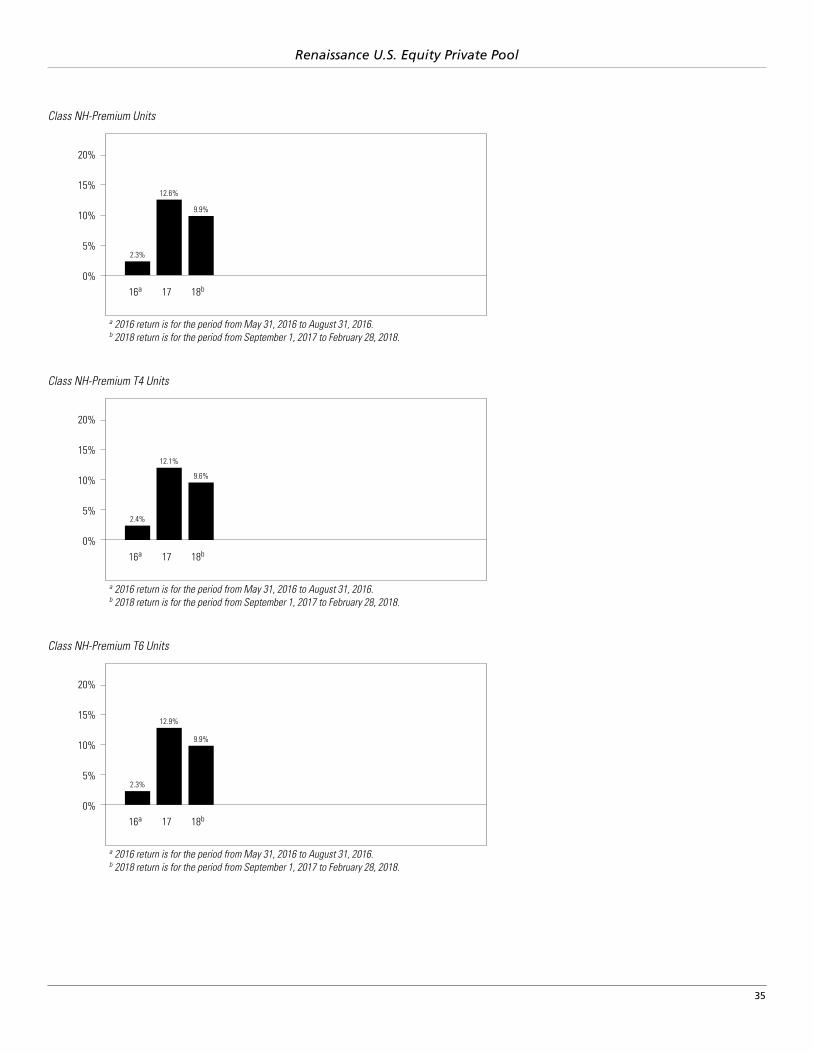
35
Renaissance U.S. Equity Private Pool
Class NH-Premium Units
2.3%
12.6%
9.9%
16a
17 18b
20%
15%
10%
5%
0%
a2016 return is for the period from May 31, 2016 to August 31, 2016.
b2018 return is for the period from September 1, 2017 to February 28, 2018.
Class NH-Premium T4 Units
2.4%
12.1%
9.6%
16a
17 18b
20%
15%
10%
5%
0%
a2016 return is for the period from May 31, 2016 to August 31, 2016.
b2018 return is for the period from September 1, 2017 to February 28, 2018.
Class NH-Premium T6 Units
2.3%
12.9%
9.9%
16a
17 18b
20%
15%
10%
5%
0%
a2016 return is for the period from May 31, 2016 to August 31, 2016.
b2018 return is for the period from September 1, 2017 to February 28, 2018.

36
Renaissance U.S. Equity Private Pool
Class O Units
-13.3%
-17.7%
3.6%
8.8% 9.4%
27.7% 26.6%23.6%
7.6%
13.1%14.7%
08 09 10 11 12 13 14 15 16 17 18a
40%
20%
0%
-20%
-40%
a2018 return is for the period from September 1, 2017 to February 28, 2018.
Class OH Units
2.5%
14.2%
11.0%
16a
17 18b
20%
15%
10%
5%
0%
a2016 return is for the period from May 31, 2016 to August 31, 2016.
b2018 return is for the period from September 1, 2017 to February 28, 2018.
.
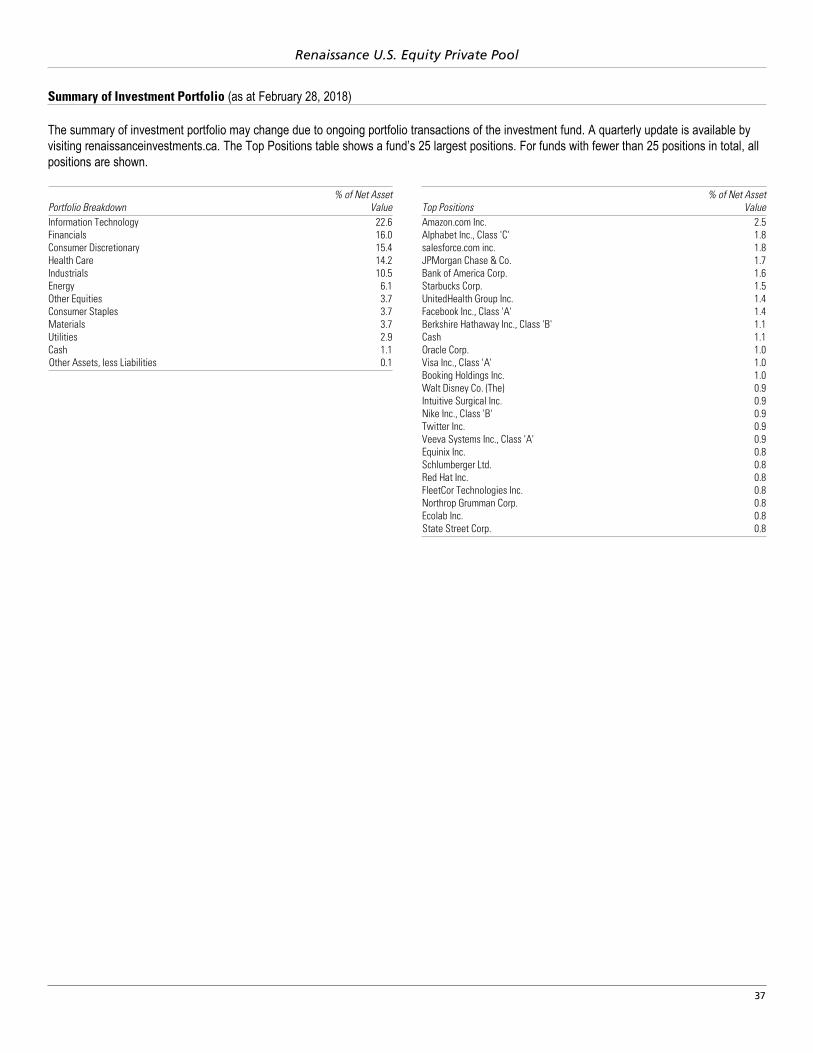
37
Renaissance U.S. Equity Private Pool.
.
.
.
.
.
.
.
.
.
Summary of Investment Portfolio (as at February 28, 2018).
The summary of investment portfolio may change due to ongoing portfolio transactions of the investment fund. A quarterly update is available by
visiting renaissanceinvestments.ca. The Top Positions table shows a fund’s 25 largest positions. For funds with fewer than 25 positions in total, all
positions are shown.
x
Portfolio Breakdown
% of Net Asset
Value
Information Technology 22.6
Financials 16.0
Consumer Discretionary 15.4
Health Care 14.2
Industrials 10.5
Energy 6.1
Other Equities 3.7
Consumer Staples 3.7
Materials 3.7
Utilities 2.9
Cash 1.1
Other Assets, less Liabilities 0.1
x
Top Positions
% of Net Asset
Value
Amazon.com Inc. 2.5
Alphabet Inc., Class 'C' 1.8
salesforce.com inc. 1.8
JPMorgan Chase & Co. 1.7
Bank of America Corp. 1.6
Starbucks Corp. 1.5
UnitedHealth Group Inc. 1.4
Facebook Inc., Class 'A' 1.4
Berkshire Hathaway Inc., Class 'B' 1.1
Cash 1.1
Oracle Corp. 1.0
Visa Inc., Class 'A' 1.0
Booking Holdings Inc. 1.0
Walt Disney Co. (The) 0.9
Intuitive Surgical Inc. 0.9
Nike Inc., Class 'B' 0.9
Twitter Inc. 0.9
Veeva Systems Inc., Class 'A' 0.9
Equinix Inc. 0.8
Schlumberger Ltd. 0.8
Red Hat Inc. 0.8
FleetCor Technologies Inc. 0.8
Northrop Grumman Corp. 0.8
Ecolab Inc. 0.8
State Street Corp. 0.8

A note on forward-looking statements
The management report of fund performance may contain forward-looking statements. Forward-looking statements include statements that are predictive in nature,
that depend upon or refer to future events or conditions, or that include words such as “expects”, “anticipates”, “intends”, “plans”, “believes”, “estimates”, or other
similar wording. In addition, any statements that may be made concerning future performance, strategies, or prospects and possible future actions taken by the
fund, are also forward-looking statements. Forward-looking statements are not guarantees of future performance. These statements involve known and unknown
risks, uncertainties, and other factors that may cause the actual results and achievements of the fund to differ materially from those expressed or implied by such
statements. Such factors include, but are not limited to: general economic, market, and business conditions; fluctuations in securities prices, interest rates, and
foreign currency exchange rates; changes in government regulations; and catastrophic events.
The above list of important factors that may affect future results is not exhaustive. Before making any investment decisions, we encourage you to consider these
and other factors carefully. CIBC Asset Management Inc. does not undertake, and specifically disclaims, any obligation to update or revise any forward-looking
statements, whether as a result of new information, future developments, or otherwise prior to the release of the next management report of fund performance.

Renaissance Investments
1500 Robert-Bourassa Boulevard, Suite 800
Montreal, Quebec
H3A 3S6
1-888-888-3863
Website
renaissanceinvestments.ca
CIBC Asset Management Inc., the manager and trustee of the Renaissance Private Pools, is a wholly-owned subsidiary of Canadian Imperial Bank of Commerce. Please read the
Renaissance Private Pools simplified prospectus before investing. To obtain a copy of the simplified prospectus, call 1-888-888-3863, email us at [email protected], or
ask your advisor.
Renaissance Investments® and Renaissance Private Pools® are registered trademarks of CIBC Asset Management Inc.
Renaissance Investments is offered by CIBC Asset Management Inc.
55-128 (201802)