Renaissance Services SAOG and its Subsidiary · PDF fileRenaissance Services SAOG and its...
49
Renaissance Services SAOG and its Subsidiary Companies CONSOLIDATED FINANCIAL STATEMENTS 31 DECEMBER 2010
Transcript of Renaissance Services SAOG and its Subsidiary · PDF fileRenaissance Services SAOG and its...

Renaissance Services SAOG
and its Subsidiary Companies
CONSOLIDATED FINANCIAL STATEMENTS
31 DECEMBER 2010

Renaissance Services SAOG (Parent Company)
NOTES TO THE CONSOLIDATED FINANCIAL STATEMENTS At 31 December 2010
- 22 -
Registered Office
Renaissance Services SAOG
PO Box 1676
Muttrah
Postal Code 114
Sultanate of Oman

Renaissance Services SAOG and its Subsidiary Companies Consolidated financial statements
31 December 2010
Contents Page
Report of the Auditors 1
Consolidated statement of comprehensive income 2
Consolidated statement of financial position 3
Consolidated statement of cash flows 4
Consolidated statement of changes in equity 5-6
Notes to the consolidated financial statements 7 to 46

INDEPENDENT AUDITOR’S REPORT TO THE SHAREHOLDERS OF
RENAISSANCE SERVICES SAOG Report on the financial statements We have audited the financial statements of Renaissance Services SAOG (“the Company”), and its subsidiaries (“the Group”) which comprise the consolidated statement of financial position as at 31 December 2010, and the related consolidated statements of comprehensive income, changes in equity and cash flows for the year then ended, and a summary of significant accounting policies and other explanatory notes set out in the notes 1 to 32. Management’s responsibility for the financial statements The Management is responsible for the preparation and fair presentation of these financial statements in accordance with International Financial Reporting Standards, the disclosure requirements of the Capital Market Authority and the Commercial Companies Law of 1974, as amended, and for such internal control as management determines is necessary to enable the preparation of financial statements that are free from material misstatement, whether due to fraud or error. Auditors’ responsibility Our responsibility is to express an opinion on these financial statements based on our audit. We conducted our audit in accordance with International Standards on Auditing. Those standards require that we comply with relevant ethical requirements and plan and perform the audit to obtain reasonable assurance whether the financial statements are free of material misstatement. An audit involves performing procedures to obtain audit evidence about the amounts and disclosures in the financial statements. The procedures selected depend on our judgment, including the assessment of the risks of material misstatement of the financial statements, whether due to fraud or error. In making those risk assessments, we consider internal control relevant to the entity‟s preparation and fair presentation of the financial statements in order to design audit procedures that are appropriate in the circumstances, but not for the purpose of expressing an opinion on the effectiveness of the entity‟s internal control. An audit also includes evaluating the appropriateness of accounting principles used and the reasonableness of accounting estimates made by the Group‟s Management, as well as evaluating the overall presentation of the financial statements. We believe that the audit evidence we have obtained is sufficient and appropriate to provide a basis for our opinion. Opinion In our opinion, the financial statements present fairly, in all material respects, the financial position of the Group as at 31 December 2010 and its financial performance and its cash flows for the year then ended in accordance with International Financial Reporting Standards. Report on other legal and regulatory requirements In our opinion, the financial statements of the Group as at and for the year then ended on 31 December 2010, in all material respects, comply with: the relevant disclosure requirements of the Capital Market Authority; and the Commercial Companies Law of 1974, as amended.

Renaissance Services SAOG and its Subsidiary Companies
CONSOLIDATED STATEMENT OF COMPREHENSIVE INCOME for the year ended 31 December 2010
- 2 -
2010 2009
Notes RO’000 RO‟000
Revenue 253,429 247,590
Operating expenses (176,209) (172,907)
────── ──────
Gross profit 77,220 74,683
Administrative expenses (28,457) (34,106)
────── ──────
Profit from operations 48,763 40,577
Net finance costs 20 (10,338) (7,845)
Share of profit from associate companies 7 368 -
Net gain (loss) on investments 3 (7)
Amortisation of intangible assets 5 (13) (34)
────── ──────
Net profit before income tax 38,783 32,691
Income tax expenses 19 (6,501) (4,181)
────── ──────
Net profit for the year 20 32,282 28,510
══════ ══════
Other comprehensive income (loss)
Foreign currency translation differences 5 31
Effective portion of changes in fair value of cash flow hedges (143) (88)
────── ──────
Other comprehensive loss for the year (138) (57)
────── ──────
Total comprehensive income for the year 32,144 28,453
══════ ══════
Net profit attributable to:
Shareholders of the Parent Company 27,648 25,085
Non controlling interest 4,634 3,425
────── ──────
Net profit for the year 32,282 28,510
══════ ══════
Total comprehensive income attributable to:
Shareholders of the Parent Company 27,510 25,028
Non controlling interest 4,634 3,425
────── ──────
Total comprehensive income for the year 32,144 28,453
══════ ══════
Basic and diluted earnings per share (RO) 21 0.103 0.094
══════ ══════
Dividend per share:
Cash dividend (RO) 22 0.012 0.012 ══════ ══════
The attached notes 1 to 32 form an integral part of these financial statements.
The Parent Company statement of comprehensive income is presented as a separate schedule attached to the
financial statements.
The report of the Auditors is set forth on page 1.

Renaissance Services SAOG and its Subsidiary Companies
CONSOLIDATED STATEMENT OF FINANCIAL POSITION as at 31 December 2010
- 3 -
2010 2009
Notes RO’000 RO‟000
Non-current assets
Property, plant and equipment 4 391,555 282,749
Intangible assets 5 38,855 34,023
Investments 7 1,734 1,366
Deferred tax asset 19 448 1,229 ─────── ───────
Total non-current assets 432,592 319,367 ─────── ───────
Current assets
Trading investments 15 12
Inventories and work in progress 9 13,270 11,042
Trade and other receivables 10 93,779 86,826
Cash and bank balances 11 22,437 30,692 ─────── ───────
Total current assets 129,501 128,572 ─────── ───────
Current liabilities
Trade and other payables 12 62,422 64,760
Bank borrowings 11 & 13 3,485 3,520
Term loans and leases 14 56,308 38,494 ─────── ───────
Total current liabilities 122,215 106,774 ─────── ───────
Net current assets 7,286 21,798 ─────── ───────
Non-current liabilities
Term loans and leases 14 228,508 150,090
Non current payables and advances 15 9,871 17,835
Staff terminal benefits 16 5,667 4,823 ─────── ───────
Total non-current liabilities 244,046 172,748 ─────── ───────
Net assets 195,832 168,417
══════ ══════
Equity
Share capital 17 28,209 28,209
Share premium 17 19,496 19,496
Treasury shares 17 (1,704) (1,704)
Legal reserve 17 10,577 10,440
Proposed distribution 22 3,385 3,385
Retained earnings 112,479 88,176
Hedging reserve 17 (231) (88)
Exchange reserve 17 107 102 ─────── ───────
172,318 149,720
Non controlling interest 23,514 20,401 ─────── ───────
Total equity 195,832 168,417
══════ ══════
Net assets per share (RO) 18 0.644 0.553
══════ ══════
The financial statements were authorised for issue in accordance with a resolution of the Directors on 27 February
2011.
Chairman Director
The attached notes 1 to 32 form an integral part of these financial statements.
The Parent Company statement of financial position is presented as a separate schedule attached to the financial
statements.
The report of the Auditors is set forth on page 1.

Renaissance Services SAOG and its Subsidiary Companies
CONSOLIDATED STATEMENT OF CASH FLOWS for the year ended 31 December 2010
- 4 -
2010 2009
Notes RO’000 RO‟000
OPERATING ACTIVITIES
Cash receipts from customers 252,547 242,833
Cash paid to suppliers and employees (195,126) (186,567)
──────── ─────────
Cash generated from operations 57,422 56,266
Net finance costs (10,522) (7,613)
Income tax paid (6,273) (2,663)
───────── ─────────
Cash flows from operating activities 40,626 45,990
───────── ─────────
INVESTING ACTIVITIES
Acquisition of property, plant and equipment (134,355) (71,797)
Acquisition of intangible assets (149) -
Proceeds from sale of investments - 1,051
Acquisition of a subsidiary (5,964) -
Dividend received 176 136
───────── ─────────
Cash used in investing activities (140,292) (70,610)
───────── ─────────
FINANCING ACTIVITIES
Net receipt of term loans 96,232 38,301
Net movement in related party balances 120 141
Cash dividends paid (3,385) (2,453)
Funds (paid to ) / introduced by minority interests (1,521) 3,595
───────── ─────────
Cash flows from financing activities 91,446 39,584
───────── ─────────
Net (decrease) increase in cash and cash equivalents (8,220) 14,964
Cash and cash equivalents at the beginning of the year 27,172 12,208
───────── ─────────
Cash and cash equivalents at the end of the year 11 18,952 27,172 ═════════ ═════════
Cash and cash equivalents comprise the following:
Cash and bank balances 22,437 30,692
Bank borrowings (3,485) (3,520)
───────── ─────────
18,952 27,172
═════════ ═════════
The attached notes 1 to 32 form an integral part of these financial statements.
The Parent Company statement of cash flows is presented as a separate schedule attached to the financial
statements.
The report of the Auditors is set forth on page 1.

Renaissance Services SAOG and its Subsidiary Companies
CONSOLIDATED STATEMENT OF CHANGES IN EQUITY for the year ended 31 December 2010
- 5 -
Attributable to shareholders‟ of the Parent Company
Share
capital
Share
premium
Treasury
shares
Legal
reserve
Proposed
distribution
Retained
earnings
Hedging
reserves
Exchange
reserves
Total
Non
controlling
interest
Total
RO‟000 RO‟000 RO‟000 RO‟000 RO‟000 RO‟000 RO „000 RO‟000 RO‟000 RO‟000 RO‟000
1 January 2009 24,530 20,723 (1,704) 9,087 6,132 66,474 - 71 125,313 13,381 138,694
─────── ─────── ─────── ─────── ─────── ─────── ─────── ─────── ─────── ─────── ───────
Total comprehensive income for the year :
Net profit for the year - - - - - 25,085 - - 25,085 3,425 28,510
Other comprehensive income:
Changes in fair value of cash flow
hedge
-
-
-
-
-
-
(88)
-
(88)
-
(88)
Foreign currency translation differences - - - - - - - 31 31 - 31
─────── ─────── ─────── ─────── ─────── ─────── ─────── ─────── ─────── ─────── ───────
Total comprehensive income for the year - - - - - 25,085 (88) 31 25,028 3,425 28,453
─────── ─────── ─────── ─────── ─────── ─────── ─────── ─────── ─────── ─────── ───────
Transactions with owners, directly recorded
in equity:
Dividend paid and bonus shares issued 3,679 - - - (6,132) - - - (2,453) - (2,453)
Proposed dividend - - - - 3,385 (3,385) - - - - -
Income from treasury shares - - - - - 128 - - 128 - 128
Transfers to legal reserve - (1,227) - 1,353 - (126) - - - - -
Movement related to investments in
subsidiaries
-
-
-
-
-
-
-
-
-
3,595
3,595
─────── ─────── ─────── ─────── ─────── ─────── ─────── ─────── ─────── ─────── ───────
Transactions with owners, directly recorded
in equity
3,679
(1,227)
-
1,353
(2,747)
(3,383)
-
-
(2,325)
3,595
1,270
─────── ─────── ─────── ─────── ─────── ─────── ─────── ─────── ─────── ─────── ───────
31 December 2009 28,209 19,496 (1,704) 10,440 3,385 88,176 (88) 102 148,016 20,401 168,417
══════ ══════ ══════ ══════ ══════ ══════ ═════ ══════ ══════ ══════ ══════

Renaissance Services SAOG and its Subsidiary Companies
CONSOLIDATED STATEMENT OF CHANGES IN EQUITY (continued) for the year ended 31 December 2010
- 6 -
Attributable to shareholders‟ of the Parent Company
Share
capital
Share
premium
Treasury
shares
Legal
reserve
Proposed
distribution
Retained
earnings
Hedging
reserves
Exchange
reserves
Total
Non
controlling
interest
Total
RO‟000 RO‟000 RO‟000 RO‟000 RO‟000 RO‟000 RO „000 RO‟000 RO‟000 RO‟000 RO‟000
1 January 2010 28,209 19,496 (1,704) 10,440 3,385 88,176 (88) 102 148,016 20,401 168,417
─────── ─────── ─────── ─────── ─────── ─────── ─────── ─────── ─────── ─────── ───────
Total comprehensive income for the year :
Net profit for the year - - - - - 27,648 - - 27,648 4,634 32,282
Other comprehensive income:
Changes in fair value of cash flow
hedge
- - - - - - (143) - (143) - (143)
Foreign currency translation differences - - - - - - - 5 5 - 5
─────── ─────── ─────── ─────── ─────── ─────── ─────── ─────── ─────── ─────── ───────
Total comprehensive income for the year - - - - - 27,648 (143) 5 27,510 4,634 32,144
─────── ─────── ─────── ─────── ─────── ─────── ─────── ─────── ─────── ─────── ───────
Transactions with owners, directly recorded
in equity:
Dividend paid - - - - (3,385) - - - (3,385) - (3,385)
Proposed dividend - - - - 3,385 (3,385) - - - - -
Income from treasury shares - - - - - 177 - - 177 - 177
Transfers to legal reserve - - - 137 - (137) - - - - -
Movement related to investments in
subsidiaries
-
-
-
-
-
-
-
-
(1,521)
(1,521)
─────── ─────── ─────── ─────── ─────── ─────── ─────── ─────── ─────── ─────── ───────
Transactions with owners, directly recorded
in equity
-
-
-
137
-
(3,345)
-
-
(3,208)
(1,521)
(4,729)
─────── ─────── ─────── ─────── ─────── ─────── ─────── ─────── ─────── ─────── ───────
31 December 2010 28,209 19,496 (1,704) 10,577 3,385 112,479 (231) 107 172,318 23,514 195,832
══════ ══════ ══════ ══════ ══════ ══════ ═════ ══════ ══════ ══════ ══════
The attached notes 1 to 32 form an integral part of these financial statements.
The Parent Company statement of changes in equity is presented as a separate schedule attached to the financial statements.
The report of the Auditors is set forth on page 1.

Renaissance Services SAOG and its Subsidiary Companies
NOTES TO THE CONSOLIDATED FINANCIAL STATEMENTS for the year ended 31 December 2010
- 7 -
1 LEGAL STATUS AND PRINCIPAL ACTIVITIES
Renaissance Services SAOG (the "Parent Company") is incorporated in the Sultanate of Oman as a
public joint stock company. The business activities of Renaissance Services SAOG and its subsidiary
companies (together referred to as the "Group") include investments in companies and properties,
providing solutions in offshore support vessel fleet, ship building, purchase and sales of vessels, a float
ship repair, fabrication and maintenance for the oil & gas and energy services sectors, a leading turnkey
contract services provider providing facilities management, facilities establishment, contract catering,
operations and maintenance services, provision of training services, media publishing, advertising and
distribution, manufacturing, general trading and related activities.
2 SIGNIFICANT ACCOUNTING POLICIES
Basis of preparation
The consolidated financial statements have been prepared in accordance with International Financial
Reporting Standards (IFRS) and applicable requirements of the Commercial Companies Law of 1974 and
the minimum disclosure requirements of the Capital Market Authority (CMA).
These financial statements have been prepared in Rial Omani ("RO") rounded to the nearest thousand.
The consolidated financial statements are prepared under the historical cost convention modified to
include the measurement at fair value of the following assets:
- Held for trading investments;
- Available for sale investments; and
- Derivative financial instruments. Basis of consolidation
Subsidiaries
Subsidiaries are those entities controlled by the Group. Control exists when the Group has the power,
directly or indirectly, to govern the financial and operating policies of an entity so as to obtain benefits
from its activities. The financial statements of subsidiaries are included in the consolidated financial
statements from the date that control commences until the date that control ceases.
Special purpose entities (“SPEs”) are consolidated if, based on the evaluation of the substance of the
relationship of the entity with the Group and the SPEs risks and rewards, the Group concludes that it
controls the SPEs.
The financial statements of the subsidiaries are prepared for the same reporting year as the Parent
Company, using consistent accounting policies.
Associates
Associates are those entities in which the Group has significant influence, but not control, over the
financial and operating policies. The consolidated financial statements include the Group's share of the
total recognised gains and losses of associates on an equity accounting basis, from the date that
significant influence commences until the date that significant influence ceases. When the Group's share
of losses exceeds the carrying amount of the associate, the carrying amount is reduced to nil and
recognition of further losses is discontinued except to the extent that the Group has incurred obligations
in respect of the associate.

Renaissance Services SAOG and its Subsidiary Companies
NOTES TO THE CONSOLIDATED FINANCIAL STATEMENTS for the year ended 31 December 2010
- 8 -
2 SIGNIFICANT ACCOUNTING POLICIES (continued)
Basis of consolidation (continued)
Investments in jointly controlled entities
Investments in the jointly controlled entities are accounted for under the proportionate consolidation
method whereby the Group accounts for its share of the assets and liabilities, income and expenses in
the jointly controlled entity.
Jointly controlled operations
Where the Group participates in jointly controlled operations as defined in International Accounting
Standard 31 the Group accounts only for its own share of assets and liabilities, income and expenditure.
Transactions eliminated on consolidation
Intra-group balances and transactions, and any unrealised gains arising from intra-group transactions,
are eliminated in preparing the consolidated financial statements. Unrealised gains arising from
transactions with associates are eliminated to the extent of the Group's interest in the entity, against the
investment in the associate. Unrealised losses are eliminated in the same way as unrealised gains, but
only to the extent that there is no evidence of impairment.
Accounting for business combinations
Business combinations are accounted for using the acquisition method as at the acquisition date, which
is the date on which control is transferred to the Group. Control is the power to govern the financial and
operating policies of an entity so as to obtain benefits from its activities. In assessing control, the Group
takes into consideration potential voting rights that currently are exercisable.
The Group measures goodwill at the acquisition date as:
- the fair value of the consideration transferred; plus
- the recognised amount of any non-controlling interests in the acquiree; plus if the business
combination is achieved in stages, the fair value of the existing equity interest in the acquiree; less
- the net recognised amount (generally fair value) of the identifiable assets acquired and liabilities
assumed.
When the excess is negative, a bargain purchase gain is recognised immediately in profit or loss.
Costs related to the acquisition, other than those associated with the issue of debt or equity securities,
that the Group incurs in connection with a business combination are expensed as incurred.
Non controlling interests
Non controlling interests represent the portion of profit or loss and net assets not held by the Group and
are presented in the statement of comprehensive income and within equity in the consolidated statement
of financial position, separately from parent shareholders‟ equity. Acquisitions of minority interests are
accounted for using the parent entity extension method, whereby, the difference between the
consideration and the book value of the share of the net assets acquired is recognised as goodwill.
Revenue recognition
Marine charter
Revenue comprises operating lease rent from charter of marine vessels, mobilization income, revenue
from provision of on-board accommodation, catering services and sale of fuel and other consumables.
Lease rent income is recognised on a straight line basis over the period of the lease. Revenue from
provision of on- board accommodation and catering services is recognised over the period of hire of
such accommodation while revenue from sale of fuel and other consumables is recognised when
delivered. Income generated from the mobilization or demobilization of the vessel to or from the

Renaissance Services SAOG and its Subsidiary Companies
NOTES TO THE CONSOLIDATED FINANCIAL STATEMENTS for the year ended 31 December 2010
- 9 -
2 SIGNIFICANT ACCOUNTING POLICIES (continued)
Revenue recognition (continued)
Marine charter (continued)
location of charter under the vessel charter agreement is recognized when the mobilization or
demobilization service has been rendered.
Ship building, ship repair and oil and gas engineering services
Revenue comprises amounts derived from ship repair, provision of mechanical, electrical and
instrumentation services, fabrication and maintenance services, turbocharger services and marine boiler
repairs. Revenue is recognised under the percentage of completion method and is stated net of discounts
and allowances. Where the outcome of a contract can be assessed with reasonable certainty, a prudent
estimate of attributable profit is recognised in the income statement. Full provision is immediately made
for all known or expected losses on individual contracts, when such losses are foreseen. Revenue
arising from contract variations and claims is not accounted for unless it is probable that the customer
will approve the variations/claims and the amount of revenue arising from the variations/claims can be
measured reliably.
Goods sold and services rendered
Revenue from the sale of goods is recognised in the income statement when the significant risks and
rewards of ownership have been transferred to the buyer i.e. delivery of goods, acceptance by the
customer and the amount of revenue can be measured reliably.
Revenue from services rendered is recognised in the income statement in proportion to the stage of
completion of the transaction in the accounting period in which the services are rendered and the right
to receive the consideration is established. No revenue is recognised if there are significant uncertainties
regarding the recovery of the consideration due, associated costs or the possible return of goods.
Long-term contracts
As soon as the outcome of a long-term contract can be estimated reliably, contract revenue and
expenses are recognised in the income statement in proportion to the stage of completion of the
contract. An expected loss on a contract is recognised immediately in the income statement. No
revenue is recognised if there are significant uncertainties regarding the recovery of the consideration
due, associated costs or the possible return of goods.
Maintenance contracts
Income from maintenance contracts is recognised in the income statement on a straight line basis evenly
over the term of the contract.
Commission income
Commission income is recognised when the amount is notified to the Group entities by the principal.
Investment income and gain or loss on disposals
On disposal of an investment, the resultant gain or loss between the net disposal proceeds and the
carrying amount is recognised in the income statement.
Dividend income
Dividend income is recognised in the income statement on the date that the dividend is declared.

Renaissance Services SAOG and its Subsidiary Companies
NOTES TO THE CONSOLIDATED FINANCIAL STATEMENTS for the year ended 31 December 2010
- 10 -
2 SIGNIFICANT ACCOUNTING POLICIES (continued)
Revenue recognition (continued)
Sale of vessels
Revenue from sale of vessels is recognized in the income statement when the significant risks and
rewards of ownership have been transferred to the buyer, recovery of the consideration is probable, the
associated costs and possible return of goods can be estimated reliably, there is no continuing
management involvement with the vessel and the amount of revenue can be measured reliably.
Interest
Interest revenue is recognised as the interest accrues.
Others
Sale of operating assets and other miscellaneous income like insurance claims, provision write back and
other income are shown as part of revenue and recognised when the right to receive is established.
Property, plant and equipment
Owned assets
Items of property, plant and equipment are stated at cost or revalued amounts less accumulated
depreciation and impairment losses, if any. Subsequent to initial recognition or certain assets are carried
at revalued amount, being their fair value at the date of the revaluation less any subsequent accumulated
depreciation. The revaluation of these assets is carried out at regular intervals on an open-market basis
to ensure that the carrying amount does not differ materially from the fair value. Surplus arising on
revaluation is recorded in other comprehensive income and presented in the revaluation reserve in
equity.
Subsequent expenditure
Expenditure incurred to replace a component of an item of property, plant and equipment that is
accounted for separately, including major inspection and overhaul expenditure is capitalised. Other
subsequent expenditure is capitalised only when it increases the future economic benefits embodied in
property, plant and equipment. All other expenditure is recognised in the income statement as an
expense as incurred.
Depreciation
Depreciation is charged to the income statement on a straight line basis over the estimated useful lives
of items of property, plant and equipment. The estimated useful lives are as follows:
Years
Buildings and improvements 5 - 25
Furniture and fixtures 3 - 5
Plant, machinery and office equipment 1 - 15
Marine vessels revalued (from the date of latest revaluation) 10
Marine vessels acquired 15 - 30
Expenditure on marine vessel dry docking (included as a component of marine vessels) 3
Jetty and land development 25
Floating dock 25
Motor vehicles 3
Freehold land is not depreciated. The cost of certain assets used on specific contracts is depreciated to
estimated residual value over the period of the respective contract, including extensions if any.
Vessels that are no longer being chartered and are held for sale are transferred to inventories at their
carrying value.

Renaissance Services SAOG and its Subsidiary Companies
NOTES TO THE CONSOLIDATED FINANCIAL STATEMENTS for the year ended 31 December 2010
- 11 -
2 SIGNIFICANT ACCOUNTING POLICIES (continued)
Property, plant and equipment (continued)
Capital work-in-progress
Capital work-in-progress is stated at cost and comprises all costs directly attributable to bringing the
assets under construction ready for their intended use. Capital work-in-progress is transferred to
property, plant and equipment at cost on completion.
Dry docking costs
The expenditure incurred on vessel dry docking, a component of property, plant and equipment, is
amortised over the period from the date of dry docking, to the date on which the management estimates
that the next dry docking is due.
Vessel refurbishment costs
Leased assets
Costs incurred in advance of charter to refurbish vessels under long term charter agreements are
capitalised within property, plant and equipment in line with the use of the refurbished vessel. Where
there is an obligation to incur future restoration costs under charter agreements which would not meet
the criteria for capitalisation within property, plant and equipment, the costs are accrued over the period
to the next vessel re-fit to match the use of the vessel and the period over which the economic benefits of
its use are realised.
Owned assets
Cost incurred to refurbish owned assets are capitalised within property, plant and equipment and then
depreciated over the shorter of the estimated economic life of the related refurbishment or the remaining
life of the vessel.
Goodwill
Following initial recognition, goodwill is measured at cost less any accumulated impairment losses.
Goodwill is reviewed for impairment, annually, or more frequently if events or changes in circumstances
indicate that the carrying value may be impaired.
For the purpose of impairment testing, goodwill acquired in a business combination is, from the
acquisition date, allocated to each of the Group‟s cash-generating units, or groups of cash-generating
units, that are expected to benefit from the synergies of the combination, irrespective of whether other
assets and liabilities of the Group are assigned to those units or groups of units. Each unit or group of
units to which the goodwill is so allocated:
represents the lowest level within the Group at which the goodwill is monitored for internal
management purposes; and
is not larger than a segment based on the Group‟s operating segment format determined in
accordance with IFRS 8 Operating Segments.
Impairment is determined by assessing the recoverable amount of the cash-generating unit (group of
cash-generating units), to which the goodwill relates. Where the recoverable amount of the cash-
generating unit (group of cash-generating units) is less than the carrying amount, an impairment loss is
recognised. Where goodwill forms part of a cash-generating unit (group of cash-generating units) and
part of the operation within that unit is disposed of, the goodwill associated with the operation disposed
of is included in the carrying amount of the operation when determining the gain or loss on disposal of
the operation. Goodwill disposed of in this circumstance is measured based on the relative values of the
operation disposed of and the portion of the cash-generating unit retained.

Renaissance Services SAOG and its Subsidiary Companies
NOTES TO THE CONSOLIDATED FINANCIAL STATEMENTS for the year ended 31 December 2010
- 12 -
2 SIGNIFICANT ACCOUNTING POLICIES (continued)
Intangible assets
Intangible assets acquired separately are measured on initial recognition at cost. The cost of intangible
assets acquired in a business combination is their fair value as at the date of acquisition. Following initial
recognition, intangible assets are carried at cost less any accumulated amortisation and any accumulated
impairment losses. The useful lives of intangible assets are assessed to be either finite or indefinite.
Intangible assets with finite lives are amortised over the useful economic life and assessed for impairment
whenever there is an indication that the intangible asset may be impaired. The amortisation period and the
amortisation method for an intangible asset with a finite useful life are reviewed at least at each financial
year-end. Changes in the expected useful life or the expected pattern of consumption of future economic
benefits embodied in the asset is accounted for by changing the amortisation period or method, as
appropriate, and treated as changes in accounting estimates. The amortisation expense on intangible assets
with finite lives is recognised in the income statement in the expense category consistent with the function
of the intangible asset.
Computer software costs represent expenditure incurred on implementing an ERP solution for the Group.
Amortisation is charged on a straight line basis over a period of five years, from the date of completion.
Investments
Held for trading investments are stated at fair value, with any resultant gain or loss recognised in the
income statement. Other investments held by the Group are classified as being available for sale and are
stated at fair value. Unrealised gains and losses on remeasurement to fair value are reported in other
comprehensive income and presented as fair value reserve in equity until the investment is derecognised
or the investment is determined to be impaired. Upon impairment any loss, or upon derecognition any
gain or loss, previously reported as “cumulative changes in fair value” within equity is included in the
income statement for the period.
Inventories and work-in-progress
Inventories are valued at the lower of cost and net realisable value. Cost is determined applying the
first-in, first-out and the weighted average methods and includes all costs incurred in acquiring and
bringing them to their present location and condition. Net realisable value signifies the estimated selling
price in the ordinary course of business, less estimated costs of completion and selling expenses.
Work-in-progress in the case of short-term contracts is stated at the invoice value of goods and services
supplied less amounts received or receivable. In the case of long-term contracts, work-in-progress is
stated at cost, which includes direct costs and all attributable overheads, plus profit recognised to date
less a provision for foreseeable losses, uncertainty and progress billings. Cost includes all expenditure
related to specific contracts and an allocation of fixed and variable overheads incurred in the Group's
contract activities based on normal operating capacity.
Trade and other receivables
Trade and other receivables are stated at cost less impairment losses, if any.
Treasury shares
Own equity instruments which are reacquired (treasury shares) are deducted from equity. No gain or
loss is recognised in profit or loss on the purchase, sale, issue or cancellation of the Group‟s
own equity instruments. Any gain or loss or income related to these shares are directly transferred to
retained earnings and shown in the statement of changes in equity.

Renaissance Services SAOG and its Subsidiary Companies
NOTES TO THE CONSOLIDATED FINANCIAL STATEMENTS for the year ended 31 December 2010
- 13 -
2 SIGNIFICANT ACCOUNTING POLICIES (continued)
Cash and cash equivalents
Cash and cash equivalents comprise cash at hand, bank balances and short-term deposits with an
original maturity of three months or less.
Bank borrowings that are repayable on demand and form an integral part of the Group's cash
management are included as a component of cash and cash equivalents for the purpose of the statement
of cash flows.
Trade and other payables
Liabilities are recognised for amounts to be paid in the future for goods or services received, whether
billed by the supplier or not.
Interest bearing borrowings
Interest bearing borrowings are recognised initially at the fair value of the consideration received less
directly attributable transaction costs. Subsequent to initial recognition interest bearing borrowings are
stated at amortised cost with any difference between cost and redemption value being recognised in the
income statement over the period of the borrowings on an effective interest basis.
Provisions
A provision is recognised in the statement of financial position when the Group has a legal or
constructive obligation as a result of a past event, and it is probable that an outflow of economic benefit
will be required to settle the obligation. If the effect is material, provisions are determined by
discounting the expected future cash flows at a pre-tax rate that reflects current market assessments of
the time value of money and, where appropriate, the risks specific to the liabilities.
Dividends
Dividends are recognised as a liability in the period in which they are declared.
Leases
Group as a lessee
Finance leases, which transfer to the Group substantially all the risks and benefits incidental to ownership
of the leased item, are capitalised at the inception of the lease at the fair value of the leased asset or, if
lower, at the present value of the minimum lease payments. Lease payments are apportioned between the
finance charges and reduction of the lease liability so as to achieve a constant rate of interest on the
remaining balance of the liability. Finance charges are charged directly to the income statement.
Capitalised leased assets are depreciated over the estimated useful life of the asset or the lease term,
whichever is less.
Leases where the lessor retains substantially all the risks and benefits of ownership of the asset are
classified as operating leases. Operating lease payments are recognized as an expense in the income
statement on a straight-line basis over the lease term.

Renaissance Services SAOG and its Subsidiary Companies
NOTES TO THE CONSOLIDATED FINANCIAL STATEMENTS for the year ended 31 December 2010
- 14 -
2 SIGNIFICANT ACCOUNTING POLICIES (continued)
Leases (continued)
Group as a lessor
Leases where the Group does not transfer substantially all the risks and benefits of ownership of the
asset are classified as operating leases. Initial direct costs incurred in negotiating an operating lease are
added to the carrying amount of the leased asset and recognised over the lease term on the same basis as
lease rental income. Contingent rents are recognised as revenue in the period in which they are earned.
Employee benefits
Contributions to a defined contribution retirement plan for Omani employees, in accordance with the
Oman Social Insurance Scheme, are recognised as an expense in the income statement as incurred.
The Group provides end of service benefits to its expatriate employees. The entitlement to these
benefits is based upon the employees‟ salary and length of service, subject to completion of a minimum
service period. The expected costs of these benefits are accrued over the period of employment.
For non Omani companies the end of service benefits are provided as per the respective regulations in
their country.
Retirement benefit costs
Payments to defined contribution retirement benefit schemes are charged as an expense as they fall due.
Payments made to state-managed retirement benefit schemes are dealt with as payments to defined
contribution schemes where the Group‟s obligations under the schemes are equivalent to those arising in a
defined contribution retirement benefit scheme.
Directors’ remuneration
The Board of Directors‟ remuneration of the Parent Company is accrued within the limits specified by the
Capital Market Authority and the requirements of the Commercial Companies Law of the Sultanate of
Oman.
Term loans
Term loans are carried on the statement of financial position at the fair value of the consideration
received less directly attributable transaction costs. Installments due within one year are shown as a
current liability. Interest expense is accrued on a time-proportion basis with unpaid amounts included
in accounts payable and accruals.
Net finance costs
Net finance costs comprise interest payable on borrowings calculated using the effective interest rate
method and interest received on funds invested. After initial recognition, interest bearing loans and
borrowings are subsequently measured at amortised cost using the effective interest method. Financing
costs are recognised as an expense in the income statement in the period in which they are incurred.
Borrowing costs, net of interest income, which are directly attributable to the acquisition of items of
property, plant and equipment are capitalised as the cost of property, plant and equipment. Borrowing
costs incurred beyond the construction period are recognised in the income statement.

Renaissance Services SAOG and its Subsidiary Companies
NOTES TO THE CONSOLIDATED FINANCIAL STATEMENTS for the year ended 31 December 2010
- 15 -
2 SIGNIFICANT ACCOUNTING POLICIES (continued)
Net finance costs (continued)
Interest income is recognised in the income statement as it accrues, taking into account the effective
yield on the asset.
Segment reporting
An operating segment is the component of the Group that engages in business activities from which it
may earn revenues and incur expenses, including revenue and expenses that relate to transaction with
any of the Group‟s other components, whose operating results are reviewed regularly by the Group
CEO (being the chief operating decision maker) to make decisions about resources allocated to each
segment and assess its performance, and for which discrete financial information is available.
Income tax
Income tax is provided for in accordance with the fiscal regulations of the country in which the Group
operates.
Income tax on the profit or loss for the year comprises current and deferred taxation. Income tax is
recognised in the income statement except to the extent that it relates to items recognised directly in the
equity or other comprehensive income.
Current tax is the expected tax payable on the taxable income for the year, using tax rates enacted or
substantially enacted at the reporting date, and any adjustment to tax payable in respect of previous
years.
Deferred tax is recognized in respect of temporary differences between the carrying amounts of assets
and liabilities for financial reporting purposes and the amounts use for taxation purposes. The amount
of deferred tax provided is based on the expected manner of realistic settlement of the carrying amount
of assets and liabilities, using tax rates enacted or substantially enacted at the reporting date.
A deferred tax asset is recognised only to the extent that it is probable that future taxable profits will be
available against which the unused tax losses and credits can be utilised. Deferred tax assets are
reduced to the extent that it is no longer probable that the related tax benefit will be realised.
Foreign currency transactions
Transactions denominated in foreign currencies are translated to Rial Omani at the foreign exchange
rate ruling at the date of the transaction. Monetary assets and liabilities denominated in foreign
currencies at the reporting date are retranslated to Rial Omani at foreign exchange rates prevailing on
that date. Foreign exchange differences arising on conversion are recognised in the income statement.
Non-monetary assets and liabilities denominated in foreign currencies that are stated at fair value are
translated into Rial Omani at the foreign exchange rates ruling at the dates the values were determined.

Renaissance Services SAOG and its Subsidiary Companies
NOTES TO THE CONSOLIDATED FINANCIAL STATEMENTS for the year ended 31 December 2010
- 16 -
2 SIGNIFICANT ACCOUNTING POLICIES (continued)
Foreign operations
The assets and liabilities of foreign operations, including goodwill and fair value adjustments arising on
acquisition, are translated to Rial Omani at exchange rates at the reporting date. The income and
expenses of foreign operations are translated to Rial Omani at exchange rates at the dates of the
transactions. Foreign currency differences are recognised in other comprehensive income and are
reflected in the exchange reserve in equity. When a foreign operation is disposed of, in part or in full,
the relevant amount in the exchange reserve is transferred to income statement as part of the profit or
loss on disposal. Foreign exchange gains and losses arising from a monetary item receivable from or
payable to a foreign operation, the settlement of which is neither planned nor likely in the foreseeable
future, are considered to form part of a net investment in a foreign operation and are recognised in other
comprehensive income, and are presented within the equity in the translation reserve.
Impairment
Financial assets
A financial asset is assessed at each reporting date to determine whether there is objective evidence that
it is impaired. A financial asset is impaired if objective evidence indicates that a loss event has occurred
after the initial recognition of the asset, and that the loss event had a negative effect on the estimated
future cash flows of that asset that can be estimated reliably.
Objective evidence that financial assets are impaired can include default or delinquency by a debtor,
restructuring of an amount due to the Group on terms that the Group would not consider otherwise,
indications that a debtor or issuer will enter bankruptcy. The Group considers evidence of impairment
of financial assets at both a specific asset and collective level. All individually significant financial
assets are assessed for specific impairment. All individually significant financial assets found not to be
specifically impaired are then collectively assessed for any impairment that has been incurred but not
yet identified. Financial assets that are not individually significant are collectively assessed for
impairment by grouping together financial assets with similar risk characteristics.
In assessing collective impairment the Group uses historical trends of the probability of default, timing
of recoveries and the amount of loss incurred, adjusted for management‟s judgment as to whether
current economic and credit conditions are such that the actual losses are likely to be greater or less
than suggested by historical trends.
An impairment loss in respect of a financial asset measured at amortised cost is calculated as the
difference between its carrying amount and the present value of the estimated future cash flows
discounted at the asset‟s original effective interest rate. Losses are recognised in the income statement
and reflected in an allowance account against receivables. Interest on the impaired asset continues to be
recognised through the unwinding of the discount. When a subsequent event causes the amount of
impairment loss to decrease, the decrease in impairment loss is reversed through the income statement.
Non-financial assets (other than goodwill)
The carrying amounts of the Group‟s non-financial assets, are reviewed at each reporting date to
determine whether there is any indication of impairment. If any such indication exists then the asset‟s
recoverable amount is estimated. An impairment loss is recognized if the carrying amount of an asset or
its cash generating unit exceeds its recoverable amount. Impairment losses are recognized in the income
statement.
The recoverable amount of an asset or its cash generating unit is the greater of its value in use and its
fair value less costs to sell. In assessing value in use, the estimated future cash flows are discounted to
their present value using a pre tax discount rate that reflects current market assessments of time value of

Renaissance Services SAOG and its Subsidiary Companies
NOTES TO THE CONSOLIDATED FINANCIAL STATEMENTS for the year ended 31 December 2010
- 17 -
2 SIGNIFICANT ACCOUNTING POLICIES (continued)
Impairment (continued)
Non-financial assets (other than goodwill) (continued)
money and risks specific to the asset. For the purpose of impairment testing, assets are grouped together
into the smallest group of assets that generates cash inflows from continuing use that are largely
independent of the cash inflows of other assets or groups of assets (the “cash-generating unit”).
Impairment losses recognised in prior periods are assessed at each reporting date for any indications
that the loss has decreased or no longer exists. An impairment loss is reversed if there has been a
change in the estimates used to determine the recoverable amount. An impairment loss is reversed only
to the extent that the asset‟s carrying amount does not exceed the carrying amount that would have been
determined, net of depreciation or amortisation, if no impairment loss had been recognised.
Derivatives
Derivatives are stated at fair value. (Level 2)
For the purposes of hedge accounting, hedges are classified into two categories: (a) fair value hedges
which hedge the exposure to changes in the fair value of a recognised asset or liability; and (b) cash
flow hedges which hedge exposure to variability in cash flows of a recognised asset or liability or a
highly probable transaction.
In relation to effective fair value hedges any gain or loss from remeasuring the hedging instrument to
fair value, as well as related changes in fair value of the item being hedged, are recognised immediately
in the income statement.
In relation to effective cash flow hedges, the gain or loss on the hedging instrument is recognised
initially in equity and either transferred to the other comprehensive income in the period in which the
hedged transaction impacts the statement of comprehensive income, or included as part of the cost of
the related asset or liability
For hedges which do not qualify for hedge accounting, any gains or losses arising from changes in the
fair value of the hedging instrument are taken directly to the income statement for the year.
Fair value hedge accounting is discontinued when the hedging instrument expires or is sold, terminated
or exercised, or no longer qualifies for hedge accounting. For fair value hedges of financial instruments
with fixed maturities any adjustment arising from hedge accounting is amortised over the remaining
term to maturity. For cash flow hedges, any cumulative gain or loss on the hedging instrument
recognised in equity remains in equity until the hedged transaction occurs. If the hedged transaction is
no longer expected to occur, the net cumulative gain or loss recognised in equity is transferred to the
income statement.
New standards and interpretation not yet effective
A number of new standards, amendment to the standards and interpretations are not yet effective for the
year ended 31 December 2010, and have not been applied in preparing these consolidated financial
statements. None of these is expected to have a significant effect on the consolidated financial
statements of the Group, except for IFRS 9 Financial Instruments, which become mandatory for the
Group‟s 2013 consolidated financial statements and could change the classification and measurement of
financial assets. The Group does not plan to adopt this standard early and the extent of the impact has
not been determined.

Renaissance Services SAOG and its Subsidiary Companies
NOTES TO THE CONSOLIDATED FINANCIAL STATEMENTS for the year ended 31 December 2010
- 18 -
2 SIGNIFICANT ACCOUNTING POLICIES (continued)
Fair values
For investments traded in organised financial markets, fair value is determined by reference to Stock
Exchange quoted market bid prices at the close of business on the statement of financial position date.
(Level 1)
For unquoted investments, a reasonable estimate of the fair value is determined by reference to the
market value of a similar investment or is based on the expected discounted cash flows. Fair value
cannot be reliably measured for certain unquoted foreign investments. Such investments are measured
at cost. (Level 3)
The fair value of interest-bearing items is estimated based on discounted cash flows using market
interest rates for items with similar terms and risk characteristics. (Level 3)
Judgements
In the process of applying the Group‟s accounting policies, management has made the following
judgements, apart from those involving estimations, which have the most significant effect in the
amounts recognised in the financial statements:
Classification of investments
Management decides on acquisition of an investment whether it should be classified as held to maturity,
held for trading, carried at fair value through profit and loss account, or available for sale.
The Group classifies investments as trading if they are acquired primarily for the purpose of making a
short term profit by the dealers.
Classification of investments as fair value through profit and loss account depends on how management
monitor the performance of these investments. When they are not classified as held for trading but have
readily available reliable fair values and the changes in fair values are reported as part of income
statement in the management accounts, they are classified as fair value through profit and loss.
All other investments are classified as available for sale.
Estimates and assumptions
The preparation of financial statements requires management to make judgments, estimates and
assumptions that affect the application of accounting policies and reported amounts of assets and
liabilities, income and expenses. Actual results may differ from these estimates.
Estimates and underlying assumptions are reviewed on an ongoing basis. Revisions to accounting
estimates are recognized in the period in which the estimate is revised and in any future periods
affected.

Renaissance Services SAOG and its Subsidiary Companies
NOTES TO THE CONSOLIDATED FINANCIAL STATEMENTS for the year ended 31 December 2010
- 19 -
3 ACQUISITION OF SUBSIDIARY
On 1 July 2010 the Group obtained control of Al Wasita Emirates Catering Services LLC (“Al
Wasita Emirates”) by acquiring 100 percent of the shares and voting interests in the company. Al
Wasita Emirates is engaged in catering and related contract service activities.
In the six months to 31 December 2010, Al Wasita Emirates contributed revenue of RO 3,339,000 and
net profit of RO 573,000 to the Group‟s result. If the acquisition had occurred on 1 January 2010,
management estimates that consolidated revenue would have been RO 256,837,000 and consolidated
net profit for the year would have been RO 32,592,000. In determining these amounts, management
has assumed that the fair value adjustments, determined provisionally, that arose on the date of
acquistion of would have been the same if the acquisition had occurred on 1 January 2010.
The following summarises the major classes of consideration transferred, and the recognised amounts
of assets acquired and liabilities assumed at the acquisition date:
Identifiable assets acquired and liabilities assumed
RO’000
Furniture and equipment 365
Current assets 2,584
Cash and cash equivalents 29
Current liabilities (1,681)
────────
Fair value of identifiable net assets 1,297
Total consideration transferred 5,993
────────
Goodwill 4,696
════════

Renaissance Services SAOG and its Subsidiary Companies
NOTES TO THE CONSOLIDATED FINANCIAL STATEMENTS for the year ended 31 December 2010
- 20 -
4 PROPERTY, PLANT AND EQUIPMENT
Freehold
land and
buildings
Marine
vessels
Jetty
and dock
Machinery
and
equipment
Motor
vehicles
Furniture
and fixtures
Capital
work in
progress
Total
RO‟000 RO‟000 RO‟000 RO‟000 RO‟000 RO‟000 RO‟000 RO‟000
Cost or valuation
1 January 2010 49,340 248,559 2,055 29,945 2,553 1,852 45,562 379,866
Adjustment on deconsolidation
of a subsidiary
(1,276)
-
-
(711)
(10)
-
(542)
(2,539)
Acquisitions through business
combination
8
-
-
422
-
43
-
473
Additions 10,344 70,349 - 5,256 665 399 49,311 136,324
Transfers 32,157 40,463 - 24 - - (72,644) -
Disposals (1,221) (3,181) - (539) (261) (29) (808) (6,039)
──────── ──────── ──────── ──────── ──────── ──────── ─────── ───────
31 December 2010 89,352 356,190 2,055 34,397 2,947 2,265 20,879 508,085
════════ ════════ ════════ ════════ ════════ ════════ ═══════ ═══════
Depreciation
1 January 2010 22,513 52,998 504 17,780 1,869 1,453 - 97,117
Adjustment on deconsolidation
of a subsidiary
-
-
-
-
(1)
-
-
(1)
Acquisitions through business
combination
2
-
-
96
-
10
-
108
Charge for the year 4,135 13,270 144 3,681 467 261 - 21,958
Disposals (13) (2,075) - (300) (248) (16) - (2,652)
──────── ──────── ──────── ──────── ──────── ──────── ─────── ───────
31 December 2010 26,637 64,193 648 21,257 2,087 1,708 - 116,530
──────── ──────── ──────── ──────── ──────── ──────── ─────── ───────
Net carrying amount
31 December 2010 62,715 291,997 1,407 13,140 860 557 20,879 391,555
════════ ════════ ════════ ════════ ════════ ════════ ═══════ ═══════
31 December 2009 26,827 195,561 1,551 12,165 684 399 45,562 282,749
════════ ════════ ════════ ════════ ════════ ════════ ═══════ ═══════
Renaissance Services SAOG and its Subsidiary Companies
NOTES TO THE CONSOLIDATED FINANCIAL STATEMENTS for the year ended 31 December 2010
- 21 -
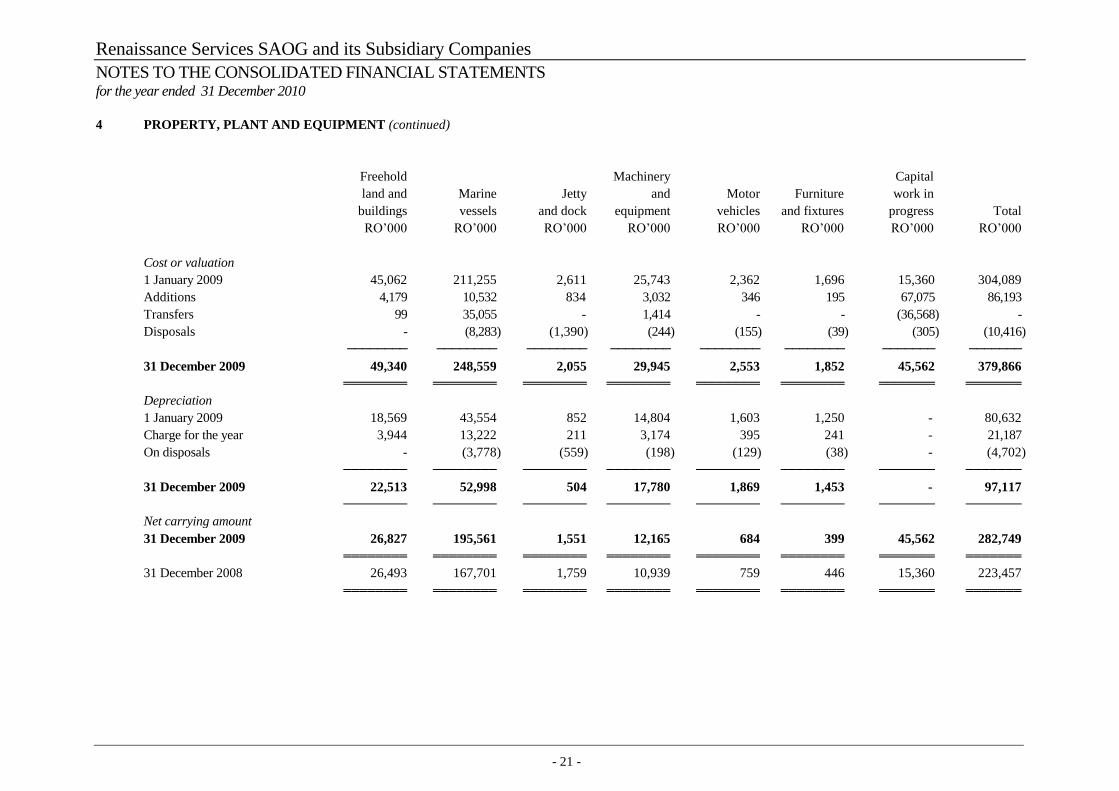
4 PROPERTY, PLANT AND EQUIPMENT (continued)
Freehold
land and
buildings
Marine
vessels
Jetty
and dock
Machinery
and
equipment
Motor
vehicles
Furniture
and fixtures
Capital
work in
progress
Total
RO‟000 RO‟000 RO‟000 RO‟000 RO‟000 RO‟000 RO‟000 RO‟000
Cost or valuation
1 January 2009 45,062 211,255 2,611 25,743 2,362 1,696 15,360 304,089
Additions 4,179 10,532 834 3,032 346 195 67,075 86,193
Transfers 99 35,055 - 1,414 - - (36,568) -
Disposals - (8,283) (1,390) (244) (155) (39) (305) (10,416)
──────── ──────── ──────── ──────── ──────── ──────── ─────── ───────
31 December 2009 49,340 248,559 2,055 29,945 2,553 1,852 45,562 379,866
════════ ════════ ════════ ════════ ════════ ════════ ═══════ ═══════
Depreciation
1 January 2009 18,569 43,554 852 14,804 1,603 1,250 - 80,632
Charge for the year 3,944 13,222 211 3,174 395 241 - 21,187
On disposals - (3,778) (559) (198) (129) (38) - (4,702)
──────── ──────── ──────── ──────── ──────── ──────── ─────── ───────
31 December 2009 22,513 52,998 504 17,780 1,869 1,453 - 97,117
──────── ──────── ──────── ──────── ──────── ──────── ─────── ───────
Net carrying amount
31 December 2009 26,827 195,561 1,551 12,165 684 399 45,562 282,749
════════ ════════ ════════ ════════ ════════ ════════ ═══════ ═══════
31 December 2008 26,493 167,701 1,759 10,939 759 446 15,360 223,457
════════ ════════ ════════ ════════ ════════ ════════ ═══════ ═══════

Renaissance Services SAOG and its Subsidiary Companies
NOTES TO THE CONSOLIDATED FINANCIAL STATEMENTS for the year ended 31 December 2010
- 22 -
4 PROPERTY, PLANT AND EQUIPMENT (continued)
Most of the assets including vessels, plant and equipment, buildings and other assets are pledged
against bank loans and bank borrowings.
During the year, the Group has reviewed the useful life and residual values of its marine vessels and has
revised the useful life of certain vessels from 25 years to 30 years, and reassessed their residual values.
The revisions have been treated as a change in accounting estimate under IAS 8 “Accounting Policies,
Changes in Accounting Estimates and Errors” and applied prospectively. Had there been no change in
the useful life and residual values of marine vessels, the depreciation charge for the current year would
have been higher by RO 1,719,000 and profit for the year would have been lower by the same amount.
Capital work in progress includes progress payments for the construction of new vessels and workshop
facilities for marine repair and fabrication and construction. Advances or deposits paid for construction or
acquisition of assets are classified as advances to suppliers and contractors, and the amount will be
transferred to capital work in progress after the commencement of construction.
During the year 2010, the Group has capitalized borrowing cost amounting to RO 2,074,000 (2009: RO
1,948,000).
The depreciation charge has been allocated in the income statement as follows:
2010 2009
RO’000 RO‟000
Operating expenses 20,251 19,700
Administrative expenses 1,707 1,487
──────── ────────
21,958 21,187
════════ ════════
5 INTANGIBLE ASSETS
2010 2009
Goodwill RO’000 RO‟000
Initial goodwill 39,960 39,960
Additions (note 3) 4,696 -
──────── ────────
31 December 44,656 39,960
──────── ────────
Amortisation and impairment
1 January 5,968 5,968
──────── ────────
31 December 5,968 5,968
──────── ────────
Net carrying amount at 31 December 38,688 33,992
════════ ════════

Renaissance Services SAOG and its Subsidiary Companies
NOTES TO THE CONSOLIDATED FINANCIAL STATEMENTS for the year ended 31 December 2010
- 23 -
5 INTANGIBLE ASSETS (continued)
Goodwill represents the excess of the cost of acquiring shares in certain subsidiaries companies over the
aggregate fair value of their net assets.
The carrying amount of goodwill at 31 December allocated to each of the cash-generating units:
Goodwill 2010 2009
RO’000 RO‟000
Topaz Energy and Marine Group 29,079 29,079
Tawoos Industrial Services Company LLC 1,900 1,900
Al Wasita Emirates Catering Services LLC (note 3) 4,696 -
Norsk Offshore Catering AS 1,007 1,007
Others (UMS, NTI and NHI) 2,006 2,006
──────── ────────
38,688 33,992
════════ ════════
The recoverable amount of each cash-generating unit is determined based on a value in use calculation,
using cash flow projections based on financial budgets approved by senior management. The key
assumptions of the value in use calculations are those regarding discount rates, growth rates and
expected changes to selling prices and direct costs during the period. Management estimates discount
rates that reflect current market assessments of the time value of money and the risks specific to each
cash-generating unit. The growth rates are based on management estimates having regard to industry
growth rates. Changes in selling prices and direct costs are based on past practices and expectations of
future changes in the market.
Sensitivity to changes in assumptions:
With regard to the assessment of value in use of the cash generating units, management believes that no
reasonably possible change in any of the key assumptions would cause the carrying value of the unit to
materially exceed its recoverable amount.
For the year ended 31 December 2010, there have been no events or changes in circumstances to
indicate that the carrying values of goodwill of the above cash-generating units may be impaired.
Computer software 2010 2009
RO’000 RO‟000
1 January 31 65
Acquisition through business combination 149 -
Amortisation (13) (34)
──────── ────────
Net carrying amount at 31 December 167 31
════════ ════════
Total intangible assets 38,855 34,023
════════ ════════

Renaissance Services SAOG and its Subsidiary Companies
NOTES TO THE CONSOLIDATED FINANCIAL STATEMENTS for the year ended 31 December 2010
- 24 -
6 SUBSIDIARIES AND ASSOCIATES
The Group and Parent Company investments in Subsidiary and Associate companies are as follows:
Ownership interest (%)
2010 2009
Subsidiary Companies
Topaz Energy and Marine Limited (“TOPAZ”) (incorporated in UAE) 100 100
Tawoos Industrial Services Company LLC ("TISCO") 100 100
United Media Services Company LLC ("UMS") 100 100
National Training Institute LLC ("NTI") 100 100
National Hospitality Institute SAOG ("NHI")
Renaissance Energy Limited (“REL”)
46
100
46
-
In 2010 Renaissance Services SAOG has incorporated a new subsidiary, Renaissance Energy Limited
(“REL”) in Jebel Ali Free Zone Authority, Dubai, to raise funding from regional and international banks
and to hold its overseas investments.
Associate Companies
Dubai Wire FZE ("DW") (incorporated in the UAE) 20 20
The Group‟s subsidiaries have investments in the following subsidiaries:
Subsidiary Companies of TOPAZ
Nico Middle East Limited (incorporated in Bermuda) 100 100
Topaz Holding Limited (incorporated in the UAE) 100 100
Topaz Energy and Marine Services DMCC (incorporated in the UAE) 100 -
Nico Middle East Limited has a subsidiary BUE Marine Ltd, incorporated in UK, which operates through
its subsidiaries and engaged principally in charter of marine vessels and vessel management.
Topaz Energy and Marine Services DMCC is a wholly owned subsidiary of Topaz Energy and Marine
Limited, incorporated in 2010. It has been formed with the purpose of owning an office accommodation
for the group in Dubai Multi Commodities Centre (Free Zone) and providing administrative services to
group companies.
Topaz owns 50% of the shareholding in Mangistau Oblast Boat Yard LLP (“MOBY”), an entity
incorporated in Kazakhstan. In the previous year when the facilities of MOBY were under construction, it
was being entirely managed by the Group and hence treated as a subsidiary in the consolidated financial
statements of Topaz. However, since the commencement of operations in the current year, the Group has
re-examined the matter, and having acknowledged that the other partners in MOBY have become more
participative in the management and decisions are now being made jointly, has dealt with MOBY as a
jointly controlled entity (refer note 8).
Subsidiary Companies of TISCO
Rusail Catering and Cleaning Services LLC ("RCCS") 100 100
Supraco Limited (incorporated in Cyprus) 100 100
Renaissance Contract Services International LLC ("RCSI") 100 100
Al Wasita Catering Services LLC ("Al Wasita") 100 -

Renaissance Services SAOG and its Subsidiary Companies
NOTES TO THE CONSOLIDATED FINANCIAL STATEMENTS for the year ended 31 December 2010
- 25 -
6 SUBSIDIARIES AND ASSOCIATES (continued)
Al Wasita is wholly owned subsidiary of TISCO which was formed during 2010 to acquire the shares in
Al Wasita Emirates Catering Services LLC, a company incorporated in the UAE, which is engaged in the
supply of catering services (refer note 3).
Supraco Limited through its subsidiaries in Norway provides contract catering services. RCSI through its
subsidiaries in Angola, UAE and Qatar provide, catering and allied services in the respective countries.
RCSI subsidiaries in Iraq, Dubai and Abu Dhabi, UAE are dormant as at 31 December 2010.
Subsidiary Companies of UMS
Ownership interest (%)
2010 2009
United Press and Publishing Company LLC ("UPP") 100 100
Oryx Advertising Company WLL (incorporated in Qatar) 49 49
Subsidiary Company of NHI
Nakshatra Hospitality India Private Limited (incorporated in India) 100 100
Subsidiary Company of NTI
National Training Institute Qatar WLL (incorporated in Qatar) 100 100
Except as otherwise stated, the companies are incorporated in Oman.
7 INVESTMENTS
2010 2009
RO’000 RO‟000
Non-current investments
Investment in associates companies 1,343 975
Available for sale investments 391 391
────── ──────
1,734 1,366
══════ ══════
Investment in associates
As at 31 December 2010, the Group has an associate Dubai Wire FZE. The increase in carrying amount
relates to the Group‟s share in DW‟s profits.
Available for sale investments
Available for sale investments represents investments in Global Fasteners Limited (incorporated in the
Isle of Man), Fund for Development of Youth Projects SAOC and Industrial Management Technology
and Contracting LLC.

Renaissance Services SAOG and its Subsidiary Companies
NOTES TO THE CONSOLIDATED FINANCIAL STATEMENTS for the year ended 31 December 2010
- 26 -
8 INVESTMENTS IN JOINTLY CONTROLLED ENTITIES
The Group‟s share of income, expenses, assets and liabilities in the jointly controlled entities at
31 December are set out below:
2010 2009
RO’000 RO‟000
Current assets 9,293 6,282
Current liabilities (6,530) (2,366)
Non-current assets 8,167 4,193
Non-current liabilities (6,430) (2,769)
──────── ────────
Net assets 4,500 5,340
════════ ════════
Revenue 10,029 5,917
Cost of sales (8,858) (3,828)
Administrative expenses (1,493) (1,001)
Finance cost (373) (166)
Finance income - 1
Other income 9 -
Tax (39) (15)
──────── ────────
Net (loss) / profit for the year (725) 908
════════ ════════
Investments in jointly controlled entities are in:
2010 2009
% %
Nico Dososan Babcock (previously known
as Nico Mitsui Babcock) 50 50
DMS Jaya Marine WLL 51 51
Jaya DMS Marine Pte Ltd. 50 50
Mangistau Oblast Boat LLP (refer note 6) 50 50
════════ ════════
The above entities are incorporated in the UAE, Qatar, Singapore and Kazakhstan, respectively.
9 INVENTORIES AND WORK IN PROGRESS
2010 2009
RO’000 RO‟000
Stock and consumables – net 7,981 6,096
Work in progress 5,289 4,946
──────── ────────
13,270 11,042
════════ ════════

Renaissance Services SAOG and its Subsidiary Companies
NOTES TO THE CONSOLIDATED FINANCIAL STATEMENTS for the year ended 31 December 2010
- 27 -
10 TRADE AND OTHER RECEIVABLES
2010 2009
RO’000 RO‟000
Trade receivables - net 59,897 57,460
Prepayments and other receivables 20,598 15,365
Advances to suppliers and contractors 11,914 13,224
Amounts due from related parties (note 23) 1,370 777
──────── ────────
93,779 86,826
════════ ════════
As at 31 December 2010, trade receivables of RO 3,725,000 (2009: RO 3,902,000) were impaired.
Movements in the allowance for impairment of receivables were as follows:
2010 2009
RO’000 RO‟000
At 1 January 3,902 2,587
Charge for the year 533 1,450
Amounts written off (263) (125)
Unused amounts reversed (447) (10)
──────── ────────
At 31 December 3,725 3,902
════════ ════════
As at 31 December, the ageing of unimpaired trade receivables is as follows:
Past due but not impaired
Total
RO’000
Neither past
due nor
impaired
RO’000
< 30 days
RO’000
30 – 60
days
RO’000
60 – 90
day
RO’000
90 – 120
day
RO’000
>120 days
RO’000
2010 59,897 43,261 6,500 2,858 2,393 1,576 3,309
═════ ═════ ═════ ═════ ════ ════ ════
2009 57,460 35,057 14,727 2,070 1,492 1,861 2,253
═════ ═════ ═════ ═════ ════ ════ ════
Unimpaired receivables are expected, on the basis of past experience, to be fully recoverable. It is not the
practice of the Group to obtain collateral over receivables and the vast majority are, therefore, unsecured.
11 CASH AND CASH EQUIVALENTS
2010 2009
RO’000 RO‟000
Cash and bank balances 22,437 30,692
Bank borrowings (note 13) (3,485) (3,520)
──────── ────────
18,952 27,172
════════ ════════
Included in cash and bank balances are fixed and call deposits of RO 5,217,000 (2009: RO 10,364,000)
maintained with commercial banks. These are denominated mainly in Rial Omani, US Dollar, UAE
Dirhams and Qatari Rial and are short term in nature.

Renaissance Services SAOG and its Subsidiary Companies
NOTES TO THE CONSOLIDATED FINANCIAL STATEMENTS for the year ended 31 December 2010
- 28 -
12 TRADE AND OTHER PAYABLES
2010 2009
RO’000 RO‟000
Trade payables 22,792 20,167
Accrued expenses and other payables 33,507 38,703
Income tax payable 5,050 5,529
Amounts due to related parties (note 23) 1,073 361
──────── ────────
62,422 64,760
════════ ════════
13 BANK BORROWINGS
Certain of the Group‟s bank borrowings are secured by a registered first mortgage over Group‟s certain
assets, guarantees and assignment of receivables. Bank borrowings carries interest rates ranging from
3% to 9.5% per annum (2009: 6% to 9% per annum).
14 TERM LOANS AND LEASES
Term loans
1 year 2 -5 More than
31 December 2010 Total or less Years 5 years
RO’000 RO’000 RO’000 RO’000
Parent company – term loans 110,399 27,026 66,504 16,869
Parent company - subordinated loan 20,000 - 10,000 10,000
Subsidiary companies 154,417 29,282 103,362 21,773
──────── ──────── ──────── ────────
284,816 56,308 179,866 48,642
════════ ════════ ════════ ════════
1 year 2 -5 More than
31 December 2009 Total or less Years 5 years
RO‟000 RO‟000 RO‟000 RO‟000
Parent company 60,375 15,790 34,460 10,125
Subsidiary companies 126,986 22,494 95,051 9,441
──────── ──────── ──────── ────────
187,361 38,284 129,511 19,566
════════ ════════ ════════ ════════
Included in term loans from bank are the following:
Term loans in Parent Company
Term loans in Parent Company amounting to RO 110,399,000 (2009: RO 60,375,000) are secured by
charge over certain assets, investment rights on leasehold land, assignment of certain project receivables,
assignment of insurance interests in certain contract assets and guarantees.
Subordinated loan in Parent Company
In 2010 the Parent Company has raised a subordinated loan of RO 40,000,000 through an issue of
subordinated loan notes, which is secured by a second charge over the assets of the Parent Company and
its subsidiaries. The loan has been raised by the Parent Company for funding its subsidiary company,
TOPAZ for meeting the financing requirements of the expansion plans in Topaz‟s marine and
engineering businesses.

Renaissance Services SAOG and its Subsidiary Companies
NOTES TO THE CONSOLIDATED FINANCIAL STATEMENTS for the year ended 31 December 2010
- 29 -
14 TERM LOANS AND LEASES (continued)
The first drawdown of RO 20,000,000 of the loan was made on 6 December 2010. The second drawdown
of RO 20,000,000 will be made by 28 February 2011. The tenure of the loan is 7 years with repayment
of four annual installments of RO 10,000,000 with effect from November 2014. Pursuant to the
subordinated loan agreement, the Parent Company is required to restrict dividends, raise additional
capital and create a subordinated reserve by transferring an amount equal to 1/7th
of the outstanding
aggregate amount of loan notes out of annual profit after tax of the company from 31 December 2011.
The subordinated loan carries a fixed interest rate of 8.5% per annum.
Term loans in Subsidiaries
Term loans relate only to Topaz. The term loans, amounting to RO 154,417,000 are secured by a first
preferred mortgage over certain assets of the subsidiaries, the assignment of marine vessel insurance
policies, the assignment of the marine vessel charter lease income. The equipment finance loan is
secured against plant and machinery acquired with the proceeds of the loan. The property loan is secured
by first preferred mortgage over the underlying property.
The borrowing arrangements include undertakings to comply with various covenants like senior interest
cover, current ratio, debt to EBITDA ratio, gearing ratio, total assets to net worth ratio and equity ratio
including an undertaking to maintain a minimum net worth of TOPAZ which, at no time, shall be less
than RO 86,500,000 (2009: RO 62,000,000). Term loans carry interest rates ranging from 4.5% to 9.5%
per annum (2009: 4.5% to 7.5% per annum).
Leases
2010 2009
RO’000 RO‟000
Total lease payments outstanding as at 31 December - 1,223
Less: Due within a year (disclosed as current liability) - (210)
──────── ────────
Long term lease obligations (note 24 c) - 1,013
════════ ════════
Term loans and leases are disclosed in the statement of financial position as:
2010 2009
RO’000 RO‟000
Non current liabilities:
Term loans 228,508 149,077
Finance leases - 1,013
──────── ────────
228,508 150,090
════════ ════════
Current liabilities:
Term loans 56,308 38,284
Finance leases - 210
──────── ────────
56,308 38,494
════════ ════════

Renaissance Services SAOG and its Subsidiary Companies
NOTES TO THE CONSOLIDATED FINANCIAL STATEMENTS for the year ended 31 December 2010
- 30 -
15 NON CURRENT PAYABLE AND ADVANCES
2010 2009
RO’000 RO‟000
Deferred income 2,093 732
Income tax payable 5,431 5,506
Other payables and advances 2,347 11,597
──────── ────────
9,871 17,835
════════ ════════
16 STAFF TERMINAL BENEFITS
2010 2009
RO’000 RO‟000
Movements in the liability recognized in the statement of financial
position are as follows:
1 January 4,823 4,151
Addition on acquisition of a subsidiary 64 -
Accrued during the year 1,897 1,278
Payments during the year (1,117) (606)
──────── ────────
31 December 5,667 4,823
════════ ════════
Significant amount of terminal benefits as at 31 December 2010 is comprised of end of service
obligations of Topaz (2010: RO 3,520,000; 2009: RO 2,981,000). Principal actuarial assumptions
for Topaz at the reporting date are:
Normal retirement age : 60-65 years
Mortality, withdrawal and retirement: 5% turnover rate. Due to the nature of the benefit, which is a
lump sum payable on exit due to any cause, a combined single decrement rate has been used for
maturity, withdrawal and retirement.
Discount rate: 5.25% per annum
Salary increases: 3% - 5% per annum
The pension scheme of one of Group‟s subsidiary covers a total of 543 employees (2009: 477
employees). The pension scheme gives the right to defined future benefits, which are mainly dependent
on number of years worked, salary level at time of retirement and the amount of payment from the
national insurance fund. The obligations are covered through an insurance company. The calculated
pension obligations are based on actuarial valuation.
The actuarial valuations are based on assumptions of demographical factors normally used within the
insurance industry.
17 CAPITAL AND RESERVES
Share capital
The authorised share capital of the Parent Company comprises 400,000,000 ordinary shares of
RO 0.100 each (2009: 400,000,000 of RO 0.100 each). At 31 December 2010, the issued and fully paid
up share capital comprised 282,094,452 ordinary shares of RO 0.100 each (2009: 282,094,452 of
RO 0.100 each).

Renaissance Services SAOG and its Subsidiary Companies
NOTES TO THE CONSOLIDATED FINANCIAL STATEMENTS for the year ended 31 December 2010
- 31 -
17 CAPITAL AND RESERVES (continued)
Details of shareholders, who own 10% or more of the Parent Company's share capital, are as follows:
2010 2009
Number of
shares
‘000
%
Number of
shares
„000
%
Tawoos LLC 42,538 15.08 42,538 15.08
══════ ══════ ══════ ══════
Legal reserve
The Omani Commercial Companies Law of 1974 requires that 10% of an entity's net profit be
transferred to a non-distributable legal reserve until the amount of legal reserve becomes equal to one-
third of the entity's issued share capital. The legal reserve is not available for distribution. Legal
reserve also includes transfer relating to non Oman registered subsidiary companies as per the
respective regulations in their country of incorporation. The Group utilises the share premium for
transfers to legal reserve.
Treasury shares
These are shares held by certain subsidiaries in the Parent Company at the cost of RO 1,703,826
(2009: RO 1,703,826). Dividend received on these treasury shares have been directly transferred to
retained earnings and shown as movement in the statement of changes in equity. At 31 December 2010,
the subsidiaries held 14,554,586 shares (2009: 14,554,586) in the Parent Company. The market value
of these shares at 31 December 2010 was approximately RO 16,130,000 (2009: RO 11,130,000).
Treasury shares are pledged against a bank loan.
Share premium
The Group utilises the share premium for issuing bonus shares and transfers to legal reserve. No such
transfers took place during 2010.
Hedging reserve
The hedging reserve comprises the effective portion of the cumulative net change in the fair value of
cash flow hedging instruments related to hedged transactions that have not yet occurred.
Exchange reserve
The exchange reserve comprises all foreign currency differences arising from the translation of the
financial statements of foreign operations.

Renaissance Services SAOG and its Subsidiary Companies
NOTES TO THE CONSOLIDATED FINANCIAL STATEMENTS for the year ended 31 December 2010
- 32 -
18 NET ASSETS PER SHARE
Net assets per share is calculated by dividing the net assets at the year end attributable to the
shareholders of the Parent Company by the number of shares outstanding as follows:
2010 2009
Net assets
Net assets (RO „000) 195,832 168,417
Minority interest (RO „000) (23,514) (20,401)
─────── ───────
Net assets attributable to the shareholders of the Parent Company
(RO „000)
172,318
148,016
─────── ───────
Number of shares
Number of shares at 1 January („000) 282,094 245,299
Bonus shares issued („000) - 36,795
─────── ───────
282,094 282,094
Treasury shares (refer note 17) („000) (14,555) (14,555)
─────── ───────
Number of shares at 31 December („000) 267,539 267,539
─────── ───────
Net assets per share (RO) 0.644 0.553
════════ ════════
19 INCOME TAX
The expense relates to tax payable on the profits earned by the Group, as adjusted in accordance with
the taxation laws and regulations of various countries in which the Group operates.
2010 2009
RO’000 RO‟000
Charge for the year 6,501 4,181
════════ ════════
Current liability 5,050 5,529
Non current liability 5,431 5,506
──────── ────────
10,481 11,035
════════ ════════
Deferred tax asset
At 1 January 1,229 1,239
Debited to income statement (781) (10)
──────── ────────
At 31 December 448 1,229
════════ ════════
The deferred tax balance at 31 December 2010 comprises capital allowances in excess of depreciation
charge of RO 322,000 (2009: RO 1,115,000) and short term timing differences of RO 125,000 (2009:
RO 88,000).
The Parent Company and its Oman incorporated subsidiaries are subject to income tax at the rate of
12% of taxable income in excess of RO 30,000 in accordance with the income tax law of the Sultanate
of Oman.

Renaissance Services SAOG and its Subsidiary Companies
NOTES TO THE CONSOLIDATED FINANCIAL STATEMENTS for the year ended 31 December 2010
- 33 -
19 INCOME TAX (continued)
The Parent Company‟s assessments for the tax years 2005 to 2009 have not been finalised with the
Secretariat General for Taxation at the Ministry of Finance (the „Department‟).
The Parent Company has filed appeals to the Tax Committee and the Courts against certain decisions of
the Department on disallowances made by the Department in the assessments. The main issues under
the appeals are taxation of overseas income, taxation of overseas dividend, double taxation of
management fees paid by the subsidiaries to the parent company and disallowances relating to interest
and some specific expenses. The Parent Company has established provisions at 31 December 2010
against the potential tax liabilities which might arise in this regard. As required under the tax laws, the
Parent Company has paid the tax dues and are continuing to appeal to the higher authorities on some of
the disallowances made by the Department in assessments.
20 NET PROFIT FOR THE YEAR
Net profit for the year is stated after charging: 2010 2009
RO’000 RO‟000
Staff costs 82,896 78,408
════════ ════════
Net finance costs
Net interest expense 10,522 8,247
Reversal for derivative used for hedging (refer note 25) (184) (402)
─────── ───────
10,338 7,845
════════ ════════
21 BASIC AND DILUTED EARNINGS PER SHARE
Basic and diluted earnings per share is calculated by dividing the net profits for the year attributable to
the shareholders of the Parent Company by the weighted average number of shares as follows: 2010 2009
Net profit for the year attributable to the shareholders
of the Parent Company (RO„000)
27,648
25,085 ─────── ───────
Weighted average number of shares
Number of shares at 1 January („000) 282,094 282,094
Less: weighted average number of treasury shares („000) (14,555) (14,555) ─────── ───────
Weighted average number of shares („000) 267,539 267,539 ─────── ───────
Basic and diluted earnings per share (RO) 0.103 0.094 ════════ ════════

Renaissance Services SAOG and its Subsidiary Companies
NOTES TO THE CONSOLIDATED FINANCIAL STATEMENTS for the year ended 31 December 2010
- 34 -
22 DIVIDEND PER SHARE 2010 2009
Total distribution for the Shareholders (RO „000) 3,385 3,385
──────── ────────
Number of shares outstanding at 31 December („000) 282,094 282,094
──────── ────────
Distribution per share (RO) 0.012 0.012
════════ ════════
Cash dividend (RO „000) 3,385 3,385
Bonus shares, at par (RO „000) - -
──────── ────────
3,385 3,385
════════ ════════
The dividend proposed by the Board of Directors is subject to the approval of shareholders at the
Annual General Meeting (AGM) of the Company on 28 March 2011. Dividend for the year 2009 was
approved by the shareholders at the AGM held on 28 March 2010.
As required by CMA regulation, unclaimed dividends of previous years have been deposited with the
CMA Investors‟ Trust Fund. There were no unclaimed dividends for 2010.
23 RELATED PARTY TRANSACTIONS
The Group has entered into transactions with entities over which certain Directors are able to exercise
significant influence. In the ordinary course of business, such related parties provide goods, services
and funding to the Group. The Group also provides goods, services and funding to the related parties.
The Board of Directors believes that the terms of purchases, sales, provision of services and funding
arrangements are comparable with those that could be obtained from unrelated third parties.
The value of significant related party transactions during the year was as follows:
2010 2009
RO’000 RO‟000
Income
Service rendered and sales 408 941
════════ ════════
Advances due from related parties
Net advances 14 328
════════ ════════
Expenses
Services received and purchases 285 1,071
════════ ════════
Directors' remuneration and sitting fees
Remuneration 176 174
Sitting fees 24 26
════════ ════════
Remuneration and sitting fees above relate only to the Parent Company.
Out of above related party transactions, the following are the details of transactions entered into with
the related parties holding 10% or more interest in the Parent Company:
Service rendered and sales 20 20
════════ ════════

Renaissance Services SAOG and its Subsidiary Companies
NOTES TO THE CONSOLIDATED FINANCIAL STATEMENTS for the year ended 31 December 2010
- 35 -
23 RELATED PARTY TRANSACTIONS (continued)
Compensation of key management personnel
The remuneration of key management personnel during the year are as follows:
2010 2009
RO’000 RO‟000
Short-term benefits 1,737 1,631
Employees‟ end of service benefits 263 26
─────── ───────
2,000 1,657
═══════ ═══════
Topaz Energy and Marine Limited has paid RO 270,900 as remuneration to its Executive Chairman
who is also the Chairman of the Parent Company.
Amounts due from and due to related parties have been disclosed in notes 10 and 12 respectively.
Outstanding balances at the year-end arise in the normal course of business. For the year ended
31 December 2010, the Group has not recorded any impairment of amounts owed by related parties
(2009: Nil).
24 COMMITMENTS AND CONTINGENT LIABILITIES
2010 2009
RO’000 RO‟000
Commitments
Letters of credit 4,737 893
Capital expenditure commitments 39,297 67,223
════════ ════════
Contingent liabilities
Letters of guarantee 46,595 28,627
Bills discounted – receivables 1,987 -
════════ ════════
Litigation
In the previous year, one of the Group‟s customer cancelled contracts for building two marine vessels.
The Group is of the view that the cancellation is a breach of contract and a case has been filed in the
UK courts, challenging the cancellation. The matter is presently subject to litigation in the High Court
in London, and likely to be heard during the first quarter of 2011. The Management believes that, it is
unlikely that the Group will incur losses as a consequence of this breach of contract.

Renaissance Services SAOG and its Subsidiary Companies
NOTES TO THE CONSOLIDATED FINANCIAL STATEMENTS for the year ended 31 December 2010
- 36 -
25 LEASES
a) Operating leases - receivable
The Group leases its marine vessels under operating leases. The leases typically run for a period between
3 months to 10 years and are renewable for similar periods after the expiry date. The lease rental is usually
renewed to reflect market rentals. Future minimum lease rentals receivable under non-cancellable
operating leases are as follows as of 31 December:
2010 2009
RO’000 RO‟000
Within one year 64,507 58,898
Between one and five years 126,070 132,415
More than five years 52,044 54,430
──────── ────────
242,621 245,743
════════ ════════
b) Operating leases - payable
The Group has future minimum lease payments under operating leases for marine vessels with payments as
follows:
2010 2009
RO’000 RO‟000
Within one year 8,493 6,946
Between one and five years 23,855 6,537
More than five years 14,468 4,530
──────── ────────
46,816 18,013
════════ ════════
c) Finance lease commitments
The Group has entered into finance lease commitments with rentals payable as follows:
Present value of minimum lease payments
2010 2009
RO’000 RO‟000
Within one year - 210
After one year but not more than five years - 362
More than five years - 651
──────── ────────
Total minimum lease payments - 1,223
════════ ════════

Renaissance Services SAOG and its Subsidiary Companies
NOTES TO THE CONSOLIDATED FINANCIAL STATEMENTS for the year ended 31 December 2010
- 37 -
26 DERIVATIVE FINANCIAL INSTRUMENTS
The table below shows the positive and negative fair values of derivative financial instruments, which
are equivalent to the market values, together with the notional amounts analysed by the term to
maturity. The notional amount is the amount of a derivative‟s underlying asset, reference rate or index
and is the basis upon which changes in the value of derivatives are measured. The notional amounts
indicate the volume of transactions outstanding at year end and are neither indicative of the market risk
nor credit risk.
31 December 2010:
Notional amounts by term to maturity
Positive Negative Notional Over 1
fair fair amount Within 1 year to Over
value value Total year 5 years 5 years
RO’000 RO’000 RO’000 RO’000 RO’000 RO’000
Interest rate swaps - 2,903 70,562 5,726 57,394 7,442
________ _______ ________ ________ _______ _______
- 2,903 70,562 5,726 57,394 7,442
═══════ ══════ ═══════ ═══════ ══════ ══════
31 December 2009:
Notional amounts by term to maturity
Positive Negative Notional Over 1
fair fair amount Within 1 year to Over
value value Total year 5 years 5 years
RO’000 RO’000 RO’000 RO’000 RO’000 RO’000
Interest rate swaps - 2,870 45,335 1,093 44,242 -
Forward foreign
exchange contracts - 74 17,346 17,346 - -
________ ________ ________ ________ ________ ________
- 2,944 62,681 18,439 44,242 -
═══════ ═══════ ═══════ ═══════ ═══════ ═══════
The term loan facilities of the Group bear interest at US LIBOR plus applicable margins. In accordance with
the financing documents, the Group has fixed the rate of interest through Interest Rate Swap Agreements
("IRS") amounting to approximately RO 21,150,000 (2009: RO 21,150,000) at a fixed interest rate of 3.95%
(2009: 3.95%) per annum excluding margin, RO 4,120,000 (2009: RO 5,760,000) at a fixed margin of
4.89% (2009: 4.89%) per annum excluding margin, RO 19,230,000 (2009: RO 19,230,000) at the rate of
2% (2009: 2%) per annum excluding margin, and an amount of RO 3,230,000 (2009: RO 3,850,000) at the
rate of 3.25% (2009: 3.25%) per annum excluding margin and an amount of RO 22,810,000 (2009: nil) at
the rate of 1.97% (2009: nil) per annum excluding margin. At 31 December 2010, the US LIBOR was
approximately 0.46% (31 December 2009: 0.43%) per annum, whereas the Group has fixed interest at
3.95%, 4.89%, 2%, 3.25% and 1.97% per annum (2009: 3.95%, 4.89%, 2% and 3.25% per annum).
Accordingly, the gaps between US LIBOR and fixed rate under IRS was approximately 3.49%, 4.43%,
1.54%, 2.79% and 1.51% (2009: 3.52%, 4.46%, 1.57% and 2.82%) per annum.
Based on the interest rates gaps, over the life of the IRS, the indicative losses were assessed at
approximately RO 2,900,000 (2009: RO 2,900,000) by the counter parties to IRS. In case the Group
terminates the IRS at 31 December 2010, it may incur losses to the extent of approximately RO 2,900,000
(2009: RO 2,860,000). Consequently, in order to comply with International Accounting Standard 39
"Financial Instruments: Recognition and Measurement" fair value of the hedge instruments' indicative losses
in the amount of approximately RO 2,900,000 (2009: RO 2,860,000) has been recorded under accounts
payables and accruals and the impact for the year amounting to RO 180,000 (2009: RO 510,000) has been
recorded under finance costs and RO 140,000 (2009: RO 90,000) has been recognized in the hedging
reserve.

Renaissance Services SAOG and its Subsidiary Companies
NOTES TO THE CONSOLIDATED FINANCIAL STATEMENTS for the year ended 31 December 2010
- 38 -
26 DERIVATIVE FINANCIAL INSTRUMENTS (continued)
Similarly, an amount of RO nil (2009: RO 70,000) has been recorded under accounts payable and accruals
in respect of forward foreign exchange contracts and the net impact for the year amounting to RO nil (2009:
RO 100,000) has been recorded under finance costs (refer note 19).
The Parent Company has entered into USD LIBOR callable accruals swaps as an interest cost reduction
strategy. The accruals range is between 0% to 7% (2009: 0% to 7%) per annum. Any gains or loss related to
these swaps are recognised as finance cost.
27 OPERATING SEGMENTS
The Group has three reportable segments, as described below, which are the Group‟s strategic business
units. The strategic business units offer different products and services, and are managed separately because
they require different technology and marketing strategies. For each of the strategic business units, the
Group‟s CEO reviews internal management reports on a regular basis. The following summary describes the
operations in each of the Group‟s reportable segments:
Engineering services: includes ship repair, ship building and fabrication and maintenance services for the
oil and gas industry.
Marine services: includes vessel chartering to oil and gas off shore companies.
Contract services: includes facilities management, facilities establishment, contract catering and operations
and maintenance services.
Other operations include the provision of training services, media publishing, advertising and distribution,
manufacturing, general trading, investments and related activities.
Information regarding the results of each reportable segment is included below. Performance is measured
based on segment profit before income tax, as included in the internal management reports that are reviewed
by the Group‟s CEO. Segment profit is used to measure performance as management believes that such
information is the most relevant in evaluating the results of certain segments relative to other entities that
operate within these industries. Inter-segment pricing is determined on an arm‟s length basis.

Renaissance Services SAOG and its Subsidiary Companies
NOTES TO THE CONSOLIDATED FINANCIAL STATEMENTS for the year ended 31 December 2010
- 39 -
27 OPERATING SEGMENTS (continued)
Information about reportable segments:
Engineering services Marine services Contract services Others Adjustments Total
2010 2009 2010 2009 2010 2009 2010 2009 2010 2009 2010 2009
RO’000 RO‟000 RO’000 RO‟000 RO’000 RO‟000 RO’000 RO‟000 RO’000 RO‟000 RO’000 RO‟000
Total revenues 77,376 77,904 94,931 95,500 84,387 65,035 14,083 10,304 (3,552) (503) 267,225 248,240
Less: Inter-segment revenue (11,822) (313) (1,705) - (174) (126) (95) (211) - - (13,796) (650)
_______ ______ ______ ______ ______ ______ ______ ______ ______ ______ ______ ______
External revenue 65,554 77,591 93,226 95,500 84,213 64,909 13,987 10,093 (3,552) (503) 253,429 247,590
_______ ______ ______ ______ ______ ______ ______ ______ ______ ______ ______ ______
Net finance (cost)/income (353) (463) (9,005) (7,000) (1,473) (574) 493 (210) - 402 (10,338) (7,845)
Depreciation and amortisation (3,143) (2,452) (13,558) (13,427) (4,412) (4,536) (858) (551) - (255) (21,971) (21,221)
Reportable segment profit after
income tax 2,732
3,625 22,331
22,639 9,540
7,017 1,341
(3,992) (3,661)
(779) 32,283
28,510
_______ ______ ______ ______ ______ ______ ______ ______ ______ ______ ______ ______
Reportable segment assets 56,735 58,288 373,054 277,366 117,576 91,881 50,017 39,091 (35,290) (18,687) 562,092 447,939
Capital expenditure 2,819 9,762 119,566 45,064 12,741 30,955 2,146 412 (475) - 136,797 86,193
Reportable segment liabilities 33,800 39,521 220,849 150,352 71,500 45,875 66,251 58,880 (26,140) (15,106) 366,260 279,522
_______ ______ ______ ______ ______ ______ ______ ______ ______ ______ ______ ______

Renaissance Services SAOG and its Subsidiary Companies
NOTES TO THE CONSOLIDATED FINANCIAL STATEMENTS for the year ended 31 December 2010
- 40 -
27 OPERATING SEGMENTS (continued)
Geographical segments:
Revenue as based on the geographical location of the business activities is as follows:
2010 2009
RO’000 RO‟000
Oman 56,075 42,943
Middle East and North Africa (excluding Oman) 85,201 135,665
Caspian 70,174 51,553
Others 41,979 17,429
─────── ───────
253,429 247,590
════════ ════════
28 FINANCIAL INSTRUMENTS AND FINANCIAL RISK MANAGEMENT
Financial instruments carried on the statement of financial position comprise investments, trade
receivables, amount due from related parties, cash in hand and at bank, term loans, bank borrowings,
trade and other payables and amount due to related parties.
The Group has exposure to the following risks from its use of financial instruments:
(i) Credit risk
(ii) Liquidity risk
(iii) Market risk
This note presents information about the Group‟s exposure to each of the above risks, the Group‟s
objectives, policies and processes for measuring and managing risk, and the management of capital.
Further quantitative disclosures are included throughout these financial statements.
The Board of Directors has overall responsibility for the establishment and oversight of the Group‟s
risk management framework. The Group‟s risk management policies are established to identify and
analyse the risks faced by the Group, to set appropriate risk limits and controls, and to monitor risks
and adherence to limits. Risk management policies and systems are reviewed regularly to reflect
changes in market conditions and the Group‟s activities. The Group, through its training and
management standards and procedures, aims to develop a disciplined and constructive control
environment in which all employees understand their roles and obligations.
The Audit Committee oversees how management monitors compliance with the Group‟s risk
management policies and procedures, and reviews the adequacy of the risk management framework in
relation to the risks faced by the Group. The Audit Committee is assisted in its oversight role by
Internal Audit. Internal Audit undertakes both regular and ad hoc reviews of risk management controls
and procedures, the results of which are reported to the Audit Committee.

Renaissance Services SAOG and its Subsidiary Companies
NOTES TO THE CONSOLIDATED FINANCIAL STATEMENTS for the year ended 31 December 2010
- 41 -
28 FINANCIAL INSTRUMENTS AND FINANCIAL RISK MANAGEMENT (continued)
Credit risk
Credit risk is the risk of financial loss to the Group if a customer or counterparty to a financial
instrument fails to meet its contractual obligations, and arises principally from the receivables from
customers and investments.
The carrying amount of financial assets represents the maximum credit exposure. The maximum exposure
to credit risk at the statement of financial position date was:
2010 2009
RO’000 RO‟000
Investments 1,749 2 1,378
Trade receivables 59,897 57,460
Amount due from related parties 1,370 777
Cash and bank balances 22,437 30,692
85,453 90,307
The Group has a credit policy in place and exposure to credit risk is monitored on an ongoing basis.
Credit evaluations are generally performed on all customers requiring credit over specified amounts.
The Group does not require collateral in respect of financial assets.
The maximum exposure to credit risk is represented by the carrying amount of each financial asset in
the statement of financial position.
With respect to credit risk arising from the other financial assets of the Group, including cash and cash
equivalents, and derivative instruments with positive values, the Group‟s exposure to credit risk arises
from default of the counterparty, with a maximum exposure equal to the carrying amount of these
instruments.
Liquidity risk
Liquidity risk is the risk that the Group will not be able to meet its financial obligations as they fall due.
The Group‟s approach to managing liquidity is to ensure, as far as possible, that it will always have
sufficient liquidity to meet its liabilities when due, under both normal and stressed conditions, without
incurring unacceptable losses or risking damage to the Group‟s reputation.
The Group limits its liquidity risk by ensuring that bank facilities are available. Short term loans and
overdraft are, on average, utilized for period of 90 days to bridge the gap between collections of
receivables and settlement of payables during the month.
The contractual maturities of financial liabilities, including estimated interest payments and excluding the
impact of netting agreements at statement of financial position date is as below:
31 December 2010 Carrying
amount
RO’000
Contractual
cash flows
RO’000
Upto
1 year
RO’000
1 year to
5 years
RO’000
More than
5 years
RO’000
Term loans and leases 284,816 333,262 68,866 210,515 53,881
Bank borrowings 3,485 3,485 3,485 - -
Trade and other payables 57,372 57,372 57,372 - -
345,673 394,119 129,723 210,515 53,881

Renaissance Services SAOG and its Subsidiary Companies
NOTES TO THE CONSOLIDATED FINANCIAL STATEMENTS for the year ended 31 December 2010
- 42 -
28 FINANCIAL INSTRUMENTS AND FINANCIAL RISK MANAGEMENT (continued)
Liquidity risk (continued)
31 December 2009 Carrying
amount
RO‟000
Contractual
cash flows
RO‟000
Upto
1 year
RO‟000
1 year to 5
years
RO‟000
More than 5
years
RO‟000
Term loans and leases 188,584 213,477 41,952 144,218 27,307
Bank borrowings 3,520 3,520 3,520 - -
Trade and other payables 87,418 87,418 64,760 22,658 -
279,522 304,415 110,232 166,876 27,307
Market risk
Market risk is the risk that changes in market prices, such as foreign exchange rates, interest rates and
equity prices will affect the Group‟s income or the value of its holdings of financial instruments. The
objective of market risk management is to manage and control market risk exposures within acceptable
parameters, while optimizing the return on risk.
The Group also enters into derivative transactions, primarily interest rate swaps and forward currency
contracts. The purpose is to manage the interest rate and currency risks arising from the Group‟s operations
and its sources of finance.
Currency risk
Trade accounts payable include amount due in foreign currencies, mainly US Dollars, Euros, Pounds
Sterling, UAE Dirham and Norwegian Krone.
The table below indicates the Group‟s foreign currency exposure at 31 December, as a result of its
monetary assets and liabilities. The analysis calculates the effect of a reasonably possible movement of the
RO currency rate against the foreign currencies, with all other variables held constant, on the profit or loss
(due to the fair value of currency sensitive monetary assets and liabilities).
Effect on profit before tax
Increase/decrease in respective
Currency rate to the RO ‘000
2010 +5% -5%
Euro (EUR) 23 (23)
Azerbaijan Manat (MNT) 18 (18)
Kazakhstan Tenge (KZT) 12 (12)
UK Pound (GBP) 6 (6)
Norwegian Krone (NOK) 38 (38)
Japanese Yen (JPY) 3 (3)
Singapore Dollars (SGD) 16 (16)

Renaissance Services SAOG and its Subsidiary Companies
NOTES TO THE CONSOLIDATED FINANCIAL STATEMENTS for the year ended 31 December 2010
- 43 -
28 FINANCIAL INSTRUMENTS AND FINANCIAL RISK MANAGEMENT (continued)
Currency risk (continued)
Effect on profit before tax
Increase/decrease in respective
Currency rate to the RO ‘000
2009 +5% -5%
Euro (EUR) (39) 39
Azerbaijan Manat (MNT) (15) 15
Kazakhstan Tenge (KZT) (30) 30
UK Pound (GBP) (14) 14
Norwegian Krone (NOK) (32) 32
The Group is also exposed to foreign exchange risk on sales, purchases, receivables and payables arising
primarily from GCC currencies and US Dollar exposures which are pegged to the Omani Rial.
Interest rate risk
The Group's borrowings are on fixed as well as floating interest rate basis. The Group is exposed to
interest rate risk due to fluctuation in the market interest rate of floating interest rate borrowings.
The following table demonstrates the sensitivity of the statement of comprehensive income to
reasonably possible changes in interest rates, with all other variables held constant.
The sensitivity of the profit or loss is the effect of the assumed changes in interest rates on the Group‟s
profit for the year, based on the floating rate financial assets and financial liabilities held at
31 December 2010.
Increase/decrease
in basis points
Effect on profit
for the year
RO’000
2010
Borrowings converted to Rial Omani +15 (234)
Borrowings converted to Rial Omani -10 156
2009
Borrowings converted to Rial Omani +15 (216)
Borrowings converted to Rial Omani -10 144
Other market price risk
Equity price risk arises from available-for-sale equity securities. Management of the Group monitors the
mix of debt and equity securities in its investment portfolio based on market indices. Material investments
within the portfolio are managed on an individual basis and all buy and sell decisions are approved by the
Board of Directors.
Capital management
The Group‟s policy is to maintain an optimum capital base to maintain investor, creditor and market
confidence to sustain future growth of business as well as return on capital.

Renaissance Services SAOG and its Subsidiary Companies
NOTES TO THE CONSOLIDATED FINANCIAL STATEMENTS for the year ended 31 December 2010
- 44 -
29 FAIR VALUE OF FINANCIAL INSTRUMENTS
Certain of the Group‟s accounting policies and disclosures require the determination of fair value, for
non-financial assets. Fair values have been determined for measurement and / or disclosure purposes
based on the following methods. When applicable, further information about the assumptions made in
determining fair values is disclosed in the notes specific to that asset.
Derivatives
The fair value of interest rate swaps is based on broker quotes. Those quotes are tested for
reasonableness by discounting estimated future cash flows based on the terms and maturity of each
contract and using market interest rates for a similar instrument at the measurement date. Fair values
reflect the credit risk of the instrument and include adjustments to take account of the credit risk of the
Group entity and counterparty when appropriate.
Financial instruments comprise financial assets and financial liabilities. The fair value of derivatives is set out in note 26. The fair values of other financial instruments are not
materially different from their carrying values.
Fair value hierarchy
The table below analyses financial instruments carried at fair value, by valuation method. The different
levels have been defined as follows:
Level 1: quoted prices (unadjusted) in active markets for identical assets or liabilities;
Level 2: inputs other than quoted prices included within Level 1 that are observable for the
asset or liability, either directly (i.e., as prices) or indirectly (i.e., derived from prices);
Level 3: inputs for the asset or liability that are not based on observable market data
(unobservable inputs).
Level 1
RO‟000
Level 2
RO‟000
Level 3
RO‟000
Total
RO‟000
31 December 2010
Investments 15 - 391 406
Derivative financial instruments - (2,903) - (2,903)
31 December 2009
Investments 12 - 391 403
Derivative financial instruments - (2,944) - (2,944)
30 KEY SOURCES OF ESTIMATION UNCERTAINTY
Estimation uncertainty
The key assumptions concerning the future and other key sources of estimation uncertainty at the statement
of financial position date, that have a significant risk of causing a material adjustment to the carrying
amounts of assets and liabilities within the next financial year are discussed below.
Impairment of goodwill
The Group determines whether goodwill is impaired at least on an annual basis. This requires an
estimation of the value in use of the cash-generating units to which the goodwill is allocated. Estimating
the value in use requires the Group to make an estimate of the expected future cash flows from the cash-
generating unit and also to choose a suitable discount rate in order to calculate the present value of those
cash flows. The net carrying amount of goodwill at 31 December 2010 was RO 38,688,000 (2009:
RO 33,992,000).

Renaissance Services SAOG and its Subsidiary Companies
NOTES TO THE CONSOLIDATED FINANCIAL STATEMENTS for the year ended 31 December 2010
- 45 -
30 KEY SOURCES OF ESTIMATION UNCERTAINTY (continued)
Impairment of vessels
The Group determines whether its vessels are impaired when there are indicators of impairment as
defined in IAS 36. This requires an estimation of the value in use of the cash-generating unit which is
the vessel owning and chartering segment. Estimating the value in use requires the Group to make an
estimate of the expected future cash flows from this cash-generating unit and also to choose a suitable
discount rate in order to calculate the present value of those cash flows. The carrying value of the
vessels as at 31 December 2010 was RO 292,000,000 (2009: RO 196,000,000).
Impairment of accounts receivable
An estimate of the collectible amount of trade accounts receivable is made when collection of the full
amount is no longer probable. For individually significant amounts, this estimation is performed on an
individual basis. Amounts which are not individually significant, but which are past due, are assessed
collectively and a provision applied according to the length of time past due, based on historical
recovery rates.
At the statement of financial position date, gross trade accounts receivable were RO 63,622,000 (2009:
RO 61,362,000) and the provision for doubtful debts was RO 3,725,000 (2009: RO 3,902,000). Any
difference between the amounts actually collected in future periods and the amounts expected will be
recognised in the income statement.
Impairment of inventories
Inventories are held at the lower of cost and net realisable value. When inventories become old or
obsolete, an estimate is made of their net realisable value. For individually significant amounts this
estimation is performed on an individual basis. Amounts which are not individually significant, but
which are old or obsolete, are assessed collectively and a provision applied according to the inventory
type and the degree of ageing or obsolescence, based on historical selling prices.
At the statement of financial position date, gross inventories were RO 8,596,000 (2009: RO 6,675,000)
with provisions for old and obsolete inventories of RO 615,000 (2009: RO 579,000). Any difference
between the amounts actually realised in future periods and the amounts expected will be recognised in
the income statement.
Useful lives of property, plant and equipment
The useful lives, residual values and methods of depreciation of property, plant and equipment is
reviewed, and adjusted if appropriate, at each financial year end. In the review process, the Group takes
guidance from recent acquisitions, as well as market and industry trends.
Provision for tax
The Group reviews the provision for tax on a regular basis. In determining the provision for tax, laws of
particular jurisdictions (where applicable entity is registered) are taken into account. The management
considers the provision for tax to be a reasonable estimate of potential tax liability after considering the
applicable laws and past experience.
Effectiveness of hedge relationship
At the inception of the hedge, the management documents the hedging strategy and performs hedge
effectiveness testing to assess whether the hedge is effective. This exercise is performed at each
reporting date to assess whether the hedge will remain effective throughout the term of the hedging
instrument. As at the reporting date the cumulative fair value of the interest rate swap was RO
2,903,000 (2009: RO 2,944,000).

Renaissance Services SAOG and its Subsidiary Companies
NOTES TO THE CONSOLIDATED FINANCIAL STATEMENTS for the year ended 31 December 2010
- 46 -
30 KEY SOURCES OF ESTIMATION UNCERTAINTY (continued)
Accounting for investments
The Group reviews its investment in entities to assess whether the Group has control, joint control or
significant influence over the investee. This includes consideration of the level of shareholding held by
the Group in the investee as well as other factors such as representation on the Board of Directors of the
investee, terms of any agreement with the other shareholders etc. Based on the above assessment the
Group decides whether the investee needs to be consolidated, proportionately consolidated or equity
accounted in accordance with the accounting policy of the Group (also refer note 2).
31 SUBSEQUENT EVENTS
Subsequent to the reporting date, Topaz has established a new wholly owned subsidiary Topaz Energy
and Marine plc, UK, with the objective of listing Topaz in the London Stock Market and raising equity
capital from the public markets. Topaz is in the process of seeking approvals from the various stake
holders and the UK Listing Authority. The proceeds from the capital raised will be used to finance the
future growth plans of Topaz.
32 COMPARATIVE FIGURES
Certain comparative figures for the previous year have been reclassified, where necessary, in order to
conform to the current year‟s presentation.