Remuneration’s role in the EVP decision-making process
115
MBA 2011/2012 Remuneration’s role in the EVP decision-making process Stephan van der Merwe 11365669 A research project submitted to the Gordon Institute of Business Science, University of Pretoria, in partial fulfilment of the requirements for the degree of Master of Business Administration. Supervisor: Dr Mark Bussin 7 November 2012 Copyright © 2013, University of Pretoria. All rights reserved. The copyright in this work vests in the University of Pretoria. No part of this work may be reproduced or transmitted in any form or by any means, without the prior written permission of the University of Pretoria. © University of Pretoria
Transcript of Remuneration’s role in the EVP decision-making process

MBA 2011/2012
Remuneration’s role in the EVP decision-making process
Stephan van der Merwe
11365669
A research project submitted to the Gordon Institute of Business Science,
University of Pretoria, in partial fulfilment of the requirements for the degree of
Master of Business Administration.
Supervisor:
Dr Mark Bussin
7 November 2012
Copyright © 2013, University of Pretoria. All rights reserved. The copyright in this work vests in the University of Pretoria. No part of this work may be reproduced or transmitted in any form or by any means, without the prior written permission of the University of Pretoria.
©© UUnniivveerrssiittyy ooff PPrreettoorriiaa
Page i
Abstract
The key objective of this study was to determine the importance of remuneration in the
organisational employer value proposition (EVP) decision-making process, who the
EVP decision makers in organisations are, and whether EVP strategy is aligned with
the organisational strategy.
A quantitative study, using a survey as data-collection method, was conducted. The
survey was developed to explore the importance of remuneration in the EVP process
and to gather data regarding EVP decision makers and the alignment of EVP to
organisational strategy. A total of 101 respondents participated in this study, and
content analysis was used to interpret the data. The data were collected via
SurveyMonkey and statistically analysed using SPSS.
The findings indicate that remuneration and all of its components are crucial to the
process of EVP decision making. The findings also indicate the importance of aligning
EVP strategy to organisational strategy. The main EVP decision makers in
organisations are the CEO and the Human Resources Manager. Organisations need
to find the correct mix of decision makers in this process to optimise value.
Organisations should also ensure alignment of the EVP with organisational strategy,
and implement an optimal remuneration strategy to ensure the best possible EVP. A
relationship framework was developed to graphically represent the findings of the
study.

Page ii
List of key words:
EVP: Employer Value Proposition
Role players: Individuals responsible for the planning of the EVP
Decision makers: Individuals responsible for the planning of the EVP
Remuneration: A component of EVP
Alignment: The alignment of the EVP with the organisation's strategy

Page iii
Decleration
I declare that this research project is my own work. It is submitted in partial fulfilment
of the requirements for the degree of Master of Business Administration at the Gordon
Institute of Business Science, University of Pretoria. It has not been submitted before
for any degree or examination in any other University. I further declare that I have
obtained the necessary authorisation and consent to carry out this research.
Signature: _________________
Name: Stephan van der Merwe
Date: 7 November 2012

Page iv
Acknowledgements
There are people that supported and inspired me during this project and the 31 years
leading to this project.
Firstly, I would like express my sincere gratitude and appreciation to my supervisor, Dr.
Mark Bussin, for his insights, support, and guidance throughout the research project.
You made more than enough time to share your amazing knowledge in the most
respectful of ways.
To my sister, Xenia Goosen, a special word of thanks and acknowledgement. I enjoy
being your student, brother, and especially your friend.
I would also like to thank my parents, the people who inspire me most in life. I can’t
express my gratitude and love for you in mere words.
To the rest of my family and friends, who supported me throughout the MBA, thank you
for your patience and understanding.

Page v
Contents
Chapter 1: Introduction .............................................................................................................. 1
1.2 Problem statement .......................................................................................................... 4
Chapter 2: Literature review ..................................................................................................... 7
2.1 Rewards ............................................................................................................................ 7
2.1.1 Motivation .................................................................................................................. 7
2.1.2 Total reward systems ............................................................................................... 9
2.1.3 The WorldatWork model ........................................................................................ 13
2.1.4 The Towers Perrin Total Reward Model ............................................................. 14
2.1.5 The Armstrong and Brown Total Reward Model ............................................... 16
2.1.6 The Zingheim and Schuster Total Reward Model ............................................. 16
2.1.7 Total guaranteed packages .................................................................................. 17
2.2 The employer value proposition (EVP) ....................................................................... 18
2.3 Decision making ............................................................................................................. 23
2.3.1 Strategic reward management ............................................................................. 26
2.4 Summary ......................................................................................................................... 28
Chapter 3: Research objective ............................................................................................... 30
3.1 Research questions ....................................................................................................... 30
Chapter 4: Research methodology and design ................................................................... 32
4.1 Methodology ................................................................................................................... 32
4.1.1 Research design and type .................................................................................... 32
4.1.2 Population ................................................................................................................ 33
4.1.3 Survey design ......................................................................................................... 34
4.1.3.1 Control variables ................................................................................................ 36
4.1.3.2 Remuneration .................................................................................................... 37
4.1.3.3 Decision making ................................................................................................ 37
4.1.3.4 EVP...................................................................................................................... 37
4.2 Unit of analysis ............................................................................................................... 38
4.3 Sampling method ........................................................................................................... 38
4.4 Data-gathering method ................................................................................................. 38
4.5 Data analysis .................................................................................................................. 39
4.6 Research limitations ...................................................................................................... 40
Chapter 5: Results .................................................................................................................... 41
5.1 Demographics of the sample ....................................................................................... 41

Page vi
5.2 Results and measurements ......................................................................................... 45
5.2.1 Strategy in the current role .................................................................................... 45
5.2.2 The extent of EVP decision-making your current role .................................... 46
5.2.3 Importance of different components in total package ....................................... 46
5.2.4 Results from t-tests ................................................................................................ 47
5.2.5 Decision makers ..................................................................................................... 51
5.2.6 Pearson correlation ................................................................................................ 53
5.2.7 Employer brand....................................................................................................... 56
5.2.8 Alignment of EVP and strategy ............................................................................ 57
5.2.9 The emphasis organisations place on remuneration components when
planning EVP. ................................................................................................................... 61
5.2.10 The emphasis that organisations should place on remuneration
components in their EVP ................................................................................................. 65
5.3 Cross-tabulations ........................................................................................................... 69
5.4 Regression analysis ..................................................................................................... 74
Chapter 6: Discussion of results ............................................................................................ 77
6.1 Research Question 1 .................................................................................................... 77
6.1.1 Remuneration .......................................................................................................... 78
6.1.2 Total reward package ............................................................................................ 79
6.1.3 Opinion of the job levels ........................................................................................ 80
6.1.4 Conclusion ............................................................................................................... 81
6.2 Research Question 2 .................................................................................................... 81
6.2.1 The alignment ......................................................................................................... 81
6.2.2 Conclusion ............................................................................................................... 82
6.3 Research Question 3 .................................................................................................... 82
6.3.1 Role players ............................................................................................................ 83
6.3.2 EVP decision makers vs. business strategy decision makers......................... 83
6.3.3 Cross-tabulation ...................................................................................................... 84
6.3.4 Conclusion ............................................................................................................... 84
6.4 Conclusion ...................................................................................................................... 85
6.4.1 EVP planning framework ....................................................................................... 85
Chapter 7: Conclusion ............................................................................................................. 88
7.1 Introduction ..................................................................................................................... 88
7.2 Main findings of the study ............................................................................................. 88
7.3 Recommendations ......................................................................................................... 90
7.4 Limitations of the research ........................................................................................... 91

Page vii
7.5 Suggestions for future research .................................................................................. 92
7.6 Conclusion ...................................................................................................................... 93
List of references: ..................................................................................................................... 94
Appendix 1: Research Survey ................................................................................................ 99

Page 1
Chapter 1: Introduction
“The importance of employee commitment and loyalty has never been more significant than
in today’s context, where the war for talent is rife, and skilled employees have a greater
choice of employment, both locally and globally” (Munsamy & Venter, 2009). Bussin (2003)
states that the management of remuneration was once straight forward, with a strong link
between job level and pay. This is no longer the case, due to the evolution to more complex
remuneration theories and practices.
It can be argued that striving to earn compensation in order to gain safety is part of human
nature (Maslow, 1943), but does money really motivate? This question has been asked for
decades, and many theories have been developed to answer it, to no avail (Bussin, 2009).
Managers do not know how to manage the remuneration process and align the process with
the organisational strategy. “One of the biggest challenges that managers face in executing
business strategies to achieve competitive advantage is the employment of motivational
techniques that build wholehearted commitment to operating excellence” (Arnolds & Venter,
2008, p. 15). One of the ways of achieving this competitive advantage is for managers and
organisations to concentrate on strategic human resources management. The need for
alignment of human resources management with the organisation's business strategy is the
central premise of strategic human resource management theory (Batt, 2007).
Ferguson and Brohaugh (2009) suggest that companies have to concentrate on employee
retention in the good and the bad times ‒ there is a war for talent. Some of the reasons that
Ferguson and Brohaugh give for focusing on employee retention in the good and the bad
times include:
Preserving institutional memory;
Controlling acquisition costs;
Reducing customer attrition;
Maintaining brand loyalty; and
Enhancing the customer experience.
Page 2
A 2008 Accenture study showed that 70% of all customers changed provider in the previous
year. Many of the customers ascribed the change to poor service (Ferguson & Brohaugh,
2009).
A study by Maxwell and Knox (2012) shows that some of the attributes that employees
consider important in an organisation are different in each organisation, implying that
decision makers should understand what employees want when developing the employer's
brand (Knox & Maxwell, 2012).
The present researcher will attempt to answer this question in part by exploring the role of
remuneration in an organisation’s total employer value proposition (EVP).
Remuneration refers to the way in which employees are rewarded at work (Bach, 2005).
Bach (2005) expands the definition by stating that rewards represent an array of returns
offered in exchange for a collection of employee services.
EVP includes components such as pay and benefit programmes, development opportunities,
and work environment (Finney, 2010). EVP is closely related to employer branding (Barrow
& Mosley, 2005), and the two concepts are often used interchangeably in literature, but EVP
is, in fact, merely one aspect of employer branding. EVP broadly refers to what the
employee can expect from the company, and what the company expects to give the
employee.
The present study will further explore the role of remuneration, as one of the components of
EVP, in organisations’ EVP decision-making processes. Most EVP theories support the
notion that remuneration forms part of the EVP framework, and that remuneration could be
sub-divided into various components. Sartain and Schuman (2006) suggest that
remuneration can be divided into base pay, bonus, external equity, health benefits, internal
equity, and retirement benefits.
The effect of the remuneration components (guaranteed package, long-term incentives, and
short-term incentives) on the EVP decision making will also be explored in the study.
Guaranteed package found a place in the South African labour market in the eighties, when
companies were exposed to open-ended liabilities and uncapped employment costs (Bussin,
2008). The remuneration structures supported discriminatory practices, which put firms at
risk of considerable expenses associated with employee benefits (Bussin, 2008). Tax laws
have also since changed, closing the gap between taxable income and earnings.
Page 3
International accounting standards have ensured that financial implications are accounted
for, and employers have eliminated open-ended liabilities (Bussin, 2008).
A guaranteed package includes the following components: basic salary, fixed bonus, car
allowance, house allowance, fringe benefits, and employer contributions to pension and
provident funds (Bussin, 2008). The question is whether a guaranteed package is still
relevant in South Africa today (Bussin, 2008).
Incentives are generally used to align rewards with performance (Erasmus & Schenk, 2008).
Erasmus and Schenk (2008) propose the following reasons for introducings incentives as
remuneration:
to increase an organisation's competitiveness;
To stimulate performance by linking incentives to targets;
To reward better performance; and
To control fixed remuneration costs.
Long-term incentives are structured similarly to bonuses, but are awarded for performance
over multiple years (Eckbo, 2008). Long-term incentives' popularity in healthcare firms in the
US grew from 14% in 2006 to 25% in 2011 (Quirk, 2012). Whether this is a trend that
permeates other sectors will be explored in the present study.
A survey on performance-based pay strategies by FSA-Contact in 1998 produced the
following findings: 77% of the firms that had shown a profit over a three-year period had
implemented short-term incentives, and 62% of all firms that responded to the study used
short-term incentives (Erasmus & Schenk, 2008). The present researcher will explore
whether short-term incentives have any influence on the EVP decision-making process.
Today, organisations acknowledge the importance of reward programmes in achieving
business goals (Gross & Friedman, 2004). In addition, organisations are starting to realise
that they have to implement a reward strategy that supports their specific human capital
strategy. The definition of reward has also expanded over time. Historically, the term
'reward' was only interpreted in monitory terms, but has expanded to encompass the entire
value proposition that the employer offers its employees (Gross & Friedman, 2004).
According to Aghazadeh (2003), human resources management needs to change as the
business environment changes. Aghazadeh (2003) also describes the HR department of

Page 4
the past as little more than an administrative necessity helping the organisation to hire and
fire. HR needs to represent the organisation's vision while having a clear and functional
perception of the operational management needs. They have to align their human
resources procedures with the organisation's goals and procedures (Aghazadeh, 2003).
It is, thus, crucial for companies to strategically plan their reward practices and incorporate
them into their total strategic plan. A company with a superior employment offering is one
that aligns its employment offering with its corporate brand and the needs of its consumers
(Minchington, 2010). An effective total reward strategy will lead to the following
advantages (Gross & Friedman, 2004):
Affordable and sustainable costs;
A high-performance culture;
Maximum return on reward programme investment; and
An enhanced employer brand.
Reward strategies are changing, and companies need to consider the different
components that play a role in remuneration as suggested by Sartain and Schuman
(2006), as well as the role these components play in the rewards process. One of the
components of reward is monetary remuneration.
Nienaber (2009) states that there is an abundance of research suggesting that employees
are more productive and engaged when they are motivated. “Motivation influences the
direction, intensity and persistence of behaviour and impacts organisational performance”
(Nienaber 2009, p. 5). It is therefore important for managers to understand more about
these components that influence motivation levels of their employees (Nienaber, 2009).
The following problem statement will show why the problem was selected for the present
study, and what evidence verified the problem.
1.2 Problem statement
Attracting and retaining key talent remains the most important strategic driver (Bussin,
2008). Corporate leaders and their human resource functions are placing a high importance

Page 5
on employer brand as a critical advantage in the war for talent (Botha, Bussin & de Swardt,
2011).
Donath (2001) explains employer brand as the identity of the employer which include the
organisations values, system, policies and behaviours. Companies seem to be ineffectively
managing their talent resources, even though they are acknowledging the significance of an
employer brand (Leonardi, 2007). According to Barrow and Mosley (2005), the term
'employer value proposition' is closely related to the concept of 'employer brand.'
Management’s role in the EVP is unclear, with multiple parties seeking their own best
interests when creating the EVP (Chapman & Kelliher, 2011).
The inability to manage organisational human resources is evidenced by the ever-changing
environment of the South African labour environment. The effects of globalisation, the
recent recession, and affirmative action directly impact an organisation's employment
strategy. Talented employees can easily move between companies and countries, and
companies have never had a tougher, more confusing, and more contradictory time in
finding, managing, and nurturing talent (Cheese, Thomas & Craig, 2007).
Managers attempt to compensate for the lack of human management skills and knowledge
by using money to attract scarce resources. The problem is that many managers do not
know how to use their resources strategically and effectively. Remuneration forms an
integral part of the EVP, and the present research will set out to understand the role of
remuneration in the larger EVP context, which will help managers to better manage their
financial resources to attract and retain scarce human resources.
Ferguson and Brohaugh (2009) suggest that remuneration is important to employees, but
that what really matters on a day-to-day basis is the quality of their work experience. It is
clear from previous research that the EVP process is crucial to an organisation's success.
There is a need for a better understanding of the EVP process. It seems that most of the
latest research concentrated on the non-financial aspects of the employer package. Tang,
Luna-Arocas, Sutarso, and Tang (2004) postulate that there has been an increase in the
interest of the importance of money, and they suggest that managers use money and the
effects of money to attract and retain talent.
The final part of the present research should motivate organisations to better understand the
EVP and concentrate on the effective management of the EVP process.

Page 6
The following literature review is aimed at illustrating the importance of EVP in a company’s
strategic decision making, in particular, the role of remuneration in EVP.

Page 7
Chapter 2: Literature review
The previous section explained the problem statement. In this section, the literature review
covers the recent literature on remuneration and its relation to organisational strategy, as
well as organisational remuneration decision making.
The theory review aims to build a platform for understanding financial reward, specifically
remuneration, guaranteed package, and long-term incentives play the context of total
reward. The review also takes a look at who makes the decisions regarding total reward,
and how they reach those decisions.
2.1 Rewards
The concept of total reward developed over a long period of time. Total reward is the
combination of compensation and benefits, together with the tangible and intangible aspects
that companies use to attract, motivate, and retain employees. A total reward model
contains all types of financial, non-financial, intrinsic and extrinsic rewards (Armstrong,
2006).
2.1.1 Motivation
Guest (1987) proposed that human resource management appears to favour theories of
commitment and motivation and other ideas derived from the field of organisational
behaviour. Herzberg (1987) put forward that all motivational factors fall into one of two
categories: extrinsic motivation and intrinsic motivation.
Extrinsic motivation comes from external factors that are outside the employee's personal
self, and includes rewards such as money, coercion, and threat of punishment, while intrinsic
motivation describes the rewards that an employee experiences while doing the work.
Intrinsic rewards are what employees are feeling within themselves (Ryan & Deci, 2000).
According to Parker and Wright (2001), more money will make employees more loyal,
motivated, and productive, meaning that money has a direct influence on employees'
behaviour (Parker & Wright, 2001). Furthermore, Haynes (2002) postulates that exceptional

Page 8
human relations is not an adequate substitute for sufficient monetary rewards. These views
are shared by Rynes, Gerhart, and Minette (2004), who argue that the role of pay is
underrated because of misjudgement of the reactions of employees when offered higher-
paying jobs. Rynes et al. (2004) states that pay is important, because it is broadly applied
and carries multiple symbolic meanings, satisfying most of needs expressed in Maslow’s
motivational hierarchy. This view is supported by Parker and Wright (2001), who state that,
when you pay employees more, they become more loyal.
Not everyone agrees with the above mentioned statements. Tang et al. (2004) postulate
that managers should not concentrate on money as a reward, because employees'
satisfaction with pay will eventually revert back to zero, and that this zero point continually
escalates.
Sheldon, Gunz, Nichols, and Fergusen (2010) examined three different studies that
indicated that extrinsically-orientated individuals overestimate the positive effects of extrinsic
goals. They conclude that the following might be the reasons why employees strive to attain
extrinsic goals: developmental and current emotional difficulties, encouragement by the
media and advertising, and social comparison and peer group pressure.
Mahaney and Lederer (2006) state that intrinsic motivation is the physiological reward that
employees derive from doing their work. They also state that intrinsic motivation is lodged in
the execution of the job, for example achievement, variety, challenge, autonomy,
responsibility, and personal and professional growth.
Thomas (2009) states that extrinsic rewards are more important when work is generally
more routine and bureaucratic, and when compliance is crucial. Thomas (2009) further
states that extrinsic rewards are important when an employee first considers a job, and that
unfair pay can be a powerful demotivator. However, the importance of extrinsic rewards
lessens substantially once the job is accepted.
Extrinsic rewards can also have an effect on intrinsic rewards by conveying to the
employees that they are viewed as competent. It is thus difficult to predict the outcome of
the interaction of the contradicting forces of intrinsic and extrinsic rewards (Bartol &
Srivastava, 2002).
Most modern research in the field of motivation is done on intrinsic motivation.
Vansteenkiste, Lens, and Deci (2006) state that intrinsic, rather that extrinsic motivation,

Page 9
promotes deeper processing, but they also postulate, in the same research paper, that
extrinsic goal-framing yields positive results in motivating individuals.
Armstrong (2006) describes reward as the combination of all types of rewards. According to
Hiles (2009), these employee rewards include:
Financial and non-financial rewards;
Direct and indirect rewards; and
Intrinsic and extrinsic rewards.
The literature is divided on which motivational factors best motivate employees (De Winnaar,
2008). Arnolds and Venter (2008) agree with this argument by stating: “Much confusion
however still exists on the question of which rewards really motivate employees“(Arnold and
Venter, 2008, p. 1).
2.1.2 Total reward systems
Multiple theories try to explain the link between remuneration and the different motivations.
Total reward implicate that there is more to rewarding people than just paying them money
(Armstrong & Brown, 2006). Armstrong and Brown (2006) also postulate that a total reward
strategy is crucial in addressing the issues of recruitment and retention. They also suggest
that a total reward strategy provides an important tool with which to influence people.
Armstrong and Brown (2006) suggest that the following benefits will arise from a total reward
strategy:
Greater impact;
Enhancement of the employment relationship;
Increased cost-effectiveness;
Flexibility to meet individual demands; and
Victory in the war for talent.
The concept of total reward calls for multiple components of reward to be combined to form
the organisation's rewards strategy, which needs to be integrated into the organisation's
larger employer branding strategy (Giancola, 2009). Hill and Tande (2006) postulate that a

Page 10
flexible and environmentally adapted total reward system will assist organisations to attract
and retain scarce human resources. Hill and Tande (2006) estimate that an effective
rewards model could increase productivity by up to 35%.
Hiles (2009) states that a total reward package strategy must be unique to the organisation
and, if done correctly, will help drive a sustainable competitive advantage in the competition
for key talent. Gross and Friedman (2004) are of the view that organisations are changing,
and that they are acknowledging the importance of reward in achieving and aligning their
business goals.
Hiles (2009) uses the three core elements of a reward strategy mentioned by Collis and
Rukstad (2008):
Objective
The objective is that which the organisation is trying to achieve. Hiles (2009) suggests that
the objective should be measurable and time bound. Some of the measurable options
mentioned by Hiles are: differentiation in base pay, cost per employee, plant participant
behaviour, and employee satisfaction.
Scope
This aspect of the total reward strategy clarifies who and what should be included (Hiles,
2009).
Advantage
Hiles (2009) states that the advantage is the most important part of the total reward strategy.
The advantage will stipulate the means an organisation will use to reach its goals. Hiles
(2009) also states that these means are concerned with differentiation ‒ finding the aspects
of the total reward package that will be used to gain better results at the same or lower
costs.
The importance and complexity of the total reward system is applicable to both South African
and international organisations. This statement is supported by research done in South
Africa and internationally. Kerry-Phillips and Thomas (2009) conducted research on
expatriated South African employees living in New Zealand, and found that competitive
remuneration is only important in attracting employees. None of the respondents mentioned

Page 11
remuneration as a factor when promoting these employees (Kerry-Phillips & Thomas, 2009).
The figure below illustrates the findings of Kerry-Phillips and Thomas regarding the
attraction, attrition, retention, and emigration of talent.
FIGURE 2.1: Factors influencing the attraction, attrition, retention, and emigration
of talent.
In contrast to the findings of Kerry-Phillips and Thomas (2009), the results of the
research done by the Corporate Leadership Council (2007) shows that employees find
the following aspects important in their employment package:

Page 12
Remuneration and benefits are important considerations in career decisions;
Base salary is regarded as the most important attribute;
The most important decision in managing a career is the quality of management
staff. The importance of this aspect is illustrated by the fact that employees are
willing to accept less remuneration if they can work for the best managers; and
Employees do not find a high-risk, high-reward job attractive.
According to the Corporate Leadership Council (2007), other aspects that are important to
employees, but are not directly influenced by remuneration, are:
Work-life balance, with penalties for inconvenience;
An attractive organisational brand; and
The best top management.
The studies by Kerry-Phillips and Thomas (2009) and the Corporate Leadership Council
(2007) on remuneration and pay are contradictory in some of their findings, emphasising
the diverse views that individuals have on the subject.
The concept of total reward includes the combination of two different reward categories
(Armstrong, 2006). These categories are:
Transaction rewards: Tangible or financial rewards arising from a transaction between an
organisation and its employees for services rendered (Armstrong, 2006); and
Relational rewards: Intangible or non-financial rewards concerned with the work
environment, recognition, performance management, and learning and development
(Armstrong, 2006).
The different types of rewards and how they fit into the total reward are shown in Figure
2.2 below:

Page 13
FIGURE 2.2: The elements of total reward (Armstrong, 2006)
The differing points of view exacerbate the lack of structured reward system strategising.
There are multiple total reward systems that try to explain and link the different elements of
rewards, bringing some form of clarity to the subject matter. These models give insight into
total reward systems. The models that will be discussed are:
The WorldatWork Model;
The Towers Perrin Model of Total Reward;
The Armstrong and Brown Total Reward Model;
The Zingheim and Schuster Total Reward Model; and
The Total Reward Model.
2.1.3 The WorldatWork model
WorldatWork is the largest global not-for-profit professional association, dedicated to
knowledge leadership in total reward (WorldatWork, 2007). Their reward model includes five
total pay categories, namely compensation, benefits, work-life, performance and recognition,
and development and career opportunities.
WorldatWork's model (Figure 2.3) indicates how an organisation's total reward strategy
contributes to the attraction, motivation, and retention of employees, which, in turn, has a
positive impact on the organisation's performance and results. This model stipulates the

Page 14
inclusion of five core components: programmes, practices, components, and dimensions,
which define the organisation's culture and strategies (WorldatWork, 2007).
Figure 2.3: The WorldatWork Total Reward Model (WorldatWork, 2007, p. 7)
This model further states that total reward operates within an overall business strategy,
organisational culture, and human resources strategy. A company's unique culture or
external brand value may be considered a critical component of the total EVP (WorldatWork,
2007).
2.1.4 The Towers Perrin Total Reward Model
The Towers Perrin model is depicted on a graph with both X- and Y-axes. The vertical Y
axis is divided into the transactional or tangible rewards on the one side and relational or
intangible rewards on the other. The horizontal X axis is divided into individual rewards and

Page 15
communal rewards (Armstrong, Brown & Reilly, 2011), meaning that the graph is divided into
four categories, namely pay, benefits, learning and development, and work environment
(Armstrong, Brown & Reilly, 2011).
The performance and recognition categories are absent from the WorldatWork model, but
are incorporated in the other categories included in the model. The model is displayed in
Figure 2.4 below.
Figure 2.4: Towers Perrin Total Reward Model (Armstrong & Brown & Reilly, 2011,
p. 25)
Transactional (tangible)
Indiv
idua
l
Pay Benefits
Co
mm
una
l
Base pay Pensions Contingent pay Holidays
Cash bonuses Health care
Long-term incentives Other perks
Shares Flexibility
Profit-sharing
Learning and development
Work environment
Workplace
Learning & development Core values of the organisation
Training Leadership
Performance management Employee voice
Career development Recognition
Achievement
Relational (intangible)

Page 16
2.1.5 The Armstrong and Brown Total Reward Model
The Armstrong and Brown Total Reward Model is similar to the WorldatWork model, with the
addition of work experience and non-financial information. The model also differentiates
between transactional and relational rewards. The model does not make a direct reference
to work-life balance, but work-life balance is touched on in the description of work
experience (Armstrong, 2006).
Figure 2.5: The Armstrong and Brown Total Reward Model (Armstrong & Brown,
2006)
2.1.6 The Zingheim and Schuster Total Reward Model
This model, proposed by Zingheim and Schuster in 2000, is the same as the Towers Perrin
model, except for the addition of the time factor. The model divides the four blocks into
current and future rewards. The new dimension of time explains that employees consider
future rewards, and not only current rewards, as important when considering their current
and future employment (Zingheim & Schuster, 2000).

Page 17
Figure 2.6: The Zingheim and Schuster Total Reward Model (Zingheim & Schuster,
2000)
2.1.7 Total guaranteed packages
The total guaranteed package is used by 70% of South African companies (Bussin, 2010),
and needs to be added to the calculation when considering the impact of total reward on
remuneration strategies. A total guaranteed package includes the following: basic salary,
fixed guaranteed bonus, fixed car- and housing allowances, housing subsidies, non-cash
fringe benefits such as a car allowance, and employer contributions to pension- and
provident funds and medical aids (Bussin, 2008).
Bussin (2008) states that total guaranteed packages rest on three pillars: internal equity,
flexibility, and competitiveness. He further argues that a guaranteed packages will only be
accepted by employees if it is perceived as fair. Packages should be flexible for the
employee, and employees’ jobs should be valued and measured against the labour market.

Page 18
Bussin, in his total guaranteed package model, (see Figure 2.7) differentiates between fixed
and variable costs. A fixed cost is a non-discretionary compensation that does not depend
on performance or results. Variable compensation is dependent on results or performance
(Bussin & Gildenhuys, 2008).
Figure 2.7: Total reward (Bussin & Gildenhuys, 2008, p.3.)
2.2 The employer value proposition (EVP)
An EVP is the terminology used to describe the characteristics and appeal of working for an
organisation (Talentsmoothie, 2010). EVP is closely related to employer brand (Barrow &
Mosley, 2005), and these concepts are often used interchangeably in literature. EVP is, in
fact, a tool used to enhance the employer's brand; it describes a desired future state of the
company’s culture and strategic objectives (Kochanski, 2004). An employer's brand builds
an EVP that matches what employees want and what is expected from them (Mandhanya &
Shah, 2010).
EVP is experienced by current employees and, in turn, communicated to potential
candidates (Kalajian, 2011). Figure 2.8 suggests that what is associated with a brand starts
Base Pay / Basic Salary
+ Long-term Incentives / Shares
+ Short-term Incentives
+ Inconvenience Pay
+ Statutory Contributions
Total Earn
ings / To
tal C
ost to
Co
mp
any
Total R
em
un
eratio
n / To
tal C
ost o
f Emp
loym
en
t
+ Guaranteed 13th
Cheque
+ Fixed Allowances
+ Car / Housing Benefits
+ Cost of employee benefits
+ Other Benefits
V
ariable
Pay
Base
/ Basic Sa
lary
Base
/ Basic Sa
lary
Fixed
Pay
Base
/ Basic Sa
lary
Gu
arante
ed
Package

Page 19
from inside the organisation, and that the attractiveness of a brand to employees is
dependent on these associations (Kalajian, 2011).
Figure 2.8: Steps in employer branding (Kalajian, 2011)
Botha, Bussin, and de Swardt (2011) postulate that the following factors could be used as
building blocks for an employer brand model. These blocks could be incorporated in a
predictive model that will predict talent attraction and retention after being validated. EVP is
one of the building blocks of an employer brand. Botha, Bussin, and de Swardt (2011)
include the following building blocks in their brand predictive model:
Target group needs;
EVP differentiation;
People strategy;
Brand consistency;
Employer brand communication; and
Employer branding metrics.

Page 20
Figure 2.9 depicts the employer brand predictive model of Botha, Bussin and de Swardt.
The model is informed by the above mentioned employer brand building blocks, based on
their relative significance in employer branding, which, in turn, influences talent attraction
and retention (Botha, Bussin & de Swardt, 2011).
FIGURE 2.9: Employer brand predictive model (Botha, Bussin & de Swardt, 2011).
EVP is a crucial part of any company's brand management. Mandhanya and Shah (2010)
define employer brand from a talent management perspective:
Brand management is a snapshot of the company which promotes and profiles the
company to potential candidates. It’s the communication and presentation of a
unique perception of the company in the mind of potential candidates and employees
which subtly encourages and retains them. Employer brand tries to describe what it
will feel like to work for the company (Mandhanya and Shah 2010).

Page 21
Moroko and Uncles (2008) state that multiple organisations in different industries are using
employer branding to retain the most sought-after employees.
Heger (2007) describes EVP as the benefit or value that an employee perceives to gain from
working for a certain employer. A distinctive EVP provides a clear distillation of what sets a
company apart as an employer, and refers to the unique set of attributes and benefits that
will motivate target candidates to join a company and current employees to stay (Brand
Learning, 2009). Organisations need to understand what benefits attract desired employees
and retain existing employees, and they need to devise retention and recruitment strategies
based on their EVP (Munsamy & Venter, 2009).
The EVP includes the total financial and non-financial benefits that employees receive from
working for a specific company. The Corporate Leadership Council (2007) states that the
EVP is not a total reward model. When the components of an EVP are compared to those of
the WorldatWork model, the Towers Perrin model, the Armstrong and Brown total reward
model, and the Zingheim and Schuster model of total reward, it is clear that they share most
of the same components, but with slightly differentiating factors.
The following illustrates the different EVP components (Sartain & Schumann; 2006).

Page 22
FIGURE 2.10 Components informing choice of an EVP (Sartain & Schumann, 2006).
The EVP model in Figure 2.10 is a comprehensive total reward model that covers the
tangible and intangible components in building a value proposition. One factor that is
prominent in all of the discussed models is remuneration. The EVP model further breaks
down the remuneration category into the following sub-categories: base pay, incentives,
ownership, cash recognition, premium pay, and pay process (Sartain & Schumann, 2006).
Common to all the above models are the components of compensation, benefits, work-life
balance, performance and recognition, and development and career opportunities.
Giancola (2009) states that certain components of total reward systems are being eliminated
to simplify the implementation of these systems. Initially, the total reward concept addressed
all aspects of the work environment, including organisational factors such as culture,
leadership, and climate. These factors can only be improved by effecting organisational
changes (Giancola, 2009). Human resources practitioners have often omitted these factors
because of difficulty with implementation, and because they felt that these factors were not
important. This led to strategies that are easier to implement.
Page 23
Giancola (2009) questions the longevity of the total reward strategy. Ciancola’s viewpoint is
supported by the fact that models such as the Towers Perrin model of total reward
(Armstrong and Brown, 2006) does not take the larger company culture and strategies into
calculation. On the other hand, the WorldatWork model purposefully includes these factors
in the total reward strategy (WorldatWork, 2007). The differing view points between the
models make it difficult for practitioners to identify which of the components to use in their
reward strategies.
A wide range of components are addressed by the different models, but all include the five
components mentioned above, namely compensation, benefits, work-life balance,
performance and recognition, and development and career opportunities. These models are
evolving and are still relevant in modern human resources strategy
2.3 Decision making
Dyer and Holder (1988) recommend that the role of the HR department should be that of a
business partner. They further suggest that the role of business partner include the following
four aspects:
HR executives should cooperate with their counterparts in other departments to
formulate HR strategies;
HR executives should participate in all company strategy sessions, and should be
equal to the CFO and other executives, allowing HR executives to give input into
strategic decisions from a HR perspective;
HR executives should work closely with line managers to ensure that the strategies
are implemented throughout the organisation; and
The HR function should be managed strategically.
The Chartered Institute of Personnel and Development supports this point of view, and
suggests that strategic partners should work closely with business leaders, influencing
organisational strategy and steering its implementation (Chartered Institute of Personnel and
Development, 2007 in Armstrong, 2011).

Page 24
HR professionals need to become business partners to ensure a sustained competitive
advantage. They have to align their activities with the organisation's strategic plan in order
to improve organisational performance (Ulrich & Lake, 1990).
Human resources management is not only about strategising, but also about
implementation. The behaviour of the role players in the HR- and reward processes is
crucial in reaching the strategic and HR goals (Armstrong, 2011). Strategic reward
strategies need to be aligned with the human resource strategies, which, in turn, have to be
aligned with the organisation's strategies.
Top management should ensure that the reward strategy is implemented for the whole
organisation. Management should deliver the message that the reward strategy is an
integral part of the fabric of the organisation to insure buy in from the entire organisation
(Armstrong & Brown, 2006). Armstrong and Brown (2006) propose that management should
demonstrate their conviction by showing that they will play their part in communicating and
implementing the reward strategy.
Grosse and Edelsten (2004) suggest that it is not possible for most organisations to
administer unique individualised reward requests, due to the arduous administrative burden.
They also deduce that a way of overcoming this problem is by structuring reward models
that will be versatile enough to satisfy the unique needs of the employees. These reward
models designed with the needs of employees in mind, could lead to optimal benefits to both
the organisation and the employees without incurring any extra costs (Harris & Clements,
2007). The reward decision-making process is crucial in any organisation, and a more
effective process could save costs, and even provide a competitive advantage over
competitors.
Chapman and Kelliher (2011) name four groups that influence the decision making regarding
rewards, namely the board, the executives, the human resources director, and the financial
director. The board’s focus is on the overall reward budget, mainly concentrating on base
salary budgets and not the reward mix. It was found that the board’s involvement in the
reward mix is increasing because of two factors, namely the increase in pension costs and
the increased regulatory and political interest in the remuneration of employees. The level of
board participation is also related to the extent to which the HR director has a role at board
level. The most successful organisations tend to be those where the HR director contributes
directly to the board (Chapman & Kelliher, 2011).

Page 25
Chapman and Kelliher (2011) present potential conflict between the HR- and financial
functions. They found that the range of decision makers with a role in the reward decision-
making process is diverse (Chapman & Kelliher, 2011). Chapman and Kelliher (2011) quote
one consultant from the study as saying: “All I see is a horrible, fractured approach to
determining reward mix.” The findings highlight that the presence of different decision
makers with different needs is potentially detrimental to achieving the most effective reward
mix for a specific company.
The Chapman and Kelliher (2011) study found that there are external and internal influences
that affect the composition of the reward components. The external factors include market
benchmarks, legal, regulatory, and taxation requirements, political and social issues, and the
state of the economy. The internal factors include business strategy, risk appetite, talent
needs, and employee preferences (Chapman & Kelliher, 2011).
The company's business strategy needs to be aligned with the needs of its employees to
insure a successful reward mix. The relationship between scarcity and talent, on the one
hand, and giving staff the opportunity to determine their own reward mix, on the other, also
influences the organisation’s reward mix (Chapman & Kelliher, 2011).
The Chapman and Kelliher (2011) study identified the institutional pressures of mimicking
and coercion as paramount in determining an organisation’s reward mix. The examination of
other organisations, or benchmarking, was identified as the main external influences on
reward mix. Organisations examine what other organisations do and then mimic them. The
coercive influences include legal and regulatory frameworks, the need to improve
employees' long term savings, and the understanding of, and responsibility for, personal
financial management.
The study found industry inertia in determining reward mix. The two reasons given for the
inertia are: the poor quality of human resource management and organisational history
(Chapman & Kelliher, 2011). Managers are reluctant to evaluate reward systems and, as a
result, hold back advances in the reward implementation. This creates a harmful reality gap
between the reward offering and the needs of the employees (Armstrong & Brown & Reilly,
2011).
Bussin and Gildenhuys (2008) predict that the challenge of attracting, motivating, and
retaining employees will remain in the coming years. They also suggest that the workforce
will continue to evolve, which will increase the importance of innovative strategies in total
reward, in order to enhance the competitiveness of organisations.

Page 26
2.3.1 Strategic reward management
“Reward strategy is a declaration of intent. It defines what an organization wants to do in the
longer term to address critical reward issues and to develop and implement reward policies,
practices and processes that will further the achievement of its business goals and meet the
needs of its stakeholders. It starts from where the reward practices of the business are now
and goes on to describe what they should become” (Armstrong, 2011, p. 257). Armstrong
(2011) further states that a reward strategy is the sense of direction that links the business
and its employees with the reward policies.
Wright and McMahan (1992) suggest that HR management is attempting to align reward
strategy with the strategic management process, in order to achieve strategic human
resource management. Boxall (1996) supports this statement by describing strategic human
resource management as the link between human resources strategy and the organisations
management. Boxall, Purcell, and Wright (2007) further imply that strategic human resource
management concentrates on the HR policies that are adapted by the different business
units and organisations. Figure 2.11 shows that HR management includes HR strategies
and the management activities of HR professionals (Armstrong, 2011)
Figure 2.11: HR Strategies and strategic management activities combined in
strategic HRM (Armstrong, 2011)

Page 27
Brown (2001) postulates that organisations will gain value from an effective reward strategy.
Armstrong (2011) agrees with the statement, and suggests these four additional reasons for
having a reward strategy:
Provides direction;
Pay costs are most organisations' highest cost, and a strategy ensures that these
costs are effectively spent and invested in the long term;
There is a positive relationship between rewards and performance; and
Reward strategies create a complex link with other HR and organisational strategy
policies and practices.
A reward strategy is characterised by the diversity of the employee needs, and is
conditioned by the legacy of the past and the realities of the future (Armstrong & Murlis,
2001). Different companies' reward strategies have similar characteristics, but these
characteristics are treated differently because of the diversified needs of the employees and
organisation (Armstrong, 2011). Reward strategies need more than just a clear view on
what needs to be done, they also have to reflect the views of top management. Affordability
of the programme and the needs and happiness of the employees also need to be taken into
consideration when creating a reward strategy (Armstrong, 2011).
Armstrong (2011) suggests that a reward strategy should be based on a detailed
arrangement of the present rewards. This should include an analysis of the current reward
structure's strengths and weaknesses. According to Armstrong (2011), the analysis could
take the form of a gap analysis, asking the questions: What is happening at this moment?
And what should be done?
Armstrong (2011) further implies that a reward strategy could be either broad-based which
provides the framework for more specific plans or specific which targets particular areas.
The two approaches are not mutually exclusive, and could be combined in a single strategy.
The broad-based option will commit the organisation to the pursuit of a total reward policy.
Broad-based aims could include the following (Armstrong, 2011):
Page 28
A balance between financial and non-financial rewards;
A more integrated approach, encouraging personnel development;
A more flexible approach;
Rewards being in line with contributions; and
A reward strategy that supports a performance culture, building high levels of
competence.
The reward strategy may also specify intentions to deal with particular aspects of reward
management (Armstrong, 2011). One example of a specific reward initiative is “...the
development of a total reward approach in which each aspect of reward, namely base pay,
contingent pay, employee benefits and non-financial rewards (which include intrinsic rewards
from the work itself), are linked together and treated as an integrated and coherent whole”
(Armstrong, 2011 pg 262).
An effective reward strategy is one that gives clear guidance on its development, planning,
and implementation, and also achieves the planned results after implementation (Brown,
2001).
Trevor (2009) questions to what extent remuneration can be strategised. He also found a
gap in the intended and the practised reward strategy, arriving at the conclusion that intent
does not always lead to action. The use of a strategy often leads to unintended
consequences, thereby doing damage rather than creating value (Trevor, 2009). Reward
strategising is not a clear-cut science, and more clarity is needed on the subject.
According to Trevor and Armstrong, “... an alternative approach for the use of pay systems in
the support of strategy is required: one that acknowledges the relative limits on the ability of
companies to manage pay strategically” (Trevor, 2009 & Armstrong, 2011, p. 270).
2.4 Summary
Reward models have certain components in common, namely benefits, work-life balance,
performance and recognition, and development and career opportunities.

Page 29
Giancola (2009) states that certain components are being eliminated from total reward
systems in order to simplify implementation. Initially, the total reward concept addressed all
aspects of the work environment, including organisational factors such as culture,
leadership, and climate. These factors can only be improved by effecting organisational
changes (Giancola, 2009). Human resources practitioners have excluded these factors
because of the difficulties with implementation, and because they felt these factors were not
important. This led to strategies that are easier to implement. Giancola (2009) questions
the longevity of the total rewards strategy. Ciancola’s view point is supported by the fact that
reward models, such as that of Towers Perrin, do not take the larger company culture and
strategies into consideration (Armstrong and Brown, 2006). On the other hand, the
WorldatWork model purposefully includes these factors in the total reward strategy
(WorldatWork, 2007).
The reward decision-making process varies from organisation to organisation. Chapman
and Kelliher (2011) shed light on the incoherent nature of the remuneration planning
process. The decision makers in organisations don’t have the same goals when making
reward decisions, which negatively influence the effectiveness of the reward mix in the
organisation.
In this section, literature that relates to this research paper was discussed. Firstly, total
reward and how it fits into the larger organisational environment were examined. This was
followed by a discussion on the management of total reward. The research questions are
presented in the next chapter.

Page 30
Chapter 3: Research objective
The objective of this study is to explore whether remuneration plays a role in an
organisation's thought process when determining the organisation’s EVP. The research also
aims to determine whether the larger organisational strategy is considered in this process,
and who makes the strategic EVP decisions in the organisation.
3.1 Research questions
The previous sections presented an overview of the pertinent literature that relates to the
present study, the problem statement, and the main objective of this study. In this section,
specific research questions are formulated in an attempt to address the objective of this
study.
The research aims to explore the role that remuneration plays in the organisation's EVP.
The definition of the EVP is wide and refers to multiple factors. The EVP model is a dynamic
model that includes internal and external company factors. Not all organisations make use
of the concepts of an EVP, and they use different EVP factors when compiling a
remuneration strategy. The literature summary also points to the fact that there are multiple
decision makers when it comes to the remuneration strategy. These role players might have
different needs when it comes to strategising on remuneration.
The EVP should be compatible with the organisation's brand and strategy. The purpose of
the present research is to explore aspects of the EVP and its role in defining the organisation
remuneration strategy.
Primary research question: To what extent does the perceived importance of
remuneration, guaranteed package, long-term incentives, and short-term incentives play a
role in determining an organisation’s EVP?
Secondary research question 1: To what extent does organisational strategy play a role in
determining the organisation’s EVP?
Secondary research question 2: Who in the organisation are the decision makers
regarding the EVP?

Page 31
One primary research question and two secondary research questions were formulated in
this chapter. The research methodology that was used during the data-gathering process is
discussed in the following chapter.

Page 32
Chapter 4: Research methodology and design
The research questions were stated in the previous section. In this section, the research
methodology that was utilised for this study is discussed. The discussion on the
methodology will include details of the research design, the research type, the population,
the unit of analysis, and the sampling method. The chapter will further include details of the
data collection and analysis tools.
4.1 Methodology
4.1.1 Research design and type
The research was descriptive and quantitative in nature (Saunders & Lewis, 2012), as
previous research had been done in the areas of EVP, remuneration, and strategic decision
making. Saunders and Lewis (2012) describe descriptive research as research that
examines the association between two variables. Descriptive research also seeks to
describe persons, events, or situations (Saunders & Lewis, 2012). It seeks to answer the
questions of Who?, What?, When?, Where?, and How? (Zikmund, 2003). The research tool
takes the form of a questionnaire, which, in the present study, was distributed via e-mail.
Figure 4.1 provides an overview of the research methodology used in the present study.

Page 33
Figure 4.1: Overview of research methodology (Zikmund, 2003)
4.1.2 Population
The population consisted of professionals in the reward arena, active in various industries
across South Africa. The database of SARA (South African Reward Association) was used
to send out the surveys. There are 400 member organisations and 3 000 individuals on the
database. This database was selected because input from reward practitioners was
required, and because it was convenient. The database was made available for research
purposes by the President of SARA. These prospective participants were also selected for
their involvement in the organisational remuneration process and their understanding of the
financial reward elements in the total reward package.

Page 34
These professionals represented the following job groups in the sample:
CEO
Board member
Human resource director
Financial director
Executive manager
Senior manager
Specialist
Other
4.1.3 Survey design
A survey was selected as the preferred measurement instrument for the present study. A
survey is defined as a method of gathering primary data through communication with a
representative sample of individuals. Surveys provide quick, efficient, and accurate means
of gathering information. Surveys are flexible and, when properly conducted, valuable to
managers (Zikmund, 2003). The questionnaire in the present study was designed to collect
the necessary data to meet the research objectives, while being correctly understood and
interpreted by the respondents (Saunders & Lewis, 2012).
A test version of the questionnaire was distributed to 10 respondents in a pilot study. The
responses received from the 10 test participants were valuable in fine-tuning the final survey
questionnaire. The survey items were adjusted to eliminate reported confusion experienced
by the pilot study respondents while completing the survey.
The final survey was sent to the prospective participants after the necessary adjustments
had been made. Participants were asked to participate in the online survey on a website
called SurveyMonkey. The link to the survey was e-mailed to the potential participants,
identified from the SARA database.

Page 35
The survey was designed to identify the role that remuneration, guaranteed package, short –
term incentives and long-term incentives play in determining the organisation's EVP. The
survey also aimed to identify the role players in the EVP decision-making process, and if
organisational strategy had any impact on EVP decision making in the organisation. The
survey was designed according to the guidelines set out by Zikmund (2003). These
guidelines include simplicity, avoiding ambiguity, and the avoidance of loaded questions.
The survey was kept relevant by collecting only data relevant to the research questions
(Zikmund, 2003). The researcher also attempted to maintain accuracy of the information by
ensuring that the collected data were reliable and valid (Zikmund, 2003).
The survey was divided into the following four sections. Sections 2 to 4 represent the three
constructs covered in the research:
Control variables;
Remuneration;
Decision making; the alignment between organisational strategy and EVP decision
making; and
EVP.
The complete questionnaire is available in Appendix A.
The items were allocated to the different constructs as shown in Table 4.1 below.
Table 4.1: Allocation of survey items to constructs
Section Survey items
Control variables 1, 2, 3, 4, 5, 6
Construct 1: Remuneration 9
Construct 2: Decision making 7, 8, 13, 14, 15, 16, 17
Construct 3: EVP 12, 18, 19, 20, 21, 22, 23, 24, 25

Page 36
4.1.3.1 Control variables
The demographic data item elicited information on the gender of the
respondents.
Data on participants' current job were collected to ascertain the respondent’s
current working environment, in order to gain insight into the respondents'
answers. The following information was requested:
o Department,
o Job title, and
o Job level, where participants were requested to indicate one of the
following:
CEO
Board member
Human resource director
Financial director
Executive management
Senior management
Specialist
Other
o Industry
Extractive
Producer services
Personal services
Logistics and transport
Transformative

Page 37
Social services
Energy
o Tenure with current employer.
4.1.3.2 Remuneration
It is evident from the literature that some authors view the non-financial components as more
important than financial components in rewards. The respondents were asked to allocate a
total of 100 points to the different components of the total reward package, according to
importance.
4.1.3.3 Decision making
Top management should ensure that the reward strategy is implemented for the whole
organisation by delivering a message that the reward strategy is an integral part of the fabric
of the organisation (Armstrong & Brown, 2006).
A set of five-point Likert scales were used for this section. Question 7 asked the
respondents what part of their current role involved organisational strategising, while
Question 8 asked what part of their current role involved EVP decision making. Questions
13 to 17 covered the respondents' current employers set-up regarding the alignment of EVP
and the organisations strategy.
4.1.3.4 EVP
Information on the participants' organisations' EVP was elicited in two sets of questions. The
first set of questions made used of a five-point Likert scale, and asked the respondents what
role the different remuneration components play in determining the current organisational
EVP.
The second group of questions was the same set of questions, but asked the respondents
what role the components should play in their organisations.

Page 38
4.2 Unit of analysis
The unit of analysis was the individuals that appeared on the SARA data base and who
participated in the present study. Their decision making and their view on the EVP were
surveyed in this research study.
4.3 Sampling method
A population is the total set of group members (Saunders & Lewis, 2012). The population in
the present research included decision makers in organisations with pay solutions, which
included all types of organisations.
A sub-group or sample was used for purposes of the present study. The researcher did not
have a complete list of the entire population, and therefore made use of non-probability
sampling (Zikmund, 2003). The researcher made use of convenience sampling, using the
database obtained from SARA. The database was representative of different age and
gender groups, job titles, organisations, industries, and job families. The sample was
considered appropriate for the present study (Saunders & Lewis, 2012).
4.4 Data-gathering method
The survey was loaded onto the SurveyMonkey website. SurveyMonkey is a research tool
that enables the online collection of responses. A link is created on the website, which is e-
mailed to the prospective participants. The participants are then able to access the survey
immediately.
A non-response error occurs when there is no response from members of the sample. The
non-response error is especially acute in mail and internet surveys (Zikmund, 2003). Alreck
and Settle (1995) claim that a sample size of 100 is regarded as the minimum size that will
be representative for large populations, and 750 is the maximum practical size for a study.
The sample size was considered sufficiently large to compensate for the estimated large
non-response rate. The research also reached multiple geographic areas. This enabled the
research to establish if there are any geographical differences in the responses to the
questionnaires.

Page 39
4.5 Data analysis
Quantitative research yields a large number of responses that need to be analysed in order
for the researcher to be able to form relevant conclusions (Zikmund, 2003). This statement
is supported by Fowler (2009), who states that raw data gathered from a survey need to be
translated into an appropriate form in order to conduct analyses. In the present study, the
Internet survey tool SurveyMonkey was used to distribute the surveys. The data were
extracted from SurveyMonkey into an Excel file format, which made it possible to upload the
data to a statistical software package. All analyses were done using the Statistical Package
for the Social Sciences (SPSS) version 20.0 (SPSS, 2012). The following statistical
techniques were used to analyse the data:
Descriptive statistics analysis was performed on the raw data to better conceptualise the
responses received in the survey. The aim of descriptive statistics is to describe the set of
data that is employed (Howell, 2004). The descriptive statistics analysis was followed by
cross-tabulations. This allowed for the use of organisational data from two or more items.
The job levels were cross-tabulated with all the items in order to investigate whether role
players have different opinions regarding the different survey items.
Inferential statistics was used to assess the significance of various research questions. The
tests conducted in this section of the analysis included the following:
A number of t-tests were performed on the means of the different components of the
total reward package. The t-tests were used to determine whether the differences in
the means were coincidental or statistically significant.
A Pearson correlation coefficient analysis was computed to assess the relationship
between the role players in the EVP decision-making process and the role players in
the organisational decision-making process.
Regression analysis was used to examine whether the independent variables could
predict the quality of the organisation's EVP, where the organisation's employer
brand is the dependent variable

Page 40
4.6 Research limitations
The previous section described the research methodology used in the present study.
Due to the nature of this study, including time constraints, various limitations were identified.
These include:
Only members of the South African Reward Association (SARA) were approached.
The sample might have produced skewed results because of the sample bias
resulting from the selected sample.
Random sample error also skewed the results, because of the difference between
the results from the sample and the results from a census (Zikmund, 2003). The
skewness of the sample is evidenced by the fact that only one financial director, four
board members, and four CEOs participated in the survey. 63.4% of all the
participants fell into the senior management or specialists fields.
The survey reached mainly HR managers, which might have resulted in a bias in
favour of this group.
Systematic errors, such as non-response bias, could stem from the nature of the
survey method used. In the present study, attempts were made to minimise these
errors, but these errors should still be borne in mind when viewing the data and
results.
The research methodology used in the present research study was discussed in this
chapter. This included the research design, the research type, the population, the unit of
analysis, and the sampling method. A short discussion on the data analyses and research
limitations was also included. The findings obtained from the data analyses are discussed in
the following chapter.

Page 41
Chapter 5: Results
The planning and execution of the present research study were discussed in the previous
chapter. This chapter presents the findings obtained from the data analyses. The results
were obtained from the data analyses done by means of SPSS, as per discussion of the
research design and methodology in Chapter 3. This chapter includes all results obtained
from the empirical statistical tests performed on the data with regards to the objectives set
for the study, together with the applicable research questions.
This chapter is divided into four distinct sections:
Section 1: Sample demographics and descriptive statistics
Section 2: Results of the measurements
Section 3: Cross-tabulations
Section 4: Inferential statistics (regression analysis).
The following section presents the demographics of the sample used in this research study.
5.1 Demographics of the sample
The sampling techniques utilised in the present study resulted in a diverse group of
respondents. Over 3 000 Internet questionnaires were sent to the 400 member
organisations members and 3 000 individuals on the SARA database. Only 65 surveys
responses were initially received, and it was decided to postpone the cut-off date by one
week, by which time 102 responses had been received ‒ a 3% response rate. 101
responses were useable, giving a final usable response rate of 2.9%. The following section
provides more insight into the biographical composition of the sample group.
The questions regarding department and job title were open-ended questions with a wide
variety of possible answers. There were 75 possible answers for Question 1, which asked
the respondents to name the department they are currently working in, and 83 possible
answers to Question 2, which asked the respondents to provide their current job title. The
feedback was seen as nominal data; the data gave record of the respondents' current job
environments, but were not used in further analysis.

Page 42
Figure 5.1 illustrates the gender distribution of the sample group. It is apparent that there
was a relatively even spread of female and male respondents.
Figure 5.1: Frequency distribution according to gender
The job levels of the sample group were also considered in the biographical information. As
is illustrated in Figure 5.2, there was a particularly large representation of specialists (33.7%)
and senior management (29.7%), and only one (1%) financial director. The amount of
respondents from every job level is illustrated in Figure 5.2.

Page 43
Figure 5.2: Frequency distribution according to job level
The tenure of the participants in their current position was grouped as follows: Less than two
years, 2-5 years, 6-10 years, and more than 10 years. The percentage distribution of the
different tenures is represented in Figure 5.3 below. A total of 32 (31.7%) participants
indicated that they have been with their organisation for longer than two years, but less than
five years, and 44.6% of the participants have been with their organisation for longer than
five years. The frequency distribution of participants' tenure is illustrated in the bar chart
below.

Page 44
Figure 5.3: Frequency distribution according to tenure
The industry to which the different respondents in the sample group belonged was also
considered in the biographical information. 50.5% of the participants worked in the producer
services industry. The extractive, personal services, transformative, and social services
industries were represented by between 8.9% and 11.9% of respondents. The logistics and
transport (4%) and energy (2%) industries had the lowest representation in the sample. The
frequency distribution according to industry is illustrated in Figure 5.4.
Figure 5.4: Frequency distribution according to industry

Page 45
It is evident that the producer services industry was the best represented by the
respondents, while only 2% of the respondents worked in the transport and energy industry.
5.2 Results and measurements
The comparison of the role that role players in the EVP decision-making process to the role
that those in the organisational strategy decision-making process is important in
understanding who the different decision makers are in EVP.
5.2.1 Strategy in the current role
The participants were asked to indicate what percentage of their current role involves
business strategy decision making. As is illustrated in Figure 5.5, 57.4% spend less than
40% of their time on strategy, and a significant proportion of respondents (24.7%) spend
more than 60% of their time on strategy.
Figure 5.5: Percentage of respondents' time spent making business strategy
decisions
A high percentage of the participants play an active role in their organisations' business
strategy decision-making.

Page 46
5.2.2 The extent of EVP decision-making your current role
The participants were asked to rate the role of EVP decision-making in their current jobs. A
five-point Likert scale was used for this question. The possible answers provided were: no
role, small role, medium role, big role, and major role. A large portion of the respondents
(19.8%) felt that their current job roles required no EVP decision-making. The medium role
response constituted the largest group, at 30.7%.
Figure 5.6 illustrates the frequency distribution of the respondents' roles in their
organisations' EVP decision-making process.
Figure 5.6: The extent of EVP decision-making in the respondents' current roles.
Most of the participants indicated that they play a role in the EVP decision-making process,
with most of them feeling that they play a medium role.
5.2.3 Importance of different components in total package
Most literature proposes that less attention should be given to fixed salary and more to other
aspects of total reward. Question 9 asked the participants to distribute a total of 100 points

Page 47
across the different components of the total reward package to indicate the importance of
the components compared to each other. The respondents allocated varying amounts of
points to the different components. The points were clustered into ten different clusters of
ten percentage points each.
The mean scores for the different total reward package components were calculated, and
are shown in Table 5.1 below. Fixed salary was ranked the highest, with a mean score of
3.56. The other components showed a relatively even spread, with mean scores ranging
from 1.38 to 1.73.
Table 5.1: Calculated means of the components of the total reward package sorted
according to mean
Components Mean score
Fixed salary 3.56
Development and career opportunities 1.73
Performance and recognition 1.62
Variable pay 1.59
Work-life balance 1.50
Benefits 1.38
Fixed salary was ranked the highest of all the components. The other components showed
similar mean scores, but it was not certain whether these differences were coincidental or
statistically significant. The t-tests were therefore used to test for significance of the
difference in the means. This enabled the researcher to draw conclusions regarding the
importance of the different total reward components, provided below.
5.2.4 Results from t-tests
The calculated means suggested that the following ranking is applicable to the importance of
the different components:

Page 48
1. Fixed salary
2. Development and career opportunities
3. Performance and recognition
4. Variable pay
5. Work-life balance
6. Benefits.
The null hypothesis of all the t-tests in this chapter is µ1= µ2. A significance of 0.05 was
used to conduct the t-tests. The differences in means are significant when the t-test sig is
below 0.05.
The t-tests conducted to compare the mean of fixed salary with the other components,
showing that the significance levels were below 0.05, and that the differences in the means
were significant and not coincidental. Therefore, it can be concluded that fixed salary is
considered significantly more important than the other components.
The results of the t-tests conducted between the means of the total reward components
(excluding fixed salary) are shown in Tables 5.2 - 5.5 below.
Development and career opportunities are the total reward component with the second-
highest mean score, but is considered significantly less important than fixed salary. It is
clear from Table 5.2 that the component development and career opportunities is considered
significantly more important than work-life balance and benefits, which both had t-test values
of less than 0.05. The component development and career opportunities are not considered
significantly more important than performance and recognition and variable pay. The
difference in mean scores between the components could be seen as coincidental.
Table 5.2: Comparison of t-test results of development and career opportunities and
components with lower mean scores
t-Test results of development and career opportunities and other total package components
Components t-test value
Performance and recognition 0.42
Variable pay 0.13
Work-life balance 0.03
Benefits 0.00

Page 49
The results show that the component development and career opportunities is not
considered the most important, and the difference in means is significant enough that it won’t
be 5th or 6th in the rankings. The results do not show that the component development and
career opportunities are significantly more important than performance and recognition or
variable pay, and that these differences in means could be coincidental.
The performance and recognition component showed the third-highest mean score. The t-
tests showed that performance and recognition as a component is only significantly more
important than benefits, which had a t-test value of 0.02.
Table 5.3: Comparison of T-test results of performance and recognition and
components with lower mean scores
t-test of Performance and Recognition and other total package components
Components t-test value
Variable pay 0.47
Work-life balance 0.18
Benefits 0.02
It cannot be concluded that performance and recognition is considered more important than
work-life balance or variable pay, as the difference in mean scores could be coincidental.
Variable pay received the fourth-highest ranking, and is therefore not considered significantly
more important than other components in the total package, but is considered significantly
less important than fixed salary.
Table 5.4: Comparison of t-test results of variable pay and components with lower
mean scores
t-test of Variable Pay and other total package components
Components t-test value
Work-life balance 0.58
Benefits 0.11

Page 50
Work-life balance and benefits received the lowest mean scores, and are therefore not
considered significantly more important than any other components. Work-life balance is
considered significantly less important than fixed salary, development and career
opportunities, and performance and recognition. The benefits component was rated
significantly less important than fixed salary and development and career opportunities.
Table 5.5: Comparison of t-test results of work-life balance and components with
lower mean scores
t-tests of work-life balance and other total package components
Components t-test value
Benefits 0.24
It is statistically impossible to specify an exact rank order of the importance of the different
total package components, but these tests gave a good indication of the importance of the
different components, which can be summarised as follows:
1. Fixed Salary: Definitely the most important component.
2. Development and career opportunities: Could be second to fourth in the rankings, but
the results indicate that it should be seen as one of the more important components.
3. Performance and recognition: Could be second to fifth in the rankings; the results
indicate that it could be in the middle of the rankings in terms of importance.
4. Variable Pay: Could be second to sixth in the rankings; also considered to be in the
middle of the rankings.
5. Work-life balance: Could be third to sixth in the rankings, and falls in the bottom two
in terms of importance.
6. Benefits: Lies fourth to sixth in the rankings.
The importance of all of the components should not be underestimated, as the t-tests
showed that all the components play relatively important roles in the total package structure.

Page 51
5.2.5 Decision makers
In the exploration of who the decision makers are in the EVP decision-making process, the
survey asked the participants to rank the different role players in the organisation. The role
players whom the participants were asked to rank were the following:
CEO
Board member
Human resources director
Financial director
Executive manager
Senior manager
Specialist
Other.
The respondents were asked to allocate a ranking according to perceived importance to
each of the 10 choices of role player. They were also only allowed to allocate one ranking
per role player, and one role player to each of the ranking options. The rankings ranged
from 1 to 10, with 1 being the most important and 10 the least important. CEOs were
indicated as the most important role player in the EVP decision-making process, and Other
was indicated as the least important. The ranking and distribution of the different role
players in the EVP decision-making process are shown in Table 5.6 below.
Table 5.6: Perceived importance of the role players in the EVP decision-making
process, sorted by rank order of the mean score
Role players Mean score
CEO 2.81
Human resources director 4.59
Leadership team 4.63
Executive manager 4.96
Financial director 5.27
Senior management 5.33
Board member 5.52
Line manager 6.12
Specialist 7.17
Other 8.59

Page 52
The respondents were asked to rank the role players in their organisations' business
strategy decision-making process according to perceived importance of the role player (see
Table 5.7). The respondents were also asked to allocate a ranking to each of the 10
choices. They were allowed to allocate only one ranking per role player, and one role player
to each of the ranking options. The ranking options ranged from 1 to 10, with 1 being the
most important and 10 the least important. CEOs were indicated as the most important role
player in the business strategy decision-making process, and Other was indicated as the
least important. The ranking and distribution of the different role players in the organisations'
business strategy decision-making process are shown in Table 5.7 below.
Table 5.7: Perceived importance of the role players in the organisation's business
strategy decision-making process, sorted by rank order of the mean score.
Role players Mean score
CEO 2.23
Board member 4.01
Leadership team 4.28
Financial director 4.61
Executive manager 4.99
Human resources director 5.41
Senior management 5.85
Line manager 7.02
Specialist 7.56
Other 9.04
The mean scores gave a good indication of the perceived importance of the different role
players. The table shows that all the role players were perceived as important to one
participant, and all the role players were perceived as important to at least one of the
participants.
The direct relationship between the role players in the EVP decision-making process and the
role players in the organisational decision-making process will be covered in the next
section.

Page 53
5.2.6 Pearson correlation
A Pearson's correlation coefficient was computed to assess the relationship between the
different role players in the EVP decision-making process and the different role players in the
organisation's business strategy. The highlighted fields are the direct correlations between
the role players of each process.

Page 54
Table 5.8: Pearson correlation of the EVP decision-making process and the role players in organisational business
strategy process, according to mean scores.
EVP role players
CEO
Board member
Leadership team
Human resources director
Financial director
Executive manager
Senior management
Line manager Specialist Other
Str
ate
gy
Ro
le P
laye
rs
CEO 0.70** 0.38
** 0.34
** 0.09 0.22
* -0.04 -0.18 -0.48
** -0.57
** -
0.63**
Board member
0.15 0.45** 0.17 0.06 -0.06 -0.1 -0.25
* -0.21
* -0.2 -
0.26**
Leadership team
0.39** 0.19 0.72
** 0.13 -0.1 -0.05 -0.18 -0.44
** -0.43
** -
0.42**
Human resources director
0.34** 0.31
** 0.27
** 0.44
** 0.1 -0.18 -0.33
** -0.46
** -0.31
** -
0.39**
Financial director
0.15 0.07 -0.13 0.01 0.39** -0.04 -0.12 -0.11 -0.09 -0.11
Executive manager
0.05 -0.21* -0.11 -0.23
* 0.03 0.42
** 0.21
* 0.05 0.08 -0.05
Senior management
-0.19 -0.44** -0.17 -0.11 -0.1 0.26
** 0.51
** 0.28
** 0.14 0.16
Line manager
-0.25* -0.26
** -0.30
** -0.19 -0.13 0.04 0.23
* 0.47
** 0.15 0.39
**
Specialist -0.56** -0.37
** -0.39
** -0.1 -0.1 -0.13 0.18 0.46
** 0.60
** 0.54
**
Other -0.77** -0.33
** -0.46
** -0.19 -0.22
* 0 0.13 0.52
** 0.66
** 0.79
**
*. Correlation is significant at the 0.05 level (2-tailed).
**. Correlation is significant at the 0.01 level (2-tailed).

Page 55
The direct correlation of the variables between the two groupings is shown Table 5.9
(Field, 2009). The table illustrates a positive correlation between the direct variables of
the two processes. Discovering statistics using SPSS was used as the guidelines to
set up the following table (Field, 2009)
Table 0.9: Interpretation of Pearson correlation coefficient
Correlation coefficient
Strength of the relationship
Direction of the relationship Components
CEO 0.69 Large Positive
Board member
0.45 Medium Positive
Leadership team
0.72 Large Positive
Human resource director
0.44 Medium Positive
Financial director
0.39 Medium Positive
Executive management
0.42 Medium Positive
Senior management
0.51 Large Positive
Line management
0.47 Medium Positive
Specialist 0.60 Large Positive
Other 0.79 Large Positive

Page 56
Overall, there was a strong positive relationship between role players in EVP decision
making and role players in organisational business strategy, indicating that the two
processes have similar decision makers.
5.2.7 Employer brand
The respondents' perceptions of their organisation’s employer brand were explored in
the next section. The respondents was asked to rate their current organisation's
employer brand on a five-point Likert scale, 1 being a very weak brand, and 5
indicating a very strong brand. The calculated mean for employer brand was 3.7,
which showed that, on average, respondents feel that their organisation has a strong
brand. 40.6% of the total respondents felt that their organisational brand is strong, and
22.6% felt that the brand is very strong. Only 2% of the respondents felt that their
organisation has a very week brand, and 11.9% felt that their organisation's brand is
weak. 22.8% of the participants felt that their organisation's brand was neither weak
nor strong.
Table 5.10: Distribution of participants' perceptions of current employer brand
Frequency Percent
Very weak brand 2 2.0
Weak brand 12 11.9
Neither weak nor strong brand
23 22.8
Strong brand 41 40.6
Very strong brand 23 22.8
Total 101 100.0
Figure 5.7 illustrates the distribution of the perceptions of the respondents of their
organisation's employer brand. It is clear that most of the respondents felt that their
organisation has a strong brand.
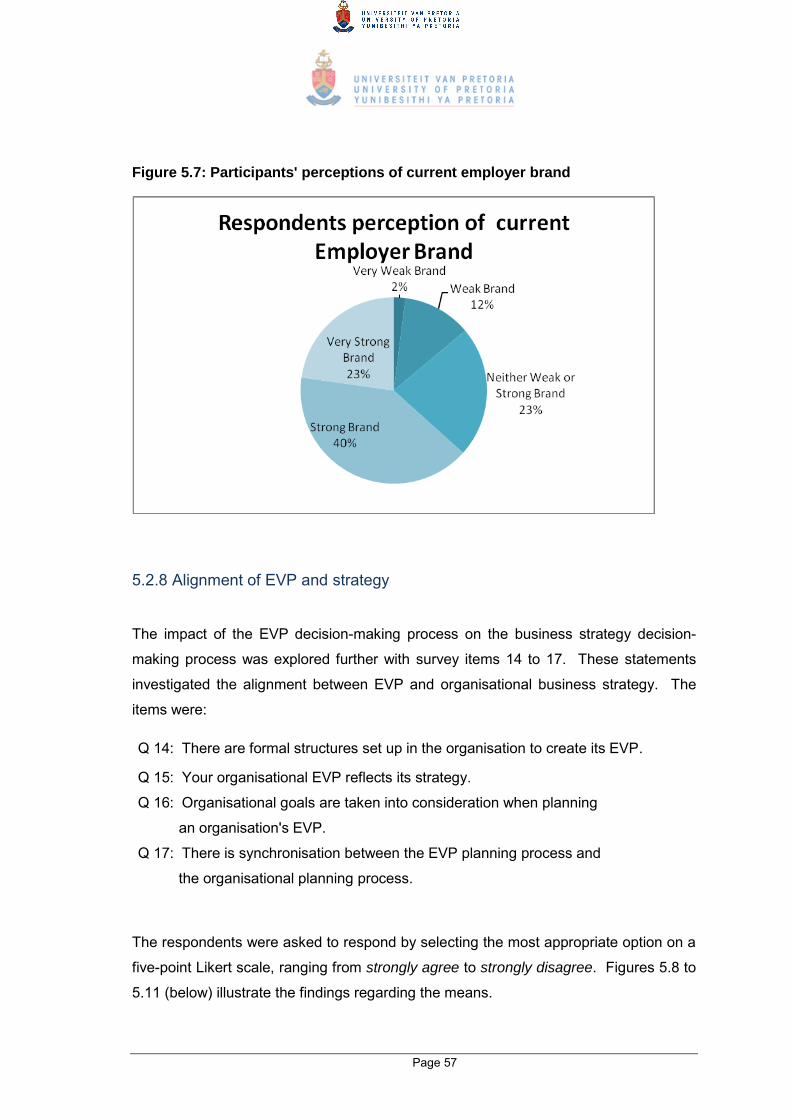
Page 57
Figure 5.7: Participants' perceptions of current employer brand
5.2.8 Alignment of EVP and strategy
The impact of the EVP decision-making process on the business strategy decision-
making process was explored further with survey items 14 to 17. These statements
investigated the alignment between EVP and organisational business strategy. The
items were:
Q 14: There are formal structures set up in the organisation to create its EVP.
Q 15: Your organisational EVP reflects its strategy.
Q 16: Organisational goals are taken into consideration when planning
an organisation's EVP.
Q 17: There is synchronisation between the EVP planning process and
the organisational planning process.
The respondents were asked to respond by selecting the most appropriate option on a
five-point Likert scale, ranging from strongly agree to strongly disagree. Figures 5.8 to
5.11 (below) illustrate the findings regarding the means.

Page 58
Figure 5.8 illustrates the responses to the statement: There are formal structures set
up in the organisation to create its EVP.
Figure 5.8: Frequency distribution of responses to the statement: There are
formal structures in place to create EVP
Most of the respondents felt that there were formal structures in place to create the
organisational EVP. The responses to the statement that the organisation’s EVP
reflects its business strategy are illustrated in Figure 5.9 below.

Page 59
Figure 5.9: Frequency distribution of responses to the statement: The
organisation’s EVP does reflect the business strategy.
Most respondents felt that their organisational EVP does reflect the organisation's
business strategy. Figure 5.9 illustrates the high percentage of respondents who felt
that their organisation's EVP does not reflect its strategy. The responses to the
statement that the organisation's goals are taken into consideration when the EVP is
being planned are illustrated in Figure 5.10 below.
Figure 5.10: Frequency distribution of responses to the statement: The
organisation’s goals are taken into consideration when planning the
organisational EVP.
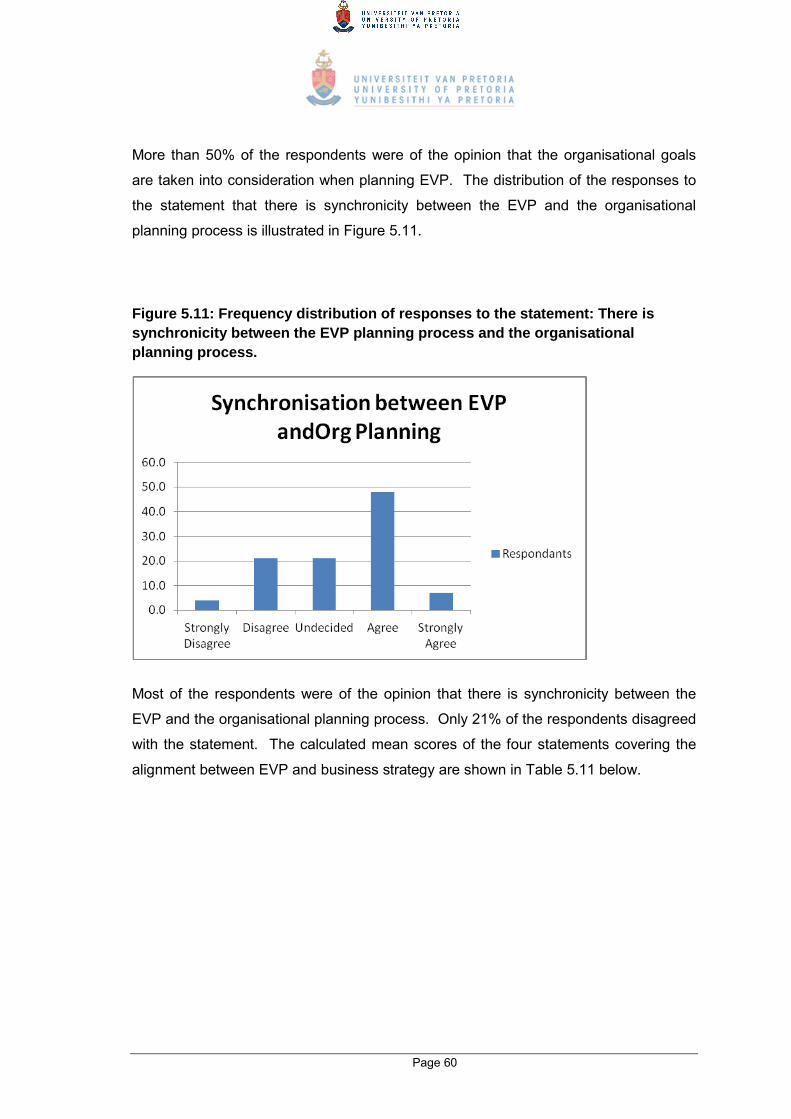
Page 60
More than 50% of the respondents were of the opinion that the organisational goals
are taken into consideration when planning EVP. The distribution of the responses to
the statement that there is synchronicity between the EVP and the organisational
planning process is illustrated in Figure 5.11.
Figure 5.11: Frequency distribution of responses to the statement: There is
synchronicity between the EVP planning process and the organisational
planning process.
Most of the respondents were of the opinion that there is synchronicity between the
EVP and the organisational planning process. Only 21% of the respondents disagreed
with the statement. The calculated mean scores of the four statements covering the
alignment between EVP and business strategy are shown in Table 5.11 below.

Page 61
Table 5.11: Mean scores of statements covering EVP and strategy alignment,
sorted by mean.
Items covering EVP/strategy alignment Mean
1: Organisational goals are considered in EVP 3.49
2: Formal structures set up in organisation to create its EVP 3.41
3: EVP and organisational planning are synchronised 3.36
4: The EVP reflects the business strategy 3.19
The item with the highest mean score was item 14: The organisational goals are
considered when planning the organisational EVP. The other statements also received
high mean scores, indicating that most organisations do align their EVP with their
organisational strategy.
5.2.9 The emphasis organisations place on remuneration components when
planning EVP.
The next series of statements covered the role that the different components of
remuneration are playing in organisations' EVP decision-making processes. The
statements used for the analysis were:
18: Remuneration plays a substantial role in your organisation's EVP.
19: Guaranteed package plays a substantial role in your organisation's EVP
20: Long-term incentives play a substantial role in your organisation's EVP.
21: Short-term incentives play a substantial role in your organisation's EVP
Figure 5.12 illustrates the responses to the statement regarding the importance of the
role of remuneration to the organisation's EVP.

Page 62
Figure 5.12: Frequency distribution of the responses to the statement:
Remunerations plays a substantial role in your organisation's EVP.
The overwhelming majority (54%) of respondents indicated that they agree or strongly
agree with the statement that remuneration plays a substantial role in their
organisation's EVP. None of the respondents indicated that they strongly disagree with
the statement.
Figure 5.13 illustrates the answers to the statement regarding the importance of the
role of guaranteed package in the organisation's EVP.
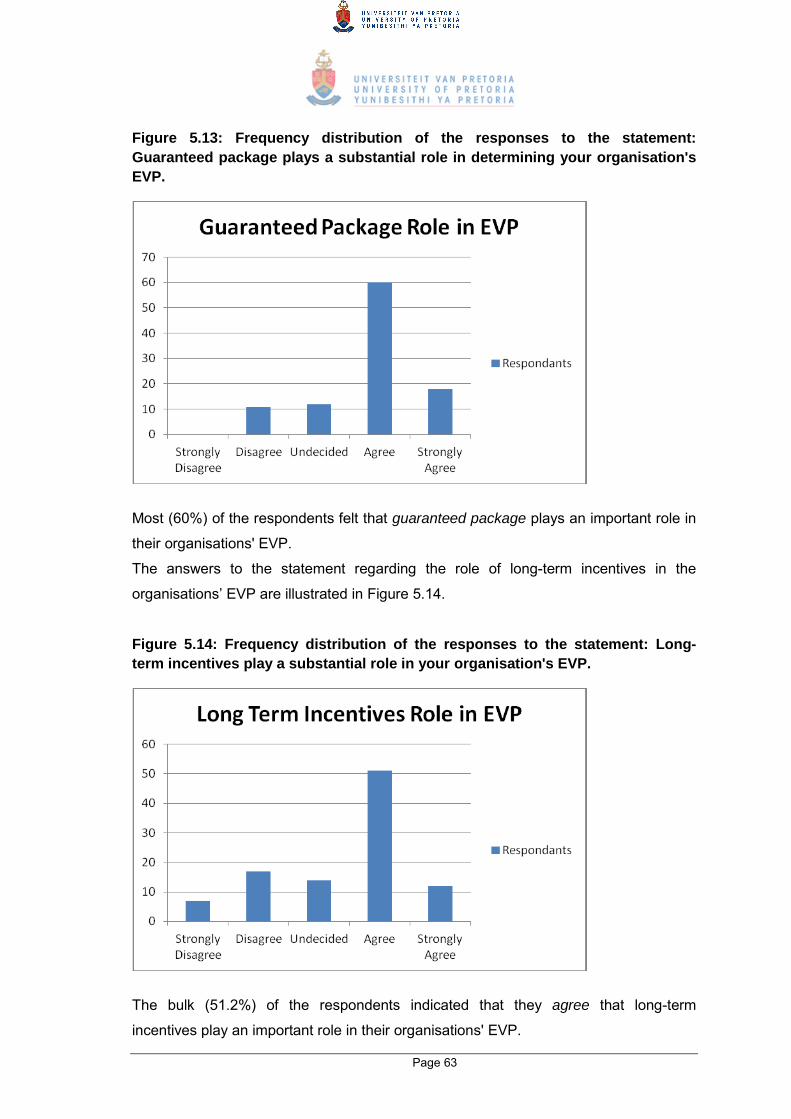
Page 63
Figure 5.13: Frequency distribution of the responses to the statement:
Guaranteed package plays a substantial role in determining your organisation's
EVP.
Most (60%) of the respondents felt that guaranteed package plays an important role in
their organisations' EVP.
The answers to the statement regarding the role of long-term incentives in the
organisations’ EVP are illustrated in Figure 5.14.
Figure 5.14: Frequency distribution of the responses to the statement: Long-
term incentives play a substantial role in your organisation's EVP.
The bulk (51.2%) of the respondents indicated that they agree that long-term
incentives play an important role in their organisations' EVP.

Page 64
The role of short-term incentives, according to the respondents, is illustrated in Figure
5.15 below.
Figure 5.15: Frequency distribution of responses to the statement: Short-term
incentives play a significant role in your organisation's EVP.
Almost 70% of the respondents agreed that their organisations are emphasising the
importance of short-term Incentives when planning an EVP.
The calculated mean scores of the items covering the role that remuneration and its
components play in the EVP are shown in Table 5.12 below.
Table 5.12: Means of items covering the role of components in the organisational
EVP, sorted by mean.
Items covering the role of remuneration in EVP Mean
18: Remuneration's role in EVP 3.84
19: Guaranteed package's role in EVP 3.84
20: Short-term incentives' role in EVP 3.55
21: Long-term incentives' role in EVP 3.44

Page 65
5.2.10 The emphasis that organisations should place on remuneration
components in their EVP
The last four questions of the survey asked the participants what role they felt the
remuneration components should play in the organisation's EVP. The four questions
appeared in the survey as follows:
22: What role should remuneration play in your organisation's EVP with
regards to importance?
23: What role should Guaranteed Package play in your organisation's EVP
with regards to importance?
24: What role should Short term incentives play in your organisation's EVP
with regards to importance?
25: What role should Long term incentives play in your organisation's EVP
with regards to importance?
Each questions had three possible answers: more important, keep the same and less
important. The means show that the participants felt that all four components ‒
remuneration, guaranteed package, short-term incentives, and long-term incentives ‒
should play more important roles in their organisations' EVP.
Figure 5.16 illustrates the answers to the question regarding how important the role of
remuneration should be in the organisation's EVP.

Page 66
Figure 5.16: Frequency distribution of the responses to the statement: What role
should remuneration play in the organisation's EVP?
Over 60% of the respondents felt that remuneration should play a more important role
in the organisation's EVP. Only one respondent felt that less emphasis should be
placed on remuneration.
Figure 5.17 illustrates the answers to the question on how important guaranteed
package should be in the organisation's EVP.
Figure 5.17: Frequency distribution of the responses to the statement: What role
should guaranteed package play in the organisation's EVP?

Page 67
More than 55% of respondents felt that the role of guaranteed package in their
organisations' EVP should stay the same, with just over 40% of the respondents
feeling it should play a more important role.
The answers to the question on what role short-term incentives should play in the
organisation's EVP are illustrated in Figure 5.18.
Figure 5.18: Frequency distribution of the responses to the statement: What role
should short-term incentive play in the organisation's EVP?
Almost 60% of the respondents felt that organisations should place more emphasis on
short-term incentives when planning their EVP.
The role that respondents felt long-term incentives should play in the EVP is illustrated
in Figure 5.19 below.

Page 68
Figure 5.19: Frequency distribution of the responses to the question: What role
should long-term incentives play in the organisation's EVP?
Only 21% of the respondents felt that the weighting of long-term incentives in the
organisation's EVP should stay the same, while a majority of 74% of respondents felt
that long-term incentives should play a more important role in the EVP.
The calculated mean scores of the four questions are shown in Table 5.13 below.
Table 5.13: Means of questions covering the role that the remuneration
components should play in the organisation's EVP, sorted by mean.
Items covering the role that remuneration should play in the EVP Mean
22: Role long-term incentives should play in EVP 2.69
23: Role remuneration should play in EVP 2.63
24: Role short-term incentives should play in EVP 2.49
25: Role guaranteed package should play in EVP 2.39
According to the respondents, more emphasis should be placed on all the
components. Respondents were of the opinion that the most emphasis should be
placed on long-term incentives, indicated by the highest of all the mean scores.

Page 69
5.3 Cross-tabulations
Respondents' job levels, obtained from the demographic analysis, were cross-
tabulated with a series of other results. These cross-tabulations provide insight into
who the decision makers are, and what decisions they make with regard to EVP and
the remuneration components.
The first combination of data to be cross-tabulated was job level and the participant’s
role in the organisation's business strategy decision making. The CEOs, with a mean
score of 4.5, felt they spend the greatest percentage of their time on business strategy.
The board members came second, with a rank score of 4.25. The specialists and
other groups spend the least amount of time on organisational business strategy. The
results of the cross-tabulation can be seen in Table 5.14.
Table 5.14: Cross-tabulation of job level and percentage role in organisational
business strategy, sorted by mean score.
Job level Mean
Percentage role in organisational strategy
0% - 19%
20% - 39%
40% - 59%
60% - 79%
80% - 100%
CEO 4.50 0 0 0 2 2
Board Member 4.25 1 0 0 0 3
Financial Director 4.00 0 0 0 1 0 Human Resources Director 3.17 1 2 0 1 2
Executive Manager 2.83 1 2 0 3 0
Senior Management 2.83 3 9 10 6 2
Specialist 1.82 15 12 5 2 0
Other 1.75 9 3 3 1 0
The cross-tabulation between job level and role in EVP decision making shows that
CEOs and board members play the most important role in EVP decision-making. The
specialists and other job levels play the least important roles in EVP decision making.
The cross-tabulation between job level and EVP decision making is shown in Table
5.15.

Page 70
Table 5.15: Cross-tabulation of job level and role in EVP decision making, sorted
by mean score.
Job level Mea
n
Role in EVP decision-making process
No role Small role
Medium role
Big role
Major role
CEO 5.00 0 0 0 0 4
Board member 4.50 0 0 1 0 3
Human resources director 4.30 0 0 0 4 2
Executive manager 4.20 0 1 0 2 3
Financial director 4.00 0 0 0 1 0
Senior management 3.10 0 7 15 5 3
Specialist 1.90 15 12 5 2 0
Other 1.90 6 5 5 0 0
The HR directors felt that EVP decision making plays a more important role in their job
descriptions than business strategy decision-making. The financial directors, on the
other hand, felt that business strategy decision making plays a more important role in
their job description than EVP decision making.
The respondents' perceptions of their current organisations' brand strength is an
important indicator of their perception of their organisations. The cross-tabulation of
job level and employer brand indicated that all the job levels felt that their
organisation's brand is positive. The single financial director that responded to the
survey gave his organisation a strong brand rating of 5. CEOs gave the second-
highest rating, with a mean score of 4.25, followed by the executive manager group
(4.17), and the board member group (4). The other job levels rated their organisations'
brands the lowest, with a mean score of 3.25. The full results of the cross-tabulation
are provided in Table 5.16.

Page 71
Table 5.16: Cross-tabulation of job level and organisational brand, sorted by
mean.
Job level Mean
Very weak brand
Weak brand
Neither weak nor strong brand
Strong brand
Very strong brand
Financial director 5.00 0 0 0 1 0
CEO 4.25 0 0 1 1 2
Board member 4.00 0 0 0 4 0
Executive manager 4.17 0 0 1 3 2 Human resources director 3.83 0 1 1 2 2
Senior management 3.77 0 4 6 13 7
Specialist 3.62 2 3 9 12 8
Other 3.25 0 4 5 6 1
Table 5.16 shows a strong correlation between the seniority of the job level and the
perception of the employer brand. The table also indicates that the job levels that play
the biggest parts in EVP decision-making and business strategy are also the most
positive about their organisations' brands.
Items 14 to 17 of the survey covered the synchronization of EVP and the organisations'
business strategy:
14: There are formal structures in the organisation to create its EVP.
15: Your organisational EVP reflects its strategy.
16: Organisational goals are taken into consideration when planning
an organisation's EVP.
17: There is synchronisation between the EVP planning process and
the organisational planning process.
The cross-tabulation of the job levels and items 14 to 17 indicated that the different job
levels more or less agreed with the statements. The means of the cross-tabulation are
shown in Table 5.17 below.
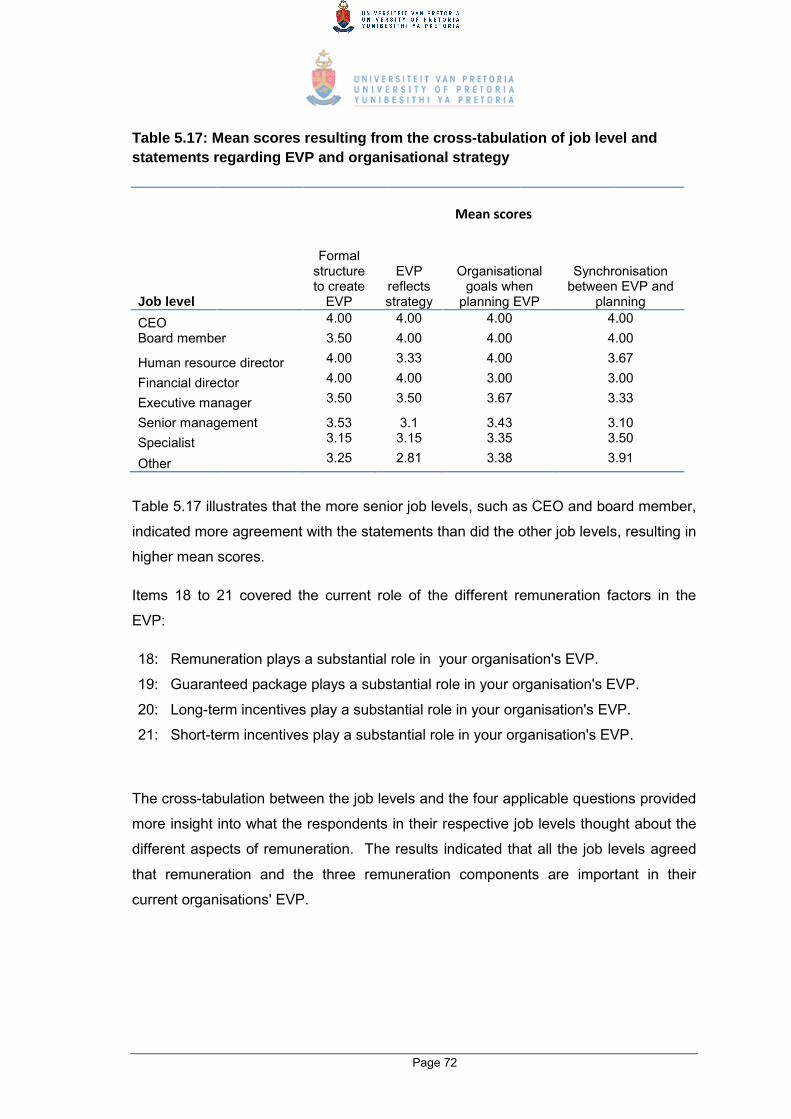
Page 72
Table 5.17: Mean scores resulting from the cross-tabulation of job level and
statements regarding EVP and organisational strategy
Mean scores
Job level
Formal structure to create
EVP
EVP reflects strategy
Organisational goals when
planning EVP
Synchronisation between EVP and
planning
CEO 4.00 4.00 4.00 4.00
Board member 3.50 4.00 4.00 4.00
Human resource director 4.00 3.33 4.00 3.67
Financial director 4.00 4.00 3.00 3.00
Executive manager 3.50 3.50 3.67 3.33
Senior management 3.53 3.1 3.43 3.10
Specialist 3.15 3.15 3.35 3.50
Other 3.25 2.81 3.38 3.91
Table 5.17 illustrates that the more senior job levels, such as CEO and board member,
indicated more agreement with the statements than did the other job levels, resulting in
higher mean scores.
Items 18 to 21 covered the current role of the different remuneration factors in the
EVP:
18: Remuneration plays a substantial role in your organisation's EVP.
19: Guaranteed package plays a substantial role in your organisation's EVP.
20: Long-term incentives play a substantial role in your organisation's EVP.
21: Short-term incentives play a substantial role in your organisation's EVP.
The cross-tabulation between the job levels and the four applicable questions provided
more insight into what the respondents in their respective job levels thought about the
different aspects of remuneration. The results indicated that all the job levels agreed
that remuneration and the three remuneration components are important in their
current organisations' EVP.

Page 73
Table 5.18: Mean scores resulting from the cross-tabulation of job levels and
current remuneration components
Mean scores
Job level Remuneration Guaranteed
package
Short-term
incentives
Long-term
incentives
CEO 4.50 3.50 4.25 4.50
Board member 3.50 3.75 4.00 3.50
Human resource director 3.67 3.67 3.17 3.33
Financial director 4.00 4.00 4.00 4.00
Executive manager 4.00 3.67 4.17 3.83
Senior management 3.73 3.87 3.43 3.53
Specialist 3.82 4.00 3.26 3.53
Other 4.00 3.69 3.25 3.31
The job levels of CEO and board member had the highest mean scores. The CEOs
scored the highest mean scores for remuneration and long-term incentives, indicating
that they feel very strongly about these two components. The only other mean score
above four was the importance that executive managers placed on short-term
incentives.
The role that the respondents felt remuneration and its three components should play
in the EVP was covered in Questions 22–25:
22 What role should remuneration play in your organisation's EVP with
regards to importance?
23: What role should guaranteed package play in your organisation's EVP
with regards to importance?
24: What role should short-term incentives play in your organisation's EVP
with regards to importance?
25: What role should long-term incentives play in your organisation's EVP
with regards to importance?
The questions offered three possible responses: less important, keep the same, and
more important. The mean scores show that all the participants felt that the different
components should be at least as important as they are currently viewed, or they
should play a more important role in the future, with the exception being the board

Page 74
members, who indicated that guaranteed package could play a smaller role.
Guaranteed package scored the lowest mean totals of all the job levels, with the
exception of other.
Table 5.19: Mean scores resulting from the cross-tabulation of job levels and
importance of remuneration components
Mean score
Job level Remuneration Guaranteed
package
Short-term
incentives
Long-term
incentives
CEO 2.50 2.50 2.50 2.75
Board member 2.25 1.75 2.25 2.75
Human resource director 2.83 2.00 2.50 3.00
Financial director 2.00 2.00 3.00 3.00
Executive manager 2.50 2.00 2.33 2.67
Senior management 2.60 2.47 2.50 2.93
Specialist 2.59 2.38 2.62 2.50
Other 2.81 2.69 2.25 2.50
On average, it was the opinion of the participants that remuneration and its three
components (guaranteed package, short-term incentives, and long-term incentives)
should play a more important role in their organisations' EVP.
5.4 Regression analysis
A regression analysis was conducted to investigate whether the remuneration
questions were good predictors of the employer brand.
Table 0.20: Regression analysis of employer brand and current remuneration
components.
Model
Unstandardised
coefficients
Standardised
coefficients t P
(Sig) R R² ∆R²
Employer brand and current remuneration components
B SE Beta
0.24 0.06 0.05
(Constant) 0.57 0.72
0.79 0.43 ESP 0.68 0.28 0.24 2.41 0.02

Page 75
The significance level of 0.02, shown in Table 5.19, indicates that the questions
related to remuneration offer a significant predictor of the dimensions of employer
brand. This set of questions produced an R² value of 0.05 for the prediction of the
affective dimension, indicating that only 5% of the total variance in the affective
dimension was explained by the regression model consisting of the questions on
remuneration.
Table 0.21: Regression analysis of employer brand and EVP/business strategy
synchronisation
Model Unstandardised
coefficients
Standardised
coefficients t P
(Sig) R R² ∆R²
Employer brand and EVP/strategy synchronisation
B SE Beta
(Constant) 1.00 0.64
1.57 0.12
0.39 0.15 0.10
ESP 0.85 0.20 0.39 4.20 0
It is evident from Table 5.20 that the questions related to EVP/business strategy offer a
significant predictor of all the dimensions of EVP. This set of questions produced an
R² value of 0.15, indicating that only 15 percent of the total variance in the affective
dimension was explained by the regression model consisting of the set of questions on
EVP/strategy.
Both sets of questions are significant predictors of the employer brand, but explained
relatively small portions of the employer brand.
5.5 Conclusion
This chapter was a presentation of the research results. The results of the survey
indicate that remuneration, guaranteed package, long-term incentives, and short-term
incentives are important in the construction of an organisation's EVP, and should play
an even more important role in this process. In terms of the relationship between EVP
and strategy, the respondents were of the opinion that it is important for organisations
to align these two constructs in order gain the optimal results for the organisation. The
role players in the EVP decision-making process were also ranked according to
importance in the EVP process, with CEOs ranked as the most important. The results

Page 76
also suggest a strong correlation between the role players in EVP decision-making and
organisational decision-making.
The next chapter will provide a discussion on the results of the research against the
background of the literature review in Chapter 2 and the research questions discussed
in Chapter 3.

Page 77
Chapter 6: Discussion of results
The previous chapter outlined the statistical analyses conducted on the raw data
obtained from the survey. In this chapter, the results are discussed and linked to the
literature review and research questions of this study.
The main purpose of this research was to better understand EVP in organisations.
More specifically, the study aimed to establish whether remuneration, guaranteed
package, long-term incentives, and short-term incentives still play a role in
organisational EVP, who makes those decisions, and how those decisions are
influenced by organisational strategy. In this chapter, the researcher will present a
comprehensive discussion of the findings from both the literature and the present
study. An integrated conclusion, derived from the findings, is presented at the end of
this chapter, together with a framework that will illustrate the relationship between the
components that need to be in place to ensure the optimal EVP strategy. The
discussion of the results in this chapter is presented in the order in which the research
questions were presented. The original research questions were:
Primary research question: To what extent do remuneration, guaranteed package,
long-term incentives, and short-term incentives play a role in an organisation’s EVP?
Secondary research question 1: To what extent does the organisational strategy play
a role in the organisation’s EVP?
Secondary research question 2: Who in the organisation are the decision makers
regarding the EVP?
6.1 Research Question 1
With Research Question 1, the researcher sought to determine the role of
remuneration, guaranteed package, and long-term incentives in the organisational
EVP.

Page 78
6.1.1 Remuneration
Gioncola (2009) states that multiple components of reward need to be combined to
form an organisational rewards strategy. By comparing the means of the different
components rated by the respondents in the present study, it is clear that fixed pay (i.e.
mean=3.5644) is considered the most important component of the total reward
package. This result is in conflict with some theories covered in Chapter 2 (e.g., that of
Tang et al., 2004) that propose that organisations should not concentrate on money as
a reward, but supports other theories, such as that of Rynes et al. (2004), that the role
of pay is underrated. It is clear from the means obtained in the present study that base
pay is distinctly important.
The analysis of the means indicated that remuneration and its components play the
following role in the EVP:
Remuneration – Remuneration as a collective concept is crucial in the
organisational EVP, which is in agreement with the literature (Bussin &
Gildenhuys, 2008). The results of the present study further indicate that
remuneration should play an even more important role in an organisation's
EVP.
Guaranteed package – Guaranteed package as one of the components of
remuneration currently plays the most important part of all the components of
remuneration. This is supported by Bussin (2010) who states that more than
70% of South African organisations use guaranteed package structures to pay
their employees. The present study also shows that guaranteed package
should play a more important role in an organisation's EVP with 97% of the
respondents stating that guaranteed package should play the same role or an
more important role in the future. However, more than half of the respondents
indicated that the role of guaranteed package should stay the same.
Respondents were of the view that guaranteed package requires the least
increase in emphasis when planning future EVPs.
Long-term incentives – This component is regarded as requiring the most
emphasis when organisations plan their future EVP. Long-term incentives play
an important part in an organisation's EVP, but the present study shows that
long-term incentives are currently playing the smallest part of all the
remuneration components. Organisations, therefore, need to rethink their

Page 79
strategy with regards to long-term incentives, and use it more effectively in their
future remuneration strategies. The trend of long-term incentives' growth in
importance is supported by Quirk (2012), who states that the popularity of long-
term incentives in the US has grown from 14% in 2006 to 25% in 2011.
Short-term incentives – According to the present study's results short-term
incentives play an important part in the organisational EVP, and organisations
need to put more emphasis on short-term incentives in the future. The
literature states that 77% of firms showing a profit over a three-year period
offered short-term incentives (Erasmus & Schenk, 2008).
Theory covered in the literature review also proposes that managers should gain an
understanding of all the components of the total reward package to enable them to
motivate employees. The results of the research show that all the components play a
significant role in the eyes of the respondents, and all of the components showed
relatively high means, which suggests that all have to be considered to a certain
extent. The attributes that employees consider important differ from organisation to
organisation (Maxwell & Knox, 2012), which needs to influence decision makers when
they plan their remuneration strategy.
6.1.2 Total reward package
The importance of the different remuneration components was discussed above. The
rank order of importance of the components of the total reward package according to
the present research is as follows:
1. Fixed salary
2. Development and career opportunities
3. Performance and recognition
4. Variable pay
5. Work-life balance
6. Benefits.
Managers and decision makers need to understand that all the components are
important when considering a total reward package. The results of the present study
show that fixed salary is statistically more important than the other components. Very

Page 80
little statistical differentiation is shown between the other components. This indicates
that all the components are important in the remuneration process, and all should be
used effectively. This finding is in line with the literature, with Rynes et al. (2004)
suggesting that pay is significant because it is widely applied across industries and
organisations, and has a wide range of symbolic meanings. Managers and decision
makers need to strategically plan their remuneration programme, taking into account
their organisations' unique circumstances.
6.1.3 Opinion of the job levels
It is clear from the results of the present study that the participants regard the role of
remuneration and its three components (guaranteed package, long-term incentives,
and short-term incentives) in the organisational EVP as important. The research also
shows that companies are currently concentrating the most on remuneration as a
whole construct, and guaranteed package as a single component, when they consider
their organisational EVP.
The respondents indicated that all four components should play more important roles
in the organisation's EVP. Remuneration and short-term incentives need the biggest
increase in emphasis when planning organisations' EVP.
Different job levels have different view on the importance of the different remuneration
components in the organisational EVP. CEOs, specialists, and Other are of the
opinion that remuneration is currently playing the most important role in the
organisational EVP, while board members are of the opinion that guaranteed package
and short-term incentives are the most important components. According to human
resource directors, remuneration and guaranteed package are the most important, and
senior managers regard guaranteed package as the most important. The importance
that the components should receive also differs between the different job levels, but
not as much as regarding the current importance of the components.
The significant difference in the views of job levels regarding the importance of the
different components could be due to two reasons: The first is the message that the
organisations are sending to employees and the second is the personal wants and
needs of the employees (Cross & Friedman, 2004).

Page 81
6.1.4 Conclusion
The different components researched are all important to the EVP. Remuneration as a
whole should receive the most attention from organisations when they plan their
organisational EVP. More thought also needs to be given to the weighting accorded to
the individual components when considering the organisational EVP.
The differences in perspectives of the different job levels also show that different
organisations treat the remuneration process differently, a notion that is supported by
Gross and Friedman (2004) when they say that total reward needs to be unique to
each organisation. Also, different job levels in organisations seek different strategies
when regarding their total reward package.
Future EVP decision makers need to concentrate on what the different employees see
as important in terms of rewards. It is crucial for EVP decision makers to treat each
case and each employee on own merit, as people, companies, and job levels differ.
Organisations need to start now, as it is predicted that the war for talent will continue
in the future (Bussin, 2008). It is evident from the literature review that organisations
need to invest in their reward strategy and put one in place that will further enhance
their achievements (Armstrong, 2011).
Remuneration, guaranteed package, long-term incentives, and short-term incentives
play a substantial role in determining an organisation’s EVP. The roles that these
components play are dependent on the organisation and the EVP decision makers.
6.2 Research Question 2
Research Question 2 sought to determine the extent of the role of organisational
strategy in determining an organisation's EVP.
6.2.1 The alignment
It is stated in the literature that the alignment of business and human resources is the
central principle of strategic human resource management (Batt, 2007). This view is
also supported by the results obtained from the analysis of the data in the present
study.

Page 82
The present research indicates that the EVP should reflect the organisation's strategy.
The research further indicates that formal structures have been put in place to create
the EVP. Organisations are also aligning their EVP with their business strategy by
considering their goals when planning their EVP.
However, analysis of the data showed that a high percentage of organisations have no
formal structures in place to create their organisational EVP. Furthermore, a high
percentage of respondents felt that their organisation’s EVP did not reflect its strategy,
and that there was no synchronisation between the business and the EVP. The lack of
alignment between business strategy and EVP is supported by the literature, which
states that one of the biggest challenges faced by management is the employment of
motivation techniques to achieve business strategy goals (Arnolds & Venter, 2008).
6.2.2 Conclusion
The percentage of organisations that are aligning their EVP strategy with their
organisational strategy is high, as expected, but the number of organisations that are
not aligning their EVP with their organisational strategies is also substantial. This
leads to mixed messages being sent to employees as the employees doesn’t always
know where they stand with their organisations. This finding also contradicts the
literature discussed in Chapter 2, where it was stated that HR should play a part in
business strategy decision making, and should align their strategies with those of the
organisation (Aghazadeh, 2003).
The analysed data from the present research are supported by the literature, but it
seems that many organisations that are not successfully aligning of their EVP and their
organisation's business strategy.
6.3 Research Question 3
With Research Question 3, the study sought to determine who the decision makers are
in the EVP decision-making process.

Page 83
6.3.1 Role players
The literature indicates that remuneration and EVP processes are not only the
responsibility of the human resource function. Chapman and Kelliher (2011) identified
four groups that influence the decision making of the reward mix, namely the board,
the CEO, the human resource director, and the financial director. Literature shows that
the role players in the reward mix are diverse. For the purpose of the present study, a
more comprehensive list of role players was used. The rankings of the role players in
the EVP decision-making process is as follows:
1 CEO
2 Human resource directors
3 Leadership team
4 Executive team
5 Financial directors
6 Senior management
7 Board member
8 Line manager
9 Specialist
The rankings of the business strategy role players differ from those in EVP decision-
making, which differences are discussed in the next section.
6.3.2 EVP decision makers vs. business strategy decision makers
The Pearson correlation coefficient of the perceived EVP decision-making role players
and the perceived organisational strategy role players was discussed in the previous
chapter. There is a positive relationship between all the variables from the EVP group
compared to the strategy group, the relationships between the two groups varies in
strength.
There are differences in the ranking in term of the role players in EVP and the role
players in business strategising. A human resources director is ranked number 6 in
business strategising and number 2 in EVP decision-making. This indicates that there

Page 84
is a difference in the importance of the different jobs in the two processes. However,
the Pearson correlation indicated that there is a correlation between all the job levels
with regard to the EVP and business strategy.
The above mentioned results are supported by the literature. Dyer and Holder (1988)
state that human resources executives should cooperate with their counterparts in
other departments in developing HR strategies. It is also stated that the human
resource function should play a role in developing business strategy.
In the present study, correlations between different job levels were evident, e.g., CEO
has a strong negative correlation with specialist and other, and a medium relationship
with leadership team and human resources director. The relationship between the job
levels and whom they perceive as the future decision makers will be an interesting
topic for future research.
6.3.3 Cross-tabulation
It is evident from the cross-tabulation of the job levels and the roles they play in the
EVP decision-making process that CEOs play the biggest role in the EVP decision
making, while specialists play the smallest part in both EVP decision making and
business strategy. Human resources directors and executive managers both play
bigger parts in the EVP decision-making process than in business strategy decision-
making.
6.3.4 Conclusion
The main EVP decision makers in organisations are the CEO, the human resources
director, and the leadership team. The role players play slightly different roles in the
EVP decision-making process and the business strategy, but there is a medium to
strong correlation for all the job levels, which indicates that the job levels play similar
roles in the two processes, even if the roles are not exactly the same.
Page 85
6.4 Conclusion
The results from the research illustrate that organisations need to understand and
utilise all components of the total reward package to extract the optimal value for the
company. The literature indicates that non-financial rewards are important in reward
strategy, but the present research clearly shows that financial rewards remain the
primary reward strategy.
Organisations are attempting to align their EVP with their business strategy, but the
present research shows that many organisations that are not attaining the optimal
alignment. The present study also shows that EVP decision-making should be aligned
with the organisation's business strategy.
The literature indicates that human resources should involve other departments in the
rewards strategy process, and that human resources should also play a significant role
in the business strategy process. The research results indicate that there is a
correlation between EVP decision making and the organisation's business strategy,
with the most important role players in the EVP decision-making process being the
CEO, the human resource director, and the leadership team.
6.4.1 EVP planning framework
The findings mentioned above hold numerous implications for organisations when they
plan their organisational EVP. Armed with information on the important decision
makers, the alignment of EVP, and the remuneration components, stakeholders could
develop EVP and remuneration strategies that will increase employee satisfaction and
ultimately improve the outcomes for the their organisations.
The relationships between the different components involved in planning the
organisation's EVP are shown in Figure 6.1. The figure illustrates that the components
are placed around the needs of the employees; the needs of the employees have to be
taken into consideration when planning the organisation's EVP. The figure further
illustrates that the entire process is reliant of environmental factors such as industry
and macro economic environment, and that the process will be different for every
organisation.

Page 86
The alignment of EVP and business strategy goes hand in hand with who the decision
makers are. The research shows that the EVP should be aligned with organisation's
business strategy. The research also shows that the same decision makers play very
similar roles in the EVP and the organisation's strategy decision-making process.
Alignment is an evolving process, and should be constantly reviewed and considered.
It is important that the right decision makers ensure the best EVP by aligning it with the
organisation's business strategy. The information should also flow the other way ‒ the
right the decision makers should be selected to ensure optimal alignment.
The third factor in Figure 6.1 is remuneration, the tool that these managers could use
to ensure alignment of the EVP with the business strategy, by considering the needs of
the employees. The research indicated which of the remuneration components are
important to employees. The ranking or these components according to the current
study are: remuneration, guaranteed package, short term incentives and long term
incentives.

Page 87
Figure 6.1: EVP planning framework. Source: Integration of the literature review
and factor analysis (Author's own)
The correct decision makers with knowledge of the organisational strategy should be
empowered to ensure that the needs of the employees are met by using the optimal
remuneration strategy.
The following chapter concentrates on the results of the research, and includes a
discussion of recommendations and the limitations of the study.
Environmental
factors
influencing the
organisation

Page 88
Chapter 7: Conclusion
7.1 Introduction
In the previous chapter, the results obtained from the data were discussed with
reference to the literature.
Literature on remuneration tends to concentrate on non-financial elements, but the
results from the present research contradict the literature. Very little literature exists on
the role players in the EVP decision-making process, and the present study
investigated who makes the decisions in the organisational EVP process. Some
literature exists on the relationship between the business strategy and EVP, but no
actual research studies were found. The present study explored the relationship
between business strategy and EVP.
It is also the first time that research has attempted to explain the relationship between
remuneration, business strategy, and decision making in an EVP. A framework was
developed to explain the relationship between the different components.
The focus in this chapter is on the main findings of the research and the
recommendations resulting from these findings. Recommendations for future research
are made and the limitations of the present study are identified and discussed.
7.2 Main findings of the study
The purpose of this research was to gain an understanding of the EVP process in
organisations. More specifically, the study aimed to establish whether remuneration
still plays a role in an organisation's EVP, who makes those decisions, and how those
decisions are influenced by the organisation's business strategy.
In an attempt to obtain clarity on the above, the following research questions were
posed:
Question 1: To what extent do remuneration, guaranteed package, long-term
incentives, and short-term incentives play a role in an organisation’s EVP?
The results showed that remuneration and all its components play a significant role in
the EVP. In addition, the results indicate that there should be more emphasis on
remuneration and its three components, especially short-term incentives.

Page 89
Question 2: To what extent does organisational strategy play a role in determining the
organisation’s EVP?
Most organisations successfully align their EVP with their business strategy. The
present study and the literature indicate that EVP decision making is conducted with
the organisational strategy in mind. However, a substantial percentage of
organisations fail to achieve this, as their EVP decision making is completely
disconnected from their business strategy.
Question 3: Who in are the decision makers regarding the EVP?
A high correlation exists between EVP decision makers and the business strategy
decision makers. The key EVP decision makers were ranked as follows:
1 CEO
2 Human resource directors
3 Leadership team
4 Executive team
5 Financial directors
6 Senior management
7 Board member
8 Line manager
9 Specialist
Organisations need to appoint the right people to ensure the alignment of EVP and
strategy. These decision makers also need to look at the needs of the employees and
use the most effective remuneration strategy. The decision makers, the business
strategy, the employees' needs, the environment of the organisation, and remuneration
all play a role in organisation's EVP. The relationships between these components
should be managed to ensure an optimal EVP strategy. These relationships are
indicating in the illustration of the EVP planning process below.

Page 90
Figure 7.1: EVP planning framework. Source: Integration of the literature review
and factor analysis (Author's own)
7.3 Recommendations
The present study set out to determine the role of remuneration and its components
(guaranteed package, long-term incentives, and short-term incentives) in an EVP. It is
safe to say that most organisations and employees gravitate towards financial rewards,
even though the literature tends to favour non-financial rewards. The results of the
present study showed that more emphasis should be placed on the financial
components. The literature further states that all organisations are unique. It is
therefore crucial that organisations continuously monitor the needs and wants of their
employees in order to develop their own EVP strategies.
Organisations also need to know how to manage these components. Organisations
throw money at their employees because they don’t know how to manage the rewards
process in order to extract optimal results. This prompts the question: To what extent
has the importance of money been driven by the employee or the employer? It is
Environmental
factors
influencing the
organisation

Page 91
recommended that organisations constantly review their remuneration strategies in
order to align it with the needs of the employees and to manage their rewards strategy.
It is recommended that organisations research and understand what their employees
and potential employees want and need from their pay packages. This needs to be a
continuous and evolving process in order to achieve unified goals between business
strategy and employer brand. This will enable the organisation to gain optimal value
from its human resource assets in terms of the performance of the organisation.
The fact that the present study shows that an EVP should be aligned with the
organisation's business strategy presents a good opportunity for organisations to
involve different role players in both. It is recommended that organisations involve
human resources managers in the business strategy process, and also involve other
senior management positions in the EVP decision-making process. This inclusion of
different role players will make the alignment of EVP and the business strategy more
effective.
The EVP process should be viewed as a whole, rather than different components.
Organisations should develop their EVP strategy by considering the environment as
this will differ between companies. The employees' needs, the decision makers, the
business strategy, and the remuneration components. The organisation should also
consider the relationships between these components when planning their EVP.
7.4 Limitations of the research
The research was done through a quantitative survey sent to respondents via email.
The respondents' views might have been better captured using a qualitative interview.
The small sample of 101 respondents may indicate a lack of depth in the research.
Care needs to be taken when using the results of the present study.
Only clients of the SARA were included in the present study. The sample might have
produced skewed results due to sample bias. The survey reached mainly HR
managers, which might have resulted in a bias in favour of this group.
The lack of depth further manifests in the lack of representation for some of the job
levels. Caution needs to be taken when using data from the present study concerning
the different job levels.

Page 92
The present study does not explore all of the components of EVP and is therefore not
comprehensive in this regard.
7.5 Suggestions for future research
The literature suggests that non-financial rewards are the preferred reward type. This
is contradictory to the results of the present study, which found that monitory reward in
the form of base pay is considered the most important. Further studies could retest
these results using bigger samples and all the components of reward.
The preferences of employees, according to the present study, are monitory rewards.
Another suggestion for future research is to investigate what influences these
preferences, as well as the dynamics of these preferences, for whether employer
preferences are dependent on macro-economic factors, status, and life cycle.
The current study was conducted on all job levels in organisations. Future research
could be done in more detail on specific job levels. This will indicate their specific
preferences, which will be to the benefit of organisations with EVP strategies.
The different job levels gave a variety of answers to the questions regarding EVP and
reward components. It is suggested that future research be done on the way in which
human resources departments communicate their strategic plans to employees and
other departments in organisations.
The present study indicates that HR management should be included in the
organisation's business strategy process, while including other job levels such as
financial director, management team and the CEO in the EVP decision-making
process. Future research could establish how these two roles can be combined to
streamline the two processes in the organisation.
The EVP should be aligned with the organisations business strategy. A possible
framework for this alignment can be considered for a future study.
A random sample should be used to ensure that inferences can be made for the entire
population.
The relationship between the job levels and whom they perceive as the future decision
makers in the EVP decision making process will be an interesting topic for future
research.

Page 93
Future research could also explore the dynamics of the relationships in the EVP
planning framework.
7.6 Conclusion
The main objective of this study was to establish the role of remuneration components
in an organisation's EVP. In addition, the study explored the alignment of EVP with
business strategy, as well as the decision makers in the EVP process.
A total reward strategy should be applied, as there is more to reward than just money.
Guaranteed package, long-term incentives, and short-term Incentives are also
important in the total reward package. It is evident from the present study that
remuneration is still considered the most important form of reward, and that base pay
is the most important remuneration component.
It was further confirmed that organisations should align their EVP strategy with the
business strategy in order to maximise the benefit to the organisation. There are
multiple decision makers in the EVP process, with the CEO and the human resource
managers being the most important.
Considering that the challenges related to reward will remain in the future, it is advised
that organisations understand their workforce and their needs, while aligning their EVP
to their organisation's business strategy. This will only be possible with the right
leadership and role players in place.
Organisations should consider their EVP as the sum of all the parts, and not the parts
individually.

Page 94
List of references:
Aghazadeh, S.M. (2003). The future of human resource management. Work Study, 52(4), 201-207.
Alreck, L.A. & Settle, R.B. The survey research handbook. Boston: McGraw-Hill/Irwin
Armstrong, M. (2006). A handbook of human resource management practice (10th ed.). United Kingdom: Cambridge University Press.
Armstrong, M. (2011). Armstrong's handbook of strategic human resource management (5th ed). London: Kogan Page.
Armstrong, M. & Brown, D. (2006). Strategic reward: Making it happen. USA: Kogan Page Limited.
Armstrong, M., Brown, D. & Reilly, P. (2011). Increasing the effectiveness of reward management: an evidence-based approach. Employee Relations, 33(2), 106-120.
Armstrong, M. & Murlis, H. (2001). Reward management(5th ed.). London: Kogan Page.
Arnolds, C. & Venter, D. (2008). The strategic importance of motivation rewards for lower level employees in the manufactoring and retailing industry. South African Journal of Industrial Psychology, 33(3), 15-23.
Bach, S. (2005). Managing human resources: Personnel management in transition. Oxford: Blackwell Publishing.
Barrow, S. & Mosley R. (2005). The employer brand: Bringing the best of brand management to people at work. New York: John Wiley & Sons.
Bartol, K. & Srivastava, A. (2002). Encouraging knowledge sharing: The role of organisational rewards systems. Journal of Leadership & Organisational Studies, 9(1), 64-76.
Batt, R. (2007). Service strategies, in The Oxford Handbook of Human Resource Management. Oxford: Oxford University Press.
Botha, A., Bussin, M. & de Swardt, L. (2011). An employer brand predictive model for talent attraction and retention. SA Journal of Human Resource Management , 9(1), 1-12.
Boxall, P.F. (1996). The strategic HRM debate and the resource-based view of the firm. Human Resource Management Journal, 6(3), 59-75.
Boxall, P.F., Purcell, J. & Wright, P. (2007). Human resources management: Scope analysis and signifigance, in The Oxford Handbook of Human Resource Management. Oxford: Oxford University Press.
Brand Learning. (2009). Employee value propositions: a key marketing tool for talent management. Retrieved from http://www.brandlearning.com/Uploaded Documents/Employee-Value-Propositions.pdf.

Page 95
Brown, D. (2001). Reward strategies: From intent to impact. London: CIPD.
Bussin, M. (2003). Factors driving changes to remuneration policy and outcomes. Ph.D thesis, Johannesburg: University of Johannesburg.
Bussin, M. (2008). Remuneration trends. Rosebank: 21st Century Pay Solutions Group.
Bussin, M. (2009). Exploring the link between incentives and motivation. Retrieved from http://www.21century.co.za.
Bussin, M. (2010). Total guaranteed packages: Dead or alive? Retrieved from http://www.21century.co.za.
Bussin, M., & Gildenhuys, H. (2008). Total guaranteed packages: dead or alive? 21st Century PaySolutions Group
Chapman, J. & Kelliher, C. (2011). Influences on reward mix determination: Reward consultants' perspectives. Employee Relations , 33(2), 121-139.
Chartered Institute of Personnel and Development. (2007). HR business partnering, CIPD, London.
Cheese, P., Thomas, R.J. & Craig, E. (2007). The talent powered organization: strategies for globalization, talent management and high performance. London: Kogan Page Limited.
Collis, D.J. & Rukstad, M.J. (2008). Can you say what your strategy is? Harvard Business Review. Retrieved September 4, 2012, from http://hbr.harvardbusiness.org/2008/04/can-you-say-what-your-strategy-is/ar/1.
Corporate Leadership Council. (2007). Leveraging total rewards to attract and retain in-store employees. Retrieved from www.corporateleadershipcouncil.com.
De Winnaar, J. (2008). Employee behaviour towards pay-for-performance in a collections environment of a financial institution, University of Pretoria. Johannesburg: Gordon Institute of Business Science.
Donath, B. (2001). Branding works for internal audience too. Marketing News, 35, 7.
Dyer, L. & Holder, G.W. (1988). Resource management: Evolving roles and responsibilities, Washington DC: Bureau of National Affairs.
Eckbo, B.E. (2008) Handbook of corporate finance: Empirical corporate finance. Amsterdam: Elsevier
Erasmus, B.J. & Schenk, H.W. (2008). South African human resource management, Cape Town: Juta & Co Ltd
Ferguson, R. & Brohaugh, B. (2009). The talent wars, Journal of Consumer Marketing, 26(5), 358-362.
Field, A. (2009). Discovering statistics using SPSS (3rd ed.). London: Sage

Page 96
Finney, J. (2010). The new 'new deal'. Communication World , 27(2), 27-30.
Fowler. F.J. (2009). Survey research methods. (4th ed.). California: Sage.
Giancola, F.L. (2009). Is total rewards a passing fad? Compensation & Benefits Review , 41(29), 29-35.
Gross, S.E. & Friedman, H.M. (2004). Creating an effective total reward strategy: Holistic approach better supports business success. Benefits Quarterly ,(20), 7-12.
Guest, D.E. (1987). Human resource management and industrial relations, Journal of Management Studies, 24(5), 503-521.
Harris, S. & Clements, L. (2007). What's the percieved value of your incentives? Workspan, Scottsdale, United States: WorldatWork Press.
Haynes, D. (2002). Assesing existing remuneration strategies of medical representatives in South Africa. Unpublished MBA Thesis, Gordon institute of Business Science, University of Pretoria, Johannesburg.
Heger, B.K. (2007). Linking the Employment Value Proposition(EVP) to employee engagement and business outcomes: Preliminary findings from a linkage research pilot study. Organisational Development Journal , 25(2), 121-132.
Herzberg, F. (1987). One more time – How do you motivate employees? Harvard Business Review, 65(5), 109-120.
Hiles, A. (2009). Though times demand focus – Total rewards strategy. Benefits Quarterly, 44-47.
Hill, B. & Tande, C. (2006). Total Rewards – the employment value proposition. Workspan. Scottsdale, United States:Worldatwork Press.
Howell, D.C. (2004). Fundamental statistics for the behavioural sciences(5th ed.). Belmont: Thomson Learning.
Kalajian, M. (2011). Employer Brand Network for ICT B2B multinationals. Case Study: Ericson AB.
Kerry-Phillips, B. & Thomas, A. (2009). Macro and micro challenges for talent retention in South Africa. South African Journal of Human Resource Management, 7(1), 1-10.
Kochanski, J.T. (2004). How business operating models drive talent development. WorldatWork Journal. Third Quarter, 2004.
Leonardi, C. (2007). Skills management becomes a key strategic imperative. Gordon Institute of Business Science Review, (10), 1-4.
Mahaney, R. & Lederer. (2006). The effect of intrinsic and extrinsic rewards for developers on information systems project success. Project Management Journal, 37(4), 42-54.
Mandhanya, Y. & Shah, M. (2010). Employer branding: A tool for talent management. Global Management Review, 4(2), 42-48.
Maslow, A.H. (1943). A theory of human motivation. Psychological Review , 370-396.

Page 97
Maxwell, R. & Knox, S. (2012). Motivating employees to "live the brand": a comparative case study of employer brand attractiveness within the firm. Journal of Marketing Management, 25(9), 894-907.
Minchington, B. (2010). The employer brand manager’s handbook. Torrensville: Collective Learning.
Moroko, L. & Uncles, M. (2008). Characteristics of succesful employer brands. Brand Management, (16), 160-175.
Munsamy, M. & Venter, A. (2009). Retention factors of management staff in the maintenance phase. SA Journal of Human Resource Management, 7(1), 1-9.
Nienaber, R. (2009). The relationship between personality types and reward preferences. (Ph.D thesis), Johannesburg: University of Johannesburg.
Parker, O. & Wright, L. (2001). The missing link: Pay and employee commitment. Ivey Business Journal, 65(3), 70-79.
Quirk, W. (2012). Long term incentive pay plans: a value option for healthcare organisations. Healthcare Financial Management, 66(9), 132-140
Ryan, R.M. & Deci, E.L. (2000). Self determination theory and the facilitation of intrinsic motivation, social development, and well-being. American Psychologist, 55(1), 68-78.
Rynes, S., Gerhart, B. & Minette, K. (2004). The importance of pay in employee motivation: Discrepancies between what people say and what they do. Human Resource Management, 43(4), 381-394.
Sartain, L. & Schumann, M. (2006). Brand from the Inside: Eight essentials to emotionally connect your employees to your business. San Francisco: Jossey-Bass.
Saunders, M. & Lewis, P. (2012). Doing research in business and management. Harlow: Prentice Hall.
Sheldon, K.M., Gunz, A., Nichols, P.C. & Fergusen, Y. (2010). Extrinsic value orientation and affective forecasting: Overestimating the rewards, underestimating the costs. Journal of Personality, 78(1), 149-178.
SPSS Inc. (2012). SPSS 20 for Windows. Chicago, IL: Author.
Talentsmoothie. (2010). Employee Value Proposition (EVP). Hämtat från Organisational development in the new world of work: http://www.sallybibb.com/media/Employee-Value-Proposition-infosheet.pdf den 01 10 2010. Tang, T., Luna-Arocas, R., Sutarso, T. & Tang, D. (2004). Does the love of money moderate and mediate the income-pay satisfaction relationship? Journal of Management Psychology, 19(2), 111-135.
Thomas, K. (2009). The four intrinsic rewards that drive employee engagement. Ivey Business Journal Online, 1-6.
Trevor, J. (2009). Can pay be strategic? In Rethinking Reward. Basingstoke: Palgrave Macmillan.

Page 98
Ulrich, D. & Lake, D. (1990). Organizational capability: Competing from the inside out. New York: Wiley.
Vansteenkiste, M., Lens, W. & Deci, L. (2006). Intrinsic versus extrinsic goal contents in self-determination theory: Another look at the quality of academic motivation. Educational Psychologist, 41(1), 19-31.
WorldatWork. (2007). The WorldatWork handbook of compensation, benefits and total rewards. Hoboken, New Jersey: John Wiley & Sons.
Wright, P.M. & McMahan, C.G. (1992). Theoretical perspectives for SHRM. Journal of Management, 18(2), 295-320.
Zikmund, W.G. (2003). Business Research Methods (7th ed.). Mason, Ohio, USA: South-Western Cengage Learning.
Zingheim, P.K. & Schuster, J.E. (2000). Pay people right! Breakthrough strategies to create great companies. San Francisco: Jossey-Bass.

Page 99
Appendix 1: Research Survey
Dear Participant,
Thank you for setting time aside to complete this questionnaire. It will require approximately 15 minutes of your time.
I am a registered MBA scholar at GIBS University conducting research in the area of Remuneration. The purpose of this questionnaire is to obtain information on the role remuneration plays in the thought process when an organisation determines its Employee Value Proposition, and whether the larger organisational strategy is brought into consideration when determining EVP.
Please note your participation is voluntary and you can withdraw at any time without penalty. All participants will remain completely anonymous throughout the research, and once the questionnaire has been completed, the information is regarded as completely confidential. Feedback of the general results will similarly, also remain completely anonymous.
Instructions for completing the questionnaire:
1
Complete the questionnaire as truthfully as possible. Ensure that all questions have been answered.
2 Note that there are no right or wrong answers to the questions in this questionnaire.
3 The first answer/response that generally comes to mind is usually the most appropriate response to a given question.
Once again, the researcher assumes responsibility for the anonymity and confidentiality of the questionnaires once they have been completed, and wants to urge you to be absolutely honest and truthful when you complete the questionnaire. This is very important for reliable and meaningful

Page 100
research.
Please complete and submit the survey by Thursday the 16th of August.
If you have any concerns, please contact me or my research supervisor (details are listed below).
Researcher: Stephan van der Merwe
Email: [email protected]
Phone: 082 831 7213
Research Supervisor: Dr. Mark Bussin
Email: [email protected]
Phone: 082 901 0055
Questionnaire: Part A
1 Name of your department
2 Please indicate your job title
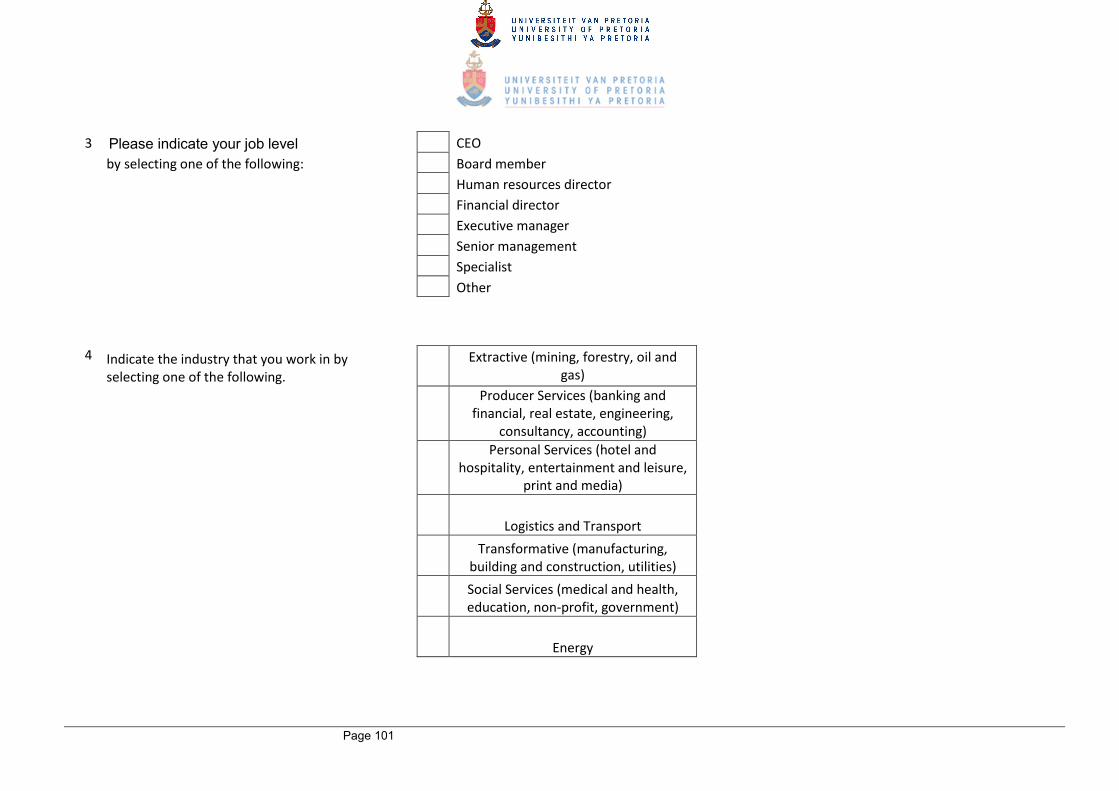
Page 101
3 Please indicate your job level
CEO
by selecting one of the following:
Board member
Human resources director
Financial director
Executive manager
Senior management
Specialist
Other
4 Indicate the industry that you work in by selecting one of the following.
Extractive (mining, forestry, oil and gas)
Producer Services (banking and financial, real estate, engineering,
consultancy, accounting)
Personal Services (hotel and hospitality, entertainment and leisure,
print and media)
Logistics and Transport
Transformative (manufacturing, building and construction, utilities)
Social Services (medical and health, education, non-profit, government)
Energy

Page 102
5 How long have you been working
Less than 2 years
for your current employer?
2 - 5 years
6 - 10 years
More than 10 years
6 Gender
Male
Female
7 What percentage of your current role
0% - 19%
involves organisational strategy?
20% - 39%
40% - 59%
60% - 79%
80% - 100%
8 How big is the role
No role
of the employer value proposition (EVP)
Small role
decision-making process in
Medium role
your current position?
Big role
Major role

Page 103
Questionnaire: Part B
9 The following are components of a
Fixed Salary (salary, 13th cheque, fixed allowances)
total rewards package. Distribute
Variable Pay - short- and long-term incentives (once-off payments if targets are reached, share options)
100 points between the components,
Benefits medical aid, retirement, disability)
based on the importance you attach
Work-life balance (organisational practices, policies and programmes aimed to achieve balance between work and personal life. Includes flexi-time, telecommunications and job-sharing)
to each in regards to EVP. The total
Performance and Recognition (How organisational goals are achieved and how formal or informal recognition are given)
points allocated need to add up to 100.
Development and career opportunities (learning opportunities presented and career opportunities available through company)
10 Rank the following role players in terms
1 2 3 4 5 6 7
of their importance in contributing to
CEO
your organisational EVP decision making
Board member
(1 being the most important and 8
Leadership team
being the least important).
Human resources director
Financial director
Executive manager
Senior management
Line manager
Specialist

Page 104
Other
11 Rank the following role players in terms
1 2 3 4 5 6 7
of their importance in contributing to
CEO
your organisational strategy (1 being
Board member
the most important and 8 being the
Leadership team
least important).
Human resources director
Financial director
Executive manager
Senior management
Line manager
Specialist
Other

Page 105
12 In your opinion, rate your current employer in terms of the strength of the company Ver
y st
ron
g b
ran
d
Stro
ng
bra
nd
Nei
ther
wea
k n
or
stro
ng
bra
nd
We
ak b
ran
d
Ver
y w
eak
bra
nd
as an employer brand.
Please indicate the extent to which you agree or disagree with the following statement:
Stro
ngl
y ag
ree
Agr
ee
Un
dec
ided
Dis
agre
e
Stro
ngl
y d
isag
ree
13 An organisation’s EVP should reflect its strategy.
14 There are formal structures set up in the organisation to create its EVP.
15 Your organisational EVP reflects its strategy.
16 Organisational goals are taken into consideration when planning organisational EVP.
17 There is synchronisation between the EVP planning process and the organisational planning process.
18 Remuneration plays a substantial role in determining your organisation's EVP.
19 Guaranteed package plays a substantial role in determining your organisation's EVP.
20 Long-term incentives play a substantial role in determining your organisation's EVP.
21 Short-term incentives play a substantial role in determining your organisation's EVP

Page 106
In your opinion:
Mo
re im
po
rtan
t
Ke
ep t
he
sam
e
Less
imp
ort
ant
22 What role should remuneration play in your organisational EVP with regards to importance?
23 What role should guaranteed package play in your organisational EVP with regards to importance?
24 What role should short-term incentives play in your organisational EVP with regards to importance?
25 What role should long-term incentives play in your organisational EVP with regards to importance?

Page 107