REMUNERATION OF ACADEMIC STAFF AT SOUTH … · A summary report of the HESA Statistical Study of...
57
REMUNERATION OF ACADEMIC STAFF AT SOUTH AFRICAN UNIVERSITIES: A summary report of the HESA Statistical Study of Academic Remuneration November 2014 1
Transcript of REMUNERATION OF ACADEMIC STAFF AT SOUTH … · A summary report of the HESA Statistical Study of...
REMUNERATION OF ACADEMIC STAFF AT SOUTH AFRICAN UNIVERSITIES:
A summary report of the HESA Statistical Study of Academic Remuneration
November 2014
1
FOREWORD
In the face of ageing academics at most South African universities, as well as the transformation of the academic profession in order to make it more representative of the South African population, it is important to attract the best qualified young people from all population groups in significant numbers into the Academy. Without competitive remuneration for academics, especially at the lower echelons of the profession, many promising potential academics, as well as current academic staff, will be lured away to well paying positions in the public sector, as well as in the private sector
What is the current situation regarding the remuneration of academic staff at South African universities? Is the remuneration of academic staff market related when compared with the remuneration of public sector staff and private sector staff? Which demographic and academic factors discriminate between the different levels of remuneration of academics in South Africa? These types of questions are important and should be tackled head-on.
The Funding Strategy Group (FSG) of HESA proposed to the HESA Board that a study on the remuneration of academic staff should be commissioned. This proposal was accepted by the HESA Board in July 2012. The Executive Office of HESA appointed a Steering Committee to oversee the study1:
At its first meeting on 26 September 2012 the Steering Committee agreed on the following purpose of the study, namely to produce a report for the FSG and ultimately for the Board of HESA on the remuneration and remuneration trends of academic staff at individual South African universities, as well as for the HE sector as a whole. One of the important aims of the study was also to compare the remuneration of academic staff with the remuneration of comparable staff in the public sector and private sector.
Dr S Badat Chairperson: Funding Strategy Group of HESA until 31 December 2013, as well as convenor of Steering Committee of HESA remuneration study
1 Dr Saleem Badat (Convenor of the Steering Committee), Prof Enrico Uliana (UCT), Mr Hennie Kruger (UJ), Ms Amanda Glaeser (UWC), Dr Kgomotso Kasonkola (WITS), Mr T J Manenzhe (UNIVEN), Mr Craig Lyall-Watson (Consultant), Dr Gert Steyn (Researcher), Ms Jana van Wyk (HESA Executive Office)
SECTION 1: GLOSSARY OF TERMS .......................................................................................................5
SECTION 2: BACKGROUND TO STUDY .................................................................................................6 Introduction .......................................................................................................................................... 6 Purpose of the study ............................................................................................................................. 6 Aims of the study .................................................................................................................................. 6 Sources of remuneration data .............................................................................................................. 7
SECTION 3: PREVIOUS STUDIES ON THE REMUNERATION OF ACADEMIC STAFF AT HIGHER EDUCATION INSTITUTIONS ...................................................................................................................................8
SECTION 4: CRITERIA FOR AND APPROACH OF THE ANALYSIS .............................................................9 Equating the HE academic positions with positions in the public sector and private sector ............... 9 Definition of total remuneration .......................................................................................................... 9 Staff included in the analysis ................................................................................................................ 9 Measures of location used in the remuneration analysis ..................................................................... 9
SECTION 5: ACADEMIC STAFF REMUNERATION DATA ....................................................................... 10 Universities included in the study ....................................................................................................... 10 Profile of the academic staff within the study data set ...................................................................... 10
REMUNERATION INFORMATION BY INSTITUTION ............................................................................................... 12 Monthly and annual remuneration of academic staff for 2008-2012 ................................................ 12 Using a standard model to compare average remuneration between insitutions ............................. 15 Comparing HEIs’ academics staff remuneration by means of indices in 2008-2012.......................... 17 Percentile plots of remuneration of academic staff by institution in 2012 ........................................ 17 Histograms of remuneration of academic staff by institution in 2012............................................... 17 The average annual growth rate of monthly remuneration of academic staff for the period 2008-2012 .................................................................................................................................................... 17 Basic cash/ salary of academic staff in 2008-2012 as percentage of total remuneration ................. 19 Percentage breakdown of remuneration of academic staff according to type of payment .............. 20
STATISTICAL ANALYSIS OF THE INFLUENCE OF THE EXPLANATORY VARIABLES IN THE STUDY OF THE TOTAL REMUNERATION
OF ACADEMIC STAFF IN 2012 ........................................................................................................................ 21 ANALYSIS OF REMUNERATION ACCORDING TO ACADEMIC RANK / LEVEL FOR THE PERIOD 2008 - 2012 ..................... 23
Remuneration breakdown by gender and population group for each academic rank ...................... 26 Average remuneration of academic staff in 2012 according to highest qualification ....................... 27 Average remuneration of academic staff in 2012 according to CESM category ................................ 28 Remuneration-age scatterplots and profiles of academic staff in 2012 ............................................ 29 Remuneration-age profiles in 2012 according to gender ................................................................... 29 Comparison of remuneration of academic staff in 2012 according to type of HE institution ............ 30
SECTION 6: ANALYSIS OF PUBLIC SECTOR REMUNERATION DATA ..................................................... 32 The average annual growth rate in annual remuneration of public sector staff in 2010 and 2012 .. 32 The annual remuneration of public sector staff in 2012 according to salary level ............................ 33 Average annual remuneration of public sector staff in 2012 according to population group and gender ................................................................................................................................................. 33 Average annual remuneration of public sector staff in 2012 according to occupational category ... 33 Summary points to note: .................................................................................................................... 33
SECTION 7: ANALYSES OF PRIVATE SECTOR STAFF REMUNERATION DATA ......................................... 35 Summary points to note: .................................................................................................................... 35
SECTION 8: COMPARISON OF THE ANNUAL REMUNERATION OF ACADEMIC STAFF IN HE SECTOR WITH
3
THAT OF COMPARABLE STAFF IN THE PUBLIC AND PRIVATE SECTORS ............................................... 37 A COMPARISON BETWEEN THE MEASURES OF LOCATION OF THE ANNUAL REMUNERATION OF ACADEMIC STAFF IN SOUTH
AFRICA AND COMPARABLE STAFF IN THE SOUTH AFRICAN PUBLIC AND PRIVATE SECTORS FOR 2012 ......................... 37 Professor: Rank 1/Salary level 13/Paterson grade D3: ....................................................................... 39 Associate Professor: Rank 2/Salary level 12/Paterson grade D2:....................................................... 40 Senior Lecturer: Rank 3/Salary level 11/Paterson grade D1/D5: ........................................................ 40 Lecturer: Rank 4/Salary level 10/Paterson grade C4: ......................................................................... 40 Junior Lecturer: Rank 5/Salary level Paterson grade C3: ................................................................... 41
COMPARISON OF THE AVERAGE ANNUAL GROWTH RATE IN THE ANNUAL REMUNERATION OF IN THE ACADEMIC SECTOR
VS THE PUBLIC AND PRIVATE SECTORS ............................................................................................................. 41 ADDENDUM TO SECTION 8 ........................................................................................................................... 43 COMPARISON OF THE TOTAL PACKAGE WHICH INCLUDES THE GUARANTEED PACKAGE AND NON-GUARANTEED
PERFORMANCE BONUSES FOR THE ACADEMIC AND PRIVATE SECTORS ................................................................... 43
SECTION 9: SUMMARY OF ADDITIONAL INFORMATION REQUESTED FROM HIGHER EDUCATION INSTITUTIONS ................................................................................................................................. 46
9.1 A COMPARISON OF THE REMUNERATION OF ACADEMIC STAFF WITH THE REMUNERATION OF THE VICE-CHANCELLOR
OF EACH UNIVERSITY ACCORDING TO INSTITUTION AND YEAR. ............................................................................. 46 9.2 INSTITUTIONAL POLICIES ON THE REMUNERATION OF ACADEMIC STAFF .......................................................... 47 SUMMARY OF INFORMATION SUBMITTED BY HE INSTITUTIONS REGARDING THE RETENTION OF MASTER AND DOCTORAL
GRADUATES AS ACADEMIC STAFF MEMBERS ..................................................................................................... 48 Summary observations: ...................................................................................................................... 48
SUMMARY OF INFORMATION SUBMITTED BY HE INSTITUTIONS ON THE INVOLVEMENT OF ORGANISED LABOUR
ORGANISATIONS IN THE DETERMINATION OF THE REMUNERATION OF ACADEMIC STAFF ........................................... 49 Summary observations ....................................................................................................................... 50
SECTION 10: RECOMMENDATIONS .................................................................................................. 51 PROPOSALS ON THE REMUNERATION OF ACADEMIC STAFF ADDRESSED TO UNIVERSITIES, HESA AND THE GOVERNMENT, RECOGNISING THE IMPORTANT PRINCIPLE OF INSTITUTIONAL AUTONOMY ............................................................. 51
APPENDIX 1..................................................................................................................................... 53 Table 3.1 Job grades for three job evaluation systems ...................................................................... 53 Table 6.4 Annual average remuneration of public sector staff according to occupational category 54 Table 9.3 Remuneration policies ........................................................................................................ 55
APPENDIX 2..................................................................................................................................... 57 Summary of information regarding the retention of master and doctoral graduates as academic staff members ..................................................................................................................................... 57
4
SECTION 1: GLOSSARY OF TERMS ACU – Association of Commonwealth Universities
CATE – Colleges of Advance Technical Education
CES – Committee of Education Structures
CPI – Consumer Price Index
CS – College/school
CUP – Committee of University Principals
DHET – Department of Higher Education and Training
DPSA – Department of Public Service and Administration
FTE – Full-time equivalent
FSG – Funding Strategy Group
GDP – Gross domestic product
HATs – Historically Advantaged Technikons
HAUs - Historically Advantaged Universities
HDI – Human development index
HDTs - Historically Disadvantaged Technikons
HDUs – Historically Disadvantaged Universities
HEMIS – Higher Education Management Information System
HSRC – Human Science Research Council
PERSAL-Personnel Salary system
PPP – Purchasing-power parity
RECES – Research Committee of Education Structures
SAUVCA – South African Universities Vice-Chancellors Association
SAPSE – South African Post-Secondary Education Average (arithmetic mean) of remuneration: Sum of remuneration amounts of all academic staff members divided by the number of academic staff members. Quartiles Q1, Q2 (also known as the median (Me)) and Q3 of remuneration: These 3 measures divide the remuneration array (i. e. the ordering of all the values of the remuneration of academic staff members from lowest remuneration value to highest remuneration value) into four parts of equal size, with the characteristics that 25 % of the remuneration values are lower as Q1, 50% of all remuneration values are lower than Me, and 75% of all remuneration values are lower than Q3.
5
SECTION 2: BACKGROUND TO STUDY
Introduction
In the face of ageing academics at most South African universities, as well as the transformation of the academic profession in order to make it more representative of the South African population, it is important to attract the best qualified young people from all population groups in significant numbers into the Academy. Without competitive remuneration for academics (more formally known in HEMIS as instruction/research staff), especially at the lower echelons of the profession, many promising potential academics, as well as current academic staff, will be lured away to well paying positions in the public sector, as well as in the private sector. There is also an ongoing brain drain in our country. Some of the best researchers at universities in South Africa annually took up prestigious academic positions in other countries, sometimes as a result of better remuneration associated with these positions. On the other hand, as a result of the weak rand it is difficult to attract international academic staff to South African HE institutions.
Increasingly, universities are being recognised as leaders and agents in the knowledge economy. They, therefore, need to develop the necessary numbers of graduate citizens who can participate adequately in economic and social development and knowledge economies. The challenge South Africa faces is to develop and maintain at each university the necessary human resources, especially academics, necessary to meet these societal demands.
What is the current situation regarding the remuneration of academic staff at South African universities? Is the remuneration of academic staff market related when compared with the remuneration of public sector staff and private sector staff? Which demographic and academic factors discriminate between the different levels of remuneration of academics in South Africa? These types of questions are important and should be tackled head-on.
Purpose of the study The purpose of the study is to produce a report for the FSG and ultimately for the Board of HESA on the remuneration and remuneration trends of academic staff at individual South African universities, as well as for the HE sector as a whole.
Aims of the study The aims of the study are:
i. To establish the remuneration of full-time permanent academic staff and staff with fixed contracts of one year or more and trends in this regard over the past 10 years.
ii. To analyse the remuneration of academic staff in relation to rank/position, age, highest qualification, field of study (e.g. CESM category), population group, gender and post grading (e. g. Peromnes grade).
iii. To compare the remuneration of academic staff with the remuneration of comparable staff in both the public sector and the private sector.
iv. To compare the remuneration of academic staff relative to that of the remuneration of the Vice-Chancellor of each university.
v. To establish the retention rate of masters/doctoral graduates as academic staff members. vi. To advance proposals on the remuneration of academic staff addressed to universities, HESA and
6

the government, recognising the important principle of institutional autonomy.
It was later decided to also determine the role which organised labour plays in determining the remuneration of academic staff at South African universities. Furthermore, institutions would also be requested to provide copies of their remuneration policies for academic staff.
Sources of remuneration data The sources of the remuneration data is described in detail in the full report.
7
SECTION 3: PREVIOUS STUDIES ON THE REMUNERATION OF ACADEMIC STAFF AT HIGHER EDUCATION INSTITUTIONS
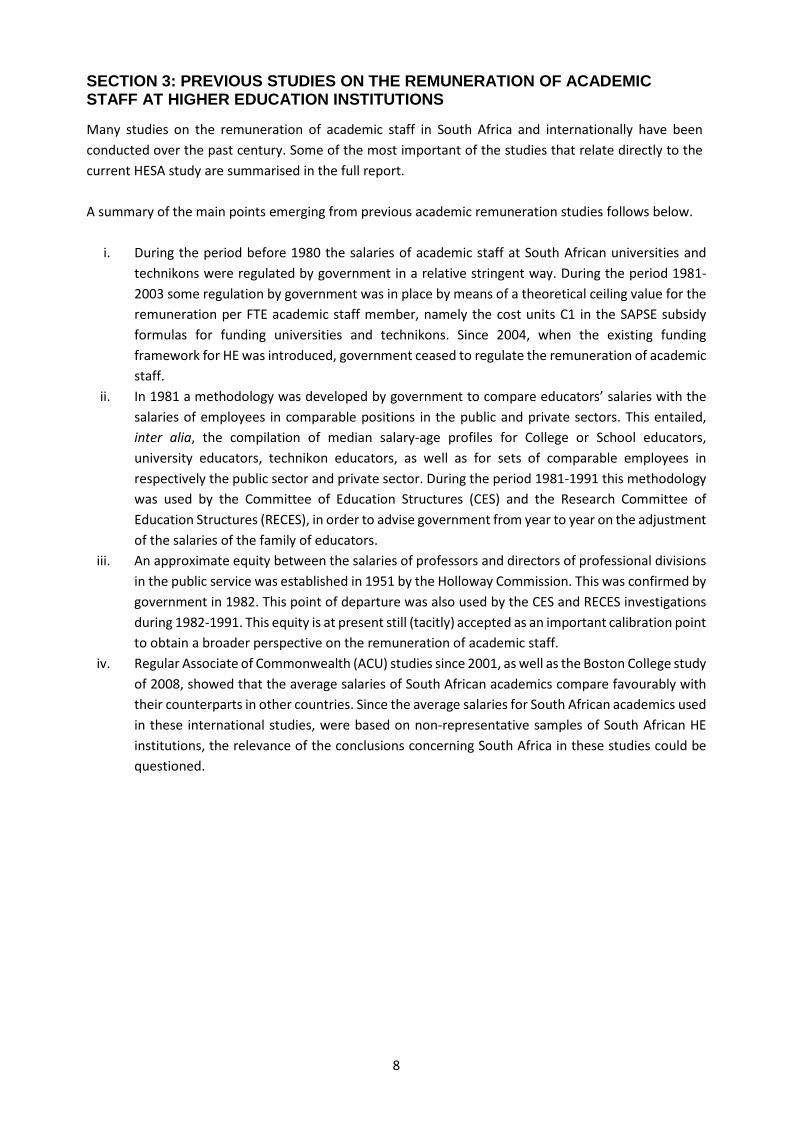
Many studies on the remuneration of academic staff in South Africa and internationally have been conducted over the past century. Some of the most important of the studies that relate directly to the current HESA study are summarised in the full report. A summary of the main points emerging from previous academic remuneration studies follows below.
i. During the period before 1980 the salaries of academic staff at South African universities and technikons were regulated by government in a relative stringent way. During the period 1981-2003 some regulation by government was in place by means of a theoretical ceiling value for the remuneration per FTE academic staff member, namely the cost units C1 in the SAPSE subsidy formulas for funding universities and technikons. Since 2004, when the existing funding framework for HE was introduced, government ceased to regulate the remuneration of academic staff.
ii. In 1981 a methodology was developed by government to compare educators’ salaries with the salaries of employees in comparable positions in the public and private sectors. This entailed, inter alia, the compilation of median salary-age profiles for College or School educators, university educators, technikon educators, as well as for sets of comparable employees in respectively the public sector and private sector. During the period 1981-1991 this methodology was used by the Committee of Education Structures (CES) and the Research Committee of Education Structures (RECES), in order to advise government from year to year on the adjustment of the salaries of the family of educators.
iii. An approximate equity between the salaries of professors and directors of professional divisions in the public service was established in 1951 by the Holloway Commission. This was confirmed by government in 1982. This point of departure was also used by the CES and RECES investigations during 1982-1991. This equity is at present still (tacitly) accepted as an important calibration point to obtain a broader perspective on the remuneration of academic staff.
iv. Regular Associate of Commonwealth (ACU) studies since 2001, as well as the Boston College study of 2008, showed that the average salaries of South African academics compare favourably with their counterparts in other countries. Since the average salaries for South African academics used in these international studies, were based on non-representative samples of South African HE institutions, the relevance of the conclusions concerning South Africa in these studies could be questioned.
8
SECTION 4: CRITERIA FOR AND APPROACH OF THE ANALYSIS
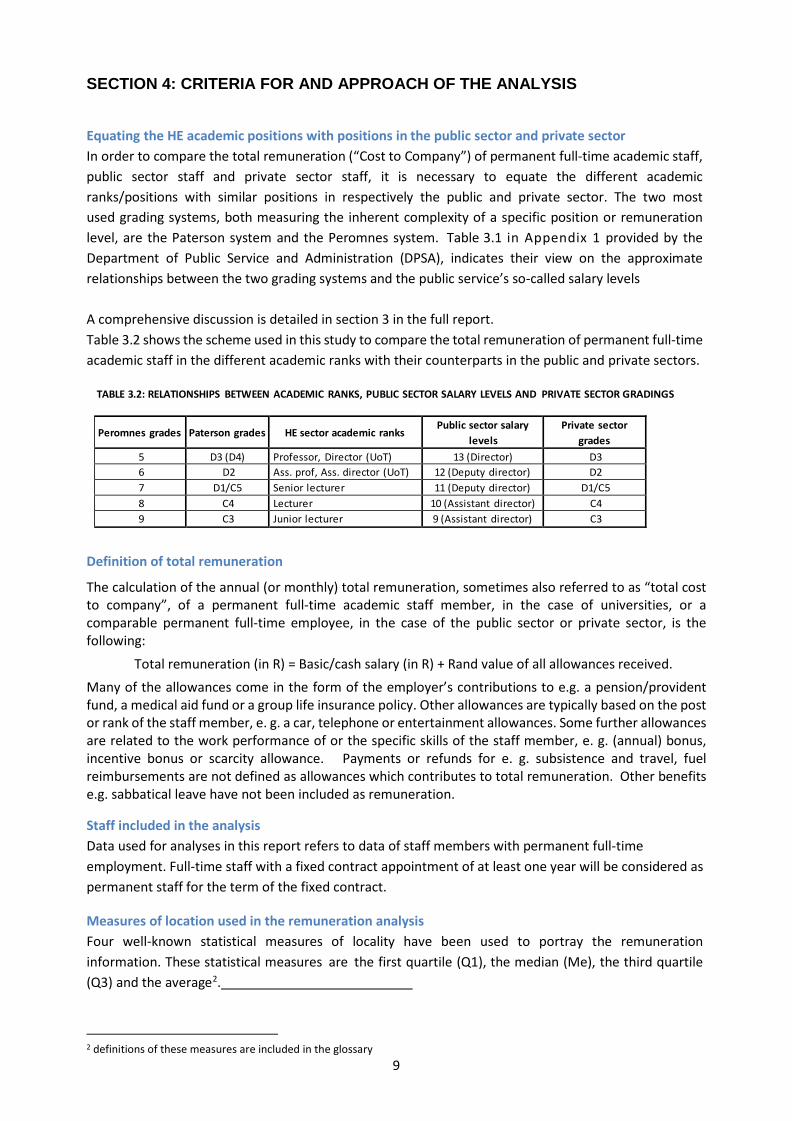
Equating the HE academic positions with positions in the public sector and private sector In order to compare the total remuneration (“Cost to Company”) of permanent full-time academic staff, public sector staff and private sector staff, it is necessary to equate the different academic ranks/positions with similar positions in respectively the public and private sector. The two most used grading systems, both measuring the inherent complexity of a specific position or remuneration level, are the Paterson system and the Peromnes system. Table 3.1 in Appendix 1 provided by the Department of Public Service and Administration (DPSA), indicates their view on the approximate relationships between the two grading systems and the public service’s so-called salary levels A comprehensive discussion is detailed in section 3 in the full report. Table 3.2 shows the scheme used in this study to compare the total remuneration of permanent full-time academic staff in the different academic ranks with their counterparts in the public and private sectors.
TABLE 3.2: RELATIONSHIPS BETWEEN ACADEMIC RANKS, PUBLIC SECTOR SALARY LEVELS AND PRIVATE SECTOR GRADINGS
Peromnes grades
Paterson grades
HE sector academic ranks
Public sector salary levels
Private sector grades
5 D3 (D4) Professor, Director (UoT) 13 (Director) D3 6 D2 Ass. prof, Ass. director (UoT) 12 (Deputy director) D2 7 D1/C5 Senior lecturer 11 (Deputy director) D1/C5 8 C4 Lecturer 10 (Assistant director) C4 9 C3 Junior lecturer 9 (Assistant director) C3
Definition of total remuneration
The calculation of the annual (or monthly) total remuneration, sometimes also referred to as “total cost to company”, of a permanent full-time academic staff member, in the case of universities, or a comparable permanent full-time employee, in the case of the public sector or private sector, is the following:
Total remuneration (in R) = Basic/cash salary (in R) + Rand value of all allowances received. Many of the allowances come in the form of the employer’s contributions to e.g. a pension/provident fund, a medical aid fund or a group life insurance policy. Other allowances are typically based on the post or rank of the staff member, e. g. a car, telephone or entertainment allowances. Some further allowances are related to the work performance of or the specific skills of the staff member, e. g. (annual) bonus, incentive bonus or scarcity allowance. Payments or refunds for e. g. subsistence and travel, fuel reimbursements are not defined as allowances which contributes to total remuneration. Other benefits e.g. sabbatical leave have not been included as remuneration.
Staff included in the analysis Data used for analyses in this report refers to data of staff members with permanent full-time employment. Full-time staff with a fixed contract appointment of at least one year will be considered as permanent staff for the term of the fixed contract.
Measures of location used in the remuneration analysis Four well-known statistical measures of locality have been used to portray the remuneration information. These statistical measures are the first quartile (Q1), the median (Me), the third quartile (Q3) and the average2.
2 definitions of these measures are included in the glossary
9
SECTION 5: ACADEMIC STAFF REMUNERATION DATA
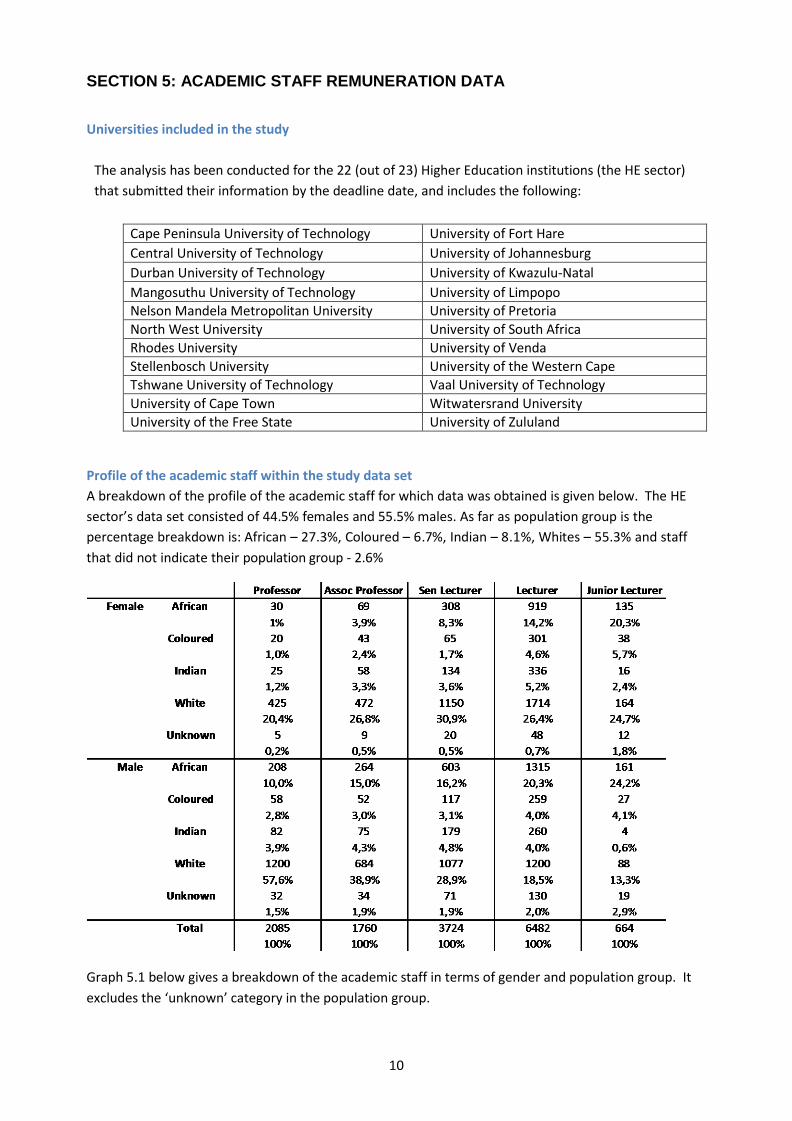
Universities included in the study The analysis has been conducted for the 22 (out of 23) Higher Education institutions (the HE sector) that submitted their information by the deadline date, and includes the following:
Cape Peninsula University of Technology University of Fort Hare Central University of Technology University of Johannesburg Durban University of Technology University of Kwazulu-Natal Mangosuthu University of Technology University of Limpopo Nelson Mandela Metropolitan University University of Pretoria North West University University of South Africa Rhodes University University of Venda Stellenbosch University University of the Western Cape Tshwane University of Technology Vaal University of Technology University of Cape Town Witwatersrand University University of the Free State University of Zululand
Profile of the academic staff within the study data set A breakdown of the profile of the academic staff for which data was obtained is given below. The HE sector’s data set consisted of 44.5% females and 55.5% males. As far as population group is the percentage breakdown is: African – 27.3%, Coloured – 6.7%, Indian – 8.1%, Whites – 55.3% and staff that did not indicate their population group - 2.6%
Graph 5.1 below gives a breakdown of the academic staff in terms of gender and population group. It excludes the ‘unknown’ category in the population group.
10
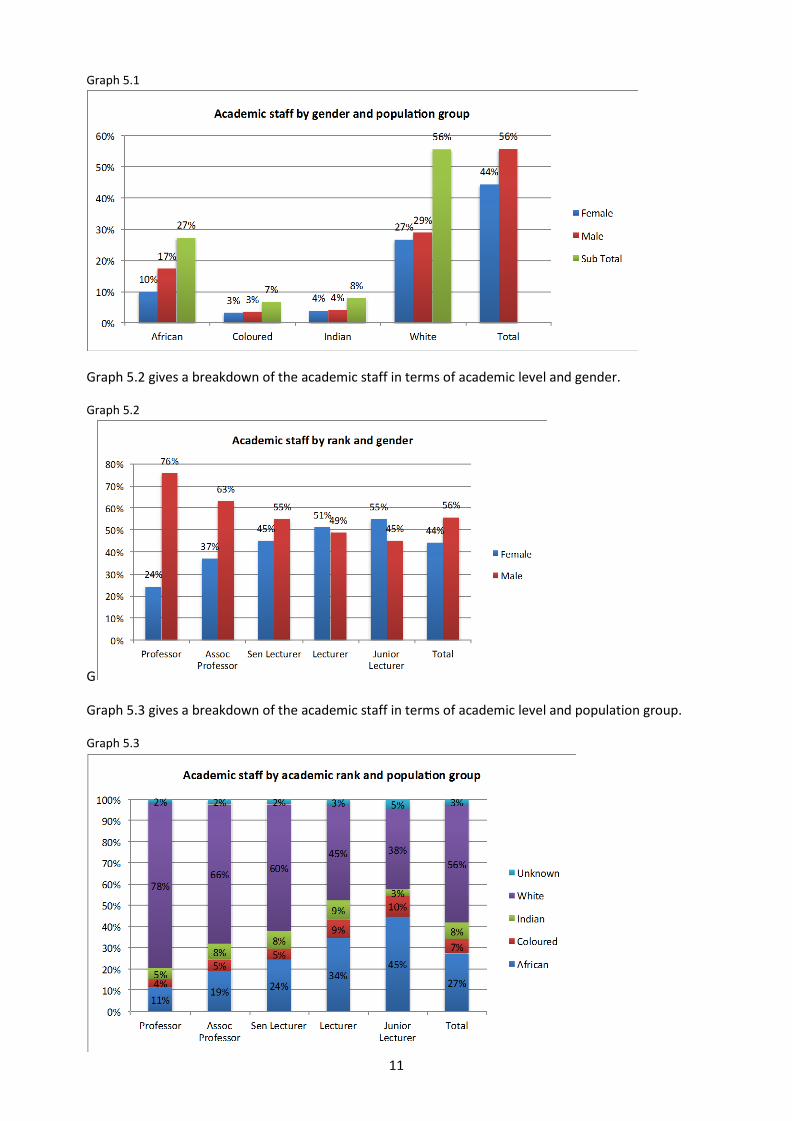
Graph 5.1
Graph 5.2 gives a breakdown of the academic staff in terms of academic level and gender.
Graph 5.2
G
Graph 5.3 gives a breakdown of the academic staff in terms of academic level and population group.
Graph 5.3
11
Remuneration information by institution
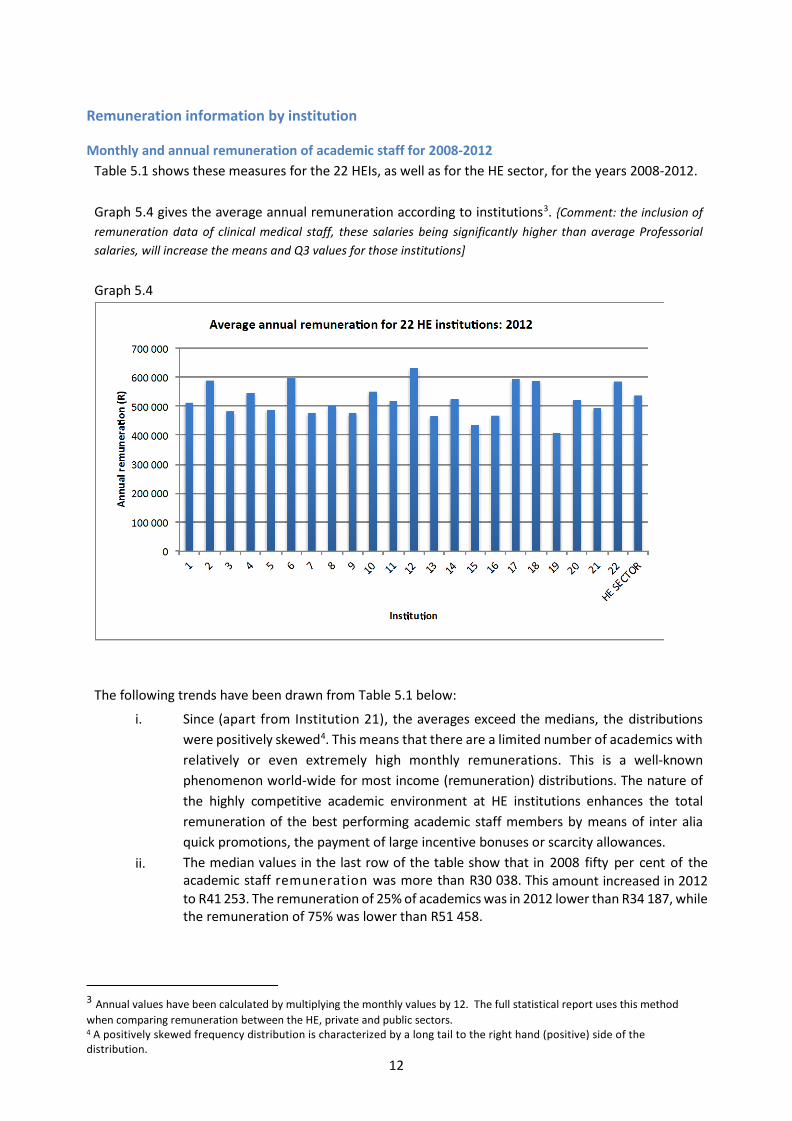
Monthly and annual remuneration of academic staff for 2008-2012 Table 5.1 shows these measures for the 22 HEIs, as well as for the HE sector, for the years 2008-2012. Graph 5.4 gives the average annual remuneration according to institutions3. {Comment: the inclusion of remuneration data of clinical medical staff, these salaries being significantly higher than average Professorial salaries, will increase the means and Q3 values for those institutions] Graph 5.4
The following trends have been drawn from Table 5.1 below:
i. Since (apart from Institution 21), the averages exceed the medians, the distributions were positively skewed4. This means that there are a limited number of academics with relatively or even extremely high monthly remunerations. This is a well-known phenomenon world-wide for most income (remuneration) distributions. The nature of the highly competitive academic environment at HE institutions enhances the total remuneration of the best performing academic staff members by means of inter alia quick promotions, the payment of large incentive bonuses or scarcity allowances.
ii. The median values in the last row of the table show that in 2008 fifty per cent of the academic staff remuneration was more than R30 038. This amount increased in 2012 to R41 253. The remuneration of 25% of academics was in 2012 lower than R34 187, while the remuneration of 75% was lower than R51 458.
3 Annual values have been calculated by multiplying the monthly values by 12. The full statistical report uses this method when comparing remuneration between the HE, private and public sectors. 4 A positively skewed frequency distribution is characterized by a long tail to the right hand (positive) side of the distribution.
12
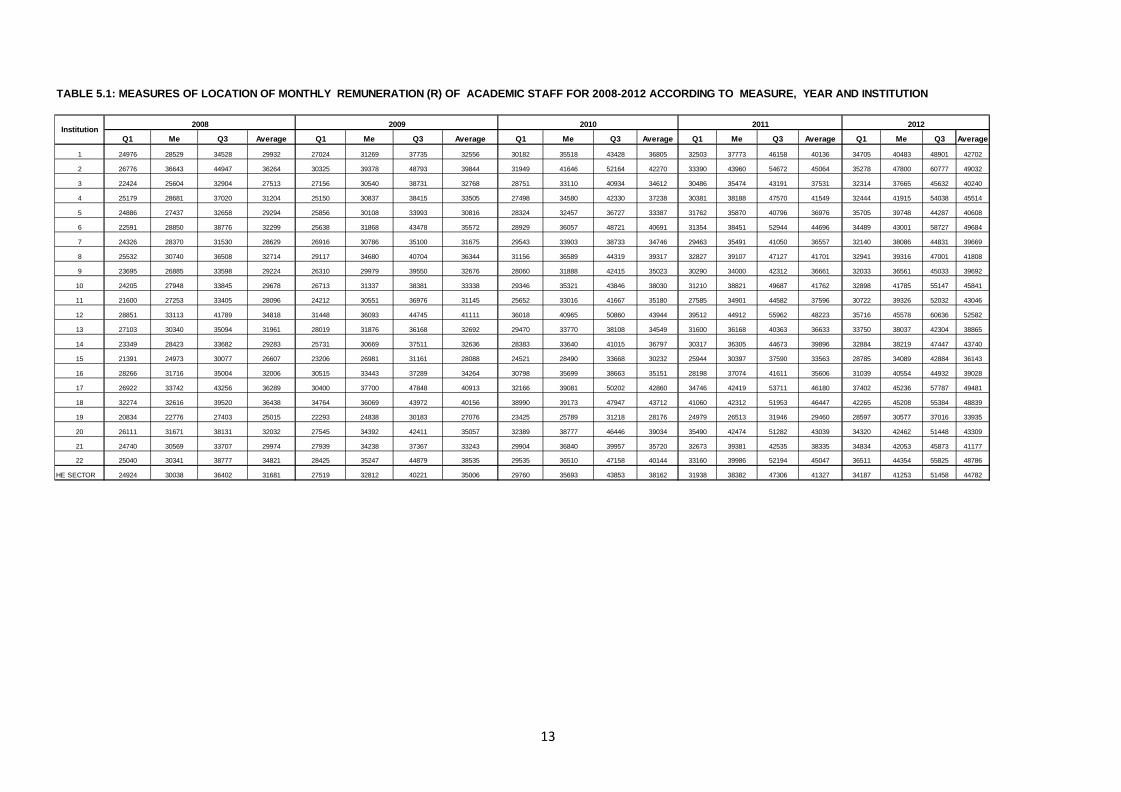
TABLE 5.1: MEASURES OF LOCATION OF MONTHLY REMUNERATION (R) OF ACADEMIC STAFF FOR 2008-2012 ACCORDING TO MEASURE, YEAR AND INSTITUTION
Q1 Me Q3 Average Q1 Me Q3 Average Q1 Me Q3 Average Q1 Me Q3 Average Q1 Me Q3 Average
1 24976 28529 34528 29932 27024 31269 37735 32556 30182 35518 43428 36805 32503 37773 46158 40136 34705 40483 48901 42702
2 26776 36643 44947 36264 30325 39378 48793 39844 31949 41646 52164 42270 33390 43960 54672 45064 35278 47800 60777 49032
3 22424 25604 32904 27513 27156 30540 38731 32768 28751 33110 40934 34612 30486 35474 43191 37531 32314 37665 45632 40240
4 25179 28681 37020 31204 25150 30837 38415 33505 27498 34580 42330 37238 30381 38188 47570 41549 32444 41915 54038 45514
5 24886 27437 32658 29294 25856 30108 33993 30816 28324 32457 36727 33387 31762 35870 40796 36976 35705 39748 44287 40608
6 22591 28850 38776 32299 25638 31868 43478 35572 28929 36057 48721 40691 31354 38451 52944 44696 34489 43001 58727 49684
7 24326 28370 31530 28629 26916 30786 35100 31675 29543 33903 38733 34746 29463 35491 41050 36557 32140 38086 44831 39669
8 25532 30740 36508 32714 29117 34680 40704 36344 31156 36589 44319 39317 32827 39107 47127 41701 32941 39316 47001 41808
9 23695 26885 33598 29224 26310 29979 39550 32676 28060 31888 42415 35023 30290 34000 42312 36661 32033 36561 45033 39692
10 24205 27948 33845 29678 26713 31337 38381 33338 29346 35321 43846 38030 31210 38821 49687 41762 32898 41785 55147 45841
11 21600 27253 33405 28096 24212 30551 36976 31145 25652 33016 41667 35180 27585 34901 44582 37596 30722 39326 52032 43046
12 28851 33113 41789 34818 31448 36093 44745 41111 36018 40965 50860 43944 39512 44912 55962 48223 35716 45578 60636 52582
13 27103 30340 35094 31961 28019 31876 36168 32692 29470 33770 38108 34549 31600 36168 40363 36633 33750 38037 42304 38865
14 23349 28423 33682 29283 25731 30669 37511 32636 28383 33640 41015 36797 30317 36305 44673 39896 32884 38219 47447 43740
15 21391 24973 30077 26607 23206 26981 31161 28088 24521 28490 33668 30232 25944 30397 37590 33563 28785 34089 42884 36143
16 28266 31716 35004 32006 30515 33443 37289 34264 30798 35699 38663 35151 28198 37074 41611 35606 31039 40554 44932 39028
17 26922 33742 43256 36289 30400 37700 47848 40913 32166 39081 50202 42860 34746 42419 53711 46180 37402 45236 57787 49481
18 32274 32616 39520 36438 34764 36069 43972 40156 38990 39173 47947 43712 41060 42312 51953 46447 42265 45208 55384 48839
19 20834 22776 27403 25015 22293 24838 30183 27076 23425 25789 31218 28176 24979 26513 31946 29460 28597 30577 37016 33935
20 26111 31671 38131 32032 27545 34392 42411 35057 32389 38777 46446 39034 35490 42474 51282 43039 34320 42462 51448 43309
21 24740 30569 33707 29974 27939 34238 37367 33243 29904 36840 39957 35720 32673 39381 42535 38335 34834 42053 45873 41177
22 25040 30341 38777 34821 28425 35247 44879 38535 29535 36510 47158 40144 33160 39986 52194 45047 36511 44354 55825 48786
HE SECTOR 24924 30038 36402 31681 27519 32812 40221 35006 29760 35693 43853 38162 31938 38382 47306 41327 34187 41253 51458 44782
Institution 2008 2009 2010 2011 2012
13
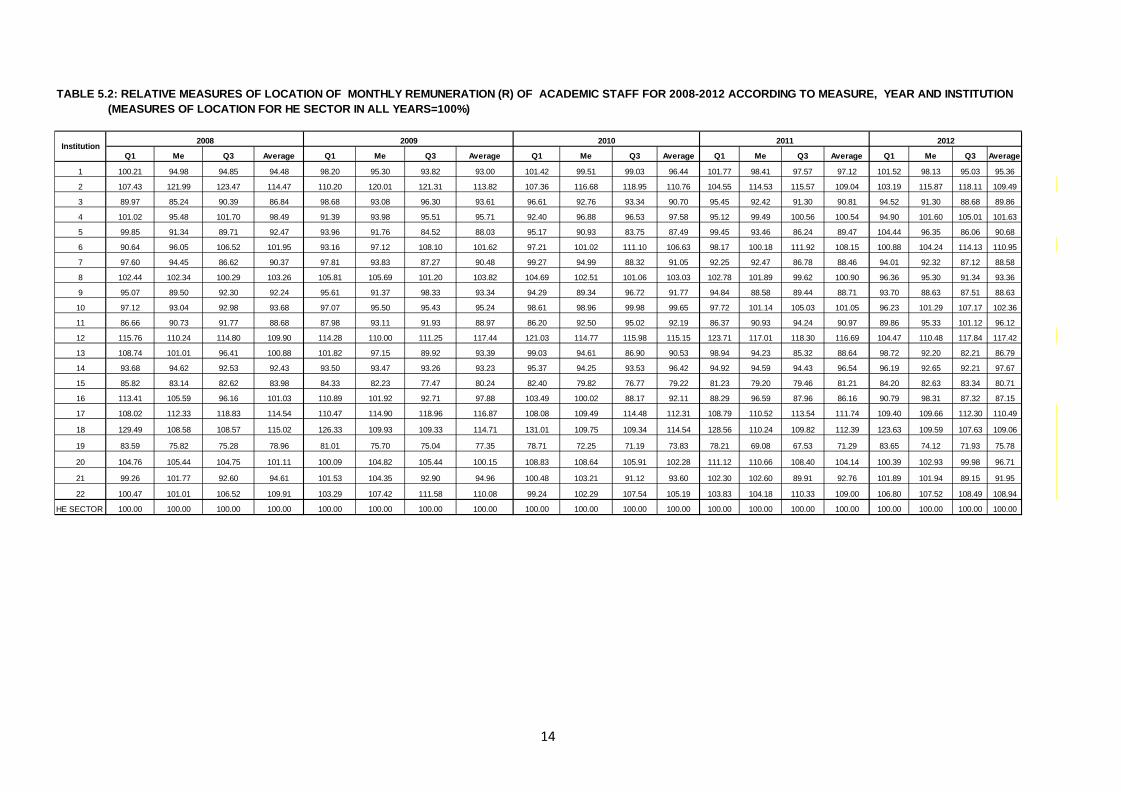
TABLE 5.2: RELATIVE MEASURES OF LOCATION OF MONTHLY REMUNERATION (R) OF ACADEMIC STAFF FOR 2008-2012 ACCORDING TO MEASURE, YEAR AND INSTITUTION(MEASURES OF LOCATION FOR HE SECTOR IN ALL YEARS=100%)
Q1 Me Q3 Average Q1 Me Q3 Average Q1 Me Q3 Average Q1 Me Q3 Average Q1 Me Q3 Average
1 100.21 94.98 94.85 94.48 98.20 95.30 93.82 93.00 101.42 99.51 99.03 96.44 101.77 98.41 97.57 97.12 101.52 98.13 95.03 95.36
2 107.43 121.99 123.47 114.47 110.20 120.01 121.31 113.82 107.36 116.68 118.95 110.76 104.55 114.53 115.57 109.04 103.19 115.87 118.11 109.49
3 89.97 85.24 90.39 86.84 98.68 93.08 96.30 93.61 96.61 92.76 93.34 90.70 95.45 92.42 91.30 90.81 94.52 91.30 88.68 89.86
4 101.02 95.48 101.70 98.49 91.39 93.98 95.51 95.71 92.40 96.88 96.53 97.58 95.12 99.49 100.56 100.54 94.90 101.60 105.01 101.63
5 99.85 91.34 89.71 92.47 93.96 91.76 84.52 88.03 95.17 90.93 83.75 87.49 99.45 93.46 86.24 89.47 104.44 96.35 86.06 90.68
6 90.64 96.05 106.52 101.95 93.16 97.12 108.10 101.62 97.21 101.02 111.10 106.63 98.17 100.18 111.92 108.15 100.88 104.24 114.13 110.95
7 97.60 94.45 86.62 90.37 97.81 93.83 87.27 90.48 99.27 94.99 88.32 91.05 92.25 92.47 86.78 88.46 94.01 92.32 87.12 88.58
8 102.44 102.34 100.29 103.26 105.81 105.69 101.20 103.82 104.69 102.51 101.06 103.03 102.78 101.89 99.62 100.90 96.36 95.30 91.34 93.36
9 95.07 89.50 92.30 92.24 95.61 91.37 98.33 93.34 94.29 89.34 96.72 91.77 94.84 88.58 89.44 88.71 93.70 88.63 87.51 88.63
10 97.12 93.04 92.98 93.68 97.07 95.50 95.43 95.24 98.61 98.96 99.98 99.65 97.72 101.14 105.03 101.05 96.23 101.29 107.17 102.36
11 86.66 90.73 91.77 88.68 87.98 93.11 91.93 88.97 86.20 92.50 95.02 92.19 86.37 90.93 94.24 90.97 89.86 95.33 101.12 96.12
12 115.76 110.24 114.80 109.90 114.28 110.00 111.25 117.44 121.03 114.77 115.98 115.15 123.71 117.01 118.30 116.69 104.47 110.48 117.84 117.42
13 108.74 101.01 96.41 100.88 101.82 97.15 89.92 93.39 99.03 94.61 86.90 90.53 98.94 94.23 85.32 88.64 98.72 92.20 82.21 86.79
14 93.68 94.62 92.53 92.43 93.50 93.47 93.26 93.23 95.37 94.25 93.53 96.42 94.92 94.59 94.43 96.54 96.19 92.65 92.21 97.67
15 85.82 83.14 82.62 83.98 84.33 82.23 77.47 80.24 82.40 79.82 76.77 79.22 81.23 79.20 79.46 81.21 84.20 82.63 83.34 80.71
16 113.41 105.59 96.16 101.03 110.89 101.92 92.71 97.88 103.49 100.02 88.17 92.11 88.29 96.59 87.96 86.16 90.79 98.31 87.32 87.15
17 108.02 112.33 118.83 114.54 110.47 114.90 118.96 116.87 108.08 109.49 114.48 112.31 108.79 110.52 113.54 111.74 109.40 109.66 112.30 110.49
18 129.49 108.58 108.57 115.02 126.33 109.93 109.33 114.71 131.01 109.75 109.34 114.54 128.56 110.24 109.82 112.39 123.63 109.59 107.63 109.06
19 83.59 75.82 75.28 78.96 81.01 75.70 75.04 77.35 78.71 72.25 71.19 73.83 78.21 69.08 67.53 71.29 83.65 74.12 71.93 75.78
20 104.76 105.44 104.75 101.11 100.09 104.82 105.44 100.15 108.83 108.64 105.91 102.28 111.12 110.66 108.40 104.14 100.39 102.93 99.98 96.71
21 99.26 101.77 92.60 94.61 101.53 104.35 92.90 94.96 100.48 103.21 91.12 93.60 102.30 102.60 89.91 92.76 101.89 101.94 89.15 91.95
22 100.47 101.01 106.52 109.91 103.29 107.42 111.58 110.08 99.24 102.29 107.54 105.19 103.83 104.18 110.33 109.00 106.80 107.52 108.49 108.94
HE SECTOR 100.00 100.00 100.00 100.00 100.00 100.00 100.00 100.00 100.00 100.00 100.00 100.00 100.00 100.00 100.00 100.00 100.00 100.00 100.00 100.00
2011 2012Institution 2008 2009 2010
14
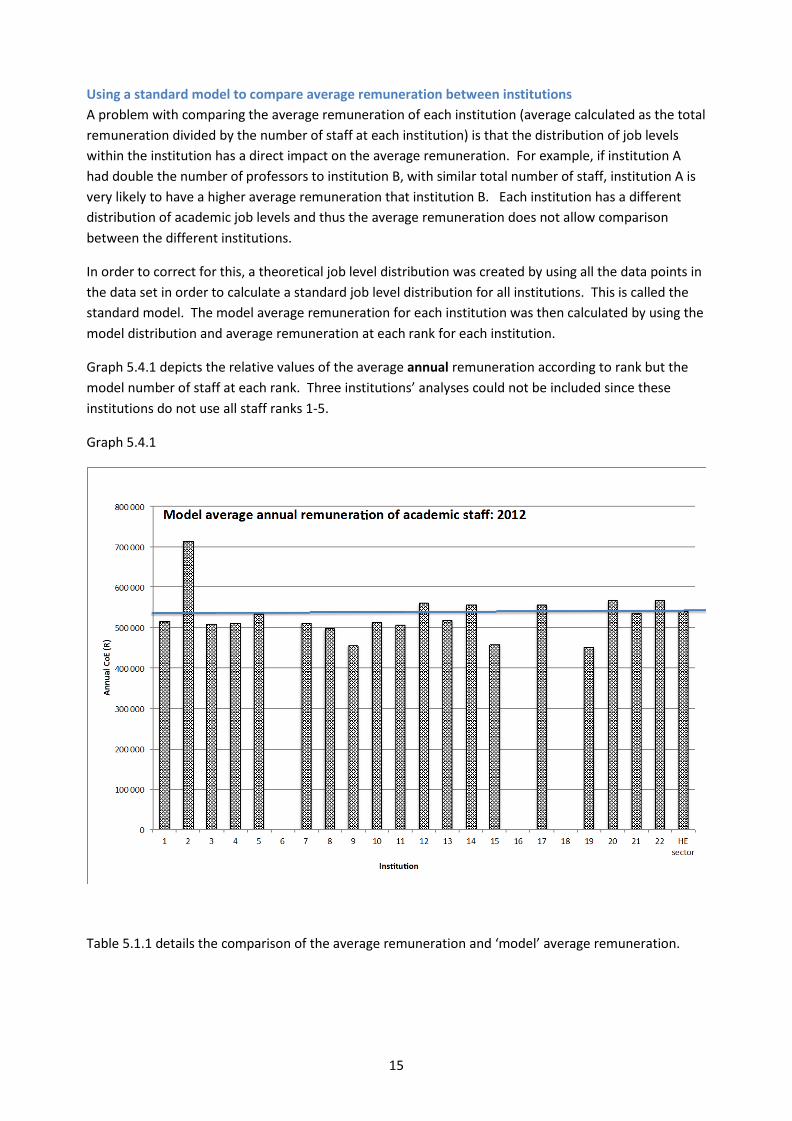
Using a standard model to compare average remuneration between institutions A problem with comparing the average remuneration of each institution (average calculated as the total remuneration divided by the number of staff at each institution) is that the distribution of job levels within the institution has a direct impact on the average remuneration. For example, if institution A had double the number of professors to institution B, with similar total number of staff, institution A is very likely to have a higher average remuneration that institution B. Each institution has a different distribution of academic job levels and thus the average remuneration does not allow comparison between the different institutions.
In order to correct for this, a theoretical job level distribution was created by using all the data points in the data set in order to calculate a standard job level distribution for all institutions. This is called the standard model. The model average remuneration for each institution was then calculated by using the model distribution and average remuneration at each rank for each institution.
Graph 5.4.1 depicts the relative values of the average annual remuneration according to rank but the model number of staff at each rank. Three institutions’ analyses could not be included since these institutions do not use all staff ranks 1-5.
Graph 5.4.1
Table 5.1.1 details the comparison of the average remuneration and ‘model’ average remuneration.
15
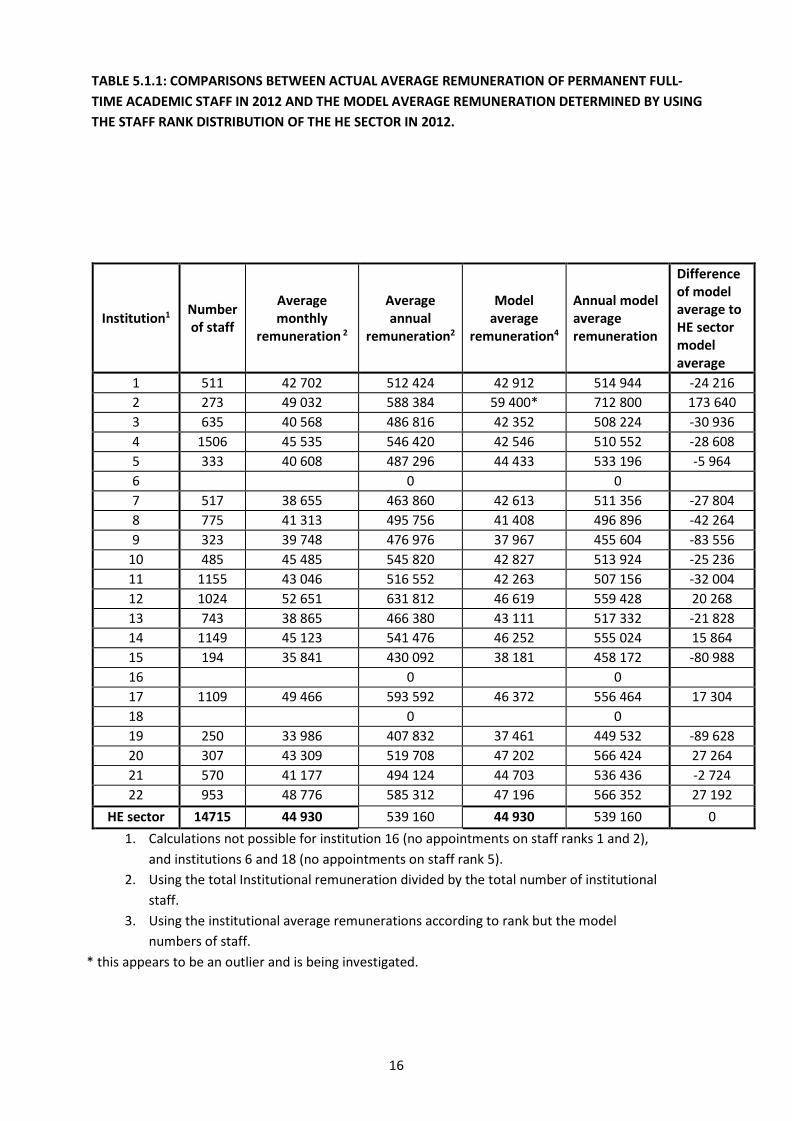
TABLE 5.1.1: COMPARISONS BETWEEN ACTUAL AVERAGE REMUNERATION OF PERMANENT FULL-TIME ACADEMIC STAFF IN 2012 AND THE MODEL AVERAGE REMUNERATION DETERMINED BY USING THE STAFF RANK DISTRIBUTION OF THE HE SECTOR IN 2012.
Institution1 Number of staff
Average monthly
remuneration 2
Average annual
remuneration2
Model average
remuneration4
Annual model average remuneration
Difference of model average to HE sector model average
1 511 42 702 512 424 42 912 514 944 -24 216 2 273 49 032 588 384 59 400* 712 800 173 640 3 635 40 568 486 816 42 352 508 224 -30 936 4 1506 45 535 546 420 42 546 510 552 -28 608 5 333 40 608 487 296 44 433 533 196 -5 964 6 0 0 7 517 38 655 463 860 42 613 511 356 -27 804 8 775 41 313 495 756 41 408 496 896 -42 264 9 323 39 748 476 976 37 967 455 604 -83 556
10 485 45 485 545 820 42 827 513 924 -25 236 11 1155 43 046 516 552 42 263 507 156 -32 004 12 1024 52 651 631 812 46 619 559 428 20 268 13 743 38 865 466 380 43 111 517 332 -21 828 14 1149 45 123 541 476 46 252 555 024 15 864 15 194 35 841 430 092 38 181 458 172 -80 988 16 0 0 17 1109 49 466 593 592 46 372 556 464 17 304 18 0 0 19 250 33 986 407 832 37 461 449 532 -89 628 20 307 43 309 519 708 47 202 566 424 27 264 21 570 41 177 494 124 44 703 536 436 -2 724 22 953 48 776 585 312 47 196 566 352 27 192
HE sector 14715 44 930 539 160 44 930 539 160 0 1. Calculations not possible for institution 16 (no appointments on staff ranks 1 and 2),
and institutions 6 and 18 (no appointments on staff rank 5). 2. Using the total Institutional remuneration divided by the total number of institutional
staff. 3. Using the institutional average remunerations according to rank but the model
numbers of staff. * this appears to be an outlier and is being investigated.
16
Comparing HEIs’ academics staff remuneration by means of indices in 2008-2012
In order to simplify the comparisons between the 22 institutions the information in Table 5.1 it is portrayed as indices in Table 5.2. Each amount is expressed relative to the HE sector amount. The following conclusions have been drawn:
i. In 2012 the relative average remuneration (indices) for the institutions fluctuated between 75.8% (Institution 19) and 117.4% (Institution 12), while the relative median remuneration fluctuated between 74.1% (Institution 19) and 115.9% (Institution 2). Most institutions do not differ by more than 10% from the HE sector in 2012 in both the average and median remuneration of academic staff.
ii. Generally, taking into account all 4 statistical measures of location a. Institution 19 had the lowest remuneration for the 5 year period; and b. Institutions 2, 12, 17 and 18 had the highest remuneration of academic staff for the 5
year period. iii. The very high relative values of Q1 in the case of Institution 18 in all 5 years indicate
relatively high remuneration for academics at that institution in the first few years of their academic careers. [Comment from M Price and J du Toit: this assumes that the more junior staff are paid at the lower end of the range, and thus the remuneration levels of junior staff are depicted by the Q1 values. The conclusion made that the relatively high Q1 values of some institutions indicates higher pay for the junior staff at those institutions can only be made if the ratio of junior to senior staff is the same or similar for all the institutions. If, for instance, there is a greater ratio of senior staff to junior staff, the Q1 value as well as the median and mean are likely to be higher.]
Percentile plots of remuneration of academic staff by institution in 2012 Figure 5.1 in the Appendix shows the institutional and the HE sector percentile plots5 of the monthly remuneration of academic staff members in 2012. These plots can be used to determine any percentile, e.g. the 90th percentile, in the case of each institution or the HE sector. For example, in 2012 about 90% of academic staff members had a monthly remuneration of lower than R60 000.
Histograms of remuneration of academic staff by institution in 2012 Figure 5.2 in the Appendix shows the institutional and overall sector histograms of the monthly remuneration in 2012. With the exception of Institution 21, the positive skewness of the remuneration distributions is evident.
The average annual growth rate of monthly remuneration of academic staff for the period 2008-2012 Table 5.3 shows the average annual growth rates (%) in the monthly remuneration of academic staff for the HE sector over for the period 2008-2012 in nominal and real terms6. The real average annual growth rate for the HE sector was 2.91% for Q1, 2.94% for the median, 3.73%
5 Percentiles P1, P2, ---, P99 are also measures of location and is a direct extension (or generalization) of the concept used in defining the three quartiles Q1, Me and Q3. The 99 percentiles divide the remuneration array (i. e. the ordering of all the values of the remuneration of academic staff members from lowest remuneration to highest remuneration) into 100 parts of equal size, with the characteristics that e. g. 40 % of the remuneration values are lower as P40, 87% of the remuneration values lower as P87, etc. 6 To convert the nominal rate to real rates the average annual CPI inflation rate of 5.3% was used for the period 2008-2012.
17
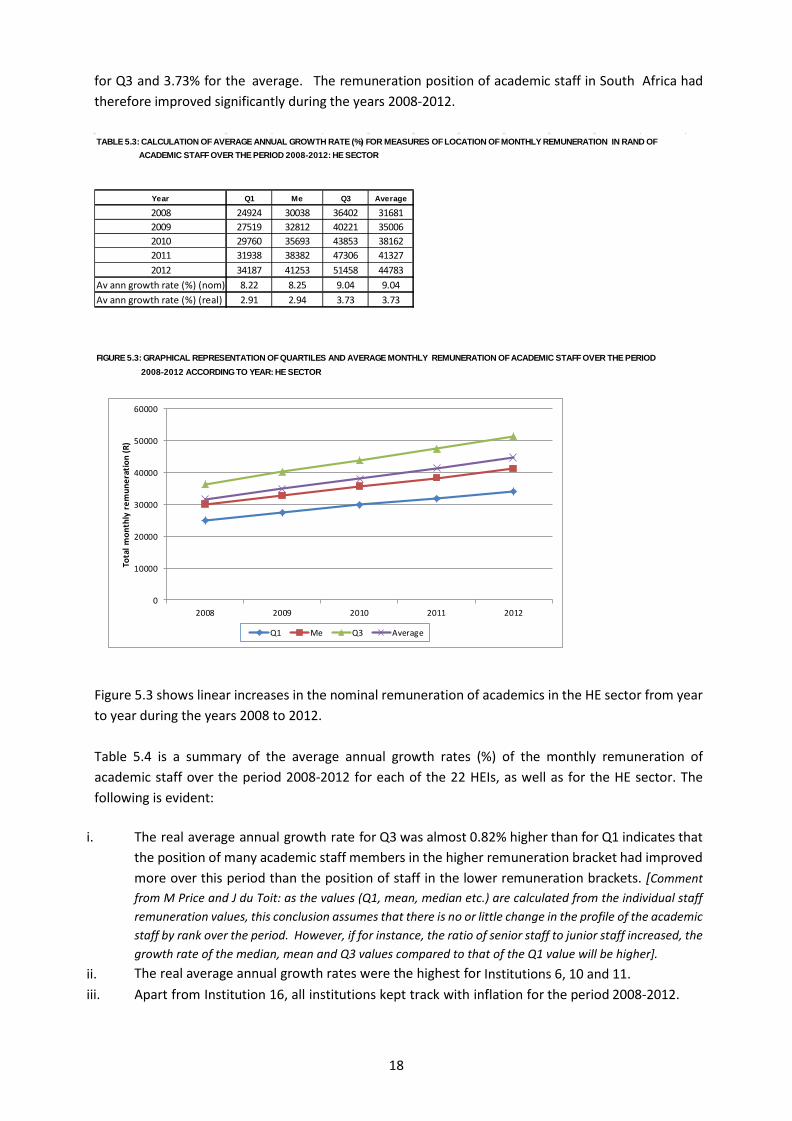
for Q3 and 3.73% for the average. The remuneration position of academic staff in South Africa had therefore improved significantly during the years 2008-2012.
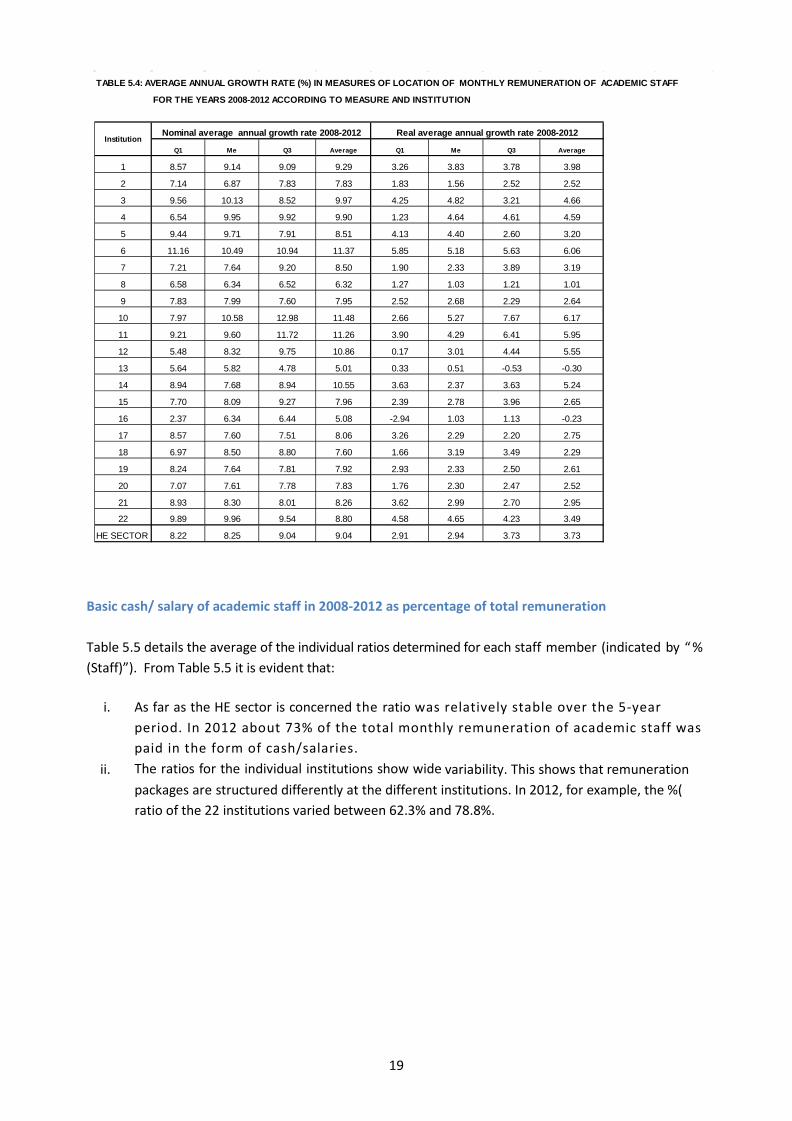
Figure 5.3 shows linear increases in the nominal remuneration of academics in the HE sector from year to year during the years 2008 to 2012. Table 5.4 is a summary of the average annual growth rates (%) of the monthly remuneration of academic staff over the period 2008-2012 for each of the 22 HEIs, as well as for the HE sector. The following is evident:
i. The real average annual growth rate for Q3 was almost 0.82% higher than for Q1 indicates that
the position of many academic staff members in the higher remuneration bracket had improved more over this period than the position of staff in the lower remuneration brackets. [Comment from M Price and J du Toit: as the values (Q1, mean, median etc.) are calculated from the individual staff remuneration values, this conclusion assumes that there is no or little change in the profile of the academic staff by rank over the period. However, if for instance, the ratio of senior staff to junior staff increased, the growth rate of the median, mean and Q3 values compared to that of the Q1 value will be higher].
ii. The real average annual growth rates were the highest for Institutions 6, 10 and 11. iii. Apart from Institution 16, all institutions kept track with inflation for the period 2008-2012.
TABLE 5.3: CALCULATION OF AVERAGE ANNUAL GROWTH RATE (%) FOR MEASURES OF LOCATION OF MONTHLY REMUNERATION IN RAND OF ACADEMIC STAFF OVER THE PERIOD 2008-2012: HE SECTOR
Year Q1 Me Q3 Average
2008 24924 30038 36402 316812009 27519 32812 40221 350062010 29760 35693 43853 381622011 31938 38382 47306 413272012 34187 41253 51458 44783
Av ann growth rate (%) (nom) 8.22 8.25 9.04 9.04Av ann growth rate (%) (real) 2.91 2.94 3.73 3.73
FIGURE 5.3: GRAPHICAL REPRESENTATION OF QUARTILES AND AVERAGE MONTHLY REMUNERATION OF ACADEMIC STAFF OVER THE PERIOD 2008-2012 ACCORDING TO YEAR: HE SECTOR
0
10000
20000
30000
40000
50000
60000
2008 2009 2010 2011 2012
Tota
l mon
thly
rem
uner
atio
n (R
)
Q1 Me Q3 Average
18
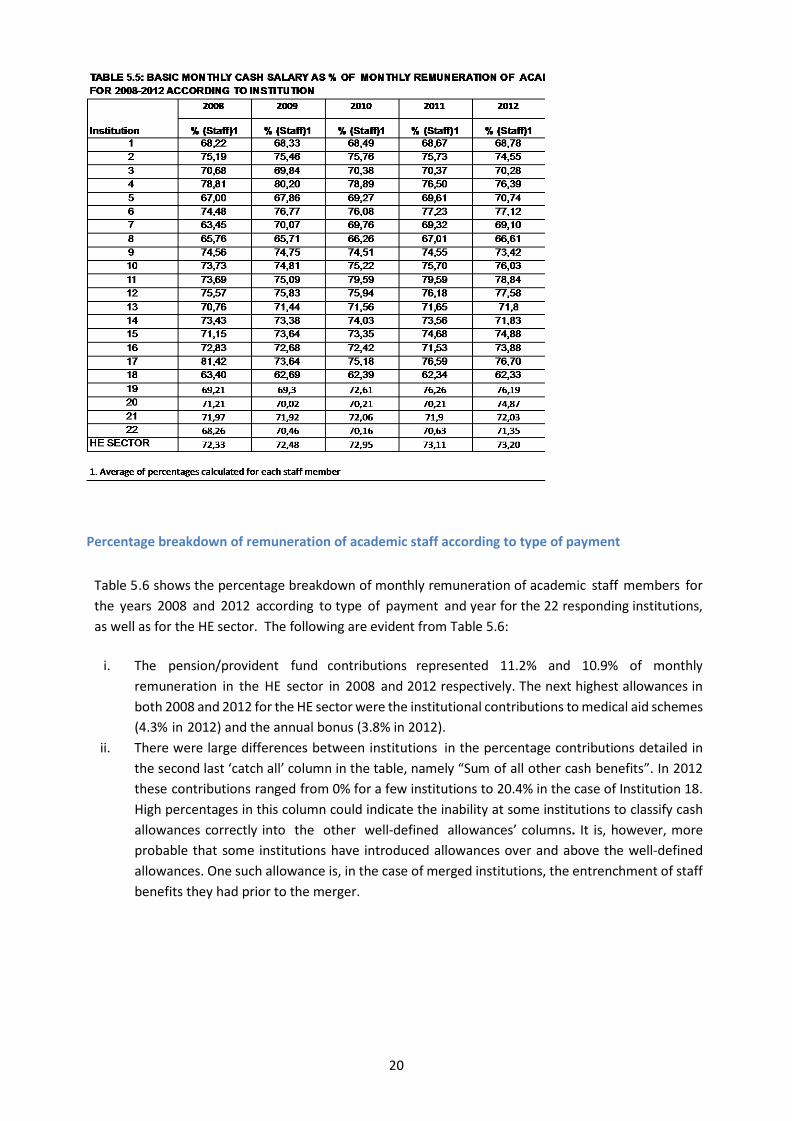
Basic cash/ salary of academic staff in 2008-2012 as percentage of total remuneration Table 5.5 details the average of the individual ratios determined for each staff member (indicated by “ % (Staff)”). From Table 5.5 it is evident that:
i. As far as the HE sector is concerned the ratio was relatively stable over the 5-year period. In 2012 about 73% of the total monthly remuneration of academic staff was paid in the form of cash/salaries.
ii. The ratios for the individual institutions show wide variability. This shows that remuneration packages are structured differently at the different institutions. In 2012, for example, the %( ratio of the 22 institutions varied between 62.3% and 78.8%.
TABLE 5.4: AVERAGE ANNUAL GROWTH RATE (%) IN MEASURES OF LOCATION OF MONTHLY REMUNERATION OF ACADEMIC STAFF
FOR THE YEARS 2008-2012 ACCORDING TO MEASURE AND INSTITUTION
Q1 Me Q3 Average Q1 Me Q3 Average
1 8.57 9.14 9.09 9.29 3.26 3.83 3.78 3.98
2 7.14 6.87 7.83 7.83 1.83 1.56 2.52 2.52
3 9.56 10.13 8.52 9.97 4.25 4.82 3.21 4.66
4 6.54 9.95 9.92 9.90 1.23 4.64 4.61 4.59
5 9.44 9.71 7.91 8.51 4.13 4.40 2.60 3.20
6 11.16 10.49 10.94 11.37 5.85 5.18 5.63 6.06
7 7.21 7.64 9.20 8.50 1.90 2.33 3.89 3.19
8 6.58 6.34 6.52 6.32 1.27 1.03 1.21 1.01
9 7.83 7.99 7.60 7.95 2.52 2.68 2.29 2.64
10 7.97 10.58 12.98 11.48 2.66 5.27 7.67 6.17
11 9.21 9.60 11.72 11.26 3.90 4.29 6.41 5.95
12 5.48 8.32 9.75 10.86 0.17 3.01 4.44 5.55
13 5.64 5.82 4.78 5.01 0.33 0.51 -0.53 -0.30
14 8.94 7.68 8.94 10.55 3.63 2.37 3.63 5.24
15 7.70 8.09 9.27 7.96 2.39 2.78 3.96 2.65
16 2.37 6.34 6.44 5.08 -2.94 1.03 1.13 -0.23
17 8.57 7.60 7.51 8.06 3.26 2.29 2.20 2.75
18 6.97 8.50 8.80 7.60 1.66 3.19 3.49 2.29
19 8.24 7.64 7.81 7.92 2.93 2.33 2.50 2.61
20 7.07 7.61 7.78 7.83 1.76 2.30 2.47 2.52
21 8.93 8.30 8.01 8.26 3.62 2.99 2.70 2.95
22 9.89 9.96 9.54 8.80 4.58 4.65 4.23 3.49
HE SECTOR 8.22 8.25 9.04 9.04 2.91 2.94 3.73 3.73
InstitutionNominal average annual growth rate 2008-2012 Real average annual growth rate 2008-2012
19
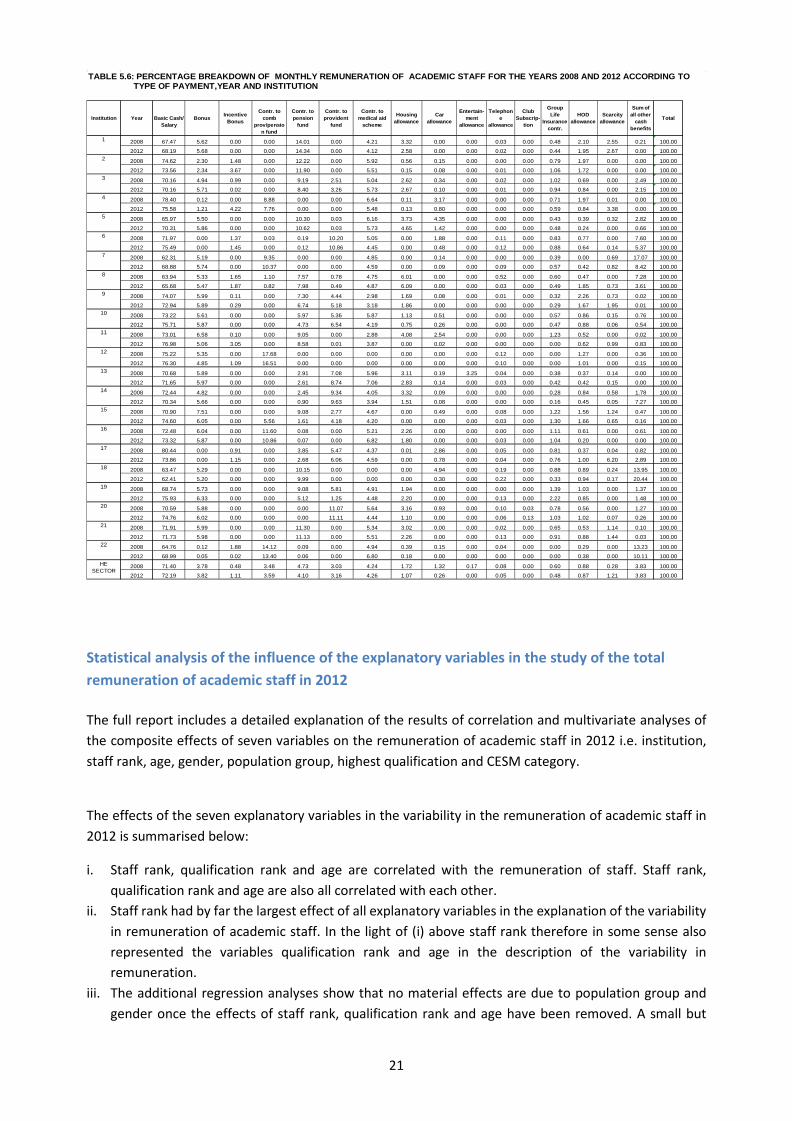
Percentage breakdown of remuneration of academic staff according to type of payment
Table 5.6 shows the percentage breakdown of monthly remuneration of academic staff members for the years 2008 and 2012 according to type of payment and year for the 22 responding institutions, as well as for the HE sector. The following are evident from Table 5.6:
i. The pension/provident fund contributions represented 11.2% and 10.9% of monthly
remuneration in the HE sector in 2008 and 2012 respectively. The next highest allowances in both 2008 and 2012 for the HE sector were the institutional contributions to medical aid schemes (4.3% in 2012) and the annual bonus (3.8% in 2012).
ii. There were large differences between institutions in the percentage contributions detailed in the second last ‘catch all’ column in the table, namely “Sum of all other cash benefits”. In 2012 these contributions ranged from 0% for a few institutions to 20.4% in the case of Institution 18. High percentages in this column could indicate the inability at some institutions to classify cash allowances correctly into the other well-defined allowances’ columns. It is, however, more probable that some institutions have introduced allowances over and above the well-defined allowances. One such allowance is, in the case of merged institutions, the entrenchment of staff benefits they had prior to the merger.
20
Statistical analysis of the influence of the explanatory variables in the study of the total remuneration of academic staff in 2012 The full report includes a detailed explanation of the results of correlation and multivariate analyses of the composite effects of seven variables on the remuneration of academic staff in 2012 i.e. institution, staff rank, age, gender, population group, highest qualification and CESM category.
The effects of the seven explanatory variables in the variability in the remuneration of academic staff in 2012 is summarised below:
i. Staff rank, qualification rank and age are correlated with the remuneration of staff. Staff rank, qualification rank and age are also all correlated with each other.
ii. Staff rank had by far the largest effect of all explanatory variables in the explanation of the variability in remuneration of academic staff. In the light of (i) above staff rank therefore in some sense also represented the variables qualification rank and age in the description of the variability in remuneration.
iii. The additional regression analyses show that no material effects are due to population group and gender once the effects of staff rank, qualification rank and age have been removed. A small but
TABLE 5.6: PERCENTAGE BREAKDOWN OF MONTHLY REMUNERATION OF ACADEMIC STAFF FOR THE YEARS 2008 AND 2012 ACCORDING TO TYPE OF PAYMENT,YEAR AND INSTITUTION
Institution Year
Basic Cash/ Salary
Bonus Incentive Bonus
Contr. to comb
prov/pension fund
Contr. to pension
fund
Contr. to provident
fund
Contr. to medical aid
scheme
Housing allowance
Car allowance
Entertain-ment
allowance
Telephone
allowance
Club Subscrip-
tion
Group Life
Insurance contr.
HOD allowance
Scarcity allowance
Sum of all other
cash benefits
Total
2008 67.47 5.62 0.00 0.00 14.01 0.00 4.21 3.32 0.00 0.00 0.03 0.00 0.48 2.10 2.55 0.21 100.00
2012 68.19 5.68 0.00 0.00 14.34 0.00 4.12 2.58 0.00 0.00 0.02 0.00 0.44 1.95 2.67 0.00 100.00
2008 74.62 2.30 1.48 0.00 12.22 0.00 5.92 0.56 0.15 0.00 0.00 0.00 0.79 1.97 0.00 0.00 100.00
2012 73.56 2.34 3.67 0.00 11.90 0.00 5.51 0.15 0.08 0.00 0.01 0.00 1.06 1.72 0.00 0.00 100.00
2008 70.16 4.94 0.99 0.00 9.19 2.51 5.04 2.62 0.34 0.00 0.02 0.00 1.02 0.69 0.00 2.49 100.00
2012 70.16 5.71 0.02 0.00 8.40 3.26 5.73 2.67 0.10 0.00 0.01 0.00 0.94 0.84 0.00 2.15 100.00
2008 78.40 0.12 0.00 8.88 0.00 0.00 6.64 0.11 3.17 0.00 0.00 0.00 0.71 1.97 0.01 0.00 100.00
2012 75.58 1.21 4.22 7.76 0.00 0.00 5.48 0.13 0.80 0.00 0.00 0.00 0.59 0.84 3.38 0.00 100.00
2008 65.97 5.50 0.00 0.00 10.30 0.03 6.16 3.73 4.35 0.00 0.00 0.00 0.43 0.39 0.32 2.82 100.00
2012 70.31 5.86 0.00 0.00 10.62 0.03 5.73 4.65 1.42 0.00 0.00 0.00 0.48 0.24 0.00 0.66 100.00
2008 71.97 0.00 1.37 0.03 0.19 10.20 5.05 0.00 1.88 0.00 0.11 0.00 0.83 0.77 0.00 7.60 100.00
2012 75.49 0.00 1.45 0.00 0.12 10.86 4.45 0.00 0.48 0.00 0.12 0.00 0.88 0.64 0.14 5.37 100.00
2008 62.31 5.19 0.00 9.35 0.00 0.00 4.85 0.00 0.14 0.00 0.00 0.00 0.39 0.00 0.69 17.07 100.00
2012 68.88 5.74 0.00 10.37 0.00 0.00 4.59 0.00 0.09 0.00 0.09 0.00 0.57 0.42 0.82 8.42 100.00
2008 63.94 5.33 1.65 1.10 7.57 0.78 4.75 6.01 0.00 0.00 0.52 0.00 0.60 0.47 0.00 7.28 100.00
2012 65.68 5.47 1.87 0.82 7.98 0.49 4.87 6.09 0.00 0.00 0.03 0.00 0.49 1.85 0.73 3.61 100.00
2008 74.07 5.99 0.11 0.00 7.30 4.44 2.98 1.69 0.08 0.00 0.01 0.00 0.32 2.26 0.73 0.02 100.00
2012 72.94 5.89 0.29 0.00 6.74 5.18 3.18 1.86 0.00 0.00 0.00 0.00 0.29 1.67 1.95 0.01 100.00
2008 73.22 5.61 0.00 0.00 5.97 5.36 5.87 1.13 0.51 0.00 0.00 0.00 0.57 0.86 0.15 0.76 100.00
2012 75.71 5.87 0.00 0.00 4.73 6.54 4.19 0.75 0.26 0.00 0.00 0.00 0.47 0.88 0.06 0.54 100.00
2008 73.01 6.58 0.10 0.00 9.05 0.00 2.88 4.08 2.54 0.00 0.00 0.00 1.23 0.52 0.00 0.02 100.00
2012 76.98 5.06 3.05 0.00 8.58 0.01 3.87 0.00 0.02 0.00 0.00 0.00 0.00 0.62 0.99 0.83 100.00
2008 75.22 5.35 0.00 17.68 0.00 0.00 0.00 0.00 0.00 0.00 0.12 0.00 0.00 1.27 0.00 0.36 100.00
2012 76.30 4.85 1.09 16.51 0.00 0.00 0.00 0.00 0.00 0.00 0.10 0.00 0.00 1.01 0.00 0.15 100.00
2008 70.68 5.89 0.00 0.00 2.91 7.08 5.96 3.11 0.19 3.25 0.04 0.00 0.38 0.37 0.14 0.00 100.00
2012 71.65 5.97 0.00 0.00 2.61 8.74 7.06 2.83 0.14 0.00 0.03 0.00 0.42 0.42 0.15 0.00 100.00
2008 72.44 4.82 0.00 0.00 2.45 9.34 4.05 3.32 0.09 0.00 0.00 0.00 0.28 0.84 0.58 1.78 100.00
2012 70.34 5.66 0.00 0.00 0.90 9.63 3.94 1.51 0.08 0.00 0.00 0.00 0.16 0.45 0.05 7.27 100.00
2008 70.90 7.51 0.00 0.00 9.08 2.77 4.67 0.00 0.49 0.00 0.08 0.00 1.22 1.56 1.24 0.47 100.00
2012 74.60 6.05 0.00 5.56 1.61 4.18 4.20 0.00 0.00 0.00 0.03 0.00 1.30 1.66 0.65 0.16 100.00
2008 72.48 6.04 0.00 11.60 0.08 0.00 5.21 2.26 0.00 0.00 0.00 0.00 1.11 0.61 0.00 0.61 100.00
2012 73.32 5.87 0.00 10.86 0.07 0.00 6.82 1.80 0.00 0.00 0.03 0.00 1.04 0.20 0.00 0.00 100.0017 2008 80.44 0.00 0.91 0.00 3.85 5.47 4.37 0.01 2.86 0.00 0.05 0.00 0.81 0.37 0.04 0.82 100.00
2012 73.86 0.00 1.15 0.00 2.68 6.06 4.59 0.00 0.78 0.00 0.04 0.00 0.76 1.00 6.20 2.89 100.0018 2008 63.47 5.29 0.00 0.00 10.15 0.00 0.00 0.00 4.94 0.00 0.19 0.00 0.88 0.89 0.24 13.95 100.00
2012 62.41 5.20 0.00 0.00 9.99 0.00 0.00 0.00 0.30 0.00 0.22 0.00 0.33 0.94 0.17 20.44 100.0019 2008 68.74 5.73 0.00 0.00 9.08 5.81 4.91 1.94 0.00 0.00 0.00 0.00 1.39 1.03 0.00 1.37 100.00
2012 75.93 6.33 0.00 0.00 5.12 1.25 4.48 2.20 0.00 0.00 0.13 0.00 2.22 0.85 0.00 1.48 100.0020 2008 70.59 5.88 0.00 0.00 0.00 11.07 5.64 3.16 0.93 0.00 0.10 0.03 0.78 0.56 0.00 1.27 100.00
2012 74.76 6.02 0.00 0.00 0.00 11.11 4.44 1.10 0.00 0.00 0.06 0.13 1.03 1.02 0.07 0.26 100.0021 2008 71.91 5.99 0.00 0.00 11.30 0.00 5.34 3.02 0.00 0.00 0.02 0.00 0.65 0.53 1.14 0.10 100.00
2012 71.73 5.98 0.00 0.00 11.13 0.00 5.51 2.26 0.00 0.00 0.13 0.00 0.91 0.88 1.44 0.03 100.0022 2008 64.76 0.12 1.88 14.12 0.09 0.00 4.94 0.39 0.15 0.00 0.04 0.00 0.00 0.29 0.00 13.23 100.00
2012 68.99 0.05 0.02 13.40 0.06 0.00 6.80 0.18 0.00 0.00 0.00 0.00 0.00 0.38 0.00 10.11 100.00
2008 71.40 3.78 0.48 3.48 4.73 3.03 4.24 1.72 1.32 0.17 0.08 0.00 0.60 0.88 0.28 3.83 100.00
2012 72.19 3.82 1.11 3.59 4.10 3.16 4.26 1.07 0.26 0.00 0.05 0.00 0.48 0.87 1.21 3.83 100.00
16
10
1
2
3
4
5
6
7
8
9
HE SECTOR
11
12
13
14
15
21
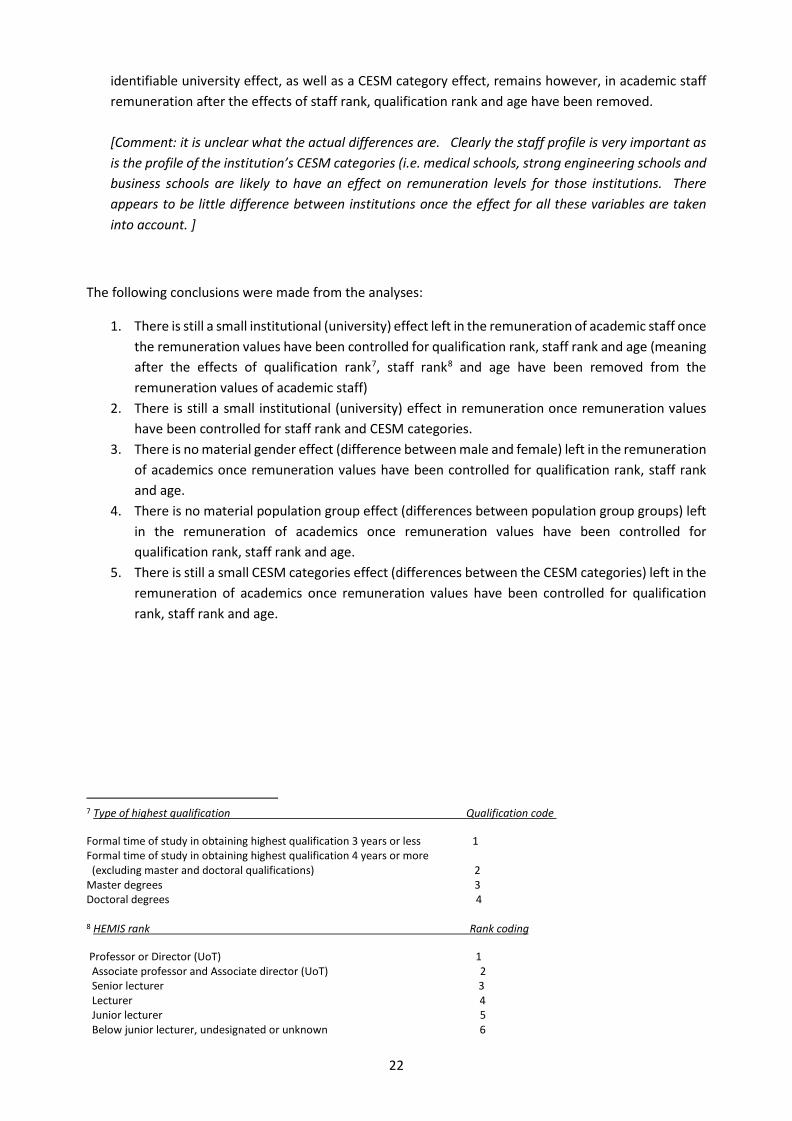
identifiable university effect, as well as a CESM category effect, remains however, in academic staff remuneration after the effects of staff rank, qualification rank and age have been removed. [Comment: it is unclear what the actual differences are. Clearly the staff profile is very important as is the profile of the institution’s CESM categories (i.e. medical schools, strong engineering schools and business schools are likely to have an effect on remuneration levels for those institutions. There appears to be little difference between institutions once the effect for all these variables are taken into account. ]
The following conclusions were made from the analyses:
1. There is still a small institutional (university) effect left in the remuneration of academic staff once the remuneration values have been controlled for qualification rank, staff rank and age (meaning after the effects of qualification rank7, staff rank8 and age have been removed from the remuneration values of academic staff)
2. There is still a small institutional (university) effect in remuneration once remuneration values have been controlled for staff rank and CESM categories.
3. There is no material gender effect (difference between male and female) left in the remuneration of academics once remuneration values have been controlled for qualification rank, staff rank and age.
4. There is no material population group effect (differences between population group groups) left in the remuneration of academics once remuneration values have been controlled for qualification rank, staff rank and age.
5. There is still a small CESM categories effect (differences between the CESM categories) left in the remuneration of academics once remuneration values have been controlled for qualification rank, staff rank and age.
7 Type of highest qualification Qualification code
Formal time of study in obtaining highest qualification 3 years or less 1 Formal time of study in obtaining highest qualification 4 years or more (excluding master and doctoral qualifications) 2 Master degrees 3 Doctoral degrees 4 8 HEMIS rank Rank coding
Professor or Director (UoT) 1 Associate professor and Associate director (UoT) 2 Senior lecturer 3 Lecturer 4 Junior lecturer 5 Below junior lecturer, undesignated or unknown 6
22
Analysis of remuneration according to academic rank / level for the period 2008 - 2012
Tables 5.7 and 5.8 show remuneration information according to academic rank9.
The summary report includes additional graphs depicting the associated annual remuneration.
Points to note:
• Using the 2012 data, the average remuneration of Associate Professors, Senior Lecturers, Lecturers and Junior Lecturers relative to the average remuneration of Professors were respectively 79.2%, 65.7%, 51.8% and 38.6%.
• The fact that the senior academic staff, Professors and Associate Professors, had the highest real average growth over the period 2008 to 2012, as well as the fact that the average remuneration of professors was in 2012 almost twice that of lecturers, may indicate that institutional management are under some pressure to keep their senior academic staff.
9 HEMIS rank Rank coding
Professor or Director (UoT) 1 Associate professor and Associate director (UoT) 2 Senior lecturer 3 Lecturer 4 Junior lecturer 5 Below junior lecturer, undesignated or unknown 6
23
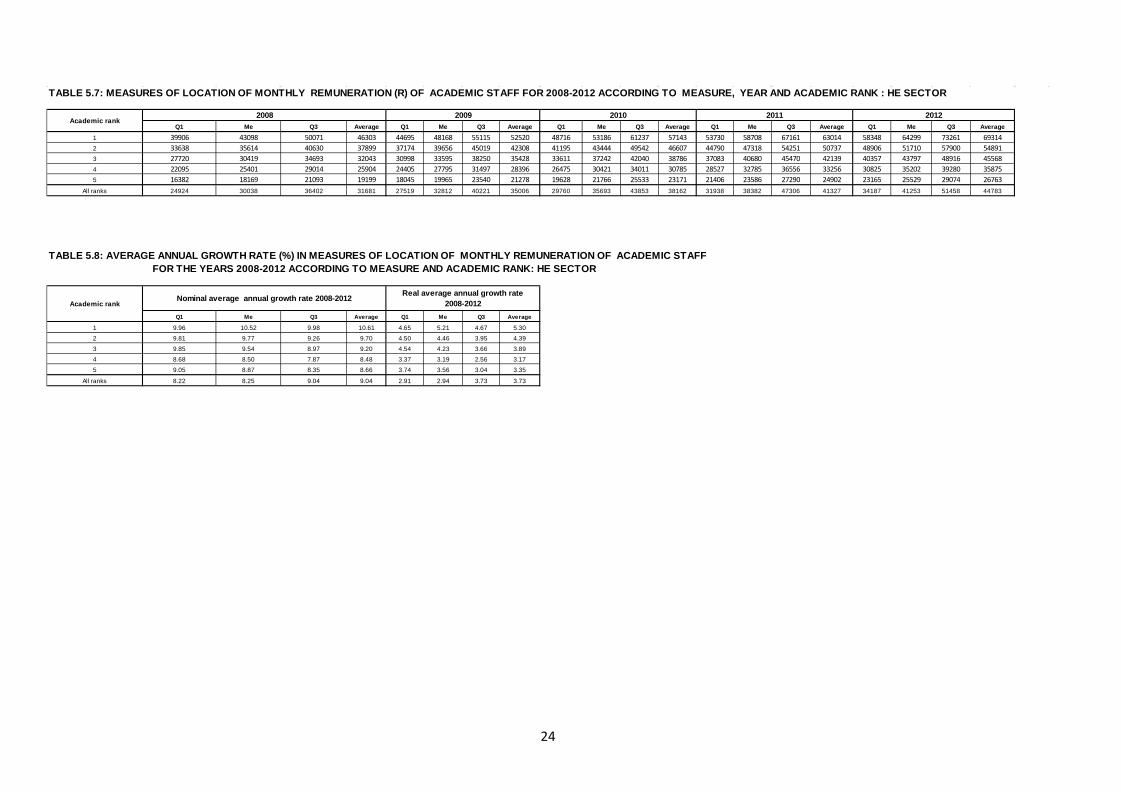
TABLE 5.7: MEASURES OF LOCATION OF MONTHLY REMUNERATION (R) OF ACADEMIC STAFF FOR 2008-2012 ACCORDING TO MEASURE, YEAR AND ACADEMIC RANK : HE SECTOR
Q1 Me Q3 Average Q1 Me Q3 Average Q1 Me Q3 Average Q1 Me Q3 Average Q1 Me Q3 Average
1 39906 43098 50071 46303 44695 48168 55115 52520 48716 53186 61237 57143 53730 58708 67161 63014 58348 64299 73261 693142 33638 35614 40630 37899 37174 39656 45019 42308 41195 43444 49542 46607 44790 47318 54251 50737 48906 51710 57900 548913 27720 30419 34693 32043 30998 33595 38250 35428 33611 37242 42040 38786 37083 40680 45470 42139 40357 43797 48916 455684 22095 25401 29014 25904 24405 27795 31497 28396 26475 30421 34011 30785 28527 32785 36556 33256 30825 35202 39280 358755 16382 18169 21093 19199 18045 19965 23540 21278 19628 21766 25533 23171 21406 23586 27290 24902 23165 25529 29074 26763
All ranks 24924 30038 36402 31681 27519 32812 40221 35006 29760 35693 43853 38162 31938 38382 47306 41327 34187 41253 51458 44783
TABLE 5.8: AVERAGE ANNUAL GROWTH RATE (%) IN MEASURES OF LOCATION OF MONTHLY REMUNERATION OF ACADEMIC STAFF FOR THE YEARS 2008-2012 ACCORDING TO MEASURE AND ACADEMIC RANK: HE SECTOR
Q1 Me Q3 Average Q1 Me Q3 Average
1 9.96 10.52 9.98 10.61 4.65 5.21 4.67 5.30
2 9.81 9.77 9.26 9.70 4.50 4.46 3.95 4.39
3 9.85 9.54 8.97 9.20 4.54 4.23 3.66 3.89
4 8.68 8.50 7.87 8.48 3.37 3.19 2.56 3.17 5 9.05 8.87 8.35 8.66 3.74 3.56 3.04 3.35
All ranks 8.22 8.25 9.04 9.04 2.91 2.94 3.73 3.73
2010 2011 2012
Academic rankNominal average annual growth rate 2008-2012 Real average annual growth rate
2008-2012
Academic rank2008 2009
24
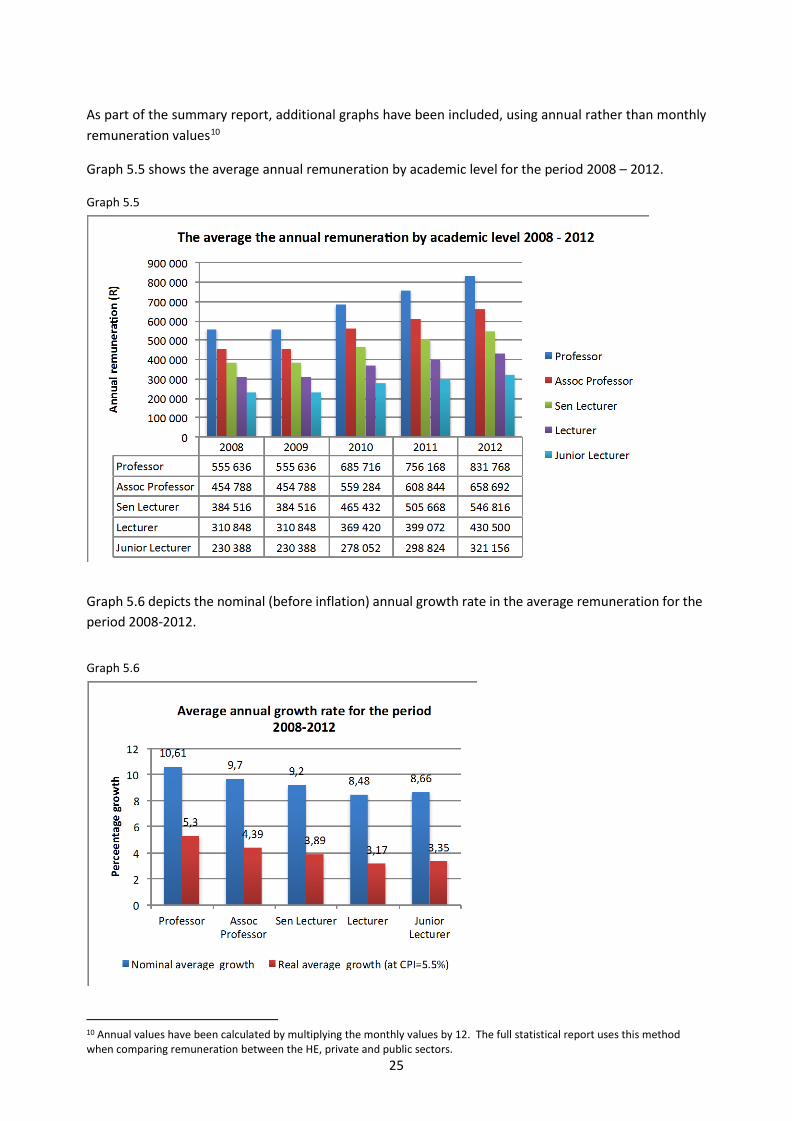
As part of the summary report, additional graphs have been included, using annual rather than monthly remuneration values10
Graph 5.5 shows the average annual remuneration by academic level for the period 2008 – 2012.
Graph 5.5
Graph 5.6 depicts the nominal (before inflation) annual growth rate in the average remuneration for the period 2008-2012.
Graph 5.6
10 Annual values have been calculated by multiplying the monthly values by 12. The full statistical report uses this method when comparing remuneration between the HE, private and public sectors.
25
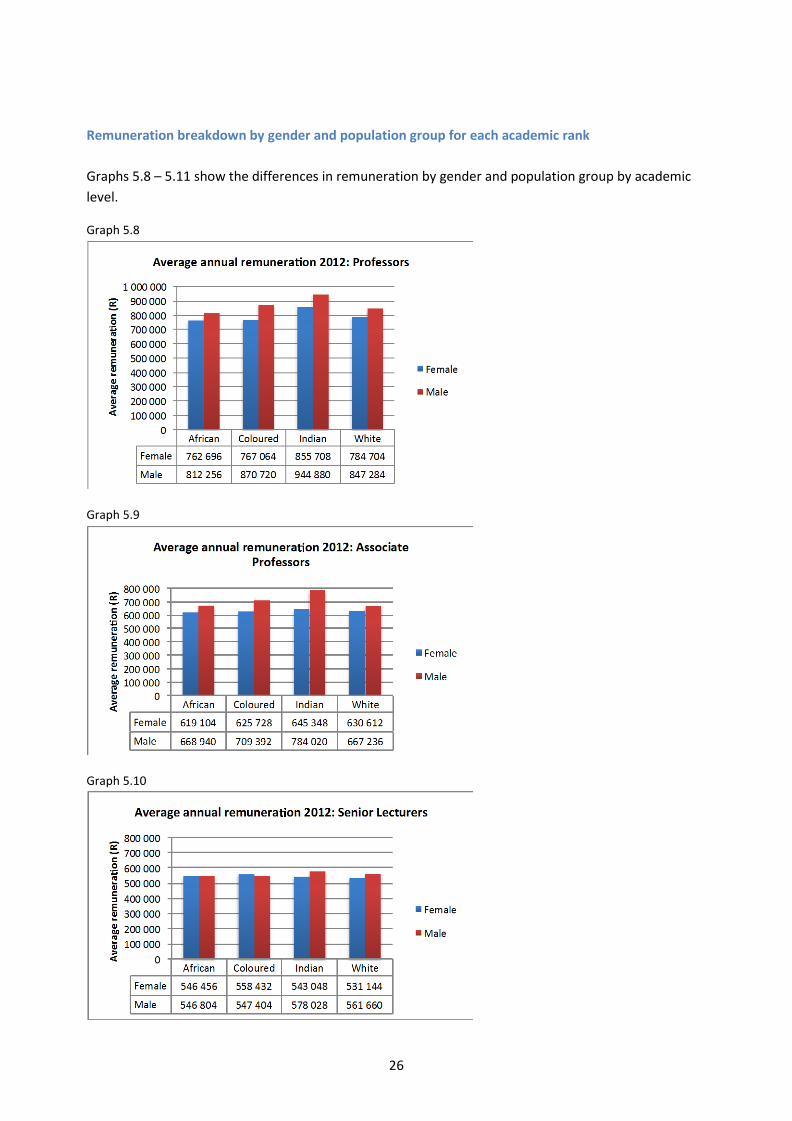
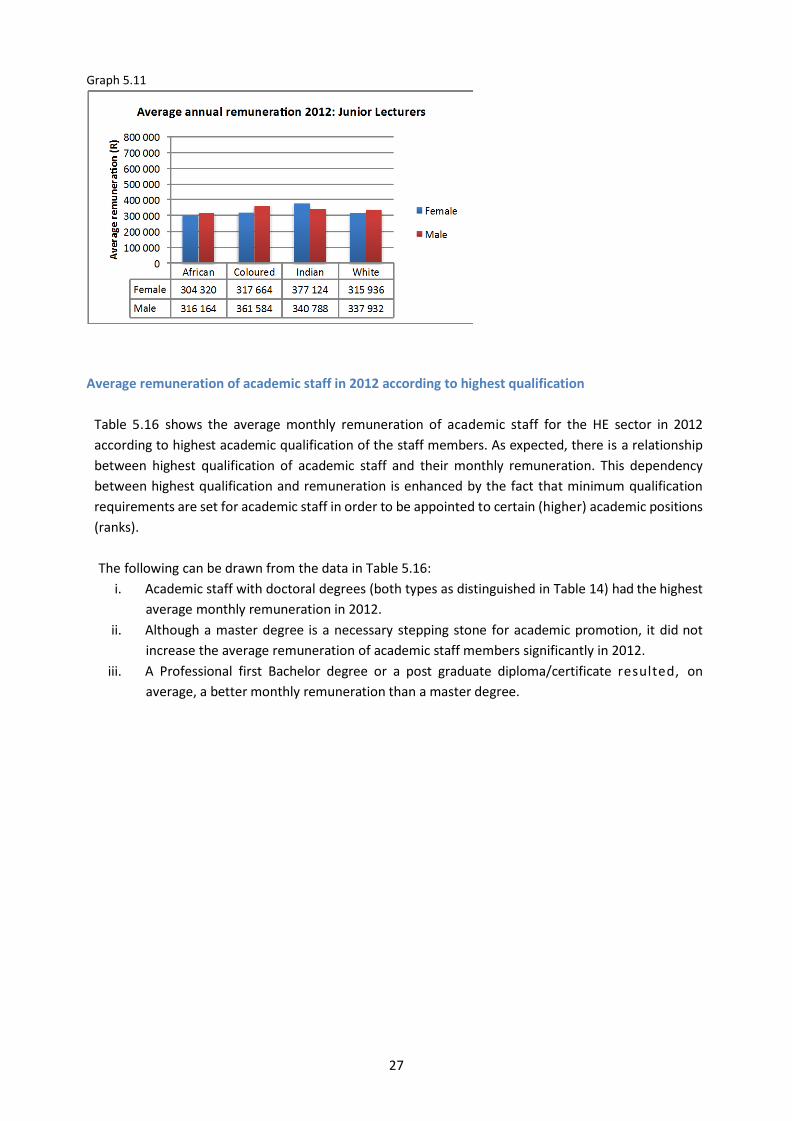
Remuneration breakdown by gender and population group for each academic rank Graphs 5.8 – 5.11 show the differences in remuneration by gender and population group by academic level.
Graph 5.8
Graph 5.9
Graph 5.10
26
Graph 5.11
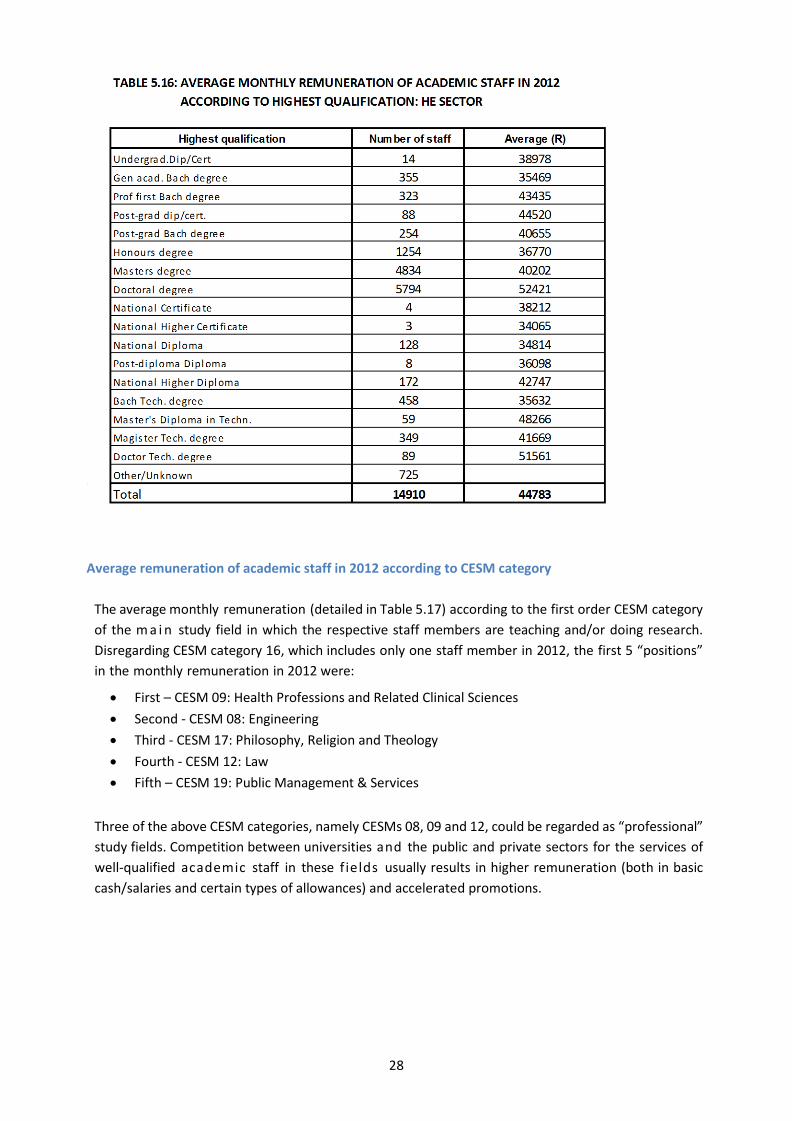
Average remuneration of academic staff in 2012 according to highest qualification Table 5.16 shows the average monthly remuneration of academic staff for the HE sector in 2012 according to highest academic qualification of the staff members. As expected, there is a relationship between highest qualification of academic staff and their monthly remuneration. This dependency between highest qualification and remuneration is enhanced by the fact that minimum qualification requirements are set for academic staff in order to be appointed to certain (higher) academic positions (ranks). The following can be drawn from the data in Table 5.16:
i. Academic staff with doctoral degrees (both types as distinguished in Table 14) had the highest average monthly remuneration in 2012.
ii. Although a master degree is a necessary stepping stone for academic promotion, it did not increase the average remuneration of academic staff members significantly in 2012.
iii. A Professional first Bachelor degree or a post graduate diploma/certificate resulted, on average, a better monthly remuneration than a master degree.
27
Average remuneration of academic staff in 2012 according to CESM category The average monthly remuneration (detailed in Table 5.17) according to the first order CESM category of the m a i n study field in which the respective staff members are teaching and/or doing research. Disregarding CESM category 16, which includes only one staff member in 2012, the first 5 “positions” in the monthly remuneration in 2012 were:
• First – CESM 09: Health Professions and Related Clinical Sciences • Second - CESM 08: Engineering • Third - CESM 17: Philosophy, Religion and Theology • Fourth - CESM 12: Law • Fifth – CESM 19: Public Management & Services
Three of the above CESM categories, namely CESMs 08, 09 and 12, could be regarded as “professional” study fields. Competition between universities and the public and private sectors for the services of well-qualified academic staff in these f ields usually results in higher remuneration (both in basic cash/salaries and certain types of allowances) and accelerated promotions.
28

Remuneration-age scatterplots and profiles of academic staff in 2012 The relationship between age and total monthly remuneration of academic staff members is important. Although it was already indicated that age is only one of the determinants of total monthly remuneration of academic staff members, any a c a d em i c staff member should have some expectation about the improvement in his/her real remuneration position in years to come. A full statistical analysis was performed for each institution and is included in the Appendix. [Comment: Age is correlated with rank and very little differentiation in remuneration is related to age rather than that differentiation due to rank]
Remuneration-age profiles in 2012 according to gender To investigate the differences in the career paths of male and female academic staff in 2012, the joint scatterplot of these two groups of total remuneration against age was used. The data was restricted to academic staff with ages ranging from 24 years to 65 years (usual retirement age) in 2012. Figure 5.5 shows the respective fits for the remuneration of male and female academics. The figure shows that from about the age of 30 the gap between the male (top graph) and female (bottom graph) remuneration-age profiles is systematically widening. This is likely to be partly as a result of family responsibilities and commitments which influence many female academics’ career path, e. g. maternity leave or even an interruption of service for a few years to raise children. Once women resume their academic careers, for any given age they will generally be lower in the academic job ladder than their male counter parts. In a highly competitive environment like the academe it could be difficult for female academics to make up for the lost years and opportunities. Hence the lower monthly total remuneration of female academics compared to their male counterparts of the same age. [Comment:
TABLE 5.17: AVERAGE MONTHLY REMUNERATION OF ACADEMIC STAFF IN 2012 ACCORDING TO FIRST ORDER CESM CATEGORY: HE SECTOR
1st order CESM category Number of staff Average (R)01. Agriculture, Agricultural Operations and Related subjects 429 4369802. Architecture and the Built Environment 268 4255803. Visual and Performing Arts 572 4084504. Business, Economics and Management Studies 2490 4497605. Communication, Journalism and Related Subjects 258 3973206.Computer and Information Sciences 639 4298507. Education 1196 4105708. Engineering 1185 4831009. Health professions and Related Clinical Sciences 1482 5037110. Family Ecology and Consumer Sciences 106 3810411. Languages, Linguistics and Literature 686 4172212. Law 748 4644313. Life Sciences 971 4536514. Physical Sciences 1036 4445815. Mathematics and Statistics 660 4320217. Philosophy, Religion and Theology 284 4735018. Psychology 456 4085019. Public Management and Services 269 4637520. Social Sciences 777 42613Unknown1 398Total 14910 44783
1.Include 1 s taff member of CESM category 16, namely Mi l i tary Sciences
29
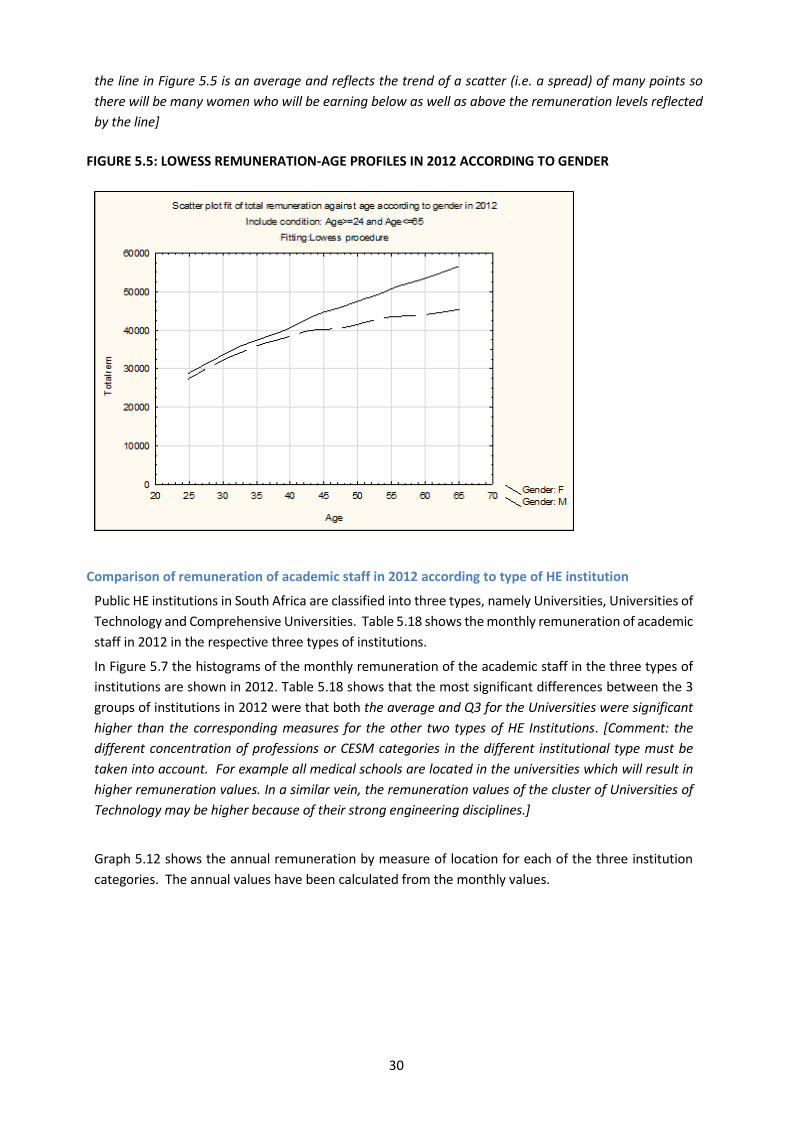
the line in Figure 5.5 is an average and reflects the trend of a scatter (i.e. a spread) of many points so there will be many women who will be earning below as well as above the remuneration levels reflected by the line]
FIGURE 5.5: LOWESS REMUNERATION-AGE PROFILES IN 2012 ACCORDING TO GENDER
Comparison of remuneration of academic staff in 2012 according to type of HE institution
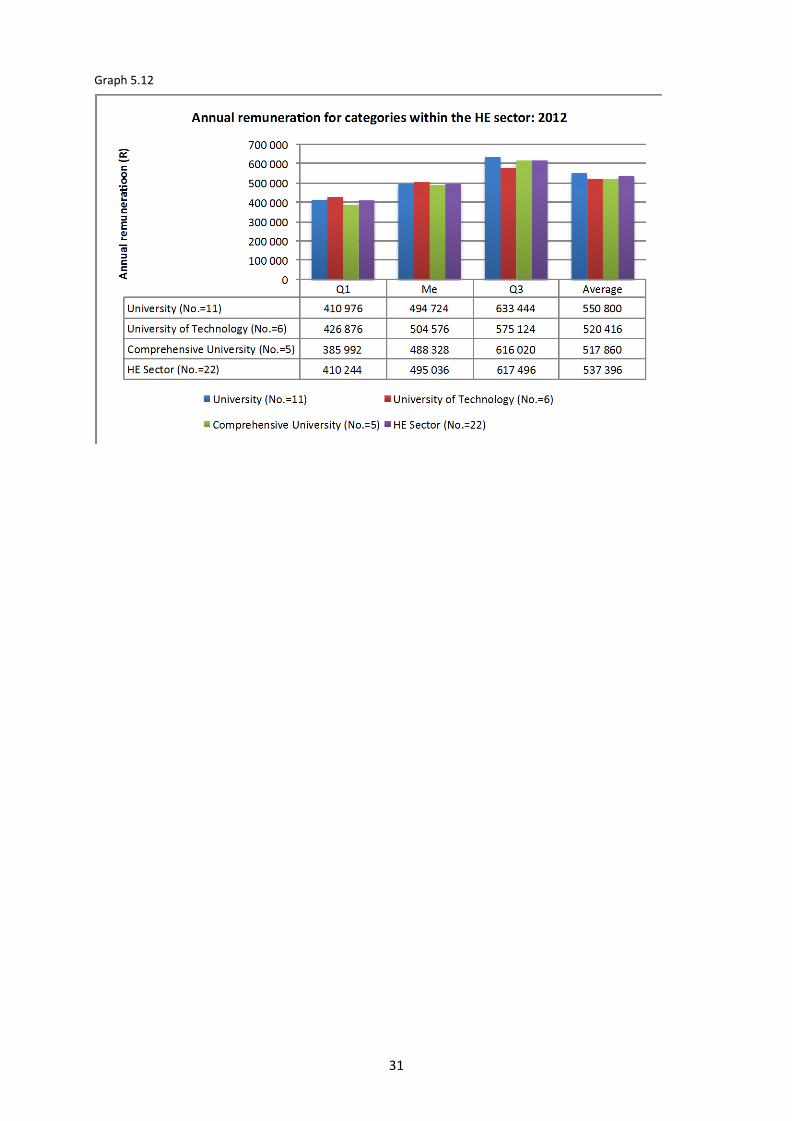
Public HE institutions in South Africa are classified into three types, namely Universities, Universities of Technology and Comprehensive Universities. Table 5.18 shows the monthly remuneration of academic staff in 2012 in the respective three types of institutions.
In Figure 5.7 the histograms of the monthly remuneration of the academic staff in the three types of institutions are shown in 2012. Table 5.18 shows that the most significant differences between the 3 groups of institutions in 2012 were that both the average and Q3 for the Universities were significant higher than the corresponding measures for the other two types of HE Institutions. [Comment: the different concentration of professions or CESM categories in the different institutional type must be taken into account. For example all medical schools are located in the universities which will result in higher remuneration values. In a similar vein, the remuneration values of the cluster of Universities of Technology may be higher because of their strong engineering disciplines.]
Graph 5.12 shows the annual remuneration by measure of location for each of the three institution categories. The annual values have been calculated from the monthly values.
30
Graph 5.12
31

SECTION 6: ANALYSIS OF PUBLIC SECTOR REMUNERATION DATA
The report below is based on remuneration information provided by DPSA for the years 2010 and 2012 for permanent full-time staff appointed by the national or provincial governments on salary levels 9-13 and with broad occupational group either ”Professionals and Managers” or “IT personnel”. The levels 9-13 broadly compare to the academic levels Junior Lecturer to Professor. A detailed explanation of the statistical analysis can be found in the full report. Graph 6.1 shows the annual remuneration of public sector staff. Graph 6.1
The average annual growth rate in annual remuneration of public sector staff in 2010 and 2012 Table 6.1 shows the annual remuneration of all public sector staff on salary levels 9-13 for the years 2010 and 2012. Using the average annual inflation rate of 5.3% for the years 2010 to 2012, the last two rows in the table indicate average annual growth rates of between 5.4% and 7.6% in real terms. This indicates that the conditions of service of public sector staff on salary levels 9-13 improved significantly from 2010 to 2012.
A full and comprehensive statistical analysis is detailed in the main report and includes the following:
• Correlation analyses of remuneration, age and salary level of public sector staff in 2012
TABLE 6.1: QUARTILES AND AVERAGE OF ANNUAL REMUNERATION IN RAND OF PUBLIC SECTOR STAFF IN 2010 AND 2012 ACCORDING TO TYPE OF MEASURE AND YEAR
Year Q1 Me Q3 Average Number of staff
2010 281034 341252 433810 379289 106215
2012 349870 434820 531650 465973 114012
Av ann growth rate (%) (nom) 11.58 12.88 10.70 10.84
Av ann growth rate (%) (real) 6.28 7.58 5.40 5.54
32
according to gender and population group • Multivariate Regression analysis of five explanatory variables on remuneration of public sector
staff in 2012
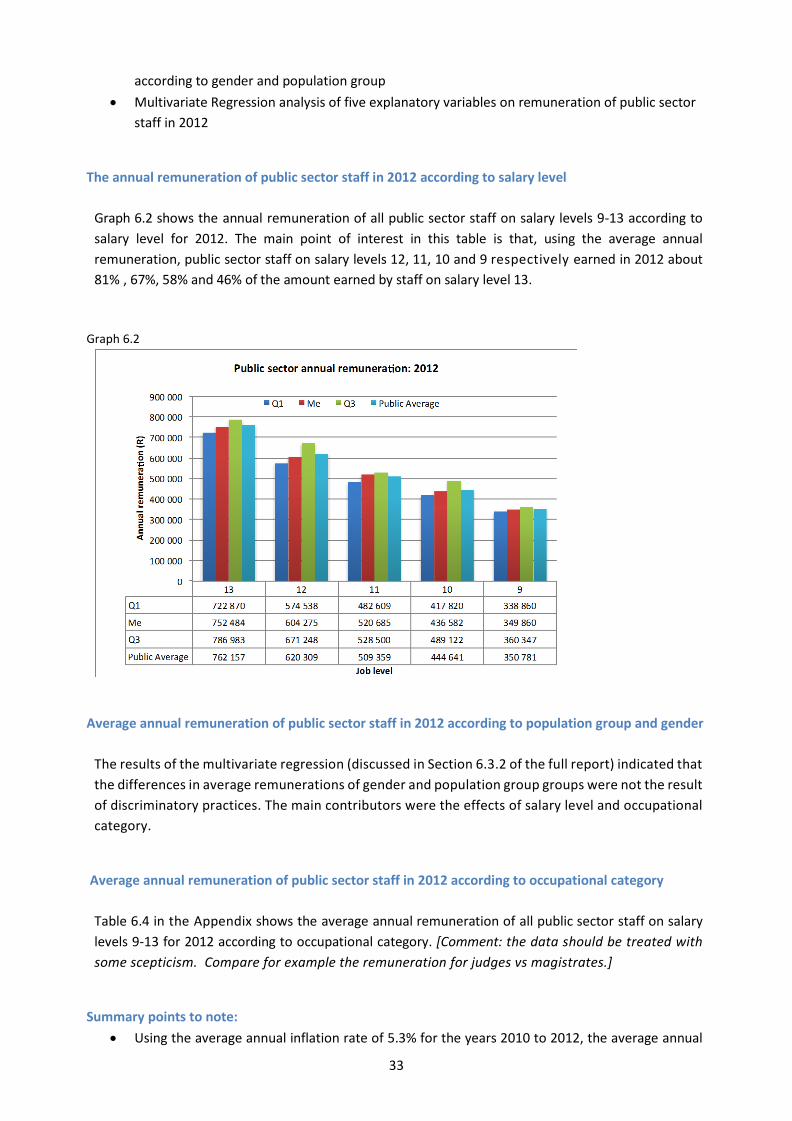
The annual remuneration of public sector staff in 2012 according to salary level Graph 6.2 shows the annual remuneration of all public sector staff on salary levels 9-13 according to salary level for 2012. The main point of interest in this table is that, using the average annual remuneration, public sector staff on salary levels 12, 11, 10 and 9 respectively earned in 2012 about 81% , 67%, 58% and 46% of the amount earned by staff on salary level 13.
Graph 6.2
Average annual remuneration of public sector staff in 2012 according to population group and gender The results of the multivariate regression (discussed in Section 6.3.2 of the full report) indicated that the differences in average remunerations of gender and population group groups were not the result of discriminatory practices. The main contributors were the effects of salary level and occupational category.
Average annual remuneration of public sector staff in 2012 according to occupational category Table 6.4 in the Appendix shows the average annual remuneration of all public sector staff on salary levels 9-13 for 2012 according to occupational category. [Comment: the data should be treated with some scepticism. Compare for example the remuneration for judges vs magistrates.]
Summary points to note: • Using the average annual inflation rate of 5.3% for the years 2010 to 2012, the average annual
33
growth rates in real terms is between 5.4% and 7.6%. • There is no material gender effect left in the remuneration of staff once remuneration values
have been controlled for salary level (job grade) and age. • There no material race effect left in the remuneration of staff once remuneration values have
been controlled for salary level (job grade) and age • There is a relatively small but definite occupational category effect left in the remuneration of
staff once remuneration values have been controlled for salary level (job grade) and age. • Using the average annual remuneration, public sector staff on salary levels 12, 11, 10 and 9
respectively earned in 2012 about 81% , 67%, 58% and 46% of the amount earned by staff on salary level (job grade) 13.
• The top 10 paid occupational categories, in ranked order are Senior Manager, Advocate, Magistrate, Head of Department, Medical specialist, Dental specialist, Attorney, Dental practitioner, Author/Journalist (only 5 staff members in dataset) and Medical researcher.
34
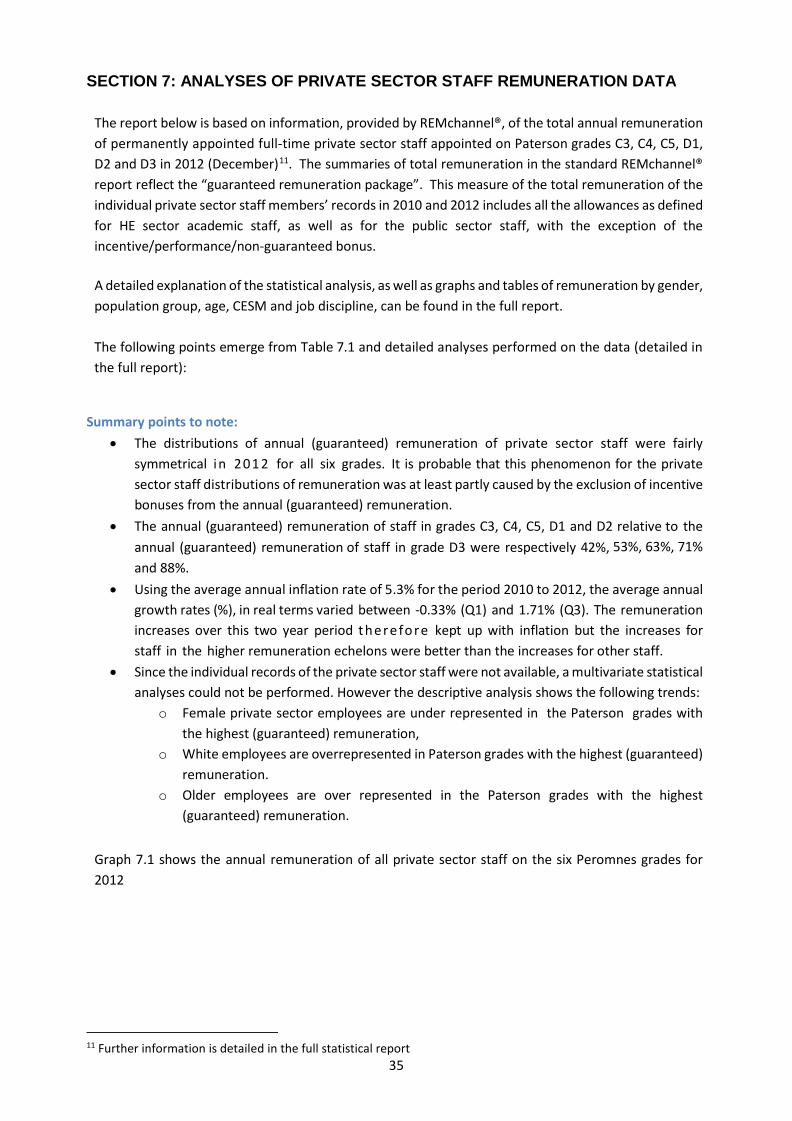
SECTION 7: ANALYSES OF PRIVATE SECTOR STAFF REMUNERATION DATA The report below is based on information, provided by REMchannel®, of the total annual remuneration of permanently appointed full-time private sector staff appointed on Paterson grades C3, C4, C5, D1, D2 and D3 in 2012 (December)11. The summaries of total remuneration in the standard REMchannel® report reflect the “guaranteed remuneration package”. This measure of the total remuneration of the individual private sector staff members’ records in 2010 and 2012 includes all the allowances as defined for HE sector academic staff, as well as for the public sector staff, with the exception of the incentive/performance/non-guaranteed bonus.
A detailed explanation of the statistical analysis, as well as graphs and tables of remuneration by gender, population group, age, CESM and job discipline, can be found in the full report. The following points emerge from Table 7.1 and detailed analyses performed on the data (detailed in the full report):
Summary points to note: • The distributions of annual (guaranteed) remuneration of private sector staff were fairly
symmetrical in 2012 for all six grades. It is probable that this phenomenon for the private sector staff distributions of remuneration was at least partly caused by the exclusion of incentive bonuses from the annual (guaranteed) remuneration.
• The annual (guaranteed) remuneration of staff in grades C3, C4, C5, D1 and D2 relative to the annual (guaranteed) remuneration of staff in grade D3 were respectively 42%, 53%, 63%, 71% and 88%.
• Using the average annual inflation rate of 5.3% for the period 2010 to 2012, the average annual growth rates (%), in real terms varied between -0.33% (Q1) and 1.71% (Q3). The remuneration increases over this two year period therefo re kept up with inflation but the increases for staff in the higher remuneration echelons were better than the increases for other staff.
• Since the individual records of the private sector staff were not available, a multivariate statistical analyses could not be performed. However the descriptive analysis shows the following trends:
o Female private sector employees are under represented in the Paterson grades with the highest (guaranteed) remuneration,
o White employees are overrepresented in Paterson grades with the highest (guaranteed) remuneration.
o Older employees are over represented in the Paterson grades with the highest (guaranteed) remuneration.
Graph 7.1 shows the annual remuneration of all private sector staff on the six Peromnes grades for 2012
11 Further information is detailed in the full statistical report
35
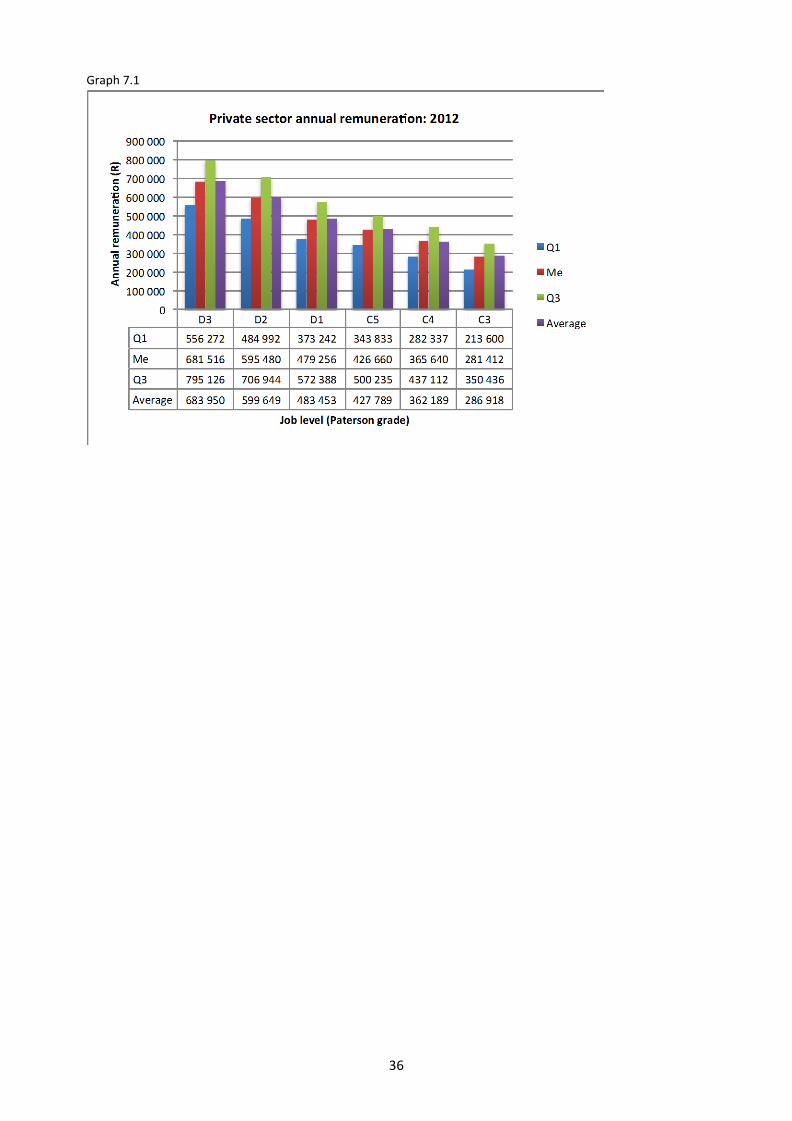
Graph 7.1
36
SECTION 8: COMPARISON OF THE ANNUAL REMUNERATION OF ACADEMIC STAFF IN HE SECTOR WITH THAT OF COMPARABLE STAFF IN THE PUBLIC AND PRIVATE SECTORS
Three important types of comparisons will be made between the remuneration of the three sectors, namely:
i. A comparison between the measures of location of the annual remuneration of academic staff in the South African HE sector and comparable staff in the South African public and private sectors for 2012.
ii. A comparison of the average annual growth rate (%) in the annual remuneration of academic staff in the South African HE sector and comparable staff in the South African public and private sectors for the period 2010 to 2012.
iii. a comparison between the three sectors for 2012 of the annual remuneration of male and female staff, staff in the four population group groups, staff in different age groups, as well as, where possible, staff in different study/work areas (CESM categories/occupational categories, job disciplines).
A comparison between the measures of location of the annual remuneration of academic staff in South Africa and comparable staff in the South African public and private sectors for 2012
Comparisons between the annual remuneration of staff in the three sectors will be made for comparable academic ranks/salary levels/Paterson grades, as detailed in Table 3.2.
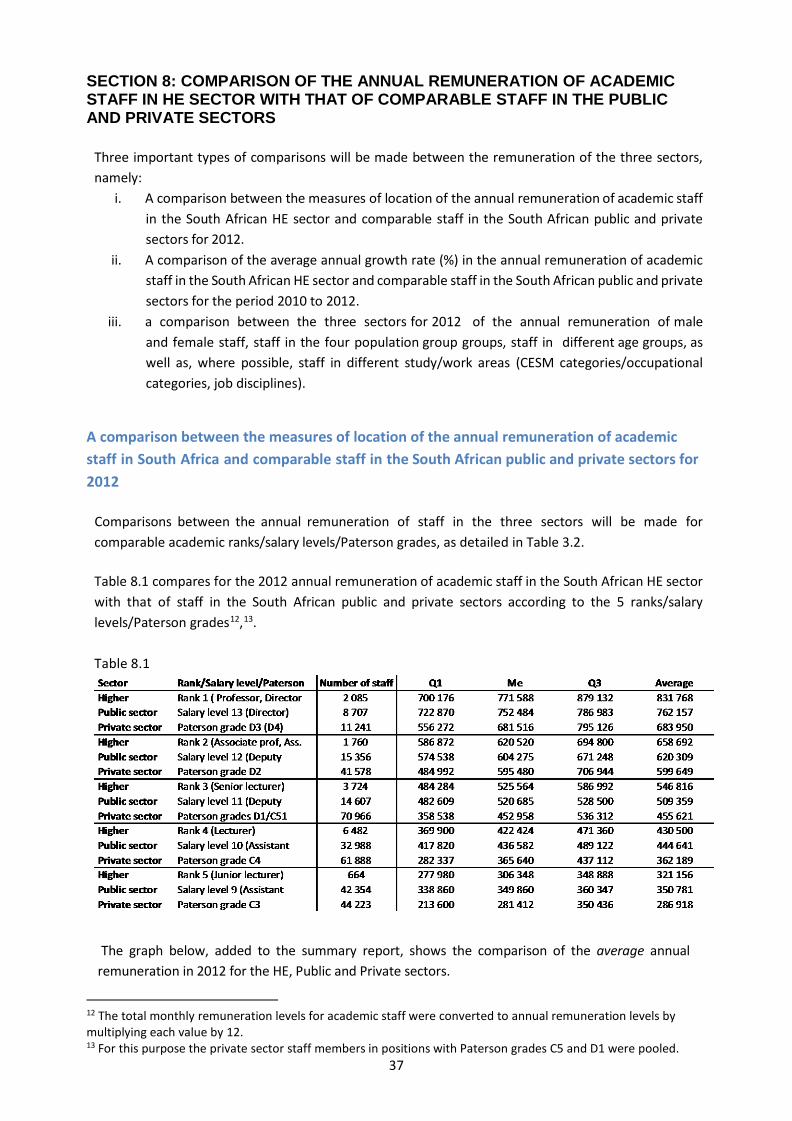
Table 8.1 compares for the 2012 annual remuneration of academic staff in the South African HE sector with that of staff in the South African public and private sectors according to the 5 ranks/salary levels/Paterson grades12,13. Table 8.1
The graph below, added to the summary report, shows the comparison of the average annual remuneration in 2012 for the HE, Public and Private sectors.
12 The total monthly remuneration levels for academic staff were converted to annual remuneration levels by multiplying each value by 12. 13 For this purpose the private sector staff members in positions with Paterson grades C5 and D1 were pooled.
37
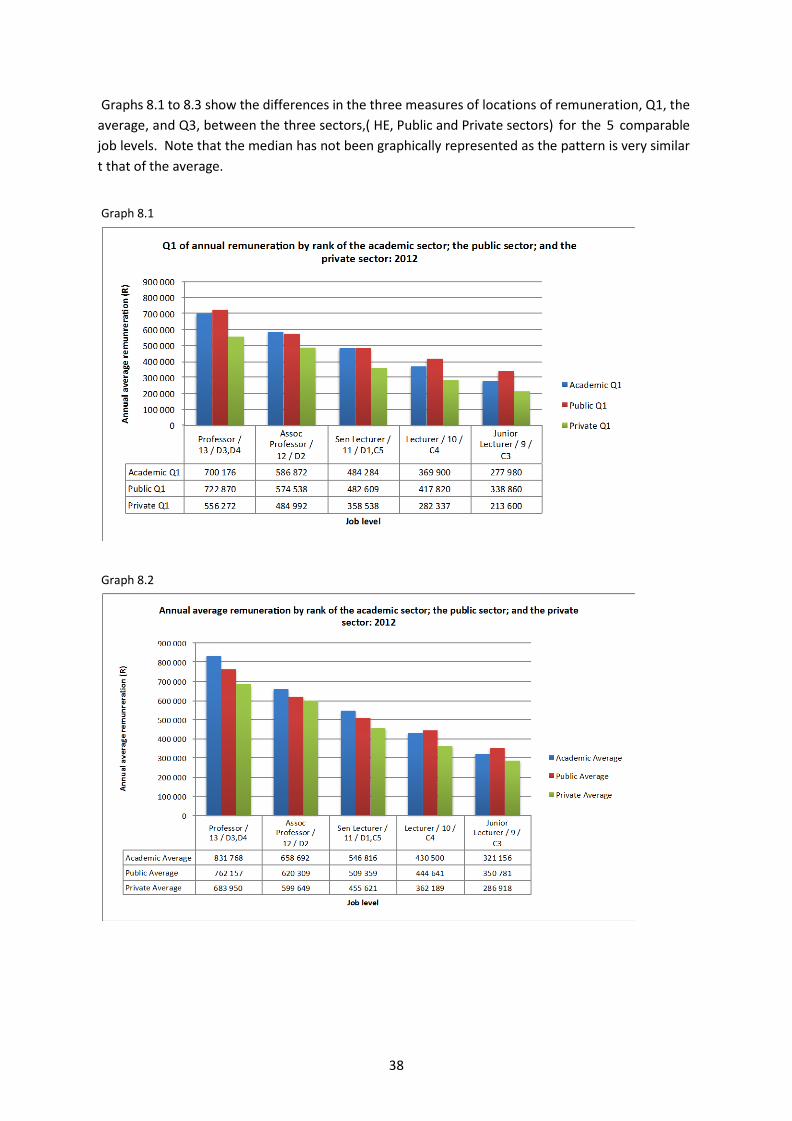
Graphs 8.1 to 8.3 show the differences in the three measures of locations of remuneration, Q1, the average, and Q3, between the three sectors,( HE, Public and Private sectors) for the 5 comparable job levels. Note that the median has not been graphically represented as the pattern is very similar t that of the average.
Graph 8.1
Graph 8.2
38

Graph 8.3
Table 8.2, calculated from Table 8.1, shows the annual remuneration of public sector and private sector staff relative to the annual remuneration of academic staff in the South African HE sector in 2012 b y m e a n s o f p ercentages according to rank and the 4 measures of location. The differences in these percentages for the three sectors will be used to draw conclusions for each of the 5 comparable ranks/salary levels/Paterson grades:
Professor: Rank 1/Salary level 13/Paterson grade D3: • the annual remuneration of academic staff in rank 1 positions (equivalent to
Professor) in 2012 was i. substantially higher than the remuneration in the private sector for all 4
measures of location. ii. was relatively on a par with the staff in the public sector as far for the first two
quartiles (Q1 and Me) but higher for the Q3 quartile, and for the average. It
39
must be emphasised that the annual remuneration of private sector staff excluded non-guaranteed incentive/performance bonuses in 2012, which could be high in a profitable year for staff in relatively senior positions, such as positions graded as Paterson D3.
iii. On average, the remuneration of public sector staff and private sector staff was respectively 8% and 18% lower than the remuneration.
[Further information on the requirements (particularly qualifications and years of experience) for the Peromnes 5 job in the public sector (equivalent to the level of Professor) was sought in order to gain a better understanding and comparison of the public and academic sector jobs at this level. Ms Ronelle Brandt was contacted with regards to requirements for the job level in the public sector that, in this report, is equated to the level of Professor but indicated that each job is graded independently and will have differing requirements in terms of qualification and experience. ]
Associate Professor: Rank 2/Salary level 12/Paterson grade D2: The annual remuneration of academic staff in rank 2 positions (equivalent to Associate Professor) in 2012 was—
i. moderately higher than the remuneration of their counterparts in the private sector as far as the Me and average were concerned and about the same for Q3 quartile.
ii. substantially higher in the Q1 than that of the private sector (as was the case for rank 1 positions in the HE sector). This phenomenon is also evident in the comparison of the HE sector with the private sector in the case of academic ranks 3, 4 and 5. This could perhaps indicate that staff appointed in the private sector usually start with relatively moderate remuneration, even in senior positions, and significant remuneration increases only follow after the staff showed their worth. In the HE sector, on the other hand, staff qualifications and publication records are known before appointment and provide a good barometer for their academic skills. Their entrance remunerations is therefore higher when compared with that of comparable private sector staff.
iii. on a par with that of the staff in the public sector for the quartiles Q1, Median and Q3. iv. On average, the public sector staff remuneration was 6% lower than the remuneration of
academic staff.
Senior Lecturer: Rank 3/Salary level 11/Paterson grade D1/D5: The annual remuneration of academic staff in rank 3 positions (equivalent to Senior Lecturer) in 2012 was—
i. substantially higher than the remuneration of their counterparts in the private sector as far as Q1, Me and the average were concerned and moderately higher for Q3. Note again that Q1 for the private sector was in the case of rank 3 significantly (26%) lower than Q1 for academic staff.
ii. almost the same as for the staff in the public sector as far as the first two quartiles (Q1 and Me) were concerned and moderately higher for Q3 and the average.
Lecturer: Rank 4/Salary level 10/Paterson grade C4: The annual remuneration of academic staff in rank 4 positions (equivalent to Lecturer) in 2012 was—
i. substantially higher than the remuneration in the private sector as far as Q1, Me and the average were concerned and moderately higher for Q3. Note again that Q1 for the private
40
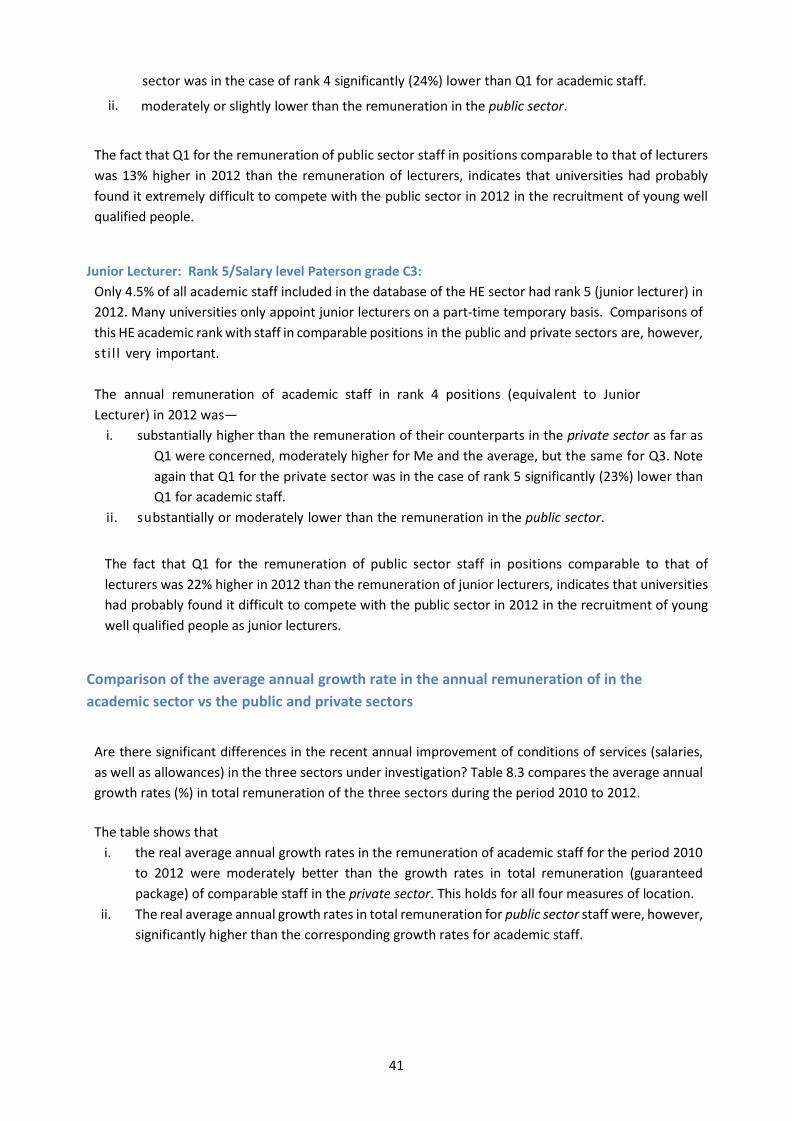
sector was in the case of rank 4 significantly (24%) lower than Q1 for academic staff.
ii. moderately or slightly lower than the remuneration in the public sector.
The fact that Q1 for the remuneration of public sector staff in positions comparable to that of lecturers was 13% higher in 2012 than the remuneration of lecturers, indicates that universities had probably found it extremely difficult to compete with the public sector in 2012 in the recruitment of young well qualified people.
Junior Lecturer: Rank 5/Salary level Paterson grade C3: Only 4.5% of all academic staff included in the database of the HE sector had rank 5 (junior lecturer) in 2012. Many universities only appoint junior lecturers on a part-time temporary basis. Comparisons of this HE academic rank with staff in comparable positions in the public and private sectors are, however, sti l l very important. The annual remuneration of academic staff in rank 4 positions (equivalent to Junior Lecturer) in 2012 was—
i. substantially higher than the remuneration of their counterparts in the private sector as far as Q1 were concerned, moderately higher for Me and the average, but the same for Q3. Note again that Q1 for the private sector was in the case of rank 5 significantly (23%) lower than Q1 for academic staff.
ii. substantially or moderately lower than the remuneration in the public sector.
The fact that Q1 for the remuneration of public sector staff in positions comparable to that of lecturers was 22% higher in 2012 than the remuneration of junior lecturers, indicates that universities had probably found it difficult to compete with the public sector in 2012 in the recruitment of young well qualified people as junior lecturers.
Comparison of the average annual growth rate in the annual remuneration of in the academic sector vs the public and private sectors
Are there significant differences in the recent annual improvement of conditions of services (salaries, as well as allowances) in the three sectors under investigation? Table 8.3 compares the average annual growth rates (%) in total remuneration of the three sectors during the period 2010 to 2012.
The table shows that
i. the real average annual growth rates in the remuneration of academic staff for the period 2010 to 2012 were moderately better than the growth rates in total remuneration (guaranteed package) of comparable staff in the private sector. This holds for all four measures of location.
ii. The real average annual growth rates in total remuneration for public sector staff were, however, significantly higher than the corresponding growth rates for academic staff.
41
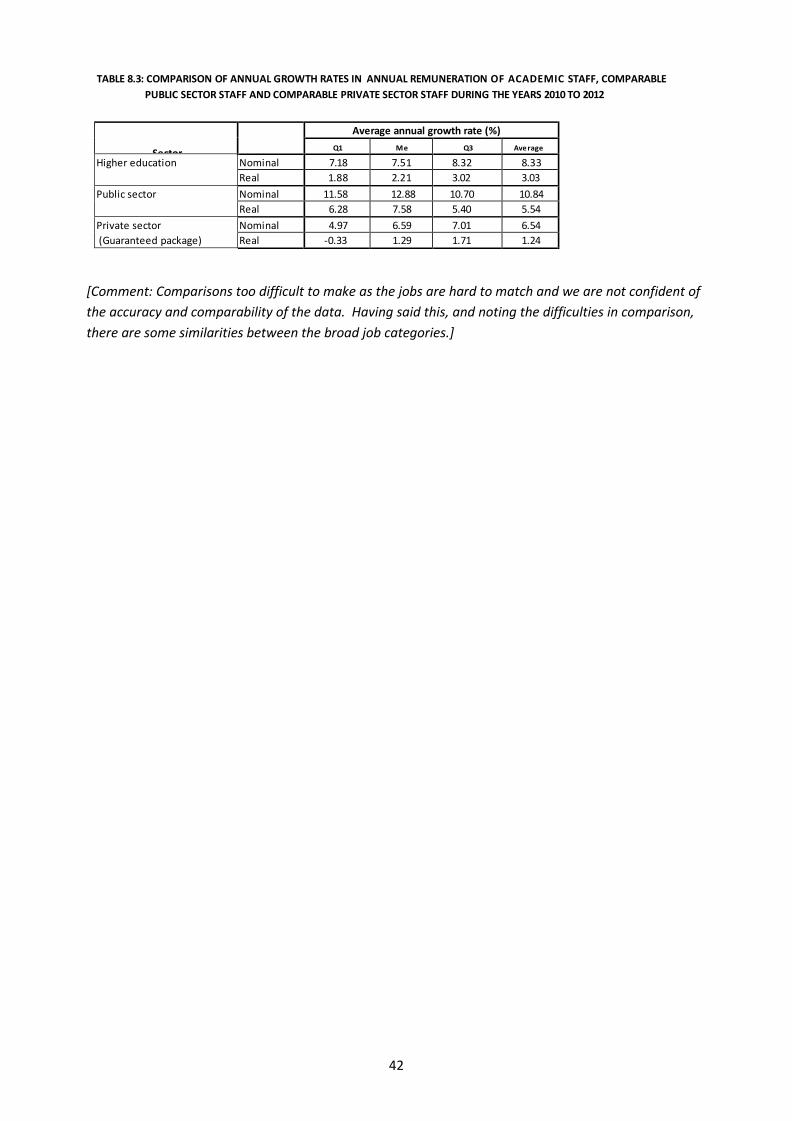
TABLE 8.3: COMPARISON OF ANNUAL GROWTH RATES IN ANNUAL REMUNERATION OF ACADEMIC STAFF, COMPARABLE PUBLIC SECTOR STAFF AND COMPARABLE PRIVATE SECTOR STAFF DURING THE YEARS 2010 TO 2012
Sector
Average annual growth rate (%) Q1 Me Q3 Ave r age
Higher education Nominal 7.18 7.51 8.32 8.33 Real 1.88 2.21 3.02 3.03 Public sector Nominal 11.58 12.88 10.70 10.84 Real 6.28 7.58 5.40 5.54 Private sector Nominal 4.97 6.59 7.01 6.54 (Guaranteed package) Real -0.33 1.29 1.71 1.24
[Comment: Comparisons too difficult to make as the jobs are hard to match and we are not confident of the accuracy and comparability of the data. Having said this, and noting the difficulties in comparison, there are some similarities between the broad job categories.]
42
Addendum to Section 8
Comparison of the total package which includes the guaranteed package and non-guaranteed performance bonuses for the academic and private sectors
After consideration of the summary and full remuneration reports on remuneration of academic staff at South African universities, HESA requested additional information comparing remuneration in the academic and private sectors that included non-guaranteed bonus (short term cash incentives). It was thought that, particularly in the private sector, this component could be a significant and customary part of the total remuneration package.
REMchannel is a ‘rolling’ database of remuneration data and as such does not store historical remuneration data. For that reason data on non-guaranteed bonuses could not be obtained at the same time period (December 2012) as used in the HESA Remuneration report. The report below therefore gives a direct comparison, as at August 2014, of the guaranteed plus non-guaranteed bonus data of the academic and private sectors. Thought was given to attempting to extrapolate back but it was concluded that there were too many variables that have probably changed in the interim.
The information was drawn from the REMchannel® database, as at August 2014. The graphs depict the total annual guaranteed package (used consistently in the body of the main report) and annual values for performance bonuses14 for both the academic and private sectors.
Careful note must be taken that this data reflects the position in August 2014 and cannot be compared directly to the rand values of the summary report which depicts 2012 information. However there is value in the relative comparison between the academic and private sectors which is likely to be similar to the situation in 2012.
Table 8.4 below gives the percentage of staff in receipt of a non-guaranteed short-term cash incentives in the private and academic sector respectively. This does not include share options (REMchannel® does not capture and store this information).
Table 8.4
% staff in receipt of non-guaranteed bonuses Private Academic
P8 / Lec 71,1 17,1 P7 / Sen Lec 74,1 31,2 P 6 / Assoc Prof 79,6 31,9 P5 / Prof 81,8 40,1
Graph 8.4 gives the mean of the (i) academic sector guaranteed package (aca gua mean), (ii) academic non-guaranteed performance bonus (aca bonus mean), (iii) private sector guaranteed package (priv gua mean), and (iv) private sector non-guaranteed performance bonus (priv bonus mean) for the different job levels.
14 Classified as short term non-guaranteed cash incentives. This does not include share options.
43
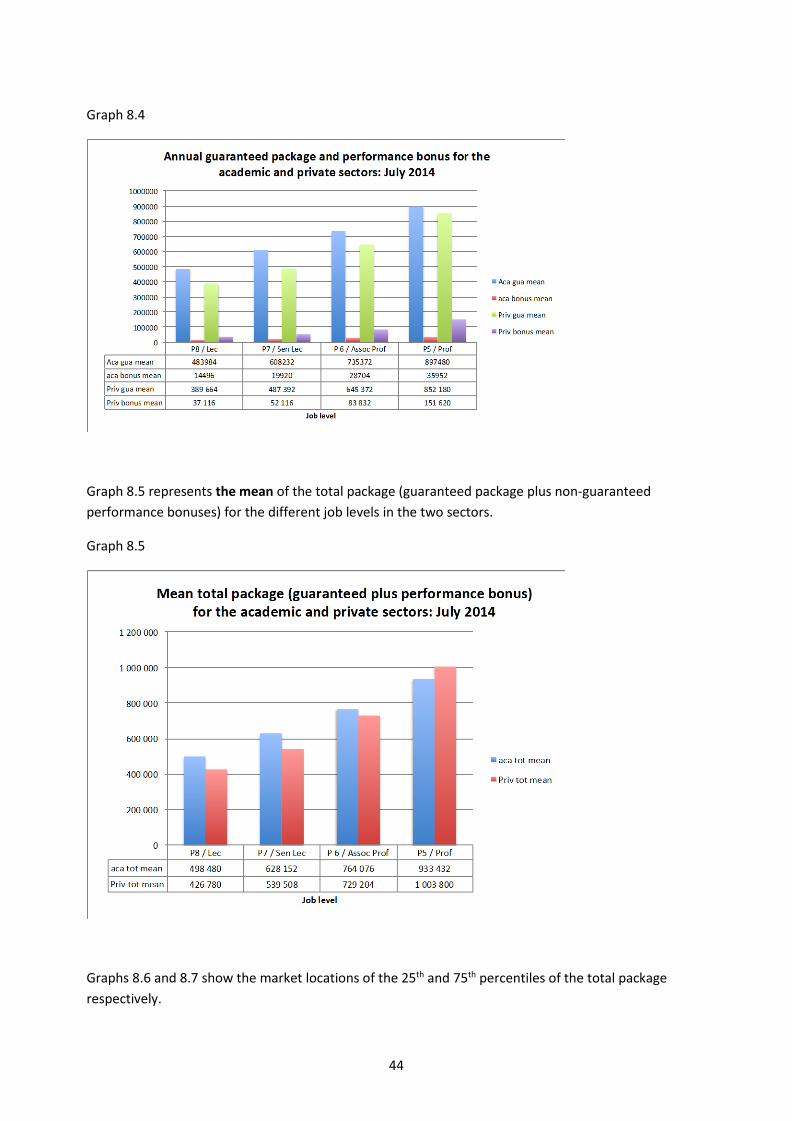
Graph 8.4
Graph 8.5 represents the mean of the total package (guaranteed package plus non-guaranteed performance bonuses) for the different job levels in the two sectors.
Graph 8.5
Graphs 8.6 and 8.7 show the market locations of the 25th and 75th percentiles of the total package respectively.
44
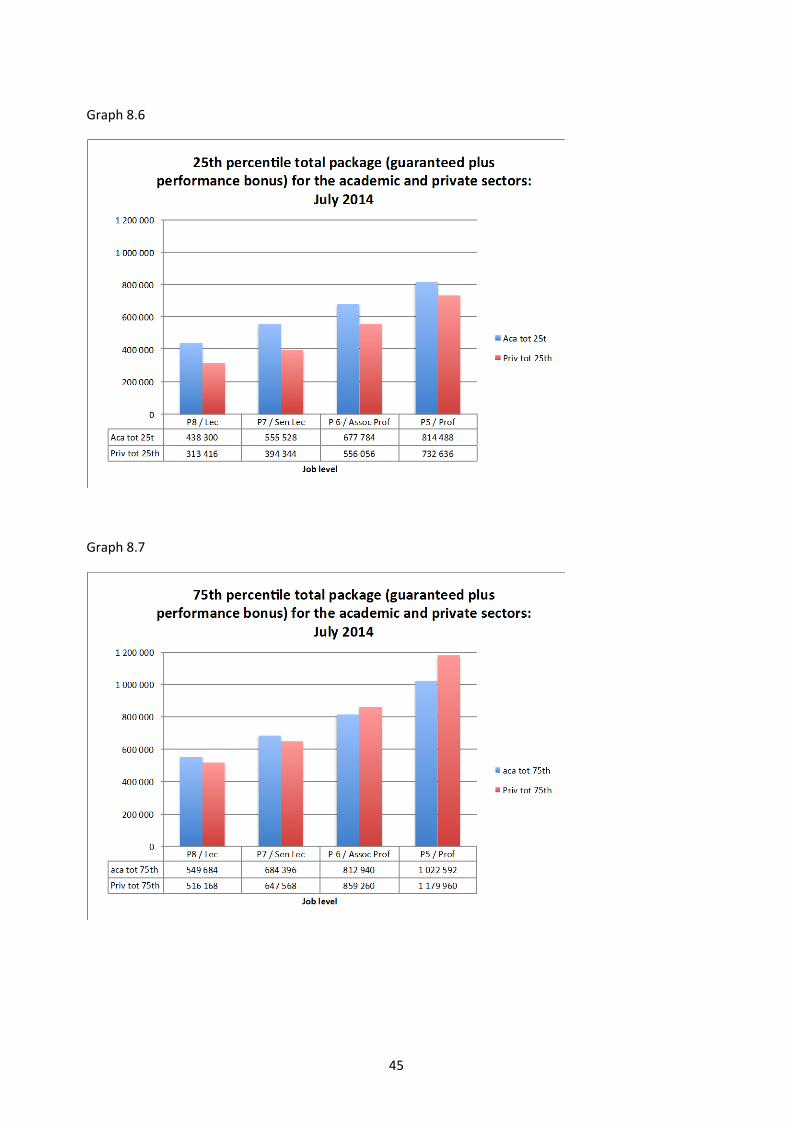
Graph 8.6
Graph 8.7
45
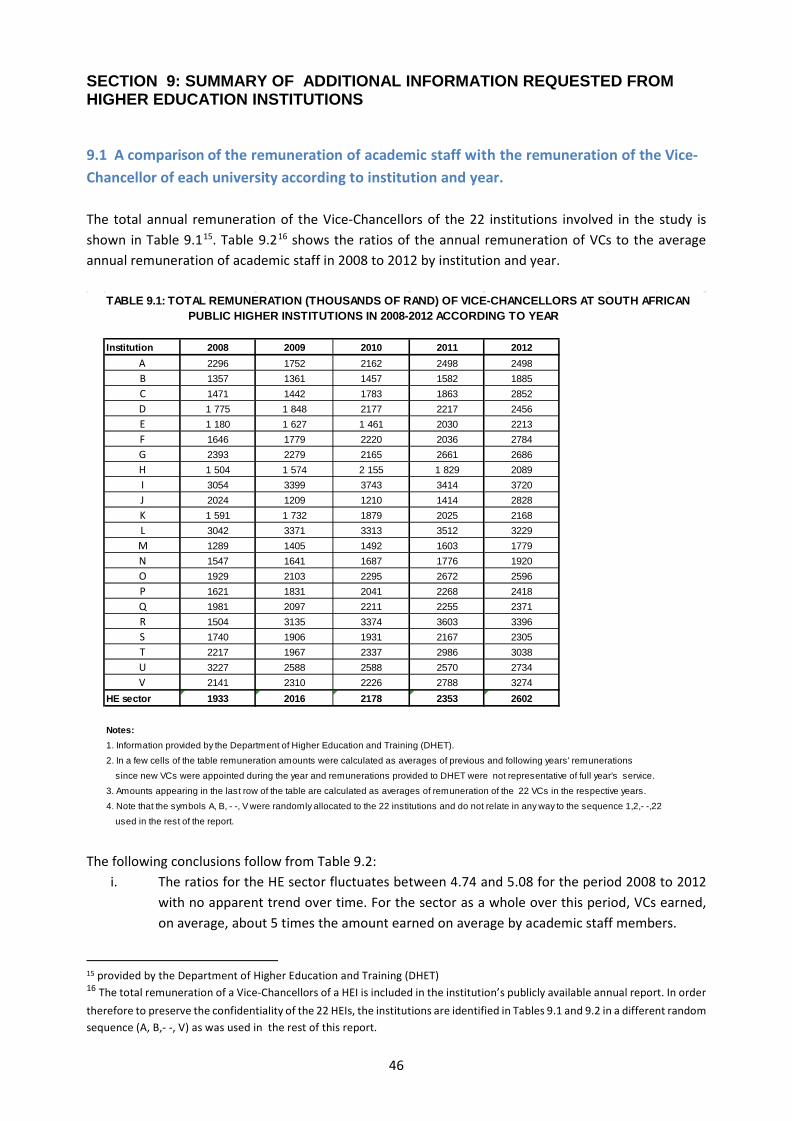
SECTION 9: SUMMARY OF ADDITIONAL INFORMATION REQUESTED FROM HIGHER EDUCATION INSTITUTIONS
9.1 A comparison of the remuneration of academic staff with the remuneration of the Vice-Chancellor of each university according to institution and year. The total annual remuneration of the Vice-Chancellors of the 22 institutions involved in the study is shown in Table 9.115. Table 9.216 shows the ratios of the annual remuneration of VCs to the average annual remuneration of academic staff in 2008 to 2012 by institution and year.
The following conclusions follow from Table 9.2:
i. The ratios for the HE sector fluctuates between 4.74 and 5.08 for the period 2008 to 2012 with no apparent trend over time. For the sector as a whole over this period, VCs earned, on average, about 5 times the amount earned on average by academic staff members.
15 provided by the Department of Higher Education and Training (DHET) 16 The total remuneration of a Vice-Chancellors of a HEI is included in the institution’s publicly available annual report. In order therefore to preserve the confidentiality of the 22 HEIs, the institutions are identified in Tables 9.1 and 9.2 in a different random sequence (A, B,- -, V) as was used in the rest of this report.
TABLE 9.1: TOTAL REMUNERATION (THOUSANDS OF RAND) OF VICE-CHANCELLORS AT SOUTH AFRICAN PUBLIC HIGHER INSTITUTIONS IN 2008-2012 ACCORDING TO YEAR
Institution 2008 2009 2010 2011 2012A 2296 1752 2162 2498 2498B 1357 1361 1457 1582 1885C 1471 1442 1783 1863 2852D 1 775 1 848 2177 2217 2456E 1 180 1 627 1 461 2030 2213F 1646 1779 2220 2036 2784G 2393 2279 2165 2661 2686H 1 504 1 574 2 155 1 829 2089I 3054 3399 3743 3414 3720J 2024 1209 1210 1414 2828K 1 591 1 732 1879 2025 2168L 3042 3371 3313 3512 3229M 1289 1405 1492 1603 1779N 1547 1641 1687 1776 1920O 1929 2103 2295 2672 2596P 1621 1831 2041 2268 2418Q 1981 2097 2211 2255 2371R 1504 3135 3374 3603 3396S 1740 1906 1931 2167 2305T 2217 1967 2337 2986 3038U 3227 2588 2588 2570 2734V 2141 2310 2226 2788 3274
HE sector 1933 2016 2178 2353 2602
Notes: 1. Information provided by the Department of Higher Education and Training (DHET).
2. In a few cells of the table remuneration amounts were calculated as averages of previous and following years' remunerations
since new VCs were appointed during the year and remunerations provided to DHET were not representative of full year's service.
3. Amounts appearing in the last row of the table are calculated as averages of remuneration of the 22 VCs in the respective years.
4. Note that the symbols A, B, - -, V were randomly allocated to the 22 institutions and do not relate in any way to the sequence 1,2,- -,22
used in the rest of the report.
46
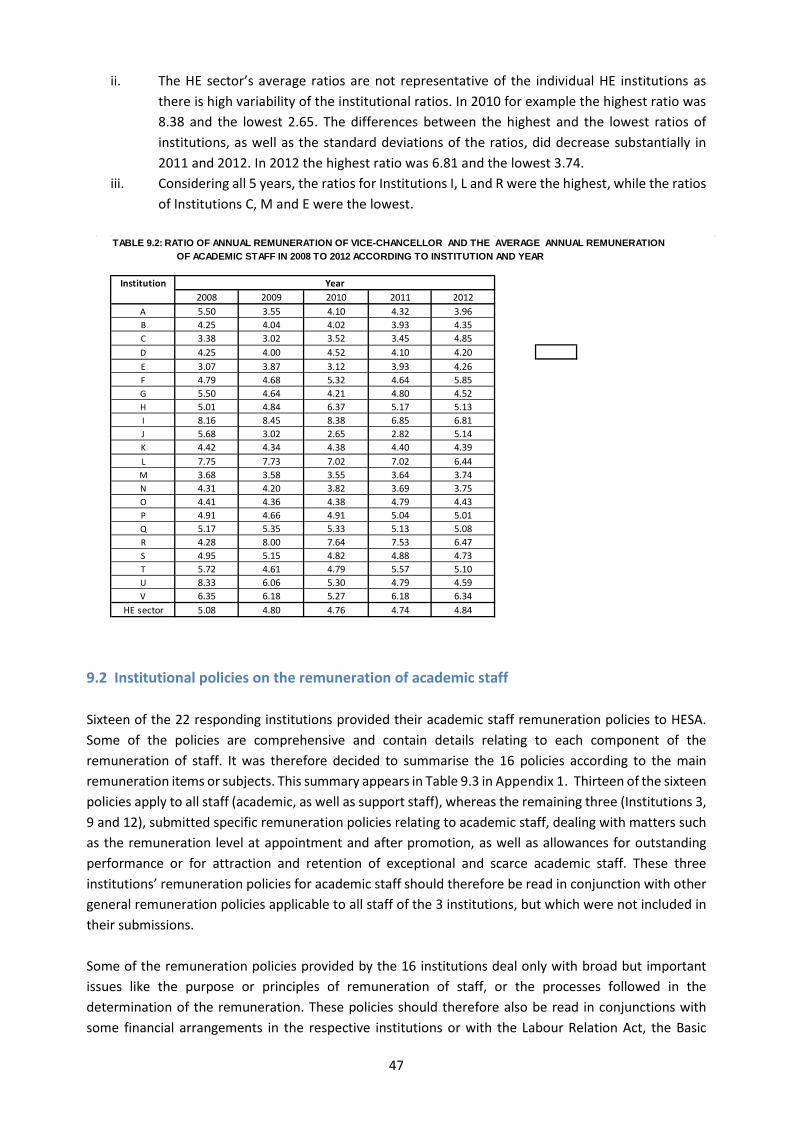
ii. The HE sector’s average ratios are not representative of the individual HE institutions as there is high variability of the institutional ratios. In 2010 for example the highest ratio was 8.38 and the lowest 2.65. The differences between the highest and the lowest ratios of institutions, as well as the standard deviations of the ratios, did decrease substantially in 2011 and 2012. In 2012 the highest ratio was 6.81 and the lowest 3.74.
iii. Considering all 5 years, the ratios for Institutions I, L and R were the highest, while the ratios of Institutions C, M and E were the lowest.
9.2 Institutional policies on the remuneration of academic staff Sixteen of the 22 responding institutions provided their academic staff remuneration policies to HESA. Some of the policies are comprehensive and contain details relating to each component of the remuneration of staff. It was therefore decided to summarise the 16 policies according to the main remuneration items or subjects. This summary appears in Table 9.3 in Appendix 1. Thirteen of the sixteen policies apply to all staff (academic, as well as support staff), whereas the remaining three (Institutions 3, 9 and 12), submitted specific remuneration policies relating to academic staff, dealing with matters such as the remuneration level at appointment and after promotion, as well as allowances for outstanding performance or for attraction and retention of exceptional and scarce academic staff. These three institutions’ remuneration policies for academic staff should therefore be read in conjunction with other general remuneration policies applicable to all staff of the 3 institutions, but which were not included in their submissions. Some of the remuneration policies provided by the 16 institutions deal only with broad but important issues like the purpose or principles of remuneration of staff, or the processes followed in the determination of the remuneration. These policies should therefore also be read in conjunctions with some financial arrangements in the respective institutions or with the Labour Relation Act, the Basic
TABLE 9.2: RATIO OF ANNUAL REMUNERATION OF VICE-CHANCELLOR AND THE AVERAGE ANNUAL REMUNERATION OF ACADEMIC STAFF IN 2008 TO 2012 ACCORDING TO INSTITUTION AND YEAR
2008 2009 2010 2011 2012A 5.50 3.55 4.10 4.32 3.96B 4.25 4.04 4.02 3.93 4.35C 3.38 3.02 3.52 3.45 4.85D 4.25 4.00 4.52 4.10 4.20E 3.07 3.87 3.12 3.93 4.26F 4.79 4.68 5.32 4.64 5.85G 5.50 4.64 4.21 4.80 4.52H 5.01 4.84 6.37 5.17 5.13I 8.16 8.45 8.38 6.85 6.81J 5.68 3.02 2.65 2.82 5.14K 4.42 4.34 4.38 4.40 4.39L 7.75 7.73 7.02 7.02 6.44M 3.68 3.58 3.55 3.64 3.74N 4.31 4.20 3.82 3.69 3.75O 4.41 4.36 4.38 4.79 4.43P 4.91 4.66 4.91 5.04 5.01Q 5.17 5.35 5.33 5.13 5.08R 4.28 8.00 7.64 7.53 6.47S 4.95 5.15 4.82 4.88 4.73T 5.72 4.61 4.79 5.57 5.10U 8.33 6.06 5.30 4.79 4.59V 6.35 6.18 5.27 6.18 6.34
HE sector 5.08 4.80 4.76 4.74 4.84
Institution Year
47
Conditions of Employment Act and the SA Tax Legislation. As indicated in the second last row of Table 9.3, most of the remuneration policies are recent or are presently under review. There was concern about the quality of the submissions of the remuneration policies by some institutions. Many institutions do not have a consolidated official remuneration policy. Some institutions reporting their policies regarding specific allowances, do not reflect any payment in respect of these allowances in their remuneration data for 2008 to 2012.
Summary of information submitted by HE institutions regarding the retention of master and doctoral graduates as academic staff members Six responses were received from HE institutions regarding this topic, and the information not very helpful. A summary of the other 6 responses is given in Appendix 2.
Summary observations: Although the number of responses was low, the following could be concluded from the information obtained:
i. It is common knowledge that senior post-graduate students are encouraged by many universities to take up academic positions (mostly part-time) while studying. See for example the response of Institution 22. There is, however, apparently no tracking studies being done on the retention of these students as full-time academic staff members after graduation. It is not clear whether incentives for full-time appointment or strategic plans to ensure such full-time appointment of master and doctoral graduates are part of institutional policies of HEIs. Judging from the responses of some institutions, policy on the retention of academic staff members with scarce or critical skills is regarded as more important.
ii. In the cases of the three institutions which had performed limited tracking studies, it is a matter of great concern that the number of post graduate students which graduated and are already employed as academic staff, or are employed directly after graduation as academic staff, is extremely low.
Comment With hindsight it is probable that we have asked the wrong questions.
1. For most universities a PhD is an entry requirement, so masters graduates who plan academic careers would go onto doctoral studies not employment (therefore calculating the proportion of master students employed is not relevant)
2. The norm these days is for PhD graduates to do a postdoc and the preference of many universities and doctoral graduates is to do a postdoc at a different university to that where they studied for their PhD, so again non-retention of these graduates would not be a mark of failure.
3. Most jobs are advertised and recruitment takes place from the whole country and internationally, not just from ones own graduates.
So the starting point actually is: “Is there a shortage of PhD applicants for positions and where are posts being filled from?”
48
Summary of information submitted by HE institutions on the involvement of organised labour organisations in the determination of the remuneration of academic staff Ten responses were received from HE institutions regarding this topic. A summary of these responses is given below: Institution 2 The institution deals with annual general increases in accordance with its salary determination model and negotiates such increases with the two recognised unions at the joint bargaining forum. The unions thus have a role to play in determining the remuneration of academic staff on an institutional level, but not on an individual level, e.g. during negotiations with a candidate in the selection and appointment process.
Institution 3 Both labour unions at the institution are involved with the annual salary adjustments (i.e. structural adjustments, benefits, etc.).
Institution 4 The institutional bargaining forum, consisting currently of the management negotiating committee and two labour unions, deals with collective bargaining in respect of the remuneration of all employees on post grades P5-P18.
Institution 6 Trade unions play no role in the determination of academic salaries at the institution.
Institution 7 Organised labour unions do not play a role in the determination of remuneration of academic staff at the institution other than their presence in interviews for the appointment of staff as observers to ensure the application of policy and procedures.
Institution 9 The institution has a recognition agreement with labour union as regards the representation of academic staff. When this union has 50%+1 representation of its constituency (permanent academic and support staff grades 6 to 17), it achieves bargaining rights. This includes bargaining on annual and market salary adjustments and the remuneration policy and protocols. The unions were also very involved in the market adjustments (right-sizing) arising from an investigation into remuneration at the institution done a few years ago. Should the union not have bargaining rights, the institution would still consult with the union about these matters.
Institution 11 The institution has an institutional bargaining forum on which management and organised labour unions are represented. Academic and support staff's yearly cost of living allowance are negotiated in this forum. During the year assumptions are made on the average on the average CPI for a particular year. During the year preceding the year in which the wage negotiations will commence, an average of eight meetings are scheduled during January to 15 April solely dedicated to wage negotiations. The wage negotiation process is called COLA (Cost Of Living Adjustment). The aim is to finalise these negotiations in time for implementation on 1 April every year. If the deadline of 1 April is not met, a clause in the recognition agreement makes provision to backdate the increase. Institution 12
49
The institution has a representative academics' union which negotiates together with management on the formulation of the academic pay policy and negotiates each year on salary and non-salary demands. Institution 18 The institution has established an institutional bargaining forum where management and organised labour discuss and reach agreements on a wide range of issues that affect staff, including annual salary increment for all categories of staff, including academics from Peromnes post level 17 up to Peromnes post level 5 .
Institution 22 There are three unions at the institution, with which recognition agreements have yet to be concluded. Salaries are negotiated with them – one union particularly for academic salaries. Recently, the unions have been involved in salary benchmarking processes aimed at improving transparency and leading to more focused negotiations.
Summary observations The number of responses to the request for information in respect of the role of organised labour in the determination of the remuneration of academic staff was low. One institution indicated that trade unions play no role in determining the remuneration of academics, while another indicated that the unions’ role is restricted to observer status in job interviews with applicants to ensure that remuneration policy and appointment procedures are upheld. As far as the rest of the responding institutions are concerned the trends in the involvement of unions are as follows:
i. With the exception of the remuneration of members of top management, unions are annually involved in institutional remuneration bargaining forums as far as the remuneration of all staff is concerned. Academic remuneration is not handled separately in these bargaining forums but forms part of determining the remuneration of all staff members.
ii. The negotiations involving organised labour deal mostly with the structural adjustments in remuneration, annual wage increases and the type of benefits/allowances included in packages of staff. They do not cover the remuneration of individual staff members.
iii. Apart from one institution where a union only obtain bargaining rights when representing 50%+1 of staff members (academic plus support), the other institutions did not give any indication of required level of representation to be granted formal recognition rights as a labour union for the purposes of participating in negotiations on improvement of conditions of service.
50
SECTION 10: RECOMMENDATIONS
Proposals on the remuneration of academic staff addressed to universities, HESA and the government, recognising the important principle of institutional autonomy
Although this study is exploratory by nature, the numbers of staff members included in this study from the respective three sectors, namely 14 910 academic staff members, 114 012 public sector staff members, and 229 896 private sector staff members in 2012, ensure that the results of the analyses, as set out in this report, as well as the implications of the results, should be viewed as very important for each HE institution, as well as in the management of the whole HE sector. In the light of this the following conclusions and recommendations are made:
Conclusion 1: The analyses of the four measures of locality of the remuneration of academic staff in 2012, namely Q1, Me, Q3 and the average, point to the fact that the remuneration of academic staff in the senior ranks (Ranks 1-3) was in 2012 better than the remuneration of comparable staff in the public and private sectors.
Recommendation 1: Conclusion 1 is comforting as far as the retention of senior academic staff members is concerned. HE institutions should, however, be aware of the possible implications of the fierce competition between institutions for the services of the best researchers and consequently the very high remuneration of these staff members, as indicated, for example, in the scatterplots of Figure 5.4. This competition could enhance academic excellence at some HE institutions, but could also dampen the research spirit at other HE institutions. Eventually it could have a destabilising effect on the HE system.
Conclusion 2: The analyses of the four measures of locality of the remuneration of academic staff in 2012, namely Q1, Me, Q3 and the average, point to the fact that the remuneration of academic staff was better than the comparable staff in the private sector, marginally better for academic staff ranks 1-3 than comparable staff in the public sector, but far less, especially on the introductory levels of academic ranks 4 and 5, than the remuneration of comparable staff in the public sector. Obviously, this last conclusion hampers the attractiveness of an academic career for young graduates, especially graduates on the master’s and doctoral levels. This was pointed out by the (very) limited number of institutional studies on the retention of master and doctoral graduates as academic staff.
Recommendation 2.1: HE institutions will have to improve the conditions of service of lecturers and junior lecturers drastically in order to attract the best young graduates to an academic career.
Recommendation 2.2: Each HE institution should conduct on a regular basis studies highlighting not only changes in the retention rate of graduates (especially on the master’s and doctoral levels) as academic staff, but also all the stumbling blocks (not only low remuneration) in the retention of young graduates as academics. Section 9.3 clearly shows a lack of information regarding this very contentious problem.
Conclusion 3: The remuneration-age profiles for male and female academic staff in 2012, as depicted in Figure 5.5, show a widening gap between the earnings of male and female academic staff, especially from the age of about 30 years. This is a phenomenon apparently also present in the private sector. It was established by analysis that there was no direct discrimination against female academic staff in 2012 as far as remuneration is concerned. However, as a result of many possible factors, which were discussed in this report (See e.g. Section 10.3.7) female staff are under-represented in the higher academic ranks and over-represented in the lower academic ranks, resulting in lower remuneration levels.
Recommendation 3: HE institutions should not accept the situation as outline in Conclusion 3 as a given fact of life. This issue should be studied on the institutional level, and if needed, measures should be taken to rectify this situation, or at least to reduce the gap in the remuneration-age profiles of male and female
51
academics.
Conclusion 4: The difference between the remuneration-age profiles of White and Indian academics on the one hand and African and Coloured academics on the other hand in 2012, as depicted in Figure 5.6, is also a matter of concern, even though analysis also shows it is not the direct consequence of discriminatory practices. These differences, which also seem to widen with increasing age, are the result of African and Coloured academics being under-represented in the higher academic ranks and over-represented in the lower academic ranks, especially as far as the older (previously disadvantaged) African and Coloured academics are concerned.
Recommendation 4: The DHET is at present considering proposals by HESA to enhance the development of a new generation of academics. The implementation of these proposals will help to close the differences in remuneration levels of academics in the different race groups, especially in the younger age groups. Additional funds, however, will be needed for the implementation of these proposals. Although the state should contribute, it is recommended that each HE institution should become involved in this important joint initiative of HESA and the DHET and that all HEIs consider to annually allocate earmarked funds for this purpose.
SECTION 11: REFERENCES A full set of references are laid out in the full report and will not be repeated in the summary
52

APPENDIX 1
Table 3.1 Job grades for three job evaluation systems TABLE 3.1: APPROXIMATE RELATIONSHIPS BETWEEN SOME JOB EVALUATION SYSTEMS
PATERSON GRADES
PATERSON BANDS PEROMNES GRADES
EQUATE GRADES DECISION LEVEL
F5
FU
1++
Top Management
Board Level
Policy Making Decisions
F4 1+
F3 1+
F2 FL
1 16
F1 1 16
E5
EU
2 16
Senior Management,
Heads of Major Functions Programming Decisions
E4 2 16
E3 3 15
E2 EL
3 15
E1 4 14
D5
DU
4 14
Professionally Qualified and Experienced Specialists,
Middle Management Interpretative Decisions
D4 5 13
D3 5 13
D2 DL
6 12
D1 7 11
C5
CU
7 11 Skilled, Technical and Academically Qualified Employees
Junior Specialists
Supervisors, Foremen,
Superintendents,
Routine or Process Decisions
C4 8 10
C3 9 9
C2 CL
10 8
C1 11 7
B5
BU
11 7
Discretionary/Operative Decisions
B4 12 6
B3 13 5
B2 BL
13 5
B1 14/15 4
A3
A
16 3
Defined Decisions A2 17 2
A1 18/19 1
53
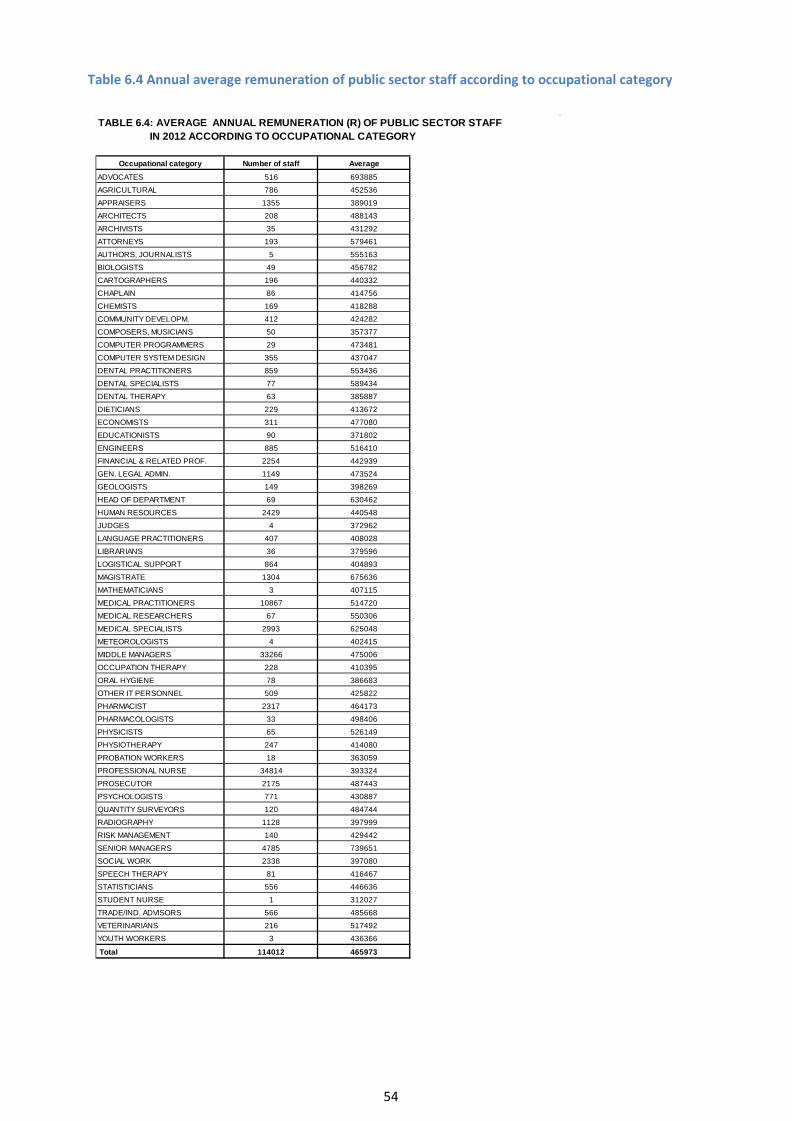
Table 6.4 Annual average remuneration of public sector staff according to occupational category
TABLE 6.4: AVERAGE ANNUAL REMUNERATION (R) OF PUBLIC SECTOR STAFF IN 2012 ACCORDING TO OCCUPATIONAL CATEGORY
Occupational category Number of staff Average
ADVOCATES 516 693885
AGRICULTURAL 786 452536
APPRAISERS 1355 389019
ARCHITECTS 208 488143
ARCHIVISTS 35 431292
ATTORNEYS 193 579461
AUTHORS, JOURNALISTS 5 555163
BIOLOGISTS 49 456782
CARTOGRAPHERS 196 440332
CHAPLAIN 86 414756
CHEMISTS 169 418288
COMMUNITY DEVELOPM. 412 424282
COMPOSERS, MUSICIANS 50 357377
COMPUTER PROGRAMMERS 29 473481
COMPUTER SYSTEM DESIGN 355 437047
DENTAL PRACTITIONERS 859 553436
DENTAL SPECIALISTS 77 589434
DENTAL THERAPY 63 385887
DIETICIANS 229 413672
ECONOMISTS 311 477080
EDUCATIONISTS 90 371802
ENGINEERS 885 516410
FINANCIAL & RELATED PROF. 2254 442939
GEN. LEGAL ADMIN. 1149 473524
GEOLOGISTS 149 398269
HEAD OF DEPARTMENT 69 630462
HUMAN RESOURCES 2429 440548
JUDGES 4 372962
LANGUAGE PRACTITIONERS 407 408028
LIBRARIANS 36 379596
LOGISTICAL SUPPORT 864 404893
MAGISTRATE 1304 675636
MATHEMATICIANS 3 407115
MEDICAL PRACTITIONERS 10867 514720
MEDICAL RESEARCHERS 67 550306
MEDICAL SPECIALISTS 2993 625048
METEOROLOGISTS 4 402415
MIDDLE MANAGERS 33266 475006
OCCUPATION THERAPY 228 410395
ORAL HYGIENE 78 386683
OTHER IT PERSONNEL 509 425822
PHARMACIST 2317 464173
PHARMACOLOGISTS 33 498406
PHYSICISTS 65 526149
PHYSIOTHERAPY 247 414080
PROBATION WORKERS 18 363059
PROFESSIONAL NURSE 34814 393324
PROSECUTOR 2175 487443
PSYCHOLOGISTS 771 430887
QUANTITY SURVEYORS 120 484744
RADIOGRAPHY 1128 397999
RISK MANAGEMENT 140 429442
SENIOR MANAGERS 4785 739651
SOCIAL WORK 2338 397080
SPEECH THERAPY 81 416467
STATISTICIANS 556 446636
STUDENT NURSE 1 312027
TRADE/IND. ADVISORS 566 485668
VETERINARIANS 216 517492
YOUTH WORKERS 3 436366
Total 114012 465973
54
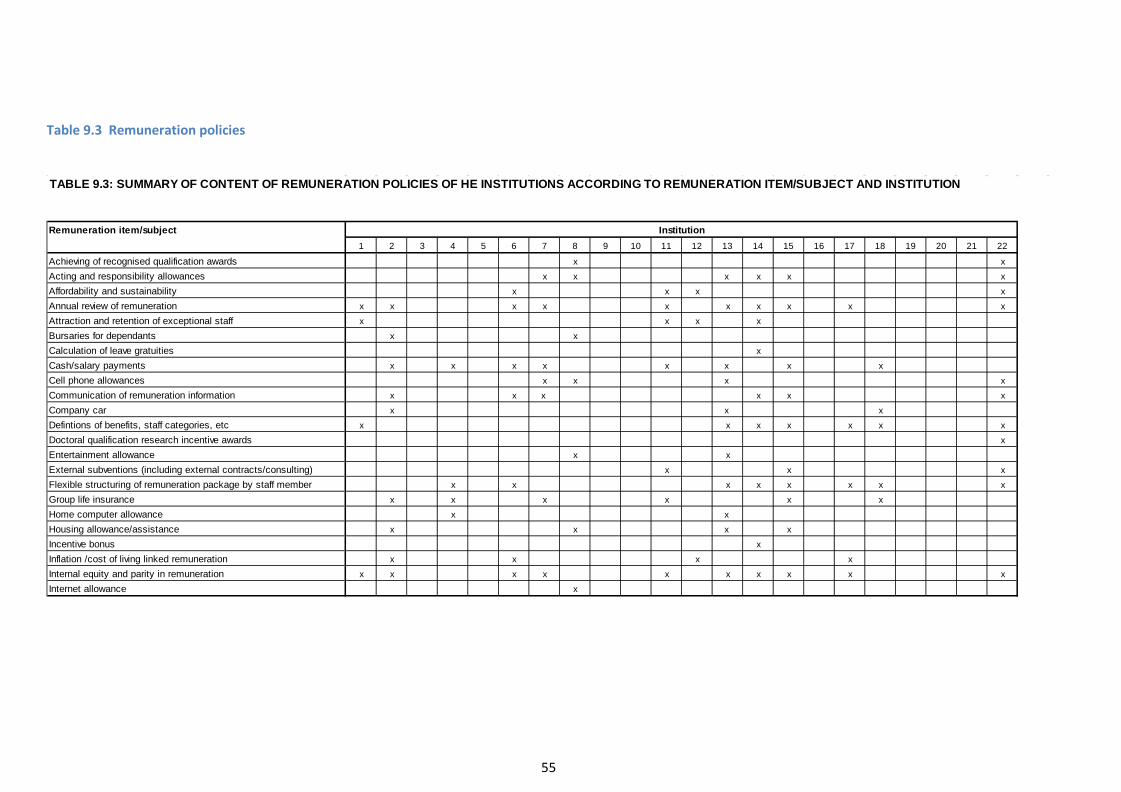
Table 9.3 Remuneration policies
TABLE 9.3: SUMMARY OF CONTENT OF REMUNERATION POLICIES OF HE INSTITUTIONS ACCORDING TO REMUNERATION ITEM/SUBJECT AND INSTITUTION
Remuneration item/subject1 2 3 4 5 6 7 8 9 10 11 12 13 14 15 16 17 18 19 20 21 22
Achieving of recognised qualification awards x x
Acting and responsibility allowances x x x x x x
Affordability and sustainability x x x x
Annual review of remuneration x x x x x x x x x x
Attraction and retention of exceptional staff x x x x
Bursaries for dependants x x
Calculation of leave gratuities x
Cash/salary payments x x x x x x x x
Cell phone allowances x x x x
Communication of remuneration information x x x x x x
Company car x x x
Defintions of benefits, staff categories, etc x x x x x x x
Doctoral qualification research incentive awards x
Entertainment allowance x x
External subventions (including external contracts/consulting) x x x
Flexible structuring of remuneration package by staff member x x x x x x x x
Group life insurance x x x x x x
Home computer allowance x x
Housing allowance/assistance x x x x
Incentive bonus x
Inflation /cost of living linked remuneration x x x x
Internal equity and parity in remuneration x x x x x x x x x x
Internet allowance x
Institution
55
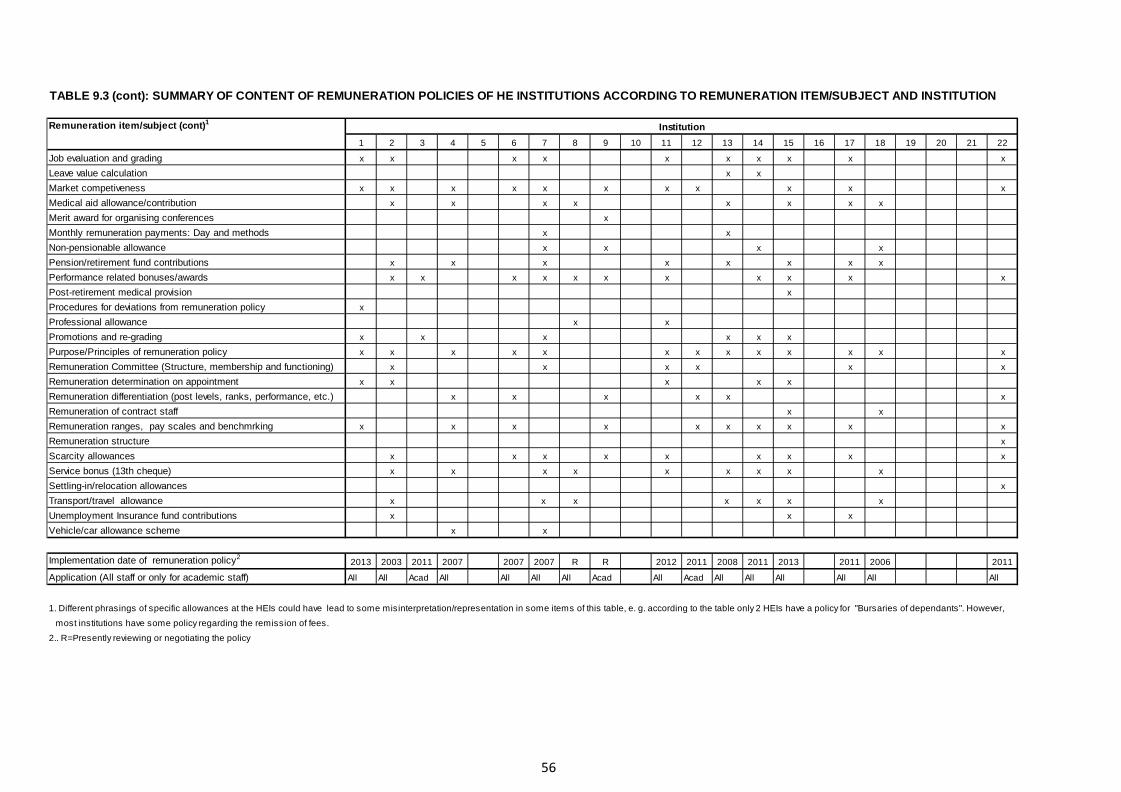
TABLE 9.3 (cont): SUMMARY OF CONTENT OF REMUNERATION POLICIES OF HE INSTITUTIONS ACCORDING TO REMUNERATION ITEM/SUBJECT AND INSTITUTION
Remuneration item/subject (cont)1
1 2 3 4 5 6 7 8 9 10 11 12 13 14 15 16 17 18 19 20 21 22
Job evaluation and grading x x x x x x x x x x
Leave value calculation x x
Market competiveness x x x x x x x x x x x
Medical aid allowance/contribution x x x x x x x x
Merit award for organising conferences x
Monthly remuneration payments: Day and methods x x
Non-pensionable allowance x x x x
Pension/retirement fund contributions x x x x x x x x
Performance related bonuses/awards x x x x x x x x x x x
Post-retirement medical provision x
Procedures for deviations from remuneration policy x
Professional allowance x x
Promotions and re-grading x x x x x x
Purpose/Principles of remuneration policy x x x x x x x x x x x x x
Remuneration Committee (Structure, membership and functioning) x x x x x x
Remuneration determination on appointment x x x x x
Remuneration differentiation (post levels, ranks, performance, etc.) x x x x x x
Remuneration of contract staff x x
Remuneration ranges, pay scales and benchmrking x x x x x x x x x x
Remuneration structure x
Scarcity allowances x x x x x x x x x
Service bonus (13th cheque) x x x x x x x x x
Settling-in/relocation allowances x
Transport/travel allowance x x x x x x x
Unemployment Insurance fund contributions x x x
Vehicle/car allowance scheme x x
Implementation date of remuneration policy22013 2003 2011 2007 2007 2007 R R 2012 2011 2008 2011 2013 2011 2006 2011
Application (All staff or only for academic staff) All All Acad All All All All Acad All Acad All All All All All All
1. Different phrasings of specific allowances at the HEIs could have lead to some misinterpretation/representation in some items of this table, e. g. according to the table only 2 HEIs have a policy for "Bursaries of dependants". However,
most institutions have some policy regarding the remission of fees.
2.. R=Presently reviewing or negotiating the policy
Institution
56
Appendix 2
Summary of information regarding the retention of master and doctoral graduates as academic staff members
Institution 1 The institution submitted their Retention of scarce/critical skills policy which forms part of the Institutional Regulatory Code (IRC) (Policies, Procedure, Rules, etc.). The policy focussed on specific academic staff members with very scarce and/or critical skills but did not address the broader issue of the retention of master and doctoral graduates of the institution by appointing them as academic staff members at the institution or, in the case where they are already academic staff members, ensure the retention of their services once they have obtained masters and/or doctoral qualifications.
Institution 2 This institution studied the population of 154 master/doctoral graduates for the period 2008-2012. The institution concluded that 54 of these graduates had been employed by the institution in an academic capacity of which 33 were employed on a full-time basis. Of these 33 graduates 20 were already employed as academics at the time of graduation, while 10 (9 masters and 1 doctoral) were appointed only after having completed their master/doctoral studies. The other 3 had left the service of the institution before graduating.
Institution 9 This institution expressed the number of students that obtained a post graduate qualification in year n and were permanently employed as an academic staff member in year n+1 as a ratio of the total number as post graduate qualifications awarded in year n for 21 years between 1973 and 2012. Combining the results of the analyses for the 21 years the overall annual ratio for these years is 0.004 or 0.4%. This means that this institution over the past 40 years retained only 4 out of every 1000 students graduating on the post graduate level as permanent academic staff members.
Institution 14 This institution studied all new academic staff appointments for the years 2009 to 2011. They found that in the case of 5 new appointments during these 3 years the appointed staff members obtained a Masters qualification, and 1 obtained a doctoral qualification, in the year preceding their appointments. Although, as a result of methodological differences, the results of this analysis cannot be compared directly with the analysis made by Institutions 2 and 9, the results also suggest a very low retention rate of senior post graduate graduates as academic staff members.
Institution 18 This institution indicated that no formal policy regarding the retention of masters and doctoral graduates as academics exists at the institution. The institution, however, is currently busy with the development of policy on the retention of academic staff members with scarce skills.
Institution 22 This institution indicated that master/doctoral students are encouraged to apply for academic positions at the following levels: associate lecturer, associated researcher and professional assistant. These positions may only be advertised internally.
57