Remuneration and Attitudes Survey 2019
24
Remuneration and Attitudes Survey 2019 Chartered Professionals PROPERTY I LAND I CONSTRUCTION 2019
Transcript of Remuneration and Attitudes Survey 2019

1 SCSI REMUNERATION AND ATTITUDES SURVEY 2019
Remuneration and Attitudes Survey 2019Chartered ProfessionalsPROPERTY I LAND I CONSTRUCTION
2019
Remuneration and Attitudes Survey 2019
Chartered ProfessionalsPROPERTY I LAND I CONSTRUCTION
Contents
ForewordKey HighlightsOur Survey results Profile of respondents 2019 Surveying salaries - Size of firm - By discipline - Dublin - Outside of Dublin - Salary review and benefits Surveying career for all genders Outlook on the future
Research methodology & contacts
i
iii
1
2
4
4
5
6
6
7
9
10
12
i SCSI REMUNERATION AND ATTITUDES SURVEY 2019
vv
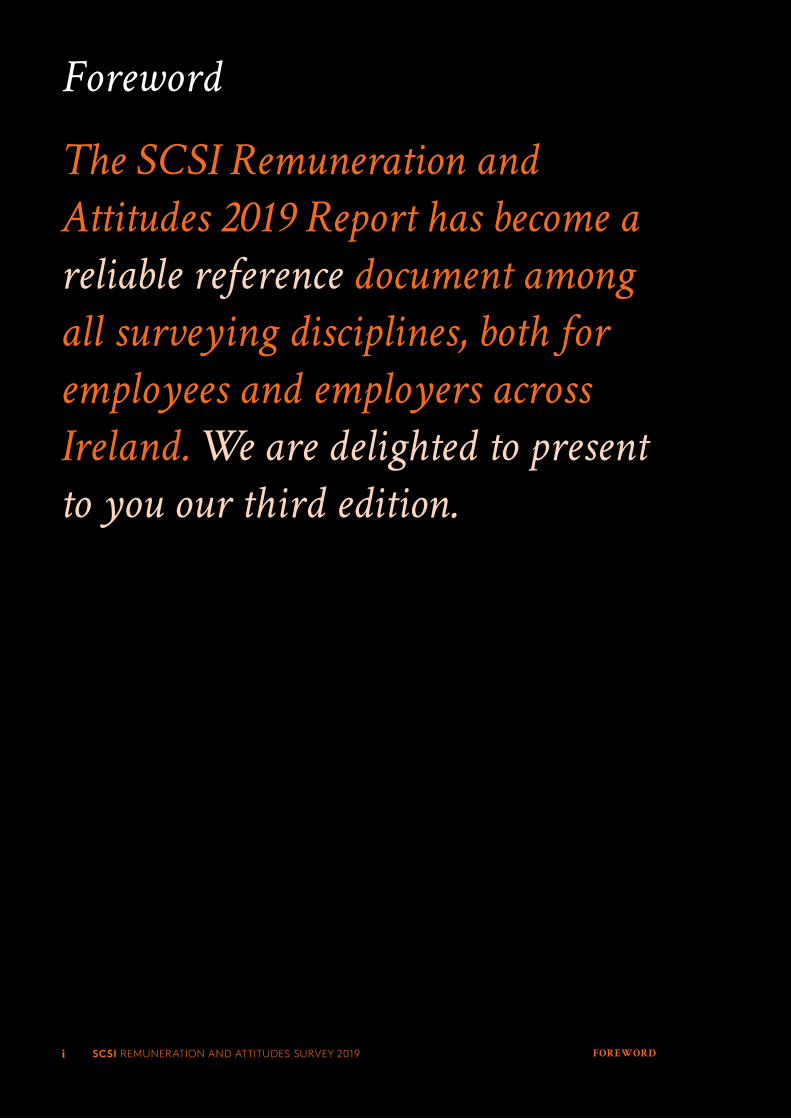
The SCSI Remuneration and
Attitudes 2019 Report has become a
reliable reference document among
all surveying disciplines, both for
employees and employers across
Ireland. We are delighted to present
to you our third edition.
i SCSI REMUNERATION AND ATTITUDES SURVEY 2019 FOREWORD
Foreword

ii SCSI REMUNERATION AND ATTITUDES SURVEY 2019
Activity in the property and construction sectors remain positive with members reporting continued demand for services across most of the country. Businesses outside our major urban centres, particularly smaller businesses, continue to report challenging trading conditions as local investment and local trade is still lagging expectations.
Set against this backdrop, our report looks at median salary levels in Dublin and the rest of the country. Not surprisingly, Dublin salaries attract a premium of approximately €11,000. This is obviously a result of the higher accommodation costs and general inflationary costs of living in the capital.
The number of school-leavers considering property, land and construction surveying courses is on the rise according to the latest CAO results, as knowledge of opportunities in the sectors spread and they are seen as attractive career choices once again. Our ‘Employment Opportunities and Future Skills Requirements for Surveying Professions Report 2018 – 2021’ maps the growing need for surveying professionals due to increased activity levels and pent-up demand for professionals across the board. We anticipate that these reports will successfully highlight the significant benefits of a career in surveying, especially to school-leavers.
It is hoped that the next generation of surveyors will help drive greater gender diversity within the profession. Membership data for the Society shows that female members (Fellows, Professionals, Associates) is at 20% of total membership. The regression analysis of the survey data found that there is equal pay for equal work – as is legally required. According to the survey results, the profile of women in our sector shows that there is less participation in senior roles. The Society believes that all members and firms should seek to encourage more diversity of backgrounds for all staff including on boards and leadership teams. Making our careers as attractive as possible for future talent is a primary focus for SCSI. Looking at recent data of new members to SCSI, we are seeing slight increases in the proportion of female participation in surveying, with new female members representing 28% of the total intake compared with a 80:20 male: female ratio of existing members.
Looking at other areas in the report, satisfaction levels among our membership is relatively high with 92% of members indicating that they are satisfied in their job. The attractiveness of career progression and security of work are two main areas of interest to employees outside of salary expectations. Remote working is becoming a more significant feature in many roles and is likely to become an increasing trend.
We must continue to focus on these benefits to ensure adequate promotion of our courses and careers in order to attract greater numbers of entrants into our profession.
Thank you to all members for taking the time to complete this and previous surveys. Your
continued support and commitment is acknowledged and appreciated.
FOREWORD
PRESIDENT

iii SCSI REMUNERATION AND ATTITUDES SURVEY 2019
National
Median Salary
Each step up in
Seniority earns an
additional
Balancing the
trade-offs –
big vs small firms
per annum (+/- €4,200) per annum
€70,000
€7,500
€8,700
Median salary
in Dublin
Premium on basic
salaries for those
based in Dublin
Each year of
experience earns
an increase of
Median salary
outside of Dublin
€74,375
€11,400 €800
€61,760
Bigger better?
– each jump in size (e.g. micro to small, medium to large) increases salary by
Key Highlights
iii KEY HIGHLIGHTSSCSI REMUNERATION AND ATTITUDES SURVEY 2019

iv SCSI REMUNERATION AND ATTITUDES SURVEY 2019
It’s not all
about pay…
73%
85% 51%
57%
92%1
2
3
expect to receive a
salary increase in
next 12 months
of Surveyors would
recommend their
profession to
school leavers
of firms are
intending to increase
their workforce
received an increase
in previous
12 months
Median duration
with employer
4 YEARS
of Surveyors are satisfied in their job
Salary
Job Security
Career Progression
Top 3 employment
benefits
iv KEY HIGHLIGHTSSCSI REMUNERATION AND ATTITUDES SURVEY 2019

1 SCSI REMUNERATION AND ATTITUDES SURVEY 2019
Residential Lettings
Minerals Surveying
Residential Property Management
Facilities Management
Quantity Surveying
Commercial Property Manager
General Property Practice
Valuation Surveying
Geomatics Surveying
Estate Agency
Asset Manager
Project Management
Building Surveying
114
0
9
4
66 40
3
24
4
6
7
OUR SURVEY RESULTS
Profile of respondentsOUR SURVEY RESULTS
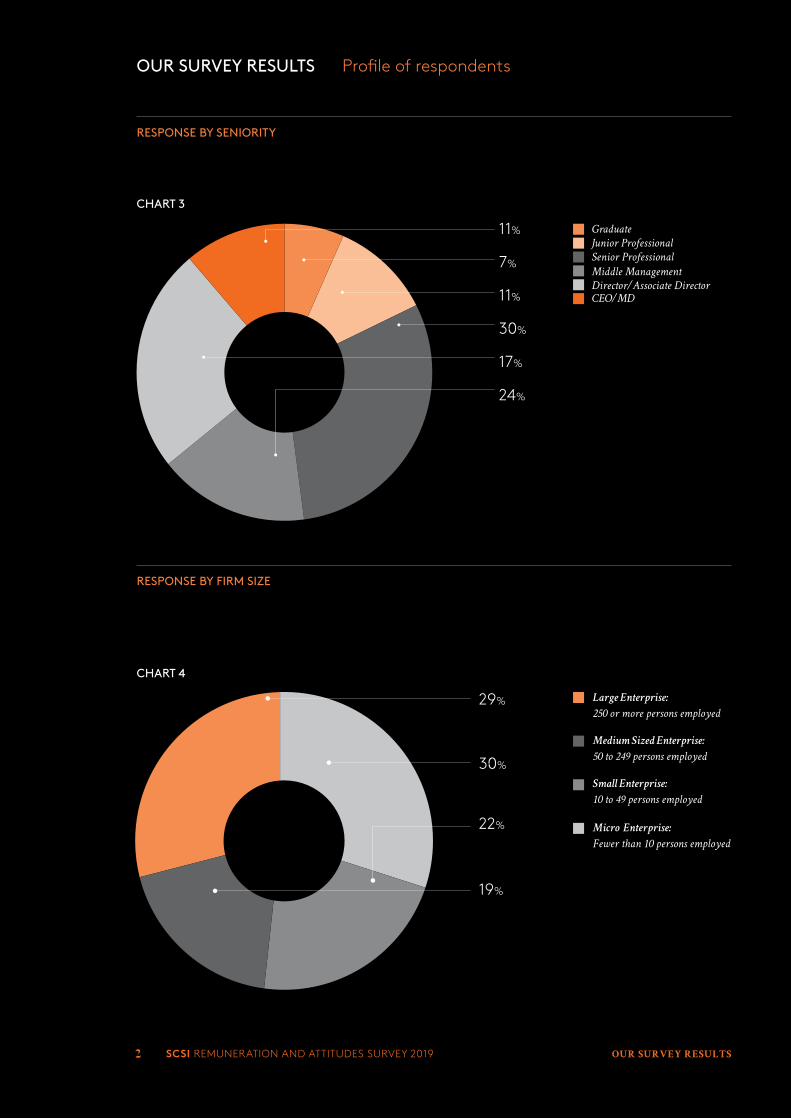
RESPONSE BY PROFESSION
CHART 1
CHART 2
RESPONSE BY LOCATION
Our survey is representative of the membership categories of the Society with respondents from Construction equating to 49% and Property & Land equalling 51%.
The location of respondents matches closely with the geographical location distribution of members of the SCSI and the location distribution of respondents from previous years which ensures accuracy of comparative analysis.
8%
63%
9%
4%
16%
Connaught/Ulster
Dublin
International
Munster
Rest of Leinster (exl. Dublin)
2 SCSI REMUNERATION AND ATTITUDES SURVEY 2019 OUR SURVEY RESULTS
CHART 3
CHART 4
RESPONSE BY SENIORITY
RESPONSE BY FIRM SIZE
29%
11%
7%
11%
30%
17%
24%
CEO/MD
Graduate
Junior Professional
Senior Professional
Middle Management
Director/Associate Director
Large Enterprise:
250 or more persons employed
Micro Enterprise:
Fewer than 10 persons employed
Medium Sized Enterprise:
50 to 249 persons employed
Small Enterprise:
10 to 49 persons employed
30%
22%
19%
Profile of respondentsOUR SURVEY RESULTS
2 SCSI REMUNERATION AND ATTITUDES SURVEY 2019

3 SCSI REMUNERATION AND ATTITUDES SURVEY 2019
FULL-TIME V PART TIME AND THOSE SEEKING EMPLOYMENT
CHART 5
CHART 6 - NATIONAL MEDIAN SALARY BY QUALIFICATION
SECTOR, GENDER AND EDUCATION BREAKDOWN
For the purpose of analysis, only those in full-time employment were included in the findings on salary.
The highest level of education attainment was not founded to impact salary directly.
The private sector was the largest component of the respondents at 86%.
The response rate from female surveyors was 20% which aligns with SCSI membership.
Full Time
0% 10% 20% 30% 40% 50 60% 70% 80% 90% 100%
Unemployed and Seeking work
Part Time
93%
6%
1%
90000
80000
70000
60000
50000
40000
30000
20000
10000
0
1. No Formal Education
2. Certificate
3. Diploma
4. Degree
5. Post Grad Diploma
6. Masters
7. Doctorate 1 2 3 4 5 6 7
Profile of respondentsOUR SURVEY RESULTS
OUR SURVEY RESULTS

4 SCSI REMUNERATION AND ATTITUDES SURVEY 2019
2019 Surveying salaries
TABLE 1 - NATIONAL SALARIES BY FIRM SIZE
Some members may find themselves working in positions that are slightly outside of the reporting parameters and therefore our analysis of the data under the following sub-headings are used to provide readers with a useful range of salaries that may be a more accurate descriptor of your current career stage;
» Seniority of position within firm/organisation » Size of the firm/organisation » Experience in years » Location in Dublin or in the rest of Ireland
From our analysis, we can see that;
» a move up in seniority earns an increase in the region of €7,500 (+/- €1,300); » an increase in firm size by category (micro, small, medium or large) results in a salary increase
in the region of €8,700 (+/- €1,400); » each year of experience earns an increase in the region of €800 (+/- €200); and » a pay premium for those that are working in Co. Dublin in the region of €11,400 (+/-€4,200).
The relationship between firm size and position in our analysis is interesting. Based on the actual data for basic salary, the following table sets out the median along with the associated 25% and 75% quartiles as lower and upper values to assist members in reviewing their salary position.
Position vs Firm size
Micro firm (9 or less staff)
Small firm (10 to 49 staff)
Medium firm (50 to 249 staff)
Large firm (250 or more staff)
Graduate €31,000 (€27,125 to €33,500)
€32,000 (€25,500 to €34,000)
€33,000 (€28,000 to €35,000)
€32,000 (€29,500 to €34,000)
Junior Professional €38,000(€33,000 to €44,000)
€41,500(€35,000 to €45,750)
€42,000(€37,500 to €48,750)
€46,000 (€39,500 to €52,000)
Senior Professional €41,500(€35,000 to €51,250)
€60,000(50,000 to €73,500)
€62,500(€50,000 to €72,125)
€70,000(€60,000 to €80,000)
Middle Management €54,800(€40,000 to €72,000)
€60,000(€50,000 to €75,000)
€60,000(€49,000 to €75,000)
€78,000(€65,000 to €90,000)
Director/ Assoc. Dir. €56,000 (€40,000 to €74,375)
€85,000 (70,000 to €95,000)
€100,000 (€70,000 to €120,000
€100,000 (€80,000 to €120,000)
CEO/MD €60,000 (€40,000 to €80,000)
€113,500 (€75,000 to €127,500)
€145,000 (€107,500 to €170,500)
Insufficientsample size
OUR SURVEY RESULTS4

5 SCSI REMUNERATION AND ATTITUDES SURVEY 2019
TABLE 2 - ANNUAL NATIONAL SALARY BY DISCIPLINE
The analysis found that discipline wasn’t a significant factor in salaries but we’ve presented the median tables as in past reports.
CEO Director Middle Management
Senior Junior Graduate
Building Surveyor €66,000 €74,000 €65,750 €59,700 €40,000 €32,500
Commercial Property Manager
* €110,000 €87,500 €63,000 €43,000 €40,750
Development / Asset Manager
€100,000 €110,000 €85,500 €94,000 €40,000 *
Residential Estate Agent
€60,000 €95,000 €50,000 €42,500 €30,000 €24,000
Facilities Mgt. Surveyor
* * €69,000 €55,000 * *
General Practice/ Auctioneer
€80,000 €100,000 €66,500 €65,000 €40,000 €28,150
Land Surveyor/Geomatics Surveyor
€50,700 €66,000 €72,000 €54,264 * *
Project Management Surveyor
* €119,000 €85,000 €87,500 €35,000 *
Quantity Surveyor €100,000 €100,000 €85,900 €71,001 €50,000 €34,000
Residential Property Manager
€97,500 €68,000 €54,000 €49,250 €35,050 *
Valuation Surveyor * €85,000 €70,000 €71,000 €47,500 €34,750
Residential Lettings * * * €43,500 * *
*denotes less than 5 responses
OUR SURVEY RESULTS

6 SCSI REMUNERATION AND ATTITUDES SURVEY 2019
CHART 8: MEDIAN SALARY - ALL PROFESSIONS
OUTSIDE OF DUBLIN The CEO figures highlighted in chart 8 is mainly from those surveyors operating in micro- businesses which can often be sole traders. This is the main reasons for the lower median salary figures for CEO in comparison to other senior grades, which is also explained in Table 1.
Levels of Seniority
Levels of Seniority
DUBLIN
CHART 7: MEDIAN SALARY
Median salaries are almost €74,375 in Dublin, similar levels to what was reported two years ago
120000
100000
80000
60000
40000
20000
0
80000
70000
60000
50000
40000
30000
20000
10000
0
1
1
2
2
3
3
4
4
5
5
6
6
1. CEO/Managing Director
2. Director/Associate
3. Middle Management
4. Senior
5. Junior
6. Graduate
1. CEO/Managing Director
2. Director/Associate
3. Middle Management
4. Senior
5. Junior
6. Graduate
110000
60020
102000
70000
78750
74700
70000
63500
46000
40000
43500
30250
OUR SURVEY RESULTS

7 SCSI REMUNERATION AND ATTITUDES SURVEY 2019
CHART 10: INCREASE IN SALARY - PERCENTAGE OF RESPONDENTS
SALARY REVIEWS AND BENEFITS
The percentage of respondents reporting an increase in salaries has risen from 54% in 2017 to 57% in 2019.
Levels of Seniority
OUTSIDE DUBLIN
CHART 9: NATIONAL MEDIAN SALARY
Chart 9 removes those respondents from Micro Businesses which distorts ‘CEO’ data due to higher number of sole traders in this category.
140000
120000
100000
80000
60000
40000
20000
0
58
57
56
55
54
53
52
51
1
2016 2017 2019
2 3 4 5 6
1. CEO/Managing Director
2. Director/Associate
3. Middle Management
4. Senior
5. Junior
6. Graduate
125000 116000 76000 71340 40000 30500
OUR SURVEY RESULTS

8 SCSI REMUNERATION AND ATTITUDES SURVEY 2019
Levels of Seniority
SALARY REVIEWS AND BENEFITS
CHART 11: ANNUAL LEAVE (MEDIAN VALUES)
26
25
24
23
22
21
20
19
Days -
1 2 3 4 5 6
1. CEO/Managing Director
2. Director/Associate
3. Middle Management
4. Senior
5. Junior
6. Graduate
25 25 24 22 21 21
OUR SURVEY RESULTS
9 SCSI REMUNERATION AND ATTITUDES SURVEY 2019
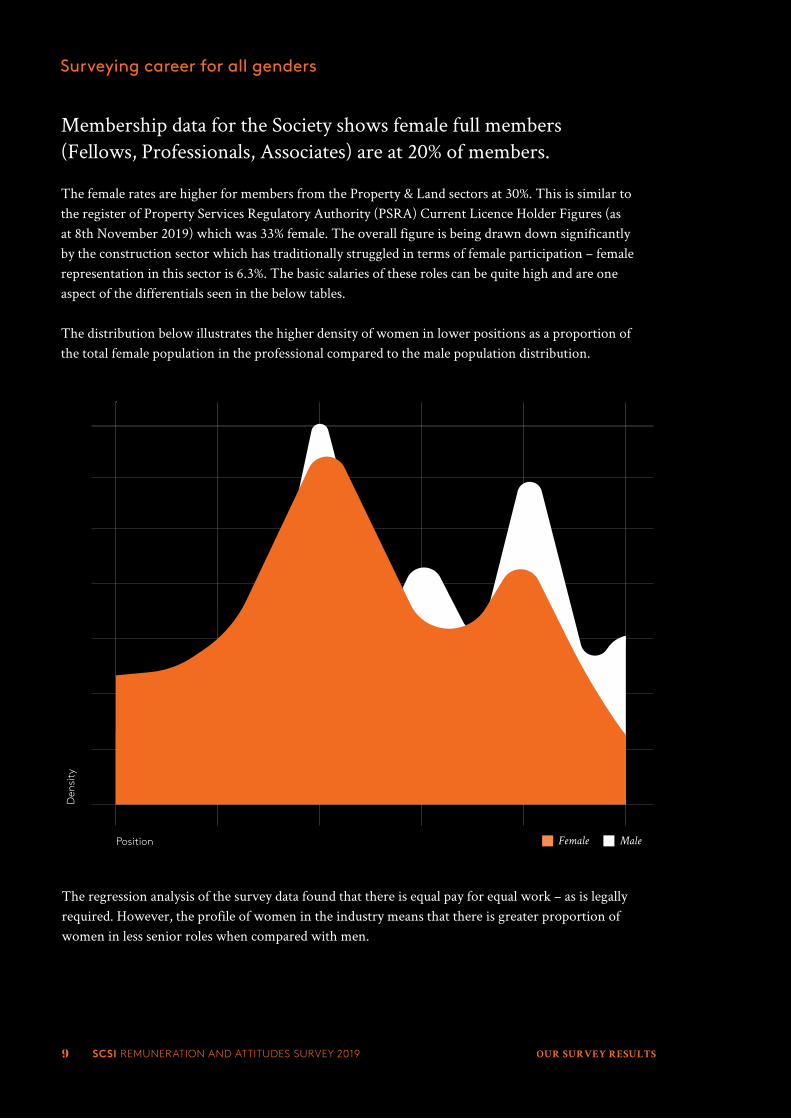
Surveying career for all genders
Membership data for the Society shows female full members (Fellows, Professionals, Associates) are at 20% of members.
The female rates are higher for members from the Property & Land sectors at 30%. This is similar to the register of Property Services Regulatory Authority (PSRA) Current Licence Holder Figures (as at 8th November 2019) which was 33% female. The overall figure is being drawn down significantly by the construction sector which has traditionally struggled in terms of female participation – female representation in this sector is 6.3%. The basic salaries of these roles can be quite high and are one aspect of the differentials seen in the below tables.
The distribution below illustrates the higher density of women in lower positions as a proportion of the total female population in the professional compared to the male population distribution.
The regression analysis of the survey data found that there is equal pay for equal work – as is legally required. However, the profile of women in the industry means that there is greater proportion of women in less senior roles when compared with men.
Position
Den
sity
9 OUR SURVEY RESULTSSCSI REMUNERATION AND ATTITUDES SURVEY 2019
Female Male

10 SCSI REMUNERATION AND ATTITUDES SURVEY 2019
CONFIDENT OF SALARY INCREASE IN 12 MONTHS
CHART 12
CHART 13
% OF RESPONDENTS SATISFIED IN THEIR JOB
65% of those surveyed in 2016 expected an increase in pay in 2017. However, just 54% of respondents in 2017 reported an actual increase in pay. However in 2019 the figure jumped to 73%
OUTLOOK ON THE FUTURE
74
72
70
68
66
64
62
60
58
56
54
52
100
90
80
70
60
50
40
30
20
10
0
2016
2016
2017
2017
2019
2019
65
0
54
89
73
92
OUR SURVEY RESULTS
Male
11 SCSI REMUNERATION AND ATTITUDES SURVEY 2019
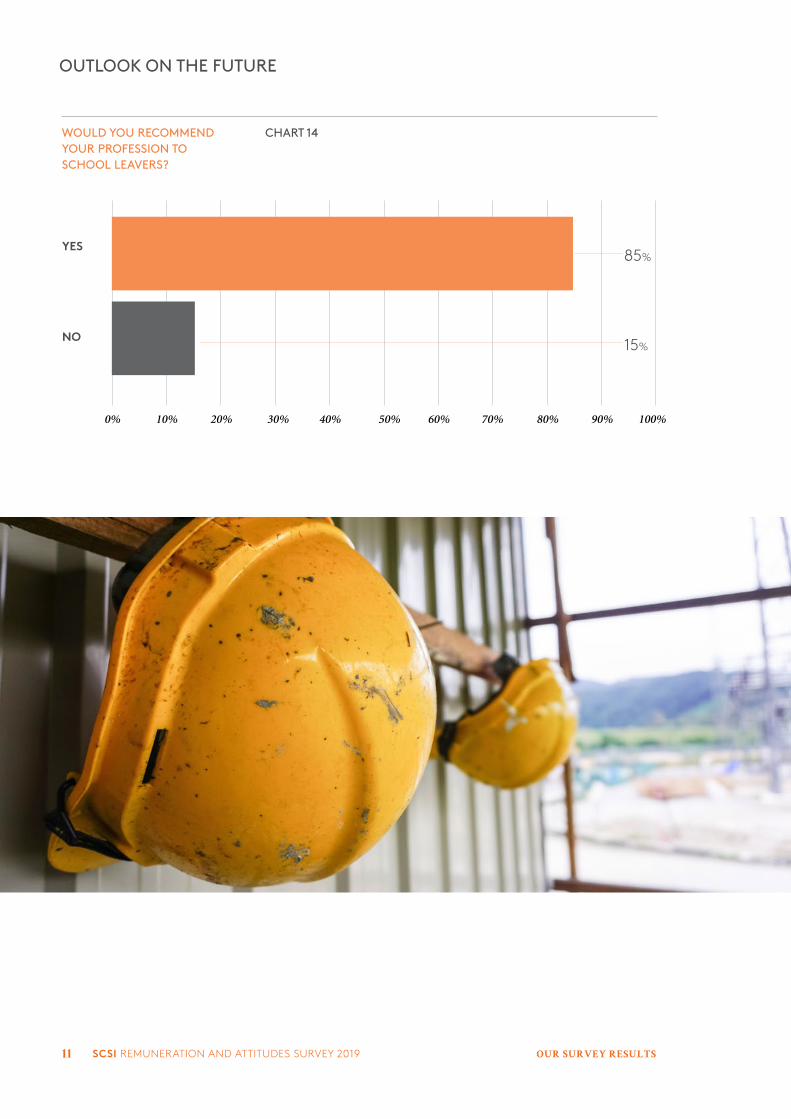
WOULD YOU RECOMMEND YOUR PROFESSION TO SCHOOL LEAVERS?
CHART 14
OUTLOOK ON THE FUTURE
YES
NO
85%
15%
0% 10% 20% 30% 40% 50% 60% 70% 80% 90% 100%
OUR SURVEY RESULTS
12 SCSI REMUNERATION AND ATTITUDES SURVEY 2019
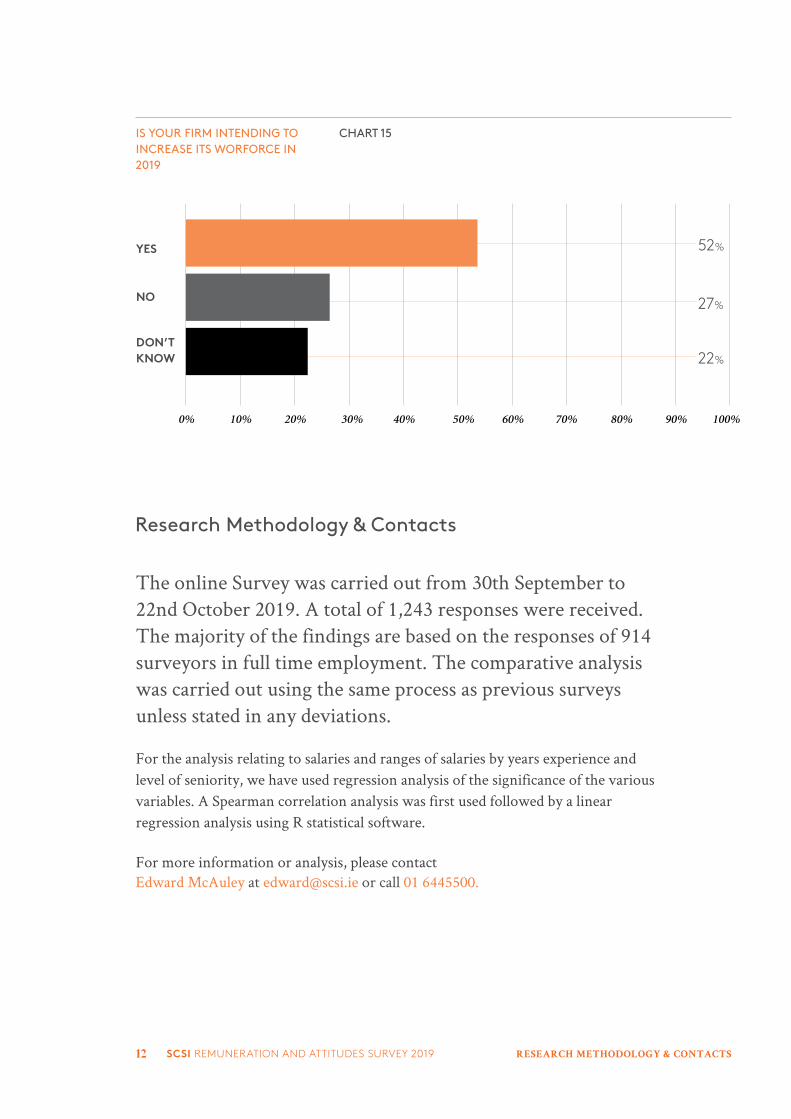
IS YOUR FIRM INTENDING TO INCREASE ITS WORFORCE IN 2019
CHART 15
YES
NO
DON’T KNOW
52%
27%
22%
0% 10% 20% 30% 40% 50% 60% 70% 80% 90% 100%
Research Methodology & Contacts
The online Survey was carried out from 30th September to 22nd October 2019. A total of 1,243 responses were received. The majority of the findings are based on the responses of 914 surveyors in full time employment. The comparative analysis was carried out using the same process as previous surveys unless stated in any deviations.
For the analysis relating to salaries and ranges of salaries by years experience and level of seniority, we have used regression analysis of the significance of the various variables. A Spearman correlation analysis was first used followed by a linear regression analysis using R statistical software.
For more information or analysis, please contact Edward McAuley at [email protected] or call 01 6445500.
RESEARCH METHODOLOGY & CONTACTS

13 SCSI REMUNERATION AND ATTITUDES SURVEY 201913 SCSI REMUNERATION AND ATTITUDES SURVEY 2019

14 SCSI REMUNERATION AND ATTITUDES SURVEY 201914 SCSI REMUNERATION AND ATTITUDES SURVEY 2019

15 SCSI REMUNERATION AND ATTITUDES SURVEY 2019
Remuneration and Attitudes Survey 2019
Chartered ProfessionalsPROPERTY I LAND I CONSTRUCTION

16 SCSI REMUNERATION AND ATTITUDES SURVEY 2019
Report designed by:
A: 23 Fitzwilliam Square S, Dublin M: +353 (0) 1 639 4836E: [email protected]

17 SCSI REMUNERATION AND ATTITUDES SURVEY 2019