Removal of Metallic Impurities in Chromium by Electrocoagulation
79
WMRC Reports Waste Management and Research Center Removal of Metallic Impurities in Chromium Plating Solutions by Electrocoag u lation s. B. Lalvani Southern Illinois University RR-92 April 2002 Electronic Version
Transcript of Removal of Metallic Impurities in Chromium by Electrocoagulation

WMRC ReportsWaste Management and Research Center
Removal of Metallic Impurities in Chromium Plating Solutions by Electrocoagu lation
s. B. Lalvani
Southern Illinois University
RR-92 April 2002
Electronic Version
About WMRC's Electronic Publications:
This document was originally published in a traditional format.
It has been transferred to an electronic format to allow faster and broader access to important information and data.
While the Center makes every effort to maintain a level of quality during the transfer from print to digital format, it is possible that minor formatting and typographical inconsistencies will still exist in this document.
Additionally, due to the constraints of the electronic format chosen, page numbering will vary slightly from the original document.
The original, printed version of this document may still be available.
Please contact WMRC for more information:
WMRC One E. Hazelwood Drive Champaign, IL 61820 217-333-8940 (phone)
www.wmrc.uiuc.edu
ld WMRC is a division of the ~L~~ Illinois Department of Natural
DEPARTMENT OF
NATURAL Resources RESOURCES

Removal of Metallic Impurities in Chromium Plating Solutions by Electrocoagulation
Dr. S. B. Lalvani
Department of Mechanical Engineering and Energy Processes Southern Illinois University
Carbondale, IL 62901
Prepared for
Illinois Waste Management and Research Center One E Hazelwood Drive
Champaign, IL 61820

This report is part of WMRC's Research Report Series. Mention of trade names or commercial products does not constitute endorsement or recommendation for use.

TABLE OF CONTENTS
LIST OF FIGURES 111
LIST OF TABLES v
ACKNOWLEDGEMENTS VII
ABSTRACT VIII
1. INTRODUCTION 1
2. METHODOLOGY 4
2.1 Electromigration 4 2.2 Preparation of Anodes for Hexavalent Chromium Regeneration 6
3. RESULTS AND DISCUSSION 9
3.1 Removal of Impurities 9 3.1.1 Catholyte Selection 9 3.1.2 Iron (Fe+2
) Removal 11 3.1.3 Nickel (Ni+2
) Removal 13 3.1.4 Removal ofMixture of impurities 17
3.2 Characterization and Properties of Deposits 17 3.2.1 Evaluation of Composition of Deposits 17 3.2.2 Determination of Mechanical Properties 20 3.2.3 Corrosion resistance Properties 21 3.2.4 Microstructural Properties 23
3.3 Kinetics of Impurity Removal 27 3.3.1 Model Development 27 3.3.2 Kinetic Data and Model Validation 31
3.4 Regeneration of Hexavalent Chromium 41 3.4.1 Model Development 41 3.4.2 Kinetic Studies and Model Validation 45
4. GUIDELINES FOR PRACTICAL OPERATION 56
5. CONCLUSIONS 57
NOMENCLATURE 59
REFERENCES 61
APPENDIX I 64
APPENDIX II 66
ii

LIST OF FIGURES
Figure 1
Figure 2.
Figure 3
Figure 4
Figure 5
Figure 6
Figure 7
Figure 8-a
Figure 8 -b
Figure 9-a
Figure 9-b
Figure 10
Figure 11
Figure 12
Figure 13
Figure 14.
Figure 15.
Figure 16.
A Sketch of Electrochemical Reactor used in the Laboratory
Schematic of the experimental setup for regeneration.
Iron removal vs. time
pH vs. time
Nickel removal vs. time Catholytes: O-phosphoric acid and sodium monophosphate
Nickel and Iron removal vs.tTime Catholyte: Chromic Acid (2.5 M)
Photomicrograph of deposit from freshly prepared hard chrome solution
Photomicrograph of deposit from Set 1 spent solution
Photomicrograph of deposit from Set 1 rejuvenated solution
Photomicrograph of deposit from Set 2 spent solution
Photomicrograph of deposit from Set 2 rejuvenated solution
Concentration vs time for iron
Concentration vs time for nickel
Concentration vs time for copper
pH of catholyte vs. time
Concentration vs. time for chromium species in both compartments. Initial concentration of hexavalent chromium of29 gil. Bi-doped lead dioxide anode was used.
Concentration vs. time for chromium species in both compartments. Initial concentration of hexavalent chromium of98.5 gil. Bi-doped lead dioxide anode was used.
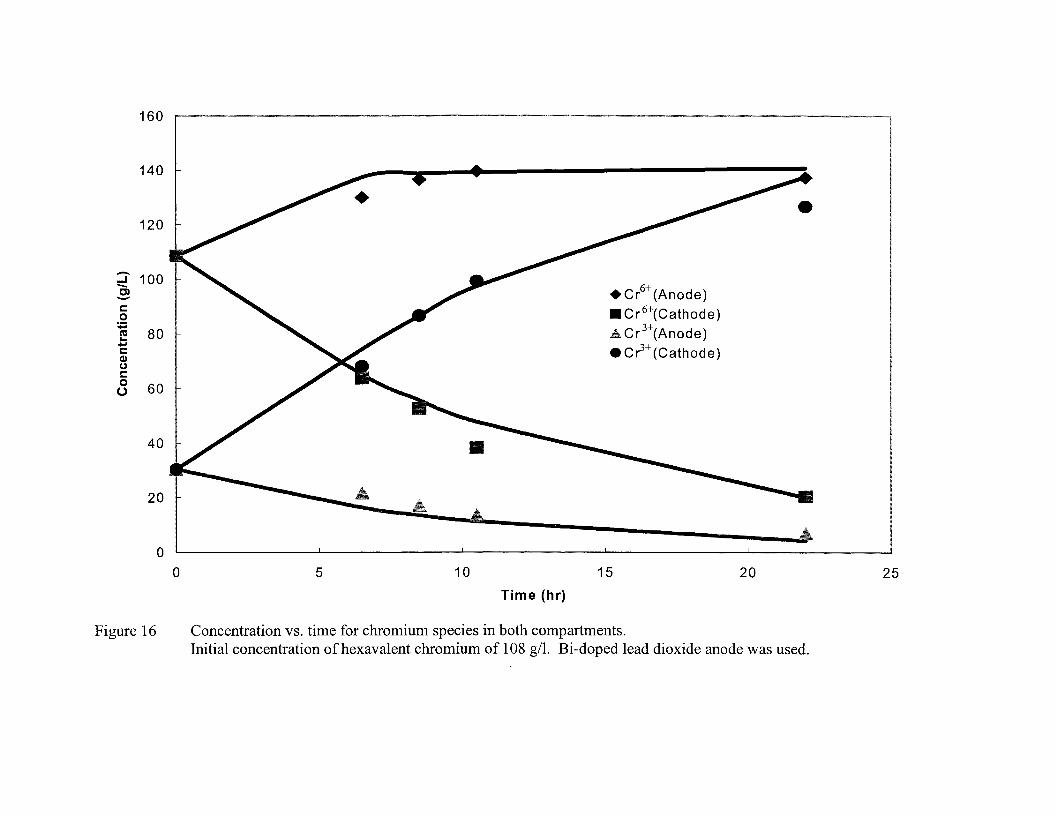
Concentration vs. time for chromium species in both compartments. Initial concentration of hexavalent chromium of 108 gil. Bi-doped lead dioxide anode was used.
iii

Figure 17.
Figure 18.
Figure 19:
Concentration vs. time for chromium species in both compartments. Initial concentration of hexavalent chromium of 127 gil. Bi-doped lead dioxide anode was used.
Concentration vs. time for chromium species in anolyte. Initial concentration of hexavalent chromium of29 gil.
Potential (V vs. SCE) vs. time.
iv
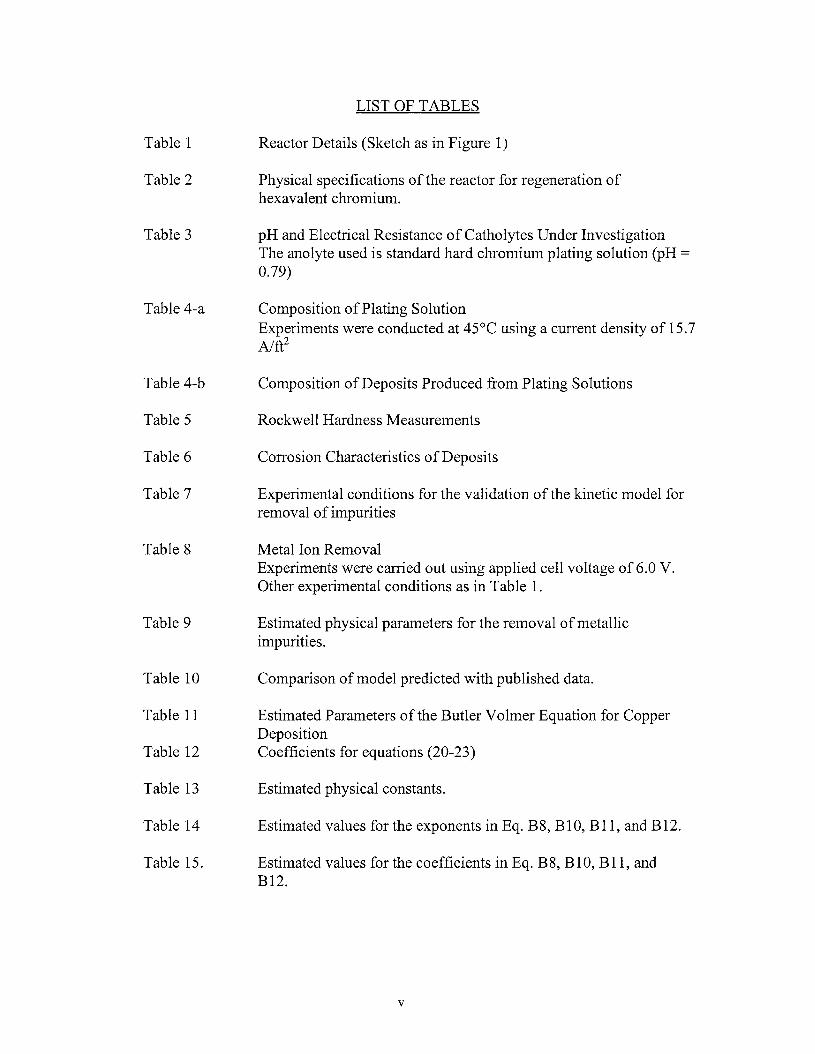
LIST OF TABLES
Table 1 Reactor Details (Sketch as in Figure 1)
Table 2 Physical specifications of the reactor for regeneration of hexavalent chromium.
Table 3 pH and Electrical Resistance of Catholytes Under Investigation The anolyte used is standard hard chromium plating solution (pH = 0.79)
Table 4-a Composition of Plating Solution Experiments were conducted at 45°C using a current density of 15.7 Nft2
Table 4-b Composition of Deposits Produced from Plating Solutions
Table 5 Rockwell Hardness Measurements
Table 6 Corrosion Characteristics of Deposits
Table 7 Experimental conditions for the validation of the kinetic model for removal of impurities
Table 8 Metal Ion Removal Experiments were carried out using applied cell voltage of 6.0 V. Other experimental conditions as in Table 1.
Table 9 Estimated physical parameters for the removal of metallic impurities.
Table 10 Comparison ofmodel predicted with published data.
Table 11 Estimated Parameters of the Butler Volmer Equation for Copper Deposition
Table 12 Coefficients for equations (20-23)
Table 13 Estimated physical constants.
Table 14 Estimated values for the exponents in Eq. B8, BI0, Bll, and B12.
Table 15. Estimated values for the coefficients in Eq. B8, BI0, Bll, and B12.
v

ACKNOWLEDGEMENTS
The funding for this research was provided by the Waste Management and Research
Center, Champaign, Illinois and the Materials Technology Center, Southern Illinois
University-Carbondale, IL. Experimental assistance was provided by Kanchan
Mondal, Ph. D. candidate and Dr. J. Pattanayak. Dr. Wiltowski provided help with
ICP analysis. Dr. N. V. Mandich ofHBM Electrochemical Co. provided valuable
insights into this research. We also thank the staff at IWMRC for providing the
technical reviews of our work performed.
VI

ABSTRACT
Metallic impurities such as Ni, Fe, Cu ions in chromium plating solutions can be removed by electromigration followed by electrodeposition or coagulation using a porous pot, suspended in the bath and containing a lead cathode. In the same process, Cr(III) is oxidized to Cr (VI) at the insoluble lead anode leading to regeneration of the plating solution. Previous research and data from industrial operations have indicated the "porous pot" method could be a cost-effective and environmentally friendly method to continuously separate impurities and recycle spent chromium solutions. However, no data are available that relate the various concentrations of impurities to the extent and the rate of their removal. This investigation focused on the use of five suitable catholytes for the removal of impurities. Up to 60% nickel and 52% iron removal were observed in orthophosphoric acid and sodium monophosphate catholytes respectively. In addition to these two electrolytes, chromic acid appears to be a most suitable catholyte for purification when more than one metallic impurity is present in the spent solution. The rejuvenated chromium solution was used to make chromium deposits on various substrates. The deposits obtained from the rejuvenated solution were found to have microstructure and hardness and corrosion resistance properties similar to those obtained from freshly prepared solutions. These deposits had hardness and corrosion resistance properties far superior to those obtained from contaminated plating solutions. The kinetics of metal impurity removal and regeneration of hexavalent chromium were studied using a mathematical model developed in this study. The model was validated against experimental data.
vii

1.0 INTRODUCTION
A typical spent hard chromium plating solution contains chromic oxide as anions
of chromates, trivalent chromium and metallic impurities of nickel, iron, copper and zinc.
A number of methodologies involving neutralization, adsorption, electrodialysis and ion
exchange have been reported for the removal of metallic impurities from chromium
plating solutions. However, the above mentioned methods suffer from severe drawbacks
in actual continuous practice. For example neutralization followed by precipitation of
metals involves the use of a large volume of chemicals and results in the formation of
sludge which is relatively difficult to handle and dispose off. In addition, this method
works best when impurity concentration is relatively high. The problem with adsorbents
lies in that they are expensive and generally non-selective. Electrodialysis suffers from
the problems associated with membrane stability while ion-exchange methods are
believed to be not very suitable due to their huge capital cost and volumes of effluents
produced with regeneration [1-2]. A number of researchers have shown that upon the
application of a DC electric field, the metallic cations of impurities present in the anode
compartment migrate to the negatively charged cathode through a ceramic membrane
(also called "porous pot") where they are concentrated [3-8]. Since the chromates are
anions, they remain confined to the positively charged anode. Depending upon the
solution pH, the impurities concentrated in the catholyte (i.e. electrolyte in the cathode
compartment) as a result of electromigration are either electrodeposited on the electrode
surface or precipitated. This method of separation is inexpensive and can be carried out
rather easily in electroplating shops. According to Mandich et al [3] the advantages of
this process over other methods for impurity removal are due to (i) simplicity of design

and operation, (ii) economy, and (iii) compactness. Generally, sulfuric acid is used as a
catholyte, however, the use of this acid quickly leads to an increase in the solution pH
upon the application of a DC field (due to hydrogen evolution at the cathode) which
results in rapid precipitation of metals and hence the decrease of electrical conductivity.
The increase in solution resistance leads to higher cell voltage demand (when operation is
conducted at constant current) thus necessitating the cessation of operation, followed by
cleaning of the cathode compartment and recharging with fresh sulfuric acid. Another
possible disadvantage of using sulfuric acid is that sulfate anions could electromigrate to
the positively charged anode and upset the required optimum sulfate to chromium ratio
needed for hard chromium plating solution. It should be noted that sulfate ion acts as a
catalyst in chromium plating [6]. The lead anode and lead cathode are used in this study.
Lead forms an oxide layer on its surface that catalyzes the oxidation of trivalent
chromium to hexavalent chromium. Therefore, lead cathodes and anodes are widely used
in chromium plating industry.
The following is a list of various key mechanisms that govern the operation of
porous pot subjected to the application of DC potential:
(a) Electromigration determines the movement of ions. The cations of Fe2+, Ni2+, Cr3+
and H+ are attracted towards the negatively charged cathode where they are
concentrated inside the porous pot, whereas the anion such as chromates,
dichromates, polychromates and sulfate (e.g. Cr042-, Cr2072-, Cr30102- and S042-) are
driven towards the positively charged anode that is placed in the bulk of the spent
plating solution;
2

(b) In addition to migration, the trivalent chromium ion, Cr3+ is oxidized to the
hexavalent chromium (i.e. Cr042-) at the anode compartment. Therefore,
regeneration of hexavalent chromium is possible [8].
(c) Depending upon the electrode potential, specific electrochemical reactions such as
iron and nickel electrodeposition, and hydrogen evolution at the cathode and
oxidation ofFe2+to Fe3+at the anode can and do occur,
(d) Evolution of hydrogen at the cathode results in an increase of solution pH. The most
common chemical reaction therefore in the porous pot (i.e. cathode compartment)
involves precipitation of metals.
Even though the "porous pot" method may be an economical device for removing
metallic impurities, its operation remains poorly understood.:. Mandich et al [3, 7] first
described the chemical and electrochemical reactions as well the operational mode and
suggested a qualitative explanation of reactions inside (i.e. cathode) and outside (i.e.
anode) the pot. Some of the reactions that can occur in the cathode compartment are:
Men++ ne- = Meo (1)
2H30+ + 2e- = 2H20 + H2 (2)
2H20 + 2e- = H2 + 20H- (3)
nH+ + A-n = HnA (4)
Men++ mOH- = Me (OH)m(n-m)+ (5)
Where Me = Metal and, A = anion
The pH changes at the cathode inside the porous diaphragm occur are the result of
reactions (2) and (3). Reactions (4) and (5) tend to decrease the rate of change of pH;
reaction (4) accomplishes this when the buffer pH of the particular metal is reduced, and
3

reaction (5) when the solubility limit is reached and the hydroxide precipitation begins to
act as a buffer.
If the catholyte does not contain buffering agents or complexing agents, the pH
increases to high values upon the application of current. Some buffering action can occur
due to the reaction of hydroxide with the metal ions present as the impurities. However,
this reaction is less effective at buffering any pH change, especially as the solution
becomes more purified and the concentration of metals decreases. There may be
transient plateaus due to precipitation of Fe (OH)3, Ni (OH)2 etc., after which the pH will
again increase. If the pH is maintained low enough, metallic impurities will be plated out
at the cathode, rather than to form the hydroxides in the form of voluminous sludge.
In this study, the following tasks were undertaken:
(i) investigation of suitable catholyte(s) for the removal of impurities;
(ii) investigation of hexavalent chromium from trivalent chromium at the anode; and
(iii) study of properties of deposits prepared from rejuvenated plating solutions.
2. METHODOLOGY
2.1 Electromigration
A sketch of the batch glass reactors constructed is provided in Figure 1. The
outside compartment contains 2,000 ml of anolyte while the inside compartment consists
of a round porous ceramic diaphragm (porosity 40% and pore size 1 J.lm) with a capacity
of 750 m!. Both anodes and cathodes are constructed out of lead grids. Other details of
the reactor are provided in Table 1. The outside compartment (i.e. anode) consists of the
impurity bearing (therefore designated as spent) hard chrome plating solution while the
4

side compartment (i.e. cathode) contains the selected solution (catholyte) in which the
impurities are to be concentrated. Upon the application of a DC electric current (or
voltage) the metal cations electromigrate to the cathode compartment where, depending
upon the pH, temperature, current density and catholyte composition, they are either
electrodeposited and/or precipitated. In a typical experiment, a known amount of metal
impurities are added to the typical hard chromium plating solution which is made by
dissolving 250 g of chromic acid powder in 1 L of water to which 2.55 g of sulfate ion as
sulfuric acid have been added. Experiments involve the application of constant current at
a temperature of 45°C (temperature used in actual plating practice). Samples (5 ml) are
drawn from the cathode and anode compartments at regular intervals. The metal
concentration in solutions was determined using a Perkin-Elmer inductively coupled
plasma spectrometer (ICP). The pH of the samples is also monitored. In addition, the
voltage drop across the reactor is noted. Any sludge formed in the reactor is collected and
analyzed.
2.2 Preparation of Anodes for Hexavalent Chromium Regeneration
The lead electrodes were made by cutting 3/32" thick sheets obtained by McMaster
Carr (Chicago, IL) in to 10 cm X 1 cm pieces. The rest of the chemicals were supplied
by Alfa Aesar (Ward Hill, MA). In accordance to the experimental conditions described
by Vora et al [9], a passivating film was formed on the Pb surface by holding it in a 3 M
H2S04 solution for three hours at 0.4 V vs. the standard calomel electrode (SCE). The
potential of this electrode was then spiked momentarily to 2.3 V vs. SCE to allow the
creation of the nucleating sites for Pb02 in the passive film. Finally, the electrode was
5

anodized at a constant potential of 1.7 V vs. SCE for a period of 8 hours. The Bi-doped
Pb02 layer was deposited on the Pb02 coated lead from a bath containing 0.4 mM
Bi(N03)2, 0.12 M CU(N03)2, 10 mM Pb(N03)2 along with 0.1 gil of sodium dodecyl
sulfate (SDS) in 1 M perchloric ·acid. Perchloric acid was used since the solubility of
bismuth nitrate is high in the acid solution. A typical spent chromic acid bath contains
Cr(III)/Cr(VI) in the ratio of 1:25. However, for the purpose of this investigation four
different ratios of Cr(III) I Cr(VI) were synthesized from chromium sulfate and
chromium trioxide while the sulfate concentration was maintained at 2.5 gil. The total
chromium metal concentration of the synthetic spent solutions was kept at 130 gil, which
approximately corresponds to a concentration of 250 gil of Cr03 used in hard chromium
plating baths. The composition of the catholyte used in this study was identical to that of
the anolyte in order to avoid the occurrence of any concentration across the ceramic
membrane prior to the application of an electric field. The electrochemical oxidation of
Cr(III) was conducted in a divided electrolytic cell as shown in Figure 2. The design
parameters of the electrochemical cell are provided in Table 2. The analysis of the
solutions at different times in both the cathode and the anode chamber were analyzed for
the Cr(VI) content with an Ion Chromatograph (Dionex Corp, Sunnyvale (CA), Model #
DX 500). The ion chromatograph was equipped with a conductivity cell (CD 20) and the
Cr(VI) content was measured based on the conductivity in J.lSiemens. The column used
was a CS5A - 4 mm column. The total chromium was measured using a Buck Scientific
210 VGP Atomic Absorption Spectrophotometer.
6
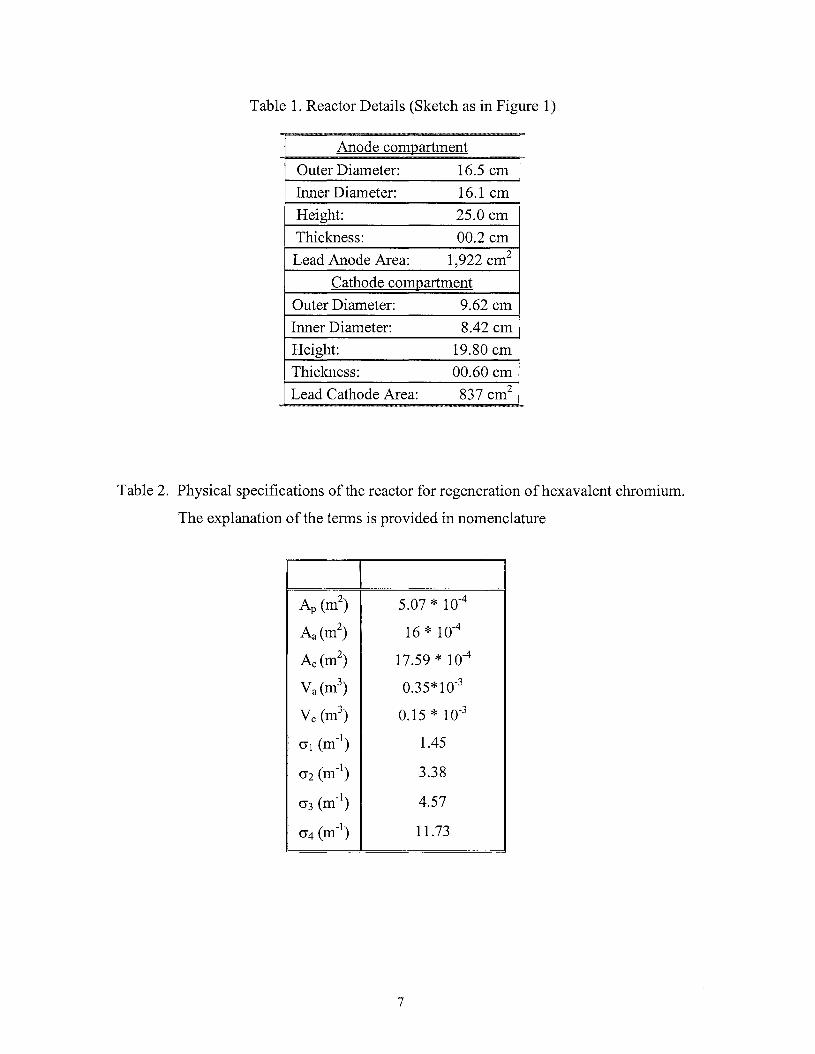
Table 1. Reactor Details (Sketch as in Figure 1)
Anode compartment -
Outer Diameter: 16.5 cm
Inner Diameter: 16.1 cm
Height: 25.0 cm
Thickness: 00.2 cm
Lead Anode Area: 1,922 cm 2
Cathode compartment
Outer Diameter: 9.62 cm
Inner Diameter: 8.42 cm
Height: 19.80 cm
Thickness: 00.60 cm
Lead Cathode Area: 837 cm2
Table 2. Physical specifications of the reactor for regeneration ofhexavalent chromium.
The explanation of the terms is provided in nomenclature
I II Ap (m
2)
Aa(m2)
Ac(m2)
Va (m3)
Vc (m3)
(J1 (m-I)
(J2 (m-I)
(J3 (m-I)
(J4 (m-I)
5.07 * 10-4
16 * 10-4
17.59 * 10-4
0.35*10-3
0.15 * 10-3
1.45
3.38
4.57
11.73
7

PorousCathode Anode Compartment (bulk DiaphragmCompartment of plating solution)
Figure 2. Schematic of the experimental setup for regeneration.
3. RESULTS AND DISCUSSION
3.1 Removal of Impurities
3.1.1 Catholyte Selection
In a set of preliminary experiments, a number of catholytes were examined for
their pH values. The following rationale was used to investigate the selection of possible
catholytes. Electrolytes containing the anion of cr, S04-2, or N03- were not considered
in this study because these anions could electromigrate to the anode compartment where
the spent plating solution is placed. These anions are detrimental in that they either
poison or overcatalyze the plating bath. The electrolytes were placed in the reactor
8

shown in Figure 1 and the electrical resistance across the reactor was determined. The
data are presented in Table 3. The catholytes selected offer a wide variation in pH as
desired. It is also interesting to note that when hard chromium plating solution is chosen
as one of the catholytes, the electrical resistance is the lowest.
Table 3. pH and Electrical Resistance of Catholytes Under Invesitgation
The anolyte used is standard hard chromium plating solution (pH == 0.79)
Catholyte I!H Cell Relative cell Resistance Resistance
(milli-ohms)
2.5M Chromic Acid* 0.79 0.077 1
0.5M Sodium
Monophosphate (MSP)
4.45 0.252 3.3
0.5M Orthophosphoric acid
(H3P04)
1.18 0.291 3.8
0.5M Sodium Bicarbonate
(baking soda)
8.34 0.364 4.7
0.5 Potassium
Pyrophosphate (TPP)
11 0.402 5.2
0.5M Sodium Perchlorate
(NaCI04)
5.45 0.46 6.0
*Did not contain sulfate ion as it would migrate to the anode and overcatalyze the
spent hard chromium plating solution.
The catholytes used included sodium monophosphate (MSP), potassium
pyrophosphate (TPP), sodium bicarbonate, orthophosphoric acid, sodium perchlorate and
the chromic acid solution. The catholytes chosen had a wide range of pH values, from
very low to very high. The idea was to determine if the impurity removal is affected by
9

the pH of the electrolyte. At low pH, metal deposition is the preferred reaction while at
high pH values, metal precipitation (as sludge) predominates. Both approaches have their
merits and disadvantages.
3.1.2 Iron (Fe+2) Removal
The source of iron used was ferrous sulfate. The total concentration of sulfate ion
in the solution was controlled and maintained at 2.55 gil. Figure 3 is a plot of total iron
removal as a function of time. The experiments were conducted at 45°C and a current
density of 7.8 Nft2 . The data are reported for four sets of catholytes: sodium
monophosphate, NaH2P04 (0.5M); o-phosphoric acid, H3P04 (0.5M); and sodium
perchlorate, NaCI04 (0.5 M), and chromic acid (2.5 M). The data show that up to 50%
iron removal is possible in less than 5 hours when sodium monophosphate catholyte is
used. However, the pH in the cathode compartment increased rapidly and at the end of
experiment (30 hours) the pH had risen to 12.8 from an initial value of 3.7. Sludge
formation was also observed in the cathode compartment which is consistent with the pH
observations. About 27% iron removal was observed in the case of sodium perchlorate in
15 hours of operation while 21 % iron removal was observed in the case of o-phosphoric
acid catholyte. The use of o-phosphoric acid resulted in iron complex formation, which
severely limited the conductivity of the solution (as evidenced by an increase in the cell
voltage), and as a result the power consumption rose dramatically from 43 to over 100
watts over a period of 30 hours. However, when chromic acid was used as a catholyte,
up to 28% iron removal was observed.
10

As compared to other electrolytes, the use of chromic acid as a catholyte led to a
relatively lower amount of iron removal. At the anode, Fe (II) is oxidized to Fe(III).
Ferric ions are known to form the negatively charged anions of iron-chromate complex
[10]. This complex, because of its charge, is unable to electromigrate to the positively
charged cathode compartment. Data reported in Figure 4 show that very small change in
the solution pH is observed in the cathode and anode compartments when experiments
are conducted for up to 24 hours at 7.8 Nft2 using chromic acid as a catholyte. In
addition, the power consumption remained fairly constant (at about 32-39W) during the
course of experiments. Thus, the hard chromium plating solution appears to be a good
choice as a catholyte because of its buffering properties.
3.1.3 Nickel (Ni+2) Removal
The source of nickel was nickel carbonate. Figure 5 is a plot of nickel removal vs.
time. In the case 0.5M of sodium monophosphate (MSP), the metal removal increased
almost linearly with time. Only a modest amount (14.6%) of nickel removal was
achieved. In the case of o-phosphoric acid (0.5M), it is interesting to note that metal
removal increased very rapidly at about 12 hours and up to 66% nickel removal is
possible in 29 hours of operation. Also, the power consumption and pH of the catholyte
remain relatively unchanged during the course of experiment. Thus, o-phosphoric acid
appears to be a good catholyte for nickel removal. When 2.5M chromic acid (hard
chromium plating solution minus the sulfate ion because the sulfate ion could migrate to
the anode where it could overcatalyze the spent hard chromium plating solution) was
used as a catholyte, up to 55% metal removal was obtained while the solution pH
11

remained almost unchanged, and the catholyte pH rose very slightly from an initial value
of 0.58 to 1.27 for the experiment conducted at 7.8 Nft2.
The movement of metallic impurities of Ni2+ and Fe2+ across the ceramIC
membrane to the cathode occurs due to the application of DC field. These cations are
attracted to the cathode which bears negative polarity. On the other hand, chromate ions
are anions, therefore they are confined to the positively charged anode. However,
hydrogen evolution occurs at the cathode due to reduction of protons (2H+ + 2e- ~ H2)
resulting in an increase in the pH. At sufficiently high pH, metal (M) precipitation occurs
according to the following equation:
Mn++ nOH- ~ M(OH)n
The use of chromic acid as a catholyte did not result in a significant increase in
the solution pH because chromic acid acts as a buffer. The data show that pH increase
was accompanied by an increase in the cell voltage which presumably occurred due to a
decrease in conductivity of the solution because of metal precipitation. In the case when
chromic acid was used as a catholyte, an insignificant increase in solution pH occurred
and thus no metal precipitation was observed. Therefore, should metal precipitation need
to be avoided, the use of chromic acid as a catholyte is attractive especially for the
removal of nickel impurities. Another advantage of the use of chromic acid as a
catholyte is in that chromate ions move to the anode upon the application of voltage thus
increasing the chromium concentration in the spent plating solution. Chromic acid is also
inexpensive and it is readily available in the chromium plating shops.
12

3.1.4 Removal of Mixture of Impurities
A spent hard chromium plating solution was obtained from HBM Electrochemical
and Engineering Company. The solution was found to contain 1.78 gil of nickel and 17.4
gil of iron. The solution was subjected to a current of 15.6 Alft2 at 45°C for a period of
24 hours. Chromic acid (2.5M) was used as a catholyte. The amount of metal removed
vs. time plot is shown in Figure 6. The data shows a monotonic relationship between the
amount of nickel and iron removal vs. time. Up to 46% of nickel and 24% iron removal
was achieved in 24 hours. The power consumption was relatively low for the first ten
hours of operation (85 W maximum). The results obtained are in accordance with the
data on metal removal obtained from solutions containing single metal impurities. The
residual amount of impurities from the plating baths could also be removed by
carbonaceous adsorbents [11-12].
3.2 Characterization and Properties of Deposits
3.2.1 Evaluation of Composition ofDeposits
Purification of the spent solution was carried out using the procedure described
above. The solution entitled "Set 1" was collected from the HBM Electrochemical and
Engineering Company and the solution entitled "Set 2" was synthesized in laboratory.
The purification step involved the application of DC current of 14A (current density of
15.7A1ft2) at 45°C. The data on metal removal are shown in Table 4-A.
13

Deposits were plated from solutions listed under Table 4-A. Plating was carried
out using a constant current (of about 0.28 - 0.35 A/cm2) at 45°C for an hour. The
substrate (i.e. cathode) consisted of 304 stainless steel polished with #3 finish and of
dimensions 6 cm x 1 cm.
Table 4-A Composition of Plating Solution
Experiments were conducted at 45°C using a current density of 15.7 Nft2
Solution PH Impurity Spent Solution
Concentration, mg/l
Rejuvenated Solution
Concentration, mg/l
Removal
(%)
Set 1 0.4 Iron
Nickel
Copper
11,680
1,964
9,408
9,000
1,168
5,720
23.0
40.5
39.2
Set 2 0.5 Iron
Nickel
Copper
2,844
544
2,356
2,164
296
1,308
23.9
45.6
44.5
Table 4-B Composition of Deposits Produced from Plating Solutions.
Sample Iron (wt. %) Nickel (wt. %) Copper (wt. %)
Set 1
a) Deposit from spent solution
b) Deposit from rejuvenated solution
0.48
0.12
0.12
0.05
0.23
0.07
Set 2
a) Deposit from spent solution
b) Deposit from rejuvenated solution
0.13
0.10
0.04
0.04
0.07
0.07
14

The composition of the coatings was found by dissolving them in an acid and
analyzing the solution using inductively coupled plasma spectroscopy (ICP). The
composition of the deposits is reported in Table 4-B. It can be seen from the data that the
deposits contain the impurities of iron, nickel and copper. The amount of impurities
present in the deposits is a function of the concentration of impurities present in the
plating solution. Upon the rejuvenation of the contaminated plating solution, the level of
impurities present in the deposits reduces considerably.
3.2.2 Determination of Mechanical Properties
Hardness measurement is used to characterize the mechanical strength of the
deposits produced. One of the major reasons for the use of chromium plating is due to its
high mechanical strength. The most commonly used method for measuring hardness is
the Rockwell tester. Carefully prepared deposits were used for this study. The data show
that the sample prepared from the most contaminated solution (Set 1) has the lowest
hardness value of 57.1 while the chromium deposited from a freshly prepared solution
has the highest hardness value of77.5.
When the Set 1 solution was purified and the deposit was produced, the hardness
value of the deposit was found to be 69.6 - which represents an increase of 22%. The
deposit produced from the less contaminated solution (Set 2) has a hardness value of
68.2. Upon purification of the solution and subsequent deposition, the hardness value
increased to 77.5 (an increase of 14%) which is the same value that was obtained for the
deposit produced from the freshly produced hard chromium plating solution.
15

Table 5. Rockwell Hardness Measurements
Sample Hardness Value (mean/median)
1. Deposit from freshly prepared hard chromium
solution (control)
77.5 I 77.0
2. Set 1
a) Deposit from spent solution
b) Deposit from rejuvenated solution
57.1 I 58.0
69.6 I 69.0
3. Set 2
a) Deposit from spent solution
b) Deposit from rejuvenated solution
68.2 I 68.0
77.5 178.0
3.2.3 Corrosion Resistance Properties
Electrochemical methods are employed to measure the corrosion resistance of
metals and alloys. The method used in this study is called the DC potentiodynamic
polarization method and this method is in accordance with the American Society of
Testing Materials (ASTM) procedure, Number D-1242. The rate of corrosion of selected
chromium coatings was determined in a chloride solution (33 gil of distilled water). The
procedure involved generation of current (i.e. metal dissolution rate) vs. potential (i.e.
oxidizing power) diagram. The active-passive regions of chromium corrosion were
determined. The net anodic and cathodic currents were calculated from the experimental
data. The potential at which the anodic and cathodic currents equal one another is called
the corrosion potential, Ecorr and the current is named corrosion current, Icorr. The method
used for calculation of corrosion characteristics is called the Tafel analysis. The
corrosion rate in mils per year (MPY) is calculated using the Faraday law:
16
dW M I corrcorrosion rate = -- = --- (6)dt nF
where:
W = weight loss of specimen
M = atomic weight
n = valence of disollution
t = time,
F = Faraday constant
d = differential
The corrosion characteristics of the deposits produced are reported in Table 6.
The deposit produced from a freshly prepared hard chromium solution showed the lowest
metal dissolution rate. The rate of dissolution is found to be proportional to the amount
of impurities present in the plating solutions. For example, the deposit produced from Set
1 solution which contains the highest level of metal impurities, is observed to have the
highest corrosion (i.e. dissolution) rate. Once the contaminated solutions have been
rejuvenated, the deposits produced exhibit greatly lowered metal dissolution rates. There
rates are of nearly the same order of magnitude as the corrosion rate observed for the
deposit produced from the freshly produced hard chromium plating solution.
17

Table 6. Corrosion Characteristics of Deposits
Sample Ecorr, mV Icorr Dissolution rate,
MPY*
1. Deposit produced from freshly
prepared hard chromium solution
(control)
-100 0.27 0.04
2. Set 1
a) Deposit from spent solution
b) Deposit from rejuvenated
solution
-945
-50
1707
0.63
265
0.10
3. Set 2
a) Deposit from spent solution
b) Deposit from rejuvenated
solution
-265
-100
316
0.63
49.04
0.10
*Mils (one-thousand of an inch) per year.
3.2.4 Microstructural
A micrograph of deposits prepared from a freshly prepared hard chromium
plating solution is shown in Figure 7. A magnification factor of 1000 was used. The
micrograph shows some macro-cracks which are typical of chromium plating. The grains
are observed to be relatively uniform and appear to form a continuous layer. Figures 8-a
and 9-a are the micrographs of deposits produced from set 1 and set 2 solutions whereas
Figures 8-b and 9-b are the micrographs of deposits produced from purified set 1 and set
2 solutions respectively. In comparison with the micrograph obtained for hard chromium
deposit (Figure 7), micrographs of the deposits produced from the as-received set 1 and
set 2 solutions appear to have grains whose boundaries do not touch one another and give
18

the appearance of being 'burnt' deposits. However, when the set 1 and set 2 solutions
were purified by the application of electrical fields and then deposits were produced the
micrographs show that the plating obtained has characteristics (see Figure 8-b and 9-b)
which are very similar to that of the deposits produced from freshly prepared hard
chromium plating solution (Figure 7).
3.3 Kinetics of Impurity Removal
3.3.1 Model Development
The following assumptions are implied in the development of the mathematical
model presented below:
i) the movement of impurities from the anode compartment to the cathode is governed by:
a) electromigration due to the opposite charges present on metal ions and the cathode;
b) diffusion due to concentration gradients; and
c) convection caused by the stirring of the solution;
ii) the pH of the solution does not change over the course of the reaction and hence no metal precipitation or sludge formation occurs;
iii) metal deposition at the cathode;
iv) insignificant resistance offered to the movement of ions by the porous membrane;
v) unidirectional movement of ions; and
vi) Initially the impurities are present in the anode compartment only.
19

The approach presented below involves performing mass balances over individual
ionic species in the anode and cathode compartments whose movement is caused by the
application of constant voltage across the anode and cathode.
The flux of ions of species i is given by (13):
aCi a¢J. =-D.--u.c.-+c.v(x) (7)
I I I I Iax ax
where the first, second and third term respectively represent flux due to diffusion
gradient, electromigration and convection. In equation [7], D is the diffusion coefficient,
C is the concentration, x is the separation distance, ¢ is the potential and vis the velocity
causing the convection. The mobility, Ui of species i is given by:
IZiFDil u· -~--..;. (7-a)1 - RT
where, z is the charge on the ion, F is the Faraday constant, R is the universal gas
constant and T is the temperature in K.
Material Balance (Species) Over Anode Compartment
The decrease in the mass of the migrating species i equals its flux multiplied by
the surface areaAp of the diaphragm, hence, using equation (7), we obtain:
(8)
where Va is the volume of the anode compartment. The diffusion and convection terms
are represented by an aggregate term that contains the mass transfer coefficient, kma,
hence the above equation can be rewritten as:
20

(9)
The above equation is simplified as shown below:
(10)
(la-a)
(1 a-b)
and
(la-c)
Material Balance (Individual Species) Over Cathode Compartment
The net change in the mass of the cation migrating to the cathode equals its rate of
transport minus the rate of electrodeposition.
dc. [ac. a¢ ][Ap J A~= -D.~-u. c. -+c. v(x) - -k ~c. (11)dt 1 ax lC lC ax lC V C V lC
C C
The second term on the right hand side represents the amount electrodeposited.
The rate constant, kc, is a function of the electrode potential as determined by the Butler-
Volmer equation. The diffusion and convection terms are represented again by an
aggregate term that contains the mass transport coefficient, Kma, hence we have:
(12)
The above expression can be rewritten as:
(13)
21

Ach (Y (I3-a)were =
2 V c
(I3-b)
(I3-c)
and,
(I3-d)
The two coupled first-order differential equations (10) and (13) are solved using
the initial conditions: t = 0: Cia = Cio, and Cic = o.
The solution to the differential equations is given by the following expression: [See
Appendix I]
(14)
and
(15)
where the exponents ml and m2 are given by:
(16)
Thus, equations (14) and (15) describe the dynamic concentrations of individual
ions in the cathode and anode compartments.
22
3.3.2 Kinetic Data and Model Validation
The metal concentration vs. time plots for both anolyte and catholyte are given in
Figures 10-12. In these experiments o-phosphoric acids were used. As expected, the
anolyte ion concentration is observed to initially decrease sharply with time and then
the rate decreases asymptotically. The catholyte ion concentration, on the other
hand, increased initially and reached a maximum and then decreased with time. The
initial increase in concentration of metallic ions in the catholyte is due to the
movement of ions to the cathode due to electromigration and concentration
gradients. However, upon a sufficient build-up of concentration, the metal
deposition ensues which results in a decrease in the catholyte metal concentration.
This behavior is more pronounced in the case of nickel and copper migration to the
cathode compartment as seen from Figures 11 and 12. The data on the experimental
parameters and the amount of metal removal are presented in Tables 7 and 8. For
example, 36.4% and 29% decrease in iron and nickel removal was observed in 24.4
and 25.4 hours, respectively. Up to 32% copper removal was observed in 7 hours.
The rate of copper removal was found to be 300% times as great as the rate of nickel
removal while the rate of iron removal was found to be 30% greater than the rate of
nickel removal under similar experimental conditions.
23

Table 7: Experimental conditions for the validation of the kinetic model for
removal of impurities.
Iron Nickel I Copper
Parameter Voltage, V
6.0 6.0 3.0 5.5 6.51
Apa (dm2 ) 5.02 4.95 5.50 4.83 4.77
Va (dm3 ) 1.95 1.94 1.79 1.91 1.89
V (volts) 5.00 6.50 3.00 5.50 6.51
x (cm) 4.00 4.00 4.00 4.00 4.00
Ape (dm2 ) 4.32 4.26 4.73 4.15 4.10
Ae (dm2 ) 0.07 0.07 0.07 0.07 0.07
Ve (dm3 ) 0.74 0.76 0.69 0.75 0.74
crI (m-I) 25.70 25.55 30.72 25.27 25.26
cr2 (m-I) 0.950 0.950 0.901 0.895 0.895
cr3 (m-I) 58.46 56.18 68.12 55.32 55.27
Table 8: Metal Ion Removal
Experiments were carried out using applied cell voltage of 6.0 V. Other
experimental conditions as in Table 1.
Iron Nickel Copper
Initial concentration, mg/l 1,604 1,560 1,360
Final concentration, mg/l 1,020 1,108 924
Length of Experiment, h 24.4 25.4 7.0
% decrease in concentration 36.4 29.0 32
% decrease in concentration per unit time, h- I 1.49 1.14 4.57
24

The equations developed in this model (Equations 12 and 13) were used to predict
the concentration vs. time data. Using the experimental data, the mass transfer
coefficient (kma), the heterogeneous rate constant (ke), the mobility (Ui) and the diffusivity
(D i) were calculated (Table 9). The constants evaluated from the experimental data using
the model developed are in general agreement with the experimental values published in
the literature (13-15). The comparison between the predicted and published data (14) for
the ionic mobility and diffusivity for nickel, iron and copper are provided in Table 10.
An excellent agreement between the two values are observed for nickel and copper.
However, in the case of iron, the model predicts slightly larger values for mobility and
diffusivity. The reason for this observation may be due to the chromic acid - iron system
used in this study. A good correlation between the experimental data and the predicted
concentration vs. time data for the movement of three ions of iron, nickel and copper is
obtained (Figures 10-12). The model fit assumes that nickel and copper electrode
position begins 3 and 2 hours after the beginning of the experiments, respectively. The
iron deposition was estimated to occur since the start of the experiment. The data
obtained at various applied voltages for copper electromigration was further evaluated
according to the following analysis. The flux near the surface of the cathode can be
approximated by: kc (Cic - 0) =kccic, since the metal deposition at the cathode can be
neglected. In addition, the potential gradient, 8rjJ can be approximated as E/4 where E is ax
the potential at the cathode and t5is the diffusion layer thickness at the cathode. Similarly
8Ci can be approximated by Cic . Substitution of these approximate values into equation ffi g
(7) allows us the determination ofE according to the following expression:
25

(17)
Assuming t5 to be 20 Ilm, the cathodic potentials for copper deposition for a 2
electron transfer process are calculated (Table 11). Using the Butler-Volmer expression
for copper deposition, the standard heterogeneous rate constant (ko), the symmetry factor
(a), and the number of electrons transferred (n) are calculated and reported in Table 11.
The r 2 value for the regression fitting was greater than 0.98. In addition, the data show
that the calculated values are in good agreement with the data known as kinetics of
copper electrodeposition (15). This analysis further validates the model developed in this
study.
Damjanovic, Setty and Bockris (15) have studied the mechanism and kinetics of
electrocrystallization of copper on copper.
Table 9. Estimated physical parameters for the removal of metallic impurities
Nickel Iron Copper
Cell Voltage, V
kma (m/hr)
kc (m/hr)
Ui (m2IV-hr)
Di (m2/s)
6.0
8.48 * 10-4
2.19 * 10-2
2.17*10-5
0.84 * 10-10
6.0
28.79 * 10-4
1.16 * 10-2
15.9 * 10-5
6.09 * 10-10
3.0
3.26 * 10-4
1.01 * 10-2
7.22 * 10-5
2.75 * 10-10
5.5
5.39 * 10-4
9.26 * 10-2
4.77 * 10-5
1.85 * 10-10
6.51
3.96 * 10-4
10.17 * 10-2
4.05 * 10-5
1.32 * 10-10
26

Table 10. Comparison of model predicted with published data.
Published Model Predicted
Di Ui Di Ui
Nickel 0.88* 10-10 7.09 * 10-5 0.84 * 10-10 2.17 * 10-5
Iron 0.96 * 10-10 5.04 * 10-5 6.09 * 10-10 15.9 * 10-5
Copper 0.95 * 10-10 6.70 * 10-5 1.32*10-10 7.22 * 10-5
Table 11: Estimated Parameters of the Butler Volmer Equation for Copper Deposition
Parameter
8 (Jlm) 20
an 1.496
ko (m/hr) 4.35 * 10-3
a (n=2) 0.748
2 r 0.98
They derived the following approximate expression for the rate of growth (P) of
the deposits as a function of the current density (1):
P=3.751 (12).
For the current density (16.87 mNcm2) used in this study, the rate of growth is calculated
to be 63.3 Ns. It was observed by Damjanovic et. al. (15) that the actual rate of a
macrostep propagation is about 7 times larger than the calculated value. This implies that
the rate of propagation of a macrostep is about 442.8 Ns.
27

Since the surface of the deposit produced is not smooth but of the shape of a
pyramid, the expression for the growth rate is rewritten in the following form:
growth rate =Po + 3.751 cot y
where y is the inclination of the pyramidical surface of the deposit with the substrate.
The value for Po observed by Damjanovic (15) is 55 Ns where as the angle y from our
deposits is around 0.5°. According to the above equation, the rate of growth is 7304 Ns
or approximately 0.0026 m/hr. The observed rate from our experiments is 0.004 m/hr.
Based upon the above analysis, it appears that since the theoretical rate of growth and
observed rate of growth are of the same order of magnitude, the model developed in the
paper appears to be valid.
One of the important assumptions of this model is that the cathode pH does not vary
greatly so as to cause metal precipitation or sludge formation. Figure 13 is a plot of
the catholyte pH vs. time. The data show that for the duration of the experiment, the
solution pH did not change significantly enough to cause metal precipitation. In the
case of nickel and copper removal, the solution pH did increase somewhat. We
ascribe this change to the evolution of hydrogen gas at the cathode. The hydrogen
ions could electromigrate from the anode to the cathode, and thus offset the increase
in the catholyte pH, as seems to be the case for pH vs. time behavior during iron
removal.
28

3.4 Regeneration of Hexavalent Chromium
3.4.1 Model Development
In the analysis presented below, the two ionic species of chromium, i.e. trivalent
chromium Cr3 + and dichromate anion CrXOy
2- are considered. For the sake of simplicity,
we will consider that complete chromium reduction Cr6+ OC r 0 involves only dichromate
ions and disregard higher polychromates. The movement of ions is assumed to be
governed by concentration gradients and electromigration according to the flux equation
(7). The diffusion and convection terms in equation (7) are lumped together by an
aggregate term that is characterized by the mass transfer coefficient, Kmi, and therefore,
the flux equation can be rewritten as:
(19)
The development of the following mathematical model includes performing mass
balances on the two chromium species for each of the two compartments of the
electrochemical cell. The anode and cathode concentrations are represented by letters x
and y respectively, and subscripts 1 and 2 represent Cr3+ and ~Oy2:, respectively.
Implicit in the model is the assumption that the resistance offered to the transfer of ionic
species by the porous membrane is negligible. It is also hypothesized that the electrode
potential at the anode and cathode remain constant over the course of experiments and
hence, the rate constants for various electrochemical reactions listed below can be
assumed to remain invariant.
Cr 3+ K OJ ) Cr 6+ ~s CrxO y 2- ] (anode)
Cr6+ K 02 ) Cr 3+ (cathode)
Cr6+ K 03 ) Cro (cathode)
29

A. Cr3+ Balance
The schematic block-diagram for the movement of trivalent chromium ions is
presented in sketch below.
Anode + Cathode -
Yl
t
rate == Kojxj rate == K 02Y2
Anode:
'The mass balance for trivalent chromium ions in the anodic chamber can be
written as:
On rewriting the above expression, it assumes the form presented below:
dX1-=-aIxI +bIYI dt
The constants, aj and bj , are listed in Table 12.
(20)
Cathode:
Similarly for the cathode chamber, the mass balance expreSSIon for trivalent
chromium is given by:
which can be rewritten as:
dYI I bl I-=aIxI - IYI +CIY2 (21) dt
The constants, aj ~ bj ' and ej', are listed in Table 12.
30

B. ~OX2- Balance
The following sketch shows the fate ofCrxOy2
- anion during the process.
Anode + Cathode
rate == K03Y2
t kGlCr3+ ) Cr6+ [as Cr O;2 ] x
rate == KOlx1 rate == K 02Y2
For the trivalent chromium speCIes, the differential mass balances on the
chromium anIon for anode and cathode compartments are gIven by the following
equations:
(22)
(23)
Coefficients of the equations (20) - (23) are listed in Table 12. The four coupled
equations (Eqs. 20-23) are solved by an elimination of variables method outlined in
Appendix II. The solution for concentration Xl, X2, Yl and Y2 involves estimation of
exponential terms as listed in Appendix II.
31
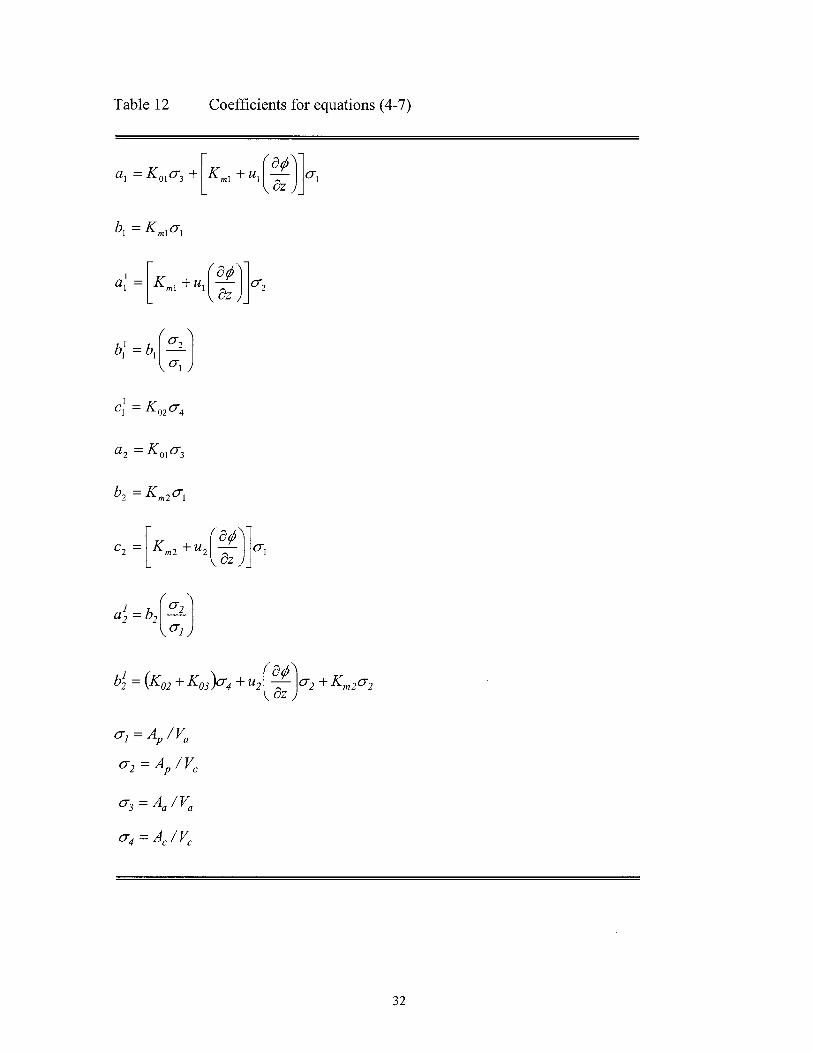
Table 12 Coefficients for equations (4-7)
(Jj = Ap IVa
(J2 = A IVcp
32

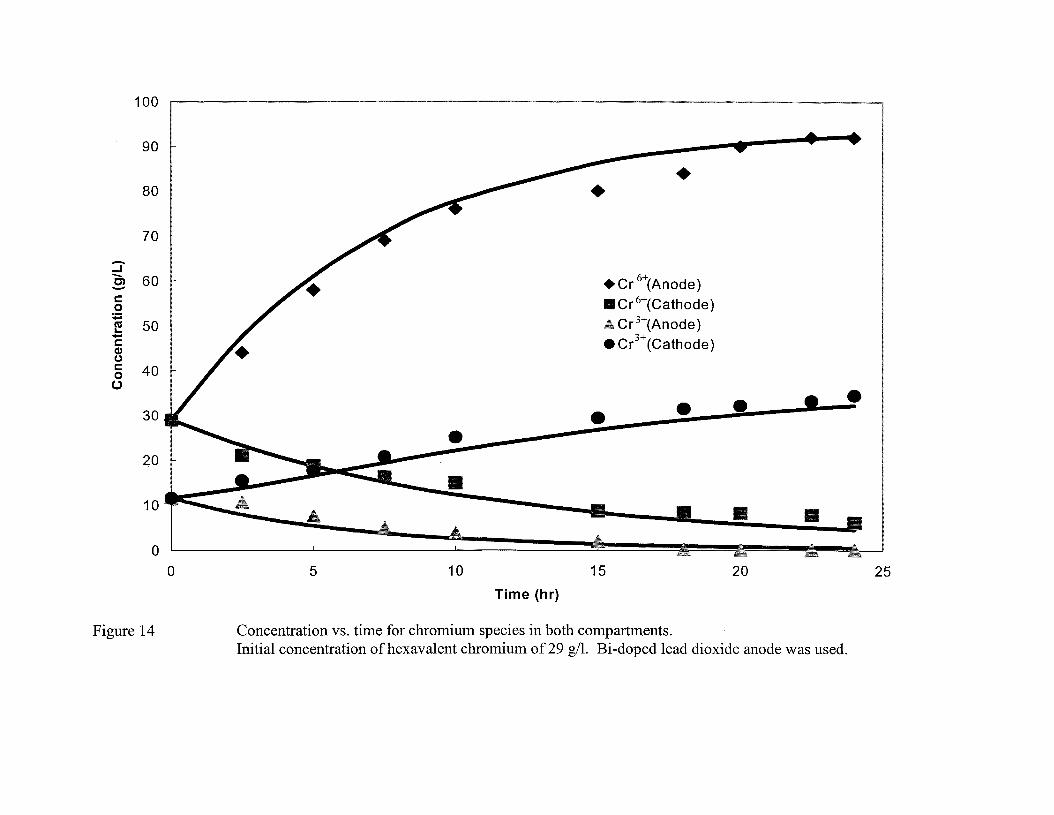
3.4.2 Kinetic Studies and Model Validation
A total of 4 figures (Fig. 14-17) represent the data on hexavalent chromium and trivalent
chromium concentration vs. time from four experiments. The initial hexavalent
chromium concentration in these four experiments was kept at 29, 98, 108, and 127 gil,
while the total chromium concentration in all the experiments (except for the experiment
in which initial hexavalent chromium concentration of 29 gil was used) was maintained
at 130 gil (corresponding to 250 gil ofCrO)). Bi-doped lead dioxide on Pb02 coated lead
substrate was used as anode for these experiments. A more dilute solution (43 gil of total
chromium) was used for the experiment that involved initial hexavalent chromium
concentration of 29 gil. Both Bi-doped lead dioxide on Pb02 coated lead substrate and
anodized lead were used for regeneration via reoxidation of hexavalent chromium. The
amount of trivalent chromium was adjusted to maintain the total chromium concentration.
2.5 gil of sulfate, which acts as a catalyst for chromium deposition, was added. A
constant voltage of 5 V was applied across the electrochemical cell which was
maintained at a temperature of 45 aC. The data show that for the experiment using low
initial concentration of chromium, the concentration of regenerated hexavalent chromium
increases rather rapidly in the anode compartment. As an example, the hexavalent
chromium concentration increases by about 218% in about 23 hours (Figure 14) when the
initial hexavalent chromium concentration in the solution is 29 gil. The trivalent
chromium concentration decreases with time and reduces to a negligible amount at the
end of the experiment. As expected, the hexavalent chromium concentration in the
cathode compartment decreases with time due to its migration to the anode as well as by
reductions to trivalent chromium and to the metallic chromium at the cathode. When an
33

initial chromium (Cr 6+) concentration of 98 gil was used, the data show that its
concentration initially increases with time in the anode compartment, reaches a maximum
of about 120 gil and then declines somewhat with further increase in time. The initial
increase in concentration is attributed to electromigration of hexavalent chromium from
the cathode to the anode as well as electrocatalytic anodic oxidation of trivalent
chromium to hexavalent chromium. However, when the hexavalent chromium
concentration in the anode compartment is significantly greater that that in the cathode
compartment, mass transfer rate of the hexavalent chromium from the anode to the
cathode compartment (back diffusion) becomes significant in comparison to its rate of
electromigration from the cathode to the anode. In addition, the rate of hexavalent
chromium regeneration decreases with time due to a decrease in the trivalent chromium
concentration in the anode compartment. The increase in hexavalent chromium
concentration for relatively large initial concentrations of hexavalent chromium (Figure
16 and 17) was relatively modest. Nonetheless, the maximum chromium concentration
of 130-135 gil is achievable. In order to compare the effect of various anode materials on
the increase in hexavalent chromium concentration, one experiment using lead dioxide as
anode (at the lowest Cr6 + initial concentration of 29 gil) was carried out. The data in
Figure 18 show that Bi-doped Pb02 is much more effective to its Pb02 counterpart in that
the hexavalent chromium concentration increases much more rapidly with time due to its
use. Whereas the use of Pb02 coated lead anode results in only 67 % increase, the Bi
doped Pb02 results in about 218 % increase in hexavalent chromium concentration under
identical experimental conditions.
34

The experimental data shown in Figure 14-18 were fit to the mathematical model
developed in this paper (Appendix II). The constants described in the model were
estimated using the Levenberg-Marquadt algorithm for non-linear parameter estimation
[16]. The objective function was to minimize the total errors between experimental and
predicted values for each species after normalization with the measurement error under
the constraint that the errors for individual species were also minimized. The values of
constants of integration, C/s, were determined analytically by solving for the initial
conditions, once the remaining constants were determined. The results of the parameter
estimation and the comparison of the experimental values versus predicted values are
provided in the following paragraphs.. The results are shown in Tables 13, 14 and 15.
The results presented for Table 13 corresponds closely to that found in literature
[14]. For example, the mobility of trivalent chromium was found to be 30.2 *10-5 m2/V
hr, while that reported in literature is that of20.5 * 10-5 m2/V-hr. The estimated values of
the mass transfer coefficients show that the complex chromate anions have a greater
mobility as compared to that of the trivalent chromium cation. Table 14 shows that all
the exponents (m/s) of the terms describing various concentrations in the mathematical
model are negative. Thus, the rates of change in concentration decreases with time and
may eventually change the direction of change. This is reflected in the fact that the
concentration of hexavalent chromium in the anode chamber decreases while that in the
cathode chamber increases after around 20 hours of running the experiments. The anodic
and cathodic potentials were monitored as a function of time. The data shown in Figure
19 reflect that the assumption made in the mathematical analysis, that the potentials are
almost invariant with time is valid.
35

As seen in Table 13, the rate of oxidation of trivalent chromium to hexavalent
chromium is found to be over 4 times greater in the case of the Bi-doped anode than that
of the simple commercial Pb02 coated lead electrode for the same applied voltage and
same initial concentrations and is reflected in the concentration of hexavalent chromium
in the anode chamber as seen in Figure 18. The reason for this improvement can be
explained through the following mechanism that was provided by Hsiao and Johnson
[17]. According to this mechanism the labile surface-bound oxygen atom is generated as
an intermediate product of the hydrogen evolution. These oxygen atoms probably exist
as adsorbed hydroxyl radicals. These oxygen atoms are then transferred to the products
of the electrocatalyzed anodic reactions as shown in Eq [24]-[25], where M[ } represents
the unpopulated surface site, R is the reactant and RO is the product of one oxygen
transfer reaction. The rate of concurrent evolution of oxygen (Eq [26]) is to be reduced
for efficient O-transfer reactions.
M[ }+H20~M[OH}+H++e (24)
M[OH}+R~M[}+RO+H++e (25)
M[OH} + H 20 ~ O2 +3H+ +3e- (26)
In order to achieve this goal, a suitable electrode has to be found with high
oxygen evolution overpotential such as lead or lead dioxide. When using doped lead
dioxide electrodes, hydroxyl atoms are adsorbed on the doped (Bi) sites at an enhanced
rate and are transferred to the lead sites for the O-transfer to take place. Thus, an ideal
anode for enhanced O-transfer reactivity can be envisioned as an inert matrix having a
large oxygen evolution overpotential into which is incorporated a low-density array of
36

catalytic sites characterized by low O2 evolution overpotential. Owing to the low area of
the sites, the background current for oxygen evolution would be minimal. However, a
high flux of the diffusing reactant exists at the sites. If the inter-site distances were less
than the diffusion layer thickness, highly efficient oxygen transfer reactions can be
expected at the electrode.
Table 13. Estimated physical constants.
Bi-doped Pb02 anode Pb02 anode
kml (m/hr) 27.1 * 10-5 27.1 * 10-5
km2 (m/hr) 90.2 * 10-5 90.2 * 10-5
kOl (m/hr) 66.8 * 10-3 15.8 * 10-3
k02 (m/hr) 13.8 * 10-3 13.8 * 10-3
2 .Ul (m IV-hr) 30.2 * 10-5 30.2 * 10-5
U2 (m2IV-hr) 80.9 * 10-5 80.9 * 10-5
k03 (m/hr) 1.8 * 10-3 1.8 * 10-3
Table 14. Estimated values for the exponents in Eq. B8, BI0, Bll, and B12.
Bi-doped Pb02 anode Pb02 anode
Initial Cr6+ 29 gil 98.5 gil 108 gil 127 gil 29 gil
ml
m2
m3
m4
-0.1510
-2* 10-5
-0.0865
-0.1401
-0.0759
-0.1505
-0.1374
-0.0050
-0.1517
-0.0042
-0.0854
-0.1099
-0.1514
-0.0052
-0.0599
-0.0775
-0.0990
-0.0865
-0.0032
-0.1839
37

Table 15. Estimated values for the coefficients in Eq. B8, B10, B11, and B12.
Bi-doped Pb02 anode Pb02 anode
Initial Cr6+ 29 gil 98.5 gil 108 gil 127 gil 29 gil
Cl
C2
C3
C4
12.5921
0.3487
-1.1487
-0.2921
-3.4420
37.3673
-3.9532
1.5378
32.3238
1.6628
-5.5645
1.8779
5.8767
2.5706
0.7947
-6.1420
2.9894
9.6771
-0.6987
-0.4678
4. GUIDELINES FOR PRACTICAL OPERATIONS
Based upon our research and experience we suggest the following:
1. The cathode compartment should contain freshly prepared hard chromium
plating solution as an electrolyte
2. A current density of 15.6 Nft2 or a cell voltage of6-8 V is recommended.
3. After about 12-14 hrs of operations, the lead cathode should be removed
and the deposits consisting of metals need to be removed. Thereafter, new
freshly prepared catholyte ought to be used.
4. The catholyte, concentrated with metallic impurities could either be
treated with an appropriate adsorbent to extract metals or its pH can be
raised to precipitate the metals.
5. A note of caution. When the applied current (or voltage is turned off, the
porous pot must be removed immediately from the tank so as to prevent
any back diffusion of impurities from the solution in the cathode chamber
to the plating solution.
38

5. CONCLUSIONS
The research has shown that application of voltage across the two electrodes
placed in a solution containing metallic impurities results in the migration of metal
cations in the cathode compartment. The impurities are concentrated in the catholyte and
can be removed either by electrodeposition or precipitation (which is brought about by
the increase in solution pH). Chromic acid appears to a suitable choice as a catholyte
because it is readily available in chromium plating shops, it is inexpensive and offers
very little solution resistance. Research has shown that trivalent chromium is effectively
regenerated at Bi-doped lead dioxide anode. The properties of chromium deposits
produced from the regenerated plating solutions are far superior to those obtained from
contaminated plating solutions and are comparable to the properties of the deposits
obtained from freshly produced hard chromium plating solutions. Although the mobility
of ions is slow, nonetheless the approach described here for plating solution purification
and regeneration is used in the industry over the weekends and during the night when the
bath is not utilized for plating purposes. This purification process does not require any
supervIsIon.
39

NOMENCLATURE
A: area, cm 2
C: constant of integration
c: concentration, moles/cm3
D: diffusivity, m2/s
E: potential at the cathode, V
F: Faraday constant, 96485 coulombs/equiv
F: Faraday constnat, 96485 coulombs/equivalent
I: current density, Ncm2 , Nft2
J: flux, moles/m2 -s
K: heterogeneous rate constant, m/s
heterogeneous rate constant, m/s
mass transfer coefficient, m/s
n: ionic charge (integer)
P: growth rate, m/s
R: universal gas constant, 8.314 J/mol-K
t: time, s
T: temperature, K
u: ionic mobility, m2/V-s
V: volume, m3
x: separation distance, m
x: anodic concentration, moles/m3
y: cathodic concentration, moles/m3
40

z: charge
z: separation distance, cm
Greek letters
v: velocity, m/s
potential, V
8: diffusion layer thickness, m
y: inclination of the pyramid surface
Subscripts
1: Cr3+
a: anode
c: cathode
m: mass transfer coefficient
. .1: speCIes
p: porous pot
0: time = 0
01: oxidation of trivalent chromium
02: reduction to trivalent chromium
03: chromium deposition
41

REFERENCES
1. Chessin, H., and Knill, E.C., Plating and Surface Finishing 73,8 (1986),26.
2. Boyce, A.R., and Kavanaugh, D.J., Proceedings of 9th AESF/EPA Conference
on Environmental Control in Metal Finishing Industries (1980).
3. Mandich, N. V., Li, C-C, and Selman, J.R., Practical and Theoretical Aspects
of Regeneration of Chromic Acid Plating Solution, via Electrolytic
Purification, Plating And Surface Finishing, 84, 12. (1997).
4. Guddari, M., Holsten, C., Li, C.-C., and Mandich, N.V., "The Use of Porous
Ceramic Diagrapham for the Removal of Metallic Impurities from Chromium
Plating Baths," J. Appl. Electrochemistry, accepted for publication.
5. Reid, F. H., and Goldie, W., Gold Plating Technology, Electrochemical
Publications, Glasgow, U.K., 7 (1974).
6. Mandich, N. V., "Chemistry and Theory of Chromium Deposition - Part I,"
Plating and Surface Finishing, 81, 108-115 (1997).
7. Mandich, N.V., "Removal of Metallic Impurities from Plating Solutions by
Electrocoagulation," AESF Chromium Colloqium, Orlando, FL (Jan. 1994).
8. Lalvani, S.B., Mandich, N.V., "Removal of Metallic Impurities in Chromium
Plating Solutions by Electrocoagulation," Illinois Waste Management and
Research Center, Champaign, IL, Project No. 97025, (1997).
42

9. Vora, R. J., Taylor, S. R., and Stoner, G. E., "Factors Affecting the
Perfonnance ofPb02 Anodes in the Generation of Hexavalent Chromium" in
F. Hine et al. (Eds), Proceedings of the Symposium on Perfonnance of
Electrodes for Industrial and Chemical Processes, The Electrochemical Society,
(1989) 279-289.
10. Mayne, J. E. 0., "Inhibition of Corrosion of iron and Aluminum", British
Corrosion J. 31 (3),232-234 (1996) .
11. Lalvani, S.B., Wiltowski, T., Weston, A., and Mandich, N.V., "Removal of
Hexavalent Chromium and Metal Cations by a Novel Carbon Adsorbent,"
Carbon, 36, 7, 1219-1224 (1998).
12. Mandich, N.V., Lalvani, S.B., and Wiltowski, T., "Selective Removal of
Chromate Anion by New Carbon Adsorbent," Metal Finishing, 96, 39-45,
(1998).
13. Bard. A. J., and Faulkner, L. R., Electrochemical Methods- Fundamentals and
Applications, John Willey and Sons, Inc." New York, USA (1980).
14. Guddati, S. L., Holsen, T. M., and Selman, J. R., "Optimization of Porous
Ceramic Diaphragm Cell Operation for the Removal of Metallic Impurities
from Chrome Plating Bath", Report for Summer Research Grant Program,
AESF, Orlando, FL (1995)
15. Damjanovic, A., Setty, T. H. V., Bockris, J. 0' M., " Effect of Crystal Plane on
the Mechanism and Kinetics of Copper Crystallization", J. Electrochemical
Society, 113, 5, 431-440 (1966)
43

16. Ratkowsky, David A., Nonlinear Regression Modeling, A Unified Practical
Approach, Marcel Dekker, New York (1983).
17. Hsiao, Y-L. and Johnson, D. C., "Electrocatalysis of Anodic Oxygen Transfer
Reactions: Chlorine Doped Lead Dioxide Electrodes", J Electrochemical Soc.,
136 (12), (1989) 3704-3711.
44

APPENDIX I
Consider the two coupled first ordered differential equations:
dy-+a1y=a2 x (AI)dt
(A2)
I dy a 1from (AI): x=--+-y (AI') a 2 dt a 2
differentiate (AI) w.r.t. time, t:
d 2 y dy dx --+a -=adt 2
1 dt 2 dt
Substitute (A2) in the above equation
Substitute (AI') in the above equation and rearrange the terms:
the solution to above second order differential equation is given by:
(A3)
where the exponents are given by
substitute (A3) into (AI '):
(A4)
45

using the initial conditions, t == 0; Y== 0 and x == Cia, we solve for constants a and band
their substitution equations (A3) and (A4) yields the following:
(A5)
and
46

Appendix II
Consider the following coupled differential equations:
(Bl)
(B2)
(B3)
(B4)
From Eq. (Bl):
(Bl-a)
Substitution ofEq. (Bl-a) into Eq. (B2) and solving for Y2 gives
(B5)
where (i)
(ii)
Substitution ofEq. (B5) into Eq. (B4) and solving for X2 gives:
(B6)
where p = q + b~ (iii)
f = r-q b~ (iv)
47

g -rbl - 2 (v)
Substitution ofEqs. (B5) and (B6) into Eq. (B3) and solving for Xl
Solution to the above fourth order differential equation is given by:
(B8)
where 0 is the constant of integration and the four exponents, mj are given by the roots of
the algebraic expression:
(B9)
Substitution of Xl from equation (B8) into equations (B6), (B I-a) and (B5) yields the
following expressions:
(BIO)
(BII)
(BI2)
48

--- ----
Cylindrical Lead Cathode
Ceramic Pot
Cylindrical Lead Anode
Spent Solution
Figure 1 A Sketch of Electrochemical Reactor used in the Laboratory


60
50 •~~.------------.---------~ / • sodium monophosphate I • • o-phosphoric acid I40 -A-sodium perchlorateI
I -e-- chromic acid
• -10
o 5 10 15 20 25 30 35
Time (hrs)
Figure 3. Iron Removal vs. Time
......-...
~ 30 co > o E ~ 20 CD u..
10
o
I I
I I I I I I I I I
....... ~ ~~
~~ ,~
,"

tfII
1.00
0.90 • 0.80 • 0.70
0.60 .... .. - . -.. -. . -. - . . - - . - - - - . - - .. .+- -. _.• ~
~
~
~
~
:a 0.50
0.40
0.30
-. 'Anolyte0.20 • Catholyte
0.10
0.00
o 5 10 15 20 25
Time (hrs)
Figure 4 pH vs. Time

70
•••••••••••• .. -... -- ..-. 20
10
60 t -. 'sodium monophosphate
• Chromium
• a-phosphoric acid
50
~
0
~ 40 co >0 E Q)
30So...
Z
o 5 10 15 20
Time (hrs)
25 30 35
Figure 5. Nickel Removal vs. Time Catholytes: O-phosphoric Acid and Sodium Monophosphate

50
45 -Nickel
• Iron 40
35 ....-.... ~ 0
......" 30 co >0 E 25 Q)
0:::
2 20 Q)
~
15
10
5
0_
0 5 15 20 2510
Time (hrs)
Figure 6. Nickel and Iron Removal vs. Time Catholyte: Chromic Acid (2.5 M)

Figure 7: Micrograph of chrome plate deposited from pure hard chrome.plating solution

(a) impure (b) rejuvenated
Figure8: Micrographs of chrome plates deposited from Set 1 solution

(b) rejuvenated(a) impure
Figure 9: Micrographs of chrome plates deposited from Set 2 solution

1600 •
1400
/AnOlyte1200 l ... ..
....-.... I :::::::: ~ 1000 '-'
c 0
+:i 800ro L...... C Q) Calculated(.) I
0c 600 ()
400 I
200 I .. 6 • • .....
,
5 10 15 20 25
Time (hrs)
Figure 10 Concentration vs time for iron

1600
Anolyte1400
1200
......-....
en 1000 E
..............
c o :; 800 L..
+-' C Q) CalculatedU
§ 600 CatholyteU
400
200
o. ' o 15 20 25 30
Time (hrs)
5 10
Figure 11 Concentration vs time for nickel

J-
I
I
.
J
1600
1400
Anolyte1200 ~
/ ..-... 0,1000 E
'--""
c 0 ~ 800 L.. ....... c CalculatedQ)
5 ()
600 ()
/cathOlyte
400
...~
200 • at. • 0
0 1 2 3 4 5 6 7 8
Time (hrs)
Figure 12 Concentration vs time for copper

-----------
3
- -+-- -Iron
--Nickel 2.5 - ..- Copper
",.- -.2 ........ ",
-- ------+ -----..----------------. I 1.5c.
1
0.5
o ' , o 5 10 15 20 25 30
Time (hrs)
Figure 14 pH of catholyte vs. time
100
90
•80 • 70
.---. -I """--- 6+en 60 +Cr (Anode)~
c: • Cr 6+(Cathode)0 ;::; ns 50 Cr 3+(Anode)...I c: • Cr3+(Cathode)(1) 0 c: 400 0 - 30 -
20
10 • 0
0 5 10 20 2515
Time (hr)
Figure 14 Concentration vs. time for chromium species in both compartments. Initial concentration of hexavalent chromium of29 gil. Bi-doped lead dioxide anode was used.

120
140
100
..-..
...J ........ en +Cr6+(Anode)--- 80r::: .Cr 6+(Cathode)0.. co .aCr 3+(Anode) s...., r::: • Cr 3+(Cathode)
o
20
(I) 60u
r::: ~0 I ~ - II(J
40
o 5 10 15 20 25
Time (hr)
Figure 15 Concentration vs. time for chromium species in both compartments. Initial concentration of hexavalent chromium of98.5 gil. Bi-doped lead dioxide anode was used.
160
140
120
::r 100
-......... C) +Cr6+(Anode)~
s::: 0 II Cr 6+(Cathode) ;:;
C'CS 80 aCr 3+(Anode)~ ~
s::: .C~+(Cathode)(1)
o o 5 10 15 20 25
Time (hr)
Figure 16 Concentration vs. time for chromium species in both compartments. Initial concentration of hexavalent chromium of 108 gil. Bi-doped lead dioxide anode was used.
20
40
0 s::: 0 600

20
0
160
140
120
.-.. ~ 100 tn
"-"
0 ~
; ns 80... ~ +Cr6+(Anode)~ (1) u II Cr6+(Cathode 0 ~
£.Cr3+(Anode) )600 ~ eCr 3+(Cathode)
~
40 ~ / ~ • •~I /
...~ ~ A I
o 5 10 15 20 25 30
Time (hr)
Figure 17 Concentration vs. time for chromium species in both compartments. Initial concentration ofhexavalent chromium of 127 gil. Bi-doped lead dioxide anode was used.

• • •
• •
100 r- -~""-'''''''~~~~-~'''''~----...._-_....~ ~--,- ....II
----..--.•..•90 t ... ... .. . ..-.. ::::: 80 -.. m 111
"'-"
E •.'. :::s "" -E 70 0
•~
L. --" .t: ....,(.)
60 ~#.c: (I)
(ij > 6-
I -I
eu 50 .t: I (I) .. .t: I •... 0 ~ 40
I
c: • 0 I :;:; eu L. 30...., c: (I) (.) c: 0 200
10
0
0 5 10 15 20
Time (hours)
Figure18 Concentration vs. time for chromium species in anolyte. Initial concentration of hexavalent chromium of29 gil.
• -Lead dioxide
- Bi doped lead dioxide -
25 30

2
3 r~"--- ~,,~-~~----,~-"'~,-~,--,~"'---~--,----~--'''~'''---,,~--,,-~""~~-~"----~
1.--....
()w I tn tn
~ 0 I ca ;
s::::: Q)... 0 a..
-1
-2
o
--...... -. _..
-----Anode
....Cathode
5 10 15 20 25
Time (hrs)
Figure 19 Potential (V vs. SeE) vs. time.
-3

I~§?j7L:I~/ DEPARTMENT OF
NATURAL RESOURCES