Remote Visualization of Large Scale Data for Ultra-High Resolution
17
Remote Visualization of Large Scale Data for Ultra-High Resolution Display Environment Sungwon Nam, Luc Renambot, Andrew Johnson, Jason Leigh Electronic Visualization Laboratory, University of Illinois, Chicago Byungil Jeong, Kelly Gaither Texas Advanced Computing Center, University of Texas, Austin
Transcript of Remote Visualization of Large Scale Data for Ultra-High Resolution

Remote Visualization of Large Scale Data for Ultra-High Resolution Display Environment
Sungwon Nam, Luc Renambot, Andrew Johnson, Jason Leigh Electronic Visualization Laboratory, University of Illinois, Chicago
Byungil Jeong, Kelly Gaither Texas Advanced Computing Center, University of Texas, Austin

Introduction
• Explosive scientific data size increase – Very difficult to transfer the data – Exceed the capacity of modest visualization systems
• Remote visualization using cyber-infrastructure – Depend on remote HPC resource for retrieving, handling and
analyzing (visualization) data – Users see the result streamed over high-speed networks to their
desktop computer
visualization
image result
simulation storage users’ desktop
Remote HPC resource

ParaView and SAGE
• ParaView : one of the major scientific visualization tools – Well fit to the cyber-infrastructure model – Designed for large-scale parallel visualization – Rendering resolution is limited by remote client and network
• SAGE : Scalable Adaptive Graphics Environment – Assuming ultra-speed network (at least gigabits per second) – High-resolution display helps scientific discovery – Enable remote visualization on ultra-resolution tiled display – Allow users to juxtapose multiple high-resolution visualizations
• ParaView and SAGE integration – Enable remote visualization of multiple large-scale data-sets in ultra-
resolution display environments

ParaView and SAGE Integration
• ParaView servers visualize large-scale data in parallel • Resulting imagery generated on each server is composited and
streamed as a single image to the client (ParaView only) • SAGE interface captures the pixel data from each server and
streams in parallel (ParaView + SAGE)
ParaView servers
composite
simulation storage ParaView Client
pixel steream
< Scientific visualization pipeline using ParaView > < ParaView + SAGE >
Paraview Servers parallel pixel
streams SAGE driving tiled display
SAGE interface

Benefits of the Integration
ParaView servers parallel pixel
streams
ParaView servers
SAGE driving tiled display
• Juxtapose multiple remote ultra-resolution visualizations
• Distribute the visualizations to multiple tiled displays at collaboration endpoints
SAGE-enabled collaboration
endpoints
SAGE Visualcasting
servers
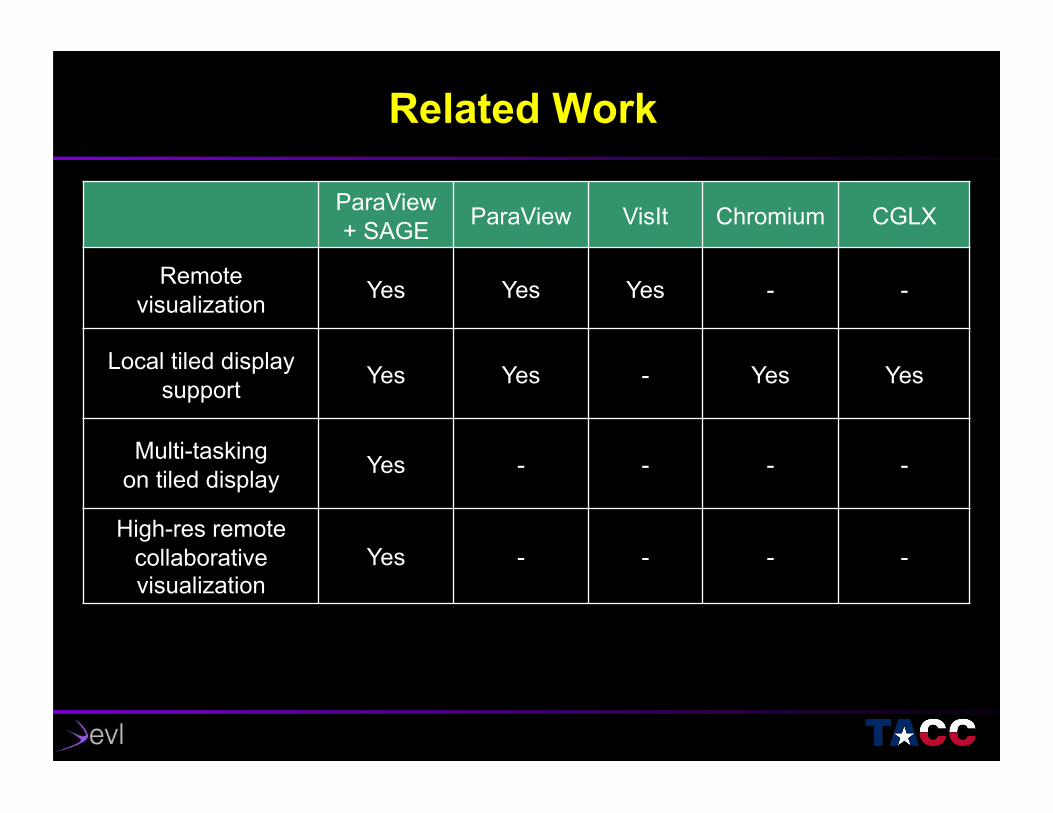
Related Work
ParaView + SAGE ParaView VisIt Chromium CGLX
Remote visualization Yes Yes Yes - -
Local tiled display support Yes Yes - Yes Yes
Multi-tasking on tiled display Yes - - - -
High-res remote collaborative visualization
Yes - - - -
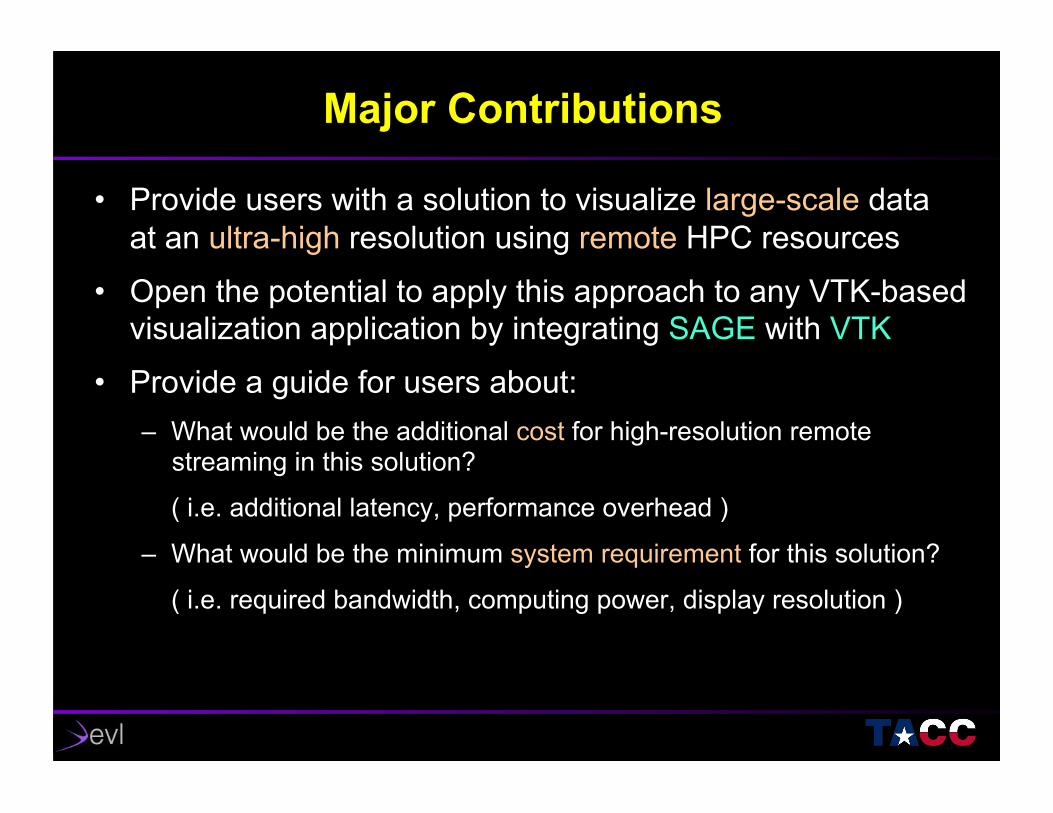
Major Contributions
• Provide users with a solution to visualize large-scale data at an ultra-high resolution using remote HPC resources
• Open the potential to apply this approach to any VTK-based visualization application by integrating SAGE with VTK
• Provide a guide for users about: – What would be the additional cost for high-resolution remote
streaming in this solution?
( i.e. additional latency, performance overhead )
– What would be the minimum system requirement for this solution?
( i.e. required bandwidth, computing power, display resolution )

Video

SAGE Interface in VTK
ParaView Server VTK
RenderWindow
SAIL parallel pixel
streams
• ParaView tiled-display mode - ParaView servers do sort-last rendering and
compositing for each tile
• Insert SAGE interface inside the VTK library which ParaView depends on.

SAGE Components
• Render node
• Display node
€
C1Simage
Nren _ node+C2Nren _ node
€
C1DQ
SimageNrcv _ node
+C2Nrcv _ node +DQ
render capture synch split LAN/WAN
capture delay
sync delay
splitting delay
into buffer
copy to texture synch
LAN/WAN
queueing delay
copy delay
sync delay
display

Experimental Environment
• Render nodes – TACC Spur vis nodes (16CPU cores, 4GPUs, and
128GB RAM per node).
• Display nodes – EVL LambdaVision driven by Yorda cluster – Each node has AMD Opteron 2Ghz, 4GB RAM, – Nvidia Quardo graphics. – Each display node has two 1600x1200 LCD monitors
• Network route – 10Gbps National Lambda Rail (Cavewave) via – San Diego

Frame Rate with Increasing Dataset Size

ParaView + SAGE Delay

Delay Incurred by SAGE

Future Work and Conclusion
• Automatic generation of SAGE configuration
• Integration with other parallel visualization applications
• Remote ultra high-resolution visualization with ParaView integrated with SAGE
– Visualize large dataset using parallel computation and rendering on remote servers
– Stream high-resolution final image over high-speed network to the tiled-display in your lab
• This will motivate more scientists to solve their problems using high-resolution displays and remote HPC resource

Acknowledgements
• This project is supported by grants from the National Science Foundation. – NSF Award CNS-0420477, OCI-0441094, OCI-0225642,
and OCI-0943559
• We would like to thank Alan Verlo, Lance Long (EVL/UIC), Greg Abram, Bill Jones, and Tommy Minyard (TACC/UT-Austin).

Thank you