Space Infrared Telescope Facility Launch Press Kit April 2003

University of Technology, Sydney
Faculty of Engineering
REMOTE VISUALISATION SYSTEM
by
Anil Chandra
Student Number: 99069650
Project Number: S03-148
Major: Software Engineering
UTS Supervisor: Mr Stephen Murray
Industry Co-supervisor: Mr Malte Marquarding (ATNF, CSIRO)
A 12 Credit Point Project submitted in partial fulfilment of the
requirement for the Degree of Bachelor of Engineering.
22 November 2004

Declaration of Originality
I, Anil Chandra, declare that I am the sole author of this document and
have not used fragments of text from other sources without proper
acknowledgement. All theories, results and designs of others that I have
incorporated into this document have been appropriately referenced and
all sources of assistance have been acknowledged.
Signature:
Date:
Abstract
When astronomers observe regions of the sky, the data gathered by telescopes are
filtered, reduced into astronomical images and then stored in data archives. Since
these images are different from normal images and require specialised tools and
processing, astronomers view and analyse them using sophisticated astronomy
software packages
The global nature of astronomy has resulted in numerous different data archives
scattered all over the world. The International Virtual Observatory (IVO) is a recent
global effort to give astronomers transparent access to the images in these archives
over the internet. However, images may be hundreds of megabytes in size and the
client-side processing model does not accommodate well, situations where users
wish to quickly access large images that are often in remote data archives.
The Remote Visualisation System (RVS) is a solution that I conceptualised, designed
and fully implemented for my capstone project. It is a server-side distributed
software system that addresses the need for quick visualisation and analysis of large
astronomical images stored in remote locations. It is a system in which the majority
of the processing is done on the RVS Server, freeing the client from most of the
complex processing tasks.
Users of the RVS will not download images to their computers for quick viewing and
analysis. They may instead use a web browser to request the RVS Server to
download the image as well as request any processing that is required. The web
browser then simply displays the results of the processing requests. A high
bandwidth connection between the RVS Server and the data archive will result in a
much faster transfer of the image than if the users downloaded the image to their
local computers.
I developed the RVS at the Australia Telescope National Facility as an Australian
contribution to the IVO.

Acknowledgements
The following people have helped in some way to the success of the project.
Malte Marquarding
Thank you for all your help and guidance. You have shaped the project into what it is
today and I could not have completed it without your help.
Stephen Murray
Thank you for supervising this project. It was always reassuring to know that I was
on the right track.
Ne il Killeen
Thank you for your managerial guidance. The project went through some changes
earlier on and it was great to have your feedback on all the technical and non-
technical matters.
David McConnell
Thank you for giving me the opportunity to work at the ATNF. I wouldn’t have had
the chance to work on such an interesting project otherwise.
Pooja Raniga
Thank you for your encouragement and support during the project. Thank you for
pushing me hard enough to succeed.
My Uni Friends (you know who you are )
Thank you for all your little help, here and there, whenever I needed it. You have all
been a reliable source of help and comfort.
My Family (esp my mum and brother)
Thank you for your support during the busy times. Thank you for accommodating for
my ever-changing erratic schedule.
Table of Contents
ABSTRACT...........................................................................................................................................................3
ACKNOWLEDGEMENTS...............................................................................................................................4
I. INTRODUCTION.....................................................................................................................................2
1 OVERVIEW................................................................................................................................................2 2 ABOUT ATNF..........................................................................................................................................2 3 SYSTEM DESCRIPTION ............................................................................................................................2 4 SCOPE........................................................................................................................................................3 5 T ERMINOLOGY.........................................................................................................................................4
5.1 Acronyms.......................................................................................................................................4 5.2 Definitions.....................................................................................................................................4
6 DOCUMENT LAYOUT ..............................................................................................................................6
II. LITERATURE REVIEW........................................................................................................................7
1 OVERVIEW................................................................................................................................................7 2 ASTRONOMY BACKGROUND ..................................................................................................................7
2.1 Introduction ..................................................................................................................................7 2.2 Definition.......................................................................................................................................7 2.3 Types of Astronomy.....................................................................................................................8
3 DATA VISUALISATION AND ANALYSIS IN ASTRONOMY....................................................................9 3.1 Introduction ..................................................................................................................................9 3.2 Visualisation ............................................................................................................................... 10 3.3 Position Tracking....................................................................................................................... 12 3.4 Image File Formats ................................................................................................................... 14 3.5 VOTable....................................................................................................................................... 15 3.6 FITS – VOTable Comparison .................................................................................................. 16
4 T HE VIRTUAL OBSERVATORY............................................................................................................. 17 4.1 Introduction ................................................................................................................................ 17 4.2 Changing Science ...................................................................................................................... 18 4.3 Visualisation and Analysis in the VO ..................................................................................... 18
5 CURRENT VISUALISATION AND ANALYSIS SYSTEMS ...................................................................... 19 5.1 Introduction ................................................................................................................................ 19 5.2 MIRIAD ....................................................................................................................................... 19 5.3 AIPS++........................................................................................................................................ 20 5.4 Aladin........................................................................................................................................... 21 5.5 Oasis............................................................................................................................................. 23 5.6 Summary...................................................................................................................................... 25
6 CONCLUSION.......................................................................................................................................... 28
III. PROJECT MANAGEMENT PLAN............................................................................................. 30
1 OVERVIEW.............................................................................................................................................. 30 1.1 Introduction ................................................................................................................................ 30 1.2 System Description .................................................................................................................... 30 1.3 Project Constraints .................................................................................................................... 31
2 PROCESS MODEL................................................................................................................................... 32 3 SCHEDULING .......................................................................................................................................... 33
3.1 Work Breakdown........................................................................................................................ 34 3.2 Work Schedule ............................................................................................................................ 34
4 PROJECT RESOURCES ............................................................................................................................ 35 4.1 Human Resources ...................................................................................................................... 35 4.2 Hardware .................................................................................................................................... 35 4.3 Software....................................................................................................................................... 35 4.4 Time.............................................................................................................................................. 36
IV. SOFTWARE REQUIREMENTS SPECIFICATION.............................................................. 37
1 OVERVIEW.............................................................................................................................................. 37 1.1 Scope ............................................................................................................................................ 37 1.2 SRS Layout .................................................................................................................................. 39
2 GENERAL DESCRIPTION ....................................................................................................................... 39 2.1 System Functions ....................................................................................................................... 39 2.2 User Characteristics ................................................................................................................. 40 2.3 Operational Environment......................................................................................................... 41
3 SPECIFIC REQUIREMENTS..................................................................................................................... 41 3.1 Functional Requirements .......................................................................................................... 41 3.2 Non Functional Requirements ................................................................................................. 49
4 REQUIREMENTS ANALYSIS .................................................................................................................. 53 4.1 Use Cases .................................................................................................................................... 53 4.2 State Analysis.............................................................................................................................. 53 4.3 Class Diagrams.......................................................................................................................... 55
V. S YSTEM ARCHITECTURE ............................................................................................................... 56
1 OVERVIEW.............................................................................................................................................. 56 2 SCOPE...................................................................................................................................................... 56 3 ARCHITECTURE GOALS ........................................................................................................................ 56
3.1 Functional Objectives ............................................................................................................... 57 3.2 Non -Functional Objectives ...................................................................................................... 57
4 DESIGN PRINCIPALS .............................................................................................................................. 58 5 ARCHITECTURE DESCRIPTION............................................................................................................. 59
5.1 Component Descriptions .......................................................................................................... 60 6 LOGICAL VIEW ...................................................................................................................................... 61 7 PROCESS VIEW....................................................................................................................................... 62
8 DEVELOPMENT VIEW............................................................................................................................ 63 9 PHYSICAL VIEW ..................................................................................................................................... 64
VI. HIGH LEVEL DESIGN ................................................................................................................... 66
1 OVERVIEW.............................................................................................................................................. 66 2 SCOPE...................................................................................................................................................... 66 3 DESIGN CONSIDERATIONS ................................................................................................................... 66
3.1 Assumptions ................................................................................................................................ 66 3.2 Constraints .................................................................................................................................. 67 3.3 System Environment .................................................................................................................. 67 3.4 Design Methodology ................................................................................................................. 67
4 DISTRIBUTED ENVIRONMENT.............................................................................................................. 69 4.1 User Manager Invocation Service (UMIS) ............................................................................ 69
5 COMPONENTS......................................................................................................................................... 71 5.1 Command Centre....................................................................................................................... 72 5.2 Security Service.......................................................................................................................... 74 5.3 User Manager............................................................................................................................. 76 5.4 Session Manager ........................................................................................................................ 78 5.5 Data Communications Manager............................................................................................. 80
VII. LOW LEVEL DESIGN .................................................................................................................... 82
1 OVERVIEW.............................................................................................................................................. 82 2 T ECHNOLOGY SELECTION.................................................................................................................... 82 3 COMPONENTS......................................................................................................................................... 83
3.1 Command Centre....................................................................................................................... 83 3.2 Security Service.......................................................................................................................... 85 3.3 User Manager............................................................................................................................. 86 3.4 Session Manager ........................................................................................................................ 88 3.5 CORBA and AIPS++ in RVS................................................................................................... 89 3.6 Data Communications Manager............................................................................................. 97
VIII. PROTOTYPE RELEASE................................................................................................................ 98
1 OVERVIEW.............................................................................................................................................. 98 2 LEVEL OF IMPLEMENTATION ............................................................................................................... 98
2.1 Components ................................................................................................................................ 98 2.2 Demonstration Client ................................................................................................................ 99
3 SCENARIO ANALYSIS .......................................................................................................................... 100 3.1 Pre-Implementation................................................................................................................. 100 3.2 Post-Implementation............................................................................................................... 102
4 PERFORMANCE RESULTS.................................................................................................................... 104 5 IMPACT ON DESIGN ............................................................................................................................. 105
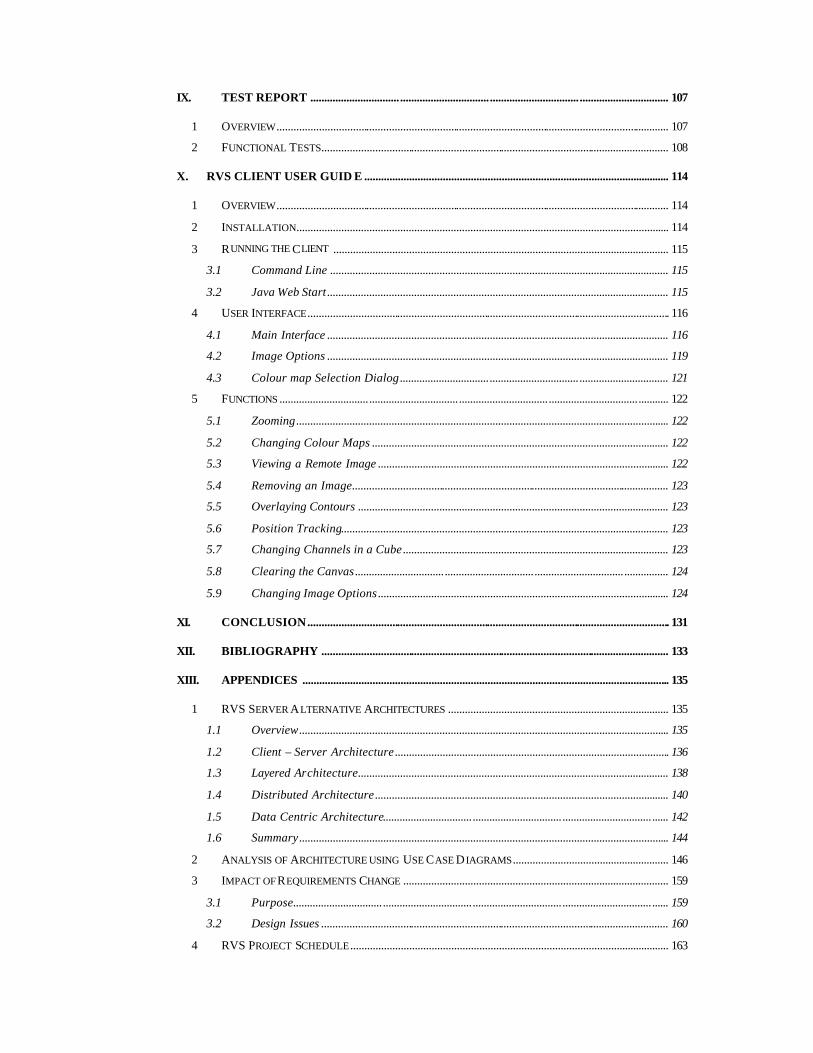
IX. TEST REPORT ................................................................................................................................ 107
1 OVERVIEW............................................................................................................................................ 107 2 FUNCTIONAL TESTS............................................................................................................................ 108
X. RVS CLIENT USER GUID E ............................................................................................................. 114
1 OVERVIEW............................................................................................................................................ 114 2 INSTALLATION..................................................................................................................................... 114 3 RUNNING THE CLIENT ........................................................................................................................ 115
3.1 Command Line ......................................................................................................................... 115 3.2 Java Web Start .......................................................................................................................... 115
4 USER INTERFACE................................................................................................................................. 116 4.1 Main Interface .......................................................................................................................... 116 4.2 Image Options .......................................................................................................................... 119 4.3 Colour map Selection Dialog................................................................................................ 121
5 FUNCTIONS ........................................................................................................................................... 122 5.1 Zooming..................................................................................................................................... 122 5.2 Changing Colour Maps .......................................................................................................... 122 5.3 Viewing a Remote Image ........................................................................................................ 122 5.4 Removing an Image................................................................................................................. 123 5.5 Overlaying Contours ............................................................................................................... 123 5.6 Position Tracking..................................................................................................................... 123 5.7 Changing Channels in a Cube............................................................................................... 123 5.8 Clearing the Canvas................................................................................................................ 124 5.9 Changing Image Options........................................................................................................ 124
XI. CONCLUSION................................................................................................................................. 131
XII. BIBLIOGRAPHY ............................................................................................................................ 133
XIII. APPENDICES ................................................................................................................................... 135
1 RVS SERVER ALTERNATIVE ARCHITECTURES ............................................................................... 135 1.1 Overview.................................................................................................................................... 135 1.2 Client – Server Architecture.................................................................................................. 136 1.3 Layered Architecture............................................................................................................... 138 1.4 Distributed Architecture......................................................................................................... 140 1.5 Data Centric Architecture...................................................................................................... 142 1.6 Summary.................................................................................................................................... 144
2 ANALYSIS OF ARCHITECTURE USING USE CASE D IAGRAMS........................................................ 146 3 IMPACT OF REQUIREMENTS CHANGE ............................................................................................... 159
3.1 Purpose...................................................................................................................................... 159 3.2 Design Issues ............................................................................................................................ 160
4 RVS PROJECT SCHEDULE .................................................................................................................. 163

List of Figures
Figure I-1: How RVS works ........................................................................................ 3
Figure II-1: Observation frequency ranges in astronomy (Houghton 2004) ................ 8
Figure II-2: Radio telescopes of the ATCA (ATNF 2004) .......................................... 9
Figure II-3: A 2D array of values mapped to colour map...........................................11
Figure II-4: Raster image from SGPS Archive (McClure-Griffiths 2003) .................11
Figure II-5: Contour image from SGPS Archive (McClure-Griffiths 2003) ..............12
Figure II-6: An overlay of a raster and contour map...................................................12
Figure II-7: Raster display with axis labels .................................................................13
Figure II-8: A VOTable example (Williams & Ochsenbein 2002).............................16
Figure II-9: AIPS++ Viewer screenshot .....................................................................21
Figure II-10: Screen shot of Aladin Java applet..........................................................23
Figure II-11: Screenshot of Oasis main window.........................................................24
Figure II-12: Client side processing model.................................................................25
Figure II-13: Partial server side model of processing .................................................26
Figure II-14: Pure server side processing model.........................................................27
Figure III-1: System overview diagram ......................................................................31
Figure III-2: Incremental process model of RVS........................................................32
Figure III-3: RVS Work Breakdown...........................................................................34
Figure IV-1: Boundary Model.....................................................................................38
Figure IV-2: Relationship between client, server, session and image ........................42
Figure IV-3: Relationship between clients and a session............................................43
Figure IV-4: Relationship of keys to uses and sessions..............................................44
Figure IV-5: Sequence diagram show image query and response ..............................48
Figure IV-6: Multiple users accessing a single image ................................................49
Figure IV-7: Level 1 Use Case diagram......................................................................53
Figure IV-8: Level 1 RVS State Diagram ...................................................................53
Figure IV-9: Level 2 State Diagram – Serving Client ................................................54
Figure IV-10: Level 1 Class Diagram.........................................................................55
Figure V-1: Conceptual view of RVS Server architecture..........................................60
Figure V-2: Logical view of RVS Server architecture ................................................62
Figure V-3: Process view of the RVS Server architecture..........................................63
Figure V-4: Development view of the RVS architecture ............................................64

Figure V-5: Physical view of RVS Server architecture ..............................................65
Figure VI-1: Communication between distributed RVS Server processes.................69
Figure VI-2: Creating user manager via UMIS ...........................................................70
Figure VI-3: UMIS and User Managers during normal operation..............................71
Figure VII-1: Command Centre class diagram ...........................................................84
Figure VII-2: Security Service class diagram.............................................................86
Figure VII-3: User Manager class diagram.................................................................87
Figure VII-4: Session Manager class diagram ............................................................88
Figure VII-5: Java Pixel Canvas design......................................................................90
Figure VII-6: Remote Display Data design.................................................................92
Figure VII-7: XML representation of AIPS++ record ................................................94
Figure VII-8: Event dispatcher for Remote Pixel Canvas...........................................95
Figure VII-9: Data Communications Manager class diagram ....................................97
Figure VIII-1: RVS Client configuration ....................................................................99
Figure X-1: Main interface screenshot ......................................................................116
Figure X-2: Image options window screenshot.........................................................119
Figure X-3: Colour map selection dialog screenshot................................................121
Figure XIII-1: Client - Server architecture diagram..................................................136
Figure XIII-2: Layered architecture diagram............................................................138
Figure XIII-3: Distributed architecture diagram .......................................................140
Figure XIII-4: Data Centric architecture analysis .....................................................142
Figure XIII-5: Use case - new user registers .............................................................146
Figure XIII-6: Use case - user joins a session...........................................................147
Figure XIII-7: Use case - user requests remote image ..............................................148
Figure XIII-8: Use case - User zooms image ............................................................149
Figure XIII-9: Use case - User views local image ....................................................150
Figure XIII-10: Use case - User creates new layer ...................................................151
Figure XIII-11: Use case - User obtains image statistics ..........................................152
Figure XIII-12: Use case - User rotates image ..........................................................153
Figure XIII-13: Use case - User changes image resolution ......................................154
Figure XIII-14: Use case - User draws circle............................................................155
Figure XIII-15: Use case - User views last error ......................................................156
Figure XIII-16: Use case - User requests canvas ......................................................157
Figure XIII-17: Use case - Slave User Gets Update .................................................158

Figure XIII-18: Use case - User switches to Quanta session....................................159
Figure XIII-19: Session sharing - one instance for all clients...................................161
Figure XIII-20: Session sharing - once image instance per user ...............................162
Figure XIII-21: RVS Gantt Chart..............................................................................168

List of Tables
Table III-1: Software resources required by RVS.......................................................35
Table III-2: Software resources required by RVS.......................................................36
Table IV-1: Characteristics of direct users of RVS Server .........................................40
Table IV-2: Characteristics of indirect users of RVS Server......................................40
Table VI-1: Command Centre Interface......................................................................74
Table VI-2: Security Service interface ........................................................................76
Table VI-3: UMIS Interface ........................................................................................77
Table VI-4: User Manager interface ...........................................................................78
Table VI-5: SIS Interface ............................................................................................79
Table VI-6: Session Interface......................................................................................79
Table VI-7 Data Comms Manager interface ...............................................................81
Table VIII-1: Time taken to perform operations .......................................................104
Table X-1: Main interface description ......................................................................119
Table X-2: Image Options screenshot description....................................................120
Table X-3: Colour map selection dialog description ................................................121
Table XIII-1: Architecture evaluation method ..........................................................135
Table XIII-2 : Client - Server architecture analysis ..................................................137
Table XIII-3: Layered architecture analysis ..............................................................139
Table XIII-4: Distributed architecture analysis.........................................................142
Table XIII-5: Data Centric architecture analysis ......................................................143
Table XIII-6: Summary of architecture analysis .......................................................144
Table XIII-7: Architecturally significant requirement weight ..................................145
Table XIII-8: Normalised result of architecture analysis ..........................................145
Table XIII-9: Task List for RVS Project...................................................................167

Remote Visualisation System I. Introduction
2
I. Introduction
1 Overview
This thesis covers the Remote Visualisation System (RVS) project conducted by me,
Anil Chandra, as part of my capstone project ending in autumn 2004. I designed and
developed the RVS as an employee at the Australia Telescope National Facility
ATNF), a division of CSIRO.
2 About ATNF
Radio astronomy is one of the major branches of modern astronomy. Studying the
radio waves emitted by stars, galaxies and gas clouds gives us a deeper
understanding of how these things work, just as an X-ray of a human body adds to
what we can learn from an ordinary photograph. (ATNF Outreach 2004)
The Australia Telescope National Facility (ATNF) supports Australia's research in
radio astronomy. It is administered by the CSIRO, Australia's national scientific
research organisation and is funded by the Australian Government. The ATNF
operates the Australia Telescope which consists of the Compact Array at Narrabri
and the Parkes and Mopra radio telescopes. (ATNF Outreach 2004)
The ATNF was created in 1989. Its immediate “ancestor” was the CSIRO Division
of Radio physics. It is now the largest single astronomical institution in Australia. It
has about 145 staff and an annual operating budget of about A$18M.
3 System Description
The RVS is a software system that will be used by scientists, mainly
astronomers/astrophysicists to visualise and analyse astronomical images that are
stored in remote locations. Astronomers often need to view astronomical images that
are stored somewhere other than their local computer or even their local network.
Remote Visualisation System I. Introduction
3
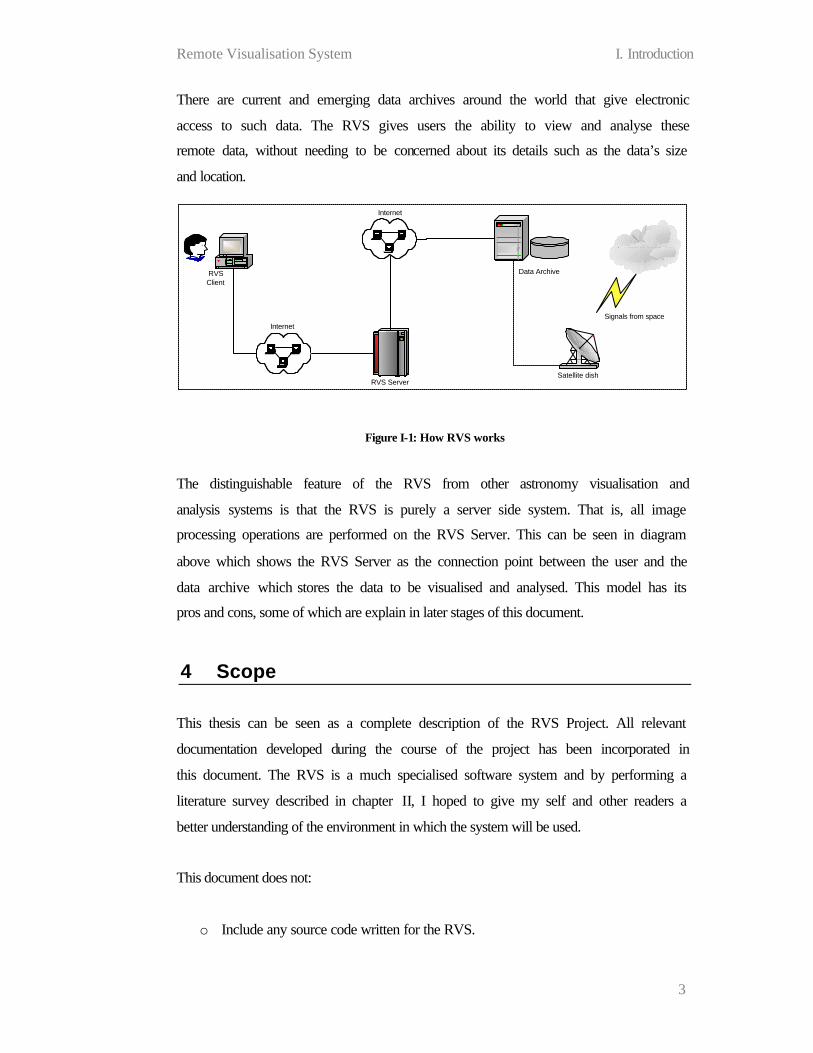
There are current and emerging data archives around the world that give electronic
access to such data. The RVS gives users the ability to view and analyse these
remote data, without needing to be concerned about its details such as the data’s size
and location.
Data Archive
RVS Server
RVSClient
Internet
Internet
Satellite dish
Signals from space
Figure I-1: How RVS works
The distinguishable feature of the RVS from other astronomy visualisation and
analysis systems is that the RVS is purely a server side system. That is, all image
processing operations are performed on the RVS Server. This can be seen in diagram
above which shows the RVS Server as the connection point between the user and the
data archive which stores the data to be visualised and analysed. This model has its
pros and cons, some of which are explain in later stages of this document.
4 Scope
This thesis can be seen as a complete description of the RVS Project. All relevant
documentation developed during the course of the project has been incorporated in
this document. The RVS is a much specialised software system and by performing a
literature survey described in chapter II, I hoped to give my self and other readers a
better understanding of the environment in which the system will be used.
This document does not:
o Include any source code written for the RVS.
Remote Visualisation System I. Introduction
4
o Include an SRS for the RVS Client. The main focus of this project was the
server. Although a client was developed, it was intended to be internal
software used to demonstrate the capabilities of the RVS Server.
5 Terminology
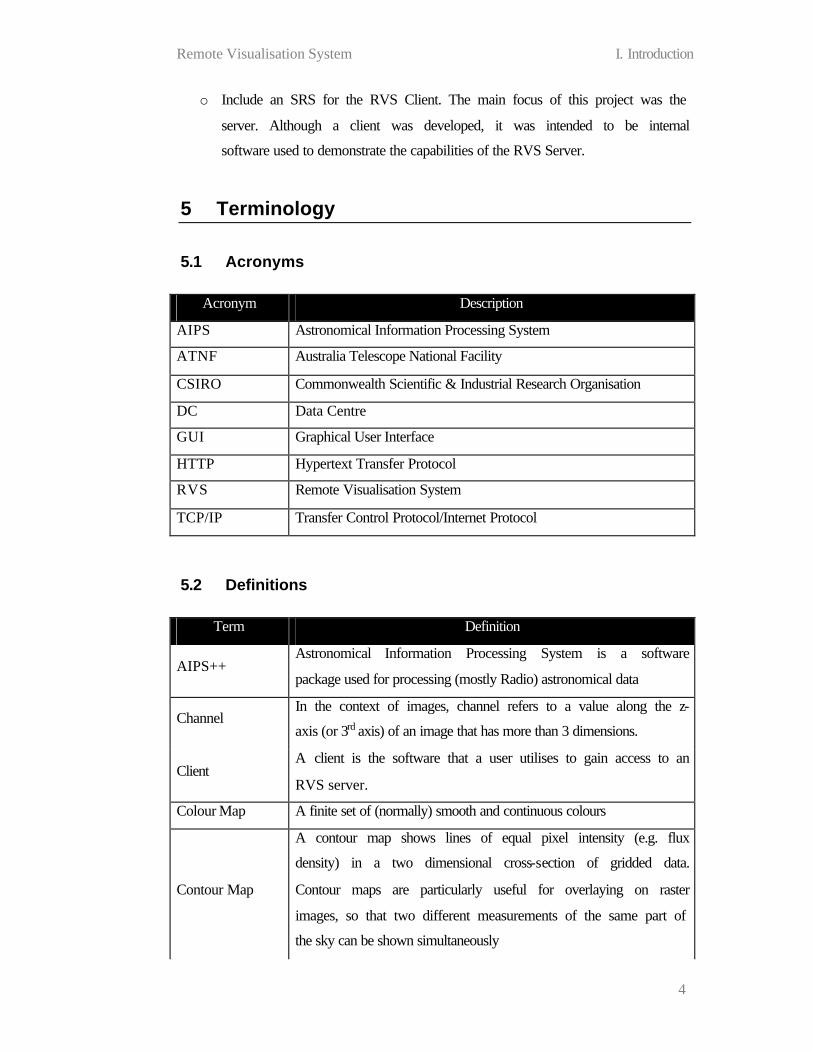
5.1 Acronyms
Acronym Description
AIPS Astronomical Information Processing System
ATNF Australia Telescope National Facility
CSIRO Commonwealth Scientific & Industrial Research Organisation
DC Data Centre
GUI Graphical User Interface
HTTP Hypertext Transfer Protocol
RVS Remote Visualisation System
TCP/IP Transfer Control Protocol/Internet Protocol
5.2 Definitions
Term Definition
AIPS++ Astronomical Information Processing System is a software
package used for processing (mostly Radio) astronomical data
Channel In the context of images, channel refers to a value along the z-
axis (or 3rd axis) of an image that has more than 3 dimensions.
Client A client is the software that a user utilises to gain access to an
RVS server.
Colour Map A finite set of (normally) smooth and continuous colours
Contour Map
A contour map shows lines of equal pixel intensity (e.g. flux
density) in a two dimensional cross-section of gridded data.
Contour maps are particularly useful for overlaying on raster
images, so that two different measurements of the same part of
the sky can be shown simultaneously

Remote Visualisation System I. Introduction
5
Data Centre A server provides data to clients. Clients typically browse for
data and then request any data desired.
Session idle time The time since a request was made to an RVS server using the
session id.
Marker map
A marker map represents pixel intensities by a particular marker
shape and fills style. For example, the marker shape may be a
square. The size of the square is proportional to the absolute
pixel intensity. If the pixel is positive the square is filled, if the
pixel intensity is negative, the square is open.
Master User In the RVS Server, a user that creates a session is the master user
for that session.
Position
Tracking
When the world and pixel coordinates of a cursor is displayed
and updated as it moves on the surface of an image.
Raster Image
A raster map represents pixel intensities in a two-dimensional
cross-section of gridded data with colours selected from a colour
map
Remote
Visualisation
System (RVS)
A proposed client/server system for visualisation and analysis of
data located in remote locations.
Server A program that awaits and fulfils requests from client programs
in the same or other computers
Session On the RVS Server, a session is a workspace used by clients and
data centres to hold the data they are interested in.
Slave User In the RVS Server, a slave user is one that accesses a session, but
is not the master user.
Thin Client
A client that knows little about and does little manipulation on
the data it receives from a server. For example, a thin client may
only display images and not let users zoom.
Thick Client
A client that ‘knows a lot’ about the data that it receives from a
server. This means the client can do data manipulation without
querying the server for additional information.
User An individual that uses a client to connect to an RVS server.

Remote Visualisation System I. Introduction
6
Vector Map
For complex images and arrays, where each pixel, represents an
amplitude and phase (position angle). A common method of
displaying amplitude and position angle data is via vectors (line-
segments) where the length of the vector is proportional to the
amplitude.
6 Document Layout
The remainder of this document contains the following sections:
o Literature Review – a review of the literature relevant to the RVS.
o Project Management Plan – a plan on how the RVS Project will be
conducted. Particular emphasis has been placed on the software engineering
process to be adopted and the project schedule.
o Software Requirements Specification – a definition of all requirements to be
satisfied by the RVS Server.
o System Architecture – a description of the selected architecture of the RVS
Server. This involves the determination of the high level components in the
software.
o High Level Design – a more detailed description of the components defined
in the system architecture. This includes the interfaces between the
components.
o Low Level Design – a look at the interfaces defined in the HLD and how they
will be represented in the software. Also, how the operations of the interfaces
will be implemented
o Prototype Release – a summary of the RVS prototype and its findings.
o Testing – an acceptance test report
o RVS Client User guide – A user guide for the demonstration client developed
for the RVS.
o Conclusion – Some concluding remarks about the project.
o Bibliography – a list of references used during the course of the project.
o Appendices – A collection of attachments, related to some of the above
sections in this document that may be of interest to readers.

Remote Visualisation System II. Literature Review
7
II. Literature Review
1 Overview
This chapter contains a summary of research I conducted before and during the RVS
project. The goals of the literature survey are as follows.
o To gain a better understanding of some of the issues involved in astronomical
data visualisation and analysis.
o To understand how scientists currently use visualisation tools to analyse their
data and achieve their scientific aims.
o To realize the various visualisation and analysis tools used by astronomers.
o To understand the needs of astronomers that existing software systems do not
satisfy.
o To determine whether there is, in fact, a need for the Remote Visualisation
System.
2 Astronomy Background
2.1 Introduction
This section gives readers a background into how scientists, mainly astronomers, use
data visualisation and analysis to achieve their scientific aims. It is hoped that by
understanding the needs of astronomers and the purpose of visualisation, readers will
be better equipped to understand the purpose of the Remote Visualisation System
(RVS) and its place in astronomy.
2.2 Definition
Astronomy is the scientific study of the planets, stars, galaxies and the universe.
Generally speaking, astronomy and physics are essentially the same science, with
different areas of research and application. (Houghton 2004)

Remote Visualisation System II. Literature Review
8
The study of the astronomical objects, as mentioned in the above definition, is done
by astronomers. Astronomers ‘observe’ regions of the sky and then analyse the
observed data using sophisticated software systems and applications.
2.3 Types of Astronomy
Astronomers don’t just observe the universe by looking at visible light, as many
would expect. As well as observing visible light, astronomers also observe different
waves in the electromagnetic spectrum. The different frequency ranges that are
observed are:
o Gamma Ray
o X-Ray
o Ultraviolet
o Visible
o Infrared
o Radio
Figure II-1: Observation frequency ranges in astronomy (Houghton 2004)
Figure II-1 shows the different ways in which astronomers can observe the sky as
well as where each type of electromagnetic radiation lies in the spectrum. You will
notice that some of the visible and radio waves make it through the earth’s
atmosphere reaching the ground. Optical telescopes and radio telescopes on the
ground are used to observe visible and radio waves respectively. Other frequencies
are visualised using telescopes higher up in the sky such as satellites. (Houghton
2004)

Remote Visualisation System II. Literature Review
9
There are many objects in the universe that are of interest to astronomers, but not all
of them emit radiation at all the different frequencies. Therefore, a radio telescope
may observe objects that an X-Ray telescope does not.
However, there are often objects or regions of the sky that emit radiation in more
than one of the frequency ranges. A useful analysis technique for astronomers is to
view a single region of the sky captured using different types of telescopes. For
example, an astronomer may view an optical image of an object, and then look at a
radio image of the same object to find the radio waves that the object is emitting.
Figure II-2: Radio telescopes of the ATCA (ATNF 2004)
3 Data Visualisation and Analysis in Astronomy
3.1 Introduction
Once the data is observed using telescopes astronomers perform analysis on this data
to extract the information they are interested in. Data analysis is the process of
examining a set of data to extract knowledge. An observation of the sky produces a
collection of numbers that do not provide any real knowledge. This data needs to be
investigated using specific techniques and used in conjunction with other data to
extract the knowledge that is sought, i.e. to make sense of all the data.

Remote Visualisation System II. Literature Review
10
3.2 Visualisation
The primary goal of scientists using visual analysis is to better understand the data
they observe through the use of visual methods. Scientific data can be massive, and
when one tries to sift through to find correlations among numerous variables, it is
time consuming and often leads to a limited understanding of parameters of interest
to a professional. (Palu 2003)
As explained earlier, an observation produces a collection of numbers and
visualisation in astronomy is the representation of these numbers in a visual form.
There are different ways in which this can be done.
3.2.1 Rasters
A raster display of an image looks very much like an ordinary image. An array of
values is mapped to a particular colour map and then displayed as a raster. These
values may vary from very low negative to very high positive numbers, but for a
simple example, let’s take an array of numbers that range from 1 to 10. This is shown
below.
We now define a couple of colours for the two ends of the numerical range.
1 = 10 =
If the value 1 was mapped to red and the value 10 was mapped to blue as shown
above, the resulting raster image will be as follows.
1 2 3 4 5 6 7 8 9 10

Remote Visualisation System II. Literature Review
11
Using the same colour map, if we display a 2-dimensional array with the centre value
of 1 and gradually increasing to the outside, the result will be:
Figure II-3: A 2D array of values mapped to colour map
Colour maps may consist of as many colours as the platform supports. As you see
above intermediate colours are usually ‘filled’ by the visualisation applic ation. The
image shown in Figure II-4 is a real image taken from ATNFs Southern Galactic
Plane Survey archive. It shows a cloudy structure mapped using a colour map
ranging from yellow to black. The minimum and maximum pixel values of this
particular image are -6.5302 and 110.798 respectively.
Figure II-4: Raster image from SGPS Archive (McClure-Griffiths 2003)
3.2.2 Contour Maps
Contour maps are another way of displaying astronomy images. Contours of images
are drawn by connecting the lines of equal ‘elevation’. In the case of astronomy

Remote Visualisation System II. Literature Review
12
images, the word ‘elevation’ refers to ‘values’. Figure II-5 shows the same image as
Figure II-4, but as a contour map rather than a raster.
Figure II-5: Contour image from SGPS Archive (McClure -Griffiths 2003)
Figure II-6 shows contour map above overlayed on top of the raster display from the
same image.
Figure II-6: An overlay of a raster and contour map
3.3 Position Tracking
All astronomy images contain meta-data as well as the pixel data that is displayed.
One of the most important pieces of information provided by the meta-data is a
coordinate system that allows the user to determine the real position in the sky, of a
particular point in the image. Most good visualisation applications allow users to
move their mouse cursor over the image to have the position, in the sky, of where the
cursor is at any one time displayed to the user.
As well as the position in the sky, the real value of the pixel is also displayed. This is
not usually the value that is used to draw the image. The value is used with the

Remote Visualisation System II. Literature Review
13
coordinate system that came with the image, to determine a real world value. For
example, one of the pixels in the images above may translate to a real world value of,
say, 1.672 x 10⁻⁴ Jy/Beam. Jy/Beam (“Janky’s per Beam”) is a measure of intensity.
Another way of displaying position information to the user is by placing axis labels
around the image. This is shown in Figure II-7.
Figure II-7: Raster display with axis labels
3.3.1 Catalogue Overlays
Images are not the only result of astronomy observations. Over the course of time,
surveys of the sky have unveiled thousands of objects such as galaxies, stars and
black holes. All these objects are given unique names and stored in catalogues that
can be accessed for later reference.
One of the details of each object stored is its position in the sky. By using this
position information it is possible to draw these objects on images that encompass
the position in the sky where the object was observed. Therefore, when viewing an
Remote Visualisation System II. Literature Review
14
image such the one shown above in Figure II-7 it is possible (depending on the
capabilities of the software system being used) to find objects that have been
observed in that part of the sky and draw these objects on top of the image. This is
known as catalogue overlays.
3.4 Image File Formats
Just like any other visual display of data, astronomy images need standard formats in
which to format their data. This is so software can interpret the data and produce the
desired visual images. Common image types for non-astronomy data are JPEG, GIF,
TIF and PNG. Astronomy images however are very different, in that they contain
other information besides just the information about pixel colours.
A JPEG image is a binary file that simply contains visual information about each
pixel in the image. Since the colour of each pixel is defined in the file, all JPEG
images look very similar regardless of the computer or software used to view them.
Astronomy images, on the contrary, do not contain colour information. Each pixel in
the image is defined by a value that relates to a real world value. Each pixel has at
least the following information associated with it:
o A numerical value
o A real world unit, such as intensity in Jy/Beam
o Real world coordinates, such as the longitude and latitude in the sky.
Therefore, each pixel actually represents a point in the sky, and you can use the
image to determine the intensity value (as it was observed) at any point, for example.
Astronomy images may be 3 dimensional. Image of 3 dimensions are referred to as
cubes and they are common occurrences in astronomy. All good astronomy
visualisation systems will allow viewing of cubes.

Remote Visualisation System II. Literature Review
15
3.4.1 Flexible Image Transform System (FITS)
FITS is the standard computer data format widely used by astronomers to transport,
analyse, and archive scientific data files. It evolved out of the recognition that a
standard format was needed for transferring astronomical data from one installation
to another. The original form, or Basic FITS, was designed for the transfer of images
and consisted of a binary array, usually multidimensional, preceded by an ASCII text
header with information describing the organization and contents of the array. The
FITS concept was later expanded to accommodate more complex data formats. A
new format for image transfer, random groups, was defined in which the data would
consist of a series of arrays, with each array accompanied by a set of associated
parameters.
FITS is by far the most widely used and accepted image format for the transfer of
astronomy images.
3.5 VOTable
The emergence of the Virtual Observatory (VO) has motivated the development of a
flexible file format for exchange and processing of tabular data. The VOTable is an
XML based format which is designed for generic use, but particular emphasis has
been placed on astronomical tables.
A VOTable is designed to be flexible in its use. It is not only used to transfer image
data, as FITS is, one can store any table data such as catalogue objects. This, along
with its XML heritage, makes VOTable an excellent format for mass data exchange.
Figure II-8 is an example of a VOTable that contains a table of star objects.

Remote Visualisation System II. Literature Review
16
Figure II-8: A VOTable example (Williams & Ochsenbein 2002)
3.6 FITS – VOTable Comparison
o FITS has semantics for how data is to be represented when printed.
Formatting instructions using the TDISP keyword make this possible. For
example F12.4 means 12 characters are to be used and 4 decimal places. This
same feature has been represented in VOTable as the attributes width and
precision which, connected with datatype, are semantically identical. Note
that error estimation and the number of digits to print are rather different
semantically.
o FITS has a complex semantics for structuring a single string as a collection of
substrings, and VOTable does not support this. VOTable allows fixed and
variable-length strings, as well as variable-length arrays of fixed length
strings.
<?xml version="1.0"?>
<!DOCTYPE VOTABLE SYSTEM "http://us-vo.org/xml/VOTable.dtd">
<VOTABLE version="1.0">
<RESOURCE ID="Stars">
<PARAM ID="Mass" datatype="float" unit="solMass" value="1"/>
<RESOURCE ID="BigStars">
<PARAM ID="Mass-big" datatype="float" unit="solMass" value="10"/>
</RESOURCE>
<RESOURCE ID="SmallStars">
<PARAM ID="Mass-small" datatype="float" unit="solMass" value="0.2"/>
<RESOURCE ID="VerySmallStars">
<PARAM ID="Mass-tiny" datatype="float" unit="solMass" value="0.05"/>
</RESOURCE>
</RESOURCE>
</RESOURCE>
</VOTABLE>

Remote Visualisation System II. Literature Review
17
o VOTable supports separating of data from metadata and the streaming of
tables, and other ideas from modern distributed computing. It bridges two
ways to express structured data: XML and FITS. It tries (through UCD) to
express formally what is the semantic content of a parameter or field. It has
the hierarchy and flexibility of XML. FITS does not handle Unicode
(extended alphabet) characters.
It should be noticed that the transformation of FITS to VOTable is meant to be
reversible: the conversion of a FITS file into VOTable does not lose any information,
and a transformation back into FITS is possible. It will however not be possible to
transform any VOTable into a FITS file without losing some information. (Williams
& Ochsenbein 2002)
4 The Virtual Observatory
4.1 Introduction
Astronomy faces a data avalanche. Breakthroughs in telescope, detector, and
computer technology allow astronomical instruments to produce terabytes of images
and catalogs. These datasets will cover the sky in different wavebands, from gamma-
and X-rays, optical, infrared, through to radio. In a few years it will be easier to
“dial-up” a part of the sky than wait many months to access a telescope. With the
advent of inexpensive storage technologies and the availability of high-speed
networks, the concept of multi-terabyte on-line databases interoperating seamlessly
is no longer outlandish. More and more catalogs will be interlinked, query engines
will become more and more sophisticated, and the research results from on-line data
will be just as rich as that from “real” telescopes. Moore’s law is driving astronomy
even further: new survey telescopes now being planned will image the entire sky
every few days and yield data volumes measured in petabytes. These technological
developments will fundamentally change the way astronomy is done. These changes
will have dramatic effects on the sociology of astronomy itself. (Hanisch & Quinn
2004)

Remote Visualisation System II. Literature Review
18
The Australian Virtual Observatory (Aus-VO) is the Australian arm of the
International Virtual Observatory Alliance (IVOA), which umbrella’s the efforts of
the various alliance partners.
4.2 Changing Science
By providing the tools to assemble and explore massive data sets quickly, the VO
will facilitate and enable a broad range of science. It will make practical studies
which otherwise would require so much time and resources that they would be
effectively impossible. Federating massive data sets over a broad range of
wavelengths will be especially fruitful. This will minimize the selection effects that
inevitably affect any given observation or survey and will reveal new knowledge that
is present in the data but cannot be recognized in any individual data set.
VO-based studies would include systematic explorations of the large-scale structure
of the Universe, the structure of our Galaxy, AGN populations in the universe,
variability on a range of time scales, wavelengths, and flux levels, and other,
heretofore poorly known portions of the observable parameter space. The VO will
also enable searches for rare, unusual, or even completely new types of astrophysical
objects and phenomena. For the first time, we will be able to test the results of
massive numerical simulations with equally voluminous and complex data sets. The
VO-enabled studies will span the range from major, key project level efforts to
supporting data and sample selection for new, focused studies of interesting types of
targets, both for the space-based and major ground-based observatories. (Hanisch &
Quinn 2004)
4.3 Visualisation and Analysis in the VO
The VO introduces are new need for computer systems that are capable of handling
very large amounts of data and performing complex operations on the data in a
relatively short time. The transparent access to remote data introduces the need for
systems that perform remote processing for users.

Remote Visualisation System II. Literature Review
19
When images that users wish to visualise are very large, it is inefficient for them to
download the image to their local computers for visualisation. With the use of remote
visualisation software, we can have a scenario as follows:
A user performs a query by submitting a HTML form in a web browser. The result of
the query is a list of images that the user may view. By clicking on one of the
images, the browser opens another window that displays the image and allows the
user to perform analysis operations on the image. All this occurs without the user
being aware of the location and the size of the image data.
5 Current Visualisation and Analysis Systems
5.1 Introduction
This section analyses the current ways astronomers view and analyse their data. It is
hoped that by studying the existing software systems we can determine what
requirements of astronomers are not being met, and whether the current systems can
support the emergence of the Virtual Observatory.
5.2 MIRIAD
MIRIAD (Multichannel Image Reconstruction, Image Analysis and Display) is a
toolbox, in the form of an environment with a large set of moderate sized programs
which perform individual tasks, involving complex data processing, image analysis
and visualisation. It was originally developed in 1987 on Sun workstations (SUN OS
3.2), but has since then been ported to a large number of UNIX flavours (SUN OS
4.x, 5.x, SGI/IRIX, HP/UX, ConvexOS, DEC Alpha, LINUX, and VAX/VMS).
Most of the code is written in Fortran 77, with some lower level I/O routine in ANSI-
C. (MIRIAD Introduction 2001)
MIRIAD is a reasonably old and quite popular software package. It is installed
locally, like any other software and supports all the necessary basic functionality that
is expected in a package such as this. MIRIAD, however, does not support:
Remote Visualisation System II. Literature Review
20
o VOTables
o Catalogue Overlays
o Remote communications (to obtain images located elsewhere)
MIRIAD cannot be used on MS Windows platforms.
5.3 AIPS++
Astronomical Image Processing System (AIPS++) provides facilities for calibration,
editing, image formation, image enhancement, and analysis of images and other
astronomical data. Although the tools provided in AIPS++ are mainly designed for
processing data from varieties of radio telescopes, the package is expected to also be
useful for processing other types of astronomical data and images.
The core of the AIPS++ is written in C++ (although it makes of C and FORTRAN
functions) and the user interface layer is written in a scripting language called Glish.
Glish is an interactive programming language that makes AIPS++ a very tool-based
package that is programmable by the user.
Like MIRIAD, AIPS++ is a standalone package this is installed on the user’s
computer. In terms of basic features, AIPS++ has everything that MIRIAD provides,
the biggest difference between the two being AIPS++s object oriented approach to
user interactivity.
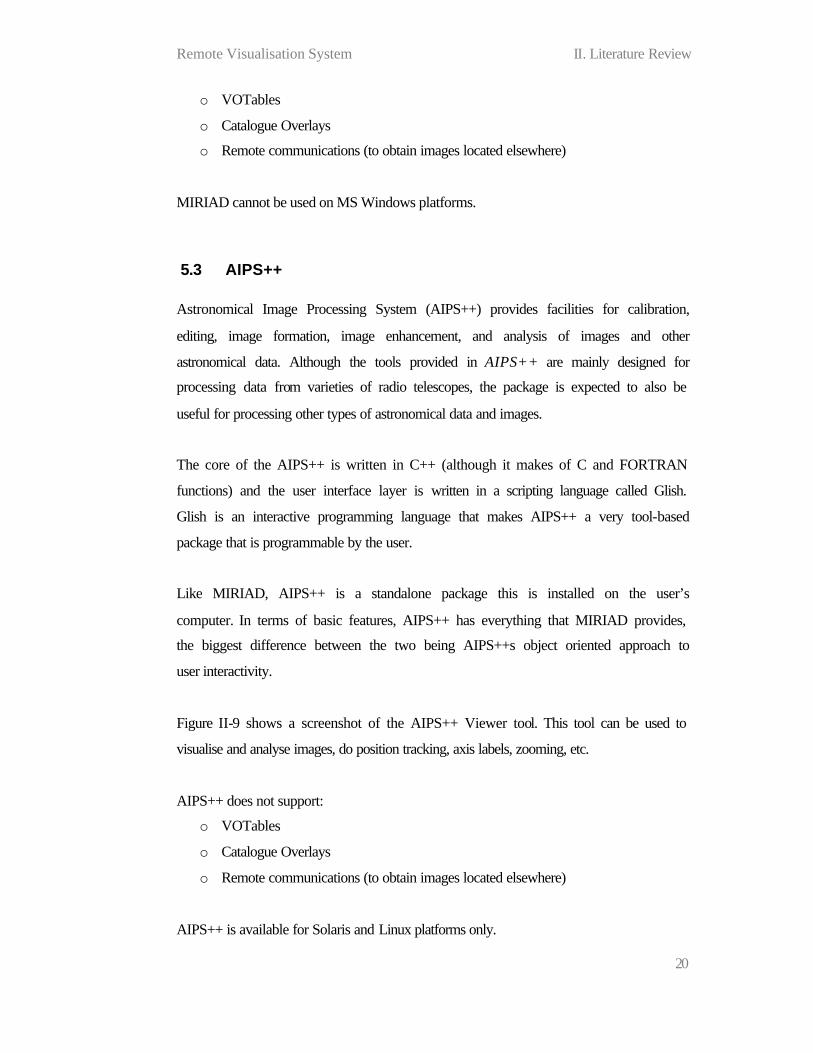
Figure II-9 shows a screenshot of the AIPS++ Viewer tool. This tool can be used to
visualise and analyse images, do position tracking, axis labels, zooming, etc.
AIPS++ does not support:
o VOTables
o Catalogue Overlays
o Remote communications (to obtain images located elsewhere)
AIPS++ is available for Solaris and Linux platforms only.

Remote Visualisation System II. Literature Review
21
Figure II-9: AIPS++ Viewer screenshot
5.4 Aladin
Aladin is an interactive software sky atlas allowing the user to visualize digitized
images of any part of the sky, to superimpose (or overlay) entries from astronomical
catalogues or databases, and to interactively access related data and information from
popular data archives for all known objects in the field. (Fernique 2003)
Put simply, Aladin allows users to view images located in remote archives. Access to
these archives is given via a query interface where the user enters the query details
(e.g. sky coordinates), selects the archive to search and then receives a viewable
image as a result of the search.
Aladin is not a standalone software package such as MIRIAD and AIPS++. It is a
system that is accessible to users via the Internet, consisting of a client, that the user

Remote Visualisation System II. Literature Review
22
interfaces with and a server that does the data retrieval and processing. There are
three types of clients:
o A simple previewer
o A java applet interface
o A java standalone interface
All of these can be access using a web browser. This feature makes Aladin extremely
accessible. A user does not need complex image processing software installed on
their local machine. Another big advantage is that the data is transparent. The user
does not need to be aware of where the image came from or how big the image is. In
fact, the Aladin clients don’t download the original image files. When a user requests
an image, the following sequence of operations occurs:
1. Client requests image from the server
2. Server obtains image from data archive
3. Server processes the image and generates a flat image file (e.g. jpg)
4. Server sends simple image file and meta-data to client.
5. Client displays the image.
Therefore, the client never has access to the original astronomy image (unless it
explicitly requests it). This results in a relatively thin client side application, but also
means the client is limited in the number of features it can provide. A couple of the
common visualisation features that are not provided in Aladin are axis labelling and
the viewing of cubes.
Another disadvantage of not having access to the original image is that the zooming
becomes lossy. The client only has the simple image to zoom into and the result will
become pixelated.

Remote Visualisation System II. Literature Review
23
Figure II-10: Screen shot of Aladin Java applet
The greatest feature of Aladin is that it gives transparent access to image and
catalogue data that can be overlayed on top of each other. Simply by moving the
mouse cursor over the image display, users can see the details of the objects in the
image. This is a powerful VO feature that many other visualisation and analysis
packages don’t have.
5.5 Oasis
Oasis is a standalone Java application that provides basic astronomy data
visualisation and analysis tools. Its main objective is to allow the ‘fusion of multiple
dataset simultaneously’. This simply means:
o To allow users to view images from different remote archives by performing
queries on them.
o To allow users to perform queries on remote catalogue servers and overlay
the results on top of images.

Remote Visualisation System II. Literature Review
24
This is exactly what Aladin allows users to do. The difference between the two is in
the way the images are processed. Oasis downloads the original FITS file from the
image archives and processes the file and displays it for the user to view. Aladin, on
the other hand does not process FITS files at all, it only displays the rendered image
file sent by the Aladin server.
Figure II-11: Screenshot of Oasis main window
The availability of the FITS image on the client side makes Oasis richer in features
than Aladin. The disadvantage of having feature packed client is that it makes the
client larger in size. The size of the downloaded jar is 4.67MB compared to Aladin’s
1.67MB file. Oasis also consumes more memory than Aladin.
Remote Visualisation System II. Literature Review
25
5.6 Summary
There are a number of visualisation tools in the market some of which have similar
purposes and others have totally different goal. In general, we can split visualisation
and analysis systems into three different categories.
o Client Side Processing
o Partial Server Side Processing
o Pure Server-Side Processing
5.6.1 Client Side Processing
Data Archive
Physical transfer
Network transfer
Client
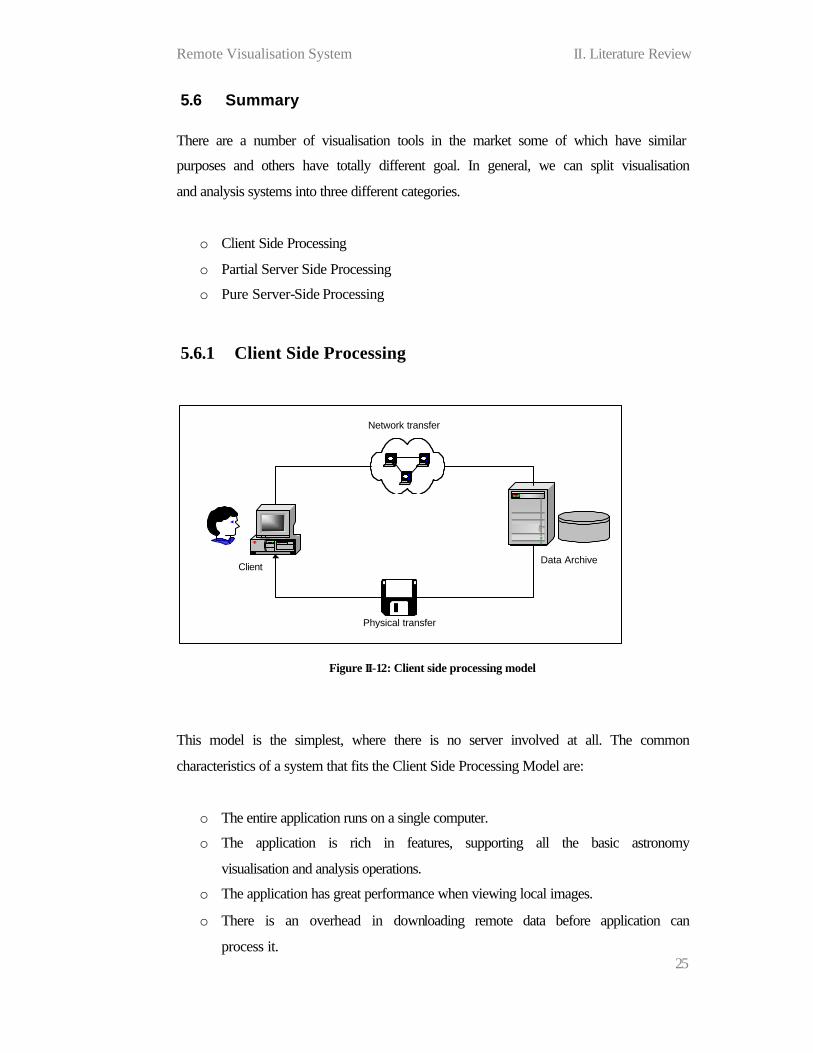
Figure II-12: Client side processing model
This model is the simplest, where there is no server involved at all. The common
characteristics of a system that fits the Client Side Processing Model are:
o The entire application runs on a single computer.
o The application is rich in features, supporting all the basic astronomy
visualisation and analysis operations.
o The application has great performance when viewing local images.
o There is an overhead in downloading remote data before application can
process it.

Remote Visualisation System II. Literature Review
26
o The application uses a large amount of disk space.
o The application has a relatively large footprint (memory use).
o Accessibility is low, since the entire application needs to be installed on a
user’s computer for it to be used.
o Application is relatively easy to implement (relative to other models).
AIPS++, MIRIAD and OASIS are all examples of applications based on the client
side processing model. Although OASIS communicates with remote servers to
retrieve data, the visualisation and analysis processing is all done on the client.
5.6.2 Partial Server Side Processing
Data Archive
Network transfer
Server
Client
Network transfer
Figure II-13: Partial server side model of processing
The partial server side processing model is one where:
o One or more remote servers are used to perform stateless operations on behalf
of the client.
o Most user operations do not require communication with remote servers.
The critical detail in the first point is that the operations on the server are stateless.
That is, the server does not hold user state. Instead, it merely receives some input
data performs the requested operation and returns some output data. It has no notion
of users’ context.
Remote Visualisation System II. Literature Review
27
The common characteristics of systems based on the partial server side processing
model are:
o The client application runs on a different computer to the server.
o The client is located in a different geographical location.
o The client application is very small in size. It users relatively small amount of
memory.
o The client application is a lot more accessible.
o Performances of some operations are slow.
o Client application required to do some image processing.
Aladin is an example of a system based on the partial server side processing model.
The Aladin client does not process astronomical images. When it wishes to view an
image, it requests the Aladin server to obtain and process the astronomical image and
return a rendered image that Aladin can simply display. Therefore, the Aladin makes
use of a server to perform some of the required image processing operations.
5.6.3 Pure Server Side Processing
ServerData Archive
PCClient
LaptopClient
PDA Client
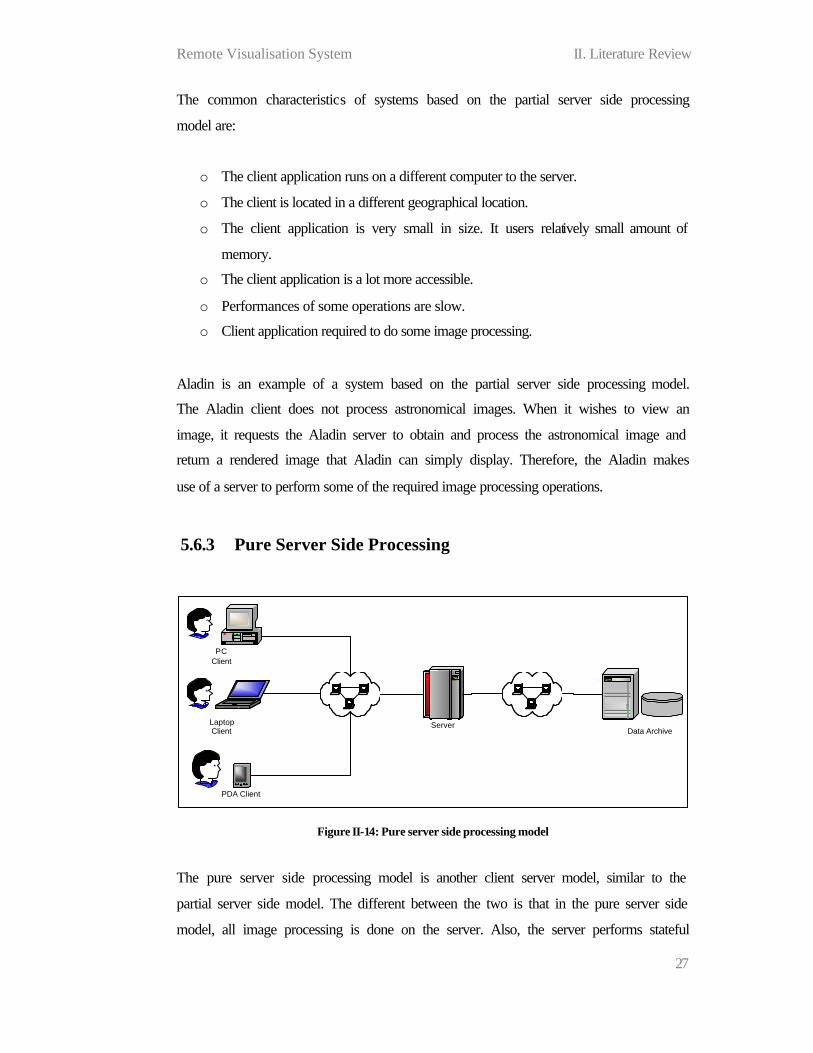
Figure II-14: Pure server side processing model
The pure server side processing model is another client server model, similar to the
partial server side model. The different between the two is that in the pure server side
model, all image processing is done on the server. Also, the server performs stateful
Remote Visualisation System II. Literature Review
28
operations on client requests. That is, the server is aware of the client state and all
operations are context sensitive according to that state.
The common characteristics of pure server side systems are:
o Client applications are required to do very little processing. All processing is
done on a server.
o Larger set of features than partial server side systems.
o Client applications are very small in size.
o Client applications have relatively small footprints (memory usage).
o Clients are very accessible due their limited processing requirements.
o Slow response times on user operations.
o Great performance on resource intensive operations (e.g. viewing large
images).
o A variety of client user interfaces possible.
o Server is difficult to implement.
There are currently no pure server side systems in use by astronomers. This is mainly
due to the difficulty in implementing such systems. There are, however, obvious
benefits of such systems in the virtual observatory. One of the aims of the VO is to
provide transparent data access. For data to be transparent, the user need not be
aware of the location and size of the data. This becomes very difficult in other
models where very large images require the transfer of the images from the data
archive to the processing server.
6 Conclusion
This literature survey has shown that astronomy is a much specialised science that
has the need for specific visualisation and analysis tools. The emergence of the
Virtual Observatory (VO) has introduced a new set of challenges mainly to do with
transparent data access and ways of analysing this data. The pure client side
applications such as MIRIAD and AIPS++ are good analysis tools for local data, but

Remote Visualisation System II. Literature Review
29
do not provide the remote communication capabilities and accessibility required for
VO tools.
Astronomy is all about data. Data Archives around the world are hosting terabytes of
information in the form of images, catalogues, raw data, and other meta-data. Aladin
(and to some extent OASIS) have introduced for the first time, the ability to view
multiple images and catalogue information from different VO source all on the same
canvas. However, what is lacking at present is a system that provides visualisation of
large remote images.
As the VO expands and different data archives become available, we will see the
development of tools that access this data. From what we have seen so far, some of
these tools are starting to be developed and this is duplicating a lot of effort. If we
had a system that provided a set of core functionalities, then different clients (or
access points) could be developed that re-used this functionality.
It is evident then that we need a system that will meet the following high level
requirements:
o Provide a set of basic tools that astronomers these days are used to. This
includes image displays, axis labelling, position tracking, zooming and
contour overlays.
o Provide the ability to overlay objects from catalogues.
o Support the FITS and VOTable file formats.
o Allow users to view and analyse very large images transparently.
o Allow the development of differing user interfaces to make use of a core set
of functionalities.

Remote Visualisation System III. Project Management Plan
30
III. Project Management Plan
1 Overview
1.1 Introduction
This section covers the management plan for the Remote Visualisation System
project to be undertaken by me, Anil Chandra at the Australia Telescope National
Facility (ATNF).
The goals of this plan are to:
o Determine the process model that will be used to implement the system.
o Break down the work into smaller work components.
o Develop a schedule for the entire duration of the project.
o Determine the resources required for the project to be completed successfully.
o Perform a risk analysis and develop strategies of minimising the risks.
1.2 System Description
The Remote Visualisation System (RVS) is to be a software system that allows
remote visualisation and analysis of astronomical datasets through a generic
interface. For example, a user shall be able to use a web browser to visualise and
interact with a dataset that exists on a different machine at a different location.
Figure III-1shows a simplified view of the use of RVS. It receives commands from a
client (the user), obtains the required data from the appropriate external source,
formats the data so that it can be visualised by the client and sends this formatted
data back to the client.

Remote Visualisation System III. Project Management Plan
31
RVS
User
Database/Catalogue of Datasets
User requests dataset
Visualisation Data (Image) returned to user
RVS requests dataset
Dataset returned to RVS
Figure III-1: System overview diagram
1.3 Project Constraints
The constraints of the RVS project are:
o Time – a period of one has been allocated for the duration of the project. The
system must be completed within this time.
o Resources – The software being developed is for research purposes and will
be an open source, freely available software system. Since there will be no
financial return on investment, the system will need to operate mostly with
freely available software.
o Expertise – My personal level of expertise is limited to my experience with
JAVA based web systems and application level C++ development. Since I
will be, primarily, the only software engineer working on the system, this
lack of expertise may limit the technologies to be used.

Remote Visualisation System III. Project Management Plan
32
2 Process Model
To solve actual problems in an industry setting, a software engineer or a team of
engineers must incorporate a development strategy that encompasses the process, the
methods and the generic phases in the project. This process is often referred to as a
process model (Pressman, 2000). The list of general models that Pressman describes
is:
o The linear sequential model
o The prototyping model
o The Rapid Application Development (RAD) model
o The incremental model
o The spiral model (and the WINWIN spiral model)
o The concurrent development model
o Component based development
After reviewing the above models, I have decided that a slight derivation of the
incremental model is the most appropriate process for the RVS project.
analysis design code informal tests
System/Informationengineering
Increment 1
analysis design code informal testsIncrement 2
analysis design code informal testsIncrement 3
Completion ofincrement 1
Delivery of RVSPrototype
Completion ofincrement 3
analysis design code informal testsIncrement n
Completion ofincrement n
Figure III-2: Incremental process model of RVS

Remote Visualisation System III. Project Management Plan
33
The incremental model combines elements of the linear sequential model applied
iteratively with the iterative philosophy of prototyping (Pressman, 2000). The RVS is
a project with some technological uncertainties. It is a technically challenging project
due to its server side nature and hence, the technical feasibility of the system must be
established as early as possible. This will be done by building a working version of
the RVS Server in the early phases of the project. From that point on, the RVS
Server will continue to be operational, with new functionality being added after each
increment. Figure III-2 shows the modified incremental process to be adopted by this
project.
Being a research project, the RVS does not have a ‘client’ as a project would have in
a business environment. The progress of the project will be monitored by my
industry supervisor, Mr Malte Marquarding, and at a much higher level by a CSIRO
Projects Review Committee. The incremental model requires a working prototype
model to be developed at the end of each increment. The RVS, however, will not
produce a working prototype after each increment. The output of each increment will
simply be an RVS Server that has been further implemented further since the
previous increment.
The reason behind this modification to the standard model is that the delivery of
official prototypes requires additional overheads in testing and documentation. This
has been avoided by having a less formal approach to the increment delivery phase.
Instead of a prototype after each increment, an official prototype will be released
after the second increment. This is necessary in order to guarantee the technical
feasibility of the project. After this increment, the design will be thoroughly
reviewed and modifications made where necessary.
3 Scheduling
This section details the schedule for the RVS project by first breaking the project
down into smaller components. These components are then represented in a Gantt
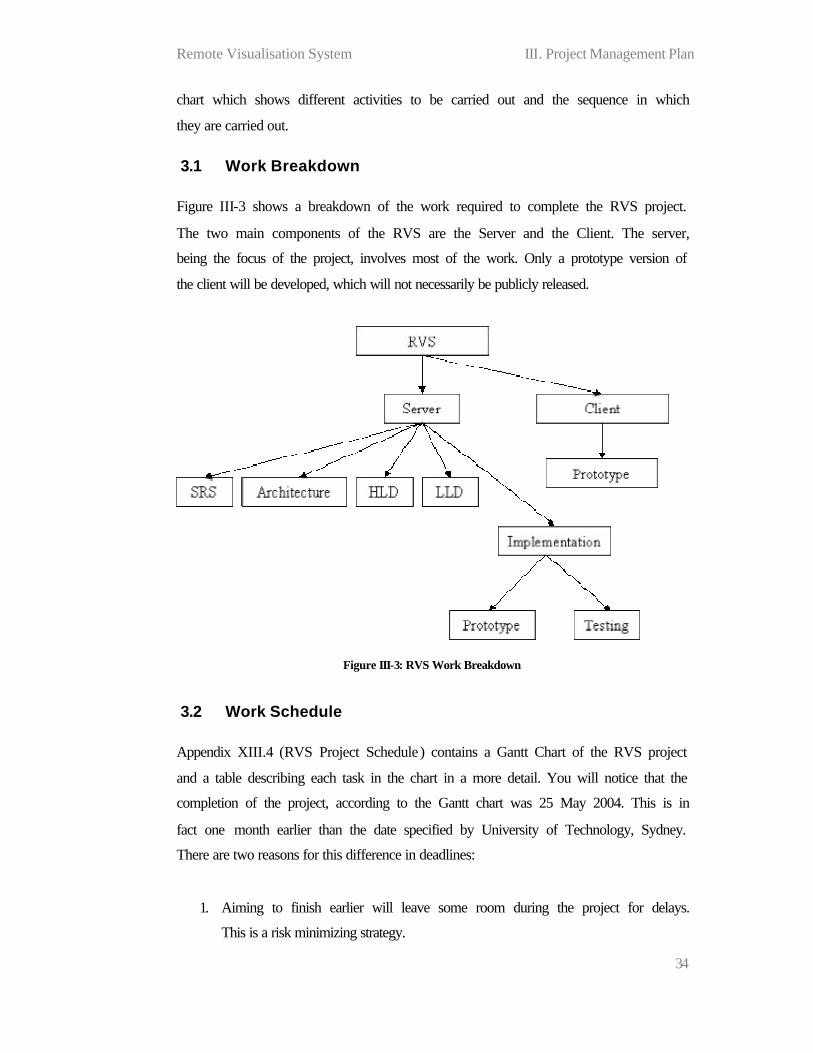
Remote Visualisation System III. Project Management Plan
34
chart which shows different activities to be carried out and the sequence in which
they are carried out.
3.1 Work Breakdown
Figure III-3 shows a breakdown of the work required to complete the RVS project.
The two main components of the RVS are the Server and the Client. The server,
being the focus of the project, involves most of the work. Only a prototype version of
the client will be developed, which will not necessarily be publicly released.
Figure III-3: RVS Work Breakdown
3.2 Work Schedule
Appendix XIII.4 (RVS Project Schedule) contains a Gantt Chart of the RVS project
and a table describing each task in the chart in a more detail. You will notice that the
completion of the project, according to the Gantt chart was 25 May 2004. This is in
fact one month earlier than the date specified by University of Technology, Sydney.
There are two reasons for this difference in deadlines:
1. Aiming to finish earlier will leave some room during the project for delays.
This is a risk minimizing strategy.

Remote Visualisation System III. Project Management Plan
35
2. My employment contract at ATNF finished on 25 June 2004. In the case that
I did not continue, ATNF wanted the project complete enough for my
successor to continue on it.
4 Project Resources
This section identifies all the resources required to complete the project successfully.
4.1 Human Resources
I am the only full time software engineer working on this project. It is intended that
assistance will be obtained from the following people when necessary.
Mr Malte Marquarding – Software Engineer at ATNF
Dr Neil Killeen – Software Developer / Team Leader at ATNF
Dr David Barnes – Scientist at University of Melbourne
4.2 Hardware
The hardware requirements of the project are listed below.
Hardware Comments Availability
Server to host CVS
and Bugzilla
To host the CVS server that can be
accessed at all times from any location. ATNF
Server to host the RVS To host a web server that will be the
RVS access point. CMIS
A development
platform with at least
256 MB RAM and
LAN adapter
Development PC. This will be the PC
that I will do all my development work
on.
Self + ATNF
Table III-1: Software resources required by RVS
4.3 Software
The following software resources will definitely be required during the course of the
project.
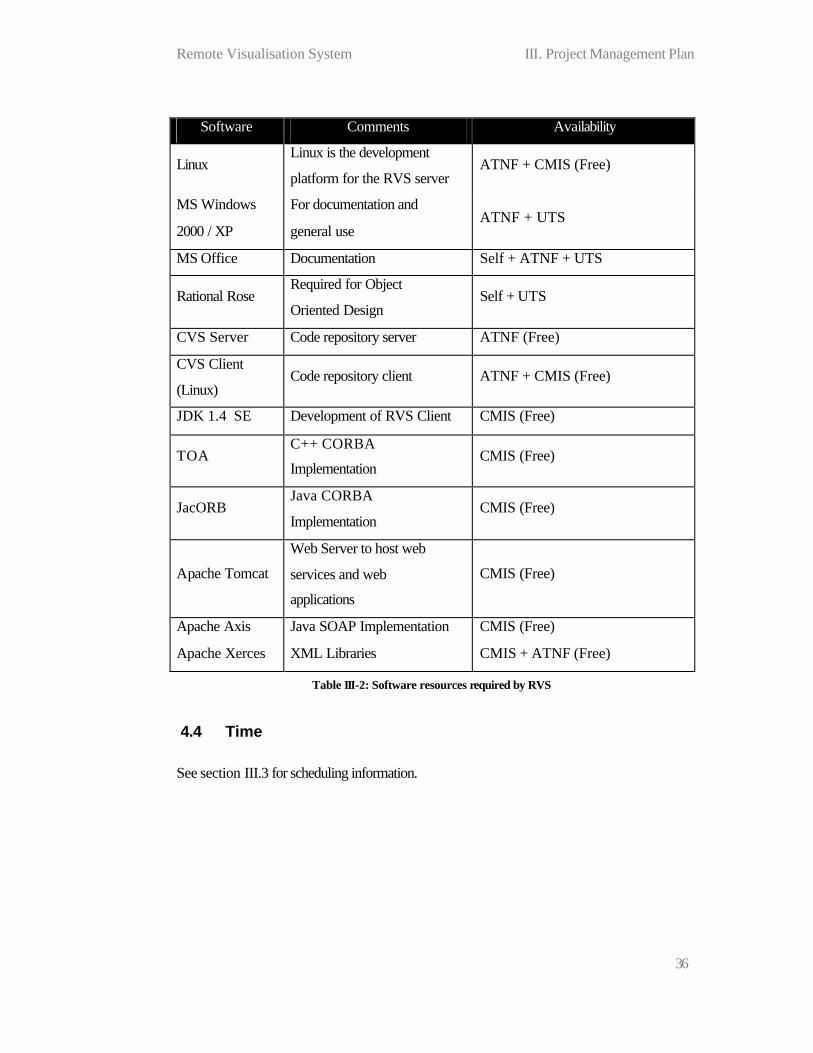
Remote Visualisation System III. Project Management Plan
36
Software Comments Availability
Linux Linux is the development
platform for the RVS server ATNF + CMIS (Free)
MS Windows
2000 / XP
For documentation and
general use ATNF + UTS
MS Office Documentation Self + ATNF + UTS
Rational Rose Required for Object
Oriented Design Self + UTS
CVS Server Code repository server ATNF (Free)
CVS Client
(Linux) Code repository client ATNF + CMIS (Free)
JDK 1.4 SE Development of RVS Client CMIS (Free)
TOA C++ CORBA
Implementation CMIS (Free)
JacORB Java CORBA
Implementation CMIS (Free)
Apache Tomcat
Web Server to host web
services and web
applications
CMIS (Free)
Apache Axis Java SOAP Implementation CMIS (Free)
Apache Xerces XML Libraries CMIS + ATNF (Free)
Table III-2: Software resources required by RVS
4.4 Time
See section III.3 for scheduling information.
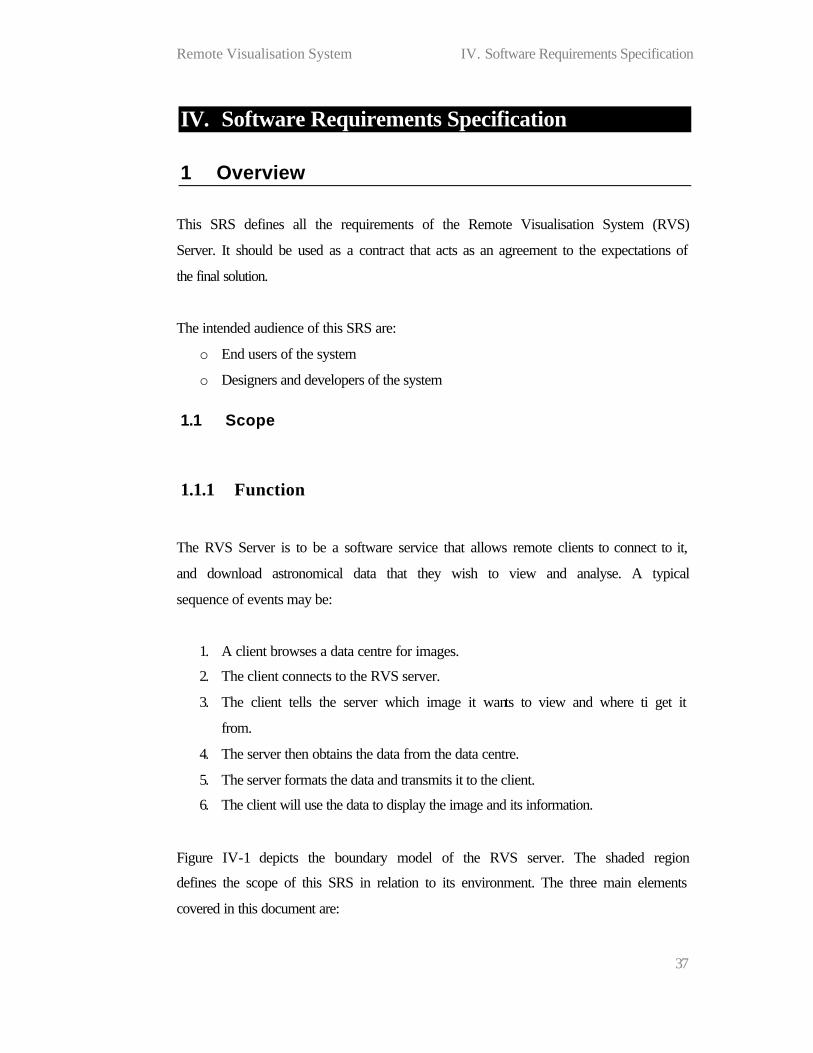
Remote Visualisation System IV. Software Requirements Specification
37
IV. Software Requirements Specification
1 Overview
This SRS defines all the requirements of the Remote Visualisation System (RVS)
Server. It should be used as a contract that acts as an agreement to the expectations of
the final solution.
The intended audience of this SRS are:
o End users of the system
o Designers and developers of the system
1.1 Scope
1.1.1 Function
The RVS Server is to be a software service that allows remote clients to connect to it,
and download astronomical data that they wish to view and analyse. A typical
sequence of events may be:
1. A client browses a data centre for images.
2. The client connects to the RVS server.
3. The client tells the server which image it wants to view and where ti get it
from.
4. The server then obtains the data from the data centre.
5. The server formats the data and transmits it to the client.
6. The client will use the data to display the image and its information.
Figure IV-1 depicts the boundary model of the RVS server. The shaded region
defines the scope of this SRS in relation to its environment. The three main elements
covered in this document are:

Remote Visualisation System IV. Software Requirements Specification
38
o The RVS server software
o The interface between the server and the Data Centres.
o The interface between the server and the client.
This document does not define the following:
o The functional or non-functional requirements of a client
o How a client connects to the server using the server - client interface.
o The interface between a client and a Data Centre
o The functional or non-functional requirements of Data Centres.
DataCentre
DataCentre
DataCentre
RVS Client
Server - Client InterfaceS
erve
r -
DC
Inte
rface
Clie
nt -
DC
Inte
rfac
e
RVS Server
Figure IV-1: Boundary Model
1.1.2 Objectives
The Objectives of the RVS Server are:
o To provide a facility for users to visualise and analyse images that reside on
different machine(s) at a different geographical location.

Remote Visualisation System IV. Software Requirements Specification
39
o To provide the visualisation data in a generic format so clients have
flexibility in terms of its use.
o To allow multiple users in remote locations to view a single instance of an
image concurrently.
o To provide its remote facilities at a speed that is comparable to client side
visualisation packages. That is, the interaction between user and system
should allow users to perform their tasks at a satisfactory speed.
o To develop a system that is scalable and easily extensible.
1.2 SRS Layout
The remainder of this SRS contains a general description of the RVS, the specific
requirements that it should meet an analysis of the requirements and a list of all the
requirements of the RVS Server.
o The general description section gives a high level view of the server and its
environment.
o The requirements sections details more specific requirements that the server
is to meet.
o The analysis section includes all analysis that was performed in order to
derive the requirements in this document.
o The Requirements Traceability Matrix is a table that that defines all the
requirements and the sections in which they are documented.
2 General Description
2.1 System Functions
The RVS server shall provide the following services to its clients:
o Allow clients to connect to it and use its services.
o Allow clients to request viewing of image located in remote Data Centres.
o Receive images from remote Data Centres.
o Encapsulate the image data in a consistent data format.

Remote Visualisation System IV. Software Requirements Specification
40
o Send the formatted data to the client that requested the data.
o Facilitate the sharing of images amongst clients.
o The formatted data sent to clients shall encapsulate sufficient information so
the clients can visualise it and, at a minimum, perform position tracking on
the image.
2.2 User Characteristics
Users of the RVS server can be divided into two groups; direct users and indirect
users.
Direct User Description
RVS Server Administrators
Individuals who have administrative right to the RVS server.
They shall have access to the application installations and be
capable of viewing/modifying the server’s internal
parameters. Administrator access shall not be provided
remotely.
Client Developers
Individuals that are involved in the development of RVS
client applications. They will use the client – server interface
to connect to the server
Data Centre Developers / Administrators
Individuals involved with interfacing a data centre to the
RVS server.
Table IV-1: Characteristics of direct users of RVS Server
Indirect User Description
End Users (Service Users)
Individuals such as scientists who will use an RVS client
software to visualise an analyse images using the RVS server.
Service users are divided into two types:
1. Master user 2. Slave user
Table IV-2: Characteristics of indirect users of RVS Server
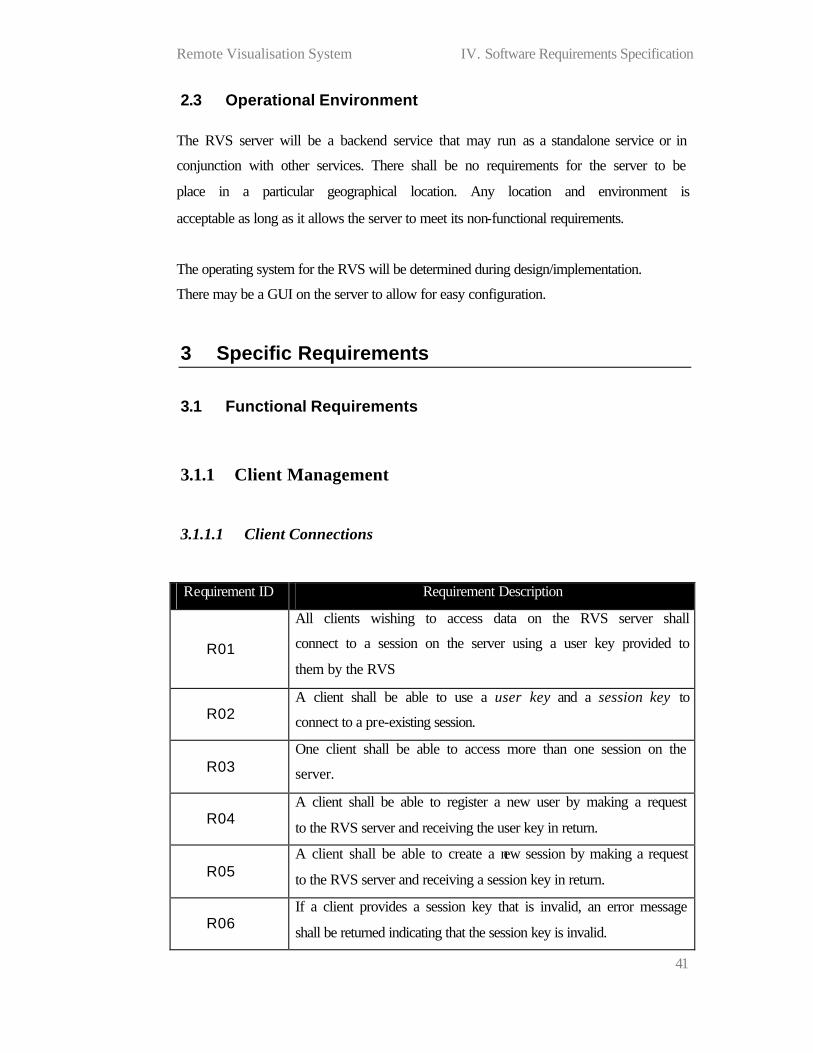
Remote Visualisation System IV. Software Requirements Specification
41
2.3 Operational Environment
The RVS server will be a backend service that may run as a standalone service or in
conjunction with other services. There shall be no requirements for the server to be
place in a particular geographical location. Any location and environment is
acceptable as long as it allows the server to meet its non-functional requirements.
The operating system for the RVS will be determined during design/implementation.
There may be a GUI on the server to allow for easy configuration.
3 Specific Requirements
3.1 Functional Requirements
3.1.1 Client Management
3.1.1.1 Client Connections
Requirement ID Requirement Description
R01
All clients wishing to access data on the RVS server shall
connect to a session on the server using a user key provided to
them by the RVS
R02 A client shall be able to use a user key and a session key to
connect to a pre-existing session.
R03 One client shall be able to access more than one session on the
server.
R04 A client shall be able to register a new user by making a request
to the RVS server and receiving the user key in return.
R05 A client shall be able to create a new session by making a request
to the RVS server and receiving a session key in return.
R06 If a client provides a session key that is invalid, an error message
shall be returned indicating that the session key is invalid.

Remote Visualisation System IV. Software Requirements Specification
42
R07
Each session shall timeout after it has been idle for a
configurable period of time. There shall be a default timeout
period for all sessions (this value shall also be configurable).
R08
When a session is timed out it is deleted and all data associated
with only that session is deleted. A caching mechanism may hold
some data in case the need for the data arises again in the near
future.
R09 A master user shall have the ability to explicitly delete a session.
R10 All users of a session shall be notified when the session is
deleted. See related requirement R06.
Client/User : User Key : Session Key
SessionServer
Image
1 n
1
n
1
n
Figure IV-2: Relationship between client, server, session and image
3.1.1.2 Service User Types
Requirement ID Requirement Description
R11
There shall be two types of end users of the RVS Service:
o Master user
o Slave user
R12 The user that created a session shall be the Master user for that
session.
R13 Master users shall have read and write access to the session they
create on the RVS server.

Remote Visualisation System IV. Software Requirements Specification
43
R14 All clients that are not Master users shall access a session as
Slave users.
R15 Slave users of a session shall only have read-access to that
session on the RVS server.
R16
When a Master user on the RVS server modifies the instance of
an image, the updated image data shall be sent to all users in that
session.
Client/User : User Key : Session Key
Master User
Slave User
Session n
1 n
n
Figure IV-3: Relationship between clients and a session
3.1.2 Security
Requirement ID Requirement Description
R17 A client shall only be able to create a session when:
o The client explicitly requests a new session.
R18
When a new session is created the RVS Server shall:
o Generate a new unique session key for the session
o Send the session key to the client that requested the
session creation.

Remote Visualisation System IV. Software Requirements Specification
44
R19
A client shall only be given access to an existing session when:
o A valid user key is provided and
o A valid session key (for that session) is provided.
R20
A master user, when creating a session, shall have the option of
selecting the maximum number of users for the session. The
default shall be 1 (one). At any time a master user shall be able to
change this value to a value more than the number of current
users of the session.
R21 Provisions shall be made so that advance mechanisms such as
public key authentication can be added to the system in the future
Session
Key Session
User Key Client 1 n
n
n
1 1
Figure IV-4: Relationship of keys to uses and sessions
3.1.3 Data Centre Management
3.1.3.1 Connection
Requirement ID Requirement Description
R22 The RVS Server shall initiate a connection with a data centre at
the request of a user.
R23
The user shall provide a URL to be used as a query to the data
centre. This URL must return an image of an acceptable standard
format. See 3.1.5 for acceptable image formats.

Remote Visualisation System IV. Software Requirements Specification
45
R24 After a connection is established the RVS server shall receive the
image data (see 3.1.5) from the data centre.
R25 After receiving all data from a data centre, the RVS server shall
associate the image with at least one session.
R26
If the data is of an invalid format or the data is not received
successfully, an error message shall be sent to the user indicating
that the requested the image cannot be obtained.
R27
If a failure occurs in receiving data from a data centre, the user
shall have the option of retrying the process without having to
submit all query data again.
R28
The caching of images shall be implemented so that frequently
accessed images can be accessed locally instead of transferring
remote data each time.
3.1.4 Visualisation
3.1.4.1 Image Canvas
Requirement ID Requirement Description
R29 An image canvas shall be the container that holds all the
visualisation information in a session.
3.1.4.2 Image Manipulation
Requirement ID Requirement Description
R30 The RVS server shall be able to obtain the image data of a single
channel from an image cube to send to a client.
R31
The RVS server, upon request from a client, shall rotate the
image on the X, Y or Z plane. When images are rotated, the
server shall retain the original axes order.
R32 The RVS server, upon request from a client shall return a subset
of the currently displayed image (zooming).
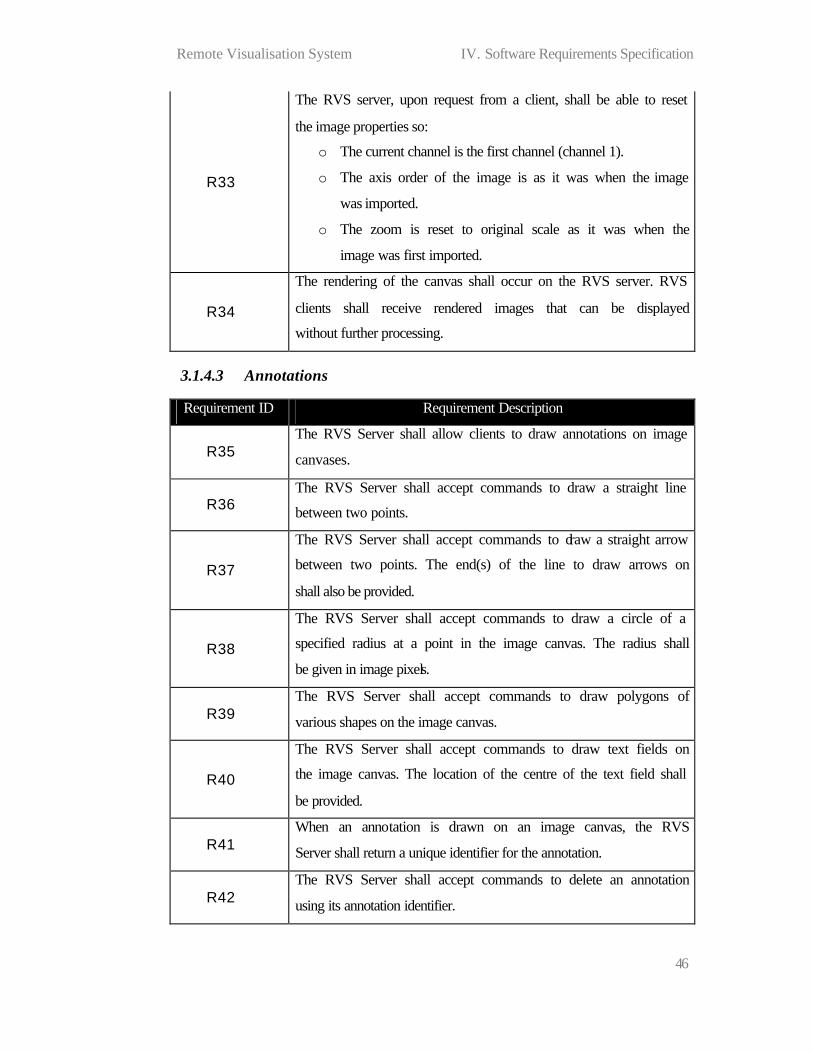
Remote Visualisation System IV. Software Requirements Specification
46
R33
The RVS server, upon request from a client, shall be able to reset
the image properties so:
o The current channel is the first channel (channel 1).
o The axis order of the image is as it was when the image
was imported.
o The zoom is reset to original scale as it was when the
image was first imported.
R34
The rendering of the canvas shall occur on the RVS server. RVS
clients shall receive rendered images that can be displayed
without further processing.
3.1.4.3 Annotations
Requirement ID Requirement Description
R35 The RVS Server shall allow clients to draw annotations on image
canvases.
R36 The RVS Server shall accept commands to draw a straight line
between two points.
R37
The RVS Server shall accept commands to draw a straight arrow
between two points. The end(s) of the line to draw arrows on
shall also be provided.
R38
The RVS Server shall accept commands to draw a circle of a
specified radius at a point in the image canvas. The radius shall
be given in image pixels.
R39 The RVS Server shall accept commands to draw polygons of
various shapes on the image canvas.
R40
The RVS Server shall accept commands to draw text fields on
the image canvas. The location of the centre of the text field shall
be provided.
R41 When an annotation is drawn on an image canvas, the RVS
Server shall return a unique identifier for the annotation.
R42 The RVS Server shall accept commands to delete an annotation
using its annotation identifier.

Remote Visualisation System IV. Software Requirements Specification
47
3.1.5 Image Data
Requirement ID Requirement Description
R43
The image format supported by the RVS server are:
o FITS
o AIPS++ images
o VOTable
R44 All images shall contain valid coordinate systems
R45 The data sent to all clients for visualisation and analysis shall be
in a standard file format (such as XML) so it is easy to interpret.
R46
The data sent to all clients shall encapsulate the following
information at a minimum:
o The data array to be visualised.
o The coordinate system of the image
R47 The RVS server shall be capable of compressing the image data
before transferring to the client.
3.1.6 Image Transfer
Requirement ID Requirement Description
R48 The client shall provide the RVS server with the query string to
be used for accessing images from data centres.
R49 The RVS Server shall receive images after requesting it from a
data centre
R50
When an image is received from a data centre the RVS server
shall:
o Associate the image with at least one session
o Update the canvas inside which the image is placed.
R51 If an image is not associated with a session, it shall be removed
or cached in the RVS server.
R52 The RVS image data file shall be transferred to a client when the
client makes a request.
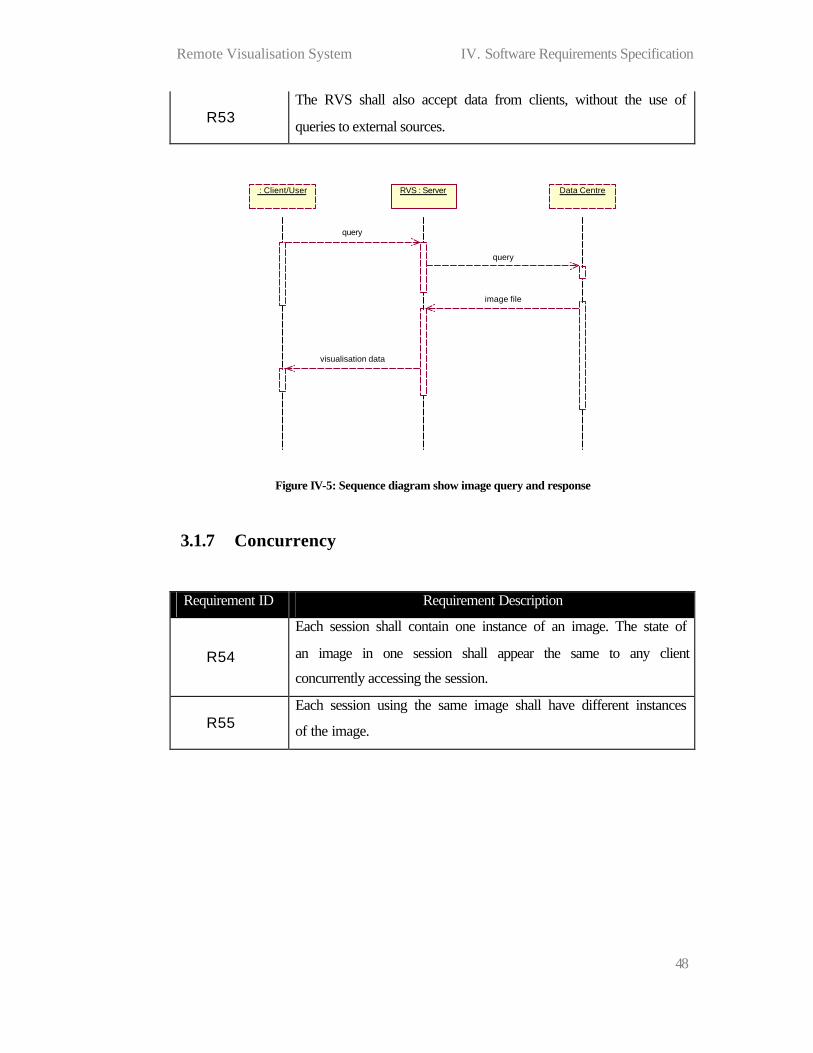
Remote Visualisation System IV. Software Requirements Specification
48
R53 The RVS shall also accept data from clients, without the use of
queries to external sources.
RVS : Server : Client/User Data Centre
query
query
image file
visualisation data
Figure IV-5: Sequence diagram show image query and response
3.1.7 Concurrency
Requirement ID Requirement Description
R54
Each session shall contain one instance of an image. The state of
an image in one session shall appear the same to any client
concurrently accessing the session.
R55 Each session using the same image shall have different instances
of the image.

Remote Visualisation System IV. Software Requirements Specification
49
Image
Instance 1
Instance 2
Session 1
Session 2
Figure IV-6: Multiple users accessing a single image
3.2 Non Functional Requirements
3.2.1 Graphical User Interface
Requirement ID Requirement Description
R56 The RVS server may have a GUI that can be used to adjust server
preferences and settings.
3.2.2 Availability
Requirement ID Requirement Description
R57
An RVS server shall be available to clients and data centres at all
times while the server software is running. Connections to the
server shall only be blocked if serving more clients or data
centres compromises the stability or security of the server.
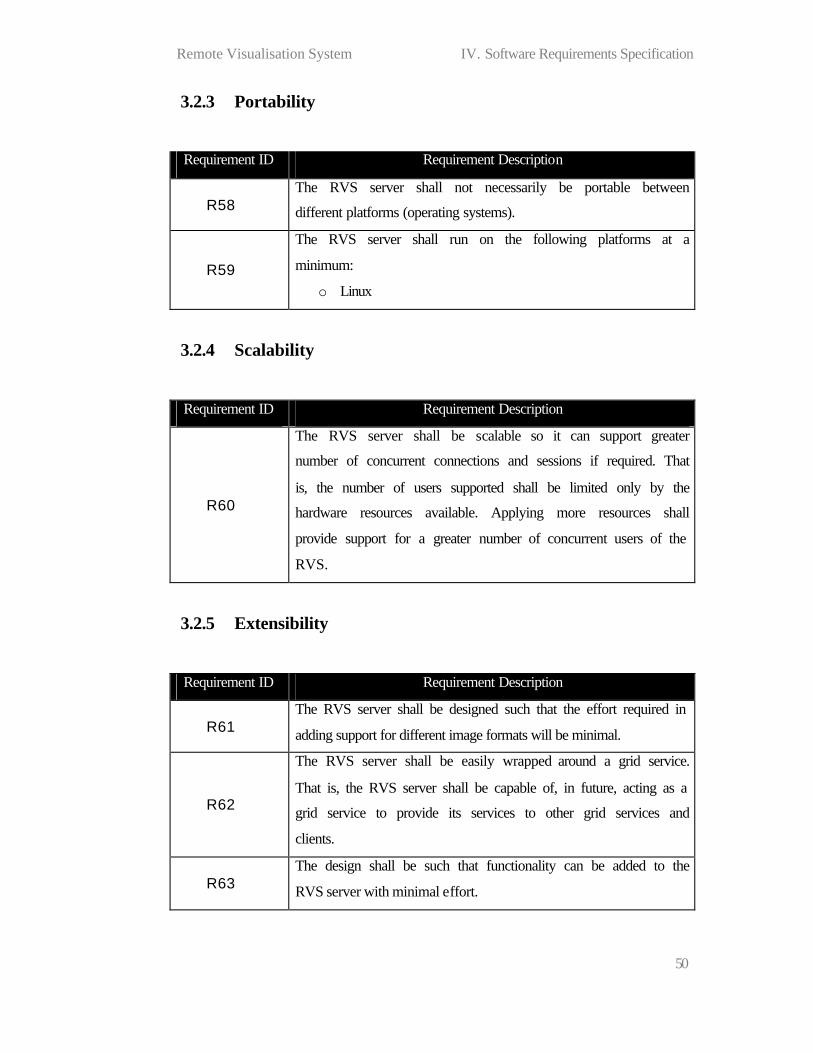
Remote Visualisation System IV. Software Requirements Specification
50
3.2.3 Portability
Requirement ID Requirement Description
R58 The RVS server shall not necessarily be portable between
different platforms (operating systems).
R59
The RVS server shall run on the following platforms at a
minimum:
o Linux
3.2.4 Scalability
Requirement ID Requirement Description
R60
The RVS server shall be scalable so it can support greater
number of concurrent connections and sessions if required. That
is, the number of users supported shall be limited only by the
hardware resources available. Applying more resources shall
provide support for a greater number of concurrent users of the
RVS.
3.2.5 Extensibility
Requirement ID Requirement Description
R61 The RVS server shall be designed such that the effort required in
adding support for different image formats will be minimal.
R62
The RVS server shall be easily wrapped around a grid service.
That is, the RVS server shall be capable of, in future, acting as a
grid service to provide its services to other grid services and
clients.
R63 The design shall be such that functionality can be added to the
RVS server with minimal effort.

Remote Visualisation System IV. Software Requirements Specification
51
3.2.6 Usability
Requirement ID Requirement Description
R64
The RVS server interface (to clients) shall be learnable, so that
client developers may learn to interface to the RVS server using
the interface documentation provided.
3.2.7 Reusability
Requirement ID Requirement Description
R65 The RVS server application shall run on any system with the
appropriate operating environment (see R59).
R66
The RVS server shall have a clearly defined external software
interface so clients of all types can be served. Client types shall
include:
o Web Server
o Other independent servers
o Grid Services
o Cluster of servers.
o Client side applications
o Client side applets
R67 The RVS server shall be modularised so that there is a greater
emphasis on the re-use of individual components.
3.2.8 Configurability
Requirement ID Requirement Description
R68 The RVS server shall be highly configurable with configuration
information stored in an easy to read format.
R69 Configuration information shall be modified without affecting
the availability of the RVS server.

Remote Visualisation System IV. Software Requirements Specification
52
R70 Configuration information shall be viewed and edited by RVS
server administrators only.
3.2.9 Reliability
Requirement ID Requirement Description
R71 The RVS server shall provide the correct data for the requested
image 100% of the time.
R72 The RVS server shall never send image data to any user that did
not request that image.
3.2.10 Performance Requirements
Requirement ID Requirement Description
R73 The RVS server shall provide connectivity via high bandwidth
broadband connection.
R74
The response to a command is to take longer than 20 seconds; an
acknowledgement of the command must be sent the client to
indicate that it is being processed.
R75 The RVS Server shall support at least 50 concurrent sessions.
R76 The RVS Server shall support at least 10 concurrent slave users
per session.
3.2.11 Documentation
Requirement ID Requirement Description
R77
There shall be a user guide document constructed that details:
o The RVS server interface to clients
o A guide to writing clients
o A guide to adding components to the RVS server

Remote Visualisation System IV. Software Requirements Specification
53
4 Requirements Analysis
4.1 Use Cases
Log in to RVS server
Get image from data centre
Receive canvasVisualise canvas
Connect to data centre
<<include>>
Create canvas
<<include>>
Create session
Authorise user
<<include>>
Client
(from Actors)
RVS Server
(from Actors)
Send canvas<<include>>
Figure IV-7: Level 1 Use Case diagram
4.2 State Analysis
Loading settings (from settings file)
Awaiting connection
success
RVS offline
RVS starting
failure
success
failure
Serving client
completed
connected to client
Figure IV-8: Level 1 RVS State Diagram
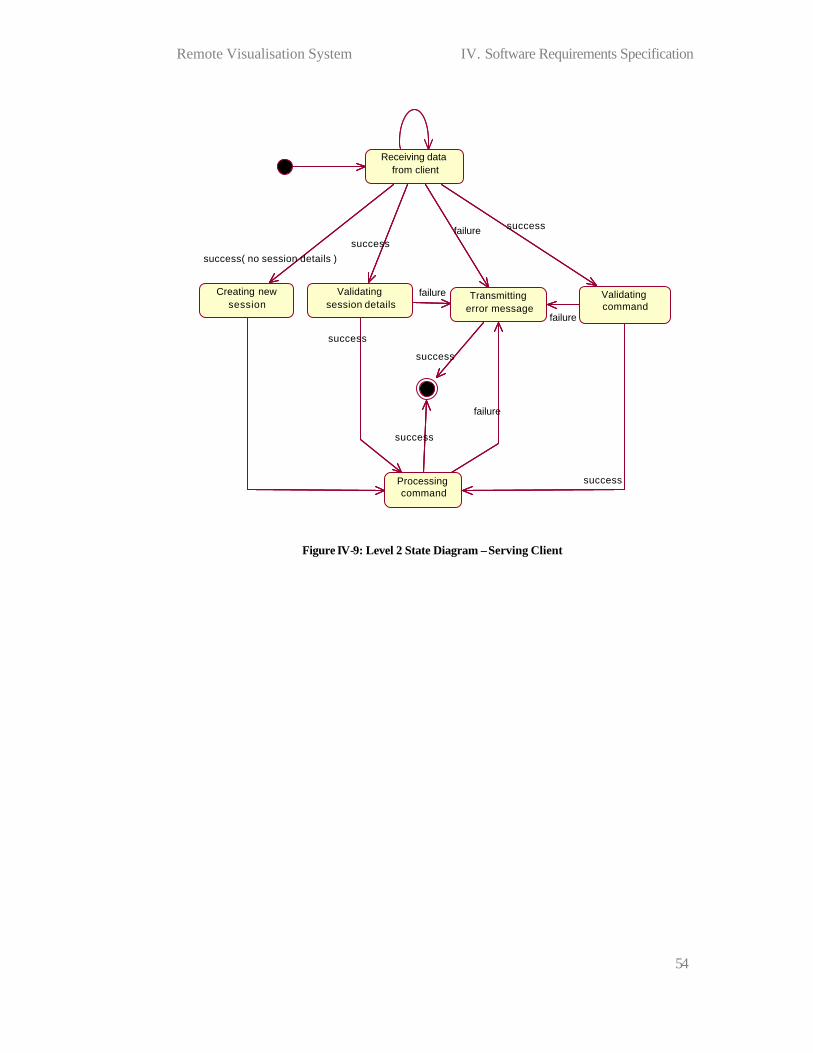
Remote Visualisation System IV. Software Requirements Specification
54
Receiving data from client
Transmitting error message
Validating session details
Validating command
Processing command
success
success
success
Creating new session
success( no session details )
failure
failure
success
success
failure
failure
success
Figure IV-9: Level 2 State Diagram – Serving Client
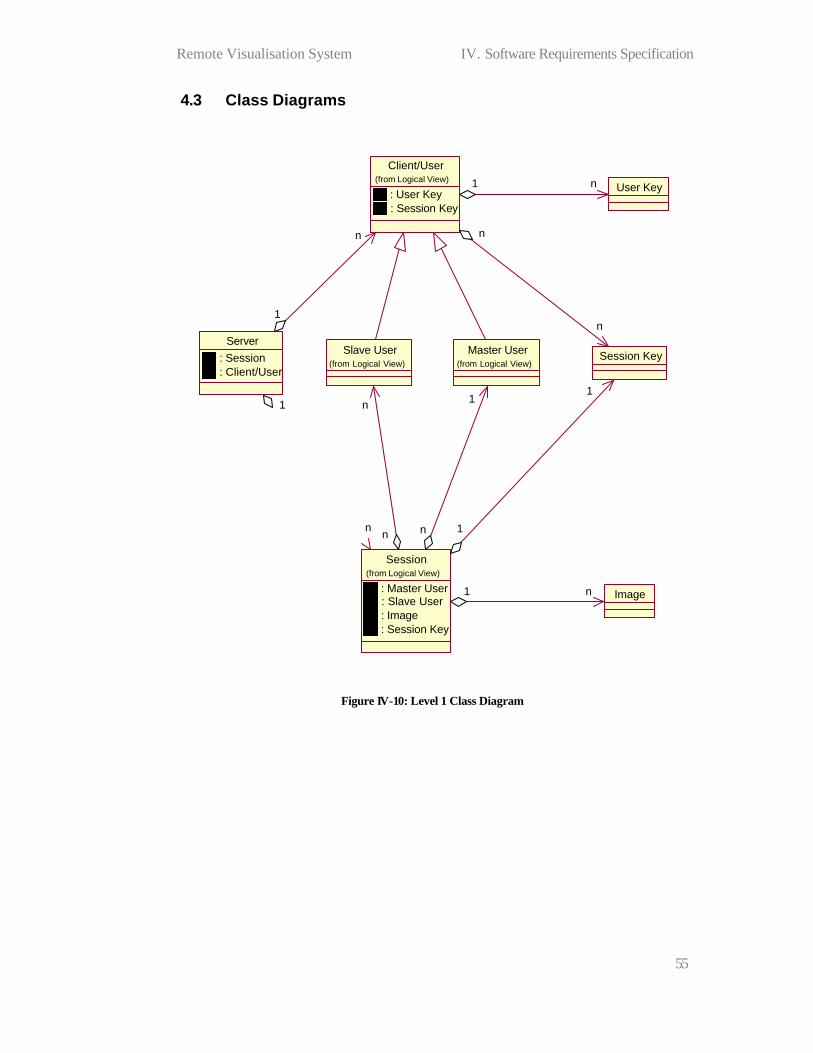
Remote Visualisation System IV. Software Requirements Specification
55
4.3 Class Diagrams
Client/User
: User Key : Session Key
(from Logical View)
Master User (from Logical View)
Session
: Master User : Slave User : Image : Session Key
(from Logical View)
n
1
Slave User (from Logical View)
n
n
User Key 1 n
Session Key
n
n Server
: Session : Client/User
1
n
1
n
Image 1 n
1
1
Figure IV-10: Level 1 Class Diagram

Remote Visualisation System V. System Architecture
56
V. System Architecture
1 Overview
This chapter defines the software architecture of the Remote Visualisation System
(RVS) Server. Its purpose is to ensure that the business goals of the system will be
met by the final design, and hence, the final product that is developed. It compares
several alternative architectures as well as justifying the selected architecture by
demonstrating how it allows the system to meet the appropriate requirements as
defined in the RVS Server SRS (Chapter IV).
The selected architecture is broken down into several components and all of these
components are discussed in the sections below.
2 Scope
This chapter aims to provide a detailed definition of an architecture for the RVS
server selected from a set of alternatives. The criteria for selecting the appropriate
architecture is bounded by the software requirements stated in the software
requirements specification (Chapter IV). The architecture does not promise to meet
requirements outside this boundary.
3 Architecture Goals
There are two basic goals of the RVS server architecture.
o To provide a high level abstract design of a system that can meet the overall
functional objectives of the RVS server.
o To provide a high level design for a system that meets the non-functional
requirements of the RVS server.

Remote Visualisation System V. System Architecture
57
3.1 Functional Objectives
o To provide a facility for users to visualise and analyse images that reside on
different machine(s) at a different geographical location.
o To provide the visualisation data in a generic format so clients have
flexibility in terms of its use.
o To allow multiple users in remote locations to view a single instance of an
image concurrently.
3.2 Non-Functional Objectives
The Architecture should meet all of the following non-functional requirements of the
RVS server:
o Availability – whether the RVS server is ready to be used by clients.
o Portability – whether the software written for the RVS server can be executed
on multiple platforms without re-compiling the code.
o Scalability – the extent to which more concurrent users can be supported
when required.
o Extensibility – the ease with which the functionality can be added to the
system.
o Usability – the ease with which the server can be set up and used.
o Reusability – whether components of the software can be reused within the
application and also by other applications.
o Configurability – the ease with which the operational options of the software
can be modified by administrators and end users.
o Reliability – whether the data received from the RVS server is exactly what is
expected. That is, whether the data is accurate.
o Maintainability – the ease with bugs in the system can be fixed and upgrades
performed.
o Performance – the efficiency of the system.

Remote Visualisation System V. System Architecture
58
4 Design Principals
Principals are “a set of high-level decisions that will strongly influence the integrity
and structure of the system, but is not itself the structure of the system”. (Kruchten
1995) Below are some of the principals that will be used in the design of the RVS
Server architecture.
Principal Independent Components
Description Each component is totally independent of other components.
They should run as independent processes.
Rationale
Makes the system distributed
Improves scalability
Improves maintainability
Counterargument Decrease in performance due to interprocess communication.
Principal Cohesive Components
Description
Components should only perform functions that it is
responsible for (functions that their names suggest they
perform).
Rationale
Improves re-usability since it concentrates functionality
Improves useability by making the system easier to
‘understand’.
Helps in maintenance since problems can be narrowed down to
cohesive components.
Counterargument Results in more components, which results in more processes,
which introduce greater overheads in communication.
Principal Share data storage
Description For data that needs to be shared, share the data storage
locations amongst components.
Rationale
Avoids duplication of data in the system
More efficient since physical data not passed between
components.

Remote Visualisation System V. System Architecture
59
Counterargument
Need to develop access control mechanisms.
Concurrent data access threatens data integrity.
Problems can be very difficult to track/determine/resolve
Principal Separate logic from data
Description Always separate the logic of a component from its data.
Rationale
Increases flexibility by allowing data to be used by other
components if needed.
Makes the system more configurable if persistent data can be
modified without modifying code.
Counterargument More storage needed
Data access becomes very slightly slower.
5 Architecture Description
Appendix XIII.1 shows a number of alternative architectures that have been
evaluated before arriving at the final architecture. The RVS Server will be a
Distributed Architecture since the evaluation shows that the business requirements of
the system can best be met with this architecture.
Figure V-1 shows the different conceptual components that make up the system. This
view is intentionally simplistic and further break down of the components will be
done in later stages of design.

Remote Visualisation System V. System Architecture
60
Command Centre
Middleware
User Manager
Middleware
Session
Middleware
Security
Middleware
DataCommunications
Manager
Middleware
Data Storage
Figure V-1: Conceptual view of RVS Server architecture
5.1 Component Descriptions
5.1.1 Command centre
o The point of access for all RVS clients
o Uses the security sub-component to manage user access rights.
o Interpret commands received from clients
o Execute user commands by interfacing with other components
o Format commands for delivery to clients
5.1.2 Security Service
o Ensuring right user access to right sessions.
o Create user and session keys
o Manage list of user keys
o Manage list of session keys
Remote Visualisation System V. System Architecture
61
5.1.3 User Manager
o Manage the user process
o Process commands from the command centre
o Send messages to users (via command centre)
o Manage a list of sessions a user is involved in
o Manage a set of user specific preferences
5.1.4 Session Manager
o Encapsulate data representing single sessions.
o Manage an image canvas for the session.
o Provide access to an interface allowing operations on a canvas.
5.1.5 Data Communications Manager
o Establish connections with remote data centres.
o Obtain data from remote data centres when requested.
o Provide caching of data that is retrieved.
o Send and receive any other data required by the RVS Server from an external
source.
6 Logical View
This view aims to provide an overview of the logical components that make up the
system. (Kruchten 1995)

Remote Visualisation System V. System Architecture
62
Command Centre
Security
SessionUser Manager
Data Storage
1 1
1
n
n n
n
1
1
nData Communications
Manager
n
1
n
1
n
n
Figure V-2: Logical view of RVS Server architecture
As can be seen from Figure V-2, the RVS server will consist of multiple users,
multiple sessions along with single instances of the Command Centre, Security
Service and Data Communications Manager.
One command centre exists as a point of user access and this component uses a
single security component to authorise users. Authentication mechanisms may also
be built into the security component.
7 Process View
The process view looks at the tasks (or processes) that will be executing in the
system. (Kruchten 1995) Each component of the architecture executes as an
individual process. Each RVS server deployment will have one command centre
process, one user manager process for each user accessing the server and one session
process for every session running on the server.
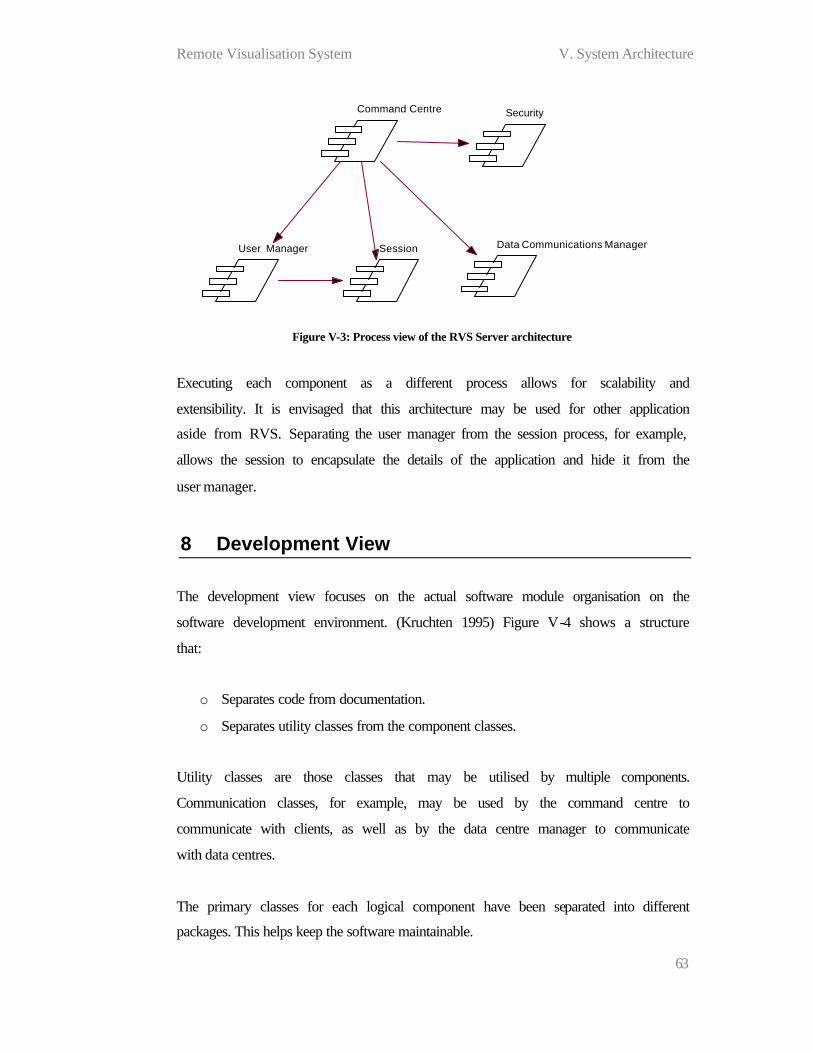
Remote Visualisation System V. System Architecture
63
Command Centre
User Manager Session
Security
Data Communications Manager
Figure V-3: Process view of the RVS Server architecture
Executing each component as a different process allows for scalability and
extensibility. It is envisaged that this architecture may be used for other application
aside from RVS. Separating the user manager from the session process, for example,
allows the session to encapsulate the details of the application and hide it from the
user manager.
8 Development View
The development view focuses on the actual software module organisation on the
software development environment. (Kruchten 1995) Figure V-4 shows a structure
that:
o Separates code from documentation.
o Separates utility classes from the component classes.
Utility classes are those classes that may be utilised by multiple components.
Communication classes, for example, may be used by the command centre to
communicate with clients, as well as by the data centre manager to communicate
with data centres.
The primary classes for each logical component have been separated into different
packages. This helps keep the software maintainable.

Remote Visualisation System V. System Architecture
64
src
util
comms
imaging
datacomms
Security
Session
CommandCentre
...
User Manager
java
rvs
corba
src
util
comms
imaging
datacomms
Security
Session
CommandCentre
...
User Manager
cpp
corba
corba
corba
corba
corba
Figure V-4: Development view of the RVS architecture
9 Physical View
It is a requirement of the RVS server to support multiple client connections at any
one time. To support multiple users and still meet the performance requirements, the
RVS server needs to be distributed across multiple nodes on a network.
There needs to be a central server that receives and transmits messages to users and
other RVS server components. Figure V-5 shows the physical distribution of
processes amongst different machines (nodes).

Remote Visualisation System V. System Architecture
65
User manager 1 Session Manager 1
DataCommunications
Manager 1
Command Centre Security Service
User manager 2 Session Manager 2
DataCommunications
Manager 2
Figure V-5: Physical view of RVS Server architecture
It shows only two nodes expanding from the main node (command centre node) but
there can be many nodes to support greater number of users and sessions.
In cases where multiple users are accessing the same session, all users do not need to
be executing on the same node. However, placing them in the same node will
improve performance since data is passed around locally, and not over a network.
It is of course possible for all components reside in a single machine. The
distribution of components over different nodes is required when one machine is
being overloaded with processing. If one node can do all the work, then the overall
performance will be better if all key components reside on a single node.

Remote Visualisation System VI. High Level Design
66
VI. High Level Design
1 Overview
The purpose of this chapter is to provide a high level description of the RVS server.
It follows on from the system architecture, described in chapter I, by further detailing
each component of the server and interfaces between them.
At this stage, some critical design decisions have been made, which tie some
components of the system to particular implementation technologies. These design
decisions will be justified by considering the likely alternatives.
2 Scope
The aims of the high level design are:
o To define the major software components of the RVS server.
o To define the interfaces between the components.
o To determine how these components will work together in various scenarios.
This chapter does not go into the low level design details of the components. That is,
it does not detail the processes and the data involved in completing the services
defined by its interfaces.
3 Design Considerations
3.1 Assumptions
o It is an assumption of the high level design that all participating nodes in a
distributed environment will be connected via a high bandwidth connection.

Remote Visualisation System VI. High Level Design
67
3.2 Constraints
o For the most efficient design, communication between an RVS client and the
RVS server needs to be asynchronous. However, the RVS server is to be
implemented as a GRID service, which limits the communication to being
synchronous (via HTTP). Therefore, although asynchronous communication
may occur for services other than GRID services, the design needs to be able
to handle the possibility of a user communicating only synchronously with
the server.
3.3 System Environment
The RVS server will run on Linux and shall be distributed amongst at least two
computers (nodes) on a network. The main node will be the one running the
Command Centre component and all other nodes will be connected to the data centre
via a very high bandwidth connection.
3.4 Design Methodology
3.4.1 Inter-Process Communication
Some of the RVS Server components shall communicate with each other through
some form of inter-process communication (IPC) if the components are functioning
as different processes (For example, the command centre will need to communicate
with the user manager using IPC). On the Linux platform there are several forms of
low level IPC.
o Pipes
o Message Queues
o Shared Memory
o Semaphores
o Sockets
Remote Visualisation System VI. High Level Design
68
IPC using sockets is the only mechanism for communication between processes
running on different nodes on a network. The problem with all of the above
mechanisms, including sockets, is that that they are all very low level. This results in
a lot of steps for designers and coders in order to achieve stable, secure and efficient
communication.
Alternatives to these low level approaches are the following application level
mechanisms.
o RPC
o SOAP
o XML-RPC
o CORBA
o RMI
It is apparent that for Object Oriented and flexible architectures such as this, CORBA
will be the most appropriate communication between processes on different
processors. There following features of CORBA were decisive factors:
o CORBA is built around pure object oriented architecture
o Language independence
o Platform independence
o Mature technology
o Wide support and resources
o Standard for distributed systems
Therefore, the major components of RVS server will be separate processes
communicating with each other using CORBA.

Remote Visualisation System VI. High Level Design
69
Command Centre
CORBA
User Manager
CORBA
Session
CORBA
Security
CORBA
DataCommunications
Manager
CORBA
Data Storage
Figure VI-1: Communication between distributed RVS Server processes
4 Distributed Environment
As mentioned in 3.4.1 CORBA will be the glue that holds together the RVS server’s
distributed environment. A command centre will be the central point of contact for
all uses of the RVS server. The command centre then has one of two options:
o Call the User Manager Invocation Service (UMIS) to create a User Manager
Service for a new user.
o Call the Session Invocation Server (SIS) to create a new Session.
o Send commands to user manager / session to satisfy the user command.
4.1 User Manager Invocation Service (UMIS)
A UMIS is special part of the user manager component that will be used by
command centres to create User Managers for new RVS users. It is an application

Remote Visualisation System VI. High Level Design
70
running on a networked server that offers a CORBA interface to its services. This
allows any number of UMIS applications to be distributed on multiple servers across
a network.
It is important to note that the reason for having a service such as UMIS is due to the
stateful sessions required for the RVS. For applications that are not required to
maintain user state information, the sensible solution will be to provide service
specific managers instead user specific managers. For example, instead of calling on
a user manager to convert an image to a different format, the image object can be
sent to an independent imaging service (that is distributed somewhere on the
network) to perform the conversion.
Command Centre
ORB
User manager 2
ORB
User manager 1
ORB
ORB
UMIS
Create Create
Create User
Figure VI-2: Creating user manager via UMIS
The diagram above shows a command centre instructing a UMIS to create a User
Manager. The larger dashed rectangle signifies a different node on the network. Each
of the User Managers, the UMIS and the Command Centre are all operating as
different processes in their respective node and communicating with each other
through an ORB.

Remote Visualisation System VI. High Level Design
71
Although multiple UMIS is allowed, there only needs to be one deployment of UMIS
per node. Therefore, each node wishing to host a User Manager shall have UMIS
running.
Once the User Managers are created, the command centre will communicate directly
with them, without going through the UMIS. This is illustrated in Figure VI-3.
Command Centre
ORB
User manager 2
ORB
User manager 1
ORB
ORB
UMIS
usercommand
usercommand
Figure VI-3: UMIS and User Managers during normal operation
4.1.1 Session Invocation Service (SIS)
The SIS is a special service that is part of the Session component. Its purpose is
almost the same as that of the UMIS, with the difference being the SIS creates
Session processes (when requested) instead of User Managers.
5 Components
The following section is a break down of all the architectural components in the RVS
Server. The purpose and the responsibilities of each component are identified as well
as the software interface exposed by the components.
Remote Visualisation System VI. High Level Design
72
5.1 Command Centre
5.1.1 Identification
RVS Command Centre
5.1.2 Component Type
HTTP Soap Service
5.1.3 Purpose
The purpose of the command centre is to act as the connection point for all RVS
clients. The services offered by the RVS Server will be limited by the operations
available on the command centre.
5.1.4 Function
o Receiving SOAP commands from clients
o Initiate security checks on each command.
o Forward commands to appropriate user components.
o Call distributed objects to perform actions required to process commands
o Format and send SOAP responses to clients
5.1.5 Sub Components
The Command Centre will be made up of two components:
o The SOAP Interface – that performs all SOAP-related operations.

Remote Visualisation System VI. High Level Design
73
o CORBA communications – that performs all the CORBA communication
with other distributed components.
5.1.6 Dependencies
The Command Centre relies on the following components to perform its operations:
o Security Service – used to authorise (and maybe authenticate) users when the
Command Centre is accessed.
o User Manager – used for user management
o Session Manager – used for managing sessions
o Data Communications Manager – used for communicating with data centres
when acquiring remote images.
5.1.7 Interfaces
Return type Operation
boolean exit ()
long createNewSession ()
boolean joinSession (long sessionKey)
boolean quitSession (long sessionKey)
boolean switchToSession (long sessionKey)
long getCurrentSessionKey ()
int addRemoteImage (String url, String type)
boolean removeImage (int id)
ImagePosition getPositionInfo (int imageId, double x, double y)
String getPosInfo (int imageId, double x, double y)
String getImageOptions (int imageId)
String setImageOptions (int imageId, String options)
String getOutputImage ()
boolean setOutputSize (int width, int height)
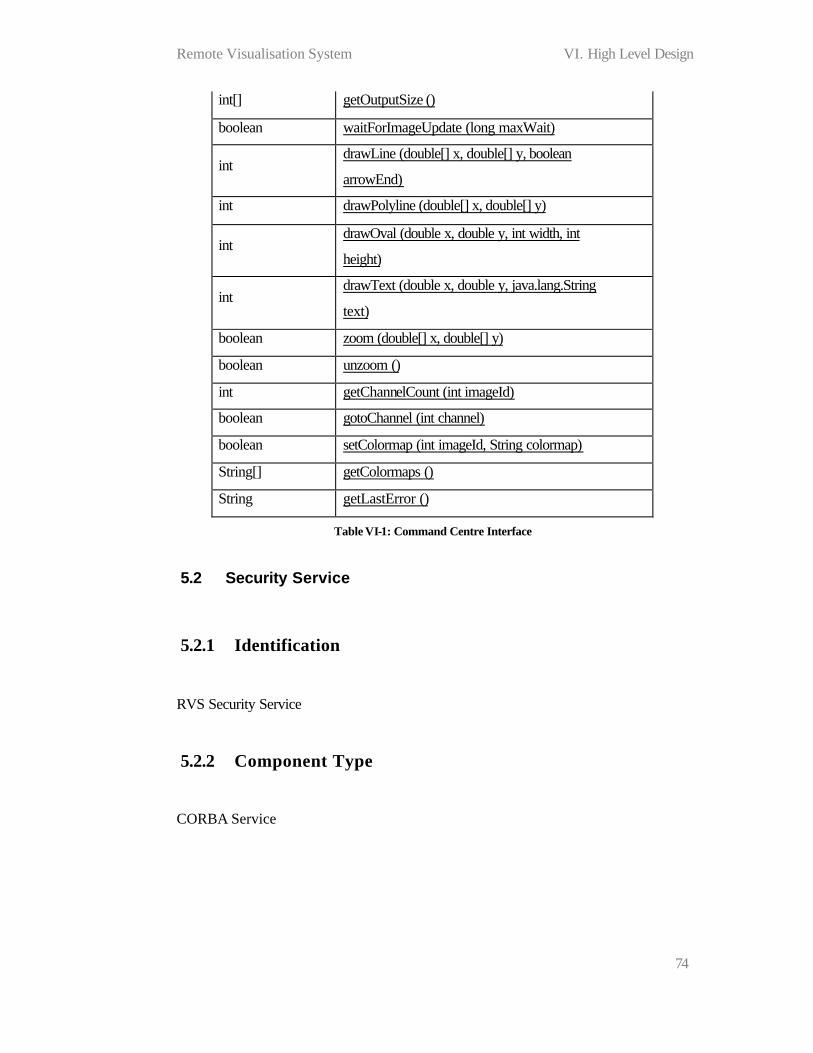
Remote Visualisation System VI. High Level Design
74
int[] getOutputSize ()
boolean waitForImageUpdate (long maxWait)
int drawLine (double[] x, double[] y, boolean
arrowEnd)
int drawPolyline (double[] x, double[] y)
int drawOval (double x, double y, int width, int
height)
int drawText (double x, double y, java.lang.String
text)
boolean zoom (double[] x, double[] y)
boolean unzoom ()
int getChannelCount (int imageId)
boolean gotoChannel (int channel)
boolean setColormap (int imageId, String colormap)
String[] getColormaps ()
String getLastError ()
Table VI-1: Command Centre Interface
5.2 Security Service
5.2.1 Identification
RVS Security Service
5.2.2 Component Type
CORBA Service
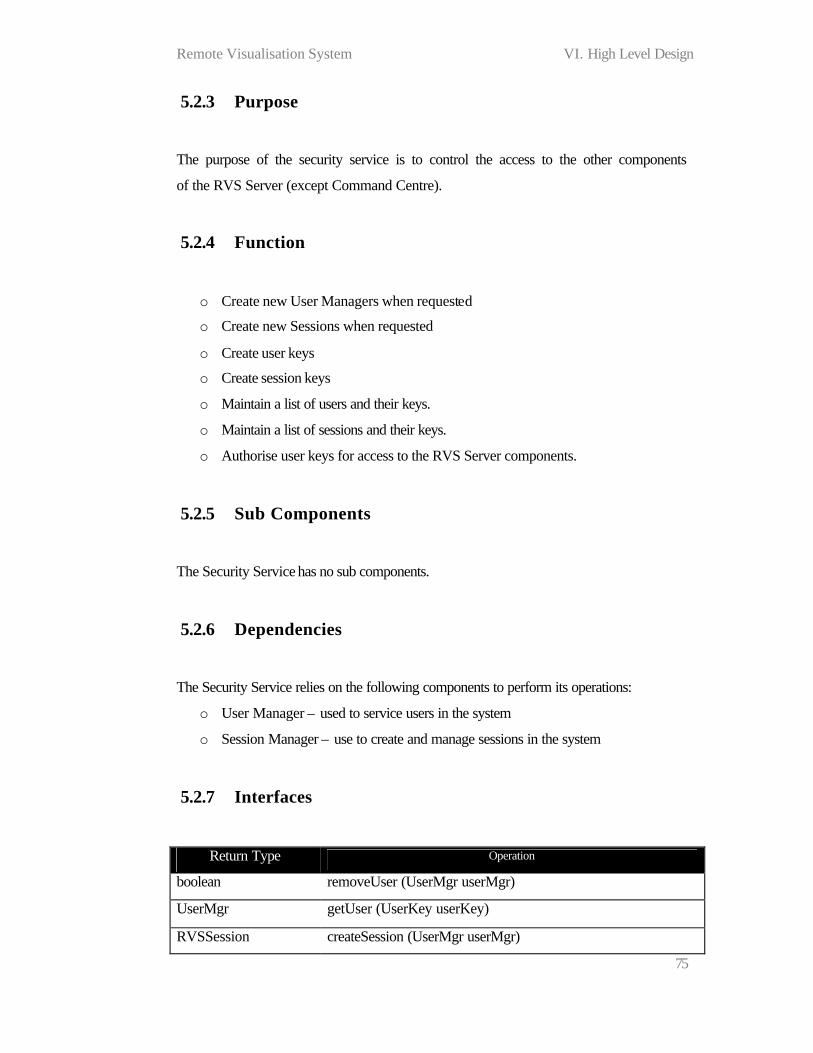
Remote Visualisation System VI. High Level Design
75
5.2.3 Purpose
The purpose of the security service is to control the access to the other components
of the RVS Server (except Command Centre).
5.2.4 Function
o Create new User Managers when requested
o Create new Sessions when requested
o Create user keys
o Create session keys
o Maintain a list of users and their keys.
o Maintain a list of sessions and their keys.
o Authorise user keys for access to the RVS Server components.
5.2.5 Sub Components
The Security Service has no sub components.
5.2.6 Dependencies
The Security Service relies on the following components to perform its operations:
o User Manager – used to service users in the system
o Session Manager – use to create and manage sessions in the system
5.2.7 Interfaces
Return Type Operation
boolean removeUser (UserMgr userMgr)
UserMgr getUser (UserKey userKey)
RVSSession createSession (UserMgr userMgr)

Remote Visualisation System VI. High Level Design
76
boolean joinSession (UserMgr userMgr, SessionKey sessionKey,
boolean makeCurrent)
boolean quitSession (UserMgr userMgr, SessionKey sessionKey)
boolean quitAllSessions (UserMgr userMgr)
UserKey generateUserKey (long value)
SessionKey generateSessionKey (long value)
Table VI-2: Security Service interface
5.3 User Manager
5.3.1 Identification
RVS User Manager
5.3.2 Component Type
CORBA Service
5.3.3 Purpose
The purpose of the user component is to represent a single user of the system and
hold data (or links to data) specific to each user.
5.3.4 Function
o Listen for commands from command centre and service those commands.
o Manage a set of user preferences.
o Manage a list of sessions that the user is part of.
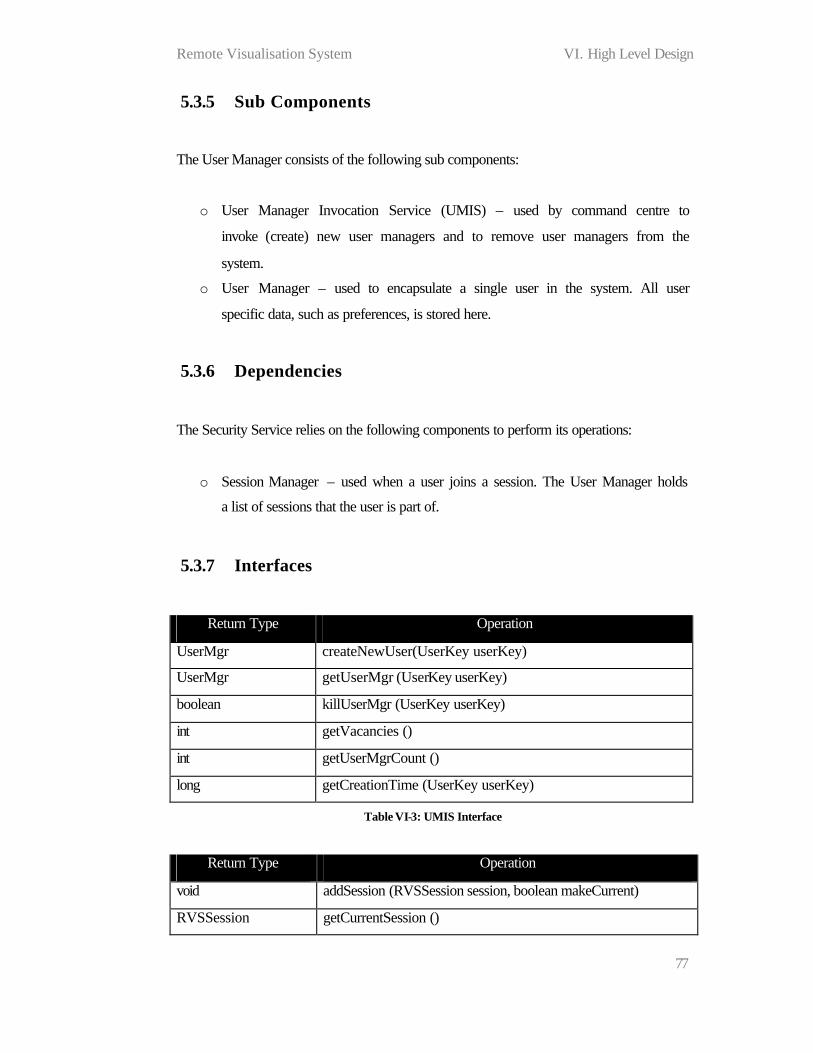
Remote Visualisation System VI. High Level Design
77
5.3.5 Sub Components
The User Manager consists of the following sub components:
o User Manager Invocation Service (UMIS) – used by command centre to
invoke (create) new user managers and to remove user managers from the
system.
o User Manager – used to encapsulate a single user in the system. All user
specific data, such as preferences, is stored here.
5.3.6 Dependencies
The Security Service relies on the following components to perform its operations:
o Session Manager – used when a user joins a session. The User Manager holds
a list of sessions that the user is part of.
5.3.7 Interfaces
Return Type Operation
UserMgr createNewUser(UserKey userKey)
UserMgr getUserMgr (UserKey userKey)
boolean killUserMgr (UserKey userKey)
int getVacancies ()
int getUserMgrCount ()
long getCreationTime (UserKey userKey)
Table VI-3: UMIS Interface
Return Type Operation
void addSession (RVSSession session, boolean makeCurrent)
RVSSession getCurrentSession ()
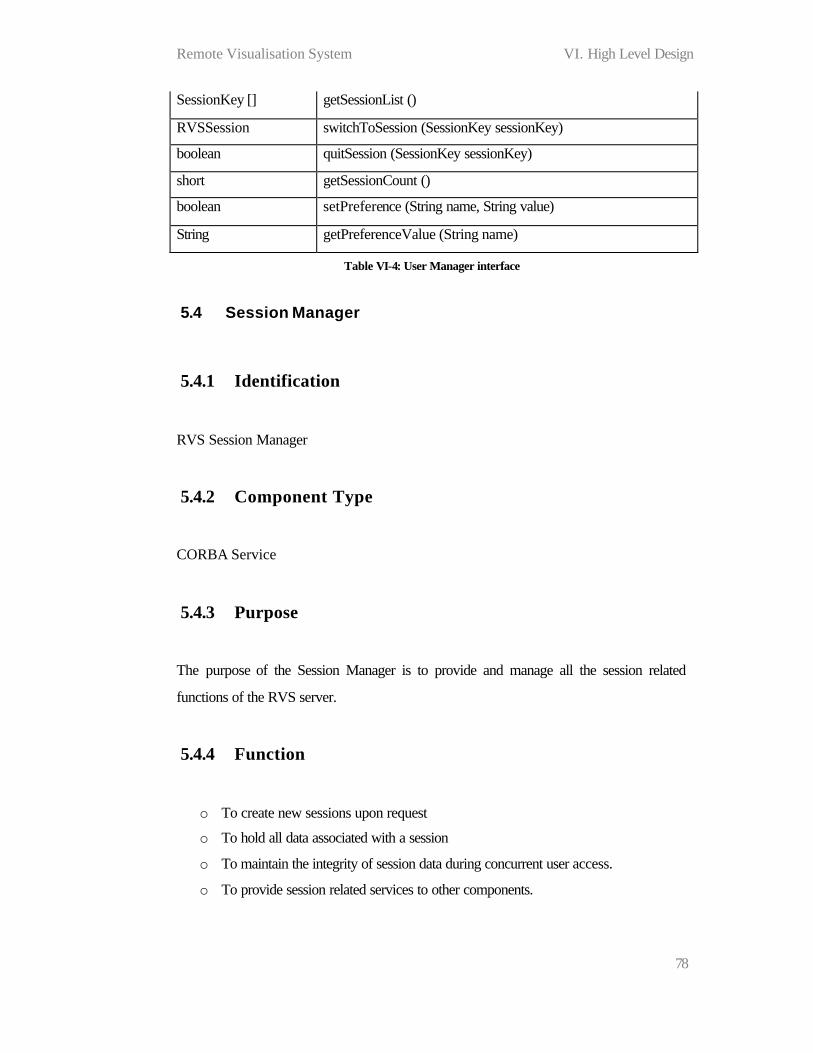
Remote Visualisation System VI. High Level Design
78
SessionKey [] getSessionList ()
RVSSession switchToSession (SessionKey sessionKey)
boolean quitSession (SessionKey sessionKey)
short getSessionCount ()
boolean setPreference (String name, String value)
String getPreferenceValue (String name)
Table VI-4: User Manager interface
5.4 Session Manager
5.4.1 Identification
RVS Session Manager
5.4.2 Component Type
CORBA Service
5.4.3 Purpose
The purpose of the Session Manager is to provide and manage all the session related
functions of the RVS server.
5.4.4 Function
o To create new sessions upon request
o To hold all data associated with a session
o To maintain the integrity of session data during concurrent user access.
o To provide session related services to other components.

Remote Visualisation System VI. High Level Design
79
5.4.5 Sub Components
The Session Manager consists of the following sub components:
o Session Invocation Service (SIS) – used by the command centre to invoke
(create) new sessions and to remove existing sessions from the system.
o Session – represents and encapsulates data for a single session in the system.
5.4.6 Dependencies
The Security Service relies on the following components to perform its operations:
o User Manager: used when a user joins a session. The Session Manager is
required to hold list of users that are part of (have joined) each session.
5.4.7 Interfaces
Return Type Operation
RVSSession createNewSession (SessionKey sessionKey)
RVSSession getSession (SessionKey sessionKey)
boolean killSession (SessionKey sessionKey)
long getVacancies ()
long getSessionCount ()
Table VI-5: SIS Interface
Return Type Operation void addUser (UserMgr userMgr) void removeUser (UserKey userKey) UserMgr getMasterUser () boolean isMaster (UserKey userKey) boolean setMaxUsers (int maxUsers, UserKey userKey) int userCount ()
Table VI-6: Session Interface

Remote Visualisation System VI. High Level Design
80
5.5 Data Communications Manager
5.5.1 Identification
RVS Data Comms Manager (DCM)
5.5.2 Component Type
CORBA Service
5.5.3 Purpose
The purpose of the DCM is to provide other RVS components with easier
connectivity to remote data.
5.5.4 Function
o Download and return data from HTTP Servers.
o Download and return data from secured or unsecured FTP servers.
o Upload data to secured or unsecured FTP servers.
5.5.5 Sub Components
The DCM has no sub components.
5.5.6 Dependencies
The DCM has no dependencies on other components.

Remote Visualisation System VI. High Level Design
81
5.5.7 Interfaces
Return Type Operation
boolean getFileAsAnonymous (String url, String filename)
boolean getFileAsUser (String url, java.lang.String filename, String login, String password)
boolean uploadFile (String filename, String login, String password, String url, String location)
Table VI-7 Data Comms Manager interface
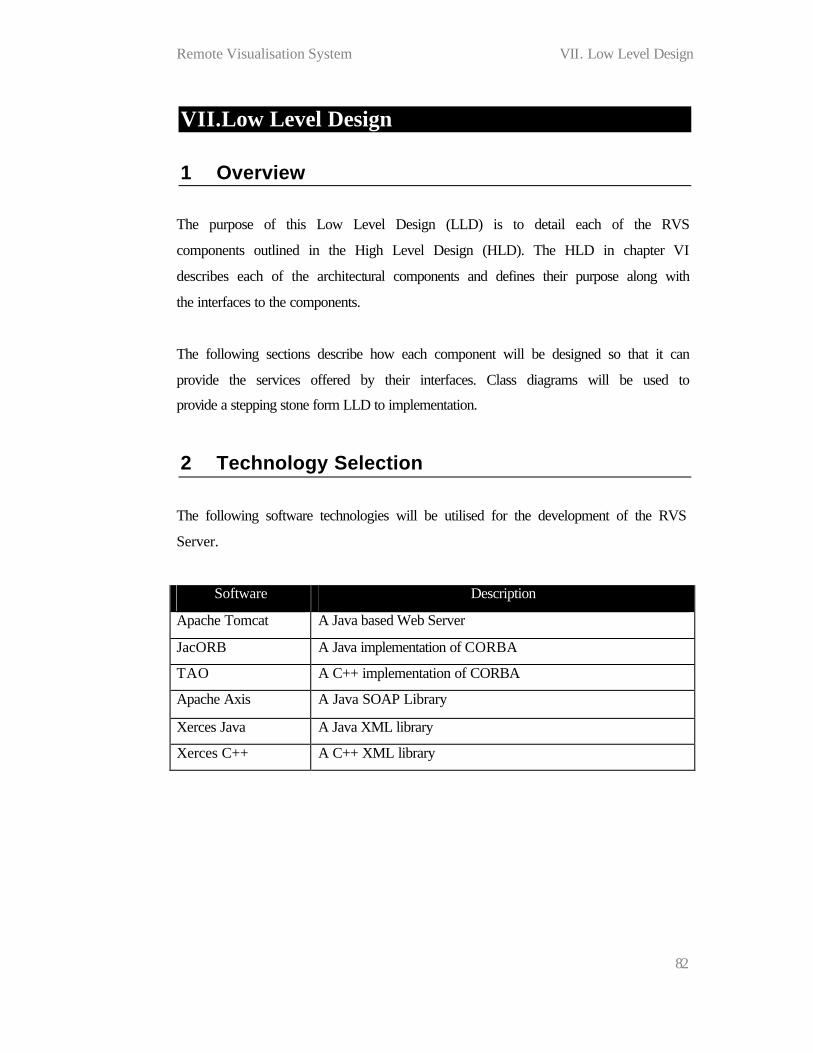
Remote Visualisation System VII. Low Level Design
82
VII. Low Level Design
1 Overview
The purpose of this Low Level Design (LLD) is to detail each of the RVS
components outlined in the High Level Design (HLD). The HLD in chapter VI
describes each of the architectural components and defines their purpose along with
the interfaces to the components.
The following sections describe how each component will be designed so that it can
provide the services offered by their interfaces. Class diagrams will be used to
provide a stepping stone form LLD to implementation.
2 Technology Selection
The following software technologies will be utilised for the development of the RVS
Server.
Software Description
Apache Tomcat A Java based Web Server
JacORB A Java implementation of CORBA
TAO A C++ implementation of CORBA
Apache Axis A Java SOAP Library
Xerces Java A Java XML library
Xerces C++ A C++ XML library
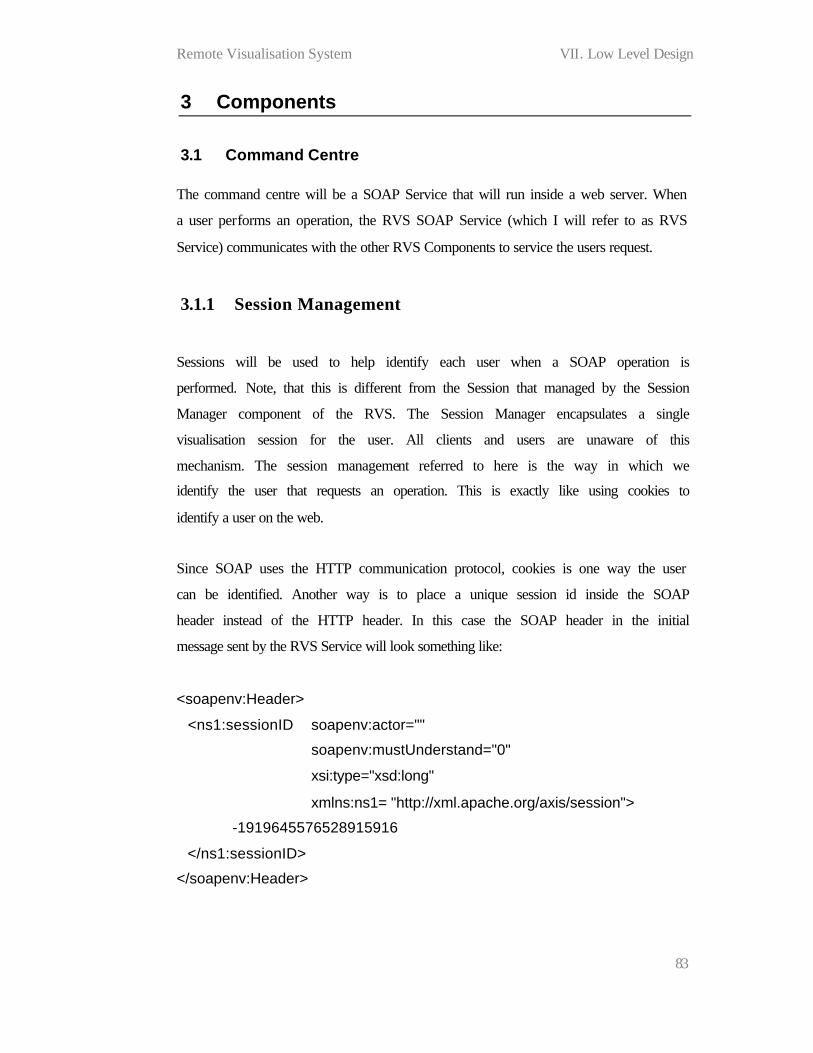
Remote Visualisation System VII. Low Level Design
83
3 Components
3.1 Command Centre
The command centre will be a SOAP Service that will run inside a web server. When
a user performs an operation, the RVS SOAP Service (which I will refer to as RVS
Service) communicates with the other RVS Components to service the users request.
3.1.1 Session Management
Sessions will be used to help identify each user when a SOAP operation is
performed. Note, that this is different from the Session that managed by the Session
Manager component of the RVS. The Session Manager encapsulates a single
visualisation session for the user. All clients and users are unaware of this
mechanism. The session management referred to here is the way in which we
identify the user that requests an operation. This is exactly like using cookies to
identify a user on the web.
Since SOAP uses the HTTP communication protocol, cookies is one way the user
can be identified. Another way is to place a unique session id inside the SOAP
header instead of the HTTP header. In this case the SOAP header in the initial
message sent by the RVS Service will look something like:
<soapenv:Header>
<ns1:sessionID soapenv:actor=""
soapenv:mustUnderstand="0"
xsi:type="xsd:long"
xmlns:ns1= "http://xml.apache.org/axis/session">
-1919645576528915916
</ns1:sessionID>
</soapenv:Header>
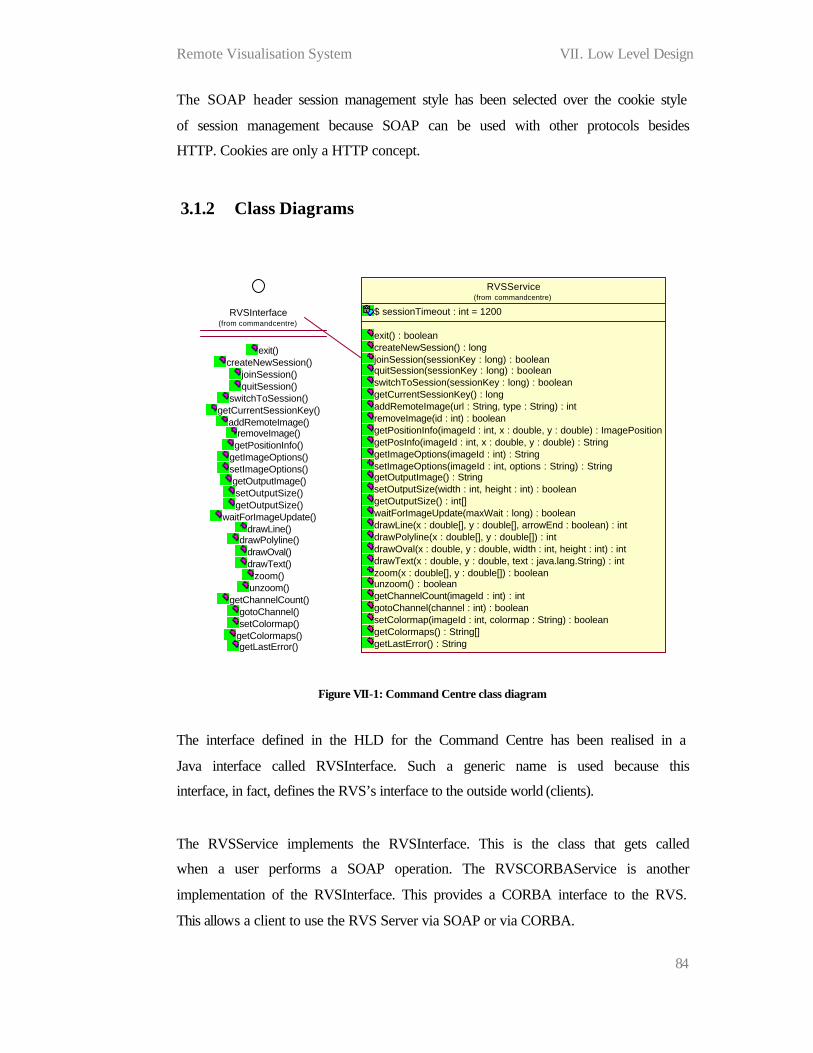
Remote Visualisation System VII. Low Level Design
84
The SOAP header session management style has been selected over the cookie style
of session management because SOAP can be used with other protocols besides
HTTP. Cookies are only a HTTP concept.
3.1.2 Class Diagrams
RVSService
$ sessionTimeout : int = 1200
exit() : booleancreateNewSession() : longjoinSession(sessionKey : long) : booleanquitSession(sessionKey : long) : booleanswitchToSession(sessionKey : long) : booleangetCurrentSessionKey() : longaddRemoteImage(url : String, type : String) : intremoveImage(id : int) : booleangetPositionInfo(imageId : int, x : double, y : double) : ImagePositiongetPosInfo(imageId : int, x : double, y : double) : StringgetImageOptions(imageId : int) : StringsetImageOptions(imageId : int, options : String) : StringgetOutputImage() : StringsetOutputSize(width : int, height : int) : booleangetOutputSize() : int[]waitForImageUpdate(maxWait : long) : booleandrawLine(x : double[], y : double[], arrowEnd : boolean) : intdrawPolyline(x : double[], y : double[]) : intdrawOval(x : double, y : double, width : int, height : int) : intdrawText(x : double, y : double, text : java.lang.String) : intzoom(x : double[], y : double[]) : booleanunzoom() : booleangetChannelCount(imageId : int) : intgotoChannel(channel : int) : booleansetColormap(imageId : int, colormap : String) : booleangetColormaps() : String[]getLastError() : String
(from commandcentre)
RVSInterface
exit()createNewSession()
joinSession()quitSession()
switchToSession()getCurrentSessionKey()
addRemoteImage()removeImage()
getPositionInfo()getImageOptions()setImageOptions()getOutputImage()setOutputSize()getOutputSize()
waitForImageUpdate()drawLine()
drawPolyline()drawOval()drawText()
zoom()unzoom()
getChannelCount()gotoChannel()setColormap()
getColormaps()getLastError()
(from commandcentre)
Figure VII-1: Command Centre class diagram
The interface defined in the HLD for the Command Centre has been realised in a
Java interface called RVSInterface. Such a generic name is used because this
interface, in fact, defines the RVS’s interface to the outside world (clients).
The RVSService implements the RVSInterface. This is the class that gets called
when a user performs a SOAP operation. The RVSCORBAService is another
implementation of the RVSInterface. This provides a CORBA interface to the RVS.
This allows a client to use the RVS Server via SOAP or via CORBA.

Remote Visualisation System VII. Low Level Design
85
The RVSService uses the RVSCORBAService to service user requests, since
CORBA is the only way of communicating with other RVS components.
3.2 Security Service
The security service will be a CORBA service implemented in Java. Its major
purpose initially will be to manage the creation and deletion of sessions and user
managers. The Command Centre will use the Security Service to perform these
operations. Although this way of creating sessions and user managers is not
necessary, it will be done this way because a certain amount of care is required to
ensure that all resources are released and re-used appropriately.

Remote Visualisation System VII. Low Level Design
86
3.2.1 Class Diagrams
SecurityServiceOperations
createUser()removeUser()
getUser()createSession()joinSession()quitSession()
quitAllSessions()generateUserKey()
generateSessionKey()
(from security)SecurityServiceHolder
SecurityServiceHolder()SecurityServiceHolder()_type()_read()_write()
(from security)
SecurityService(from security)
+value
SessionKeyImpl
keyValue : long
SessionKeyImpl()getKeyValue()
(from security)
UserKeyImpl
keyValue : long
UserKeyImpl()getKeyValue()
(from security)
UserKeyOperations
getKeyValue()
(from security)
SessionKeyOperations
getKeyValue()
(from security)
Figure VII-2: Security Servi ce class diagram
The UserKey and SessionKey are very simple classes that initially will store just a
long value. These long values will be used by the Command Centre to identify users
with their appropriate User Managers and RVS Sessions.
3.3 User Manager
The User Manager will be a CORBA service implemented in Java. It is responsible
for storing all user specific information in the RVS. The get and set preferences

Remote Visualisation System VII. Low Level Design
87
functions, for example, store string based preferences that may be used across
multiple sessions.
Unlike the Security Service, the User Manager needs to create one instance of itself
for each user. For this reason, the User Manager Invocation Service (UMIS) will be
the service that creates the individual User Managers in the system.
3.3.1 Class Diagram
Server
$ maxUsers : int = 20
main()
(from usermanager)
UserMgrOperations
getUserKey()addSession()
getCurrentSession()getSessionList()
switchToSession()quitSession()
getSessionCount()setPreference()
getPreferenceValue()
(from usermanager)
UserMgrHolder
UserMgrHolder()UserMgrHolder()_type()_read()_write()
(from usermanager)
UserMgr
(from usermanager)
+value
UMISOperations
createNewUser()getUserMgr()killUserMgr()
getVacancies()getUserMgrCount()getCreationTime()
(from usermanager)
UMISHolder
UMISHolder()UMISHolder()_type()_read()_write()
(from usermanager)
UMIS
(from usermanager)
+value
Figure VII-3: User Manager class diagram

Remote Visualisation System VII. Low Level Design
88
As can be seen, this is a very simple component. It consists of the UMIS class and
the UserMgr class. A UMIS creates and returns a UserMgr when required via the
createNewUser function call.
3.4 Session Manager
The Session Manager will be a CORBA service implemented in C++. It is in this
component that the bulk of the image processing occurs.
3.4.1 Class Diagram
RVSCanvasImpl
RVSCanvasImpl()setPixelCanvas()~RVSCanvasImpl()getPixelCanvas()createNewDD()deleteDD()getDisplayData()refresh()drawLine()drawPolyline()drawOval()drawText()deleteAnnotation()getWorldPosition()operator ()()zoom()unzoom()gotoChannel()installPositionEH()
(from canvas)
SessionImpl
SessionImpl()getSessionKey()~SessionImpl()addUser()removeUser()getMasterUser()isMaster()setMaxUsers()
(from sessionmgr)
SISImpl
SISImpl()createNewSession()~SISImpl()getSession()killSession()getVacancies()getSessionCount()findSession()
(from sessionmgr)
RVSSessionImpl
RVSSessionImpl()getCanvas()~RVSSessionImpl()getSessionKey()addUser()removeUser()getMasterUser()isMaster()setMaxUsers()userCount()
(from sessionmgr)
PCEventDispatcher
PCEventDispatcher()dispatchRefreshEvent()~PCEventDispatcher()dispatchMotionEvent()dispatchPositionEvent()
(from aips)
RemoteDisplayDataImpl
RemoteDisplayDataImpl()getOptions()~RemoteDisplayDataImpl()setOptions()getDisplayData()showPosition()showValue()addMotionEventHandler()addPositionEventHandler()removeMotionEventHandler()removePositionEventHandler()nelements()refresh()filterRecord()addHelpField()
(from aips)
0..1
1
-itsRVSCanvas0..1
1ProxyPixelCanvas
(from aips)
0..1
1
-itsEventDispatcher0..1
1
Figure VII-4: Session Manager class diagram

Remote Visualisation System VII. Low Level Design
89
As mentioned in the earlier sections of this document, the processing of astronomy
images is a much specialised task. It would not be feasible to develop such software
in the time allocated for this project. In fact, it would be an unnecessary waste of
effort, since there are software packages that do this work already.
The RVS will use the AIPS++ Display Library (see section II.5) for all image
processing tasks.
3.5 CORBA and AIPS++ in RVS
There are a selected number of AIPS++ objects that have been ‘wrapped’ in a
CORBA wrapper making these objects distributed. That is, one process can send the
object to another process (possibly on another machine). Any process, with code
written in any language, can make calls to this object and expect the same result.
This is what CORBA allows us to do.
3.5.1 Pixel Canvas
PixelCanvas is an abstract C++ class within the AIPS++ Display Library. It acts as
an interface that can be used by AIPS++ to draw its data. There are specialisations of
the pixel canvas that implement the draw routines for a specific target. For example,
the PSPixelCanvas (postscript pixel canvas) draws to a postscript file and the
X11PixelCanvas allows drawing on the screen, via an X11 server
The RVS needs to draw image data on a Java panel and also to a PNG canvas, which
will end up outputting a PNG file. By using CORBA to create a Java based
JavaPixelCanvas object, we can not only achieve this, but also make the pixel canvas
distributed. That is, the canvas that is being drawn on can be located on another
machine to the one that is sending the draw commands. Figure VII-5 shows how the
CORBA based Java pixel canvas works.

Remote Visualisation System VII. Low Level Design
90
IDL file
Skeleton (Java)
Stub (C++)
JavaPixelCanvas
ProxyPixelCanvas
PixelCanvas
Generates Generates
Has instance of
Inherits from
Inherits (implements)
Pixel Canvas Method calls
Output on java.awt.Graphics
object
Remote method call
Figure VII-5: Java Pixel Canvas design
The blue elements are the ones that we need to implement. The IDL file describes the
pixelcanvas interface, which is then used to generate the skeleton and stub classes.
The idl file is used by the java idl compiler to generate the java stub file. Similarly,
the c++ idl compiler is used to generate the stub file.
The JavaPixelCanvas implements the skeleton interface to draw on a java Graphics
object.
The ProxyPixelCanvas implements the existing AIPS++ PixelCanvas interface.
These implementations forward all requests to the stub. For instance, when a
drawImage(Matrix, ... ) method is called on the ProxyPixelCanvas, it does the
following:
1. Convert the Matrix into a type that the stub accepts (this is not difficult).

Remote Visualisation System VII. Low Level Design
91
2. Call stub::drawImage(...)
Behind the scenes, the following sequence of events take place:
1. The stub calls the skeleton and sends it the drawImage method call.
2. Since the skeleton is implemented by the JavaPixelCanvas, the drawImage
method in the JavaPixelCanvas is called.
3. The JavaPixelCanvas creates an image out of the array of pixel values. To do
this, in my test application I have created a simple ColorModel (see the J2SE
API ) which is used to create the image.
4. This image is drawn, and the method returns, and so does the stub, and so
does ProxyPixelCanvas.
3.5.2 Display Data
A Display Data, in AIPS++, is a structure that encapsulates a set of data that is to be
drawn on a canvas. Before drawing an image as a raster, for example, the image is
stored in memory as a display data. Each display data has a set of options that can be
adjusted by the user. These options include:
o Colormap
o Position Tracking options
o Axis labels
In the RVS, users will want to change some of the image options at run time, via the
web service. This requires the RVS web service (written in Java) to get a hold of the
display data object (written in c++) and call its setOptions method.
To achieve this we need to again, wrap the display data object in a CORBA wrapper.
We have called this wrapper the Remote Display Data. Figure VII-6 shows the
design of the Remote Display Data and the flow of data from the user to the actual
display data object.

Remote Visualisation System VII. Low Level Design
92
Similar to the Java Pixel Canvas shown in Figure VII-5, the blue elements are those
that have been implemented. The IDL file describes the Remote Display Data
interface that is used by the web service to make method calls to the end Display
Data object. This IDL file is compiled by the java IDL compiler into a stub file and
by the C++ IDL compiler into a skeleton file. The RemoteDisplayData class then
implements the skeleton file. Therefore, all remote method calls received by the
skeleton are forwarded on to their respective implementations in
RemoteDisplayData.
IDL file
Stub (Java)
Skeleton (C++)
Web Service
RemoteDisplayData
DisplayData
Generates Generates
Inherits (implements)
Has instance of
Has instance of
User calls “set options” on the Display Data
Remote method call
Figure VII-6: Remote Display Data design
3.5.2.1 Remote Display Data Interface
The Remote Display Data interface does not implement all DisplayData methods,
since all of the methods are not required remotely. Only two methods are
implemented:
o string getOptions()
Remote Visualisation System VII. Low Level Design
93
o boolean setOptions(in string optionsIn, out string optionsOut)
The original DisplayData object has these two methods, except the options are stored
in a Record class as opposed to a string as shown above. The strings are in fact XML
representation of an AIPS++ Record.
3.5.3 Records
A Record, in AIPS++ is a hierarchical collection of named fields of various types. A
record may contain any number of fields, any one of which may be another Record.
Display Datas use Records as a means of storing and communicating options. To
receive the current option settings from a Display Data, the options Record object
must be retrieved from Display Data. Similarly, when wanting to set new options, a
Record must be created for it and sent to the Display Data using setOptions.
To make the above requirement possible, the record must be wrapped in a CORBA
wrapper, in the same way as the Display Data was. However, this wrapper has NOT
yet been implemented. This is because there is a CORBA limitation that does not
permit method overloading in its remote interfaces and there is extensive use of
method overloading in the Record class. A little more time and effort will be required
to create the CORBA wrapper.
Not being able to distribute the Record object means that the web service can’t
obtain a reference to it. As a work around, we have developed a utility that converts
AIPS++ Record to XML format and vice versa. This allows options data to be sent as
Strings (containing XML data) instead of in Record format. On the java side the
XML string is converted to and from a JavaRecord class.

Remote Visualisation System VII. Low Level Design
94
CORBA Interface
JavaRecord/ XML
Converter
Record/ XML
Converter
Web Service DisplayData
JavaRecord
XML String XML String
Record
Figure VII-7: XML representation of AIPS++ record
3.5.4 Event Handling
The lowest level events generated in the Display Library are:
o Position events – generated when users press a button on the keyboard or the
mouse
o Motion events – generated when users move the mouse cursor
o Refresh events – generated when a change in the data requires the ‘display’ to
be refreshed.
All three of the above events almost always originate from the pixel canvas.
However, sometimes the refresh event is generated elsewhere and sent to the pixel
canvas.
In the RVS, the java pixel canvas needs to send position, motion and refresh events
to event handlers that reside on the C++ side. One way to approach this problem
would be to wrap all events and event handlers with a CORBA wrapper as was done
with Display Data. This approach would mean overriding the ‘add’ and ‘remove’
(Event Handler) methods of the PixelCanvas in the ProxyPixelCanvas. However,
these methods are not virtual. The extensive use of polymorphism in he DL means,
this approach was not viable.

Remote Visualisation System VII. Low Level Design
95
Instead, an EventDispatcher class has been developed to cater for events generated
by remote pixel canvases. Figure VII-8 shows the EventDispatcher architecture and
the flow of event data from the Java PixelCanvas to the event handlers of the pixel
canvas on the C++ side.
IDL file (Event
Dispatcher)
Event
Dispatcher Stub (Java)
Event Dispatcher Skeleton
(C++)
Java Pixel
Canvas
PCEventDispatcher
PixelCanvas
Generates Generates
Inherits (implements)
Has instance of
Has instance of
User calls “set options” on the Display Data
Remote method call
Pixel Canvas distributes events to all its event handlers
Figure VII-8: Event dispatcher for Remote Pixel Canvas
1. When event handlers are added to a pixel canvas, the base PixelCanvas class
stores them in a list.
2. The PCEventDispatcher is created by passing it a pointer to a pixel canvas.
3. The PCEventDispatcher is then registered with the Java Pixel Canvas. The
Java Pixel Canvas will have the stub for that event dispatcher in its list.
4. When the Java Pixel Canvas wants to generate an event, it calls on the
following methods in the EventDispatcher stub:
o dispatchPositinEvent

Remote Visualisation System VII. Low Level Design
96
o dispatchMotionEvent
o dispatchRefreshEvent
The event information is passed using CORBA object created specifically for this
purpose. These are RemotePCPositionEvent, RemotePCMotionEvent and
RemotePCRefreshEvent.
3.5.5 Data Types
One of the difficulties of distributed programming is the sharing of complex data
types between different components, which in the case of RVS are Java and C++
components. The example of sending Record object for display data options is one
example. However, there are more commonly used data types that need to be shared.
These include:
o Array
o Vector
o Matrix
o Complex
o DComplex
o String
CORBA (IDL) has a set of defined data types that map to language specific data
types. For example, the IDL type long maps to a Java and C++ type int. Float, double
and short types map directly to the same types in Java and C++.
We can also define an array (bounded array) and a sequence (boundless arrays).
These, more complex types, are used to map the list of AIPS++ types above, to IDL
types. With C++, an object of type Vector, for example, will need to be converted to
a sequence before it can be used in a distributed object such as a
RemotePixelCanvas. A utility class AipsCORBAUtil has been created to do these
conversions using static public methods.
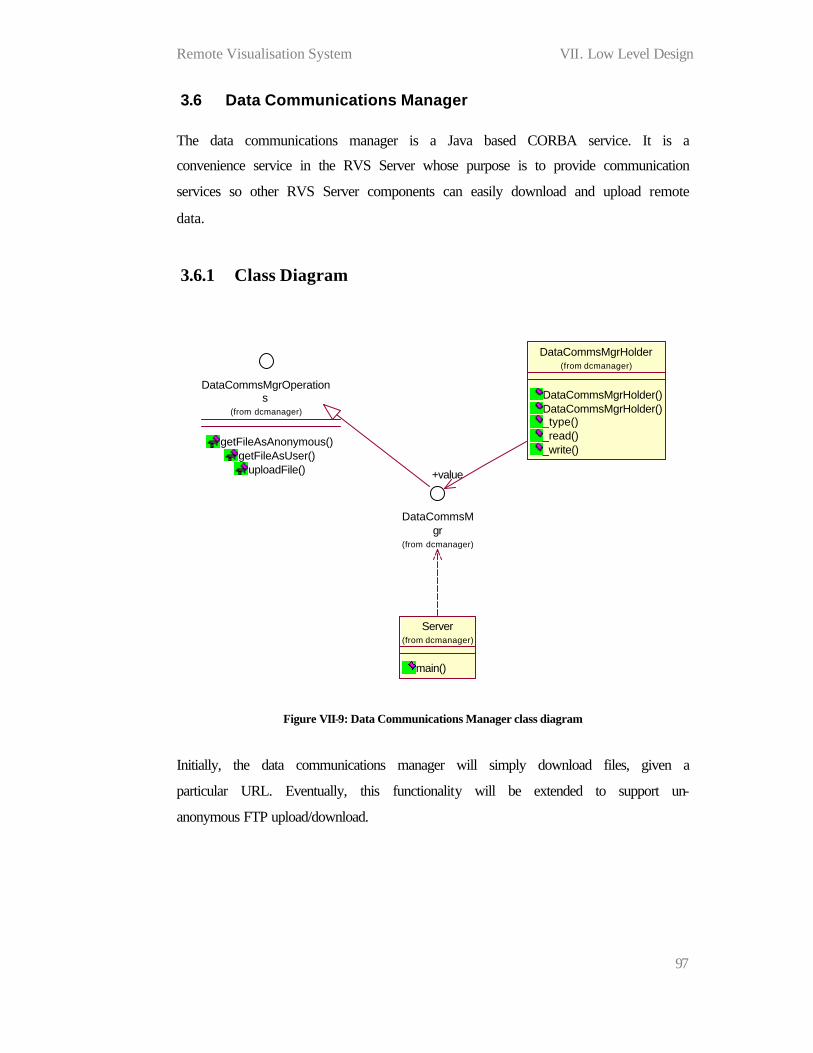
Remote Visualisation System VII. Low Level Design
97
3.6 Data Communications Manager
The data communications manager is a Java based CORBA service. It is a
convenience service in the RVS Server whose purpose is to provide communication
services so other RVS Server components can easily download and upload remote
data.
3.6.1 Class Diagram
Server
main()
(from dcmanager)
DataCommsMgrOperations
getFileAsAnonymous()getFileAsUser()
uploadFile()
(from dcmanager)
DataCommsMgrHolder
DataCommsMgrHolder()DataCommsMgrHolder()_type()_read()_write()
(from dcmanager)
DataCommsMgr
(from dcmanager)
+value
Figure VII-9: Data Communications Manager class diagram
Initially, the data communications manager will simply download files, given a
particular URL. Eventually, this functionality will be extended to support un-
anonymous FTP upload/download.

Remote Visualisation System VIII. Prototype Release
98
VIII. Prototype Release
1 Overview
On 18 November 2003, a prototype version of the RVS was completed. The goals of
the prototype were as follows:
o To demonstrate a ‘proof of concept’ implementation of the server. That is, to
prove that the architecture and high level design of the RVS Server were
feasible.
o To determine the technological feasibility of the server. That is, to determine
whether the different technologies can be used successfully to come up with a
good solution.
o To obtain some performance statistics and determine whether the design can
meet the performance goals of the system.
o To demonstrate the RVS to users and get feedback on areas of improvement.
2 Level of Implementation
2.1 Components
For the prototype, all the components of the RVS Server (as designed at that time)
were partially implemented. The components that made up the system at that time
were:
o Command Centre (Tomcat web server running a SOAP Service)
o Security Service (Java CORBA)
o User Manager (Java CORBA)
o Session Manager (C++ CORBA)
o Data Store (Java CORBA)
o Data Centre Manager (Java CORBA)
o Client Applet
o Client Web Application (Deployed on Tomcat)

Remote Visualisation System VIII. Prototype Release
99
2.2 Demonstration Client
2.2.1 Configuration
A demonstration client was developed to make use of the services offered by the
RVS Server. This client consisted of a Java applet that could be run inside a web
browser, somewhat similar to how the system was to be used in future. The applet
used HTTP Tunnelling to communicate with an intermediate servlet (Client Web
Application as listed earlier). This servlet then communicated with the RVS Server
using SOAP.
Client (applet)
Web Server (Servlet)
SOAP Server (Command Centre)
Firewall
HTTP Tunnelling
FirewallSOAP
CORBA
RVS Server Components
Figure VIII-1: RVS Client configuration
2.2.2 User Functions
The following, limited functions, were available to users of the RVS prototype:
o Allows the user to enter a URL to a FITS image
o When a URL is submitted, the image is displayed on the left half of the applet
o The image is always displayed with axis labels
o Allows the user to change the colour map of the image (from a list of options)

Remote Visualisation System VIII. Prototype Release
100
o If the image is a cube, allows the user to view any channel in the cube by
entering the channel number
3 Scenario Analysis
3.1 Pre-Implementation
Before the prototype was implemented, a collection of scenarios were developed.
The prototype was then implemented according to these scenarios.
3.1.1 Interactions between user, applet and the servlet
User enters username and password at home page:
1. Tomcat allows access to the target servlet, which sends a web page
containing the applet.
2. The web page is displayed on the user’s browser.
3. The applet requests (from the servlet) an array of strings specifying the
images that are available for display. These images will be located on the
Tomcat server and accessible via a URL.
4. The applet is displayed without any content. Only the image selection drop
down list is available. The status bar reads, “No image loaded”.
User selects “Image A” from the drop down list:
1. The applets activity light starts blinking and the status bar reads, “Receiving
image data”.
2. The applet requests (from the servlet) a java VOTable object that has the
image details.
3. The applet then gets the png image from the URL included in the VOTable.
This URL is stored as the image base for later use.
4. The applet asks for the options record java object (of the DD) from the servlet
5. The applet then displays the image.

Remote Visualisation System VIII. Prototype Release
101
6. The applet then parses the options record and displays them in an appropriate
form.
7. The activity light stops blinking and the status bar reads “Idle”.
User changes colour map and clicks ‘update’:
1. The activity light starts blinking and the status bar reads, “Updating
canvas…”
2. The applet sends a setImageOptions command to the servlet. This command
sends the options record and also sends the layer id of the layer that is being
operated on.
3. The servlet takes the options record and sends a setImageOptions SOAP
command to the RVS server. The options AND the layer id is sent.
4. The servlet receives a True value indicating the option has been set.
5. The servlet returns a True value to the applet.
6. The status bar changes to “update successful.”
7. The status bar changes to “downloading new image.”
8. The applet uses the stored URL of the image base to retrieve the latest image.
9. The applet displays the image.
10. The activity light is off and the status bar reads “Idle”.
3.1.2 Interaction between Servlet and RVS Server
Tomcat allows access to the target servlet, which sends a web page containing the applet:
1. The servlet registers a new user with the RVS server.
2. Servlet creates a new session on the RVS server and joins the new user in that
session.
The applet requests (from the servlet) a java VOTable object that has the image details:
1. Servlet creates a new layer in the RVS canvas.

Remote Visualisation System VIII. Prototype Release
102
2. Servlet requests ‘remote image’ to be added to the new layer. The URL for
the image is sent to the RVS server.
3. The RVS server obtains the remote image
4. RVS server creates DisplayData, PSPixelCanvas, WorldCanvas and
WorldCanvasHolder.
5. RVS server creates the ps file and converts it to png.
6. RVS server deletes the PSPixelCanvas. WorldCanvas and the
WorldCanvasHolder.
7. RVS server returns a True flag to the Servlet, indicating the remote image as
been added.
8. Servlet requests the RVSCanvas from the RVS server.
9. Servlet sends the VOTable (which is inside the RVSCanvas) to the applet.
NOTE: In the final product, the entire RVSCanvas will be sent to the applet.
The prototype is restricted to only one image (or DD) per canvas.
The servlet sends a setImageOptions SOAP command to the RVS server:
1. The RVS server takes the imageOptions and converts it to an options Record
that can be understood by DisplayDatas.
2. The RVS server retrieves the DisplayData and sets the option on the
DisplayData.
3. The RVS server then calls the refresh function on the RVSCanvas layer.
4. The RVSCanvas then creates a PSPixelCanvas, WorldCanvas and
WorldCanvasHolder.
5. RVSCanvas creates the postscript file and converts it to a png file.
6. RVS server returns a True flag to the Servlet, indicating the option has been
set.
3.2 Post-Implementation
During the implementation some details in the scenarios above were modified. For
example, instead of users selecting from a list of images to view, they may enter in a
URL to any valid FITS image. Following are a couple of scenarios that demonstrate
how the prototype worked after implementation was complete.

Remote Visualisation System VIII. Prototype Release
103
The user submits a new URL of an image to be visualised:
1. ‘Get Image’ command sent from applet to a servlet
2. The servlet sends a SOAP message to the RVS Server
3. The RVS Server downloads the remote image and writes it to disk
4. The RVS Server then gets the correct session object from the Security
component (CORBA).
5. The session object is used to load the downloaded image (CORBA). This is
when the Display Data and the PSPixelCanvas is created.
6. Still inside the session component, the postscript file generated is converted
to a PNG file using ImageMagick. This PNG file is stored at a location that is
accessible via URL.
7. The URL of the result image is sent to the servlet via a return SOAP message.
8. The servlet sends the URL of the result image to the applet. The applet
displays the image
The user submits a new colour map:
1. ‘Set co lour map’ command sent from applet to a servlet
2. The servlet sends a SOAP message to the RVS Server
3. The RVS Server then gets the correct session object from the Security
component (CORBA).
4. The session object is used to create a new PSPixelCanvas using the
DisplayData (which already exists).
5. The colour map on the DisplayData is changed to he desired colour map.
6. Still inside the session component, the postscript file generated is converted
to a PNG file using ImageMagick. This PNG file is stored at a location that is
accessible via URL.
7. The URL of the result image is sent to the servlet via a return SOAP message.
8. The servlet sends the URL of the result image to the applet. The applet
displays the image

Remote Visualisation System VIII. Prototype Release
104
4 Performance Results
One of the objectives of this prototype was to ensure that the performance
requirements of the system can be satisfied by the design. To analyse the
performance of the prototype, I decided to determine the time taken to perform a
couple of key user operations. These are:
o The time taken for a remote image to load once the users submit’s a URL.
o The time taken for a colour map to be changed and the new image to be
displayed, once the user submit’s the new colour map.
The following table shows these results, when viewing images of different sizes.
Image size (MB) Time to load image (s) Time to change colour map (s)
8.99 3.96 1.69
14.03 5.40 1.70
18.31 5.48 1.60
Table VIII-1: Time taken to perform operations
NOTE: All components (including the client and server) were on the same machine
when tested. The test data was located on a remote server with high bandwidth
connection to the RVS Server.
When changing the colour map, it was found that about 90% of the time (as
described above) was in the creation of the new PNG file. That is, about 10% of the
time was spent on data transfer, establishing context, etc. This amounts to
somewhere between 10ms to 300ms per client request.
That is, when a client makes a request to RVS Server, somewhere between 5ms and
300ms is spent in the transfer of data and establishing context for the user. In most
cases the time is less then 50ms.
Remote Visualisation System VIII. Prototype Release
105
The bottleneck seems to be in the conversion of the postscript file (generated from
PSPixelCanvas) to a PNG file. This takes between 850ms to 900ms. Ideally in the
final RVS system, this process will not be necessary. That is, the output from the
pixel canvas should be a PNG file (or a format that can be displayed on the client).
The overall performance of the system is quite satisfactory. One of the aims of this
prototype was to determine whether the overall performance objectives of the RVS
can actually be met. Even though the tests were done a single machine, these results
are promising.
5 Impact on Design
The prototype has resulted in a number of changes to the design of the RVS Server.
These changes are listed below.
o The Data Store should be removed. It is prone to errors if the CORBA
components are distributed. This occurs when all components do not share a
common file system. After further analysis it was though that the data store
component is not a necessity. File sharing can occur by simply using full
paths to file locations. There is no need to make this access transparent.
o The Data Centre Manager should be renamed to Data Communications
Manager. The Data Centre Manager performs a general task of downloading
images via a URL that is given to it. There is no specific communication with
any data centres, as was the original intention. Therefore, we should make
this component more generic by making it an interface to all remote data
access (not just to data centres). We can call this the Data Communications
Manager.
o The process of creating new users, registering them to new sessions and
managing these transactions are a little tedious. It would be better for the
security manager to perform create/delete operations.
o The session manager should not write image to a postscript file before
converting it to PNG format. This incurs an unacceptable overhead that we

Remote Visualisation System VIII. Prototype Release
106
can not afford. The image should be immediately written to a PNG file for the
user to download.

Remote Visualisation System IX. Test Report
107
IX. Test Report
1 Overview
This chapter contains the acceptance test report for the RVS. The main focus of this
project was to develop RVS Server and hence, this acceptance report is designed to
test whether the server meets all the requirements stated in the Software
Requirements Specification in chapter IV.
A number of test cases have been identified to test the different requirements of the
server. One use case may test more than one requirement. The tables below are
separated into the following columns:
o Case Id – a unique id for the test case.
o User Action – the action that the user performs.
o Expected Result – the result that is expected from the user’s action.
o Pass/Fail/NAT – Whether the test case passed, failed, or if the requirement
could not be tested
o SRS Reference – The requirements in the SRS that are tested by this test case.
o Comments – Any additional comments about the test case.

Remote Visualisation System IX. Test Report
108
2 Functional Tests
Case Id User Action Expected Result Pass / Fail / NAT SRS Reference Comments
1 User starts RVS client Client window opens with session
id printed in the status bar Pass
R01, R02, R04,
R05, R17, R18,
R19, R20
2 User waits for 20 mins before
adding an image to the canvas
The operation will fail and the user
will be told that the session has
timed out
Pass R07, R08
3 User clicks on the “New
Session” button
The current session will be deleted
and a new one started Pass R09
4 User clicks the ‘share’ button
A new window should open to
allow users to enter in the session
id of another session. The user can
then view the output of that
session in another window.
NAT
R11, R12, R13,
R14, R15, R16,
R54
Cannot be tested
since this
functionality was not
implemented in the
client.

Remote Visualisation System IX. Test Report
109
5
User enters a URL, selects raster
as the image type and clicks the
submit button.
The status bar indicated that the
client is communicating with the
server. Soon after, the image
should be displayed to the user.
Pass
R22, R23, R24,
R25, R34, R48,
R49, R50
6 User enters an invalid URL and
clicks submit button
An error message should be
displayed to tell the user that the
entered URL is invalid.
Pass R27
7 User enters a URL to an invalid
FITS image.
The status bar indicated that the
client is communicating with the
server. Soon after, the user should
be notified that the data download
was unsuccessful.
Pass R26
8
User adds a 3 dimensional image
(cube) to the canvas and selects a
single channel to view.
The status bar indicated that the
client is communicating with the
server. Soon after, the selected
channels image will be displayed
Pass R30

Remote Visualisation System IX. Test Report
110
9
The user clicks the options
button for an image and goes to
the ‘display axes’ tab. The user
then changes the axis order and
clicks apply.
The status bar indicated that the
client is communicating with the
server. Soon after, an image with
the axes modified is displayed.
Pass R31
10
The user clicks on the zoom in
button (magnifying glass on ‘+’
symbol). He/She presses left
mouse button and drags a
rectangle on the image and
releases the button.
The status bar indicated that the
client is communicating with the
server. Soon after, the region
inside the rectangle is displayed in
full size.
Pass R32
11
User clicks on the line tool to
press and drag the mouse before
releasing at another point on the
canvas.
As the user drags the mouse a line
will appear between the points of
the button press and cursors
position.
NAT R35, R42
Annotations were not
implemented in the
demo client so this
feature cannot be
tested by the user.

Remote Visualisation System IX. Test Report
111
12
User clicks on the circle tool to
press and drag the mouse before
releasing at another point on the
canvas
As the user drags the mouse a
circle is drawn, centred where the
user had pressed the mouse button.
NAT R38, R42
Annotations were not
implemented in the
demo client so this
feature cannot be
tested by the user.
13
User clicks on the polygon and
then clicks on different points on
the canvas and the lastly on the
point of the first click
Each click on the canvas draws a
new line between that point and
the previous point, until the user
clicks on the first point again.
NAT R39, R42
Annotations were not
implemented in the
demo client so this
feature cannot be
tested by the user.
14
User clicks on the text tool,
clicks at a point on the canvas,
and enters some text.
As the user presses keys on the
keyboard, the relevant text will
start to appear at the point where
the mouse was clicked.
NAT R40, R42
Annotations were not
implemented in the
demo client so this
feature cannot be
tested by the user.

Remote Visualisation System IX. Test Report
112
15 A user clicks on an annotation
and presses the delete key.
The annotation that was clicked is
removed from the canvas NAT R41, R42
Annotations were not
implemented in the
demo client so this
feature cannot be
tested by the user.
16 A user submits a URL to a FITS.
The status bar indicated that the
client is communicating with the
server. Soon after, the image
should be displayed to the user.
Pass R43
17 A user submits a URL to tarred
AIPS++ image
The status bar indicated that the
client is communicating with the
server. Soon after, the image
should be displayed to the user.
Fail R43
AIPS++ images are
not yet supported by
the RVS Server
18 A user submits a URL to a
VOTable (image)
The status bar indicated that the
client is communicating with the
server. Soon after, the image
should be displayed to the user.
Fail R43
VOTables are not yet
supported by the RVS
Server
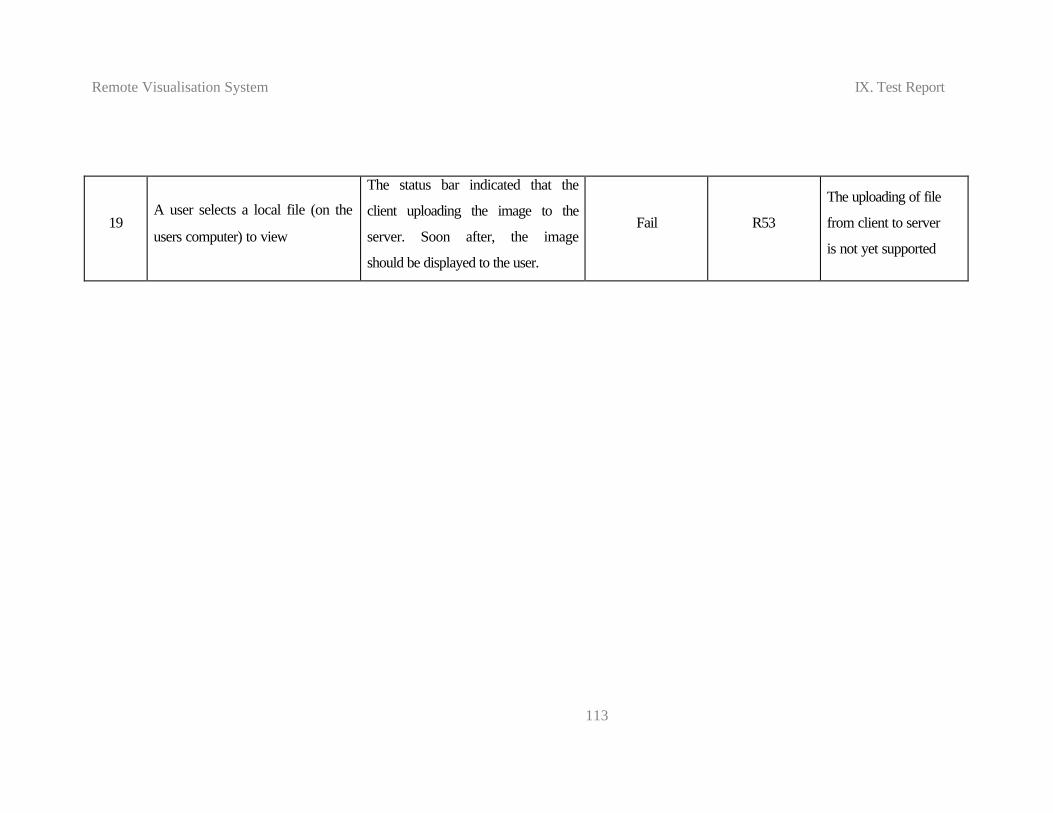
Remote Visualisation System IX. Test Report
113
19 A user selects a local file (on the
users computer) to view
The status bar indicated that the
client uploading the image to the
server. Soon after, the image
should be displayed to the user.
Fail R53
The uploading of file
from client to server
is not yet supported

Remote Visualisation System X. RVS Client User Guide
114
X. RVS Client User Guide
1 Overview
The Standalone Client is Java application that allows users to visualise FITS images
by using the RVS Server. The application takes URL to FITS images and displays
the image for the user to analyse.
Users may zoom in and out of the image, change the colour map, select specific
channels in a cube to view, enable/disable axis labels and change other options of
images. The client also allows contours to be overlaid on top of raster images.
This chapter is a guide to the use of the client application.
2 Installation
Being a Java implementation, the client executes on all java enabled platforms
including Solaris, Linux and Microsoft Windows. There is no installation process for
the application besides placing the client jar file somewhere on the file system
accessible by the user.
The following are the minimum hardware and software requirements for the client:
1. Java enabled platform
2. 128MB RAM
3. JRE version 1.3.1 or higher
4. Java Web Start version 1.1 or higher (For running over the web)

Remote Visualisation System X. RVS Client User Guide
115
3 Running the Client
There are a number of ways the client can be executed. It can either be started from
the command line or using Java Web Start technology to run it straight from within
the web browser.
3.1 Command Line
The client can be executed by typing the following on the command line:
java –jar democlient.jar
Where democlient.jar is the name of the client jar file.
You may also send width, height and image parameters the application. For example:
java –jar democlient.jar 700 500 http://server.com/image.fits
Starts the application with window width = 700 pixels, window height = 500 pixels
and loads the image at http://server.com/images.fits when the application begins.
3.2 Java Web Start
Java Web Start allows users to execute the RVS Client straight from within the web
browser. Doing this as simple as entering a URL in the browser window, or clicking
on a link that takes you to that URL.
The URL for starting the client using Java Web Start is as follows:
http://plexus.act.cmis.csiro:8088/rvsclient/democlient.jsp
Similar to the command line access, you may also specify width, height and initial
image parameters via the URL. For example, the following URL:
http://plexus.act.cmis.csiro:8088/rvsclient/democlient.jsp?width=700&height=500&image=http://server.com/image.fits

Remote Visualisation System X. RVS Client User Guide
116
starts the application with window width = 700 pixels, window height = 500 pixels
and loads the image at http://server.com/images.fits when the application begins.
4 User Interface
The interface of the standalone client is simple and easy to use for even the most
novice users. Below is a description of three different graphical elements; the main
interface, image options and the colour map changer.
4.1 Main Interface
Figure X-1: Main interface screenshot
Figure X-1 shows a screenshot of the main application window. The table below
contains a description of the numbered items on the screenshot.
Item Number Item Name Description
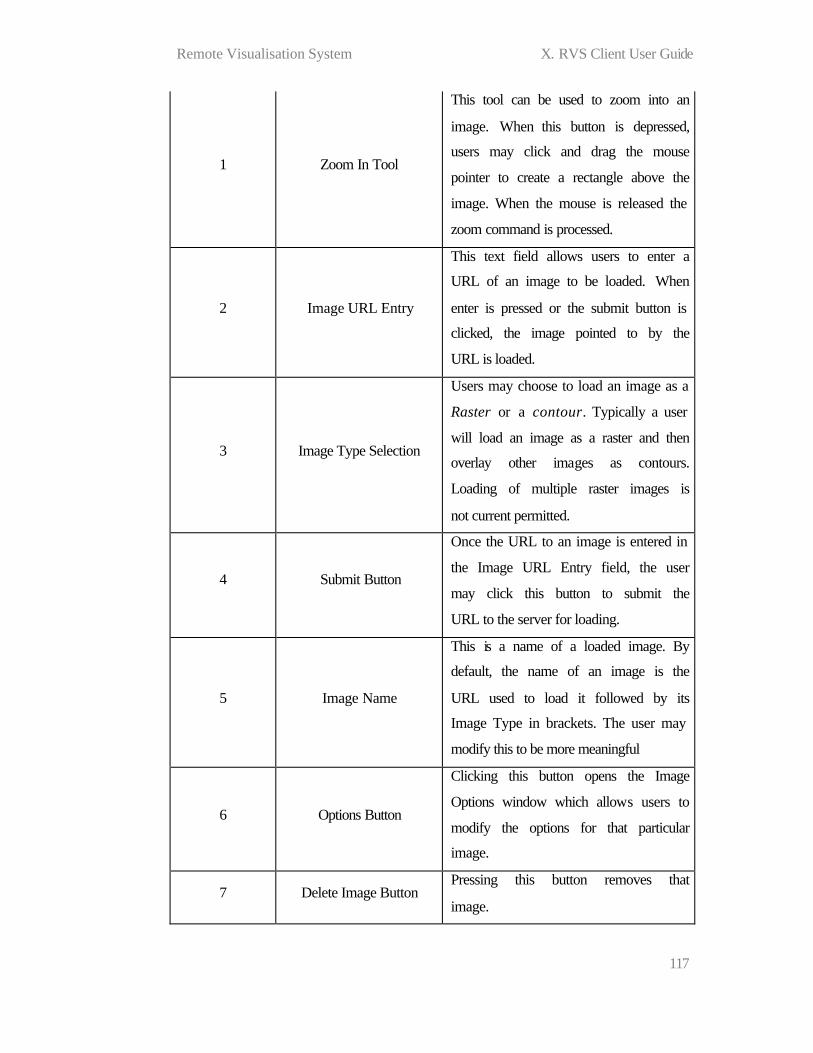
Remote Visualisation System X. RVS Client User Guide
117
1 Zoom In Tool
This tool can be used to zoom into an
image. When this button is depressed,
users may click and drag the mouse
pointer to create a rectangle above the
image. When the mouse is released the
zoom command is processed.
2 Image URL Entry
This text field allows users to enter a
URL of an image to be loaded. When
enter is pressed or the submit button is
clicked, the image pointed to by the
URL is loaded.
3 Image Type Selection
Users may choose to load an image as a
Raster or a contour. Typically a user
will load an image as a raster and then
overlay other images as contours.
Loading of multiple raster images is
not current permitted.
4 Submit Button
Once the URL to an image is entered in
the Image URL Entry field, the user
may click this button to submit the
URL to the server for loading.
5 Image Name
This is a name of a loaded image. By
default, the name of an image is the
URL used to load it followed by its
Image Type in brackets. The user may
modify this to be more meaningful
6 Options Button
Clicking this button opens the Image
Options window which allows users to
modify the options for that particular
image.
7 Delete Image Button Pressing this button removes that
image.

Remote Visualisation System X. RVS Client User Guide
118
8 Position Display
A user may click anywhere on the
current image to have the current
position and the value displayed here.
9 Colour map Button
This button is available for raster image
types only. When pressed, the colour
map chooser dialog box is opened so
users may select the colour map to be
used.
10 Activity bar
When the client is busy, you will see a
read beam running across the activity
bar.
11 Channel Slider
When viewing a cube, the channel
slider may be used to go to a particular
channel. As the slider is dragged, the
number in the channel text field will
change according to the channel the
slider is at. When the mouse button is
released, the new channel is set.
12 Channel Text Field
This field indicates the current channel
that is being represented by the
displayed image. Users may change
this to another channel and press enter
to go to that channel. All invalid
requests will be ignored.
13 New Session Button
When this button is clicked, the current
session will be completely discarded
and a new session created. This
basically means you will you be
presented with a fresh client window
without any images loaded.
14 Exit Clicking this button will close the
application.

Remote Visualisation System X. RVS Client User Guide
119
15 Status Bar The status bar displays the current
status of the application.
16 Un-zoom Tool When this button is clicked, the current
canvas is completed un-zoomed.
Table X-1: Main interface description
4.2 Image Options
Figure X-2: Image options window screenshot
Figure X-2 shows a screenshot of the Image Options window. The table below
contains a description of the numbered items on the screenshot.

Remote Visualisation System X. RVS Client User Guide
120
Item Number Item Name Description
1-5 Context Tabs
All options are categorised into
different contexts and these are
represented by one tab each. You can
display the options in each context by
clicking on its tab. The contexts and
their options are dependent on the type
of image.
6 Options Display
This is where the options for the active
tab (see 1-5) is displayed. The options
that are available depend on the image
type.
7 Close Button Clicking this button will close the
options window
8 Apply Button
Clicking this button will cause all
changes made (since the last press) to
be applied. This button is disabled if
Auto Apply is selected
9 Auto Apply
When this is enabled. Making a change
to an option will cause the change to be
applied immediately. When disabled,
any change will not be applied until the
Apply Button is pressed.
Table X-2: Image Options screenshot description

Remote Visualisation System X. RVS Client User Guide
121
4.3 Colour map Selection Dialog
1
2 3
Figure X-3: Colour map selection dialog screenshot
Figure X-3 shows a screenshot of the colour map selection dialog box. The table
below contains descriptions of the numbered items in the figure.
Item Number Item Name Description
1 Colour map List
This drop-down list can be used to
select a new colour map to be used on
the canvas
2 Cancel Button
Pressing this button will discard any
changes to the colour map (since the
dialog was opened) and close the
dialog.
3 OK Button
Clicking this button will set will set the
colour map to the currently selected
value in the list, and close the colour
map selection dialog.
Table X-3: Colour map selection dialog description

Remote Visualisation System X. RVS Client User Guide
122
5 Functions
5.1 Zooming
Zooming operations can be performed by using the zoom and un-zoom tool on the
left edge of the application window.
You can zoom in to an image by firstly clicking the zoom in tool (indicated by the
magnifying glass over the + symbol). You can then click and drag the mouse pointer
over an image to create a rectangle region to zoom into. When the mouse button is
released, the zoom process will begin and you will shortly see the image resulting
from the zoom operation.
You can zoom out, to view the original un-zoomed image by clicking on the un-
zoom tool (indicated by the magnifying glass over the - symbol).
5.2 Changing Colour Maps
The RVS let’s you set different colour maps for Raster images. By clicking on the
colour map button corresponding to an image, you can select from a predefined list
of colour maps.
5.3 Viewing a Remote Image
The RVS let’s you view any valid FITS image that can be accessed via a URL.
Images can be added to the canvas by entering its URL in the text field located at the
top of the application window and either pressing enter or clicking the submit button.
The time taken to load an image depends on:
1. The size of the FITS file 2. The bandwidth between your computer and the RVS Server 3. The bandwidth between the RVS Server and the server where the file is
located.
A file is successfully loaded when you see the image drawn on the canvas and a new
entry for the image appears at to the right of the application window.

Remote Visualisation System X. RVS Client User Guide
123
The RVS is currently limited to viewing a single Raster image at a time. You are not
permitted to overlay raster images.
5.4 Removing an Image
You may remove an image by clicking the delete button corresponding with the
image. When an image is successfully removed, you will notice the image is no
longer displayed on the canvas and the entry for that image (where the delete button
was located) has also been removed.
5.5 Overlaying Contours
You may display different images as contours on top of a raster image. The process
of doing this is the same as Viewing a Remote Image (see 5.3), but selecting the
image type to be a contour instead of a raster.
5.6 Position Tracking
You may click anywhere on top of an image to display the corresponding world or
pixel coordinate in the image’s Position Display area. See section 4.2 for options
relating to position tracking.
5.7 Changing Channels in a Cube
When viewing a cube, users may step to different channels by using either the
Channel Slider or by entering the channel number in the Channel Text Field. Valid
entries are between 1 (default) and n, where n = number of channels in the cube.
As the channel slider is dragged, the number in the channel text field will change
according to the channel the slider is at. When the mouse button is released, the new
channel is set. Alternatively, users may type in the channel in the text field and press
enter to go to that channel. All invalid requests will be ignored.
Remote Visualisation System X. RVS Client User Guide
124
5.8 Clearing the Canvas
You can completely clear the canvas by clicking the New Session button. This will
delete all images that are currently loaded and start a new session for you.
5.9 Changing Image Options
You can change some options of an image by clicking on the image’s corresponding
Options button. This will open a new window containing the options that you may
alter.
All options are categorised into different contexts and these are represented by one
tab each. You can display the options in each context by clicking on its tab. The
contexts and their options are dependent on the type of image.
5.9.1 General Options
These options are available for all image types.
o Display axes
In this tab, adjustments can be made to select how the data is sliced for
display, i.e. which axes of the data are mapped to X and Y on the screen. The
new selection will take effect immediately if Auto Apply is selected.
Otherwise, the new selection will not take place until the Apply button at the
bottom of the adjustment window is pressed. If you have selected the same
axis for more than one display axis, then your request will be ignored, and
you should correct your error, and press Apply again.
o Hidden axes
This tab is only present when the image or array has more than three axes,
and is used to set the location in the data along all of the axes which are not
mapped to either X, Y or Z (movie) axes in the Display axes tab.

Remote Visualisation System X. RVS Client User Guide
125
o Position tracking
In this tab, adjustments can be made to how the coordinates under the pointer
(mouse cursor, when clicked) are displayed. By default, position tracking is
enabled, so that when you click a mouse button with the pointer over an
image, the data value and coordinate are shown in the image’s Position
Display. You can turn position tracking off with the switch called Position
Tracking at the bottom of the tab.
Other options in this rollup are:
§ Position tracking - Absolute or relative
You may display absolute or relative (to the reference pixel)
coordinates.
§ Position tracking - World or pixel coordinates
You may display world or pixel coordinates.
§ Position tracking - Fractional or integral pixel coordinates
A data lattice is discrete, but each pixel can be considered to extend
over the range i±0.5. E.g. pixel [20, 30] in a 2D images covers the
range [19.5, 29.5] to [20.5, 30.5]. By default pixel coordinates are
presented integrally. If you like, this optional allows you to have them
presented fractionally.
§ Position tracking - Spectral unit
If the data contain a spectral axis, this menu will be included. It allows
you to select the units for the presentation of the spectral coordinates
(e.g. km/s or Hz etc). Conversion to km/s is only possible if the
Spectral coordinate contains the rest frequency. In its absence, no
conversion to km/s will be offered.
§ Position tracking - Velocity type

Remote Visualisation System X. RVS Client User Guide
126
If the data contain a spectral axis, this menu will be included. If you ask
to see the spectral coordinate as a velocity, then this allows you to select
the type of velocity definition (e.g. optical, radio etc.).
o Axis labels
The parameters in this tab offer basic control over the axis labels (which by
default are visible). You can toggle them on and off by selecting True/False
for Axis labelling & annotation. The other parameters in this tab are pretty
much self explanatory, and include text entries for the axis labels and control
of whether tick marks or grid lines are drawn.
o Axis label properties
In this tab, finer control over the axis label properties is provided.
Here you have control over whether the axis labels are shown as world
coordinates or image pixel coordinates (1-relative). You may select whether
the labels are relative (to the reference pixel) or absolute.
For Direction coordinates, you may select the units of the labels if they are
relative. For Spectral coordinates you may select the units of the labels, and
the velocity type. For other Coordinate types, you don't yet have further
control over the units.
You can also choose the Direction coordinate reference type of the following
J2000, B1950, GALACTIC, ECLIPTIC and SUPERGAL. Your coordinate
grid will reflect these types.
You can also choose where to place your axis labels. The default Auto is
usually sufficient, but other placements are available.
o General

Remote Visualisation System X. RVS Client User Guide
127
This tab has the parameters that most dramatically alter the generation of the
raster map itself from the image or array data. The elements of this tab are:
§ General - Aspect ratio
This option controls the dimensions with which data pixels are drawn
to the screen. Fixed lattice means data pixels will be mapped to square
pixels on the screen, in as much as the screen pixels themselves are
square. Fixed world means that the aspect ratio of the pixels according
to the coordinate system of the image will be honoured. Finally,
selecting flexible will allow the raster map to stretch independently in
each direction to fill as much of the canvas as possible.
§ General - Pixel treatment
This option controls how individual data pixels are drawn to the
screen. Selecting center means that pixels at the edge of the display
will be drawn only from the centres inwards. That is, down the left
hand border of the raster map, only the right-hand half of the pixels
will be visible, and along the bottom of the raster map, only the upper
half of the pixels will be visible. So for center, the raster map is drawn
from the center of the bottom left pixel in the selected data to the
center of the top right pixel in the selected data.
Selecting edge (the default) will change this behaviour such that all
data pixels will be drawn fully on the screen. This would be useful for
cases where only one of the display axes only has length one pixel.
§ General - Resampling mode
This setting controls how the data are resampled to the resolution of
the screen. Nearest refers to nearest neighbour resampling, where
each pixel on the screen is coloured according to the intensity of the
nearest corresponding data pixel. The alternative, bilinear (default),
applies a bilinear interpolation to produce smooth-looking images
independent of the screen pixel dimensions of the data pixels. While
Remote Visualisation System X. RVS Client User Guide
128
bilinear resampling normally produces a better looking image, it can
be significantly slower than nearest neighbour resampling, so be
aware of this.
§ General - Complex mode
If the data source (image or array) is Complex, then this menu allows you
to select whether you wish to see the magnitude, phase, real or imaginary
part.
5.9.2 Raster Options
These options are available for Raster images only.
o General - Histogram equalisation
The default value for this option is False. When enabled for raster maps,
some internal optimisation of colours from the colour map (or colour
channel) is made. The number of colours allocated to a given range of data is
proportional to the fraction of pixels whose pixel intensities lie in that range.
Thus colour cells are allocated where they are needed most.
o General - Scaling power cycles
This option offers further control over the mapping of data values to colour
cells from the colour map. The overall process in selecting a colour for a
particular pixel is as follows: the data value of the pixel is clipped lie between
the data minimum and maximum as specified elsewhere in this General tab.
Then, according to this option which is described below, this clipped pixel
intensity is mapped to an index between 0 and the number of colours
available in the selected colour map. The colour which is in the colour map at
this position, which itself is controlled by the current stretch, shift, contrast,
brightness and invert settings of the colour map, is then drawn for this
particular pixel.

Remote Visualisation System X. RVS Client User Guide
129
So, the scaling power cycles option controls the mapping of clipped pixel
intensities to colour look-up values. When this is set to zero, a straight line
connects (domainMin, rangeMin) and (domainMax, rangeMax) on a plot
where the domain is the input data values constrained to the range given by
the data min and max sliders, and the range runs from 1 to number of colours
in the selected colour map.
As the scaling power decreases from zero, the curve deviates from the
straight line, rising above it, such that an increasing fraction of the available
colour map is used for data values close to the data minimum. This curve is
calculated using a log function.
As the scaling power increases from zero, the curve deviates from this
straight line, falling below it, such that an increasing fraction of the available
colour map is used for data values closer to the maximum. The curve is
calculated using an exponential function.
5.9.3 Contour Options
The following options are available for contour images only.
o General - Contour scale factor
The contour levels given will be multiplied by the factor entered in this
option before being drawn.
o General - Level type
This option indicates whether the vector of contour levels, specified in the
Contour levels box, multiplied by the scale factor, are absolute levels (that is,
in the native units of the image), or are instead fractional levels, where 0 is

Remote Visualisation System X. RVS Client User Guide
130
mapped to the lowest pixel intensity in the image, and 1 is mapped to the
highest.
o General - Line width
This option controls the thickness of the contour lines.
o General - Dash negative contours?
Set this option to True if you would like contours of negative values in your
data to be dashed rather than solid lines.

Remote Visualisation System XI. Conclusion
131
XI. Conclusion
The RVS is a distributed server side software system that allows users to visualise
and analyse large images that are located on a remote data archive. This is a unique
system, where the user is not required to download the image to his/her computer for
visualisation. This results in a quick and efficient display of the required data.
There is an enormous amount of astronomy data all around the world. One of the
goals of the International Virtual Observatory is to provide scientists with transparent
access to this data. That is, a scientist in one corner of the world should be able to
enter a set of query parameters and have the data from all over the world searched,
queried, processed and then presented in a form that is requested. The user should
not be concerned with the location and size of the data.
Current systems such as client side packages and the more modern systems like
Aladin (section II.5) are part way to meeting these requirements. Aladin and Oasis
provide great correlation between data from various different archives and
catalogues, but they fail to address the issue of very large dataset that will be
common in the VO. The RVS was designed to address this issue in particular, as well
as provide an architecture that is extensible to accommodate the growing needs of the
VO.
The RVS project was conducted at the Australia Telescope National Facility (a
division of CSIRO) as part of a one year employment contract. This has been only an
initial phase in the development of the RVS. The intention was to have an
operational system, but to also lay a foundation for further development. There are
already plans at the ATNF to use the RVS framework to deploy other services,
besides visualisation, to the astronomy community. It is my hope that eventually the
RVS will be utilised by other organisations to provide access to their data in the VO.
This project has been a great learning experience for me as I have had to apply
majority of the Software Engineering skills I have obtained during the course of my
degree at UTS. I have used and as a result, learnt, a host of software technologies

Remote Visualisation System XI. Conclusion
132
including SOAP, CORBA, Linux development, XML, C++ and Java. Being
responsible for a somewhat ambitious project such as this has given me valuable
experience in the software project management. I am confident that this experience
will provide a good foundation on which I can build the rest of my career.
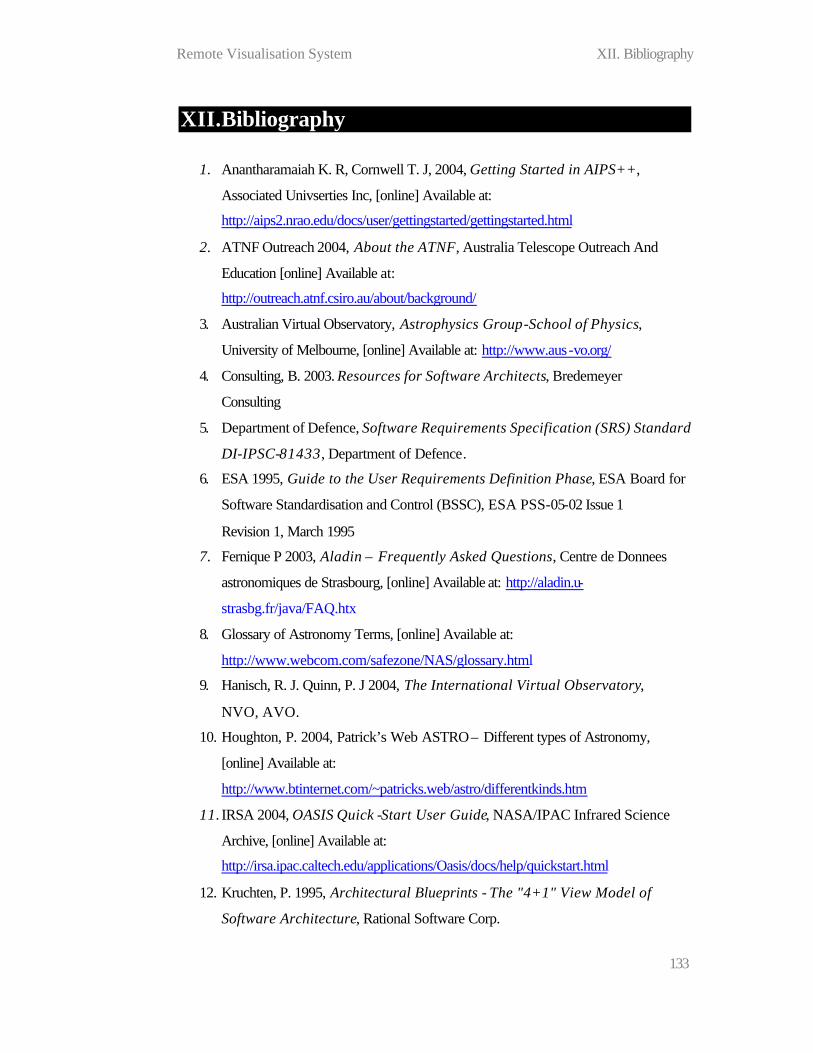
Remote Visualisation System XII. Bibliography
133
XII. Bibliography
1. Anantharamaiah K. R, Cornwell T. J, 2004, Getting Started in AIPS++,
Associated Univserties Inc, [online] Available at:
http://aips2.nrao.edu/docs/user/gettingstarted/gettingstarted.html
2. ATNF Outreach 2004, About the ATNF, Australia Telescope Outreach And
Education [online] Available at:
http://outreach.atnf.csiro.au/about/background/
3. Australian Virtual Observatory, Astrophysics Group-School of Physics,
University of Melbourne, [online] Available at: http://www.aus-vo.org/
4. Consulting, B. 2003. Resources for Software Architects, Bredemeyer
Consulting
5. Department of Defence, Software Requirements Specification (SRS) Standard
DI-IPSC-81433, Department of Defence.
6. ESA 1995, Guide to the User Requirements Definition Phase, ESA Board for
Software Standardisation and Control (BSSC), ESA PSS-05-02 Issue 1
Revision 1, March 1995
7. Fernique P 2003, Aladin – Frequently Asked Questions, Centre de Donnees
astronomiques de Strasbourg, [online] Available at: http://aladin.u-
strasbg.fr/java/FAQ.htx
8. Glossary of Astronomy Terms, [online] Available at:
http://www.webcom.com/safezone/NAS/glossary.html
9. Hanisch, R. J. Quinn, P. J 2004, The International Virtual Observatory,
NVO, AVO.
10. Houghton, P. 2004, Patrick’s Web ASTRO – Different types of Astronomy,
[online] Available at:
http://www.btinternet.com/~patricks.web/astro/differentkinds.htm
11. IRSA 2004, OASIS Quick -Start User Guide, NASA/IPAC Infrared Science
Archive, [online] Available at:
http://irsa.ipac.caltech.edu/applications/Oasis/docs/help/quickstart.html
12. Kruchten, P. 1995, Architectural Blueprints - The "4+1" View Model of
Software Architecture, Rational Software Corp.

Remote Visualisation System XII. Bibliography
134
13. Malan, D. B. 2001, Defining Non-Function Req uirements, Bredemeyer
Consulting.
14. Malan, D. B. 2002, Software Architecture: Central Concerns, Key Decisions,
Bredemeyer Consulting.
15. Matjaz B. Juric, I. R., Marjan Hericko, 2000. Performance Comparison of
CORBA and RMI. Maribor, University of Maribor Smetanova.
16. McClure-Griffiths N 2003, Southern Galactic Plane Survey, Australia
Telescope National Facility, [online] Available at:
http://www.atnf.csiro.au/research/HI/sgps/queryForm.html
17. MIRIAD Introduction, University of Berkeley 2001 [online] Available at:
http://bima.astro.umd.edu/miriad/intro.html
18. Palu S 2003, Data Visualization in Java for Technical Computing,
developer.com, [online] Available at:
http://www.developer.com/java/article.php/1483661
19. Pence W. D 2004, A Brief Introduction To FITS , NASA, [online] Available
at: http://fits.gsfc.nasa.gov/fits_overview.html
20. Sandholm, J. G. 2003, Globus Toolkit 3 Core - A Grid Service Container
Framework , Globus.
21. Williams R, Ochsenbein F 2002, VOTable: A Proposed XML Format for
Astronomical Tables, United States Virtual Observatory (US-VO), [online]
Available at: http://www.us-vo.org/VOTable/VOTable-1-0.htm

Remote Visualisation System XIII. Appendices
135
XIII. Appendices
1 RVS Server Alternative Architectures
1.1 Overview
The RVS Server is the type of software system that may be designed in many ways.
For this reason, a number of different architectures were designed and then
evaluated. The remainder of this section outlines these alternative architectures and
demonstrates how the non-functional requirements of the system were used to
determine the best architecture.
Four alternative architecture styles have been evaluated to determine which style is
most appropriate for the RVS server. Please note, that the architectures are applied to
the RVS server only. They do not apply to the entire RVS system, which would
include clients and data centres.
The following table is used to determine the appropriateness of each architecture.
Requirements Satisfied Comments
The requirement
to be satisfied
A rating 0 and 5.
0 = Not Satisfied
5 = Fully Satisfied
Justification of the rating and other
comments.
Table XIII-1: Architecture evaluation method

Remote Visualisation System XIII. Appendices
136
1.2 Client – Server Architecture
User 1
User 2
User 3
ServerCommon Storage
Figure XIII-1: Client - Server architecture diagram
This architecture follows a client server model where multiple user processes are
created (one per user) and they all act as clients. There is also a server process
running for all logic and data that needs to be shared amongst different users. A user
component would request a service and the server would perform the requested
operation and return a result. For example, a user can:
o Use the server to order an image from a data centre.
o Obtain canvas or image data from the server.
o Perform a zoom on an image by calling a zoom service on the server.
Requirements Satisfied Comments
Availability 3
All user components rely upon a single
server process. Downtime of server
component will always equal downtime of
the whole RVS server.

Remote Visualisation System XIII. Appendices
137
Portability 4
Since the number of different processes is
limited, the components don’t necessarily
need to rely too heavily on inter-process
communication. The components can be
written to be platform independent.
Scalability 3 Scalable due to multiple user components.
Extensibility 3
Although it is extensible, it’s not easy to do
so. With so much functionality bundled
into a single component, it may be difficult
to extend.
Reusability 2
The large server component makes it very
specific for its purpose. There are no
components that can be re-used for similar
purposes.
Configurability 3
The decomposition by function means the
user and the server component can each
have different configuration options.
Although, too much further configuration
of the server component can be difficult
Reliability 5
One component controlling access to all
data ensures good access control and
reliability
Maintainability 2
The server is too large a component to be
easily maintained. Need further
decomposition by functionality.
Performance 3
Server and data access may be a
performance bottleneck if two many users
are being serviced.
Table XIII-2 : Client - Server architecture analysis
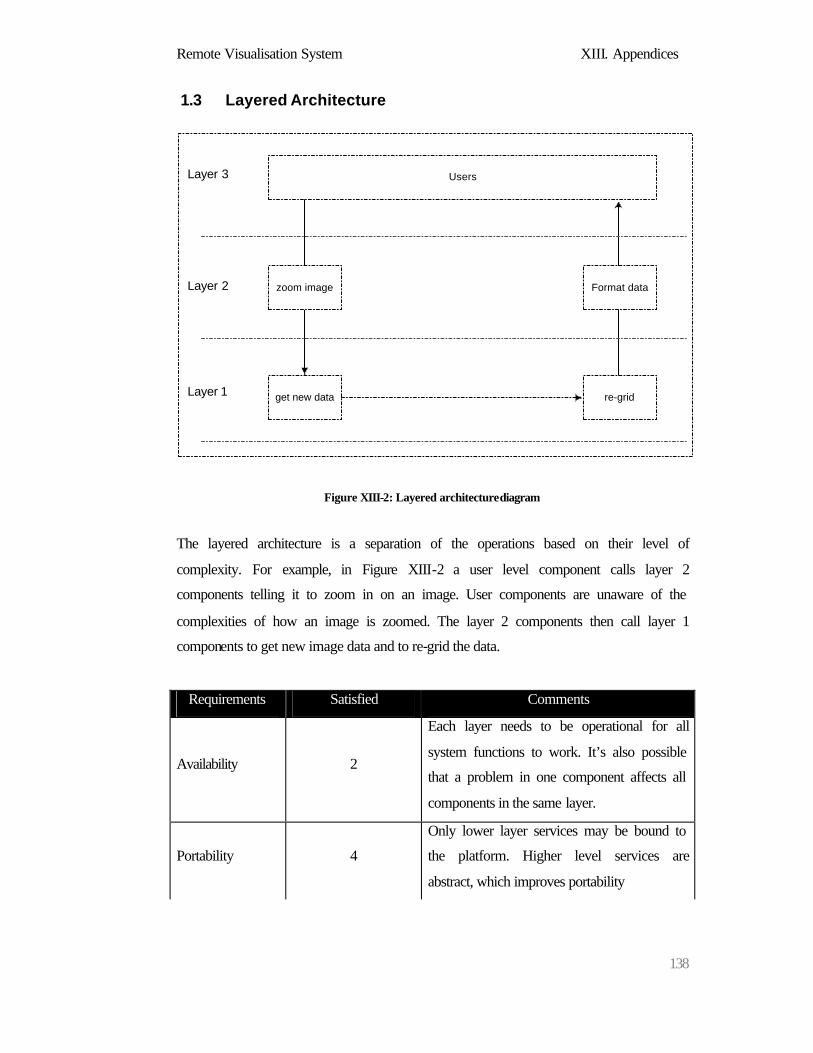
Remote Visualisation System XIII. Appendices
138
1.3 Layered Architecture
Layer 1
Layer 2
Layer 3 Users
zoom image
get new data re-grid
Format data
Figure XIII-2: Layered architecture diagram
The layered architecture is a separation of the operations based on their level of
complexity. For example, in Figure XIII-2 a user level component calls layer 2
components telling it to zoom in on an image. User components are unaware of the
complexities of how an image is zoomed. The layer 2 components then call layer 1
components to get new image data and to re-grid the data.
Requirements Satisfied Comments
Availability 2
Each layer needs to be operational for all
system functions to work. It’s also possible
that a problem in one component affects all
components in the same layer.
Portability 4
Only lower layer services may be bound to
the platform. Higher level services are
abstract, which improves portability
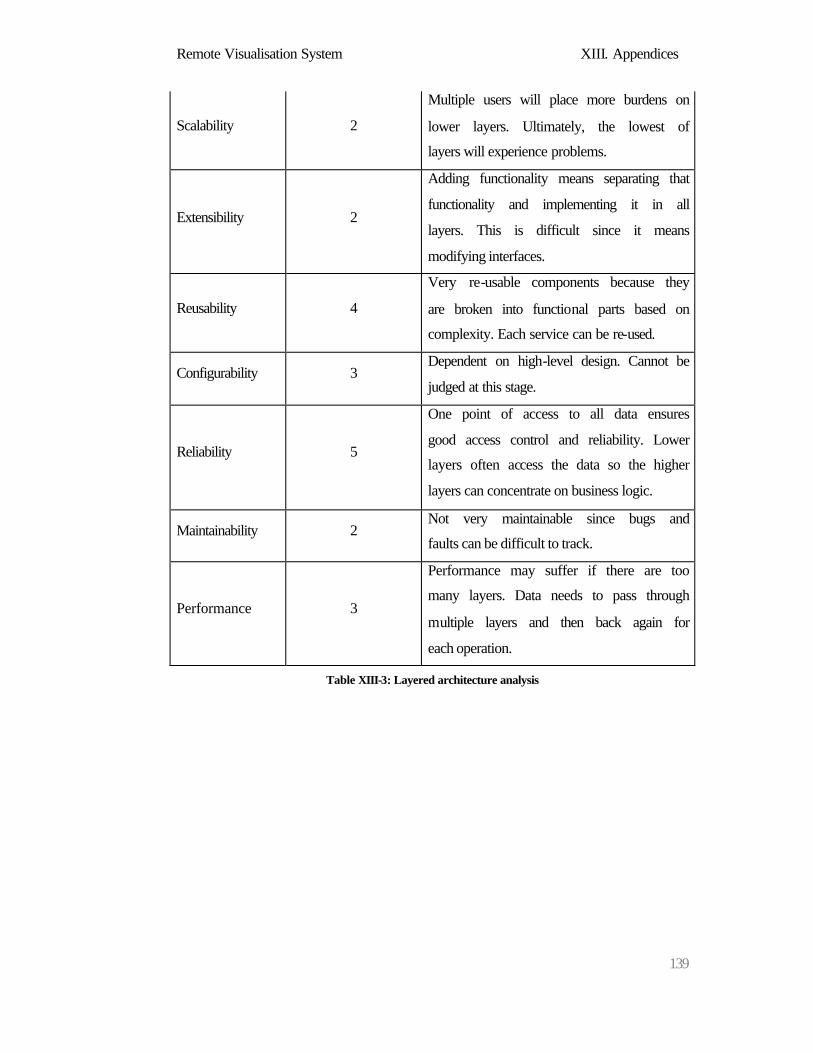
Remote Visualisation System XIII. Appendices
139
Scalability 2
Multiple users will place more burdens on
lower layers. Ultimately, the lowest of
layers will experience problems.
Extensibility 2
Adding functionality means separating that
functionality and implementing it in all
layers. This is difficult since it means
modifying interfaces.
Reusability 4
Very re-usable components because they
are broken into functional parts based on
complexity. Each service can be re-used.
Configurability 3 Dependent on high-level design. Cannot be
judged at this stage.
Reliability 5
One point of access to all data ensures
good access control and reliability. Lower
layers often access the data so the higher
layers can concentrate on business logic.
Maintainability 2 Not very maintainable since bugs and
faults can be difficult to track.
Performance 3
Performance may suffer if there are too
many layers. Data needs to pass through
multiple layers and then back again for
each operation.
Table XIII-3: Layered architecture analysis
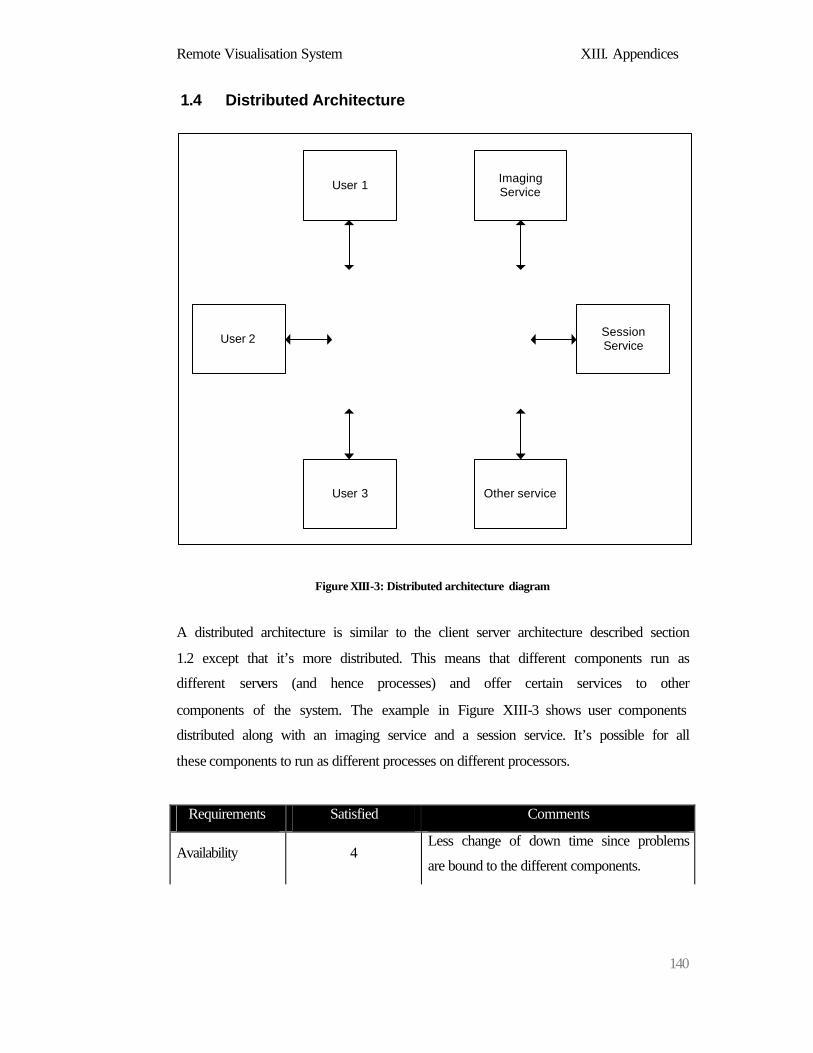
Remote Visualisation System XIII. Appendices
140
1.4 Distributed Architecture
User 1
User 2
ImagingService
User 3
SessionService
Other service
Figure XIII-3: Distributed architecture diagram
A distributed architecture is similar to the client server architecture described section
1.2 except that it’s more distributed. This means that different components run as
different servers (and hence processes) and offer certain services to other
components of the system. The example in Figure XIII-3 shows user components
distributed along with an imaging service and a session service. It’s possible for all
these components to run as different processes on different processors.
Requirements Satisfied Comments
Availability 4 Less change of down time since problems
are bound to the different components.

Remote Visualisation System XIII. Appendices
141
Portability 2
Depends slightly on implementation, but a
lot of inter-process communication results
in system specific code. Although it is
possible to use CORBA, RMI, RPC, etc to
communicate between platforms.
Scalability 4
Distributed architectures are known for
greater scalability since processes can be
spawned as demand increases. Processes
can also be spanned across multiple
processors.
Extensibility 4
Very modular, and hence, components can
be added without affecting other
components.
Reusability 4
Since all components are highly cohesive
and act as a service, they can be re-used in
different environments.
Configurability 3
Each component can be configured
independently. System-wide configuration
may be a problem since it is so modular.
Reliability 3
Reliability suffers when so many different
components behave independently. There
is greater threat to data security and
integrity.
Maintainability 5
Another common advantage of distributed
architectures is maintainability. Bugs can
easily be tracked to components and
updates can be performed on one
component without affecting another.

Remote Visualisation System XIII. Appendices
142
Performance 3
Dependent on implementation, but
typically distributed architectures perform
better with higher workloads, and slower
than other architectures with less
workload. This is because interprocess
communication carries a significant
overhead.
Table XIII-4: Distributed architecture analysis
1.5 Data Centric Architecture
Data Storage(Disk or memory)
User 1
User 2 User 3
Figure XIII-4: Data Centric architecture analysis
The data centric architecture models the system as a set of components that share
common data. It is similar to the client – server architecture except that the
functionality of the server is enclosed into the user components. Therefore, there is
no logic or services that are being shared by all user components. Each component is
responsible for its own operation.
Data such as images are stored in a central location (in disk or memory). The
components use locking mechanisms to control access to the data.

Remote Visualisation System XIII. Appendices
143
Requirements Satisfied Comments
Availability 2
All users are dependent on a single source
of data. Downtime of the storage means
downtime for the entire RVS server.
Portability 4
Can be made very portable since no inter-
process communication needs to take
place.
Scalability 4
More users will put a greater burden on the
data storage. This can become a bottleneck
of the system if it cannot process requests
in time. Although, multiple users can be
spanned across processes and different
processors.
Extensibility 2
Due to the lack of modularity, adding
functions to this architecture may affect
other functions. More care is needed.
Reusability 1 Very little re-usability due to the lack of
modularity.
Configurability 2 Configurable per user only.
Reliability 2
Low reliability due to multiple processes
accessing one piece of data at one time.
More opportunities for errors to occur and
because each user component is
responsible for itself, errors can go
undetected.
Maintainability 3
Overall system is easy to understand but
complexities may arise with bug fixing.
Faults often cannot be narrowed to
individual components.
Performance 5
Extremely efficient due to the time saved
in communicating between multiple
components.
Table XIII-5: Data Centric architecture analysis

Remote Visualisation System XIII. Appendices
144
1.6 Summary
Table XIII-6 below summarises the data in the above sections. The values represent
the raw points obtained by the architectures without considering the importance of
each requirement that the points were obtained for.
Requirement Client - Server
(Raw)
Layered
(Raw)
Distributed
(Raw)
Data - Centric
(Raw)
Availability 3 2 4 2
Portability 4 4 2 4
Scalability 3 2 4 4
Extensibility 3 2 4 2
Reusability 2 4 4 1
Configurability 3 3 3 2
Reliability 5 5 3 2
Maintainability 2 2 5 3
Performance 3 3 3 5
Total 28 27 32 25
Table XIII-6: Summary of architecture analysis
The summary shows the distributed architecture to be most suitable assuming that
each requirement is equally as important, which isn’t the case. Table XIII-7 shows
the weighting of each requirement. These values are determined by considering the
importance of each requirement to the RVS server. The RVS-S-SRS document as
was used to as guide for these values.
Requirement Requirement Weight
Availability 4
Portability 2
Scalability 4
Extensibility 4
Reusability 3

Remote Visualisation System XIII. Appendices
145
Configurability 4
Reliability 5
Maintainability 3
Performance 5
Table XIII-7: Architecturally significant requirement weight
Using the weightings, the points gained by the architectures for each requirement can
be normalised. Table XIII-8 shows a summary of the normalised points earned by the
architectures.
Requirement
Client - Server
(Normalised)
Layered
(Normalised)
Distributed
(Normalised)
Data - Centric
(Normalised)
Availability 12 8 16 8
Portability 8 8 4 8
Scalability 12 8 16 16
Extensibility 12 8 16 8
Reusability 6 12 12 3
Configurability 12 12 12 8
Reliability 25 25 15 10
Maintainability 6 6 15 9
Performance 15 15 15 25
Total 108 102 121 95
Table XIII-8: Normalised result of architecture analysis
Using the points Ð weight system of selection it is evident that the distributed
architecture is most appropriate for the RVS server.

Remote Visualisation System XIII. Appendices
146
2 Analysis of Architecture using Use Case Diagrams
The following use case diagrams were used to analyse the initial software
architecture of the RVS Server. The goal was to use common user scenarios to
determine the events that occur on the RVS Server as a result of user operations.
NOTE: This analysis was performed in the initial iteration of the architecture. Some
components were removed and design decisions altered after the prototype
evaluation.
Client
(from Actors)
register new user
Create new user
UserManager
(from Actors)
CommandCentre
(from Actors)
register new user
Security
(from Actors)
Figure XIII-5: Use case - new user registers

Remote Visualisation System XIII. Appendices
147
UserManager
(from Actors)
Session
(from Actors)
Security
(from Actors)
Client
Create session
(from Business Use-Case Model)
Join session
Register update listener
Join session Create session
(from Business Use-Case Model)
<<include>>
The command centre registers as an update listener so that it is notified when an update in the session has occured.
The client creates and joins a session
CommandCentre
(from Actors)
Authorise user
(from Business Use-Case Model)
Figure XIII-6: Use case - user joins a session
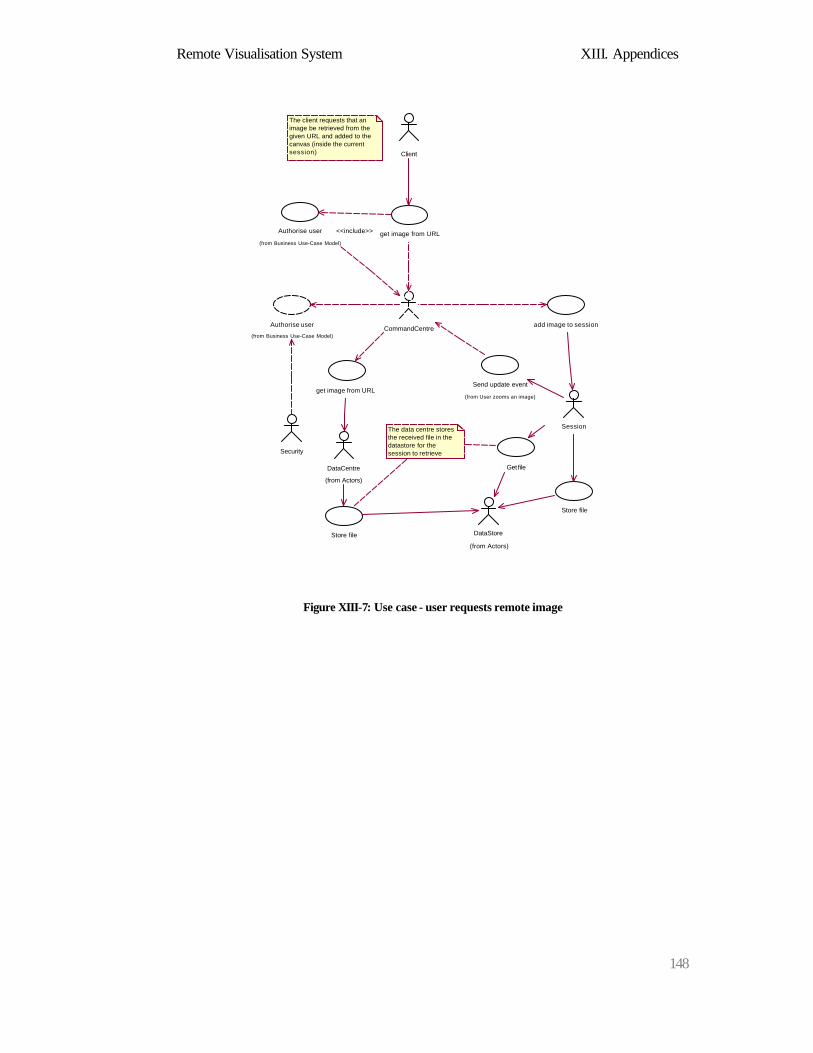
Remote Visualisation System XIII. Appendices
148
DataCentre
(from Actors)
Store file DataStore
(from Actors)
Security
Get file
Store file
Session
Client
get image from URL
add image to session
Send update event
(from User zooms an image)
Authorise user
(from Business Use-Case Model)
get image from URL<<include>>
The data centre stores the received file in the datastore for the session to retrieve
The client requests that an image be retrieved from the given URL and added to the canvas (inside the current session)
CommandCentreAuthorise user
(from Business Use-Case Model)
Figure XIII-7: Use case - user requests remote image

Remote Visualisation System XIII. Appendices
149
DataStore Store file
(from User opens remote image)Session
Security
Client
Zoom image
Send update event
Authorise user
(from Business Use-Case Model)
Zoom image
The session zooms the image and stores the result in the DataStore
The update event is sent to notify all listeners that the canvas has been updated.
The client requests that an image be zoomed in to the specified region
CommandCentre
(from Actors)
Authorise user
(from Business Use-Case Model)
<<include>>
Figure XIII-8: Use case - User zooms image

Remote Visualisation System XIII. Appendices
150
Client
(from Actors)
Security
(from Actors)
Authorise user
(from Business Use-Case Model) Add FITS image to canvas<<include>>
Authorise user
(from Business Use-Case Model)
add image to session
(from User opens remote image)
CommandCentre
(from Actors)
Session
(from Actors)
Store file
(from User opens remote image)
Get file
(from User opens remote image)
DataStore
(from Actors)
The user views a FITS image located on client computer
Figure XIII-9: Use case - User views local image

Remote Visualisation System XIII. Appendices
151
Client
(from Actors)
Security
(from Actors)
Create new layer
Authorise user
(from Business Use-Case Model)
Authorise user
(from Business Use-Case Model)
<<include>>
CommandCentre
(from Actors)
Session
(from Actors)
Create new layer
The user creates a new layer on the canvas
Figure XIII-10: Use case - User creates new layer

Remote Visualisation System XIII. Appendices
152
Client
(from Actors)
Security
(from Actors)
Get statisticsAuthorise user
(from Business Use-Case Model)
<<include>>
Authorise user
(from Business Use-Case Model)CommandCentre
(from Actors)
Session
(from Actors)
Get statistics
The user asks for the statistics of a region inside an image
Figure XIII-11: Use case - User obtains image statistics

Remote Visualisation System XIII. Appendices
153
DataStore
Store file
(from User opens remote image)
Client
(from Actors)
SecuritySession
change axis orderAuthorise user
(from Business Use-Case Model)
<<include>>
Authorise user
(from Business Use-Case Model)
change axis orderCommandCentre
(from Actors)
User rotates an image on the canvas
Figure XIII-12: Use case - User rotates image

Remote Visualisation System XIII. Appendices
154
Security
Client
(from Actors)
Authorise user
(from Business Use-Case Model)
Authorise user
(from Business Use-Case Model)
Set new resolution<<include>>
CommandCentre
(from Actors)
Set new resolution
UserManagerSessionSet new resolution
The user changes the image resolution it wants to receive from the RVS server
Figure XIII-13: Use case - User changes image resolution
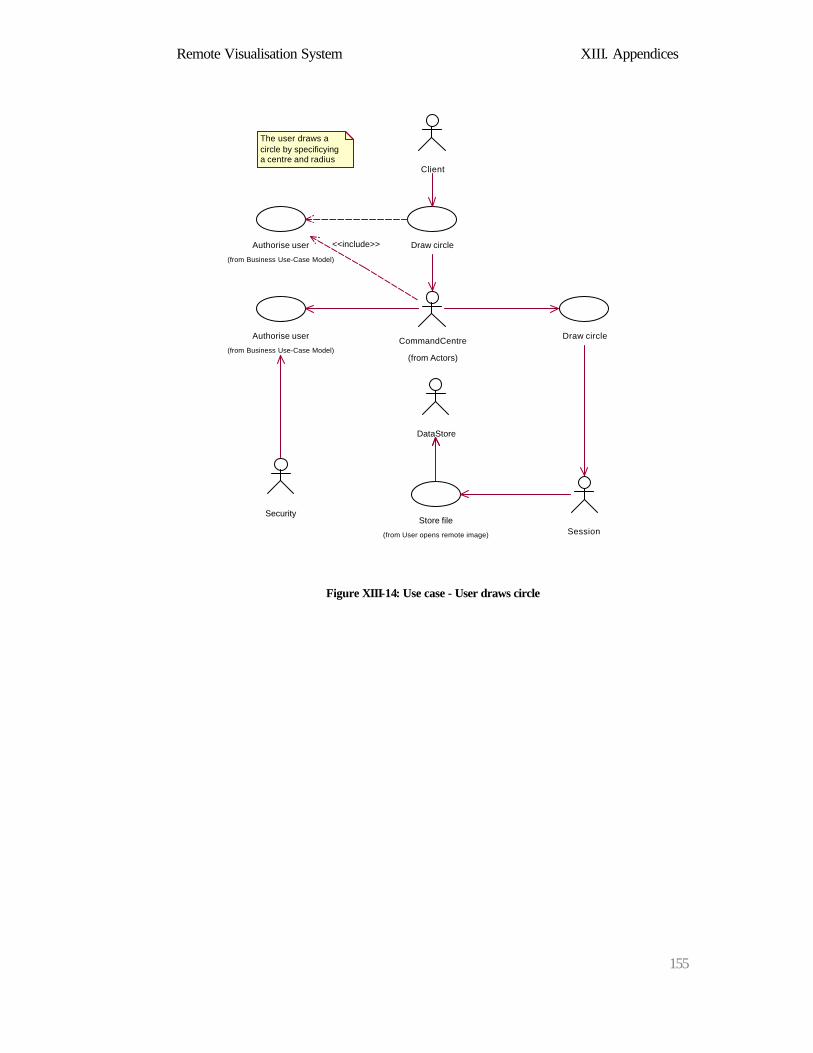
Remote Visualisation System XIII. Appendices
155
DataStore
Store file
(from User opens remote image)
Client
Security
Session
Draw circle
Authorise user
(from Business Use-Case Model)
Draw circle
The user draws a circle by specificying a centre and radius
CommandCentre
(from Actors)
Authorise user
(from Business Use-Case Model)
<<include>>
Figure XIII-14: Use case - User draws circle
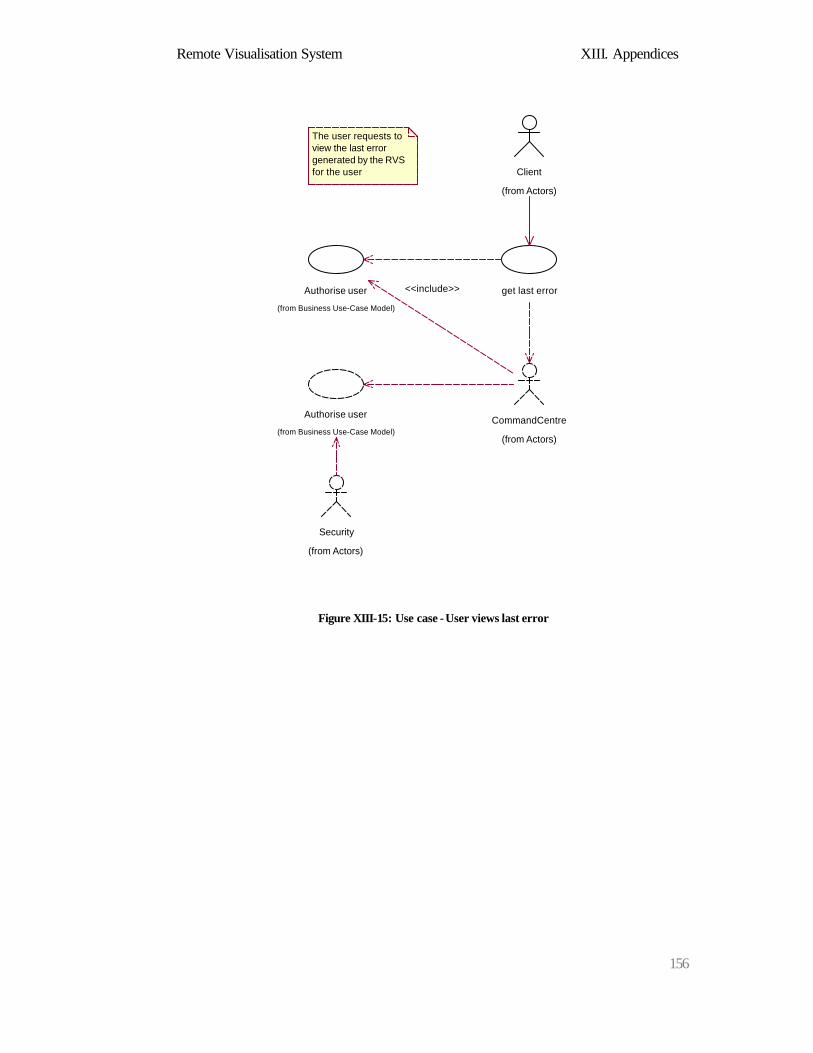
Remote Visualisation System XIII. Appendices
156
Client
(from Actors)
get last errorAuthorise user
(from Business Use-Case Model)
<<include>>
CommandCentre
(from Actors)
Authorise user
(from Business Use-Case Model)
Security
(from Actors)
The user requests to view the last error generated by the RVS for the user
Figure XIII-15: Use case - User views last error
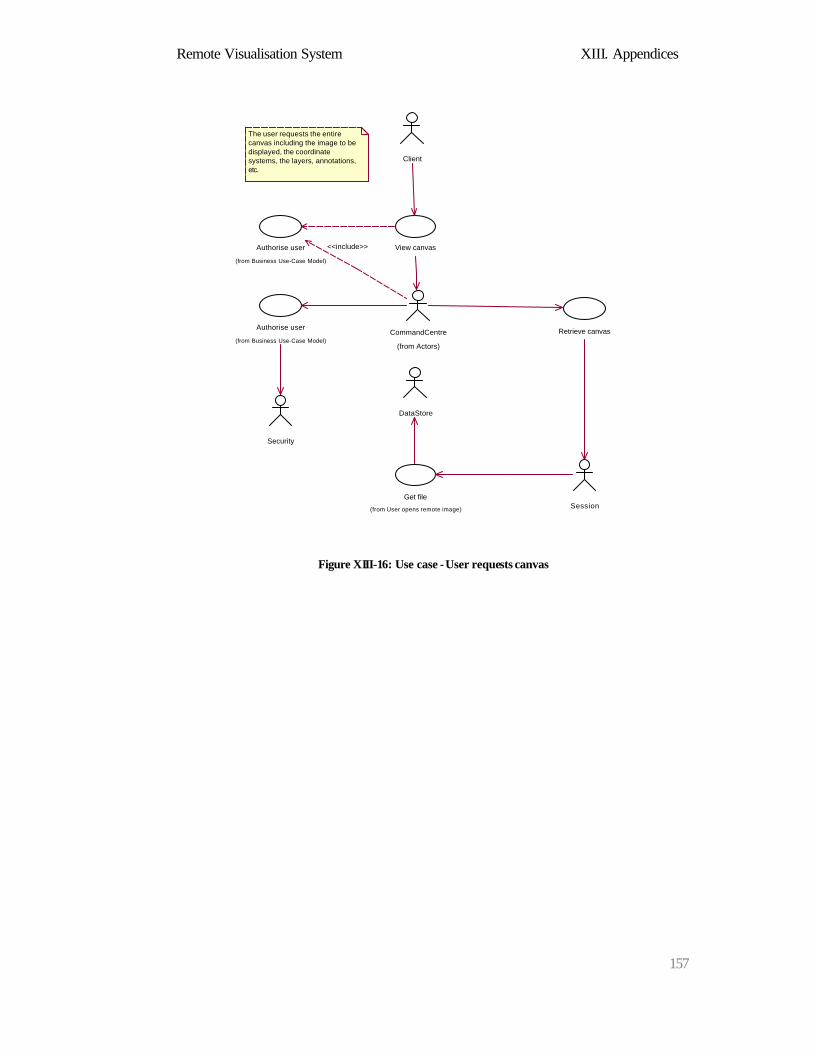
Remote Visualisation System XIII. Appendices
157
Client
Security
View canvas
Authorise user
(from Business Use-Case Model)Retrieve canvas
SessionGet file
(from User opens remote image)
DataStore
CommandCentre
(from Actors)
Authorise user
(from Business Use-Case Model)
<<include>>
The user requests the entire canvas including the image to be displayed, the coordinate systems, the layers, annotations, etc.
Figure XIII-16: Use case - User requests canvas
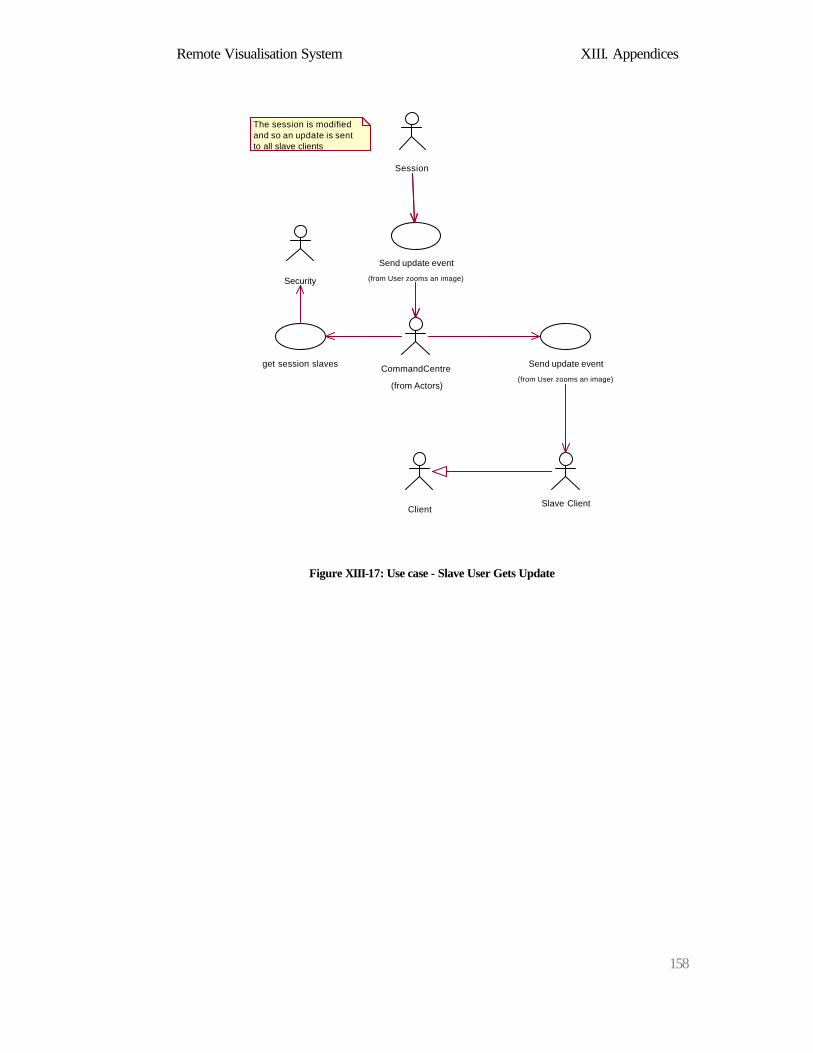
Remote Visualisation System XIII. Appendices
158
Session
Security
Send update event
(from User zooms an image)
get session slaves
Client
CommandCentre
(from Actors)
Slave Client
Send update event
(from User zooms an image)
The session is modified and so an update is sent to all slave clients
Figure XIII-17: Use case - Slave User Gets Update
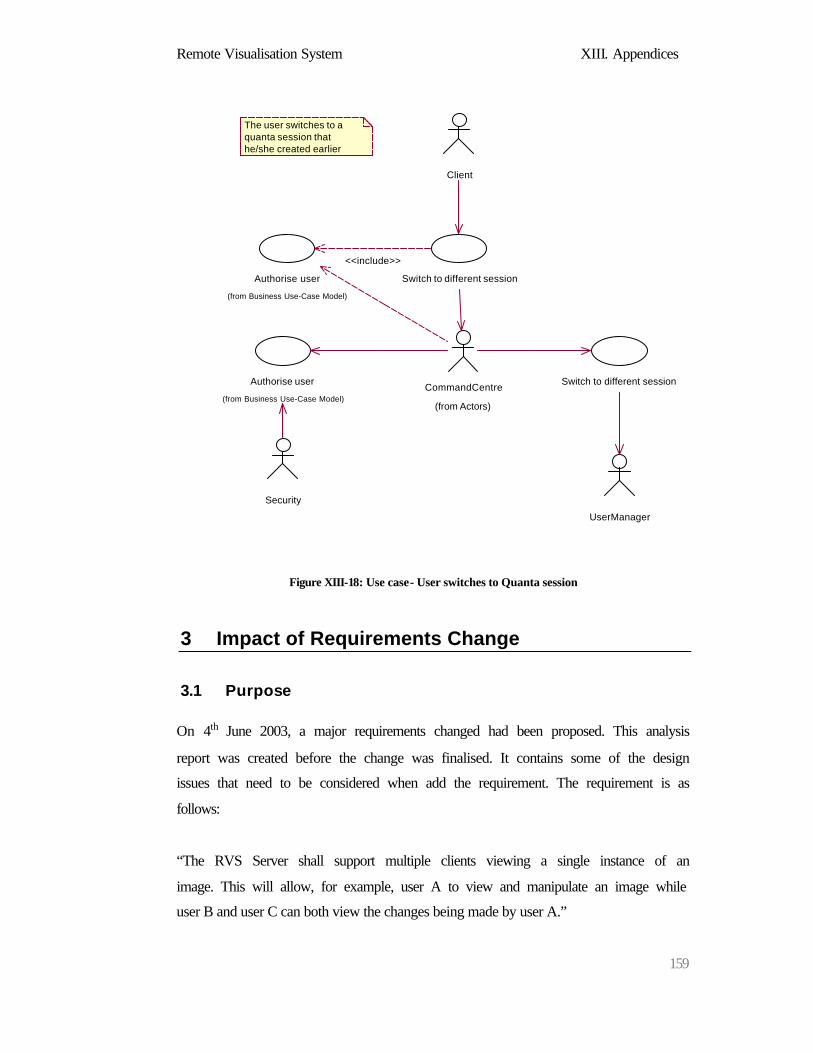
Remote Visualisation System XIII. Appendices
159
Client
Security
Switch to different session
Authorise user
(from Business Use-Case Model)
UserManager
Switch to different sessionCommandCentre
(from Actors)
Authorise user
(from Business Use-Case Model)
<<include>>
The user switches to a quanta session that he/she created earlier
Figure XIII-18: Use case - User switches to Quanta session
3 Impact of Requirements Change
3.1 Purpose
On 4th June 2003, a major requirements changed had been proposed. This analysis
report was created before the change was finalised. It contains some of the design
issues that need to be considered when add the requirement. The requirement is as
follows:
“The RVS Server shall support multiple clients viewing a single instance of an
image. This will allow, for example, user A to view and manipulate an image while
user B and user C can both view the changes being made by user A.”

Remote Visualisation System XIII. Appendices
160
3.2 Design Issues
Following are some of the design issues we’ll need to consider if we want to make
concurrent image sharing a requirement of the RVS. If we do decide to add this as a
requirement, then the initial design will need take this into consideration. Adding it
in later will be too difficult.
o If the image on all clients (connected to one session) need to appear identical:
§ Then the image sent to clients need to be pre-rendered (using a colour
map), or
§ The colour map to be used has to be sent to the client so the client can
render it.
o We’ll need command from server to clients for setting a new position. If a
‘master’ client track’s to a new position, that new position needs to be seen
with other ‘slave’ clients.
o It might be good have a message log so clients can pass messages to one
another. It depends on how we want the system to be used. Two users may
talk on the phone and share images on the computer, which would eliminate
he need for message passing.
o There needs to be a locking mechanism on the RVS server. The instance of
the image that is being manipulated needs to be locked for write access to
only one client.

Remote Visualisation System XIII. Appendices
161
Figure XIII-19: Session sharing - one instance for all clients
Client 1 has read/write access to the instance of the image. Client 2 can only read the
instance of the image. If the colour map is changed in client 1, then client 2 will be
updated to reflect this change. I.e. what you see in client 1 is what you get in client 2.
Alternatively we can have concurrent changes to an image.
Client 1
(Master)
Client 2
(Slave)
Instance
Image
RVS Server
Client 1
(Master)
Client 2
(Slave)
Instance 1
Instance 2
Image
RVS Server
Remote Visualisation System XIII. Appendices
162
Figure XIII-20: Session sharing - once image instance per user
The most of the properties of instance 1 and instance 2 will mirror each other, but if
client 1 changes the colour map it’s using, then client 2 will be told that the colour
map on client 1 has changed, but client 2 has the option to use a different one. Client
2 will have an option to ‘sync’ its instance of the image to that of client 1.
The design in Figure XIII-19 will take more time and effort to implement. It will also
use more resources, since each client will have instance of the image. However, for
flexibility and scalability reasons, it seems like the way to go.
o We also need to consider whether control can be switched between clients, so
can client 2, for example, become the master and client 1 the slave? How this
is done will require some coordination.
o This new requirement of sharing images will mean a little more work for the
client developers. Keeping a slave client in sync with a master will require
some ‘auto-update’ option in the client.

Remote Visualisation System XIII. Appendices
163
4 RVS Project Schedule
Task Duration Start Date Description Finish Date
RVS SRS 15 days
9/06/2003
8:00 RVS Software Requirements Specification 27/06/2003 17:00
RVS Software
Architecture 18 days
30/06/2003
8:00
Create a High Level Design (HLD) document
that defines all the software components of the
RVS server and also the interfaces between
them. 23/07/2003 17:00
Architecture research 5 days
30/06/2003
8:00 Research on software architecture.... 4/07/2003 17:00
Determine Alternatives 5 days
7/07/2003
8:00
Document the alternative architectures that can
be used 11/07/2003 17:00
Analyse Alternatives 5 days
14/07/2003
8:00
Analyse the alternative architectures (pros and
cons) 18/07/2003 17:00
Architecture Selection 2 days
21/07/2003
8:00
Select an architecture from the alternatives and
justify selection 22/07/2003 17:00
Architecture Traceability 1 day
23/07/2003
8:00 Trace the architecture back to the requirements 23/07/2003 17:00
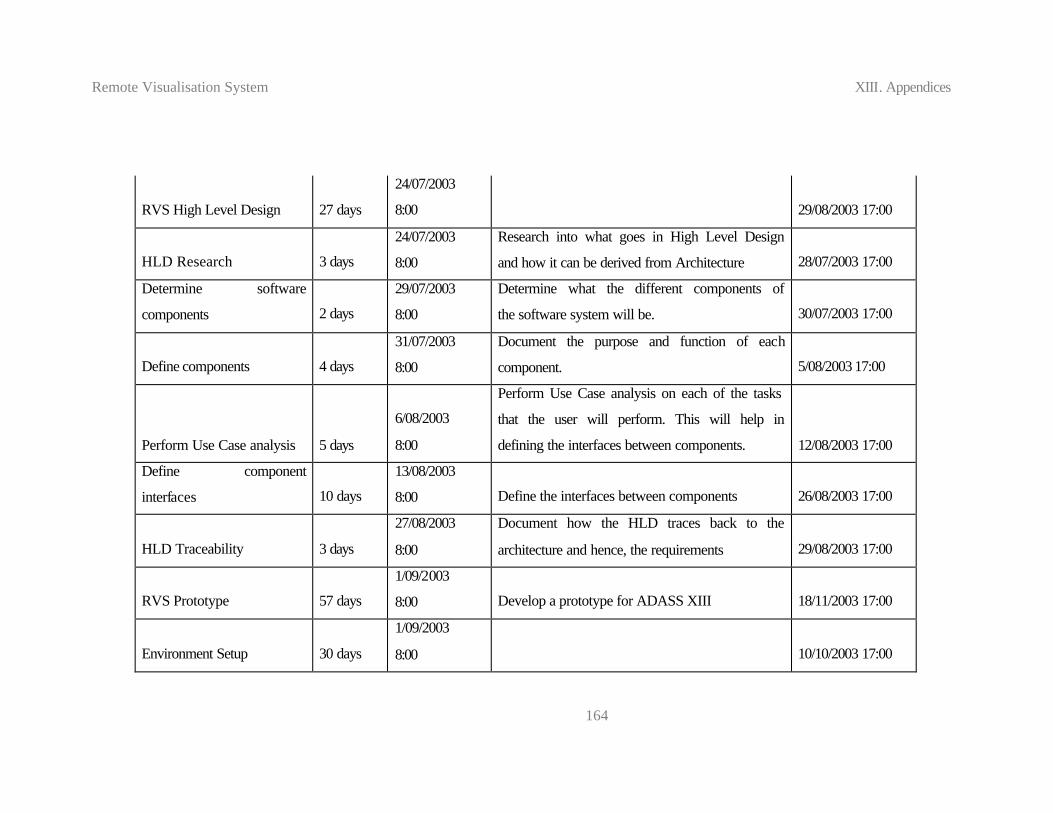
Remote Visualisation System XIII. Appendices
164
RVS High Level Design 27 days
24/07/2003
8:00 29/08/2003 17:00
HLD Research 3 days
24/07/2003
8:00
Research into what goes in High Level Design
and how it can be derived from Architecture 28/07/2003 17:00
Determine software
components 2 days
29/07/2003
8:00
Determine what the different components of
the software system will be. 30/07/2003 17:00
Define components 4 days
31/07/2003
8:00
Document the purpose and function of each
component. 5/08/2003 17:00
Perform Use Case analysis 5 days
6/08/2003
8:00
Perform Use Case analysis on each of the tasks
that the user will perform. This will help in
defining the interfaces between components. 12/08/2003 17:00
Define component
interfaces 10 days
13/08/2003
8:00 Define the interfaces between components 26/08/2003 17:00
HLD Traceability 3 days
27/08/2003
8:00
Document how the HLD traces back to the
architecture and hence, the requirements 29/08/2003 17:00
RVS Prototype 57 days
1/09/2003
8:00 Develop a prototype for ADASS XIII 18/11/2003 17:00
Environment Setup 30 days
1/09/2003
8:00 10/10/2003 17:00

Remote Visualisation System XIII. Appendices
165
Server Low Level Design 3 days
10/10/2003
13:00 Low level design of the RVS server prototype 15/10/2003 12:00
Server Implementation 11 days
16/10/2003
8:30 31/10/2003 8:30
Server Testing 2 days
31/10/2003
13:00 4/11/2003 12:00
Client Design 3 days
3/11/2003
13:00 6/11/2003 12:00
Prototype Client
Implementation 7 days
6/11/2003
8:30 17/11/2003 8:30
Client Testing 2 days
17/11/2003
8:00 18/11/2003 17:00
RVS Low Level Design 38 days
19/11/2003
8:30
Create a Low Level Design (LLD) document
that details how each component of the RVS
server will operate. 15/01/2004 8:30
LLD Research 2 days
19/11/2003
8:30
Research into what goes in a Low Level
Design Document and how it can be derived
from HLD 21/11/2003 8:30
Component Design 35 days 24/11/2003 Low Level detail of all the components of the 15/01/2004 8:30

Remote Visualisation System XIII. Appendices
166
8:30 RVS
RVS Implementation
68.94
days
4/12/2003
8:00
This task is the implementation of the RVS
Server software. 12/03/2004 16:30
Implementation Research 3 days
4/12/2003
8:00
Research on how to approach the
implementation and what resources are needed. 8/12/2003 17:00
Develop Components 66 days
8/12/2003
8:30 Develop the RVS Server Components 12/03/2004 16:30
RVS Testing
74.94
days
1/01/2004
8:30 - Units tests of each component... 15/04/2004 16:30
Unit Testing
60.76
days
1/01/2004
8:30 Test the individual RVS server components 8/04/2004 16:58
Integration Testing 5 days
8/04/2004
16:30 Test the whole system together with the client 15/04/2004 16:30
RVS Documentation 10 days
1/04/2004
16:30 Create an API doc for server developers... 15/04/2004 16:30
Client Design 2 days
12/03/2004
16:30 Design of the RVS Demo Client 16/03/2004 16:30
Client Implementation 17 days
16/03/2004
16:30 Implementation of RVS demo client 8/04/2004 16:30

Remote Visualisation System XIII. Appendices
167
Client Testing 5 days
8/04/2004
8:30
Unit testing and Integration testing of RVS
demo client 15/04/2004 8:30
Client Documentation 5 days
26/04/2004
8:30 - Create user guide for the RVS demo client 3/05/2004 8:30
Acceptance testing 4 days
15/04/2004
16:30
Use the requirements validation matrix in the
SRS to see if all requirements have been met 21/04/2004 16:30
User (Beta) testing 15 days
21/04/2004
16:30
Let the users run beta tests on the system and
report bugs 12/05/2004 16:30
Bug Resolution 15 days
21/04/2004
16:30 Resolve any bugs found during user testing 12/05/2004 16:30
Software Setup 5 days
13/05/2004
8:30 Setup software infrastructure for RVS 20/05/2004 8:30
CVS Setup 2 days
13/05/2004
8:30 Make RVS available via CVS 17/05/2004 8:30
Bugzilla Setup 3 days
17/05/2004
8:30 Setup Bugzilla as a Bug Reporting system 20/05/2004 8:30
Enhancements 3 days
20/05/2004
8:30 Make any enhancements to RVS 25/05/2004 8:30
Table XIII-9: Task List for RVS Project

Remote Visualisation System XIII. Appendices
168
Figure XIII-21: RVS Gantt Chart