Remote Sensing of water stress using the...
158
Teledetección de estrés hídrico en cultivos mediante el Indice de Reflectancia Fotoquímica (PRI) Remote Sensing of water stress using the Photochemical Reflectance Index (PRI) PhD Candidate: Lola Suárez PhD Supervisors: Pablo J. Zarco-Tejada Elías Fereres Castiel Department of Agronomy University of Córdoba (Spain) November 2009 Memoria presentada en satisfacción de los requisitos necesarios para optar al grado de doctor europeo.
Transcript of Remote Sensing of water stress using the...
Teledetección de estrés hídrico en cultivos mediante el Indice de Reflectancia
Fotoquímica (PRI)
Remote Sensing of water stress using the Photochemical Reflectance Index
(PRI)
PhD Candidate:
Lola Suárez
PhD Supervisors: Pablo J. Zarco-Tejada
Elías Fereres Castiel
Department of Agronomy University of Córdoba (Spain)
November 2009
Memoria presentada en satisfacción de los requisitos
necesarios para optar al grado de doctor europeo.


TABLE OF CONTENTS LIST OF FIGURES 1 LIST OF TABLES 6 RESUMEN 7 SUMMARY 14 AGRADECIMIENTOS 21 Chapter 1: General introduction 1.1. BACKGROUND 25 1.2. WATER-LIMITED AGRICULTURE 26 1.3. REMOTE SENSING OF WATER STRESS 26 1.4. THE PHOTOCHEMICAL REFLECTANCE INDEX (PRI) 28 1.5. AIM AND OUTLINE OF THE THESIS 31 RERERENCES 32 RESUMEN 39 ABSTRACT 40 Chapter 2: Assessing canopy PRI for water stress detection 2.1 INTRODUCTION 41 2.2. METHODS 42 2.2.1. Field and data collection 42 2.2.2 Airborne Image Acquisitions 44 2.2.3. Simulation with FLIGHT radiative transfer model 49 2.3. RESULTS 53 2.3.1. Experimental Results 53 2.3.2. Model simulation with FLIGHT 61 2.4. CONCLUSIONS 68 REFERENCES 70 RESUMEN 77 ABSTRACT 78

Chapter 3: Modeling PRI for water stress detection
3.1 INTRODUCTION 79 3.2 METHODS 80 3.2.1. Study sites 80 3.2.2. Leaf-level measurements 82 3.2.3. Airborne Imagery acquisition 84 3.2.4. Radiative transfer modelling methods for simulating non-stress PRI 86 3.3. RESULTS 91 3.3.1. PRI measurements at the leaf level 91 3.3.2. PRI measurements at the canopy level 91 3.3.3. Assessing stress with PRI through model inversion 95 3.4. CONCLUSIONS 102 REFERENCES 104 Chapter 4: Detecting water stress effects on fruit quality in
orchards with PRI RESUMEN 113 ABSTRACT 114 4.1. INTRODUCTION 115 4.2 METHODS 116 4.2.1. Study sites 116 4.2.2 Field data 117 4.2.3 Airborne Imagery 121 4.2.4 Radiative transfer modelling 123 4.3. RESULTS AND DISCUSION 125 4.4. CONCLUSIONS 139 REFERENCES 141 Chapter 5: Synthesis 5.1. INTRODUCTION 149 5.1.1 PRI as a pre-visual water-stress indicator and factors affecting the index 149 5.1.2. Methodology for water stress assessment through PRI 150 5.1.3. PRI as an indicator of final fruit quality parameters 151 5.2. APPLICABILITY IN AGRICULTURE 152 5.3. RECOMMENDATIONS FOR FURTHER RESEARCH 153

List of figures
LIST OF FIGURES Figure 1.1. Prediction of water stress for 2020s based on climatic and socio-economic changes (Alcamo et al., 2007). ............................................................................ 25 Figure 1.2. Xanthophyll molecules participating in the xanthophyll cycle. Under stress conditions, violaxanthin de-epoxidize to antheraxanthin and the latter to zeaxanthin eviting the photosystems to be damaged. The opposite happens under non-stress conditions............................................................................................................ 28 Figure 1.3. Leaf reflectance of dark adapted leaves (dotted line, first measurement) and under steady state condition (continuous line, last measurement), showing the reflectance difference associated with xanthophyll pigment cycle. ...................................................................................................................... 29
Figure 2.1. Overview of the area acquired with the AHS instrument (a). Detail of the olive orchard where the experiment was conducted (b). AHS spectra for pure vegetation, soil and mixed vegetation-soil pixels (c). Regions of interest created for single tree crowns (d). .................................................................................................... 45 Figure 2.2. Center wavelength and bandwidth for the AHS bands used to calculate the vegetation indices NDVI (B6 and B3), TCARI/OSAVI (B1, B4, B5 and B6) and PRI (B1 and B2). ............................................................................................. 47 Figure 2.3. (a) Leaf reflectance of dark adapted leaves (dotted line, first measurement) and under steady state condition (continuous line, last measurement), showing the reflectance difference associated with blue fluorescence, chlorophyll fluorescence and xanthophylls pigment cycle. Changes in the PRI region are shown (b), indicating the AHS bands used in this study..................................................................................................................................... 48 Figure 2.4. Model simulations conducted with FLIGHT for a forest canopy (a) and a crop canopy planted in regular grids (b). Input parameters for the forest canopy (a) were total LAI=1.7, fraction cover=0.8, leaf size=1.5, fraction of green leaves=0.85, fraction of bark=0, crown shape=spherical, soil roughness=0, aerosol optical thickness=0.15, solar zenith=21.36º, solar azimuth=294.44º, view zenith=0º, view azimuth=0º. Parameters for the crop canopy (b) comprised a total LAI=0.8, fraction cover=0.8, tree LAI=1, leaf size=2, fraction of green leaves=0.85, fraction of bark=0, LAD=spherical, crown shape=spherical, crown radius=1.5, tree height=4, soil roughness=0, aerosol optical thickness=0.15, solar zenith=21.36º, solar azimuth=20.94º, view zenith=0º, view azimuth=0º. ................... 50 Figure 2.5. AHS images acquired from the study site showing the corresponding simulations conducted with FLIGHT at 7:30 GMT (a, b), 9:30 GMT (c and d) and 12:30 GMT (e and f). Input parameters were the total LAI=0.39, fractional
1

cover=0.39, crown LAI=1, leaf size=1.26, fraction of green leaves=0.85, fraction of bark=0, LAD=spherical, crown shape=spherical, crown radius=1.75m, tree height=3.45m, soil roughness=0, aerosol optical thickness=0.1, view zenith=0º, view azimuth=0º, solar azimuth=160º, solar zenith=58.29º (b), 36.19º (d), 0º (f). .....................................................................................51 Figure 2.6. Relationships obtained between NDVI, TCARI/OSAVI and PRI with Tc-Ta (K) at tree level (a, b and c respectively), and block level at 7:30 GMT (d and e) and 9:30 (f). .................................................................................................54 Figure 2.7. Relationship between stomatal conductance (G) and NDVI (a), PRI (b) and TCARI/OSAVI (c) at tree scale at 9:30 GMT. At the block scale, the relationships found between conductance and PRI for different times of the day is presented in figures (d), (e) and (f) at 7:30 GMT, 9:30 GMT and 12:30 GMT respectively. .........................................................................................................................55 Figure 2.8. Relationship between stem water potential (Ψ) and PRI (a), NDVI (b) and TCARI/OSAVI (c) at block scale at 9:30 GMT. .....................................................57 Figure 2.9. Relationships between stem water potential and crown temperature at 7:30 (a) and 12:30 (b) GMT. Relationships between stem water potential and PRI at the same times (c and d). ...........................................................................................58 Figure 2.10. Relationships obtained between NDVI, PRI, and TCARI/OSAVI with steady-state fluorescence (Ft) at the tree level at 12:30 (a, b and c respectively). Relationship between Ft and Tc-Ta at the same time for individual trees. .....................................................................................................................................60 Figure 2.11. AHS spectra extracted from pure crowns at the three acquisition times (a) and spectra simulated from FLIGHT (b) for three viewing geometries. Spectra in the 500-580 nm region used to calculate PRI (c and d).......................................62 Figure 2.12. Comparison between the vegetation indices calculated from AHS imagery and the FLIGHT simulations for NDVI (a), TCARI/OSAVI (b), and PRI (c), observing trend differences between PRI for stressed and non stressed crowns (c) as compared with temperature changes for the same trees over the diurnal cycle (d). ..................................................................................................................63 Figure 2.13. Diurnal variation of Tc-Ta and PRI for stressed and non-stressed trees, enabling the identification of water stress levels over the course of the diurnal experiment................................................................................................................64 Figure 2.14. Model simulations conducted with FLIGHT for the orchard scene at different times of day from 9:30 GMT to 17:00 GMT (a to f). Input parameters were: total LAI=0.393, fractional cover=0.393, crown LAI=1, leaf size=1.26, fraction of green leaves=0.85, fraction of bark=0, LAD=spherical, crown shape=spherical, crown radius=1.75m, tree height=3.45m, soil roughness=0, aerosol optical thickness=0.1, view zenith=0º, view azimuth=0º, solar zenith=53.6º (a), 36.1º (b), 21.5º (c), 19.6º (d), 32.7º (e) and 49.9º (f), solar azimuth=92.4º (a), 109.7º (b), 143.2º (c), 205.6º (d), 245.3º (e) and 264.4º (f).
2

List of figures
PRI values corresponding to the simulations along the day are presented in (g) for pure crown pixels and aggregated pixels........................................................................ 65 Figure 2.15. Model simulations conducted with FLIGHT for the orchard scene with different soil types (a to c, spectra shown in d). Input parameters were: total LAI=0.449, fractional cover=0.449, crown LAI=1, leaf size=1.26, fraction of green leaves=0.85, fraction of bark=0, LAD=spherical, crown shape=spherical, crown radius=1.75m, tree height=3.45m, soil roughness=0, aerosol optical thickness=0.1, view zenith=0º, view azimuth=0º, solar zenith=21.36º, solar azimuth= 20.94º. The input soil spectra were acquired from the AHS imagery (spectra presented in (d)) and changed for each simulation. The effect of the different soil types (1, 2 and 3) on PRI is presented in (e) for pure crown pixels and aggregated pixels........................................................................................................... 66 Figure 2.16. Model simulations conducted with FLIGHT for the orchard scene as function of crown LAI variation. Input parameters were: total LAI=0.449 (a), 0.898 (b), 1.347 (c), 1.796 (d), 2.255 (e), fractional cover=0.449, crown LAI=1, 2, 3, 4, 5 (respectively), leaf size=1.26, fraction of green leaves=0.85, fraction of bark=0, LAD=1, crown shape=spherical, crown radius=1.75m, tree height=3.45m, soil roughness=0, aerosol optical thickness=0.15, view zenith=0º, view azimuth=0º, solar zenith=21.36º, solar azimuth= 20.94º. PRI as function of crown LAI is presented in (f) for pure crown pixels and aggregated pixels. ....................... 67
Figure 3.1. Overview of the field experiments presented in this study: (a) olive orchard and the three irrigation treatments applied: Full irrigation (R), and two regulated deficit irrigation treatments (RDI1, RDI2); (b) peach orchard with one full irrigation treatment (R) and a regulated deficit irrigation treatment (RDI); and (c) corn field with 24 different cultivars replicated three times. ................................... 81 Figure 3.2. Leaf reflectance and transmittance measurements taken with an integrated sphere corresponding to a subsample of 30 spectra measured on peach leaves (Figures 2a and b). Reflectance and transmittance corresponding to water-stressed and well-watered olive leaves (Figures 2c and d). ....................................... 83 Figure 3.3. (a) Imagery acquired with a thermal camera over the peach orchard where full irrigation (R) and deficit irrigation treatments (RDI) were applied; (b) Map of surface temperature of the experimental orchard. ................................................... 86 Figure 3.4. Spectra used for modelling inversion for the peach orchard (a) and for the olive orchard (b). Relationship between chlorophyll content (Cab) and PRI for different N values (c), and for different LAI values (d). ......................................... 89 Figure 3.5. Simulated PRI (sPRI) against airborne PRI (a), showing the PRI-sPRI differences (b). ............................................................................................................ 90 Figure 3.6. (a) Peach leaf reflectance measured in the field for a stressed and an unstressed peach leaf. (b) Leaf spectra on the two wavelengths (530 and 570 nm) used to calculate the PRI index.. (c) Leaf spectra on the PRI region and
3

inverted spectra of the stressed leaf showing the effects of chlorophyll loss on leaf spectra and the effects of xanthophylls absorption........................................................92 Figure 3.7. Average crown reflectance derived from imagery of olive trees from the RDI and R treatments (a); spectra on the PRI region (b)................................................93 Figure 3.8. Relationships obtained between crown/canopy PRI and vegetation surface temperatures derived from imagery for (a) olive trees; (b) peach trees; (c) corn, and (d) between canopy NDVI and temperature for corn. .....................................94 Figure 3.9. Comparison between mean full-irrigated crown spectrum and the inverted modelled spectrum for (a) olive, and (c) peach trees. Relationship between PRI and water potential for (c) olive trees, and (d) PRI with temperature for peach trees. The relative position of individual crown PRI as compared with the calculated PRI from the theoretical spectrum is shown. ........................96 Figure 3.10. (a) overview of the olive orchard experiment with three irrigation treatments applied; (b) crown PRI minus simulated PRI (PRI-sPRI) map of the experiment; (c) crown NDVI map........................................................................................97 Figure 3.11. Corn PRI values compared with the simulated PRI values (sPRI), calculated before irrigation for the morning (a), at midday (b), and after irrigation, in the morning (c) and at midday (d). ..................................................................98 Figure 3.12. Corn block PRI-sPRI (diamonds) and block surface temperature minus air temperature (Tc-Ta; dashes) in the morning and midday before irrigation (a and b respectively) and after irrigation (c and d)............................................100 Figure 3.13. Corn PRI minus block simulated PRI (PRI-sPRI) for the four image acquisitions before irrigation ((a) in the morning and (b) at midday), and after irrigation in the morning (c) and midday (d). .....................................................................101
Figure 4.1. Overview of the experiments conducted on peach trees (a); nectarines (b); and orange trees (c). The irrigation treatments for the peach study area consisted of fully-irrigated and three deficit irrigation treatments (RDI1, RDI2 and RDI3). The nectarine field was divided into one fully-irrigated treatment and five rows of trees under regulated deficit irrigation (RDI). In the orange tree experiment there were three different irrigation treatments: over-irrigated, control and deficit-irrigated. ...............................................................................118 Figure 4.2. Spectra from three soil types were used as input for radiative transfer modelling of vegetation scenes (a). Simulations were conducted for dark soil at 30%, 50% and 70% vegetation coverage (b, c and d, respectively). .......................124 Figure 4.3. (a) Relationship between the epoxidation state (EPS) calculated from xanthophyll pigment extraction and PRI from spectral measurements on the same leaves from a total of 12 tree crowns. Relationship between the EPS calculated from the averaged xanthophyll content of four leaves per crown and
4

List of figures
5
spectral indices extracted from imagery for the crowns: PRI index (b) and NDVI (c). ...................................................................................................................................... 126 Figure 4.4. Correlation between pre-harvest EPS in the nectarine orchard experiment and the fruit quality ratio, Total Soluble Solids/Tritatable Acidity (TSS/TA)............................................................................................................................ 127 Figure 4.5. Relationship between the ratio, Total Soluble Solids/Tritatable Acidity (TSS/TA) and: (a) crown PRI; (b) canopy T; (c) NDVI; and (d) TCARI/OSAVI extracted from imagery on the orange orchard study area. ...................... 129 Figure 4.6. Overview of the time series for the peach deficit irrigation treatments normalized by the fully-irrigated treatment values of PRI/PAR and stem water potential (SWP) from the beginning of Stage II of fruit growth until harvest. I1, I2 and I3 correspond to the dates in which RDI1, RDI2 and RDI3 treatments were re-irrigated to recover from water stress.................................................................... 131 Figure 4.7. Integral of PRI/PAR and Tc-Ta from imagery for Stages II and III of fruit growth versus the fruit quality ratio, TSS/TA for peach (a and c) and nectarine (b and d).............................................................................................................. 132 Figure 4.8. (a) The peach orchard showing four trees corresponding to four irrigation treatments: full irrigation, RDI1, RDI2 and RDI3; (b to e) zoom on selected trees showing TSS/TA values; (f to i) zoom on selected and surrounding trees showing the integral of PRI/PAR. ......................................................... 133 Figure 4.9. (a) Zoom on an image from the peach study area; (b and c) area corresponding to aggregated crown, soil and shadows; (d) high spatial resolution imagery enabling within crown separation of sunlit (yellow) and shaded vegetation (red). ................................................................................................................. 135 Figure 4.10. Relationship between the integral of PRI/PAR extracted from pure crowns and the fruit quality ratio, TSS/TA (a); relationship between the integral of PRI/PAR extracted from pure vegetation spectra vs the integral of PRI/PAR of aggregated crown, soil and shadows (b); relationship between the integral of PRI/PAR for aggregated crown, soil and shadows with TSS/TA (c)................................. 136 Figure 4.11. Pure crown PRI values extracted from radiative transfer simulation using the 3D forest light interaction model (FLIGHT) versus aggregated PRI including crown, soil and shadows for vegetation cover ranging from 100% to 10% for three backgrounds. Leaf input parameters were N = 1.6, Cab = 40 μg/cm2, Cw = 0.015, Cm = 0.015 and Cs = 0, canopy input parameters were LAD = spherical, crown LAI = 2.5, solar zenith = 23º and solar azimuth = 124º.............. 137 Figure 4.12. (a) Relationship between EPS and pure crown PRI for peach trees; (b) relationship between EPS and PRI from aggregated pixels including different backgrounds. The error bars are function of the maximum and minimum scene PRI corresponding to each EPS value................................................................................ 138

LIST OF TABLES Table 1.1. Overview of the sensors on airborne and satellite platforms used to acquire PRI information in previous studies, the spectral bands used to calculate the index and the ground spatial resolution of the imagery..................................................30 Table 2.1. Nominal values and range of parameters used for leaf and canopy modelling with PROSPECT and FLIGHT for the orchard study sites. Canopy structural parameters were used in the FLIGHT model for simulation of the canopy reflectance by radiative transfer. Leaf structural parameters, and leaf biochemical parameters were used for leaf-level simulation of reflectance and transmittance using PROSPECT. .........................................................................................52 Table 3.1. Nominal values and range of parameters used to construct the look-up tables for leaf and canopy modelling inversion with PROSPECT and FLIGHT models for the olive and peach orchard study sites. Leaf structural parameters and leaf biochemical parameters were used for leaf-level simulation of reflectance and transmittance using PROSPECT. Canopy structural parameters were used as inputs in the FLIGHT model for simulating canopy reflectance by radiative transfer..................................................................................................................................87 Table 3.2: Nominal values and range of parameters used for leaf and canopy model inversion conducted with PROSPECT and SAILH for the corn study site. ..............90 Table 4.1. Summary of each study site, harvest, and imagery acquisition dates. The treatments under RDI had a “withheld period” (no irrigation) followed by a re-watering period until their stem water potential were equal to the control. .......................119 Table 4.2. Overview of the vegetation indices used in this study and their formulation, being Rx the reflectance at x nm. ...................................................................122 Table 4.3. Coefficients of determination (r2) in the orange experiment , between indices [PRI, T, NDVI, SR and TCARI/OSAVI] and post-harvest fruit quality parameters [TSS, Total Soluble Solids; TA, Tritatable Acidity; the ratio, TSS/TA; and the median of the fruit size]. ........................................................................................128 Table 4.4. Coefficients of determination (r2) for peach and nectarine between the time series integral of indices [PRI/PAR, Tc-Ta, NDVI, SR and TCARI/OSAVI] and the fruit quality parameters [TSS, Total Soluble Solids; TA, Tritatable Acidity; the ratio, TSS/TA and the median of the fruit size]............................................................130
6

Resumen
RESUMEN Desde hace mucho tiempo se ha ido demostrando que un déficit hídrico severo afecta a los procesos fisiológicos de la vegetación y puede tener como consecuencia una disminución de la cosecha (Hsiao et al., 1976). Sin embargo, déficits hídricos moderados difíciles de detectar pueden tener también consecuencias negativas en la cosecha final (Hsiao y Bradford, 1983). Por lo tanto es importante llevar un control del nivel de estrés en una parcela completa con la ayuda de indicadores específicos. Estudios anteriores han usado índices tradicionales basados en bandas de absorción de agua y estructurales como son el PWI (Plant Water Index, Peñuelas et al., 1997) y el NDVI (Normalized Difference Vegetation Index, Rouse et al., 1974). A pesar de ello, el PWI está relacionado con el contenido de agua líquida en hoja y un índice estructural como el NDVI nos detecta estrés hídrico cuando el déficit ya es moderado y afecta a la estructura, no siendo índices pre-visuales (antes de que los efectos sean visibles). La teledetección pre-visual del estrés hídrico se ha llevado a cabo usando el infrarrojo térmico desde hace mucho tiempo. Hace 25 años se empezó a usar esta zona del espectro electromagnético (Jackson et al., 1977; 1981; Idso et al., 1978; 1981; 1982a, 1982b) porque los índices de reflectancia existentes en ese momento no eran tan sensibles al estado hídrico de la vegetación como los derivados de la temperatura de cubierta (Jackson et al., 1983). A pesar de ello, actualmente hay limitaciones técnicas que hacen la adquisición de imágenes térmicas a alta resolución espacial difícil, por lo que es crítico desarrollar metodologías para la teledetección pre-visual del estrés hídrico basadas en las regiones del visible e infrarrojo cercano. Por eso el estudio de índices basados en bandas estrechas del visible como el Indice de Reflectancia Fotoquímica (Photochemical Reflectance Index, PRI) y la fluorescencia clorofílica (Thenot et al., 2002; Dobrowsky et al., 2005; Perez-Priego et al., 2005; Suarez et al., 2008). El PRI lo propusieron Gamon et al. (1992) como indicador del estado de oxidación de las xantofilas relacionado con los procesos fotosintéticos. Se ha usado para el estudio de la eficiencia del uso de la luz, fotosíntesis y, más recientemente, para el estudio del estrés hídrico en cultivos (Thenot et al, 2002 y Winkel et al, 2002; Suárez et al., 2008; 2009). La variabilidad existente en la estructura, contenido clorofílico y contenido de materia seca en vegetación enmascara la sensibilidad del PRI al estrés, por lo que en el caso de existir tal variabilidad, el valor del índice respondería básicamente a la distribución espacial de la estructura y densidad foliar (Barton y North, 2001; Suárez et al., 2008). Por lo tanto, se necesita el uso de modelización a nivel de hoja y cubierta para permitir el uso operativo del PRI para elaborar mapas de estrés hídrico en cubiertas discontínuas donde la estructura de la vegetación ejerce la mayor influencia en la señal espectral. En esta tesis se presenta una nueva metodología para la detección de estrés hídrico en vegetación usando modelos de transferencia radiativa. La metodología ha sido validada en dos especies arbóreas: olivo y melocotonero y en un cultivo herbáceo contínuo: maíz. El método compara el valor de PRI de la vegetación con el valor teórico de PRI (sPRI) calculado por medio de modelización a partir de los parámetros fisiológicos y estructurales existentes. Se establece por tanto un umbral teórico para condiciones de ausencia de estrés que se usa como referencia para estudiar el estado hídrico de las copas individuales.
7

En estudios previos sobre el efecto del riego deficitario en la calidad final del fruto, se ha usado la integral del potencial hídrico de tallo a lo largo del periodo de crecimiento como indicador de calidad final (Myers, 1988; Moriana et al., 2007). En esta tesis se presenta una metodología similar usando el PRI obtenido de imágenes en vez del potencial hídrico como indicador de estrés para la posterior relación con parámetros de calidad en cosecha. Las zonas de estudio utilizadas están situadas en Andalucía. La primera es un olivar (Olea europaea L. cv. “Arbequino”) de cuatro hectáreas bajo riego por goteo que se plantó en 1997 en un marco de 3.7x7 m. El riego por goteo permitió la aplicación de distintas dosis dentro de la misma parcela. El diseño del experimento se hizo en un área de 6 filas de árboles donde se aplicaron tres tratamientos de riego distintos: dos deficitarios y uno regado de acuerdo a las necesidades del cultivo (usado como control) (ver Suárez et al., 2008 para una descripción completa). La segunda zona de estudio se situó en una finca comercial de melocotonero (Prunus persica cv. “BabyGold8”) plantado en 1990 con un marco de 5x3.3 m. Una subparcela de 6 líneas con 30 árboles cada una se regó de manera distinta al resto de la plantación. Los árboles que seguían el riego de la parcela comercial se empezaron a regar a mediados de mayo con una dosis equivalente al 80% de la evapotranspiración. Se diseñaron tres estrategias de riego deficitario controlado en tres bloques distintos que comenzaron a regarse en la fase III de desarrollo del fruto (fase de crecimiento exponencial). Los bloques de riego deficitario comenzaron a regarse con una dosis doble hasta que su estado hídrico (potencial hídrico de tallo) se igualó al del resto de la parcela. La tercera zona de estudio se situa cerca de Sevilla, en una parcela comercial de cítricos con una extensión de 82 hectáreas sobre un suelo de textura ligera clasificado como Rodoxeralf, con una profundidad de aproximadamente 3 m. Los árboles se plantaron en 1997 con un marco de 7x3 m orientando las filas en dirección N-S. El diseño se hizo distribuyendo aleatoriamente 18 bloques de 5x3 árboles de naranjo (Citrus sinensis L. cv. ‘Navelina’), habiendo seis repeticiones de tres tratamientos de riego distintos. Los tratamientos de riego fueron: i) Un tratamiento control, al que se aplicó el mismo riego aplicado al resto de la finca diseñado a partir de la evapotranspiración; ii) un tratamiento con una dosis de 137% de la dosis del control; y iii) un tratamiento deficitario regado al 62% del control. La cuarta zona de estudio estaba situada en un maizal en Córdoba donde había 3 repeticiones de 24 variedades sembradas en bloques de un área de 3x9 m. La plantación no se regó hasta que se tomaron las primeras imágenes el 6 de junio de 2007. El riego comenzó después y cuando el cultivo estaba perfectamente recuperado se tomaron las segundas imágenes el 2 de julio de 2007. La variabilidad genética existente entre las distintas variedades generó un gradiente en el estado fenológico en el que se encontraba cada bloque, y, consecuentemente, había una alta variabilidad de índice de área foliar. De manera simultánea a la toma de imágenes se hicieron medidas en campo de conductancia estomática (G) y potencial hídrico de tallo con un porómetro model SC-1, Decagon Devices, Washington, DC, USA) y una bomba de presión Scholander (PWSC Model 3000, Soil Moisture Equipment Corp., California) respectivamente. Al mismo tiempo, se tomaron muestras de reflectancia foliar con un espectrómetro de campo ASD Field Spectrometer (FieldSpec Handheld Pro, ASD Inc., CO, USA) al que se acopló una pinza foliar. En las zonas de estudio de naranjo y melocotonero (para las variedades de lanelate, babygold8 y sweetlady) se escogió una submuestra de árboles a los que se hizo un
8

Resumen
seguimiento durante el periodo de crecimiento del fruto y se recolectaron independientemente. Se midió el calibre y pesaron todos los frutos recogidos de esos árboles. Posteriormente, ocho frutos de cada árbol se utilizaron para medir el contenido de sólidos solubles (TSS) y la acidez (TA), usados para calcular el ratio TSS/TA, considerado uno de los indicadores más importantes de calidad del fruto. Se realizaron 2 campañas de toma de imágenes en colaboración con el Instituto Nacional de Técnicas Aeroespaciales (INTA) usando el sensor Airborne Hyperspectral Scanner (AHS, Sensytech Inc., Argon St. Inc., USA) sobre la primera zona de estudio. Se adquirieron un total de seis imágenes que correspondían a tres horas de vuelo distintas (7:30, 9:30 y 12:30 GMT) en dos años consecutivos (25 julio 2004 y 16 julio 2005). Se voló a una altura de 1000 m sobre el terreno tomando las imágenes con un ángulo de vision de 90º y un ángulo instantaneo de visión de 2.5 mrad, dando como resultado una resolución espacial de 2 m. En la campaña de 2004, se obtuvieron imágenes con 38 bandas de las zonas espectrales 0.430-1.550 μm y 8.20-12.70 μm. La corrección atmosférica y calibración radiométrica se hicieron con el procedimiento de Sobrino et al. (2006). En los veranos de 2007 y 2008, se sobrevolaron todas las zonas de estudio con una cámara multiespectral (MCA-6, Tetracam, Inc., California, USA) a bordo de un vehículo aéreo no tripulado (UAV) volando a 150 metros sobre la superficie (Berni et al., 2009). Las características de la cámara e imágenes, así como las calibraciones hechas se pueden encontrar en Berni et al. (2009) y Suárez et al. (2009). Con las imágenes multiespectrales de seis bandas centradas en las longitudes de onda 530, 550, 570, 670, 700 y 800 nm se calculó el índice PRI (Gamon et al., 1992). La cámara térmica instalada sobre el UAV fue una Thermovision A40M (FLIR, USA), sus características y calibración se pueden encontrar en Berni et al. (2009). Se llevo a cabo un estudio de simulación usando los modelos de transferencia radiativa PROSPECT a nivel de hoja (Jacquemoud and Baret, 1990) unido al modelo tridimensional FLIGHT a nivel de cultivo (North, 1996) para dos cultivos (olivo y melocotonero) y PROSPECT unido a SAILH para maíz. El modelo FLIGHT se usó primero para simular escenas complejas de cubiertas discontínuas para estudiar los efectos bidireccionales de los índices de banda estrecha como PRI. Posteriormente PROSPECT-FLIGHT se usó para generar tablas de inversión específicas para cada cultivo y condiciones de adquisición de imágenes. La metodología aplicada consiste en la extracción del espectro medio correspondiente a la parcela y su inversión con las tablas generadas para un amplio rango de contenido clorofílico (Cab) e índice de área foliar (LAI). Las inversiones se llevaron a cabo fijando el resto de parámetros de entrada a los modelos: N (parámetro estructural de la hoja), Cm (materia seca foliar), y Cw (contenido hídrico foliar) obtenidos de bibliografía (Kempeneers et al., 2007 para melocotonero; Zarco-Tejada et al, 2004 para olivo). Para la zona de estudio del maíz, los parámetros N y Cab a escala de hoja y LAI a escala de cultivo se dejaron libres mientras que los demás parámetros se fijaron con valores de bibliografía para maíz (Haboudane et al., 2004). Se extrajeron los espectros de cada uno de los 72 bloques en el experimento y se invirtieron individualmente. El PRI proveniente de la inversión para cada cultivo (sPRI) se comparó con el PRI extraído de cada copa / bloque en las imágenes. Además, se estudió la relación del PRI con los
9

parámetros relacionados con estrés hídrico que se midieron en campo durante la adquisición de las imágenes (temperatura de cubierta, potencial hídrico de tallo y conductancia estomática). La diferencia entre el PRI de cada bloque con el sPRI se estudió antes y después del riego a dos horas distintas (por la mañana y al mediodía) para comprobar la capacidad de aplicación de la metodología a distintas horas. El estudio de la calidad final del fruto en la parcela de melocotonero, donde el experimento consistía en la aplicación de riego deficitario controlado y, por lo tanto, el riego deficitario no se aplicó de manera constante, se hizo caracterizando el “historial hídrico” de cada árbol individual. Para ello se extrajo PRI de cada copa a partir de las 10 imágenes adquiridas durante el periodo de crecimiento del fruto y se normalizó dividiendo por la radiación PAR correspondiente. La integral de PRI/PAR hecha para todo el periodo de crecimiento del fruto se comparó con los parámetros de calidad medidos en cosecha. Para el caso del naranjo, donde el riego deficitario aplicado era constante, se hizo lo mismo usando una sola imagen adquirida el 16 de septiembre. Los coeficientes de determinación obtenidos entre PRI y parámetros relacionados con estrés medidos en campo como son el potencial hídrico de tallo, temperatura y conductancia estomática antes de que la vegetación sufriera cambios estructurales debidos al estrés demuestran que el PRI es un indicador de pre-visual de estrés hídrico. Sin embargo, el estudio de simulación llevado a cabo con modelos de transferencia radiativa a dos resoluciones espaciales distintas muestra la sensibilidad del índice al tipo de suelo, geometría solar e índice de área foliar. Una vez demostrada dicha sensibilidad, se ve necesario el uso de modelización para separar la respuesta del índice a estrés de la respuesta a dichos factores. Tras aplicar la metodología propuesta mediante el uso de modelización, de manera consistente, los árboles / bloques cuyo estado hídrico era deficitario mostraron valores de PRI superiores al teórico simulado (sPRI). Este método permite una detección de estrés operativa a escala de parcela usando modelización para acometer la variabilidad espacial de la clorofila e índice de área foliar (LAI) y sus efectos en el PRI. Se obtuvieron mapas de variabilidad de LAI a través del índice de vegetación normalizado NDVI. Los mapas de LAI, al contrario que la metodología propuesta, no mostraron diferencias de masa foliar en función del estrés hídrico. Estos resultados demuestran que la modelización de un índice de vegetación que responde a procesos fisiológicos, como es el PRI, es mejor indicador de estrés hídrico que un índice estructural como NDVI que muestra únicamente diferencias de masa foliar. En el experimento en naranjo, PRI mostró mejores relaciones con parámetros de calidad en cosecha que el resto de índices (estructurales, relacionados con clorofila y temperatura). La temperatura, a pesar de ser un indicador de estrés hídrico reconocido, no mostró relación con ninguno de los parámetros excepto con calibre de fruto (r2=0.47). Este hecho es consistente con las medidas de potencial hídrico, ya que no indicaban diferencias significativas de estado hídrico entre tratamientos de riego, por lo que las diferencias de temperatura entre los dos tratamientos principales eran difícilmente detectables. En el experimento en melocotonero, la variación temporal de riego en los distintos tratamientos hizo necesario el uso de la serie temporal completa ya que una medida puntual
10

Resumen
no era indicativa de la respuesta en la calidad del fruto. El parámetro TSS/TA mostró una correlación lineal con la integral de PRI/PAR calculada para todo el periodo de crecimiento del fruto para melocotón (r2=0.72) y nectarina (r2=0.61). Por el contrario, las relaciones obtenidas usando la integral de temperatura de copa menos temperatura del aire (Tc-Ta) no fueron buenas (r2=0.21 para melocotón y r2=0.25 para nectarina). Una posible explicación a estos resultados son los cambios en el reparto de carbono como respuesta a déficits ligeros de agua. En estudios anteriores se ha demostrado que el riego deficitario altera el reparto de carbono en la planta, anteponiendo los frutos como sumideros (Fereres y Soriano, 2007). Los déficits de agua ligeros que casi no afectan a la transpiración (y por lo tanto a Tc-Ta), pueden tener efectos sobre el metabolismo del carbono que se ven reflejados en la respuesta fotosintética y por lo tanto son detectados con el PRI. La ausencia de relación de PRI con parámetros de calidad cuando se agrega la respuesta espectral de vegetación, suelo y sombras en el caso de tener imágenes con resolución espacial más baja, sugiere que la relación entre PRI y EPS se pierde cuando el PRI no se obtiene de vegetación pura. De hecho, la relación entre la integral de PRI para resolución espacial baja presenta un coeficiente de determinación de 0.25 frente a 0.72 obtenido usando pixeles de vegetación pura. Como conclusión, los resultados presentados en esta tesis demuestran que PRI es un buen indicador pre-visual de estrés hídrico. Sin embargo el uso de modelización es necesario para evitar que factores como el contenido clorofílico o el índice de área foliar enmascaren la sensibilidad del índice al estrés. La metodología que se presenta para detección de estrés a nivel de copa / bloque usando modelos de transferencia radiativa se ha validado en dos cultivos arbóreos (olivo y melocotonero) y uno herbáceo (maíz). Además, se ha demostrado que PRI/PAR obtenido de imágenes nos da indicios de la distribución de la calidad del fruto por su relación con el riego a lo largo del periodo de crecimiento. Estas metodologías aplicables en el campo de la agricultura de precisión supondrían una optimización de la cosecha para maximizar los beneficios de los agricultores basándose en segmentaciones de la parcela de acuerdo a parámetros de calidad. BIBLIOGRAFÍA Barton, C.V.M. & North, P.R.J. (2001). Remote Sensing of canopy light use efficiency
using the photochemical reflectance index. Model and analysis. Remote Sens Environ, 78, 264, 273.
Berni, J.A.J., Zarco-Tejada, P.J., Suarez, L., Fereres, E. Thermal and Narrow-band Multispectral Remote Sensing for Vegetation Monitoring from an Unmanned Aerial Vehicle. (2009). IEEE T Geosci Remote, 47, (3), 722-738.
Dobrowsky, S.Z., Pushnik, J.C., Zarco-Tejada, P.J. and Ustin, S.L. (2005). Simple reflectance indices track heat and water stress-induced changes in steady-state chlorophyll fluorescence at the canopy scale. Remote Sensing of Environment, 97, 403-414.
Gamon, J.A., Peñuelas, J. & Field, C.B. (1992). A narrow-wave band spectral index that track diurnal changes in photosynthetic efficiency. Remote Sens Environ 41, 35-44.
11

Haboudane, D., Miller, J.R., Tremblay, N., Zarco-Tejada, P.J. & Dextraze, L. (2002). Integrated narrow-band vegetation indices for prediction of crop chlorophyll content for application to precision agriculture. Remote Sens Environ 84 (2-3), 416-426.
Hsiao, T.C., Fereres, E., Acevedo, E., Henderson, D.W. Water stress and dynamics of growth and yield of crops. Water and Plant life: Problems and modern approaches, 1976, Springer.
Hsiao TC, Bradford KJ. 1983. Physiological consequences of cellular water deficits. In: Taylor HM, Jordan WR, Sinclair TR, eds. Limitations to efficient water use in crop production. Madison, WI: ASA, CSSA, SSSA, 227–265.
Idso, S.B., Jackson, R.D. and Reginato, R.J. (1978), Extending the “degree day” concept of phenomenological development to include water stress effects. Ecology 59, 431-433.
Idso, S.B., Jackson, R.D., Pinter, P.J., Reginato, R.J. and Hatfield, J.L. (1981). Normalizing the stress-degree-day parameter for environmental variability. Agricultural and Forest Meteorology, 24, 45-55.
Idso, S.B. (1982a). Humidity measurement by Infrared Thermometry. (1982). Remote Sensing of Environment, 12, 87-91.
Idso, S.B. (1982b). Non-water-stressed baselines: A key to measuring and interpreting plant water stress. Agricultural Meteorology, 27, 59-70.
Jackson R.D., Idso, S.B., Reginato R.J. and Ehrier, W.L. (1977). Crop temperature reveals stress. Crop Soils 29, 10-13.
Jackson, R.D., Idso, S.B., Reginato, R.J. and Pinter, P.J. Jr. (1981). Canopy temperature as a crop water stress indicator. Water Resources Research, 17, 1133-1138.
Jackson, R.D., Slater, P.N. and Pinter, P.J. Jr. (1983). Discrimination of growth and water stress in wheat by various vegetation indices through clear and turbid atmospheres. Remote Sensing of Environment 13, 187-208.
Jacquemoud S. and Baret F. (1990), PROSPECT: a model of leaf optical properties spectra, Remote Sens Environ. 34:75-91.
Kempeneers, P., P.J. Zarco-Tejada, P.R.J. North, S. De Backer, S. Delalieux , G. Sepulcre-Cantó, F. Morales, J.A.N. Van Aardt, R. Sagardoy, P. Coppin, P. Scheunders, Model inversion robustness under changing viewing conditions for chlorophyll estimation from hyperspectral imagery. Int J Remote Sens (in press, April 2007).
Myers, B.J. (1988). Water stress integral-a link between short-term stress and long-term growth. Tree Physiology (4), 315-323.
Mo, X., Liu, S., Lin, Z., & Zhao, W. (2004). Simulating temporal and spatial variation of evapotranspiration over the Lushi basin. Journal of Hydrology, 285, 125–142.
North, P.R.J. (1996). Three-dimensional forest light interaction model using a montecarlo method. IEEE T Geosci Remote 34 (5), 946-956.
Peñuelas J., Piñol J., Ogaya R., Filella I. (1997). Estimation of plant water concentration by the reflectance Water Index WI (R900/R970). International Journal of Remote Sensing 18: 2869–2875.
Pérez-Priego, O., Zarco-Tejada, P.J., Sepulcre-Cantó, G, Miller, J.R., and Fereres, E. (2005). Detection of Water Stress in Orchard Trees with a High-Resolution Spectrometer through Chlorophyll Fluorescence in-filling of the O2-A band, IEEE Transactions on Geoscience and Remote Sensing, 43, 2860-2869.
12

Resumen
13
Rouse, J.W., Haas, R.H., Schell, J.A., Deering, D.W. & Harlan, J.C. (1974). Monitoring the vernal advancements and retrogradation of natural vegetation in Nasa/Gsfc Final Report (ed. MD, U.G.) p. 371.
Sobrino, J.A., Jiménez-Muñoz, J.C., Zarco-Tejada, P.J., Sepulcre-Cantó, G. and de Miguel, E. (2006). Land Surface Temperature derived from Airborne Hyperspectral Scanner Thermal Infrared data. Remote Sens Environ, 102, 99–115.
Suárez, L., Zarco-Tejada, P. J., Sepulcre-Cantó, G., Pérez-Priego, O., Miller, J.R., Jiménez-Muñoz, J.C., Sobrino, J. (2008). Assessing Canopy PRI For Water Stress Detection With Diurnal Airborne Imagery. Remote Sens Environ, 112, 560-575.
Suárez, L., Zarco-Tejada, P.J., Berni, J.A.J., González-Dugo, V., Fereres, E., (2009) Modelling PRI for Water Stress Detection using Radiative Transfer Models, Remote Sens Environ 113 730-744.
Thenot, F., Méthy, M. & Winkel, T. (2002). The Photochemical Reflectance Index (PRI) as a water-stress index. Int J Remote Sens, 23(23), 5135-5139.
Winkel, T., Méthy, M. & Thénot, F. (2002). Radiation use efficiency, chlorophyll fluorescence , and reflectance indices associated with ontogenic changes in water-limited Chenopodium quinoa leaves. Photosynthetica, 40(2), 227-232.
Zarco-Tejada, P. J., Rueda, C. A., & Ustin, S. L. (2003). Water content estimation in vegetation with MODIS reflectance data and model inversion models. Remote Sensing of Environment, 85, 109–124.
Zarco-Tejada, P.J., Miller J.R., Morales A., Berjón A., & Agüera J. (2004) Hyperspectral Indices and Model Simulation for Chlorophyll Estimation in Open-Canopy Tree Crops, Remote Sens Environ, 90(4), 463-476.

SUMMARY It is well known that severe water deficits affect many physiological processes and have a strong impact on yield (Hsiao et al., 1976). However, even moderate water deficits, which are not easy to detect, can also have important negative effects on yield (Hsiao and Bradford, 1983). It is important to spatially monitor the level of stress through some pertinent remote sensing indicators. Previous studies (Mo et al., 2004; Zarco-Tejada et al., 2003) have used traditional indices to assess leaf water content and water stress using the plant water index (PWI, Peñuelas et al., 1997) and the normalized difference vegetation index (NDVI, Rouse et al., 1974). Nevertheless, PWI is related with water content in the leaf and a structural index such as NDVI gives information on water stress when the deficit has already affected vegetation structure, not being a pre-visual water stress indicator. The pre-visual detection of water stress has been successfully achieved with remote sensing data using thermal infrared radiation since long ago. Twenty-five years ago, thermal information was chosen for the remote sensing of water stress in crops (Jackson et al., 1977; 1981; Idso et al., 1978; 1981; 1982a, 1982b) because the spectral vegetation indices that existed at that time were not nearly as sensitive to water deficits as those derived from canopy temperature (Jackson et al., 1983). Nevertheless, there are current technical limitations for acquiring high-spatial resolution thermal imagery which emphasizes the need for developing pre-visual water stress indicators in the VIS/NIR region for agricultural and precision farming methods. Thus, attention must be placed on VIS/NIR narrow-band indicators of pre-visual stress, such as the Photochemical Reflectance Index (PRI), as well as chlorophyll fluorescence for stress-detection methods (Thenot et al., 2002; Dobrowsky et al., 2005; Perez-Priego et al., 2005; Suarez et al., 2008). The PRI was proposed by Gamon et al. (1992) as an indicator of the de-epoxidation state of the xanthophyll pigments related with photosynthetic processes. It has been used to assess light use efficiency, photosynthesis, and more recently, water stress in crops (Thenot et al, 2002 y Winkel et al, 2002; Suárez et al., 2008; 2009). Canopies with variable structure, chlorophyll content and dry matter affect the sensitivity of PRI to stress, which in such case would mostly track the spatial variation of the canopy leaf area density and structure (Barton and North, 2001; Suárez et al., 2008). Consequently, modelling work at leaf and canopy scales is needed to enable an operational use of PRI to map water stress in non-homogeneous canopies where structural variation play the main role in the reflectance signature. A new modelling method is presented in this thesis based on radiative transfer simulation to estimate a theoretical PRI baseline for non-stress conditions. The methodology has been tested in two tree species: olive and peach and in an herbaceous continuous species: maize. The method compares canopy-level imaged PRI with theoretical non-stress PRI obtained through model inversion for existing structural and background conditions, defining a within field threshold to detect stressed vegetation. As part of the research of regulated deficit irrigation effect on fruit quality parameters, some authors demonstrated that stem water potential (SWP) time series measured along the fruit growing season would potentially indicate fruit quality (Myers, 1988). In this study, similar approach is undertaken using PRI instead of SWP as water stress indicator to assess fruit quality using a time series of imagery acquired over the fruit growing period.
14

Summary
The study sites used in this study are located in Andalusia (Spain). The first study site is an irrigated 4 ha-orchard established in 1997 with olive trees (Olea europaea L. cv. “Arbequino”) in a 3.5x7 m grid. Drip irrigation permitted the use of different water treatment amounts within the same field. The experiment was designed in an area of six rows with three different water treatments: 2 deficit-irrigation treatments and one block of full-irrigated trees used as control (see Suárez et al. (2008) for a full description). The second study site was within a commercial peach orchard (Prunus persica cv. “BabyGold8”) planted in 1990 in a 5x3.3 m grid. A subset of 6 lines x 30 peach trees each were irrigated differently than the rest of the orchard. The non-stressed trees were drip irrigated starting in mid May with an application rate equivalent to 80% of calculated crop ET. Three different deficit irrigation treatments were applied starting irrigation at Stage III of fruit development (rapid growth stage) and over-irrigating afterwards until tree water status (by means of stem water potential, SWP) was fully recovered. A third tree orchard site was located near Seville, Southern Spain (37ºN, 5.7ºO), on an 82 ha commercial citrus orchard. The light-textured soil is classified as Rodoxeralf, with an approximate depth of 3 m. The trees were planted in 1997 in a 7x3 m pattern on a N-S orientation. The experiment was a randomized block design with six replications, each individual plot composed of five rows of three orange trees (Citrus sinensis L. cv. ‘Navelina’). Three different drip irrigation treatments were applied:, i) the control, that followed the orchard schedule which is designed to meet ET requirements for maximum production; ii) an over-irrigated treatment that applied 137% of control; and iii) a DI treatment that applied 62% of control. Finally, a fourth study site consisted on a maize field that had 24 varieties replicated three times, yielding a total of 72 plots of 3 m x 9 m area, was used. Irrigation had not been applied prior to image acquisition on 6th of June 2007. Afterwards, irrigation was applied and by the 2nd of July when a second airborne image was acquired, the crop had recovered from water stress. The genetic variability of the different maize cultivars generated a gradient in their phenological stages of development, and consequently, there was variability in LAI values between the different plots. In the field, stomatal conductance (G) and stem water potential (Ψ) were measured with a leaf steady-state porometer (model SC-1, Decagon Devices, Washington, DC, USA) and a Scholander pressure bomb (PWSC Model 3000, Soil Moisture Equipment Corp., California) respectively. Leaf reflectance measurements were also conducted in the study sites at the time of the flights with an ASD Field Spectrometer (FieldSpec Handheld Pro, ASD Inc., CO, USA) with a leaf clip probe. In the peach tree and orange tree orchards, a subset of trees were monitored during the fruit growing period and harvested independently. All the fruits of the trees of these subsets were weighted and their diameters measured. Later, 8 fruits per tree were selected for a physiochemical and organoleptic characterization: Total Soluble Solids (TSS) and Total Acidity (TA) used to calculate the ratio (TSS/TA), which is considered the best indicator of fruit taste. Two airborne campaigns were conducted in collaboration with the Spanish Aerospace Institute (INTA) using the Airborne Hyperspectral Scanner (AHS) developed by Sensytech Inc. (Argon St. Inc., USA) over the first experimental field to acquire six images corresponding to three flight times (7:30, 9:30 and 12:30 GMT) on two consecutive years (25th July 2004 and 16th July 2005). The flight height was set to 1000 m above ground level,
15

acquiring imagery with a 90º field of view (FOV) and 2.5 mrad instantaneous FOV, produced a spatial resolution of 2 m. In the 2004 campaign, imagery was collected at 38 bands over the 0.430-1.550 μm and 8.20-12.70 μm spectral regions. In the 2005 campaign, 80 bands were available in the 0.430-2.49 μm and 8.20-12.70 μm ranges. Atmospheric correction and radiometric calibrations were applied as can be found in Sobrino et al. (2006). In the summers of 2007 and 2008, a 6-band multispectral camera (MCA-6, Tetracam, Inc., California, USA) onboard an Unmanned Aerial Vehicle (UAV) flying at 150 m above ground level (Berni et al, 2009) was used to acquire imagery from all the study sites. The characteristics of the camera and images acquired as long as the calibration procedures applied can be found in Berni et al. (2009) and Suárez et al. (2009). The bandsets used in each of the study sites comprised bands centered at 530, 550, 570, 670, 700 and 800 nm used to calculate the PRI (Gamon et al., 1992). The thermal camera installed on board the airborne platform was the Thermovision A40M (FLIR, USA). The camera, imagery characteristics, and calibration methods can be found in Berni et al. (2009). Radiative transfer simulations were conducted with PROSPECT (Jacquemoud and Baret, 1990) linked to the 3D radiative transfer FLIGHT model (North, 1996) for two crops (olive and peach trees) and PROSPECT linked to SAILH for maize. The FLIGHT model was first used in this study to simulate complex canopy scenes to understand the directional effects on narrow-band indices such as PRI. Then, PROSPECT-FLIGHT model was used to generate look-up tables independently for each crop and imagery conditions. The method consisted on targeting pure crowns under non-water-deficit conditions, and inverting the coupled leaf-canopy models for Cab and LAI. Model inversion was conducted fixing N (structural parameter), Cm (dry matter) and Cw (water content) values from the literature (Kempeneers et al., 2007 for peach trees; Zarco-Tejada et al, 2004 for olive trees). Cab and LAI were allowed to vary in the leaf- and canopy-level model inversion step, respectively. The rest of parameters were kept fixed, characterizing each crop field with inputs to represent the architecture of the orchard. For the corn study site, the parameters N and Cab at leaf level, and LAI at canopy level were inverted. The rest of the inputs were fixed to values and ranges found in literature for corn (Haboudane et al., 2004). Spectra were extracted from images acquired over the corn field for each of the 72 variety blocks. Block spectra were used as input for the model inversion, accounting for large within-field LAI differences found in the variety-trial study. Simulated PRI obtained by model inversion for each crop field (sPRI) was compared with PRI extracted from the canopy reflectance for each pure crown / block. In addition, simulated PRI and image-extracted PRI from each orchard tree / corn block were compared against crown temperature and water potential measurements acquired at the time of each flight. The difference PRI-sPRI and the temperature for each corn block were assessed before and after irrigation for morning and afternoon flights, assessing the stress detection capabilities of the proposed methodology. To assess final fruit quality parameters in the peach tree orchard, where the deficit irrigation applied was regulated and not constant, the characterization of each tree water stress history along the fruit growing period was needed. Individual crown PRI values extracted from the
16

Summary
10 images acquired over the fruit growing period were normalized with the instantaneous irradiance (E) for peach and nectarine fruits. The integral of PRI/E along the fruit growing period was calculated for each individual crown and compared with fruit quality parameters after harvesting at crown scale following the approach of previous authors (Myers, 1988; Moriana et al., 2007). In the orange tree orchard, where sustained deficit irrigation was applied with constant irrigation rates, crown PRI values where extracted from one image acquired the 16th of September. High determination coefficients between PRI and crown temperature, stem water potential and stomatal conductance were obtained before structural effects of water stress appeared, demonstrating PRI is a pre-visual water stress indicator. Nevertheless, the simulation work and the study of both resolutions: high (by means of individual crowns) and medium (by means of the mixture crown-soil-shadows) demonstrate the influence of the type of soil, sun angle and leaf area index on PRI. Once the influence of external parameters on PRI was demonstrated, a methodology based on radiative transfer modelling is undertaken to separate the effects of such parameters and water stress on the spectral signal. After applying the developed methodology, consistently, deficit trees / blocks showed higher PRI values than the simulated non-stress PRI values derived from model inversion. This method enables an operational detection of stressed trees using the modelling approach to account for LAI and chlorophyll content effects on modelled PRI index values. The spatial variability of canopy leaf area index through the normalized difference vegetation index (NDVI) was assessed. The NDVI map, on the contrary, did not detect water stress levels as well as the PRI-sPRI indicator did. These results demonstrate that a physiological index such as PRI, when modelled to account for leaf and canopy inputs N, Cab and LAI, was superior to NDVI to detect within-field water stress variability. In the orange tree orchard, PRI showed the highest correlation with TA and TSS/TA, which are considered important indicators of fruit quality. On the contrary, crown temperature was not associated with any of the quality parameters, with one exception (fruit size; r2=0.47). This is consistent with the stem water potential measurements, which indicated no significant differences between the deficit irrigation treatment and the control. Consequently, crown temperature differences between the two treatments were hardly detectable. In the peach experiment, the variation in irrigation regimes with time indicated that a single measurement of PRI could not glean stress history. Therefore, it was necessary to use a time series of data acquired during fruit growth to accurately describe the different treatments. The correlation of TSS/TA with the integral of PRI/PAR calculated for every single crown using a set of 10 images taken in different days yielded linear relationships of r2=0.72 for the peach tree experiment, and r2=0.61 for the nectarine orchard. By contrast, relationships between the integral of Tc-Ta with TSS/TA, yielded much lower linear relationships for peach (r2=0.21) and nectarines (r2=0.25). A possible explanation for the difference in behaviour between PRI and Tc-Ta lies in the changes in carbon partitioning in response to mild water deficits. It has been shown that deficit irrigation alters the distribution of carbon, increasing the allocation to fruits (Fereres and Soriano, 2007). Mild water deficits that hardly would affect transpiration (and hence
17

Tc-Ta) may have some effects on carbon metabolism that are reflected in the light reactions of photosynthesis and are detected by PRI measurements. The lack of relationship when scene components are aggregated in a mixed pixel suggests that the PRI vs. EPS relationship is lost when pure sunlit crowns are not selected. In fact, the relationship of the integral of “low-spatial resolution” PRI with TSS/TA yielded a coefficient of determination of 0.25, versus the r2=0.72 when using high-spatial resolution PRI. Results demonstrated that PRI is a good indicator of crops water stress. Nevertheless the effect of external parameters such as soil type, sun angle and leaf area index, require the use of radiative transfer modelling to assess water stress using PRI. The methodology presented for the assessment of water stress at crown / block scale using PRI and RTM have been validated in two tree species: olive and peach and a herbaceous continuous species:maize. The results show that PRI can be used as a water stress indicator, being able to characterized trees under water stress with the use of RTM. Moreover, the image-based crown PRI/E was demonstrated to yield insights into the final fruit quality parameters due to its relationship with water stress levels. The practical implications of this approach to optimize harvest operations and maximize revenues in horticultural crops based on field segmentation as a function of fruit quality may be substantial. REFERENCES Barton, C.V.M. & North, P.R.J. (2001). Remote Sensing of canopy light use efficiency
using the photochemical reflectance index. Model and analysis. Remote Sens Environ, 78, 264, 273.
Berni, J.A.J., Zarco-Tejada, P.J., Suarez, L., Fereres, E. Thermal and Narrow-band Multispectral Remote Sensing for Vegetation Monitoring from an Unmanned Aerial Vehicle. IEEE T Geosci Remote, 47, (3), 722-738.
Dobrowsky, S.Z., Pushnik, J.C., Zarco-Tejada, P.J. and Ustin, S.L. (2005). Simple reflectance indices track heat and water stress-induced changes in steady-state chlorophyll fluorescence at the canopy scale. Remote Sensing of Environment, 97, 403-414.
Gamon, J.A., Peñuelas, J. & Field, C.B. (1992). A narrow-wave band spectral index that track diurnal changes in photosynthetic efficiency. Remote Sens Environ 41, 35-44.
Haboudane, D., Miller, J.R., Tremblay, N., Zarco-Tejada, P.J. & Dextraze, L. (2002). Integrated narrow-band vegetation indices for prediction of crop chlorophyll content for application to precision agriculture. Remote Sens Environ 84 (2-3), 416-426.
Hsiao, T.C., Fereres, E., Acevedo, E., Henderson, D.W. Water stress and dynamics of growth and yield of crops. Water and Plant life: Problems and modern approaches, 1976, Springer.
Hsiao TC and Bradford KJ. 1983. Physiological consequences of cellular water deficits. In: Taylor HM, Jordan WR, Sinclair TR, eds. Limitations to efficient water use in crop production. Madison, WI: ASA, CSSA, SSSA, 227–265.
18

Summary
Idso, S.B., Jackson, R.D. and Reginato, R.J. (1978), Extending the “degree day” concept of phenomenological development to include water stress effects. Ecology 59, 431-433.
Idso, S.B., Jackson, R.D., Pinter, P.J., Reginato, R.J. and Hatfield, J.L. (1981). Normalizing the stress-degree-day parameter for environmental variability. Agricultural and Forest Meteorology, 24, 45-55.
Idso, S.B. (1982a). Humidity measurement by Infrared Thermometry. (1982). Remote Sensing of Environment, 12, 87-91.
Idso, S.B. (1982b). Non-water-stressed baselines: A key to measuring and interpreting plant water stress. Agricultural Meteorology, 27, 59-70.
Jackson R.D., Idso, S.B., Reginato R.J. and Ehrier, W.L. (1977). Crop temperature reveals stress. Crop Soils 29, 10-13.
Jackson, R.D., Idso, S.B., Reginato, R.J. and Pinter, P.J. Jr. (1981). Canopy temperature as a crop water stress indicator. Water Resources Research, 17, 1133-1138.
Jackson, R.D., Slater, P.N. and Pinter, P.J. Jr. (1983). Discrimination of growth and water stress in wheat by various vegetation indices through clear and turbid atmospheres. Remote Sensing of Environment 13, 187-208.
Jacquemoud S. and Baret F. (1990), PROSPECT: a model of leaf optical properties spectra, Remote Sens Environ. 34:75-91.
Kempeneers, P., P.J. Zarco-Tejada, P.R.J. North, S. De Backer, S. Delalieux , G. Sepulcre-Cantó, F. Morales, J.A.N. Van Aardt, R. Sagardoy, P. Coppin, P. Scheunders, Model inversion robustness under changing viewing conditions for chlorophyll estimation from hyperspectral imagery. Int J Remote Sens (in press, April 2007).
Myers, B.J. (1988). Water stress integral-a link between short-term stress and long-term growth. Tree Physiology (4), 315-323.
Mo, X., Liu, S., Lin, Z., & Zhao, W. (2004). Simulating temporal and spatial variation of evapotranspiration over the Lushi basin. Journal of Hydrology, 285, 125–142.
North, P.R.J. (1996). Three-dimensional forest light interaction model using a montecarlo method. IEEE T Geosci Remote 34 (5), 946-956.
Peñuelas J., Piñol J., Ogaya R., Filella I. (1997). Estimation of plant water concentration by the reflectance Water Index WI (R900/R970). International Journal of Remote Sensing 18: 2869–2875.
Pérez-Priego, O., Zarco-Tejada, P.J., Sepulcre-Cantó, G, Miller, J.R., and Fereres, E. (2005). Detection of Water Stress in Orchard Trees with a High-Resolution Spectrometer through Chlorophyll Fluorescence in-filling of the O2-A band, IEEE Transactions on Geoscience and Remote Sensing, 43, 2860-2869.
Rouse, J.W., Haas, R.H., Schell, J.A., Deering, D.W. & Harlan, J.C. (1974). Monitoring the vernal advancements and retrogradation of natural vegetation in Nasa/Gsfc Final Report (ed. MD, U.G.) p. 371.
Sobrino, J.A., Jiménez-Muñoz, J.C., Zarco-Tejada, P.J., Sepulcre-Cantó, G. and de Miguel, E. (2006). Land Surface Temperature derived from Airborne Hyperspectral Scanner Thermal Infrared data. Remote Sens Environ, 102, 99–115.
Suárez, L., Zarco-Tejada, P. J., Sepulcre-Cantó, G., Pérez-Priego, O., Miller, J.R., Jiménez-Muñoz, J.C., Sobrino, J. (2008). Assessing Canopy PRI For Water Stress Detection With Diurnal Airborne Imagery. Remote Sens Environ, 112, 560-575.
19

20
Suárez, L., Zarco-Tejada, P.J., Berni, J.A.J., González-Dugo, V., Fereres, E., (2009) Modelling PRI for Water Stress Detection using Radiative Transfer Models, Remote Sens Environ 113 730-744.
Thenot, F., Méthy, M. & Winkel, T. (2002). The Photochemical Reflectance Index (PRI) as a water-stress index. Int J Remote Sens, 23(23), 5135-5139.
Winkel, T., Méthy, M. & Thénot, F. (2002). Radiation use efficiency, chlorophyll fluorescence , and reflectance indices associated with ontogenic changes in water-limited Chenopodium quinoa leaves. Photosynthetica, 40(2), 227-232.
Zarco-Tejada, P. J., Rueda, C. A., & Ustin, S. L. (2003). Water content estimation in vegetation with MODIS reflectance data and model inversion models. Remote Sensing of Environment, 85, 109–124.
Zarco-Tejada, P.J., Miller J.R., Morales A., Berjón A., & Agüera J. (2004) Hyperspectral Indices and Model Simulation for Chlorophyll Estimation in Open-Canopy Tree Crops, Remote Sens Environ, 90(4), 463-476.

Agradecimientos
AGRADECIMIENTOS Esta tesis es el resultado de mucho esfuerzo, esfuerzo que ha sido fructífero gracias a la ayuda de muchas personas a las que estoy muy agradecida. En primer lugar, quiero agradecer la acogida que tuve en el Instituto de Agricultura Sostenible desde el primer momento en que Pablo Zarco me invitó a realizar las prácticas de master en su laboratorio. Él puso a mi disposición sus recursos y todo lo que necesité para hacerme sentir aún más que la investigación era mi camino. Gracias a su ejemplo y motivación y gracias a que me ofreció una línea de trabajo que me apasionaba, sentí que mis siguientes años estaban allí haciendo este trabajo. Durante este tiempo no he recibido otra cosa que no fuera motivación en mi trabajo y entusiasmo por la ciencia. Gracias a Pablo Zarco y Elías Fereres, mis directores de tesis, me he formado durante todos estos años, recibiendo a cada paso una lección de ciencia. Gracias a ellos, he podido seguir una línea de trabajo contínua y bien estructurada. Gracias a sus ideas, gracias a su constancia, gracias a su dedicación, gracias a su cercanía, gracias a ellos. Gracias. Gracias también a todos mis compañeros de QuantaLab que han participado en mi trabajo fueran parte activa o no, gracias a Guada, Berni, Mariluz, Vic, Manoli, Alberto, David y Jesús. Ellos me han ayudado cada vez que eran necesarios, pudieran o no. Hemos pasado juntos campañas, sudores, instrumentos… muy buenos ratos sobre todo. Gracias a un equipo así, es un gusto tomar datos de campo. Este agradecimiento quiero hacerlo extensivo a otros técnicos con los que he trabajado: kiki, Ignacio, Rafa… También a todas las personas de otras instituciones que han trabajado activamente en estos trabajos: John, Fermín, Ruth, gracias. Al resto de compañeros del departamento de Agronomía e investigadores, siempre han estado dispuestos para lo que fueran necesarios. Gracias por estar ahí siempre ayudando, apoyando, sugiriendo y aclarando conceptos. Gracias a todos: Marga, Oscar, Auxi, Francisco, Paco, Luca, muchas gracias. A mi familia, por su apoyo incondicional y porque siempre han estado orgullosos de mí por el simple hecho de estar a gusto con mi trabajo, por muy arduo que pareciera. A mis amigos, que también me han apoyado siempre aún cuando no tenía tiempo de tomarme un café, aguantando agobios y risas en la misma medida. Gracias Pepa, Rocío, Andrés, Manolo, Mónica, Bea, María, Ana, Tania… gracias gracias a todos todos. A todos los que aún no estando en esta lista han aportado apoyo durante este tiempo o una simple sonrisa en un día gris.
21

22

General Introduction
Chapter 1
General introduction
23

Chapter 1
24

General Introduction
1.1. BACKGROUND "There is a water crisis today. But the crisis is not about having too little water to satisfy our needs. It is a crisis of managing water so badly that billions of people - and the environment - suffer badly." World Water Vision Report. Population growth, economic development and environmental concerns have increased water demand from several sectors, notably from the environment, and this has intensified the competition for scarce water resources in many world regions. Predictions of water stress for the 2020s from “Future long-term changes in global water resources driven by socio-economic and climatic changes” (Alcamo et al., 2007) are presented in Figure 1.1. Agriculture is the sector which demands the highest amount of water. Irrigation now uses 66 percent of all freshwater appropriated for human use (FAO, 2009). The surface area under rainfed agriculture largely exceeds the area devoted to irrigation; in fact, only 18% of the cultivated lands in the world are irrigated. However, the value of irrigated production is over 45% of total, indicating the importance that irrigated agriculture has for feeding the world now and in the future (Molden, 2007).
Figure 1.1. Prediction of water stress for 2020s based on climatic and socio-economic changes (Alcamo et al., 2007).
25
Chapter 1
1.2. WATER-LIMITED AGRICULTURE Crop performance and yield result from genotypic expression as modulated by continuous interactions with the environment. Water stress occurs when the demand of water exceeds the available supply during a certain period or when poor water quality restricts its use. It is well known that severe water deficits affect many physiological processes and have a strong impact on yield (Hsiao et al., 1976). However, even moderate water deficits, which are not easy to detect, can also have important negative effects on yield (Hsiao and Bradford, 1983). It is important to be able to assess the level of stress through some pertinent indicators. The early detection of water stress is a key issue to avoid yield loss, which can be affected even by short-term water deficits (Hsiao et al., 1976). Water scarcity is a major constraint to irrigated agriculture, and is forcing farmers to reduce irrigation water use via deficit irrigation (DI; Fereres and Soriano, 2007). Deficit irrigation is defined as the application of water below full crop-water requirements (evapotranspiration). One of the DI approaches is the regulated deficit irrigation (RDI), where water deficits are imposed only during the crop developmental stages that are the least sensitive to water stress (Chalmers et al., 1981). This practice was originally proposed to control the vegetative vigour in high-density orchards to reduce production costs and to improve fruit quality. However, it also saves irrigation water, with the concomitant benefits of reduced drainage losses (Fereres & Soriano, 2007). It has long been known that tree water deficits affect fruit quality parameters (Veihmeyer, 1927). However, when water deficits are imposed as in RDI, yield and fruit size are not affected (Girona, 2003), while some quality parameters such as total soluble sugars and total acidity increase (Crisosto et al., 1994, Girona et al., 2003, Mills et al., 1994). The responses to RDI are variable depending on the timing and severity of water deficits (Marsal & Girona, 1997; Girona, 2003) which vary within a given orchard. Then, the precise remote detection and monitoring of water stress is critical for water management. 1.3. REMOTE SENSING OF WATER STRESS Previous studies have used traditional indices to assess leaf water content and water stress using the plant water index (PWI, Peñuelas et al., 1997) and the normalized difference vegetation index (NDVI) (Zarco-Tejada et al., 2003; Mo et al., 2004). Nevertheless, PWI is based on absorption of liquid water so related with water content in the leaf. Vegetation water status is not a direct measurement of vegetation water content. Water content per unit leaf area generally does not change much due to moderate water stress since the plant tried to maintain a minimum level for basic functioning (Beaumont, 1995). In fact, reducing transpiration helps to conserve available water (Larcher, 1995) as each species has developed different mechanisms to resist water stress. The loose of water in the leaf or wilting occurs when structural effects of water stress are already visible. The same happens with a structural index such as NDVI which gives information on water stress when the deficit has already affected vegetation structure, not being a pre-visual water stress indicator. The pre-visual detection of water stress has been successfully achieved with
26

General Introduction
remote sensing data using thermal infrared radiation since long ago. Twenty-five years ago, thermal information was chosen for the remote sensing of water stress in crops (Jackson et al., 1977; 1981; Idso et al., 1978; 1981; 1982a, 1982b) because the spectral vegetation indices that existed at that time were not nearly as sensitive to water deficits as those derived from canopy temperature (Jackson et al., 1983). Thermal remote sensing of water stress was first performed using spectrometers at ground level (Idso et al., 1981; Jackson et al., 1977, 1981), but other approaches have been developed more recently. These included the use of airborne thermal imagery (Cohen et al., 2005; Leinonen and Jones, 2004; Sepulcre-Cantó et al., 2007) and satellite thermal information in combination with 3D radiative transfer models to understand the effects of scene thermal components on large ASTER pixels (Sepulcre-Cantó et al., 2009). Alternatively, thermal imagery acquired over vegetation is sensitive to canopy transpiration because temperature is raised due to the reduction in evaporative cooling under stress conditions. Thermal remote sensing of water stress has been accomplished using spectrometers at ground level (Idso et al., 1981; Jackson et al., 1977 and 1981), thermal sensors at image level (Cohen et al., 2005; Leinonen and Jones, 2004; Sepulcre-Cantó et al., 2007) and using satellite thermal information (Sepulcre-Cantó et al., 2009). Notwithstanding the advances in thermal detection, the visible part of the spectrum has also been useful for pre-visual water stress detection based on indices that use bands located at specific wavelengths where photosynthetic pigments are affected by stress condition. This is the case of the xanthophyll cycle response to stress tracked by the PRI index, which is suggested as a pre-visual indicator of water stress and is the aim of this study. PRI has been used to assess pre-visual water stress in the work by Thenot et al. (2002) and Winkel et al. (2002) at leaf level, at canopy level (Evain et al., 2004; Dobrowsky et al., 2005; Sun et al., 2008; Peguero-Pina et al., 2008) and using airborne imaging spectroscopy (Suarez et al., 2008; 2009). Both indicators, canopy temperature and PRI, are complementary; they provide physiological information related to plant water status, transpiration and photosynthesis. High spatial resolution imagery in the visible and near infrared region is relatively easy to acquire with current airborne and satellite sensors, such as AHS, Hymap, CASI, AVIRIS, and Hyperion, among others. On the contrary, high-resolution thermal sensors are not common due to technical limitations of microbolometer technology. Moreover, high resolution thermal imagers onboard satellite platforms are restricted due to technical limitations. Current thermal medium resolution sensors on satellite platforms are limited to ASTER and LANDSAT sensors, offering spatial resolutions limited to the 60-120 m pixel-size range. These current technical limitations for acquiring high-spatial resolution thermal imagery emphasize the need for developing pre-visual water stress indicators in the VIS/NIR region for agricultural and precision farming methods. Technically, CMOS and CCD VIS/NIR imaging sensors based on silicon detectors provide very high spatial resolution with pixel sizes at the centimetre level and cost-effective for precision agriculture imagers and future satellite platforms. Thus, attention must be placed on VIS/NIR narrow-band indicators of pre-visual stress, such as PRI, as well as chlorophyll fluorescence for stress-detection methods (Thenot et al., 2002; Dobrowsky et al., 2005; Perez-Priego et al., 2005; Suarez et al., 2008).
27

Chapter 1
1.4. THE PHOTOCHEMICAL REFLECTANCE INDEX (PRI) The Photochemical Reflectance Index (PRI) was suggested by Gamon and collaborators (1992) as an indicator of the de-epoxidation state of the xanthophyll pigments related with photosynthetic processes. Xanthophylls are pigments participating in an enzymatic cycle which plays a key role in stimulating energy dissipation within light harvesting antenna proteins by non-photochemical quenching, a mechanism to reduce the amount of energy that reaches the photosynthetic reaction centers. The xanthophylls contained in the vegetation and involved in the de-epoxidation processes are in the form of three different compounds: i) violaxanthin (V), with two epoxides absorbing incident photons and transmitting them to the reactive centres to conduct the photosynthesis; ii) antheraxanthin (A), with one epoxide; and iii) zeaxanthin (Z) with no epoxides, by which the incoming energy is released and hence is not tranmitted to the photosystems, and therefore not being used to conduct photosynthesis. Non-photochemical quenching is one of the main ways of protecting against photoinhibition which is light-induced reduction in the photosynthetic capacity of a plant. When light absorption exceeds light utilization in photosynthetic electron transport, excess absorbed light results. This can arise from exposure to a high photosynthetic photon flux density (PFD), or a low requirement for electron transport under environmental stresses.
Non-Stress conditions
Stre
ss c
ondi
tions
Figure 1.2. Xanthophyll molecules participating in the xanthophyll cycle. Under stress conditions, violaxanthin de-epoxidize to antheraxanthin and the latter to zeaxanthin eviting the photosystems to be damaged. The opposite happens under non-stress conditions.
28

General Introduction
0.04
0.05
0.06
0.07
0.08
0.09
0.10
0.11
500 520 540 560 580 600
Wavelength (nm)
leaf
refle
ctan
ce
0.0000
0.0002
0.0004
0.0006
0.0008
0.0010
0.0012
0.0014
reflectance difference
Figure 1.3. Leaf reflectance of dark adapted leaves (dotted line, first measurement) and under steady state condition (continuous line, last measurement), showing the reflectance difference associated with xanthophyll pigment cycle.
Figure 1.2 represents the three molecules participating in the xanthophyll cycle as a plant –defence mechanism under stress conditions. The excess energy is released as a defence mechanism for the plant photosystems, therefore xanthophylls are in the form of violaxanthin under normal conditions with no high incoming energy. The de-epoxidation of violaxanthin is related to an absorption feature in the visible part of the electromagnetic spectrum located around 530 nm. Figure 1.3 represents the reflectance difference between a dark-adapted leaf and a leaf excited by a light pulse at the xanthophyll influence area. The PRI is based on a normalized difference of the 530 nm band where xanthophyll pigment absorption occurs, and a reference band located at 570 nm (Equation 1.1).
531570
531570
RRRR
PRI+−
= [1.1]
As the xanthophyll pigments are related to light absorption mechanisms, the PRI index has been extensively linked to light use efficiency (LUE) at leaf scale (Serrano and Peñuelas, 2005; Guo and Trotter, 2004; Sims et al., 2006; Nakaji et al., 2006), at canopy scale using field spectrometers (Trotter et al., 2002; Strachan et al., 2002; Nichol et al., 2000 and 2002) and using satellite imagery such as EO-1 Hyperion (Asner et al., 2005), MODIS (Drolet et
29

Chapter 1
al., 2005) and AVIRIS (Fuentes et al., 2006). The estimation of LUE through the remote sensing PRI index is demonstrated as a direct link to photosynthesis rate assessment (Nichol et al., 2000 and 2006; Guo and Trotter, 2004; Sims et al., 2006). In addition, photosynthesis has also been related to PRI through chlorophyll fluorescence and non-photochemical quenching (Evain et al., 2004 and Nichol et al., 2006). The bands that are needed to calculate PRI are available in current sensors on board airborne and satellite platforms. The satellite sensors MODIS and Hyperion and the hyperspectral airborne sensors AHS, Hymap, AVIRIS, CASI and ROSIS, provide with spectral information on the xanthophyll-influence area. An overview of the sensors that have been used to assess PRI can be found in Table 1.1. Although PRI has been widely used at different ground spatial resolutions on homogeneous and heterogeneous study sites, it cannot be readily used to map vegetation stress without considering leaf and canopy structural effects on the index. PRI bands at 531 and 570 nm are affected by both leaf and canopy parameters such as chlorophyll content (Cab), dry matter (Cm), leaf thickness, leaf area index (LAI), and leaf angle distribution function (LADF), among others (Barton and North, 2001; Suárez et al., 2008). Thus, PRI maps obtained over canopies with variable LAI mask the sensitivity of the index to stress, mostly tracking the spatial variation of the canopy leaf area density and structure (Barton and North, 2001; Suárez et al., 2008). Consequently, modelling work at leaf and canopy scale is needed to enable an operational application of PRI to map water stress in non-homogeneous canopies where structural changes play the main role in the reflectance signature.
Table 1.1. Overview of the sensors on airborne and satellite platforms used to acquire PRI information in previous studies, the spectral bands used to calculate the index and the ground spatial resolution of the imagery.
Platform Sensor Spectral bands (nm)
Spatial Resolution References
Satellite-AQUA MODIS 531, 551 nm 1 km Drolet et al., 2005 Satellite-EO 1 Hyperion 529, 569 nm 30 m. Asner et al., 2004; 2005 Airborne AHS 542, 571 nm 2 m Suárez et al., 2008 Airborne Hymap 543, 573 nm 5 m Kooistra et al., 2008 Airborne AVIRIS 517, 567 nm 2-16 m Fuentes et al., 2006 Airborne CASI 528, 567 nm 2 m. Zarco-Tejada et al., 1999 Airborne ROSIS 531, 570 nm 1 m. Zarco-Tejada et al., 2005
30

General Introduction
1.5. AIM AND OUTLINE OF THE THESIS The aim of this thesis is the study of PRI as a physiological indicator of the processes occurring in vegetation subjected to water stress. For this purpose, three main objectives were defined as follows:
- To demonstrate that PRI is a pre-visual water stress indicator at the canopy scale and to explore the external factors affecting the index.
- To develop a methodology for water stress assessment of crop canopies using PRI - To evaluate the potential of PRI as an indicator of fruit quality parameters in peach
and citrus orchards.
The work is presented as chapters, each one with specific objectives. Chapter 2, 3 and 4 are peer-reviewed publications; the first two have been published and the last one has been accepted for publication in Remote Sensing of Environment. Chapter 2 presents a study of PRI as a pre-visual water stress indicator in an olive tree orchard. The 3D radiative transfer model FLIGHT is used to study the influence of soil background and solar geometry on the index. The influence of soil background, canopy structure and solar geometry makes necessary the use of radiative transfer modelling to develop a methodology to properly use PRI to assess water stress, which is presented in Chapter 3. The methodology presented in Chapter 3 assesses water stress, taking into account the specific solar geometry at the time of imagery acquisition, the soil background and the vegetation structure giving a threshold PRI value for non-stress conditions. It has been validated for two discontinuous, tree canopies (olive and peach trees) and a continuous canopy structure of a field crop (maize). Chapter 4 explores the possibility of using PRI as a fruit quality indicator, based on the hypothesis that it could detect the known effects that water stress has on final fruit quality. The links between the PRI during the period of fruit development and the quality parameters at harvest are studied and presented in chapter 4. Finally, a synthesis with conclusions is presented in Chapter 5.
31

Chapter 1
RERERENCES Alcamo, J., Flörke, M. and Märker, M. (2007). Future long-term changes in global water
resources driven by socio-economic and climatic changes. Hydrological Sciences Journal 52, 247-275.
Asner, G.P., Nepstad, D., Cardinot, G. and Ray, D. (2004). Drought stress and carbon uptake in an Amazon forest measured with spaceborne imaging spectroscopy. PNAS, 101, 6039-6044.
Asner, G.P., Carlson, K.M. and Martin, R.E. (2005) Substrate age and precipitation effects on Hawaiian forest canopies from spaceborne imaging spectroscopy. Remote Sensing of Environment, 98, 457-467.
Barton, C.V.M. and North, P.R.J. (2001). Remote Sensing of canopy light use efficiency using the photochemical reflectance index. Model and analysis. Remote Sensing of Environment, 78, 264, 273.
Beaumont, P. (1995). Reflectance foliaire et acclimatation à un deficit hydrique: cas des feuilles de tournesol. PhD. Thesis, Ecophysiologie végétale et Télédétection, Université Paul Sabatier, Toulouse, France, p. 129.
Chalmers, D.J., Mitchell, P.D. and Van Heek, L. (1981). Control of peach tree growth and productivity by regulated water supply, tree density and summer pruning. Journal of the American Society of Horticultural Sciences, 106, 307-312.
Cohen, Y., Alchanatis, V., Meron, M., Saranga, Y., and Tsipris, J. (2005). Estimation of leaf potential by thermal imagery and spatial analysis. Journal of Experimental Botany, 56, 1843-1852.
Crisosto, C.H., Johnson, R.S., Luza, J.G. and Crisosto, G.M. (1994). Irrigation regimes affect fruit soluble solids concentration and rate of water loss of ‘O’Henry’ peaches. Horticultural Sciences, 29, 1169-1171.
Dobrowsky, S.Z., Pushnik, J.C., Zarco-Tejada, P.J. and Ustin, S.L. (2005). Simple reflectance indices track heat and water stress-induced changes in steady-state chlorophyll fluorescence at the canopy scale. Remote Sensing of Environment, 97, 403-414.
Drolet, G.G., Huemmrich, K.F., Hall, F.G., Middleton, E.M., Black, T.A., Barr, A.G. and Margolis, H.A. (2005). A MODIS-derived photochemical reflectance index to detect inter-annual variations in the photosynthetic light-use efficiency of a boreal deciduous forest. Remote Sensing of Environment, 98, 212-224.
Evain, S., Flexas, J. and Moya, I. (2004). A new instrument for passive remote sensing: 2. Measurement of leaf and canopy reflectance changes at 531 nm and their relationship with photosynthesis and chlorophyll fluorescence. Remote Sensing of Environment, 91, 175-185.
Fereres, E. and Soriano, M. "Deficit Irrigation For Reducing Agricultural Water Use". J. Exp. Bot., vol. 58, pp.147-159, 2007.
Fuentes, D.A., Gamon, J.A., Cheng, Y., Claudio, H.C., Qiu, H.L., Mao, Z., Sims, D.A., Rahman, A.F., Oechel, W. and Luo, H. (2006). Mapping carbon and water vapour fluxes in a chaparral ecosystem using vegetation indices derived from AVIRIS. Remote Sensing of Environment, 103, 312-323.
32

General Introduction
Gamon, J.A., Peñuelas, J. and Field, C.B. (1992). A narrow-wave band spectral index that track diurnal changes in photosynthetic efficiency. Remote Sensing of Environment 41, 35-44.
Girona, J., Mata, M., Arbonès, A., Alegre, S., Rufat, J., Marsal, J. (2003). Peach tree response to single and combined regulated deficit irrigation regimes under swallow soils. Journal of the American Society of Horticultural Sciences, 128, 432-440.
Guo, J. and Trotter, C.M. (2004). Estimating photosynthetic light-use efficiency using the photochemical reflectance index: variations among species. Functional Plant Biology, 31, 255-565.
Hsiao, T.C., Fereres, E., Acevedo, E., Henderson, D.W. Water stress and dynamics of growth and yield of crops. Water and Plant life: Problems and modern approaches, 1976, Springer.
Hsiao TC, Bradford KJ. 1983. Physiological consequences of cellular water deficits. In: Taylor HM, Jordan WR, Sinclair TR, eds. Limitations to efficient water use in crop production. Madison, WI: ASA, CSSA, SSSA, 227–265.
Idso, S.B., Jackson, R.D. and Reginato, R.J. (1978), Extending the “degree day” concept of phenomenological development to include water stress effects. Ecology 59, 431-433.
Idso, S.B., Jackson, R.D., Pinter, P.J., Reginato, R.J. and Hatfield, J.L. (1981). Normalizing the stress-degree-day parameter for environmental variability. Agricultural and Forest Meteorology, 24, 45-55.
Idso, S.B. (1982a). Humidity measurement by Infrared Thermometry. (1982). Remote Sensing of Environment, 12, 87-91.
Idso, S.B. (1982b). Non-water-stressed baselines: A key to measuring and interpreting plant water stress. Agricultural Meteorology, 27, 59-70.
Jackson R.D., Idso, S.B., Reginato R.J. and Ehrier, W.L. (1977). Crop temperature reveals stress. Crop Soils 29, 10-13.
Jackson, R.D., Idso, S.B., Reginato, R.J. and Pinter, P.J. Jr. (1981). Canopy temperature as a crop water stress indicator. Water Resources Research, 17, 1133-1138.
Jackson, R.D., Slater, P.N. and Pinter, P.J. Jr. (1983). Discrimination of growth and water stress in wheat by various vegetation indices through clear and turbid atmospheres. Remote Sensing of Environment 13, 187-208.
Kooistra, L., Wamelink, W., Schaepman-Strub, G., Schaepman, M., van Dobben, H., Aduaka, U. and Batelaan, O. (2008). Assessing and predicting biodiversity in a floodplain ecosystem: Assimilation of net primary production derived from imaging spectrometer data into a dynamic vegetation model. Remote Sensing of Environment, 112, 2118-2130.
Larcher, W. (1995). Physiological plant ecology. Ecophysiology and stress physiology of functional groups (3rd ed.) p. 528. New York: Springer.
Leinonen, I. and Jones, H.G. (2004). Combining thermal and visible imagery for stimulating canopy temperature and identifying plant stress. Journal of Experimental Botany, 55, 1423-1431.
Marsal, J. and Girona, J. (1997). Relationship between leaf water potencial and gas exchange activity at different phonological stages and fruit loads in peach trees. Journal of the American Society of Horticultural Sciences, 122, 415-421.
Mills, T.M., Behboudian, M.H. and Tan, P.Y. (1994). Plant water status and fruit quality in “Braeburn” apples. Horticultural Science 29, 1274-1278.
33

Chapter 1
Mo, X., Liu, S., Lin, Z., & Zhao, W. (2004). Simulating temporal and spatial variation of evapotranspiration over the Lushi basin. Journal of Hydrology, 285, 125–142.
Molden , D., 2007. Water for Food, Water for Life: A Comprehensive Assessment of Water Management in Agriculture. Earthscan , London .
Nakaji, T., Oguma, H. and Fujinuma, Y. (2006). Seasonal changes in the relationship between photochemical reflectance index and photosynthetic light use efficiency of Japanese larch needles. International Journal of Remote Sensing, 27, 493-509.
Nichol, C.J., Huemmrich, K.F., Black, T.A., Jarvis, P.G., Walthall, J.G. and Hall, F.G. (2000). Remote sensing of photosynthetic-light-use efficiency of boreal forest. Agricultural and Forest Meteorology, 101, 131-142.
Nichol, C.J., Lloyd, J., Shibistova, O., Arneth, A., Röser, C., Knohl, A., Matsubara, S. and Grace, J. (2002). Remote sensing of photosynthetic-light-use-efficiency of a Siberian boreal forest. Tellus, 54B, 677-687.
Nichol, C.J., Rascher, U., Matsubara, S. and Osmond, B. (2006). Assessing photosynthetic efficiency in an experimental mangrove canopy using remote sensing and chlorophyll fluorescence. Trees, 20, 9-15.
Peguero-Pina, J.J., Morales, F., Flexas, J., Gil-Pelegrín, E. and Moya, I. (2008) Photochemistry, remotely sensed physiological reflectance index and de-epoxidation state of xanthophyll cycle in Quercus coccifera under intense drought. Oecologia, 156, 1-11.
Peñuelas J., Piñol J., Ogaya R., Filella I. (1997). Estimation of plant water concentration by the reflectance Water Index WI (R900/R970). International Journal of Remote Sensing 18: 2869–2875.
Pérez-Priego, O., Zarco-Tejada, P.J., Sepulcre-Cantó, G, Miller, J.R., and Fereres, E. (2005). Detection of Water Stress in Orchard Trees with a High-Resolution Spectrometer through Chlorophyll Fluorescence in-filling of the O2-A band, IEEE Transactions on Geoscience and Remote Sensing, 43, 2860-2869.
Playan, E. and Mateos , L., 2006. Modernization and optimization of irrigation systems to increase water productivity. Agric. Water Manage. 80, 100–116.
Serrano, L. and Peñuelas, J. (2005). Assessing forest structure and function from spectral transmittance measurements: a case study in a Mediterranean holm oak forest. Tree Physiology, 25, 67-74.
Sepulcre-Cantó, G., Zarco-Tejada, P.J., Jiménez-Muñoz, J.C., Sobrino, J.A., Soriano, M.A., Fereres, E., Vega V., and Pastor, M. (2007). Monitoring yield and fruit quality parameters in open-canopy tree crops under water stress. Implications for ASTER. Remote Sensing of Environment, 107, 455-470.
Sepulcre-Cantó, G., Zarco-Tejada, P.J., Sobrino, J.A., Berni, J.A. J., Jiménez Muñoz, J.C. and Gastellu-Etchegorry J.P. (2009) Detecting Water Status in Open Canopies with thermal ASTER Imagery and DART radiative transfer simulation. Agricultural and Forest Meteorology, 149, 962-975.
Sims, D.A., Luo, H., Hastings, S., Oechel, W.C., Rahman, A.F. and Gamon, J.A. (2006). Parallel adjustment in vegetation greenness and ecosystem CO2 exchange in response to drought in a Southern California chaparral ecosystem. Remote Sensing of Environment, 103, 289-303.
34

General Introduction
Strachan, I.B., Pattey, E. and Boisvert, J.B. (2002). Impact of nitrogen and environmental conditions on corn as detected by hyperspectral reflectance. Remote Sensing of Environment, 80, 213-224.
Suárez, L., Zarco-Tejada, P. J., Sepulcre-Cantó, G., Pérez-Priego, O., Miller, J.R., Jiménez-Muñoz, J.C. and Sobrino, J. (2008). Assessing Canopy PRI For Water Stress Detection With Diurnal Airborne Imagery. Remote Sensing of Environment, 112, 560-575.
Suárez, L., Zarco-Tejada, P.J., Berni, J.A.J., González-Dugo, V. and Fereres, E., (2009). Modelling PRI for Water Stress Detection using Radiative Transfer Models. Remote Sensing of Environment, 113, 730-744.
Sun, P., Grignetti, A., Liu, S., Casacchia, R., Salvatori, R., Pietrini, F., Loreto, F., and Centritto, M. (2008). International Journal of Remote Sensing, 29 (6), 1725-1743.
Thenot, F., Méthy, M. and Winkel, T. (2002). The Photochemical Reflectance Index (PRI) as a water-stress index. International Journal of Remote Sensing, 23, 5135-5139.
Trotter, G.M., Whitehead, D. and Pinkney, E.J. (2002). The photochemical reflectance index as a measure of photosynthetic light use efficiency for plants with varying foliar nitrogen contents. International Journal of Remote Sensing, 23, 1207-1212.
Veihmeyer, F.J. (1927). Some factors affecting the irrigation requirements of deciduous orchards. Hilgardia, 2, 125-284.
Winkel, T., Méthy, M. and Thénot, F. (2002). Radiation use efficiency, chlorophyll fluorescence , and reflectance indices associated with ontogenic changes in water-limited Chenopodium quinoa leaves. Photosynthetica, 40(2), 227-232.
Zarco-Tejada, P.J., J.R. Miller, G.H. Mohammed, T.L. Noland, P.H. Sampson, (1999). Canopy Optical Indices from Infinite Reflectance and Canopy Reflectance Models for Forest Condition Monitoring: Application to Hyperspectral CASI data . Presented at the IEEE 1999 International Geoscience and Remote Sensing Symposium, IGARSS'99, Hamburg (Germany), 28th June - 2nd July 1999. Tammy I. Stein (Ed.), ISBN: 0-7803-5207-6.
Zarco-Tejada, P. J., Rueda, C. A., & Ustin, S. L. (2003). Water content estimation in vegetation with MODIS reflectance data and model inversion models. Remote Sensing of Environment, 85, 109–124.
Zarco-Tejada, P.J., Berjón, A., López-Lozano, R., Miller, J.R., Martín, P., Cachorro, V.; González M.R. and de Frutos, A. (2005). Assessing vineyard condition with hyperspectral indices: Leaf and Canopy reflectance simulation in a row-structured discontinuous canopy. Remote Sensing of Environment 99, 271-287.
35

Chapter 1
36
Assessing canopy PRI for water stress detection
Chapter 2
Assessing canopy PRI for water stress detection with diurnal imagery
Suárez1, L., Zarco-Tejada1, P.J., Sepulcre-Cantó1, G., Pérez-Priego1, O., Miller2, J.R., Jiménez-Muñoz3, J.C., Sobrino3, J. 1 Instituto de Agricultura Sostenible (IAS), Consejo Superior de Investigaciones Científicas (CSIC), Córdoba, Spain 2 Dept. of Earth and Space Science and Engineering, York University, Toronto, Canada 3 Global Change Unit, Department of Thermodynamics, Faculty of Physics, University of Valencia, Valencia, Spain From: Suárez, L., Zarco-Tejada, P. J., Sepulcre-Cantó, G., Pérez-Priego, O., Miller, J.R., Jiménez-Muñoz, J.C. and Sobrino, J. (2008). Assessing Canopy PRI For Water Stress Detection With Diurnal Airborne Imagery. Remote Sensing of Environment, 112, 560-575.
37

Chapter 2
38

Assessing canopy PRI for water stress detection
RESUMEN
En este trabajo se realizaron dos campañas diurnas de toma de imágenes sobre un cultivo discontínuo para estudiar el Indice de Reflectancia Fotoquímica (Photochemical Reflectance Index, PRI) como indicador de estrés hídrico. Para ello se utilizó el sensor Airborne Hyperspectral Scanner (AHS) para estudiar los cambios en PRI, el Indice Transformado de Absorción de Clorofila (Transformed Chlorophyll Absorption in Reflectance Index, TCARI) normalizado con el Indice Optimizado para Suelo (Optimized Soil-Adjusted Vegetation Index, OSAVI) (TCARI/OSAVI), y el Indice de Vegetación Normalizado (Normalized Difference Vegetation Index, NDVI) como respuesta a parámetros fisiológicos de estrés hídrico medidos en campo (conductancia estomática, potencial hídrico, temperatura de copa y fluorescencia en estado estacionario). El sensor AHS sobrevoló la parcela experimental tres veces en 2004 y 2005, tomando imágenes con 80 bandas espectrales en la región 0.43-12.5 µm con una resolución espacial de 2 m. PRI, TCARI/OSAVI, NDVI y temperatura se calcularon extraídos de los píxeles puros de cada copa separando los efectos del suelo y las sombras en los valores finales. El Indice de Reflectancia Fotoquímica, inicialmente desarrollado como indicador de los cambios de concentración de las xantofilas se calculó para estudiar su relación con el estrés hídrico de la vegetación a escala de cubierta, y para estudiar el efecto de la estructura y la geometría de visión en el estudio diurno del estrés hídrico en vegetación. El modelo tridimensional de transferencia radiativa FLIGHT se usó para simular los cambios en la reflectancia bidireccional debidos a la geometría de visión, suelo, y estructura de la vegetación. Los resultados que se presentan en este artículo demuestran que el índice PRI, calculado a partir de imágenes de un sensor aerotransportado, es sensible al estado de oxidación de las xantofilas y la concentración de cada pigmento en el ciclo debido al estrés hídrico. Sin embargo, también demuestra que el PRI está afectado a lo largo del día por los cambios en la geometría solar. De entre los índices estudiados, solo el PRI mostró sensibilidad a los cambios diurnos de los parámetros fisiológicos relacionados con el estrés hídrico (temperatura de copa menos temperatura de aire (Tc-Ta), conductancia estomática (G), y potencial hídrico de tallo (ψ)) medidos en campo en el momento de adquisición de las imágenes. No se encontraron relaciones entre NDVI y TCARI/OSAVI y los parámetros fisiológicos medidos en las copas. Por último, las simulaciones hechas con el modelo FLIGHT demostraron que PRI está muy afectado por la estructura de la vegetación y el tipo de suelo.
39

Chapter 2
ABSTRACT
A series of diurnal airborne campaigns were conducted over an orchard field to assess the canopy Photochemical Reflectance Index (PRI) as an indicator of water stress. Airborne campaigns over two years were conducted with the Airborne Hyperspectral Scanner (AHS) over an orchard field to investigate changes in PRI, in the Transformed Chlorophyll Absorption in Reflectance Index (TCARI) normalized by the Optimized Soil-Adjusted Vegetation Index (OSAVI) (TCARI/OSAVI), and in the Normalized Difference Vegetation Index (NDVI) as function of field-measured physiological indicators of water stress, such as stomatal conductance, stem water potential, steady-state fluorescence, and crown temperature. The AHS sensor was flown at three times on 2004 and 2005 years, collecting 2 m spatial resolution imagery in 80 spectral bands in the 0.43-12.5 µm spectral range. PRI, TCARI/OSAVI, and NDVI were calculated from reflectance bands, and thermal bands were assessed for the retrieval of land surface temperature, separating pure crowns from shadows and sunlit soil pixels. The Photochemical Reflectance Index, originally developed for xanthophyll cycle pigment change detection was calculated to assess its relationship with water stress at a canopy level, and more important, to assess canopy structural and viewing geometry effects for water stress detection in diurnal airborne experiments. The FLIGHT 3D canopy reflectance model was used to simulate the bi-directional reflectance changes as function of the viewing geometry, background and canopy structure. This manuscript demonstrates that the airborne-level PRI index is sensitive to the de-epoxidation of the xanthophyll pigment cycle caused by water stress levels, but affected diurnally by the confounding effects of BRDF. Among the three vegetation indices calculated, only airborne PRI demonstrated sensitivity to diurnal changes in physiological indicators of water stress, such as canopy temperature minus air temperature (Tc-Ta), stomatal conductance (G), and stem water potential (ψ) measured in the field at the time of each image acquisition. No relationships were found from the diurnal experiments between NDVI and TCARI/OSAVI with the tree-measured physiological measures. FLIGHT model simulations of PRI demonstrated that PRI is highly affected by the canopy structure and background.
Keywords: water stress, thermal, hyperspectral , PRI, TCARI/OSAVI, airborne,
TES, AHS, remote sensing.
40

Assessing canopy PRI for water stress detection
2.1 INTRODUCTION The Photochemical Reflectance Index (PRI) is a physiological reflectance index sensitive to the de-epoxidation state of the xanthophyll cycle pigments and the efficiency of photosynthesis (Gamon et al., 1992). The xanthophyll cycle is associated with diurnal reductions in photosynthetic efficiency, as the xanthophyll cycle pigment violaxanthin is de-epoxidized under conditions of excess light since this reaction is readily reversed under limiting light (Gamon et al., 1992). Thus, the de-epoxidation state, or in other words, the concentration of the three xanthophyll cycle pigments, may be used as an indicator of short-term changes in photosynthetic activity. Several studies focus the assessment of PRI at the leaf level to track photosynthesis changes as function of elevation and latitude (Richardson and Berlyn, 2002; Richardson et al., 2003), and across ecosystems with nutrient level variability (Whitehead et al., 2005). Photosynthetic light-use efficiency (LUE) was demonstrated to be successfully estimated with PRI (Serrano and Peñuelas, 2005), although effects due to the species were found on leaf PRI (Guo and Trotter, 2004), as well as inconsistencies in the PRI/LUE relationship as function of drought conditions (Sims et al, 2006). The relationships between PRI and chlorophyll fluorescence measures have also been the focus of increasing interest in recent research. Relationships between PRI and dark-adapted fluorescence (Fv/Fm) over seasonal trials were demonstrated (Weng et al., 2006a; Weng et al., 2006b), and the assessment for leaf-level PRI sensitivity to seasonal changes were studied for parameters such as LUE (Nakaji et al., 2006), carbon uptakes (Filella et al., 2004), carotenoid pigments and photosynthetic activity (Stylinsky et al., 2002), and carotenoid / total chlorophyll ratio (Sims and Gamon, 2002). Nevertheless, difficulty is encountered in the assessment of PRI at canopy scale related with the effects of the structure and viewing geometry on the vegetation reflectance index. Some successful studies with field spectrometers at the canopy scale in diurnal cycles and seasonal acquisitions demonstrated that PRI is sensitive to photosynthetic efficiency (Nichol et al., 2006), under nutrient stress conditions (Strachan et al., 2002; Trotter et al., 2002), and over the green-up period in a boreal forest (Nichol et al., 2002). Filella et al. (1996) showed that PRI was significantly correlated with de-epoxidation state, zeaxanthin concentration, and with photosynthetic radiation-use efficiency on a cereal canopy. In addition, canopy-level relationships between PRI and chlorophyll fluorescence (Louis et al., 2005) suggested the potential estimation of carbon assimilation at canopy level using the PRI index. Although several studies demonstrate the sensitivity of PRI bands to the de-epoxidation state, which is potentially affected by water stress conditions, limited work has been found which demonstrate that PRI tracks the diurnal dynamics of water-limited physiology. Thenot et al. (2002) and Winkel et al. (2002) demonstrated the sensitivity of PRI to water stress conditions, although structural effects caused by the water stress would also affect the reflectance signal. The relationships obtained at canopy level between PRI and chlorophyll fluorescence under water stress conditions (Evain et al., 2004; Dobrowski et al., 2005) demonstrated that PRI accurately tracked induced stress conditions.
41

Chapter 2
However, consistent relationships between PRI, radiation-use efficiency and chlorophyll fluorescence measures at the canopy level have not always been found. Furthermore, the application of PRI at larger scales would present additional complications due to heterogeneous landscape composition, atmospheric interference and background effects. Accordingly, a number of formulations for PRI have been proposed in the literature using different reference wavelengths to minimize diurnal sun angle effects (Gamon et al., 1992; Peñuelas et al., 1994; Filella et al., 1996). These undesired effects of canopy structure, viewing geometry and background on PRI may be an important reason for the limited work published from airborne- and satellite-level research on PRI. Examples are limited to the Airborne Visible Infrared Imaging Spectrometer (AVIRIS) for carbon and water vapor flux estimations using PRI, NDVI and PWI (Fuentes et al., 2006), satellite level using Hyperion for LUE estimations (Asner et al., 2005), and MODIS-derived PRI for inter-annual variations in LUE (Drolet et al., 2005). Although PRI has been successfully applied for the remote sensing of photosynthetic processes at the leaf (Gamon et al., 1997; Tambussi et al. 2002) and at the canopy levels (Nichol et al. 2000; Peñuelas and Inoue 2000; Evain et al. 2004; Rahman et al. 2004; Louis et al. 2005; Fuentes et al. 2006), questions still need to be answered regarding the interpretation of PRI inter-specific and long-term dynamics changes (Weng et al. 2006a; Guo and Trotter 2004; Gamon et al. 1999). Effects due to the canopy architecture, canopy structure, background and the viewing geometry at the time of image acquisition are key factors inhibiting successful understanding of PRI changes. Work by Barton and North (2001) demonstrated that PRI is highly affected by the view angle, highly influenced by soil background at canopies with LAI<3, and also affected by the leaf angle distribution function at large view angles. The present study presents new insights on the understanding of the diurnal dynamics of canopy PRI as a function of water stress as imaged by an airborne sensor that enabled tree crowns to be targeted over the course of diurnal airborne campaigns. Relationships with image-extracted canopy temperature and field-measured fluorescence are also discussed, along with the assessment of diurnal effects of the viewing geometry on the PRI index for water stress detection.
2.2. METHODS
2.2.1. Field and data collection The study site is located in Córdoba, southern Spain (37.8ºN, 4.8ºW), an area dominated by Mediterranean climate with an annual rainfall of 650 mm concentrated between autumn to spring. Data was collected in an irrigated 4 ha-orchard established in 1997 with olive trees (Olea europaea L. cv. “Arbequino”) in a 3.5x7 m grid. The soil was kept under no-tillage conditions using weed-killers. The tree lines followed a north-south direction and the trees were planted on ridges to avoid flooding problems due to the soil-low percolation rate. Drip
42

Assessing canopy PRI for water stress detection
irrigation permitted the use of different water treatment amounts within the same field. The experiment was designed in an area of six rows with three different water treatments: (i) irrigating 2.8 mm/day (well-irrigated treatment used as reference, treatment R), (ii) 0.7 mm/day (deficit treatment S1), and (iii) combining a deficit irrigation (1.2 mm/day) with intermittent application from 14 June 2004 to 5 July and from 6 September to 19 October of the same year (deficit treatment S2). A more detailed description of this experiment and study site for water stress can be found in Pérez-Priego et al. (2006) (related to fluorescence detection using a high spectral resolution spectrometer), and Sepulcre-Cantó et al. (2006) (related to thermal detection). Thermal data were taken continuously on ten trees comprising the three irrigation treatments. The instruments used were IRTS-P sensors (Apogee, UT, USA) positioned one metre over the monitored trees recording in the 6.5-14 μm range. Three data-loggers (model CR10X, Campbell Sci., UT, USA) were used to record the mean temperature every five minutes out of 300 measurements in each interval (1 s-1). At the same time, temperature over a water body was measured with a field thermal radiometer (model Raynger II, Raytek, CA, USA) with a single broadband sensor covering the range 8-14 μm. In addition, air temperature data was collected at image acquisition times with a Vaisala Weather Transmitter (model WXT510, Vaisala Oyj, Helsinki, Finland) installed 1 m over a well-irrigated tree in the study site. Relative temperature was calculated as the difference between the temperature of the crowns of the trees and the air temperature at the same time (Tc-Ta). A Pulse-Amplitude-Modulated Fluorometer (PAM-2100, Heinz Walz GMBH, Effeltrich, Germany) was used to measure leaf steady-state chlorophyll fluorescence (Ft). The measurements were taken on an average of fifty exposed leaves per tree five times per day from 6:30 to 11:30 solar time between June and November 2004. The PAM-2100 standard procedure was used to obtain steady-state fluorescence (Ft) and effective quantum yield (∆F/Fm’=(Fm’-Ft)/Fm’) at the leaf level. Stomatal conductance (G) was measured once a week at hourly intervals from 7:30 to 11:30 GMT on one tree per irrigation treatment. The instrument used was a leaf steady-state porometer (model PMR4, PP Systems, Hitchin Herts, Great Britain). Stem water potential (Ψ) was monitored weekly with a Scholander pressure bomb (PWSC Model 3000, Soil Moisture Equipment Corp., California) on four trees from each S1 and S2 deficit irrigation treatments, and on three trees under the well-irrigated R treatment. The former eleven trees used for the detailed monitoring were located in the centre of treatment blocks to avoid edge influences. Water potential measurements were taken at 10:00 GMT on two shaded leaves near the trunk. The field measurements were collected on individual trees, conducting the further analysis both at the tree and block levels. Both thermal data and reflectance indices for stress detection analysis were then extracted from the multi-year airborne campaign acquired diurnally over the study site.
43

Chapter 2
2.2.2 Airborne Image Acquisitions Two airborne campaigns were conducted over the experimental field to acquire six images corresponding to three flight times (7:30, 9:30 and 12:30 GMT) on two consecutive years (25th July 2004 and 16th July 2005). Therefore, two complete data sets comprising field physiological measures and airborne thermal and reflectance imagery were acquired for further analysis of water stress detection. The airborne campaigns were conducted in collaboration with the Spanish Aerospace Institute (INTA) using the Airborne Hyperspectral Scanner (AHS) developed by Sensytech Inc. (Argon St. Inc., USA). The flight height was set to 1000 m above ground level, acquiring imagery with a 90º field of view (FOV) and 2.5 mrad instantaneous FOV, produced a spatial resolution of 2 m. In the 2004 campaign, imagery was collected at 38 bands over the 0.430-1.550 μm and 8.20-12.70 μm spectral regions. In the 2005 campaign, 80 bands were available in the 0.430-2.49 μm and 8.20-12.70 μm ranges. Atmospheric correction was conducted with the MODTRAN-4 radiative transfer code (Berk et al., 1999) supported by in situ radiosoundings launched at 7:00 and 12:00 GMT on 16 July 2005. Water vapour was obtained by scaling to an altitude of 1 km the measured value at the ‘El Arenosillo’ site, part of the AERONET network (http://aeronet.gsfc.nasa.gov). A full description of the calibration of the AHS bands and the radiometric and the atmospheric correction methodology can be found in Sobrino et al. (2006). For the VIS-SWIR region, soil reflectance spectra were used to conduct flat-field calibration (Ben-Dor and Levin, 2000) after atmospheric correction with MODTRAN, which compensated for residual effects on derived surface reflectance estimations in atmospheric water and oxygen absorption spectral regions (Haboudane et al., 2004; Zarco-Tejada et al., 2004). Figure 1 shows a sample image acquired over the study site with the AHS airborne sensor after atmospheric correction (Figure 1a), a subset of the entire imagery (Figure 1.b), and the corresponding spectra extracted from the imagery for the three scene components: i) pure tree crowns; ii) pure soil spectra, and iii) mixed pixels comprising pure crown, soil and shadow scene components (Figure 1c). The extraction of pure crown pixels was conducted with the 2 m spatial resolution imagery (Figure 1d shows the identification of single crowns) enabling the calculation of indices without the effects of shadow and soil components. Vegetation indices were calculated from each of the six available images to track changes in canopy structure and pigment concentration as function of the water stress status. The Normalized Difference Vegetation Index (NDVI) (Rouse, 1974) was calculated in this study to track changes in canopy structure in healthy vegetation, due to its relationship with leaf area index. The Transformed Chlorophyll Absorption in Reflectance Index (TCARI) (Haboudane et al., 2002) based on the Modified Chlorophyll Absorption in Reflectance (MCARI) (Daughtry et al., 2000), normalized by the Optimized Soil-Adjusted Vegetation Index (OSAVI) (Rondeaux et al., 1996) to obtain TCARI/OSAVI have been demonstrated to successfully minimize soil background and leaf area index variation in crops, providing
44

Assessing canopy PRI for water stress detection
predictive relationships for chlorophyll concentration estimation with hyperspectral imagery in closed crops (Haboudane et al., 2002) and open tree canopy orchards (Zarco-Tejada et al., 2004).
(a) (b) (d)
0.00
0.05
0.10
0.15
0.20
0.25
0.30
0.35
0.40
0.45
0.400 0.500 0.600 0.700 0.800
Wavelength (μm)(c
Pure vegetation
Soil
Mixed vegetation-soil
Ref
lect
ance
)
Figure 2.1. Overview of the area acquired with the AHS instrument (a). Detail of the olive orchard where the experiment was conducted (b). AHS spectra for pure vegetation, soil and mixed vegetation-soil pixels (c). Regions of interest created for single tree crowns (d).
45

Chapter 2
Finally, the Photochemical Reflectance Index (PRI), originally developed for xanthophyll cycle pigment change detection (Gamon et al., 1992) and suggested as a potential indicator for carotenoid/chlorophyll ratio monitoring (Sims and Gamon, 2002; Zarco-Tejada et al., 2005), was calculated to assess its relationship with water stress at canopy levels, and more important, to assess canopy structural and viewing geometry effects for water stress detection in diurnal airborne experiments. The three indices are described in Equations [1-3].
670800
670800
RRRRNDVI
+−
= [1]
[ ]
)16.0/()(*)16.01()/(*)(*2.0)(*3/
670800670800
670700550700670700
++−+−−−
=RRRR
RRRRRROSAVITCARI [2]
531570
531570
RRRR
PRI+−
= [3]
Adapted indices with spectral bands as available from the AHS airborne sensor were 659 nm and 804 nm for NDVI; 542 nm, 689 nm, 718 nm and 804 nm for TCARI/OSAVI; and 542 nm and 571 nm for PRI (all of them with 29 nm FWHM). Figure 2 shows the centre wavelength and bandwidths for the spectral bands used in this study to calculate the vegetation indices NDVI, TCARI/OSAVI and PRI. The feasibility of the AHS airborne sensor for PRI index changes associated with the de-epoxidation of the xanthophyll pigment cycle was further assessed.
46

Assessing canopy PRI for water stress detection
0.00
0.10
0.20
0.30
0.40
0.50
400 450 500 550 600 650 700 750 800 850 900
Wavelength (nm)
Ref
lect
ance
B1=542nmB2=571nmB3=659nmB4=689nmB5=718nmB6=804nm
B1B2 B3 B4 B5 B6
Figure 2.2. Center wavelength and bandwidth for the AHS bands used to calculate the vegetation indices NDVI (B6 and B3), TCARI/OSAVI (B1, B4, B5 and B6) and PRI (B1 and B2).
The 29 nm FWHM bandwidth of the two bands used for PRI calculation from the AHS sensor were compared with previous laboratory studies conducted which focused on the detection of fluorescence effects on leaf and canopy reflectance (Zarco-Tejada et al., 2000). Reflectance difference calculations from dark adapted leaves and under steady state condition (Figure 3a, adapted from Zarco-Tejada et al., 2000) enabled the emission bandwidths associated with blue fluorescence, chlorophyll fluorescence, and de-epoxidation of the xanthophyll pigment cycle later used to develop the PRI index (Figure 3b) to be studied. The bandwidth of the spectral region sensitive to the xanthophyll pigment is shown to be 26 nm FWHM, and centered on the 542 nm band in the AHS sensor. Therefore, the use of the 542 and 571 nm bands from the AHS airborne sensor for PRI calculation was considered justified. The indices were extracted for each tree and block of trees irrigated under different doses at each airborne acquisition for the three flight times. Additionally, crown and block surface temperature was retrieved from each airborne acquisition at the same 2 m spatial resolution. The airborne and field datasets enabled the assessment of relationships between airborne vegetation indices, crown temperature, field water potential, stomatal conductance and steady-state fluorescence as function of diurnal effects of water stress for the 2004 and 2005 campaigns.
47

Chapter 2
0
0.1
0.2
0.3
0.4
0.5
350 450 550 650 750 850
Wavelength (nm)
leaf
refle
ctan
ce
0.000
0.005
0.010
0.015
0.020
0.025
0.030
reflectance difference
First R measurementLast R measurementReflectance Difference
Blue F
Chlorophyll F
Xanthophyll cycle (PRI)
(a)
0.04
0.05
0.06
0.07
0.08
0.09
0.10
0.11
500 510 520 530 540 550 560 570 580 590 600
Wavelength (nm)
leaf
refle
ctan
ce
0.0000
0.0002
0.0004
0.0006
0.0008
0.0010
0.0012
0.0014
reflectance difference
B1 (AHS) B2 (AHS)B1=542nmB2=571nm
(b)
Figure 2.3. (a) Leaf reflectance of dark adapted leaves (dotted line, first measurement) and under steady state condition (continuous line, last measurement), showing the reflectance difference associated with blue fluorescence, chlorophyll fluorescence and xanthophylls pigment cycle. Changes in the PRI region are shown (b), indicating the AHS bands used in this study.
48

Assessing canopy PRI for water stress detection
2.2.3. Simulation with FLIGHT radiative transfer model A three dimensional forest light interaction model, FLIGHT (North, 1996) was used to simulate the radiative transfer in the canopy architecture of the study site used in this experiment. The purpose was to assess the bi-directional reflectance distribution function (BRDF) effects on the simulated vegetation indices (especially PRI) as function of the diurnal changes to the viewing geometry. FLIGHT is a computer simulation model based on a Monte Carlo ray tracing (MCRT) method. Ray tracing methods are based on a sampling of photon trajectories within the vegetation canopies (Disney et al., 1999). The model is a hybrid geometric optical/radiative transfer approach that assumes the canopy consists of a series of regular geometric shapes placed on the ground surface in a prescribed manner. At the top of the canopy, the interaction of radiation within the vegetation depends on the contribution of several components such as leaves, stems, soil background, illumination and view properties of each canopy element, as well as on their number, area, orientation and position in space (Goel and Thompson, 2000; Koetz et al., 2005). The FLIGHT model requires foliage density, angular distribution and size determined individually for every single crown simulated (North, 1996). The FLIGHT model inputs consist of: (i) geometric characteristics: shape, height, radius, leaf angle distribution (LAD), leaf area index (LAI) and position of every single crown in the scene as well as trunk geometry, total scene size and vegetation coverage; (ii) spectral signatures: soil, green leaf, senescence leaf, bark spectra; (iii) sun and view zenith and azimuth angles; and (iv) other parameters as soil roughness, aerosol optical thickness and the number of photons simulated. The output of the model simulation is a 3D hyperspectral image with the same number of bands as the input spectral signatures. Figure 4 shows a sample FLIGHT simulation scene corresponding to a heterogeneous forest with trees in a random position with different crown shapes and LAI values (Figure 4a), and an orchard canopy scene simulating a tree-crop planted in a regular grid (Figure 4b). The FLIGHT model used in this study enabled the simulation of complex canopy scenes to understand the directional effects on narrow-band indices such as PRI, as well as to study the effects of soil background and shadows in vegetation indices proposed for water stress detection. Model simulations were conducted to assess the influence of the sun position, soil type and LAI on the three vegetation indices studied at crown and canopy levels.
49

Chapter 2
(a) (b)
Figure 2.4. Model simulations conducted with FLIGHT for a forest canopy (a) and a crop canopy planted in regular grids (b). Input parameters for the forest canopy (a) were total LAI=1.7, fraction cover=0.8, leaf size=1.5, fraction of green leaves=0.85, fraction of bark=0, crown shape=spherical, soil roughness=0, aerosol optical thickness=0.15, solar zenith=21.36º, solar azimuth=294.44º, view zenith=0º, view azimuth=0º. Parameters for the crop canopy (b) comprised a total LAI=0.8, fraction cover=0.8, tree LAI=1, leaf size=2, fraction of green leaves=0.85, fraction of bark=0, LAD=spherical, crown shape=spherical, crown radius=1.5, tree height=4, soil roughness=0, aerosol optical thickness=0.15, solar zenith=21.36º, solar azimuth=20.94º, view zenith=0º, view azimuth=0º.
The input parameters sun and view azimuth, soil spectra and LAI were changed in the simulations, using structural input parameters such as crown shape and tree size collected in the field campaign. The leaf angle distribution (LAD) corresponded to the one measured by Mariscal et al. (2000) in the same olive orchard. Table 1 shows the input parameters required to run the FLIGHT model for the scenes simulated in this diurnal study, with simulations conducted for the three airborne acquisition times at 7:30, 9:30 and 12:30 GMT (Figure 5). Crown and block spectra were then extracted from both the AHS imagery and simulation scenes, and vegetation indices calculated for the three acquisition times. Diurnal variations of indices as compared with modelled changes as function of the viewing geometry and water stress condition were assessed.
50

Assessing canopy PRI for water stress detection
(a) (b)
(c) (d)
(e) (f)
Figure 2.5. AHS images acquired from the study site showing the corresponding simulations conducted with FLIGHT at 7:30 GMT (a, b), 9:30 GMT (c and d) and 12:30 GMT (e and f). Input parameters were the total LAI=0.39, fractional cover=0.39, crown LAI=1, leaf size=1.26, fraction of green leaves=0.85, fraction of bark=0, LAD=spherical, crown shape=spherical, crown radius=1.75m, tree height=3.45m, soil roughness=0, aerosol optical thickness=0.1, view zenith=0º, view azimuth=0º, solar azimuth=160º, solar zenith=58.29º (b), 36.19º (d), 0º (f).
51

Chapter 2
Table 2.1. Nominal values and range of parameters used for leaf and canopy modelling with PROSPECT and FLIGHT for the orchard study sites. Canopy structural parameters were used in the FLIGHT model for simulation of the canopy reflectance by radiative transfer. Leaf structural parameters, and leaf biochemical parameters were used for leaf-level simulation of reflectance and transmittance using PROSPECT. Leaf Optical and Structural Parameters Units / Values used Hemispherical reflectance and transmittance of green leaves Measured Hemispherical reflectance and transmittance of senescent leaves Not used Leaf equivalent radius cm Canopy Layer and Structural Parameters Leaf area index of vegetation 1-5 (m2/m2) Total leaf area index (m2/m2) Fractional cover 0-1 Leaf angle distribution 9 parameters Fraction of green leaves 0.85 Fraction of senescent leaves 0 Fraction of bark 0.15 Hemispherical reflectance and transmittance of bark Measured Number of stands and position coordinates Coordinates (m) Crown shape Spherical Crown height and radius m Trunk height and radius m Background and Viewing Geometry Solar zenith and azimuth deg Instrument zenith and azimuth deg Soil reflectance Image extracted Soil roughness 0-1 Aerosol optical thickness (AOD) 0.15
52
Assessing canopy PRI for water stress detection
2.3. RESULTS
2.3.1. Experimental Results A detailed study was conducted to assess the relationships between crown-level vegetation indices calculated from the AHS imagery at different flight times (NDVI, TCARI/OSAVI, PRI) and field-measured physiological indicators of water stress, such as crown temperature minus air temperature (Tc-Ta) (Figure 6), stomatal conductance (G) (Figure 7), stem water potential (ψ) (Figures 8 and 9), and steady-state chlorophyll fluorescence (Ft) (Figure 10). The relationships found between Tc-Ta and the airborne vegetation indices for individual trees in the 2004 campaign (first year campaign since water stress was applied) (Figures 6a, 6b and 6c) show that PRI tracks diurnal Tc-Ta changes as function of water stress (r2=0.64) better than NDVI (r2= 0.15) and TCARI/OSAVI indices (r2=0.09). In the second year after water stress treatments were applied (2005 campaign), structural effects were visually observable due to lower irrigation doses applied during the previous season. In this second year, NDVI and TCARI/OSAVI indices strengthened their relationship with Tc-Ta (r2=0.40 and r2=0.43) probably due to the mentioned structural and pigment degradation effects caused by the long-term water stress condition. The relationship between Tc-Ta and the spectral indices was also assessed on each flight time, in order to study their diurnal sensitivity. Results indicate the superior sensitivity of PRI as compared with the structurally-based NDVI, yielding (Tc-Ta vs NDVI) r2=0.01 (7:30 GMT) (Figure 6d) and r2=0.34 (9:30 GMT), and (Tc-Ta vs PRI) r2=0.42 (7:30 GMT) (Figure 6e) and r2=0.68 (9:30 GMT) (Figure 6f). These results suggest that the PRI index is able to track diurnal and spatial changes in water stress as detected through crown temperature changes (a detailed analysis on the detection of water stress in orchard crops as function of airborne-derived Tc-Ta can be found in Sepulcre-Cantó et al. (2006; 2007)). The physiological rationale for finding relationships between crown temperature and water stress is well known and suggested in several studies (Jackson et al., 1977; Idso et al., 1978; Jackson and Pinter, 1981). The use of thermal infrared instruments for stress detection have focused in the past on canopy temperature for monitoring stomatal conductance, based on the effects of water stress on stomatal closure and thermal energy dissipation pathways. Therefore the assessment of the relationships between optical vegetation indices and stomatal conductance would give a further insight on the successful tracking of physiological condition through the PRI index.
53

Chapter 2
r2 = 0.64
-1
0
1
2
3
4
5
6
0 0.02 0.04 0.06
PRI(b)
Tc-T
a (K
)
r2 = 0.15
-1
0
1
2
3
4
5
6
0.38 0.4 0.42 0.44 0.46
NDVI(a)
Tc-T
a (K
)
r2 = 0.09
-1
0
1
2
3
4
5
6
0.17 0.22 0.27
TCARI/OSAVI(c)
Tc-T
a (K
)
r2 = 0.01
0.0
0.2
0.4
0.6
0.8
1.0
1.2
0.35 0.45 0.55 0.65
NDVI(d)
Tc-T
a (K
)
r2 = 0.68
0.0
0.5
1.0
1.5
2.0
2.5
3.0
3.5
0.020 0.025 0.030 0.035 0.040
PRI(f)
Tc-T
a (K
)
r2 = 0.4
0.0
0.2
0.4
0.6
0.8
1.0
1.2
0 0.01
Tc-T
a (K
)
2
0.02 0.03
PRI(e)
Figure 2.6. Relationships obtained between NDVI, TCARI/OSAVI and PRI with Tc-Ta (K) at tree level (a, b and c respectively), and block level at 7:30 GMT (d and e) and 9:30 (f).
54

Assessing canopy PRI for water stress detection
r2 = 0.49
0
1
2
3
4
5
6
7
8
0.00 0.01 0.02 0.03 0.04 0.05
PRI(b)
G (m
m/s
)
r2 = 0.02
0
1
2
3
4
5
6
7
8
0.42 0.47 0.52 0.57
NDVI(a)
G (m
m/s
)
r2 = 0.88
0
1
2
3
4
5
6
7
8
0.020 0.025 0.030 0.035 0.040
PRI(e)
G (m
m/s
)
r2 = 0.56
0.0
0.5
1.0
1.5
2.0
2.5
3.0
0.020 0.025 0.030 0.035
PRI(f)
G (m
m/s
)
Figure 2.7. Relationship between stomatal conductance (G) and NDVI (a), PRI (b) and TCARI/OSAVI (c) at tree scale at 9:30 GMT. At the block scale, the relationships found between conductance and PRI for different times of the day is presented in figures (d), (e) and (f) at 7:30 GMT, 9:30 GMT and 12:30 GMT respectively.
r2 = 0.03
0
1
2
3
4
5
6
7
8
0.21 0.22 0.23 0.24 0.25
TCARI/OSAVI(c)
G (m
m/s
)
r2 = 0.42
0
1
2
3
4
5
6
7
8
0.010 0.015 0.020 0.025
PRI(d)
G (m
m/s
)
55

Chapter 2
Results show that conductance (G) was found to be better related to PRI than to NDVI and TCARI/OSAVI in 2004 and 2005 campaigns (results shown for 2005 campaign at 9:30 GMT at tree level in Figures 7a, 7b and 7c, yielding r2=0.49 for PRI and r2=0.02 for NDVI and r2=0.03 for TCARI/OSAVI). At a block scale (averaging the spectral reflectance from all trees irrigated under the same treatment), relationships were found between PRI and G at the three flight times in 2005 (7:30, 9:30 and 12:30 GMT) with determination coefficients yielding r2=0.42, r2=0.88 and r2=0.56 respectively (Figures 7d, 7e and 7f). Results, therefore, indicate that PRI was able to track diurnal changes in stomatal conductance as function of water stress condition from the airborne imager. More importantly, the lack of relationship found between stomatal conductance and structural and chlorophyll indices such as NDVI and TCARI/OSAVI suggested that changes observed in PRI were not due to structural effects of the water stress level. The use of thermal infrared instruments for stress detection have focused in the past on canopy temperature for monitoring stomatal conductance, based on the effects of water stress on stomatal closure and thermal energy dissipation pathways. Therefore the assessment of the relationships between optical vegetation indices and stomatal conductance would give a further insight on the successful tracking of physiological condition through the PRI index. Results show that conductance (G) was found to be better related to PRI than to NDVI and TCARI/OSAVI in 2004 and 2005 campaigns (results shown for 2005 campaign at 9:30 GMT at tree level in Figures 7a, 7b and 7c, yielding r2=0.49 for PRI and r2=0.02 for NDVI and r2=0.03 for TCARI/OSAVI). At a block scale (averaging the spectral reflectance from all trees irrigated under the same treatment), relationships were found between PRI and G at the three flight times in 2005 (7:30, 9:30 and 12:30 GMT) with determination coefficients yielding r2=0.42, r2=0.88 and r2=0.56 respectively (Figures 7d, 7e and 7f). Results, therefore, indicate that PRI was able to track diurnal changes in stomatal conductance as function of water stress condition from the airborne imager. More importantly, the lack of relationship found between stomatal conductance and structural and chlorophyll indices such as NDVI and TCARI/OSAVI suggested that changes observed in PRI were not due to structural effects of the water stress level. The consistent relationships found between PRI and physiological indicators of water stress, Tc-Ta and stomatal conductance, was assessed against stem water potential, a precise indicator of the plant water status for predicting effects of water deficits on crop yields. As discussed in Sepulcre-Cantó et al. (2007), small changes in the relative water content of leaf tissues corresponds to large changes in leaf water potential (Acevedo et al., 1979; Kramer and Boyer, 1995).
56

Assessing canopy PRI for water stress detection
r2 = 0.07
-50
-40
-30
-20
-10
00.212 0.217 0.222 0.227
TCARI/OSAVI(c)
Ψψ
(c)
r2 = 0.70
-50
-40
-30
-20
-10
0.030 0.032 0.034 0.036
PRI
0
(b)(a)
ψ
r2 = 0.28
-50
-40
-30
-20
-10
00.48 0.50 0.52 0.54
NDVI
Figure 2.8. Relationship between stem water potential (Ψ) and PRI (a), NDVI (b) and TCARI/OSAVI (c) at block scale at 9:30 GMT.
(a)
ψ
(b)
57

Chapter 2
Therefore, although leaf water content may be easily detectable with remote sensing methods, it occurs at advanced stages of dehydration, and therefore represents a parameter of limited interest for predicting crop water status. Relationships found in this study between stem water potential and reflectance indices demonstrate the sensitivity of PRI as function of water stress condition (r2=0.7 at a block level, Figure 8a) with low sensitivity observed for indices such as NDVI (r2=0.28, Figure 8b) and TCARI/OSAVI (r2=0.07, Figure 8c).
r2 = 0.04
-35
-30
-25
-20
-15
-10
-5
00 2 4 6
T (K)(b)
Ψ
r2 = 0.43
-35
-30
-25
-20
-15
-10
-5
0297 298 299 300 301
T (K)(a)
Ψ
r2 = 0.34
-35
-30
-25
-20
-15
-10
-5
00.00 0.01 0.02 0.03 0.04
PRI(d)
12:30 GMT
ψ
7:30 GMT
P (c) RI
-50.010 0.015 0.020 0.025
-10
-15
-20
-25
-30
-35
2 = 0.19r
0
ψ
Figure 2.9. Relationships between stem water potential and crown temperature at 7:30 (a) and 12:30 (b) GMT. Relationships between stem water potential and PRI at the same times (c and d).
58

Assessing canopy PRI for water stress detection
This result is consistent with the previous relationships found for PRI with Tc-Ta and G. Moreover, an additional analysis was conducted to assess the sensitivity of crown temperature and PRI with stem water potential as function of the time of day. Previous studies by Sepulcre-Cantó et al. (2006; 2007) demonstrated the sensitivity of crown temperature with field measured water potential. Nevertheless, such studies demonstrated that crown temperature was better related with water potential early in the morning, suggesting that soil thermal effects near midday affected the correct retrieval of crown temperature. The thermal effects of adjacent soil pixels in non-homogeneous canopies, with mean temperature differences between tree crowns and sunlit soil of 11 K at 9:30 GMT and 23 K at 12:30 (this study) would affect the correct retrieval of crown temperature and therefore the relationships between temperature and water potential. The assessment conducted for all the instrumented crowns under study in this experiment (Figure 9), demonstrates that in early morning (7:30 GMT) (Figure 9a,c), stem water potential is better correlated with temperature (r2=0.43) than with PRI (r2=0.19). At midday (12:30 GMT) (Figure 9b,d), with large thermal effects of adjacent bare soil pixels on the retrieved crown temperature, PRI was demonstrated to better track stem water potential (r2=0.34) than temperature (r2=0.04). Finally, an assessment was conducted to study the relationship between ground-measured steady-state chlorophyll fluorescence (Ft) and image-derived indices and surface temperature. The hypothesis under assessment was that image PRI should be related with field-measured Ft at some degree level, while structural image-derived indices should not be sensitive to fluorescence effects of water stress. Results obtained at 12:30 GMT at tree scale (2004) are shown in Figure 10, yielding r2=0.54 for PRI (Figure 10b), while NDVI and TCARI/OSAVI indices consistently yielded lower determination coefficients (r2=0.22 and r2=0.17, respectively) (Figure 10a,c). Leaf-level measured Ft and image derived Tc-Ta showed a consistent relationship at tree level at 12:30 GMT (r2=0.45; Figure 10d).
59

Chapter 2
r2 = 0.22
0.30
0.32
0.34
0.36
0.38
0.40
0.42
0.44
0.46
0.38 0.40 0.42 0.44 0.46
NDVI(a)
Ft
r2 = 0.54
0.30
0.32
0.34
0.36
0.38
0.40
0.42
0.44
0.46
0.040 0.042 0.044 0.046 0.048
PRI(b)
Ft
r2 = 0.17
0.34
0.36
0.38
0.40
0.42
0.44
0.46
0.22 0.23 0.24 0.25
TCARI/OSAVI(c)
Ft
r2 = 0.45
0.34
0.36
0.38
0.40
0.42
0.44
0.46
0 1 2 3 4 5
Tc-Ta (K)(d)
Ft
Figure 2.10. Relationships obtained between NDVI, PRI, and TCARI/OSAVI with steady-state fluorescence (Ft) at the tree level at 12:30 (a, b and c respectively). Relationship between Ft and Tc-Ta at the same time for individual trees.
60

Assessing canopy PRI for water stress detection
2.3.2. Model simulation with FLIGHT The FLIGHT model was used to simulate the viewing geometry and canopy architecture for the study site used in this study, and then the radiative transfer in that scene. The main objective was to assess BRDF effects on the vegetation indices used to track water stress, specifically PRI, therefore investigating the simulated trend of the PRI bands against the actual observed changes in the reflectance bands over the course of the diurnal experiment. The FLIGHT model was therefore used to simulate three scene configurations, corresponding to each image acquisition for the two years of the experiment (7:30, 9:30 and 12:30 GMT). The 3D scenes corresponding to each airborne overpass (Figure 5a,c,e) were intended to mimic the exact plane attitude, including plane heading and the flight plan designed to fly on the solar plane. The main changes observed in the 3D scene simulations correspond to changes in the crop grid orientation against the solar plane, and the shadows cast by the trees as function of the sun angle (Figure 5b,d,f). As expected, simulated scenes with FLIGHT show larger shadows at earlier times (7.30 GMT), almost disappearing at 12:30 GMT when the sun is at the zenith. Within-crown BRDF effects could then be assessed to study if the diurnal changes of the image-extracted indices were the main driver for the observed relationships with field-measured physiological parameters. The comparison between the spectra extracted from pure crowns on the airborne imagery at three acquisition times (Figure 11a) and the simulated spectra using the FLIGHT model for the three viewing geometries (Figure 11b) shows a consistent agreement in BRDF effects at the 500-600 nm spectral range (Figure 11c and 11d), the region used for the calculation of the PRI index. The three vegetation indices used in this study, NDVI, TCARI/OSAVI and PRI were calculated from the simulated spectra for the three acquisitions times. A comparison between the diurnal trend of the vegetation indices and the diurnal trend of the simulations for pure crowns was conducted. Diurnal changes in NDVI (Figure 12a) and TCARI/OSAVI (Figure 12b) follow the same trend for both image-extracted and model simulated indices, therefore showing consistent diurnal effects caused by BRDF on the crown reflectance. However, diurnal changes in PRI (Figure 12c) show a different trend for the simulated and image-extracted index, supporting the hypothesis that PRI is affected by both BRDF and absorption changes in xanthophyll pigments caused by diurnal water stress changes. Moreover, a different trend in canopy PRI is observed for water stressed and non-stressed trees, which increases at the time of maximum stress (12:30 GMT) (Figure 12c). Differences observed in the PRI trend for stressed and non-stressed trees acquired with airborne imagery is consistent with the measured trend for Tc-Ta for the same times and measured trees (Figure 12d), exhibiting an increasing difference in crown temperature for stressed trees as compared with well-irrigated trees.
61

Chapter 2
AHS
0.00
0.05
0.10
0.15
0.20
0.25
0.30
0.35
0.40
0.45
0.50
0.455 0.555 0.655 0.755
Wavelength(a)
Ref
lect
ance
7:30 GMT
9:30 GMT
12:30 GMT
FLIGHT
0.00
0.05
0.10
0.15
0.20
0.25
0.30
0.35
0.40
0.45
0.50
0.455 0.555 0.655 0.755
Wavelength(b)
Ref
lect
ance
7:30 GMT
9:30 GMT
12:30 GMT
FLIGHT
0.08
0.09
0.10
0.11
0.12
0.13
0.14
0.500 0.520 0.540 0.560 0.580
Wavelength(d)
Ref
lect
ance
7:30 GMT
9:30 GMT
12:30 GMT
AHS
0.060
0.065
0.070
0.075
0.080
0.085
0.090
0.500 0.520 0.540 0.560 0.580
Wavelength(c)
Ref
lect
ance
7:30 GMT
9:30 GMT
12:30 GMT
Figure 2.11. AHS spectra extracted from pure crowns at the three acquisition times (a) and spectra simulated from FLIGHT (b) for three viewing geometries. Spectra in the 500-580 nm region used to calculate PRI (c and d).
62

Assessing canopy PRI for water stress detection
0.01
0.06
0.11
0.16
0.21
0.26
0.31
0.36
7:00 8:00 9:00 10:00 11:00 12:00 13:00
Time (GMT)(b)
TCA
RI/O
SAV
I
Flight
AHS 2004
0 .40
0 .41
0 .42
0 .43
0 .44
0 .4 5
0 .46
0 .4 7
7:00 8 :00 9 :0 0 10 :0 0 11:0 0 12 :0 0 13 :00
Time (GMT)(a)
ND
VI
Flight
AHS 2004
0
1
2
3
4
5
6
7
7:00 8:00 9:00 10:00 11:00 12:00 13:00
Time (GMT)(d)
Tc-T
a (K
)
Non-stressed trees
Stressed trees
0.030
0.035
0.040
0.045
0.050
7:00 8:00 9:00 10:00 11:00 12:00 13:00
T ime (GMT)(c)
PRI
FLIGHTNon-stressed treesStressed trees
Figure 2.12. Comparison between the vegetation indices calculated from AHS imagery and the FLIGHT simulations for NDVI (a), TCARI/OSAVI (b), and PRI (c), observing trend differences between PRI for stressed and non stressed crowns (c) as compared with temperature changes for the same trees over the diurnal cycle (d).
This experiment demonstrates that the images acquired for two years show a consistent diurnal trend change for PRI, probably due to effects of the xanthophyll cycle pigment change function of the water stress levels. The diurnal variation of PRI against Tc-Ta for the monitored trees (r2=0.56, Figure 13) show that well-irrigated trees (R treatment, full ET) remain in the lower left portion of the relationship, showing lower PRI and Tc-Ta values over the course of the diurnal cycle. Water stressed trees (S1 and S2 treatments) show an increment on both PRI and Tc-Ta over the course of the diurnal experiment. These results demonstrate the potential use of a reflective index combined with crown temperature to assess water stress levels over diurnal cycles.
63

Chapter 2
y = 0,2475e59,584x
r2 = 0.56
0
1
2
3
4
5
6
7
0.025 0.03 0.035 0.04 0.045 0.05 0.055
PRI
Tc-T
a
Well irrigated (R)Water Stressed (S2)Water Stressed (S1)
Well irrigated trees
Water stressed trees
Figure 2.13. Diurnal variation of Tc-Ta and PRI for stressed and non-stressed trees, enabling the identification of water stress levels over the course of the diurnal experiment.
A further study was conducted with FLIGHT to assess the effects of sun angle, soil reflectance, and LAI on the PRI index calculated from pure crown reflectance and aggregated pixels. The objective was to investigate the potential undesired BRDF effects on the index used for both temporal and spatial studies with high- and medium-resolution imagery. Figure 14 shows a 3D scene for sun zenith angles ranging between 19.6º and 53.6º, with azimuth angles ranging between 92.4º and 264.4º (Figure 14a to 14f), including the effects of shadows on the canopy reflectance. With a canopy configuration comprising a scene LAI=0.393, fractional cover=0.39, crown LAI=1, LAD=spherical, and a spherical crown shape, simulation results show that PRI is affected by BRDF effects as function of sun angle changes over the course of the day (Figure 14g).
64
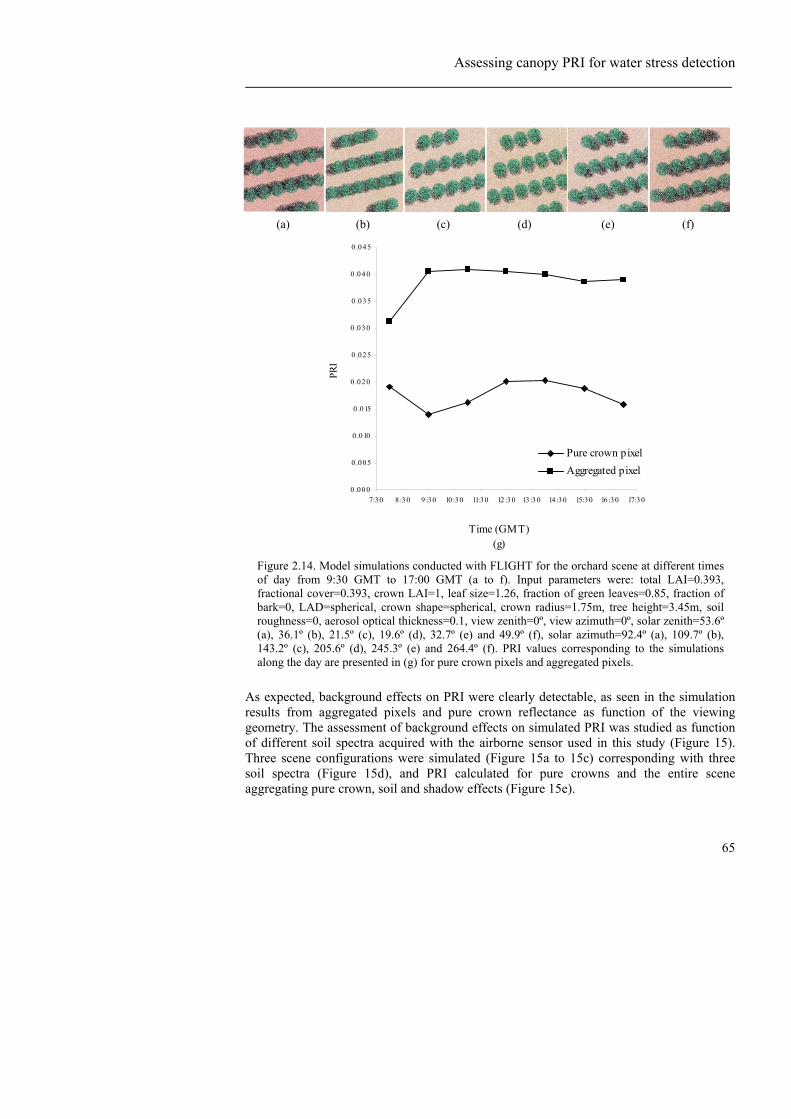
Assessing canopy PRI for water stress detection
(a) (b) (c) (d) (e) (f)
0 .00 0
0 .005
0 .0 10
0 .015
0 .02 0
0 .025
0 .03 0
0 .035
0 .04 0
0 .045
7:30 8 :3 0 9 :30 10 :30 11:30 12 :3 0 13 :3 0 14 :30 15:30 16 :30 17:30
Time (GMT)(g)
PRI
Pure crown pixelAggregated pixel
Figure 2.14. Model simulations conducted with FLIGHT for the orchard scene at different times of day from 9:30 GMT to 17:00 GMT (a to f). Input parameters were: total LAI=0.393, fractional cover=0.393, crown LAI=1, leaf size=1.26, fraction of green leaves=0.85, fraction of bark=0, LAD=spherical, crown shape=spherical, crown radius=1.75m, tree height=3.45m, soil roughness=0, aerosol optical thickness=0.1, view zenith=0º, view azimuth=0º, solar zenith=53.6º (a), 36.1º (b), 21.5º (c), 19.6º (d), 32.7º (e) and 49.9º (f), solar azimuth=92.4º (a), 109.7º (b), 143.2º (c), 205.6º (d), 245.3º (e) and 264.4º (f). PRI values corresponding to the simulations along the day are presented in (g) for pure crown pixels and aggregated pixels.
As expected, background effects on PRI were clearly detectable, as seen in the simulation results from aggregated pixels and pure crown reflectance as function of the viewing geometry. The assessment of background effects on simulated PRI was studied as function of different soil spectra acquired with the airborne sensor used in this study (Figure 15). Three scene configurations were simulated (Figure 15a to 15c) corresponding with three soil spectra (Figure 15d), and PRI calculated for pure crowns and the entire scene aggregating pure crown, soil and shadow effects (Figure 15e).
65

Chapter 2
The simulation results with a scene LAI=0.449, fractional cover=0.45, crown LAI=1, spherical LAD, and a spherical crown shape suggest that large effects on PRI occur as function of the soil background even for pure crown components. Effects due to the component aggregation (crown+soil+shadows) as acquired from medium resolution sensors are also observable. These results are especially important when conducting spatial assessments of the PRI index in low LAI canopies. The simulated variation in PRI for the three soil spectra in targeted crowns ranged from 0.035 to 0.05, due to soil background effects on the index. The range of variation for PRI in the simulation is the same as that obtained as function of water stress effects (Figure 13); this implies that a careful assessment needs to be conducted when performing spatial analyses of PRI due to the potentially large background effects on PRI which could be incorrectly attributed to stress levels. Soil 1 Soil 2 Soil 3 (a) (b) (c)
0
0.1
0.2
0.3
0.4
0.5
0.6
455 513 571 630 689 746 804
Wavelength (nm)(d)
Refle
ctan
ce
Soil 1Soil 2Soil 3
0.03
0.04
0.05
0.06
0.07
1 2
Soil(e)
PRI
3
Aggregated pixelsPure crown pixels
Figure 2.15. Model simulations conducted with FLIGHT for the orchard scene with different soil types (a to c, spectra shown in d). Input parameters were: total LAI=0.449, fractional cover=0.449, crown LAI=1, leaf size=1.26, fraction of green leaves=0.85, fraction of bark=0, LAD=spherical, crown shape=spherical, crown radius=1.75m, tree height=3.45m, soil roughness=0, aerosol optical thickness=0.1, view zenith=0º, view azimuth=0º, solar zenith=21.36º, solar azimuth= 20.94º. The input soil spectra were acquired from the AHS imagery (spectra presented in (d)) and changed for each simulation. The effect of the different soil types (1, 2 and 3) on PRI is presented in (e) for pure crown pixels and aggregated pixels.
66

Assessing canopy PRI for water stress detection
(a) (b) (c) (d) (e)
0
0.01
0.02
0.03
0.04
0.05
0.06
1 2 3 4 5
crown LAI(f)
PRI
Aggregated pixelsPure crown pixels
Figure 2.16. Model simulations conducted with FLIGHT for the orchard scene as function of crown LAI variation. Input parameters were: total LAI=0.449 (a), 0.898 (b), 1.347 (c), 1.796 (d), 2.255 (e), fractional cover=0.449, crown LAI=1, 2, 3, 4, 5 (respectively), leaf size=1.26, fraction of green leaves=0.85, fraction of bark=0, LAD=1, crown shape=spherical, crown radius=1.75m, tree height=3.45m, soil roughness=0, aerosol optical thickness=0.15, view zenith=0º, view azimuth=0º, solar zenith=21.36º, solar azimuth= 20.94º. PRI as function of crown LAI is presented in (f) for pure crown pixels and aggregated pixels.
Finally, the effects of scene LAI were assessed for a range between LAI=0.5 and LAI=2.2 (Figure 16a to 16e) considering a fractional cover=0.5, crown LAI ranging between 1 and 5, spherical LAD, and crown spherical shape. Simulation results for crown pixels and aggregated components (Figure 16f) shows large variations on PRI as function of LAI variation. LAI effects on PRI at the crown level are critical, and could be incorrectly attributed to stress condition, with a decreasing trend on PRI as LAI increases. The simulations conducted to assess the effects of the viewing geometry, background and LAI on crown and scene PRI demonstrates that they need to be seriously considered when generating spatial maps of PRI from airborne and satellite imagery to assess vegetation condition.
67

Chapter 2
2.4. CONCLUSIONS The diurnal airborne campaigns conducted for two years over an experimental crop field demonstrate that the airborne-level PRI index is sensitive to the de-epoxidation of the xanthophyll pigment cycle caused by water stress levels. Among the three vegetation indices calculated from the airborne imagery at 2 m spatial resolution, PRI, TCARI/OSAVI, as an indicator of chlorophyll a+b concentration, and NDVI, used to track structural changes on the canopy, only airborne PRI demonstrated sensitivity to diurnal changes in physiological indicators of water stress, such as canopy temperature minus air temperature (Tc-Ta), stomatal conductance (G), and stem water potential (ψ) measured in the field at each time of image acquisition. No relationships were found over the diurnal experiment between NDVI and TCARI/OSAVI with tree-measured physiological measures. Moreover, a relationship was also found between leaf-level steady-state fluorescence (Fs) and image PRI calculated from the same trees monitored over the course of the diurnal flight campaigns. The 2 m spatial resolution imagery acquired three times over the course of the day with the AHS sensor enabled targeting crowns and extracting image based information in the VIS-NIR region for vegetation index calculation, as well as in the thermal region for crown temperature monitoring. The effects of the bi-directional reflectance distribution function changes in the vegetation indices used in this study were simulated with the 3D FLIGHT canopy reflectance model linked with PROSPECT leaf model. AHS reflectance spectra were compared with those from model-simulated scenes that accounted for the viewing geometry configuration as function of the airborne acquisitions conducted on the solar plane. Diurnal trends in the airborne vegetation indices demonstrate that NDVI and TCARI/OSAVI are well simulated by crown-level simulations with FLIGHT, capturing the BRDF changes associated with the sun angle changes. On the other hand, the canopy model did not simulate correctly the image-observed diurnal changes in PRI, demonstrating that PRI bands are affected diurnally by the confounding effects of BRDF effects and the de-epoxidation of the xanthophyll pigment function of water stress. Moreover, differences observed in diurnal crown PRI for well-watered and water-stressed trees at mid-day depression agree with diurnal trends on Tc-Ta at the same times. These results confirm that diurnal changes observed in PRI are both structurally and physiologically driven, and not only affected by BRDF. A relationship obtained between Tc-Ta (thermal region) and PRI (reflective region) for single days enabled the identification of trees under water stress. Well watered trees remained with low Tc-Ta and PRI values over the course of the day, while stressed trees increased their temperature and PRI. The simulation assessment on the effects on PRI as function of sun angle, soil background, and crown LAI demonstrate that PRI is highly affected by the canopy structure and background. Changes in PRI as function of canopy LAI are comparable to those found as function of water stress levels. Therefore a careful assessment of canopy structure variability needs to be conducted when PRI is used to study the spatial distribution of
68

Assessing canopy PRI for water stress detection
vegetation stress. Soil background and canopy LAI are key factors to account for when PRI is used to detect water stress.
Acknowledgements Financial support from the Spanish Ministry of Science and Education (MEC) for the projects AGL2003-01468 and AGL2005-04049 are gratefully acknowledged, as well as the support of grant from INIA (RTA02-070), European Union 6th Framework Programme (INCO-CT-654 2004-509087), and MEC CONSOLIDER-RIDECO (CSD2006-00067). C. Ruz, J. Fortea, A. Gillespie, L. Balick and the GCU members M. Zaragoza, G. Soria, M. Romaguera and J. Cuenca are acknowledged for measurements and technical support in the field campaign. F. Villalobos, E. Fereres, F. Orgaz, L. Testi, A. Prieto, P. North, and I. Calatrava are acknowledged for scientific and technical support.
69

Chapter 2
REFERENCES Acevedo, E., Fereres, E., Hsiao, T. and Henderson, D. (1979). Diurnal Growth Trends,
Water Potential, and Osmotic Adjustement of Maize and Sorghum Leaves in the Field. Plant Physiology, 64, 476-480.
Asner, G.P., Carlson, K.M. and Martin, R.E. (2005) Substrate age and precipitation effects on Hawaiian forest canopies from spaceborne imaging spectroscopy. Remote Sensing of Environment, 98, 457-467.
Barton, C.V.M. and North, P.R.J. (2001). Remote Sensing of canopy light use efficiency using the photochemical reflectance index. Model and analysis. Remote Sensing of Environment, 78, 264, 273.
Ben-Dor, E., and N. Levin (2000), Determination of surface reflectance from raw hyperspectral data without simultaneous ground data measurements: a case study of the GER 63-channel sensor data acquired over Naan, Israel, International Journal of Remote Sensing, 21:2053-2074.
Berk, A., Anderson, G. P., Acharya, P. K., Chetwynd, J. H., Bernstein, L. S., Shettle, E. P., Matthew, M. W., and Adler-Golden, S. M. (1999). MODTRAN4 user’s manual, Air Force Research Laboratory, Hanscom AFB, MA.
Daughtry, C.S.T., Walthall, C.L., Kim, M.S., Brown de Colstoun, E., and McMurtrey III, J.E. (2000), Estimating corn leaf chlorophyll concentration from leaf and canopy reflectance, Remote Sensing of theEnvironment, 74:229-239.
Disney, M.I., Lewis, P. and North, P.R.J. (1999). Montecarlo ray tracing in optical canopy reflectance modelling. Remote Sensing reviews 18 (2-4), 197-226.
Dobrowsky, S.Z., Pushnik, J.C., Zarco-Tejada, P.J. and Ustin, S.L. (2005). Simple reflectance indices track heat and water stress-induced changes in steady-state chlorophyll fluorescence at the canopy scale. Remote Sensing of Environment 97, 403-414.
Drolet, G.G., Huemmrich, K.F., Hall, F.G., Middleton, E.M., Black, T.A., Barr, A.G. and Margolis, H.A. (2005). A MODIS-derived photochemical reflectance index to detect inter-annual variations in the photosynthetic light-use efficiency of a boreal deciduous forest. Remote Sensing of Environment, 98, 212-224.
Evain, S., Flexas, J. and Moya, I. (2004). A new instrument for passive remote sensing: 2. Measurement of leaf and canopy reflectance changes at 531 nm and their relationship with photosynthesis and chlorophyll fluorescence. Remote Sensing of Environment, 91, 175-185.
Filella, I., Amaro, T., Araus, J.L. and Peñuelas, J. (1996). Relationship between photosynthetic radiation-use efficiency of barley canopies and the photochemical reflectance index (PRI). Physiologia Plantarum 96: 211-216.
Filella, I., Peñuelas, J., Llorens, L. and Estiarte, M. (2004). Reflectance assessment of seasonal and annual changes in biomasa and CO2 uptake of a Mediterranean shrubland submitted to experimental warming and drought. Remote Sensing of Environment, 90, 308-318.
Fuentes, D.A., Gamon, J.A., Cheng, Y., Claudio, H.C., Qiu, H.L., Mao, Z., Sims, D.A., Rahman, A.F., Oechel, W. and Luo, H. (2006). Mapping carbon and water vapour
70

Assessing canopy PRI for water stress detection
fluxes in a chaparral ecosystem using vegetation indices derived from AVIRIS. Remote Sensing of Environment, 103, 312-323.
Gamon, J.A., Peñuelas, J. and Field, C.B. (1992). A narrow-wave band spectral index that track diurnal changes in photosynthetic efficiency. Remote Sensing of Environment 41, 35-44.
Gamon, J.A., Serrano, L. and Surfus, J.S. (1997) The photochemical reflectance index: an optical indicator of photosynthetic radiation use efficiency across species, functional types and nutrient levels. Oecologia, 112, 492-501.
Gamon J.A. and Surfus JS. (1999) Assessing leaf pigment content and activity with a reflectometer. New Phytologist 143 105-117.
Goel, N. S. and Thompson, R. L. (2000). "A snapshot of canopy reflectance models and a universal nodel for the radiation regime." Remote Sensing Reviews 18(2): 197-225.
Guo, J and Trotter, C.M. (2004). Estimating photosynthetic light-use efficiency using the photochemical reflectance index: variations among species. Functional Plant Biology, 31, 255-565.
Haboudane, D., Miller, J.R., Tremblay, N., Zarco-Tejada, P.J. and Dextraze, L. (2002). Integrated narrow-band vegetation indices for prediction of crop chlorophyll content for application to precision agriculture. Remote Sensing of Environment 84 (2-3), 416-426.
Haboudane, D., Miller, J.R., Pattey, E., Zarco-Tejada, P.J., and Strachan, I. (2004), Hyperspectral vegetation indices and novel algorithms for predicting green LAI of crop canopies: modeling and validation in the context of precision agriculture, Remote Sensing of Environment, 90(3), 337-352.
Idso, S.B., Jackson, R.D. and Reginato, R.J. (1978), Extending the “degree day” concept of phenomenological development to include water stress effects. Ecology 59, 431-433.
Jackson, R.D. and Pinter Jr., P.J. (1981). Detection of water stress in wheat by measurement of reflected solar and emitted thermal IR radiation. In: Spectral Signatures of Objects in Remote Sensing, Institut National de la Reserche Agronomique, Versalles, France, pp. 399-406.
Jackson R.D., Idso, S.B., Reginato R.J. and Ehrier, W.L. (1977). Crop temperature reveals stress. Crop soils 29, 10-13.
Koetz, B., Baret, F., Poilvé, H. and Hill, J. (2005). Use of coupled canopy structure dynamic and radiative transfer models to estimate biophysical canopy characteristics. Remote Sensing of Environment 95(1): 115-124.
Kramer, P.J. and Boyer, J.S. (1995). Water relations of plants and soils. Academic Press. San Diego, CA, USA.
Louis, J., Ounis, A., Ducruet, J.M., Evain, S., Laurila, T., Thum, T., Aurela, M., Wingsle, G., Alonso, L., Pedros, R. and Moya, I. (2005). Remote Sensing of sunlight-induced chlorophyll fluorescence and reflectance of Scots pine in the boreal forest during spring recovery. Remote Sensing of Environment, 96, 37-48.
Mariscal, M.J., Orgaz, F. and Villalobos, F.J., (2000). Modelling and measurement of radiation interception by olive canopies. Agricultural and forest meteorology 100, 183-197.
Nakaji, T., Oguma, H. and Fujinuma, Y. (2006). International Journal of Remote Sensing, 27(3), 493-509.
71
Chapter 2
Nichol, C.J., Huemmrich, K.F., Black, T.A., Jarvis, P.G., Walthall, J.G. and Hall, F.G. (2000). Remote sensing of photosynthetic-light-use efficiency of boreal forest. Agricultural and forest meteorology, 101, 131-142.
Nichol, C.J., Lloyd, J., Shibistova, O., Arneth, A., Röser, C., Knohl, A., Matsubara, S and Grace, J. (2002). Remote Sensing of photosynthetic-light-use-efficiency of a Siberian boreal forest. Tellus, 54B, 677-687.
Nichol, C.J., Rascher, U., Matsubara, S. and Osmond, B. (2006). Assessing photosynthetic efficiency in an experimental mangrove canopy using remote sensing and chlorophyll fluorescence. Trees, 20, 9-15.
North, P.R.J. (1996). Three-dimensional forest light interaction model using a montecarlo method. IEEE Transactions on Geosciences and Remote Sensing 34 (5), 946-956.
Peñuelas, J., Gamon, J.A., Fredeen, A.L., Merino, J. and Field, C.B. (1994). Reflectance indices associated with physiological changes in Nitrogen- and water-limited sunflower leaves. Remote Sensing of Environment, 48, 135-146.
Peñuelas, J. and Inoue, Y. (2000) Reflectance assessment of canopy CO2 uptake. International Journal of Remote Sensing 21, 3353-3356.
Pérez-Priego, O., Zarco-Tejada, P.J., Sepulcre-Cantó, G, Miller, J.R., and Fereres, E. (2005). Detection of Water Stress in Orchard Trees with a High-Resolution Spectrometer through Chlorophyll Fluorescence in-filling of the O2-A band, IEEE Transactions on Geoscience and Remote Sensing, 43, 2860-2869.
Rahman AF, Cordova VD, Gamon JA, Schmid HP and Sims DA (2004). Potential of MODIS ocean bands for estimating CO2 flux from terrestrial vegetation: a novel approach. Geophysical Research Letters, 31.
Richardson, A.D. and Berlyn G.P. (2002). Spectral reflectance and photosynthetic properties of Betula papyrifera (Betulaceae) leaves along an elevational gradient on Mt.Mansfield, Vermont, USA. American Journal of Botany, 89(1), 88-94.
Richardson, A.D., Berlyn, G.P. and Duigan, S.P. (2003). Reflectance of Alaskan black spruce floliage in relation to elevation and latitude, Tree Physiology 23, 537-544.
Rondeaux, G., Steven, M. and Baret, F. (1996). Optimization of soil-adjusted vegetation indices. Remote Sensing of Environment 55 (2), 95-107.
Rouse, J. (1974). Monitoring the Vernal Advancement and Retrogradation (greenwave Effect) of Natural Vegetation.
Sepulcre-Cantó, G., Zarco-Tejada, P.J., Jiménez-Muñoz, J.C., Sobrino, J.A., de Miguel, E., and Villalobos, F.J., (2006). Within-field thermal variability detection as function of water stress in Olea europaea L. orchards with high spatial remote sensing imagery. Agricultural and Forest Meteorology, 136, 31-44.
Sepulcre-Cantó, G., Zarco-Tejada, P.J., Jiménez-Muñoz, J.C., Sobrino, J.A., Soriano, M.A., Fereres, E. , Vega V. , and Pastor , M.. Monitoring yield and fruit quality parameters in open-canopy tree crops under water stress. Implications for ASTER. Remote Sensing of Environment, In Press, Corrected Proof, Available online 17 November 2006.
Serrano, L. and Peñuelas, J. (2005). Assessing forest structure and function from spectral transmittance measurements: a case study in a Mediterranean holm oak forest. Tree Physiology, 25, 67-74.
72
Assessing canopy PRI for water stress detection
Sims, D.A. and Gamon, J.A. (2002). Relationships between leaf pigment content and spectral reflectance across a wide range of species, leaf structures and developmental stages. Remote Sensing of Environment, 81, 337-354.
Sims, D.A., Luo, H., Hastings, S., Oechel, W.C., Rahman, A.F. and Gamon, J.A. (2006). Parallel adjustment in vegetation greenness and ecosystem CO2 exchange in response to drought in a Southern California chaparral ecosystem. Remote Sensing of Environment, 103, 289-303.
Sobrino, J.A., Jiménez-Muñoz, J.C., Zarco-Tejada, P.J., Sepulcre-Cantó, G. and de Miguel, E. (2006). Land Surface Temperature derived from Airborne Hyperspectral Scanner Thermal Infrared data. Remote Sensing of Environment, 102, 99–115.
Strachan, I.B., Pattey, E. and Boisvert, J.B. (2002). Impact of nitrogen and environmental conditions on corn as detected by hyperspectral reflectance. Remote Sensing of Environment, 80, 213-224.
Stylinski, C.D., Gamon, J.A. and Oechel, W.C. (2002). Seasonal patterns of reflectance indices, carotenoid pigments and photosynthesis of evergreen chaparral species. Oecologia, 131, 366-374.
Tambussi EA, Casadesus J, Munne-Bosch SM and Araus JL (2002) Photoprotection in water-stressed plants of durum wheat (Triticum turgidum var. durum): changes in chlorophyll fluorescence, spectral signature and photosynthetic pigments. Functional Plant Biology, 29 35-44.
Thenot, F., Méthy, M. and Winkel, T. (2002). The Photochemical Reflectance Index (PRI) as a water-stress index. International Journal of Remote Sensing, 23(23), 5135-5139.
Trotter, G.M., Whitehead, D. and Pinkney, E.J. (2002). The photochemical reflectance index as a measure of photosynthetic light use efficiency for plants with varying foliar nitrogen contents. International Journal of Remote Sensing, 23(6), 1207-1212.
Weng, G.H, Chen, Y.N. and Liao, T.S. (2006). Relationships between chlorophyll fluorescence parameters and photochemical reflectance index of tree species adapted to different temperature regimes. Functional Plant Biology, 33, 241-246.
Weng, J.H., Liao, T.S., Hwang, M.Y., Chung, C.C., Lin, C.P. and Chu, C.H. (2006). Seasonal variation in photosystem II efficiency and photochemical reflectance index of evergreen trees and perennial grasses growing at low and high elevations in subtropical Taiwan. Tree Physiology, 26, 1097-1104.
Whitehead, D., Boelman, N.T., Turnbull, M.H., Griffin, K.L., Tissue, D.T., Barbour, M.M., Hunt, J.E., Richardson, S.J. and Peltzer, D.A. (2005) Photosynthesis and reflectance indices for rainforest species in ecosystems undergoing progression along a soil fertility chronosequence in New Zealand. Oecologia, 144, 233-244.
Winkel, T., Méthy, M. and Thénot, F. (2002). Radiation use efficiency, chlorophyll fluorescence , and reflectance indices associated with ontogenic changes in water-limited Chenopodium quinoa leaves. Photosynthetica, 40(2), 227-232.
Zarco-Tejada, P.J., Miller, J.R., Mohammed, G.H., and Noland, T.L., (2000). Chlorophyll Fluorescence effects on Vegetation Apparent Reflectance: I. Leaf-level Measurements and Model Simulation. Remote Sensing of Environment, 74(3), 582-595.
Zarco-Tejada, P.J., Miller J.R., Morales A., Berjón A., and Agüera J. (2004) Hyperspectral Indices and Model Simulation for Chlorophyll Estimation in Open-Canopy Tree Crops, Remote Sensing of Environment, 90(4), 463-476.
73

Chapter 2
74
Zarco-Tejada, P.J., Berjón, A., López-Lozano, R., Miller, J.R., Martín, P., Cachorro, V.; González M.R. and de Frutos, A. (2005). Assessing vineyard condition with hyperspectral indices: Leaf and Canopy reflectance simulation in a row-structured discontinuous canopy. Remote Sensing of Environment 99, 271-287.

Modelling PRI for water stress detection
Chapter 3
Modelling PRI for water stress detection using Radiative Transfer Models
L. Suárez1, P.J. Zarco-Tejada1, J.A.J. Berni1, V. González-Dugo1, E. Fereres1,2 1Instituto de Agricultura Sostenible (IAS), Consejo Superior de Investigaciones Científicas (CSIC), Córdoba, Spain 2Department of Agronomy, University of Cordoba, Campus Universitario de Rabanales, 14014 Córdoba, Spain From: Suárez, L., Zarco-Tejada, P.J., Berni, J.A.J., González-Dugo, V. and Fereres, E., (2009). Modelling PRI for Water Stress Detection using Radiative Transfer Models. Remote Sensing of Environment, 113, 730-744.
75

Chapter 3
76

Modelling PRI for water stress detection
RESUMEN En este estudio se presenta una metodología para la detección de estrés hídrico en vegetación usando modelos de transferencia radiativa y el Indice de Reflectancia Fotoquímica (Photochemical Reflectance Index, PRI). Para ello, se llevaron a cabo campañas de vuelos sobre tres cultivos distintos, 2 cultivos arbóreos (olivo y melocotonero) y un cultivo herbáceo (maíz), obteniendo imágenes multiespectrales de 15 cm de resolución espacial y 10 nm de FWHM. La metodología presentada, basada en el índice PRI como indicador de estrés hídrico, utiliza modelos de transferencia radiativa para obtener valores teóricos de PRI correspondientes a vegetación que no sufre estrés. La estructura foliar, concentración de clorofila y el índice de área foliar de la cubierta se tienen en cuenta para obtener dicho valor teórico ya que las simulaciones demuestran que el PRI esta afectado por los parámetros mencionados anteriormente, el tipo de suelo y las geometrías solar y de visión del sensor. Por lo tanto, la metodología presentada utiliza los parámetros bioquímicos y estructurales de la vegetación para obtener un valor teórico o de referencia de PRI correspondiente a vegetación sana (sPRI). Las simulaciones se llevaron a cabo el modelo de transferencia radiativa a nivel foliar PROSPECT acoplado al modelo 3D a nivel de cubierta FLIGHT para los cultivos arbóreos y con PROSPECT acoplado al modelo SAILH para el maíz. Los resultados confirman que PRI es un indicador pre-visual de estrés hídrico, obteniéndose buenas relaciones con temperatura de cubierta y conductancia estomática para los tres cultivos estudiados (r2=0.65 para olivo, r2=0.8 para melocotonero, y r2=0.72 para maíz). Los valores de PRI de los árboles en los tratamientos de riego deficitario fueron consistentemente más altos que el valor teórico, obteniéndose al mismo tiempo una relación con potencial hídrico de tallo (r2=0.84) que permitía la identificación de las copas que estaban sufriendo estrés hídrico. La metodología que se presenta está basada en la parte visible del espectro electromagnético y tiene implicaciones importantes para la aplicación de la teledetección en el ámbito de la agricultura de precisión ya que puede ser una buena alternativa a usar información térmica cuya disponibilidad a alta resolución espacial es muy limitada. Palabras clave: estrés hídrico, Indice de Reflectancia Fotoquímica, PRI, teledetección multiespectral, térmico, modelos de transferencia radiativa.
77

Chapter 3
ABSTRACT This paper presents a methodology for water stress detection in crop canopies using a radiative transfer modelling approach and the Photochemical Reflectance Index (PRI). Airborne imagery was acquired with a 6-band multispectral camera yielding 15 cm spatial resolution and 10 nm FWHM over 3 crops comprising two tree-structured orchards and a corn field. The methodology is based on the PRI as a water stress indicator, and a radiative transfer modelling approach to simulate PRI baselines for non-stress conditions as a function of leaf structure, chlorophyll concentration (Cab), and canopy leaf area index (LAI). The simulation work demonstrates that canopy PRI is affected by structural parameters such as LAI, Cab, leaf structure, background effects, viewing angle and sun position. The modelling work accounts for such leaf biochemical and canopy structural inputs to simulate the PRI-based water stress thresholds for non-stress conditions. Water stress levels are quantified by comparing the image-derived PRI and the simulated non-stress PRI (sPRI) obtained through radiative transfer. PRI simulation was conducted using the coupled PROSPECT-SAILH models for the corn field, and the PROSPECT leaf model coupled with FLIGHT 3D radiative transfer model for the olive and peach orchards. Results obtained confirm that PRI is a pre-visual indicator of water stress, yielding good relationships for the three crops studied with canopy temperature, an indicator of stomatal conductance (r2=0.65 for olive, r2=0.8 for peach, and r2=0.72 for maize). PRI values of deficit irrigation treatments in olive and peach were consistently higher than the modelled PRI for the study sites, yielding relationships with water potential (r2=0.84) that enabled the identification of stressed crowns accounting for within-field LAI and Cab variability. The methodology presented here is based on the visible part of the spectrum and it has important implications for remote sensing applications in agriculture. This method may be a better alternative to using the thermal region, which has limitations to acquire operationally high spatial resolution thermal imagery.
Keywords: water stress, Photochemical Reflectance Index, PRI, multispectral remote sensing, thermal, radiative transfer modelling.
78

Modelling PRI for water stress detection
3.1 INTRODUCTION The Photochemical Reflectance Index (PRI) was proposed by Gamon et al. (1992) as an indicator of the de-epoxidation state of the xanthophyll pigments related with photosynthetic processes. It is based on a normalized difference of the 530 nm band where xanthophyll pigment absorption occurs, and a reference band located at 570 nm. As the xanthophyll pigments are related to light absorption mechanisms, the PRI index has been extensively linked to light use efficiency (LUE) at the leaf scale (Serrano and Peñuelas, 2005; Guo and Trotter, 2004; Sims et al., 2006; Nakaji et al., 2006), at canopy scale using field spectrometers (Trotter et al., 2002; Strachan et al., 2002; Nichol et al., 2000 and 2002) and using satellite imagery such as EO-1 Hyperion (Asner et al., 2005), MODIS (Drolet et al., 2005) and AVIRIS (Fuentes et al., 2006). The estimation of LUE through the remote sensing PRI index has shown a direct link to photosynthesis rate assessment (Nichol et al., 2000 and 2006; Guo and Trotter, 2004; Sims et al., 2006). In addition, photosynthesis has also been related to PRI through chlorophyll fluorescence and non-photochemical quenching (Evain et al., 2004 and Nichol et al., 2006). The early detection of water stress is a key issue to avoid yield loss, which can be affected even by short-term water deficits (Hsiao et al., 1976). The pre-visual detection of water stress has been successfully achieved with remote sensing data using thermal infrared radiation since long ago (Idso et al., 1978; 1981; Jackson et al., 1977; 1981; Jackson and Pinter, 1981; Leinonen and Jones, 2004; Wanjura et al., 2004; Cohen et al., 2005 and Sepulcre-Cantó et al., 2006; 2007; Mollër, 2007), and more recently being suggested the visible spectral region with the PRI index as an indicator of stress (Thenot et al., 2002; Suárez et al., 2008; Peguero-Pina et al., 2008). Alternatively, thermal imagery acquired over vegetation is sensitive to canopy transpiration because temperature is raised due to the reduction in evaporative cooling under stress conditions. Thermal remote sensing of water stress has been accomplished using spectrometers at ground level (Idso et al., 1981; Jackson et al., 1977 and 1981), thermal sensors at image level (Cohen et al., 2005; Leinonen and Jones, 2004; Sepulcre-Cantó et al., 2007) and using satellite thermal information (Sepulcre-Cantó et al., 2009). It is well known that severe water deficits affect many physiological processes and have a strong impact on yield (Hsiao et al., 1976). However, even moderate water deficits, which are not easy to detect, can also have important negative effects on yield (Hsiao and Bradford, 1983). It is important to be able to assess the level of stress through some pertinent indicators. This is the case of the xanthophyll cycle response to stress tracked by the PRI index, which is suggested as a pre-visual indicator of water stress and is the aim of this study. PRI has been used to assess pre-visual water stress in the work by Thenot et al. (2002) and Winkel et al. (2002) at leaf level, at canopy level (Evain et al., 2004; Dobrowsky et al., 2005; Sun et al., 2008; Peguero-Pina et al., 2008) and using airborne imaging spectroscopy (Suarez et al., 2008). Both indicators, canopy temperature and PRI, are complementary; they provide physiological information related to plant water status, transpiration and photosynthesis. High spatial resolution imagery in the visible and near
79

Chapter 3
infrared region is relatively easy to acquire with current airborne and satellite sensors, such as AHS, Hymap, CASI, AVIRIS, and Hyperion, among others. On the contrary, high-resolution thermal sensors are not common due to technical limitations of microbolometer technology. Moreover, high resolution thermal imagers onboard satellite platforms are restricted due to technical limitations. Current thermal medium resolution sensors on satellite platforms are limited to ASTER and LANDSAT sensors, offering spatial resolutions limited to the 60-120 m pixel-size range. These current technical limitations for acquiring high-spatial resolution thermal imagery emphasize the need for developing pre-visual water stress indicators in the VIS/NIR region for agricultural and precision farming methods. Technically, CMOS and CCD VIS/NIR imaging sensors based on silicon detectors provide very high spatial resolution with pixel sizes at the centimetre level and cost-effective for precision agriculture imagers and future satellite platforms. Thus, attention must be placed on VIS/NIR narrow-band indicators of pre-visual stress, such as PRI, as well as chlorophyll fluorescence for stress-detection methods (Thenot et al., 2002; Dobrowsky et al., 2005; Perez-Priego et al., 2005; Suarez et al., 2008). Nevertheless, the PRI index cannot be readily used to map vegetation stress without considering leaf and canopy structural effects on the index. PRI bands at 531 and 570 nm are affected by both leaf and canopy parameters such as chlorophyll content (Cab), dry matter (Cm), leaf thickness, leaf area index (LAI), and leaf angle distribution function (LADF), among others (Barton and North, 2001; Suárez et al., 2008). Thus, PRI maps obtained over canopies with variable LAI mask the sensitivity of the index to stress, mostly tracking the spatial variation of the canopy leaf area density and structure (Barton and North, 2001; Suárez et al., 2008). Consequently, modelling work at leaf and canopy scale is needed to enable an operational application of PRI to map water stress in non-homogeneous canopies where structural changes play the main role in the reflectance signature. A new modelling method is presented in this paper based on radiative transfer simulation to estimate a theoretical PRI baseline for non-stress conditions for two tree species, olive and peach, and for an herbaceous continuous canopy of maize. The method compares imaged PRI with theoretical non-stress PRI obtained through model inversion for existing structural and background conditions, defining a within field threshold to detect stressed vegetation.
3.2 METHODS
3.2.1. Study sites The three main study sites used for field and airborne data collection are located in Córdoba, southern Spain (37.8°N, 4.8°W), on soils classified as Typic Xerofluvents. The climate is Mediterranean with an annual rainfall of 650 mm concentrated between autumn and spring. The first study site corresponds to a 4 ha irrigated -olive orchard (Olea europaea L. cv. “Arbequino”) established in 1997 in a 3.5x7 m grid. The tree lines follow a north–south direction and the trees were planted on ridges to avoid flooding. The soil had a sandy stratum at 1.5 m and was kept under no-tillage with herbicides. The experiment was designed in an area of six rows where three drip-irrigation treatments were applied,
80

Modelling PRI for water stress detection
differing in water amounts: (i) constant application rate of 2.8 mm/day during the irrigation season (enough to meet the tree demand, this treatment was used as a reference, R), (ii) application rate of 0.7 mm/day (deficit treatment RDI1), and (iii) an application rate of 1.2 mm/day during the periods between 14 June to 5 July, and from 6 September to 19 October (deficit treatment RDI2). Additional information about the study site and the experiments can be found in previous publications (Perez-Priego et al., 2005 and Sepulcre-Cantó et al., 2006). Figure 1a depicts the olive orchard and the treatment block location within the olive grove.
R
RDI 2RDI 1
(a)
RDI
R
(b) (c)
Figure 3.1. Overview of the field experiments presented in this study: (a) olive orchard and the three irrigation treatments applied: Full irrigation (R), and two regulated deficit irrigation treatments (RDI1, RDI2); (b) peach orchard with one full irrigation treatment (R) and a regulated deficit irrigation treatment (RDI); and (c) corn field with 24 different cultivars replicated three times.
81

Chapter 3
The second study site was within a commercial peach orchard (Prunus persica cv. “BabyGold8”) planted in 1990 in north-south direction in a 5x3.3 m grid on a loam soil without restrictions for root growth down to 3 m depth. A subset of 6 lines x 30 peach trees each were irrigated differently than the rest of the orchard. The non-stressed trees were drip irrigated starting on 18th May 2007 with an application rate equivalent to 80% of calculated crop ET. The regulated deficit irrigation treatment (RDI) started irrigation on 5th July at Stage III of fruit development (rapid growth stage) over-irrigating afterwards until tree water status was fully recovered. The concept of regulated deficit irrigation (RDI) was first proposed by Chalmers et al. (1981) to control vegetative growth in peach orchards applying water deficits that did not reduce economic yield (Fereres and Soriano, 2007).
The third study site consisted on a maize field that had 24 varieties replicated three times, yielding a total of 72 plots of 3 m x 9 m area. Irrigation had not been applied prior to image acquisition on 6th of June 2007. Afterwards, irrigation was applied and by the 2nd of July when a second airborne image was acquired, the crop had recovered from water stress. The genetic variability of the different maize cultivars generated a gradient in their phenological stages of development, and consequently, there was variability in LAI values between the different plots.
A fourth study site located in Zaragoza (Northern Spain, 41°46’ North, 1°37’ East) was used to conduct an intensive leaf sampling campaign to study the leaf optical properties of a peach orchard using an integrating sphere in the laboratory. The leaf optical properties of the leaves varied greatly due to nutrient stress conditions found in areas of the field.
3.2.2. Leaf-level measurements Reflectance and transmittance measurements from leaves with different chlorophyll content and water stress levels were conducted to assess the influence of stress on the visible spectral region and, particularly, on the PRI index. In addition, optical variability of leaves enabled the estimation of the structural leaf parameter N (used in PROSPECT) required later for the modelling approach presented here (the complete experiment is described in Kempeneers et al., 2008). The instrument used was a Li-Cor 1800-12 integrating sphere (Li-Cor, Lincoln, NE, USA) coupled to a fibre optics spectrometer (Ocean Optics model USB2000 spectrometer, Ocean Optics, Dunedin, FL, USA). Reflectance and transmittance measurements of peach (Figure 2a and 2b) and olive leaves (Figure 2c and 2d) show variations in the visible spectral region due to nutrient and water stress levels affecting both chlorophyll and xanthophyll pigments.
82
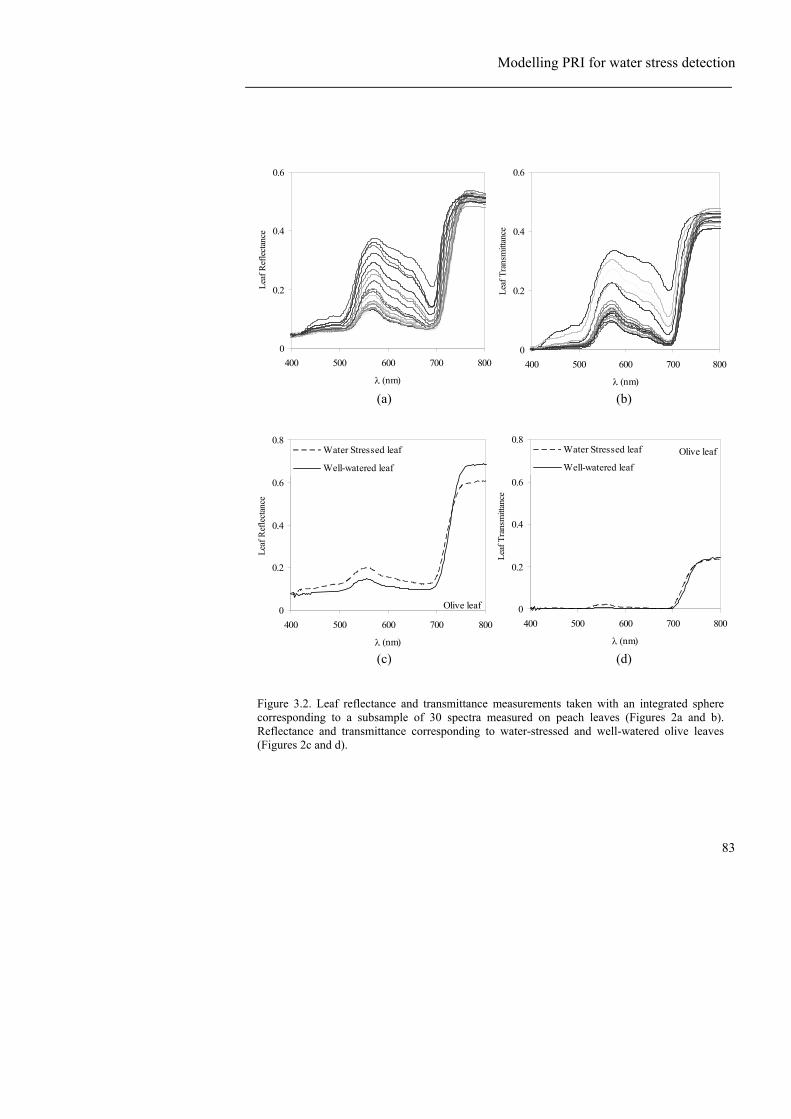
Modelling PRI for water stress detection
Olive leaf0
0.2
0.4
0.6
0.8
400 500 600 700 800
λ (nm)
Leaf
Ref
lect
ance
Water Stressed leaf
Well-watered leaf
Olive leaf
0
0.2
0.4
0.6
0.8
400 500 600 700 800
λ (nm)
Leaf
Tra
nsm
ittan
ce
Water Stressed leaf
Well-watered leaf
0
0.2
0.4
0.6
400 500 600 700 800
λ (nm)
Leaf
Ref
lect
ance
0
0.2
0.4
0.6
400 500 600 700 800
λ (nm)
Leaf
Tra
nsm
ittan
ce
(a) (b)
(c) (d)
Figure 3.2. Leaf reflectance and transmittance measurements taken with an integrated sphere corresponding to a subsample of 30 spectra measured on peach leaves (Figures 2a and b). Reflectance and transmittance corresponding to water-stressed and well-watered olive leaves (Figures 2c and d).
83

Chapter 3
During field campaigns, leaf reflectance measurements were also conducted in the study sites at the time of the flights with an ASD Field Spectrometer (FieldSpec Handheld Pro, ASD Inc., CO, USA) with a leaf clip probe. A total of 9 leaves per tree on 3 trees per treatment (olive and peach orchards) and 9 leaves per block on 6 blocks (maize) were measured in the field on each flight. Stem water potential measurements were conducted from the same sampled tree / blocks with a pressure chamber (Soil Moisture Equipment Corp. model 3000, Santa Barbara, CA, USA), and stomatal conductance was measured with a leaf porometer (model SC-1, Decagon Devices, Washington, DC, USA). In the olive tree site, a steady-state porometer was used to monitor stomatal conductance (model PMR-4, PP Systems, Hitchin Herts, UK).
3.2.3. Airborne Imagery acquisition A 6-band multispectral camera (MCA-6, Tetracam, Inc., California, USA) flying at 150 m above ground level (Berni et al, in press) was used to acquire imagery from the three study sites. The camera is built on 6 image sensors with 25 mm diameter bandpass filters of 10 nm FWHM (Andover Corporation, NH, USA). The image resolution is 1280x1024 pixels with 10-bit radiometric resolution and optic focal length of 8.5 mm, yielding an angular field-of-view (FOV) of 42.8º x 34.7º and a spatial resolution of 15 cm at 150 m altitude. The bandsets used in each of the study sites comprised bands centered at 530 and 570 nm used to calculate the PRI index, as well as 550 nm, 670 nm, 700 nm and 800 nm bands to calculate TCARI/OSAVI index for chlorophyll content estimation (Haboudane et al., 2002), and NDVI for LAI estimation (Rouse et al., 1974). Geometric calibration was performed using Bouguet’s calibration (Bouguet, 2001) in order to recover the following intrinsic camera parameters: focal distance, principal point coordinates and lens radial distortion. The lens distortion model used was based on Wolf (1983), in which tangential and radial distortion are estimated, however in this case only the tangential distortion was taken into account (Berni et al., in press). Aerial triangulation was used to georreference the multispectral images using Leica LPS (Leica Geosystems, Switzerland). Further correction was applied using the position of one of the cameras as reference and estimating the relative position of the other five by solving the system for each reference-camera pair. Images were calibrated to ground reflectance using the empirical line method with two reference targets. Two 4-square-meter black and white targets were leveled and placed in a central location of the flight path, measuring target reflectance with an ASD Field Spectrometer (FieldSpec Handheld Pro, ASD Inc., CO, USA) calibrated using a Spectralon panel (SRT-99-180, LabSphere, NH, USA). The empirical line method used to obtain surface reflectance from camera raw DN-values was validated in the study sites yielding a 1.17 % RMSE (n=90) (Berni et al., in press). The Photochemical Reflectance Index (PRI) (Gamon et al., 1992), sensitive to the de-epoxidation state of the xanthophyll cycle pigments and used in previous studies to assess water stress (Thenot, 2002; Suarez et al., 2008), was calculated with the MCA-6 camera using two 10 nm FWHM filters centred at 530 and 570 nm wavelengths (Equation 1).
84

Modelling PRI for water stress detection
Bands situated at 550, 670, 700 and 800 nm were used to calculate TCARI/OSAVI and NDVI indices using the equations 2 and 3.
530570
530570
RRRR
PRI+−
=
[ ])16.0/()(*)16.01(
/670800670800
670700550700670700
++−+)/(*)(*2.0)(*3 −−−
=RRRR
OSAVITCARI RRRRRR
670800
670800
RRNDVI
+RR −
=
The thermal camera installed on board of the airborne platform was the Thermovision A40M (FLIR, USA), acquiring one image every two seconds during the flight. The image resolution was 320 x 240 pixels and 16 bits of at-sensor calibrated radiance with a 40º FOV lens, yielding 40 cm spatial resolution at 150 m altitude. The image sensor is a Focal Plane Array (FPA) based on uncooled microbolometers with a spectral range of 7.5-13 μm yielding calibrated radiance in the range 233-393 K. The camera was calibrated in the laboratory using a calibration blackbody source (RAYBB400, Raytek, CA, USA), and switched on one hour before flight until stable. Two internal calibrations are implemented in the sensor, a non-uniformity correction (NUC) and an internal temperature calibration. Atmospheric correction was needed to retrieve surface temperature, as described in Berni et al. (2009). Single channel atmospheric correction was conducted using the Radiative Transfer Equation (RTE), where the needed input parameters are atmospheric transmittance ( λτ ), emissivity (
λε ), down-welling ( ) and up-welling thermal radiation ( ) which are driven mainly by water vapor content, air temperature and distance to object. The atmospheric calibration applied to the thermal images was validated in a specific campaign described in Berni et al. (in press) measuring simultaneously surface temperature with a thermal gun over 3 different surfaces: soil, white and black targets. The RMSE before calibration was 3.44 K, which was reduced down to 0.89 K after atmospheric correction. Figure 3 shows a thermal image acquired over the peach orchard after conducting atmospheric correction (Figure 3a) where differences between irrigated and water-stressed trees can be observed (Figure 3b). Geometric calibration was conducted using the same methodology that was applied to the multispectral camera, but using resistive wires in the calibration pattern (Berni et al., accepted). Exterior orientation, including camera position coordinates, pitch, roll and yaw, was acquired by the inertial navigation system onboard, allowing an initial estimate for the automated aerotriangulation. Sensor-to-ground distance across the image was calculated pixel by pixel, taking into account the effects of the camera’s wide field of view and the airborne platform tilt angles. This distance was used to generate a transmittance and thermal radiation map for an accurate calculation of surface temperature.
↓λ,atmL ↑
λ,atmL
85

Chapter 3
(a) (b)
340
300
T (K)
314
304
T (K)
Figure 3.3. (a) Imagery acquired with a thermal camera over the peach orchard where full irrigation (R) and deficit irrigation treatments (RDI) were applied; (b) Map of surface temperature of the experimental orchard.
3.2.4. Radiative transfer modelling methods for simulating non-stress PRI Radiative transfer simulations were conducted with PROSPECT (Jacquemoud and Baret, 1990) linked with SAILH model (Verhoef, 1984) for the maize field (a homogeneous canopy), and PROSPECT model linked to FLIGHT (North, 1996) for tree crops (olive and peach trees). The PROSPECT leaf optical properties model has been linked with several canopy reflectance models based on SAIL, such as GeoSAIL (Verhoef and Bach, 2003), 2M-SAIL (Weiss et al., 2001) or SAILH (hot spot effect added by Kuusk, 1991). An exhaustive review of models linked to PROSPECT (Jacquemoud et al., 2008) include continuous crops (Baret et al., 1995; Jacquemoud et al., 1994,1995,2000; Zarco-Tejada et al., 2001; Bacour et al., 2002; Weiss, 2002; Combal et al., 2002; Casa and Jones, 2004; Yang and Ling, 2004; Koetz et al., 2005; González-Sanpedro et al., 2008), forestry areas (Meroni et al., 2004; Zarco-Tejada et al., 2003, 2004; Zhang et al., 2005; Soudani et al., 2006; le Maire et al, 2007), and the global domain (Bacour et al., 2006; Baret et al., 2007; Weiss et al., 2007; Trombetti et al., 2008). In this study, the model PROSPECT was coupled to the SAILH model to simulate the canopy reflectance of the corn field under different irrigation treatments.
86

Modelling PRI for water stress detection
Table 3.1. Nominal values and range of parameters used to construct the look-up tables for leaf and canopy modelling inversion with PROSPECT and FLIGHT models for the olive and peach orchard study sites. Leaf structural parameters and leaf biochemical parameters were used for leaf-level simulation of reflectance and transmittance using PROSPECT. Canopy structural parameters were used as inputs in the FLIGHT model for simulating canopy reflectance by radiative transfer. Values/units used PROSPECT input parameters Olive trees Peach trees N structural parameter 2.9 1.6 Cab (μg/cm2) 50-90 50-72 Cm 0.025 0.015 Cw 0.025 0.015 Cs 0 0
FLIGHT input parameters Olive trees Peach trees
Leaf optical and structural parameters
Hemispherical reflectance and transmittance of green leaves PROSPECT PROSPECTHemispherical reflectance and transmittance of senescent leaves Not used Not used Leaf equivalent radius 0.007 m. 0.02 m.
Canopy layer and structural parameters
Leaf Area Index of vegetation 2-4 m2/m2 1-2.6 m2/m2 Total scene Leaf Area Index m2/m2 m2/m2 Fractional cover 0.32 m2/m2 0.22 m2/m2 Leaf Angle Distribution (LAD) Empirical Spherical Fraction of green leaves 1 1 Fraction of senescent leaves 0 0 Fraction of bark 0 0 Hemispherical reflectance and transmittance of bark Not used Not used Number of stands and position coordinates Coord.(m.) Coord.(m.) Crown shape elliptical elliptical Crown height and radius m. m. Trunk height and radius m. m.
Background and viewing geometry
Solar zenith and azimuth angles degrees degrees Sensor zenith and azimuth angles degrees degrees Soil reflectance From image From image Soil roughness 0 0 Aerosol optical thickness (AOD) 0.15 0.15
87

Chapter 3
The 3-D Forest Light Interaction Model, (FLIGHT) is based on Monte Carlo ray tracing (MCRT) method as a tool to simulate the radiative transfer in a canopy structure (North, 1996). At the top of the canopy, the interaction of radiation within the vegetation depends on the contribution of several components such as leaves, stems, soil background, illumination and view properties of each canopy elements as well as on their number, area, orientation and location in space (Goel and Thompson, 2000; Koetz et al, 2005). FLIGHT radiative transfer model was previously used to simulate discontinuous canopy reflectance in conifer forests (Dawson et al, 1999; Koetz et al., 2004 and Verrelst et al., in press) and in olive orchards (Suarez et al., 2008). In this work, the FLIGHT model was used together with PROSPECT to simulate peach and olive tree crown reflectance, specifically at 530 and 570 nm bands for effects of bidirectional reflectance distribution function (BRDF) on PRI simulation. A sensitivity analysis was conducted to assess the influence of model input parameters on PRI bands, specifically leaf Cab and N, and canopy LAI (Figure 4). The simulation conducted suggests that N and Cab leaf parameters, and the LAI canopy parameter are critical for simulating PRI at the canopy level. The suggested method consists on simulating a non-stress PRI value for a crop field (sPRI) by model inversion using the canopy reflectance from airborne imagery. The difference found between the image PRI (per tree or block level) and the non-stress simulated PRI by model inversion (sPRI), calculated as PRI-sPRI, would be associated with xanthophyll absorption levels at 530 nm. The methodology applied for orchards through PROSPECT-FLIGHT model inversion was based on generating look-up tables independently for each crop and imagery conditions. The method consisted on targeting pure crowns under non-water-deficit conditions, and inverting the coupled leaf-canopy models for Cab and LAI. Model inversion was conducted fixing N (structural parameter), Cm (dry matter) and Cw (water content) values from the literature (Kempeneers et al., 2007 for peach trees; Zarco-Tejada et al, 2004 for olive trees). Cab and LAI were allowed to vary in the leaf- and canopy-level model inversion step, respectively. The rest of parameters were kept fixed, characterizing each crop field with inputs to represent the architecture of the orchard. The parameter ranges used to build the look-up tables are summarized in Table 1. The resulting simulated LUT spectra for olive and peach trees are presented in Figures 4a and 4b. For the corn study site, the parameters used for the coupled PROSPECT-SAILH model inversion are presented in Table 2. In this case, the parameters N and Cab at leaf level, and LAI at canopy level were inverted. The rest of the inputs were fixed to values and ranges found in literature for corn (Haboudane et al., 2004). Spectra were extracted from images acquired over the corn field for each of the 72 variety blocks. Block spectra were used as input for the model inversion, accounting for large within-field LAI differences found in the variety-trial study. Simulated PRI obtained by model inversion for each crop field (sPRI) was compared with PRI extracted from the canopy reflectance for each pure crown / block. In addition, simulated PRI and image-extracted PRI from each orchard tree / corn block were compared against crown temperature and water potential measurements acquired at the time of each flight. The difference PRI-sPRI and the temperature for each corn block were assessed before and after irrigation for morning and afternoon flights, assessing the stress detection capabilities of the proposed methodology.
88
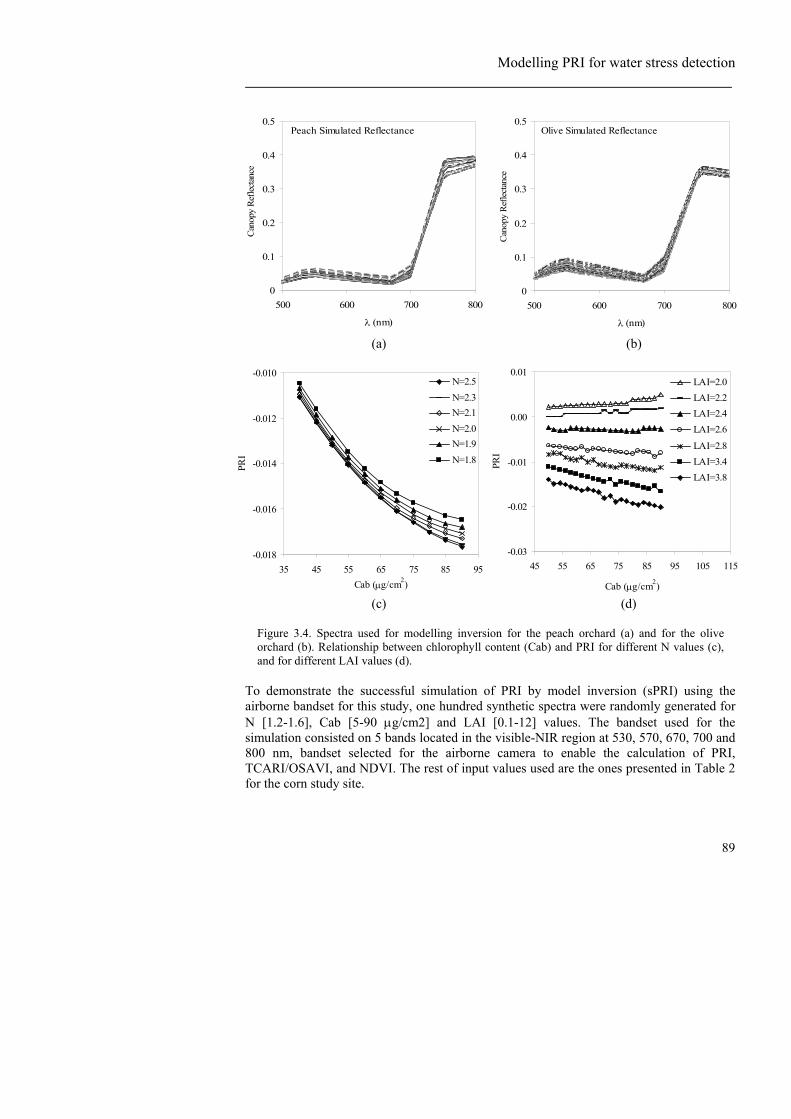
Modelling PRI for water stress detection
Olive Simulated Reflectance
0
0.1
0.2
0.3
0.4
0.5
500 600 700 800
λ (nm)
Can
opy
Ref
lect
ance
Peach Simulated Reflectance
0
0.1
0.2
0.3
0.4
0.5
500 600 700 800
λ (nm)
Can
opy
Ref
lect
ance
(a) (b)
(c) (d)
-0.03
-0.02
-0.01
0.00
0.01
45 55 65 75 85 95 105 115
Cab (μg/cm2)
PRI
LAI=2.0LAI=2.2LAI=2.4LAI=2.6
LAI=2.8LAI=3.4LAI=3.8
-0.018
-0.016
-0.014
-0.012
-0.010
35 45 55 65 75 85 95Cab (μg/cm2)
PRI
N=2.5N=2.3N=2.1N=2.0N=1.9N=1.8
Figure 3.4. Spectra used for modelling inversion for the peach orchard (a) and for the olive orchard (b). Relationship between chlorophyll content (Cab) and PRI for different N values (c), and for different LAI values (d).
To demonstrate the successful simulation of PRI by model inversion (sPRI) using the airborne bandset for this study, one hundred synthetic spectra were randomly generated for N [1.2-1.6], Cab [5-90 μg/cm2] and LAI [0.1-12] values. The bandset used for the simulation consisted on 5 bands located in the visible-NIR region at 530, 570, 670, 700 and 800 nm, bandset selected for the airborne camera to enable the calculation of PRI, TCARI/OSAVI, and NDVI. The rest of input values used are the ones presented in Table 2 for the corn study site.
89

Chapter 3
Table 3.2: Nominal values and range of parameters used for leaf and canopy model inversion conducted with PROSPECT and SAILH for the corn study site.
Values/units used
PROSPECT-SAILH input parameters Maize
Leaf optical and structural parameters
N structural parameter 1.2-1.6 Cab (μg/cm2) 5-100 Cm 0.0035 Cw 0.0015 Cs 0
Canopy layer and structural parameters
Hot Spot size 0.01 Leaf Area Index 0.1-12 Leaf Angle Distribution (LAD) Spherical
Background and viewing geometry
Solar zenith and azimuth angles Degrees Soil reflectance From image
-0.04
-0.02
0
0.02
0.04
0.06
-0.04 -0.02 0 0.02 0.04 0.06
PRI
sPR
I
-0.02
-0.01
0
0.01
0.02
-5 15 35 55 75 95
Simulation number
PRI-s
PRI
(a) (b)
Figure 3.5. Simulated PRI (sPRI) against airborne PRI (a), showing the PRI-sPRI differences (b).
90

Modelling PRI for water stress detection
The input parameters Cab, LAI and N, and the PRI index were compared with the inversion outputs, yielding a RMSE of 5.45 μg/cm2 (Cab), 1.1 (LAI), 0.13 (N). The results of this modelling approach confirm that PRI can be successfully simulated with 5-channel spectra (Figure 5a), obtaining PRI-sPRI values close to 0 for a wide range of input Cab, N and LAI (Figure 5b). The method proposed here based on using physical models, enabled the simulation of PRI for non-stress conditions accounting for N, Cab and LAI differences across the cropped field.
3.3. RESULTS
3.3.1. PRI measurements at the leaf level Leaf level measurements on olive and peach tree leaves showed differences in the leaf spectra between the full-irrigated (FI) and the regulated deficit irrigation (RDI) treatments. Figure 6a shows the mean leaf spectra corresponding to both irrigation treatments. In the near infra-red part of the spectrum, differences can be detected due to leaf structural changes in response to water stress. Differences in the green region (Figure 6b) are due to confounding effects of both chlorophyll content and xanthophyll absorption at 530 nm due to the water stress. To understand the confounding effects of chlorophyll absorption and the xanthophyll absorption, a modelling approach was undertaken. The PROSPECT radiative transfer model was used to invert the mean leaf spectrum measured under regulated deficit irrigation. Spectral differences found at 530 nm between the PROSPECT-simulated spectrum and the measured water-stress reflectance would correspond to xanthophyll pigment absorption.
3.3.2. PRI measurements at the canopy level The mean spectrum corresponding to FI trees and RDI is shown in Figure 7a. Differences due to water stress at 530 and 570 nm can be seen in Figure 7b. The large differences at 530 nm between the two spectra are due to increased xanthophyll pigment absorption under water stress. At canopy scale, the relationship between PRI and temperature derived from the thermal airborne camera is shown in Figure 8 for olive trees (Figure 8a), for peach trees (Figure 8b), and for maize (Figure 8c).
91

Chapter 3
0.00
0.10
0.20
0.30
520 530 540 550 560 570 580λ (nm)
Leaf
Ref
lect
ance
Well-watered leaf (PRI= 0.36)Water stressed leaf (PRI= 0.63)
0.00
0.20
0.40
0.60
400 500 600 700 800λ (nm)
Leaf
Ref
lect
ance
Well-watered leafWater stressed leaf
(a)
0.00
0.10
0.20
0.30
520 530 540 550 560 570 580
λ (nm)
Leaf
Ref
lect
ance
Well-watered leaf (PRI= 0.36)Water stressed leaf (PRI= 0.63)InversionAbsorption due to xantophyll pigments
(b) (c)
Figure 3.6. (a) Peach leaf reflectance measured in the field for a stressed and an unstressed peach leaf. (b) Leaf spectra on the two wavelengths (530 and 570 nm) used to calculate the PRI index.. (c) Leaf spectra on the PRI region and inverted spectra of the stressed leaf showing the effects of chlorophyll loss on leaf spectra and the effects of xanthophylls absorption.
92

Modelling PRI for water stress detection
93
0.00
0.10
0.20
0.30
0.40
0.50
450 550 650 750 850
λ (nm)
Cro
wn
Ref
lect
ance
RRDI
0.050
0.055
0.060
0.065
0.070
510 530 550 570 590
λ (nm)
Cro
wn
Ref
lect
ance
RRDI
(a) (b)
Figure 3.7. Average crown reflectance derived from imagery of olive trees from the RDI and R treatments (a); spectra on the PRI region (b).
For olive and peach trees, pure crown PRI was calculated from airborne imagery and related to surface temperature estimated from the airborne thermal imagery. Canopy temperature (T) was related to PRI, coefficients of determination of the regression lines of PRI against T yielded r2=0.65 for the olive trees, and r2=0.8 for the peach trees. For the same set of peach trees the determination coefficient of the relationship of airborne-derived temperature with TCARI/OSAVI index at canopy scale yielded 0.0017, demonstrating that PRI correlation with T was not due to differences in Chlorophyll content. The analysis on the maize field was conducted at block scale with PRI and T calculated for each of the 72 experimental blocks in the field. The relationship shown (Figure 8c) corresponds to a set of blocks with similar NDVI, therefore avoiding structural effects on the PRI vs. T relationship. The determination coefficient for that relationship (r2= 0.72) illustrates the consistency of PRI as an indicator of water stress in maize under equal structural conditions. For the same set of blocks with similar NDVI, the relationship between NDVI and canopy temperature (Figure 8d), yielded a low coefficient of determination (r2=0.26), demonstrating that structure was not the driver between PRI and canopy T relationship. In the three study sites, peach, olive orchards and maize field, airborne canopy PRI values for water stressed trees / blocks were higher than the PRI values from fully irrigated vegetation.

Chapter 3
Peach trees
y = 0.0439x - 13.318r2 = 0.8
-0.05
0.00
0.05
0.10
0.15
0.20
302 304 306 308T (K)
Cro
wn
PRI
Olive trees
y = 0.0146x - 4.474r2 = 0.65
-0.04
-0.02
0.00
0.02
0.04
304 306 308 310T (K)
Cro
wn
PRI
(a) (b) (c) (d)
Corn
y = 0.0066x - 2.0021r2 = 0.72
0.01
0.02
0.03
0.04
0.05
0.06
0.07
306 308 310 312
T (K)
Can
opy
PRI
Corn
y = -0.0042x + 2.0619r2 = 0.26
0.75
0.76
0.77
0.78
0.79
306 308 310 312
T (K)
Can
opy
ND
VI
Figure 3.8. Relationships obtained between crown/canopy PRI and vegetation surface temperatures derived from imagery for (a) olive trees; (b) peach trees; (c) corn, and (d) between canopy NDVI and temperature for corn.
94

Modelling PRI for water stress detection
3.3.3. Assessing stress with PRI through model inversion A PROSPECT-FLIGHT model inversion method was conducted using the mean spectra extracted from the airborne imagery for the olive and the peach orchards. Figures 9a and 9c show the image spectra used for the inversion for olive and peach trees, respectively, along with canopy reflectance obtained by model inversion. PRI values corresponding to the inverted spectra (Figures 9b and 9d) used as the theoretical PRI for non-stress conditions (sPRI) are shown along with the PRI values extracted from pure crowns on both orchards. The crown PRI values for full and deficit irrigation are compared against the theoretical PRI (sPRI) for non-stress conditions (Figures 9b and 9d). Results show that PRI for RDI trees are higher than simulated non-stress PRI for both olive and peach trees. On the contrary, all FI trees show PRI values around or below the simulated PRI value for non-stress conditions. Consistently, RDI trees showed higher PRI values than the simulated non-stress PRI values derived from model inversion. This method enables an operational detection of stressed trees using the modelling approach to account for LAI and chlorophyll content effects on modelled PRI index values. A map was generated representing the distance PRI-sPRI as an indicator of water stress for the olive orchard (Figure 10a). The map shows the spatial distribution of water stress as a function of irrigation levels (Figure 10b). Positive values of PRI-sPRI (red color) indicate water stress, while negative values (green color) indicate non-stress conditions. The PRI-sPRI map clearly shows that water-stress is detected in trees of the RDI1 and RDI2 treatments (Figure 10a), while the FI treatments are well identified as control. The spatial variability of canopy leaf area index through the normalized difference vegetation index (NDVI) (Figure 10c) was assessed. The NDVI map, on the contrary, did not detect water stress levels as well as the PRI-sPRI indicator did. These results demonstrate that a physiological index such as PRI, when modelled to account for leaf and canopy inputs N, Cab and LAI, was superior to NDVI to detect within-field water stress variability.
95

Chapter 3
96
Olive trees0.00
0.10
0.20
0.30
0.40
490 590 690 790λ (nm)
Cro
wn
Ref
lect
ance
ImageModel Inversion
Olive trees
r2 = 0.84
-0.04
-0.02
0.00
0.02
0.04
-3.0 -2.0 -1.0 0.0Water Potential (MPa)
Cro
wn
PRI
Well-watered trees
Water stressed trees
sPRI
(a) (b)
Peach trees0.00
0.10
0.20
0.30
0.40
490 590 690 790
λ (nm)
Cro
wn
Ref
lect
ance
ImageModel Inversion
Peach trees
r2 = 0.8
-0.10
0.00
0.10
0.20
0.30
302 304 306 308
T (K)
Cro
wn
PRI
Well-watered trees
Water stressed trees
sPRI
(c) (d)
Figure 3.9. Comparison between mean full-irrigated crown spectrum and the inverted modelled spectrum for (a) olive, and (c) peach trees. Relationship between PRI and water potential for (c) olive trees, and (d) PRI with temperature for peach trees. The relative position of individual crown PRI as compared with the calculated PRI from the theoretical spectrum is shown.

Modelling PRI for water stress detection
(a) (b) (c)
Figure 3.10. (a) overview of the olive orchard experiment with three irrigation treatments applied; (b) crown PRI minus simulated PRI (PRI-sPRI) map of the experiment; (c) crown NDVI map.
0.09
Irrigation treatments
R
RDI1
RDI2
PRI-sPRI
-0.09
0
NDVI
0.75
0.82
0.90
97

Chapter 3
PRI Pre-irrigation 10:10 GMT-0.14
-0.10
-0.06
-0.02
0.02
0.06
0.10
0 20 40 60 80
Plot number
Can
opy
PRI sPRI
PRI Pre-irrigation 14:20 GMT-0.14
-0.10
-0.06
-0.02
0.02
0.06
0.10
0 20 40 60 80
Plot number
Can
opy
PRI sPRI
(a) (b)
PRI Post-irrigation 11:03 GMT-0.14
-0.10
-0.06
-0.02
0.02
0.06
0.10
0 20 40 60 80
Plot number
Can
opy
PRI sPRI
PRI Post-irrigation 13:11 GMT-0.14
-0.10
-0.06
-0.02
0.02
0.06
0.10
0 20 40 60 80
Plot number
Can
opy
PRI sPRI
(c) (d)
Figure 3.11. Corn PRI values compared with the simulated PRI values (sPRI), calculated before irrigation for the morning (a), at midday (b), and after irrigation, in the morning (c) and at midday (d).
98

Modelling PRI for water stress detection
In the maize study site, the mean field pure-vegetation spectrum was inverted using the coupled PROSPECT-SAILH model. The inversion method was conducted on each of the four images acquired in this study, consisting on pre- and post-irrigation dates at 10.00-11.00 GMT (morning) and 13.00-14.00 GMT (midday). Two images were acquired under water deficit conditions in the morning and at midday of June 6th. Another two images were acquired after irrigation was applied on July 2nd in the morning and at midday. After conducting the model inversion for the four conditions, simulated non-stress PRI (sPRI) was calculated and compared to each block PRI value extracted from the imagery. Block PRI values are shown against the simulated non-stress PRI baseline (sPRI) for the maize field (Figures 11a to 11d). Before irrigation, on the 6th of June (Figures 11a and 11c) block PRI values were located below or around the theoretical non-stress sPRI baseline in the morning (10:10 GMT). At midday (14:20 GMT), on the contrary, airborne PRI values were located over the theoretical sPRI baseline, suggesting that the blocks are under stress conditions (Figure 11c). After irrigation, on the 2nd of July, airborne PRI values were around or below the theoretical non-stress sPRI obtained by PROSPECT-SAILH inversion, both in the morning (11:03 GMT; Figure 11b) and also at midday (13:11 GMT; Figure 11d). These results suggest that this methodology is capable of detecting water stress in continuous crop canopies such as maize, being able to assess the response to irrigation with the PRI index when modelled for N, Cab and LAI effects. A second modelling approach was undertaken to deal with crop canopy structural effects for each maize block extracted from the reflectance imagery. Each block reflectance extracted from the airborne imagery was used as input for model inversion, obtaining the non-stress PRI value for each maize block (sPRI). For each of the 72 blocks extracted from the image, the difference PRI-sPRI was calculated. Block PRI-sPRI along with block canopy temperature minus air temperature (Tc-Ta) are shown in Figure 12 for pre- and post-irrigation in the morning and midday. On the 6th of June, before irrigation, values for PRI-sPRI and Tc-Ta at 10:10 GMT and at 14:20 GMT are shown in Figures 12a and 12c. The mean Tc-Ta values obtained in the morning prior to irrigation was -0.02 K, rising up to 3.87 K at midday, with higher stress conditions. Airborne Tc-Ta values were consistent with the PRI-sPRI values, PRI-sPRI and Tc-Ta values showed a wide range of variability. Such high variability suggests the different cultivars responded differently to water deprivation, as Tc-Ta differences were up to 8 K. The same variability is obtained in PRI-sPRI values as compared with Tc-Ta variability, concluding that this methodology could be useful for screening different cultivars in their response to water deficits. Results on the data acquired after irrigation (on the 2nd of July) are shown in Figures 12b and 12d. Again, Tc-Ta values are lower (yielding an average value of -3.13 K in the morning and -1.13 K at midday), being consistent with PRI-sPRI values around zero, showing that airborne PRI values are close to the simulated non-stress PRI values as the crop is recovered from water stress. Figures 13a to 13d show PRI-sPRI maps, observing that maize fields under stress conditions before irrigation do not present stress symptoms in the morning (Figure 13a), while high PRI-sPRI values showed significant stress at midday. After irrigation, maize blocks did not show stress in the morning (Figure 13c), while slightly higher PRI-sPRI differences were found at midday (Figure 13d), as higher evaporative demand exists. Consistently, Figure 13 demonstrates
99
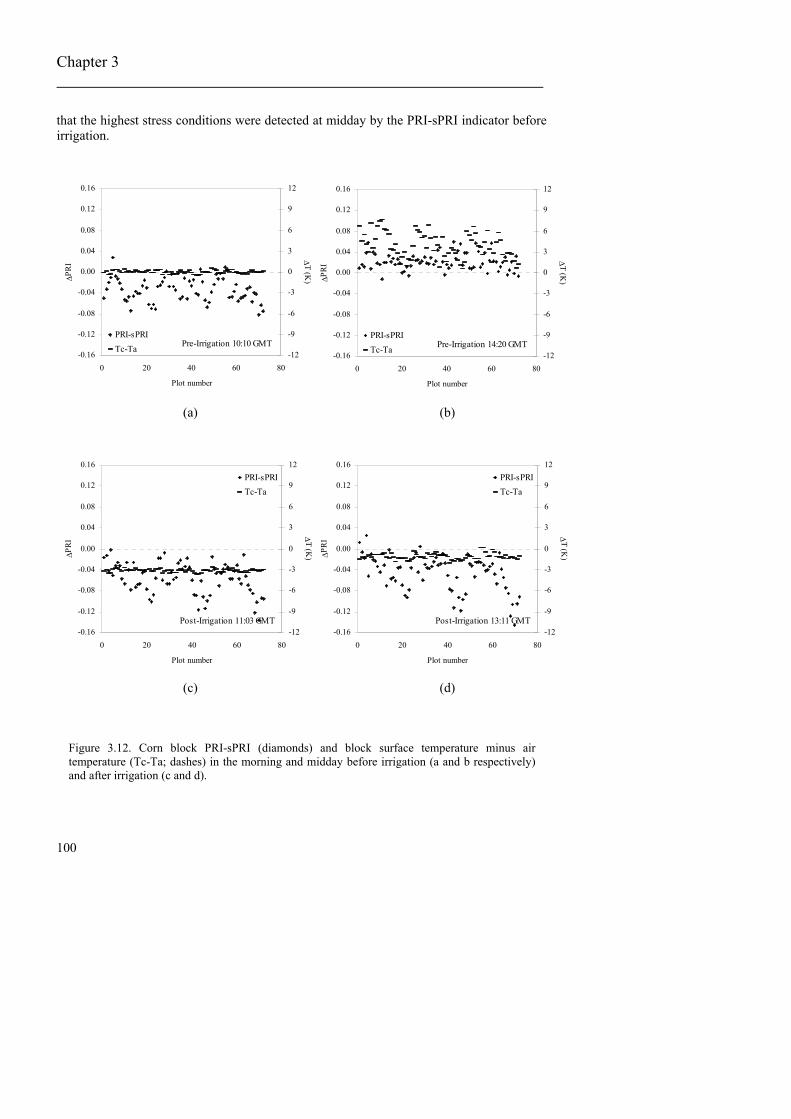
Chapter 3
that the highest stress conditions were detected at midday by the PRI-sPRI indicator before irrigation.
-0.16
-0.12
-0.08
-0.04
0.00
0.04
0.08
0.12
0.16
0 20 40 60 80
Plot number
ΔPR
I
-12
-9
-6
-3
0
3
6
9
12
Δ T (K)
PRI-sPRITc-Ta Pre-Irrigation 10:10 GMT
-0.16
-0.12
-0.08
-0.04
0.00
0.04
0.08
0.12
0.16
0 20 40 60 80
Plot number
ΔPR
I
-12
-9
-6
-3
0
3
6
9
12
Δ T (K)
PRI-sPRITc-Ta Pre-Irrigation 14:20 GMT
(a) (b)
-0.16
-0.12
-0.08
-0.04
0.00
0.04
0.08
0.12
0.16
0 20 40 60 80
Plot number
ΔPR
I
-12
-9
-6
-3
0
3
6
9
12
Δ T (K)
PRI-sPRITc-Ta
Post-Irrigation 11:03 GMT-0.16
-0.12
-0.08
-0.04
0.00
0.04
0.08
0.12
0.16
0 20 40 60 80
Plot number
ΔPR
I
-12
-9
-6
-3
0
3
6
9
12
Δ T (K)
PRI-sPRITc-Ta
Post-Irrigation 13:11 GMT
(c) (d)
Figure 3.12. Corn block PRI-sPRI (diamonds) and block surface temperature minus air temperature (Tc-Ta; dashes) in the morning and midday before irrigation (a and b respectively) and after irrigation (c and d).
100

Modelling PRI for water stress detection
PRI-sPRI (a) (b) (c) (d)
Figure 3.13. Corn PRI minus block simulated PRI (PRI-sPRI) for the four image acquisitions before irrigation ((a) in the morning and (b) at midday), and after irrigation in the morning (c) and midday (d).
0.04
.00
.20
.04
.30 -0
-0
0
0
101

Chapter 3
3.4. CONCLUSIONS This study presents a methodology for water stress detection in annual and perennial irrigated crops using remotely sensed PRI index and radiative transfer modelling. The method accounts for leaf and canopy inputs N, Cab and LAI to simulate the PRI values to identify crop crowns / blocks under stress. The methodology presented was successfully tested on two tree orchards (olive and peach trees) and a closed canopy of an annual crop (maize). The PRI index tracked water stress levels in crops under deficit irrigation, and yielded robust relationships against canopy temperatures (r2=0.65 for olive trees, r2=0.8 for peach trees, and r2=0.72 for maize). Moreover, within-field structural effects on PRI were assessed, demonstrating that PRI was successfully related with canopy temperature (r2=0.72) for crop blocks under same NDVI values, thus showing that PRI is sensitive to water stress conditions independently of canopy structural effects. In addition, the lack of relationship between crown temperature and TCARI/OSAVI for peach trees (r2=0.0017) demonstrates PRI is not driven by differences in Chlorophyll content. The ability of PRI to detect water stress before vegetation structure is affected is critical as a pre-visual indicator of stress. However, PRI was highly affected by both background and canopy structure, requiring correct modelling methods for successful mapping of water stress and its spatial variability. Modelling inversion methods enabled accounting for background and crop/orchard characteristics independently for each crop field and imagery acquired with the airborne multispectral sensor. Two different canopy radiative transfer models were used depending on the crop structure, SAILH for maize crop and FLIGHT model for tree orchards (olive and peach trees), while simulations at leaf scale were conducted successfully with the PROSPECT leaf model. Results demonstrated that airborne canopy PRI values higher than the theoretical non-stress PRI, when accounting for N, Cab and LAI via radiative transfer models, correspond to vegetation pixels under water stress. Consistency was found in three crops where this methodology was applied. Airborne PRI values compared with the theoretical non-stress PRI, calculated as PRI-sPRI, agreed with the irrigation levels applied, and the stress level before and after irrigation. The results obtained in this study, then, demonstrate that PRI is a pre-visual indicator of water stress, i.e., when no effects could be detected visually. Finally, this methodology based on a narrow-band index derived from the visible part of the spectrum may be potentially used as an alternative to thermal imagery for assessing water stress. High-resolution thermal imagers are generally more expensive and their availability more limited than CCD/CMOS instruments onboard airborne and potential satellite platforms.
102
Modelling PRI for water stress detection
Acknowledgments
Financial support from the Spanish Ministry of Science and Innovation (MCI) for the projects AGL2005-04049, EXPLORA-INGENIO AGL2006-26038-E/AGR, CONSOLIDER CSD2006-67, and AGL2003-01468 is gratefully acknowledged, and in-kind support provided by Bioiberica through the project PETRI PET2005-0616. Technical support from UAV Navigation and Tetracam Inc. is also acknowledged. M. Morales, C. Ruz, G. Sepulcre-Cantó, D. Notario, M. Guillén, C. Trapero, I. Calatrava, A. Vera and M. Ruiz Bernier are acknowledged for measurements and technical support in field and airborne campaigns.
103

Chapter 3
REFERENCES Asner, G.P., Carlson, K.M. and Martin, R.E. (2005) Substrate age and precipitation effects
on Hawaiian forest canopies from spaceborne imaging spectroscopy. Remote Sensing of Environment, 98, 457-467.
Bacour C., Jacquemoud S., Leroy M., Hautecoeur O., Weiss M., Prévot L., Bruguier N. and Chauki H. (2002), Reliability of the estimation of vegetation characteristics by inversion of three canopy reflectance models on airborne POLDER data, Agronomie: Agriculture and Environment. 22:555-565.
Bacour C., Baret F., Béal D., Weiss M. and Pavageau K. (2006), Neural network estimation of LAI, fAPAR, fCover and LAI×Cab, from top of canopy MERIS reflectance data: Principles and validation, Remote Sensing of Environment. 105:313-325.
Baret F., Clevers J.P.W. and Steven M.D. (1995), The robustness of canopy gap fraction estimates from red and near-infrared reflectances: A comparison of approaches, Remote Sensing of Environment. 54:141-151.
Baret, F., Hagolle, O, Geiger, B., Bicheron, P., Miras, B., Huc, M., Berthelot, B., Fernando Niño, F., Weiss, M., Samain, O., Roujean, J.L. and Leroy, M. (2007). LAI, fAPAR and fCover CYCLOPES global products derived from VEGETATION Part 1: Principles of the algorithm. Remote Sensing of Environment 110 (3), 275-286.
Barton, C.V.M. and North, P.R.J. (2001). Remote Sensing of canopy light use efficiency using the photochemical reflectance index. Model and analysis. Remote Sensing of Environment, 78, 264, 273.
Berni, J.A.J., Zarco-Tejada, P.J., Suarez, L., Fereres, E. Thermal and Narrow-band Multispectral Remote Sensing for Vegetation Monitoring from an Unmanned Aerial Vehicle. (In press) IEEE Transactions on Geoscience and Remote Sensing, December, 2007.
Björkman, O., Powles, S.B. (1984). Inhibition of photosynthetic reactions under water stress: interaction with light level. Planta 161: 490-504.
Bouguet, J. "Camera Calibration Toolbox for Matlab", 2001. (http://www.vision.caltech.edu/bouguetj/calib doc/index.html)
Casa R. and Jones H.G. (2004), Retrieval of crop canopy properties: a comparison between model inversion from hyperspectral data and image classification, International Journal of Remote Sensing. 25:1119-1130.
Chalmers, D.J., Mitchell, P.D., van Heek, L. (1981). Control of peach tree growth and productivity by regulated water supply, tree density and summer pruning. Journal of the American Society for Horticultural Science, 106, 307-312.
Cohen, Y., Alchanatis, V., Meron, M., Saranga, Y., and Tsipris, J. (2005). Estimation of leaf potential by thermal imagery and spatial analysis. Journal of Experimental Botany, 56, 1843-1852.
Combal B., Baret F. and Weiss M. (2002), Improving canopy variables estimation from remote sensing data by exploiting ancillary information. Case study on sugar beet canopies, Agronomie. 22:205-215.
Dawson T.P., Curran P.J., North P.R.J. and Plummer S.E. (1999), The propagation of foliar biochemical absorption features in forest canopy reflectance: a theoretical analysis, Remote Sensing of Environment. 67(2):147-159.
104

Modelling PRI for water stress detection
Dobrowsky, S.Z., Pushnik, J.C., Zarco-Tejada, P.J. and Ustin, S.L. (2005). Simple reflectance indices track heat and water stress-induced changes in steady-state chlorophyll fluorescence at the canopy scale. Remote Sensing of Environment 97, 403-414.
Drolet, G.G., Huemmrich, K.F., Hall, F.G., Middleton, E.M., Black, T.A., Barr, A.G. and Margolis, H.A. (2005). A MODIS-derived photochemical reflectance index to detect inter-annual variations in the photosynthetic light-use efficiency of a boreal deciduous forest. Remote Sensing of Environment, 98, 212-224.
Evain, S., Flexas, J. and Moya, I. (2004). A new instrument for passive remote sensing: 2. Measurement of leaf and canopy reflectance changes at 531 nm and their relationship with photosynthesis and chlorophyll fluorescence. Remote Sensing of Environment, 91, 175-185.
Fereres, E. and Soriano, M. "Deficit Irrigation For Reducing Agricultural Water Use". J. Exp. Bot., vol. 58, pp.147-159, 2007.
Fourty, T. and Baret, F. "Vegetation Water And Dry Matter Contents Estimated From Top-Of-The-Atmosphere Reflectance Data: A Simulation Study". Remote Sensing of Environment, vol. 61, pp.34-45, 1997.
Fuentes, D.A., Gamon, J.A., Cheng, Y., Claudio, H.C., Qiu, H.L., Mao, Z., Sims, D.A., Rahman, A.F., Oechel, W. and Luo, H. (2006). Mapping carbon and water vapour fluxes in a chaparral ecosystem using vegetation indices derived from AVIRIS. Remote Sensing of Environment, 103, 312-323.
Gamon, J.A., Peñuelas, J. and Field, C.B. (1992). A narrow-wave band spectral index that track diurnal changes in photosynthetic efficiency. Remote Sensing of Environment 41, 35-44.
Goel, N. S. and Thompson, R. L. (2000). A snapshot of canopy reflectance models and a universal nodel for the radiation regime. Remote Sensing Reviews 18(2): 197-225.
González-Sanpedro, M.C., Le Toan, T., Moreno, J., Kergoat, L., Rubio, E. (2008). Seasonal variations of leaf area index of agricultural fields retrieved from Landsat data. Remote Sensing of Environment 112(3), 810-824.
Guo, J and Trotter, C.M. (2004). Estimating photosynthetic light-use efficiency using the photochemical reflectance index: variations among species. Functional Plant Biology, 31, 255-565.
Haboudane, D., Miller, J.R., Tremblay, N., Zarco-Tejada, P.J. and Dextraze, L. (2002). Integrated narrow-band vegetation indices for prediction of crop chlorophyll content for application to precision agriculture. Remote Sensing of Environment 84 (2-3), 416-426.
Haboudane, D., Miller, J.R., Pattey, E., Zarco-Tejada, P.J., and Strachan, I. (2004), Hyperspectral vegetation indices and novel algorithms for predicting green LAI of crop canopies: modeling and validation in the context of precision agriculture, Remote Sensing of Environment, 90(3), 337-352.
Hsiao, T.C., Fereres, E., Acevedo, E., Henderson, D.W. Water stress and dynamics of growth and yield of crops. Water and Plant life: Problems and modern approaches, 1976, Springer.
Hsiao TC, Bradford KJ. 1983. Physiological consequences of cellular water deficits. In: Taylor HM, Jordan WR, Sinclair TR, eds. Limitations to efficient water use in crop production. Madison, WI: ASA, CSSA, SSSA, 227–265.
105

Chapter 3
Idso, S.B., Jackson, R.D. and Reginato, R.J. (1978), Extending the “degree day” concept of phenomenological development to include water stress effects. Ecology 59, 431-433.
Idso, S.B., Jackson, R.D., Pinter, P.J., Reginato, R.J. and Hatfield, J.L. (1981). Normalizing the stress-degree-day parameter for environmental variability. Agricultural and Forest Meteorology, 24, 45-55.
Jackson R.D., Idso, S.B., Reginato R.J. and Ehrier, W.L. (1977). Crop temperature reveals stress. Crop soils 29, 10-13.
Jackson, R.D. and Pinter Jr., P.J. (1981). Detection of water stress in wheat by measurement of reflected solar and emitted thermal IR radiation. In: Spectral Signatures of Objects in Remote Sensing, Institut National de la Reserche Agronomique, Versalles, France, pp. 399-406.
Jackson, R. D., Idso S. B., Reginato R. J. and Pinter, P. J. "Canopy Temperature As A Crop Water-Stress Indicator". Water Resources Research, vol. 17, pp.1133--1138, 1981.
Jacquemoud S. and Baret F. (1990), PROSPECT: a model of leaf optical properties spectra, Remote Sensing of Environment. 34:75-91.
Jacquemoud S., Flasse S., Verdebout J. and Schmuck G. (1994), Comparison of several optimization methods to extract canopy biophysical parameters, in Proc. 6th International Symposium on Physical Measurements and Signatures in Remote Sensing, Val d'Isère (France), 17-21 January 1994, CNES, pp. 291-298.
Jacquemoud S., Baret F., Andrieu B., Danson F.M. and Jaggard K. (1995), Extraction of vegetation biophysical parameters by inversion of the PROSPECT + SAIL model on sugar beet canopy reflectance data - Application to TM and AVIRIS sensors, Remote Sensing of Environment. 52:163-172.
Jacquemoud S., Bacour C., Poilve H. and Frangi J.-P. (2000), Comparison of four radiative transfer models to simulate plant canopies reflectance–Direct and inverse mode, Remote Sensing of Environment. 74:471-481.
Jacquemoud, S., Verhoef, W., Baret, W., Bacour, C., Zarco-Tejada, P.J., Asner, G.P., François, C., Ustin, S.L., PROSPECT+SAIL: 16 Years of Use for Vegetation Characterization. Remote Sensing of Environment (in press February 2008).
Kempeneers, P., P.J. Zarco-Tejada, P.R.J. North, S. De Backer, S. Delalieux , G. Sepulcre-Cantó, F. Morales, J.A.N. Van Aardt, R. Sagardoy, P. Coppin, P. Scheunders, Model inversion robustness under changing viewing conditions for chlorophyll estimation from hyperspectral imagery. International Journal of Remote Sensing (in press, April 2007).
Koetz B., Schaepman M., Morsdorf F., Bowyer P., Itten K. and Allgöwer B. (2004), Radiative transfer modeling within heterogeneous canopy for estimation of forest fire fuel properties, Remote Sensing of Environment. 92:332-344.
Koetz, B., Baret, F., Poilvé, H. and Hill, J. (2005). Use of coupled canopy structure dynamic and radiative transfer models to estimate biophysical canopy characteristics. Remote Sensing of Environment 95(1): 115-124.
Kuusk A. (1991), The hot spot effect in plant canopy reflectance, in Photon-vegetation interactions. Applications in optical remote sensing and plant ecology (R.B. Myneni and J. Ross, eds), Springer Verlag, Berlin, pp. 139-159.
Leinonen, I. and Jones, H.G. (2004). Combining thermal and visible imagery for stimulating canopy temperature and identifying plant stress. Journal of Experimental botany, 55, 1423-1431.
106

Modelling PRI for water stress detection
Le Maire G., François C., Soudani K., Berveiller D., Pontailler J.Y., Bréda N., Genet H., Davi H. and Dufrêne E., Calibration and validation of hyperspectral indices for the estimation of biochemical and biophysical parameters of broadleaves forest canopies, Remote Sensing of Environment. Submitted in 2007.
Meroni M., Colombo R. and Panigada C. (2004), Inversion of a radiative transfer model with hyperspectral observations for LAI mapping in poplar plantations, Remote Sensing of Environment. 92:195-206.
Möller M., Alchanatis V., Cohen Y., Meron M., Tsipris J., Naor A., Ostrovsky V., Sprintsin M. and Cohen S., Use of thermal and visible imagery for estimating crop water status of irrigated grapevine, Journal of Experimental Botany, Vol. 58, No. 4, pp. 827–838, 2007
Mitchell P.D. and Chalmers, D.J. (1982). The effect of reduced water supply on peach tree growth and yields. Journal of the American Society of Horticultural Science, 107, 853-856.
Nakaji, T., Oguma, H. and Fujinuma, Y. (2006). International Journal of Remote Sensing, 27(3), 493-509.
Nichol, C.J., Huemmrich, K.F., Black, T.A., Jarvis, P.G., Walthall, J.G. and Hall, F.G. (2000). Remote sensing of photosynthetic-light-use efficiency of boreal forest. Agricultural and forest meteorology, 101, 131-142.
Nichol, C.J., Lloyd, J., Shibistova, O., Arneth, A., Röser, C., Knohl, A., Matsubara, S and Grace, J. (2002). Remote Sensing of photosynthetic-light-use-efficiency of a Siberian boreal forest. Tellus, 54B, 677-687.
Nichol, C.J., Rascher, U., Matsubara, S. and Osmond, B. (2006). Assessing photosynthetic efficiency in an experimental mangrove canopy using remote sensing and chlorophyll fluorescence. Trees, 20, 9-15.
North, P.R.J. (1996). Three-dimensional forest light interaction model using a montecarlo method. IEEE Transactions on Geosciences and Remote Sensing 34 (5), 946-956.
Peguero-Pina, J.J., Morales, F., Flexas, J., Gil-Pelegrín, E., Moya, I. Photochemistry, remotely sensed physiological reflectance index and de-epoxidation state of xanthophyll cycle in Quercus coccifera under intense drought. Oecologia, 156 (1), 1-11.
Pérez-Priego, O., Zarco-Tejada, P.J., Sepulcre-Cantó, G, Miller, J.R., and Fereres, E. (2005). Detection of Water Stress in Orchard Trees with a High-Resolution Spectrometer through Chlorophyll Fluorescence in-filling of the O2-A band, IEEE Transactions on Geoscience and Remote Sensing, 43, 2860-2869.
Rouse, J.W., Haas, R.H., Schell, J.A., Deering, D.W. and Harlan, J.C. (1974). Monitoring the vernal advancements and retrogradation of natural vegetation in Nasa/Gsfc Final Report (ed. MD, U.G.) p. 371.
Sepulcre-Cantó, G., Zarco-Tejada, P.J., Jiménez-Muñoz, J.C., Sobrino, J.A., de Miguel, E., and Villalobos, F.J., (2006). Within-field thermal variability detection as function of water stress in Olea europaea L. orchards with high spatial remote sensing imagery. Agricultural and Forest Meteorology, 136, 31-44.
Sepulcre-Cantó, G., Zarco-Tejada, P.J., Jiménez-Muñoz, J.C., Sobrino, J.A., Soriano, M.A., Fereres, E. , Vega V. , and Pastor , M.. Monitoring yield and fruit quality parameters in open-canopy tree crops under water stress. Implications for ASTER. Remote Sensing of Environment, 107, 455-470.
107

Chapter 3
Sepulcre-Cantó, G., Zarco-Tejada, P.J., Sobrino, J.A., Berni, J.A. J., Jiménez Muñoz, J.C., Gastellu-Etchegorry J.P. Detecting Water Status in Open Canopies with thermal ASTER Imagery and DART radiative transfer simulation. Submitted to Agricultural and Forest Meteorology, April 2008.
Serrano, L. and Peñuelas, J. (2005). Assessing forest structure and function from spectral transmittance measurements: a case study in a Mediterranean holm oak forest. Tree Physiology, 25, 67-74.
Sims, D.A., Luo, H., Hastings, S., Oechel, W.C., Rahman, A.F. and Gamon, J.A. (2006). Parallel adjustment in vegetation greenness and ecosystem CO2 exchange in response to drought in a Southern California chaparral ecosystem. Remote Sensing of Environment, 103, 289-303.
Smith, G. M. and Milton, E. J. (1999)."The Use of the Empirical Line Method to calibrate Remotely Sensed Data To Reflectance". International Journal of Remote Sensing, vol. 20, pp.2653-2662(10).
Soudani, K., François, C., le Maire, G., le Dantec, V., Dufrêne, E. (2006) Comparative analysis of IKONOS, SPOT, and ETM+ data for leaf area index estimation in temperate coniferous and deciduous forest stands. Remote Sensing of Environment, 102 (1-2), 161-175.
Strachan, I.B., Pattey, E. and Boisvert, J.B. (2002). Impact of nitrogen and environmental conditions on corn as detected by hyperspectral reflectance. Remote Sensing of Environment, 80, 213-224.
Suárez, L., Zarco-Tejada, P. J., Sepulcre-Cantó, G., Pérez-Priego, O., Miller, J.R., Jiménez-Muñoz, J.C., Sobrino, J. (2008). Assessing Canopy PRI For Water Stress Detection With Diurnal Airborne Imagery. Remote Sensing of Environment, 112, 560-575.
Sun, P., Grignetti, A., Liu, S., Casacchia, R., Salvatori, R., Pietrini, F., Loreto, F., and Centritto, M. (2008). International Journal of Remote Sensing, 29 (6), 1725-1743.
Thenot, F., Méthy, M. and Winkel, T. (2002). The Photochemical Reflectance Index (PRI) as a water-stress index. International Journal of Remote Sensing, 23(23), 5135-5139.
Trotter, G.M., Whitehead, D. and Pinkney, E.J. (2002). The photochemical reflectance index as a measure of photosynthetic light use efficiency for plants with varying foliar nitrogen contents. International Journal of Remote Sensing, 23(6), 1207-1212.
Verhoef W. (1984), Light scattering by leaf layers with application to canopy reflectance modeling: the SAIL model, Remote Sensing of Environment. 16:125-141.
Verhoef W. and Bach H. (2003a), Remote sensing data assimilation using coupled radiative transfer models, Physics and Chemistry of the Earth. 28:3-13.
Verrels J., Schaepman M.E., Koetz B., Kneubühler M. Angular sensitivity analysis of vegetation indices derived from CHRIS/PROBA data. Remote Sensing of Environment. In press, 2008
Wanjura, D. F., Maas, S. C., Winslow, D. R., and Upchurch, D. R. (2004). Scanned and spot measured canopy temperatures of cotton and corn. Computers and Electronics in Agriculture, 44(1), 33−48.
Weiss M., Troufleau D., Baret F., Chauki H., Prévot L., Olioso A., Bruguier N. and Brisson N. (2001), Coupling canopy functioning and radiative transfer models for remote sensing data assimilation, Agricultural and Forest Meteorology. 108:113-128.
108

Modelling PRI for water stress detection
Weiss M., Baret F., Leroy M., Hautecoeur O., Bacour C., Prevot L. and Bruguier N. (2002), Validation of neural net techniques to estimate canopy biophysical variables from remote sensing data, Agronomie. 22:547-553.
Winkel, T., Méthy, M. and Thénot, F. (2002). Radiation use efficiency, chlorophyll fluorescence , and reflectance indices associated with ontogenic changes in water-limited Chenopodium quinoa leaves. Photosynthetica, 40(2), 227-232.
Wolf, P.R. Elements of Photogrammetry (ed. New York: McGraw-Hill, I.), 1983. Yang Y. and Ling P.P. (2004), Improved model inversion procedure for plant water status
assessment under artificial lighting using PROSPECT+SAIL, Transactions of the ASAE. 47:1833-1840.
Zhang Q., Xiao X., Braswell B., Linder E., Baret F. and Moore B. (2005), Estimating light absorption by chlorophyll, leaf and canopy in a deciduous broadleaf forest using MODIS data and a radiative transfer model, Remote Sensing of Environment. 99:357-371.
Zarco-Tejada, P.J., Miller, J.R., Mohammed, G.H., and Noland, T.L., (2000). Chlorophyll Fluorescence effects on Vegetation Apparent Reflectance: I. Leaf-level Measurements and Model Simulation. Remote Sensing of Environment, 74(3), 582-595.
Zarco-Tejada P.J., Miller J.R., Noland T.L., Mohammed G.H. and Sampson P.H. (2001), Scaling-up and model inversion methods with narrow-band optical indices for chlorophyll content estimation in closed forest canopies with hyperspectral data, IEEE Transactions on Geoscience and Remote Sensing. 39:1491-1507.
Zarco-Tejada P.J., Rueda C.A. and Ustin S.L. (2003), Water content estimation in vegetation with MODIS reflectance data and model inversion methods, Remote Sensing of Environment. 85:109-124.
Zarco-Tejada, P.J., Miller J.R., Morales A., Berjón A., and Agüera J. (2004) Hyperspectral Indices and Model Simulation for Chlorophyll Estimation in Open-Canopy Tree Crops, Remote Sensing of Environment, 90(4), 463-476.
Zarco-Tejada, P.J., Berjón, A., López-Lozano, R., Miller, J.R., Martín, P., Cachorro, V.; González M.R. and de Frutos, A. (2005). Assessing vineyard condition with hyperspectral indices: Leaf and Canopy reflectance simulation in a row-structured discontinuous canopy. Remote Sensing of Environment 99, 271-287.
109

Chapter 3
110
Detecting water stress effects on fruit quality in orchards with PRI
Chapter 4
Detecting water stress effects on fruit quality in orchards with times-series PRI airborne imagery
L. Suárez1, P.J. Zarco-Tejada1, V. González-Dugo1, J.A.J. Berni1, R. Sagardoy2, F.
Morales2, E. Fereres1,3 1Instituto de Agricultura Sostenible (IAS), Consejo Superior de Investigaciones Científicas (CSIC), Córdoba, Spain 2Department of Plant Nutrition, Experimental Station of Aula Dei, CSIC, Apdo 13034, 50080, Zaragoza, Spain. 3Department of Agronomy, University of Cordoba, Campus Universitario de Rabanales, 14014 Córdoba, Spain From: Suárez, L., Zarco-Tejada, P.J., González-Dugo, V., Berni, J.A.J., Sagardoy, R., Morales, F., Fereres, E., Detecting water stress effects on fruit quality in orchards with time-series PRI airborne imagery. Remote Sensing of Environment (In press).
111

Chapter 4
112
Detecting water stress effects on fruit quality in orchards with PRI
RESUMEN Este trabajo presenta una metodología para la detección de la calidad de la fruta en cultivos bajo distintos tratamientos de riego. Se hizo un seguimiento de la temperatura de las copas y del Indice de Reflectancia Fotoquímica (Photochemical Reflectance Index, PRI) en 3 plantaciones de frutales comerciales utilizando imágenes multiespectrales y térmicas en 2008. En las tres parcelas, de melocotonero, nectarina y naranjo, se llevaron a cabo distintos experimentos de riego deficitario sostenido y controlado, esto provocó un amplio rango de valores de calidad de la fruta en cosecha. El estado hídrico de cada árbol individual se controló usando medidas de potencial hídrico de tallo a lo largo de todo el periodo de crecimiento del fruto y se hicieron medidas destructivas de contenido foliar de las distintas xantofilas para estudiar la relación entre el estado de oxidación (Epoxidation state, EPS) y PRI foliar y de cada copa calculado a partir de las imágenes multiespectrales. Tras cosechar, se hicieron medidas de tamaño de fruto, solidos solubles (TSS) y acidez (TA) para determinar la calidad de la fruta para cada árbol muestreado. El EPS mostró una relación estadísticamente significativa con el PRI foliar (r2=0.81) y de cubierta (r2=0.41). El PRI de cada copa individual obtenido de las imágenes durante el periodo de crecimiento del fruto se relacionó con el indicador de calidad TSS/TA de los mismos árboles alcanzando un coeficiente de determinación de 0.50. Se obtuvo una alta relación entre el PRI de cada copa integrado durante el periodo de crecimiento y TSS/TA para melocotonero (r2=0.72) y nectarina (r2=0.61). Por el contrario no se obtuvieron relaciones tan buenas usando la integral de la temperatura de cubierta menos la temperatura del aire (Tc-Ta) para ninguno de los dos cultivos (r2=0.21 para melocotonero y 0.25 para nectarina). Estos resultados sugieren que un indicador fisiológico relacionado con la eficiencia fotosintética, como es el PRI, es más apropiado para la detección de calidad de fruto que la temperatura de copa que depende principalmente de la tasa de transpiración. La posibilidad de aplicar esta misma metodología a resoluciones espaciales medias se estudió mediante el uso de modelos de transferencia radiativa. El análisis mostró efectos importantes del suelo y las sombras en la relación de PRI versus EPS al no poderse extraer información espectral de vegetación pura. Palabras clave: Indice de Reflectancia Fotoquímica, PRI, EPS, estrés hídrico, calidad del fruto, TSS/TA, teledetección multiespectral, térmico.
113
Chapter 4
ABSTRACT A methodology for the assessment of fruit quality in crops subjected to different irrigation regimes is presented. High spatial resolution multispectral and thermal airborne imagery were used to monitor crown temperature and the Photochemical Reflectance Index (PRI) over three commercial orchards comprising peach, nectarine and orange fruit trees during 2008. Irrigation regimes included sustained and regulated deficit irrigation strategies, leading to high variability of fruit quality at harvest. Stem water potential was used to monitor individual tree water status on each study site. Leaf samples were collected for destructive sampling of xanthophyll pigments to assess the relationship between the xanthophyll epoxidation state (EPS) and PRI at leaf and airborne-canopy level. At harvest, fruit size, Total Soluble Solids (TSS) and Tritatable Acidity (TA) were measured to characterize fruit quality. A statistically significant relationship between EPS and PRI was found at the leaf (r2=0.81) and canopy level (r2=0.41). Airborne-derived crown PRI calculated from imagery acquired during the fruit growth was related to the ratio of the total soluble solids normalized by the tritatable acidity (TSS/TA), an indicator of fruit quality measured on the same trees, yielding a coefficient of determination of r2=0.50. The relationship between the integral of PRI time series and TSS/TA yielded a coefficient of determination of r2=0.72 (peach) and r2=0.61 (nectarines). On the contrary, the relation between TSS/TA and the time series of crown thermal imagery was very weak (r2=0.21 and 0.25 respectively). These results suggest that a physiological remote sensing indicator related to photosynthesis, such as PRI, is more appropriate for fruit quality assessment than crown temperature, the established method of water stress detection, which is more related to crown transpiration. A radiative transfer modelling study was conducted to assess the potential validity of this methodology for fruit quality assessment when using medium spatial resolution imagery. The analysis shows important effects of soil and shadows on the PRI vs EPS relationship used for fruit quality assessment if non-pure crown reflectance was extracted from the imagery.
Keywords: Photochemical Reflectance Index, PRI, EPS, water stress, fruit quality, TSS/TA, multispectral remote sensing, thermal.
114

Detecting water stress effects on fruit quality in orchards with PRI
4.1. INTRODUCTION Twenty-five years ago, thermal information was chosen for the remote sensing of water stress in crops (Jackson et al., 1981; Idso, 1982a, 1982b) because the spectral vegetation indices that existed at that time were not nearly as sensitive to water deficits as those derived from canopy temperature (Jackson et al., 1983). Thermal remote sensing of water stress was first performed using spectrometers at ground level (Idso et al., 1981; Jackson et al., 1977, 1981), but other approaches have been developed more recently. These included the use of airborne thermal imagery (Cohen et al., 2005; Leinonen and Jones, 2004; Sepulcre-Cantó et al., 2007) and satellite thermal information in combination with 3D radiative transfer models to understand the effects of scene thermal components on large ASTER pixels (Sepulcre-Cantó et al., 2009). Notwithstanding the advances in thermal detection, the visible part of the spectrum has also been useful for pre-visual water stress detection based on indices that use bands located at specific wavelengths where photosynthetic pigments are affected by stress condition. This is the case of the Photochemical Reflectance Index (PRI, Gamon et al., 1992) that has been proposed to assess vegetation water stress based on xanthophyll composition changes (Peguero-Pina et al., 2008; Suárez et al., 2008, 2009; Thenot et al., 2002). The PRI was presented as an indicator of the epoxidation state of the xanthophylls pool or, what is the same, the proportion of violaxanthin that has been converted into zeaxanthin under stress conditions (Gamon et al., 1992). The use of the PRI could be an alternative to thermal remote sensing for water stress detection, enabling the use of low-cost imaging sensors with high spatial resolution capabilities that are not possible in the thermal domain (Suarez et al., 2008; 2009). In addition, the PRI is an index that was first formulated as an indicator of photosynthetic efficiency, but is also an indicator of photosynthesis rate through light use efficiency (Asner et al., 2005; Drolet et al., 2005; Fuentes et al., 2006; Guo and Trotter, 2004; Nakaji et al., 2006; Nichol et al., 2000, 2002; Serrano and Peñuelas, 2005; Sims et al., 2006; Strachan et al., 2002; Trotter et al., 2002) and through chlorophyll fluorescence (Dobrowsky et al., 2005; Evain et al., 2004; Nichol et al., 2006). Therefore, PRI in addition to being a water stress indicator, is also directly related to several physiological processes involved in the photosynthetic system. The remote detection and monitoring of water stress is critical in many world areas where water scarcity is a major constraint to irrigated agriculture, and is forcing farmers to reduce irrigation water use via deficit irrigation (DI; Fereres and Soriano, 2007). One of the DI approaches is the regulated deficit irrigation (RDI), where water deficits are imposed only during the crop developmental stages that are the least sensitive to water stress (Chalmers et al., 1981). This practice was originally proposed to control the vegetative vigour in high-density orchards to reduce production costs and to improve fruit quality. However, it also saves irrigation water, with the concomitant benefits of reduced drainage losses (Fereres and Soriano, 2007). It has long been known that tree water deficits affect fruit quality parameters (Veihmeyer, 1927). However, when water deficits are imposed as in RDI, yield
115
Chapter 4
and fruit size are not affected (Girona, 2002), while some quality parameters such as total soluble sugars and total acidity increase (Crisosto et al., 1994, Girona et al., 2003, Mills et al., 1994). The responses to RDI are variable depending on the timing and severity of water deficits (Marsal and Girona, 1997; Girona, 2003) which vary within a given orchard; thus the need for remote sensing tools that could assist in monitoring stress over entire orchards. Additionally, the irregular application of water during the irrigation period made necessary a methodology integrating the whole season to account for short-term water status variations. One option would be to use an integrated measure over time of tree water status (Myers, 1988; Ginestar and Castel, 1996). González-Altozano and Castel (1999) related the time integral of stem water potential with yield and fruit quality parameters in citrus. Baeza et al. (2007) attempted the same approach on vineyards, finding a correlation between a water stress integral and final berry size, although not with sugar composition. Although the relationships between water stress and fruit quality has been widely studied, the conclusion is that there is a lack of reliable indicators that predict with precision final fruit quality, and therefore there is a need for further research concerning potential fruit quality indicators. Remote sensing of fruit quality has been attempted by several means such as by determining the vigour or total leaf area in vineyards (Johnson et al., 2001, 2003; Lamb et al., 2004); by relating quality parameters in water-stressed mandarin trees to spectral changes in the red and green channels (Kriston-Vizi et al., 2008), and by using high spatial resolution airborne thermal imagery to outline relationships of olive fruit size, weight, and oil content against thermal water stress indicators (Sepulcre-Cantó et al., 2007). In this work, the PRI has been used to assess fruit quality parameters in peach and orange orchards under various water regimes. A time series of airborne PRI imagery over a peach and an orange orchard under different irrigation treatments were acquired and related to fruit quality at harvest. Furthermore, a 3D radiative transfer model was used to assess the applicability of this method to medium resolution PRI imagery for extended monitoring of crops at larger scales. For this purpose, simulations using different soil backgrounds were conducted and the output spectral information was evaluated at different spatial resolutions.
4.2 METHODS
4.2.1. Study sites The experimental areas are located in Western Andalucía, Spain, a region of Mediterranean climate characterized by warm and dry summers and cool and wet winters, with an average annual rainfall of over 550 mm. The first study site was located on a commercial peach orchard planted in 1990 in a 5x3.3 m grid on a deep soil with moderately high water holding capacity and classified as Typic
116

Detecting water stress effects on fruit quality in orchards with PRI
Xerofluvents in Cordoba, Spain (37.5ºN, 4.9ºO) (Figure 1a). Two experiments were carried out in this location. One experiment was conducted using a set of eight rows of nine peach trees (Prunus persica cv. “BabyGold 8”). Within that set, 18 trees were drip irrigated starting in mid May (end of Stage I of fruit growth and beginning of Stage II) at a rate that met the evapotranspiration (ET) requirements (full-irrigated treatment or control). Additionally, three different RDI treatments were applied to plots of 12 trees each, by varying the onset of re-irrigation as Stage III of fruit growth commenced, following uniform water deficits imposed in Stage II. The dates of onset of re-irrigation (at 160% of ET) were 4 July, 11 July and 17 July, respectively. In the same commercial orchard, another experiment was conducted on nectarine trees (Prunus persica cv. “Sweet Lady”). Five rows of 30 trees each were irrigated meeting the ET requirement (following the commercial orchard schedule), while another six rows of 30 trees each were subjected to an RDI regime that imposed water deficits until 30 June, the beginning of Stage III (Figure 1b). The second study site was located near Seville, Southern Spain (37ºN, 5.7ºO), on an 82 ha commercial citrus orchard (Figure 1c shows the subset where the experiment was established). The light-textured soil is classified as Rodoxeralf, with an approximate depth of 3 m. The trees were planted in 1997 in a 7x3 m pattern on a N-S orientation. The experiment was a randomized block design with six replications, each individual plot composed of five rows of three orange trees (Citrus sinensis L. cv. ‘Navelina’). Three different drip irrigation treatments were applied:, i) the control, that followed the orchard schedule which is designed to meet ET requirements for maximum production; ii) an over-irrigated treatment that applied 137% of control; and iii) a DI treatment that applied 62% of control. Table 1 lists the treatments, irrigation periods and depths, harvest and imagery acquisition dates for each of the study sites.
4.2.2 Field data From the beginning of June till harvest, stomatal conductance (G) and stem water potential (Ψ) were measured at midday with a leaf porometer (model SC-1, Decagon Devices, Washington, DC, USA) and a pressure chamber (PWSC Model 3000, Soil Moisture Equipment Corp., California), respectively. For the first experimental site, measured Ψ values for the three RDI treatments were normalized by dividing them into the control Ψ values of the full-irrigated treatment. Leaf spectral measurements of adaxial surfaces were taken with a leaf probe that was attached to a field spectrometer ASD (FieldSpec Handheld Pro, ASD Inc., CO, USA). Measurements were taken on four leaves per crown, which were collected and immediately frozen in liquid nitrogen. For these, leaf spectral properties and indices were calculated to assess relationships with pigment concentrations determined after extraction through chromatography (see below).
117

Chapter 4
118
RDI-1 RDI-3
RDI-2
Irrigation treatments
Fully-irrigated (a)
Irrigation treatments
RDI
Fully-irrigated
(b)
Over-irrigated
Deficit
Control
Irrigation treatments
(c)
Figure 4.1. Overview of the experiments conducted on peach trees (a); nectarines (b); and orange trees (c). The irrigation treatments for the peach study area consisted of fully-irrigated and three deficit irrigation treatments (RDI1, RDI2 and RDI3). The nectarine field was divided into one fully-irrigated treatment and five rows of trees under regulated deficit irrigation (RDI). In the orange tree experiment there were three different irrigation treatments: over-irrigated, control and deficit-irrigated.

Detecting water stress effects on fruit quality in orchards with PRI
119
Table 4.1. Summary of each study site, harvest, and imagery acquisition dates. The treatments under RDI had a “withheld period” (no irrigation) followed by a re-watering period until their stem water potential were equal to the control.
Species Treatments Irrigation strategy
Withheld period Irrigation Dose Harvest Flights
Control Sustained 100% ET RDI Regulated 05/21 to 06/30 Rewatering:200% ET, later: 100% ET Nectarine
Control Sustained 80% ET
from 07/15 to 08/07
06/12, 06/19, 06/25, 07/01, 07/04, 07/17, 07/23, 07/29, 08/07, 08/12
RDI-1 Regulated 05/19 to 07/04 Rewatering:160% ET, later: 80% ET
RDI-2 Regulated 05/19 to 07/11 Rewatering:160% ET, later: 80% ET Peach
RDI-3 Regulated 05/19 to 07/18 Rewatering:160% ET, later: 80% ET
from 08/06 to 08/28
06/19, 06/25, 07/01, 07/04, 07/17, 07/23, 07/29, 08/07, 08/12, 08/21
Control Sustained 100-130% ET Deficit Sustained 62% ET Orange Over-irrigated Sustained 137% ET
11/03 09/16

Chapter 4
Two cm2 of leaf tissue were obtained with a cork borer from each of the four leaves per tree crown. The discs were frozen in liquid nitrogen in the field and later kept under -20ºC in microfuge tubes. Each leaf disc set corresponding to each crown was ground in a mortar on ice with liquid nitrogen and acetone (in the presence of Na ascorbate) up to five ml. Then, the extract was filtered through a 0.45μm filter to separate vegetation residues and Na ascorbate and left in dark tubes at -20ºC for pigment analysis, as reported by Abadía and Abadía (1993). First, absorption at 470, 644.8 and 661.6 nm was measured with a spectrophotometer in order to derive chlorophyll a and b, and total carotenoid concentrations as described by Abadía and Abadía (1993). Samples were injected in a 100x8 mm Waters Novapak C18 radial compression column (4µm particle size) with a 20 µl loop and mobile phases were pumped by a Waters M45 high pressure pump at a flow of 1.7 ml/min (Larbi et al., 2004). In all three orchards, between 12 and 36 trees located in the centre of the irrigation treatments were monitored and harvested individually. All fruits from each tree were immediately weighted and their diameters measured. Later, eight fruits per tree were selected randomly for a physiochemical and organoleptic characterization of Total Soluble Solids (TSS) and Total Acidity (TA) used to calculate the ratio (TSS/TA). The combination of TSS and TA in the ratio TSS/TA is an indicator of both sweetness and fruit acidity, giving more information than TSS or TA separately (Crisosto et al., 2006). Fruit juice was obtained, filtered and measured with a pH meter (pH-Burette 24, Crison, Spain). To measure Titratable Acidity, six ml of juice from each sample were mixed with 50 ml of water and used for titrating with 0.1 N NaOH to an end point of pH 8.2. The total volume of NaOH is measured and used to calculate the Titratable Acidity using the Equation 4.
sampleofgramsfactoralentmilliequivNaOHNusedNaOHmlAcid
100) ( ) 1.0( )( % ×××
= [4]
The milliequivalent factor is a coefficient dependant on the most predominant acid in the fruit. In the case of peach trees, malic acid is predominant and the milliequivalent factor is 0.067. For orange trees, citric acid is predominant, with a milliequivalent factor of 0.064. Soluble solids concentration (SSC%, ºBrix) was determined in a small sample of fruit juice using a hand-held refractometer (Atago, ATC-1E, Japan). Pigment concentrations were derived from the total area of the peaks in the chromatogram using previously determined calibration coefficients calculated by injecting pure pigments into the HPLC circuit. From the xanthophyll pigment concentrations of violaxanthin (V), antheraxanthin (A), and zeaxanthin (Z), the epoxidation state (EPS) was calculated as (V+0.5*A)/(V+A+Z) (Thayer and Björkman,1990). The EPS was calculated from the leaf set corresponding to each crown and compared with the PRI calculated as (R570-R531)/(R570+R531) (Gamon et al., 1992), from the spectra measured in the field on the same four leaves sampled.
120

Detecting water stress effects on fruit quality in orchards with PRI
121
4.2.3 Airborne Imagery A 6-band multispectral camera (MCA-6, Tetracam, Inc., California, USA) was flown in summer of 2008 at 150 m above the ground level using an unmanned aerial vehicle (UAV) (Berni et al., 2009), acquiring a time series of 12 images on different dates from the two study sites. Eleven images were acquired on the commercial field covering the nectarine and peach experiments from the beginning of the Stage II of fruit growth (12th of June) till the end of harvest (21 August). In the orange orchard, the water status of the different irrigation treatments was kept constant. Hence, there was no need of characterizing the water stress over the whole fruit growing period, and a single image acquired on 16 September was used. The camera has six image sensors with 25 mm diameter bandpass filters of 10 nm FWHM (Andover Corporation, NH, USA). The image resolution is 1280x1024 pixels with 10-bit radiometric resolution and optical focal length of 8.5 mm, yielding a ground-based spatial resolution of 15 cm at 150 m altitude. The bandsets used in each of the study sites included those centered at 530 and 570 nm used to calculate the PRI index, as well as 550, 670, 700 and 800 nm to calculate the TCARI/OSAVI index for chlorophyll content estimation (Haboudane et al., 2002), and the NDVI (Rouse et al., 1974), and the SR for LAI estimation. An overview of the spectral indices used in this study can be found in Table 2. Geometric calibration of airborne data was conducted as explained in Berni et al. (2009). The camera was radiometrically calibrated using coefficients derived from measurements made with an uniform calibration body (integrating sphere, CSTM-USS-2000C Uniform Source System, LabSphere, NH, USA) at four different levels of illumination and six different integration times. Radiance values were later converted to reflectance using total incoming irradiance simulated using sunphotometer (Microtops, Solar Light inc.) data taken in the field at the time of imagery acquisition. A thermal camera (Thermovision A40M; FLIR, USA) was installed onboard the airborne platform. Its image resolution was 320 x 240 pixels and 16 bits of at-sensor calibrated radiance with a 40º FOV lens, yielding 40 cm spatial resolution at 150 m altitude. The image sensor is a Focal Plane Array (FPA) based on uncooled microbolometers with a spectral range of 7.5-13 μm, yielding calibrated radiance in the range 233-393 K. The methodology for obtaining surface temperature from radiance temperature by removing atmospheric effects using a single-channel atmospheric correction is explained in Berni et al. (2009). As PRI is an index related to light use efficiency, the index was normalized with the incoming PAR over the time series at the time of image acquisition, calculated as the integral of the irradiance in the visible region of the electromagnetic spectrum (range 400-700 nm). Thus, PRI/PAR values could be used to study the time series over the stages II and III of fruit growth. Reflectance values were obtained for the six spectral bands for every single crown for the whole time series. The high spatial resolution allowed the identification of each individual tree and the possibility of selecting pure sunlit vegetation pixels.

Chapter 4
Table 4.2. Overview of the vegetation indices used in this study and their formulation, with Rx being the reflectance at x nm. Normalized Difference Vegetation Index
670800
670800
RRRR
NDVI+−
= Rouse, 1974
Transformed Chlorophyll Absorption in Reflectance Index/ Optimized Soil-Adjusted Vegetation Index
[ ])16.0/()(*)16.01(
)/(*)(*2.0)(*3/670800670800
670700550700670700
++−+−−−
=RRRR
RRRRRROSAVITCARI Haboudane et al., 2002
Simple Ratio
670
800
RR
SR = Asrar et al., 1985
Photochemical Reflectance Index
531570
531570
RRRR
PRI+−
= Gamon et al., 1992
122

Detecting water stress effects on fruit quality in orchards with PRI
The pixels at the edge of the crowns were not used to extract the spectral information. Additionally, individual crown temperature (Tc) was extracted from thermal imagery avoiding crown edge pixels and was normalized with air temperature (Ta) to use the value of Tc-Ta for the analysis. The integral over time was calculated for five indices: PRI/PAR, Tc-Ta, NDVI, SR, and TCARI/OSAVI for the period from 19th of July until 7th of August when harvest started. For indices having both negative and positive values, the minimum value found for each index along the whole period was used as a reference line to calculate the integral for all the trees, as explained in Myers (1988). In order to study the effect of the spatial resolution on PRI, the aggregated reflectance including shadows, soil and crown components was extracted for each crown in all images acquired, and the integral calculated. For this purpose, regions of interest comprising each individual crown, and the adjacent soil were created and the spectral information extracted.
4.2.4 Radiative transfer modelling The 3D Forest Light interaction radiative transfer model (FLIGHT, North, 1996) was used to investigate the application of this methodology to larger spatial resolution imagery, by assessing canopy aggregation effects on PRI. The FLIGHT model has been successfully used to simulate PRI in previous studies (Barton and North, 2001; Suárez et al., 2008, 2009). In this case, typical peach leaf spectral characteristics and tree structural parameters were inputs for simulating vegetation cover ranging from 10% to 100% on three different soil types. Typical peach leaf reflectance and transmittance spectra were simulated using PROSPECT model (Jacquemoud and Baret, 1990) for N = 1.6, Cab = 40 μg/cm2, Cm = Cw = 0.015 and Cs = 0. The input values of N, Cm, Cw, and Cs were found in previous literature on peach trees (Suárez et al., 2009), the input value for Cab was defined as the average of the chlorophyll concentrations estimated by destructive methods. The canopy input parameters used were crown LAI = 2.5, LAD = spherical and leaf size = 0.02 m. The solar geometry corresponded to mid July at 10:00 GMT in Cordoba, Spain (solar zenith = 23º and solar azimuth = 124º). Figure 2 represents the three generic soil spectra used (Figure 2a) and three simulations conducted for dark soil and 30% (Figure 2b), 50% (Figure 2c), and 70% vegetation cover (Figure 2d). From each simulation, crown reflectance and scene reflectance were extracted digitalizing regions of interest on the simulated scene image to calculate crown PRI and scene PRI, respectively. Crown PRI values were compared to scene PRI values in order to assess the effects caused by the spatial resolution on the index. One of the outputs of FLIGHT radiative transfer model is the percentage of each element: shadowed soil, sunlit soil, shadowed vegetation and sunlit vegetation in the whole simulated scene. Those percentages were used to assess the magnitude of the error when deriving EPS from an aggregated pixel of soil, shadows and vegetation as a function of the soil type. For this purpose, scenes with a vegetation cover of 50% were simulated using the soil spectra in Figure 2. The aggregated pixel reflectance was calculated as the sum of the fractional covers of each element in the scene multiplied by its reflectance. The vegetation fractional cover was considered to be the sum of the fractional covers for sunlit and shadowed vegetation from the FLIGHT output. The aggregated scene
123

Chapter 4
reflectance was the result of using tree reflectance which corresponded to the vegetation fractional cover in the scene. Three different scenes were recreated per tree using three soil types. For each tree, the EPS value was compared to the aggregated PRI calculated from tree reflectance and the reflectance of the fractions of shadowed and sunlit soil.
0.0
0.2
0.4
0.6
500 600 700 800
Wavelength (nm)
Ref
lect
ance
Dark soilMedium soilBright soil
(a) (b) (c) (d)
Figure 4.2. Spectra from three soil types were used as input for radiative transfer modelling of vegetation scenes (a). Simulations were conducted for dark soil at 30%, 50% and 70% vegetation coverage (b, c and d, respectively).
124

Detecting water stress effects on fruit quality in orchards with PRI
4.3. RESULTS AND DISCUSION Figure 3a shows that, at the leaf level, the EPS calculated from pigment determination methods was well correlated with leaf PRI calculated from the same leaves collected in the field. Leaves with higher EPS values, corresponding to a high concentration of the photosynthetic active pigment violaxanthin over the whole xanthophyll pool, and consequently less stressed, presented lower PRI values. Lower values of PRI are the consequence of lower absorption at 530 nm using the presented formulation of PRI corresponding to a lower concentration zeaxanthin, which is the xanthophyll pigment inhibiting photosynthesis (Gamon et al., 1992). At the crown level, the photon interaction with vegetation structure and the effect of leaf angle distribution result in lower PRI values as we can see in Figures 3b and 3c. These figures depict the relationships obtained between EPS, crown PRI (r2=0.41), and crown NDVI (r2=0.15) extracted from the canopy images. The data shown on Figures 3b and 3c suggest that PRI changes are driven by physiological processes related to xanthophyll pigments and not by vegetation structure. At both leaf and canopy scales, PRI and chlorophyll a+b content were not correlated, yielding coefficients of determination of r2=0.04 and r2=0.01 respectively (data not shown), indicating that PRI changes were not driven by chlorophyll content differences. Several authors have previously found an inverse relationship between EPS and PRI (Filella et al., 1996; Gamon et al., 1992, 1997; Guo et al., 2006; Nichol et al., 2006), as shown in Figure 3b. The results in Figure 3 demonstrate the link between PRI and the xanthophyll cycle in peach at both leaf and canopy scales. The different irrigation treatments generated variability in fruit quality, as assessed by the TSS/TA ratio measured at harvest. The TSS/TA variability in the peach orchard with four irrigation treatments was greater than the TSS/TA variability found in the nectarine and orange orchards, where only one deficit irrigation treatment was applied. Figure 4 shows the relationship between EPS at crown scale and TSS/TA measured at harvest for the nectarine experiment.
125

Chapter 4
y = -0.257x + 0.0027r2 = 0.41
-0.3
-0.2
-0.1
0.5 0.6 0.7 0.8 0.9 1
EPS=(V+0.5*A)/(V+A+Z)
Cro
wn
PRI
y = -0.166x + 0.1669r2 = 0.81
0.02
0.04
0.06
0.08
0.5 0.6 0.7 0.8 0.9
EPS= (V+0.5*A)/(V+A+Z)
Leaf
PR
I
0.85
0.90
0.95
1.00
0.6 0.7 0.8 0.9 1.0
EPS=(V+0.5*A)/(V+A+Z)
Cro
wn
ND
VI
(a)
Water-stressed trees
Fully-irrigated trees
(b)
(c)
Figure 4.3. (a) Relationship between the epoxidation state (EPS) calculated from xanthophyll pigment extraction and PRI from spectral measurements on the same leaves from a total of 12 tree crowns. Relationship between the EPS calculated from the averaged xanthophyll content of four leaves per crown and spectral indices extracted from imagery for the crowns: PRI index (b) and NDVI (c).
126

Detecting water stress effects on fruit quality in orchards with PRI
y = -0.0365x + 1.3083r2 = 0.54
0.84
0.88
0.92
0.96
1.00
9 10 11 12 1
TSS/TA
EPS=
(V+0
.5*A
)/(V
+A+Z
3)
Figure 4.4. Correlation between pre-harvest EPS in the nectarine orchard experiment and the fruit quality ratio, Total Soluble Solids/Tritatable Acidity (TSS/TA).
The higher values of EPS, obtained from trees under full irrigation, corresponded to lower values of TSS/TA found in fruits of that treatment. Previous studies on peach have demonstrated the inverse relationship between tree water status at Stage II of fruit growth and the ratio TSS/TA (calculations from data published by Crisosto et al., 1994; Gelly et al., 2004).
In the orange orchard experiment, one treatment was subjected to sustained but mild deficit irrigation throughout the irrigation season. Measurements of PRI, NDVI, SR, TCARI/OSAVI and temperature extracted from imagery were related to fruit parameters. The relationships of fruit quality parameters (TSS, TA, TSS/TA and fruit size) with the physiological and structural indices are listed in Table 3. PRI showed the highest correlation with TA and TSS/TA, which are considered important indicators of fruit quality. On the contrary, crown temperature was not associated with any of the quality parameters, with one exception (fruit size; r2=0.47). This is consistent with the stem water potential measurements, which indicated no significant differences between the deficit irrigation treatment and the control. Consequently, crown temperature differences between the two treatments were hardly detectable.
127

Chapter 4
Table 4.3. Coefficients of determination (r2) in the orange experiment , between indices [PRI, T, NDVI, SR and TCARI/OSAVI] and post-harvest fruit quality parameters [TSS, Total Soluble Solids; TA, Tritatable Acidity; the ratio, TSS/TA; and the median of the fruit size].
Orange
TSS TA TSS/TA Fruit size
PRI 0.17 0.50** 0.50** 0.11 Indices for water stress detection T (K) 0.00 0.01 0.00 0.47*
NDVI 0.28* 0.33* 0.16 0.17* Structural indices SR 0.28* 0.34* 0.17 0.18*
Chlorophyll index TCARI/OSAVI 0.24* 0.35 0.28 0.32
Pearson analysis ** Correlation is significant at the 0.01 level (2-tailed). * Correlation is significant at the 0.05 level (2-tailed).
The PRI image on the orange orchard was acquired during the stage of rapid fruit growth. Figure 5 shows the relationship of TSS/TA with: a) PRI; b) temperature; c) NDVI; and, d) TCARI/OSAVI. Crown PRI correlated reasonably well with TSS/TA (r2=0.50), while other indicators of water stress, such as temperature, structural indices such as NDVI and SR, and an index related to chlorophyll content TCARI/OSAVI were not related to TSS/TA, (coefficients of determination of 0, 0.16, 0.17 and 0.18, respectively; Figure 5 and Table 3). Although canopy temperature is a reliable remote sensing water stress indicator (Jackson et al., 1977), crown temperature values should be related to the instantaneous transpiration rate at the time of image acquisition. By contrast, crown PRI values reflect physiological processes related to photosynthesis as affected by water stress. Because fruit quality is more tied to photosynthesis and carbon metabolism, PRI may be a better estimator of fruit quality than other established water stress indicators that are related directly to transpiration such as crown temperature.
128

Detecting water stress effects on fruit quality in orchards with PRI
129
y = -34.772x + 6.1154r2 = 0.50
5
7
9
11
-0.15 -0.10 -0.05 0.00
Crown PRI
TSS/
TA
5
7
9
11
300 301 302 303
Crown T (K)
TSS/
TA
y = 26.276x + 2.4109r2 = 0.18
5
7
9
11
0.15 0.20 0.25 0.30 0.35
Crown TCARI/OSAVITS
S/TA
y = 23.148x - 12.39r2 = 0.16
5
7
9
11
0.86 0.88 0.90 0.92
Crown NDVI
TSS/
TA
(a) (b) (c) (d)
Figure 4.5. Relationship between the ratio, Total Soluble Solids/Tritatable Acidity (TSS/TA) and: (a) crown PRI; (b) canopy T; (c) NDVI; and (d) TCARI/OSAVI extracted from imagery on the orange orchard study area. In the peach experiment, the time courses of water deficits and recovery were monitored by measuring crown PRI from imagery and SWP in the field. The water stressed trees showed lower SWP and higher crown PRI values (representing stress conditions) than the control trees. Figure 6 shows the time series of PRI/PAR and the normalized SWP values (values divided by those of the control treatment).

Chapter 4
Table 4.4. Coefficients of determination (r2) for peach and nectarine between the time series integral of indices [PRI/PAR, Tc-Ta, NDVI, SR and TCARI/OSAVI] and the fruit quality parameters [TSS, Total Soluble Solids; TA, Tritatable Acidity; the ratio, TSS/TA and the median of the fruit size].
Peach Nectarines
TSS TA TSS/TAFruit size TSS TA TSS/TA
Fruit size
∫(PRI/PAR)dt 0.28 0.48* 0.72** 0.01 0.05 0.22 0.61** 0.32*Indices for water stress detection ∫(Tc-Ta)dt 0.01 0.27 0.21 0.27 0.04 0.02 0.24 0.28
∫(NDVI)dt 0.60* 0.00 0.55** 0.00 0.07 0.13 0.16 0.46 Structural indices ∫(SR)dt 0.32 0.36* 0.62** 0.00 0.15 0.03 0.03 0.13
Chlorophyll index ∫(TCARI/OSAVI)dt 0.55** 0.05 0.38* 0.05 0.02 0.08 0.26 0.28
Pearson analysis ** Correlation is significant at the 0.01 level (2-tailed). * Correlation is significant at the 0.05 level (2-tailed).
During the water deficit period that corresponded to Stage II of fruit growth, the values of PRI/PAR for the three deficit irrigation treatments were similar and higher than the control values, indicating water stress (Figure 6). Similarly, the SWP of those treatments were lower than that of the fully irrigated treatment. As the rapid growth or stage III of fruit growth began in 4 July (“Irrigation 1”), the RDI-1 treatment was re-irrigated until its SWP recovered to control values, a process that took five days. One week later (“Irrigation 2”), the RDI-2 treatment was re-irrigated, and the PRI/PAR for both RDI-1 and RDI-2 treatments fell below the control values (Figure 6) showing recovery of water status. Equally, SWP values recovered in RDI-1 and RDI-2 until they reached the values of the fully irrigated treatment, although the RDI-2 treatment took ten days to recover (Figure 6). The RDI-3 treatment entered the recovery phase at “Irrigation 3”; both the SWP and PRI/PAR records showed that recovery in this treatment occurred after 13 days, taking longer to recover from the more severe water stress than the other two RDI treatments. The results of Figure 6 clearly demonstrate that the PRI/PAR measurements tracked the evolution of tree water status in the various treatments.
130
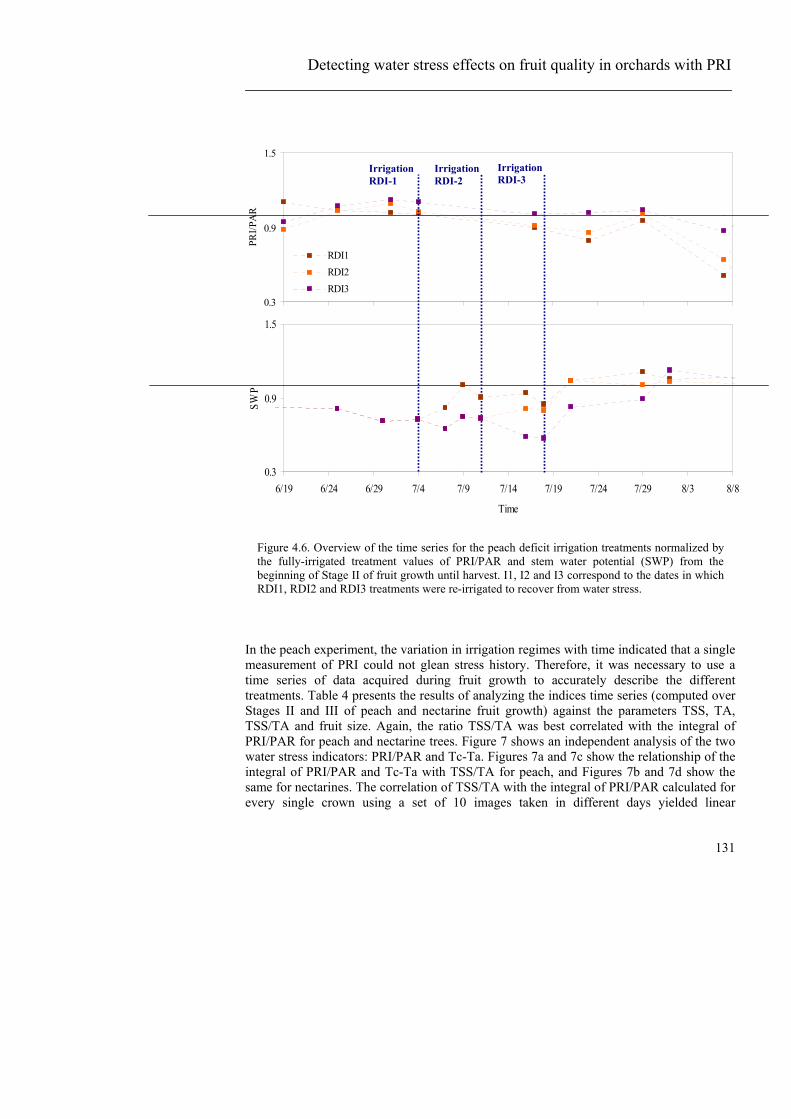
Detecting water stress effects on fruit quality in orchards with PRI
0.3
0.9
1.5
PRI/P
AR
RDI1RDI2RDI3
Irrigation RDI-1
Irrigation RDI-3
Irrigation RDI-2
0.3
0.9
1.5
6/19 6/24 6/29 7/4 7/9 7/14 7/19 7/24 7/29 8/3 8/8
Time
SWP
Figure 4.6. Overview of the time series for the peach deficit irrigation treatments normalized by the fully-irrigated treatment values of PRI/PAR and stem water potential (SWP) from the beginning of Stage II of fruit growth until harvest. I1, I2 and I3 correspond to the dates in which RDI1, RDI2 and RDI3 treatments were re-irrigated to recover from water stress.
In the peach experiment, the variation in irrigation regimes with time indicated that a single measurement of PRI could not glean stress history. Therefore, it was necessary to use a time series of data acquired during fruit growth to accurately describe the different treatments. Table 4 presents the results of analyzing the indices time series (computed over Stages II and III of peach and nectarine fruit growth) against the parameters TSS, TA, TSS/TA and fruit size. Again, the ratio TSS/TA was best correlated with the integral of PRI/PAR for peach and nectarine trees. Figure 7 shows an independent analysis of the two water stress indicators: PRI/PAR and Tc-Ta. Figures 7a and 7c show the relationship of the integral of PRI/PAR and Tc-Ta with TSS/TA for peach, and Figures 7b and 7d show the same for nectarines. The correlation of TSS/TA with the integral of PRI/PAR calculated for every single crown using a set of 10 images taken in different days yielded linear
131

Chapter 4
132
relationships of r2=0.72 for the peach tree experiment, and r2=0.61 for the nectarine orchard (Figures 7a and 7b, respectively). By contrast, relationships between the integral of Tc-Ta with TSS/TA, yielded much lower linear relationships for peach (r2=0.21) and nectarines (r2=0.25) (Figures 7c and 7d).
y = 0.001x + 0.0056r2 = 0.72
0.020
0.025
0.030
14 16 18 20
TSS/TA
∫(PR
I/PA
R)d
t
y = 0.0022x - 0.0262r2 = 0.61
-0.006
-0.002
0.002
9.6 10.4 11.2 12.0 12.8
TSS/TA
∫(PR
I/PA
R)d
t
(a) (b)
y = 8.5187x + 276.57r2 = 0.21
350
450
550
14 16 18 20
TSS/
y = 36.536x - 71.782r2 = 0.25
200
300
400
500
9.6 10.4 11.2 12 12.8
TSS/TA
∫(Tc-
Ta)d
t
TA
∫(Tc-
Ta)d
t
(c) (d)
Figure 4.7. Integral of PRI/PAR and Tc-Ta from imagery for Stages II and III of fruit growth versus the fruit quality ratio, TSS/TA for peach (a and c) and nectarine (b and d).

Detecting water stress effects on fruit quality in orchards with PRI
(a)
0.022-
0.025-
-15
-16.5
∫(PRI/PAR)dt TSS/TA (b) (c) (d) (e)
(f) (g) (h) (i)
Figure 4.8. (a) The peach orchard showing four trees corresponding to four irrigation treatments: full irrigation, RDI1, RDI2 and RDI3; (b to e) zoom on selected trees showing TSS/TA values; (f to i) zoom on selected and surrounding trees showing the integral of PRI/PAR.
133
Chapter 4
A possible explanation for the difference in behaviour between PRI and Tc-Ta lies in the changes in carbon partitioning in response to mild water deficits. It has been shown that deficit irrigation alters the distribution of carbon, increasing the allocation to fruits (Fereres and Soriano, 2007). Mild water deficits that hardly would affect transpiration (and hence Tc-Ta) may have some effects on carbon metabolism that are reflected in the light reactions of photosynthesis and are detected by PRI measurements. The effect of water stress on fruit size, an important commercial parameter (Guardiola and García-Luis, 2000), was studied in peach and nectarine using multispectral imagery acquired during Stage III of exponential fruit growth, when the absence of water stress is critical (Génard and Huguet, 1996). PRI/PAR time series computed over Stage III of fruit growth correlated well with fruit size at harvest (r2=0.51, data not shown), while the correlation of Tc-Ta time series yielded a much smaller coefficient of determination (r2=0.15). Figure 8 presents an overview of the peach experiment with the different treatments and a zoom on four of the monitored trees, each of them corresponding to a different irrigation schedule: Full-irrigated, RDI-1, RDI-2 and RDI-3 (Figure 8a). Figures 8b to 8e show the ratio TSS/TA for the four trees. In Figures 8f to 8i, the integral of PRI/PAR is shown for each of the selected and surrounding trees, demonstrating that the variability among trees of the water stress-integral within-treatments may be detected using an image-based methodology. The values of the integral of PRI/PAR and TSS/TA represented using the same color code, appear the same for the four selected trees, demonstrating that the detection of fruit quality is possible using the time series of PRI/PAR. Moreover, the use of remote sensing for the assessment of fruit quality parameters permits the spatial characterization of an entire orchard. The assessment of the influence of the imagery spatial resolution on PRI was studied using image data and radiative transfer modelling. The performance of the integral of PRI/PAR for different spatial resolutions was assessed using data from imagery. First, only reflectance extracted from pure crowns was used (Figure 9a), and then reflectance extracted from aggregated pixels, including soil, shadows and crowns (Figure 9b). The use of high-spatial resolution imagery (zoom shown in Figure 9c) allowed the classification of the crown into sunlit vegetation pixels and shadowed vegetation pixels. Figure 9d presents an example of a supervised maximum likelihood classification in which within-crown sunlit vegetation and shadows can be identified. When the integral of PRI/PAR is calculated using pure crown reflectance (Figure 10), the integral at crown scale, as a function of the EPS along the fruit growth, is well correlated with the TSS/TA ratio (r2= 0.72, Figure 10a).
134

Detecting water stress effects on fruit quality in orchards with PRI
(a) (b)
(c) (d)
Figure 4.9. (a) Zoom on an image from the peach study area; (b and c) area corresponding to aggregated crown, soil and shadows; (d) high spatial resolution imagery enabling within crown separation of sunlit (yellow) and shaded vegetation (red).
135

Chapter 4
136
y = 0.001x + 0.0056r2 = 0.72
0.015
0.020
0.025
0.030
14 16 18 20
TSS/TA
y = 0.1115x + 0.0206r2 = 0.06
0.020
0.022
0.024
0.026
0.028
0.020 0.023 0.026
∫(PRI/E)dt∫(P
RIa
gg/P
AR
)dt
tR
I)d
/PA
R
∫(P
y = 0.0003x + 0.01 84r2 = 0.25
0.020
0.022
0.024
0.026
0.028
14 16 18 20
T
∫(PR
Iagg
/PA
R)d
t
Pure vegetation pixels
Aggregated pixels
(a) (b)
SS/TA
(c)
Figure 4.10. Relationship between the integral of PRI/PAR extracted from pure crowns and the fruit quality ratio, TSS/TA (a); relationship between the integral of PRI/PAR extracted from pure vegetation spectra vs the integral of PRI/PAR of aggregated crown, soil and shadows (b); relationship between the integral of PRI/PAR for aggregated crown, soil and shadows with TSS/TA (c).
The integral of PRI/PAR extracted from pure crown pixels (i.e., high spatial resolution) versus the integral of PRI/PAR extracted from aggregated pixels where there is crown, soil and shadows (low spatial resolution) yielded a very low association (r2=0.06, Figure 10b). The lack of relationship when scene components are aggregated in a mixed pixel suggests that the PRI vs. EPS relationship is lost when pure sunlit crowns are not selected. In fact, the relationship of the integral of “low-spatial resolution” PRI with TSS/TA yielded a coefficient of determination of 0.25 (Figure 10c), versus the r2=0.72 when using high-spatial resolution PRI.

Detecting water stress effects on fruit quality in orchards with PRI
-0.05
0.00
0.05
0.10
0.15
-0.05 0.00 0.05 0.10 0.15
Aggregated pixel PRI
Cro
wn
PRI
Dark soilMedium soilBright soil
Figure 4.11. Pure crown PRI values extracted from radiative transfer simulation using the 3D forest light interaction model (FLIGHT) versus aggregated PRI including crown, soil and shadows for vegetation cover ranging from 100% to 10% for three backgrounds. Leaf input parameters were N = 1.6, Cab = 40 μg/cm2, Cw = 0.015, Cm = 0.015 and Cs = 0, canopy input parameters were LAD = spherical, crown LAI = 2.5, solar zenith = 23º and solar azimuth = 124º.
The results of modelling PRI for pure crown and aggregated pixels suggest a large influence of soil and shadows on the index (Figure 11), which prevents detecting the physiological responses to mild water stress levels. Aggregated PRI values extracted from the full reflectance scene differ greatly from pure crown PRI values as vegetation coverage decreases, increasing the proportion of soil and shadowed background in the aggregated pixel from 100% to 10% vegetation cover. The effects on the index as a function of three soil types (spectra from Figure 2) were assessed. Dark soils showed a higher influence on aggregated PRI values (see the separation from the 1:1 line), even for high percentage vegetation coverage (Figure 11). The dark soil spectrum is low and flat in comparison with the two other soil spectra used, then the influence on PRI is higher than the influence of soils with steeper spectra. The possible errors using low-resolution imagery are presented in Figure 12. The error bars in Figure 12b represent the variability of the PRI value for an aggregated pixel depending on the soil type. These modelling results emphasize the need for high spatial resolution imagery to reproduce the results obtained in this study, as medium resolution PRI imagery would be heavily affected by background and shadow components, greatly reducing the sensitivity to physiological indicators of stress, such as PRI. Future developments in this field may focus on minimizing background effects in order to use our methodology with lower spatial resolution imagery. One approach could be the use of a soil-adjusted vegetation index to deal with variable backgrounds. The first soil-adjusted vegetation index
137

Chapter 4
presented was SAVI (Huete, 1988). Subsequently, additional indices have been proposed such as TSAVI (Baret and Guyot, 1991), MSAVI (Qi et al., 1994), OSAVI (Rondeaux et al., 1996), and GESAVI (Gilabert et al., 2002), among others. Other authors have successfully transformed indices using soil adjusted-lines to minimize soil influence on spectral reflectance (Haboudane et al., 2002). Use of the above-mentioned approaches may adapt this methodology to lower spatial resolution imagery.
r2 = 0.57
-0.20
-0.18
-0.16
-0.14
-0.12
0.7 0.8 0.9 1
EPS=(V+0.5*A)/(V+A+Z)
Cro
wn
PRI
(a)
r2 = 0.44
0.01
0.03
0.05
0.07
0.09
0.7 0.8 0.9 1
EPS=(V+0.5*A)/(V+A+Z)
Agg
rega
ted
PRI
(b)
Figure 4.12. (a) Relationship between EPS and pure crown PRI for peach trees; (b) relationship between EPS and PRI from aggregated pixels including different backgrounds. The error bars are function of the maximum and minimum scene PRI corresponding to each EPS value.
138

Detecting water stress effects on fruit quality in orchards with PRI
4.4. CONCLUSIONS This study demonstrates the link between the epoxidation state of the xanthophyll cycle and the fruit quality measured in orchards under different irrigation regimes, enabling the remote detection of fruit quality as a function of water stress using high-resolution airborne PRI. The PRI index measured at leaf scale was in agreement with the epoxidation state of the xanthophyll cycle calculated from destructive sampling. In addition, the airborne image-derived PRI values calculated from pure-crown reflectance were also in agreement with xanthophyll EPS measured on the same trees. Moreover, the time series of airborne PRI normalized by the incoming PAR at the time of imagery acquisition (PRI/PAR) matched the changes in tree water status as affected by the different irrigation regimes. In an orange orchard under sustained deficit irrigation, crown PRI calculated from the airborne imagery acquired during the fruit growth was well related to fruit quality. For peach and nectarine orchards subjected to period of water stress and recovery a methodology was applied that used the time-series of PRI/PAR to assess the fruit quality responses of the different stressed treatments. Although the high resolution PRI time series exhibited a good relationship with fruit quality, crown airborne temperature acquired over the same trees, the established method for remote sensing of water stress, did not yield comparable results and did not correlate with fruit quality. This highlights the advantage of the PRI as a water stress indicator related to other physiological processes and not only to transpiration, for the assessment of fruit quality. Finally, the use of high spatial resolution imagery appears critical for a tight relationship between PRI and EPS, and therefore for assessing fruit quality from airborne PRI measurements. A radiative transfer simulation study demonstrated the influence of soil and shadows on canopy reflectance used to calculate PRI on aggregated pixels, suggesting the critical effects that soil variability has in the computation of the PRI index in discontinuous orchard canopies. This work demonstrates the feasibility for assessing fruit quality in orchards using PRI when high spatial resolution remote sensing imagery is used (20 cm in the present study) as opposed to using lower spatial resolutions where the pixels represent a mixture of shadows, vegetation and soil. The practical implications of this approach to optimize harvest operations and maximize revenues in horticultural crops based on field segmentation as a function of fruit quality may be substantial.
139

Chapter 4
Acknowledgements
Financial support from the Spanish Ministry of Science and Innovation (MCI) for the projects AGL2005-04049, EXPLORA-INGENIO AGL2006-26038-E/AGR, CONSOLIDER CSD2006-67, and AGL2003-01468, and from Gobierno de Aragón (group A03) is gratefully acknowledged, and in-kind support provided by Bioiberica through the project PETRI PET2005-0616. Technical support from UAV Navigation and Tetracam Inc. is also acknowledged. M. Medina, C. Ruz, R. Gutierrez, A. Vera, D. Notario, I. Calatrava and M. Ruiz Bernier are acknowledged for measurements and technical support in field and airborne campaigns. The Plant Stress Physiology Group of the Experimental Station of Aula Dei (CSIC) in Zaragoza is acknowledged for technical support on the leaf pigment extraction and quantification.
140

Detecting water stress effects on fruit quality in orchards with PRI
REFERENCES Abadía, A. and Abadía, J. (1993). Iron and plant pigments. In: Barton LL, Hemming BC
(eds). Iron chelation in plants and soil microorganisms. Academic, San Diego, pp 327-344.
Asner, G.P., Carlson, K.M. and Martin, R.E. (2005) Substrate age and precipitation effects on Hawaiian forest canopies from spaceborne imaging spectroscopy. Remote Sensing of Environment, 98, 457-467.
Asrar, G., Kanemasu, E.T., Jackson, R.D. and Pinter, J.R. (1985). Estimation of total above-ground phytomass production using remotely sensed data. Remote Sensing of Environment 17, 211-220.
Baeza, P., Sánchez-de-Miguel, P., Centeno, A., Junquera, P., Linares, R. and Lissarrague, J.R. (2007). Water relations between leaf water potential, photosynthesis and agronomic vine response as a tool for establishing thresholds in irrigation scheduling. Scientia Horticulturae, 114, 151-158.
Baret, F. and Guyot, G. (1991). Potentials and limits of vegetation indices for LAI and PAR assessment. Remote Sensing of Environment, 35, 161-173.
Barton, C.V.M. and North, P.R.J. (2001). Remote sensing of canopy light use efficiency using the photochemical reflectance index. Model and analysis. Remote Sensing of Environment, 78, 264, 273.
Berman, M.E. and DeJong, T.M. (1996). Water stress and crop load effects on fruit fresh and dry weights in peach (Prunus persica). Tree Physiology, 16, 859-864.
Berni, J.A.J., Zarco-Tejada, P.J., Suarez, L. and Fereres, E. (2009). Thermal and Narrow-band Multispectral Remote Sensing for Vegetation Monitoring from an Unmanned Aerial Vehicle. IEEE Transactions on Geoscience and Remote Sensing, 47, 722-738.
Chalmers, D.J., Mitchell, P.D. and Van Heek, L. (1981). Control of peach tree growth and productivity by regulated water supply, tree density and summer pruning. Journal of the American Society of Horticultural Sciences, 106, 307-312.
Cohen, Y., Alchanatis, V., Meron, M., Saranga, Y., and Tsipris, J. (2005). Estimation of leaf potential by thermal imagery and spatial analysis. Journal of Experimental Botany, 56, 1843-1852.
Crisosto, C.H., Johnson, R.S., Luza, J.G. and Crisosto, G.M. (1994). Irrigation regimes affect fruit soluble solids concentration and rate of water loss of ‘O’Henry’ peaches. Horticultural Sciences, 29, 1169-1171.
Crisosto, C.H., Crisosto, G.M., Echeverria, G., Puy, J. (2006). Segregation of peach and nectarine (Prunus persica (L.) Batsch) cultivars according to their organoleptic characteristics. Postharvest Biology and Technology 39, 10-18.
Dobrowsky, S.Z., Pushnik, J.C., Zarco-Tejada, P.J. and Ustin, S.L. (2005). Simple reflectance indices track heat and water stress-induced changes in steady-state chlorophyll fluorescence at the canopy scale. Remote Sensing of Environment, 97, 403-414.
Drolet, G.G., Huemmrich, K.F., Hall, F.G., Middleton, E.M., Black, T.A., Barr, A.G. and Margolis, H.A. (2005). A MODIS-derived photochemical reflectance index to detect inter-annual variations in the photosynthetic light-use efficiency of a boreal deciduous forest. Remote Sensing of Environment, 98, 212-224.
141
Chapter 4
Evain, S., Flexas, J. and Moya, I. (2004). A new instrument for passive remote sensing: 2. Measurement of leaf and canopy reflectance changes at 531 nm and their relationship with photosynthesis and chlorophyll fluorescence. Remote Sensing of Environment, 91, 175-185.
Fereres, E. and Soriano, M. (2007). Deficit Irrigation For Reducing Agricultural Water Use. Journal of Experimental Botany, 58, 147-159.
Filella, I., Amaro, T., Araus, J.L. and Peñuelas, J. (1996). Relationship between photosynthetic radiation-use efficiency of barley canopies and the photochemical reflectance index (PRI). Physiologia Plantarum, 96, 211-216.
Fuentes, D.A., Gamon, J.A., Cheng, Y., Claudio, H.C., Qiu, H.L., Mao, Z., Sims, D.A., Rahman, A.F., Oechel, W. and Luo, H. (2006). Mapping carbon and water vapour fluxes in a chaparral ecosystem using vegetation indices derived from AVIRIS. Remote Sensing of Environment, 103, 312-323.
Gamon, J.A., Peñuelas, J. and Field, C.B. (1992). A narrow-wave band spectral index that track diurnal changes in photosynthetic efficiency. Remote Sensing of Environment, 41, 35-44.
Gamon, J.A., Serrano, L. and Surfus, J.S. (1997). The photochemical reflectance index: an optical indicador of photosynthetic radiation use efficiency across species, functional types, and nutrient levels. Oecologia, 112, 492-501.
Gelly, M., Recasens, I., Mata, M., Arbones, A., Rufat, J., Girona, J. and Marsal, J. (2003). Effects of water deficit during stage II of peach fruit development and postharvest on fruit quality and ethylene production. Journal of Horticultural Science and Biotechnology 78, 324-330.
Génard, M. and Huguet, J.G. (1996). Modeling the response of peach fruit growth to water stress. Tree Physiology 16, 407-415.
Gillabert, M.A., González-Piqueras, J., García-Haro, F.J. and Meliá, J. (2002). A generalized soil-adjusted vegetation index. (2002). Remote Sensing of Environment, 82, 303-310.
Girona, J., Mata, M., Arbonès, A., Alegre, S., Rufat, J., Marsal, J. (2003). Peach tree response to single and combined regulated deficit irrigation regimes under swallow soils. Journal of the American Society of Horticultural Sciences, 128, 432-440.
González-Altozano, P., Castel, J.R. (1999). Regulated déficit irrigation in “Clementina de Nules” citrus tree. I. Yield and fruit quality effects. Journal of Horticultural Science and Biotechnology 74, 706-713.
Guardiola, J.L. and García-Luis, A. (2000). Increasing fruit size in citrus. Thinning and stimulation of fruit growth. Plant Growth Regulation, 31, 121-132.
Guo, J. and Trotter, C.M. (2004). Estimating photosynthetic light-use efficiency using the photochemical reflectance index: variations among species. Functional Plant Biology, 31, 255-565.
Guo, J., Trotter, C.M. and Newton, P.C.D. (2006). Initial observations of increased requirements for light-energy dissipation in ryegrass (Lolium perenne) when source/sink ratios become high at a naturally grazed Free Air CO2 Enrichment (FACE) site. Functional Plant Biology, 33, 1045-1053.
Haboudane, D., Miller, J.R., Tremblay, N., Zarco-Tejada, P.J. and Dextraze, L. (2002). Integrated narrow-band vegetation indices for prediction of crop chlorophyll content
142

Detecting water stress effects on fruit quality in orchards with PRI
for application to precision agriculture. Remote Sensing of Environment, 84, 416-426.
Huete, A.R. (1988). A soil-adjusted vegetation index (SAVI). Remote Sensing of Environment, 25, 295-309.
Idso, S.B., Jackson, R.D., Pinter, P.J., Reginato, R.J. and Hatfield, J.L. (1981). Normalizing the stress-degree-day parameter for environmental variability. Agricultural and Forest Meteorology, 24, 45-55.
Idso, S.B. (1982a). Humidity measurement by Infrared Thermometry. (1982). Remote Sensing of Environment, 12, 87-91.
Idso, S.B. (1982b). Non-water-stressed baselines: A key to measuring and interpreting plant water stress. Agricultural Meteorology, 27, 59-70.
Jackson R.D., Idso, S.B., Reginato R.J. and Ehrier, W.L. (1977). Crop temperature reveals stress. Crop Soils 29, 10-13.
Jackson, R.D., Idso, S.B., Reginato, R.J. and Pinter, P.J. Jr. (1981). Canopy temperature as a crop water stress indicator. Water Resources Research, 17, 1133-1138.
Jackson, R.D., Slater, P.N. and Pinter, P.J. Jr. (1983). Discrimination of growth and water stress in wheat by various vegetation indices through clear and turbid atmospheres. Remote Sensing of Environment 13, 187-208.
Jacquemoud S. and Baret F. (1990), PROSPECT: a model of leaf optical properties spectra, Remote Sensing of Environment, 34, 75-91.
Johnson, L.F., Bosch, D.F., Williams, D.C. and Lobitz, B.M. (2001). Remote Sensing of vineyard management zones: implications for wine quality. Applied Engineering in Agriculture, 17, 557-560.
Johnson, L.F., Roczen, D.E., Youkhana, S.K., Nemani, R.R. and Bosch, D.F. (2003). Mapping vineyard leaf area with multispectral satellite imagery. Computers and Electronics in Agriculture, 38, 33-44.
Kriston-Vizi, J., Umeda, M. and Miyamoto, K. (2008). Assessment of the water stress status of mandarin and peach canopies using visible multispectral imagery. Biosystems Engineering, 100, 338-345.
Lamb, D.W., Weedom, M.M. and Ramley, R.G.V. (2004). Using remote sensing to predict grape phenolics and colour at harvest in a Cabernet Sauvignon vineyard: timing observations against vine phenology and optimising image resolution. Australian Journal of Grape and Wine Research, 10, 46-54.
Langsberg, J.J. (1986). Physiological ecology of forest production. Academic press, London. 198p.
Larbi, A., Abadía, A., Morales, F. and Abadía, J. (2004). Fe resupply to Fe-deficient sugar beet plants leads to rapid changes in the violaxanthin cycle and other photosynthetic characteristics without significant de novo chlorophyll synthesis. Photosynthesis Research, 79, 59-69.
Larson K.D, DeJong, T.M. and Johnson, R.S. (1988). Physiological and growth responses of mature peach trees to postharvest water stress. Journal of the American Society of Horticultural Sciences, 113, 296-300.
Leinonen, I. and Jones, H.G. (2004). Combining thermal and visible imagery for stimulating canopy temperature and identifying plant stress. Journal of Experimental Botany, 55, 1423-1431.
143

Chapter 4
Marsal, J. and Girona, J. (1997). Relationship between leaf water potencial and gas exchange activity at different phonological stages and fruit loads in peach trees. Journal of the American Society of Horticultural Sciences, 122, 415-421.
Mills, T.M., Behboudian, M.H. and Tan, P.Y. (1994). Plant water status and fruit quality in “Braeburn” apples. Horticultural Science 29, 1274-1278.
Myers, B.J. (1988). Water stress integral- a link between short-term stress and long-term growth. Tree Physiology 4, 315-323.
Nakaji, T., Oguma, H. and Fujinuma, Y. (2006). Seasonal changes in the relationship between photochemical reflectance index and photosynthetic light use efficiency of Japanese larch needles. International Journal of Remote Sensing, 27, 493-509.
Nichol, C.J., Huemmrich, K.F., Black, T.A., Jarvis, P.G., Walthall, J.G. and Hall, F.G. (2000). Remote sensing of photosynthetic-light-use efficiency of boreal forest. Agricultural and Forest Meteorology, 101, 131-142.
Nichol, C.J., Lloyd, J., Shibistova, O., Arneth, A., Röser, C., Knohl, A., Matsubara, S. and Grace, J. (2002). Remote sensing of photosynthetic-light-use-efficiency of a Siberian boreal forest. Tellus, 54B, 677-687.
Nichol, C.J., Rascher, U., Matsubara, S. and Osmond, B. (2006). Assessing photosynthetic efficiency in an experimental mangrove canopy using remote sensing and chlorophyll fluorescence. Trees, 20, 9-15.
North, P.R.J. (1996). Three-dimensional forest light interaction model using a montecarlo method. IEEE Transactions on Geosciences and Remote Sensing, 34, 946-956.
Peguero-Pina, J.J., Morales, F., Flexas, J., Gil-Pelegrín, E. and Moya, I. (2008) Photochemistry, remotely sensed physiological reflectance index and de-epoxidation state of xanthophyll cycle in Quercus coccifera under intense drought. Oecologia, 156, 1-11.
Qi, J., Chehbouni, Al., Huete, A.R., Kerr, Y.H. and Sorooshian, S. (1994). A modified soil adjusted vegetation index (MSAVI). Remote Sensing of Environment, 48, 119-126.
Rondeaux, G., Steven, M. and Baret, F. (1996). Optimization of soil-adjusted vegetation indices. Remote Sensing of Environment, 55, 95-107.
Rouse, J.W., Haas, R.H., Schell, J.A., Deering, D.W. and Harlan, J.C. (1974). Monitoring the vernal advancements and retrogradation of natural vegetation. in Nasa/Gsfc Final Report (ed. MD, U.G.) p. 371.
Sepulcre-Cantó, G., Zarco-Tejada, P.J., Jiménez-Muñoz, J.C., Sobrino, J.A., Soriano, M.A., Fereres, E., Vega V., and Pastor, M. (2007). Monitoring yield and fruit quality parameters in open-canopy tree crops under water stress. Implications for ASTER. Remote Sensing of Environment, 107, 455-470.
Sepulcre-Cantó, G., Zarco-Tejada, P.J., Sobrino, J.A., Berni, J.A. J., Jiménez Muñoz, J.C. and Gastellu-Etchegorry J.P. (2009) Detecting Water Status in Open Canopies with thermal ASTER Imagery and DART radiative transfer simulation. Agricultural and Forest Meteorology, 149, 962-975.
Serrano, L. and Peñuelas, J. (2005). Assessing forest structure and function from spectral transmittance measurements: a case study in a Mediterranean holm oak forest. Tree Physiology, 25, 67-74.
Sims, D.A., Luo, H., Hastings, S., Oechel, W.C., Rahman, A.F. and Gamon, J.A. (2006). Parallel adjustment in vegetation greenness and ecosystem CO2 exchange in
144

Detecting water stress effects on fruit quality in orchards with PRI
response to drought in a Southern California chaparral ecosystem. Remote Sensing of Environment, 103, 289-303.
Strachan, I.B., Pattey, E. and Boisvert, J.B. (2002). Impact of nitrogen and environmental conditions on corn as detected by hyperspectral reflectance. Remote Sensing of Environment, 80, 213-224.
Suárez, L., Zarco-Tejada, P. J., Sepulcre-Cantó, G., Pérez-Priego, O., Miller, J.R., Jiménez-Muñoz, J.C. and Sobrino, J. (2008). Assessing Canopy PRI For Water Stress Detection With Diurnal Airborne Imagery. Remote Sensing of Environment, 112, 560-575.
Suárez, L., Zarco-Tejada, P.J., Berni, J.A.J., González-Dugo, V. and Fereres, E., (2009). Modelling PRI for Water Stress Detection using Radiative Transfer Models. Remote Sensing of Environment, 113, 730-744.
Thayer, S.S. and Björkman, O. (1990). Leaf xanthophyll content and composition in sun and shade determined by HPLC. Photosynthesis Research, 23, 331-343.
Thenot, F., Méthy, M. and Winkel, T. (2002). The Photochemical Reflectance Index (PRI) as a water-stress index. International Journal of Remote Sensing, 23, 5135-5139.
Trotter, G.M., Whitehead, D. and Pinkney, E.J. (2002). The photochemical reflectance index as a measure of photosynthetic light use efficiency for plants with varying foliar nitrogen contents. International Journal of Remote Sensing, 23, 1207-1212.
Veihmeyer, F.J. (1927). Some factors affecting the irrigation requirements of deciduous orchards. Hilgardia, 2, 125-284.
145

Chapter 4
146

Synthesis
Chapter 5
Synthesis
147

Chapter 5
148
Synthesis
5.1. Introduction This thesis demonstrates that PRI is a useful indicator of processes occurring in vegetation undergoing water deficits, and that it can be utilized in the detection of water stress at the canopy scale. Nevertheless, the effect of external parameters such as, soil type, sun angle, and leaf area index require the use of radiative transfer modelling for the precise assessment of water stress. The methodology presented for the assessment of water stress at crown / block scale using PRI and RTM has been validated in two tree species: olive and peach, and in maize, an herbaceous continuous canopy. The results show that PRI can be used as a water stress indicator, being able to characterized trees / blocks under water stress with the use of RTM. Moreover, the image-based crown PRI/PAR yielded insights into the final fruit quality parameters due to its tight relationship with water stress levels. . The relevance of the objectives achieved lays in the fact that information needed to compute the PRI is extracted from bands located in the visible region of the electromagnetic spectrum. Such bands are more accessible in many remote sensing platforms and therefore facilitates the remote monitoring of water stress in vegetation. The development of innovative methodologies that are ready to be applied in the field by end-users also opens the door to site-specific management of agricultural areas. Following are the summaries and main conclusions achieved in this work.
5.1.1 PRI as a pre-visual water-stress indicator and factors affecting the index It is demonstrated that the airborne-level PRI index is sensitive to the de-epoxidation of the xanthophyll pigment cycle caused by water stress levels (Chapter 2). Three vegetation indices were calculated from airborne imagery at 2 m spatial resolution: PRI, TCARI/OSAVI, as an indicator of chlorophyll a+b concentration, and NDVI, used to track structural changes on the canopy. Only airborne PRI demonstrated sensitivity to diurnal changes in physiological indicators of water stress, such as canopy temperature minus air temperature (Tc-Ta), stomatal conductance (G), and stem water potential (ψ) measured in the field at each time of image acquisition. No relationships were found over the diurnal experiment between NDVI and TCARI/OSAVI with tree-measured physiological measures. Moreover, a relationship was also found between leaf-level steady-state fluorescence (Fs) and image PRI calculated from the same trees monitored over the course of the diurnal flight campaigns. The radiative transfer model at leaf level PROSPECT was coupled with the 3D canopy level model FLIGHT to simulate the effects of the bi-directional reflectance distribution function changes in the vegetation indices. AHS reflectance spectra were compared with those from model-simulated scenes that accounted for the viewing geometry configuration as function of the airborne acquisitions conducted on the solar plane. Diurnal trends in the airborne vegetation indices demonstrate that NDVI and TCARI/OSAVI are well simulated
149

Chapter 5
by crown-level simulations with FLIGHT, capturing the BRDF changes associated with the sun angle changes. On the other hand, the canopy model did not simulate correctly the image-observed diurnal changes in PRI, demonstrating that PRI bands are affected diurnally by the confounding effects of BRDF effects and the de-epoxidation of the xanthophyll pigment function of water stress. The results presented confirm that diurnal changes observed in PRI are both structurally and physiologically driven, and not only affected by BRDF. The simulation assessment on the effects on PRI as function of sun angle, soil background, and crown LAI demonstrate that PRI is highly affected by the canopy structure and background. Changes in PRI as function of canopy LAI are comparable to those found as function of water stress levels. Therefore a careful assessment of canopy structure variability needs to be conducted when PRI is used to study the spatial distribution of vegetation stress. Soil background and canopy LAI are key factors to account for when PRI is used to detect water stress.
5.1.2. Methodology for water stress assessment through PRI Being aware of the external factor affecting PRI, the need of developing a methodology for water stress detection having into account these factors arises. In chapter 3, a methodology for water stress assessment using PRI and radiative transfer models is presented. The method accounts for leaf and canopy inputs N, Cab and LAI to simulate the PRI values to identify crop crowns / blocks under stress. The methodology presented was successfully tested on two tree orchards (olive and peach trees) and a closed canopy of an annual crop (maize). The ability of PRI to detect water stress before vegetation structure is affected is critical as a pre-visual indicator of stress. However, PRI was highly affected by both background and canopy structure, requiring correct modelling methods for successful mapping of water stress and its spatial variability. Modelling inversion methods enabled accounting for background and crop/orchard characteristics independently for each crop field and imagery acquired with the airborne multispectral sensor. Two different canopy radiative transfer models were used depending on the crop structure, SAILH for maize crop and FLIGHT model for tree orchards (olive and peach trees), while simulations at leaf scale were conducted successfully with the PROSPECT leaf model. Results demonstrated that airborne canopy PRI values higher than the theoretical non-stress PRI (sPRI), when accounting for N, Cab and LAI via radiative transfer models, correspond to vegetation pixels under water stress. Consistency was found in three crops where this methodology was applied. Airborne PRI values compared with the theoretical non-stress PRI, calculated as PRI-sPRI, agreed with the irrigation levels applied, and the stress level before and after irrigation. The results obtained in this study, then, demonstrate that PRI is a pre-visual indicator of water stress, i.e., when no effects could be detected visually.
150

Synthesis
5.1.3. PRI as an indicator of final fruit quality parameters The results presented demonstrate the link between the epoxidation state of the xanthophyll cycle and the fruit quality measured in orchards under different irrigation regimes, enabling the remote detection of fruit quality as a function of water stress using high-resolution airborne PRI. The PRI index measured at leaf scale was in agreement with the epoxidation state of the xanthophyll cycle calculated from destructive sampling. In addition, the airborne image-derived PRI values calculated from pure-crown reflectance were also in agreement with xanthophyll EPS measured on the same trees. Moreover, the time series of airborne PRI normalized by the incoming PAR at the time of imagery acquisition (PRI/PAR) matched the changes in tree water status as affected by the different irrigation regimes. In an orange orchard under sustained deficit irrigation, crown PRI calculated from the airborne imagery acquired during the fruit growth was well related to fruit quality. For peach and nectarine orchards subjected to period of water stress and recovery a methodology was applied that used the time-series of PRI/PAR to assess the fruit quality responses of the different stressed treatments. Although the high resolution PRI time series exhibited a good relationship with fruit quality, crown airborne temperature acquired over the same trees, the established method for remote sensing of water stress, did not yield comparable results and did not correlate with fruit quality. This highlights the advantage of the PRI as a water stress indicator related to other physiological processes and not only to transpiration, for the assessment of fruit quality. Finally, the use of high spatial resolution imagery appears critical for a tight relationship between PRI and EPS, and therefore for assessing fruit quality from airborne PRI measurements. A radiative transfer simulation study demonstrated the influence of soil and shadows on canopy reflectance used to calculate PRI on aggregated pixels, suggesting the critical effects that soil variability has in the computation of the PRI index in discontinuous orchard canopies. This work demonstrates the feasibility for assessing fruit quality in orchards using PRI when high spatial resolution remote sensing imagery is used (20 cm in the present study) as opposed of using lower spatial resolutions where the pixels represent a mixture of shadows, vegetation and soil. The practical implications of this approach to optimize harvest operations and maximize revenues in horticultural crops based on field segmentation as a function of fruit quality may be substantial.
151
Chapter 5
5.2. APPLICABILITY IN AGRICULTURE Water shortages in irrigated agriculture will force growers to reduce irrigation applications and to be much more precise in the future in the management of water. To achieve a high degree of precision, they will need monitoring tools that will detect water stress before a management decision is taken. Until now, the use of point indicators or sensors such as soil and /or plant measurements were the only methods available for advanced growers or technicians to detect crop water deficits and to make irrigation decisions on real-time using technical information. The point monitoring techniques are time consuming and expensive, and they are generally unaffordable to detect the spatial variability within whole orchards in the time needed to make irrigation management decisions. This thesis presents highly innovative methodologies that are ready to be applied in commercial fields for water stress detection, and also advances the possibility of fruit quality assessment. The use of remote sensing indicators such as the PRI will facilitate detection of soil heterogeneity, in water holding capacity and other physical and chemical properties, and may even provide information about the uniformity of irrigation applications and of failures in the irrigation system. Obviously, work is needed to separate all these factors in order to identify the causes of the changes in PRI values. If the results relating PRI and fruit quality obtained in this thesis are generalized, it will offer the manager the possibility of planning its harvest with a degree of uniformity in ripeness or other fruit characteristics never reached before. This would be very advantageous for marketing purposes and for the elaboration of certain products such as wine. Aditionally, the sugar concentration or acidity can be quality parameters targeted for specific industrial processing such as fruit juices or jams. Post-harvest conservation could also be improved by harvesting at optimum sugar/acidity content. Finally, this methodology based on a narrow-band index derived from the visible part of the spectrum may be potentially used as an alternative to thermal imagery for assessing water stress. High-resolution thermal imagers are generally more expensive and their availability more limited than CCD/CMOS instruments onboard airborne and potential satellite platforms.
152
Synthesis
153
5.3. RECOMMENDATIONS FOR FURTHER RESEARCH The following are some recommendations focused on general needs:
- The methodology presented for water stress detection and fruit quality segmentation should be developed for other field and vegetable crops and for trellis-structured crop canopies, such as vineyards.
- PRI levels should be related to different water stress levels in winegrapes that influence wine quality. If the PRI could be used for monitoring water stress in vineyards, it could be very valuable in achieving optimum must quality for wine production. - The mixtured vegetation-soil-shadows pixel cannot be used to extract PRI information. Further research should focus on developing a methodology which allows obtaining the PRI of canopies at medium-spatial resolutions. - Similarly to the research performed here relating PRI to water stress of canopies, nutritional stress can also decrease the photosynthesis capacity of vegetation and impacts also final fruit quality. Thus, PRI should be studied as an indicator of nutritional stress effects on vegetation. - More fundamental research is needed on the mechanisms involved in the relations between water stress and the processes affecting xanthophyll pigment de-epoxidation at leaf and canopy scales. - There is a need to evaluate if several water stress and recovery cycles could induce hysteresis phenomena in the canopy PRI values, thus affecting the validity of PRI as an indicator of water deficits in different crops. - Similarly, the methodology presented here should be tested in different seasons and years to assess its robustness. In this way, PRI time series would be evaluated versus theoretical PRI time series. - The underlying mechanisms behind the relationship between PRI and fruit quality parameters should be studied and a standard methodology to assess fruit quality using PRI should be developed for other fruit trees and vineyards.

154